Non-Fermi Liquid Behaviour in Uranium-Based … Liquid Behaviour in Uranium-Based Heavy-Fermion...
176
Non-Fermi Liquid Behaviour in Uranium-Based Heavy-Fermion Compounds ACADEMISCH PROEFSCHRIFT ter verkrijging van de graad van doctor aan de Universiteit van Amsterdam op gezag van de Rector Magnificus prof. dr J. J. M. Franse, ten overstaan van een door het college voor promoties ingestelde commissie, in het openbaar te verdedigen in de Aula der Universiteit op dinsdag 26 september 2000, te 12.00 uur door Pedro Miguel de Lemos Correia Estrela geboren te Lissabon, Portugal Amsterdam, 2000
Transcript of Non-Fermi Liquid Behaviour in Uranium-Based … Liquid Behaviour in Uranium-Based Heavy-Fermion...
Non-Fermi Liquid Behaviour
in Uranium-Based Heavy-Fermion Compounds
ACADEMISCH PROEFSCHRIFT
ter verkrijging van de graad van doctor
aan de Universiteit van Amsterdam
op gezag van de Rector Magnificus
prof. dr J. J. M. Franse,
ten overstaan van een door het college voor promoties ingestelde
commissie, in het openbaar te verdedigen in de Aula der Universiteit
op dinsdag 26 september 2000, te 12.00 uur
door
Pedro Miguel de Lemos Correia Estrela
geboren te Lissabon, Portugal
Amsterdam, 2000
Promotor: prof. dr F. R. de Boer
Co-promotor: dr A. de Visser
Commissie: prof. dr P.F. de Châtel
prof. dr J.J.M. Franse
prof. dr M. Godinho (Universidade de Lisboa)
dr E.H. Brück
dr G.J. Nieuwenhuys (Universiteit Leiden)
The work described in this thesis was partially financed by the European Commission through a
Marie Curie Fellowship and was carried out at the
Van der Waals - Zeeman Instituut
Universiteit van Amsterdam
Valckenierstraat 65
1018 XE Amsterdam
The Netherlands
where a limited number of copies of this thesis is available.
ISBN: 90-5776-051-7
Non-Fermi liquid behaviour
in uranium-based
heavy-fermion compounds
Contents
1. Introduction 71.1. Scope 71.2. Outline 8
2. Non-Fermi liquid behaviour in heavy-fermion compounds 112.1. Heavy-fermion compounds and Fermi liquid theory 112.2. Non-Fermi liquid behaviour 152.3. Routes to non-Fermi liquid behaviour 19
2.3.1. Multichannel Kondo effect 192.3.2. Kondo disorder model 202.3.3. Proximity to a quantum critical point 222.3.4. Griffiths phase model 25
2.4. Magnetotransport in nearly antiferromagnetic metals 262.5. Examples of non-Fermi liquid compounds 30
3. Experimental 373.1. Sample preparation 373.2. Magnetization 383.3. Resistivity and magnetoresistance 39
3.3.1. Resistivity under pressure 393.4. Specific heat 413.5. Thermal expansion 423.6. Muon Spin Relaxation and Rotation 43
3.6.1. Zero-field µSR 463.6.2. Longitudinal-field µSR 473.6.3. Transverse-field µSR 50
4. Non-Fermi liquid behaviour in U2Pt2In 534.1. The U2T2X family of compounds 53
4.1.1. Crystallographic structure and overview 544.1.2. Doniach diagram 59
4.2. U2Pt2In 634.2.1. Magnetization 64
Contents 5
4.2.2. Resistivity 664.2.2.1. Magnetoresistance 69
4.2.3. Specific heat 764.2.3.1. Specific heat in field 79
4.2.4. Thermal expansion 824.3. Discussion 86
4.3.1. Hybridization phenomena and evidence for NFL behaviour 864.3.2. Single-ion scaling and the two-channel Kondo model 884.3.3. Kondo disorder 904.3.4. Magnetic critical point 91
5. Muon spin relaxation and rotation in U2Pt2In 955.1. Zero field 955.2. Longitudinal field 1005.3. Transverse field 1025.4. Summary 106
6. Probing U2Pt2In in the Doniach phase diagram 1086.1. Pressure effects on the resistivity of U2Pt2In 1096.2. Studies of Th doping in U2Pt2In 1176.3. U2Pd2In - resistivity under pressure 1216.4. Magnetization studies of several U2T2X compounds 122
6.4.1. U2Co2Sn 1226.4.2. U2Ru2Sn 1236.4.3. U2Rh2Sn 1246.4.4. U2Ir2Sn 1266.4.5. U2Ni2In 127
6.5. Discussion 129
7. Non-Fermi liquid behaviour in other uranium compounds 1337.1. U3Ni3Sn4 134
7.1.1. Non-Fermi liquid behaviour in U3Ni3Sn4 1347.1.2. Recovery of the Fermi liquid state in U3Ni3Sn4 under pressure 139
7.2. Magnetic quantum critical point and superconductivity in U(Pt1-xPdx)3 1447.3. Possible non-Fermi liquid behaviour in URh1/3Ni2/3Al 151
8. Concluding remarks 1578.1. U2Pt2In 1578.2. Related compounds 161
Summary 164
Samenvatting 167
Published work 170
Acknowledgements 173

Introduction
1.1. Scope
“Condensed matter physics has been surprisingly fertile in giving rise to new and
unexpected phenomena, associated very often with new ground states of the electronic system.
Many of them lurk at the fringes of interest until they are received into the Church of Physics by
baptism with a name, and the latest such addition is provided by what are now called heavy-
fermion materials”. This sentence, written by B.R. Coles [1] more than a decade ago in the
introduction of a review paper on heavy-fermion compounds, can now be used in the
introduction of this thesis by simply replacing the term heavy-fermion by non-Fermi liquid.
Landau's Fermi liquid theory has been outstandingly successful in describing the low-
temperature properties of normal and heavy-fermion metals. However, in the past decade an
increasing number of heavy-fermion systems has been reported to show strong deviations from
Fermi liquid behaviour at low temperatures. This so called non-Fermi liquid (NFL) behaviour is
generally believed to represent a new type of ground state of metals, thus challenging both
theorists and experimentalists to properly describe this new behaviour [2]. This represents the
main motivation for the work described here.
Different mechanisms leading to NFL behaviour have been proposed. Some of these
mechanisms are based on the physics of quantum phase transitions, while others are based on
local Fermi liquid descriptions. NFL materials can normally be grouped into one of these two
Chapter 18
classes of mechanisms. Up to now, a theoretical model which yields an universal description of
NFL behaviour is not available. Crystallographic disorder, which is present in most NFL
materials, is expected to play an important role in modelling certain types of NFL behaviour,
however its precise influence is far from being understood. The lack of a full theoretical
understanding of NFL behaviour asks for careful and detailed studies of the low-temperature
properties of heavy-fermion compounds exhibiting NFL behaviour.
In the course of this thesis work, several systems exhibiting NFL behaviour were studied.
Among them, U2Pt2In appeared to be the most interesting system and a detailed study of its
electronic, thermal and magnetic properties was carried out. Although U2Pt2In is a "difficult"
material from the metallurgical point of view, it is the first stoichiometric uranium-based
compound discovered to exhibit NFL behaviour at ambient pressure. U2Pt2In is a promising
compound to study NFL behaviour because: i) it is a stoichiometric compound, thus the physics
might not be dominated by disorder; ii) the observation of NFL behaviour at ambient pressure,
enables the use of a wide range of experimental techniques. These points, together with the
availability of samples in a single-crystalline form, yield the motivation to study U2Pt2In
extensively.
Hopefully, this thesis will serve as a reference work to NFL behaviour in heavy-fermion
compounds. No definite answer as to the origin of the observed NFL behaviour is given.
Actually, considering the state of the art of NFL physics, no definite answer can be given at
present. The experimental results presented here are discussed in terms of possible mechanisms,
yielding strong indications for collective (as in quantum criticality) or single-ion (as in local
Fermi liquid descriptions) phenomena.
1.2. Outline
Throughout this thesis, the discussion of the results runs in parallel with the presentation
and analysis of the experimental data. A general discussion of the physical properties and/or a
summary of the results is given at the end of each chapter.
Introduction 9
A brief introduction to heavy-fermion compounds and Fermi liquid theory, as well as an
overview of the relevant models that predict NFL properties is given in Chapter 2. In this
chapter, a short overview of materials exhibiting NFL behaviour is given as well.
A description of the experimental techniques used throughout this work can be found in
Chapter 3. As most of these experimental techniques and set-ups have been described extensively
elsewhere, the presentation is kept relatively short. However, the high-pressure technique, used
in Chapters 6 and 7, and the muon spin relaxation and rotation (µSR) technique, used in Chapters
5 and 7, are described in more detail.
In Chapter 4, an introduction to the U2T2X family of compounds is given and a Doniach
phase diagram is constructed for the families with X=In and Sn. In the case of U2Pt2In,
measurements of the magnetization, resistivity, magnetoresistance, specific heat, specific heat in
field and thermal expansion are presented, analysed and discussed. The data presented in this
chapter undoubtedly establish the NFL character of U2Pt2In.
Zero-, longitudinal- and transverse-field µSR spectra taken on U2Pt2In are discussed in
Chapter 5. These experiments served to confirm the absence of static magnetic order in U2Pt2In.
In the NFL regime, pronounced magnetic fluctuations are found.
Chapter 6 deals with resistivity measurements on U2Pt2In under hydrostatic pressure, as
well as with Th-doping studies. Results of the recovery of a Fermi liquid state in U2Pt2In under
pressure and the possible emergence of magnetic ordering in Th-doped U2Pt2In are presented.
For comparison, the suppression under pressure of magnetism in U2Pd2In was studied. A
discussion in terms of the Doniach phase diagram is given. In addition, magnetization
measurements are presented for several compounds of the U2T2X family in order to investigate
their location in the Doniach diagram.
Besides the U2T2X family, several other uranium intermetallic systems exhibiting NFL
behaviour were studied. Namely, U3Ni3Sn4 was studied by means of specific heat, resistivity
(under pressure) and µSR experiments, U(Pt1-xPdx)3 by means of µSR experiments and
URh1/3Ni2/3Al by means of resistivity measurements. The results are presented in Chapter 7 in a
collection of published (or submitted for publication) articles.
Some concluding remarks are made in Chapter 8.
Several abbreviations are introduced in this thesis. A list is presented in Table 1.1.
Chapter 110
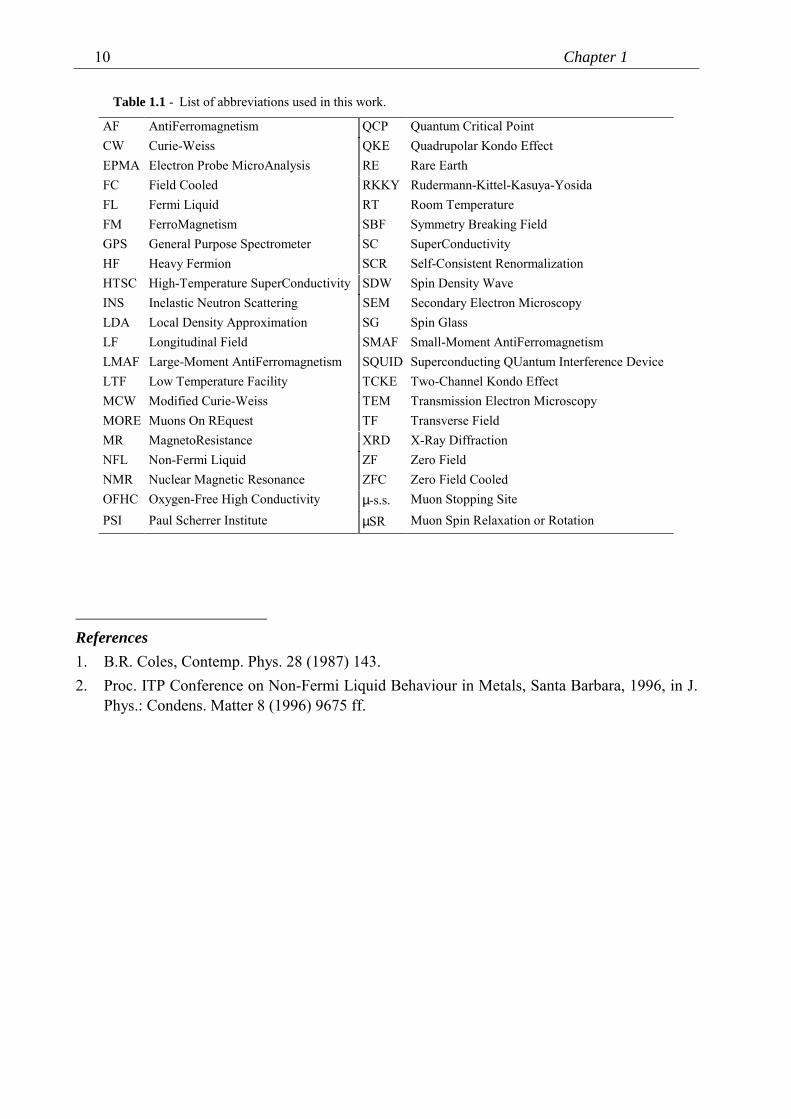
Table 1.1 - List of abbreviations used in this work.
AF AntiFerromagnetism QCP Quantum Critical PointCW Curie-Weiss QKE Quadrupolar Kondo EffectEPMA Electron Probe MicroAnalysis RE Rare EarthFC Field Cooled RKKY Rudermann-Kittel-Kasuya-YosidaFL Fermi Liquid RT Room TemperatureFM FerroMagnetism SBF Symmetry Breaking FieldGPS General Purpose Spectrometer SC SuperConductivityHF Heavy Fermion SCR Self-Consistent RenormalizationHTSC High-Temperature SuperConductivity SDW Spin Density WaveINS Inelastic Neutron Scattering SEM Secondary Electron MicroscopyLDA Local Density Approximation SG Spin GlassLF Longitudinal Field SMAF Small-Moment AntiFerromagnetismLMAF Large-Moment AntiFerromagnetism SQUID Superconducting QUantum Interference DeviceLTF Low Temperature Facility TCKE Two-Channel Kondo EffectMCW Modified Curie-Weiss TEM Transmission Electron MicroscopyMORE Muons On REquest TF Transverse FieldMR MagnetoResistance XRD X-Ray DiffractionNFL Non-Fermi Liquid ZF Zero FieldNMR Nuclear Magnetic Resonance ZFC Zero Field CooledOFHC Oxygen-Free High Conductivity µ-s.s. Muon Stopping SitePSI Paul Scherrer Institute µSR Muon Spin Relaxation or Rotation
References1. B.R. Coles, Contemp. Phys. 28 (1987) 143.2. Proc. ITP Conference on Non-Fermi Liquid Behaviour in Metals, Santa Barbara, 1996, in J.
Phys.: Condens. Matter 8 (1996) 9675 ff.
Non-Fermi liquid behaviour in
heavy-fermion compounds
2.1. Heavy-fermion compounds and Fermi liquid theory
Heavy-fermion (HF) systems are predominantly found in cerium and uranium compounds
where the 4f- and 5f-electron states are relatively close to the Fermi level. Near room temperature
(RT), the f-moment sublattice has properties resembling those of weakly (Curie-Weiss)
interacting magnetic moments. The electronic transport properties are dominated by incoherent
scattering of the conduction electrons by the local moments. As the temperature is lowered,
local-moment behaviour gives way to electronic properties that are consistent with those of a
narrow band of conduction electrons. The crossover temperature is the coherence temperature
Tcoh.
In Landau's theory of Fermi liquids (FL), a one-to-one mapping of non-interacting electron
states to interacting electron states is assumed close to the Fermi energy. If the interactions are
turned adiabatically, the states can be described in terms of quasiparticles, which have an
enhanced effective mass due to interactions with other quasiparticles in the surrounding medium.
At sufficiently low temperatures (much lower than the Fermi temperature), a useful tool to
describe the thermodynamic properties of a system with itinerant electrons is the effective mass
Chapter 212
of the electrons. In normal metals, the effective mass m* is of the order of the free-electron mass
me, while in heavy-fermion systems m* can attain values as large as 103 me.
A single quasiparticle has an energy
)( FF
20
*2k
mk
−=ε kk
, (2.1)
where k is the wave-vector and kF = (3π2ρe)1/3 is the Fermi wave-vector (ρe is the number of
electrons per unit volume). This expression defines the effective mass m*. When a quasiparticle
is added to the system, it will have an energy
∑ ′δ′Ω
+ε=ε'
)(),(k
k knkkf10k , (2.2)
where Ω is the volume of the system and f(k,k') is the quasiparticle interaction function. From
this, it follows that the energy of the added quasiparticle is not just the bare quasiparticle energy
εk0, but also depends on the presence of other quasiparticles. δn(k)=1 represents an excited
quasiparticle and δn(k)=-1 an excited quasi-hole. Notice that k denotes (k,σ) with σ the spin index
(↑ or ↓). The function f(k,k') can be transformed into spin-symmetric and spin-antisymmetric
functions:
′−′=↓′↑
′+′=↑′↑),(),(),(),(),(),(
kkkkkkkkkkkk
as
as
ffffff
. (2.3)
A restriction of the Fermi-liquid theory is that all involved particles have a momentum very
close to the Fermi surface: |k| ≈ |k'| ≈ kF. The f a,s functions can then be expanded in a series of
Legendre polynomials PL:
∑∞
=
θ=′0
sa,sa,
LLL Pff )(cos),( kk (2.4)
with cosθ = (k⋅⋅⋅⋅ k')/kF2. A dimensionless form of the coefficients fL
a,s is given by the Landau
parameters
sa,22Fsa, *F LL fkm
π= . (2.5)
The thermodynamic and response functions of the electronic liquid can now be calculated
and shown to be smooth functions of temperature. The density of states at the Fermi energy is
given by
Non-Fermi liquid behaviour in heavy-fermion compounds 13
22F*0
π=
kmN )( , (2.6)
where the effective mass of the quasiparticles m* is related to the bare mass me by a symmetric
Landau parameter
3F
1* s1
e
+=mm . (2.7)
The temperature independent Pauli susceptibility has the form
a0
22F
2B0
F11*
+πµµ
=χ
km(2.8)
with F0a an antisymmetric Landau parameter. χ is enhanced with respect to the Pauli
susceptibility of the non-interacting system by a factor m*/me(1+F0a).
The specific heat cV in the FL theory is given by
2
2BF
3*
kkmTcV =γ= , (2.9)
which is enhanced with respect to the specific heat of the non-interacting system by a factor
m*/me. Therefore, the specific-heat coefficient gives direct information about the effective mass
m*. The Wilson ratio RW relates the Pauli susceptibility to the electronic specific-heat coefficient
a0
2B0
2B
2
W F11
3R
+=
γχ
µµπ
=k
. (2.10)
In the case of a non-interacting system, RW = 1.
The electrical resistivity behaves as
20 AT+ρ=ρ , (2.11)
where ρ0 is the residual resistivity due to impurities and defects and A is a constant.
The FL theory gives a good description of the low-temperature properties of metals (above
any magnetic or superconducting transition). In heavy-fermion compounds, the high-temperature
local-moment behaviour gives way to a low-temperature coherent state where the FL theory is
valid with a strongly enhanced effective mass m*. The specific heat, susceptibility and resistivity
follow the temperature dependencies c(T) = γT, χ(T) = const and ρ(T) = ρ0+AT 2, respectively.
Values of the Wilson ratio in the range 2-5, as normally found in HF systems, can be accounted
for by a negative Landau parameter F0a. The coefficient A is related to γ by the empirical
Kadowaki-Woods relation: A/γ2 ~ 10 µΩcmK2mol2J-2 [1].
Chapter 214
Within the FL theory, spin fluctuations in the HF system give rise to a correction term in
the specific heat of the form c(T) = γT + δT 3ln(T/T*), where T* is a characteristic spin-
fluctuation temperature.
Most HF compounds exhibit the Kondo effect [2], manifested in measurements of the
electrical resistivity from room temperature down to low temperatures. The Kondo Hamiltonian
describes the exchange interaction of a single magnetic impurity (with spin S) with a conduction
electron (with spin s):
ℋ Ss ⋅−= J2 . (2.12)
For a negative coupling parameter J, the impurity spin is completely compensated at low
temperatures and a Kondo singlet is formed. As a result, the resistivity obeys a -ln(T/TK)
behaviour. The binding energy of a Kondo singlet is
−∝)(
exp)( 0
10
1k KB JNNT . (2.13)
HF materials may be considered as Kondo lattices with a periodic array of magnetic "impurities".
In Kondo lattices, scattering at low temperatures may be coherent, resulting in a fast drop of the
resistivity (as the temperature is lowered) and a T 2 behaviour at the lowest temperatures. In
general, the compensation of the f-moments by means of the Kondo effect leads to the formation
of a non-magnetic ground state.
On the other hand, antiferromagnetic interactions between the f-moments are provided via
the conduction electrons by the Rudermann-Kittel-Kasuya-Yosida (RKKY) interaction. This
interaction tends to form a magnetic ground state in HF systems. The energy associated with the
RKKY interaction is
)(0k 2RKKYB NJT ∝ . (2.14)
Considering the scales defined by TK and TRKKY, Doniach proposed that the low-
temperature ground state of the system is a direct consequence of the competition between the
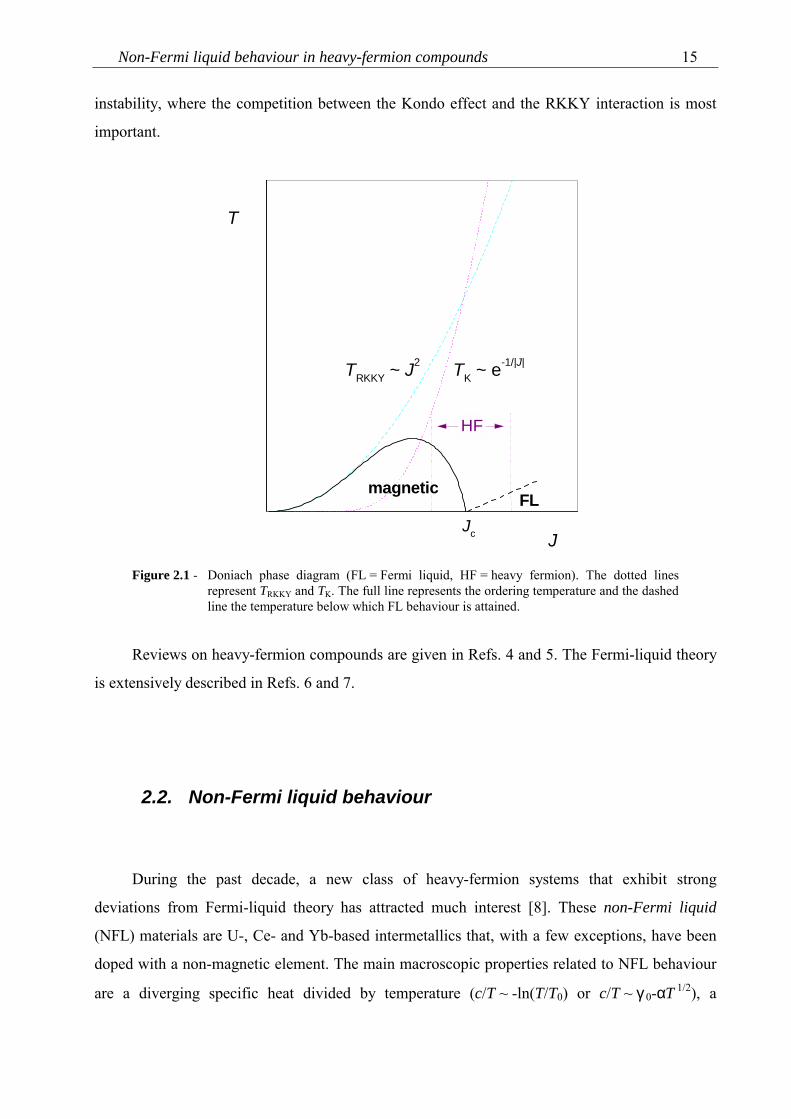
Kondo scattering and the RKKY interaction [3]. A (Doniach) phase diagram can then be
constructed (Figure 2.1) i. Heavy-fermion compounds are in general located close to the magnetic
i Strictly speaking, the Doniach phase diagram is of the form T/W versus J/W. However, for HF compounds and closeto the magnetic instability, external parameters like pressure and doping will more effectively influence theexchange-coupling parameter J than the bandwidth W. Therefore, and also for simplicity, T(J) diagrams will be usedthroughout this work.
Non-Fermi liquid behaviour in heavy-fermion compounds 15
instability, where the competition between the Kondo effect and the RKKY interaction is most
important.
HF
Jc J
magneticFL
TK ~ e-1/|J|TRKKY ~ J2
T
Figure 2.1 - Doniach phase diagram (FL = Fermi liquid, HF = heavy fermion). The dotted linesrepresent TRKKY and TK. The full line represents the ordering temperature and the dashedline the temperature below which FL behaviour is attained.
Reviews on heavy-fermion compounds are given in Refs. 4 and 5. The Fermi-liquid theory
is extensively described in Refs. 6 and 7.
2.2. Non-Fermi liquid behaviour
During the past decade, a new class of heavy-fermion systems that exhibit strong
deviations from Fermi-liquid theory has attracted much interest [8]. These non-Fermi liquid
(NFL) materials are U-, Ce- and Yb-based intermetallics that, with a few exceptions, have been
doped with a non-magnetic element. The main macroscopic properties related to NFL behaviour
are a diverging specific heat divided by temperature (c/T ~ -ln(T/T0) or c/T ~ γ0-αT 1/2), a
Chapter 216
diverging magnetic susceptibility (χ ~ 1-bT β or χ ~ -ln(T/T0)) and a non-quadratic electric
resistivity (ρ ~ aT α with α < 2 and a can be positive or negative).
The divergency of c/T is the hallmark of NFL behaviour. Within the FL theory, a
temperature dependent coefficient γ that diverges as T→0 would imply a diverging density of
states at the Fermi level. Therefore, FL theory cannot be applied in its simple form. This is why
the name non-Fermi liquid was fist given to this behaviour. Nevertheless, in some cases, models
based on a local FL description can account for this new behaviour.
At present, no theoretical models are at hand which yield an universal description of NFL
behaviour. However, a common starting point may be found in the physics of quantum critical
points. This results from the recognition that NFL properties emerge at or close to the magnetic
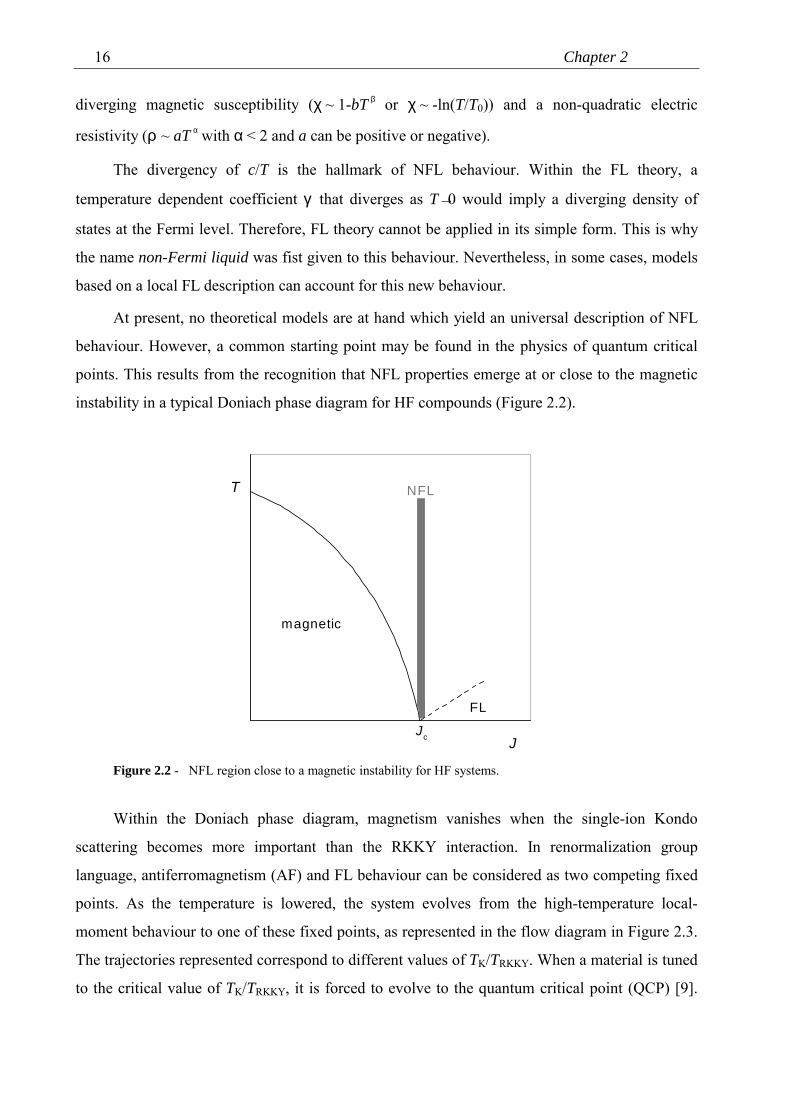
instability in a typical Doniach phase diagram for HF compounds (Figure 2.2).
NFL
Jc J
magnetic
FL
T
Figure 2.2 - NFL region close to a magnetic instability for HF systems.
Within the Doniach phase diagram, magnetism vanishes when the single-ion Kondo
scattering becomes more important than the RKKY interaction. In renormalization group
language, antiferromagnetism (AF) and FL behaviour can be considered as two competing fixed
points. As the temperature is lowered, the system evolves from the high-temperature local-
moment behaviour to one of these fixed points, as represented in the flow diagram in Figure 2.3.
The trajectories represented correspond to different values of TK/TRKKY. When a material is tuned
to the critical value of TK/TRKKY, it is forced to evolve to the quantum critical point (QCP) [9].
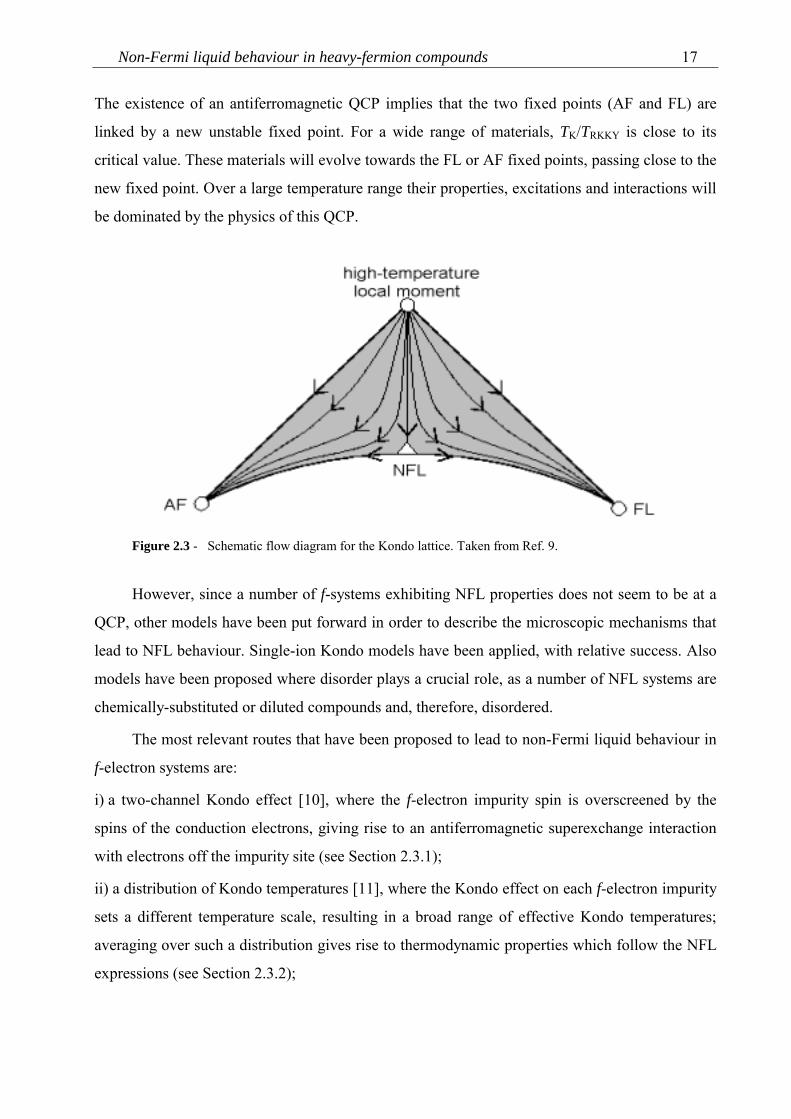
Non-Fermi liquid behaviour in heavy-fermion compounds 17
The existence of an antiferromagnetic QCP implies that the two fixed points (AF and FL) are
linked by a new unstable fixed point. For a wide range of materials, TK/TRKKY is close to its
critical value. These materials will evolve towards the FL or AF fixed points, passing close to the
new fixed point. Over a large temperature range their properties, excitations and interactions will
be dominated by the physics of this QCP.
Figure 2.3 - Schematic flow diagram for the Kondo lattice. Taken from Ref. 9.
However, since a number of f-systems exhibiting NFL properties does not seem to be at a
QCP, other models have been put forward in order to describe the microscopic mechanisms that
lead to NFL behaviour. Single-ion Kondo models have been applied, with relative success. Also
models have been proposed where disorder plays a crucial role, as a number of NFL systems are
chemically-substituted or diluted compounds and, therefore, disordered.
The most relevant routes that have been proposed to lead to non-Fermi liquid behaviour in
f-electron systems are:
i) a two-channel Kondo effect [10], where the f-electron impurity spin is overscreened by the
spins of the conduction electrons, giving rise to an antiferromagnetic superexchange interaction
with electrons off the impurity site (see Section 2.3.1);
ii) a distribution of Kondo temperatures [11], where the Kondo effect on each f-electron impurity
sets a different temperature scale, resulting in a broad range of effective Kondo temperatures;
averaging over such a distribution gives rise to thermodynamic properties which follow the NFL
expressions (see Section 2.3.2);
Chapter 218
iii) a proximity to a QCP [12], where a magnetic or superconducting phase transition occurs at
T = 0 K (either spontaneously or the transition might be tuned to 0 K by an external parameter,
like hydrostatic or chemical pressure); here, the thermodynamic properties are determined by
collective modes corresponding to fluctuations of the order parameter in the vicinity of the
critical point (see Section 2.3.3);
iv) a Griffiths phase model [13] where, due to disorder, magnetic clusters appear in the
paramagnetic phase close to a QCP (see Section 2.3.4).
NFL properties have also been found in d-transition-metal systems. For instance, NixPd1-x
has a ferromagnetic QCP at x = 0.025 [14]. The specific heat, resistivity and magnetic
susceptibility strongly deviate from the standard FL behaviour and can be fully accounted for by
a proximity to a ferromagnetic QCP (see Section 2.3.3).
NFL behaviour may also be found in one-dimensional (1D) systems, where it is described
theoretically by the Luttinger liquid model [15]. In these 1D systems, the electron-electron
interaction is much stronger than in a FL, which may lead to spin-charge separation [16].
Quantum wires [17] and some organic 1D conductors [18] have been described as Luttinger
liquids.
The normal state of high-Tc cuprates is also known to exhibit properties that deviate
strongly from FL behaviour. A so-termed marginal-Fermi liquid model [19] has been proposed
as a phenomenological approach to the behaviour of high-temperature superconductors. Here, it
is assumed that the spin and charge susceptibilities have an unusual form, in that they are
approximately momentum independent and vanish linearly in ω/T for low frequencies. In
contrast, spin and charge of a FL are strongly momentum dependent and have a low-frequency
behaviour that becomes independent of temperature as T→0. This assumption gives rise to a
scattering rate linear in temperature and an effective mass that diverges logarithmically as the
Fermi energy is approached.
Non-Fermi liquid behaviour in heavy-fermion compounds 19
2.3. Routes to non-Fermi liquid behaviour
2.3.1. Multichannel Kondo effect
As mentioned before, within the usual single-channel Kondo effect, the physics of an f-
electron system can be described by a local version of Landau's FL theory [20]. However, a
simple modification of this model can produce NFL behaviour: the multichannel Kondo effect
[10].
In the overcompensated multichannel Kondo model, M identical spin-½ conduction bands
exchange-couple to a single-impurity spin SI with the condition M/2 > SI, so that there are more
conduction spins than needed to fully compensate the impurity.
In the simplest case of the SI=½ two-channel Kondo effect (TCKE) [21], the impurity spin
is overcompensated by the presence of two conduction spins ½. The resulting spin of the ground
state will be ½ and an antiferromagnetic superexchange will be generated with electrons off the
impurity site. In renormalization group language, the kinetic energy introduced by this
superexchange interaction makes the strong-coupling (J→∞) fixed point unstable, since at this
fixed point the kinetic energy is zero. This maps the effective model back to the weak-coupling
(J=0) limit. However, the weak-coupling fixed point is unstable due to the Kondo effect. Thus
both weak- and strong-coupling limits are unstable. Therefore, a non-trivial fixed point at
intermediate coupling must exist [22].
This non-trivial fixed point gives rise to a degenerate ground state and a NFL energy
spectrum. The extra specific-heat coefficient and spin susceptibility per mole of impurity diverge
for T→0 as [23]
BbTT
TA
TTc ′+
′−=
KK
ln)( (2.15a)
KK
1TbT
TT
χ
−χ ln~)( , (2.15b)
where A ' = 0.251R, b = 0.41, bχ is of the order of 1 and B ' is a temperature independent
electronic or crystal-field background in c/T. The resistivity, on the other hand, behaves as [24]
Chapter 220
21
K
1/
~)(
−ρ
TTaT , (2.15c)
where a is of the order of 1. However, while the logarithmic divergence of c/T and χ appears for
T < 0.5TK, ρ ~ 1-aT 1/2 should be observable only for T < 0.05TK [10]. In the intermediate
temperature range 0.05TK < T < TK, ρ ~ 1-aT.
The two channels of conduction spin and the impurity have an effective spin ½. Therefore,
the degeneracy of the impurity spin is never lifted, unlike in the ordinary Kondo problem. This
residual degeneracy manifests itself in a net residual entropy of ½Rln2 per mole impurity. This
residual entropy can be recovered by e.g. an external magnetic field [10], which will lift the
degeneracy.
For the quadrupolar multichannel Kondo effect (QKE) [25], where the electrical
quadrupolar moment of the f-ion interacts with the conduction electrons and their spins provide
the two channels, the susceptibility does not diverge logarithmically but as
′−χ=χ21
K
10/
)()(TTbT (2.16)
with b ' ~ 1.
2.3.2. Kondo disorder model
A distribution of Kondo temperatures TK can arise if a material has large disorder. Around
each single magnetic impurity, antiferromagnetically coupled to conduction electrons (assuming
an effective spin-½ impurity magnetic moment), the Kondo effect will occur at a different value
of TK. Averaging over such a distribution can produce thermodynamic and transport properties
with NFL-like dependencies due to the broad range of effective Fermi temperatures. Essentially,
the unquenched moments contribute to the NFL physics.
In this scenario, a NFL state is generated as a consequence of the interplay of disorder and
strong correlations. The main idea of this model is that moderate bare disorder in a lattice model
of localized moments is magnified due to the strong local correlations between the f-moments
and the conduction electrons. In particular, a broad distribution of local energy scales (Kondo
temperatures) is generated. A few local sites with very low Kondo temperatures are unquenched
Non-Fermi liquid behaviour in heavy-fermion compounds 21
at low temperatures and dominate the thermodynamics and transport, giving rise to a dilute gas
of low-lying excitations above the disordered metallic ground state. The presence of these
unquenched moments leads to the formation of a NFL phase [11].
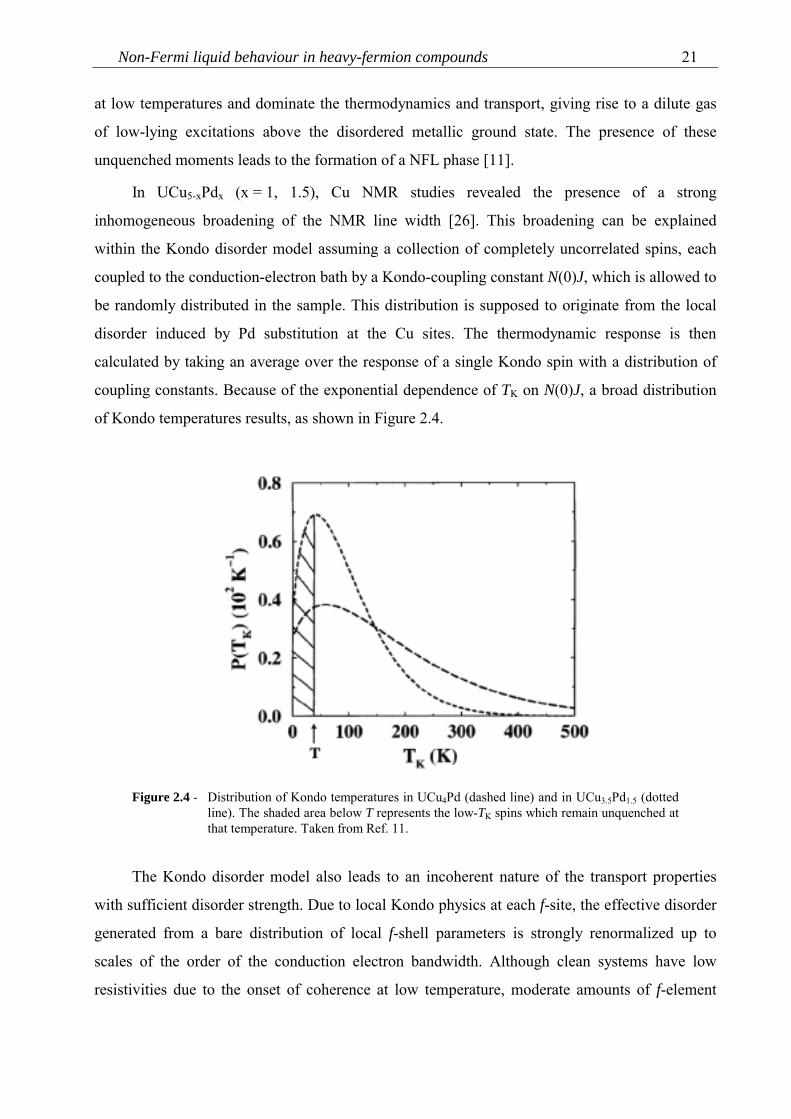
In UCu5-xPdx (x = 1, 1.5), Cu NMR studies revealed the presence of a strong
inhomogeneous broadening of the NMR line width [26]. This broadening can be explained
within the Kondo disorder model assuming a collection of completely uncorrelated spins, each
coupled to the conduction-electron bath by a Kondo-coupling constant N(0)J, which is allowed to
be randomly distributed in the sample. This distribution is supposed to originate from the local
disorder induced by Pd substitution at the Cu sites. The thermodynamic response is then
calculated by taking an average over the response of a single Kondo spin with a distribution of
coupling constants. Because of the exponential dependence of TK on N(0)J, a broad distribution
of Kondo temperatures results, as shown in Figure 2.4.
Figure 2.4 - Distribution of Kondo temperatures in UCu4Pd (dashed line) and in UCu3.5Pd1.5 (dottedline). The shaded area below T represents the low-TK spins which remain unquenched atthat temperature. Taken from Ref. 11.
The Kondo disorder model also leads to an incoherent nature of the transport properties
with sufficient disorder strength. Due to local Kondo physics at each f-site, the effective disorder
generated from a bare distribution of local f-shell parameters is strongly renormalized up to
scales of the order of the conduction electron bandwidth. Although clean systems have low
resistivities due to the onset of coherence at low temperature, moderate amounts of f-element
Chapter 222
disorder are capable of destroying this low-temperature coherence, leading to characteristic
incoherent Kondo scattering behaviour.
The predictions of the model for the specific heat, susceptibility and resistivity are [11]
( )0TTTTc /ln~)( − (2.17a)
( )0TTT /ln~)( −χ (2.17b)
aTT −ρ 1~)( . (2.17c)
2.3.3. Proximity to a quantum critical point
A quantum critical point (QCP) occurs when a critical point such as that associated with a
ferro- or antiferromagnetic transition is tuned to T=0 by some external parameter δ, such as
pressure or dopant concentration. At the QCP (δ=δc), the low-temperature thermodynamics is
determined by collective modes corresponding to fluctuations of the order parameter, rather than
by single-fermion excitations as in a FL. Therefore, NFL properties arise. NFL behaviour can
also occur near quantum spin-glass [27] or superconducting [28] transitions.
Like its finite-temperature counterpart (thermal or classical phase transition), a quantum
phase transition is characterized by a diverging correlation length ξ and a diverging relaxation
time ξ τ . However, the critical fluctuations that lead to these diverging length and time scales are
quantum fluctuations rather than thermal ones. Contrary to the situation for a classical critical
point, the dynamic and static behaviour of a QCP are coupled together. A system at a QCP will
be affected in the same way by either a finite frequency or a finite temperature. The system is
characterized by the dynamical scaling exponent z that describes the divergence of ξ τ . The value
of z affects strongly the static critical behaviour [29]. The dynamical exponent z takes the value
of 2, 3 and 4 for an antiferromagnet, a clean ferromagnet and a dirty ferromagnet, respectively. A
d-dimensional quantum system is related to a classical one with an effective dimension
deff = d+z.
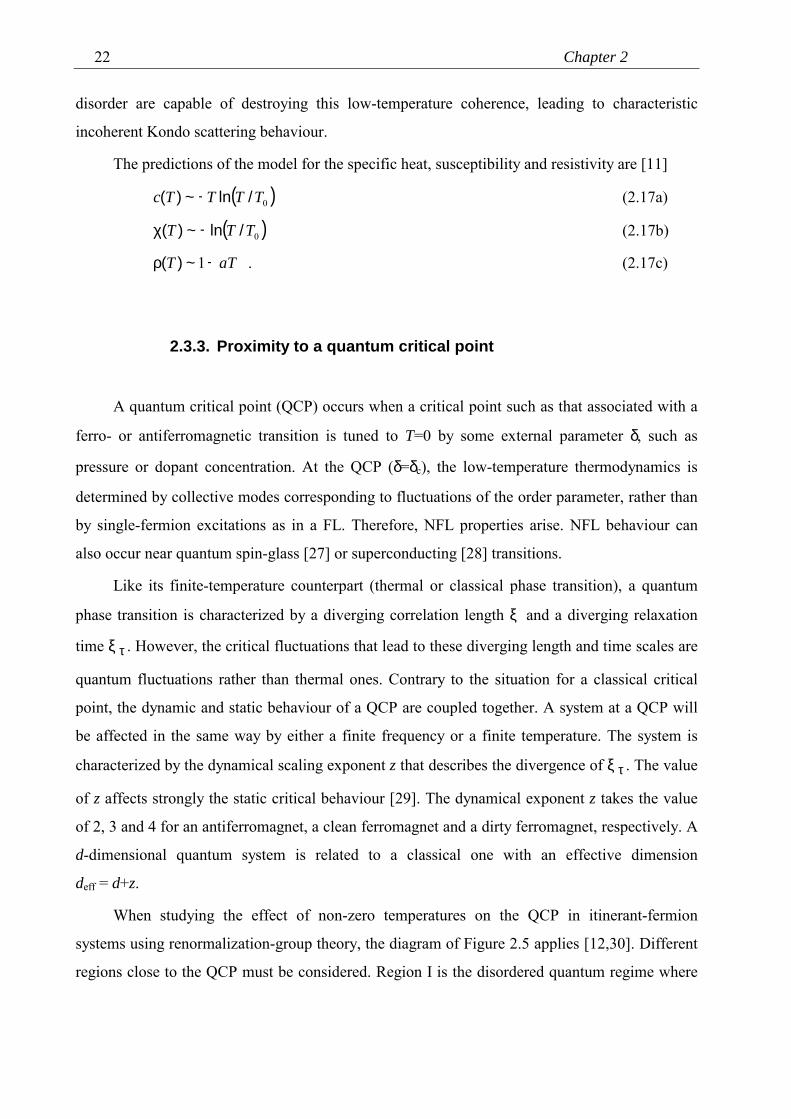
When studying the effect of non-zero temperatures on the QCP in itinerant-fermion
systems using renormalization-group theory, the diagram of Figure 2.5 applies [12,30]. Different
regions close to the QCP must be considered. Region I is the disordered quantum regime where
Non-Fermi liquid behaviour in heavy-fermion compounds 23
the FL picture applies, region II is the perturbative classical regime and region III is the classical
Gaussian regime. The different regimes are separated by the lines
( ) 2cI
/~ zT δ−δ (2.18a)
( ) )/(~ 2cII
−+δ−δ zdzT (2.18b)
( ) )/(~ 2cm
−+δ−δ zdzT . (2.18c)
Figure 2.5 - Phase diagram of the temperature versus the control parameter δ. Region I is thedisordered quantum regime, region II is the perturbative classical regime and region IIIis the classical Gaussian regime. The lines TI, TII and Tm are defined in the text. AfterRef. 12.
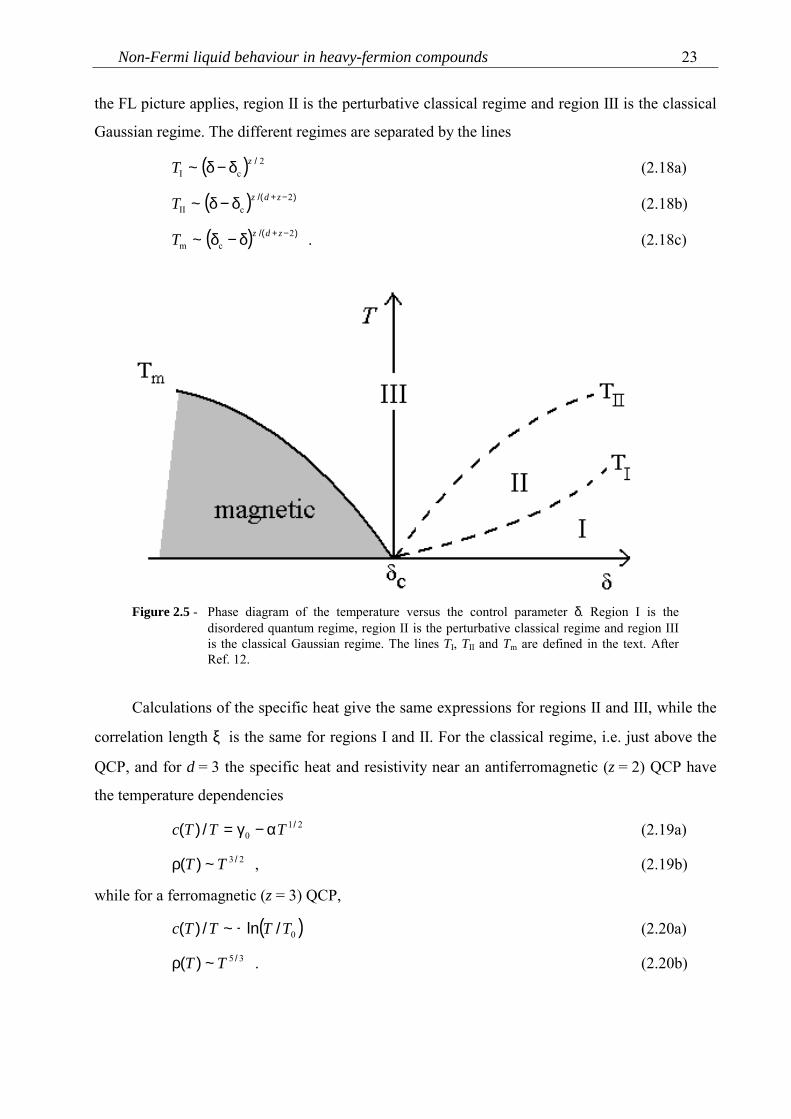
Calculations of the specific heat give the same expressions for regions II and III, while the
correlation length ξ is the same for regions I and II. For the classical regime, i.e. just above the
QCP, and for d = 3 the specific heat and resistivity near an antiferromagnetic (z = 2) QCP have
the temperature dependencies
210
//)( TTTc α−γ= (2.19a)
23 /~)( TTρ , (2.19b)
while for a ferromagnetic (z = 3) QCP,
( )0TTTTc /ln~/)( − (2.20a)
35 /~)( TTρ . (2.20b)
Chapter 224
The same predictions are obtained within the self-consistent renormalization (SCR) theory
of spin fluctuations [31]. The SCR theory takes into account the couplings among the different
modes of spin fluctuations in a self-consistent way. Although initially developed for itinerant d-
electrons, the theory can be modified to nearly localized f-electron systems [32]. It assumes that
around the magnetic phase boundary there are weakly and nearly ferro- and antiferromagnetic
regimes with various anomalous properties, which are predominantly due to exchange-enhanced
spin fluctuations. Within this theory, the d=3 predictions for c(T) and ρ(T) are the same as in
equations 2.19 and 2.20. The pressure dependence of TN or TC is also the same as in equation
2.18c. However, at very low temperatures, c(T) and ρ(T) should attain temperature dependencies
as in the FL theory.
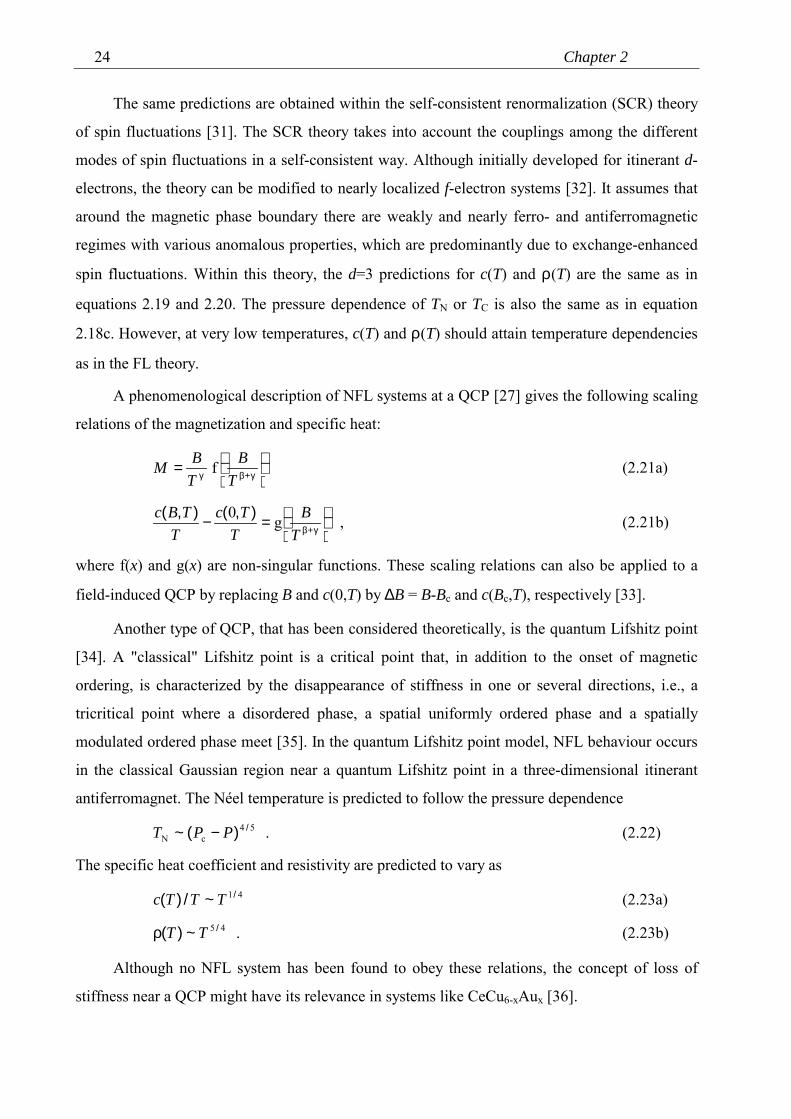
A phenomenological description of NFL systems at a QCP [27] gives the following scaling
relations of the magnetization and specific heat:
= γ+βγ T
BTBM f (2.21a)
=− γ+βT
BT
TcT
TBc g0 ),(),( , (2.21b)
where f(x) and g(x) are non-singular functions. These scaling relations can also be applied to a
field-induced QCP by replacing B and c(0,T) by ∆B = B-Bc and c(Bc,T), respectively [33].
Another type of QCP, that has been considered theoretically, is the quantum Lifshitz point
[34]. A "classical" Lifshitz point is a critical point that, in addition to the onset of magnetic
ordering, is characterized by the disappearance of stiffness in one or several directions, i.e., a
tricritical point where a disordered phase, a spatial uniformly ordered phase and a spatially
modulated ordered phase meet [35]. In the quantum Lifshitz point model, NFL behaviour occurs
in the classical Gaussian region near a quantum Lifshitz point in a three-dimensional itinerant
antiferromagnet. The Néel temperature is predicted to follow the pressure dependence
54cN
/)(~ PPT − . (2.22)
The specific heat coefficient and resistivity are predicted to vary as
41/~/)( TTTc (2.23a)
45 /~)( TTρ . (2.23b)
Although no NFL system has been found to obey these relations, the concept of loss of
stiffness near a QCP might have its relevance in systems like CeCu6-xAux [36].
Non-Fermi liquid behaviour in heavy-fermion compounds 25
Reviews on quantum critical points are given in Refs. 37-40.
2.3.4. Griffiths phase model
Another model, proposed recently, takes into account the effects of disorder near a
quantum critical point. In the Griffiths phase model [13], the presence of disorder is considered
to lead to the coexistence of a metallic paramagnetic phase and a granular magnetic phase. These
coexisting phases are equivalent to the Griffiths phase [41] of a dilute magnetic system.
The "classical" problem of a Griffiths phase occurs in a lattice of magnetic atoms diluted
with non-magnetic atoms. Long-range order is lost at the percolation threshold when the last
infinite cluster of magnetic moments ceases to exist. Above the threshold, the system is
composed of finite clusters of magnetic atoms. When a magnetic field is applied to the
percolation lattice, there is a non-analytic contribution from rare large clusters to the free energy
[41].
For the Griffiths phase model for NFL compounds, a similar picture can be drawn. Two
electronic liquids coexist: in one of them, the magnetic moments are quenched by the Kondo
interaction, giving rise to a FL, while the other is dominated by the RKKY interaction giving rise
to ordered regions. This inhomogeneous situation is energetically favoured by disorder, due to
the entropy contribution to the free energy.
For a generic magnetic HF compound, which exhibits a QCP upon alloying, a phase
diagram can be constructed within this model. For small amounts of doping, the RKKY
interaction dominates and the system orders magnetically. With increasing doping, the quantum
fluctuations grow due to the Kondo effect and the critical temperature decreases until it vanishes
for the critical value of doping. At this QCP, the system percolates. For larger values of doping,
i.e. in the paramagnetic phase, only finite clusters of magnetic atoms can be found. Among these
clusters, there are some rare ones that are large and strongly coupled, in which the spins behave
coherently as a giant spin or a magnetic grain. In this phase, the thermodynamic functions show
essential singularities with strong effects at low temperatures. The specific heat coefficient and
the static susceptibility diverge as
λ+−1TTTc ~)( (2.24a)
λ+−χ 1TT ~)( (2.24b)
Chapter 226
with λ < 1. Notice that λ = 1 corresponds to the FL expressions. The parameter λ also
characterizes the temperature dependence of the mean square deviation of the susceptibility due
to the distribution of susceptibilities in the system and of the non-linear static susceptibility, as
well as the frequency dependencies of the local susceptibility and the NMR relaxation rate [13].
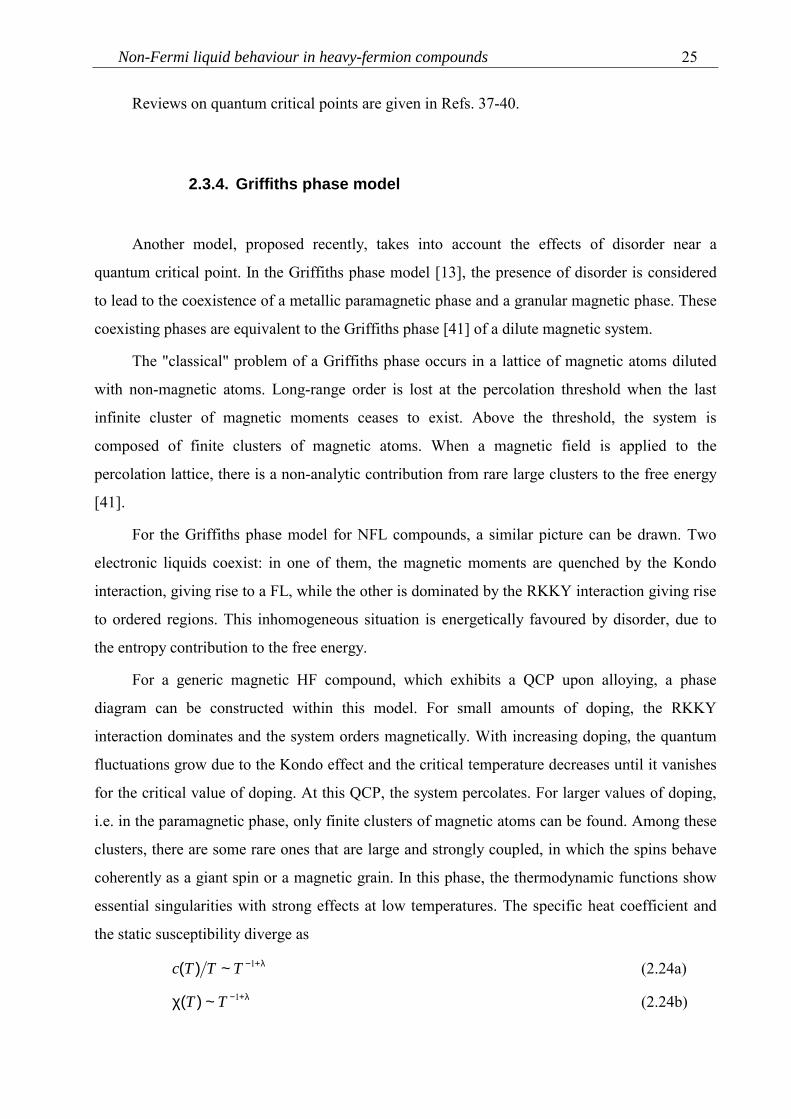
In general terms, within the Griffiths phase model, the NFL behaviour can be observed
over an extended region in the paramagnetic phase next to a QCP (Figure 2.6).
Figure 2.6 - Phase diagram for the Griffiths phase model. δ denotes a control parameter like dopingconcentration or pressure. Taken from Ref. 42.
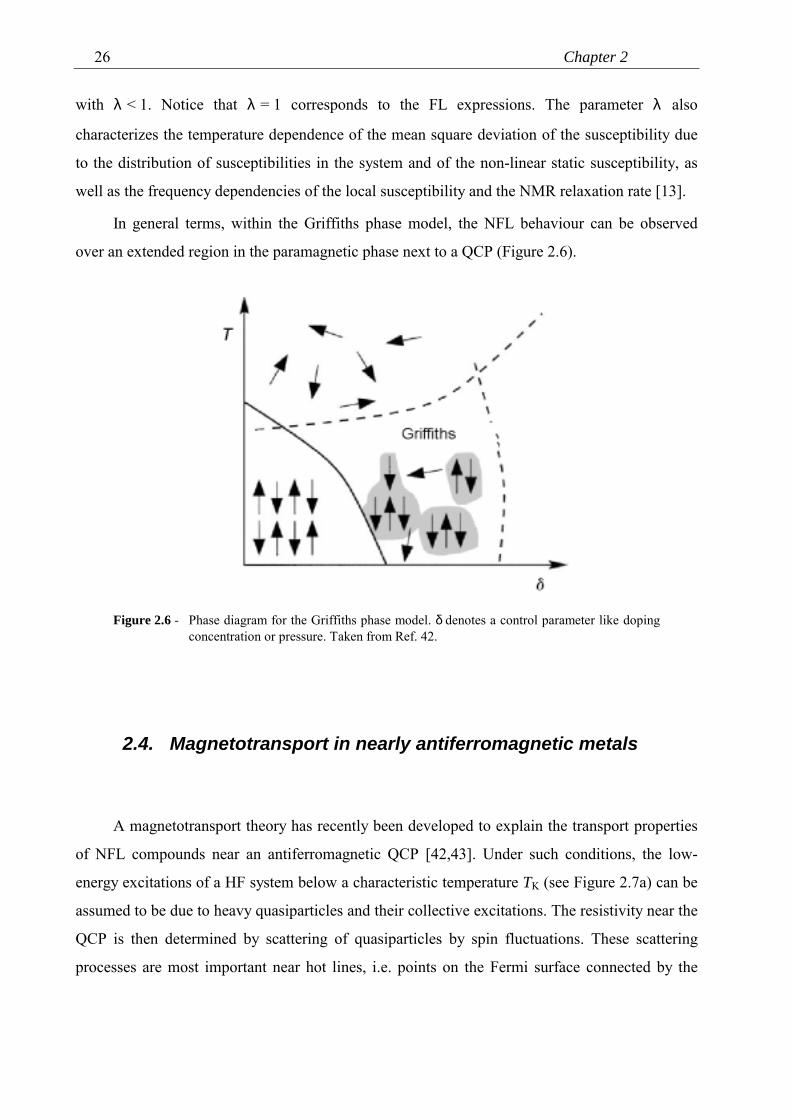
2.4. Magnetotransport in nearly antiferromagnetic metals
A magnetotransport theory has recently been developed to explain the transport properties
of NFL compounds near an antiferromagnetic QCP [42,43]. Under such conditions, the low-
energy excitations of a HF system below a characteristic temperature TK (see Figure 2.7a) can be
assumed to be due to heavy quasiparticles and their collective excitations. The resistivity near the
QCP is then determined by scattering of quasiparticles by spin fluctuations. These scattering
processes are most important near hot lines, i.e. points on the Fermi surface connected by the
Non-Fermi liquid behaviour in heavy-fermion compounds 27
magnetic ordering vector Q. In the remaining cold regions, inelastic scattering is weak (Figure
2.7b).
Figure 2.7 - (a) Phase diagram for an antiferromagnetic QCP. (b) Fermi surface with hot lines wherescattering is enhanced - Q is the ordering vector of the AF phase. Taken from Ref. 42.
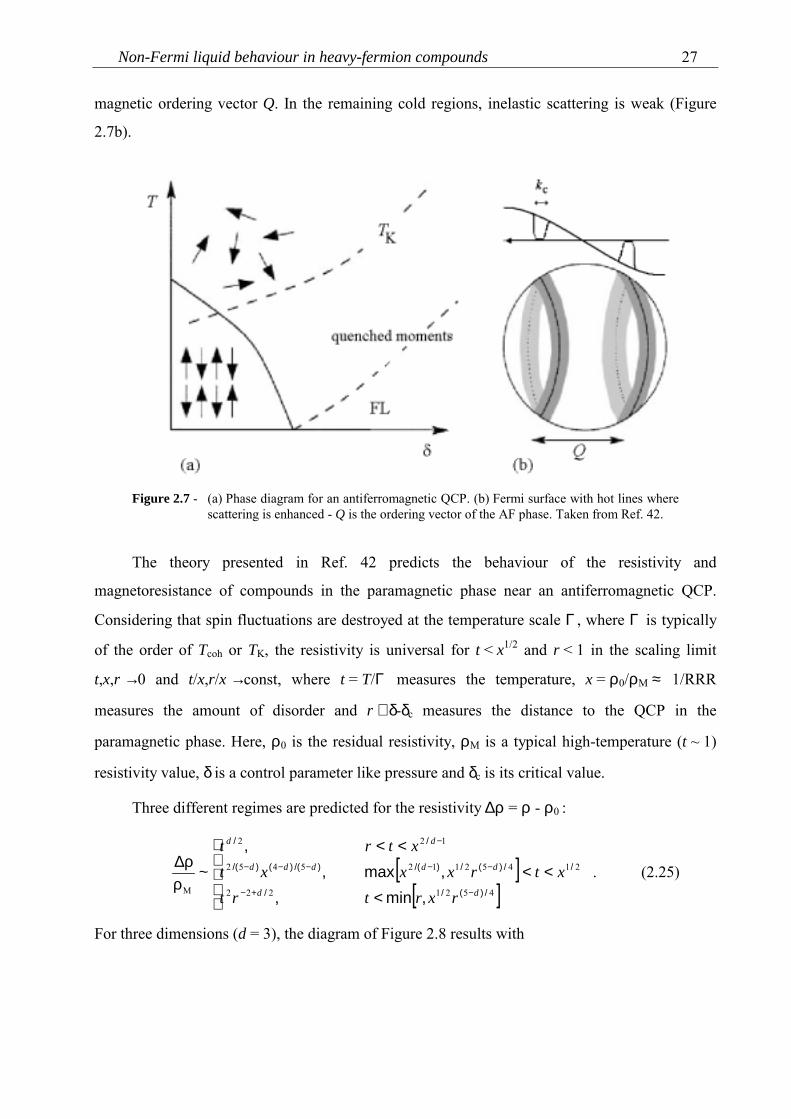
The theory presented in Ref. 42 predicts the behaviour of the resistivity and
magnetoresistance of compounds in the paramagnetic phase near an antiferromagnetic QCP.
Considering that spin fluctuations are destroyed at the temperature scale Γ , where Γ is typically
of the order of Tcoh or TK, the resistivity is universal for t < x1/2 and r < 1 in the scaling limit
t,x,r → 0 and t/x,r/x → const, where t = T/Γ measures the temperature, x = ρ0/ρM ≈ 1/RRR
measures the amount of disorder and r ∝ δ-δc measures the distance to the QCP in the
paramagnetic phase. Here, ρ0 is the residual resistivity, ρM is a typical high-temperature (t ~ 1)
resistivity value, δ is a control parameter like pressure and δc is its critical value.
Three different regimes are predicted for the resistivity ∆ρ = ρ - ρ0 :
[ ][ ]
<<<
<<
ρρ∆
−+−
−−−−−
−
4521222
214521125452
122
M /)(//
//)(/)/()/()()/(
//
,min,,max,
,~
dd
ddddd
dd
rxrtrtxtrxxxt
xtrt . (2.25)
For three dimensions (d = 3), the diagram of Figure 2.8 results with
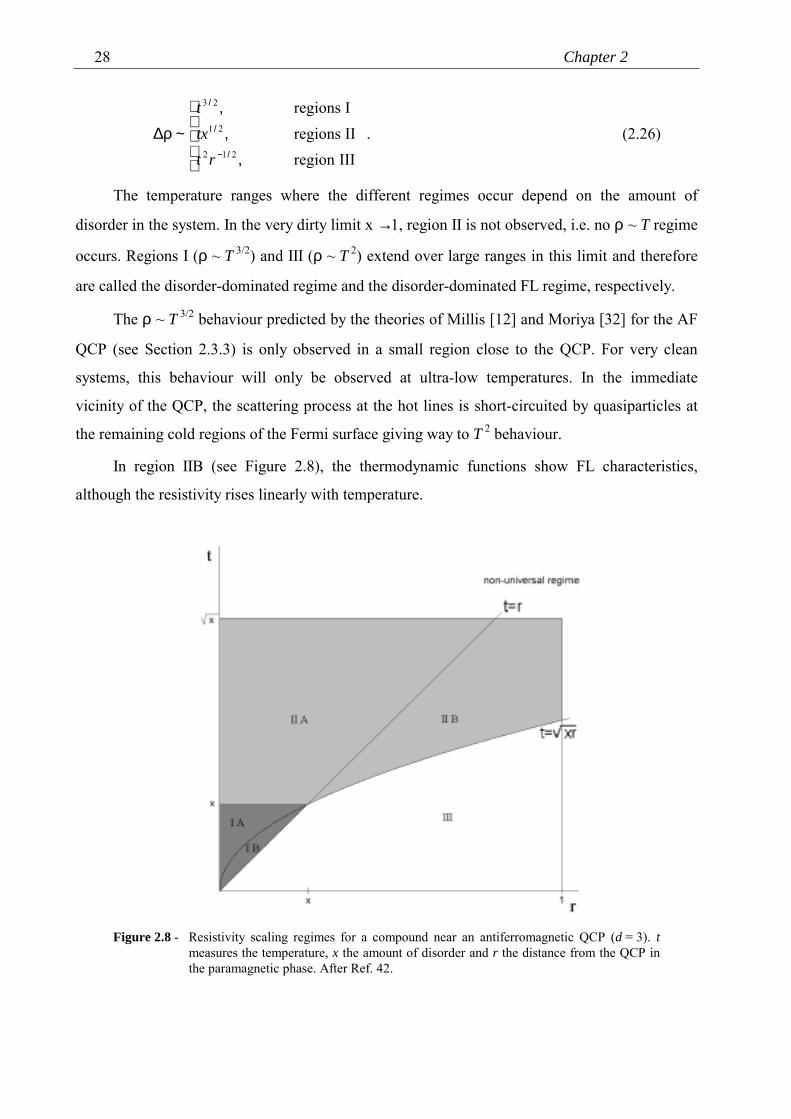
Chapter 228
ρ∆− IIIregion
IIregionsIregions
212
21
23
,,
,~
/
/
/
rttxt
. (2.26)
The temperature ranges where the different regimes occur depend on the amount of
disorder in the system. In the very dirty limit x → 1, region II is not observed, i.e. no ρ ~ T regime
occurs. Regions I (ρ ~ T 3/2) and III (ρ ~ T 2) extend over large ranges in this limit and therefore
are called the disorder-dominated regime and the disorder-dominated FL regime, respectively.
The ρ ~ T 3/2 behaviour predicted by the theories of Millis [12] and Moriya [32] for the AF
QCP (see Section 2.3.3) is only observed in a small region close to the QCP. For very clean
systems, this behaviour will only be observed at ultra-low temperatures. In the immediate
vicinity of the QCP, the scattering process at the hot lines is short-circuited by quasiparticles at
the remaining cold regions of the Fermi surface giving way to T 2 behaviour.
In region IIB (see Figure 2.8), the thermodynamic functions show FL characteristics,
although the resistivity rises linearly with temperature.
Figure 2.8 - Resistivity scaling regimes for a compound near an antiferromagnetic QCP (d = 3). tmeasures the temperature, x the amount of disorder and r the distance from the QCP inthe paramagnetic phase. After Ref. 42.
Non-Fermi liquid behaviour in heavy-fermion compounds 29
In the presence of a magnetic field, the resistivity near a QCP is influenced by spin and
orbital effects. The spin contribution typically suppresses the antiferromagnetic order. In the
paramagnetic phase, AF fluctuations will be suppressed. Within the diagram of Figure 2.8, this
corresponds to an increase of r (the distance to the QCP). The suppression of the fluctuations
reduces the amount of scattering and the resistivity drops. Therefore, a negative
magnetoresistance is expected. Due to the orbital effects, the resistivity increases in field. This
positive magnetoresistance originates because B smears out the quasiparticle distribution,
minimizing the effect that cold regions short-circuit the hot lines.
The field dependence of the resistance due to the orbital effects is different for the different
regions in Figure 2.8. Defining b = B/B0, where B0 is the typical magnetic field necessary to
observe Shubnikov-de Haas oscillations at t = 1, the following dependencies have been predicted
[43]:
− region I (disorder-dominated regime)
<<
<<
<
+−ρ
ρ∆
21212125
212
2
2
22
2523
M
////
/,,
,,,,
//
,
,
,
~
xtbxtx
t
xtbgxbt
gbgxtb
xtt rxt
rxtrxt
(2.27a)
with gt,x,r = max[xr1/2, t1/2xe-x/4t];
− region II (clean systems)
[ ]
<<
<<
<+
ρρ∆
− 41214143
21
2121
221
M ////,,
,/
//
/
,min,
,
,
~
rttxbhh
hbtxb
txbtxbtx
rtrt
rt (2.27b)
with ht,r = min[t3/2, t2r-1/2];
− region III (disorder-dominated FL regime)
<<
><+−
ρρ∆
− 21212123
4
2121253
42
23
4
21
2
M ////
///
//
,
)(,~
rtxbxrxr
t
rxtxrbrxtb
xrt
rt . (2.27c)
Chapter 230
Therefore, this theory predicts a magnetoresistance with an initial B 2 behaviour and a crossover
towards a linear dependence in B before saturation. In the disorder-dominated FL regime (region
III), ∆ρ ~ B is not observed. Besides this positive orbital contribution to the magnetoresistance,
spin effects give a negative magnetoresistance in all regions.
2.5. Examples of non-Fermi liquid compounds
A characteristic of most (but not all) HF compounds exhibiting NFL behaviour is the
presence of a QCP in the phase diagram. For the majority of the known NFL compounds, the
QCP is reached by changing the composition. This introduces disorder in the system and its
effect on the critical behaviour may be crucial. A distinction can be made between systems where
the 4f- or 5f-atom is partially substituted and systems where the ligand configuration is changed.
In the first case, a "Kondo hole" introduced by dilution may lead to substantial scattering and loss
of coherence, while in the second case the f-atoms may experience different local environments
and possibly different local Kondo temperatures. Therefore, even though a QCP is present in the
phase diagram, the mechanism responsible for the NFL behaviour might be of the single-ion type
like Kondo disorder or a multichannel Kondo effect.
NFL properties are also found in a few stoichiometric compounds. The advantage of
stoichiometric compounds is that the role of disorder may not be dominant. Usually, hydrostatic
pressure can be applied in weakly magnetic HF compounds in order to reach the QCP. Examples
of stoichiometric compounds with NFL properties at ambient pressure are U2Pt2In [44],
CeNi2Ge2 [45] and YbRh2Si2 [46]. Evidence for NFL has also been found in the normal state of
CeCu2Si2 [47], which has a complex phase diagram with competition between magnetism and
superconductivity, which relates to an intricate metallurgy.
One of the best studied NFL systems is CeCu6-xAux [48]. CeCu6 is a non-magnetic HF
compound with intersite antiferromagnetic fluctuations, as was shown by inelastic neutron-
scattering experiments. The low-temperature properties are characteristic of a FL. Upon alloying
with Au, the lattice expands. This leads to a decrease of the hybridization between the 4f-orbitals
and Cu 3d-orbitals and, therefore, to a decrease of the exchange interaction J. For x > 0.1, RKKY
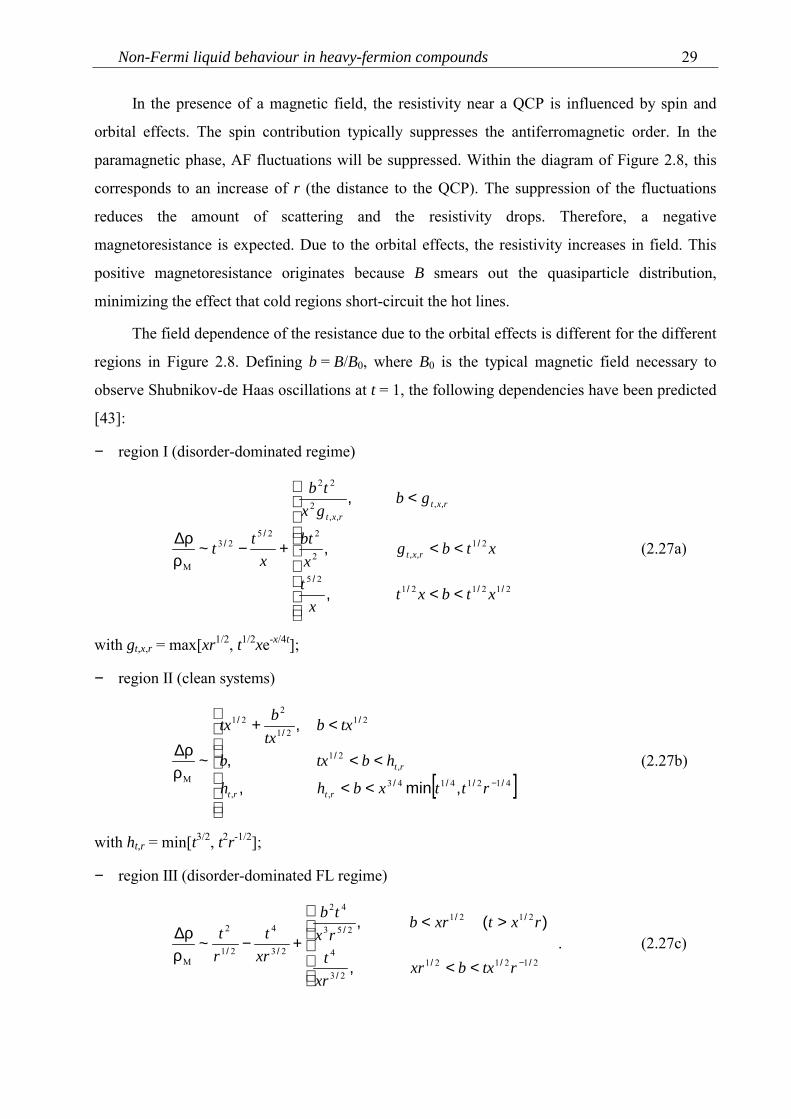
Non-Fermi liquid behaviour in heavy-fermion compounds 31
interaction between the localized moments leads to antiferromagnetic order. At the critical
concentration, xc = 0.1, NFL behaviour is observed (Figure 2.9). Applying pressure has an effect
opposite to Au substitution. The antiferromagnetic phase (x > 0.1) can be tuned to TN=0 by
pressure: e.g. pc = 0.41 GPa (= 4.1 kbar) for x = 0.2 and pc = 0.82 GPa for x = 0.3. At these
pressure values NFL behaviour is observed, as demonstrated by the logarithmic divergence of the
specific heat shown in Figure 2.9. Above the critical-pressure value, FL behaviour is recovered.
Inelastic neutron-scattering studies on CeCu6-xAux have revealed the presence of quasi 2-
dimensional (2D) magnetic critical fluctuations coupled to quasiparticles with 3D dynamics for
x = 0.1 [36]. These 2D fluctuations can be viewed as precursors to the 3D ordering for x > 0.1.
Further support for a 2D character of the critical fluctuations is provided by the fact that the
temperature dependencies of the specific heat and the resistivity of CeCu5.9Au0.1 are in agreement
with the predictions for a 2D antiferromagnetic QCP: c/T ~ -ln(T/T0) and ρ ~ T [12]. Also the
dependencies of TN on the pressure and the Au content are consistent with a 2D AF QCP:
TN ~ |δ-δc|.
Recent inelastic neutron-scattering experiments on single crystals of CeNi2Ge2 also provide
evidence for anisotropic magnetic correlations with a quasi-2D character [49].
Figure 2.9 - Specific heat of CeCu6-xAux (x = 0.1, 0.2, 0.3) plotted as c/T versus logT for differentpressure values. The sharp kinks indicate TN, while the logT behaviour is characteristicof a NFL. For x = 0.1 and p = 6 GPa, the FL is restored. Taken from Ref. 48.
Besides pressure and doping, an external magnetic field can also act as a control parameter.
In many NFL compounds, the specific heat and the resistivity display a tendency towards FL
Chapter 232
behaviour under the influence of a magnetic field. In magnetic systems like CeCu5.2Ag0.8, where
TN = 0.7 K, a magnetic field decreases the Néel temperature and NFL properties are observed at a
critical field value of 2.3 T where TN→0 [33].
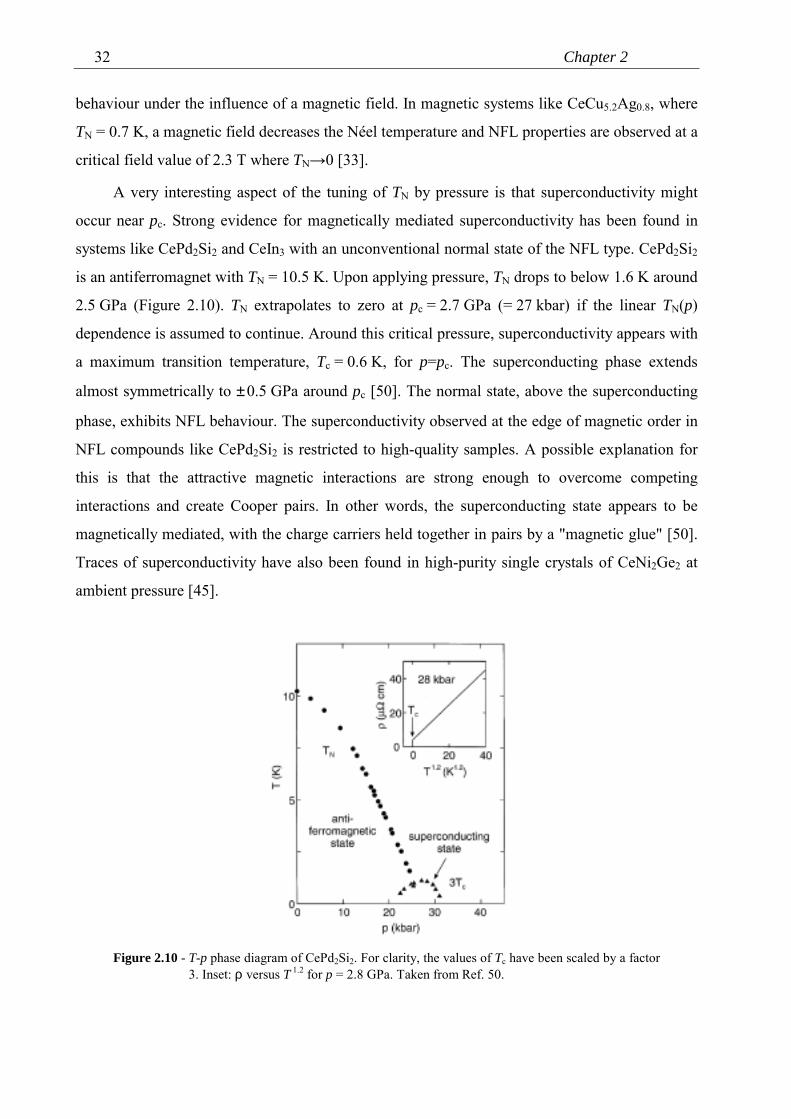
A very interesting aspect of the tuning of TN by pressure is that superconductivity might
occur near pc. Strong evidence for magnetically mediated superconductivity has been found in
systems like CePd2Si2 and CeIn3 with an unconventional normal state of the NFL type. CePd2Si2
is an antiferromagnet with TN = 10.5 K. Upon applying pressure, TN drops to below 1.6 K around
2.5 GPa (Figure 2.10). TN extrapolates to zero at pc = 2.7 GPa (= 27 kbar) if the linear TN(p)
dependence is assumed to continue. Around this critical pressure, superconductivity appears with
a maximum transition temperature, Tc = 0.6 K, for p=pc. The superconducting phase extends
almost symmetrically to ± 0.5 GPa around pc [50]. The normal state, above the superconducting
phase, exhibits NFL behaviour. The superconductivity observed at the edge of magnetic order in
NFL compounds like CePd2Si2 is restricted to high-quality samples. A possible explanation for
this is that the attractive magnetic interactions are strong enough to overcome competing
interactions and create Cooper pairs. In other words, the superconducting state appears to be
magnetically mediated, with the charge carriers held together in pairs by a "magnetic glue" [50].
Traces of superconductivity have also been found in high-purity single crystals of CeNi2Ge2 at
ambient pressure [45].
Figure 2.10 - T-p phase diagram of CePd2Si2. For clarity, the values of Tc have been scaled by a factor3. Inset: ρ versus T 1.2 for p = 2.8 GPa. Taken from Ref. 50.
Non-Fermi liquid behaviour in heavy-fermion compounds 33
Recently, much attention has been devoted to Yb compounds. The physics of Yb and Ce
systems are comparable due to an electron-hole analogy: the missing 4f-electron in the 4f 13
configuration of Yb3+ can be interpreted as the presence of a 4f-hole, in analogy to the 4f 1
electron in Ce3+. Accordingly, Yb systems respond to doping and pressure in reverse with respect
to Ce systems. For instance, pressure may drive Yb compounds towards the magnetic regime,
crossing the QCP from the non-magnetic side, while in Ce compounds the opposite effect is
observed. Another important property is the valence of the Yb ion: divalent Yb (4f 14
configuration) is non-magnetic, while trivalent Yb (4f 13) is magnetic. Proper substitutions of the
ligand atoms in an Yb system may induce a crossover from the divalent to the trivalent state,
hence inducing a crossover from a non-magnetic to a magnetic compound. This occurs e.g. in the
system YbCu5-xAlx, where a gradual change of the valence of Yb is observed with increasing Al
content x: non-magnetic Yb(4f 14) for x=0 and magnetic Yb(4f 13) for x = 2. A quantum critical
point occurs for x = 1.5, where NFL properties are observed [51].
Many attempts have been made to group all NFL heavy-fermion compounds in one
universal class. However, there does not seem to be a single and uniform picture of the
mechanism responsible for NFL behaviour. One striking example of this diversity is the system
U1-xMxPd2Al3 with M = Th or Y. UPd2Al3 is a well known HF compound with coexistence of
antiferromagnetism and superconductivity. Upon Th doping (x < 0.2), TN decreases only slightly
and Tc→0 at x ~ 0.1. This small decrease suggests that U is tetravalent, just like Th, in
U1-xThxPd2Al3 for 0 ≤ x < 0.2 [52]. As the Th content increases further, a crossover region
(0.2 < x < 0.4) occurs where neither antiferromagnetism nor superconductivity has been
observed. For x > 0.6, NFL behaviour is observed. The NFL characteristics of ρ, c and χ scale
with x and TK, indicating that a single-ion mechanism could be responsible for the NFL. No QCP
seems to be present in the T-x diagram. On the other hand, the T-x diagram of the U1-xYxPd2Al3
system is remarkably different. Upon Y doping, TN decreases rapidly and Tc=0 for x ~ 0.03. NFL
behaviour occurs around the QCP at xc = 0.7, where TN vanishes. The characteristics of ρ, c and
χ are consistent with cooperative phenomena arising from fluctuations related to magnetic order
above the QCP [52]. Therefore, substitutions with Y3+ or Th4+ lead to NFL regimes associated
with different mechanisms: single-ion for Th and cooperative for Y.
NFL properties have been observed in many other systems. A list of some representative
HF compounds exhibiting NFL behaviour is given in Table 2.1. Recent reviews are given in
Refs. 8, 47, 48 and 51.
Chapter 234
Table 2.1 - List of some HF compounds exhibiting NFL properties. References to most recent andgeneral papers are given (for the original works see references therein).
compound /system
conditionsfor NFL
notes Ref.
YbRh2Si2 - 46CeNi2Ge2 - traces of superconductivity 45U2Pt2In - 44Ce7Ni3 p=0.4 GPa intrinsic crystallographic disorder 53
CePd2Si2 p=2.7 GPa superconductivity 50CeRu2Ge2 p=6.7 GPa 54YbCu5-xAlx x=1.5 51CeCu6-xAux x=0.1 2D antiferromagnetic fluctuations 36,48
Ce(Ru1-xRhx)2Si2 x=0.5 AF phase for x>0.6, SDW phase for x<0.4 55,56U2Cu17-xAlx x=5 57UCu5-xPdx x=1, x=1.5 Kondo disorder 26
Ce1-xLaxRu2Si2 x=0.075 58U1-xThxRu2Si2 x=0.93 59U1-xThxCu2Si2 x=0.9 ferromagnetic QCP 60U1-xThxBe13 x=0.1 QKE 61
U1-xThxPd2Al3 x=0.6 52U1-xYxPd2Al3 x=0.8 52
U1-xYxPd3 x=0.8 spin-glass order for x<0.8 62,63
References1. K. Kadowaki and S.B. Woods, Solid State Commun. 58 (1986) 507.2. J. Kondo, Prog. Theor. Phys. 32 (1964) 37.3. S. Doniach, Physica B 91 (1977) 231.4. G.R. Stewart, Rev. Mod. Phys. 56 (1984) 755.5. N. Grewe and F. Steglich, in "Handbook on the Physics and Chemistry of the Rare Earths"
vol. 14 (K.A. Gschneidner Jr. and L. Eyring, eds.), Elsevier, Amsterdam, 1991, p. 343.6. D. Pines and P. Nozières, "The Theory of Quantum Liquids", Addison-Wesley, New York,
1989.7. G. Baym and C.J. Pethick, "Landau Fermi Liquid Theory", John Wiley, New York, 1991.8. Proc. ITP Conference on Non-Fermi Liquid Behaviour in Metals, Santa Barbara, 1996, in J.
Phys.: Condens. Matter 8 (1996) 9675 ff.9. P. Coleman, Physica B 259-261 (1999) 353.10. D.L. Cox and M. Jarrel, J. Phys.: Condens. Matter 8 (1996) 9825.11. E. Miranda, V. Dobrosavljević and G. Kotliar, J. Phys.: Condens. Matter 8 (1996) 9871.12. A.J. Millis, Phys. Rev. B 48 (1993) 7183.13. A.H. Castro Neto, G. Castilla and B.A. Jones, Phys. Rev. Lett. 81 (1998) 3531.
Non-Fermi liquid behaviour in heavy-fermion compounds 35
14. M. Nicklas, M. Brando, G. Knebel, F. Mayr, W. Trinkl and A. Loidl, Phys. Rev. Lett. 82(1999) 4268.
15. J.M. Luttinger, J. Math. Phys. 4 (1963) 1154.16. F.D.M. Haldane, Phys. Rev. Lett. 45 (1980) 1358.17. X.G. Wen, Phys. Rev. B 41 (1990) 12838.18. C. Bourbonnais and D. Jérome, Phys. World (sept. 1998) 41.19. C.M. Varma, P.D. Littlewood, S. Schmitt-Rink, E. Abrahams and A.E. Ruckenstein, Phys.
Rev. Lett. 63 (1989) 1996.20. P. Nozières, J. Low Temp. Phys. 17 (1974) 31.21. P. Nozières and A. Blandin, J. Physique 41 (1980) 193.22. T.S. Kim, L.N. Oliveira and D.L. Cox, Phys. Rev. B 55 (1997) 12460.23. P. Schlottmann and P.D. Sacramento, Adv. Phys. 42 (1993) 641.24. A.W.W. Ludwig and I. Affleck, Phys. Rev. Lett. 57 (1991) 3160.25. D.L. Cox, Phys. Rev. Lett. 59 (1987) 1240.26. O.O. Bernal, D.E. MacLaughlin, H.G. Lukefahr and B. Andraka, Phys. Rev. Lett. 75 (1995)
2023.27. A.M. Tsvelik and M. Reizer, Phys. Rev. B 48 (1993) 9887.28. R. Ramazashvili, Phys. Rev. B 56 (1997) 5518.29. J.A. Hertz, Phys. Rev. B 14 (1976) 1165.30. U. Zülicke and A.J. Millis, Phys. Rev. B 51 (1995) 8996.31. T. Moriya, "Spin Fluctuations in Itinerant Electron Magnetism", Springer-Verlag, Berlin,
1985.32. T. Moriya and T. Takimoto, J. Phys. Soc. Jpn. 64 (1995) 960.33. K. Heuser, E.W. Scheidt, T. Schreiner and G.R. Stewart, Phys. Rev. B 58 (1998) R15959.34. R. Ramazashvili, Phys. Rev. B 60 (1999) 7314.35. P.M. Chaikin and T.C. Lubensky, "Principles of Condensed Matter Physics", Cambridge
University Press, Cambridge, 1995, p. 184.36. A. Rosch, A. Schröder, O. Stockert and H.v. Löhneysen, Phys. Rev. Lett. 79 (1997) 159.37. T.R. Kirkpatrick and D. Belitz, in "Electron Correlation in the Solid State" (N.H. March,
ed.), Imperial College Press, London, 1999.38. M.A. Continentino, Phys. Rep. 239 (1994) 179.39. S.L. Sondhi, S.M. Girvin, J.P. Carini and D. Shahar, Rev. Mod. Phys. 69 (1997) 315.40. S. Sachdev, "Quantum Phase Transitions", Cambridge University Press, Cambridge, 1999.41. R.B. Griffiths, Phys. Rev. Lett. 23 (1969) 17.42. A. Rosch, Physica B 280 (2000) 341.43. A. Rosch, preprint (cond-mat/9910432).44. P. Estrela, A. de Visser, F.R. de Boer, G.J. Nieuwenhuys, L.C.J. Pereira and M. Almeida,
Physica B 259-261 (1999) 409.
Chapter 236
45. P. Gegenwart, F. Kromer, M. Lang, G. Sparn, C. Geibel and F. Steglich, Phys. Rev. Lett. 82(1999) 1293.
46. O. Trovarelli, C. Geibel, C. Langhammer, S. Mederle, P. Gegenwart, F.M. Grosche, M.Lang, G. Sparn and F. Steglich, Physica B 281-282 (2000) 372.
47. F. Steglich, P. Gegenwart, C. Geibel, P. Hinze, M. Lang, C. Langhammer, G. Sparn and O.Trovarelli, Physica B 280 (2000) 349.
48. H.v. Löhneysen, J. Magn. Magn. Mater. 200 (1999) 532.49. B. Fåk, J. Flouquet, G. Lapertot, T. Fukuhara and H. Kadowaki, J. Phys.: Condens. Matter
12 (2000) 5423.50. N.D. Mathur, F.M. Grosche, S.R. Julian, I.R. Walker, D.M. Freye, R.K.W. Haselwimmer
and G.G. Lonzarich, Nature 394 (1998) 39.51. E. Bauer, J. Magn. Magn. Mater. 196-197 (1999) 873.52. M.B. Maple, A. Amann, R.P. Dickey, E.J. Freeman, C. Sirvent, M.C. de Andrade and N.R.
Dilley, Physica B 281-282 (2000) 332.53. K. Umeo, H. Kadomatsu and T. Takabatake, J. Phys.: Condens. Matter 8 (1996) 9743.54. S. Süllow, M.C. Aronson, B.D. Rainford and P. Haen, Phys. Rev. Lett. 82 (1999) 2963.55. T. Takeuchi, Y. Yamamoto, M. Sato, Y. Tabata, T. Taniguchi, S. Kawarazaki, M. Ocio, P.
Pari, J. Hammann and Y. Miyako, Jpn. J. Appl. Phys. series 11 (1999) 151.56. C.Y. Liu, D.E. MacLaughlin, A.H. Castro Neto, H.G. Lukefahr, J.D. Thompson, J.L. Sarrao
and Z. Fisk, Phys. Rev. B (2000) 432.57. R. Pietri, B. Andraka, R. Troć and V.H. Tran, Phys. Rev. B 56 (1997) 14505.58. S. Raymond, L.P. Regnault, S. Kambe, J.M. Mignot, P. Lejay, J. Flouquet, J. Low Temp.
Phys. 109 (1997) 205.59. H. Amitsuka, K. Kuwahara, M. Yokoyama, K. Tenya, T. Sakakibara, M. Mihalik and A.A.
Menovský, Physica B 281-282 (2000) 326.60. M. Lenkewitz, S. Corsépius, G.F.v. Blanckenhagen and G.R. Stewart, Phys. Rev. B 55
(1997) 6409.61. F.G. Aliev, S. Vieira, R. Villar and V.V. Moshchalkov, J. Phys.: Condens. Matter 8 (1996)
9807.62. D.A. Gajewski, N.R. Diley, R. Chau and M.B. Maple, J. Phys.: Condens. Matter 8 (1996)
9793.63. M.A. Lopez de la Torre, J.R. Fernandez and K.A. McEwen, J. Appl. Phys. 79 (1996) 6364.
Experimental
A variety of experimental techniques was used to investigate the thermal, magnetic and
transport properties of U2Pt2In and related compounds. Since most of the techniques and
experimental set-ups have been described in detail by others, only a short presentation is given
here. General overviews of cryogenic techniques and low-temperature thermometry are given by
Pobell [1], White [2] and Betts [3]. Descriptions of the particular 3He system and 3He/4He
dilution refrigerator used in this work are given in Refs. 4 and 5 and Refs. 6 and 7, respectively.
The pressure cell used for the magnetotransport experiments is described in Section 3.3.1.
Section 3.6 is devoted to the µSR technique, which is described in more detail.
3.1. Sample preparation
The preparation methods of the single crystals studied in this work will be described in
Chapters 4 (U2Pt2In) and 7 (other compounds), where the corresponding experimental results are
presented and discussed. Regarding U2Pt2In, it should be mentioned that it is a difficult material
to prepare under normal arc-melting conditions due to In evaporation. Indium evaporation leads
to the formation of a secondary phase, namely UPt. In fact, small single crystals of UPt have been
grown recently out of polycrystalline U2Pt2In by inducing complete In evaporation through
annealing [8].
Chapter 338
Traces of superconductivity at about 0.7 K have been detected in the resistivity of certain
polycrystalline samples of U2Pt2In. A.c.-susceptibility measurements showed however that
superconductivity is not a bulk property. Electron probe microanalysis (EPMA) on these samples
indicate the presence of a network of UPt as an impurity phase. Upon annealing, the network is
partially destroyed and the superconducting transition is suppressed. Other batches of
polycrystalline U2Pt2In, containing UPtIn as an impurity phase, show a full superconducting
resistive transition at 0.85 K. The superconducting phase has a critical field of about 1.4 T.
Neither UPt nor UPtIn present a sign of superconductivity at low temperatures. The
superconducting phase might be an In-rich phase precipitated at the U2Pt2In grain boundaries.
The single-crystalline batches of U2Pt2In, from which the specimens used in this work were
taken, are, as far as it has been reported, the only ones prepared so far.
For general references on crystal growth of U and Ce intermetallic compounds, see e.g.
Refs. 9 and 10.
The structural properties of most of the samples used were checked by means of X-ray and
neutron diffraction, optical microscopy and secondary electron microscopy. The quality of the
single crystals of U2Pt2In was also checked by means of EPMA at the FOM-ALMOS facility.
The single crystals were oriented by means of the X-ray back-reflection Laue method.
Next, they were cut by spark-erosion. For the thermal-expansion measurements, the relevant
surfaces of the samples were shaped plane-parallel within 5 µm by means of spark-erosion.
3.2. Magnetization
Magnetization measurements were performed by means of a commercial Quantum Design
SQUID magnetometer (2 K ≤ T < 400 K, -5.5 T ≤ B ≤ 5.5 T) at the University of Lisbon.
High-field magnetization measurements up to 35 T were performed at the High-Field
Facility of the University of Amsterdam [11]. Field pulses of 7, 14, 21 and 35 T were used with
the magnetization measured during a 7-step field decay. After each pulse, the empty pick-up coil
was measured. The magnetization of the sample plus teflon holder is then given by
Experimental 39
M = Msample-in -Msample-out. The contribution of the teflon sample holder was measured in the same
way, in order to correct the data for the diamagnetic signal of teflon.
3.3. Resistivity and magnetoresistance
Resistivity measurements were performed using a standard a.c. 4-probe method with a
Linear Research resistance bridge (model LR-400 or LR-700). Since most of the materials used
in this work are very brittle, the voltage and current leads (copper wires with thickness of 50 µm)
were attached to the bar-shaped samples with silver paste. Excitation currents of 300 µA or lower
were applied in order to prevent Joule heating.
High-field magnetoresistance measurements were carried out using the step-wise field
decay of 7, 14 and 21 T pulses. In addition, free (exponential-like) decays of 5, 20 and 38 T
pulses were used.
3.3.1. Resistivity under pressure
Resistivity measurements were performed under hydrostatic pressures up to 2 GPa
(=20 kbar) in a 3He system. An overview of pressure techniques and pressure cells is given in
Ref. 12.
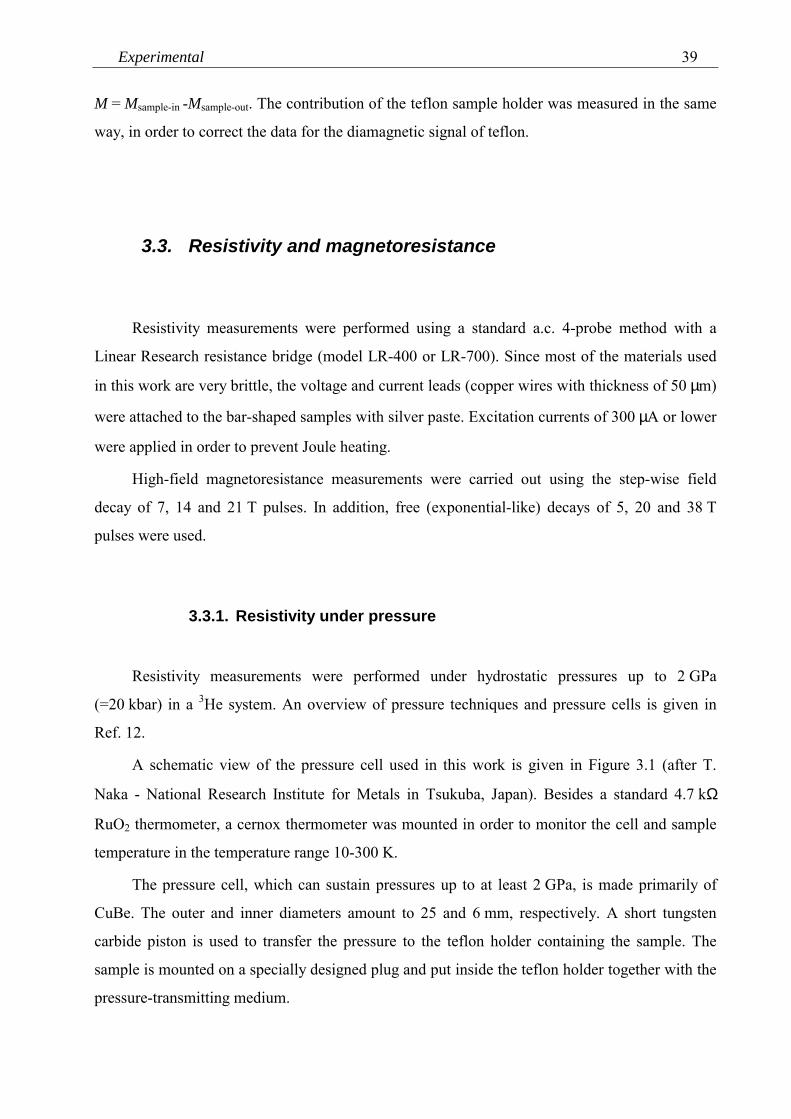
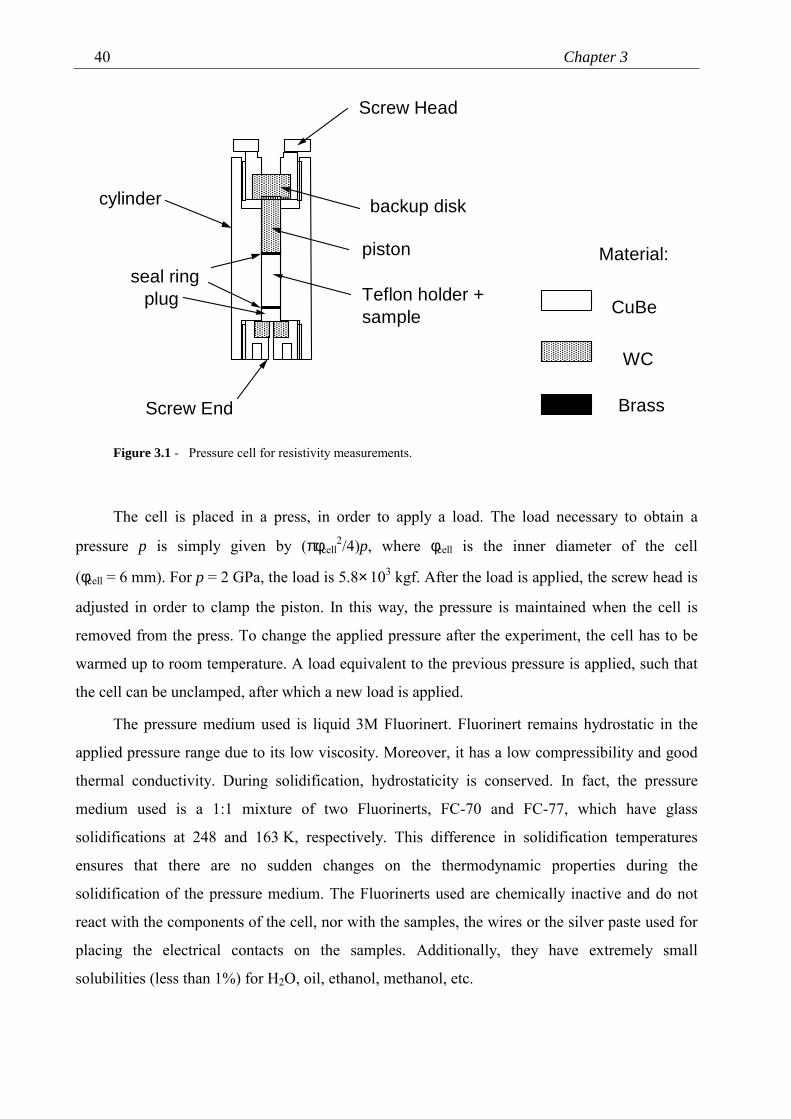
A schematic view of the pressure cell used in this work is given in Figure 3.1 (after T.
Naka - National Research Institute for Metals in Tsukuba, Japan). Besides a standard 4.7 kΩ
RuO2 thermometer, a cernox thermometer was mounted in order to monitor the cell and sample
temperature in the temperature range 10-300 K.
The pressure cell, which can sustain pressures up to at least 2 GPa, is made primarily of
CuBe. The outer and inner diameters amount to 25 and 6 mm, respectively. A short tungsten
carbide piston is used to transfer the pressure to the teflon holder containing the sample. The
sample is mounted on a specially designed plug and put inside the teflon holder together with the
pressure-transmitting medium.
Chapter 340
CuBe
Material:
WC
Brass
Screw Head
cylinder
Screw End
piston
Teflon holder +sample
backup disk
plugseal ring
Figure 3.1 - Pressure cell for resistivity measurements.
The cell is placed in a press, in order to apply a load. The load necessary to obtain a
pressure p is simply given by (πφcell2/4)p, where φcell is the inner diameter of the cell
(φcell = 6 mm). For p = 2 GPa, the load is 5.8×10³ kgf. After the load is applied, the screw head is
adjusted in order to clamp the piston. In this way, the pressure is maintained when the cell is
removed from the press. To change the applied pressure after the experiment, the cell has to be
warmed up to room temperature. A load equivalent to the previous pressure is applied, such that
the cell can be unclamped, after which a new load is applied.
The pressure medium used is liquid 3M Fluorinert. Fluorinert remains hydrostatic in the
applied pressure range due to its low viscosity. Moreover, it has a low compressibility and good
thermal conductivity. During solidification, hydrostaticity is conserved. In fact, the pressure
medium used is a 1:1 mixture of two Fluorinerts, FC-70 and FC-77, which have glass
solidifications at 248 and 163 K, respectively. This difference in solidification temperatures
ensures that there are no sudden changes on the thermodynamic properties during the
solidification of the pressure medium. The Fluorinerts used are chemically inactive and do not
react with the components of the cell, nor with the samples, the wires or the silver paste used for
placing the electrical contacts on the samples. Additionally, they have extremely small
solubilities (less than 1%) for H2O, oil, ethanol, methanol, etc.
Experimental 41
Due to the different thermal-expansion coefficients of the pressure medium and the cell
components, the pressure reduces during cooling. The pressure values presented in this work
were corrected for an empirical low-temperature efficiency value of 80% obtained by T. Naka on
the same cell.
3.4. Specific heat
Specific-heat measurements were performed using a relaxation method at low temperatures
(dilution refrigerator and 3He system) and a semi-adiabatic method at high temperatures (4He
bath cryostat).
In the relaxation method, sample and addenda are connected by a weak thermal link to a
heat reservoir at constant temperature T0. A constant power Q is applied to a heater on the
sample holder (sapphire plate) until thermal equilibrium is achieved at a temperature T+∆T.
When the power is switched off, the sample and addenda will have an exponential relaxation
towards the reservoir temperature T0: T(t) = T0 + ∆T e-t/τ . The relaxation time τ is related to the
heat capacity C by C = τ k = τ Q /∆T where k is the thermal conductivity.
For heavy-fermion compounds, which present large specific heats, the addenda
contribution at low temperatures to the total heat capacity is small and can be neglected. Special
care was taken to stabilize the temperature of the sample since bad thermalization induces errors
in the measured values of ∆T and the calculated values of τ . The power supplied by the heater is
calculated after measuring the voltage Vref across a reference resistance Rref, in series with the
heater, and the voltage drop over the heater: Q = Vheater Iheater = Vheater Vref /Rref.
In the semi-adiabatic method, there is no deliberate thermal link between the sample and
the heat reservoir. A heat pulse of energy ∆Q gives a sample temperature rise ∆T and the heat
capacity is simply given by C = ∆Q/∆T. The high-temperature specific-heat data presented in this
work have been corrected for the contribution of the addenda.
A description of the used experimental set-ups is given in Refs. 6 and 13.
Chapter 342
3.5. Thermal expansion
Thermal-expansion measurements were carried out with a parallel-plate capacitance
method. The capacitance of a parallel-plate capacitor is C = εA/d where ε is the dielectric
constant of the medium between the plates, A the area of the plates and d the distance between
the plates. Typical gap distances used are d = 100 µm. The length change of the sample as
function of temperature is proportional to the change in capacitance. The uncertainty in the
determination of the effective area of the capacitor plates, εA = 9.73×10⁻¹⁶ Fm, gives an accuracy
limit of about 3% on the absolute value of the experimental data. The capacitance was measured
using a sensitive three-terminal technique with an Andeen-Hagerling capacitance bridge. The
maximum sensitivity of the set-up used is about 0.01 Å for a sample of 5 mm. A schematic
drawing of the capacitance cell is given in Ref. 14.
The coefficient of linear thermal expansion is given by α = 1/L (dL/dT) where L is the
length of the sample. A heating in steps of ∆T is used. The linear thermal expansion of the
sample is calculated from
CuCucellsamplecell
11 α+
∆∆+
∆∆−=α
++ Td
LTd
L . (3.1)
Here, the first term corresponds to the change in gap distance with the sample mounted in the
cell, the second term is the corresponding change with a oxygen-free high-conductivity (OFHC)
copper sample mounted in the cell (cell effect) and the third term is the correction for the linear
thermal expansion of the OFHC copper of the cell. The cell effect is small at low temperatures
(∆d/∆T = -2.5 Å/K at T = 4.2 K). However, a progressive increase is observed when the
temperature is further decreased (∆d/∆T = -9.0 Å/K at T = 0.3 K).
The volume expansion coefficient αV, where V = abc is the volume, is given by
cbaV11 α+α+α=
++==α
Tcabc
Tbabc
Ta
abcTV
V dd
dd
dd
dd . (3.2)
For general references on thermal-expansion measurements see Refs. 15-17.
Experimental 43
3.6. Muon Spin Relaxation and Rotation
µSR is an acronym for Muon Spin Relaxation, Rotation, Resonance or even Research. µSR
is a technique increasingly used in solid state physics, chemistry and materials science because of
its sensitivity to static and dynamic microscopic magnetic fields, which enables a study of
relevant aspects of structural, magnetic and electronic phenomena in magnets, superconductors,
semiconductors and insulators. In the µSR technique, the positive muon, µ+, is used as a probe.
Intense µ+ beams with a high spin polarization can be produced. Some properties of µ+ are given
in Table 3.1. A general description of the µSR technique can be found in Refs. 18-20, while
experimental results on some exemplary materials are given in Refs. 21-23. The µSR
experiments presented in this work were carried out at the Paul Scherrer Institute (PSI) in
Villigen (Switzerland), in the General Purpose Spectrometer (GPS), equipped with a gas flow4He cryostat for 1.5 K ≤ T ≤ 300 K, and in the Low Temperature Facility (LTF), equipped with a
top-loading dilution refrigerator with a base temperature of about 0.025 K.
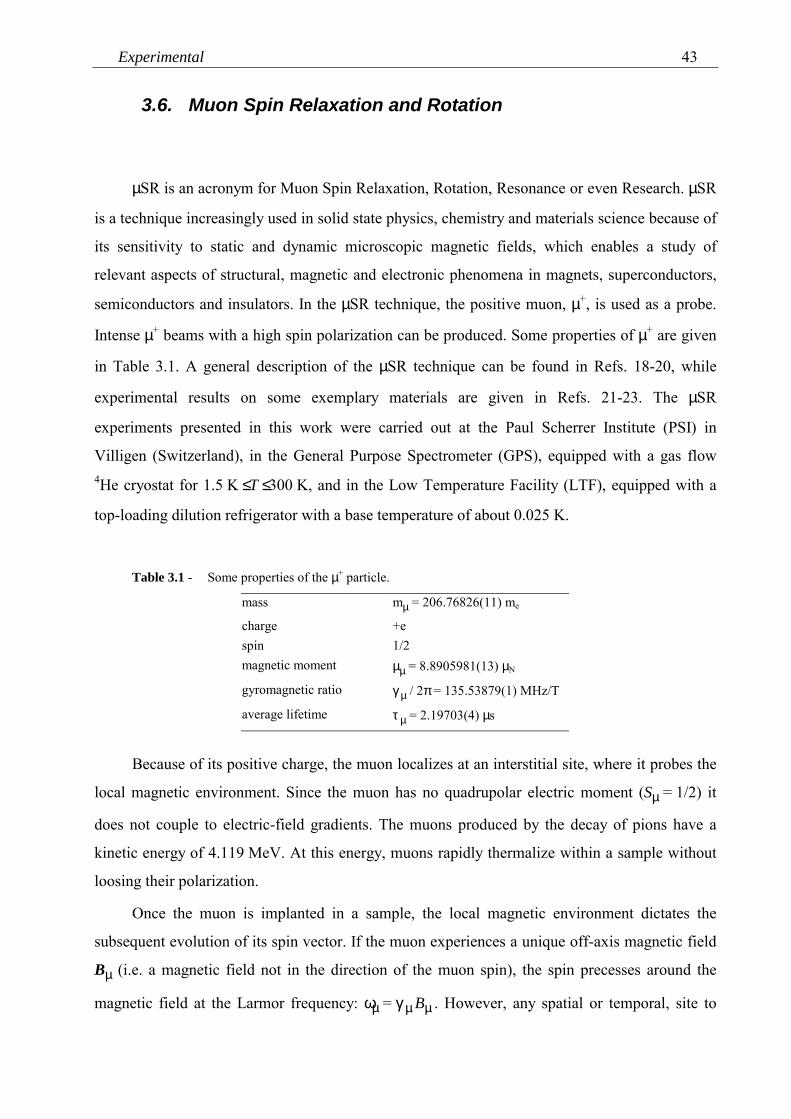
Table 3.1 - Some properties of the µ+ particle.
mass mµ = 206.76826(11) me
charge +espin 1/2magnetic moment µµ = 8.8905981(13) µN
gyromagnetic ratio γµ / 2π = 135.53879(1) MHz/T
average lifetime τ µ = 2.19703(4) µs
Because of its positive charge, the muon localizes at an interstitial site, where it probes the
local magnetic environment. Since the muon has no quadrupolar electric moment (Sµ = 1/2) it
does not couple to electric-field gradients. The muons produced by the decay of pions have a
kinetic energy of 4.119 MeV. At this energy, muons rapidly thermalize within a sample without
loosing their polarization.
Once the muon is implanted in a sample, the local magnetic environment dictates the
subsequent evolution of its spin vector. If the muon experiences a unique off-axis magnetic field
Bµ (i.e. a magnetic field not in the direction of the muon spin), the spin precesses around the
magnetic field at the Larmor frequency: ωµ = γµ Bµ . However, any spatial or temporal, site to
Chapter 344
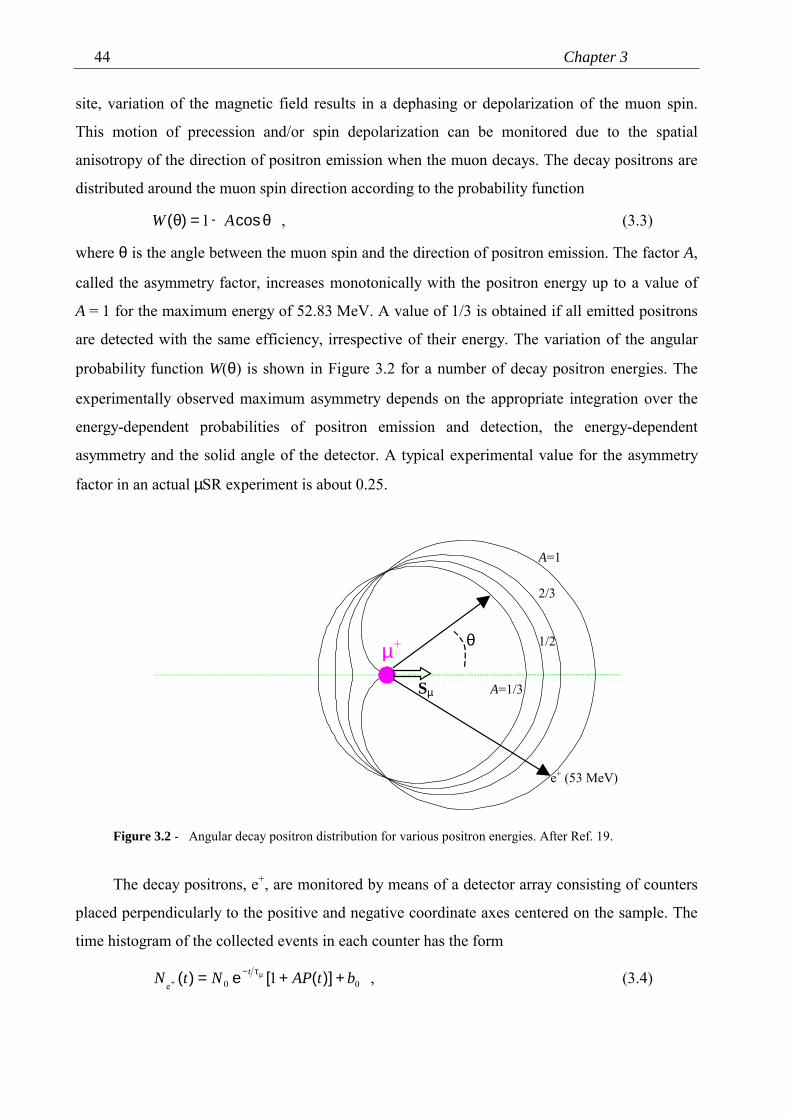
site, variation of the magnetic field results in a dephasing or depolarization of the muon spin.
This motion of precession and/or spin depolarization can be monitored due to the spatial
anisotropy of the direction of positron emission when the muon decays. The decay positrons are
distributed around the muon spin direction according to the probability function
θ+=θ cos)( AW 1 , (3.3)
where θ is the angle between the muon spin and the direction of positron emission. The factor A,
called the asymmetry factor, increases monotonically with the positron energy up to a value of
A = 1 for the maximum energy of 52.83 MeV. A value of 1/3 is obtained if all emitted positrons
are detected with the same efficiency, irrespective of their energy. The variation of the angular
probability function W(θ) is shown in Figure 3.2 for a number of decay positron energies. The
experimentally observed maximum asymmetry depends on the appropriate integration over the
energy-dependent probabilities of positron emission and detection, the energy-dependent
asymmetry and the solid angle of the detector. A typical experimental value for the asymmetry
factor in an actual µSR experiment is about 0.25.
e+ (53 MeV)
θµ+
Sµ
A=1
2/3
1/2
A=1/3
Figure 3.2 - Angular decay positron distribution for various positron energies. After Ref. 19.
The decay positrons, e+, are monitored by means of a detector array consisting of counters
placed perpendicularly to the positive and negative coordinate axes centered on the sample. The
time histogram of the collected events in each counter has the form
00e 1 btAPNtN t ++= µ+
τ− )]([e)( , (3.4)
Experimental 45
where N0 is a normalization constant, exp(-t/τ µ) accounts for the muon decay, A is the
asymmetry, P(t) is the muon depolarization function which describes the time dependence of the
polarization (with P(0) = 1) and b0 is the background contribution. The depolarization function
P(t) reflects the spatial and temporal distribution of the magnetic fields at the muon sites. In the
case of a static magnetic field Bµ at the µ+ site, P(t) is given by
∫ µµµ ωθ+θ= BB d22 )]cos(sin)[cos()( tftP , (3.5)
where f(Bµ) is the magnetic-field distribution function and θ the angle between Bµ and the initial
muon polarization Pµ(0).
For a particular crystal structure, the possible presence of different muon stopping sites,
with different magnetic environments, will be reflected in a µSR signal with different
components, i.e. with different depolarization functions. Moreover, since the muons are
uniformly implanted in a sample, the coexistence of different domains, characterized by different
types of ground states, can also be detected by the presence of different components with
distinctive functions P(t), even if only one stopping site is present.
Different experimental geometries can be used with respect to the direction of an external
magnetic field Bext. In fact, each geometry corresponds to a different meaning of the acronym
µSR: muon spin relaxation for zero or longitudinal field (Bext || Pµ(0)) and muon spin rotation for
transverse field (Bext ⊥ Pµ(0)).
The muon beam at the PSI is of the continuous type (compared to beams of the pulsed
type). Because each event is treated separately, the continuous beam has a good time resolution
but a large background b0 which limits the time window to about 10 µs. Recently, a new facility,
called MORE (Muons On REquest), has been installed at the PSI, which reduces drastically the
background, increasing the time window to 16 µs. In this arrangement, a "kicker" sends a muon
to the instrument only when it is required, deflecting all the other muons away from the
experimental set-up. A disadvantage of MORE is however the initial dead-time (about 0.15 µs)
in the histograms, which limits its usefulness to the case where there is no fast depolarization
rate.
Chapter 346
3.6.1. Zero-field µµµµSR
The µSR technique yields the possibility to probe magnetic signals in zero external field.
Its large magnetic moment makes the muon sensitive to internal fields as small as 10-5 T (which
corresponds to the magnitude of fields originating from nuclear dipoles).
The zero-field (ZF) µSR technique can be used to measure the spontaneous µ+ Larmor
frequencies in magnetically ordered phases and provides information about the magnetic
structure and the value of the static moment. In the simplest case of a magnetic structure
producing a field of well defined magnitude and direction at the µ+ sites, f(Bµ) is represented by a
δ function and the muon-depolarization function is
)cos(sincos)( ttP µωθ+θ= 22 . (3.6)
For a polycrystalline sample, averaging over the angular dependence results in
)cos()( ttP µω+= 32
31 . (3.7)
A static distribution of internal fields, as the one arising from static nuclear or electronic
dipole fields, will produce a depolarization. Assuming that the internal fields are Gaussian
distributed in their values and randomly oriented, the field distribution has zero average and no
spontaneous precession frequency is observed. P(t) assumes the form of a Kubo-Toyabe function
[24]
( ) 22232
31
KG
22
1 /e)( tttP ∆−∆−+= , (3.8a)
where ∆2/γµ2 = <B2> is the second moment of the field distribution. If the field distribution is
Lorentzian then
( ) tttP λ−λ−+= e)( 132
31
KL , (3.8b)
where λ/γµ represents the half width at half maximum of the distributions. For early times
(t << ∆-1 or t << λ -1), these functions approach a Gaussian and an exponential function,
respectively:
2GKG
22
)( /e)( ttPtP ∆−=≈ (3.9a)
ttPtP λ−=≈ e)()( EKL . (3.9b)
In the case of a time-dependent Gaussian distribution of the internal fields, the Kubo-
Toyabe function is modified to a dynamical Kubo-Toyabe function which cannot be expressed
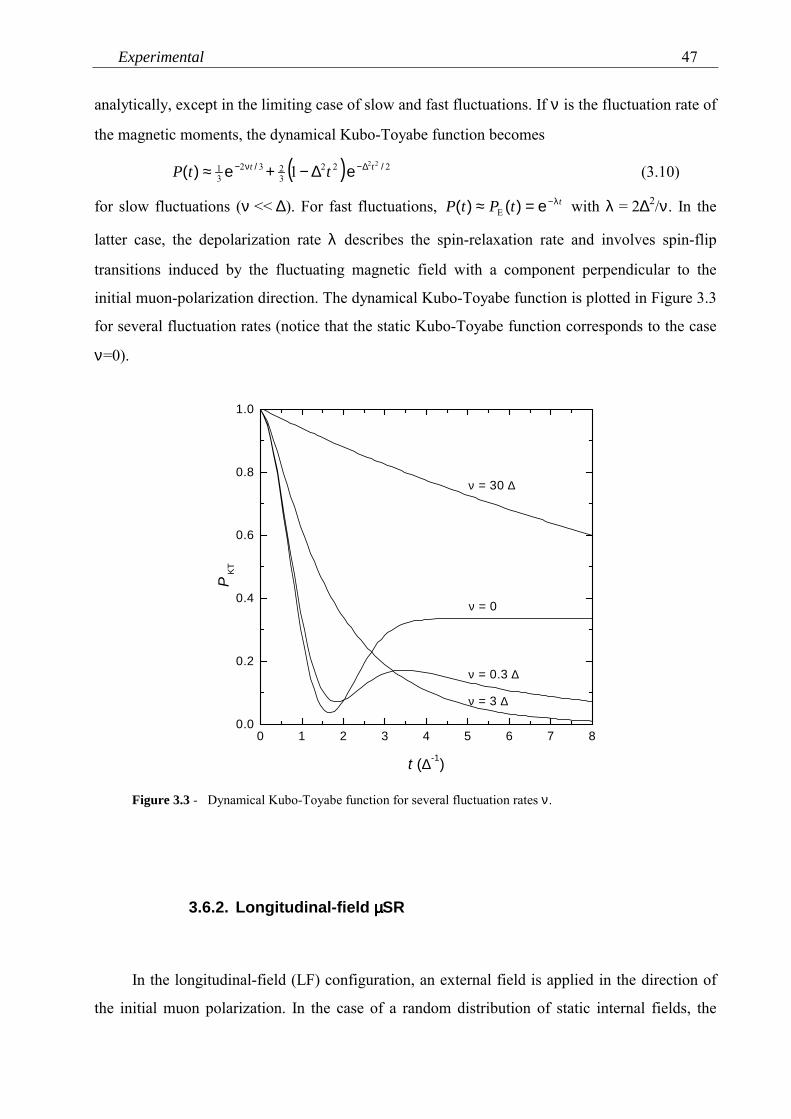
Experimental 47
analytically, except in the limiting case of slow and fast fluctuations. If ν is the fluctuation rate of
the magnetic moments, the dynamical Kubo-Toyabe function becomes
( ) 2223232
31 22
1 // ee)( tt ttP ∆−ν− ∆−+≈ (3.10)
for slow fluctuations (ν << ∆). For fast fluctuations, ttPtP λ−=≈ e)()( E with λ = 2∆2/ν. In the
latter case, the depolarization rate λ describes the spin-relaxation rate and involves spin-flip
transitions induced by the fluctuating magnetic field with a component perpendicular to the
initial muon-polarization direction. The dynamical Kubo-Toyabe function is plotted in Figure 3.3
for several fluctuation rates (notice that the static Kubo-Toyabe function corresponds to the case
ν=0).
0 1 2 3 4 5 6 7 80.0
0.2
0.4
0.6
0.8
1.0
ν = 0.3 ∆
ν = 0
ν = 3 ∆
ν = 30 ∆
P KT
t (∆-1)
Figure 3.3 - Dynamical Kubo-Toyabe function for several fluctuation rates ν.
3.6.2. Longitudinal-field µµµµSR
In the longitudinal-field (LF) configuration, an external field is applied in the direction of
the initial muon polarization. In the case of a random distribution of static internal fields, the
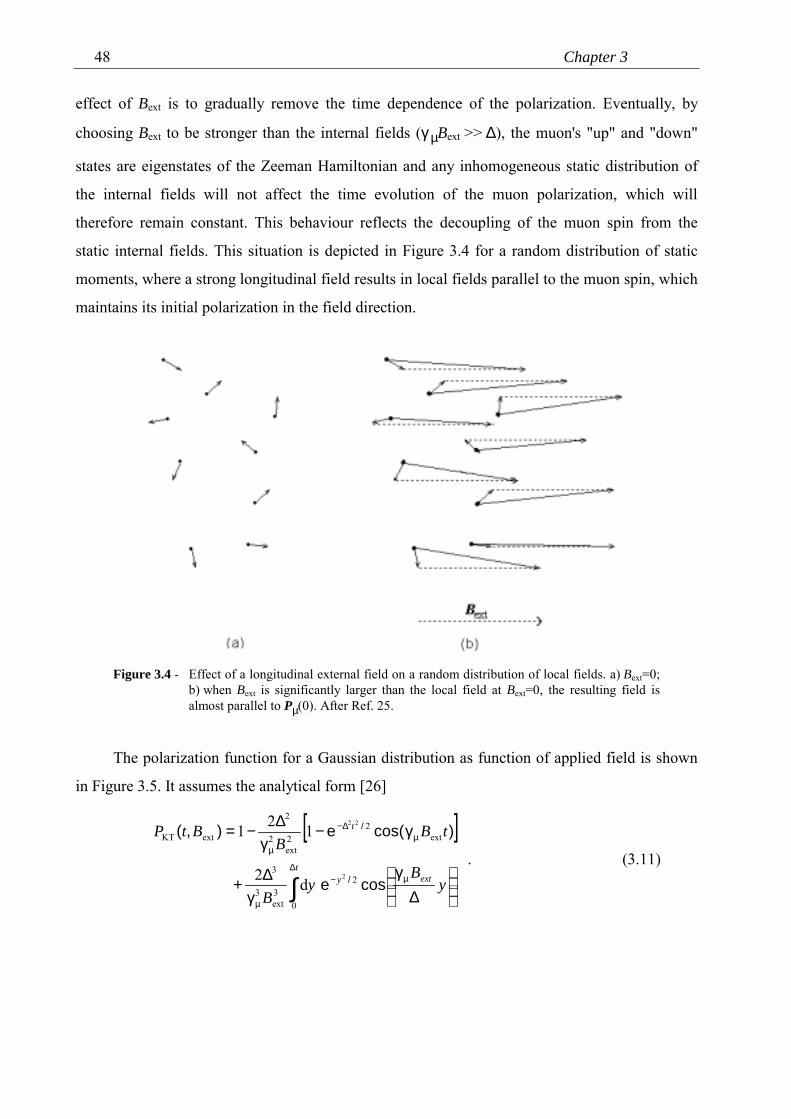
Chapter 348
effect of Bext is to gradually remove the time dependence of the polarization. Eventually, by
choosing Bext to be stronger than the internal fields (γµBext >> ∆), the muon's "up" and "down"
states are eigenstates of the Zeeman Hamiltonian and any inhomogeneous static distribution of
the internal fields will not affect the time evolution of the muon polarization, which will
therefore remain constant. This behaviour reflects the decoupling of the muon spin from the
static internal fields. This situation is depicted in Figure 3.4 for a random distribution of static
moments, where a strong longitudinal field results in local fields parallel to the muon spin, which
maintains its initial polarization in the field direction.
Figure 3.4 - Effect of a longitudinal external field on a random distribution of local fields. a) Bext=0;b) when Bext is significantly larger than the local field at Bext=0, the resulting field isalmost parallel to Pµ(0). After Ref. 25.
The polarization function for a Gaussian distribution as function of applied field is shown
in Figure 3.5. It assumes the analytical form [26]
[ ]
∫∆
µ−
µ
µ∆−
µ
∆
γγ
∆+
γ−γ
∆−=
texty
t
yB
yB
tBB
BtP
0
23ext
3
3
ext2
2ext
2
2
extKT
2
22
d2
121
cose
)cos(e),(
/
/
. (3.11)
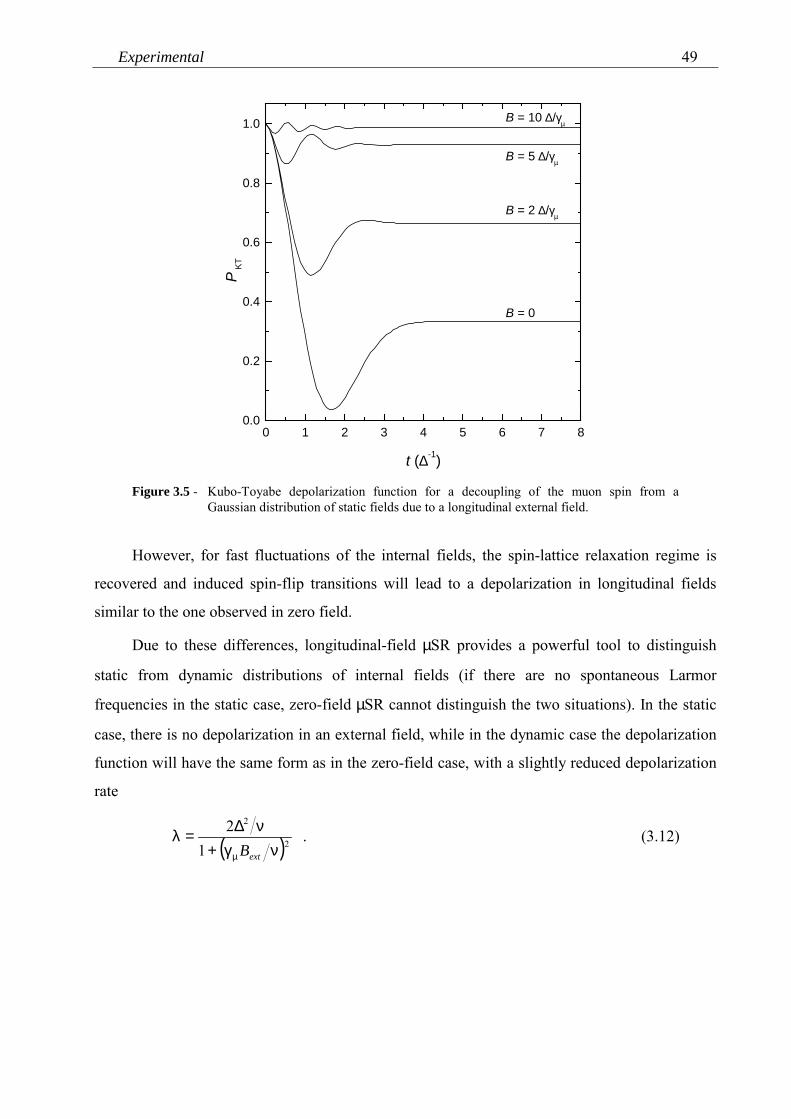
Experimental 49
0 1 2 3 4 5 6 7 80.0
0.2
0.4
0.6
0.8
1.0 B = 10 ∆/γµ
B = 5 ∆/γµ
B = 0
B = 2 ∆/γµ
P KT
t (∆-1)
Figure 3.5 - Kubo-Toyabe depolarization function for a decoupling of the muon spin from aGaussian distribution of static fields due to a longitudinal external field.
However, for fast fluctuations of the internal fields, the spin-lattice relaxation regime is
recovered and induced spin-flip transitions will lead to a depolarization in longitudinal fields
similar to the one observed in zero field.
Due to these differences, longitudinal-field µSR provides a powerful tool to distinguish
static from dynamic distributions of internal fields (if there are no spontaneous Larmor
frequencies in the static case, zero-field µSR cannot distinguish the two situations). In the static
case, there is no depolarization in an external field, while in the dynamic case the depolarization
function will have the same form as in the zero-field case, with a slightly reduced depolarization
rate
( )2
2
12
νγ+ν∆=λ
µ extB . (3.12)
Chapter 350
3.6.3. Transverse-field µµµµSR
In the transverse-field (TF) configuration, the external magnetic field Bext is applied
perpendicular to the initial muon polarization Pµ(0). The local magnetic field at the interstitial
site where the muon is implanted can be determined from the Larmor precession frequency. The
measured frequency or frequencies are expressed in the form of a Knight shift:
10ext
ext −ωω
=−
= µµµ B
BBK , (3.13)
where ω0= γµBext. Here, we consider only metals in the paramagnetic state that are exposed to a
magnetic field. The local magnetic field Bµ at the interstitial site where the muon comes to rest
can be written as
diaextconcondipext BBBBBB +χ+++=µA . (3.14)
Bdip represents the dipolar fields of the localized lattice spins. The third and the fourth term are
called the direct and indirect hyperfine contact field, respectively, and are connected with the
presence of the muon itself. The direct hyperfine contact field, Bcon, results from the spin density
at the muon site, which is induced by the polarization of the conduction electrons. In the
paramagnetic state, this polarization is induced by an external field. Bcon is proportional to the
Pauli susceptibility of the conduction electrons and is usually assumed to be temperature
independent and isotropic, in contrast to the other contributions. The indirect contact field is due
to the RKKY interaction between localized moments and the muon. The effective contact
coupling constant, Acon, is temperature independent, so that the indirect contact field is
proportional to the susceptibility tensor χ and the applied magnetic field. The last contribution,
Bdia, is due to the diamagnetic response of the electron-cloud screening of the muon charge. The
diamagnetic screening produces only a very small contribution to the local magnetic field. For
materials with an enhanced effective electron mass m*, the small diamagnetic contribution is
reduced by a factor me/m*, becoming negligible for heavy-fermion compounds.
In order to separate the different contributions to the local magnetic field, the experimental
Knight shift in heavy-fermion compounds is usually compared to the calculated one. If the
principal axes of the crystalline structure are chosen as the coordinate frame, the dipolar field
contribution can be written as
Experimental 51
extdipdip BB χ=
A . (3.15)
The dipolar tensor dipA
is given by
∑
δ−=
frij
jiij
rxx
rA 23dip
31 , (3.16)
where the sum is over all f-moments at positions rf and r = rf - rµ.
In order to calculate this finite sum, one can define a "Lorentz sphere" with radius rL, and
separate the sum into a part inside the sphere and a part outside the sphere. If one chooses the
radius large enough, the summation over the outer region can be approximated with an integral.
The magnetic field resulting from this integral yields the Lorentz field BL = µ0M/3 and the
demagnetizing field BD = - N
µ0M, where M is the magnetization and N
the demagnetization
tensor related to the shape of the sample (notice that for a sphere N = 1/3 and BL+BD = 0).
After correcting for the demagnetizing and Lorentz fields, the Knight shift is related to the
diagonal susceptibility tensor according to
)( bb χ⋅+=µ
totcon AKK , (3.17)
where b = Bext/|Bext| is the unit vector parallel to the applied magnetic field, Kcon the Knight shift
due to the direct contact field and condiptot AAA
+= the total hyperfine coupling tensor. In
contrast to Kcon and χPauli, the contribution from the localized f-moments will exhibit a strong
temperature dependence. Kcon can therefore be determined from the experimental data:
Kcon = Kµ(χ→0). The elements of χ
totA can be determined experimentally from the Knight shift
anisotropy for the principal axes. The Knight shift is simply given by
iii
i AK χ= . (3.18)
With the knowledge of χi, the tensor elements Aii can be determined from the observed
Knight shift Ki. Because totA
is the sum of a traceless dipolar tensor and a scalar contact part, totA
can be decomposed using Acon = Tr( totA
)/3. By comparison of the experimentally determined
dipA
with the calculated values, it is often possible to determine the actual muon stopping site. If
a sample orders magnetically and the muon stopping site is known, then it is easy to calculate
from the local field in the ordered state (measured by zero-field µSR) the size of the ordered
moment.
Chapter 352
References1. F. Pobell, "Matter and Methods at Low Temperatures", Springer, Berlin, 1992.2. G.K. White, "Experimental Techniques in Low-Temperature Physics", Oxford University
Press, Oxford, 1959.3. D.S. Betts, "An Introduction to Millikelvin Technology", Cambridge University Press,
Cambridge, 1989.4. M. van Sprang, Ph.D. Thesis, University of Amsterdam, 1988 (unpublished).5. K. Bakker, Ph.D. Thesis, University of Amsterdam, 1993 (unpublished).6. T. Vorenkamp, Ph.D. Thesis, University of Amsterdam, 1992 (unpublished).7. N.H. van Dijk, Ph.D. Thesis, University of Amsterdam, 1994 (unpublished).8. K. Prokeš, T. Fujita, E.H. Brück, F.R. de Boer and A.A. Menovsky, Phys. Rev. B 60 (1999)
R730.9. A.A. Menovsky and J.J.M. Franse, J. Crystal Growth 65 (1983) 286.10. J.C. Spirlet and O. Vogt, in "Handbook on the Physics and Chemistry of the Actinides" vol.
1 (A.J. Freeman and G.H. Lander, eds.), Elsevier, Amsterdam, 1984, p. 79.11. R. Gersdorf, F.R. de Boer, J.C. Wolfrat, F.A. Muller and L.W. Roeland, in "High Field
Magnetism" (M. Date, ed.), North-Holland, Amsterdam, 1983, p. 277.12. M. Eremets, "High Pressure Experimental Methods", Oxford University Press, Oxford,
1996.13. N.H. Kim-Ngan, Ph.D. Thesis, University of Amsterdam, 1993 (unpublished).14. A. de Visser, Ph.D. Thesis, University of Amsterdam, 1986 (unpublished).15. E. Grüneisen, Handbook Phys. 10 (1926) 1.16. R.S. Krishnan, R. Srinivasan and S. Devanarayanan, "Thermal Expansion of Crystals",
Pergamon Press, Oxford, 1979.17. T.H.K. Barron, J.G. Collins and G.K. White, Adv. Phys. 29 (1980) 609.18. A. Schenck, "Muon Spin Spectroscopy", Adam Hilger, Bristol, 1985.19. S.L. Lee, S.H. Kilcoyne and R. Cywinski (eds.), "Muon Science", Institute of Physics
Publishing, Bristol, 1999.20. R.J. Keizer, Ph.D. Thesis, University of Amsterdam, 1999.21. A. Schenck and F.N. Gygax, in "Handbook of Magnetic Materials" vol. 9 (K.H.J. Buschow,
ed.), Elsevier, Amsterdam, 1995, p. 57.22. P. Dalmas de Réotier and A. Yaouanc, J. Phys.: Condens. Matter 9 (1997) 9113.23. A. Amato, Rev. Mod. Phys. 69 (1997) 1119.24. R. Kubo and T. Toyabe, in "Magnetic Resonance and Relaxation" (R. Blinc, ed.), North-
Holland, Amsterdam, 1967, p. 810.25. J. Chappert, in "Muons and Pions in Materials Research" (J. Chappert and R.I. Grynszpan,
eds.), Elsevier, Amsterdam, 1984, p. 35.26. R.S. Hayano, Y.J. Uemura, J. Imazato, N. Nishida, T. Yamazaki and R. Kubo, Phys. Rev. B
20 (1979) 850.
Non-Fermi liquid behaviour in
U2Pt2In
4.1. The U2T2X family of compounds
The family of U2T2X (where T is a transition metal and X is In or Sn) intermetallic
compounds has attracted much interest in the past years [1-4], because it may serve as an
exemplary system to study hybridization phenomena in 5f-electron compounds. The
hybridization strength can be tuned by varying the T and X elements and as a result various
magnetic ground states are observed, notably Pauli paramagnetism, spin-fluctuation phenomena
and antiferromagnetism. The shortest U-U distance in these tetragonal 2:2:1 compounds is close
to the Hill limit (~ 3.5 Å) and is found either along the c-axis or within the ab-plane, depending
on the T and X elements. Therefore, this family of compounds may be used to study the
influence of the direct f-f coupling on the magnetic f-moment direction. On the other hand, it is
the strength of the 5f - d-ligand hybridization that controls the evolution of magnetism across the
2:2:1 series.
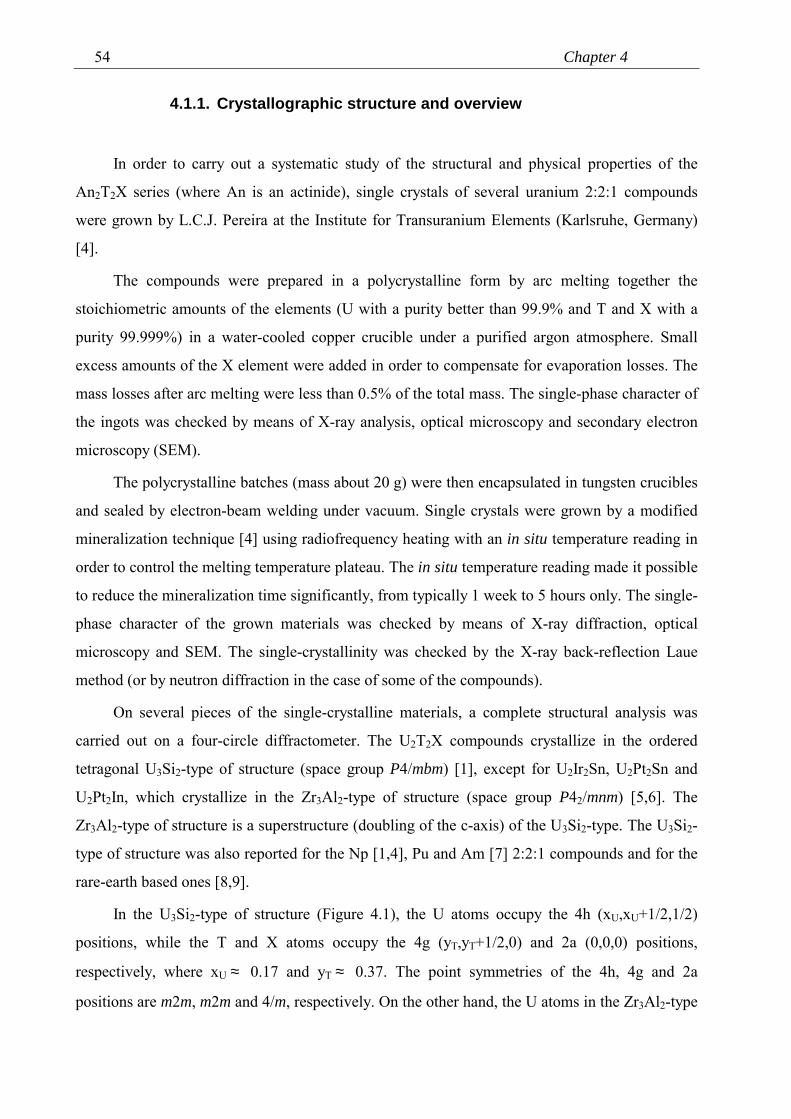
Chapter 454
4.1.1. Crystallographic structure and overview
In order to carry out a systematic study of the structural and physical properties of the
An2T2X series (where An is an actinide), single crystals of several uranium 2:2:1 compounds
were grown by L.C.J. Pereira at the Institute for Transuranium Elements (Karlsruhe, Germany)
[4].
The compounds were prepared in a polycrystalline form by arc melting together the
stoichiometric amounts of the elements (U with a purity better than 99.9% and T and X with a
purity 99.999%) in a water-cooled copper crucible under a purified argon atmosphere. Small
excess amounts of the X element were added in order to compensate for evaporation losses. The
mass losses after arc melting were less than 0.5% of the total mass. The single-phase character of
the ingots was checked by means of X-ray analysis, optical microscopy and secondary electron
microscopy (SEM).
The polycrystalline batches (mass about 20 g) were then encapsulated in tungsten crucibles
and sealed by electron-beam welding under vacuum. Single crystals were grown by a modified
mineralization technique [4] using radiofrequency heating with an in situ temperature reading in
order to control the melting temperature plateau. The in situ temperature reading made it possible
to reduce the mineralization time significantly, from typically 1 week to 5 hours only. The single-
phase character of the grown materials was checked by means of X-ray diffraction, optical
microscopy and SEM. The single-crystallinity was checked by the X-ray back-reflection Laue
method (or by neutron diffraction in the case of some of the compounds).
On several pieces of the single-crystalline materials, a complete structural analysis was
carried out on a four-circle diffractometer. The U2T2X compounds crystallize in the ordered
tetragonal U3Si2-type of structure (space group P4/mbm) [1], except for U2Ir2Sn, U2Pt2Sn and
U2Pt2In, which crystallize in the Zr3Al2-type of structure (space group P42/mnm) [5,6]. The
Zr3Al2-type of structure is a superstructure (doubling of the c-axis) of the U3Si2-type. The U3Si2-
type of structure was also reported for the Np [1,4], Pu and Am [7] 2:2:1 compounds and for the
rare-earth based ones [8,9].
In the U3Si2-type of structure (Figure 4.1), the U atoms occupy the 4h (xU,xU+1/2,1/2)
positions, while the T and X atoms occupy the 4g (yT,yT+1/2,0) and 2a (0,0,0) positions,
respectively, where xU ≈ 0.17 and yT ≈ 0.37. The point symmetries of the 4h, 4g and 2a
positions are m2m, m2m and 4/m, respectively. On the other hand, the U atoms in the Zr3Al2-type
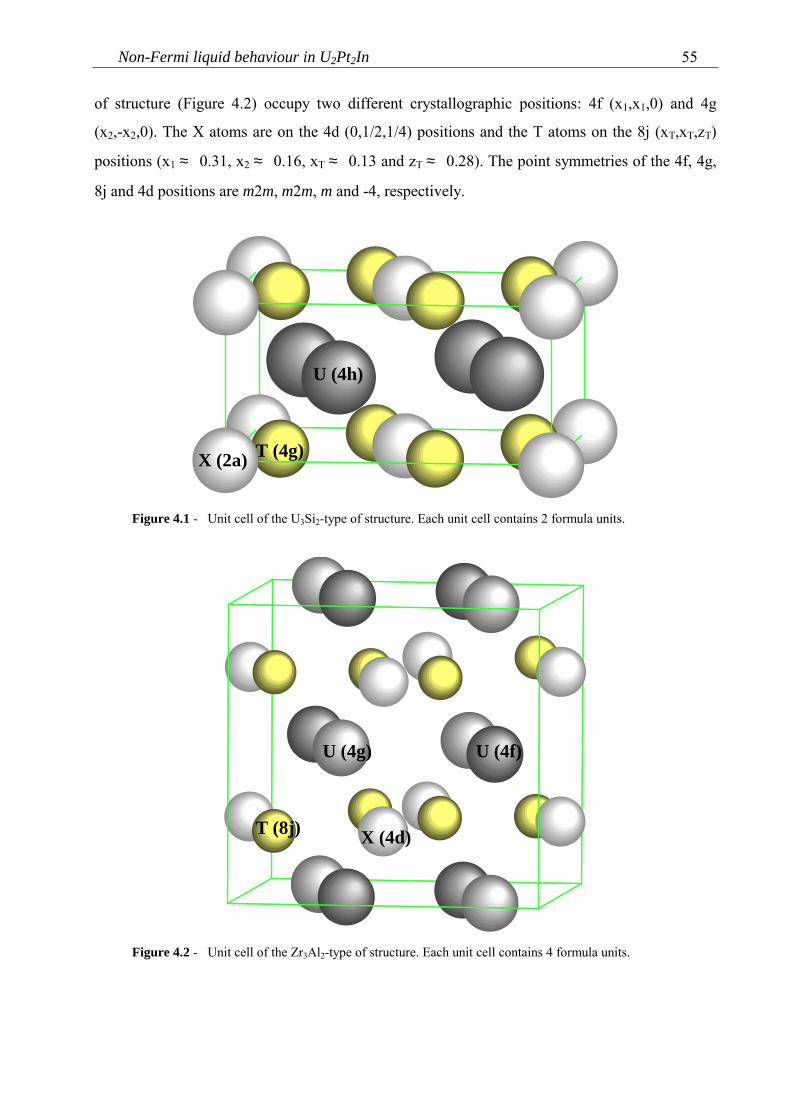
Non-Fermi liquid behaviour in U2Pt2In 55
of structure (Figure 4.2) occupy two different crystallographic positions: 4f (x1,x1,0) and 4g
(x2,-x2,0). The X atoms are on the 4d (0,1/2,1/4) positions and the T atoms on the 8j (xT,xT,zT)
positions (x1 ≈ 0.31, x2 ≈ 0.16, xT ≈ 0.13 and zT ≈ 0.28). The point symmetries of the 4f, 4g,
8j and 4d positions are m2m, m2m, m and -4, respectively.
T (4g) X (2a)
U (4h)
Figure 4.1 - Unit cell of the U3Si2-type of structure. Each unit cell contains 2 formula units.
T (8j) X (4d)
U (4g) U (4f)
Figure 4.2 - Unit cell of the Zr3Al2-type of structure. Each unit cell contains 4 formula units.

Chapter 456
In the Zr3Al2-type of structure, the U atoms do not form linear chains as is the case for the
U3Si2-type of structure, but form zig-zag chains along the c-axis. This leads to a reduction of the
shortest U-U spacing within the basal plane. Close scrutiny of Figure 4.1 and Figure 4.2 reveals
that a transition between the two structures involves only minor shifts in the positions of the
atoms.
From the structural point of view, U2Pt2In is a special case within the 2:2:1 family of
compounds, as poly- and single-crystalline materials form in different structures [10]. The X-ray
powder diffraction data taken on polycrystalline U2Pt2In confirm the U3Si2-type of structure with
lattice parameters a = 7.654 Å and c = 3.725 Å. However, U2Pt2In single crystals form in the
superstructure of the Zr3Al2-type with lattice parameters a = 7.695 Å and c = 7.368 Å.
This polymorphism of U2Pt2In shows that the stability of the crystallographic structure
depends on the experimental conditions, like pressure and temperature, during the sample
preparation process. While preparing the arc-melted polycrystalline sample, the temperatures
attained are well above the melting point of U2Pt2In and the cooling process is rather fast. This
leads to the formation of the U3Si2-type of structure. During the single crystal growth, i.e. the
mineralization process, the temperature range is much reduced (up to 20°C above the melting
point) and the cooling takes place very slowly. Under these conditions, which are closer to
equilibrium, the preferred structure is the tetragonal Zr3Al2-type of structure.
The interatomic distances and near-neighbour (d < 4.2 Å) positions, calculated for the
U2Pt2In single- and polycrystals, are listed in Table 4.1. The number of nearest neighbours for
each atom is the same in both structures (since the main effect is the doubling of the c-axis). The
average interatomic distances do not change significantly. For the U atoms, the in-plane
U(4f)-U(4f) distance decreases, while the in-plane U(4g)-U(4g) increases when moving from
polycrystals to single crystals.
As mentioned before, several magnetic ground states are found in the 2:2:1 family of
compounds. A review of the properties of the U2T2X compounds has been given in Ref. 11 and
some of the results are summarized in Table 4.2. Among these compounds, U2Pt2In and U2Pd2In
present heavy-fermion behaviour, as can be concluded from the large value of the linear
coefficient of the low-temperature specific heat, which is indicative of an enhanced effective
mass.
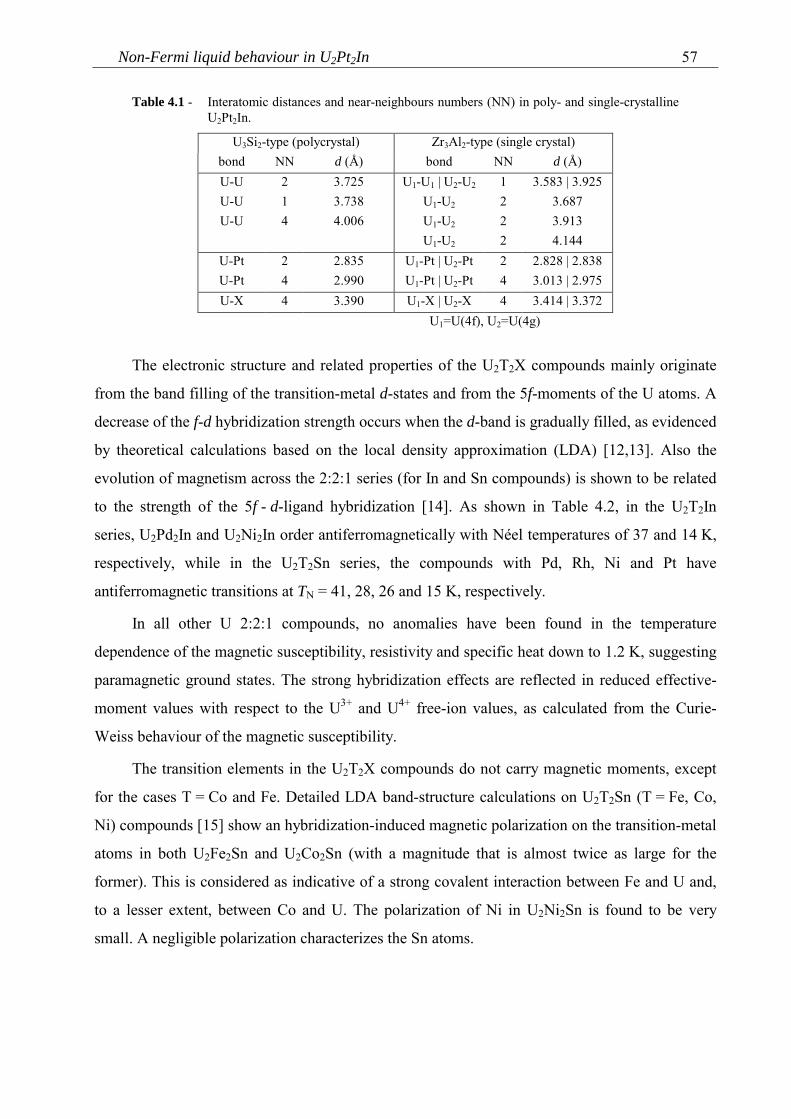
Non-Fermi liquid behaviour in U2Pt2In 57
Table 4.1 - Interatomic distances and near-neighbours numbers (NN) in poly- and single-crystallineU2Pt2In.
U3Si2-type (polycrystal) Zr3Al2-type (single crystal)bond NN d (Å) bond NN d (Å)U-UU-UU-U
214
3.7253.7384.006
U1-U1 | U2-U2
U1-U2
U1-U2
U1-U2
1222
3.583 | 3.9253.6873.9134.144
U-PtU-Pt
24
2.8352.990
U1-Pt | U2-PtU1-Pt | U2-Pt
24
2.828 | 2.8383.013 | 2.975
U-X 4 3.390 U1-X | U2-X 4 3.414 | 3.372U1=U(4f), U2=U(4g)
The electronic structure and related properties of the U2T2X compounds mainly originate
from the band filling of the transition-metal d-states and from the 5f-moments of the U atoms. A
decrease of the f-d hybridization strength occurs when the d-band is gradually filled, as evidenced
by theoretical calculations based on the local density approximation (LDA) [12,13]. Also the
evolution of magnetism across the 2:2:1 series (for In and Sn compounds) is shown to be related
to the strength of the 5f - d-ligand hybridization [14]. As shown in Table 4.2, in the U2T2In
series, U2Pd2In and U2Ni2In order antiferromagnetically with Néel temperatures of 37 and 14 K,
respectively, while in the U2T2Sn series, the compounds with Pd, Rh, Ni and Pt have
antiferromagnetic transitions at TN = 41, 28, 26 and 15 K, respectively.
In all other U 2:2:1 compounds, no anomalies have been found in the temperature
dependence of the magnetic susceptibility, resistivity and specific heat down to 1.2 K, suggesting
paramagnetic ground states. The strong hybridization effects are reflected in reduced effective-
moment values with respect to the U3+ and U4+ free-ion values, as calculated from the Curie-
Weiss behaviour of the magnetic susceptibility.
The transition elements in the U2T2X compounds do not carry magnetic moments, except
for the cases T = Co and Fe. Detailed LDA band-structure calculations on U2T2Sn (T = Fe, Co,
Ni) compounds [15] show an hybridization-induced magnetic polarization on the transition-metal
atoms in both U2Fe2Sn and U2Co2Sn (with a magnitude that is almost twice as large for the
former). This is considered as indicative of a strong covalent interaction between Fe and U and,
to a lesser extent, between Co and U. The polarization of Ni in U2Ni2Sn is found to be very
small. A negligible polarization characterizes the Sn atoms.
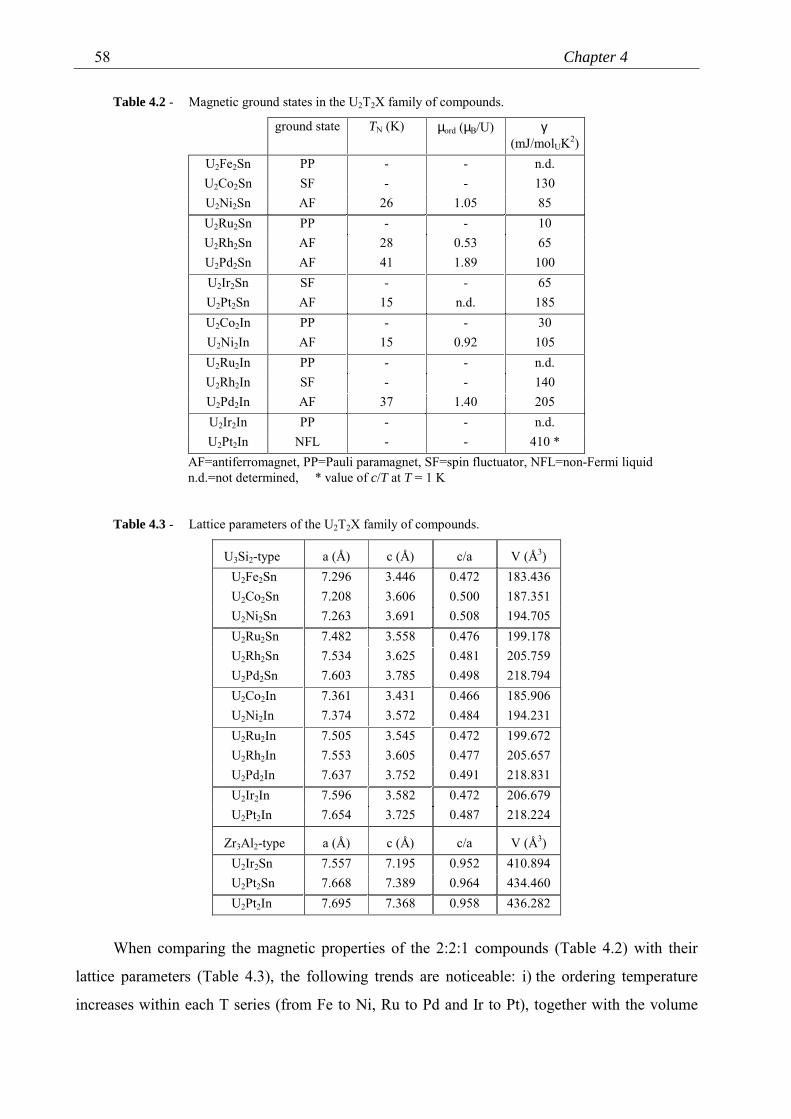
Chapter 458
Table 4.2 - Magnetic ground states in the U2T2X family of compounds.
ground state TN (K) µord (µB/U) γ(mJ/molUK2)
U2Fe2Sn PP - - n.d.U2Co2Sn SF - - 130U2Ni2Sn AF 26 1.05 85U2Ru2Sn PP - - 10U2Rh2Sn AF 28 0.53 65U2Pd2Sn AF 41 1.89 100U2Ir2Sn SF - - 65U2Pt2Sn AF 15 n.d. 185U2Co2In PP - - 30U2Ni2In AF 15 0.92 105U2Ru2In PP - - n.d.U2Rh2In SF - - 140U2Pd2In AF 37 1.40 205U2Ir2In PP - - n.d.U2Pt2In NFL - - 410 *
AF=antiferromagnet, PP=Pauli paramagnet, SF=spin fluctuator, NFL=non-Fermi liquid n.d.=not determined, * value of c/T at T = 1 K
Table 4.3 - Lattice parameters of the U2T2X family of compounds.
U3Si2-type a (Å) c (Å) c/a V (Å3)U2Fe2Sn 7.296 3.446 0.472 183.436U2Co2Sn 7.208 3.606 0.500 187.351U2Ni2Sn 7.263 3.691 0.508 194.705U2Ru2Sn 7.482 3.558 0.476 199.178U2Rh2Sn 7.534 3.625 0.481 205.759U2Pd2Sn 7.603 3.785 0.498 218.794U2Co2In 7.361 3.431 0.466 185.906U2Ni2In 7.374 3.572 0.484 194.231U2Ru2In 7.505 3.545 0.472 199.672U2Rh2In 7.553 3.605 0.477 205.657U2Pd2In 7.637 3.752 0.491 218.831U2Ir2In 7.596 3.582 0.472 206.679U2Pt2In 7.654 3.725 0.487 218.224
Zr3Al2-type a (Å) c (Å) c/a V (Å3)U2Ir2Sn 7.557 7.195 0.952 410.894U2Pt2Sn 7.668 7.389 0.964 434.460U2Pt2In 7.695 7.368 0.958 436.282
When comparing the magnetic properties of the 2:2:1 compounds (Table 4.2) with their
lattice parameters (Table 4.3), the following trends are noticeable: i) the ordering temperature
increases within each T series (from Fe to Ni, Ru to Pd and Ir to Pt), together with the volume
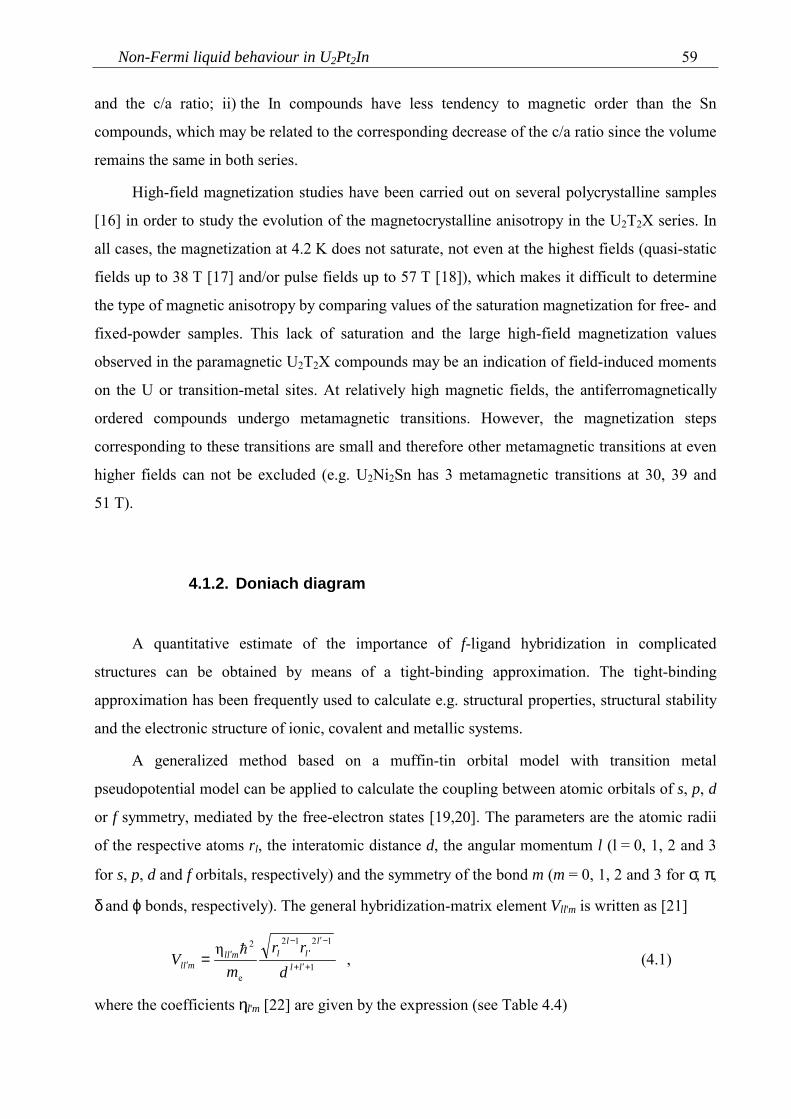
Non-Fermi liquid behaviour in U2Pt2In 59
and the c/a ratio; ii) the In compounds have less tendency to magnetic order than the Sn
compounds, which may be related to the corresponding decrease of the c/a ratio since the volume
remains the same in both series.
High-field magnetization studies have been carried out on several polycrystalline samples
[16] in order to study the evolution of the magnetocrystalline anisotropy in the U2T2X series. In
all cases, the magnetization at 4.2 K does not saturate, not even at the highest fields (quasi-static
fields up to 38 T [17] and/or pulse fields up to 57 T [18]), which makes it difficult to determine
the type of magnetic anisotropy by comparing values of the saturation magnetization for free- and
fixed-powder samples. This lack of saturation and the large high-field magnetization values
observed in the paramagnetic U2T2X compounds may be an indication of field-induced moments
on the U or transition-metal sites. At relatively high magnetic fields, the antiferromagnetically
ordered compounds undergo metamagnetic transitions. However, the magnetization steps
corresponding to these transitions are small and therefore other metamagnetic transitions at even
higher fields can not be excluded (e.g. U2Ni2Sn has 3 metamagnetic transitions at 30, 39 and
51 T).
4.1.2. Doniach diagram
A quantitative estimate of the importance of f-ligand hybridization in complicated
structures can be obtained by means of a tight-binding approximation. The tight-binding
approximation has been frequently used to calculate e.g. structural properties, structural stability
and the electronic structure of ionic, covalent and metallic systems.
A generalized method based on a muffin-tin orbital model with transition metal
pseudopotential model can be applied to calculate the coupling between atomic orbitals of s, p, d
or f symmetry, mediated by the free-electron states [19,20]. The parameters are the atomic radii
of the respective atoms rl, the interatomic distance d, the angular momentum l (l = 0, 1, 2 and 3
for s, p, d and f orbitals, respectively) and the symmetry of the bond m (m = 0, 1, 2 and 3 for σ, π,
δ and ϕ bonds, respectively). The general hybridization-matrix element Vll'm is written as [21]
1
1212
e
2η+′+
−′−′
′ = ll
ll
llmll
mll drr
mV '
, (4.1)
where the coefficients ηll'm [22] are given by the expression (see Table 4.4)
Chapter 460
)!()!()!()!())((
!!)!()!()!()(
mlmlmlmlll
llllll
ll
ml
mll −′+′−++′+
′π′′+−= ′+
++′
′1212
26221η
1
. (4.2)
Table 4.4 - Bond coefficients η ll'm defined in Equation 4.2.
ll'm pf df ffσ π2110 π3575 )( π252520π π− 2715 / π− 23575 / )( π− 252515δ - π2775 )( π25256ϕ - - )( π− 2525
The covalent energy of the coupling between the l and l' states is related to the trace of the
hybridization matrices [23]
( )21
222221
2 2221212
//'
+++
+=
+
= ϕ′δ′π′σ′′
−=′′ ∑ llllllll
lll
lmmll
llll VVVV
lN
VlN
V , (4.3)
where Nll' is the number of nearest neighbours between the atoms with angular momenta l and l'.
An estimate of the total conduction electron hybridization on the f-atom, Vcf, is then given
by
[ ] 21222 /ffpfdfcf VVVV ++= . (4.4)
In Table 4.5, average interatomic distances are given for several compounds of the U2T2X
family. The averages were calculated by considering the number of nearest neighbours for each
bond (each U atom has 4 X, 6 T and 7 U nearest neighbours). In the case of the compounds with
the Zr3Al2-type of structure, the mean value was taken as the average distances to the U(4f) and
U(4g) atoms. In order to calculate the hybridization for each compound of the 2:2:1 family, a
consistent set of atomic radii was taken from bandwidth calculations in an atomic-surface
method [24], based on free-atom wave functions evaluated at the Wigner-Seitz atomic-sphere
radius (Table 4.6).
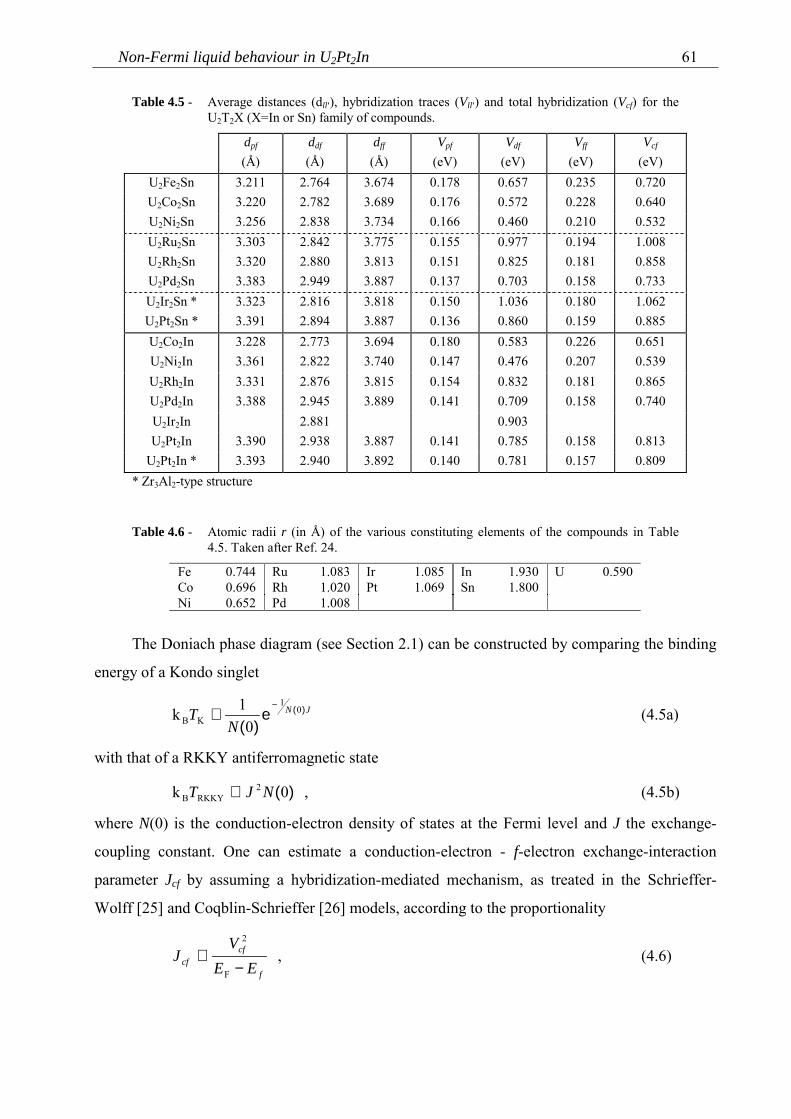
Non-Fermi liquid behaviour in U2Pt2In 61
Table 4.5 - Average distances (dll'), hybridization traces (Vll') and total hybridization (Vcf) for theU2T2X (X=In or Sn) family of compounds.
dpf
(Å)ddf
(Å)dff
(Å)Vpf
(eV)Vdf
(eV)Vff
(eV)Vcf
(eV)U2Fe2Sn 3.211 2.764 3.674 0.178 0.657 0.235 0.720U2Co2Sn 3.220 2.782 3.689 0.176 0.572 0.228 0.640U2Ni2Sn 3.256 2.838 3.734 0.166 0.460 0.210 0.532U2Ru2Sn 3.303 2.842 3.775 0.155 0.977 0.194 1.008U2Rh2Sn 3.320 2.880 3.813 0.151 0.825 0.181 0.858U2Pd2Sn 3.383 2.949 3.887 0.137 0.703 0.158 0.733U2Ir2Sn * 3.323 2.816 3.818 0.150 1.036 0.180 1.062U2Pt2Sn * 3.391 2.894 3.887 0.136 0.860 0.159 0.885U2Co2In 3.228 2.773 3.694 0.180 0.583 0.226 0.651U2Ni2In 3.361 2.822 3.740 0.147 0.476 0.207 0.539U2Rh2In 3.331 2.876 3.815 0.154 0.832 0.181 0.865U2Pd2In 3.388 2.945 3.889 0.141 0.709 0.158 0.740U2Ir2In 2.881 0.903U2Pt2In 3.390 2.938 3.887 0.141 0.785 0.158 0.813
U2Pt2In * 3.393 2.940 3.892 0.140 0.781 0.157 0.809* Zr3Al2-type structure
Table 4.6 - Atomic radii r (in Å) of the various constituting elements of the compounds in Table4.5. Taken after Ref. 24.
Fe 0.744 Ru 1.083 Ir 1.085 In 1.930 U 0.590Co 0.696 Rh 1.020 Pt 1.069 Sn 1.800Ni 0.652 Pd 1.008
The Doniach phase diagram (see Section 2.1) can be constructed by comparing the binding
energy of a Kondo singlet
JN
NT )(e
)(0
1
KB 01k
−∝ (4.5a)
with that of a RKKY antiferromagnetic state
)(0k 2RKKYB NJT ∝ , (4.5b)
where N(0) is the conduction-electron density of states at the Fermi level and J the exchange-
coupling constant. One can estimate a conduction-electron - f-electron exchange-interaction
parameter Jcf by assuming a hybridization-mediated mechanism, as treated in the Schrieffer-
Wolff [25] and Coqblin-Schrieffer [26] models, according to the proportionality
f
cfcf EE
VJ
−∝
F
2
, (4.6)
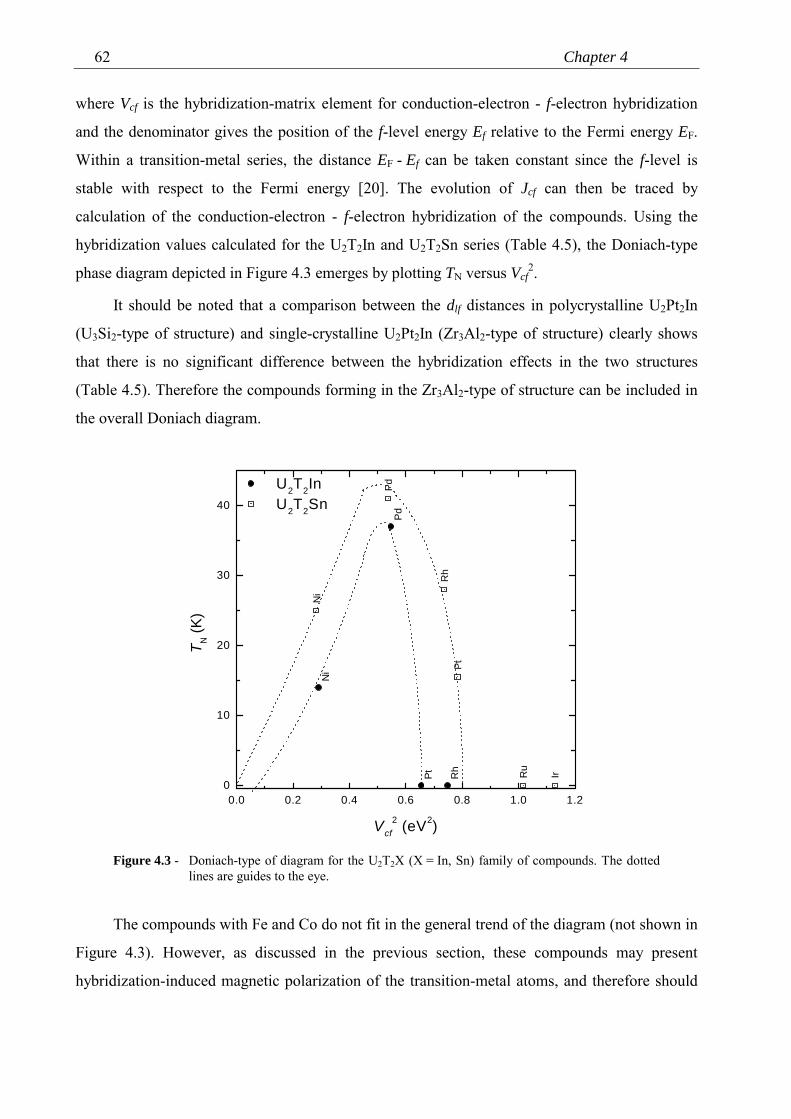
Chapter 462
where Vcf is the hybridization-matrix element for conduction-electron - f-electron hybridization
and the denominator gives the position of the f-level energy Ef relative to the Fermi energy EF.
Within a transition-metal series, the distance EF - Ef can be taken constant since the f-level is
stable with respect to the Fermi energy [20]. The evolution of Jcf can then be traced by
calculation of the conduction-electron - f-electron hybridization of the compounds. Using the
hybridization values calculated for the U2T2In and U2T2Sn series (Table 4.5), the Doniach-type
phase diagram depicted in Figure 4.3 emerges by plotting TN versus Vcf2.
It should be noted that a comparison between the dlf distances in polycrystalline U2Pt2In
(U3Si2-type of structure) and single-crystalline U2Pt2In (Zr3Al2-type of structure) clearly shows
that there is no significant difference between the hybridization effects in the two structures
(Table 4.5). Therefore the compounds forming in the Zr3Al2-type of structure can be included in
the overall Doniach diagram.
0.0 0.2 0.4 0.6 0.8 1.0 1.20
10
20
30
40
Ni
Ru
Rh
Pd
Ir
Pt
Ni
Rh
Pd
Pt
U2T2In U2T2Sn
T N (K
)
Vcf2 (eV2)
Figure 4.3 - Doniach-type of diagram for the U2T2X (X = In, Sn) family of compounds. The dottedlines are guides to the eye.
The compounds with Fe and Co do not fit in the general trend of the diagram (not shown in
Figure 4.3). However, as discussed in the previous section, these compounds may present
hybridization-induced magnetic polarization of the transition-metal atoms, and therefore should
Non-Fermi liquid behaviour in U2Pt2In 63
be treated separately from the other U2T2X compounds when discussing the evolution of
magnetism within a Doniach-type of diagram.
An important point to extract from this diagram, is the location of U2Pt2In at the border line
between magnetic and non-magnetic compounds. This strongly suggests that U2Pt2In is close to a
magnetic instability and explains its heavy-fermion behaviour.
4.2. U2Pt2In
U2Pt2In has a number of unrivalled properties. The heavy-electron properties of U2Pt2In
were first reported by Havela et al. [2]. Specific-heat experiments carried out on a polycrystalline
sample [2,3] in the temperature range 1.3-40 K revealed the presence of a pronounced upturn of
the electronic specific heat divided by temperature (c/T) below about 8 K, insensitive to an
applied field of 5 T. The c(T) data could be fitted with a T 3lnT term below 5 K, providing
evidence for spin-fluctuation phenomena. The resulting linear coefficient of the electronic
specific heat γ (T→0 K) amounted to 415 mJ/molUK2, which classifies U2Pt2In as a heavy-
electron compound. In line with this, the electrical resistivity, ρ(T), of U2Pt2In was found to show
a weak maximum around 80 K and coherence effects at low temperatures [3], which could be
attributed to the Kondo-lattice effect. The magnetic susceptibility, χ(T), shows deviations from
the Curie-Weiss behaviour below about 150 K [2]. In the limit T→1.2 K, χ is enhanced and
continues to rise. No sign of magnetic ordering has been observed.
More recently, data taken on a polycrystalline sample [27] showed that ρ(T) = ρo + aT in
the temperature range 1.4-6 K. This led to the suggestion that U2Pt2In might be a good candidate
to study non-Fermi liquid (NFL) phenomena.
In order to probe and investigate the NFL behaviour in U2Pt2In, it is of interest to study the
thermal, transport and magnetic properties of single crystals at lower temperatures (T < 1.2 K).
As discussed in Section 2.5, only a few stoichiometric compounds (like e.g. CeNi2Ge2) show
NFL properties at ambient pressure. U2Pt2In is the first U compound exhibiting NFL behaviour
without chemical substitution, pressure or magnetic field as a control parameter. In this section,
results of magnetization (2 K ≤ T ≤ 350 K, B ≤ 35 T), resistivity (0.3 K ≤ T ≤ 300 K),
Chapter 464
magnetoresistance (B ≤ 38 T), specific-heat (0.1 K ≤ T ≤ 180 K), specific-heat in field (B ≤ 8 T) and
thermal-expansion (0.35 K ≤ T ≤ 200 K) experiments carried out on U2Pt2In single crystals are
presented (for details on the preparation and characterization of the single crystals see Section
4.1.1 and Ref. 10).
4.2.1. Magnetization
Magnetization measurements were performed on several single crystals (with a mass of
10-50 mg) using a SQUID magnetometer (Quantum Design) in the temperature range 2-350 K
and in applied fields up to 5.5 T. In addition, magnetization measurements were carried out in
high magnetic fields up to 35 T at 4.2 K in the Amsterdam High-Field Facility.
The magnetizations Ma(B) and Mc(B) at some selected temperatures are shown in Figure
4.4a, where a and c refer to the crystallographic direction along which the magnetic field is
applied. In both cases, the magnetization is linear in fields up to 5.5 T. The slope dM/dB is
always higher for B || c than for B || a, though the anisotropy is not substantial. M (T = 2 K)
reaches the value of 0.25 (0.21) µB/f.u. in a field of 5.5 T applied along the c- (a-) axis. No
hysteresis in Ma and Mc was observed. Magnetization measurements for B || c at 4.2 K were
carried out up to 35 T (Figure 4.4b). No significant deviation from a linear behaviour was
observed. In the maximum field, Mc (35 T) = 1.48 µB/f.u. These results are similar to the ones
obtained on polycrystalline samples up to 35 T [17] and 57 T [18]. In the polycrystalline data, a
weak non-linearity was observed, which was not found in the single-crystal data. This non-
linearity is due to the saturation of magnetic impurities in the polycrystalline sample (about 2%
of ferromagnetic UPt was present as a second phase [3]). The data taken on free and fixed
powder are identical, which is another indication that the magnetic anisotropy is rather weak in
this compound.
The temperature variation of the d.c. susceptibility (M/H), χa(T) and χc(T), is presented in
Figure 4.5 for B = 0.1 T. The susceptibility is anisotropic, with the c-axis as the easy axis of the
magnetization. This anisotropy persists in the whole temperature range (up to 350 K).
At low temperatures, a clear difference between χa and χc is observed. χa continues to
increase as the temperature is lowered down to 2 K, while χc displays a broad maximum (Figure
4.5). Tracing the derivatives, dχ/dT, shows that the maximum occurs at Tmax = 7.9(3) K. The
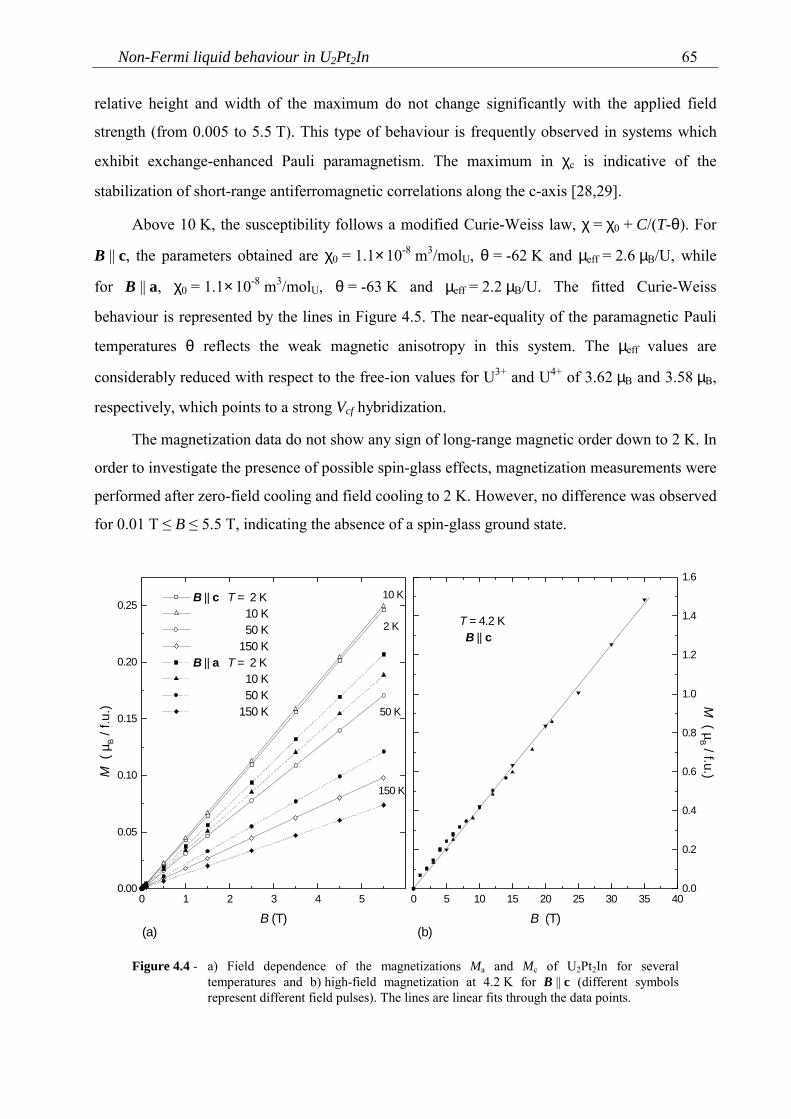
Non-Fermi liquid behaviour in U2Pt2In 65
relative height and width of the maximum do not change significantly with the applied field
strength (from 0.005 to 5.5 T). This type of behaviour is frequently observed in systems which
exhibit exchange-enhanced Pauli paramagnetism. The maximum in χc is indicative of the
stabilization of short-range antiferromagnetic correlations along the c-axis [28,29].
Above 10 K, the susceptibility follows a modified Curie-Weiss law, χ = χ0 + C/(T-θ). For
B || c, the parameters obtained are χ0 = 1.1×10⁻⁸ m3/molU, θ = -62 K and µeff = 2.6 µB/U, while
for B || a, χ0 = 1.1×10⁻⁸ m3/molU, θ = -63 K and µeff = 2.2 µB/U. The fitted Curie-Weiss
behaviour is represented by the lines in Figure 4.5. The near-equality of the paramagnetic Pauli
temperatures θ reflects the weak magnetic anisotropy in this system. The µeff values are
considerably reduced with respect to the free-ion values for U3+ and U4+ of 3.62 µB and 3.58 µB,
respectively, which points to a strong Vcf hybridization.
The magnetization data do not show any sign of long-range magnetic order down to 2 K. In
order to investigate the presence of possible spin-glass effects, magnetization measurements were
performed after zero-field cooling and field cooling to 2 K. However, no difference was observed
for 0.01 T ≤ B ≤ 5.5 T, indicating the absence of a spin-glass ground state.
0 1 2 3 4 50.00
0.05
0.10
0.15
0.20
0.25
(a)
B || c T = 2 K 10 K 50 K 150 K B || a T = 2 K 10 K 50 K 150 K
150 K
50 K
10 K
2 K
M (
µB /
f.u.
)
B (T)0 5 10 15 20 25 30 35 40
0.0
0.2
0.4
0.6
0.8
1.0
1.2
1.4
1.6
(b)
M ( µ
B / f.u.)
T = 4.2 K B || c
B (T)
Figure 4.4 - a) Field dependence of the magnetizations Ma and Mc of U2Pt2In for severaltemperatures and b) high-field magnetization at 4.2 K for B || c (different symbolsrepresent different field pulses). The lines are linear fits through the data points.
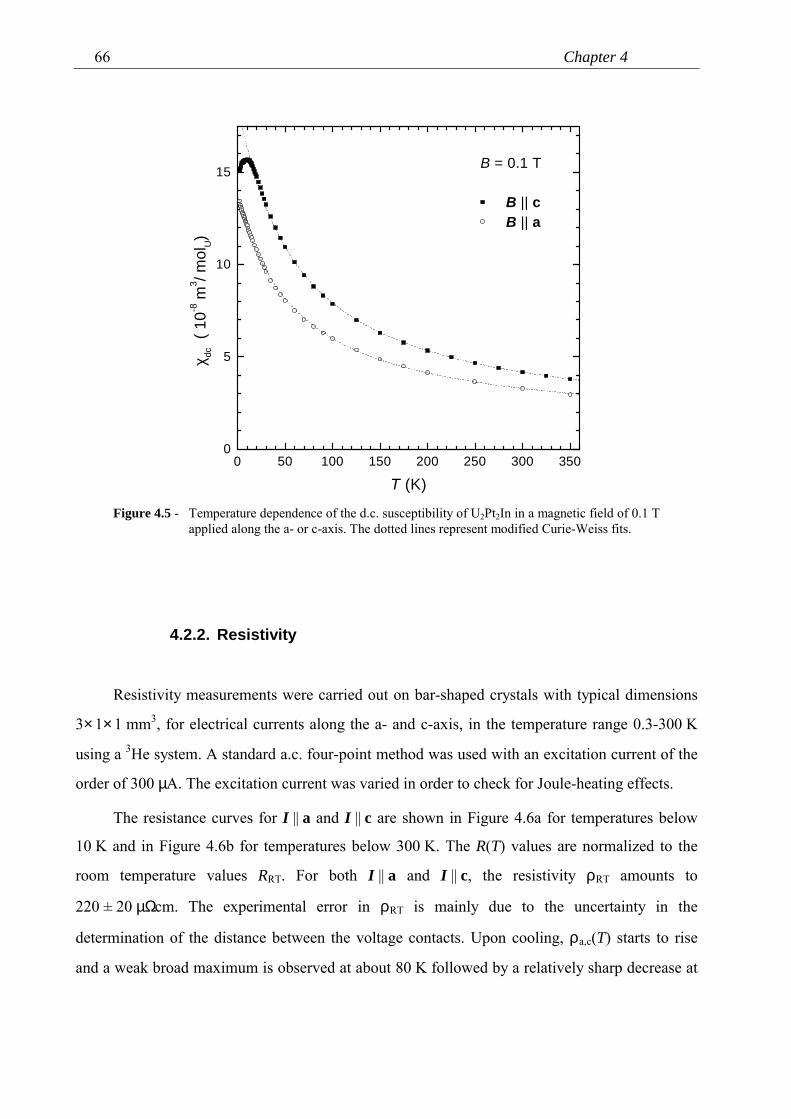
Chapter 466
0 50 100 150 200 250 300 3500
5
10
15 B = 0.1 T
B || c B || a
χ dc (
10-8
m3 / m
olU)
T (K)
Figure 4.5 - Temperature dependence of the d.c. susceptibility of U2Pt2In in a magnetic field of 0.1 Tapplied along the a- or c-axis. The dotted lines represent modified Curie-Weiss fits.
4.2.2. Resistivity
Resistivity measurements were carried out on bar-shaped crystals with typical dimensions
3×1×1 mm3, for electrical currents along the a- and c-axis, in the temperature range 0.3-300 K
using a 3He system. A standard a.c. four-point method was used with an excitation current of the
order of 300 µA. The excitation current was varied in order to check for Joule-heating effects.
The resistance curves for I || a and I || c are shown in Figure 4.6a for temperatures below
10 K and in Figure 4.6b for temperatures below 300 K. The R(T) values are normalized to the
room temperature values RRT. For both I || a and I || c, the resistivity ρRT amounts to
220 ± 20 µΩcm. The experimental error in ρRT is mainly due to the uncertainty in the
determination of the distance between the voltage contacts. Upon cooling, ρa,c(T) starts to rise
and a weak broad maximum is observed at about 80 K followed by a relatively sharp decrease at
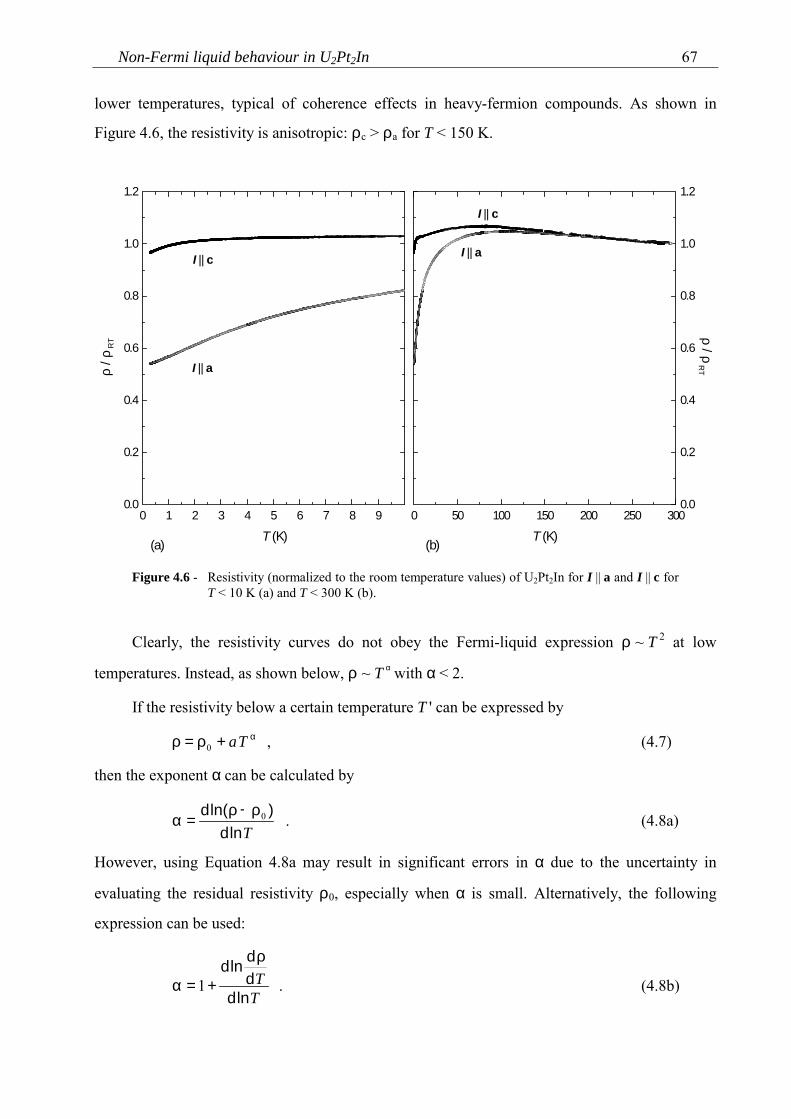
Non-Fermi liquid behaviour in U2Pt2In 67
lower temperatures, typical of coherence effects in heavy-fermion compounds. As shown in
Figure 4.6, the resistivity is anisotropic: ρc > ρa for T < 150 K.
0 50 100 150 200 250 3000.0
0.2
0.4
0.6
0.8
1.0
1.2
(b)
ρ / ρ R
T
I || a
I || c
T (K)0 1 2 3 4 5 6 7 8 9
0.0
0.2
0.4
0.6
0.8
1.0
1.2
(a)
I || a
I || c
ρ / ρ
RT
T (K)
Figure 4.6 - Resistivity (normalized to the room temperature values) of U2Pt2In for I || a and I || c forT < 10 K (a) and T < 300 K (b).
Clearly, the resistivity curves do not obey the Fermi-liquid expression ρ ~ T 2 at low
temperatures. Instead, as shown below, ρ ~ T α with α < 2.
If the resistivity below a certain temperature T ' can be expressed by
α+ρ=ρ Ta0 , (4.7)
then the exponent α can be calculated by
Tlnd)ln(d 0ρ−ρ
=α . (4.8a)
However, using Equation 4.8a may result in significant errors in α due to the uncertainty in
evaluating the residual resistivity ρ0, especially when α is small. Alternatively, the following
expression can be used:
TT
lndddlnd ρ
+=α 1 . (4.8b)
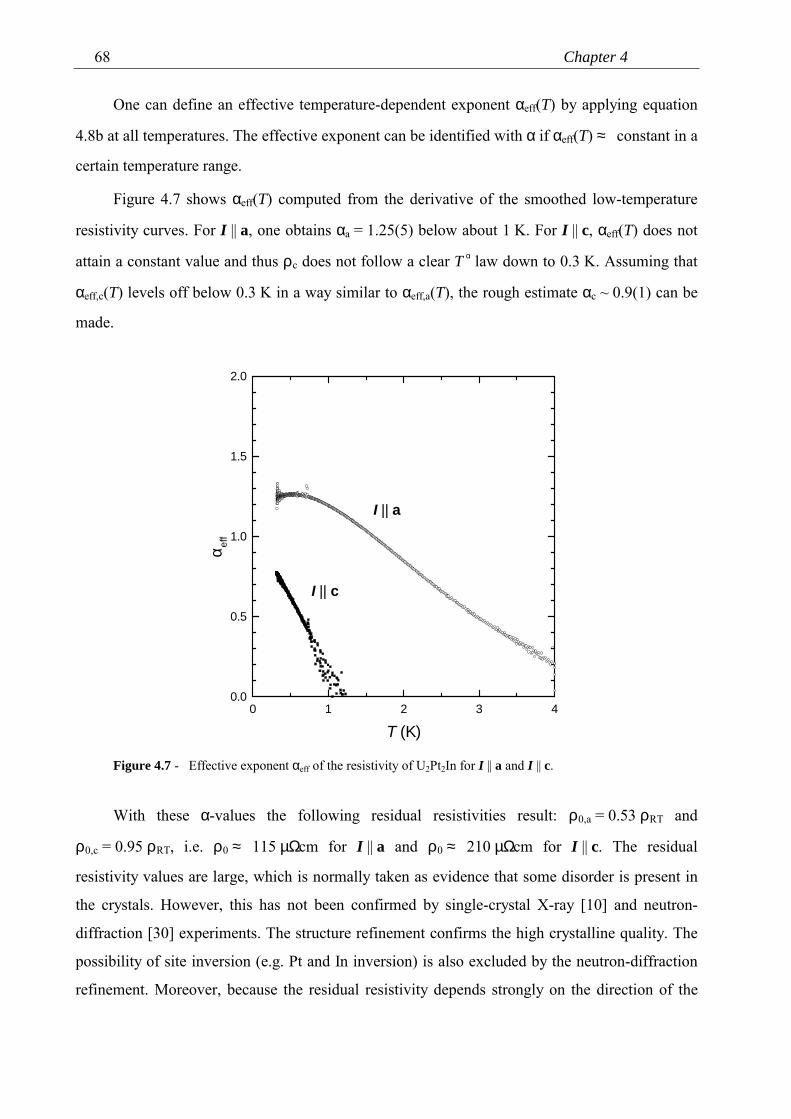
Chapter 468
One can define an effective temperature-dependent exponent αeff(T) by applying equation
4.8b at all temperatures. The effective exponent can be identified with α if αeff(T) ≈ constant in a
certain temperature range.
Figure 4.7 shows αeff(T) computed from the derivative of the smoothed low-temperature
resistivity curves. For I || a, one obtains αa = 1.25(5) below about 1 K. For I || c, αeff(T) does not
attain a constant value and thus ρc does not follow a clear T α law down to 0.3 K. Assuming that
αeff,c(T) levels off below 0.3 K in a way similar to αeff,a(T), the rough estimate αc ~ 0.9(1) can be
made.
0 1 2 3 40.0
0.5
1.0
1.5
2.0
I || c
I || a
α eff
T (K)
Figure 4.7 - Effective exponent αeff of the resistivity of U2Pt2In for I || a and I || c.
With these α-values the following residual resistivities result: ρ0,a = 0.53 ρRT and
ρ0,c = 0.95 ρRT, i.e. ρ0 ≈ 115 µΩcm for I || a and ρ0 ≈ 210 µΩcm for I || c. The residual
resistivity values are large, which is normally taken as evidence that some disorder is present in
the crystals. However, this has not been confirmed by single-crystal X-ray [10] and neutron-
diffraction [30] experiments. The structure refinement confirms the high crystalline quality. The
possibility of site inversion (e.g. Pt and In inversion) is also excluded by the neutron-diffraction
refinement. Moreover, because the residual resistivity depends strongly on the direction of the
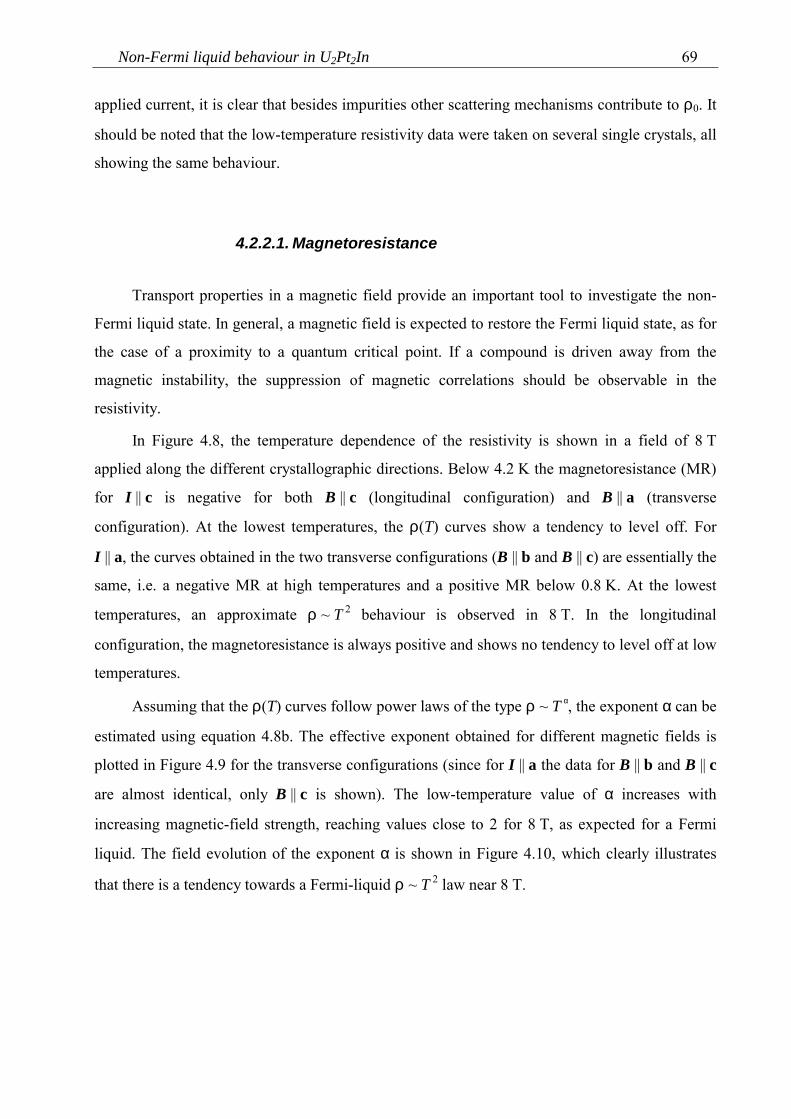
Non-Fermi liquid behaviour in U2Pt2In 69
applied current, it is clear that besides impurities other scattering mechanisms contribute to ρ0. It
should be noted that the low-temperature resistivity data were taken on several single crystals, all
showing the same behaviour.
4.2.2.1. Magnetoresistance
Transport properties in a magnetic field provide an important tool to investigate the non-
Fermi liquid state. In general, a magnetic field is expected to restore the Fermi liquid state, as for
the case of a proximity to a quantum critical point. If a compound is driven away from the
magnetic instability, the suppression of magnetic correlations should be observable in the
resistivity.
In Figure 4.8, the temperature dependence of the resistivity is shown in a field of 8 T
applied along the different crystallographic directions. Below 4.2 K the magnetoresistance (MR)
for I || c is negative for both B || c (longitudinal configuration) and B || a (transverse
configuration). At the lowest temperatures, the ρ(T) curves show a tendency to level off. For
I || a, the curves obtained in the two transverse configurations (B || b and B || c) are essentially the
same, i.e. a negative MR at high temperatures and a positive MR below 0.8 K. At the lowest
temperatures, an approximate ρ ~ T 2 behaviour is observed in 8 T. In the longitudinal
configuration, the magnetoresistance is always positive and shows no tendency to level off at low
temperatures.
Assuming that the ρ(T) curves follow power laws of the type ρ ~ T α, the exponent α can be
estimated using equation 4.8b. The effective exponent obtained for different magnetic fields is
plotted in Figure 4.9 for the transverse configurations (since for I || a the data for B || b and B || c
are almost identical, only B || c is shown). The low-temperature value of α increases with
increasing magnetic-field strength, reaching values close to 2 for 8 T, as expected for a Fermi
liquid. The field evolution of the exponent α is shown in Figure 4.10, which clearly illustrates
that there is a tendency towards a Fermi-liquid ρ ~ T 2 law near 8 T.
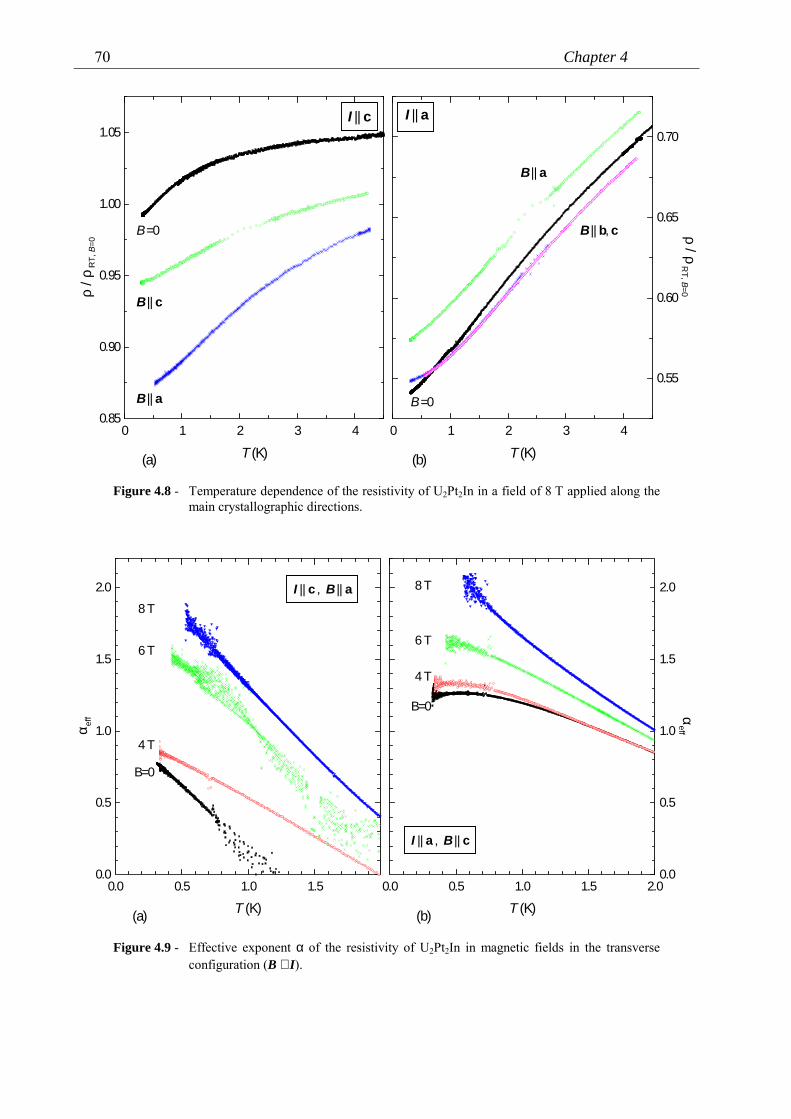
Chapter 470
0 1 2 3 40.85
0.90
0.95
1.00
1.05
(a)
B || c
B || a
B =0
I || c
ρ / ρ
RT,
B=0
T (K)0 1 2 3 4
0.55
0.60
0.65
0.70
(b)
I || a
B =0
B || a
B || b, c ρ / ρ R
T, B=0
T (K)
Figure 4.8 - Temperature dependence of the resistivity of U2Pt2In in a field of 8 T applied along themain crystallographic directions.
0.0 0.5 1.0 1.50.0
0.5
1.0
1.5
2.08 T
6 T
4 T
B=0
(a)
I || c , B || a
α eff
T (K)0.0 0.5 1.0 1.5 2.0
0.0
0.5
1.0
1.5
2.08 T
6 T
4 T
B=0
(b)
I || a , B || c
αeff
T (K)
Figure 4.9 - Effective exponent α of the resistivity of U2Pt2In in magnetic fields in the transverseconfiguration (B ⊥ I).
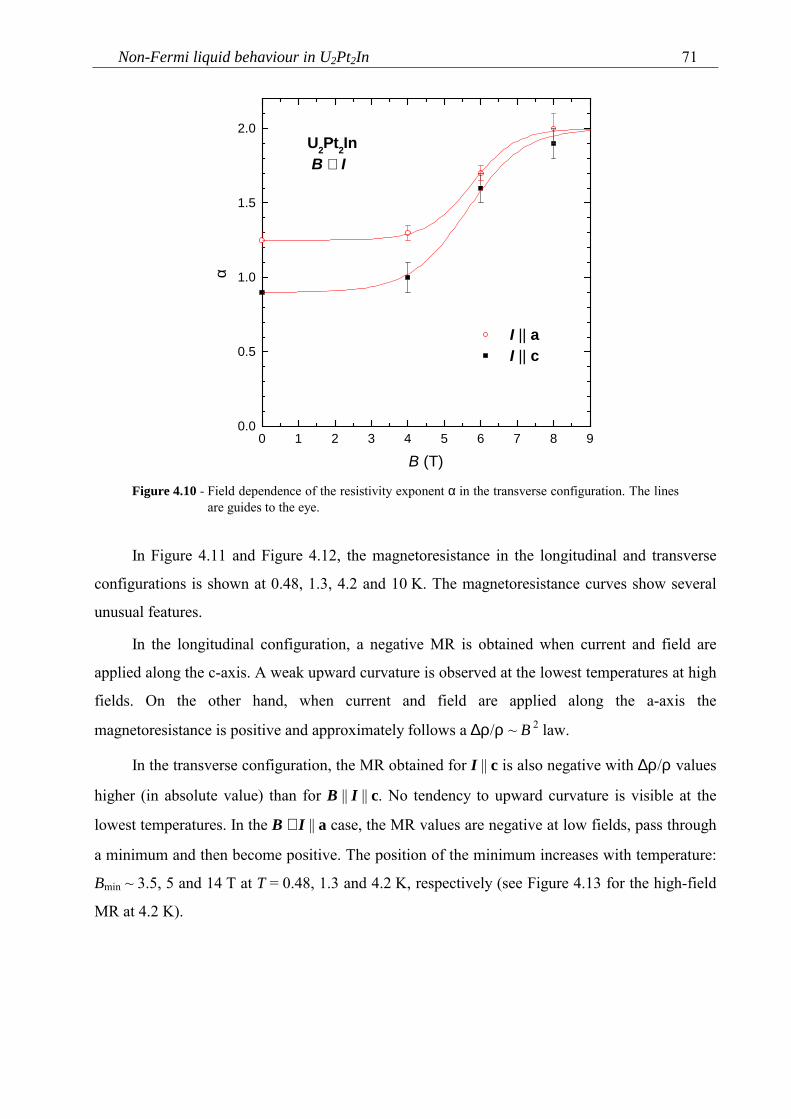
Non-Fermi liquid behaviour in U2Pt2In 71
0 1 2 3 4 5 6 7 8 90.0
0.5
1.0
1.5
2.0U2Pt2In B ⊥ I
I || a I || c
α
B (T)
Figure 4.10 - Field dependence of the resistivity exponent α in the transverse configuration. The linesare guides to the eye.
In Figure 4.11 and Figure 4.12, the magnetoresistance in the longitudinal and transverse
configurations is shown at 0.48, 1.3, 4.2 and 10 K. The magnetoresistance curves show several
unusual features.
In the longitudinal configuration, a negative MR is obtained when current and field are
applied along the c-axis. A weak upward curvature is observed at the lowest temperatures at high
fields. On the other hand, when current and field are applied along the a-axis the
magnetoresistance is positive and approximately follows a ∆ρ/ρ ~ B 2 law.
In the transverse configuration, the MR obtained for I || c is also negative with ∆ρ/ρ values
higher (in absolute value) than for B || I || c. No tendency to upward curvature is visible at the
lowest temperatures. In the B ⊥ I || a case, the MR values are negative at low fields, pass through
a minimum and then become positive. The position of the minimum increases with temperature:
Bmin ~ 3.5, 5 and 14 T at T = 0.48, 1.3 and 4.2 K, respectively (see Figure 4.13 for the high-field
MR at 4.2 K).
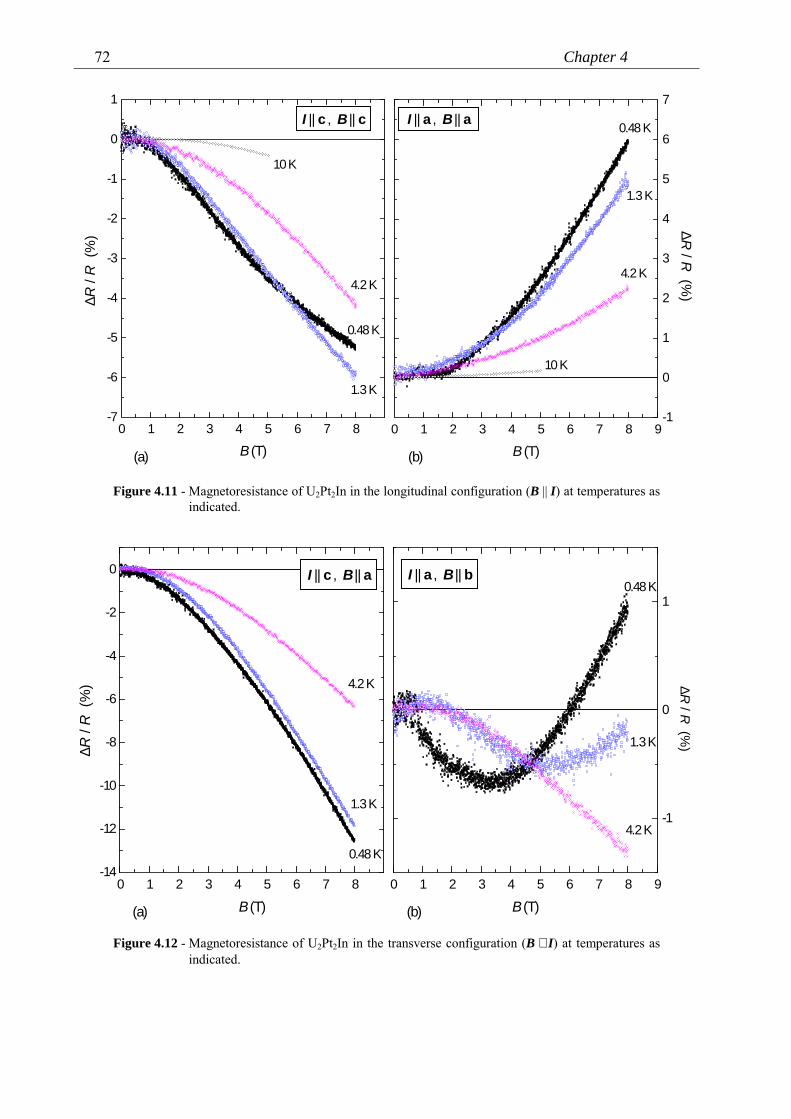
Chapter 472
0 1 2 3 4 5 6 7 8-7
-6
-5
-4
-3
-2
-1
0
1
(a)
10 K
4.2 K
1.3 K
0.48 K
I || c , B || c
∆R /
R (
%)
B (T)0 1 2 3 4 5 6 7 8 9
-1
0
1
2
3
4
5
6
7
(b)
10 K
0.48 K
1.3 K
4.2 K
∆R / R
(%)
I || a , B || a
B (T)
Figure 4.11 - Magnetoresistance of U2Pt2In in the longitudinal configuration (B || I) at temperatures asindicated.
0 1 2 3 4 5 6 7 8-14
-12
-10
-8
-6
-4
-2
0
(a)
4.2 K
1.3 K
0.48 K
I || c , B || a
∆R /
R (
%)
B (T)0 1 2 3 4 5 6 7 8 9
-1
0
1
(b)
4.2 K
1.3 K
0.48 KI || a , B || b
∆R / R
(%)
B (T)
Figure 4.12 - Magnetoresistance of U2Pt2In in the transverse configuration (B ⊥ I) at temperatures asindicated.
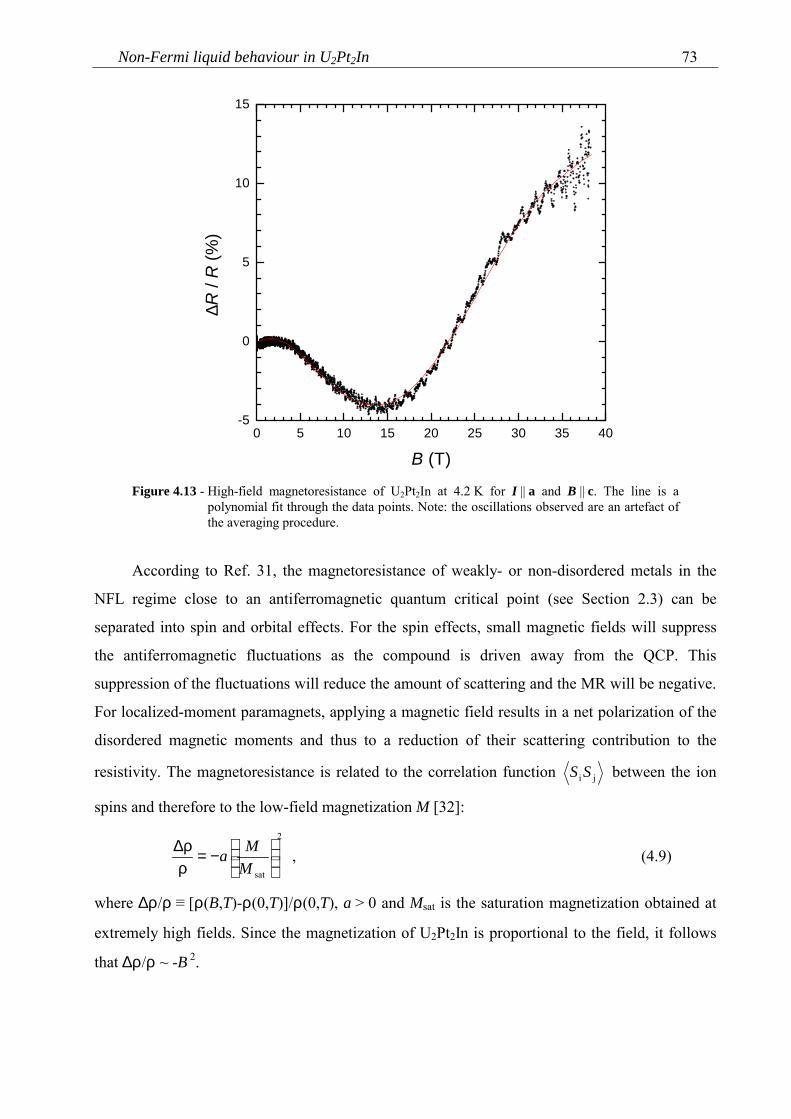
Non-Fermi liquid behaviour in U2Pt2In 73
0 5 10 15 20 25 30 35 40-5
0
5
10
15
∆R /
R (%
)
B (T)
Figure 4.13 - High-field magnetoresistance of U2Pt2In at 4.2 K for I || a and B || c. The line is apolynomial fit through the data points. Note: the oscillations observed are an artefact ofthe averaging procedure.
According to Ref. 31, the magnetoresistance of weakly- or non-disordered metals in the
NFL regime close to an antiferromagnetic quantum critical point (see Section 2.3) can be
separated into spin and orbital effects. For the spin effects, small magnetic fields will suppress
the antiferromagnetic fluctuations as the compound is driven away from the QCP. This
suppression of the fluctuations will reduce the amount of scattering and the MR will be negative.
For localized-moment paramagnets, applying a magnetic field results in a net polarization of the
disordered magnetic moments and thus to a reduction of their scattering contribution to the
resistivity. The magnetoresistance is related to the correlation function ji SS between the ion
spins and therefore to the low-field magnetization M [32]:
2
sat
−=
ρρ∆
MMa , (4.9)
where ∆ρ/ρ ≡ [ρ(B,T)-ρ(0,T)]/ρ(0,T), a > 0 and Msat is the saturation magnetization obtained at
extremely high fields. Since the magnetization of U2Pt2In is proportional to the field, it follows
that ∆ρ/ρ ~ -B 2.
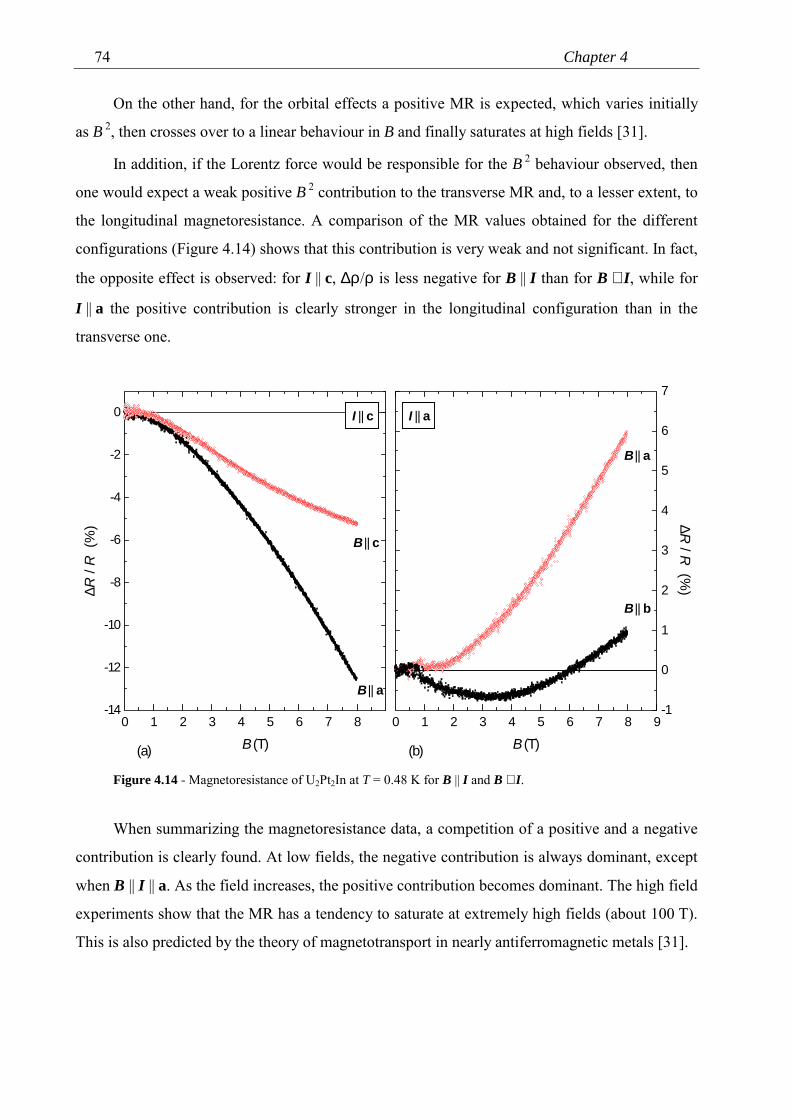
Chapter 474
On the other hand, for the orbital effects a positive MR is expected, which varies initially
as B 2, then crosses over to a linear behaviour in B and finally saturates at high fields [31].
In addition, if the Lorentz force would be responsible for the B 2 behaviour observed, then
one would expect a weak positive B 2 contribution to the transverse MR and, to a lesser extent, to
the longitudinal magnetoresistance. A comparison of the MR values obtained for the different
configurations (Figure 4.14) shows that this contribution is very weak and not significant. In fact,
the opposite effect is observed: for I || c, ∆ρ/ρ is less negative for B || I than for B ⊥ I, while for
I || a the positive contribution is clearly stronger in the longitudinal configuration than in the
transverse one.
0 1 2 3 4 5 6 7 8-14
-12
-10
-8
-6
-4
-2
0
(a)
B || c
B || a
I || c
∆R /
R (
%)
B (T)0 1 2 3 4 5 6 7 8 9
-1
0
1
2
3
4
5
6
7
(b)
B || b
B || a
I || a
∆R / R
(%)
B (T)
Figure 4.14 - Magnetoresistance of U2Pt2In at T = 0.48 K for B || I and B ⊥ I.
When summarizing the magnetoresistance data, a competition of a positive and a negative
contribution is clearly found. At low fields, the negative contribution is always dominant, except
when B || I || a. As the field increases, the positive contribution becomes dominant. The high field
experiments show that the MR has a tendency to saturate at extremely high fields (about 100 T).
This is also predicted by the theory of magnetotransport in nearly antiferromagnetic metals [31].
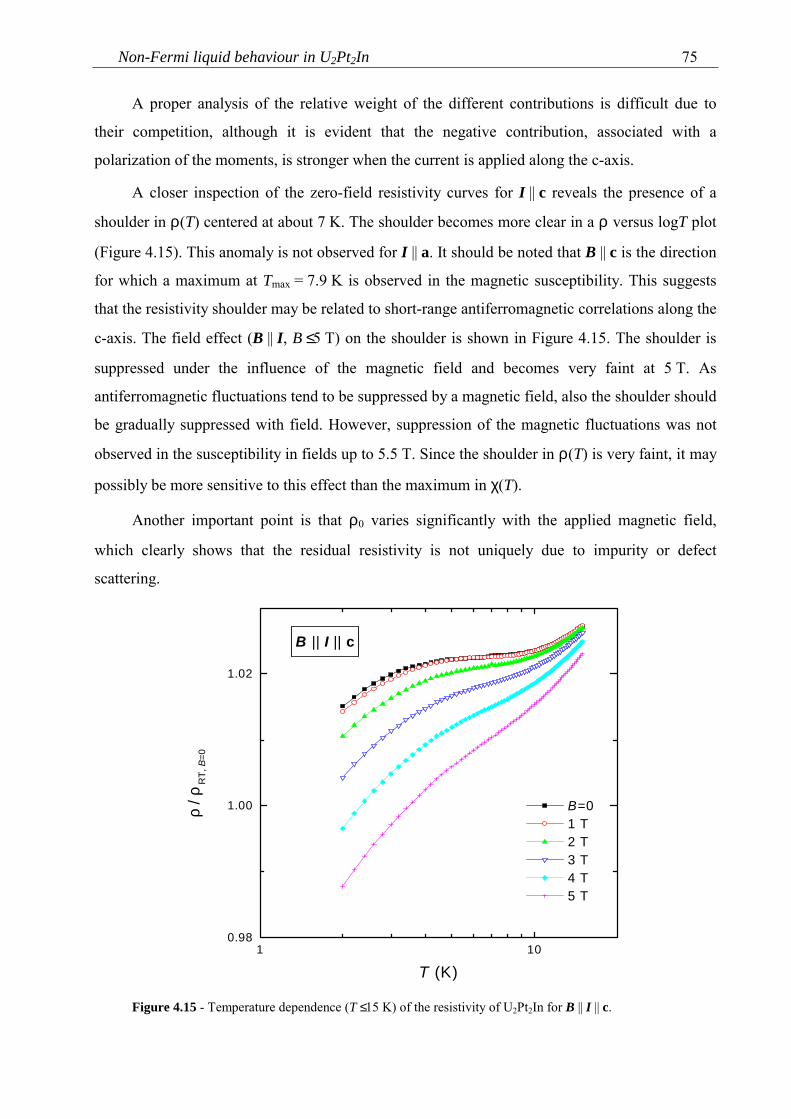
Non-Fermi liquid behaviour in U2Pt2In 75
A proper analysis of the relative weight of the different contributions is difficult due to
their competition, although it is evident that the negative contribution, associated with a
polarization of the moments, is stronger when the current is applied along the c-axis.
A closer inspection of the zero-field resistivity curves for I || c reveals the presence of a
shoulder in ρ(T) centered at about 7 K. The shoulder becomes more clear in a ρ versus logT plot
(Figure 4.15). This anomaly is not observed for I || a. It should be noted that B || c is the direction
for which a maximum at Tmax = 7.9 K is observed in the magnetic susceptibility. This suggests
that the resistivity shoulder may be related to short-range antiferromagnetic correlations along the
c-axis. The field effect (B || I, B ≤ 5 T) on the shoulder is shown in Figure 4.15. The shoulder is
suppressed under the influence of the magnetic field and becomes very faint at 5 T. As
antiferromagnetic fluctuations tend to be suppressed by a magnetic field, also the shoulder should
be gradually suppressed with field. However, suppression of the magnetic fluctuations was not
observed in the susceptibility in fields up to 5.5 T. Since the shoulder in ρ(T) is very faint, it may
possibly be more sensitive to this effect than the maximum in χ(T).
Another important point is that ρ0 varies significantly with the applied magnetic field,
which clearly shows that the residual resistivity is not uniquely due to impurity or defect
scattering.
1 100.98
1.00
1.02
B || I || c
B=0 1 T 2 T 3 T 4 T 5 T
ρ / ρ
RT,
B=0
T (K)
Figure 4.15 - Temperature dependence (T ≤ 15 K) of the resistivity of U2Pt2In for B || I || c.
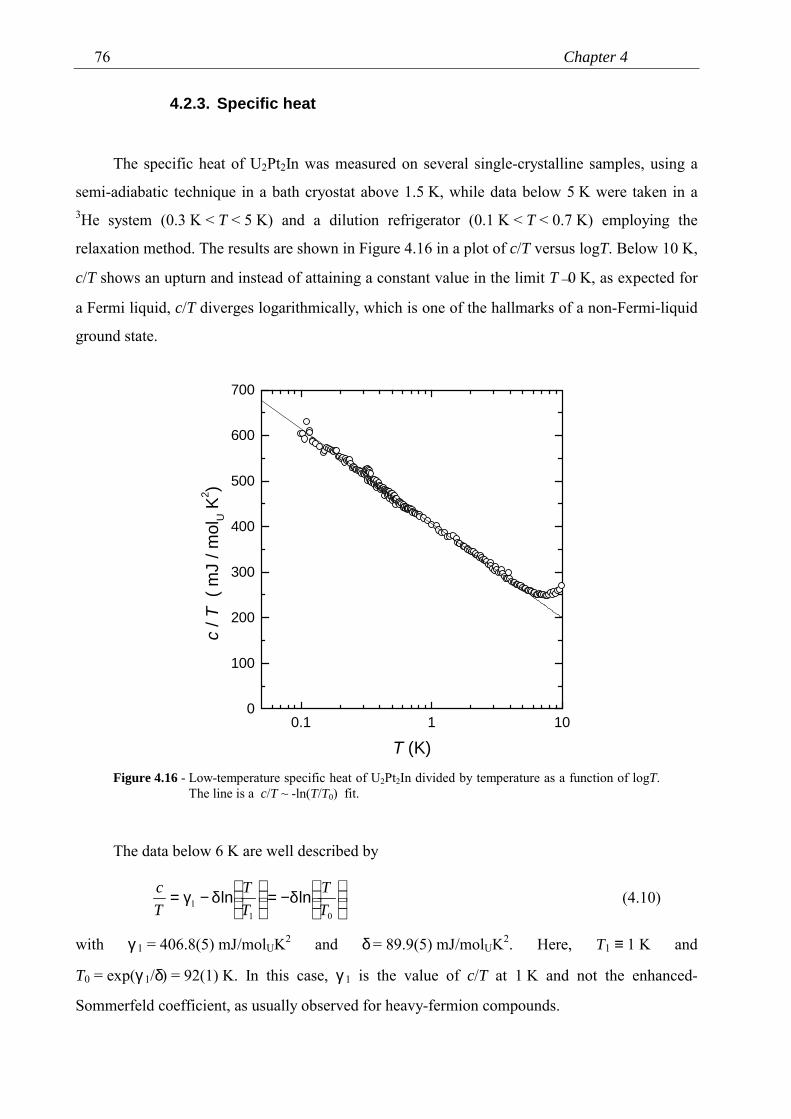
Chapter 476
4.2.3. Specific heat
The specific heat of U2Pt2In was measured on several single-crystalline samples, using a
semi-adiabatic technique in a bath cryostat above 1.5 K, while data below 5 K were taken in a3He system (0.3 K < T < 5 K) and a dilution refrigerator (0.1 K < T < 0.7 K) employing the
relaxation method. The results are shown in Figure 4.16 in a plot of c/T versus logT. Below 10 K,
c/T shows an upturn and instead of attaining a constant value in the limit T→0 K, as expected for
a Fermi liquid, c/T diverges logarithmically, which is one of the hallmarks of a non-Fermi-liquid
ground state.
0.1 1 100
100
200
300
400
500
600
700
c / T
( m
J / m
olU K
2 )
T (K)Figure 4.16 - Low-temperature specific heat of U2Pt2In divided by temperature as a function of logT.
The line is a c/T ~ -ln(T/T0) fit.
The data below 6 K are well described by
δ−=
δ−γ=
011 T
TTT
Tc lnln (4.10)
with γ1 = 406.8(5) mJ/molUK2 and δ = 89.9(5) mJ/molUK2. Here, T1 ≡ 1 K and
T0 = exp(γ1/δ) = 92(1) K. In this case, γ1 is the value of c/T at 1 K and not the enhanced-
Sommerfeld coefficient, as usually observed for heavy-fermion compounds.
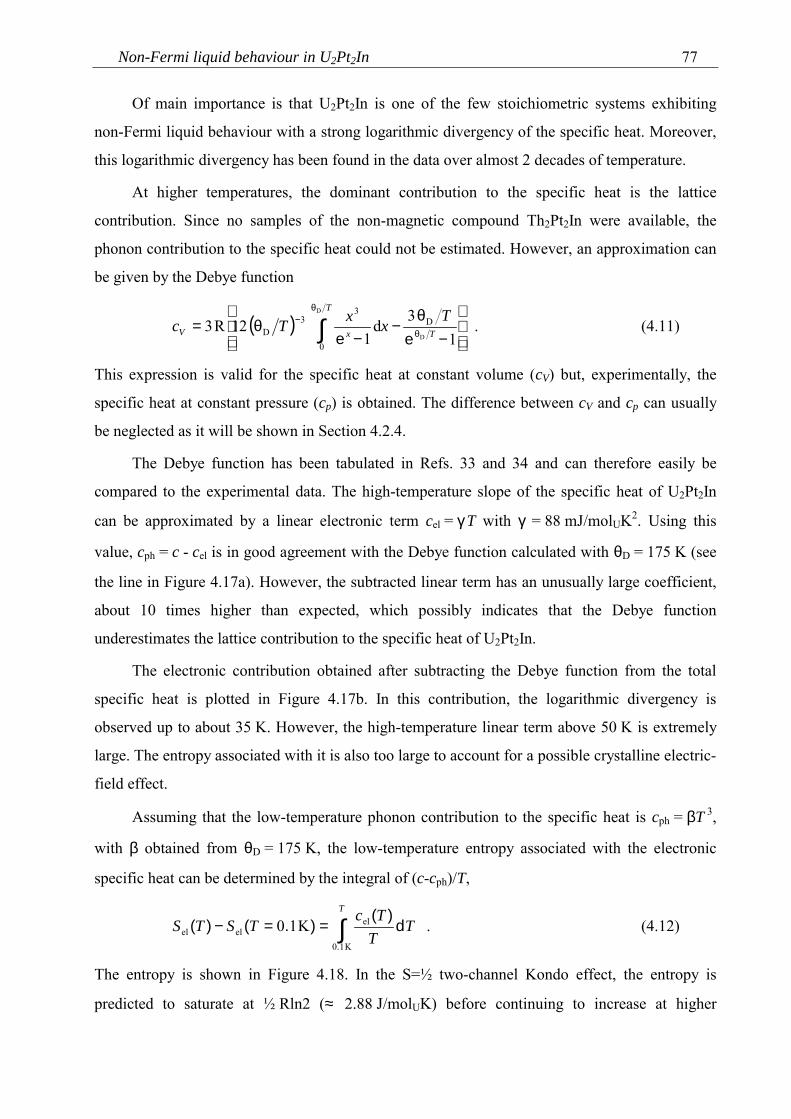
Non-Fermi liquid behaviour in U2Pt2In 77
Of main importance is that U2Pt2In is one of the few stoichiometric systems exhibiting
non-Fermi liquid behaviour with a strong logarithmic divergency of the specific heat. Moreover,
this logarithmic divergency has been found in the data over almost 2 decades of temperature.
At higher temperatures, the dominant contribution to the specific heat is the lattice
contribution. Since no samples of the non-magnetic compound Th2Pt2In were available, the
phonon contribution to the specific heat could not be estimated. However, an approximation can
be given by the Debye function
( )
−θ
−−
θ= θ
θ− ∫ 1
3d
112R3
D
D
D
0
33
D T
T
xVTxxTc
ee . (4.11)
This expression is valid for the specific heat at constant volume (cV) but, experimentally, the
specific heat at constant pressure (cp) is obtained. The difference between cV and cp can usually
be neglected as it will be shown in Section 4.2.4.
The Debye function has been tabulated in Refs. 33 and 34 and can therefore easily be
compared to the experimental data. The high-temperature slope of the specific heat of U2Pt2In
can be approximated by a linear electronic term cel = γT with γ = 88 mJ/molUK2. Using this
value, cph = c - cel is in good agreement with the Debye function calculated with θD = 175 K (see
the line in Figure 4.17a). However, the subtracted linear term has an unusually large coefficient,
about 10 times higher than expected, which possibly indicates that the Debye function
underestimates the lattice contribution to the specific heat of U2Pt2In.
The electronic contribution obtained after subtracting the Debye function from the total
specific heat is plotted in Figure 4.17b. In this contribution, the logarithmic divergency is
observed up to about 35 K. However, the high-temperature linear term above 50 K is extremely
large. The entropy associated with it is also too large to account for a possible crystalline electric-
field effect.
Assuming that the low-temperature phonon contribution to the specific heat is cph = βT 3,
with β obtained from θD = 175 K, the low-temperature entropy associated with the electronic
specific heat can be determined by the integral of (c-cph)/T,
∫==−T
TT
TcTSTS
K10
elelel K10
.
d)().()( . (4.12)
The entropy is shown in Figure 4.18. In the S=½ two-channel Kondo effect, the entropy is
predicted to saturate at ½ Rln2 (≈ 2.88 J/molUK) before continuing to increase at higher
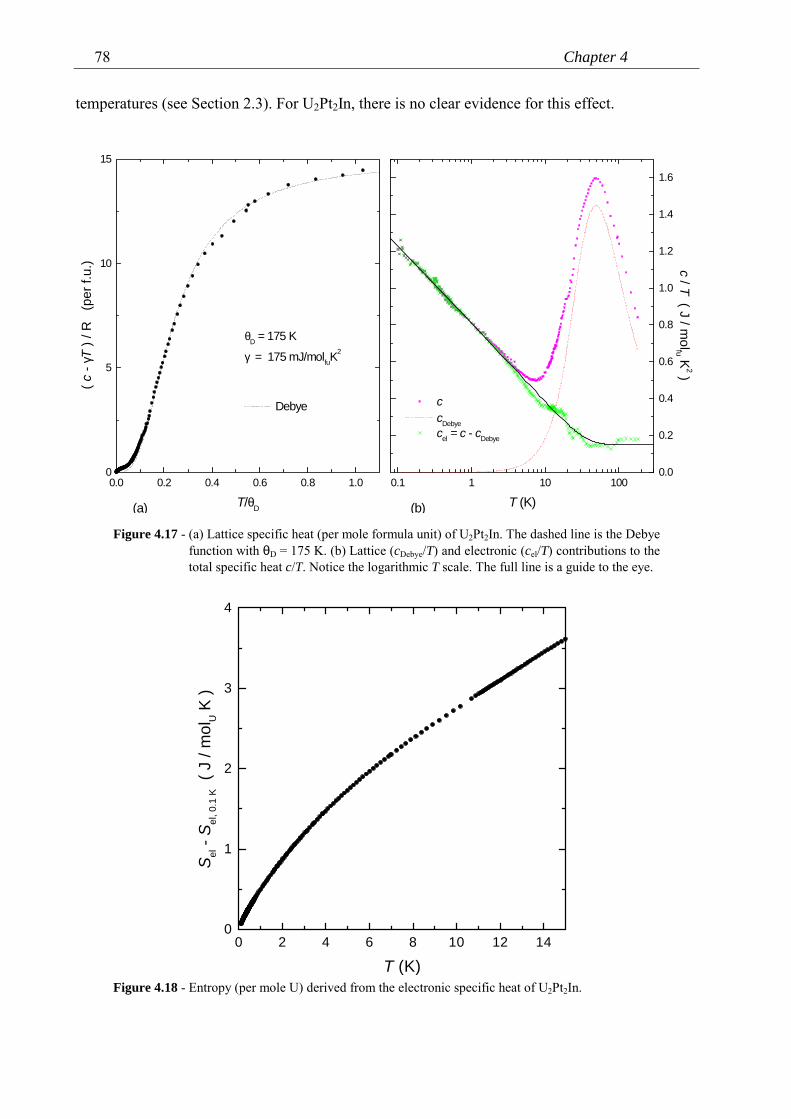
Chapter 478
temperatures (see Section 2.3). For U2Pt2In, there is no clear evidence for this effect.
0.0 0.2 0.4 0.6 0.8 1.00
5
10
15
(a)
θD = 175 K
γ = 175 mJ/molfuK2
Debye
( c -
γT )
/ R
(per
f.u.
)
T/θD
0.1 1 10 1000.0
0.2
0.4
0.6
0.8
1.0
1.2
1.4
1.6
(b)
c cDebye cel = c - cDebye
c / T ( J / molfu K
2 )
T (K)
Figure 4.17 - (a) Lattice specific heat (per mole formula unit) of U2Pt2In. The dashed line is the Debyefunction with θD = 175 K. (b) Lattice (cDebye/T) and electronic (cel/T) contributions to thetotal specific heat c/T. Notice the logarithmic T scale. The full line is a guide to the eye.
0 2 4 6 8 10 12 140
1
2
3
4
S el -
S el, 0
.1 K (
J /
mol
U K
)
T (K)Figure 4.18 - Entropy (per mole U) derived from the electronic specific heat of U2Pt2In.
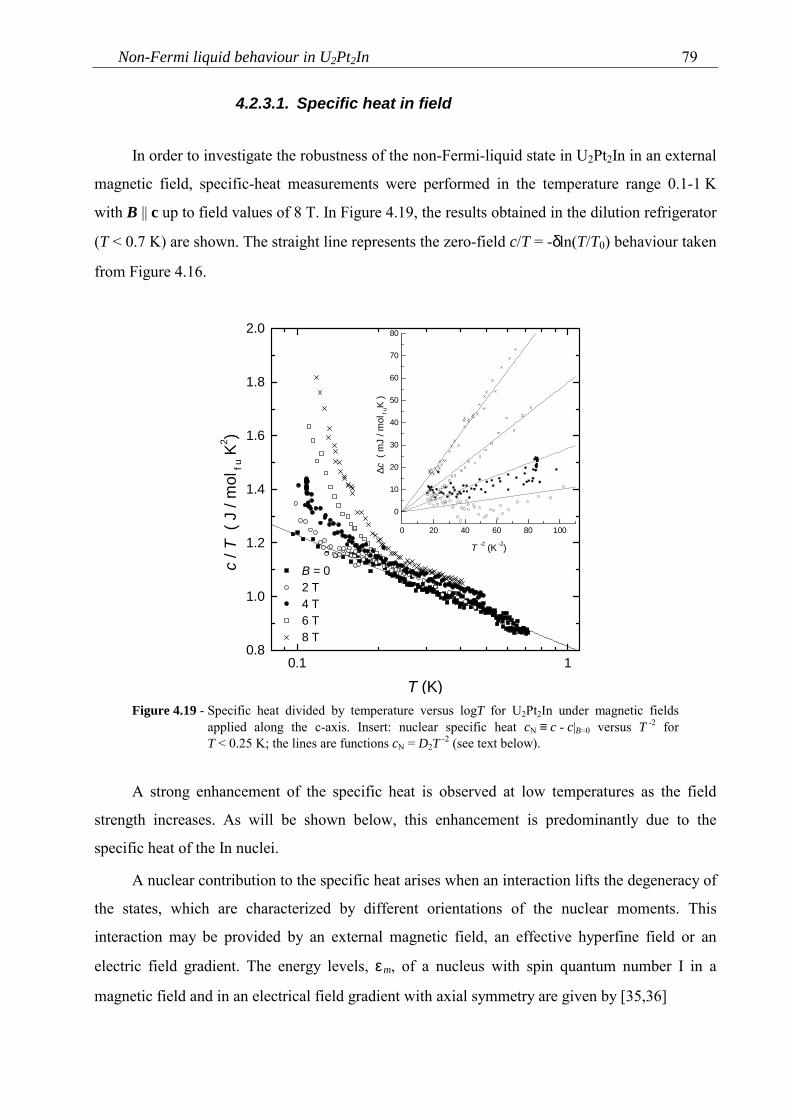
Non-Fermi liquid behaviour in U2Pt2In 79
4.2.3.1. Specific heat in field
In order to investigate the robustness of the non-Fermi-liquid state in U2Pt2In in an external
magnetic field, specific-heat measurements were performed in the temperature range 0.1-1 K
with B || c up to field values of 8 T. In Figure 4.19, the results obtained in the dilution refrigerator
(T < 0.7 K) are shown. The straight line represents the zero-field c/T = -δln(T/T0) behaviour taken
from Figure 4.16.
0 20 40 60 80 100
0
10
20
30
40
50
60
70
80
∆c (
mJ
/ mol
f uK
)
T -2 (K -2)
0.1 10.8
1.0
1.2
1.4
1.6
1.8
2.0
B = 02 T4 T6 T8 T
c / T
( J
/ m
ol f
u K2 )
T (K)Figure 4.19 - Specific heat divided by temperature versus logT for U2Pt2In under magnetic fields
applied along the c-axis. Insert: nuclear specific heat cN ≡ c - c|B=0 versus T -2 forT < 0.25 K; the lines are functions cN = D2T -2 (see text below).
A strong enhancement of the specific heat is observed at low temperatures as the field
strength increases. As will be shown below, this enhancement is predominantly due to the
specific heat of the In nuclei.
A nuclear contribution to the specific heat arises when an interaction lifts the degeneracy of
the states, which are characterized by different orientations of the nuclear moments. This
interaction may be provided by an external magnetic field, an effective hyperfine field or an
electric field gradient. The energy levels, εm, of a nucleus with spin quantum number I in a
magnetic field and in an electrical field gradient with axial symmetry are given by [35,36]
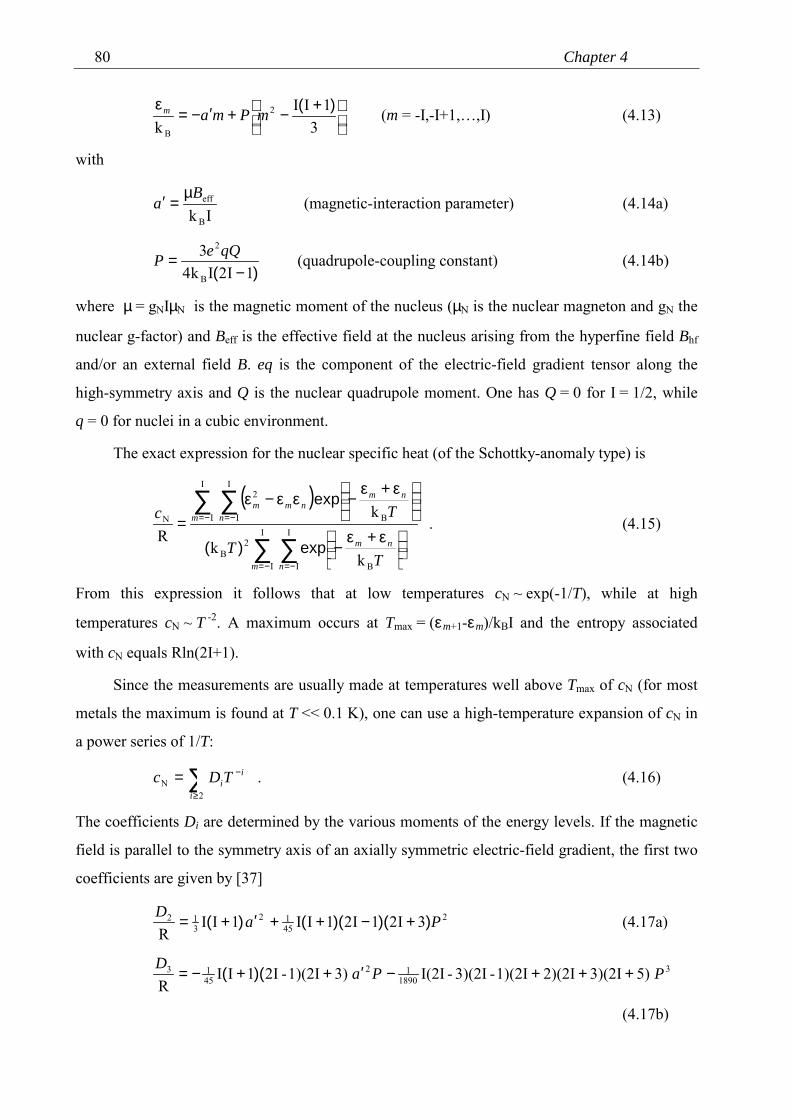
Chapter 480
+−+′−=
ε3
1IIk
2
B
)(mPmam (m = -I,-I+1,…,I) (4.13)
with
Ik B
effBa
µ=′ (magnetic-interaction parameter) (4.14a)
)( 1I2Ik43
B
2
−= qQeP (quadrupole-coupling constant) (4.14b)
where µ = gNIµN is the magnetic moment of the nucleus (µN is the nuclear magneton and gN the
nuclear g-factor) and Beff is the effective field at the nucleus arising from the hyperfine field Bhf
and/or an external field B. eq is the component of the electric-field gradient tensor along the
high-symmetry axis and Q is the nuclear quadrupole moment. One has Q = 0 for I = 1/2, while
q = 0 for nuclei in a cubic environment.
The exact expression for the nuclear specific heat (of the Schottky-anomaly type) is
( )
∑ ∑
∑ ∑
−= −=
−= −=
ε+ε−
ε+ε−εε−ε
=I
I
I
I B
2B
I
I
I
I B
2
N
kk
kR
m n
nm
m n
nmnmm
TT
Tc
exp)(
exp . (4.15)
From this expression it follows that at low temperatures cN ~ exp(-1/T), while at high
temperatures cN ~ T -2. A maximum occurs at Tmax = (εm+1-εm)/kBI and the entropy associated
with cN equals Rln(2I+1).
Since the measurements are usually made at temperatures well above Tmax of cN (for most
metals the maximum is found at T << 0.1 K), one can use a high-temperature expansion of cN in
a power series of 1/T:
∑≥
−=2
Ni
iiTDc . (4.16)
The coefficients Di are determined by the various moments of the energy levels. If the magnetic
field is parallel to the symmetry axis of an axially symmetric electric-field gradient, the first two
coefficients are given by [37]
24512
312 3I21I21II1II
RPaD ))()(()( +−++′+= (4.17a)
31890
124513 5)3)(2I2)(2I1)(2I-3)(2I-I(2I3)1)(2I-I21II
RPPaD
+++−′++−= )((
(4.17b)
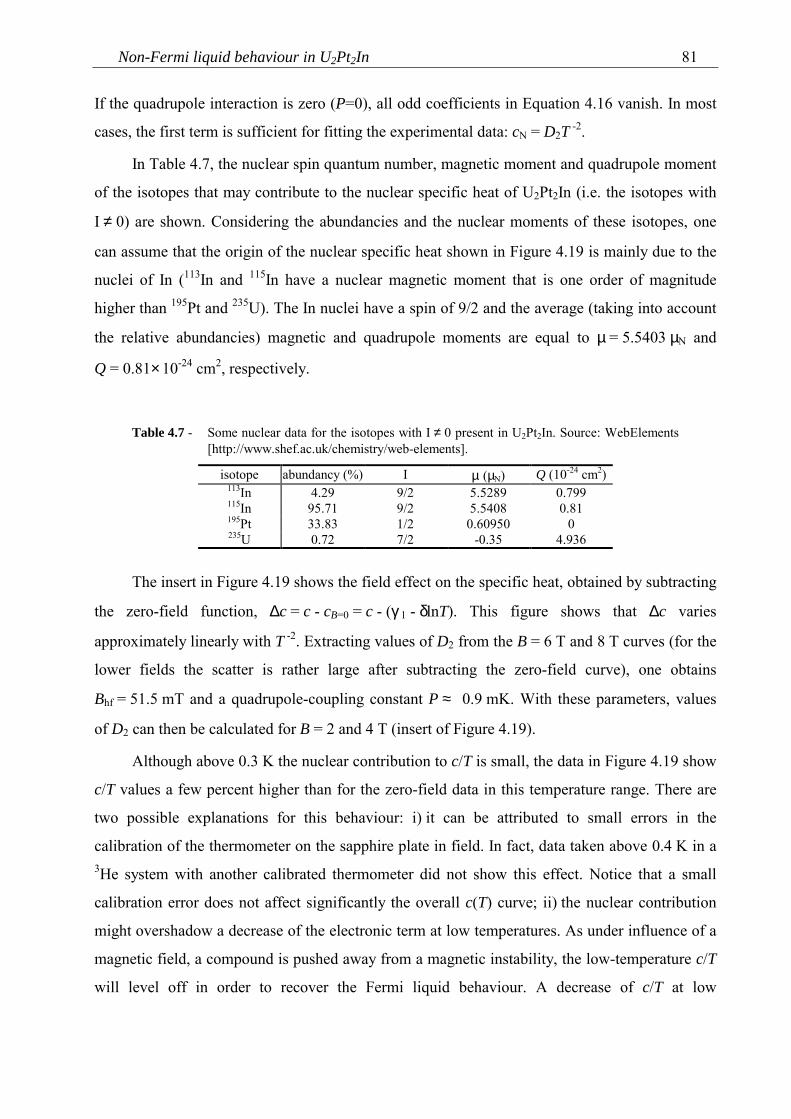
Non-Fermi liquid behaviour in U2Pt2In 81
If the quadrupole interaction is zero (P=0), all odd coefficients in Equation 4.16 vanish. In most
cases, the first term is sufficient for fitting the experimental data: cN = D2T -2.
In Table 4.7, the nuclear spin quantum number, magnetic moment and quadrupole moment
of the isotopes that may contribute to the nuclear specific heat of U2Pt2In (i.e. the isotopes with
I ≠ 0) are shown. Considering the abundancies and the nuclear moments of these isotopes, one
can assume that the origin of the nuclear specific heat shown in Figure 4.19 is mainly due to the
nuclei of In (113In and 115In have a nuclear magnetic moment that is one order of magnitude
higher than 195Pt and 235U). The In nuclei have a spin of 9/2 and the average (taking into account
the relative abundancies) magnetic and quadrupole moments are equal to µ = 5.5403 µN and
Q = 0.81×10⁻²⁴ cm2, respectively.
Table 4.7 - Some nuclear data for the isotopes with I ≠ 0 present in U2Pt2In. Source: WebElements[http://www.shef.ac.uk/chemistry/web-elements].
isotope abundancy (%) I µ (µN) Q (10-24 cm2)113In 4.29 9/2 5.5289 0.799115In 95.71 9/2 5.5408 0.81195Pt 33.83 1/2 0.60950 0235U 0.72 7/2 -0.35 4.936
The insert in Figure 4.19 shows the field effect on the specific heat, obtained by subtracting
the zero-field function, ∆c = c - cB=0 = c - (γ1 - δlnT). This figure shows that ∆c varies
approximately linearly with T -2. Extracting values of D2 from the B = 6 T and 8 T curves (for the
lower fields the scatter is rather large after subtracting the zero-field curve), one obtains
Bhf = 51.5 mT and a quadrupole-coupling constant P ≈ 0.9 mK. With these parameters, values
of D2 can then be calculated for B = 2 and 4 T (insert of Figure 4.19).
Although above 0.3 K the nuclear contribution to c/T is small, the data in Figure 4.19 show
c/T values a few percent higher than for the zero-field data in this temperature range. There are
two possible explanations for this behaviour: i) it can be attributed to small errors in the
calibration of the thermometer on the sapphire plate in field. In fact, data taken above 0.4 K in a3He system with another calibrated thermometer did not show this effect. Notice that a small
calibration error does not affect significantly the overall c(T) curve; ii) the nuclear contribution
might overshadow a decrease of the electronic term at low temperatures. As under influence of a
magnetic field, a compound is pushed away from a magnetic instability, the low-temperature c/T
will level off in order to recover the Fermi liquid behaviour. A decrease of c/T at low
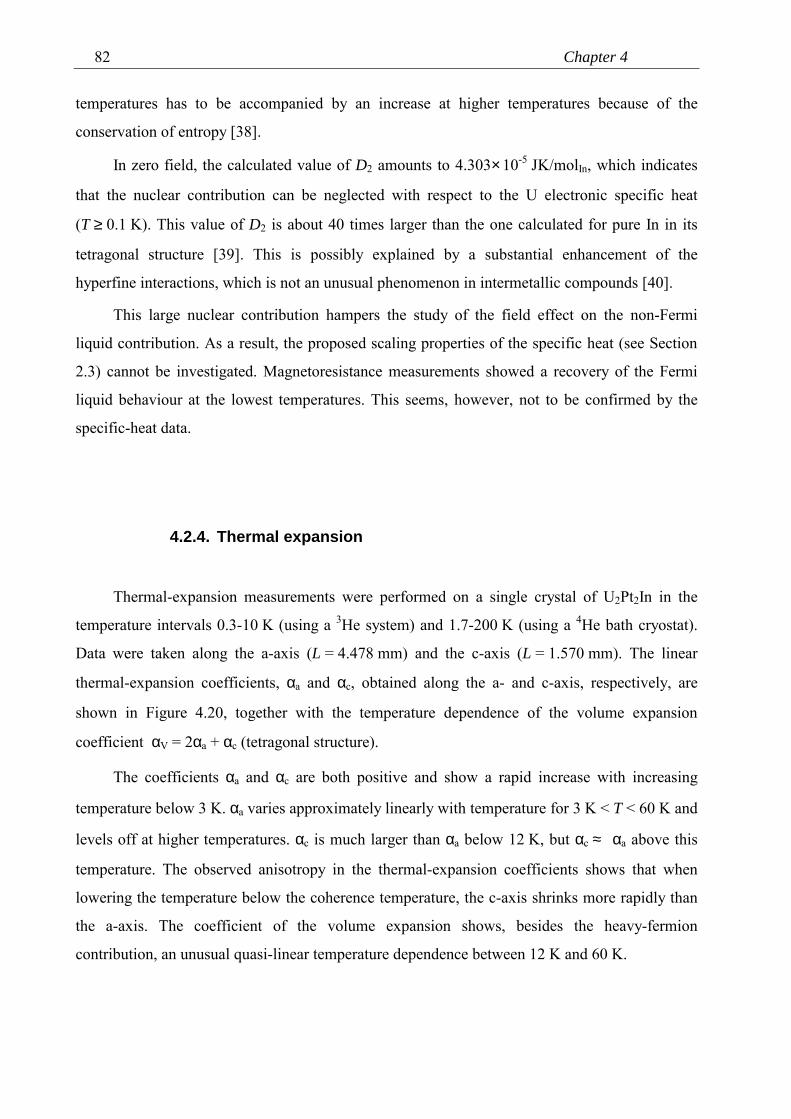
Chapter 482
temperatures has to be accompanied by an increase at higher temperatures because of the
conservation of entropy [38].
In zero field, the calculated value of D2 amounts to 4.303×10⁻⁵ JK/molIn, which indicates
that the nuclear contribution can be neglected with respect to the U electronic specific heat
(T ≥ 0.1 K). This value of D2 is about 40 times larger than the one calculated for pure In in its
tetragonal structure [39]. This is possibly explained by a substantial enhancement of the
hyperfine interactions, which is not an unusual phenomenon in intermetallic compounds [40].
This large nuclear contribution hampers the study of the field effect on the non-Fermi
liquid contribution. As a result, the proposed scaling properties of the specific heat (see Section
2.3) cannot be investigated. Magnetoresistance measurements showed a recovery of the Fermi
liquid behaviour at the lowest temperatures. This seems, however, not to be confirmed by the
specific-heat data.
4.2.4. Thermal expansion
Thermal-expansion measurements were performed on a single crystal of U2Pt2In in the
temperature intervals 0.3-10 K (using a 3He system) and 1.7-200 K (using a 4He bath cryostat).
Data were taken along the a-axis (L = 4.478 mm) and the c-axis (L = 1.570 mm). The linear
thermal-expansion coefficients, αa and αc, obtained along the a- and c-axis, respectively, are
shown in Figure 4.20, together with the temperature dependence of the volume expansion
coefficient αV = 2αa + αc (tetragonal structure).
The coefficients αa and αc are both positive and show a rapid increase with increasing
temperature below 3 K. αa varies approximately linearly with temperature for 3 K < T < 60 K and
levels off at higher temperatures. αc is much larger than αa below 12 K, but αc ≈ αa above this
temperature. The observed anisotropy in the thermal-expansion coefficients shows that when
lowering the temperature below the coherence temperature, the c-axis shrinks more rapidly than
the a-axis. The coefficient of the volume expansion shows, besides the heavy-fermion
contribution, an unusual quasi-linear temperature dependence between 12 K and 60 K.
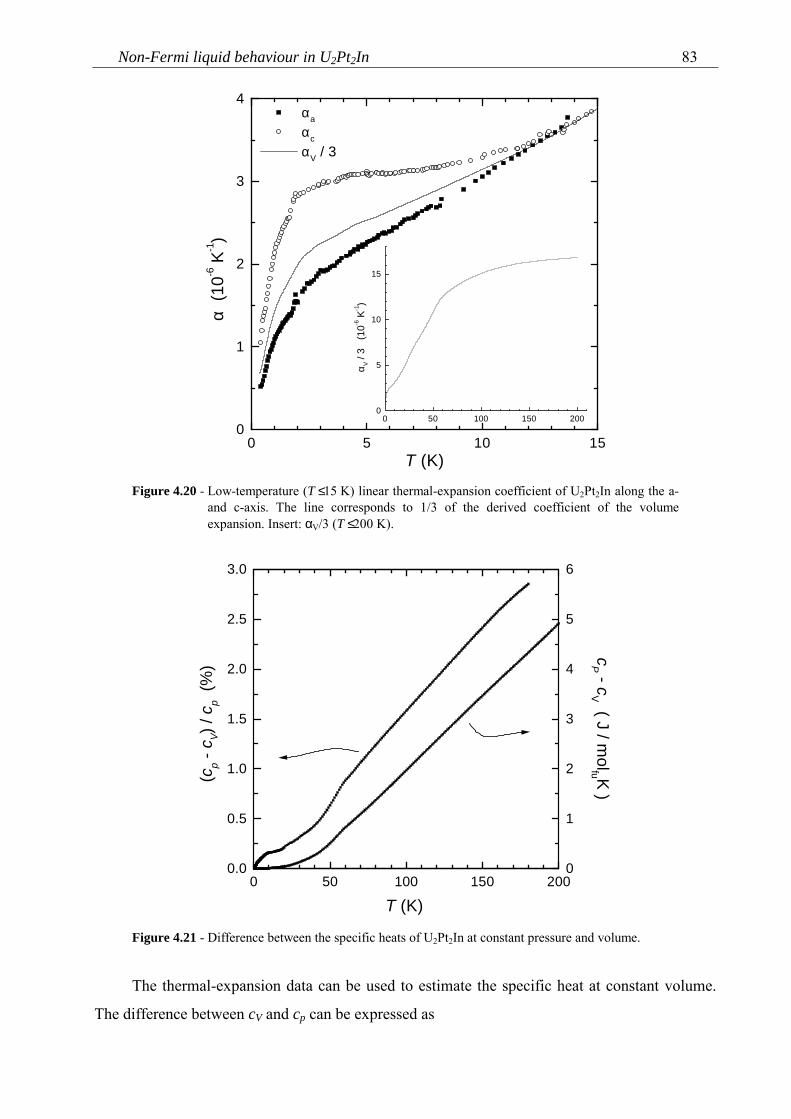
Non-Fermi liquid behaviour in U2Pt2In 83
0 50 100 150 2000
5
10
15
α V / 3
(1
0-6 K
-1)
0 5 10 150
1
2
3
4 αa
αc
αV / 3
α (1
0-6 K
-1)
T (K)
Figure 4.20 - Low-temperature (T ≤ 15 K) linear thermal-expansion coefficient of U2Pt2In along the a-and c-axis. The line corresponds to 1/3 of the derived coefficient of the volumeexpansion. Insert: αV/3 (T ≤ 200 K).
0 50 100 150 2000
1
2
3
4
5
6
cP - c
V ( J / molfu K )
0.0
0.5
1.0
1.5
2.0
2.5
3.0
(cp -
cV)
/ c p
(%)
T (K)
Figure 4.21 - Difference between the specific heats of U2Pt2In at constant pressure and volume.
The thermal-expansion data can be used to estimate the specific heat at constant volume.
The difference between cV and cp can be expressed as
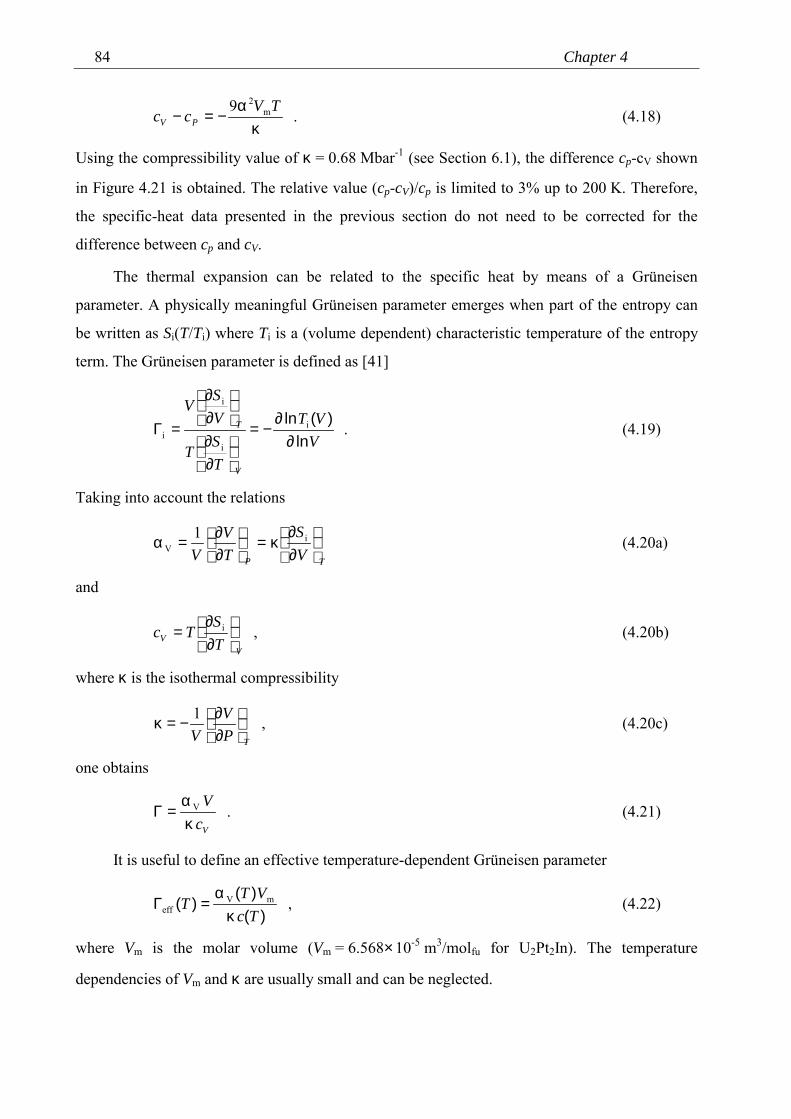
Chapter 484
κα
−=−TVcc PV
m29
. (4.18)
Using the compressibility value of κ = 0.68 Mbar-1 (see Section 6.1), the difference cp-cV shown
in Figure 4.21 is obtained. The relative value (cp-cV)/cp is limited to 3% up to 200 K. Therefore,
the specific-heat data presented in the previous section do not need to be corrected for the
difference between cp and cV.
The thermal expansion can be related to the specific heat by means of a Grüneisen
parameter. A physically meaningful Grüneisen parameter emerges when part of the entropy can
be written as Si(T/Ti) where Ti is a (volume dependent) characteristic temperature of the entropy
term. The Grüneisen parameter is defined as [41]
VVT
TST
VSV
V
T
ln)(ln
∂∂
−=
∂∂
∂∂
=Γ i
i
i
i . (4.19)
Taking into account the relations
TP VS
TV
V
∂∂
κ=
∂∂=α i
V1 (4.20a)
and
VV T
STc
∂∂
= i , (4.20b)
where κ is the isothermal compressibility
TPV
V
∂∂−=κ 1 , (4.20c)
one obtains
VcV
κα
=Γ V . (4.21)
It is useful to define an effective temperature-dependent Grüneisen parameter
)()()(TcVT
Tκ
α=Γ mV
eff , (4.22)
where Vm is the molar volume (Vm = 6.568×10⁻⁵ m3/molfu for U2Pt2In). The temperature
dependencies of Vm and κ are usually small and can be neglected.
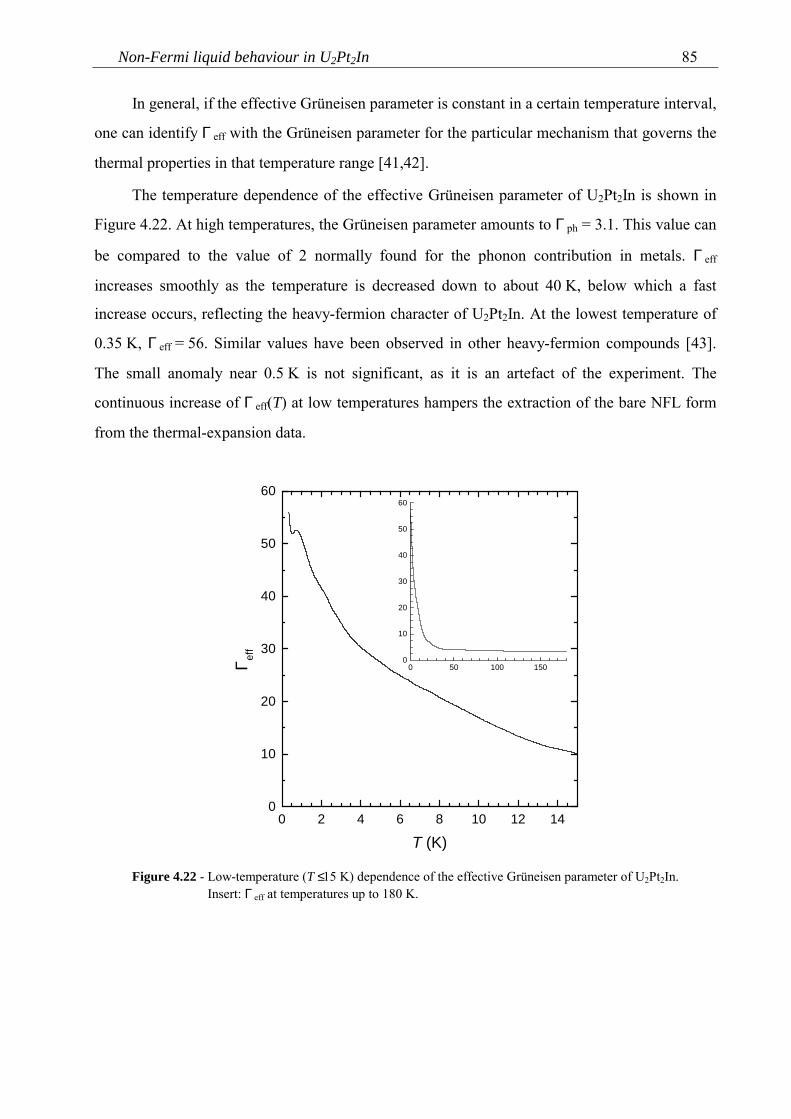
Non-Fermi liquid behaviour in U2Pt2In 85
In general, if the effective Grüneisen parameter is constant in a certain temperature interval,
one can identify Γ eff with the Grüneisen parameter for the particular mechanism that governs the
thermal properties in that temperature range [41,42].
The temperature dependence of the effective Grüneisen parameter of U2Pt2In is shown in
Figure 4.22. At high temperatures, the Grüneisen parameter amounts to Γ ph = 3.1. This value can
be compared to the value of 2 normally found for the phonon contribution in metals. Γ eff
increases smoothly as the temperature is decreased down to about 40 K, below which a fast
increase occurs, reflecting the heavy-fermion character of U2Pt2In. At the lowest temperature of
0.35 K, Γ eff = 56. Similar values have been observed in other heavy-fermion compounds [43].
The small anomaly near 0.5 K is not significant, as it is an artefact of the experiment. The
continuous increase of Γ eff(T) at low temperatures hampers the extraction of the bare NFL form
from the thermal-expansion data.
0 50 100 1500
10
20
30
40
50
60
0 2 4 6 8 10 12 140
10
20
30
40
50
60
Γ eff
T (K)
Figure 4.22 - Low-temperature (T ≤ 15 K) dependence of the effective Grüneisen parameter of U2Pt2In.Insert: Γ eff at temperatures up to 180 K.
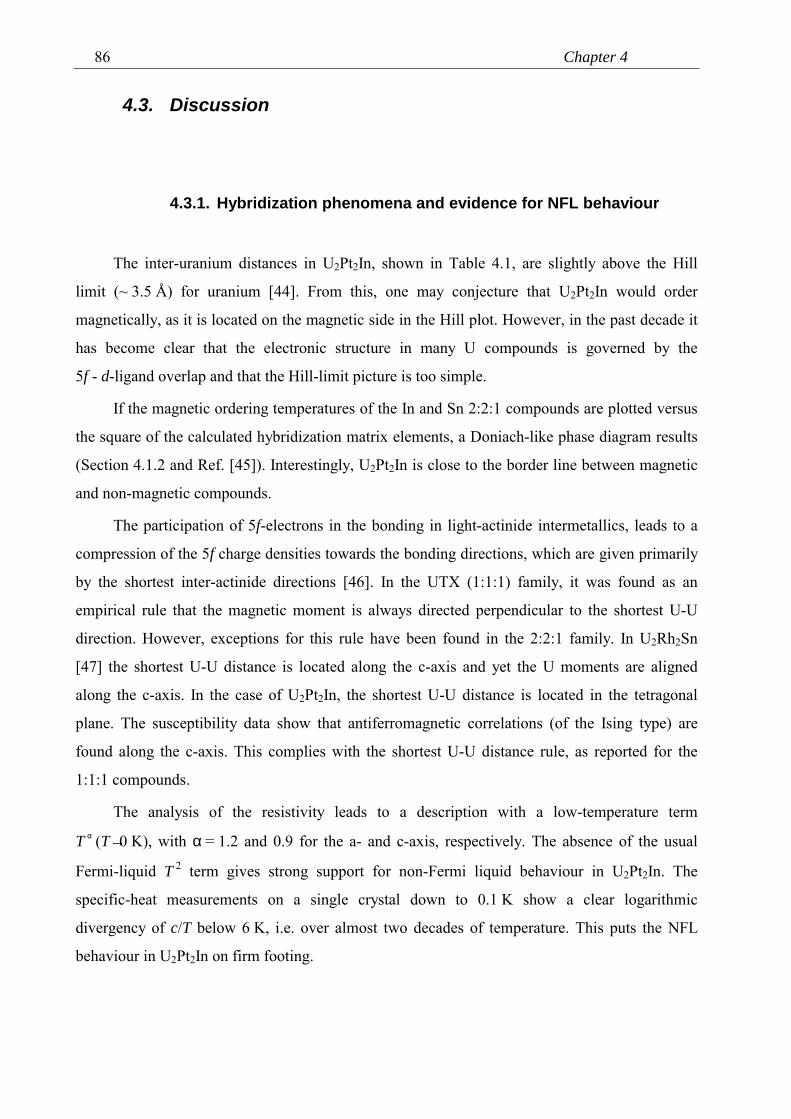
Chapter 486
4.3. Discussion
4.3.1. Hybridization phenomena and evidence for NFL behaviour
The inter-uranium distances in U2Pt2In, shown in Table 4.1, are slightly above the Hill
limit (~ 3.5 Å) for uranium [44]. From this, one may conjecture that U2Pt2In would order
magnetically, as it is located on the magnetic side in the Hill plot. However, in the past decade it
has become clear that the electronic structure in many U compounds is governed by the
5f - d-ligand overlap and that the Hill-limit picture is too simple.
If the magnetic ordering temperatures of the In and Sn 2:2:1 compounds are plotted versus
the square of the calculated hybridization matrix elements, a Doniach-like phase diagram results
(Section 4.1.2 and Ref. [45]). Interestingly, U2Pt2In is close to the border line between magnetic
and non-magnetic compounds.
The participation of 5f-electrons in the bonding in light-actinide intermetallics, leads to a
compression of the 5f charge densities towards the bonding directions, which are given primarily
by the shortest inter-actinide directions [46]. In the UTX (1:1:1) family, it was found as an
empirical rule that the magnetic moment is always directed perpendicular to the shortest U-U
direction. However, exceptions for this rule have been found in the 2:2:1 family. In U2Rh2Sn
[47] the shortest U-U distance is located along the c-axis and yet the U moments are aligned
along the c-axis. In the case of U2Pt2In, the shortest U-U distance is located in the tetragonal
plane. The susceptibility data show that antiferromagnetic correlations (of the Ising type) are
found along the c-axis. This complies with the shortest U-U distance rule, as reported for the
1:1:1 compounds.
The analysis of the resistivity leads to a description with a low-temperature term
T α (T→0 K), with α = 1.2 and 0.9 for the a- and c-axis, respectively. The absence of the usual
Fermi-liquid T 2 term gives strong support for non-Fermi liquid behaviour in U2Pt2In. The
specific-heat measurements on a single crystal down to 0.1 K show a clear logarithmic
divergency of c/T below 6 K, i.e. over almost two decades of temperature. This puts the NFL
behaviour in U2Pt2In on firm footing.
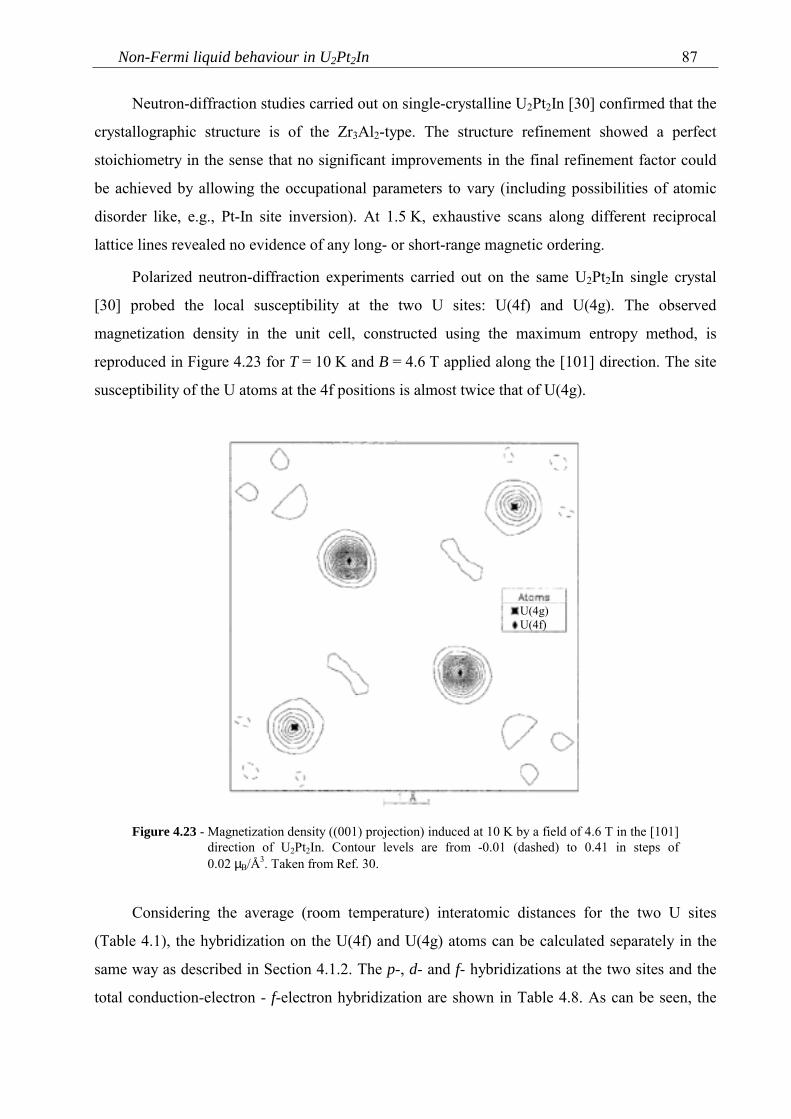
Non-Fermi liquid behaviour in U2Pt2In 87
Neutron-diffraction studies carried out on single-crystalline U2Pt2In [30] confirmed that the
crystallographic structure is of the Zr3Al2-type. The structure refinement showed a perfect
stoichiometry in the sense that no significant improvements in the final refinement factor could
be achieved by allowing the occupational parameters to vary (including possibilities of atomic
disorder like, e.g., Pt-In site inversion). At 1.5 K, exhaustive scans along different reciprocal
lattice lines revealed no evidence of any long- or short-range magnetic ordering.
Polarized neutron-diffraction experiments carried out on the same U2Pt2In single crystal
[30] probed the local susceptibility at the two U sites: U(4f) and U(4g). The observed
magnetization density in the unit cell, constructed using the maximum entropy method, is
reproduced in Figure 4.23 for T = 10 K and B = 4.6 T applied along the [101] direction. The site
susceptibility of the U atoms at the 4f positions is almost twice that of U(4g).
U(4g)U(4f)
Figure 4.23 - Magnetization density ((001) projection) induced at 10 K by a field of 4.6 T in the [101]direction of U2Pt2In. Contour levels are from -0.01 (dashed) to 0.41 in steps of0.02 µB/Å3. Taken from Ref. 30.
Considering the average (room temperature) interatomic distances for the two U sites
(Table 4.1), the hybridization on the U(4f) and U(4g) atoms can be calculated separately in the
same way as described in Section 4.1.2. The p-, d- and f- hybridizations at the two sites and the
total conduction-electron - f-electron hybridization are shown in Table 4.8. As can be seen, the
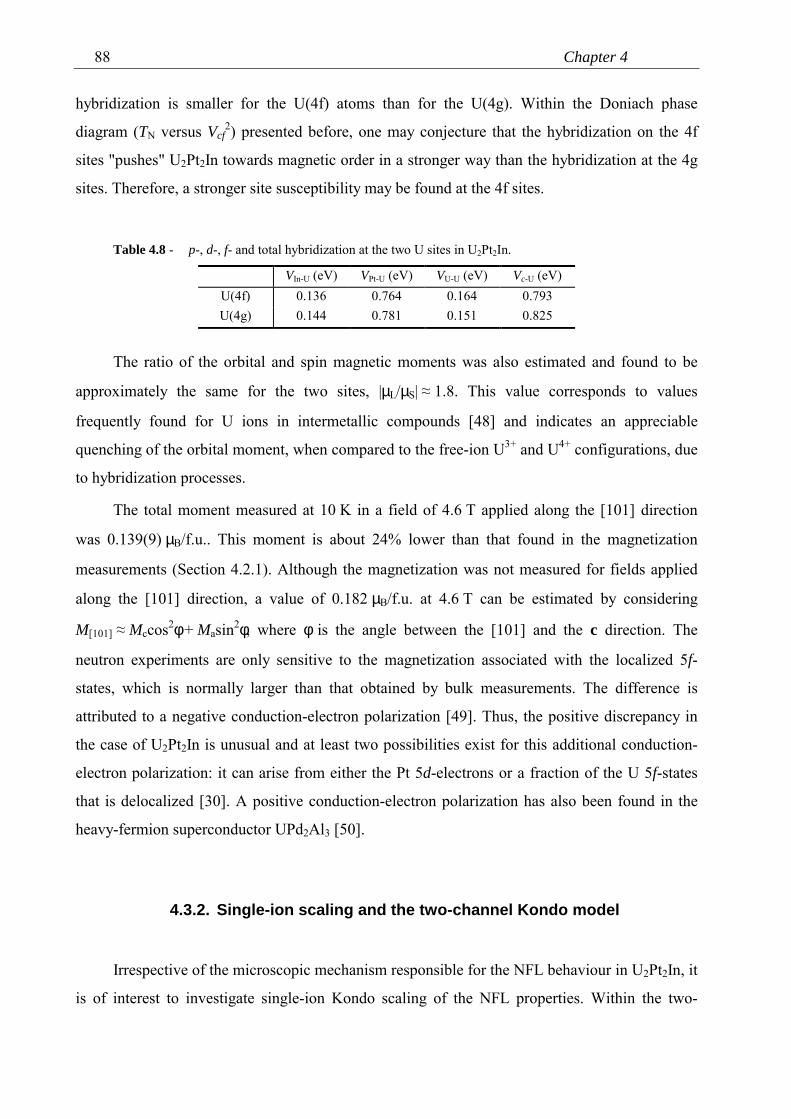
Chapter 488
hybridization is smaller for the U(4f) atoms than for the U(4g). Within the Doniach phase
diagram (TN versus Vcf2) presented before, one may conjecture that the hybridization on the 4f
sites "pushes" U2Pt2In towards magnetic order in a stronger way than the hybridization at the 4g
sites. Therefore, a stronger site susceptibility may be found at the 4f sites.
Table 4.8 - p-, d-, f- and total hybridization at the two U sites in U2Pt2In.
VIn-U (eV) VPt-U (eV) VU-U (eV) Vc-U (eV)U(4f) 0.136 0.764 0.164 0.793U(4g) 0.144 0.781 0.151 0.825
The ratio of the orbital and spin magnetic moments was also estimated and found to be
approximately the same for the two sites, |µL/µS| ≈ 1.8. This value corresponds to values
frequently found for U ions in intermetallic compounds [48] and indicates an appreciable
quenching of the orbital moment, when compared to the free-ion U3+ and U4+ configurations, due
to hybridization processes.
The total moment measured at 10 K in a field of 4.6 T applied along the [101] direction
was 0.139(9) µB/f.u.. This moment is about 24% lower than that found in the magnetization
measurements (Section 4.2.1). Although the magnetization was not measured for fields applied
along the [101] direction, a value of 0.182 µB/f.u. at 4.6 T can be estimated by considering
M[101] ≈ Mccos2φ + Masin2φ, where φ is the angle between the [101] and the c direction. The
neutron experiments are only sensitive to the magnetization associated with the localized 5f-
states, which is normally larger than that obtained by bulk measurements. The difference is
attributed to a negative conduction-electron polarization [49]. Thus, the positive discrepancy in
the case of U2Pt2In is unusual and at least two possibilities exist for this additional conduction-
electron polarization: it can arise from either the Pt 5d-electrons or a fraction of the U 5f-states
that is delocalized [30]. A positive conduction-electron polarization has also been found in the
heavy-fermion superconductor UPd2Al3 [50].
4.3.2. Single-ion scaling and the two-channel Kondo model
Irrespective of the microscopic mechanism responsible for the NFL behaviour in U2Pt2In, it
is of interest to investigate single-ion Kondo scaling of the NFL properties. Within the two-
Non-Fermi liquid behaviour in U2Pt2In 89
channel Kondo effect (TCKE - see Section 2.3), the specific heat can be expressed as
c/T = B'-(A'/TK)ln(T/bTK) [51]. Using the values A' = 0.251R and b = 0.41 from the TCKE, one
obtains TK = 23.2 K and B' = 204.3 mJ/molUK2. This value of TK is close to the Kondo
temperature 16 < TK < 21 K, which can be deduced from the susceptibility data, assuming that
the paramagnetic Curie temperature θ is 3-4 times larger than TK [52]. The value of B' is however
extremely high, since it should account for a temperature independent electronic or crystal-field
background in c/T.
This value of TK in U2Pt2In is also consistent with the one extracted from thermoelectric-
power data taken on a single crystal [53]. In the temperature range 5-150 K, the thermopower is
negative with a minimum at Tmin ≈ 25 K. Similar minima were reported for several other heavy-
fermion compounds exhibiting spin-fluctuation phenomena, with Tmin ~ TK [54].
With the value of TK, the coefficient a of the power law in the resistivity,
ρ/ρ0 = 1 + a (T/TK)α, can be calculated: aa = 2.89 and ac = 0.71 for αa = 1.2 and αc = 0.9,
respectively.
The unusual low-temperature susceptibility data yield further support for NFL behaviour.
The theoretical expressions for the magnetic susceptibility of a NFL compound are χ ~ -ln(T/T0)
or χ ~ 1-bT β (β < 1), depending on the type of system (see Section 2.3). In U2Pt2In, χc(T) is
dominated by antiferromagnetic correlations below 10 K, therefore, no low-temperature analysis
can be done confidently. However, χa(T) continues to rise, at least down to 2 K. Analysing χa
(T < 10 K) with a term χa ~ 1 - b' (T/TK)β one finds β = 0.7 and b' = 0.25, but the limited
temperature range where this behaviour occurs does not allow for a reliable estimate of the
exponent β.
The results of the scaling analysis within single-ion Kondo models are summarized in
Table 4.9. The reduced values of the parameters should be considered as rough estimates since
the data were not corrected for the phononic contributions. The high value of B' indicates that the
specific heat can not be fully described by the TCKE expression. Furthermore, single-ion models
are normally applied in diluted systems where small amounts of an f-element are used to partially
replace a non-magnetic rare earth or actinide element (e.g. systems like Y1-xUxPd3 and
Th1-xUxPd2Al3 [51,55]), while U2Pt2In should be considered as a Kondo-lattice system. A clear
indication that the TCKE does not apply to U2Pt2In is that the entropy does not saturate at the
value ½ Rln2 as expected for this model. Nevertheless, the observed scaling of the low
temperature properties shows that the Kondo temperature, being a characteristic temperature of
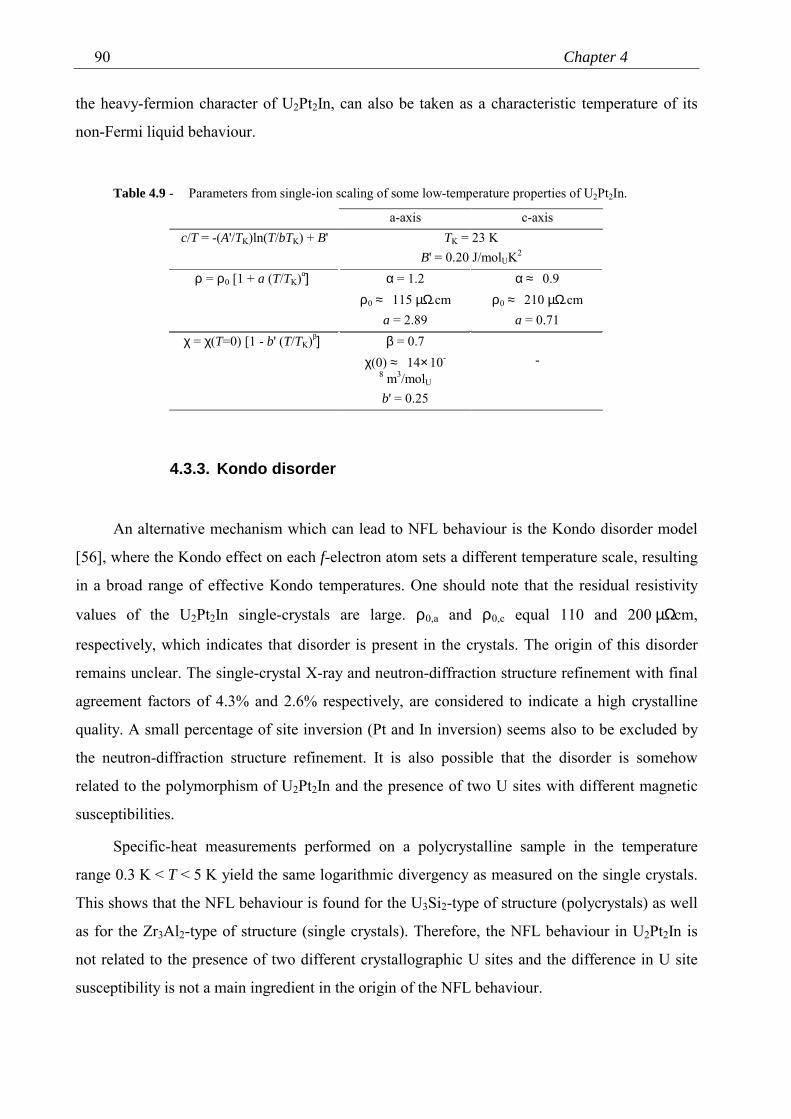
Chapter 490
the heavy-fermion character of U2Pt2In, can also be taken as a characteristic temperature of its
non-Fermi liquid behaviour.
Table 4.9 - Parameters from single-ion scaling of some low-temperature properties of U2Pt2In.
a-axis c-axisc/T = -(A'/TK)ln(T/bTK) + B' TK = 23 K
B' = 0.20 J/molUK2
ρ = ρ0 [1 + a (T/TK)α] α = 1.2ρ0 ≈ 115 µΩ.cm
a = 2.89
α ≈ 0.9ρ0 ≈ 210 µΩ.cm
a = 0.71χ = χ(T=0) [1 - b' (T/TK)β] β = 0.7
χ(0) ≈ 14×10-
8 m3/molU
b' = 0.25
-
4.3.3. Kondo disorder
An alternative mechanism which can lead to NFL behaviour is the Kondo disorder model
[56], where the Kondo effect on each f-electron atom sets a different temperature scale, resulting
in a broad range of effective Kondo temperatures. One should note that the residual resistivity
values of the U2Pt2In single-crystals are large. ρ0,a and ρ0,c equal 110 and 200 µΩcm,
respectively, which indicates that disorder is present in the crystals. The origin of this disorder
remains unclear. The single-crystal X-ray and neutron-diffraction structure refinement with final
agreement factors of 4.3% and 2.6% respectively, are considered to indicate a high crystalline
quality. A small percentage of site inversion (Pt and In inversion) seems also to be excluded by
the neutron-diffraction structure refinement. It is also possible that the disorder is somehow
related to the polymorphism of U2Pt2In and the presence of two U sites with different magnetic
susceptibilities.
Specific-heat measurements performed on a polycrystalline sample in the temperature
range 0.3 K < T < 5 K yield the same logarithmic divergency as measured on the single crystals.
This shows that the NFL behaviour is found for the U3Si2-type of structure (polycrystals) as well
as for the Zr3Al2-type of structure (single crystals). Therefore, the NFL behaviour in U2Pt2In is
not related to the presence of two different crystallographic U sites and the difference in U site
susceptibility is not a main ingredient in the origin of the NFL behaviour.
Non-Fermi liquid behaviour in U2Pt2In 91
On the other hand, it is clear that the ρ0 values found do not reflect bare residual
resistivities. This may be concluded from the following: i) there is a strong current-orientation
dependence of the values of ρ0, with ρ0,a = 0.56ρ0,c at zero field, which cannot simply be
attributed to impurity or defect scattering; ii) both ρ0,a and ρ0,c vary in field, which indicates that
at least part of ρ0 is caused by scattering mechanisms other than scattering at crystallographic
defects.
4.3.4. Magnetic critical point
An appealing scenario for the origin of the non-Fermi liquid behaviour in U2Pt2In is the
proximity to a quantum critical point [57]. This is reflected in the location of U2Pt2In at the
border line between magnetic and non-magnetic compounds in a Doniach-type of diagram for the
U2T2X series (X = In, Sn). Tuning the quantum critical point with an external parameter, e.g. a
magnetic field or (chemical) pressure, should elucidate the applicability of this scenario.
Magnetoresistance measurements show a tendency towards a ρ ~ T 2 law as the field strength
increases, suggesting that the magnetic field shifts U2Pt2In away from the quantum critical point
towards a Fermi-liquid regime. Specific-heat measurements in field were inconclusive in this
respect due to the presence of an important contribution from the In nuclear moments.
The proximity of U2Pt2In to a quantum critical point is best probed with pressure
experiments and chemical substitutions. Usually, compounds located at a magnetic instability are
tuned towards the Fermi-liquid regime by applying pressure since a reduction of the interatomic
distances results in an increase of the hybridization. On the other hand, chemical substitution of
U by a larger non-magnetic element like Th should have the opposite effect. Resistivity
measurements under pressure were carried out on U2Pt2In up to p = 1.8 GPa and will be
presented in Section 6.1, while some preliminary results of studies on Th-doped U2Pt2In will be
presented in Section 6.2.
The absence of static magnetism in U2Pt2In has been confirmed by detailed muon spin
relaxation and rotation (µSR) experiments, which will be presented in Chapter 5. As discussed in
Chapter 3, the µSR technique is a very powerful probe as it enables the detection of tiny ordered
moments (which might be overlooked by other techniques). The µSR technique may also be used
to investigate whether Kondo disorder is the origin of non-Fermi liquid behaviour.
Chapter 492
References1. M.N. Péron, Y. Kergadallan, J. Rebizant, D. Meyer, J.M. Winand, S. Zwirner, L. Havela, H.
Nakotte, J.C. Spirlet, G.M. Kalvius, E. Colineau, J.L. Oddou, C. Jeandey and J.P. Sanchez,J. Alloys Compounds 201 (1993) 203.
2. L. Havela, V. Sechovský, P. Svoboda, M. Diviš, H. Nakotte, K. Prokeš, F.R. de Boer, A.Purwanto, R.A. Robinson, A. Seret, J.M. Winand, J. Rebizant, J.C. Spirlet, M. Richter andH. Eschrig, J. Appl. Phys. 76 (1994) 6214.
3. H. Nakotte, Ph.D. Thesis, University of Amsterdam, 1994 (unpublished).4. L.C.J. Pereira, Ph.D. Thesis, University of Lisbon, 1998 (unpublished).5. F. Mirambet, P. Gravereau, B. Chevalier, L. Trut and J. Etourneau, J. Alloys Compounds
203 (1993) 29.6. P. Gravereau, F. Mirambet, B. Chevalier, F. Weill, L. Fournès, D. Laffargue, F. Bourée and
J. Etourneau, J. Mater. Chem. 4 (1994) 1893.7. L.C.J. Pereira, F. Wastin, J.M. Winand, B. Kanellakopoulos, J. Rebizant, J.C. Spirlet and M.
Almeida, J. Solid State Chem. 134 (1997) 138.8. R.A. Gordon, Y. Ijiri, C.M. Spencer and F.J. DiSalvo, J. Alloys Compounds 224 (1995) 101.9. B. Chevalier, F. Fourgeot, D. Laffargue, P. Gravereau, L. Fournès and J. Etourneau, J.
Alloys Compounds 262-263 (1997) 114.10. P. Estrela, L.C.J. Pereira, A. de Visser, F.R. de Boer, M. Almeida, M. Godinho, J. Rebizant
and J.C. Spirlet, J. Phys.: Condens. Matter 10 (1998) 9465.11. V. Sechovský and L. Havela, in "Handbook of Magnetic Materials" vol. 11 (K.H.J.
Buschow, ed.), Elsevier, Amsterdam, 1998, p. 1.12. M. Diviš, M. Richter and H. Eschrig, Solid State Commun. 90 (1994) 99.13. M. Diviš, M. Olšovec, M. Richter and H. Eschrig, J. Magn. Magn. Mater. 140-144 (1995)
1365.14. K. Prokeš, E. Brück, H. Nakotte, P.F. de Châtel and F.R. de Boer, Physica B 206-207 (1995)
8.15. S.F. Matar, J. Magn. Magn. Mater. 151 (1995) 263.16. F.R. de Boer, K. Kindo, H. Nakotte, K. Prokeš and V. Sechovský, Physica B 246-247 (1998)
129.17. H. Nakotte, K. Prokeš, E. Brück, N. Tang, F.R. de Boer, P. Svoboda, V. Sechovský, L.
Havela, J.M. Winand, A. Seret, J. Rebizant and J.C. Spirlet, Physica B 201 (1994) 247.18. T. Fukushima, S. Matsuyama, T. Kumada, K. Kindo, K. Prokeš, H. Nakotte, F.R. de Boer, L.
Havela, V. Sechovský, J.M. Winand, J. Rebizant and J.C. Spirlet, Physica B 211 (1995) 142.19. E.H. Brück, Ph.D. Thesis, University of Amsterdam, 1991 (unpublished).20. T. Endstra, G.J. Nieuwenhuys and J.A. Mydosh, Phys. Rev. B 48 (1993) 9595.21. W.A. Harrison, Phys. Rev. B 28 (1983) 550.22. J.M. Wills and W.A. Harrison, Phys. Rev. B 28 (1983) 4363.23. W.A. Harrison and G.K. Straub, Phys. Rev. B 36 (1987) 2695.
Non-Fermi liquid behaviour in U2Pt2In 93
24. G.K. Straub and W.A. Harrison, Phys. Rev. B 31 (1985) 7668.25. J.R. Schrieffer and P.A. Wolff, Phys. Rev. 149 (1966) 491.26. B. Coqblin and J.R. Schrieffer, Phys. Rev. 185 (1969) 847.27. A.M. Strydom and P. de V. du Plessis, Physica B 230-232 (1997) 62.28. M.T. Béal-Monod and J.M. Lawrence, Phys. Rev. B 21 (1980) 5400.29. J.M. Lawrence, P.S. Riseborough and R.D. Parks, Rep. Prog. Phys. 44 (1981) 1.30. A. Martin-Martin, L.C.J. Pereira, G.H. Lander, J. Rebizant, F. Wastin, J.C. Spirlet, P.
Dervenagas and P.J. Brown, Phys. Rev. B 59 (1999) 11818.31. A. Rosch, preprint (cond-mat/9910432).32. P.G. De Gennes and J. Friedel, J. Phys. Chem. Solids 4 (1958) 71.33. P. Debye, Ann. Physik 39 (1912) 789.34. J.K. Roberts, "Heat and Thermodynamics", Blackie & Son Ltd, London, 1940, p. 425.35. O.V. Lounasmaa, in "Hyperfine Interactions" (A.J. Freeman and R.B. Frankel, eds.),
Academic Press, New York, 1967, p. 467.36. N.E. Phillips, Critical Reviews in Solid State Sciences 2 (1971) 467.37. B. Bleaney and R.W. Hill, Proc. Phys. Soc. 78 (1961) 313.38. S.G. Mishra and P.A. Sreeram, Eur. Phys. J. B 14 (2000) 287.39. H.R. O'Neal and N.E. Phillips, Phys. Rev. 137 (1965) A748.40. G.C. Carter, L.H. Bennett and D.J. Hahon, Progr. Mater. Sci. 20 (1975) 1.41. P.E. Brommer, Physica B 112 (1982) 343.42. A. de Visser, A. Lacerda, P. Haen, J. Flouquet, F.E. Kayzel and J.J.M. Franse, Phys. Rev. B
39 (1989) 11301.43. A. de Visser, J.J.M. Franse, A. Lacerda, P. Haen and J. Flouquet, Physica B 163 (1990) 49.44. H.H. Hill, in "Plutonium and Other Actinides" (W.N. Miner, ed.), AIME, New York, 1970,
p. 2.45. V.H. Tran, Z. Zolnierek, A.J. Zaleski and H. Noël, Solid State Commun. 101 (1997) 709.46. V. Sechovský, L. Havela, H. Nakotte, F.R. de Boer and E. Brück, J. Alloys Compounds 207-
208 (1994) 221.47. L.C.J. Pereira, J.A. Paixão, P. Estrela, M. Godinho, F. Boudarot, M. Bonnet, J. Rebizant,
J.C. Spirlet and M. Almeida, J. Phys.: Condens. Matter 8 (1996) 11167.48. G.H. Lander, in "Handbook on the Physics and Chemistry of the Rare Earths" vol. 17 (K.A.
Gschneidner Jr., L. Eyring, G.H. Lander and G.R. Choppin, eds.), Elsevier, Amsterdam,1993, p. 635.
49. F.A. Wedgwood, J. Phys. C 5 (1972) 2427.50. L. Paolasini, J.A. Paixão, G.H. Lander, A. Delapalme, N. Sato and T. Komatsubura, J. Phys.:
Condens. Matter 5 ( 1993) 8905.51. M.B. Maple, M.C. de Andrade, J. Herrmann, Y. Dalichaouch, D.A. Gajewski, C.L. Seaman,
R. Chau, R. Movshovich, M.C. Aronson and R. Osborn, J. Low Temp. Phys. 99 (1995) 223.52. N.B. Brandt and V.V. Moshchalkov, Adv. Phys. 33 (1984) 373.
Chapter 494
53. L.C.J. Pereira, M. Almeida, P. Estrela, M. Godinho, J. Rebizant, J.C. Spirlet, R.P. Pinto,M.M. Amado, M.E. Braga and J.B. Sousa, J. Magn. Magn. Mater. 196-197 (1999) 885.
54. N. Grewe and F. Steglich, in "Handbook on the Physics and Chemistry of the Rare Earths"vol. 14 (K.A. Gschneidner Jr. and L. Eyring, eds.), Elsevier, Amsterdam, 1991, p. 343.
55. M.B. Maple, R.P. Dickey, J. Herrmann, M.C. de Andrade, E.J. Freeman, D.A. Gajewski andR. Chau, J. Phys.: Condens. Matter 8 (1996) 9773.
56. E. Miranda, V. Dobrosavljević and G. Kotliar, J. Phys.: Condens. Matter 8 (1996) 9871.57. A.J. Millis, Phys. Rev. B 48 (1993) 7183.
Muon spin relaxation and rotation
in U2Pt2In
The main purpose of using the µSR technique in the study of non-Fermi liquid compounds
is to demonstrate the absence of static magnetism with tiny ordered moments. This weak
magnetism is commonly observed in heavy-fermion compounds, and might be overlooked by
macroscopic magnetic, thermal and transport techniques. Also, because the muon is an extremely
sensitive magnetic probe, important information about magnetic fluctuations can easily be
extracted from the data. In this chapter, results of zero-, longitudinal- and transverse-field µSR
experiments carried out on single-crystalline U2Pt2In are presented. The experiments were
performed at the GPS and LTF spectrometers of the Paul Scherrer Institute (Switzerland). For a
brief description of the µSR technique and the relevant theoretical aspects see Section 3.6.
5.1. Zero field
Zero-field (ZF) µSR experiments were performed in the temperature range 0.05-200 K. The
spectra obtained give no evidence of magnetic order down to the lowest temperatures. Best fits to
the muon relaxation curves, as measured in the GPS, were obtained using a two-component
function, consisting of an exponential and a Gaussian term (Figure 5.1):
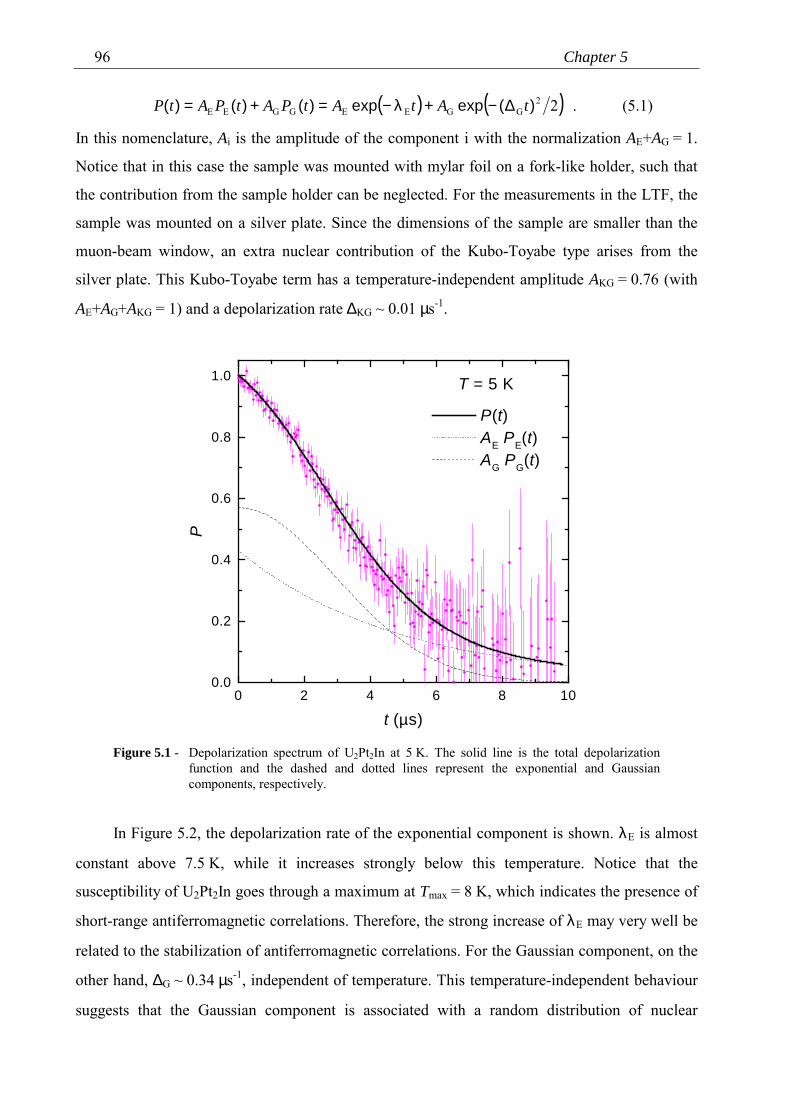
Chapter 596
( ) ( )22GGEEGGEE )(expexp)()()( tAtAtPAtPAtP ∆−+λ−=+= . (5.1)
In this nomenclature, Ai is the amplitude of the component i with the normalization AE+AG = 1.
Notice that in this case the sample was mounted with mylar foil on a fork-like holder, such that
the contribution from the sample holder can be neglected. For the measurements in the LTF, the
sample was mounted on a silver plate. Since the dimensions of the sample are smaller than the
muon-beam window, an extra nuclear contribution of the Kubo-Toyabe type arises from the
silver plate. This Kubo-Toyabe term has a temperature-independent amplitude AKG = 0.76 (with
AE+AG+AKG = 1) and a depolarization rate ∆KG ~ 0.01 µs-1.
0 2 4 6 8 100.0
0.2
0.4
0.6
0.8
1.0 T = 5 K
P(t) AE PE(t) AG PG(t)
P
t (µs)
Figure 5.1 - Depolarization spectrum of U2Pt2In at 5 K. The solid line is the total depolarizationfunction and the dashed and dotted lines represent the exponential and Gaussiancomponents, respectively.
In Figure 5.2, the depolarization rate of the exponential component is shown. λE is almost
constant above 7.5 K, while it increases strongly below this temperature. Notice that the
susceptibility of U2Pt2In goes through a maximum at Tmax = 8 K, which indicates the presence of
short-range antiferromagnetic correlations. Therefore, the strong increase of λE may very well be
related to the stabilization of antiferromagnetic correlations. For the Gaussian component, on the
other hand, ∆G ~ 0.34 µs-1, independent of temperature. This temperature-independent behaviour
suggests that the Gaussian component is associated with a random distribution of nuclear
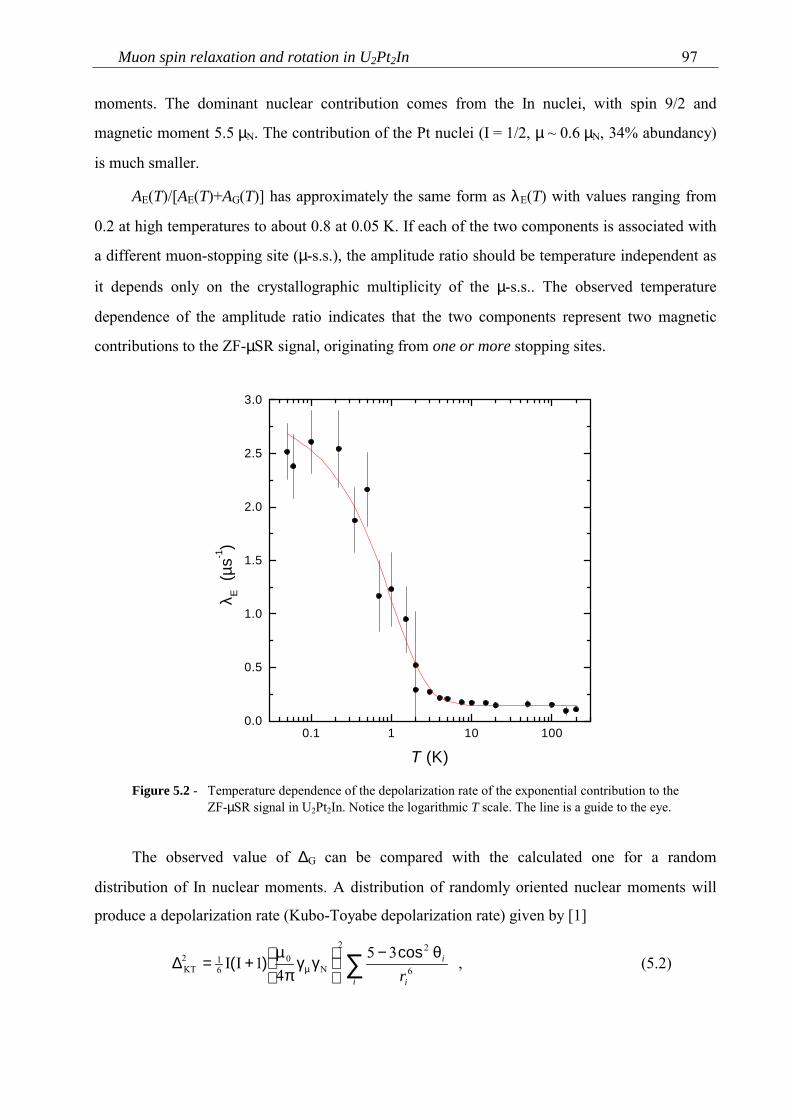
Muon spin relaxation and rotation in U2Pt2In 97
moments. The dominant nuclear contribution comes from the In nuclei, with spin 9/2 and
magnetic moment 5.5 µN. The contribution of the Pt nuclei (I = 1/2, µ ~ 0.6 µN, 34% abundancy)
is much smaller.
AE(T)/[AE(T)+AG(T)] has approximately the same form as λE(T) with values ranging from
0.2 at high temperatures to about 0.8 at 0.05 K. If each of the two components is associated with
a different muon-stopping site (µ-s.s.), the amplitude ratio should be temperature independent as
it depends only on the crystallographic multiplicity of the µ-s.s.. The observed temperature
dependence of the amplitude ratio indicates that the two components represent two magnetic
contributions to the ZF-µSR signal, originating from one or more stopping sites.
0.1 1 10 1000.0
0.5
1.0
1.5
2.0
2.5
3.0
λ E (µ
s-1)
T (K)
Figure 5.2 - Temperature dependence of the depolarization rate of the exponential contribution to theZF-µSR signal in U2Pt2In. Notice the logarithmic T scale. The line is a guide to the eye.
The observed value of ∆G can be compared with the calculated one for a random
distribution of In nuclear moments. A distribution of randomly oriented nuclear moments will
produce a depolarization rate (Kubo-Toyabe depolarization rate) given by [1]
∑ θ−
γγ
πµ
+=∆ µi i
i
r 6
22
N0
612
KT35
41II
cos)( , (5.2)
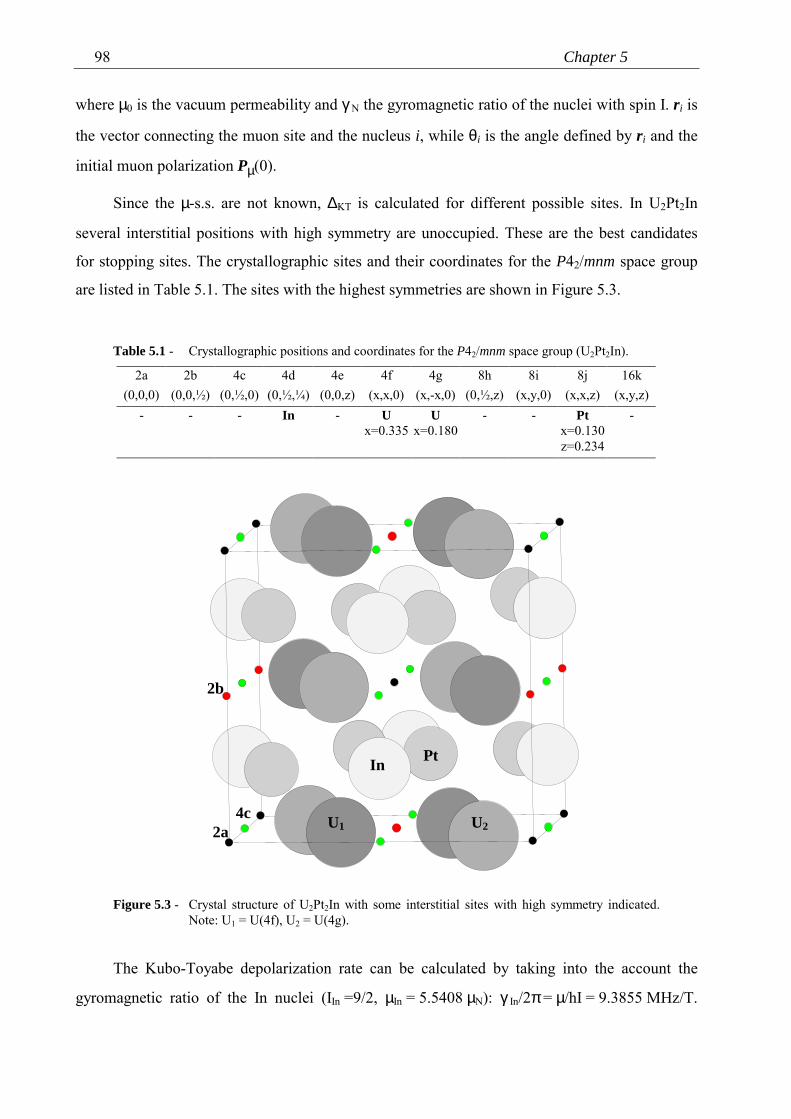
Chapter 598
where µ0 is the vacuum permeability and γN the gyromagnetic ratio of the nuclei with spin I. ri is
the vector connecting the muon site and the nucleus i, while θi is the angle defined by ri and the
initial muon polarization Pµ(0).
Since the µ-s.s. are not known, ∆KT is calculated for different possible sites. In U2Pt2In
several interstitial positions with high symmetry are unoccupied. These are the best candidates
for stopping sites. The crystallographic sites and their coordinates for the P42/mnm space group
are listed in Table 5.1. The sites with the highest symmetries are shown in Figure 5.3.
Table 5.1 - Crystallographic positions and coordinates for the P42/mnm space group (U2Pt2In).
2a 2b 4c 4d 4e 4f 4g 8h 8i 8j 16k(0,0,0) (0,0,½) (0,½,0) (0,½,¼) (0,0,z) (x,x,0) (x,-x,0) (0,½,z) (x,y,0) (x,x,z) (x,y,z)
- - - In - Ux=0.335
Ux=0.180
- - Ptx=0.130z=0.234
-
U1 U2
Pt In
2a
2b
4c
Figure 5.3 - Crystal structure of U2Pt2In with some interstitial sites with high symmetry indicated.Note: U1 = U(4f), U2 = U(4g).
The Kubo-Toyabe depolarization rate can be calculated by taking into the account the
gyromagnetic ratio of the In nuclei (IIn =9/2, µIn = 5.5408 µN): γ In/2π = µ/hI = 9.3855 MHz/T.
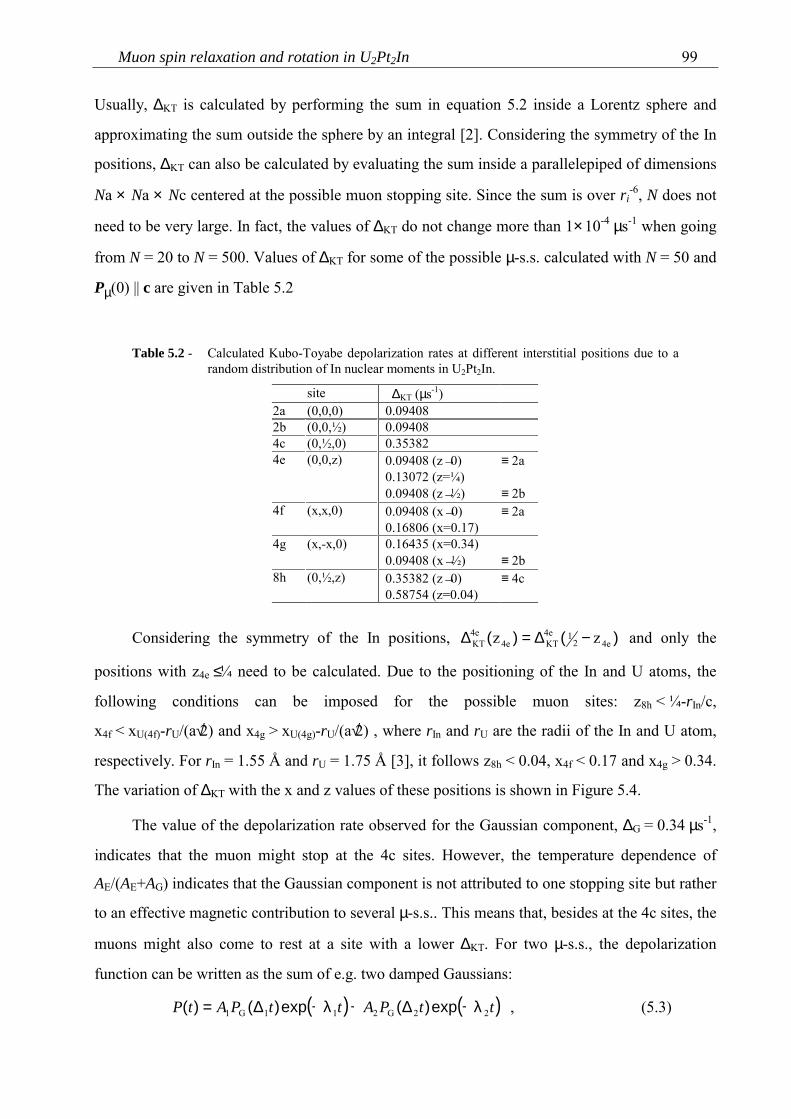
Muon spin relaxation and rotation in U2Pt2In 99
Usually, ∆KT is calculated by performing the sum in equation 5.2 inside a Lorentz sphere and
approximating the sum outside the sphere by an integral [2]. Considering the symmetry of the In
positions, ∆KT can also be calculated by evaluating the sum inside a parallelepiped of dimensions
Na × Na × Nc centered at the possible muon stopping site. Since the sum is over ri-6, N does not
need to be very large. In fact, the values of ∆KT do not change more than 1×10⁻⁴ µs-1 when going
from N = 20 to N = 500. Values of ∆KT for some of the possible µ-s.s. calculated with N = 50 and
Pµ(0) || c are given in Table 5.2
Table 5.2 - Calculated Kubo-Toyabe depolarization rates at different interstitial positions due to arandom distribution of In nuclear moments in U2Pt2In.
site ∆KT (µs-1)2a (0,0,0) 0.094082b (0,0,½) 0.094084c (0,½,0) 0.353824e (0,0,z) 0.09408 (z→0)
0.13072 (z=¼) 0.09408 (z→½)
≡ 2a
≡ 2b4f (x,x,0) 0.09408 (x→0)
0.16806 (x=0.17)≡ 2a
4g (x,-x,0) 0.16435 (x=0.34) 0.09408 (x→½) ≡ 2b
8h (0,½,z) 0.35382 (z→0) 0.58754 (z=0.04)
≡ 4c
Considering the symmetry of the In positions, )()( 4e214e
KT4e4eKT zz −∆=∆ and only the
positions with z4e ≤ ¼ need to be calculated. Due to the positioning of the In and U atoms, the
following conditions can be imposed for the possible muon sites: z8h < ¼-rIn/c,
x4f < xU(4f)-rU/(a√2) and x4g > xU(4g)-rU/(a√2) , where rIn and rU are the radii of the In and U atom,
respectively. For rIn = 1.55 Å and rU = 1.75 Å [3], it follows z8h < 0.04, x4f < 0.17 and x4g > 0.34.
The variation of ∆KT with the x and z values of these positions is shown in Figure 5.4.
The value of the depolarization rate observed for the Gaussian component, ∆G = 0.34 µs-1,
indicates that the muon might stop at the 4c sites. However, the temperature dependence of
AE/(AE+AG) indicates that the Gaussian component is not attributed to one stopping site but rather
to an effective magnetic contribution to several µ-s.s.. This means that, besides at the 4c sites, the
muons might also come to rest at a site with a lower ∆KT. For two µ-s.s., the depolarization
function can be written as the sum of e.g. two damped Gaussians:
( ) ( )ttPAttPAtP 22G211G1 λ−∆+λ−∆= exp)(exp)()( , (5.3)
Chapter 5100
where PG(∆it) = exp(-(∆it)2/2). ∆1 and ∆2 account for the In nuclear contribution from sites 1 and
2, respectively, while the amplitudes reflect the crystallographic multiplicity of the sites. At low
temperatures, the two components are damped by magnetic fluctuations characterized by the
rates λ1 and λ2. Approximating Equation 5.3 by Equation 5.1 implies that the extracted values of
∆G and λE represent effective depolarization rates. This means that at least one µ-s.s. is a site with
a high nuclear depolarization rate (∆KT ~ 0.35 µs-1) but other sites with a lower ∆KT might also be
µ-s.s..
0.0 0.1 0.2 0.3 0.4 0.50.0
0.1
0.2
0.3
0.4
0.5
0.6
4g (x,-x,0)4f (x,x,0)
8h (0,1/2,z)
4e (0,0,z)
∆ KT (µ
s-1)
x, z
Figure 5.4 - Kubo-Toyabe depolarization rate calculated for the 4e (0,0,z), 4f (x,x,0), 4g (x,-x,0) and8h (0,1/2,z) positions due to a random distribution of In nuclear moments in U2Pt2In.
5.2. Longitudinal field
In order to check the nature of the observed ZF signals, longitudinal-field (LF) experiments
were carried out. In this configuration, an external field Bext is applied along the initial muon-
polarization direction. If a signal has a static origin, there will be a decoupling of the muon spin
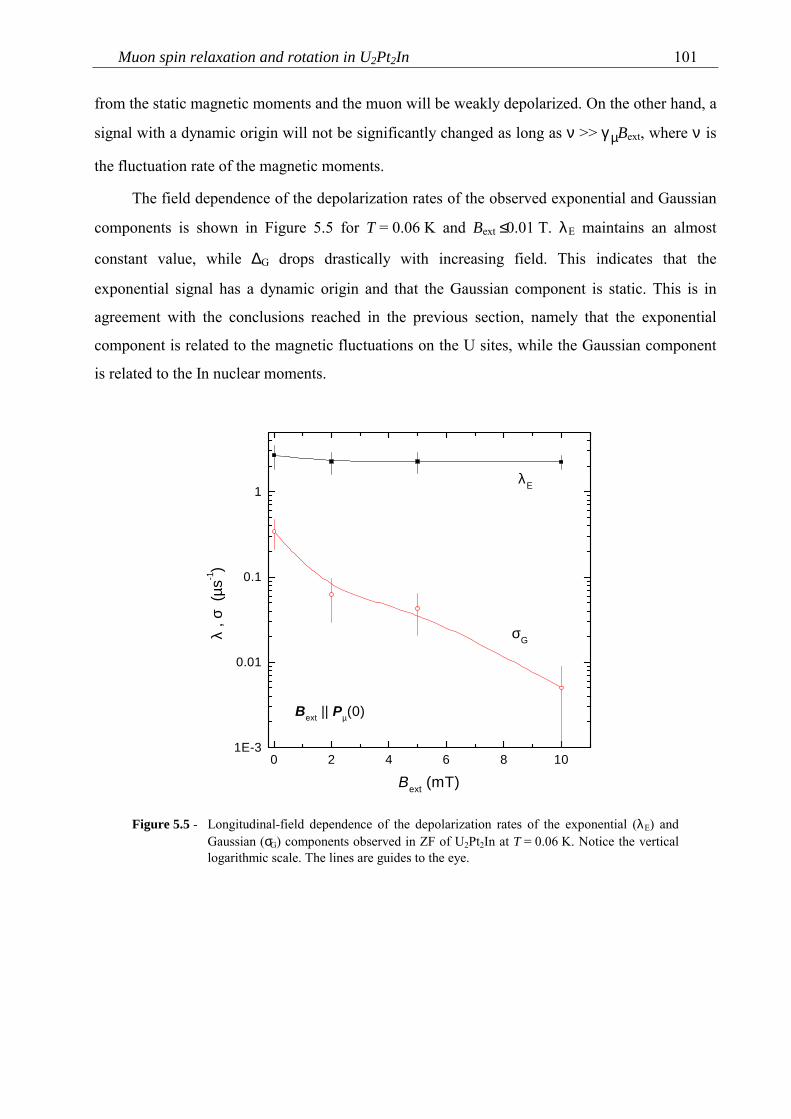
Muon spin relaxation and rotation in U2Pt2In 101
from the static magnetic moments and the muon will be weakly depolarized. On the other hand, a
signal with a dynamic origin will not be significantly changed as long as ν >> γµBext, where ν is
the fluctuation rate of the magnetic moments.
The field dependence of the depolarization rates of the observed exponential and Gaussian
components is shown in Figure 5.5 for T = 0.06 K and Bext ≤ 0.01 T. λE maintains an almost
constant value, while ∆G drops drastically with increasing field. This indicates that the
exponential signal has a dynamic origin and that the Gaussian component is static. This is in
agreement with the conclusions reached in the previous section, namely that the exponential
component is related to the magnetic fluctuations on the U sites, while the Gaussian component
is related to the In nuclear moments.
0 2 4 6 8 101E-3
0.01
0.1
1
Bext || Pµ(0)
σG
λE
λ , σ
(µs
-1)
Bext (mT)
Figure 5.5 - Longitudinal-field dependence of the depolarization rates of the exponential (λE) andGaussian (σG) components observed in ZF of U2Pt2In at T = 0.06 K. Notice the verticallogarithmic scale. The lines are guides to the eye.
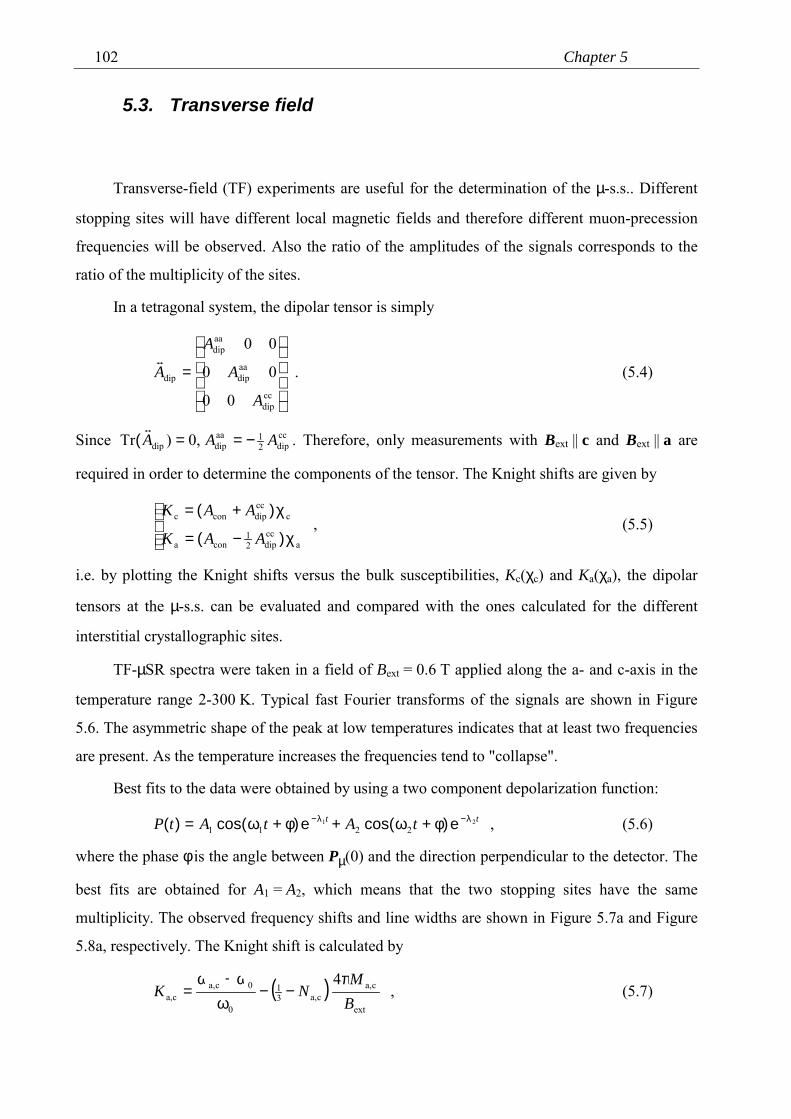
Chapter 5102
5.3. Transverse field
Transverse-field (TF) experiments are useful for the determination of the µ-s.s.. Different
stopping sites will have different local magnetic fields and therefore different muon-precession
frequencies will be observed. Also the ratio of the amplitudes of the signals corresponds to the
ratio of the multiplicity of the sites.
In a tetragonal system, the dipolar tensor is simply
=ccdip
aadip
aadip
dip
00
00
00
A
A
A
A
. (5.4)
Since ccdip2
1aadipdip 0,)Tr AAA −==
( . Therefore, only measurements with Bext || c and Bext || a are
required in order to determine the components of the tensor. The Knight shifts are given by
χ−=
χ+=
accdip2
1cona
cccdipconc
)(
)(
AAK
AAK , (5.5)
i.e. by plotting the Knight shifts versus the bulk susceptibilities, Kc(χc) and Ka(χa), the dipolar
tensors at the µ-s.s. can be evaluated and compared with the ones calculated for the different
interstitial crystallographic sites.
TF-µSR spectra were taken in a field of Bext = 0.6 T applied along the a- and c-axis in the
temperature range 2-300 K. Typical fast Fourier transforms of the signals are shown in Figure
5.6. The asymmetric shape of the peak at low temperatures indicates that at least two frequencies
are present. As the temperature increases the frequencies tend to "collapse".
Best fits to the data were obtained by using a two component depolarization function:
tt tAtAtP 212211
λ−λ− φ+ω+φ+ω= e)cos(e)cos()( , (5.6)
where the phase φ is the angle between Pµ(0) and the direction perpendicular to the detector. The
best fits are obtained for A1 = A2, which means that the two stopping sites have the same
multiplicity. The observed frequency shifts and line widths are shown in Figure 5.7a and Figure
5.8a, respectively. The Knight shift is calculated by
( )ext
ca,ca,3
1
0
0ca,ca,
4BM
NKπ
−−ω
ω−ω= , (5.7)
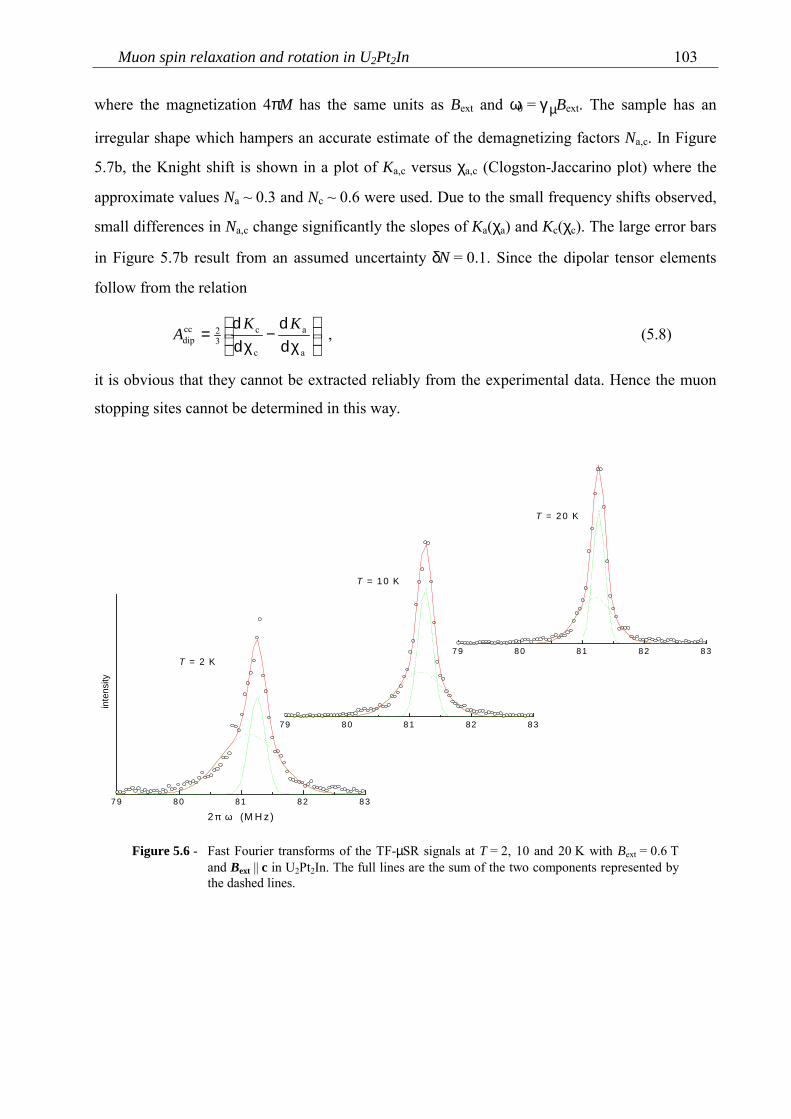
Muon spin relaxation and rotation in U2Pt2In 103
where the magnetization 4πM has the same units as Bext and ω0 = γµBext. The sample has an
irregular shape which hampers an accurate estimate of the demagnetizing factors Na,c. In Figure
5.7b, the Knight shift is shown in a plot of Ka,c versus χa,c (Clogston-Jaccarino plot) where the
approximate values Na ~ 0.3 and Nc ~ 0.6 were used. Due to the small frequency shifts observed,
small differences in Na,c change significantly the slopes of Ka(χa) and Kc(χc). The large error bars
in Figure 5.7b result from an assumed uncertainty δN = 0.1. Since the dipolar tensor elements
follow from the relation
χ
−χ
=a
a
c
c32cc
dip dd
dd KK
A , (5.8)
it is obvious that they cannot be extracted reliably from the experimental data. Hence the muon
stopping sites cannot be determined in this way.
79 80 81 82 83
T = 2 K
inte
nsity
2 π ω (M H z)
79 80 81 82 83
T = 10 K
79 80 81 82 83
T = 20 K
Figure 5.6 - Fast Fourier transforms of the TF-µSR signals at T = 2, 10 and 20 K with Bext = 0.6 Tand Bext || c in U2Pt2In. The full lines are the sum of the two components represented bythe dashed lines.
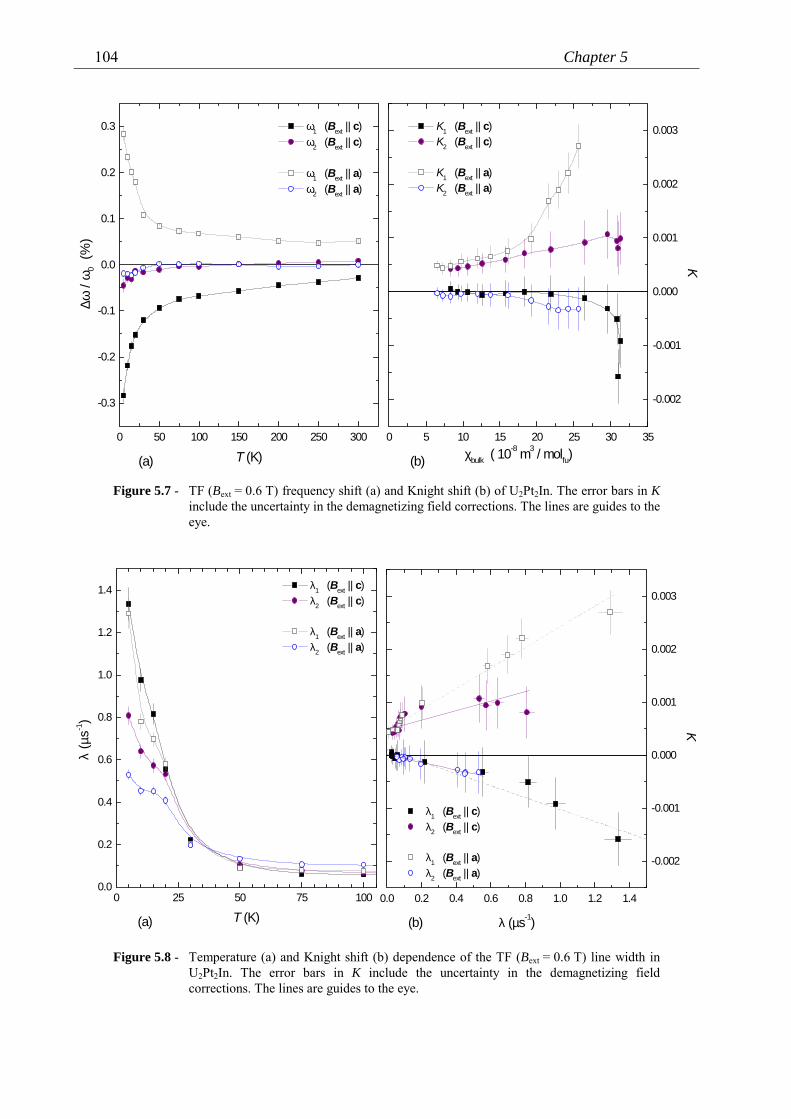
Chapter 5104
0 50 100 150 200 250 300
-0.3
-0.2
-0.1
0.0
0.1
0.2
0.3
(a)
ω1 (Bext || c) ω2 (Bext || c)
ω1 (Bext || a) ω2 (Bext || a)
∆ω /
ω0
(%)
T (K)0 5 10 15 20 25 30 35
-0.002
-0.001
0.000
0.001
0.002
0.003
(b)
K
K1 (Bext || c) K2 (Bext || c)
K1 (Bext || a) K2 (Bext || a)
χbulk ( 10-8 m3 / molfu)
Figure 5.7 - TF (Bext = 0.6 T) frequency shift (a) and Knight shift (b) of U2Pt2In. The error bars in Kinclude the uncertainty in the demagnetizing field corrections. The lines are guides to theeye.
0 25 50 75 1000.0
0.2
0.4
0.6
0.8
1.0
1.2
1.4
(a)
λ1 (Bext || c) λ2 (Bext || c)
λ1 (Bext || a) λ2 (Bext || a)
λ (µ
s-1)
T (K)0.0 0.2 0.4 0.6 0.8 1.0 1.2 1.4
-0.002
-0.001
0.000
0.001
0.002
0.003
λ (µs-1)
(b)
K
λ1 (Bext || c) λ2 (Bext || c)
λ1 (Bext || a) λ2 (Bext || a)
Figure 5.8 - Temperature (a) and Knight shift (b) dependence of the TF (Bext = 0.6 T) line width inU2Pt2In. The error bars in K include the uncertainty in the demagnetizing fieldcorrections. The lines are guides to the eye.
Muon spin relaxation and rotation in U2Pt2In 105
In Refs. 4 and 5, the µSR technique has been used to investigate the possibility of Kondo
disorder as the main route for non-Fermi liquid behaviour in the system UCu5-xPdx. Due to the
inhomogeneous distribution of Kondo temperatures arising from disorder, there is a broad
distribution of the heavy-fermion spin polarization, which is reflected in the µSR line width.
In the case of U2Pt2In, the µ-s.s. are not known and the Knight shifts cannot be determined
accurately. Therefore, these data cannot be used to test the Kondo disorder model. However,
because the Knight shift is proportional to the local susceptibility and the line width is related to
the spread of the local susceptibilities, an inhomogeneous line broadening is expected if Kondo
disorder is present in the system. This means that the line width will have a stronger dependence
on χ than the Knight shift and λ(K) will deviate from a straight line. In Figure 5.8b, K(λ) is
plotted for U2Pt2In. Considering the error bars, there is no evidence of an inhomogeneous line
broadening due to Kondo disorder.
The ZF-µSR data suggests that one of the µ-s.s. is the 4c site. Since A1 = A2 in the TF-µSR,
the other signal should originate from a site with the same multiplicity as 4c. However,
considering the large value of λ1, it is possible that signal 1 corresponds in fact to a sum of two
signals originating from two µ-s.s. with lower multiplicity, which cannot be resolved in the fits
due to the small frequency shifts. The only possible sites are 2a and 2b. This means that the total
TF-µSR spectra could be fitted with the function
[ ] ),(),(),()( ttPttPttPtP GGG c4c4b2b2a2a2 21
21 λω+λω+λω= , (5.9)
with PG(ωt,λt) = cos(ωt+φ) e-λt. Due to the different low-temperature susceptibilities at the sites 2a
and 2b, a sum over the two signals would be reflected by a large value of λ1, while ω1
corresponds to an average frequency for the two sites. The different susceptibilities at the 2a and
2b sites are well justified by considering their distances to the nearest U neighbours (Table 5.3).
The 2a site is relatively close to U(4g) and the 2b site is close to U(4f). As mentioned in Section
4.3, polarized-neutron experiments show that the field-induced susceptibility of the U atoms is
stronger at the 4f site than at the 4g site. Therefore, the susceptibility at the 2b site is expected to
be higher than at the 2a site.
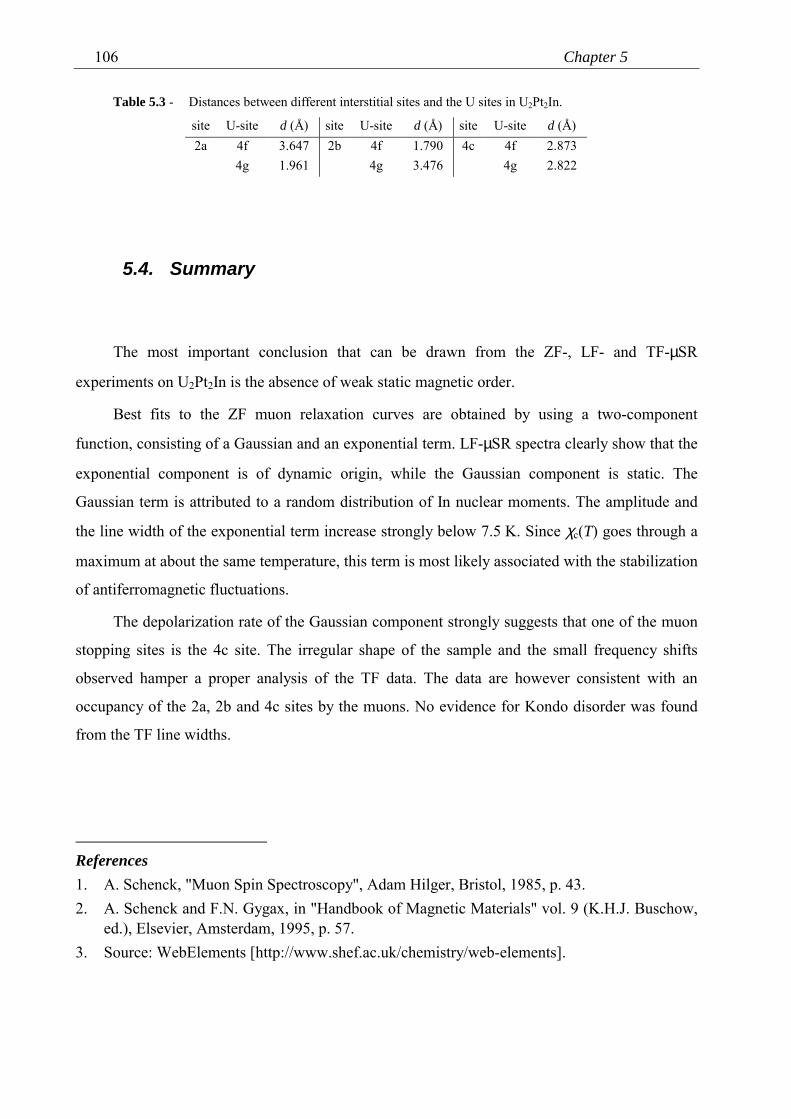
Chapter 5106
Table 5.3 - Distances between different interstitial sites and the U sites in U2Pt2In.
site U-site d (Å) site U-site d (Å) site U-site d (Å)2a 4f 3.647 2b 4f 1.790 4c 4f 2.873
4g 1.961 4g 3.476 4g 2.822
5.4. Summary
The most important conclusion that can be drawn from the ZF-, LF- and TF-µSR
experiments on U2Pt2In is the absence of weak static magnetic order.
Best fits to the ZF muon relaxation curves are obtained by using a two-component
function, consisting of a Gaussian and an exponential term. LF-µSR spectra clearly show that the
exponential component is of dynamic origin, while the Gaussian component is static. The
Gaussian term is attributed to a random distribution of In nuclear moments. The amplitude and
the line width of the exponential term increase strongly below 7.5 K. Since χc(T) goes through a
maximum at about the same temperature, this term is most likely associated with the stabilization
of antiferromagnetic fluctuations.
The depolarization rate of the Gaussian component strongly suggests that one of the muon
stopping sites is the 4c site. The irregular shape of the sample and the small frequency shifts
observed hamper a proper analysis of the TF data. The data are however consistent with an
occupancy of the 2a, 2b and 4c sites by the muons. No evidence for Kondo disorder was found
from the TF line widths.
References1. A. Schenck, "Muon Spin Spectroscopy", Adam Hilger, Bristol, 1985, p. 43.2. A. Schenck and F.N. Gygax, in "Handbook of Magnetic Materials" vol. 9 (K.H.J. Buschow,
ed.), Elsevier, Amsterdam, 1995, p. 57.3. Source: WebElements [http://www.shef.ac.uk/chemistry/web-elements].
Muon spin relaxation and rotation in U2Pt2In 107
4. O.O. Bernal, D.E. MacLaughlin, A. Amato, R. Feyerherm, F.N. Gygax, A. Schenck, R.H.Heffner, L.P. Le, G.J. Nieuwenhuys, B. Andraka, H.v. Löhneysen, O. Stockert and H.R. Ott,Phys. Rev. B 54 (1996) 13000.
5. D.E. MacLaughlin, O.O. Bernal and H.G. Lukefahr, J. Phys.: Condens. Matter 8 (1996)9855.
Probing U2Pt2In in the Doniach
phase diagram
In order to probe the (Doniach) phase diagram of U2Pt2In, resistivity experiments under
pressure and Th-doping studies were carried out. The main role of replacing small amounts of U
by Th is an expansion of the unit cell, while applying hydrostatic pressure gives the opportunity
to study the effects of unit-cell volume reduction. This in turn changes the conduction-electron -
f-electron hybridization and therefore the exchange interaction J. Assuming that U2Pt2In is close
to a quantum critical point, it is of interest to study the eventual emergence of magnetic order
with Th doping or the recovery of the Fermi-liquid state under pressure.
Experiments under pressure were also performed on U2Pd2In in order to study the
suppression of the antiferromagnetic ground state. As mentioned in Section 4.1, U2Pd2In is an
antiferromagnetic heavy-fermion material. On the magnetic side of the Doniach diagram (see
Figure 6.17a in Section 6.5), it is the compound closest to U2Pt2In.
The magnetic ground states of some of the 2:2:1 compounds, prepared in single-crystalline
form, were investigated, which confirmed their location in the Doniach diagram (Section 4.1.2).
The results are presented in Section 6.4.
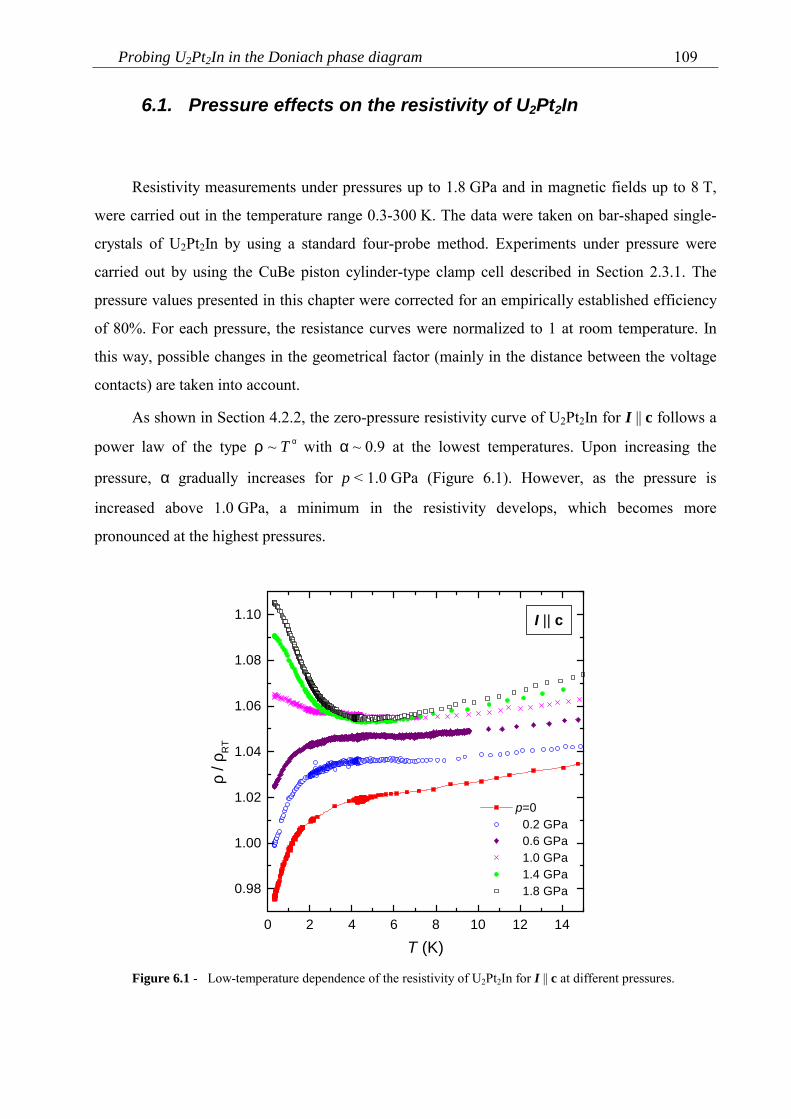
Probing U2Pt2In in the Doniach phase diagram 109
6.1. Pressure effects on the resistivity of U2Pt2In
Resistivity measurements under pressures up to 1.8 GPa and in magnetic fields up to 8 T,
were carried out in the temperature range 0.3-300 K. The data were taken on bar-shaped single-
crystals of U2Pt2In by using a standard four-probe method. Experiments under pressure were
carried out by using the CuBe piston cylinder-type clamp cell described in Section 2.3.1. The
pressure values presented in this chapter were corrected for an empirically established efficiency
of 80%. For each pressure, the resistance curves were normalized to 1 at room temperature. In
this way, possible changes in the geometrical factor (mainly in the distance between the voltage
contacts) are taken into account.
As shown in Section 4.2.2, the zero-pressure resistivity curve of U2Pt2In for I || c follows a
power law of the type ρ ~ T α with α ~ 0.9 at the lowest temperatures. Upon increasing the
pressure, α gradually increases for p < 1.0 GPa (Figure 6.1). However, as the pressure is
increased above 1.0 GPa, a minimum in the resistivity develops, which becomes more
pronounced at the highest pressures.
0 2 4 6 8 10 12 14
0.98
1.00
1.02
1.04
1.06
1.08
1.10 I || c
T (K)
ρ / ρ
RT
p=0 0.2 GPa 0.6 GPa 1.0 GPa 1.4 GPa 1.8 GPa
Figure 6.1 - Low-temperature dependence of the resistivity of U2Pt2In for I || c at different pressures.
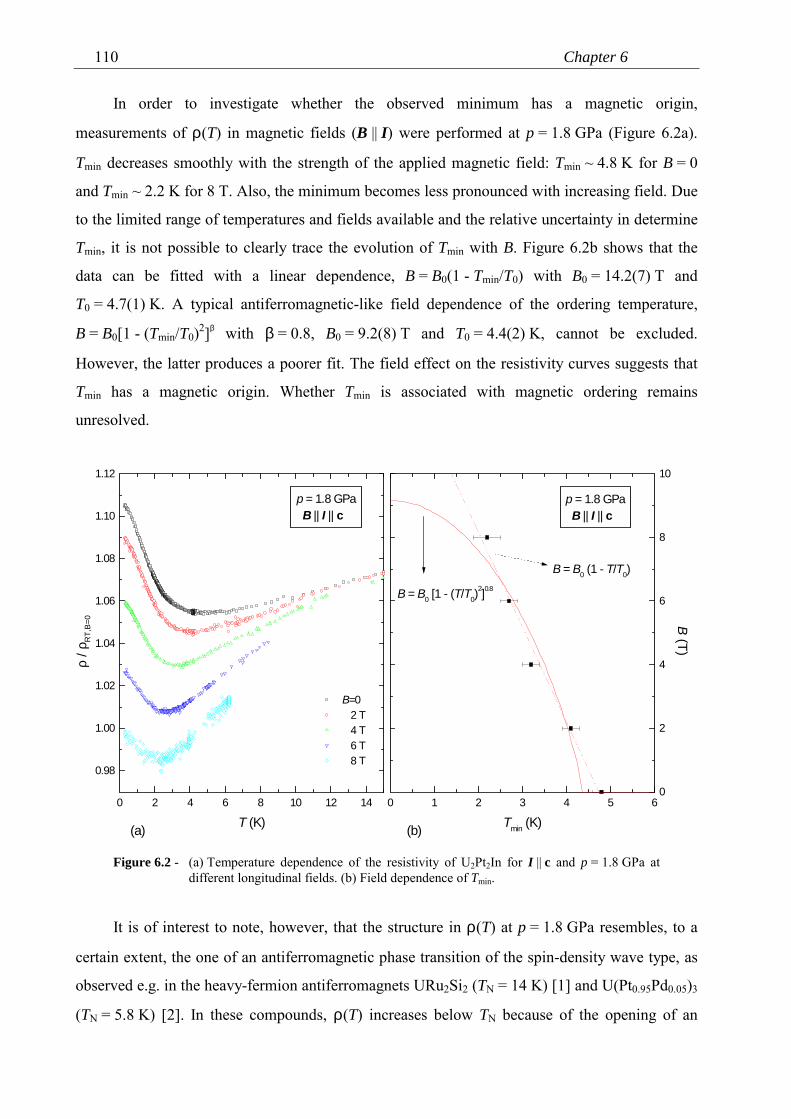
Chapter 6110
In order to investigate whether the observed minimum has a magnetic origin,
measurements of ρ(T) in magnetic fields (B || I) were performed at p = 1.8 GPa (Figure 6.2a).
Tmin decreases smoothly with the strength of the applied magnetic field: Tmin ~ 4.8 K for B = 0
and Tmin ~ 2.2 K for 8 T. Also, the minimum becomes less pronounced with increasing field. Due
to the limited range of temperatures and fields available and the relative uncertainty in determine
Tmin, it is not possible to clearly trace the evolution of Tmin with B. Figure 6.2b shows that the
data can be fitted with a linear dependence, B = B0(1 - Tmin/T0) with B0 = 14.2(7) T and
T0 = 4.7(1) K. A typical antiferromagnetic-like field dependence of the ordering temperature,
B = B0[1 - (Tmin/T0)2]β with β = 0.8, B0 = 9.2(8) T and T0 = 4.4(2) K, cannot be excluded.
However, the latter produces a poorer fit. The field effect on the resistivity curves suggests that
Tmin has a magnetic origin. Whether Tmin is associated with magnetic ordering remains
unresolved.
0 2 4 6 8 10 12 14
0.98
1.00
1.02
1.04
1.06
1.08
1.10
1.12
(a)
p = 1.8 GPa B || I || c
B=0 2 T 4 T 6 T 8 T
ρ / ρ
RT,
B=0
T (K)0 1 2 3 4 5 6
0
2
4
6
8
10
(b)
B = B0 (1 - T/T0)
B = B0 [1 - (T/T0)2]0.8
p = 1.8 GPa B || I || c
B (T)
Tmin (K)
Figure 6.2 - (a) Temperature dependence of the resistivity of U2Pt2In for I || c and p = 1.8 GPa atdifferent longitudinal fields. (b) Field dependence of Tmin.
It is of interest to note, however, that the structure in ρ(T) at p = 1.8 GPa resembles, to a
certain extent, the one of an antiferromagnetic phase transition of the spin-density wave type, as
observed e.g. in the heavy-fermion antiferromagnets URu2Si2 (TN = 14 K) [1] and U(Pt0.95Pd0.05)3
(TN = 5.8 K) [2]. In these compounds, ρ(T) increases below TN because of the opening of an
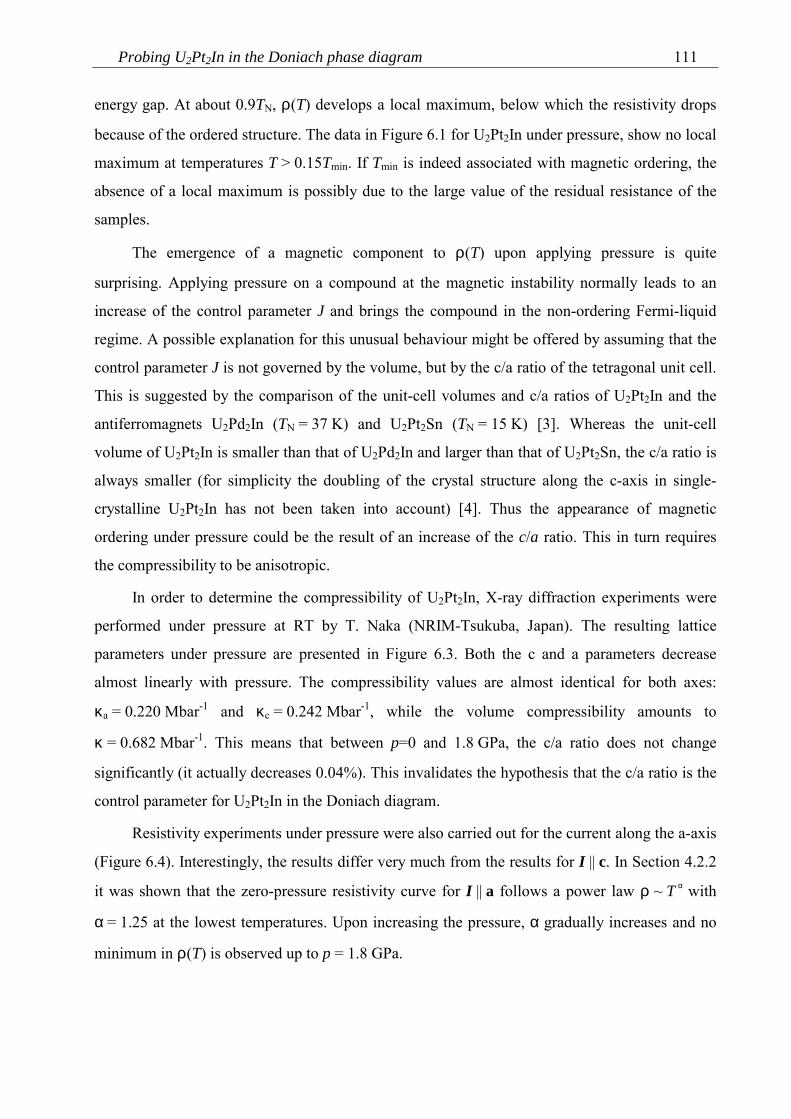
Probing U2Pt2In in the Doniach phase diagram 111
energy gap. At about 0.9TN, ρ(T) develops a local maximum, below which the resistivity drops
because of the ordered structure. The data in Figure 6.1 for U2Pt2In under pressure, show no local
maximum at temperatures T > 0.15Tmin. If Tmin is indeed associated with magnetic ordering, the
absence of a local maximum is possibly due to the large value of the residual resistance of the
samples.
The emergence of a magnetic component to ρ(T) upon applying pressure is quite
surprising. Applying pressure on a compound at the magnetic instability normally leads to an
increase of the control parameter J and brings the compound in the non-ordering Fermi-liquid
regime. A possible explanation for this unusual behaviour might be offered by assuming that the
control parameter J is not governed by the volume, but by the c/a ratio of the tetragonal unit cell.
This is suggested by the comparison of the unit-cell volumes and c/a ratios of U2Pt2In and the
antiferromagnets U2Pd2In (TN = 37 K) and U2Pt2Sn (TN = 15 K) [3]. Whereas the unit-cell
volume of U2Pt2In is smaller than that of U2Pd2In and larger than that of U2Pt2Sn, the c/a ratio is
always smaller (for simplicity the doubling of the crystal structure along the c-axis in single-
crystalline U2Pt2In has not been taken into account) [4]. Thus the appearance of magnetic
ordering under pressure could be the result of an increase of the c/a ratio. This in turn requires
the compressibility to be anisotropic.
In order to determine the compressibility of U2Pt2In, X-ray diffraction experiments were
performed under pressure at RT by T. Naka (NRIM-Tsukuba, Japan). The resulting lattice
parameters under pressure are presented in Figure 6.3. Both the c and a parameters decrease
almost linearly with pressure. The compressibility values are almost identical for both axes:
κa = 0.220 Mbar-1 and κc = 0.242 Mbar-1, while the volume compressibility amounts to
κ = 0.682 Mbar-1. This means that between p=0 and 1.8 GPa, the c/a ratio does not change
significantly (it actually decreases 0.04%). This invalidates the hypothesis that the c/a ratio is the
control parameter for U2Pt2In in the Doniach diagram.
Resistivity experiments under pressure were also carried out for the current along the a-axis
(Figure 6.4). Interestingly, the results differ very much from the results for I || c. In Section 4.2.2
it was shown that the zero-pressure resistivity curve for I || a follows a power law ρ ~ T α with
α = 1.25 at the lowest temperatures. Upon increasing the pressure, α gradually increases and no
minimum in ρ(T) is observed up to p = 1.8 GPa.
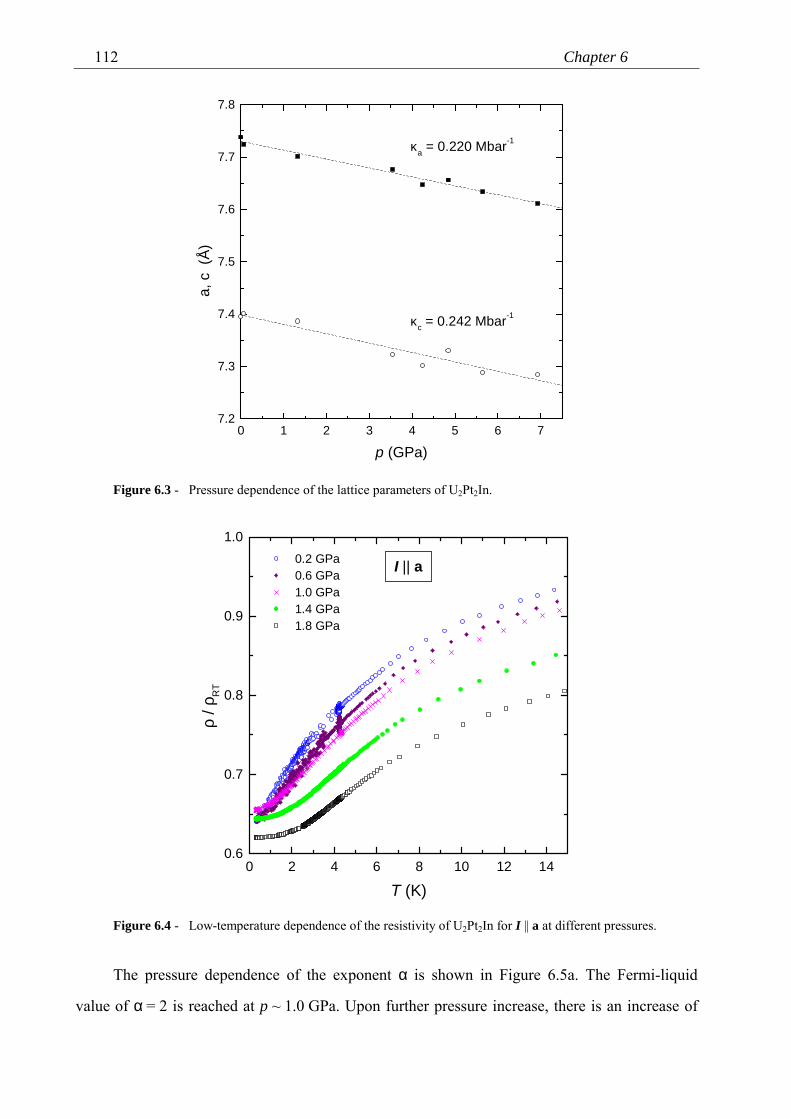
Chapter 6112
0 1 2 3 4 5 6 77.2
7.3
7.4
7.5
7.6
7.7
7.8
κa = 0.220 Mbar-1
κc = 0.242 Mbar-1
a, c
(Å)
p (GPa)
Figure 6.3 - Pressure dependence of the lattice parameters of U2Pt2In.
0 2 4 6 8 10 12 140.6
0.7
0.8
0.9
1.0
I || a 0.2 GPa 0.6 GPa 1.0 GPa 1.4 GPa 1.8 GPa
ρ / ρ
RT
T (K)
Figure 6.4 - Low-temperature dependence of the resistivity of U2Pt2In for I || a at different pressures.
The pressure dependence of the exponent α is shown in Figure 6.5a. The Fermi-liquid
value of α = 2 is reached at p ~ 1.0 GPa. Upon further pressure increase, there is an increase of
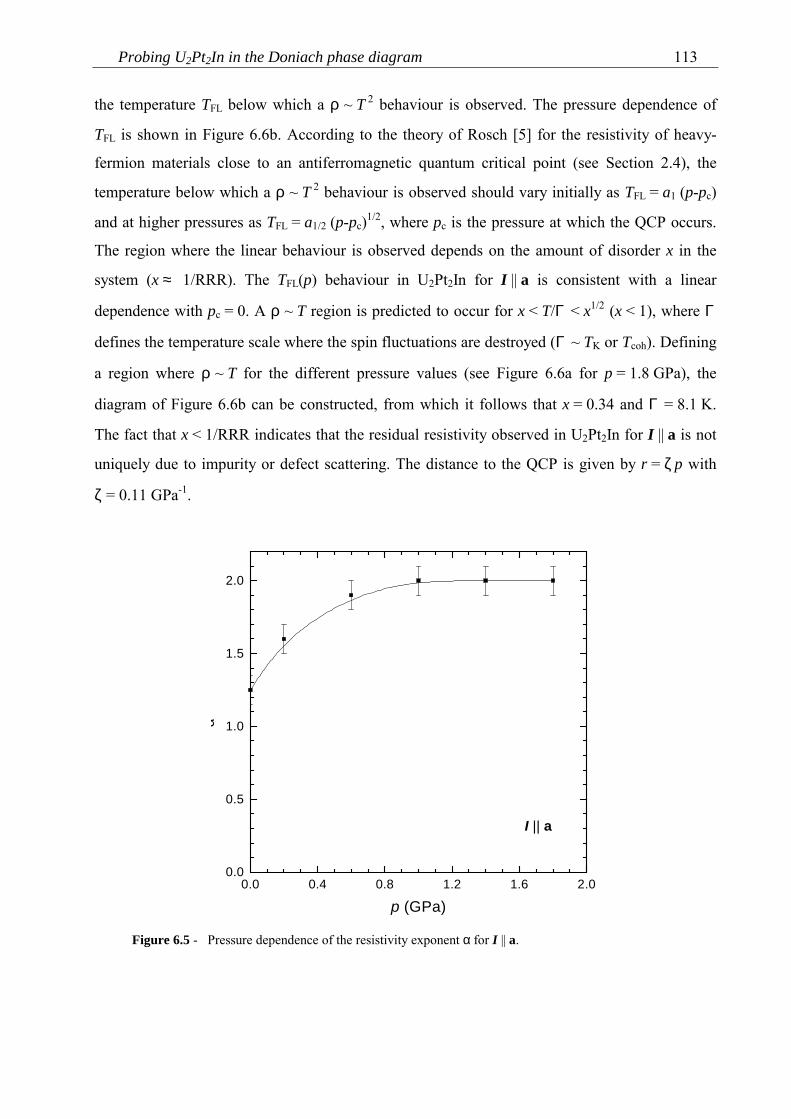
Probing U2Pt2In in the Doniach phase diagram 113
the temperature TFL below which a ρ ~ T 2 behaviour is observed. The pressure dependence of
TFL is shown in Figure 6.6b. According to the theory of Rosch [5] for the resistivity of heavy-
fermion materials close to an antiferromagnetic quantum critical point (see Section 2.4), the
temperature below which a ρ ~ T 2 behaviour is observed should vary initially as TFL = a1 (p-pc)
and at higher pressures as TFL = a1/2 (p-pc)1/2, where pc is the pressure at which the QCP occurs.
The region where the linear behaviour is observed depends on the amount of disorder x in the
system (x ≈ 1/RRR). The TFL(p) behaviour in U2Pt2In for I || a is consistent with a linear
dependence with pc = 0. A ρ ~ T region is predicted to occur for x < T/Γ < x1/2 (x < 1), where Γ
defines the temperature scale where the spin fluctuations are destroyed (Γ ~ TK or Tcoh). Defining
a region where ρ ~ T for the different pressure values (see Figure 6.6a for p = 1.8 GPa), the
diagram of Figure 6.6b can be constructed, from which it follows that x = 0.34 and Γ = 8.1 K.
The fact that x < 1/RRR indicates that the residual resistivity observed in U2Pt2In for I || a is not
uniquely due to impurity or defect scattering. The distance to the QCP is given by r = ζ p with
ζ = 0.11 GPa-1.
0.0 0.4 0.8 1.2 1.6 2.00.0
0.5
1.0
1.5
2.0
I || a
α
p (GPa)
Figure 6.5 - Pressure dependence of the resistivity exponent α for I || a.
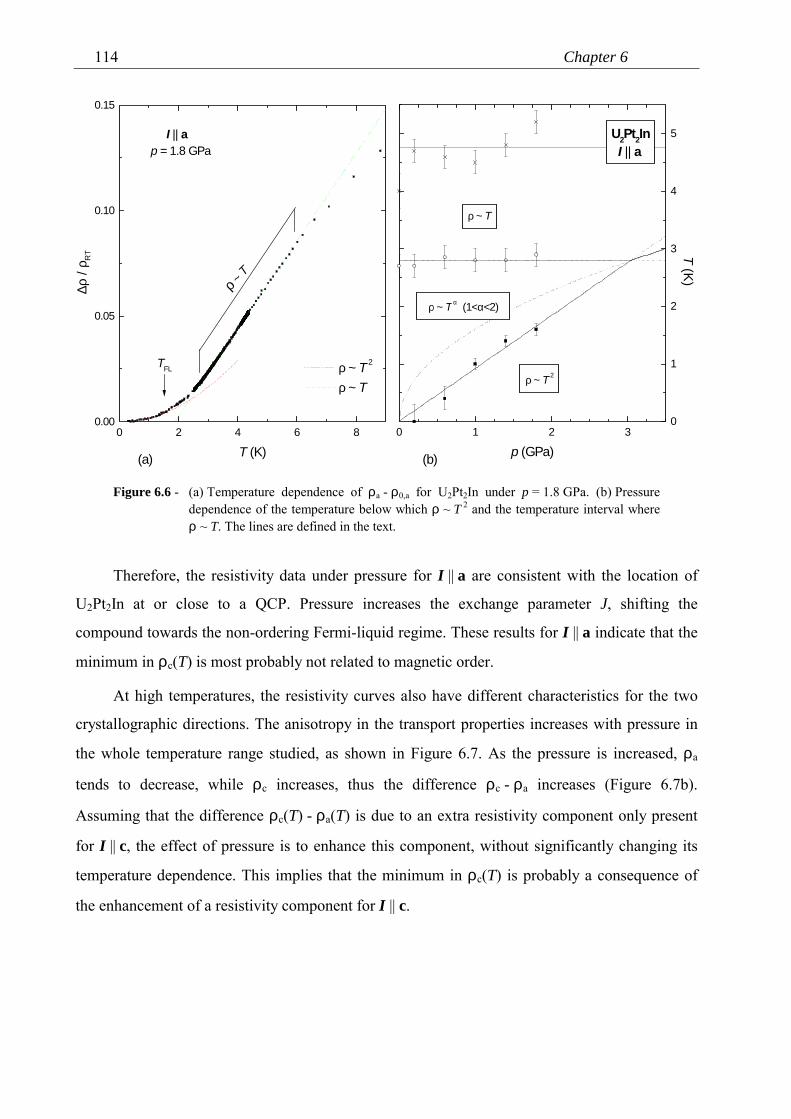
Chapter 6114
0 1 2 30
1
2
3
4
5
(b)
T (K)
ρ ~ T
ρ ~ T α (1<α<2)
ρ ~ T 2
U2Pt2In I || a
p (GPa)0 2 4 6 8
0.00
0.05
0.10
0.15
ρ ~ T
TFL
(a)
I || ap = 1.8 GPa
ρ ~ T 2
ρ ~ T
∆ρ /
ρ RT
T (K)
Figure 6.6 - (a) Temperature dependence of ρa - ρ0,a for U2Pt2In under p = 1.8 GPa. (b) Pressuredependence of the temperature below which ρ ~ T 2 and the temperature interval whereρ ~ T. The lines are defined in the text.
Therefore, the resistivity data under pressure for I || a are consistent with the location of
U2Pt2In at or close to a QCP. Pressure increases the exchange parameter J, shifting the
compound towards the non-ordering Fermi-liquid regime. These results for I || a indicate that the
minimum in ρc(T) is most probably not related to magnetic order.
At high temperatures, the resistivity curves also have different characteristics for the two
crystallographic directions. The anisotropy in the transport properties increases with pressure in
the whole temperature range studied, as shown in Figure 6.7. As the pressure is increased, ρa
tends to decrease, while ρc increases, thus the difference ρc - ρa increases (Figure 6.7b).
Assuming that the difference ρc(T) - ρa(T) is due to an extra resistivity component only present
for I || c, the effect of pressure is to enhance this component, without significantly changing its
temperature dependence. This implies that the minimum in ρc(T) is probably a consequence of
the enhancement of a resistivity component for I || c.
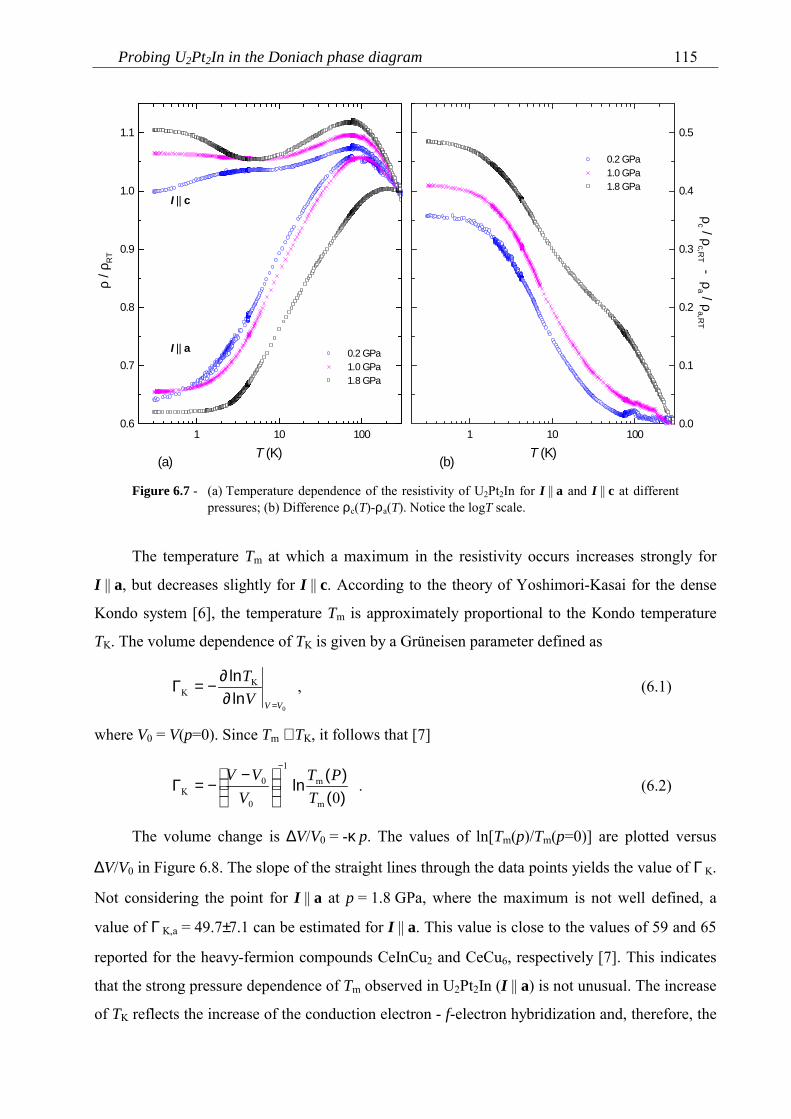
Probing U2Pt2In in the Doniach phase diagram 115
1 10 1000.0
0.1
0.2
0.3
0.4
0.5
(b)
ρc / ρ
c,RT - ρ
a / ρa,R
T
0.2 GPa 1.0 GPa 1.8 GPa
T (K)1 10 100
0.6
0.7
0.8
0.9
1.0
1.1
(a)
0.2 GPa 1.0 GPa 1.8 GPa
I || c
I || a
ρ / ρ
RT
T (K)
Figure 6.7 - (a) Temperature dependence of the resistivity of U2Pt2In for I || a and I || c at differentpressures; (b) Difference ρc(T)-ρa(T). Notice the logT scale.
The temperature Tm at which a maximum in the resistivity occurs increases strongly for
I || a, but decreases slightly for I || c. According to the theory of Yoshimori-Kasai for the dense
Kondo system [6], the temperature Tm is approximately proportional to the Kondo temperature
TK. The volume dependence of TK is given by a Grüneisen parameter defined as
0
KK
VVVT
=∂∂−=Γ
lnln , (6.1)
where V0 = V(p=0). Since Tm ∝ TK, it follows that [7]
)()(ln
0m
m
1
0
0K T
PTV
VV−
−−=Γ . (6.2)
The volume change is ∆V/V0 = -κ p. The values of ln[Tm(p)/Tm(p=0)] are plotted versus
∆V/V0 in Figure 6.8. The slope of the straight lines through the data points yields the value of Γ K.
Not considering the point for I || a at p = 1.8 GPa, where the maximum is not well defined, a
value of Γ K,a = 49.7±7.1 can be estimated for I || a. This value is close to the values of 59 and 65
reported for the heavy-fermion compounds CeInCu2 and CeCu6, respectively [7]. This indicates
that the strong pressure dependence of Tm observed in U2Pt2In (I || a) is not unusual. The increase
of TK reflects the increase of the conduction electron - f-electron hybridization and, therefore, the
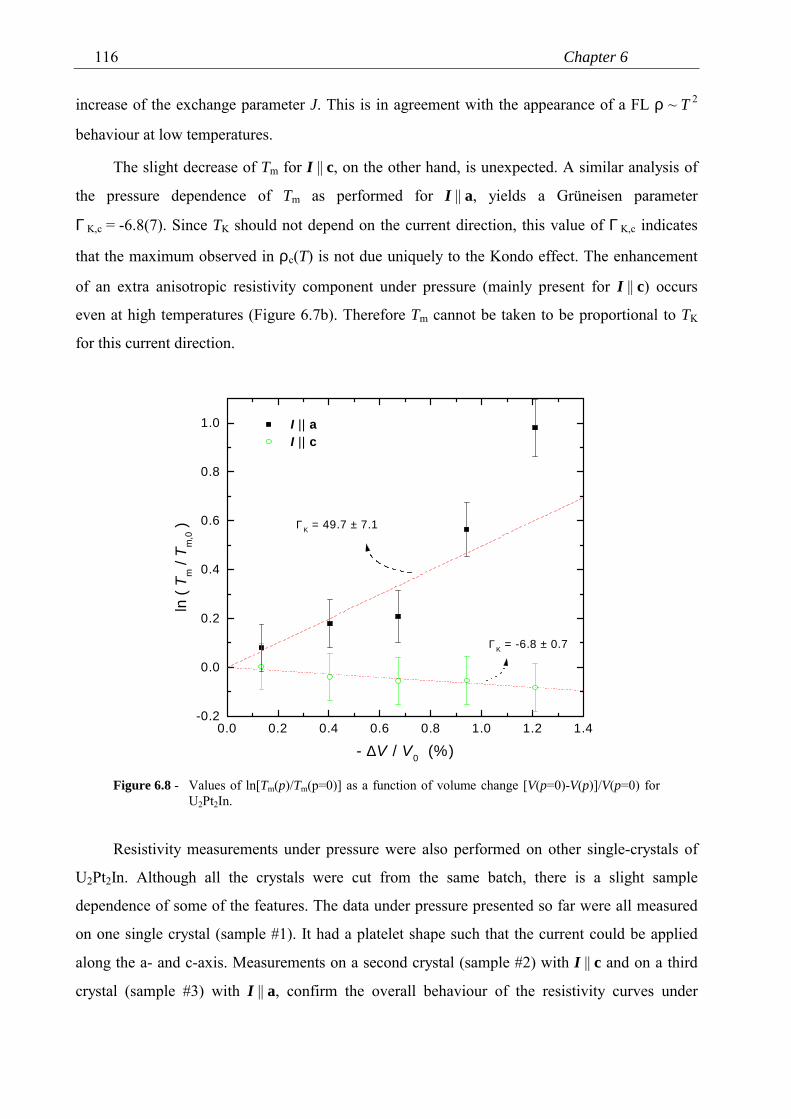
Chapter 6116
increase of the exchange parameter J. This is in agreement with the appearance of a FL ρ ~ T 2
behaviour at low temperatures.
The slight decrease of Tm for I || c, on the other hand, is unexpected. A similar analysis of
the pressure dependence of Tm as performed for I || a, yields a Grüneisen parameter
Γ K,c = -6.8(7). Since TK should not depend on the current direction, this value of Γ K,c indicates
that the maximum observed in ρc(T) is not due uniquely to the Kondo effect. The enhancement
of an extra anisotropic resistivity component under pressure (mainly present for I || c) occurs
even at high temperatures (Figure 6.7b). Therefore Tm cannot be taken to be proportional to TK
for this current direction.
0.0 0.2 0.4 0.6 0.8 1.0 1.2 1.4-0.2
0.0
0.2
0.4
0.6
0.8
1.0
Γ K = -6.8 ± 0.7
Γ K = 49.7 ± 7.1
I || a I || c
ln (
T m /
T m,0 )
- ∆V / V0 (%)
Figure 6.8 - Values of ln[Tm(p)/Tm(p=0)] as a function of volume change [V(p=0)-V(p)]/V(p=0) forU2Pt2In.
Resistivity measurements under pressure were also performed on other single-crystals of
U2Pt2In. Although all the crystals were cut from the same batch, there is a slight sample
dependence of some of the features. The data under pressure presented so far were all measured
on one single crystal (sample #1). It had a platelet shape such that the current could be applied
along the a- and c-axis. Measurements on a second crystal (sample #2) with I || c and on a third
crystal (sample #3) with I || a, confirm the overall behaviour of the resistivity curves under
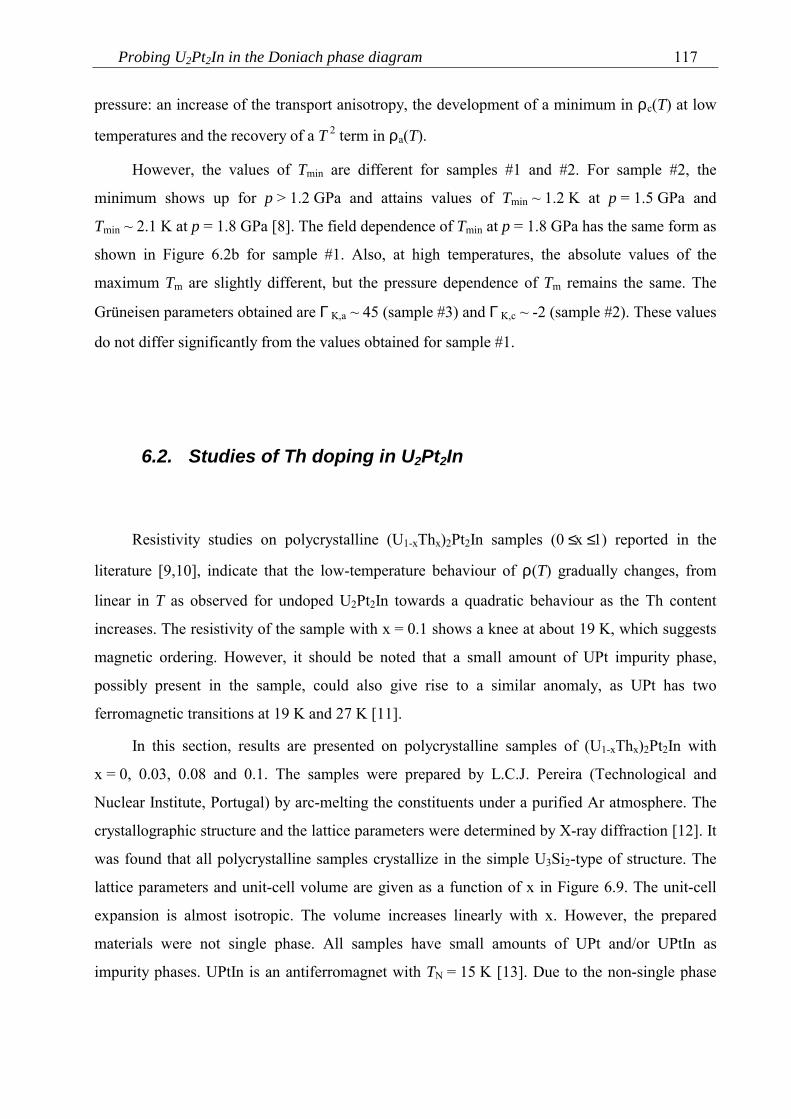
Probing U2Pt2In in the Doniach phase diagram 117
pressure: an increase of the transport anisotropy, the development of a minimum in ρc(T) at low
temperatures and the recovery of a T 2 term in ρa(T).
However, the values of Tmin are different for samples #1 and #2. For sample #2, the
minimum shows up for p > 1.2 GPa and attains values of Tmin ~ 1.2 K at p = 1.5 GPa and
Tmin ~ 2.1 K at p = 1.8 GPa [8]. The field dependence of Tmin at p = 1.8 GPa has the same form as
shown in Figure 6.2b for sample #1. Also, at high temperatures, the absolute values of the
maximum Tm are slightly different, but the pressure dependence of Tm remains the same. The
Grüneisen parameters obtained are Γ K,a ~ 45 (sample #3) and Γ K,c ~ -2 (sample #2). These values
do not differ significantly from the values obtained for sample #1.
6.2. Studies of Th doping in U2Pt2In
Resistivity studies on polycrystalline (U1-xThx)2Pt2In samples (0 ≤ x ≤ 1) reported in the
literature [9,10], indicate that the low-temperature behaviour of ρ(T) gradually changes, from
linear in T as observed for undoped U2Pt2In towards a quadratic behaviour as the Th content
increases. The resistivity of the sample with x = 0.1 shows a knee at about 19 K, which suggests
magnetic ordering. However, it should be noted that a small amount of UPt impurity phase,
possibly present in the sample, could also give rise to a similar anomaly, as UPt has two
ferromagnetic transitions at 19 K and 27 K [11].
In this section, results are presented on polycrystalline samples of (U1-xThx)2Pt2In with
x = 0, 0.03, 0.08 and 0.1. The samples were prepared by L.C.J. Pereira (Technological and
Nuclear Institute, Portugal) by arc-melting the constituents under a purified Ar atmosphere. The
crystallographic structure and the lattice parameters were determined by X-ray diffraction [12]. It
was found that all polycrystalline samples crystallize in the simple U3Si2-type of structure. The
lattice parameters and unit-cell volume are given as a function of x in Figure 6.9. The unit-cell
expansion is almost isotropic. The volume increases linearly with x. However, the prepared
materials were not single phase. All samples have small amounts of UPt and/or UPtIn as
impurity phases. UPtIn is an antiferromagnet with TN = 15 K [13]. Due to the non-single phase
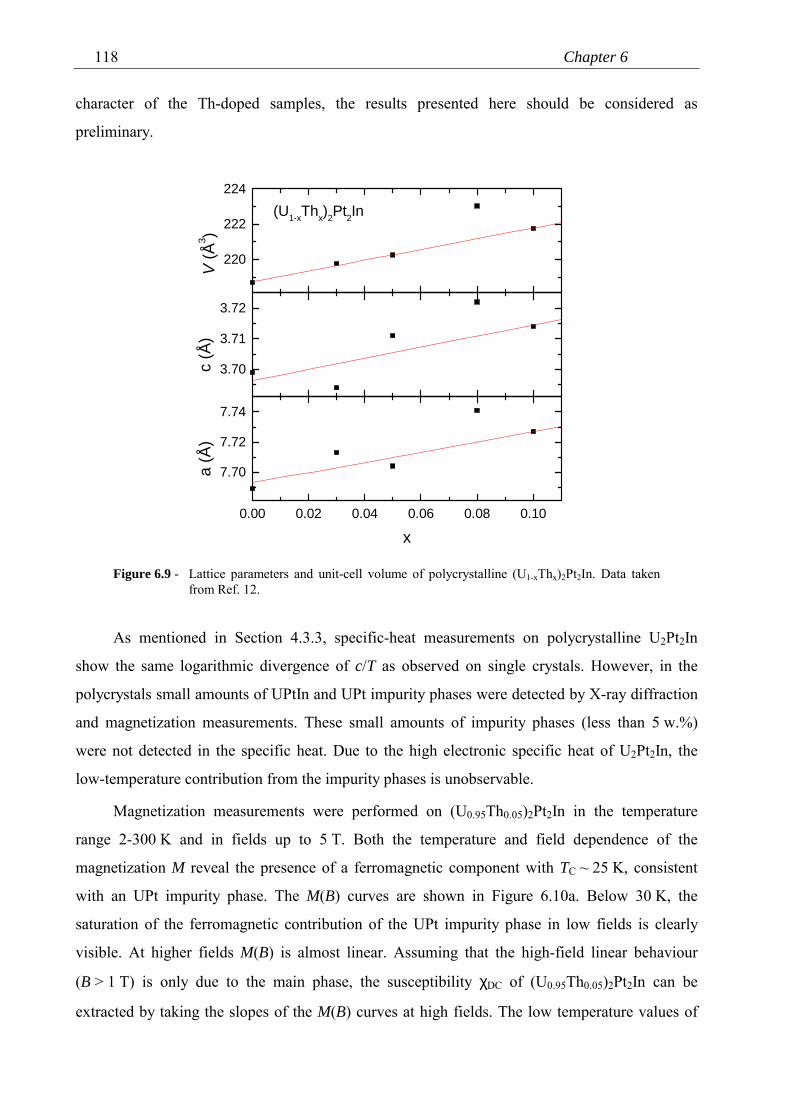
Chapter 6118
character of the Th-doped samples, the results presented here should be considered as
preliminary.
0.00 0.02 0.04 0.06 0.08 0.10
7.70
7.72
7.74
a (Å
)
x
3.70
3.71
3.72
c (Å
)
220
222
224(U1-xThx)2Pt2In
V (Å
3 )
Figure 6.9 - Lattice parameters and unit-cell volume of polycrystalline (U1-xThx)2Pt2In. Data takenfrom Ref. 12.
As mentioned in Section 4.3.3, specific-heat measurements on polycrystalline U2Pt2In
show the same logarithmic divergence of c/T as observed on single crystals. However, in the
polycrystals small amounts of UPtIn and UPt impurity phases were detected by X-ray diffraction
and magnetization measurements. These small amounts of impurity phases (less than 5 w.%)
were not detected in the specific heat. Due to the high electronic specific heat of U2Pt2In, the
low-temperature contribution from the impurity phases is unobservable.
Magnetization measurements were performed on (U0.95Th0.05)2Pt2In in the temperature
range 2-300 K and in fields up to 5 T. Both the temperature and field dependence of the
magnetization M reveal the presence of a ferromagnetic component with TC ~ 25 K, consistent
with an UPt impurity phase. The M(B) curves are shown in Figure 6.10a. Below 30 K, the
saturation of the ferromagnetic contribution of the UPt impurity phase in low fields is clearly
visible. At higher fields M(B) is almost linear. Assuming that the high-field linear behaviour
(B > 1 T) is only due to the main phase, the susceptibility χDC of (U0.95Th0.05)2Pt2In can be
extracted by taking the slopes of the M(B) curves at high fields. The low temperature values of
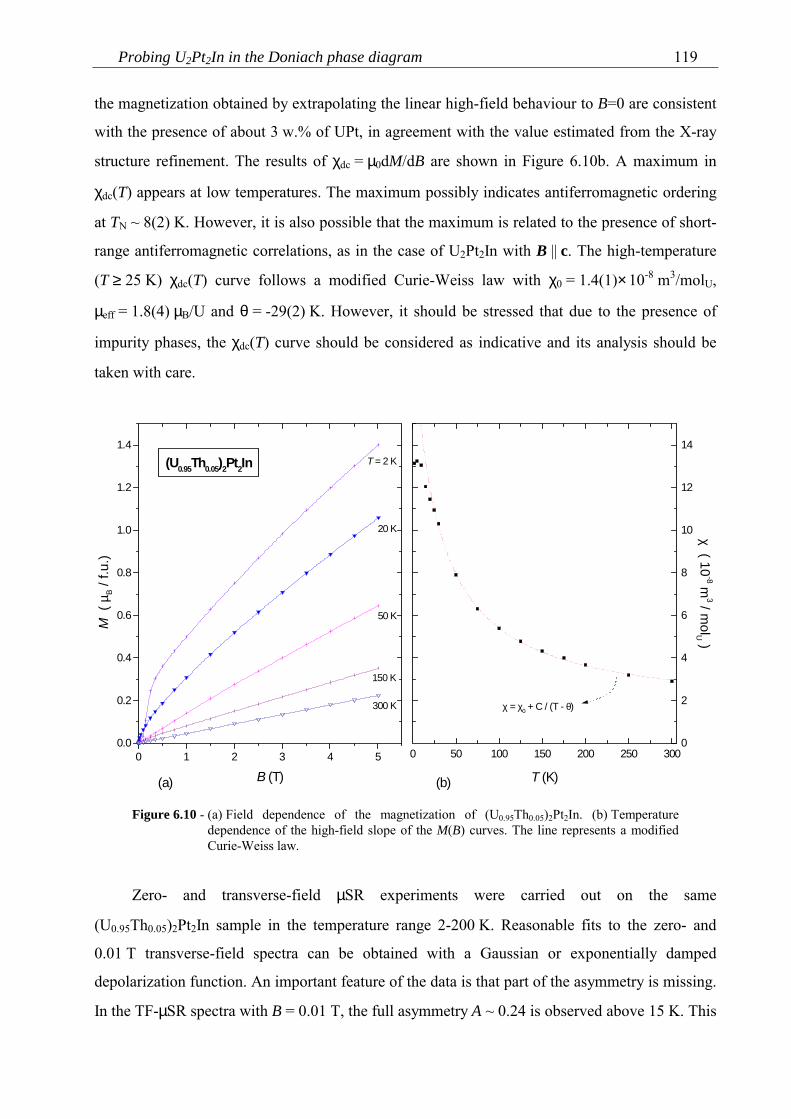
Probing U2Pt2In in the Doniach phase diagram 119
the magnetization obtained by extrapolating the linear high-field behaviour to B=0 are consistent
with the presence of about 3 w.% of UPt, in agreement with the value estimated from the X-ray
structure refinement. The results of χdc = µ0dM/dB are shown in Figure 6.10b. A maximum in
χdc(T) appears at low temperatures. The maximum possibly indicates antiferromagnetic ordering
at TN ~ 8(2) K. However, it is also possible that the maximum is related to the presence of short-
range antiferromagnetic correlations, as in the case of U2Pt2In with B || c. The high-temperature
(T ≥ 25 K) χdc(T) curve follows a modified Curie-Weiss law with χ0 = 1.4(1)×10-8 m3/molU,
µeff = 1.8(4) µB/U and θ = -29(2) K. However, it should be stressed that due to the presence of
impurity phases, the χdc(T) curve should be considered as indicative and its analysis should be
taken with care.
0 1 2 3 4 50.0
0.2
0.4
0.6
0.8
1.0
1.2
1.4
(a)
(U0.95Th0.05)2Pt2In
300 K
150 K
50 K
20 K
T = 2 K
M (
µB /
f.u.
)
B (T)
0 50 100 150 200 250 3000
2
4
6
8
10
12
14
(b)
χ = χ0 + C / (T - θ)
χ ( 10-8 m
3 / molU )
T (K)
Figure 6.10 - (a) Field dependence of the magnetization of (U0.95Th0.05)2Pt2In. (b) Temperaturedependence of the high-field slope of the M(B) curves. The line represents a modifiedCurie-Weiss law.
Zero- and transverse-field µSR experiments were carried out on the same
(U0.95Th0.05)2Pt2In sample in the temperature range 2-200 K. Reasonable fits to the zero- and
0.01 T transverse-field spectra can be obtained with a Gaussian or exponentially damped
depolarization function. An important feature of the data is that part of the asymmetry is missing.
In the TF-µSR spectra with B = 0.01 T, the full asymmetry A ~ 0.24 is observed above 15 K. This
Chapter 6120
value of the asymmetry is determined by the experimental geometry and sample size. Below
about 15 K the asymmetry drops to a value of A ~ 0.15, which implies that an additional fast
component to the µSR signal appears, which has not been accounted for in the fits. A fast
component, i.e., a component with a high depolarization rate, must have its origin in a
magnetically ordered phase. The drop in the asymmetry near 15 K (∆A ~ 0.09), is too high to be
attributed to the presence of ~ 3 w.% of UPt impurity phase.
Although no reliable fits to the spectra at low temperature were obtained, a common
feature appeared in all fit attempts: as the temperature is decreased below 25 K, the zero-field
depolarization rate increases and has a tendency to diverge at about 10 K, below which it regains
a low value. A divergency of the depolarization rate is often associated with an antiferromagnetic
transition [14], which is in agreement with the antiferromagnetic-like χDC(T) curve.
Transverse field µSR experiments in 0.01 T were carried out on (U0.97Th0.03)2Pt2In for
2.5 ≤ T ≤ 100 K. In contrast to the results obtained on the x = 0.05 sample, no significant loss of
asymmetry was found at low temperatures. Best fits to the spectra were obtained using a damped-
Gaussian depolarization function: P(t) = PG(t) exp(-λEt) with PG(t) = exp(-∆G2t2/2)cos(ωt). Here,
the temperature-independent Gaussian relaxation rate was found to be ∆G = 0.17 µs-1, which
possibly accounts for the In nuclear contribution. This value is much reduced with respect to the
one observed on U2Pt2In (∆G = 0.34 µs-1). It should be noted that the crystallographic structures
are different and therefore different muon stopping sites might be involved, leading to a different
value of ∆G from the distribution of In nuclear moments. The damping of the Gaussian term is
observed below 10 K with λE increasing below this temperature. Whether this increase is
associated with a dynamic or a static magnetic component cannot be determined from the
available data set.
Recently, polycrystalline (U1-xThx)2Pt2In samples with x = 0.03, 0.05, 0.08 and 0.1 were
prepared with lower amounts of impurity phases [12]. Specific-heat measurements carried out by
G. Bonfait (Technological and Nuclear Institute, Portugal) on these samples do not confirm
magnetic order above 2 K. It would be of interest to carry out µSR experiments on these samples
as well, in order to look for weak magnetism. Clearly, single-phase samples are highly desirable
to reliably determine the presence of magnetic order.
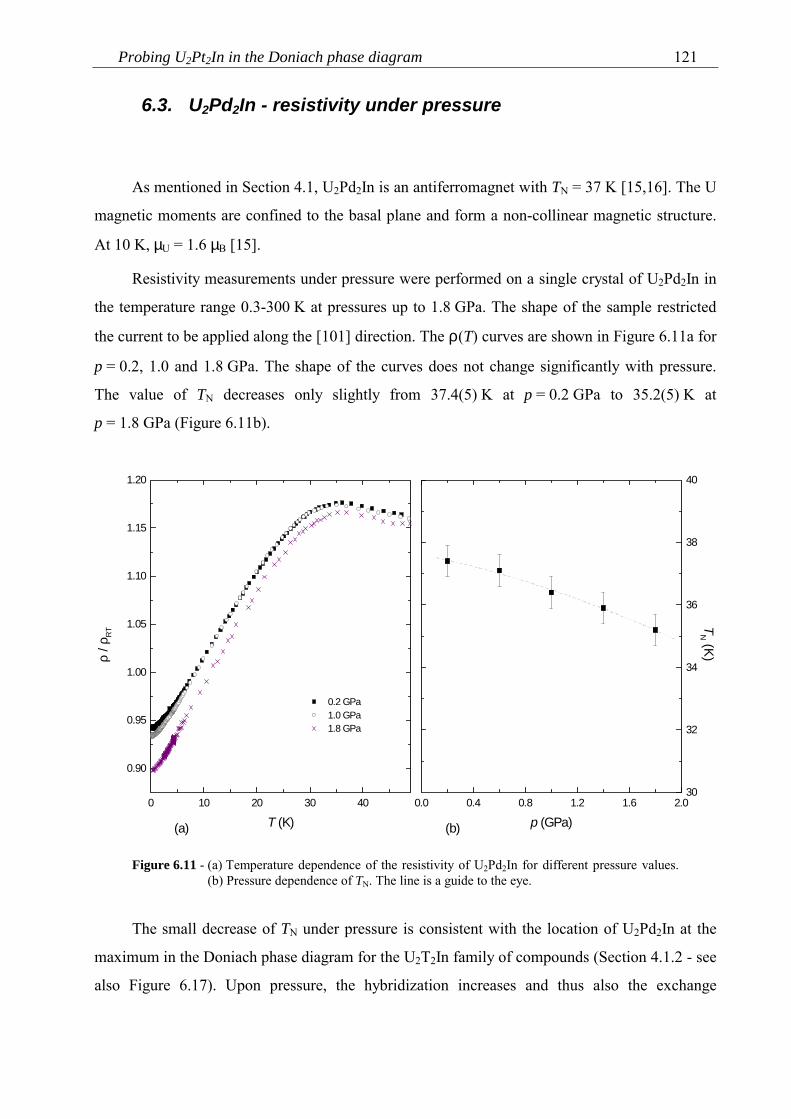
Probing U2Pt2In in the Doniach phase diagram 121
6.3. U2Pd2In - resistivity under pressure
As mentioned in Section 4.1, U2Pd2In is an antiferromagnet with TN = 37 K [15,16]. The U
magnetic moments are confined to the basal plane and form a non-collinear magnetic structure.
At 10 K, µU = 1.6 µB [15].
Resistivity measurements under pressure were performed on a single crystal of U2Pd2In in
the temperature range 0.3-300 K at pressures up to 1.8 GPa. The shape of the sample restricted
the current to be applied along the [101] direction. The ρ(T) curves are shown in Figure 6.11a for
p = 0.2, 1.0 and 1.8 GPa. The shape of the curves does not change significantly with pressure.
The value of TN decreases only slightly from 37.4(5) K at p = 0.2 GPa to 35.2(5) K at
p = 1.8 GPa (Figure 6.11b).
0 10 20 30 40
0.90
0.95
1.00
1.05
1.10
1.15
1.20
(a)
0.2 GPa 1.0 GPa 1.8 GPa
ρ / ρ
RT
T (K)0.0 0.4 0.8 1.2 1.6 2.0
30
32
34
36
38
40
(b)
TN (K)
p (GPa)
Figure 6.11 - (a) Temperature dependence of the resistivity of U2Pd2In for different pressure values.(b) Pressure dependence of TN. The line is a guide to the eye.
The small decrease of TN under pressure is consistent with the location of U2Pd2In at the
maximum in the Doniach phase diagram for the U2T2In family of compounds (Section 4.1.2 - see
also Figure 6.17). Upon pressure, the hybridization increases and thus also the exchange
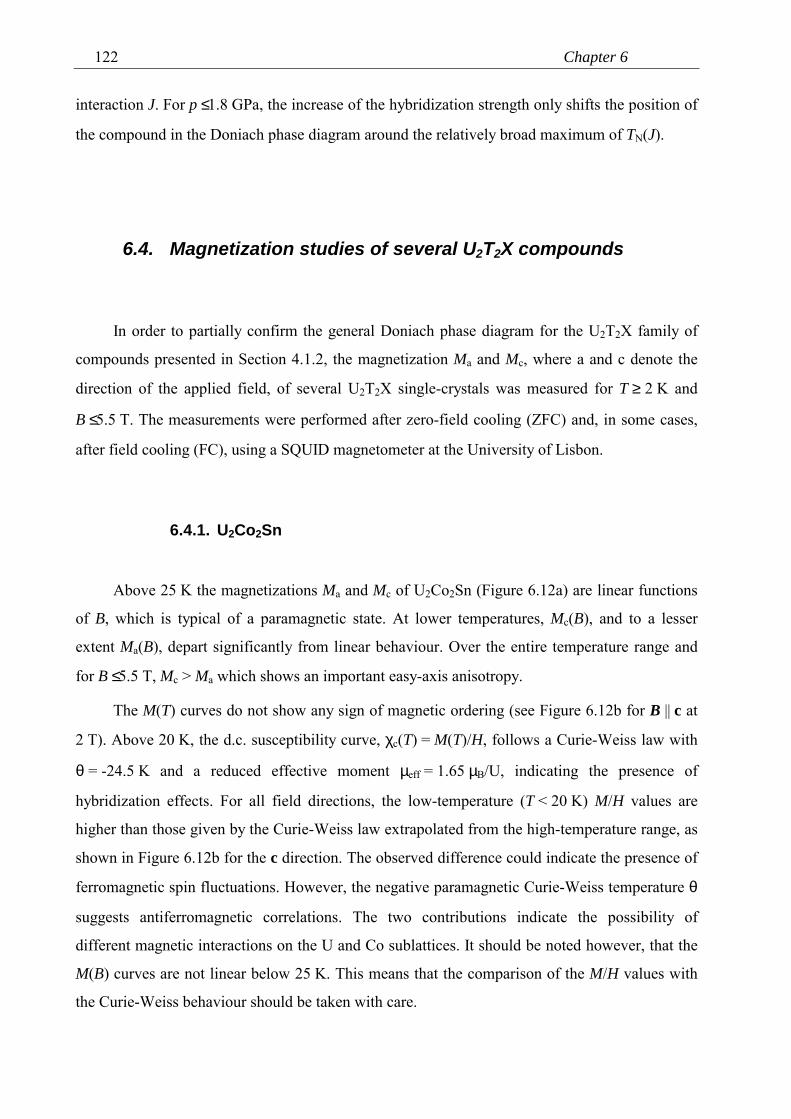
Chapter 6122
interaction J. For p ≤ 1.8 GPa, the increase of the hybridization strength only shifts the position of
the compound in the Doniach phase diagram around the relatively broad maximum of TN(J).
6.4. Magnetization studies of several U2T2X compounds
In order to partially confirm the general Doniach phase diagram for the U2T2X family of
compounds presented in Section 4.1.2, the magnetization Ma and Mc, where a and c denote the
direction of the applied field, of several U2T2X single-crystals was measured for T ≥ 2 K and
B ≤ 5.5 T. The measurements were performed after zero-field cooling (ZFC) and, in some cases,
after field cooling (FC), using a SQUID magnetometer at the University of Lisbon.
6.4.1. U2Co2Sn
Above 25 K the magnetizations Ma and Mc of U2Co2Sn (Figure 6.12a) are linear functions
of B, which is typical of a paramagnetic state. At lower temperatures, Mc(B), and to a lesser
extent Ma(B), depart significantly from linear behaviour. Over the entire temperature range and
for B ≤ 5.5 T, Mc > Ma which shows an important easy-axis anisotropy.
The M(T) curves do not show any sign of magnetic ordering (see Figure 6.12b for B || c at
2 T). Above 20 K, the d.c. susceptibility curve, χc(T) = M(T)/H, follows a Curie-Weiss law with
θ = -24.5 K and a reduced effective moment µeff = 1.65 µB/U, indicating the presence of
hybridization effects. For all field directions, the low-temperature (T < 20 K) M/H values are
higher than those given by the Curie-Weiss law extrapolated from the high-temperature range, as
shown in Figure 6.12b for the c direction. The observed difference could indicate the presence of
ferromagnetic spin fluctuations. However, the negative paramagnetic Curie-Weiss temperature θ
suggests antiferromagnetic correlations. The two contributions indicate the possibility of
different magnetic interactions on the U and Co sublattices. It should be noted however, that the
M(B) curves are not linear below 25 K. This means that the comparison of the M/H values with
the Curie-Weiss behaviour should be taken with care.
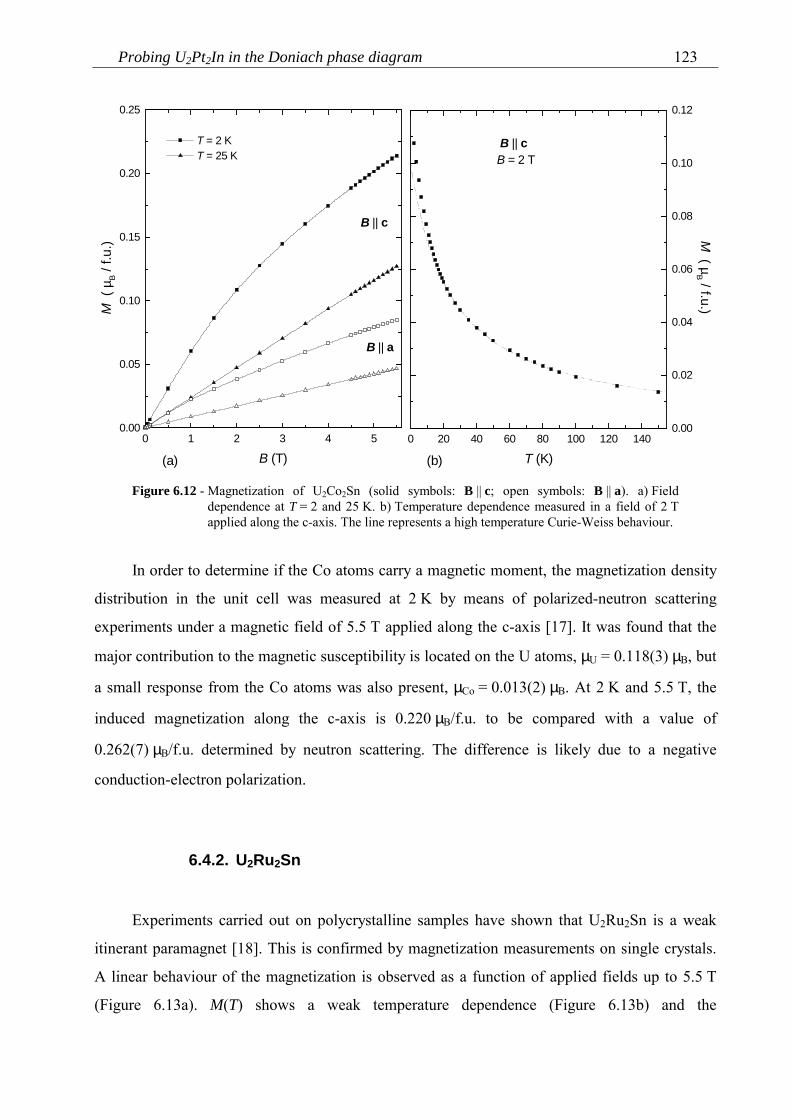
Probing U2Pt2In in the Doniach phase diagram 123
0 20 40 60 80 100 120 1400.00
0.02
0.04
0.06
0.08
0.10
0.12
(b)
B || cB = 2 T
M ( µ
B / f.u.)
T (K)0 1 2 3 4 5
0.00
0.05
0.10
0.15
0.20
0.25
(a)
B || a
B || c
T = 2 K T = 25 K
M (
µB /
f.u.
)
B (T)
Figure 6.12 - Magnetization of U2Co2Sn (solid symbols: B || c; open symbols: B || a). a) Fielddependence at T = 2 and 25 K. b) Temperature dependence measured in a field of 2 Tapplied along the c-axis. The line represents a high temperature Curie-Weiss behaviour.
In order to determine if the Co atoms carry a magnetic moment, the magnetization density
distribution in the unit cell was measured at 2 K by means of polarized-neutron scattering
experiments under a magnetic field of 5.5 T applied along the c-axis [17]. It was found that the
major contribution to the magnetic susceptibility is located on the U atoms, µU = 0.118(3) µB, but
a small response from the Co atoms was also present, µCo = 0.013(2) µB. At 2 K and 5.5 T, the
induced magnetization along the c-axis is 0.220 µB/f.u. to be compared with a value of
0.262(7) µB/f.u. determined by neutron scattering. The difference is likely due to a negative
conduction-electron polarization.
6.4.2. U2Ru2Sn
Experiments carried out on polycrystalline samples have shown that U2Ru2Sn is a weak
itinerant paramagnet [18]. This is confirmed by magnetization measurements on single crystals.
A linear behaviour of the magnetization is observed as a function of applied fields up to 5.5 T
(Figure 6.13a). M(T) shows a weak temperature dependence (Figure 6.13b) and the
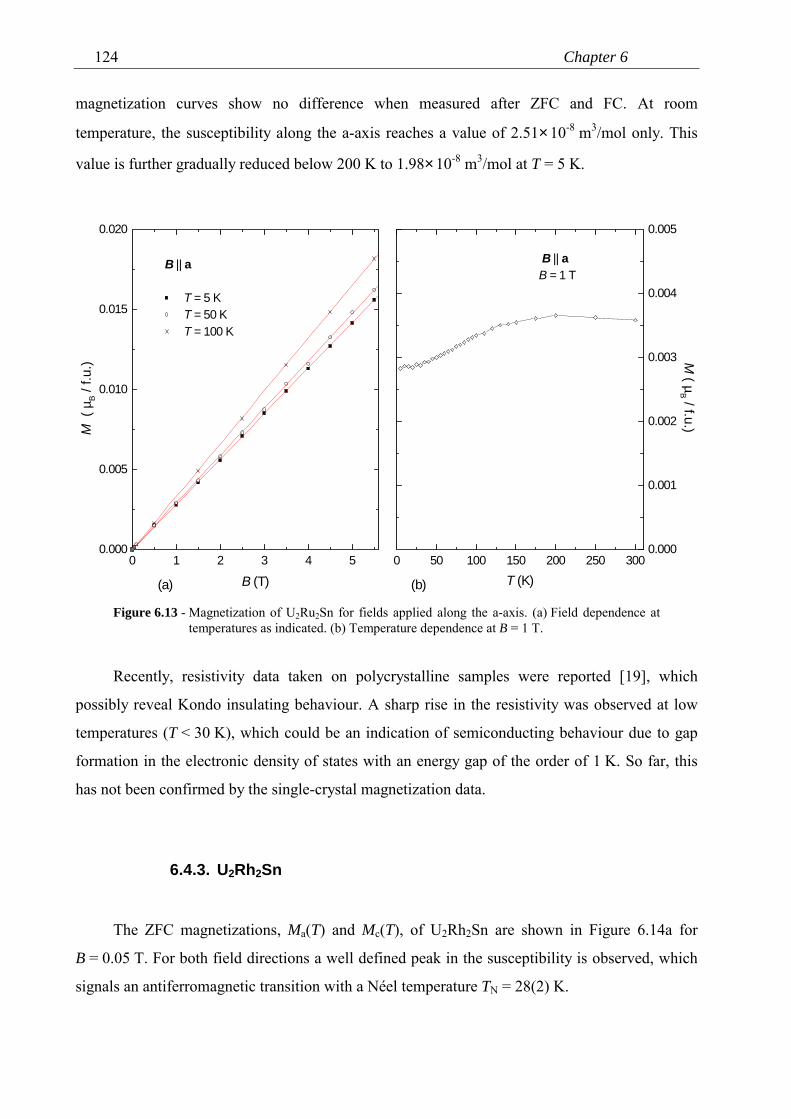
Chapter 6124
magnetization curves show no difference when measured after ZFC and FC. At room
temperature, the susceptibility along the a-axis reaches a value of 2.51×10⁻⁸ m3/mol only. This
value is further gradually reduced below 200 K to 1.98×10⁻⁸ m3/mol at T = 5 K.
0 1 2 3 4 50.000
0.005
0.010
0.015
0.020
M (
µB /
f.u.
)
(a)
B || a
T = 5 K T = 50 K T = 100 K
B (T)0 50 100 150 200 250 300
0.000
0.001
0.002
0.003
0.004
0.005
M ( µ
B / f.u.)
(b)
B || aB = 1 T
T (K)
Figure 6.13 - Magnetization of U2Ru2Sn for fields applied along the a-axis. (a) Field dependence attemperatures as indicated. (b) Temperature dependence at B = 1 T.
Recently, resistivity data taken on polycrystalline samples were reported [19], which
possibly reveal Kondo insulating behaviour. A sharp rise in the resistivity was observed at low
temperatures (T < 30 K), which could be an indication of semiconducting behaviour due to gap
formation in the electronic density of states with an energy gap of the order of 1 K. So far, this
has not been confirmed by the single-crystal magnetization data.
6.4.3. U2Rh2Sn
The ZFC magnetizations, Ma(T) and Mc(T), of U2Rh2Sn are shown in Figure 6.14a for
B = 0.05 T. For both field directions a well defined peak in the susceptibility is observed, which
signals an antiferromagnetic transition with a Néel temperature TN = 28(2) K.
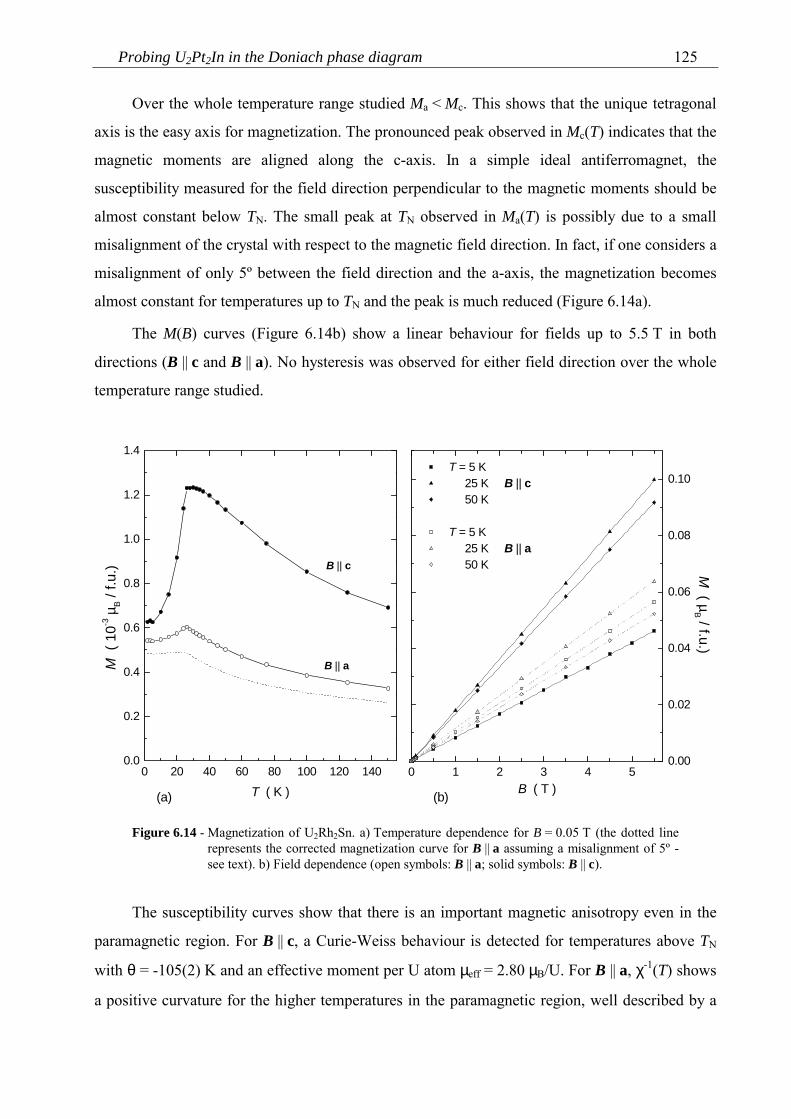
Probing U2Pt2In in the Doniach phase diagram 125
Over the whole temperature range studied Ma < Mc. This shows that the unique tetragonal
axis is the easy axis for magnetization. The pronounced peak observed in Mc(T) indicates that the
magnetic moments are aligned along the c-axis. In a simple ideal antiferromagnet, the
susceptibility measured for the field direction perpendicular to the magnetic moments should be
almost constant below TN. The small peak at TN observed in Ma(T) is possibly due to a small
misalignment of the crystal with respect to the magnetic field direction. In fact, if one considers a
misalignment of only 5º between the field direction and the a-axis, the magnetization becomes
almost constant for temperatures up to TN and the peak is much reduced (Figure 6.14a).
The M(B) curves (Figure 6.14b) show a linear behaviour for fields up to 5.5 T in both
directions (B || c and B || a). No hysteresis was observed for either field direction over the whole
temperature range studied.
0 1 2 3 4 50.00
0.02
0.04
0.06
0.08
0.10
(b)
T = 5 K 25 K B || c 50 K
T = 5 K 25 K B || a 50 K M
( µB / f.u.)
B ( T )0 20 40 60 80 100 120 140
0.0
0.2
0.4
0.6
0.8
1.0
1.2
1.4
(a)
B || a
B || c
M (
10-3
µB /
f.u.
)
T ( K )
Figure 6.14 - Magnetization of U2Rh2Sn. a) Temperature dependence for B = 0.05 T (the dotted linerepresents the corrected magnetization curve for B || a assuming a misalignment of 5º -see text). b) Field dependence (open symbols: B || a; solid symbols: B || c).
The susceptibility curves show that there is an important magnetic anisotropy even in the
paramagnetic region. For B || c, a Curie-Weiss behaviour is detected for temperatures above TN
with θ = -105(2) K and an effective moment per U atom µeff = 2.80 µB/U. For B || a, χ-1(T) shows
a positive curvature for the higher temperatures in the paramagnetic region, well described by a
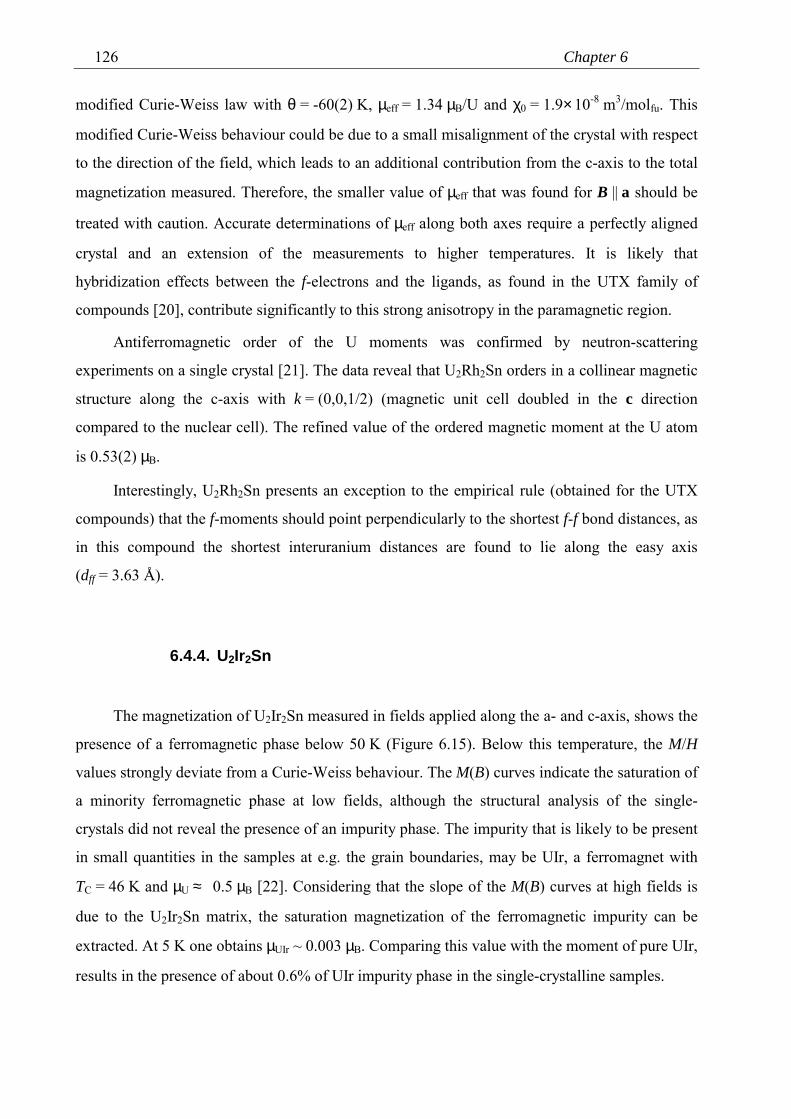
Chapter 6126
modified Curie-Weiss law with θ = -60(2) K, µeff = 1.34 µB/U and χ0 = 1.9×10⁻⁸ m3/molfu. This
modified Curie-Weiss behaviour could be due to a small misalignment of the crystal with respect
to the direction of the field, which leads to an additional contribution from the c-axis to the total
magnetization measured. Therefore, the smaller value of µeff that was found for B || a should be
treated with caution. Accurate determinations of µeff along both axes require a perfectly aligned
crystal and an extension of the measurements to higher temperatures. It is likely that
hybridization effects between the f-electrons and the ligands, as found in the UTX family of
compounds [20], contribute significantly to this strong anisotropy in the paramagnetic region.
Antiferromagnetic order of the U moments was confirmed by neutron-scattering
experiments on a single crystal [21]. The data reveal that U2Rh2Sn orders in a collinear magnetic
structure along the c-axis with k = (0,0,1/2) (magnetic unit cell doubled in the c direction
compared to the nuclear cell). The refined value of the ordered magnetic moment at the U atom
is 0.53(2) µB.
Interestingly, U2Rh2Sn presents an exception to the empirical rule (obtained for the UTX
compounds) that the f-moments should point perpendicularly to the shortest f-f bond distances, as
in this compound the shortest interuranium distances are found to lie along the easy axis
(dff = 3.63 Å).
6.4.4. U2Ir2Sn
The magnetization of U2Ir2Sn measured in fields applied along the a- and c-axis, shows the
presence of a ferromagnetic phase below 50 K (Figure 6.15). Below this temperature, the M/H
values strongly deviate from a Curie-Weiss behaviour. The M(B) curves indicate the saturation of
a minority ferromagnetic phase at low fields, although the structural analysis of the single-
crystals did not reveal the presence of an impurity phase. The impurity that is likely to be present
in small quantities in the samples at e.g. the grain boundaries, may be UIr, a ferromagnet with
TC = 46 K and µU ≈ 0.5 µB [22]. Considering that the slope of the M(B) curves at high fields is
due to the U2Ir2Sn matrix, the saturation magnetization of the ferromagnetic impurity can be
extracted. At 5 K one obtains µUIr ~ 0.003 µB. Comparing this value with the moment of pure UIr,
results in the presence of about 0.6% of UIr impurity phase in the single-crystalline samples.
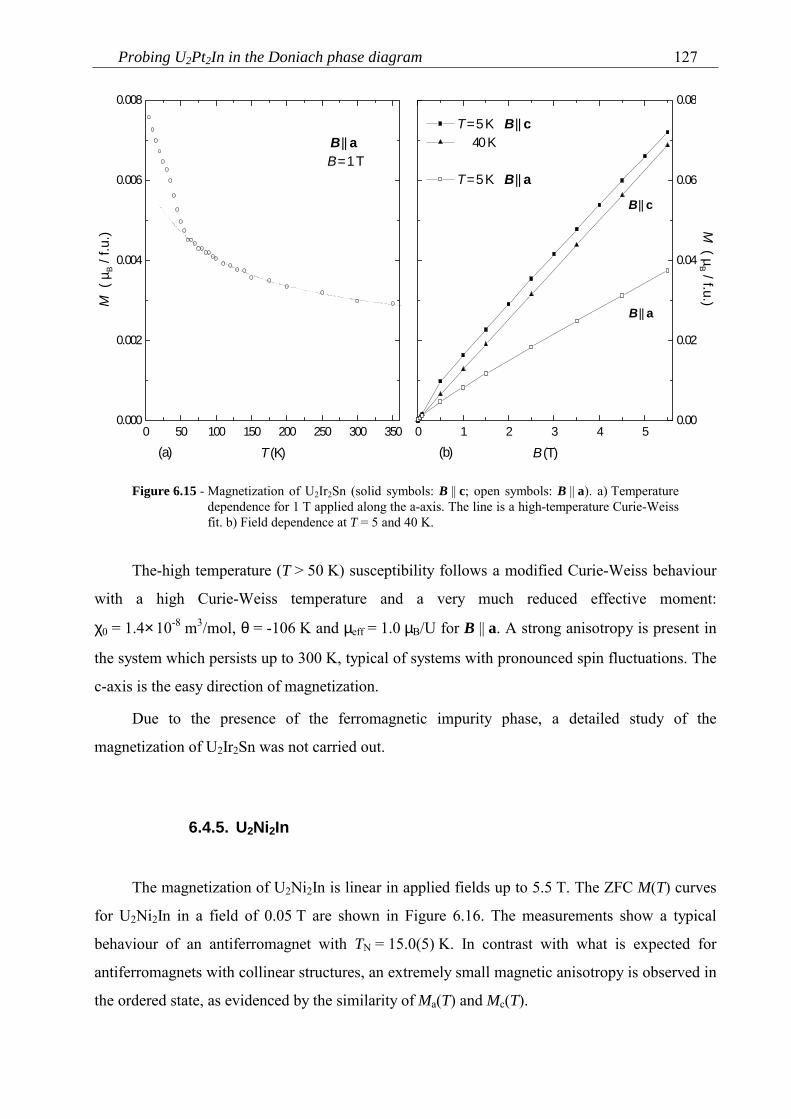
Probing U2Pt2In in the Doniach phase diagram 127
0 1 2 3 4 50.00
0.02
0.04
0.06
0.08
(b)
T = 5 K B || c 40 K
T = 5 K B || a
M ( µ
B / f.u.)
B || c
B || a
B (T)0 50 100 150 200 250 300 350
0.000
0.002
0.004
0.006
0.008
(a)
B || aB = 1 T
M (
µB /
f.u.
)
T (K)
Figure 6.15 - Magnetization of U2Ir2Sn (solid symbols: B || c; open symbols: B || a). a) Temperaturedependence for 1 T applied along the a-axis. The line is a high-temperature Curie-Weissfit. b) Field dependence at T = 5 and 40 K.
The-high temperature (T > 50 K) susceptibility follows a modified Curie-Weiss behaviour
with a high Curie-Weiss temperature and a very much reduced effective moment:
χ0 = 1.4×10⁻⁸ m3/mol, θ = -106 K and µeff = 1.0 µB/U for B || a. A strong anisotropy is present in
the system which persists up to 300 K, typical of systems with pronounced spin fluctuations. The
c-axis is the easy direction of magnetization.
Due to the presence of the ferromagnetic impurity phase, a detailed study of the
magnetization of U2Ir2Sn was not carried out.
6.4.5. U2Ni2In
The magnetization of U2Ni2In is linear in applied fields up to 5.5 T. The ZFC M(T) curves
for U2Ni2In in a field of 0.05 T are shown in Figure 6.16. The measurements show a typical
behaviour of an antiferromagnet with TN = 15.0(5) K. In contrast with what is expected for
antiferromagnets with collinear structures, an extremely small magnetic anisotropy is observed in
the ordered state, as evidenced by the similarity of Ma(T) and Mc(T).
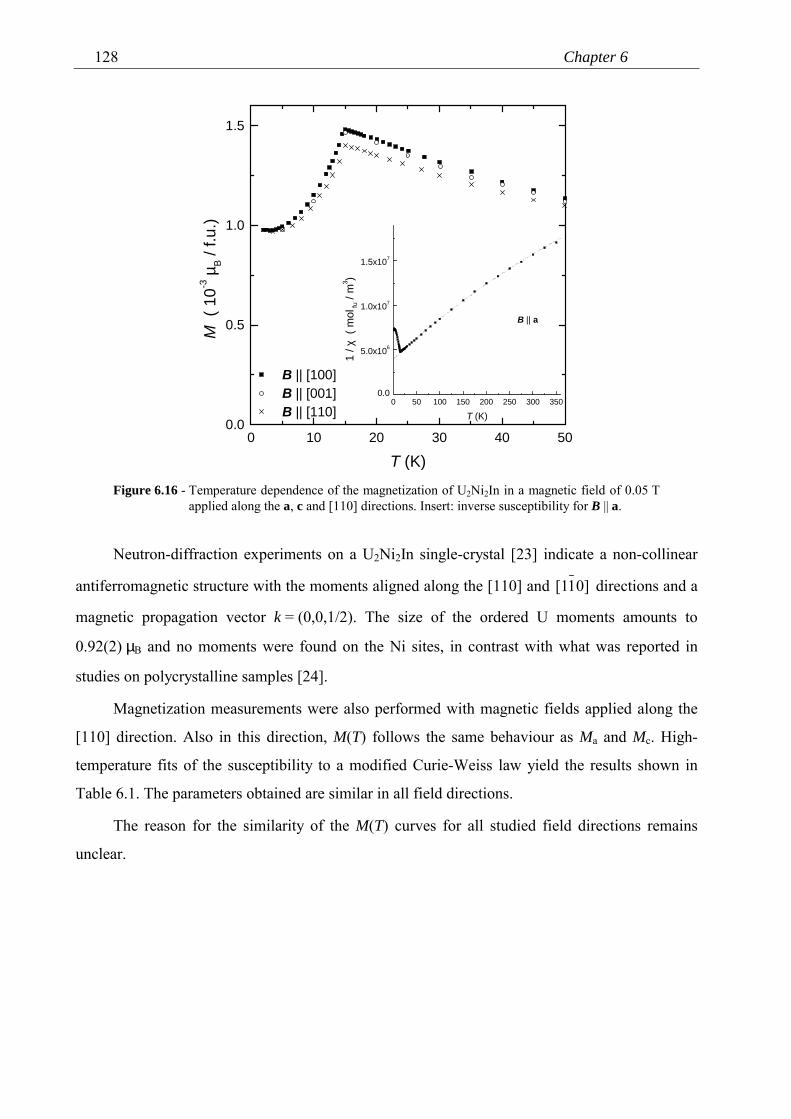
Chapter 6128
0 10 20 30 40 500.0
0.5
1.0
1.5
B || [100] B || [001] B || [110]
M (
10-3
µB /
f.u.
)
T (K)
0 50 100 150 200 250 300 3500.0
5.0x10⁶
1.0x10⁷
1.5x10⁷
B || a
1 / χ
( m
ol fu
/ m
3 )
T (K)
Figure 6.16 - Temperature dependence of the magnetization of U2Ni2In in a magnetic field of 0.05 Tapplied along the a, c and [110] directions. Insert: inverse susceptibility for B || a.
Neutron-diffraction experiments on a U2Ni2In single-crystal [23] indicate a non-collinear
antiferromagnetic structure with the moments aligned along the [110] and 0]1[1 directions and a
magnetic propagation vector k = (0,0,1/2). The size of the ordered U moments amounts to
0.92(2) µB and no moments were found on the Ni sites, in contrast with what was reported in
studies on polycrystalline samples [24].
Magnetization measurements were also performed with magnetic fields applied along the
[110] direction. Also in this direction, M(T) follows the same behaviour as Ma and Mc. High-
temperature fits of the susceptibility to a modified Curie-Weiss law yield the results shown in
Table 6.1. The parameters obtained are similar in all field directions.
The reason for the similarity of the M(T) curves for all studied field directions remains
unclear.
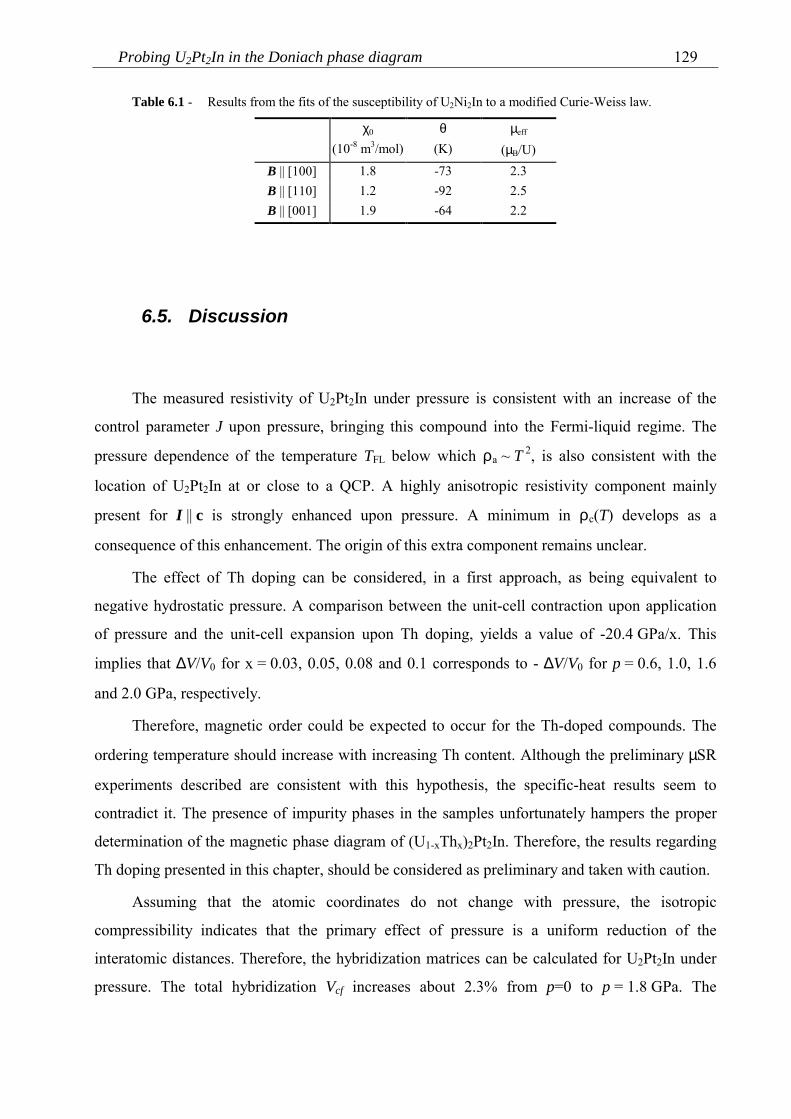
Probing U2Pt2In in the Doniach phase diagram 129
Table 6.1 - Results from the fits of the susceptibility of U2Ni2In to a modified Curie-Weiss law.
χ0
(10-8 m3/mol)θ
(K)µeff
(µB/U)B || [100] 1.8 -73 2.3B || [110] 1.2 -92 2.5B || [001] 1.9 -64 2.2
6.5. Discussion
The measured resistivity of U2Pt2In under pressure is consistent with an increase of the
control parameter J upon pressure, bringing this compound into the Fermi-liquid regime. The
pressure dependence of the temperature TFL below which ρa ~ T 2, is also consistent with the
location of U2Pt2In at or close to a QCP. A highly anisotropic resistivity component mainly
present for I || c is strongly enhanced upon pressure. A minimum in ρc(T) develops as a
consequence of this enhancement. The origin of this extra component remains unclear.
The effect of Th doping can be considered, in a first approach, as being equivalent to
negative hydrostatic pressure. A comparison between the unit-cell contraction upon application
of pressure and the unit-cell expansion upon Th doping, yields a value of -20.4 GPa/x. This
implies that ∆V/V0 for x = 0.03, 0.05, 0.08 and 0.1 corresponds to - ∆V/V0 for p = 0.6, 1.0, 1.6
and 2.0 GPa, respectively.
Therefore, magnetic order could be expected to occur for the Th-doped compounds. The
ordering temperature should increase with increasing Th content. Although the preliminary µSR
experiments described are consistent with this hypothesis, the specific-heat results seem to
contradict it. The presence of impurity phases in the samples unfortunately hampers the proper
determination of the magnetic phase diagram of (U1-xThx)2Pt2In. Therefore, the results regarding
Th doping presented in this chapter, should be considered as preliminary and taken with caution.
Assuming that the atomic coordinates do not change with pressure, the isotropic
compressibility indicates that the primary effect of pressure is a uniform reduction of the
interatomic distances. Therefore, the hybridization matrices can be calculated for U2Pt2In under
pressure. The total hybridization Vcf increases about 2.3% from p=0 to p = 1.8 GPa. The
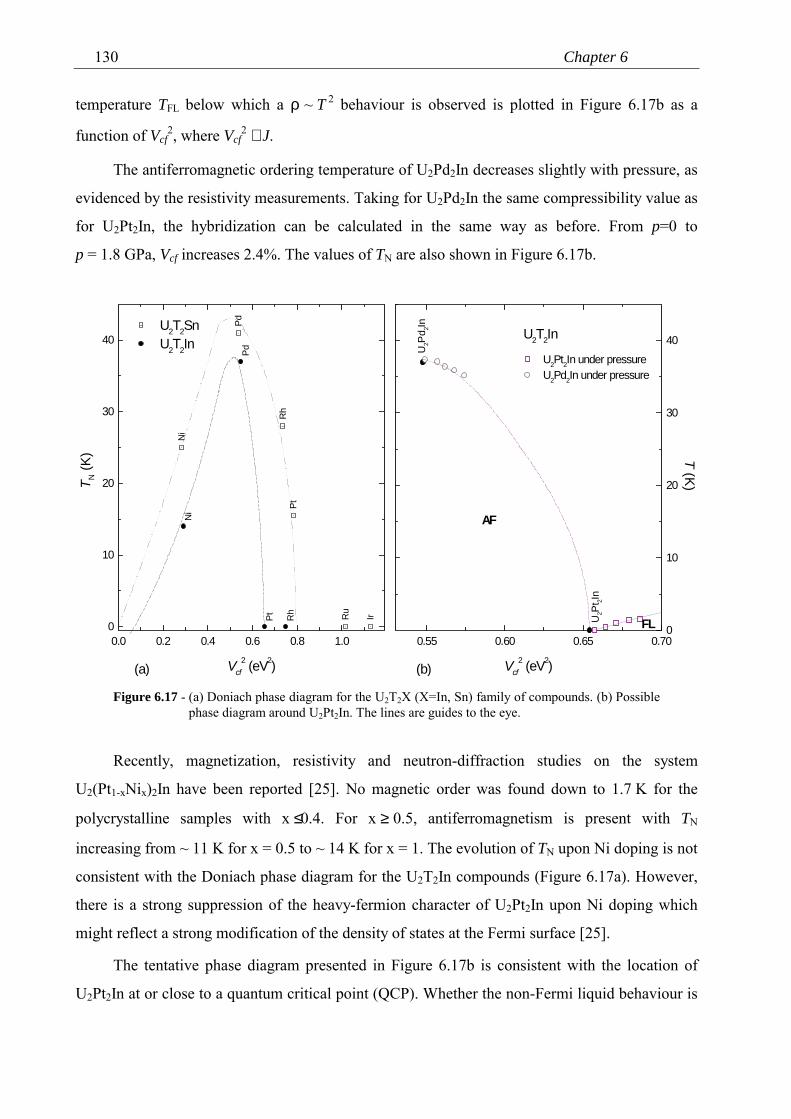
Chapter 6130
temperature TFL below which a ρ ~ T 2 behaviour is observed is plotted in Figure 6.17b as a
function of Vcf2, where Vcf
2 ∝ J.
The antiferromagnetic ordering temperature of U2Pd2In decreases slightly with pressure, as
evidenced by the resistivity measurements. Taking for U2Pd2In the same compressibility value as
for U2Pt2In, the hybridization can be calculated in the same way as before. From p=0 to
p = 1.8 GPa, Vcf increases 2.4%. The values of TN are also shown in Figure 6.17b.
0.55 0.60 0.65 0.700
10
20
30
40
U2P
d 2In
U2P
t 2In
(b)
AF
FL
U2Pt2In under pressure U2Pd2In under pressure
U2T2In
T(K)
Vcf2 (eV2)
0.0 0.2 0.4 0.6 0.8 1.00
10
20
30
40
Ni
Ru
Rh
Pd
Ir
Pt
Ni
Rh
Pd
Pt
(a)
U2T2Sn U2T2In
T N (K
)
Vcf2 (eV2)
Figure 6.17 - (a) Doniach phase diagram for the U2T2X (X=In, Sn) family of compounds. (b) Possiblephase diagram around U2Pt2In. The lines are guides to the eye.
Recently, magnetization, resistivity and neutron-diffraction studies on the system
U2(Pt1-xNix)2In have been reported [25]. No magnetic order was found down to 1.7 K for the
polycrystalline samples with x ≤ 0.4. For x ≥ 0.5, antiferromagnetism is present with TN
increasing from ~ 11 K for x = 0.5 to ~ 14 K for x = 1. The evolution of TN upon Ni doping is not
consistent with the Doniach phase diagram for the U2T2In compounds (Figure 6.17a). However,
there is a strong suppression of the heavy-fermion character of U2Pt2In upon Ni doping which
might reflect a strong modification of the density of states at the Fermi surface [25].
The tentative phase diagram presented in Figure 6.17b is consistent with the location of
U2Pt2In at or close to a quantum critical point (QCP). Whether the non-Fermi liquid behaviour is
Probing U2Pt2In in the Doniach phase diagram 131
present only at the QCP or for a finite region of J values around the QCP is a question that can
only be answered by a more thorough study of the phase diagram. This could be done by
investigating single-phase samples of (U1-xThx)2Pt2In or preferably U2(Pt1-xPdx)2In.
References1. T.T.M. Palstra, A.A. Menovsky and J.A. Mydosh, Phys. Rev. B 33 (1986) 6527.2. A. de Visser, A. Menovsky and J.J.M. Franse, Physica B 147 (1987) 81.3. L. Havela, V. Sechovský, P. Svoboda, H. Nakotte, K. Prokeš, F.R. de Boer, A. Seret, J.M.
Winand, J. Rebizant, J.C. Spirlet, A. Purwanto and R.A. Robinson, J. Magn. Magn. Mater.140-144 (1995) 1367.
4. L.C.J. Pereira, Ph.D. Thesis, University of Lisbon, 1998 (unpublished).5. A. Rosch, Physica B 280 (2000) 341.6. A. Yoshimori and H. Kasai, J. Magn. Magn. Mater. 31-34 (1983) 475.7. T. Kagayama and G. Oomi, in "Transport and Thermal Properties of f-Electron Systems" (G.
Oomi, H. Fujii and T. Fujita, eds.), Plenum Press, New York, 1993, p. 155.8. P. Estrela, T. Naka, A. de Visser, F.R. de Boer, L.C.J. Pereira and M. Almeida, Physica B
281-282 (2000) 381.9. A.M. Strydom and P. de V. du Plessis, Physica B 223-224 (1996) 222.10. A.M. Strydom and P. de V. du Plessis, Physica B 230-232 (1997) 62.11. P.H. Frings and J.J.M. Franse, J. Magn. Magn. Mater. 51 (1985) 141.12. L.C.J. Pereira, J.C. Waerenborgh, I. Catarino, G. Bonfait, M. Godinho and M. Almeida, J.
Alloys Compounds, in press.13. H. Nakotte, Ph.D. Thesis, University of Amsterdam, 1994 (unpublished).14. A. Schenck and F.N. Gygax, in "Handbook of Magnetic Materials" vol. 9 (K.H.J. Buschow,
ed.), Elsevier, Amsterdam, 1995, p. 57.15. A. Purwanto, R.A. Robinson, L. Havela, V. Sechovský, P. Svoboda, H. Nakotte, K. Prokeš,
F.R. de Boer, A. Seret, J.M. Winand, J. Rebizant and J.C. Spirlet, Phys. Rev. B 50 (1994)6792.
16. K. Prokeš, H. Nakotte, L. Havela, V. Sechovský, L.C.J. Pereira, C. Rijkeboer, A. Seret, J.C.Spirlet, P. Svoboda and F.R. de Boer, Physica B 223-224 (1996) 225.
17. J.A. Paixão, L.C.J. Pereira, P. Estrela, M. Godinho, M. Almeida, L. Paolasini, M. Bonnetand J. Rebizant, J. Phys.: Condens. Matter 11 (1999) 2115.
18. L. Havela, V. Sechovský, P. Svoboda, M. Diviš, H. Nakotte, K. Prokeš, F.R. de Boer, A.Purwanto, R.A. Robinson, A. Seret, J.M. Winand, J. Rebizant, J.C. Spirlet, M. Richter andH. Eschrig, J. Appl. Phys. 76 (1994) 6214.
19. L. Menon, P. de V. du Plessis and A.M. Strydom, Solid State Commun. 106 (1998) 519.
Chapter 6132
20. J.A. Paixão, G.H. Lander, P.J. Brown, H. Nakotte, F.R. de Boer and E. Brück, J. Phys.:Condens. Matter 4 (1992) 829.
21. L.C.J. Pereira, J.A. Paixão, P. Estrela, M. Godinho, F. Boudarot, M. Bonnet, J. Rebizant,J.C. Spirlet and M. Almeida, J. Phys.: Condens. Matter 8 (1996) 11167.
22. A. Domman, F. Hulliger, T. Siegrist and P. Fischer, J. Magn. Magn. Mater. 67 (1987) 323.23. A. Martin-Martin, L.C.J. Pereira, G.H. Lander, J. Rebizant, F. Wastin, J.C. Spirlet, P.
Dervenagas and P.J. Brown, Phys. Rev. B 59 (1999) 11818.24. H. Nakotte, A. Purwanto, R.A. Robinson, K. Prokeš, J.C.P. Klaasse, P.F. de Châtel, F.R. de
Boer, L. Havela, V. Sechovský, L.C. J. Pereira, A. Seret, J. Rebizant and J.C. Spirlet, Phys.Rev. B 53 (1996) 3263.
25. V.H. Tran, A. Hoser and M. Hofmann, J. Phys.: Condens. Matter 12 (2000) 1029.
Non-Fermi liquid behaviour in
other uranium compounds
In this chapter, the results are presented of the measurements of the thermal, magnetic and
transport properties of a few other uranium intermetallic compounds, which show non-Fermi
liquid behaviour (NFL) and/or quantum critical points.
The first compound is a stoichiometric one: U3Ni3Sn4. NFL behaviour is observed for
0.5 K < T < 5 K [1], while at lower temperatures the Fermi liquid (FL) state is attained [2]. Upon
applying pressure, the FL regime becomes more robust, as it is observed up to higher
temperatures [3]. As it will be shown, the data are consistent with the location of U3Ni3Sn4 close
to (but not at) an antiferromagnetic quantum critical point (QCP).
The second system is the pseudobinary series U(Pt1-xPdx)3. Pure UPt3 is an unconventional
superconductor. Upon alloying with Pd, superconductivity is suppressed and an
antiferromagnetic phase with "large" ordered moments is found for 0.006 < x < 0.1. At the
critical concentration xc = 0.006, both the superconducting and antiferromagnetic phase lines
meet at a (T = 0 K) QCP [4].
The last material is the system URh1-xNixAl. On the Ni-rich side of the magnetic phase
diagram antiferromagnetism exists, while the compounds with a low Ni content order
ferromagnetically. The antiferromagnetic and ferromagnetic phases meet at x = 2/3, where
magnetism vanishes and NFL properties are observed [5].
The experiments, of which the results are presented in this chapter, include:
Chapter 7134
- specific-heat measurements on U3Ni3Sn4 single crystals at 0.1 K ≤ T ≤ 5 K;
- muon spin relaxation experiments on U3Ni3Sn4 single crystals at 2 K ≤ T ≤ 10 K;
- resistivity measurements under hydrostatic pressures up to 1.8 GPa on U3Ni3Sn4 single crystals
at 0.3 K ≤ T ≤ 300 K;
- muon spin rotation experiments on polycrystalline samples of U(Pt1-xPdx)3 with x = 0.007,
0.008 and 0.009 in a transverse field of 0.01 T at 0.04 K ≤ T ≤ 2 K;
- resistivity measurements on a polycrystalline sample of URh1/3Ni2/3Al at 0.05 K ≤ T ≤ 300 K.
These results have been published [1,2,5] or are submitted for publication [3,4]. In this
chapter, these papers are partially reproduced.
7.1. U3Ni3Sn4
7.1.1. Non-Fermi liquid behaviour in U3Ni3Sn4
The ternary U3T3Sn4 compounds (where T = Ni, Cu, Pt, Au) crystallize in the cubic
Y3Au3Sb4-type structure (space group I 4 3d) which is a filled variant of the Th3P4-type [6]. The
key feature of this system is that the 5f-hybridization of the U atoms can be systematically
increased by adding relatively small transition element atoms into voids in the Th3P4-type
structure [6]. Indeed, different magnetic ground states (paramagnetism and weak magnetic order)
can be found in the U3T3Sn4 family of compounds, including several that exhibit heavy-fermion
(HF) behaviour. Only the Cu variant orders magnetically (antiferromagnet at TN = 12 K) while
the other analogues are paramagnetic [7]. Of special interest are the striking departures from the
standard FL theory of metals observed in nominally stoichiometric U3Ni3Sn4 single crystals [1].
The magnetic, transport and specific-heat properties of U3Ni3Sn4 are consistent with recent
theoretical models based upon classical fluctuations near an antiferromagnetic QCP
Single crystals of U3Ni3Sn4 and U3Cu3Sn4 were grown by the Kyropoulos technique from
the top of the melt by means of a cooled-seed crystal holder. Bulk charges were first prepared by
induction melting with 3:3:4 atomic ratios of pure U (depleted), Ni or Cu, and Sn, respectively,
each of at least 99.9% purity. Finally single-crystalline samples of U3Ni3Sn4 and U3Cu3Sn4 were
Non-Fermi liquid behaviour in other uranium compounds 135
grown by slowly cooling a semi-levitated melt of the bulk charges in a cold crucible using an
induction furnace. The rate of cooling was approximately 40°C/h between 1600-1400°C and
50°C/h between 1400-800°C. The obtained solid products were about 2-2.5 cm in diameter, and
consisted of many crystalline grains, from which single-crystals with dimensions ranging from
0.5 to 2 mm3 were extracted.
Single-crystal X-ray diffraction (XRD) data, collected at room temperature, are consistent
with the cubic space-group I 4 3d. The unit-cell parameters of U3Ni3Sn4 and U3Cu3Sn4 are
9.3524(5) Å and 9.4956(5) Å, respectively.
Previously the heat capacity of a U3Ni3Sn4 single crystal [1] in the temperature interval
0.3-5 K was described using the expression:
230
−+β+α−γ= DTTTTc )( , (7.1)
where cE = (γ0 - α√T)T is the electronic contribution, cL = βT 3 the lattice contribution, and
cN = D/T 2 represents the high-temperature form of a nuclear Schottky term [10]. The best-fit
coefficients obtained were γ0 = 0.124 J/molUK2, α = 0.0151 J/molUK2.5, β = 2.07 x 10⁻³ J/molUK4
and D = 4.62 x 10⁻⁴ JK/molU. From the value of β we estimated a Debye temperature
θD ≈ 210 K [1]. This description is in agreement with a renormalization group theory [8], which
predicts γ ∼ γ0 - α√T near a zero-temperature antiferromagnetic instability (NFL behaviour). A
non-universal scale factor T0 ≈ 10 K was estimated using the fitted value of
α = (15/64)kBNAN[2/πT0]3/2ξ (5/2) [11]. This value of T0 corresponds very well with the onset
temperature of the non-analytic behaviour of the magnetic susceptibility and resistivity.
Alternatively, recent experimental [12] and theoretical [13] work proposes that NFL
behaviour might be caused by a competition between RKKY and Kondo interactions in the
presence of atomic disorder leading to a Griffiths phase (large magnetic clusters) close to a QCP.
We found that the NFL behaviour of nominally stoichiometric U3Ni3Sn4 single-crystals can also
be described by a divergent power law predicted by this model, i.e., c(T)/T ∝ χ(T) ∝ T -1+λ with
λ = 0.7 [1]. The best-fit coefficients yielded electronic, lattice and nuclear contributions that
differ by only a few percent from those obtained using the renormalization group theory form of
Equation 7.1.
New heat capacity data spanning the temperature interval 0.1-300 K for a U3Ni3Sn4 single-
crystal are presented in Figure 7.1. A 3He/4He dilution refrigerator was used for attaining
temperatures down to 0.1 K, while the high temperature data were obtained in a standard 4He
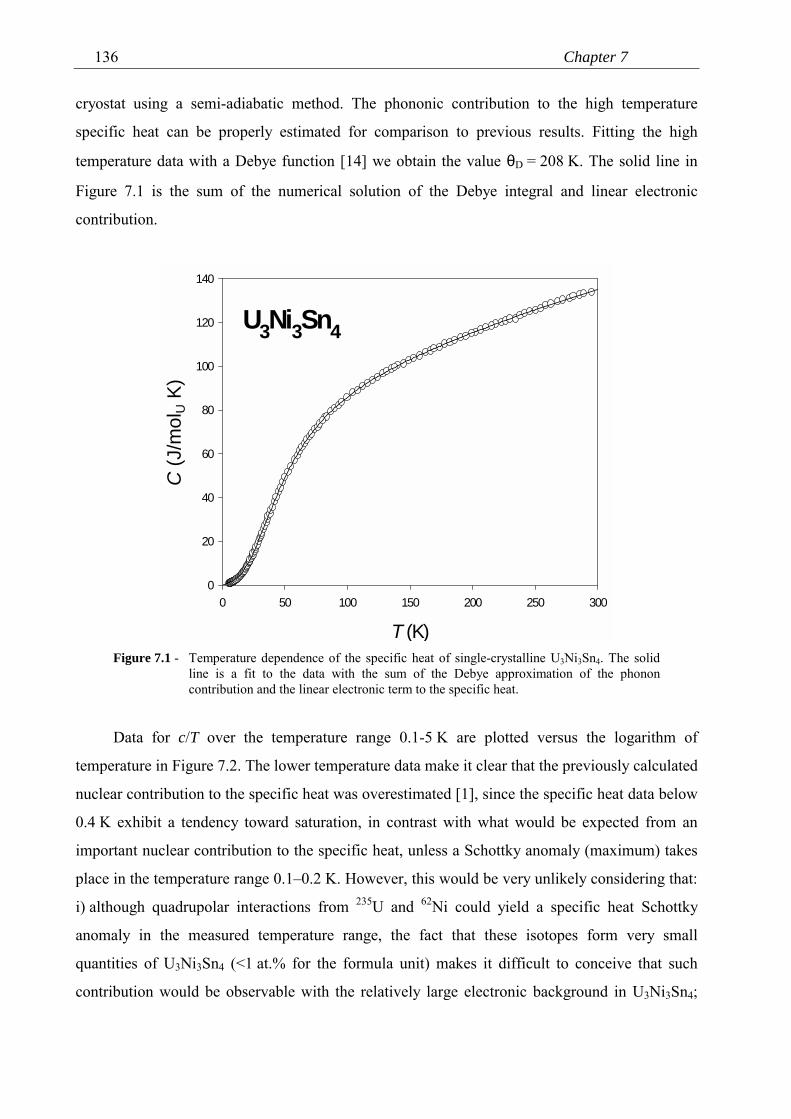
Chapter 7136
cryostat using a semi-adiabatic method. The phononic contribution to the high temperature
specific heat can be properly estimated for comparison to previous results. Fitting the high
temperature data with a Debye function [14] we obtain the value θD = 208 K. The solid line in
Figure 7.1 is the sum of the numerical solution of the Debye integral and linear electronic
contribution.
U3Ni3Sn4
T (K)0 50 100 150 200 250 300
C (J
/mol
U K
)
0
20
40
60
80
100
120
140
Figure 7.1 - Temperature dependence of the specific heat of single-crystalline U3Ni3Sn4. The solidline is a fit to the data with the sum of the Debye approximation of the phononcontribution and the linear electronic term to the specific heat.
Data for c/T over the temperature range 0.1-5 K are plotted versus the logarithm of
temperature in Figure 7.2. The lower temperature data make it clear that the previously calculated
nuclear contribution to the specific heat was overestimated [1], since the specific heat data below
0.4 K exhibit a tendency toward saturation, in contrast with what would be expected from an
important nuclear contribution to the specific heat, unless a Schottky anomaly (maximum) takes
place in the temperature range 0.1–0.2 K. However, this would be very unlikely considering that:
i) although quadrupolar interactions from 235U and 62Ni could yield a specific heat Schottky
anomaly in the measured temperature range, the fact that these isotopes form very small
quantities of U3Ni3Sn4 (<1 at.% for the formula unit) makes it difficult to conceive that such
contribution would be observable with the relatively large electronic background in U3Ni3Sn4;
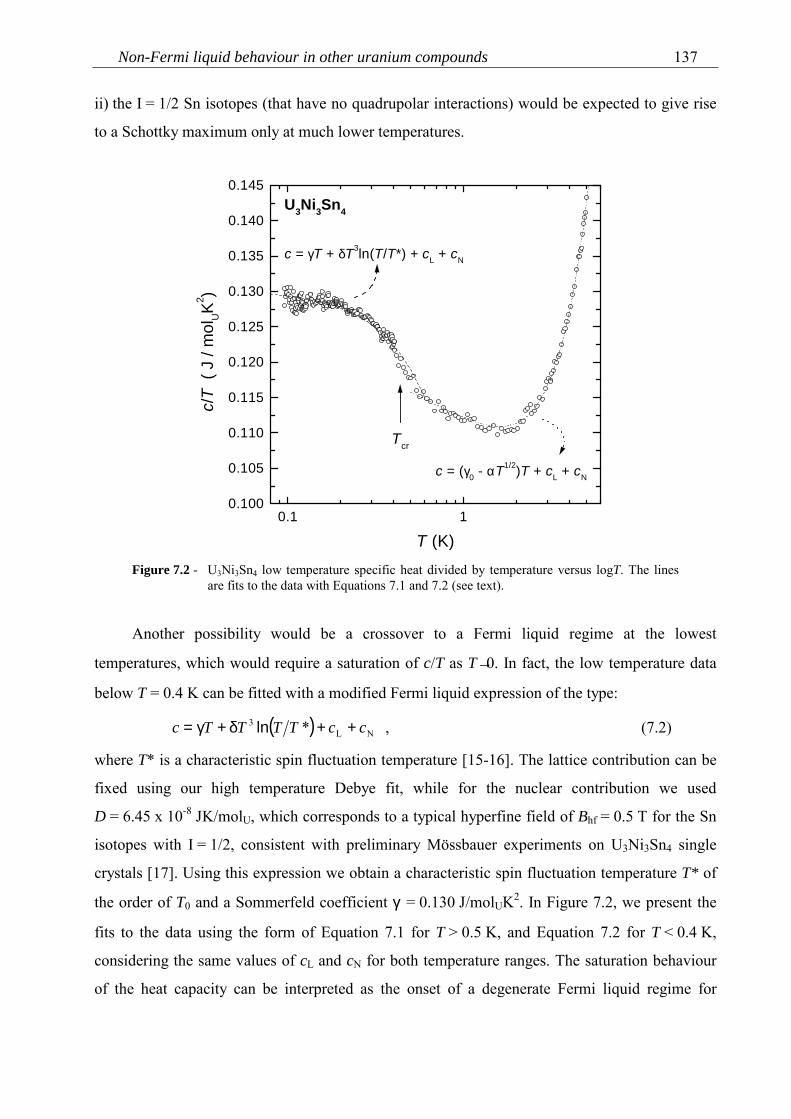
Non-Fermi liquid behaviour in other uranium compounds 137
ii) the I = 1/2 Sn isotopes (that have no quadrupolar interactions) would be expected to give rise
to a Schottky maximum only at much lower temperatures.
0.1 10.100
0.105
0.110
0.115
0.120
0.125
0.130
0.135
0.140
0.145U3Ni3Sn4
Tcr
c = γT + δT3ln(T/T*) + cL + cN
c = (γ0 - αT1/2)T + cL + cN
c/T
( J
/ mol
UK2 )
T (K)Figure 7.2 - U3Ni3Sn4 low temperature specific heat divided by temperature versus logT. The lines
are fits to the data with Equations 7.1 and 7.2 (see text).
Another possibility would be a crossover to a Fermi liquid regime at the lowest
temperatures, which would require a saturation of c/T as T→0. In fact, the low temperature data
below T = 0.4 K can be fitted with a modified Fermi liquid expression of the type:
( ) NL3 * ccTTTTc ++δ+γ= ln , (7.2)
where T* is a characteristic spin fluctuation temperature [15-16]. The lattice contribution can be
fixed using our high temperature Debye fit, while for the nuclear contribution we used
D = 6.45 x 10⁻⁸ JK/molU, which corresponds to a typical hyperfine field of Bhf = 0.5 T for the Sn
isotopes with I = 1/2, consistent with preliminary Mössbauer experiments on U3Ni3Sn4 single
crystals [17]. Using this expression we obtain a characteristic spin fluctuation temperature T* of
the order of T0 and a Sommerfeld coefficient γ = 0.130 J/molUK2. In Figure 7.2, we present the
fits to the data using the form of Equation 7.1 for T > 0.5 K, and Equation 7.2 for T < 0.4 K,
considering the same values of cL and cN for both temperature ranges. The saturation behaviour
of the heat capacity can be interpreted as the onset of a degenerate Fermi liquid regime for
Chapter 7138
T << 0.5 K. Defining Tcr as a crossover temperature to a Fermi liquid state, i.e. the temperature
below which Equation 7.2 applies, we obtain Tcr = 0.40(2) K. With this reduced nuclear
contribution Equation 7.1 only holds down to T ~ 0.5 K, which means that there is a crossover
region in the temperature range 0.4-0.5 K separating a non-Fermi liquid to a Fermi liquid regime.
An assessment of the potential existence of a Schottky term in the specific heat can only be
made by studying the effect of a magnetic field, or the acquisition of data for T < 0.1 K.
We have characterized the heat capacity, microstructure and crystal structure of U3Ni3Sn4
and U3Cu3Sn4 single-crystals. U3Cu3Sn4 is a heavy-fermion antiferromagnet while nominally
stoichiometric U3Ni3Sn4 is a nearly magnetic NFL compound.
We find that satisfactory fits of the heat capacity data for U3Ni3Sn4 in the temperature
range 0.5-5 K always require a dominant electronic term which exhibits a near-square-root
temperature dependence, consistent with a theoretical model for NFL systems near a zero-
temperature quantum transition from magnetic to non-magnetic states [8] or an alternative
Griffiths phase model [13]. It should be noted that the renormalization group theory treatment
does not include the effects of disorder, which must be present in real systems to some degree,
while the Griffiths phase model includes disorder as a crucial ingredient.
Previously we have undertaken a thorough analysis of the heat capacity and susceptibility
of nominally stoichiometric U3Ni3Sn4 [1], and conclude that several NFL models (e.g.
multichannel Kondo [18] and Kondo disorder [19]) commonly considered in the contemporary
literature do not describe the entire data set known for this material. All attempts to include a
logarithmic heat capacity term resulted in an unphysically high characteristic temperature scale
T0 [1]. On the other hand, the scaling temperature T0 ≈ 10 K, obtained from low temperature
analysis based on renormalization group theory, is consistent with the onset of the non-analytic
behaviour of physical properties in this material. Having extended heat capacity measurements to
the lower temperatures we found a crossover to a Fermi liquid state below 0.4 K described by a
T 3lnT term to the specific heat, characteristic of spin fluctuation phenomena. The crossover to a
Fermi liquid state is a characteristic of NFL materials that are imprecisely tuned to a QCP [8],
due to unfavourable conditions of a control parameter such as pressure, magnetic field,
composition or atomic disorder. In the case of nominally stoichiometric U3Ni3Sn4, such a non-
thermal critical parameter might be vacancy doping which governs the degree of spd-f
hybridization leading to competition between NFL-FL states. On the other hand, a possible
marginal Fermi liquid ground state can not be ruled out. The precise role of small amounts of
Non-Fermi liquid behaviour in other uranium compounds 139
disorder detected by XRD analysis in nominally stoichiometric U3Ni3Sn4 single crystals [1] must
be investigated by further studies of carefully characterized samples.
The moderate size of the Sommerfeld coefficient γ ~ 0.130 J/molUK2 and reduction of
µeff = 2.0 µB/U [1] from 3.62 or 3.58 µB expected for U3+ or U4+ free ions, respectively suggest
significant hybridization between 5f and itinerant electron states takes place in U3Ni3Sn4. The
replacement of the Ni atoms by Cu gives rise to an increase in the number of 3d electrons,
leading to a dehybridization of the 5f states with the 3d band. This is consistent with the observed
lattice expansion on replacing Ni (a = 9.3524(5) Å) with Cu (a = 9.4956(5) Å), the increase of γ
by a factor of about 3, and development of antiferromagnetism below 14 K in U3Cu3Sn4 with an
effective magnetic moment µeff = 3.3 µB/U, corresponding to either a 5f 2 or 5f 3 uranium
configuration. The apparent variation in 5f hybridization with transition element substitution, the
crossover from a Fermi liquid ground state in U3Ni3Sn4 to weak antiferromagnetism with
TN = 14 K in U3Cu3Sn4, and the observation of NFL properties in U3Ni3Sn4 for the temperature
range 0.5-5 K, imply that a QCP should exist in this series of materials over some range of
composition and/or pressure in the vicinity of stoichiometric U3Ni3Sn4.
7.1.2. Recovery of the Fermi liquid state in U3Ni3Sn4 under pressure
The specific heat of single-crystalline U3Ni3Sn4 shows a temperature dependence of the
type c/T ~ γ0-αT 1/2 in the temperature interval 0.5-5 K [1,2]. This is consistent with theoretical
models for NFL systems near a zero-temperature antiferromagnetic (AF) QCP [8,9]. Below about
0.4 K, there is a crossover to a FL state [2]. It is interesting to compare U3Ni3Sn4 with U3Cu3Sn4.
The latter compound is an antiferromagnet with TN = 14 K [2]. Replacement of Ni by Cu results
in an increase of the number of 3d electrons, leading to a decrease of the hybridization of the 5f-
states with the 3d-band. The hybridization change across the U3(Ni,Cu)3Sn4 series, namely the
crossover from a FL ground state in U3Ni3Sn4 to weak antiferromagnetism in U3Cu3Sn4, together
with the observation of a NFL region in U3Ni3Sn4 suggests that a QCP may exist in this series of
compounds.
In order to confirm the absence of magnetic order in U3Ni3Sn4, zero-field muon spin
relaxation (µSR) experiments were carried out on single-crystalline samples at 2 K and 10 K in
the general purpose spectrometer (GPS) of the Paul Scherrer Institute (Switzerland). Best fits to
Chapter 7140
the spectra were obtained by a depolarization function consisting of a single Gaussian
component. The depolarization rate obtained at 10 K is ∆G = 0.044(3) µs-1. This small value of ∆
can be attributed to a random distribution of the Sn nuclei with spin I = ½ and magnetic moment
µ = 1.0 µN. At 2 K, the depolarization rate slightly increases to ∆G = 0.061(2) µs-1. This small
increase, if significant, could be attributed to the presence of spin fluctuations in the system
associated with the NFL behaviour observed in the specific heat below 5 K. No static magnetic
order has been detected in these µSR experiments.
Resistivity measurements were performed on a bar-shaped single crystal of U3Ni3Sn4 under
hydrostatic pressures up to 1.8 GPa in the temperature range 0.3-300 K. A CuBe piston clamp
cell was used with Fluorinert acting as pressure transmitting medium. The pressure values here
presented were corrected for an empirical efficiency of 80%. The resistivity was measured using
a standard a.c. 4-probe method. Since the crystallographic structure of U3Ni3Sn4 is cubic, the
resistivity should be isotropic. Therefore, the current was applied along an arbitrary direction.
The low-temperature (T < 10 K) resistivity curves at p = 0, 0.6 GPa and 1.8 GPa are shown
in Figure 7.3. At ambient pressure, the resistivity increases slowly as temperature is decreased
below room temperature (RT), reaching a maximum value at Tmax ~ 240 K. Below this
temperature the resistivity decreases and coherent scattering sets in at lower temperatures. A low
residual-resistivity value of ρ0 = 6 µΩcm is attained, indicating that the single crystal is relatively
clean (RRR ≡ ρRT/ρ0 ≈ 60).
In order to account for possible changes in the distance between the voltage contacts upon
applying pressure, ρRT was assumed to be pressure independent. This assumption is supported by
the resulting negligible pressure dependence of ρ0. Pressure has the effect of reducing the
resistivity values. At the lowest temperatures, a tendency to FL-like behaviour ρ ~ T 2 is clearly
observed (Figure 7.3)
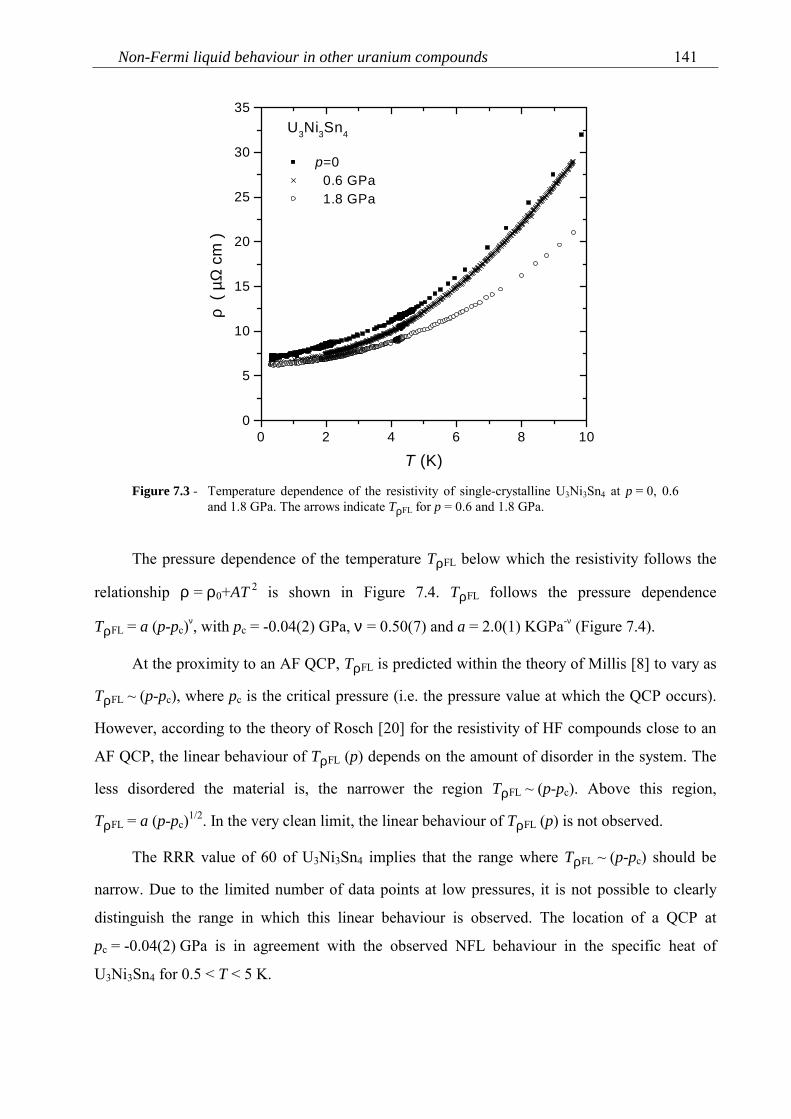
Non-Fermi liquid behaviour in other uranium compounds 141
0 2 4 6 8 100
5
10
15
20
25
30
35U3Ni3Sn4
ρ (
µΩ c
m )
T (K)
p=0 0.6 GPa 1.8 GPa
Figure 7.3 - Temperature dependence of the resistivity of single-crystalline U3Ni3Sn4 at p = 0, 0.6and 1.8 GPa. The arrows indicate TρFL for p = 0.6 and 1.8 GPa.
The pressure dependence of the temperature TρFL below which the resistivity follows the
relationship ρ = ρ0+AT 2 is shown in Figure 7.4. TρFL follows the pressure dependence
TρFL = a (p-pc)ν, with pc = -0.04(2) GPa, ν = 0.50(7) and a = 2.0(1) KGPa-ν (Figure 7.4).
At the proximity to an AF QCP, TρFL is predicted within the theory of Millis [8] to vary as
TρFL ~ (p-pc), where pc is the critical pressure (i.e. the pressure value at which the QCP occurs).
However, according to the theory of Rosch [20] for the resistivity of HF compounds close to an
AF QCP, the linear behaviour of TρFL (p) depends on the amount of disorder in the system. The
less disordered the material is, the narrower the region TρFL ~ (p-pc). Above this region,
TρFL = a (p-pc)1/2. In the very clean limit, the linear behaviour of TρFL (p) is not observed.
The RRR value of 60 of U3Ni3Sn4 implies that the range where TρFL ~ (p-pc) should be
narrow. Due to the limited number of data points at low pressures, it is not possible to clearly
distinguish the range in which this linear behaviour is observed. The location of a QCP at
pc = -0.04(2) GPa is in agreement with the observed NFL behaviour in the specific heat of
U3Ni3Sn4 for 0.5 < T < 5 K.
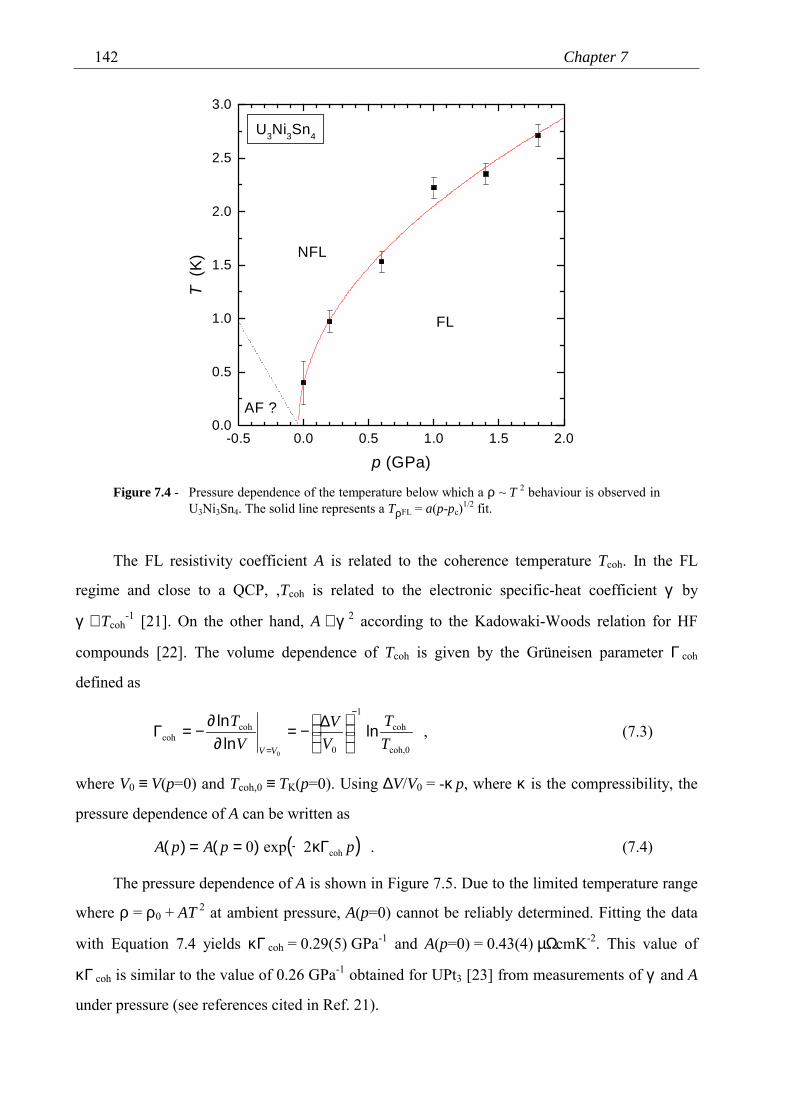
Chapter 7142
-0.5 0.0 0.5 1.0 1.5 2.00.0
0.5
1.0
1.5
2.0
2.5
3.0
AF ?
NFL
U3Ni3Sn4
FL
T (K
)
p (GPa)
Figure 7.4 - Pressure dependence of the temperature below which a ρ ~ T 2 behaviour is observed inU3Ni3Sn4. The solid line represents a TρFL = a(p-pc)1/2 fit.
The FL resistivity coefficient A is related to the coherence temperature Tcoh. In the FL
regime and close to a QCP, ,Tcoh is related to the electronic specific-heat coefficient γ by
γ ∝ Tcoh-1 [21]. On the other hand, A ∝ γ 2 according to the Kadowaki-Woods relation for HF
compounds [22]. The volume dependence of Tcoh is given by the Grüneisen parameter Γ coh
defined as
coh,0
coh
1
0
cohcoh
0TT
VV
VT
VV
lnln
ln−
=
∆−=∂
∂−=Γ , (7.3)
where V0 ≡ V(p=0) and Tcoh,0 ≡ TK(p=0). Using ∆V/V0 = -κ p, where κ is the compressibility, the
pressure dependence of A can be written as
( )ppApA coh2exp0 Γκ−== )()( . (7.4)
The pressure dependence of A is shown in Figure 7.5. Due to the limited temperature range
where ρ = ρ0 + AT 2 at ambient pressure, A(p=0) cannot be reliably determined. Fitting the data
with Equation 7.4 yields κΓ coh = 0.29(5) GPa-1 and A(p=0) = 0.43(4) µΩcmK-2. This value of
κΓ coh is similar to the value of 0.26 GPa-1 obtained for UPt3 [23] from measurements of γ and A
under pressure (see references cited in Ref. 21).
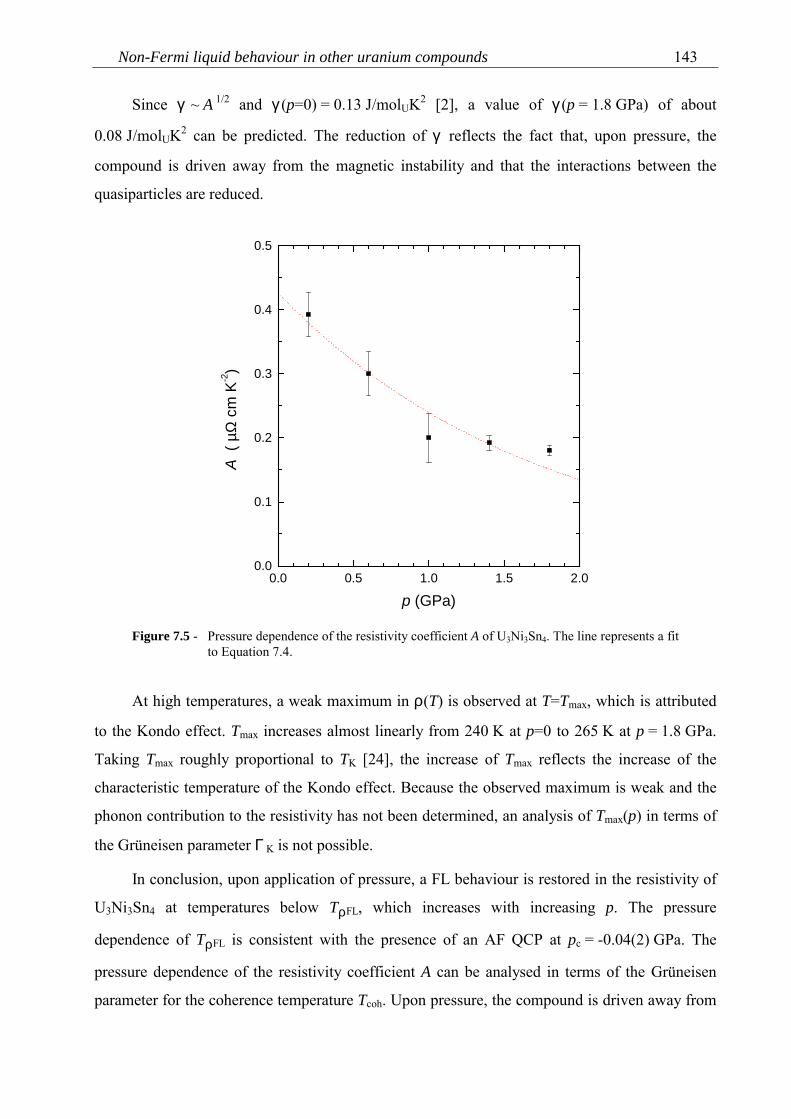
Non-Fermi liquid behaviour in other uranium compounds 143
Since γ ~ A 1/2 and γ(p=0) = 0.13 J/molUK2 [2], a value of γ(p = 1.8 GPa) of about
0.08 J/molUK2 can be predicted. The reduction of γ reflects the fact that, upon pressure, the
compound is driven away from the magnetic instability and that the interactions between the
quasiparticles are reduced.
0.0 0.5 1.0 1.5 2.00.0
0.1
0.2
0.3
0.4
0.5A
( µΩ
cm
K-2)
p (GPa)
Figure 7.5 - Pressure dependence of the resistivity coefficient A of U3Ni3Sn4. The line represents a fitto Equation 7.4.
At high temperatures, a weak maximum in ρ(T) is observed at T=Tmax, which is attributed
to the Kondo effect. Tmax increases almost linearly from 240 K at p=0 to 265 K at p = 1.8 GPa.
Taking Tmax roughly proportional to TK [24], the increase of Tmax reflects the increase of the
characteristic temperature of the Kondo effect. Because the observed maximum is weak and the
phonon contribution to the resistivity has not been determined, an analysis of Tmax(p) in terms of
the Grüneisen parameter Γ K is not possible.
In conclusion, upon application of pressure, a FL behaviour is restored in the resistivity of
U3Ni3Sn4 at temperatures below TρFL, which increases with increasing p. The pressure
dependence of TρFL is consistent with the presence of an AF QCP at pc = -0.04(2) GPa. The
pressure dependence of the resistivity coefficient A can be analysed in terms of the Grüneisen
parameter for the coherence temperature Tcoh. Upon pressure, the compound is driven away from
Chapter 7144
the QCP and the increase of Tcoh is reflected in a decrease of A. Also TK, being related to Tcoh,
increases upon pressure. The increase of TK is seen in the increase of the temperature at which
ρ(T) reaches a maximum. The NFL behaviour observed at ambient pressure at temperatures
above the FL regime in U3Ni3Sn4 is a direct consequence of its proximity to a QCP.
7.2. Magnetic quantum critical point and superconductivity in
U(Pt1-xPdx)3
For more than a decade now it has been recognized that superconductivity (SC) and
magnetism are intimately related in strongly correlated systems, such as the high-Tc cuprates,
heavy-fermion materials and organic superconductors [25]. One of the key issues is to identify
the nature of the attractive interaction for Cooper pairing. In conventional s-wave
superconductors Cooper pairing is mediated by phonons. In strongly correlated electron systems
magnetic interactions suppress s-wave SC, and therefore it has been proposed that SC is
unconventional and mediated by spin fluctuations [26,27]. Compelling evidence for spin-
fluctuation mediated SC [28] has recently been obtained for the magnetically ordered heavy-
fermion materials CePd2Si2 and CeIn3. By tuning these materials towards a magnetic quantum
critical point (the Néel temperature TN→0 K), by the application of mechanical pressure, a SC
phase appeared.
The heavy-fermion superconductor UPt3 (Tc ~ 0.5 K) has become an exemplary system to
study unconventional SC [25,29]. Because of the unusual coexistence of SC and ferromagnetic
(FM) spin fluctuations, the latter signalled by a pronounced T 3lnT contribution to the low-
temperature specific heat [30,31], it has been argued that UPt3 is an odd-parity spin-fluctuation
mediated superconductor [31,32], in close analogy with superfluidity in 3He. The thermodynamic
properties and multicomponent SC phase diagram can only be explained by Ginzburg-Landau
models, based on an unconventional SC order parameter [29,33-35]. Much attention has been
devoted to models where a symmetry-breaking field (SBF) lifts the (spin) degeneracy of the 2D
(or 1D) order parameter, which results in a splitting ∆Tc = Tc+-Tc
- of the SC phase transition
[33-35]. Experimental evidence [36] has been put forward that the SBF is provided by small-
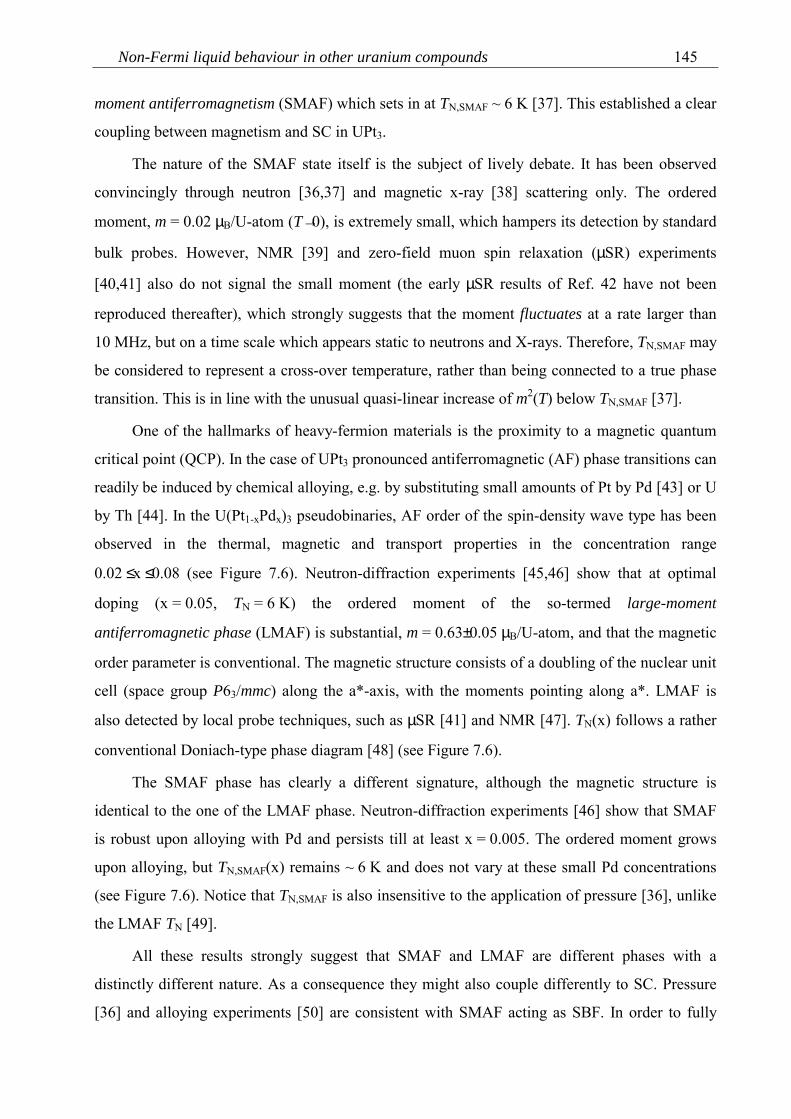
Non-Fermi liquid behaviour in other uranium compounds 145
moment antiferromagnetism (SMAF) which sets in at TN,SMAF ~ 6 K [37]. This established a clear
coupling between magnetism and SC in UPt3.
The nature of the SMAF state itself is the subject of lively debate. It has been observed
convincingly through neutron [36,37] and magnetic x-ray [38] scattering only. The ordered
moment, m = 0.02 µB/U-atom (T→0), is extremely small, which hampers its detection by standard
bulk probes. However, NMR [39] and zero-field muon spin relaxation (µSR) experiments
[40,41] also do not signal the small moment (the early µSR results of Ref. 42 have not been
reproduced thereafter), which strongly suggests that the moment fluctuates at a rate larger than
10 MHz, but on a time scale which appears static to neutrons and X-rays. Therefore, TN,SMAF may
be considered to represent a cross-over temperature, rather than being connected to a true phase
transition. This is in line with the unusual quasi-linear increase of m2(T) below TN,SMAF [37].
One of the hallmarks of heavy-fermion materials is the proximity to a magnetic quantum
critical point (QCP). In the case of UPt3 pronounced antiferromagnetic (AF) phase transitions can
readily be induced by chemical alloying, e.g. by substituting small amounts of Pt by Pd [43] or U
by Th [44]. In the U(Pt1-xPdx)3 pseudobinaries, AF order of the spin-density wave type has been
observed in the thermal, magnetic and transport properties in the concentration range
0.02 ≤ x ≤ 0.08 (see Figure 7.6). Neutron-diffraction experiments [45,46] show that at optimal
doping (x = 0.05, TN = 6 K) the ordered moment of the so-termed large-moment
antiferromagnetic phase (LMAF) is substantial, m = 0.63±0.05 µB/U-atom, and that the magnetic
order parameter is conventional. The magnetic structure consists of a doubling of the nuclear unit
cell (space group P63/mmc) along the a*-axis, with the moments pointing along a*. LMAF is
also detected by local probe techniques, such as µSR [41] and NMR [47]. TN(x) follows a rather
conventional Doniach-type phase diagram [48] (see Figure 7.6).
The SMAF phase has clearly a different signature, although the magnetic structure is
identical to the one of the LMAF phase. Neutron-diffraction experiments [46] show that SMAF
is robust upon alloying with Pd and persists till at least x = 0.005. The ordered moment grows
upon alloying, but TN,SMAF(x) remains ~ 6 K and does not vary at these small Pd concentrations
(see Figure 7.6). Notice that TN,SMAF is also insensitive to the application of pressure [36], unlike
the LMAF TN [49].
All these results strongly suggest that SMAF and LMAF are different phases with a
distinctly different nature. As a consequence they might also couple differently to SC. Pressure
[36] and alloying experiments [50] are consistent with SMAF acting as SBF. In order to fully
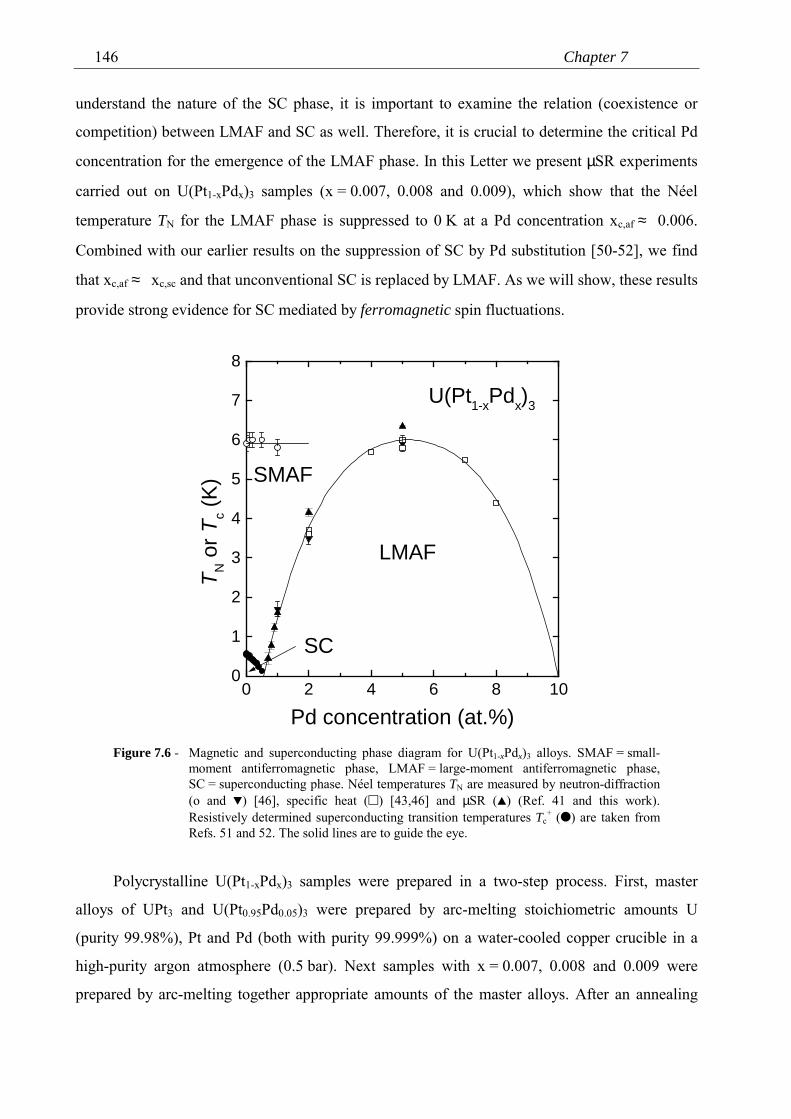
Chapter 7146
understand the nature of the SC phase, it is important to examine the relation (coexistence or
competition) between LMAF and SC as well. Therefore, it is crucial to determine the critical Pd
concentration for the emergence of the LMAF phase. In this Letter we present µSR experiments
carried out on U(Pt1-xPdx)3 samples (x = 0.007, 0.008 and 0.009), which show that the Néel
temperature TN for the LMAF phase is suppressed to 0 K at a Pd concentration xc,af ≈ 0.006.
Combined with our earlier results on the suppression of SC by Pd substitution [50-52], we find
that xc,af ≈ xc,sc and that unconventional SC is replaced by LMAF. As we will show, these results
provide strong evidence for SC mediated by ferromagnetic spin fluctuations.
0 2 4 6 8 100
1
2
3
4
5
6
7
8
SC
U(Pt1-xPdx)3
SMAF
LMAF
T N o
r Tc (
K)
Pd concentration (at.%)Figure 7.6 - Magnetic and superconducting phase diagram for U(Pt1-xPdx)3 alloys. SMAF = small-
moment antiferromagnetic phase, LMAF = large-moment antiferromagnetic phase,SC = superconducting phase. Néel temperatures TN are measured by neutron-diffraction(o and ) [46], specific heat () [43,46] and µSR () (Ref. 41 and this work).Resistively determined superconducting transition temperatures Tc
+ () are taken fromRefs. 51 and 52. The solid lines are to guide the eye.
Polycrystalline U(Pt1-xPdx)3 samples were prepared in a two-step process. First, master
alloys of UPt3 and U(Pt0.95Pd0.05)3 were prepared by arc-melting stoichiometric amounts U
(purity 99.98%), Pt and Pd (both with purity 99.999%) on a water-cooled copper crucible in a
high-purity argon atmosphere (0.5 bar). Next samples with x = 0.007, 0.008 and 0.009 were
prepared by arc-melting together appropriate amounts of the master alloys. After an annealing
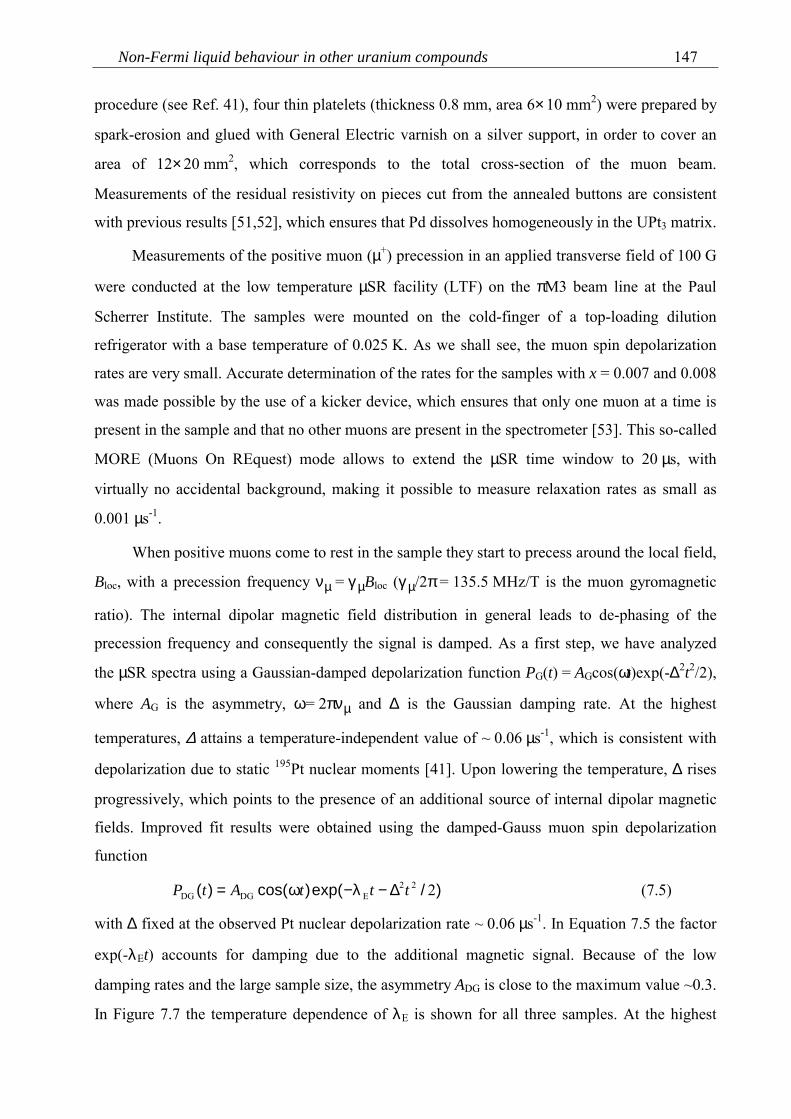
Non-Fermi liquid behaviour in other uranium compounds 147
procedure (see Ref. 41), four thin platelets (thickness 0.8 mm, area 6×10 mm2) were prepared by
spark-erosion and glued with General Electric varnish on a silver support, in order to cover an
area of 12×20 mm2, which corresponds to the total cross-section of the muon beam.
Measurements of the residual resistivity on pieces cut from the annealed buttons are consistent
with previous results [51,52], which ensures that Pd dissolves homogeneously in the UPt3 matrix.
Measurements of the positive muon (µ+) precession in an applied transverse field of 100 G
were conducted at the low temperature µSR facility (LTF) on the πM3 beam line at the Paul
Scherrer Institute. The samples were mounted on the cold-finger of a top-loading dilution
refrigerator with a base temperature of 0.025 K. As we shall see, the muon spin depolarization
rates are very small. Accurate determination of the rates for the samples with x = 0.007 and 0.008
was made possible by the use of a kicker device, which ensures that only one muon at a time is
present in the sample and that no other muons are present in the spectrometer [53]. This so-called
MORE (Muons On REquest) mode allows to extend the µSR time window to 20 µs, with
virtually no accidental background, making it possible to measure relaxation rates as small as
0.001 µs-1.
When positive muons come to rest in the sample they start to precess around the local field,
Bloc, with a precession frequency νµ = γµBloc (γµ/2π = 135.5 MHz/T is the muon gyromagnetic
ratio). The internal dipolar magnetic field distribution in general leads to de-phasing of the
precession frequency and consequently the signal is damped. As a first step, we have analyzed
the µSR spectra using a Gaussian-damped depolarization function PG(t) = AGcos(ωt)exp(-∆2t2/2),
where AG is the asymmetry, ω = 2πνµ and ∆ is the Gaussian damping rate. At the highest
temperatures, ∆ attains a temperature-independent value of ~ 0.06 µs-1, which is consistent with
depolarization due to static 195Pt nuclear moments [41]. Upon lowering the temperature, ∆ rises
progressively, which points to the presence of an additional source of internal dipolar magnetic
fields. Improved fit results were obtained using the damped-Gauss muon spin depolarization
function
)/exp()cos()( 222EDGDG tttAtP ∆−λ−ω= (7.5)
with ∆ fixed at the observed Pt nuclear depolarization rate ~ 0.06 µs-1. In Equation 7.5 the factor
exp(-λEt) accounts for damping due to the additional magnetic signal. Because of the low
damping rates and the large sample size, the asymmetry ADG is close to the maximum value ~0.3.
In Figure 7.7 the temperature dependence of λE is shown for all three samples. At the highest
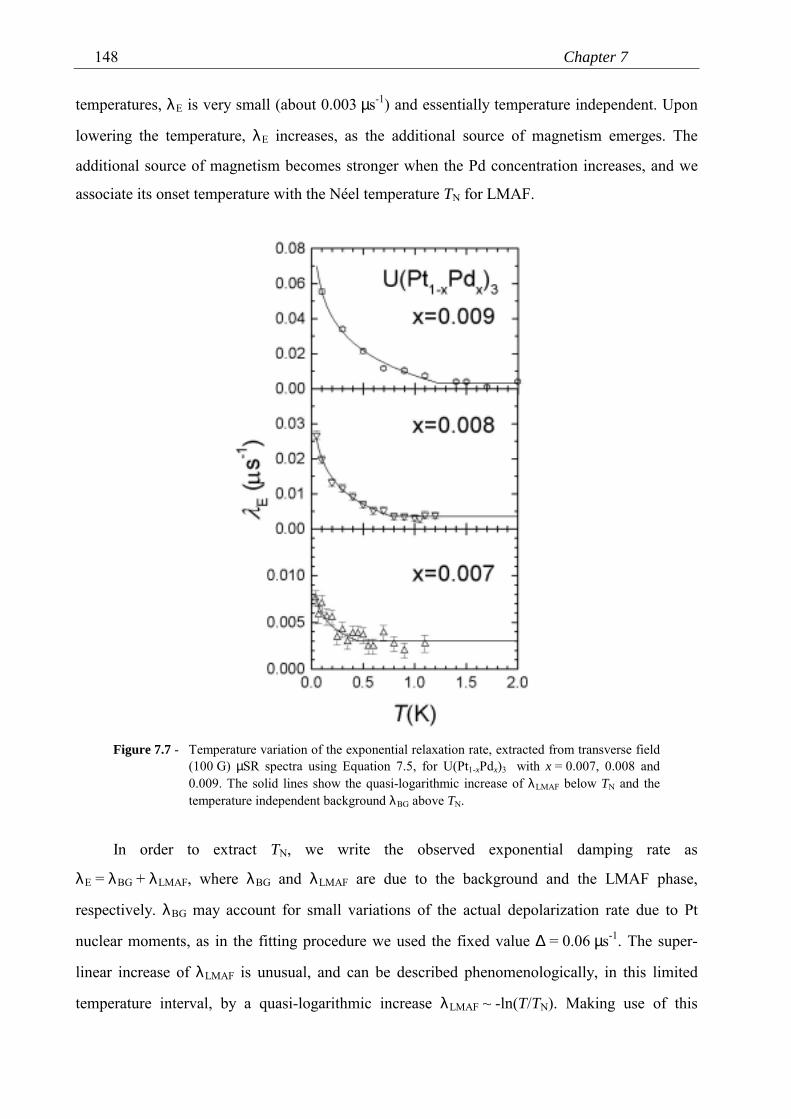
Chapter 7148
temperatures, λE is very small (about 0.003 µs-1) and essentially temperature independent. Upon
lowering the temperature, λE increases, as the additional source of magnetism emerges. The
additional source of magnetism becomes stronger when the Pd concentration increases, and we
associate its onset temperature with the Néel temperature TN for LMAF.
Figure 7.7 - Temperature variation of the exponential relaxation rate, extracted from transverse field(100 G) µSR spectra using Equation 7.5, for U(Pt1-xPdx)3 with x = 0.007, 0.008 and0.009. The solid lines show the quasi-logarithmic increase of λLMAF below TN and thetemperature independent background λBG above TN.
In order to extract TN, we write the observed exponential damping rate as
λE = λBG + λLMAF, where λBG and λLMAF are due to the background and the LMAF phase,
respectively. λBG may account for small variations of the actual depolarization rate due to Pt
nuclear moments, as in the fitting procedure we used the fixed value ∆ = 0.06 µs-1. The super-
linear increase of λLMAF is unusual, and can be described phenomenologically, in this limited
temperature interval, by a quasi-logarithmic increase λLMAF ~ -ln(T/TN). Making use of this
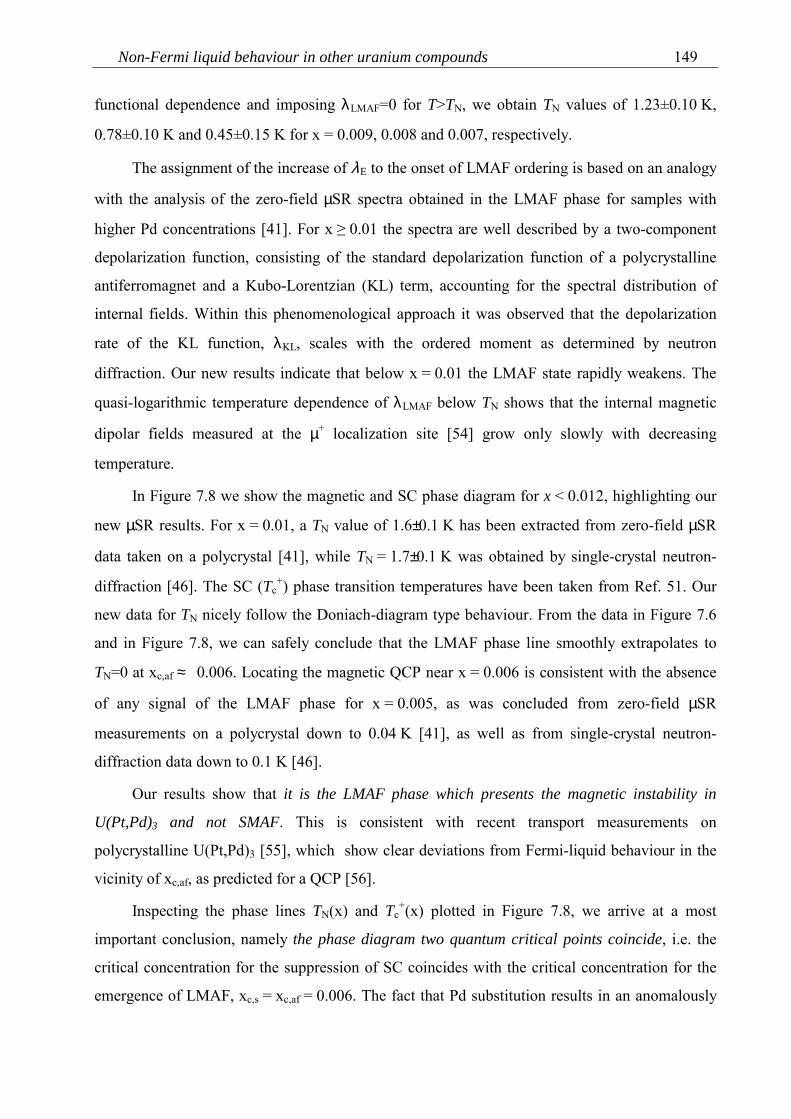
Non-Fermi liquid behaviour in other uranium compounds 149
functional dependence and imposing λLMAF=0 for T>TN, we obtain TN values of 1.23±0.10 K,
0.78±0.10 K and 0.45±0.15 K for x = 0.009, 0.008 and 0.007, respectively.
The assignment of the increase of λE to the onset of LMAF ordering is based on an analogy
with the analysis of the zero-field µSR spectra obtained in the LMAF phase for samples with
higher Pd concentrations [41]. For x ≥ 0.01 the spectra are well described by a two-component
depolarization function, consisting of the standard depolarization function of a polycrystalline
antiferromagnet and a Kubo-Lorentzian (KL) term, accounting for the spectral distribution of
internal fields. Within this phenomenological approach it was observed that the depolarization
rate of the KL function, λKL, scales with the ordered moment as determined by neutron
diffraction. Our new results indicate that below x = 0.01 the LMAF state rapidly weakens. The
quasi-logarithmic temperature dependence of λLMAF below TN shows that the internal magnetic
dipolar fields measured at the µ+ localization site [54] grow only slowly with decreasing
temperature.
In Figure 7.8 we show the magnetic and SC phase diagram for x < 0.012, highlighting our
new µSR results. For x = 0.01, a TN value of 1.6±0.1 K has been extracted from zero-field µSR
data taken on a polycrystal [41], while TN = 1.7±0.1 K was obtained by single-crystal neutron-
diffraction [46]. The SC (Tc+) phase transition temperatures have been taken from Ref. 51. Our
new data for TN nicely follow the Doniach-diagram type behaviour. From the data in Figure 7.6
and in Figure 7.8, we can safely conclude that the LMAF phase line smoothly extrapolates to
TN=0 at xc,af ≈ 0.006. Locating the magnetic QCP near x = 0.006 is consistent with the absence
of any signal of the LMAF phase for x = 0.005, as was concluded from zero-field µSR
measurements on a polycrystal down to 0.04 K [41], as well as from single-crystal neutron-
diffraction data down to 0.1 K [46].
Our results show that it is the LMAF phase which presents the magnetic instability in
U(Pt,Pd)3 and not SMAF. This is consistent with recent transport measurements on
polycrystalline U(Pt,Pd)3 [55], which show clear deviations from Fermi-liquid behaviour in the
vicinity of xc,af, as predicted for a QCP [56].
Inspecting the phase lines TN(x) and Tc+(x) plotted in Figure 7.8, we arrive at a most
important conclusion, namely the phase diagram two quantum critical points coincide, i.e. the
critical concentration for the suppression of SC coincides with the critical concentration for the
emergence of LMAF, xc,s = xc,af = 0.006. The fact that Pd substitution results in an anomalously
Chapter 7150
high rate of suppression of Tc+ [51,52], as well as in the onset of the LMAF phase, indicates that
this relationship is not coincidental. Stabilization of the LMAF phase completely suppresses
unconventional SC. Recent NMR measurements [39], as well as alloying experiments [57,58],
provide strong evidence that the SC wave function has odd parity. This in turn implies that
Cooper pairing is driven by FM spin fluctuations, rather than by AF fluctuations [26,32].
Therefore, our experiments indicate that doping UPt3 with Pd leads to a shift of the spectral
weight from FM to AF fluctuations. This is not uncommon near a QCP, where the many energy
scales become comparable and competition between various phases becomes important. Indeed,
inelastic neutron scattering experiments carried out on pure UPt3 [59] show that the magnetic
fluctuation spectrum is complex and has both AF and FM components.
0.0 0.2 0.4 0.6 0.8 1.0 1.20.0
0.5
1.0
1.5
2.0
LMAF
SC
U(Pt1-xPdx)3
T N o
r Tc (
K)
Pd concentration (at.%)Figure 7.8 - Magnetic and superconducting phase diagram for U(Pt1-xPdx)3 alloys with x < 0.012. The
meaning of the symbols is the same as in Figure 7.6. The solid lines serve to guide theeye.
The phase diagram shown in Figure 7.6, differs from the generic phase diagram, proposed
for magnetically ordered pure heavy-fermion materials under pressure [28]. In these materials,
the approach to the magnetic QCP at T=0 is circumvented by the occurrence of a SC ground
state. Tc is maximum near the critical pressure pc,af, which has been interpreted as evidence for
SC mediated by AF fluctuations. In the case of U(Pt,Pd)3, however, Tc→0 at the QCP. This is
Non-Fermi liquid behaviour in other uranium compounds 151
naturally explained if SC in UPt3 is mediated by FM spin fluctuations, which cannot coexist at
any non-zero temperature with an ordered AF state. This is consistent with the notion that the
SMAF state is fluctuating in time.
In conclusion, we have shown that the magnetic instability in U(Pt,Pd)3 is due to the
LMAF phase rather than SMAF. The U(Pt1-x,Pdx)3 phase diagram has a critical point at
x ≈ 0.006 where unconventional SC is suppressed and LMAF emerges. The existence of this
critical point provides strong evidence for SC mediated by FM spin fluctuations. A complete
understanding of the phase diagram and its quantum critical point might prove to be essential in
further specifying the SC pairing mechanism. Measurements of the critical exponents of the
thermal, magnetic and transport properties in the concomitant non-Fermi liquid regime are
needed to identify the character of the magnetic fluctuations [56]. Moreover, the results may be
relevant [60] to other strongly correlated systems, such as the high temperature superconductors,
which have phase diagrams that exhibit a similar competition between SC and static AF order.
7.3. Possible non-Fermi liquid behaviour in URh1/3Ni2/3Al
Ternary intermetallic compounds with the general formula UTX (T = late transition metal,
X = p-element) crystallizing in the hexagonal ZrNiAl-type of structure exhibit a large variety of
magnetic properties [61]. This structure consists of two basal planes, one containing U and 1/3 of
T atoms and the other the remaining T atoms and Al. It is well established that the magnetism,
which is mainly due to U moments, is controlled by the strength of the hybridization between the
5f- and the ligand-electronic states. On one hand, hybridization delocalizes the 5f-states and
inhibits magnetic ordering, on the other hand, however, it mediates interaction between them and
promotes magnetic ordering. It is therefore not surprising that the magnetic properties of these
compounds vary as a function of the constituents, which change the hybridization. Recently, we
have started a systematic study of quasiternary compounds with substitutions on the transition-
metal sites [62]. Here, we report on the magnetic, thermal and transport properties of
URh1/3Ni2/3Al, which appears to show anomalous low-temperature behaviour.
Chapter 7152
URh1/3Ni2/3Al was prepared in polycrystalline form by arc melting stoichiometric amounts
of the constituting elements (the purity of U was 99.8%, of the other elements 99.99%). After re-
melting and reversing the ingot several times to ensure homogeneity, the resulting ingot was
annealed for one week at 700°C in a vacuum-sealed quartz ampoule. After crushing the annealed
material under protective atmosphere, X-ray powder diffraction was carried out to verify the
structure and lattice parameters. The magnetic susceptibility χ(T) = M/H was measured between
1.7 and 320 K in fields up to 5 T on a sample consisting of powder that was fixed in random
orientation in a SQUID magnetometer (Quantum Design). Electrical-resistivity measurements
were performed in the temperature range 0.05-300 K on a bar-shaped sample by means of a
standard four-probe method. The temperature dependence of the specific heat was measured
between 0.4 and 40 K by means of a semi-adiabatic heat-pulse method.
In Figure 7.9 we show the temperature dependence of (a) the magnetic susceptibility
measured in 0.1 T both in zero-field cooled (ZFC) and field-cooled (FC) modes, (b) the specific
heat in the absence of a magnetic field and (c) of the electrical resistivity. It is clearly seen that all
the three physical properties deviate from the temperature dependencies expected for Fermi-
liquid systems. At low temperatures, the FC susceptibility diverges and the ZFC curve exhibits a
clear maximum at 10 K above which the FC and ZFC curves coincide. The maximum suggests
the presence of AF correlations and the difference between the FC and ZFC curves reminds one
of a spin-glass system (SG). For a SG system, some type of disorder in the compound is required.
Indeed, recent X-ray and neutron-diffraction studies suggest a random occupation of Rh and Ni
atoms of sites in the plane that does not contain U atoms [63].
The specific heat shown in Figure 7.9b exhibits a low-temperature dependence that can be
described by a -ln(T/T0) dependence with T0 ≈ 10 K ≈ -θP/4 (dashed line in Figure 7.9b),
suggesting non-Fermi-liquid (NFL) behaviour. However, the data are equally well described by
the expression c/T ≈ T λ-1 with λ = 0.94 (solid line in Figure 7.9b). To discriminate between the
two descriptions, measurements at even lower temperatures would be required.
At high temperatures, as in normal metals, the electrical resistivity decreases with
decreasing temperature. However in URh1/3Ni2/3Al, it exhibits a minimum near 10 K and a
pronounced increase below this temperature. In other words, the aT 2 term is absent or it is very
weak. The resistivity can be fitted to a ρ0 + a(T/T0)α dependence with a negative a and α = 0.96.
The best fit is shown in Figure 7.9c by the full line. At an even lower temperature of 0.33 mK, a
distinct step-like decrease of the resistivity is found (see inset of Figure 7.9) which we tentatively
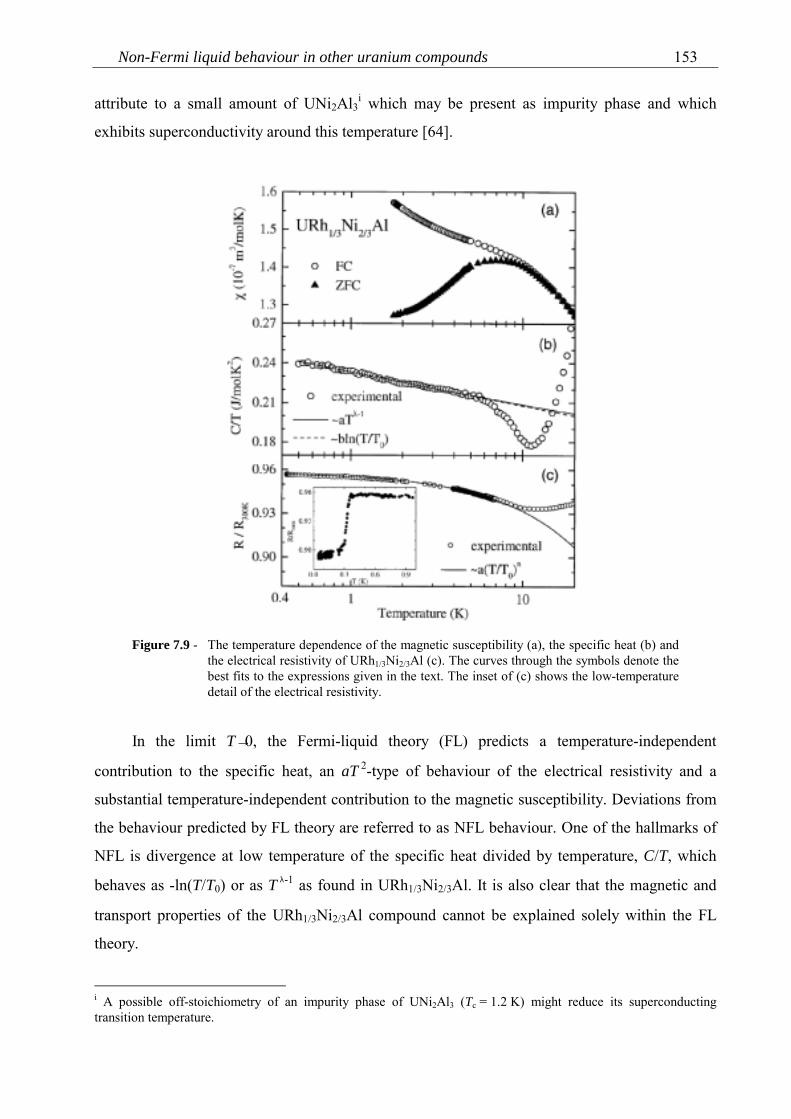
Non-Fermi liquid behaviour in other uranium compounds 153
attribute to a small amount of UNi2Al3i which may be present as impurity phase and which
exhibits superconductivity around this temperature [64].
Figure 7.9 - The temperature dependence of the magnetic susceptibility (a), the specific heat (b) andthe electrical resistivity of URh1/3Ni2/3Al (c). The curves through the symbols denote thebest fits to the expressions given in the text. The inset of (c) shows the low-temperaturedetail of the electrical resistivity.
In the limit T→0, the Fermi-liquid theory (FL) predicts a temperature-independent
contribution to the specific heat, an aT 2-type of behaviour of the electrical resistivity and a
substantial temperature-independent contribution to the magnetic susceptibility. Deviations from
the behaviour predicted by FL theory are referred to as NFL behaviour. One of the hallmarks of
NFL is divergence at low temperature of the specific heat divided by temperature, C/T, which
behaves as -ln(T/T0) or as T λ-1 as found in URh1/3Ni2/3Al. It is also clear that the magnetic and
transport properties of the URh1/3Ni2/3Al compound cannot be explained solely within the FL
theory.
i A possible off-stoichiometry of an impurity phase of UNi2Al3 (Tc = 1.2 K) might reduce its superconductingtransition temperature.
Chapter 7154
References1. L. Shlyk, J.C. Waerenborgh, P. Estrela, L.E. De Long, A. de Visser and M. Almeida, J.
Phys.: Condens. Matter 11 (1999) 3525.2. L. Shlyk, P. Estrela, J.C. Waerenborgh, L.E. De Long, A. de Visser, D.P. Rojas, F. Gandra
and M. Almeida, Physica B 292 (2000) 89.3. P. Estrela, T. Naka, A. de Visser, F.R. de Boer and L. Shlyk, in preparation4. A. de Visser, M.J. Graf, P. Estrela, A. Amato, C. Baines, D. Andreica, F. Gygax and A.
Schenck, submitted to Phys. Rev.5. K. Prokeš, I.H. Hagmusa, P. Estrela, J.C.P. Klaasse, A.V. Andreev, V. Sechovský, E. Brück
and F.R. de Boer, Physica B 281-282 (2000) 377.6. A. E. Dwight, Acta Cryst. B 33 (1977) 1579.7. T. Takabatake, S. Miyata, H. Fujii, Y. Aoki, T. Suzuki, T. Fujita, J. Sakurai and T. Hiraoko,
J. Phys. Soc. Jpn. 59 (1993) 4412.8. A.J. Millis, Phys. Rev. B 48 (1993) 7183.9. U. Zülicke and A.J. Millis, Phys. Rev. B 51 (1995) 8996.10. O.V. Lounasmaa, in "Hyperfine Interactions" (A.J. Freeman and R.B. Frankel, eds.),
Academic Press, New York, 1967, p.467.11. Proc. ITP Conference on Non-Fermi Liquid Behaviour in Metals, Santa Barbara, 1996, in J.
Phys.: Condens. Matter 8 (1996) 9675 ff.12. M.C. de Andrade, R. Chau, R.P. Dickey, N.R. Dilley, E.J. Freeman, D.A. Gajewski, M.B.
Maple, R. Movshovich, A.H. Castro Neto, G.E. Castilla and B.A. Jones, Phys. Rev. Lett. 81(1998) 5620.
13. A.H. Castro Neto, G.E. Castilla and B.A. Jones, Phys. Rev. Lett. 81 (1998) 3531.14. R. Gopal, "Specific Heat at Low Temperatures", Plenum Press, New York, 1966.15. W. Brenig, H.J. Mikeska and E. Riedel, Z. Phys. 206 (1967) 439.16. E. Riedel, Z. Phys. 210 (1968) 403.17. L. Shlyk et al. (unpublished).18. D.L. Cox and M. Jarrell, J. Phys.: Condens. Matter 8 (1996) 9825.19. E. Miranda, V. Dobrosavljević and G. Kotliar, J. Phys.: Condens. Matter 8 (1998) 9871.20. A. Rosch, Physica B 280 (2000) 341.21. M.A. Continentino, Phys. Rev. B 47 (1993) 11587.22. K. Kadowaki and S.B. Woods, Solid State Commun. 58 (1986) 507.23. M.A. Continentino, Phys. Rev. B 57 (1998) 5966.24. J.S. Schilling, Adv. Phys. 28 (1979) 657.25. R.H. Heffner and M.R. Norman, Comm. Condens. Matter Phys. 17 (1966) 361.26. P.W. Anderson, Phys. Rev. B 30 (1984) 1549.27. K. Miyake, S. Schmitt-Rink and C.M. Varma, Phys. Rev. B 34 (1986) 6554.
Non-Fermi liquid behaviour in other uranium compounds 155
28. N.D. Mathur, F.M. Grosche, S.R. Julian, I.R. Walker, D.M. Freye, R.K.W. Haselwimmerand G.G. Lonzarich, Nature 394 (1998) 39.
29. J.A. Sauls, Adv. Phys. 43 (1994) 113.30. P.H. Frings, J.J.M. Franse, F.R. de Boer and A. Menovsky, J. Magn. Magn. Mater. 31-34
(1983) 240.31. G.R. Stewart, Z. Fisk, J.O. Willis and J.L. Smith, Phys. Rev. Lett. 52 (1984) 679.32. C.J. Pethick, D. Pines, K.F. Quader, K.S. Bedell and G.E. Brown, Phys. Rev. Lett. 57 (1986)
1955.33. D.W. Hess, T.A. Tokuyasu and J.A. Sauls, J. Phys.: Condens. Matter 1 (1989) 8135.34. R. Joynt, V.P. Mineev, G.E. Volovik and M.E. Zhitomirsky, Phys. Rev. B 42 (1990) 2014.35. K. Machida and M. Ozaki, Phys. Rev. Lett. 66 (1991) 3293.36. S.M. Hayden, L. Taillefer, C. Vettier and J. Flouquet, Phys. Rev. B 46 (1992) 8675.37. G. Aeppli, E. Bucher, C. Broholm, J.K. Kjems, J. Baumann and J. Hufnagl, Phys. Rev. Lett.
60 (1988) 615.38. E.D. Isaacs, P. Zschack, C.L. Broholm, C. Burns, G. Aeppli, A.P. Ramirez, T.T.M. Palstra,
R.W. Erwin, N. Stücheli and E. Bucher, Phys. Rev. Lett. 75 (1995) 1178.39. H. Tou, Y. Kitaoka, K. Asayama, N. Kimura, Y. Onuki, E. Yamamoto and K. Maezawa,
Phys. Rev. Lett. 77 (1996) 1374.40. P. Dalmas de Réotier, A. Huxley, A. Yaouanc, J. Flouquet, P. Bonville, P. Imbert, P. Pari,
P.C.M. Gubbens and A.M. Mulders, Phys. Lett. A 205 (1995) 239.41. R.J. Keizer, A. de Visser, A.A. Menovsky, J.J.M. Franse, A. Amato, F.N. Gygax, M.
Pinkpank and A. Schenck, J. Phys.: Condens. Matter 11 (1999) 8591.42. R.H. Heffner, D.W. Cooke, A.L. Giorgi, R.L. Hutson, M.E. Schillaci, H.D. Rempp, J.L.
Smith, J.O. Willis, D.E. MacLaughlin, C. Boekema, R.L. Lichti, J. Oostens and A.B.Denison, Phys. Rev. B 39 (1989) 11345.
43. A. de Visser, J.C.P. Klaasse, M. van Sprang, J.J.M. Franse, A. Menovsky, T.T.M. Palstraand A.J. Dirkmaat, Phys. Lett. A 113 (1986) 489.
44. A.P. Ramirez, B. Batlogg, E. Bucher and A.S. Cooper, Phys. Rev. Lett. 57 (1986) 1072.45. P. Frings, B. Renker and C. Vettier, J. Magn. Magn. Mater. 63-64 (1987) 202.46. R.J. Keizer, A. de Visser, A.A. Menovsky, J.J.M. Franse, B. Fåk and J.M. Mignot, Phys.
Rev. B 60 (1999) 6668.47. Y. Kohori, M. Ishii and T. Kohara, J. Magn. Magn. Mater. 177-181 (1998) 441.48. S. Doniach, Physica B 91 (1977) 231.49. J. Tang, A. de Visser, A. Matsushita and T. Matsumoto, J. Magn. Magn. Mater 177-181
(1998) 465.50. R.J. Keizer, A. de Visser, M.J. Graf, A.A. Menovsky and J.J.M. Franse, Phys. Rev. B 60
(1999) 10527.51. M.J. Graf, R.J. Keizer, A. de Visser and J.J.M. Franse, Physica B 259-261 (1999) 666.52. M.J. Graf, R.J. Keizer, A. de Visser, A.A. Menovsky and J.J.M. Franse, Phys. Rev. B 60
(1999) 3056.
Chapter 7156
53. R. Abela, A. Amato, C. Baines, X. Donath, R. Erne, D.C. George, D. Herlach, G. Irminger,I.D. Reid, D. Renker, G. Solt, D. Suhi, M. Werner and U. Zimmermann, Hyperfine Interact.120-121 (1999) 575.
54. A. Schenck, R.J. Keizer, A. de Visser, A. Amato, D. Andreica, F.N. Gygax, M. Pinkpank, P.Estrela, M.J. Graf, A.A. Menovsky and J.J.M. Franse, Physica B 289-290 (2000) 455.
55. M.J. Graf, R.J. Keizer, A. de Visser and S.T. Hannahs, Physica B 284-288 (2000) 1281.56. A.J. Millis, Phys. Rev. B 48 (1993) 7183; A. Rosch, Phys. Rev. Lett. 82 (1999) 4280.57. Y. Dalichaouch, M.C. de Andrade, D.A. Gajewski, R. Chau, P. Visani and M.B. Maple,
Phys. Rev. Lett. 75 (1995) 3938.58. H.G.M. Duijn, N.H. van Dijk, A. de Visser and J.J.M. Franse, Physica B 223-224 (1996) 44.59. A.I. Goldman, G. Shirane, G. Aeppli, E. Bucher and J. Hufnagl, Phys. Rev. B 36 (1987)
8523.60. C.M. Varma, Phys. World 11 (1998) 22.61. V. Sechovský and L. Havela, in "Handbook of Magnetic Materials" vol. 11 (K.H.J.
Buschow, ed.), Elsevier, Amsterdam, 1998, p. 1.62. A.V. Andreev, R.V. Dremov, V. Sechovský, Y. Uwatoko, N.V. Mushnikov, T. Goto, K.
Prokeš, Y. Shiokawa, Y. Homma, I.H. Hagmusa and J.C.P. Klaasse, J. Alloys Compounds282 (1999) 64.
63. K. Prokeš et al. (unpublished).64. C. Geibel, S. Thies, D. Kaczorowski, A. Mehner, A. Grauel, B. Seidel, U. Ahlheim, R.
Helfrich, K. Petersen, C.D. Bredl and F. Steglich, Z. Phys. B 83 (1991) 305.
Concluding remarks
8.1. U2Pt2In
In this thesis, it has been shown that U2Pt2In is the first stoichiometric U-based compound
that exhibits non-Fermi liquid (NFL) behaviour at ambient pressure. Research on stoichiometric
compounds prepared in a single-crystalline form is highly desirable in the study of NFL
behaviour because the effects of disorder may not dominate the physics. This provided a strong
motivation to carry out an extensive study on U2Pt2In in order to determine its NFL properties.
Nevertheless, the rather difficult metallurgy of U2Pt2In imposed its restrictions on the research
carried out.
The main results obtained on U2Pt2In are summarized below.
• Polymorphism was found in U2Pt2In [1]: while polycrystalline samples form in the U3Si2-
type of structure, single-crystals form in the Zr3Al2-type of structure (superstructure of the U3Si2
type with a doubling along the c-axis).
• When tracing the magnetic ordering temperatures of the U2T2X family of compounds versus
the square of the conduction-electron - f-electron hybridization matrix element in a Doniach-like
diagram, one finds that U2Pt2In is located at the border line between magnetic and non-magnetic
compounds, which suggests that U2Pt2In is near a magnetic instability.
Chapter 8158
• The magnetic susceptibility of U2Pt2In is weakly anisotropic and follows a (modified) Curie-
Weiss behaviour at high temperatures. At low temperatures, however, an anomalous behaviour is
observed: χc goes through a maximum at 7.9 K, which is attributed to the stabilization of short-
range antiferromagnetic (AF) correlations, while χa increases as 1-bT 0.7 for 2 K ≤ T < 10 K. This
is at variance with the standard Fermi liquid (FL) behaviour, which predicts χ to attain a constant
value at low temperatures.
• The resistivity of U2Pt2In is highly anisotropic below about 80 K with ρc > ρa. At the lowest
temperatures, the resistivity does not follow the FL quadratic temperature dependence, instead
ρa ~ T 1.25 and ρc ~ T 0.9. The residual resistivities are unusually high: ρ0,a ≈ 115 µΩcm and
ρ0,c ≈ 210 µΩcm. However, structure refinements from X-ray [1] and neutron-diffraction [2]
experiments indicate a high sample quality. Also, the large difference between ρ0,a and ρ0,c
shows that ρ0 is largely determined by other scattering mechanisms than impurity or defect
scattering. It should also be noted that the higher resistivity values are found for a current along
the c-axis, which is the axis along which the AF fluctuations stabilize.
• Magnetoresistance (MR) experiments show a gradual increase of the resistivity exponent α
(defined as ρ ~ T α as T→0) with increasing magnetic field strength. At 8 T, α = 2 as expected for
a FL. There are two different contributions to the MR: a negative one (associated with spin
effects) and a positive one (associated with orbital effects). At low fields, the negative
contribution is dominant, except in the case B || I || a, whereas at high fields the positive
contribution becomes more and more important. The negative contribution to the MR is more
important for I || c than for I || a. However, no satisfactory explanation for this anisotropy can be
offered at the moment. Additional evidence that the high residual resistivity in U2Pt2In is not
determined by crystallographic disorder is provided by the strong field dependence of ρ0.
• The specific heat of U2Pt2In provides solid evidence for the classification of this heavy-
fermion compound as a NFL. The specific heat shows a pronounced diverging behaviour of the
type c/T ~ -ln(T/T0) over almost two decades of temperature. The low-temperature specific heat
measured in a magnetic field is dominated by a strong contribution of the In nuclear moments.
The same logarithmic divergency is observed in the specific heat measured on polycrystalline
samples. As these crystallize in the simpler U3Si2-type of structure, the NFL behaviour is not
directly related to the presence of two inequivalent U positions, as present in the single crystals
with the Zr3Al2-type of structure.
Concluding remarks 159
• The thermal-expansion coefficient of U2Pt2In becomes anisotropic below about 12 K, in a
way that the c-axis shrinks more rapidly than the a-axis upon formation of the heavy-fermion
bands.
• Absence of weak magnetic order, at least down to 0.05 K, is confirmed by means of muon
spin relaxation and rotation (µSR) experiments. Besides a static magnetic component originating
from the In nuclear moments, the µSR spectra below 10 K reveal the presence of magnetic
fluctuations. No evidence was found for Kondo disorder.
• Resistivity experiments under hydrostatic pressure indicate a recovery of the FL ρ ~ T 2
behaviour at low temperatures for I || a. This is consistent with predictions from a transport
theory for heavy-fermion compounds near an AF quantum critical point (QCP) [3]. The
anisotropy in the resistivity is strongly enhanced under pressure, as follows from the increase of
the ratio ρc/ρa measured for 0.3 K ≤ T < 300 K. Due to the enhancement of the anisotropy, the
resistivity curves for I || c do not show a ρ ~ T 2 behaviour but a low-temperature minimum.
One of the main issues that arise when discussing the properties of NFL compounds is the
responsible mechanism for this behaviour. Although in the current state-of-the-art NFL physics
no definite answers can be provided, one most important distinction can often be made: whether
the NFL behaviour is due to a single-ion or a cooperative mechanism.
The location of U2Pt2In at the border line between magnetic and non-magnetic compounds
in the Doniach diagram for the U2T2In family of compounds, suggests a proximity to an AF
QCP. Resistivity measurements under pressure carried out on U2Pt2In and U2Pd2In yield strong
support for this hypothesis. Considering the absence of magnetic order down to 0.05 K (as
evidenced from the µSR experiments) and the important finding that pressure leads to the
recovery of the FL behaviour, one cannot exclude that U2Pt2In is even located at the AF QCP. In
order to investigate this further, specific-heat experiments under pressure would be most
welcome. As the specific-heat coefficient γ is related to the coherence temperature Tcoh [4], the
observation and evolution of the FL γ coefficient with pressure would provide valuable
information on the recovery of the FL state near the QCP.
It is important to notice that the observed divergency of the specific heat, c/T ~ -ln(T/T0) is
not consistent with an AF QCP, but rather indicates a ferromagnetic (FM) QCP [5]. However, a
logarithmic divergency of c/T is allowed for an AF QCP in a two-dimensional (2D) system. This
appears to apply to compounds like CeCu5.9Au0.1 [6] and CeNi2Ge2 [7], where inelastic neutron
Chapter 8160
scattering (INS) experiments have provided evidence for a spectrum of strongly anisotropic
magnetic fluctuations, with a quasi-2D nature. INS experiments on U2Pt2In could possibly
elucidate the nature of the magnetic fluctuations further.
In order to investigate the evolution of magnetic order near U2Pt2In in the Doniach phase
diagram, the study of single-phase samples of e.g. (U1-xThx)2Pt2In and U2(Pt1-xPdx)2In is helpful
If Pd or Th doping results in the emergence of magnetism, strong evidence for U2Pt2In being at a
QCP is obtained. One could then also study such doped samples under pressure, which should
lead to the suppression of magnetic order and to the appearance of the FL state.
The origin of the strongly anisotropic character of the resistivity of U2Pt2In remains
puzzling. Its enhancement under pressure indicates that the anisotropy is not inherent to the
crystal structure since the compressibility is almost isotropic. Resistivity measurements on single
crystals of the non-magnetic compound Th2Pt2In would be useful to address this issue. These
could also serve to obtain an estimate for the phonon contribution to the resistivity of U2Pt2In. In
addition, specific-heat experiments on Th2Pt2In should be carried out in order to estimate the
phonon contribution to c(T). This would enable a more precise determination of the temperature
up to which a logarithmic divergency is present in the electronic specific heat of U2Pt2In.
The high residual resistivity of U2Pt2In raises the question of the role of disorder in the
NFL properties. The dependence of ρ0 on the current direction, as well as its field and pressure
variations, indicate that impurity and defect scattering are not the dominant mechanisms leading
to the high values of ρ0. Even though X-ray and neutron-diffraction experiments indicate a good
single-crystalline quality, the use of a local probe to measure the near-neighbour bond-length
distributions, like (synchrotron radiation) X-ray absorption fine-structure (XAFS) experiments,
could be helpful to determine the exact amount of disorder. For instance, neutron-diffraction
experiments carried out on UCu4Pd were inconclusive regarding the presence of disorder [8].
However, XAFS experiments on the same sample revealed the presence of Pd/Cu site
interchange [9]. It was concluded that the amount of disorder observed was sufficient for the
Kondo disorder model to apply.
Although there is no evidence for Kondo disorder in U2Pt2In, a good test for the Kondo
disorder model is obtained by a comparison of the µSR and NMR line widths [10]. As shown in
this work, the small frequency shifts observed in the transverse-field (TF) µSR spectra of
U2Pt2In, require that a full analysis of the TF line widths can only be accomplished with samples
with a well-defined geometry in order to account for demagnetizing effects.
Concluding remarks 161
A further study of the NFL behaviour of U2Pt2In may hopefully be carried out on a "second
generation" of single crystals, with a minimum amount of disorder. Single crystals with a lower
residual resistivity should be prepared. Therefore, one should look into single-crystal growth
methods other than the mineralization technique, by which possibly crystals of higher quality can
be produced.
8.2. Related compounds
The presence of a QCP has also been investigated for the compounds U3Ni3Sn4 and
U(Pt1-xPdx)3.
Specific-heat measurements carried out on the stoichiometric compound U3Ni3Sn4 show
the presence of a NFL regime in the temperature range 0.5-5 K and a crossover to a FL ground
state below 0.4 K. The divergency of the specific heat in the NFL regime is of the type
c/T ~ γ0-αT 1/2, which is consistent with the proximity to an AF QCP in a 3D system [5]. Both
the NFL c/T divergence and the spin-fluctuation term in the FL specific heat, have the same
characteristic temperature T0 of 10 K. The pressure dependence of the temperature below which
the FL regime in the resistivity is attained, is well described in terms of a transport theory for
nearly AF metals [3]. These results indicate that by a small lattice expansion, equivalent to a
negative pressure of about -0.04 GPa, U3Ni3Sn4 may be tuned to the QCP. The isostructural
compound U3Cu3Sn4 is an antiferromagnet with TN = 13 K and its unit-cell volume is about 5%
larger than that of U3Ni3Sn4. Therefore, it would be highly interesting to check the existence of
an AF QCP by studying samples in which small amounts of Ni are replaced by Cu.
µSR experiments on the system U(Pt1-xPdx)3 indicate a new type of QCP in the phase
diagram: at the critical concentration xc = 0.006, unconventional superconductivity is suppressed
and a large-moment antiferromagnetic (LMAF) phase emerges. The fact that the superconducting
wave-function has odd parity suggests that doping with Pd leads to a shift of the spectral weight
from FM to AF fluctuations. The observed competition between superconductivity mediated by
FM fluctuations and static AF order, is in contrast with superconductivity mediated by AF
interactions in materials like CePd2Si2 close to the QCP [11]. The phase diagram of U(Pt1-xPdx)3
Chapter 8162
is similar to the phase diagrams observed for high-temperature superconductors with the
peculiarity that the critical points TN→0 and Tc→0 coincide.
Resistivity measurements carried out on U(Pt1-xPdx)3 show values of the exponent α equal
to 1.8 and 1.6 for samples with x = 0.004 and x = 0.007, respectively [12]. These values are
inconclusive with respect to the type of QCP in the system (α = 3/2 and α = 5/3 are predicted for
the AF and FM QCP, respectively). A systematic study of the resistivity exponents in samples
with x around 0.006 is required to clearly determine the type of magnetic fluctuations at the
QCP.
The origin of the NFL behaviour observed in URh1/3Ni2/3Al might be of the single-ion type.
URh1/3Ni2/3Al shows a diverging specific heat of the type c/T ~ -ln(T/T0) below about 6 K. Below
10 K the resistivity increases as ρ ~ 1-aT α with α about 1. The low-temperature resistivity
increase is an indication that the mechanism responsible for the NFL behaviour is of the single-
ion type. In fact, a loss of coherence is predicted to occur at low temperatures within the Kondo
disorder model. This model also predicts a logarithmic divergency of c/T and the linear increase
of the resistivity below TK, as observed for URh1/3Ni2/3Al. A detailed structural analysis on
single-phase samples is required to establish the amount of disorder in this compound.
References1. P. Estrela, L.C.J. Pereira, A. de Visser, F.R. de Boer, M. Almeida, M. Godinho, J. Rebizant
and J.C. Spirlet, J. Phys.: Condens. Matter 10 (1998) 9465.2. A. Martin-Martin, L.C.J. Pereira, G.H. Lander, J. Rebizant, F. Wastin, J.C. Spirlet, P.
Dervenagas and P.J. Brown, Phys. Rev. B 59 (1999) 11818.3. A. Rosch, Physica B 280 (2000) 341.4. M.A. Continentino, Phys. Rev. B 47 (1993) 11587.5. A.J. Millis, Phys. Rev. B 48 (1993) 7183.6. A. Rosch, A. Schröder, O. Stockert and H.v. Löhneysen, Phys. Rev. Lett. 79 (1997) 159.7. B. Fåk, J. Flouquet, G. Lapertot, T. Fukuhara and H. Kadowaki, J. Phys.: Condens. Matter
12 (2000) 5423.8. R. Chau, M.B. Maple and R.A. Robinson, Phys. Rev. B 58 (1998) 139.9. C.H. Booth, D.E. MacLaughlin, R.H. Heffner, R. Chau, M.B. Maple and G.H. Kwei, Phys.
Rev. Lett. 81 (1998) 3960.10. D.E. MacLaughlin, O.O. Bernal and H.G. Lukefahr, J. Phys.: Condens. Matter 8 (1996)
9855.
Concluding remarks 163
11. N.D. Mathur, F.M. Grosche, S.R. Julian, I.R. Walker, D.M. Freye, R.K.W. Haselwimmerand G.G. Lonzarich, Nature 394 (1998) 39.
12. M.J. Graf, R.J. Keizer, A. de Visser and S.T. Hannahs, Physica B 284-288 (2000) 1281.
Summary
The Fermi liquid (FL) theory of Landau has been very successful in describing the low-
temperature properties of metals. This description is summarized by the well-known expressions
for the specific heat c(T) = γT, the magnetic susceptibility χ(T) = const, and the electrical
resistivity ρ(T) = ρ0 + AT 2. It has been a challenging task to also describe heavy-fermion (HF)
materials as strongly renormalized FL's. However, quite surprisingly, in the past decade, a
number of HF systems has been discovered, which does not obey the standard FL behaviour, at
least not down to the lowest temperatures experimentally accessible. Detailed studies of such
systems have led to the recognition that the FL framework may break down under specific
conditions. This so-called non-Fermi liquid (NFL) state may be considered as a new type of
ground state. In NFL materials, c(T)/T and χ(T) diverge when T→0, while ρ(T) obeys a non-
quadratic temperature dependence.
In this thesis it is shown that U2Pt2In is the first stoichiometric uranium-based compound
which exhibits NFL behaviour at ambient pressure. The specific heat of U2Pt2In shows a
pronounced diverging behaviour of the type c/T ~ -ln(T/T0) over almost two decades of
temperature (0.1 ≤ T < 6 K), providing solid evidence for the classification of this heavy-fermion
compound as a NFL.
At low temperatures, an anomalous behaviour is observed in the magnetic susceptibility of
U2Pt2In: χc goes through a maximum at 7.9 K, which is attributed to the stabilization of short-
range antiferromagnetic (AF) correlations, while χa increases as 1-bT 0.7 for 2 K ≤ T < 10 K. This
is in variance with the standard FL behaviour.
The resistivity of U2Pt2In is highly anisotropic below about 80 K with ρc > ρa. At the
lowest temperatures, the resistivity does not follow the FL quadratic temperature dependence,
Summary 165
instead ρ ~ T α with α = 1.25 and 0.9 for currents applied along the a- and c-axis, respectively.
Magnetoresistance experiments show a gradual increase of the resistivity exponent α with
increasing magnetic field strength, reaching the FL value α = 2 at 8 T.
The residual resistivities are unusually high (ρ0,a ≈ 115 µΩcm and ρ0,c ≈ 210 µΩcm),
even though the structure refinements from X-ray and neutron-diffraction experiments indicate a
high sample quality. The large difference between ρ0,a and ρ0,c and the strong field dependence
of ρ0, shows that ρ0 is largely determined by other scattering mechanisms than impurity or defect
scattering.
Resistivity experiments under hydrostatic pressure indicate a recovery of the FL ρ ~ T 2
behaviour at low temperatures. This is consistent with predictions from a transport theory for
heavy-fermion compounds near an AF quantum critical point (QCP). The anisotropy in the
resistivity is strongly enhanced under pressure.
Absence of weak magnetic order, at least down to 0.05 K, is confirmed by means of muon
spin relaxation and rotation (µSR) experiments. Besides a static magnetic component originating
from the indium nuclear moments, the µSR spectra below 10 K reveal the presence of magnetic
fluctuations. No evidence was found for Kondo disorder.
The location of U2Pt2In at the border line between magnetic and non-magnetic compounds
in a Doniach-type of diagram for the U2T2X family and the recovery of the FL state in the
resistivity of U2Pt2In under pressure, yield evidence for U2Pt2In being at or close to a QCP.
Other uranium-based heavy-fermion compounds exhibiting NFL behaviour have been
studied in this work:
− Specific-heat experiments on the compound U3Ni3Sn4 evidence a FL ground state. However,
a NFL regime is observed for 0.5-5 K. Resistivity experiments show that the temperature range
where FL behaviour is observed increases with applying pressure. The results are consistent with
the location of U3Ni3Sn4 close to an antiferromagnetic QCP (at the paramagnetic side of the
phase diagram).
− A new type of QCP is found for the system U(Pt1-xPdx)3. µSR experiments show that the so-
called large-moment antiferromagnetic phase appears at the same Pd concentration where
superconductivity is suppressed, i.e. the QCP of both superconducting and antiferromagnetic
Summary166
phases coincide. This result suggests that odd-parity superconductivity is suppressed because of a
shift of the spectral weight from ferromagnetic to antiferromagnetic fluctuations upon Pd doping.
− The temperature variation of the resistivity of the pseudo-ternary compound URh1/3Ni2/3Al is
consistent with NFL behaviour due to a single-ion mechanism.
Samenvatting
Het Fermi-vloeistof (FV) model van Landau is uitzonderlijk succesvol gebleken in het
beschrijven van metalen bij lage temperaturen. Deze beschrijving kan in het kort samengevat
worden middels de overbekende uitdrukkingen voor de soortelijke warmte c(T) = γT, de
magnetische susceptibiliteit χ(T) = const en de elektrische weerstand ρ(T) = ρ0 + AT 2. Niet
alleen normale metalen, maar ook de zogeheten zware-fermion (ZF) systemen kunnen
beschreven worden met behulp van het FV model, waarbij de FV parameters sterk
gerenormaliseerd zijn. Echter, in de afgelopen tien jaar is een aantal sterk gecorreleerde
elektronsystemen ontdekt dat sterke afwijkingen van het standaard FV gedrag vertoont.
Gedetailleerde studies van zulke systemen hebben tot het inzicht geleid dat het FV model onder
bepaalde condities niet toepasbaar is. Deze zogeheten niet-Fermi-vloeistof (NFV) toestand kan
beschouwd worden als een nieuwe grondtoestand. In NFV materialen, divergeren c(T)/T en χ(T)
voor T→0, terwijl ρ(T) een niet-kwadratische afhankelijkheid van de temperatuur vertoont.
In dit proefschrift wordt aangetoond dat de ZF verbinding U2Pt2In de eerste
stochiometrische uranium verbinding is, die onder normale atmosferische druk NVF gedrag
vertoont. De soortelijke warmte van U2Pt2In divergeert volgens c/T ~ -ln(T/T0) over twee decades
in temperatuur (0.1 K ≤ T < 6 K), hetgeen overtuigend bewijs is dat U2Pt2In geclassificeerd dient
te worden als een zware-fermion NFV materiaal.
Ook de magnetische susceptibiliteit vertoont anomaal gedrag bij lage temperatuur: χc
vertoont een minimum bij 7.9 K, hetgeen toegeschreven kan worden aan de stabilisatie van
antiferromagnetische (AF) interacties, terwijl χc toeneemt als 1-bT 0.7 voor 2 K ≤ T < 10 K. Dit
gedrag is in strijd met het normale FV gedrag.
Samenvatting168
De elektrische weerstand van U2Pt2In is sterk anisotroop voor temperaturen beneden 80 K,
waarbij ρc > ρa. Bij de laagste temperaturen varieert de elektrische weerstand niet kwadratisch
met de temperatuur zoals voor een FV. In plaats daarvan geldt ρ ~ T α met α = 1.25 en 0.9 voor
een stroom langs de a- en c-as, respectievelijk. Magnetoweerstandsmetingen laten zien dat de
exponent α geleidelijk toeneemt in een uitwendig magneetveld. In 8 T wordt de FV waarde α = 2
bereikt.
De restweerstanden zijn uitzonderlijk hoog (ρ0,a ≈ 115 µΩcm en ρ0,c ≈ 210 µΩcm),
terwijl Röntgen- en neutronendiffractie experimenten erop duiden dat de kristallen van goede
kwaliteit zijn. Het grote verschil tussen ρ0,a en ρ0,c en de sterke magneetveldafhankelijkheid van
ρ0 laten zien dat ρ0 grotendeels bepaald wordt door andere verstrooiingsmechanismen dan
verstrooiing aan onzuiverheden of defecten.
Weerstandsmetingen onder uitwendige hydrostatische druk laten zien dat onder hoge druk
de FV toestand hersteld wordt, aangezien ρ ~ T 2. Dit is consistent met een transporttheorie voor
zware-fermion systemen die een antiferromagnetisch quantum kritisch punt (QKP) hebben voor
T→0. De anisotropie in de weerstand neemt toe onder druk.
Muon spin-rotatie en relaxatie (µSR) experimenten laten zien dat U2Pt2In geen zwakke
magnetische ordening vertoont, althans niet boven een temperatuur van 0.05 K. Naast een
statische magnetische component, die toegeschreven kan worden aan de depolarisatie t.g.v.
indium nucleaire momenten, bestaat het µSR signaal uit een component die op magnetische
fluctuaties duidt (T < 10 K). Er is geen bewijs gevonden voor zogeheten Kondo wanorde.
De lokatie van U2Pt2In vlakbij de grens voor magnetische ordening in een Doniach-
diagram zoals samengesteld voor de hele reeks van U2T2X verbindingen en het herwinnen van de
FV grondtoestand zoals gemeten d.m.v. elektrische weerstand onder uitwendige druk, vormen
overtuigend bewijs dat U2Pt2In op of vlakbij een magnetisch QKP ligt.
Soortelijke-warmte metingen aan de verbinding U3Ni3Sn4 laten zien dat de grondtoestand
een FV is. Echter, in het temperatuurgebied 0.5-5 K wordt NFV gedrag gevonden.
Weerstandsmetingen onder uitwendige druk laten zien dat het temperatuurgebied waar FV
gedrag gevonden wordt groeit met toenemende druk. De resultaten kunnen geïnterpreteerd
worden als een bewijs dat U3Ni3Sn4 vlakbij een QKP ligt (aan de paramagnetische kant).
Een nieuw type van QKP is gevonden in het systeem U(Pt1-xPdx)3. µSR experimenten laten
zien dat de zogenaamde groot-moment antiferromagnetische fase ontstaat bij dezelfde Pd
Samenvatting 169
concentratie als die waar supergeleiding wordt onderdrukt, d.w.z. de QKP voor supergeleiding en
antiferromagnetisme vallen samen. Dit resultaat suggereert dat het spectrale gewicht van de
magnetische fluctuaties in UPt3 verschuift van ferro- naar antiferromagnetisch door legeren met
Pd.
De NFV weerstand van de pseudo-ternaire verbinding URh1/3Ni2/3Al zoals gevonden bij
lage temperatuur kan toegeschreven worden aan een single ion NFV mechanisme.
Published work
Publications related to the work described in this thesis:
• P. Estrela, A. de Visser, T. Naka, F.R. de Boer and L.C.J. Pereira: "Probing U2Pt2In in theDoniach Phase Diagram", in preparation.
• P. Estrela, A. de Visser, F.R. de Boer and L.C.J. Pereira: "Magnetoresistance Study of theNon-Fermi Liquid Compound U2Pt2In", in preparation.
• P. Estrela, T. Naka, A. de Visser, F.R. de Boer and L. Shłyk: "Recovery of a Fermi LiquidState in U3Ni3Sn4", in preparation.
• P. Estrela, A. de Visser, G.J. Nieuwenhuys, A. Schenck, A. Amato and L.C.J. Pereira: "µSRStudy of the Non-Fermi Liquid Compound U2Pt2In", in preparation.
• A. de Visser, M.J. Graf, P. Estrela, A. Amato, C. Baines, D. Andreica, F. Gygax and A.Schenck: "Magnetic Quantum Critical Point and Superconductivity in UPt3 Doped with Pd",submitted to Phys. Rev. Lett.
• L. Shłyk, P. Estrela, J.C. Waerenborgh, L.E. De Long, A. de Visser, D.P. Rojas, F. Gandraand M. Almeida: "Crystal Structure and Physical Properties of U3T3Sn4 (T=Ni, Cu) Single-Crystals", Physica B 292 (2000) 89-96.
• A. Schenck, R.J. Keizer, A. de Visser, A. Amato, D. Andreica, F.N. Gygax, M. Pinkpank, P.Estrela, M.J. Graf, A.A. Menovsky and J.J.M. Franse: "Muon Localization Site in U(Pt,Pd)3",Physica B 289-290 (2000) 455-458.
• P. Estrela, T. Naka, A. de Visser, F.R. de Boer, L.C.J. Pereira and M. Almeida: "Resistivity ofNon-Fermi Liquid U2Pt2In Under Pressure", Physica B 281-282 (2000) 381-383.
• K. Prokeš, I.H. Hagmusa, P. Estrela, J.C.P. Klaasse, A.V. Andreev, V. Sechovský, E.H. Brückand F.R. de Boer: "Possible Non-Fermi-Liquid Behaviour in URh1/3Ni2/3Al", Physica B 281-282 (2000) 377-378.
• L.C.J. Pereira, M. Almeida, P. Estrela, M. Godinho, J. Rebizant, J.C. Spirlet, R.P. Pinto,M.M. Amado, M.E. Braga and J.B. Sousa: "Magnetic and Transport Properties of U2Pt2InSingle Crystals", J. Magn. Magn. Mater. 196-197 (1999) 885-887.
Published work 171
• L. Shłyk, J.C. Waerenborgh, P. Estrela, L.E. De Long, A. de Visser and M. Almeida: "Non-Fermi-Liquid Behaviour of U3-xNi3Sn4-y Single Crystals", J. Phys.: Condens. Matter 11 (1999)3525-3534.
• P. Estrela, A. de Visser, F.R. de Boer, G.J. Nieuwenhuys, L.C.J. Pereira and M. Almeida:"Non-Fermi-Liquid Behaviour in U2Pt2In", Physica B 259-261 (1999) 409-411.
• L. Shłyk, J.C. Waerenborgh, P. Estrela, A. de Visser, L.E. De Long, A.M. Gurevich and M.Almeida: "Non-Fermi Liquid Behavior in U3-xNi3Sn4-y Single Crystals", Physica B 259-261(1999) 423-425.
• J.A. Paixão, L.C.J. Pereira, P. Estrela, M. Godinho, M. Almeida, L. Paolasini, M. Bonnet, J.Rebizant and J.C. Spirlet: "Magnetization Density Distribution in U2Co2Sn", J. Phys.:Condens. Matter 11 (1999) 2115-2125.
• P. Estrela, L.C.J. Pereira, A. de Visser, F.R. de Boer, M. Almeida, M. Godinho, J. Rebizantand J.C. Spirlet: "Structural, Magnetic and Transport Properties of Single-CrystallineU2Pt2In", J. Phys.: Condens. Matter 10 (1998) 9465-9475.
• L.C.J. Pereira, J.A. Paixão, P. Estrela, M. Godinho, F. Boudarot, M. Bonnet, J. Rebizant, J.C.Spirlet and M. Almeida: "A Single-Crystal Magnetization and Neutron ScatteringInvestigation of the Magnetic Structure of U2Rh2Sn", J. Phys.: Condens. Matter 8 (1996)11167-11179.
Other publications:
° A.P. Gonçalves, P. Estrela, J.C. Waerenborgh, J.A. Paixão, M. Bonnet, J.C. Spirlet, M.Godinho and M. Almeida: "Crystallographic and Magnetic Properties of UFe5.8Al6.2 SingleCrystals", J. Magn. Magn. Mater. 189 (1998) 283-292.
° P. Estrela, A.P. Gonçalves, M. Godinho, M. Almeida and J.C. Spirlet: "Single CrystalMagnetisation of UFe10Mo2", J. Magn. Magn. Mater. 167 (1997) L185-L188.
° J. Ayres de Campos, J.M. Gil, P.J. Mendes, L.P. Ferreira, I.C. Ferreira, N. Ayres de Campos,P. Estrela, M. Godinho, M. Bououdina, A. Collomb, D. Fruchart, J.L. Soubeyroux, S. Takele,J. Pelloth and R.A. Brand: "Magnetic Phase Transitions in RFe9.5Mo2.5 Intermetallics Studiedby 57Fe Mössbauer Spectroscopy, Magnetisation and µ+SR", J. Magn. Magn. Mater. 164(1996) 305-318.
° M. Godinho, P. Estrela, A.P. Gonçalves, M. Almeida, J.C. Spirlet and G. Bonfait:"Anomalous Magnetisation Process in UFe4Al8 Probed by Magnetisation andMagnetoresistance", J. Magn. Magn. Mater. 157-158 (1996) 690-691.
° G. Bonfait, M. Godinho, P. Estrela, A.P. Gonçalves, M. Almeida and J.C. Spirlet: "GiantMagnetoresistance Anomaly Associated with a New Magnetisation Process in UFe4Al8",Phys. Rev. B 53 (1996) R480-R483.
Published work172
° P. Estrela, M. Godinho, A.P. Gonçalves, M. Almeida and J.C. Spirlet: "Magnetic Propertiesof UFe10Si2 Single Crystal", J. Alloys Compounds 230 (1995) 35-41.
° A.P. Gonçalves, G. Bonfait, M. Almeida, P. Estrela, M. Godinho and J.C. Spirlet: "Structuraland Magnetic Properties of UFexM12-x (M=Al, Mo and Si) Intermetallic Compounds", J.Magn. Magn. Mater. 140-144 (1995) 1419-1420.
° A.P. Gonçalves, P. Estrela, J.C. Waerenborgh, M. Godinho, M. Almeida and J.C. Spirlet:"Structural and Physical Properties of UFe10Mo2", J. Alloys Compounds 218 (1995) 183-189.
° P. Estrela, C. Abílio, M. Godinho, J.L. Tholence and J.J. Capponi: "The Irreversibility Line ofthe Superconducting Compound HgBa2Ca3Cu4O10+δ", Physica C 235-240 (1994) 2731-2732.
Acknowledgements
I would like to thank the European Commission for a Marie Curie Fellowship within the
Training and Mobility of Researchers programme (contract ERBFMBICT961763). I also
acknowledge the Fundação Calouste Gulbenkian (Portugal) for partially financing my initial
period in Amsterdam through a "Bolsa de Doutoramento". Further logistic support was given by
the Universiteit van Amsterdam.
I'm much obliged to my supervisors for accepting me as a Ph.D. student. The positive
outcome of this work would not have been possible without the continuous scientific guidance,
incentive and friendship of Anne de Visser. I learned a lot from him and I thank him for
everything he has done for me. Frank de Boer always accompanied, discussed and commented on
my work in a very constructive way. I thank him for his kind and competent supervision.
I am grateful to my Portuguese co-workers and sample providers for a fruitful
collaboration: Laura Pereira (ITN), António Gonçalves (ITN), Manuel Almeida (ITN) and
Margarida Godinho (FCUL). Also Larisa Shłyk (NAS Ukraine) is acknowledged for providing
the single crystals of U3Ni3Sn4.
Special thanks are given to Ronald Keizer and Rob van Schaijk. Their precious help (and
patience) strongly contributed to a successful experimental work. The pressure experiments were
carried out together with Takashi Naka (NRIM Tsukuba). I thank him for a fun collaboration.
I had the pleasure to collaborate and discuss problems related to the µSR experiments with
Ge Nieuwenhuys (RUL), Alex Schenck (ETH Zürich) and Alex Amato (PSI). I thank them for
their valuable input. I also would like to thank Mike Graf (Boston College), Chris Baines (PSI),
Daniel Andreica (ETH Zürich), Markus Pinkpank (ETH Zürich), Bob Heffner (LANL) and Fred
Gygax (ETH Zürich) for assistance during the experiments and useful discussions. The European
Acknowledgements174
Science Foundation is acknowledged for supporting some of the visits to the Paul Scherrer
Institute within the FERLIN programme.
I thank Alois Menovsky for teaching me crystal growth methods and procedures. Many
discussions with him gave me a better understanding of the problematic of sample preparation.
Agung Nugroho, Nitin Patil and Marian Mihalik are also acknowledged for giving me assistance
on the crystal growth attempts. I would like to thank Ton Gortenmulder (RUL) for the EPMA
analysis on many of the samples.
A special acknowledgement is made to Jaap Franse for his constant interest in my work
and the many group discussions. I also would like to thank Peter de Châtel and Ekkes Brück for
accepting to be part of my thesis committee and for valuable remarks on my work.
Many colleagues and friends have contributed for a pleasant four-year period in the Van
der Waals - Zeeman Institute. Besides the names already mentioned, I should also mention
Vincent Duijn, Michiel Hilbers, Dennis de Lang, Harry Duijn, Frank Kayzel, Yuri Janssen, Isam
Hagmusa, Leonid Ponomarenko, Cyril Opeil, Joost Peters, Michel Zwanenburg, Jeroen
Bongaerts and Mohamed Nazih.
I also acknowledge the technical and administrative staff of the Institute/University who, at
one moment or another, gave me some assistance, namely: Jenny Batson, Harry Beukers, Mariet
Bos, Derk Bouhuijs, Henk Gelders, Eddy Inoeng, Dick Jensen, Willem Moolhuijzen, Ton
Riemersma, Rene Rik, Marianne Roos, Piet Sannes, Hugo Schlatter and Bert Zwart.
I am deeply indebted to my parents and the rest of the family, who always supported me
and encouraged me in many ways. Thanks also to the friends (some closer than others), who
were always there for me.
I apologize if I forgot to mention someone. My only excuse is my policy of "democratic
forgetfulness", i.e. the tendency to forget things regardless of their level of importance, spatial
and temporal localization, race, sexual gender and orientation, religion or social status.