NEW MOBILITY IMPACTS - POLIS Network
23
Future of public transport in the era of emerging modes NEW MOBILITY IMPACTS Maaike Snelder, TNO and Delft University of Technology @UrbanismNextEU #UNextEU
Transcript of NEW MOBILITY IMPACTS - POLIS Network
Future of public transport in the era of emerging modes
NEW MOBILITY IMPACTS
Maaike Snelder, TNO and Delft University of Technology
@UrbanismNextEU #UNextEU
• Vehicle automation: cars and public transport• Impact on public transport usage• Mobility system design• From pilots to implementation• Conclusions
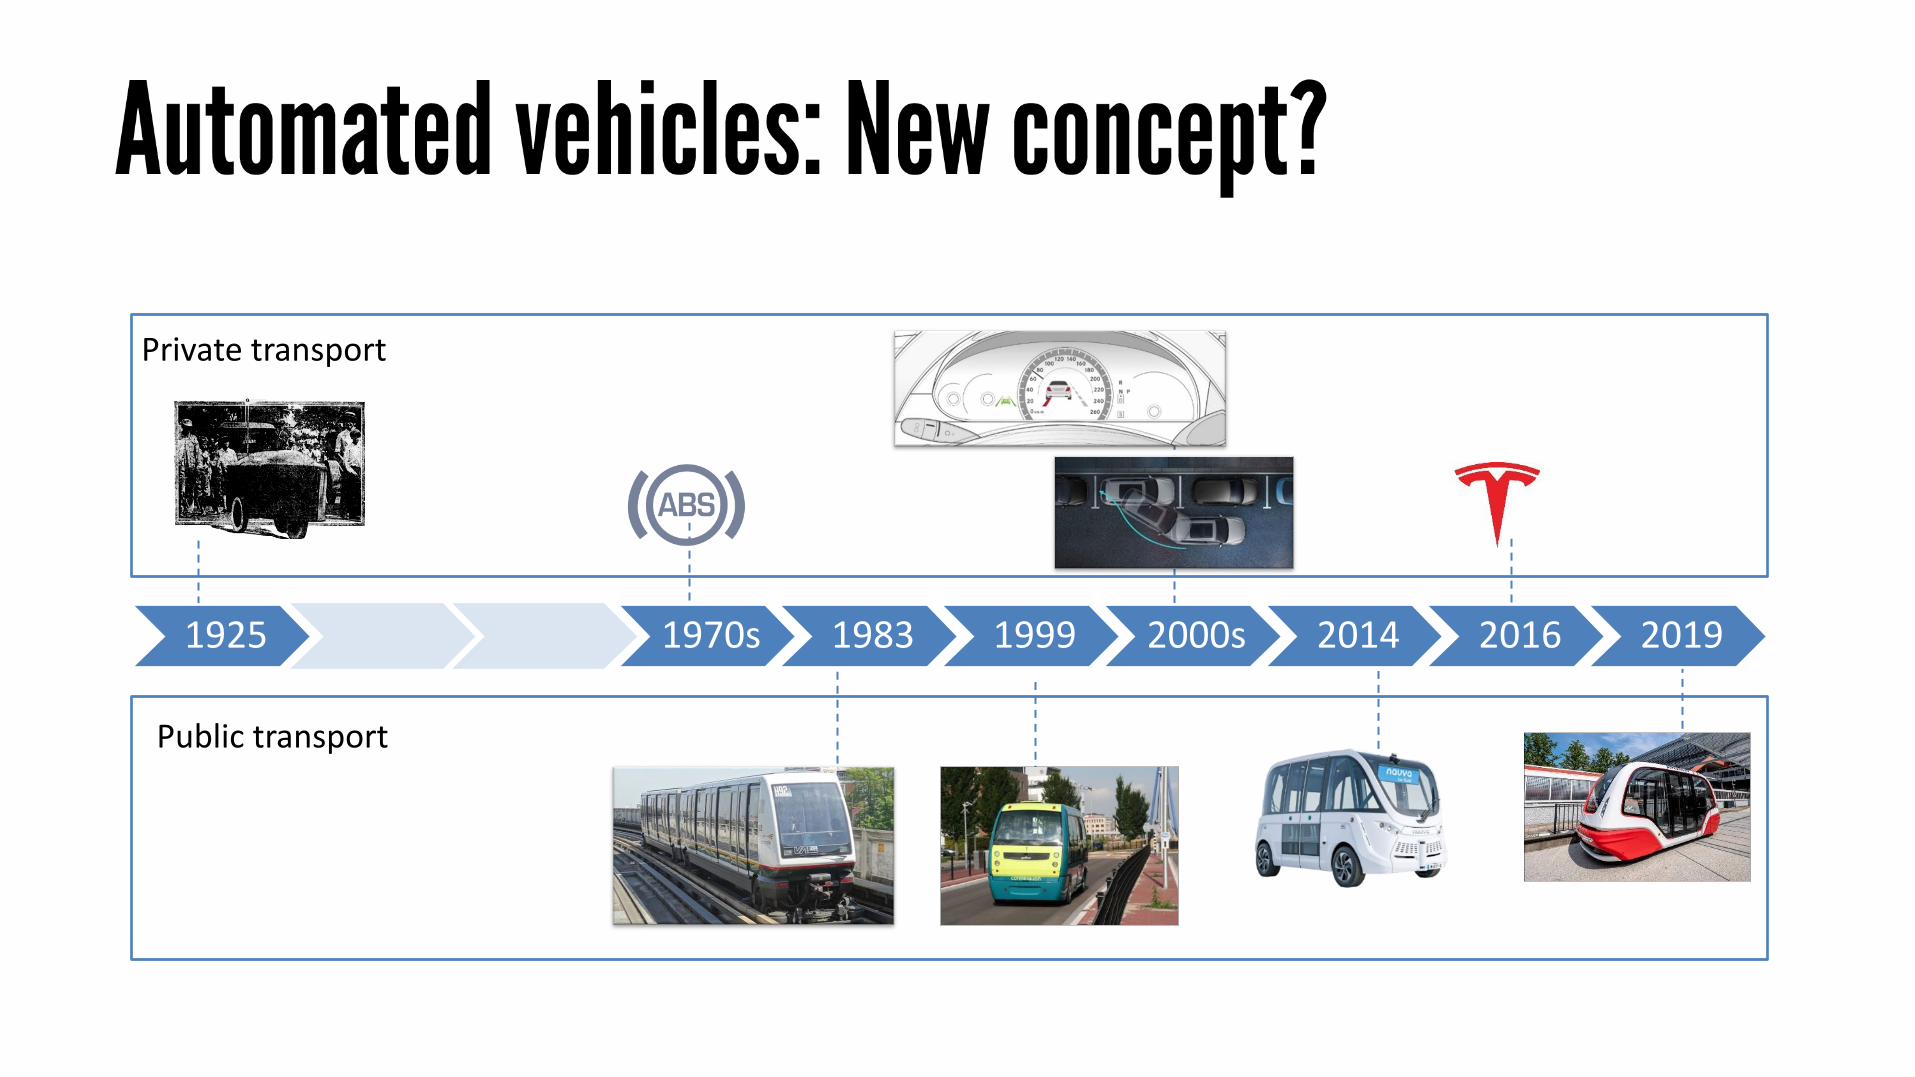
1925 1970s 1983 1999 2000s 2014 2016 2019
Private transport
Public transport
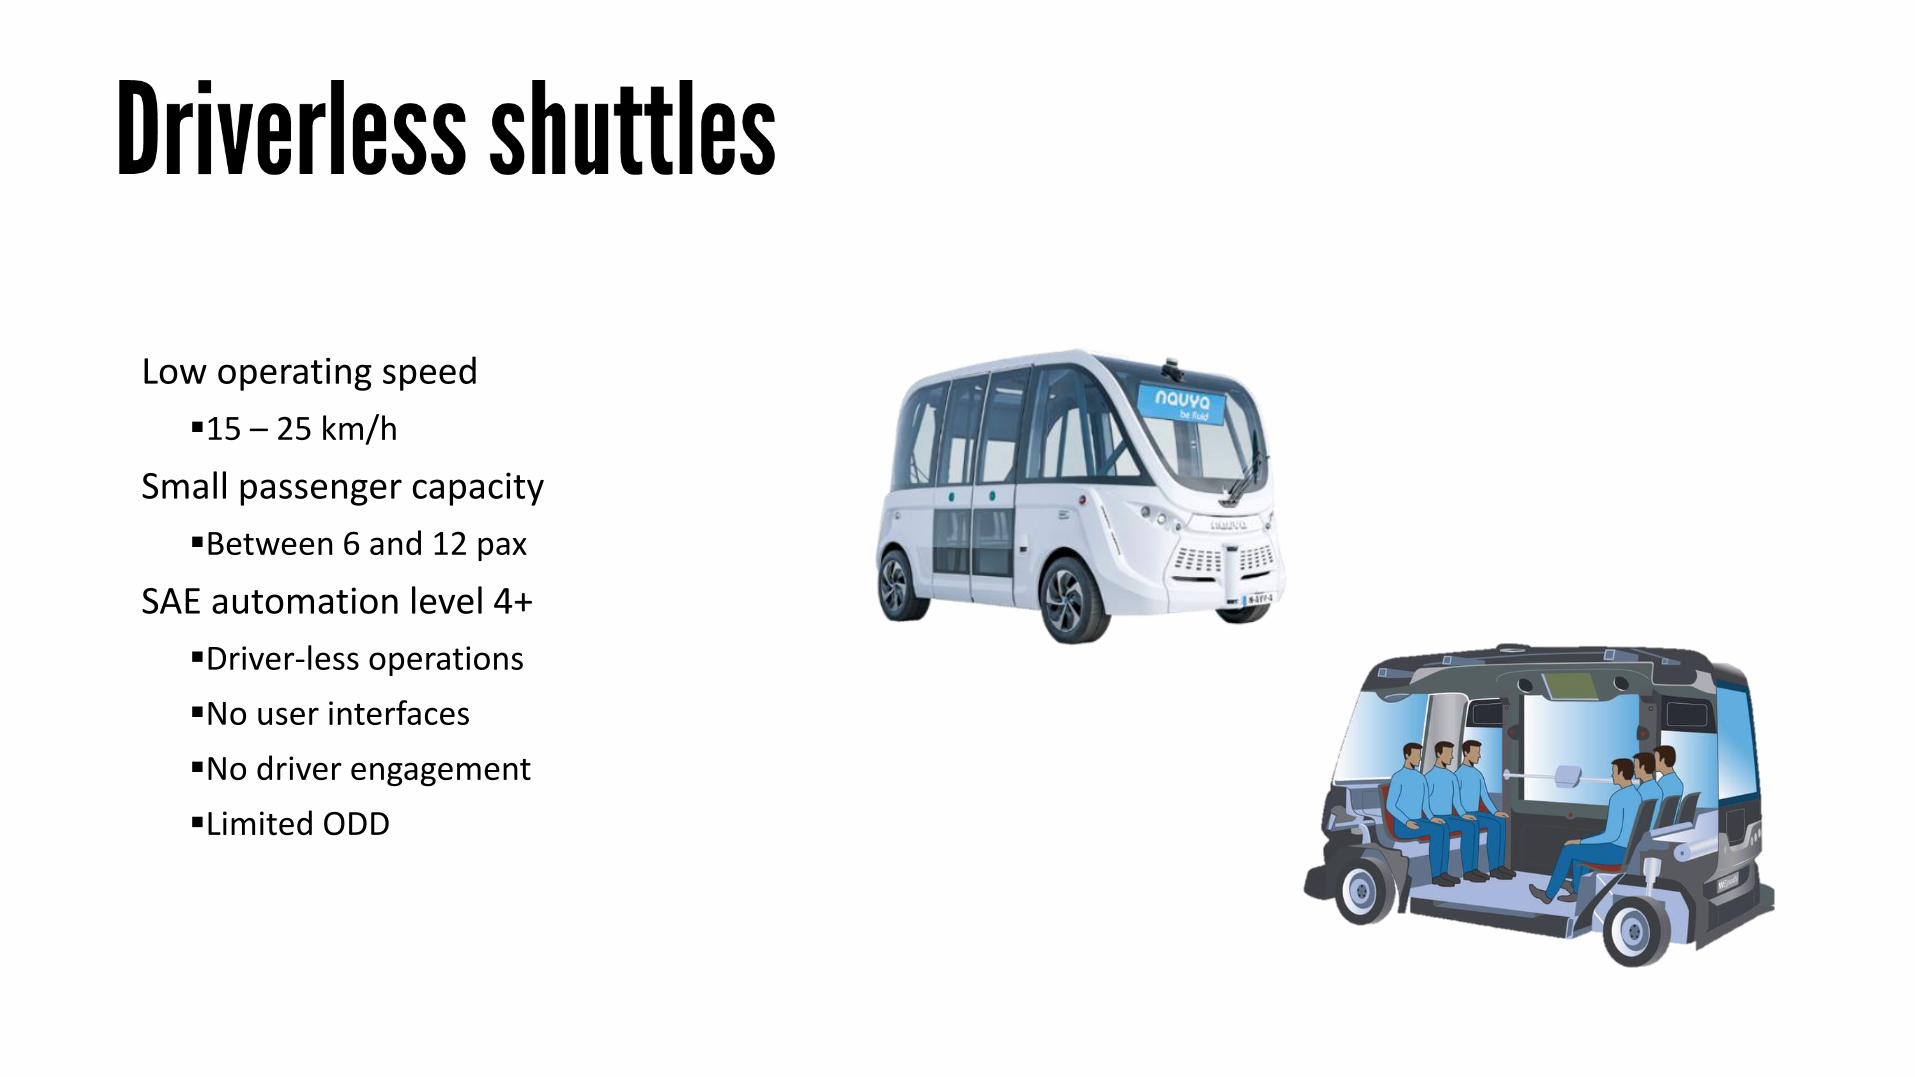
Low operating speed
▪15 – 25 km/h
Small passenger capacity
▪Between 6 and 12 pax
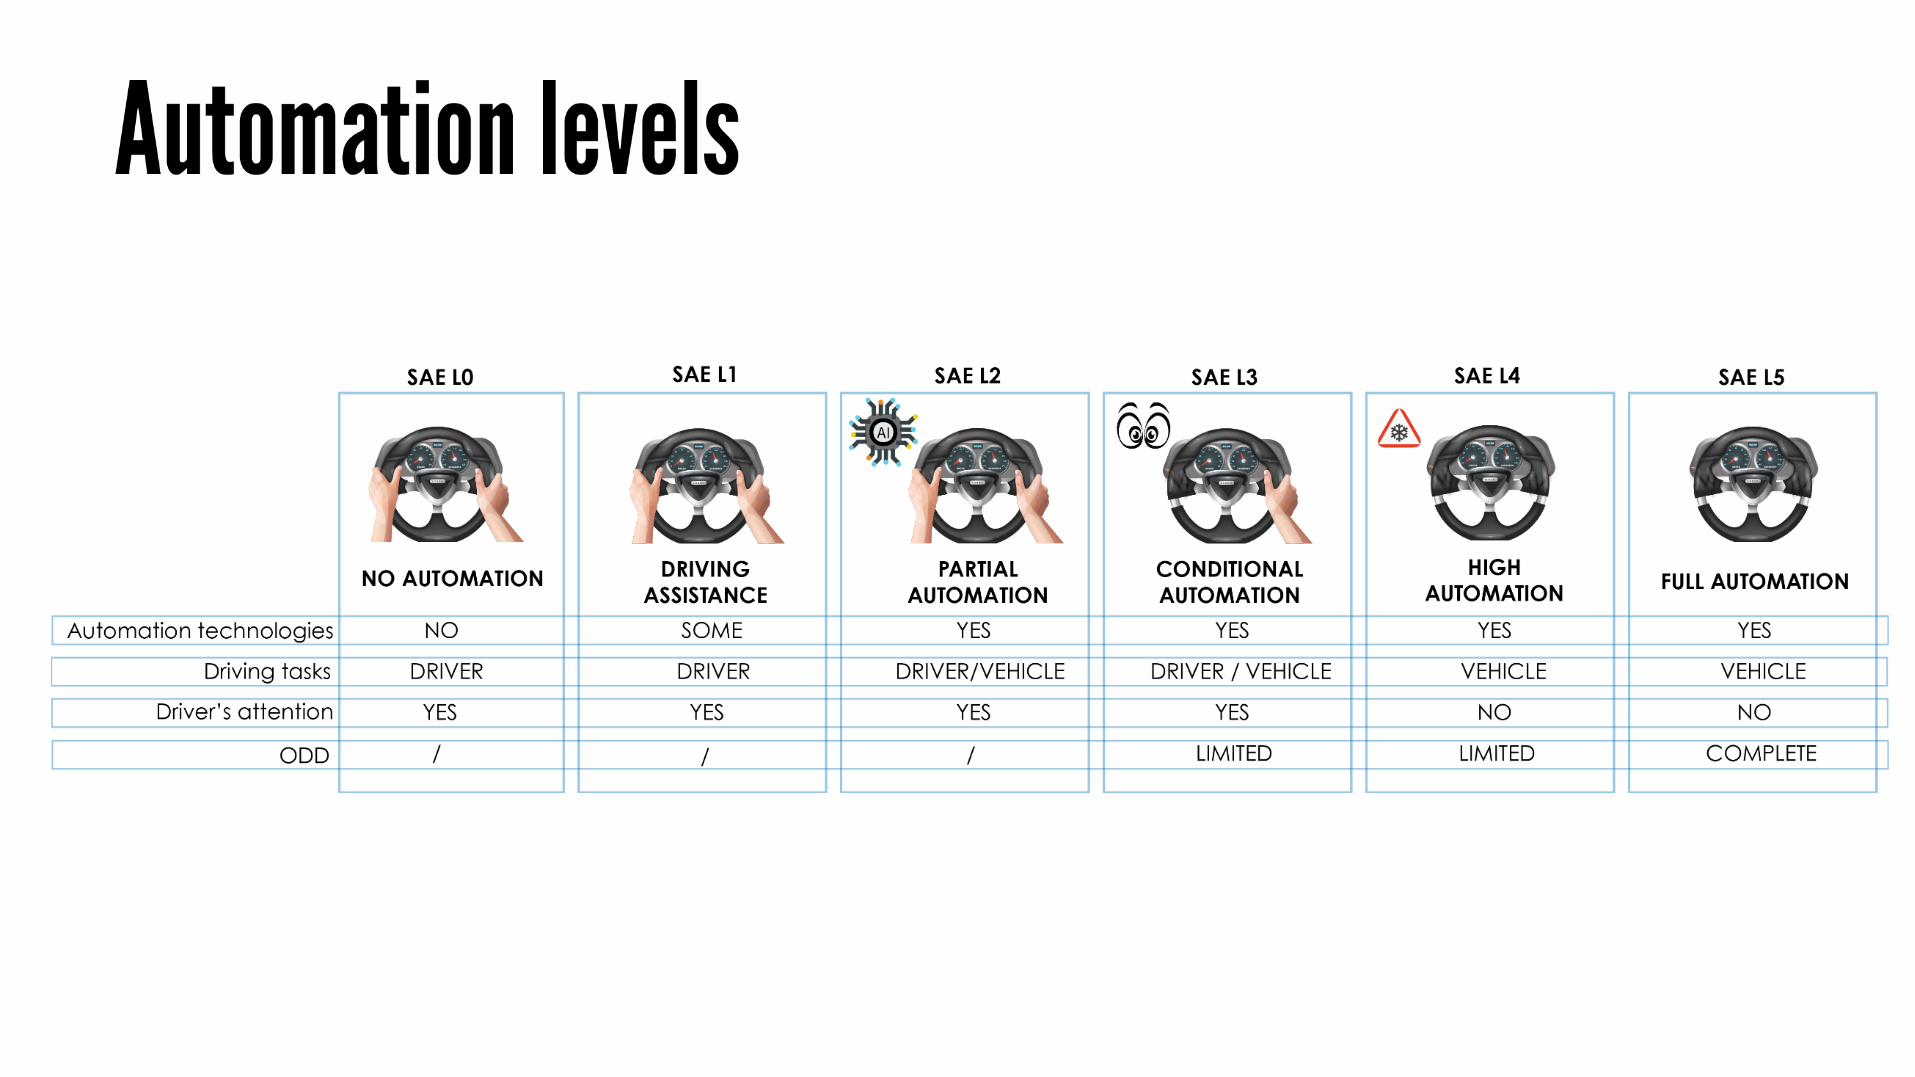
SAE automation level 4+
▪Driver-less operations
▪No user interfaces
▪No driver engagement
▪Limited ODD
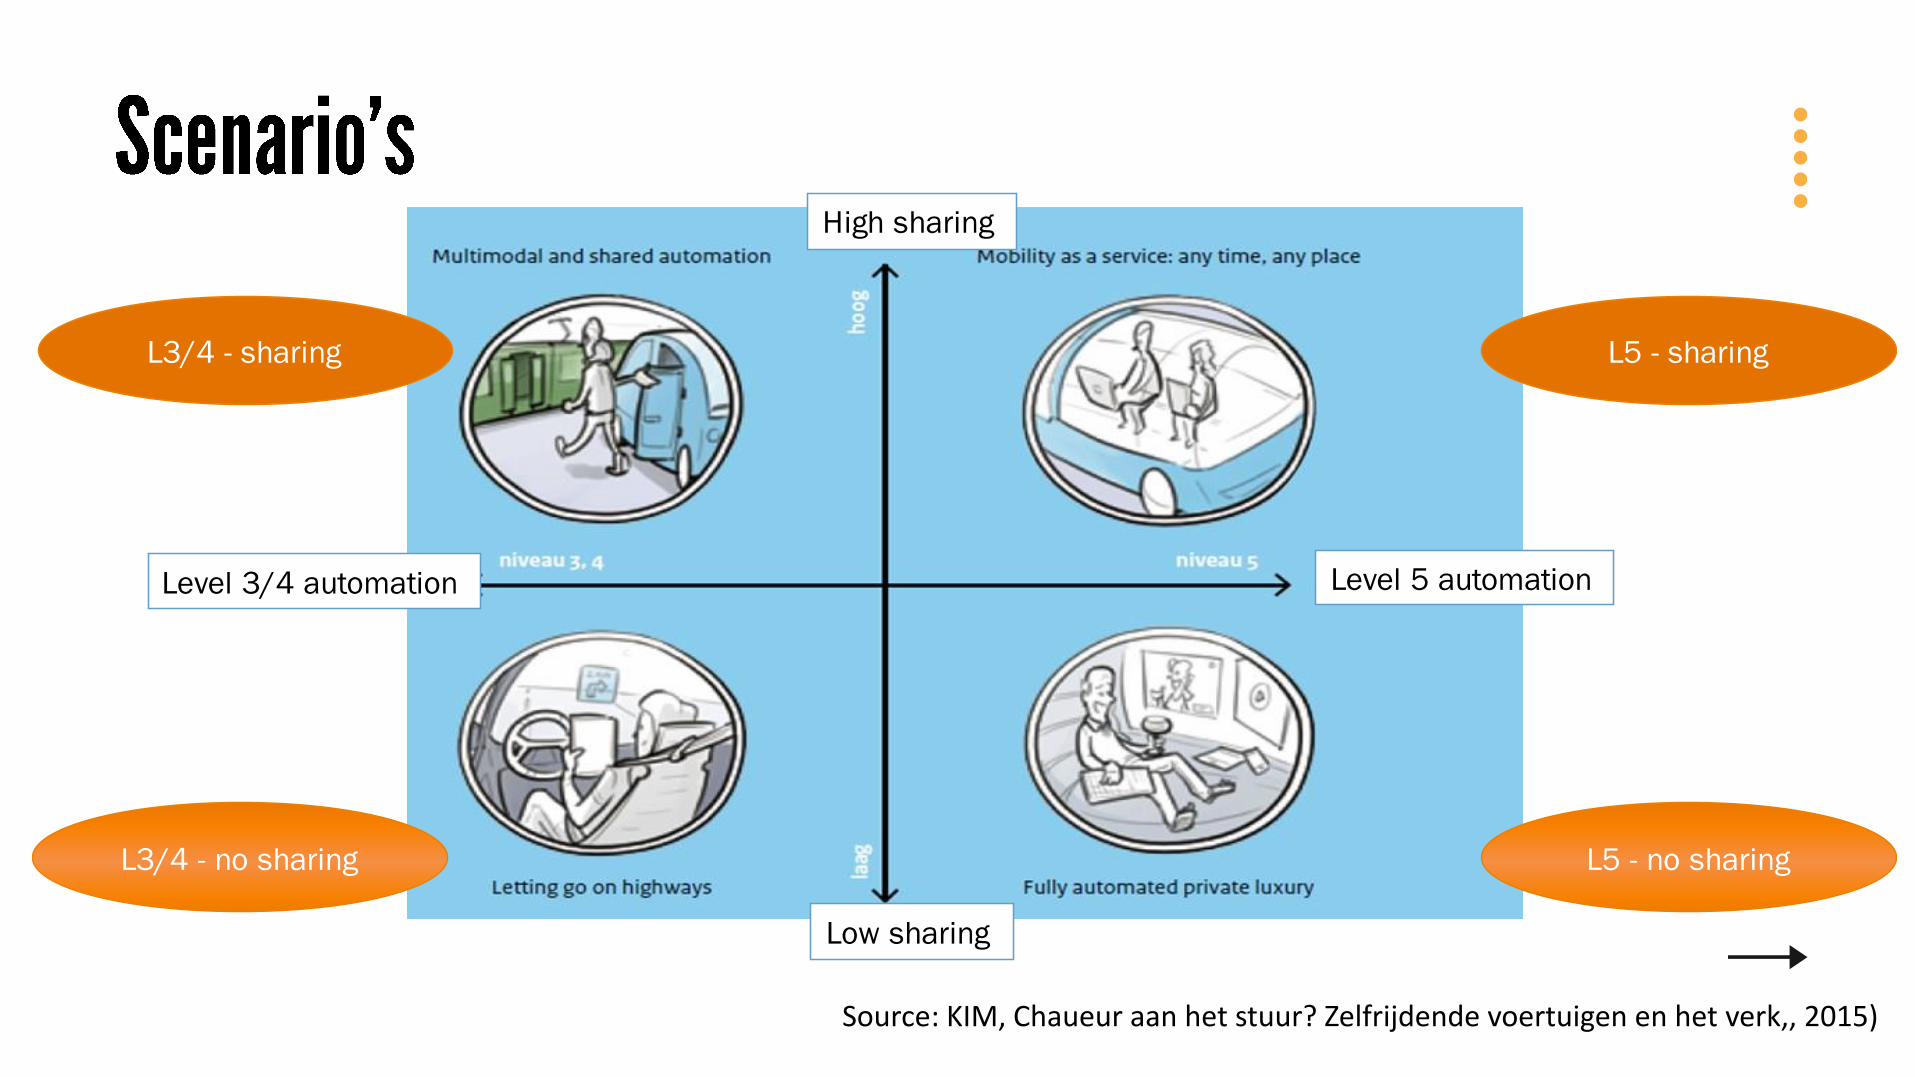
L3/4 - no sharing L5 - no sharing
L5 - sharingL3/4 - sharing
High sharing
Low sharing
Level 5 automationLevel 3/4 automation
Source: KIM, Chaueur aan het stuur? Zelfrijdende voertuigen en het verk,, 2015)
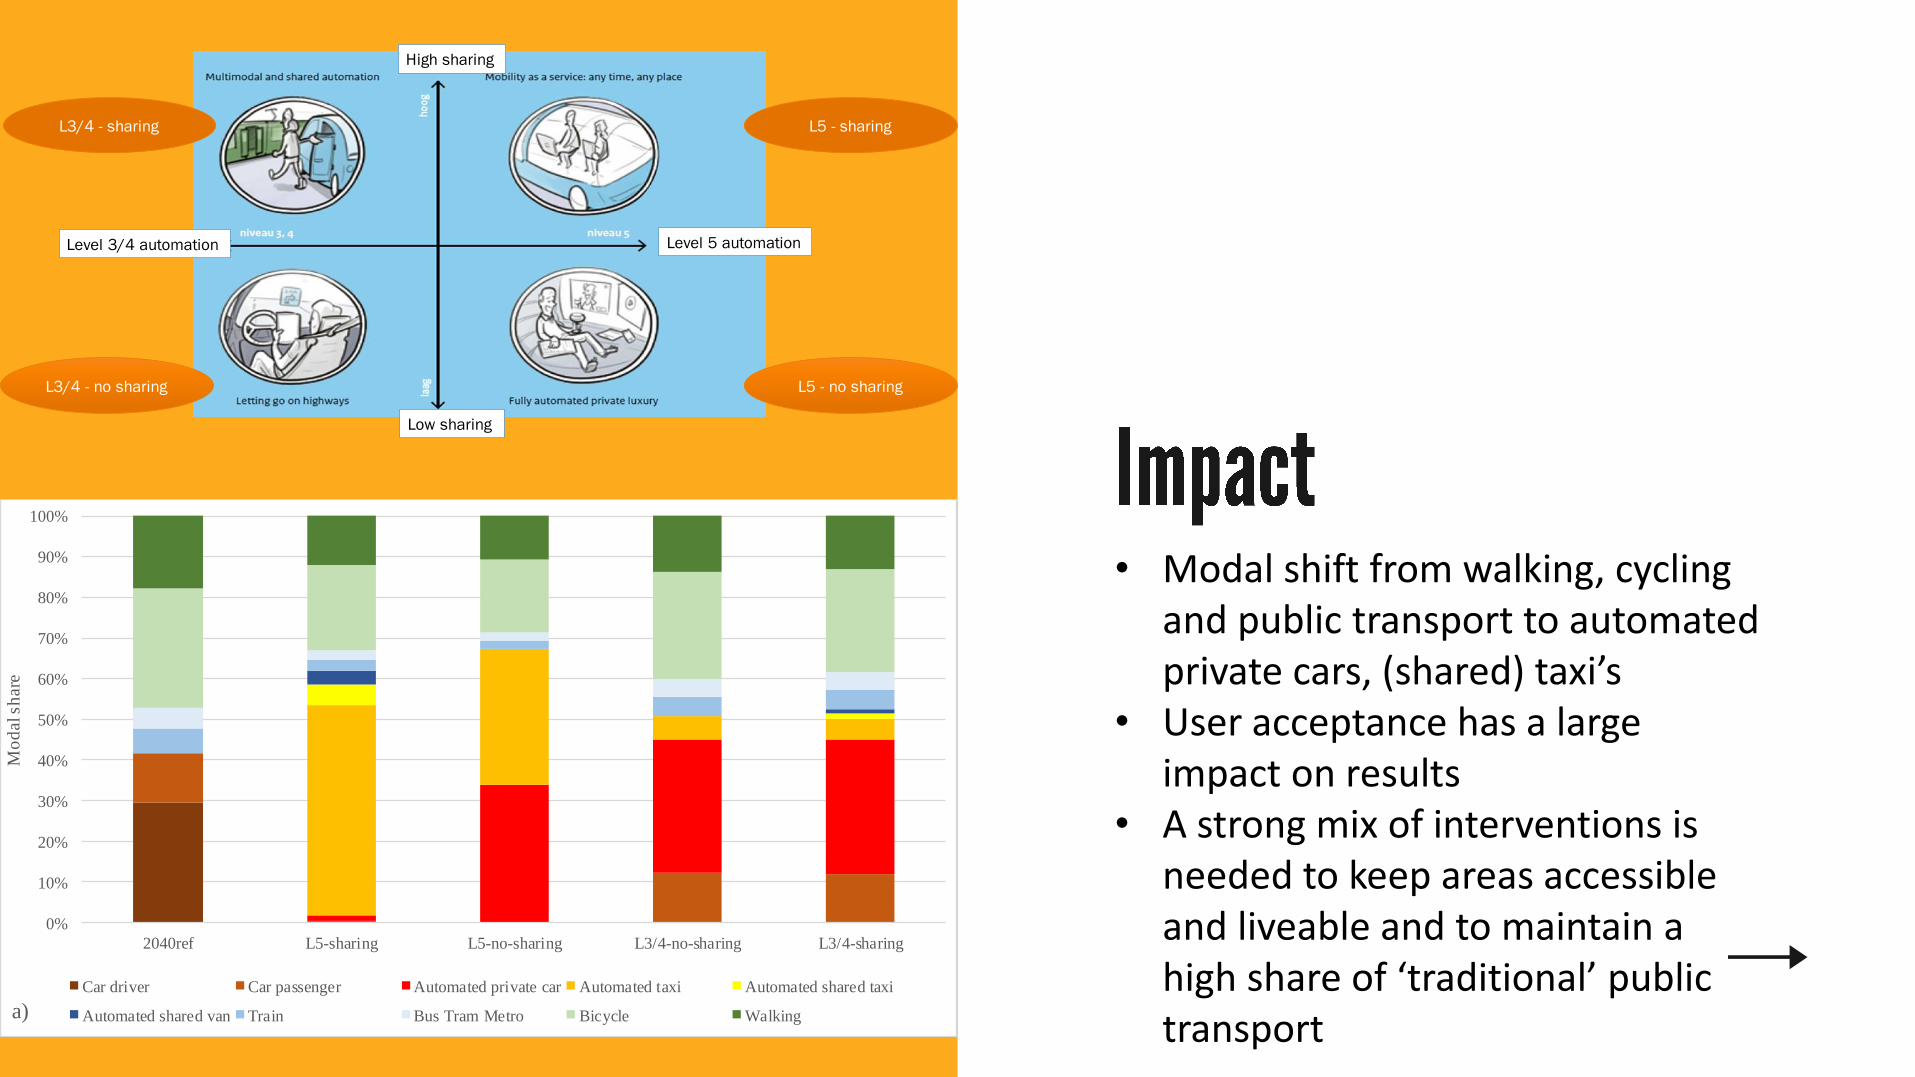
• Modal shift from walking, cycling and public transport to automated private cars, (shared) taxi’s
• User acceptance has a large impact on results
• A strong mix of interventions is needed to keep areas accessible and liveable and to maintain a high share of ‘traditional’ public transport
L3/4 - no sharing L5 - no sharing
L5 - sharingL3/4 - sharing
High sharing
Low sharing
Level 5 automationLevel 3/4 automation
0%
10%
20%
30%
40%
50%
60%
70%
80%
90%
100%
2040ref L5-sharing L5-no-sharing L3/4-no-sharing L3/4-sharing
Mo
dal sh
are
a)
Car driver Car passenger Automated private car Automated taxi Automated shared taxi
Automated shared van Train Bus Tram Metro Bicycle Walking
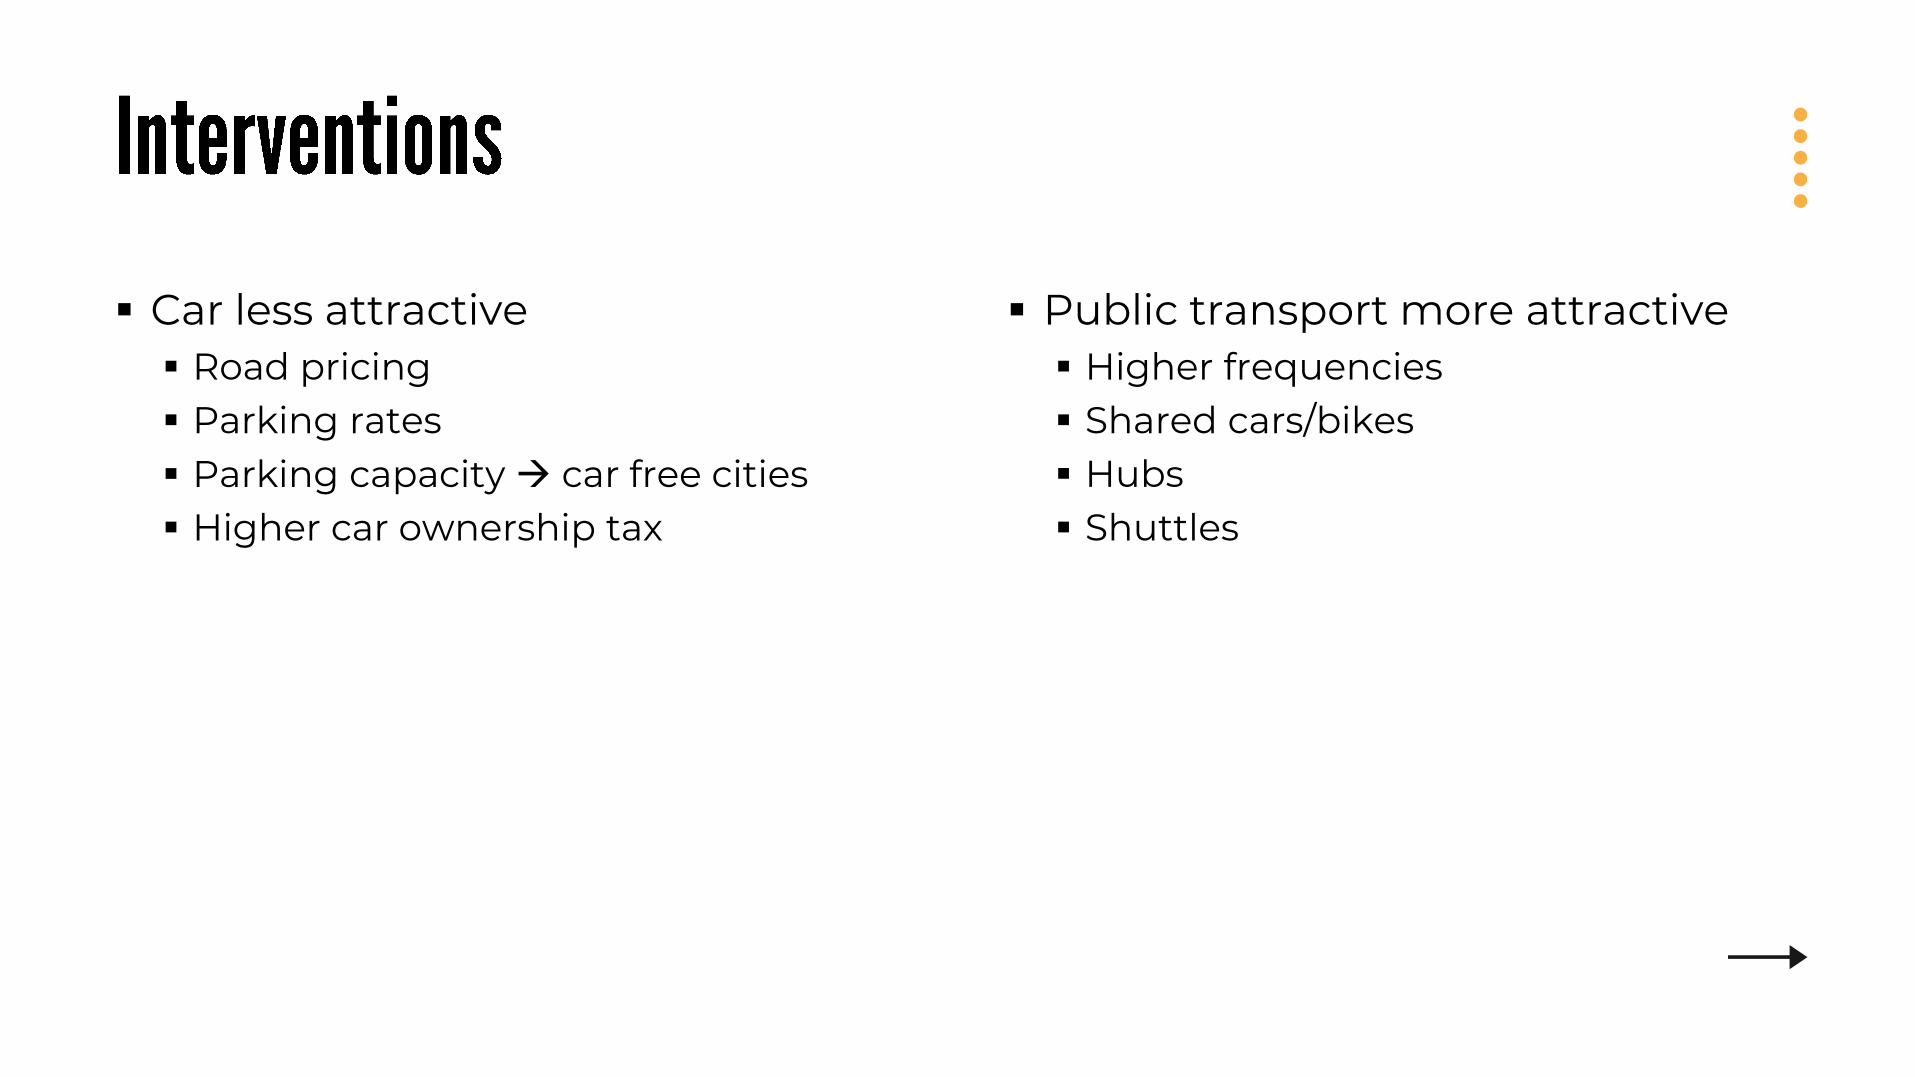
▪ Car less attractive▪ Road pricing▪ Parking rates▪ Parking capacity → car free cities▪ Higher car ownership tax
▪ Public transport more attractive▪ Higher frequencies▪ Shared cars/bikes▪ Hubs▪ Shuttles
0%
20%
40%
60%
80%
100%
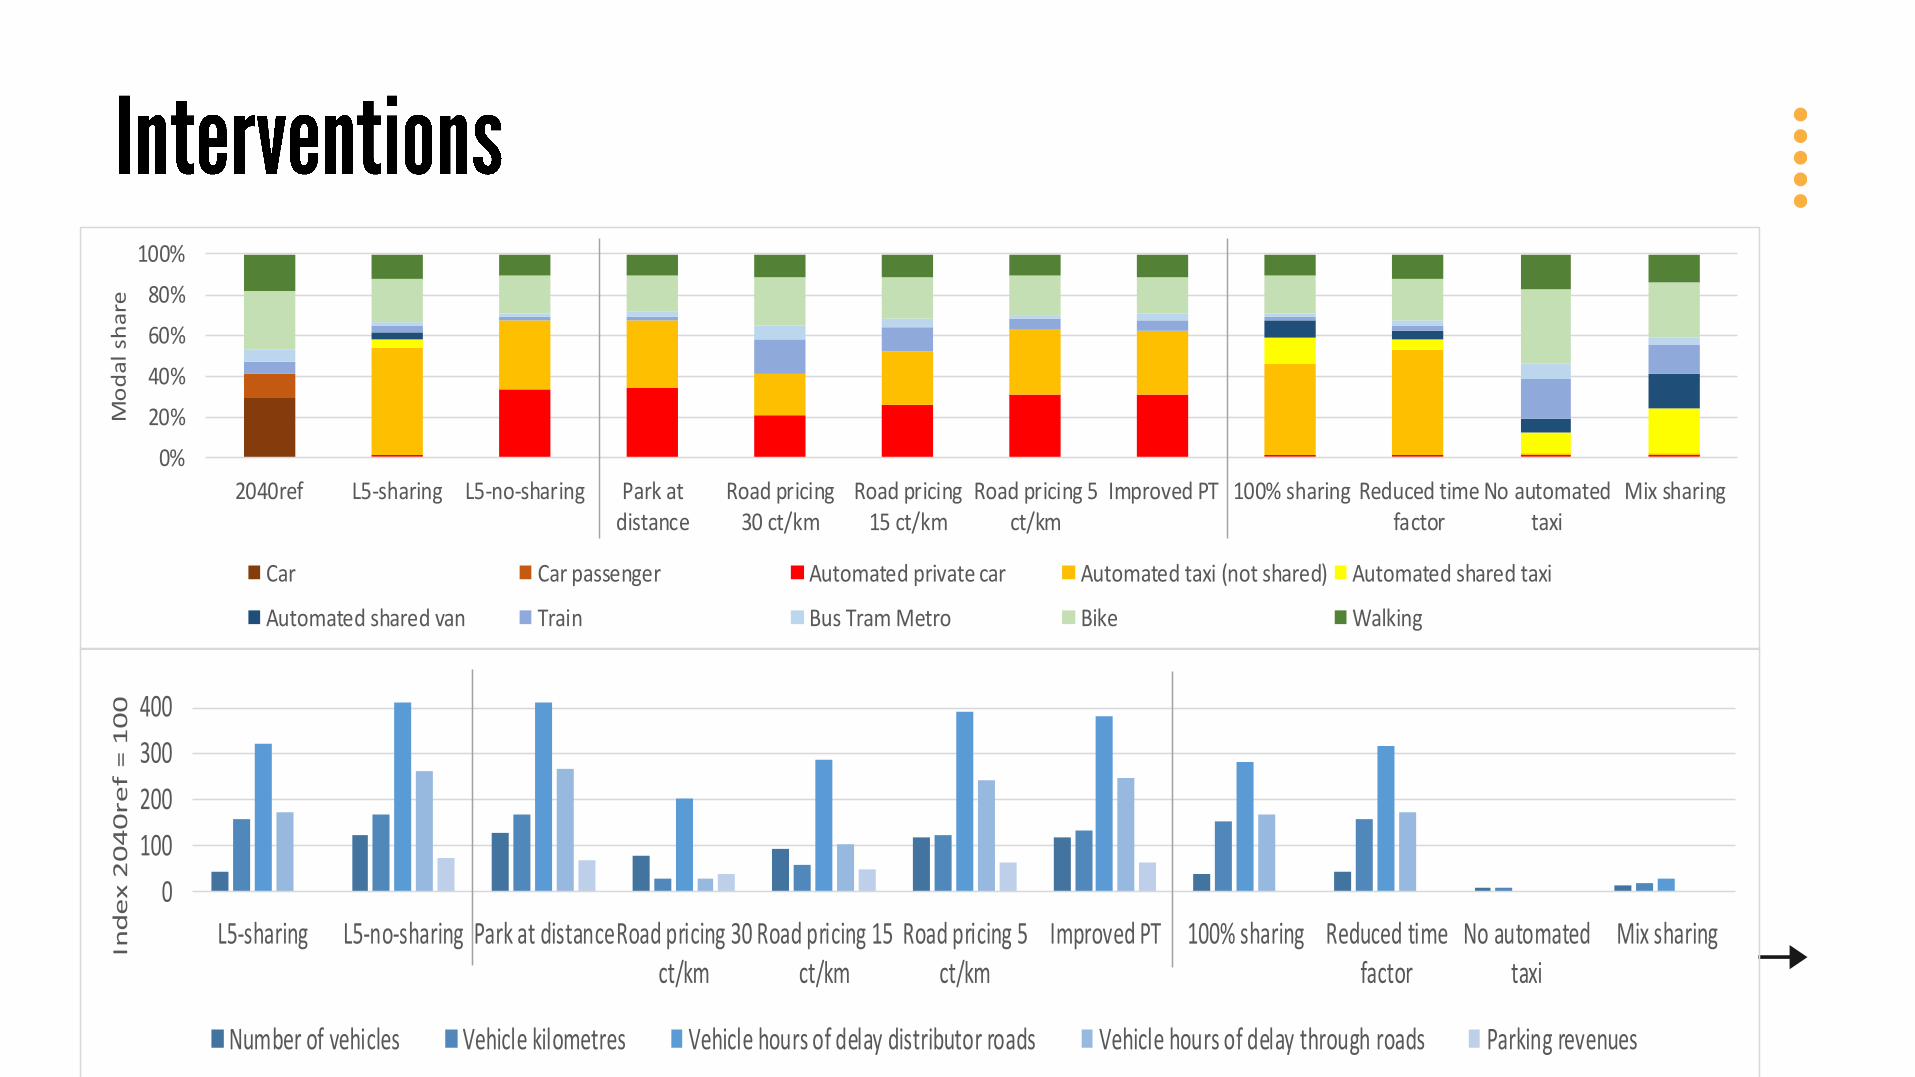
2040ref L5-sharing L5-no-sharing Park atdistance
Road pricing30 ct/km
Road pricing15 ct/km
Road pricing 5ct/km
Improved PT 100% sharing Reduced timefactor
No automatedtaxi
Mix sharing
Mo
da
l sh
are
Car Car passenger Automated private car Automated taxi (not shared) Automated shared taxi
Automated shared van Train Bus Tram Metro Bike Walking
0
100
200
300
400
L5-sharing L5-no-sharing Park at distanceRoad pricing 30ct/km
Road pricing 15ct/km
Road pricing 5ct/km
Improved PT 100% sharing Reduced timefactor
No automatedtaxi
Mix sharing
Ind
ex 2
04
0re
f =
10
0
Number of vehicles Vehicle kilometres Vehicle hours of delay distributor roads Vehicle hours of delay through roads Parking revenues
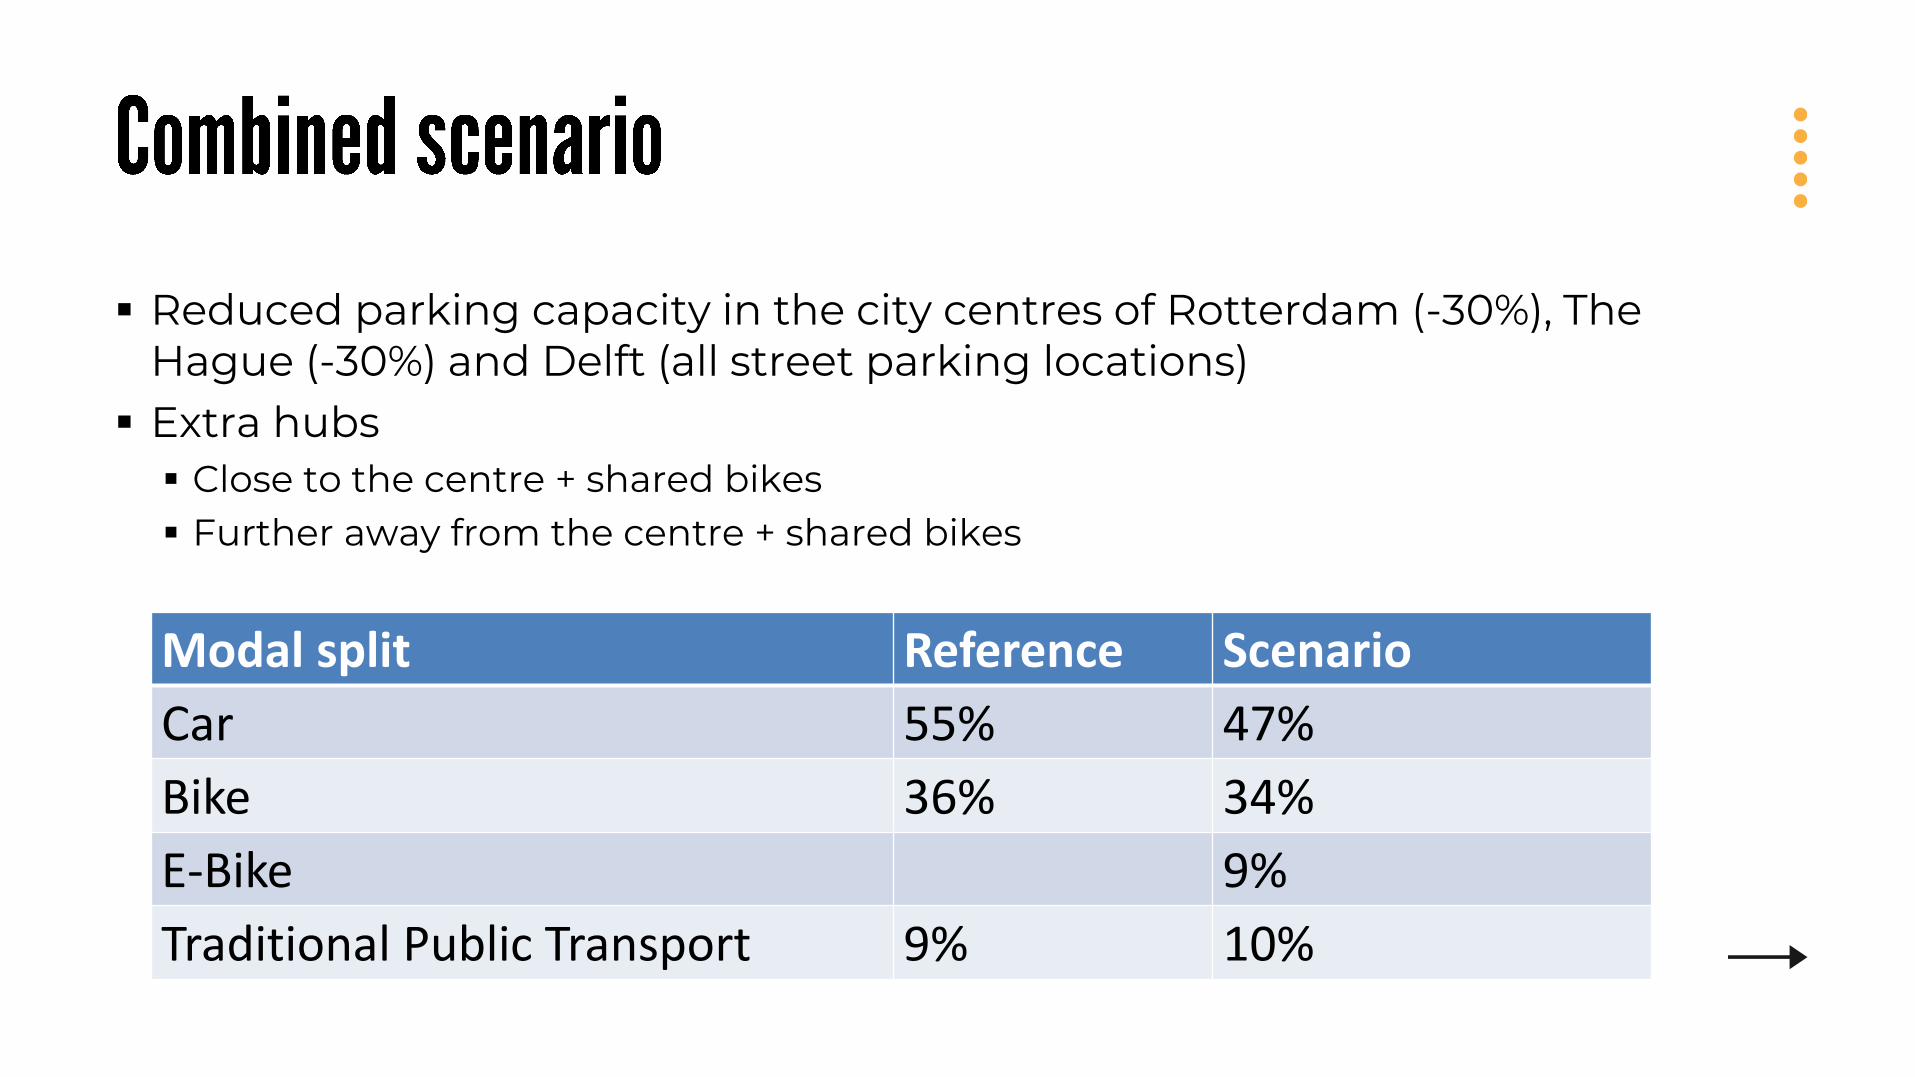
▪ Reduced parking capacity in the city centres of Rotterdam (-30%), The Hague (-30%) and Delft (all street parking locations)
▪ Extra hubs▪ Close to the centre + shared bikes▪ Further away from the centre + shared bikes
Modal split Reference Scenario
Car 55% 47%
Bike 36% 34%
E-Bike 9%
Traditional Public Transport 9% 10%
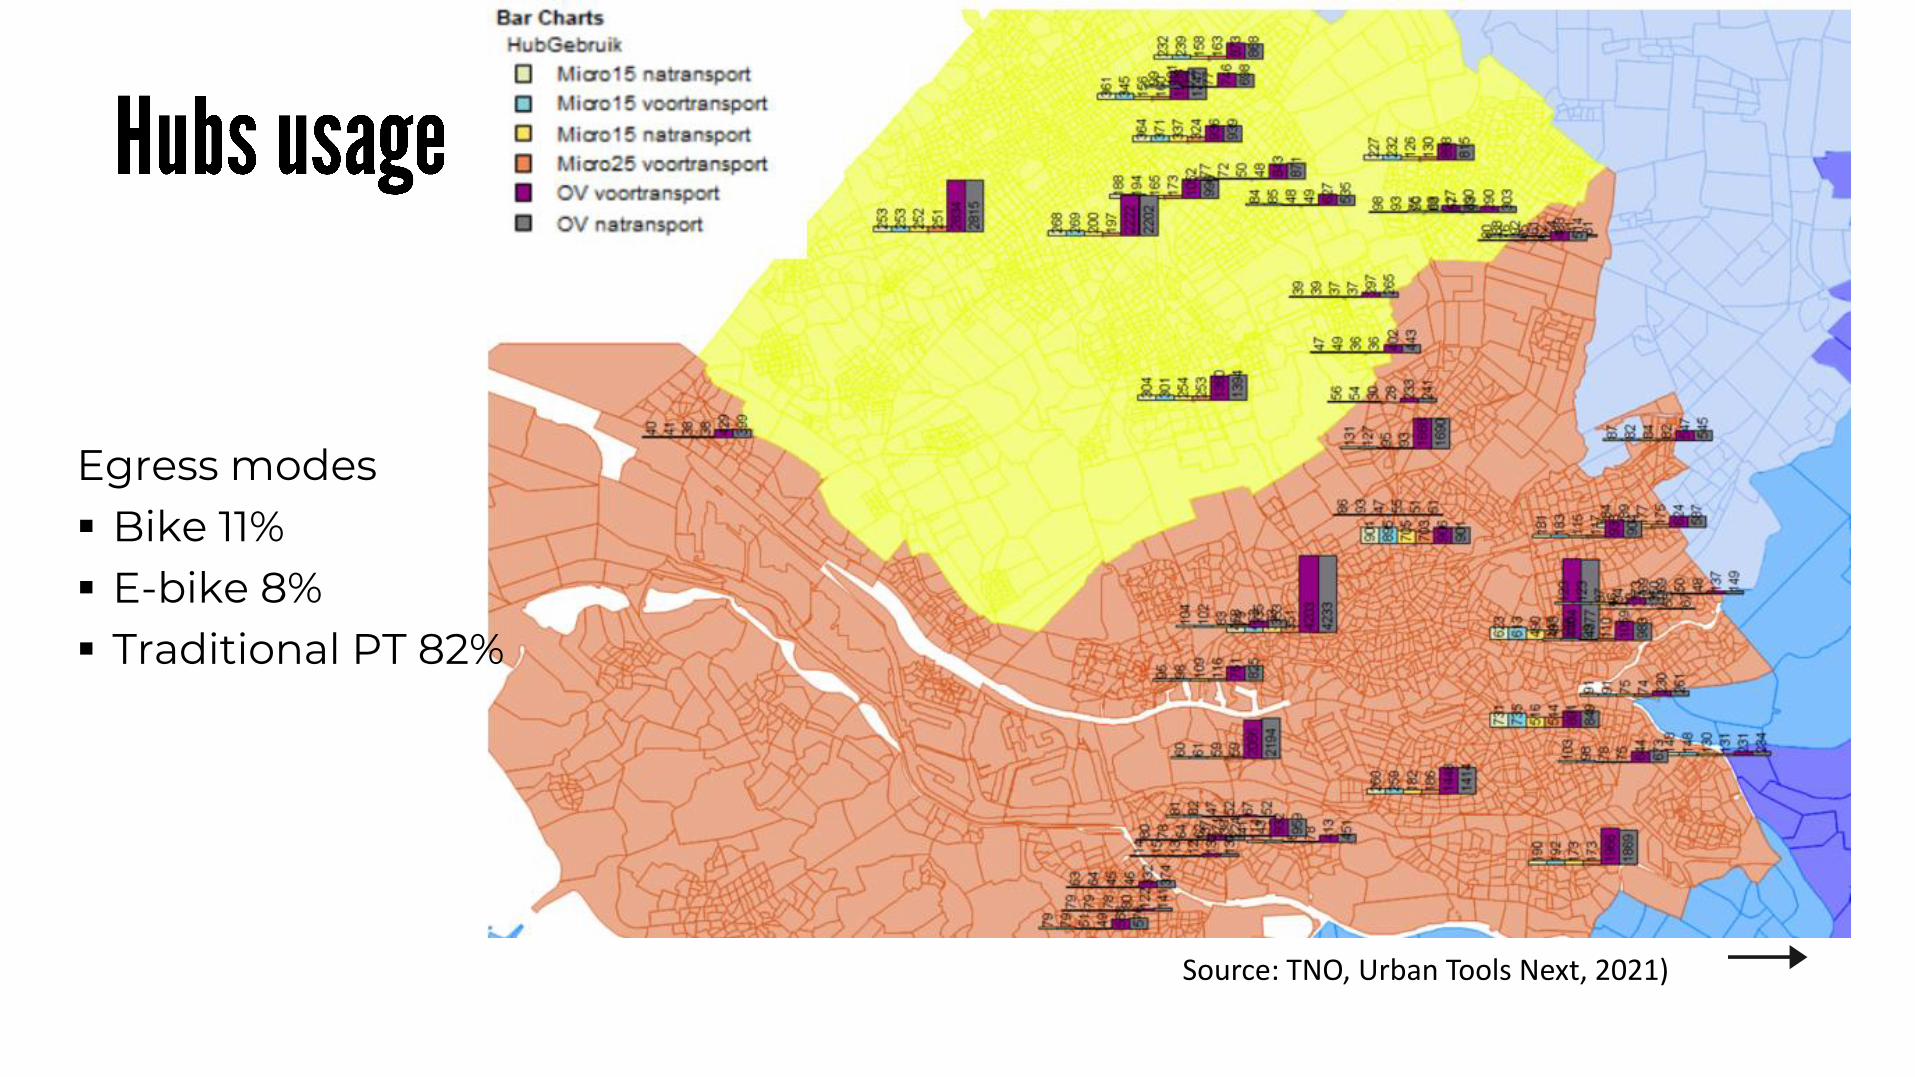
Egress modes▪ Bike 11%▪ E-bike 8%▪ Traditional PT 82%
Source: TNO, Urban Tools Next, 2021)
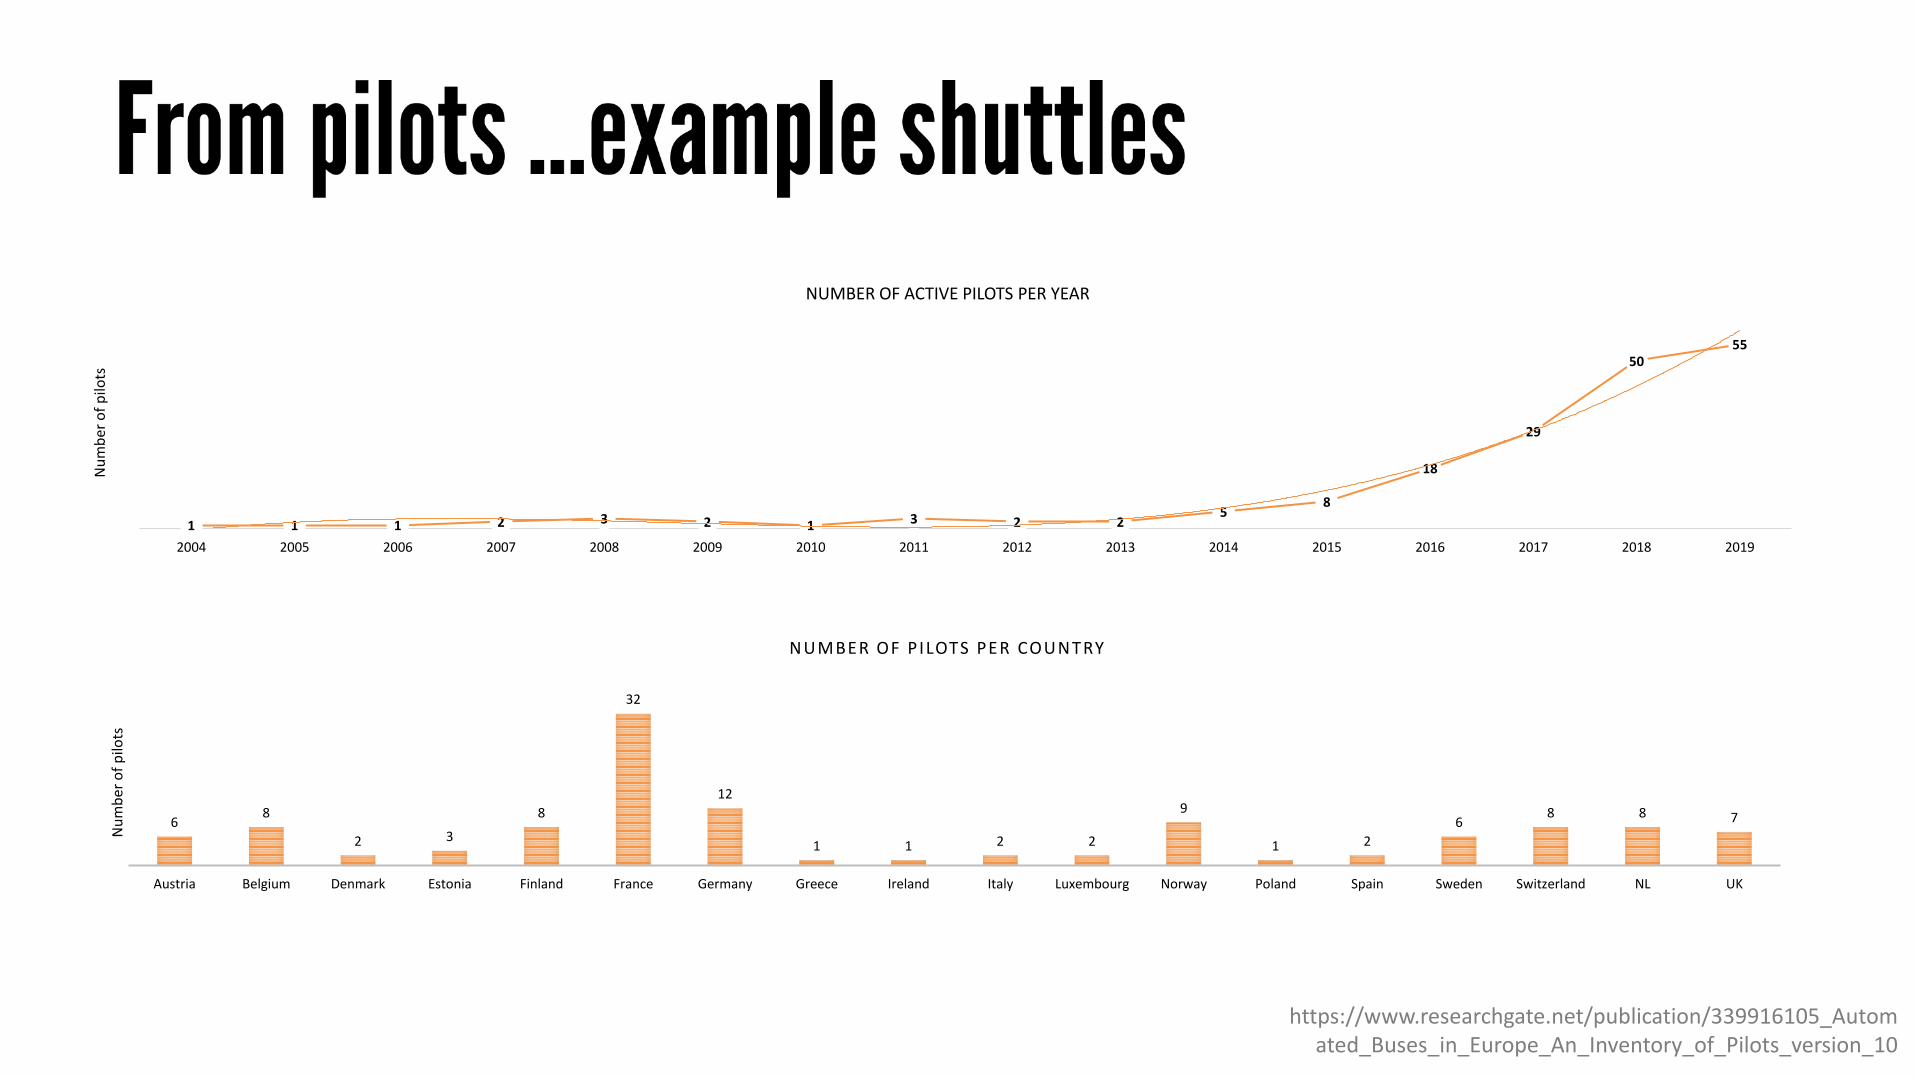
1 1 1 2 3 2 1 3 2 25
8
18
29
5055
2004 2005 2006 2007 2008 2009 2010 2011 2012 2013 2014 2015 2016 2017 2018 2019
Nu
mb
er o
f p
ilots
NUMBER OF ACTIVE PILOTS PER YEAR
68
2 3
8
32
12
1 1 2 2
9
1 2
68 8 7
Austria Belgium Denmark Estonia Finland France Germany Greece Ireland Italy Luxembourg Norway Poland Spain Sweden Switzerland NL UK
Nu
mb
er o
f p
ilots
NUMBER OF P ILOTS PER COUNTRY
https://www.researchgate.net/publication/339916105_Automated_Buses_in_Europe_An_Inventory_of_Pilots_version_10
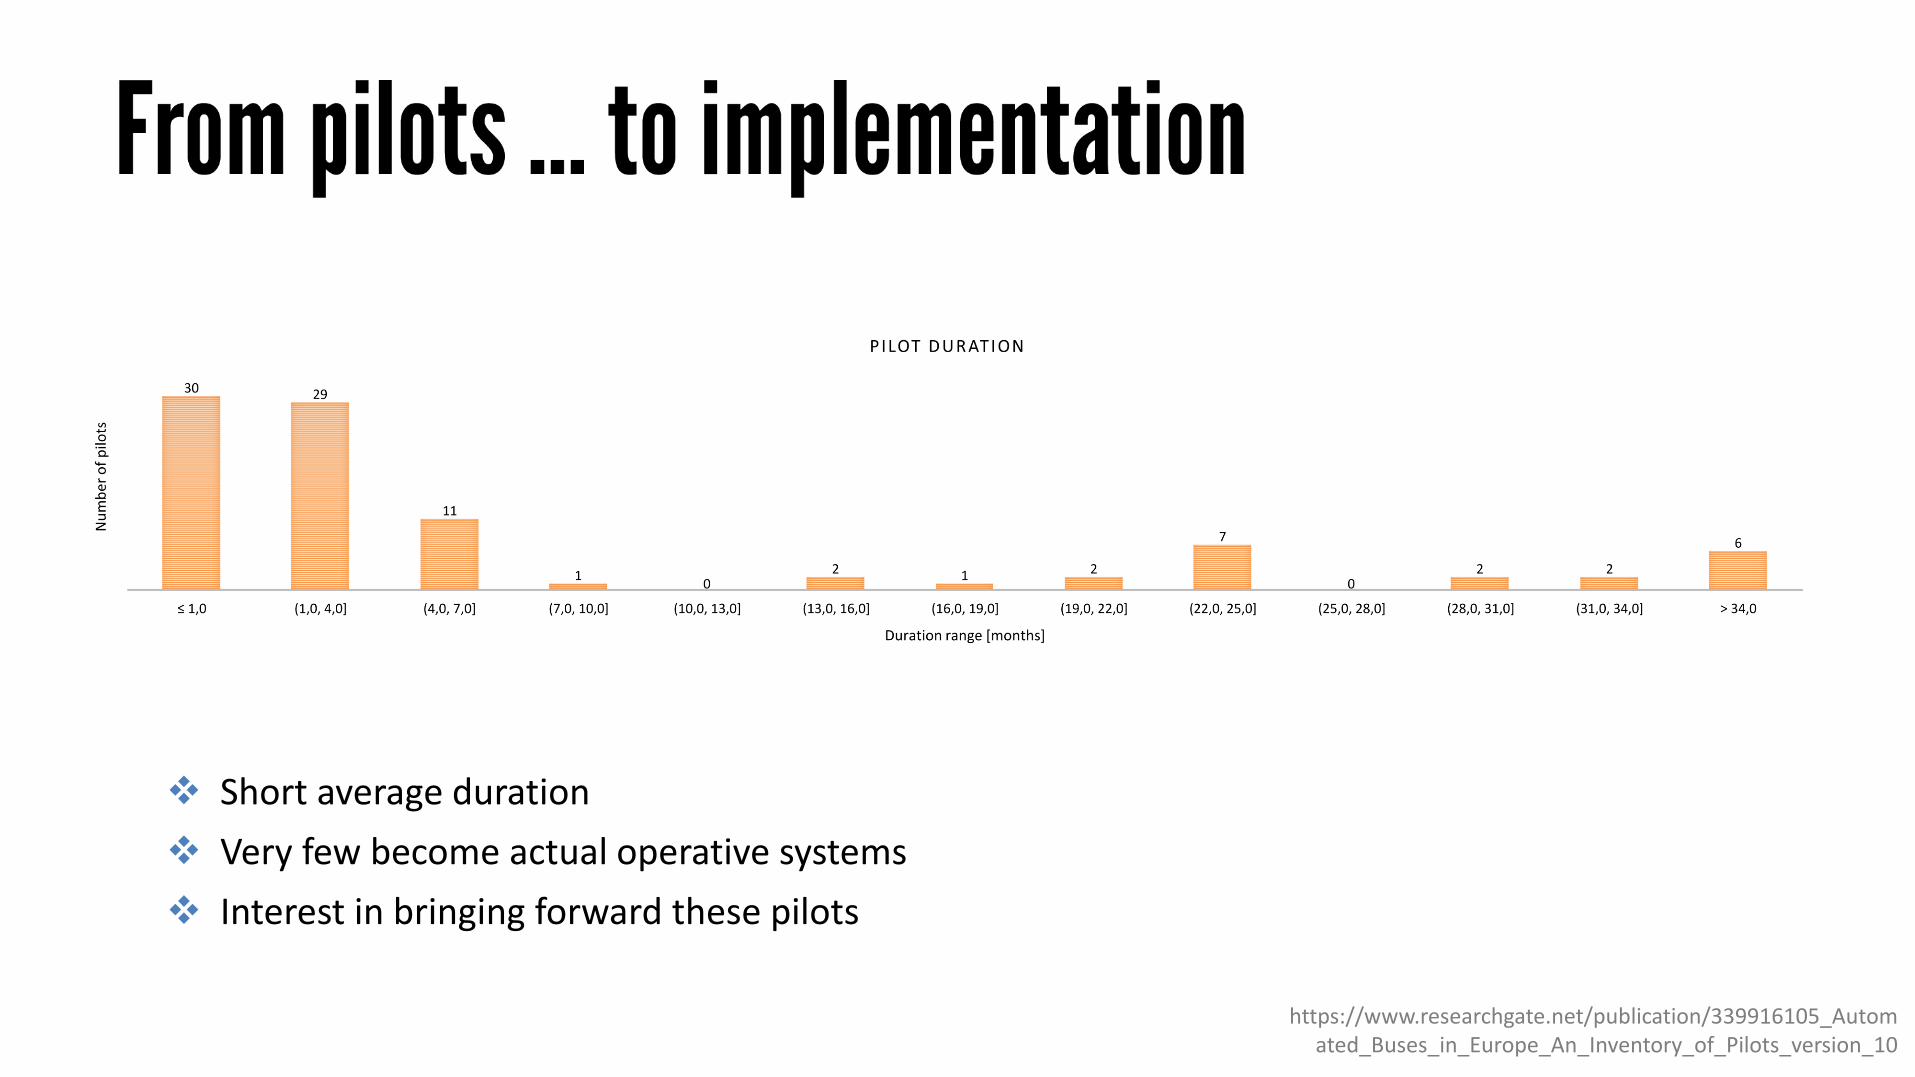
❖ Short average duration
❖ Very few become actual operative systems
❖ Interest in bringing forward these pilots
https://www.researchgate.net/publication/339916105_Automated_Buses_in_Europe_An_Inventory_of_Pilots_version_10
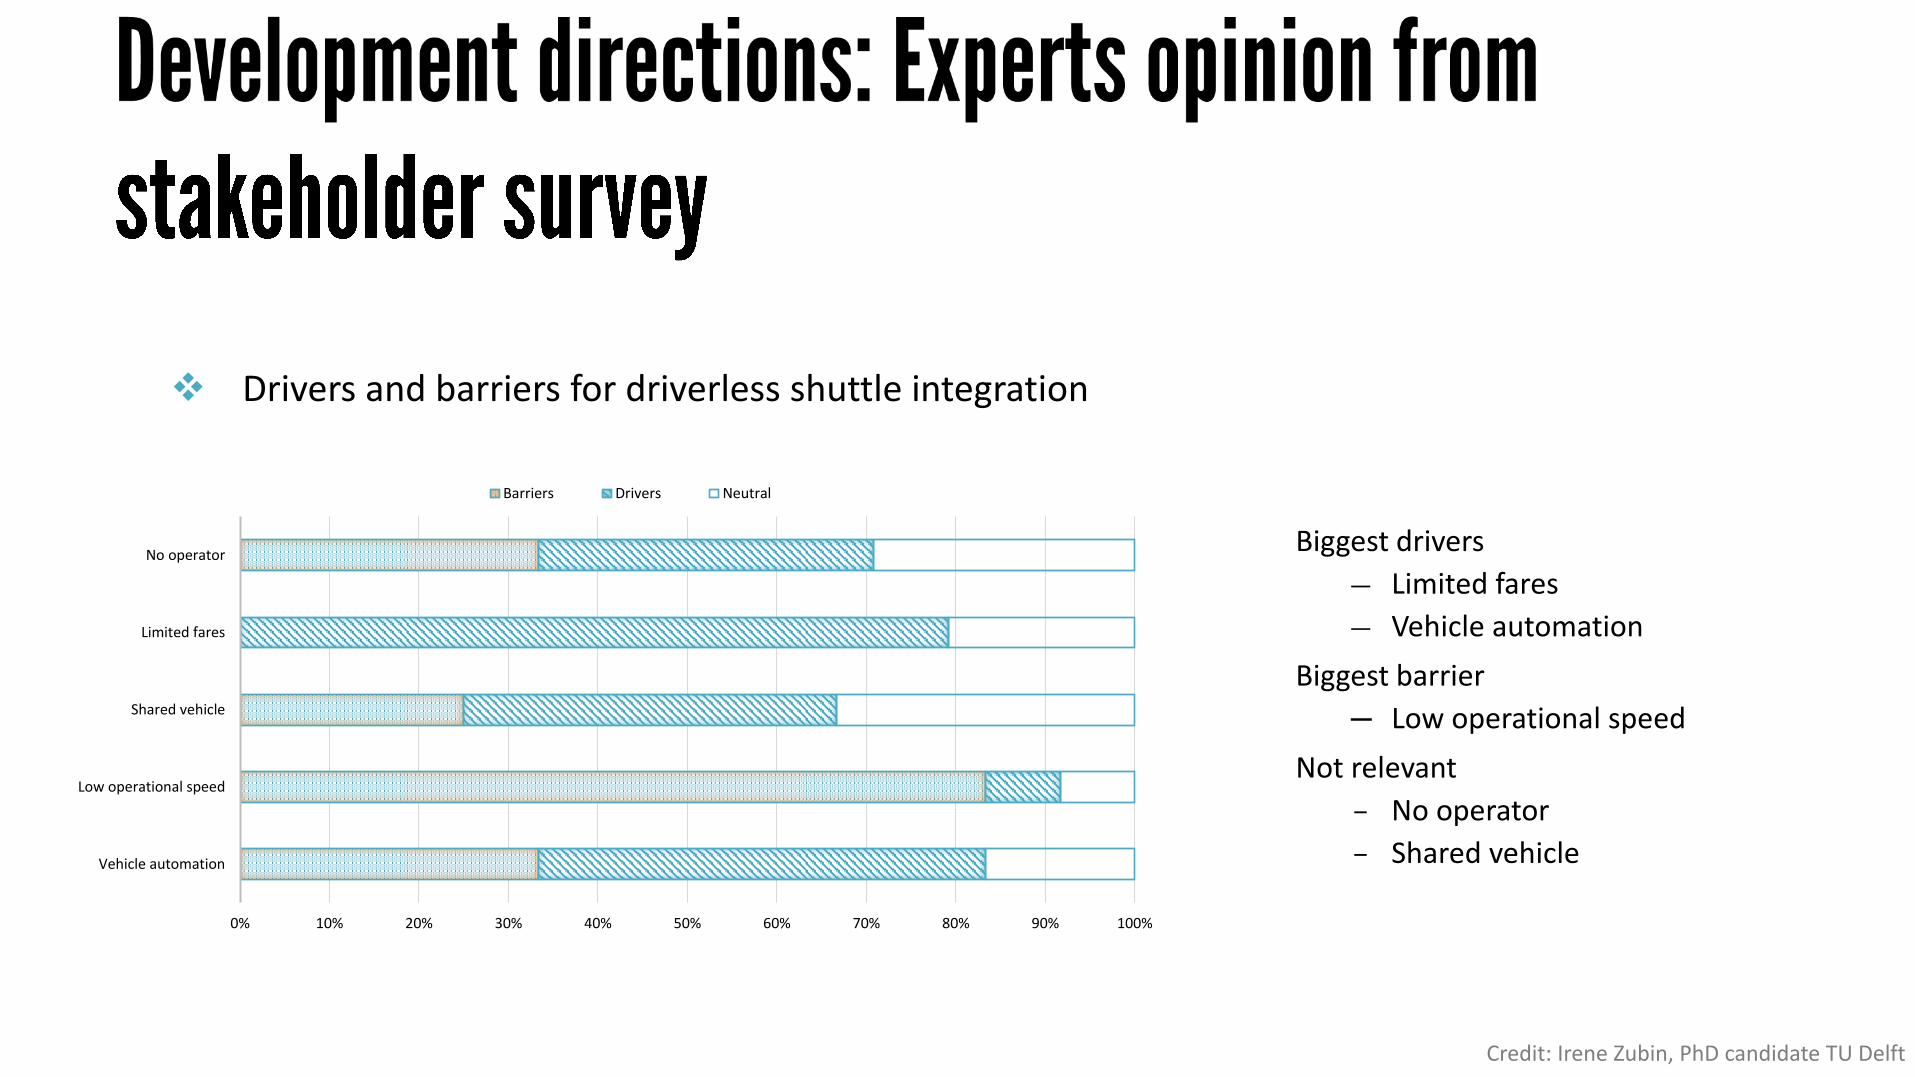
0% 10% 20% 30% 40% 50% 60% 70% 80% 90% 100%
Vehicle automation
Low operational speed
Shared vehicle
Limited fares
No operator
Barriers Drivers Neutral
Biggest drivers
― Limited fares
― Vehicle automation
Biggest barrier
─ Low operational speed
Not relevant
– No operator
– Shared vehicle
❖ Drivers and barriers for driverless shuttle integration
Credit: Irene Zubin, PhD candidate TU Delft
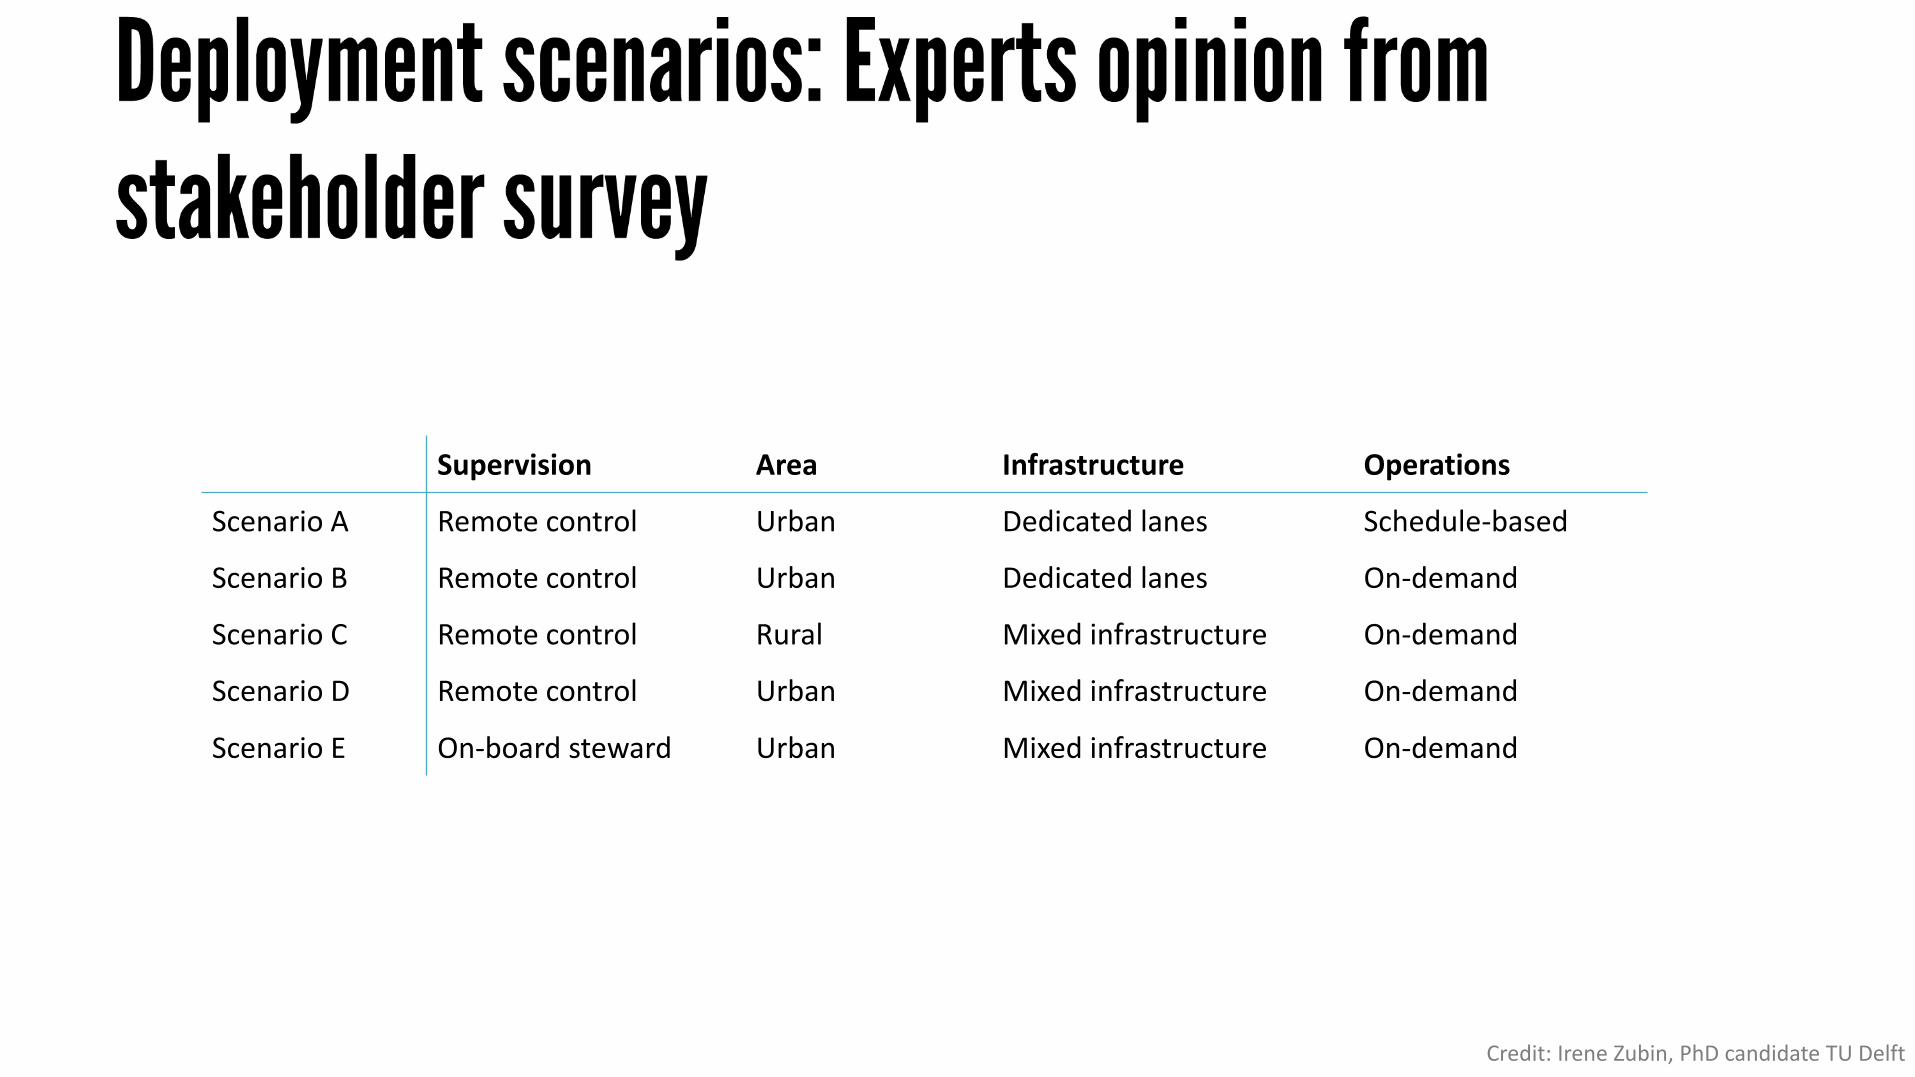
Supervision Area Infrastructure Operations
Scenario A Remote control Urban Dedicated lanes Schedule-based
Scenario B Remote control Urban Dedicated lanes On-demand
Scenario C Remote control Rural Mixed infrastructure On-demand
Scenario D Remote control Urban Mixed infrastructure On-demand
Scenario E On-board steward Urban Mixed infrastructure On-demand
Credit: Irene Zubin, PhD candidate TU Delft
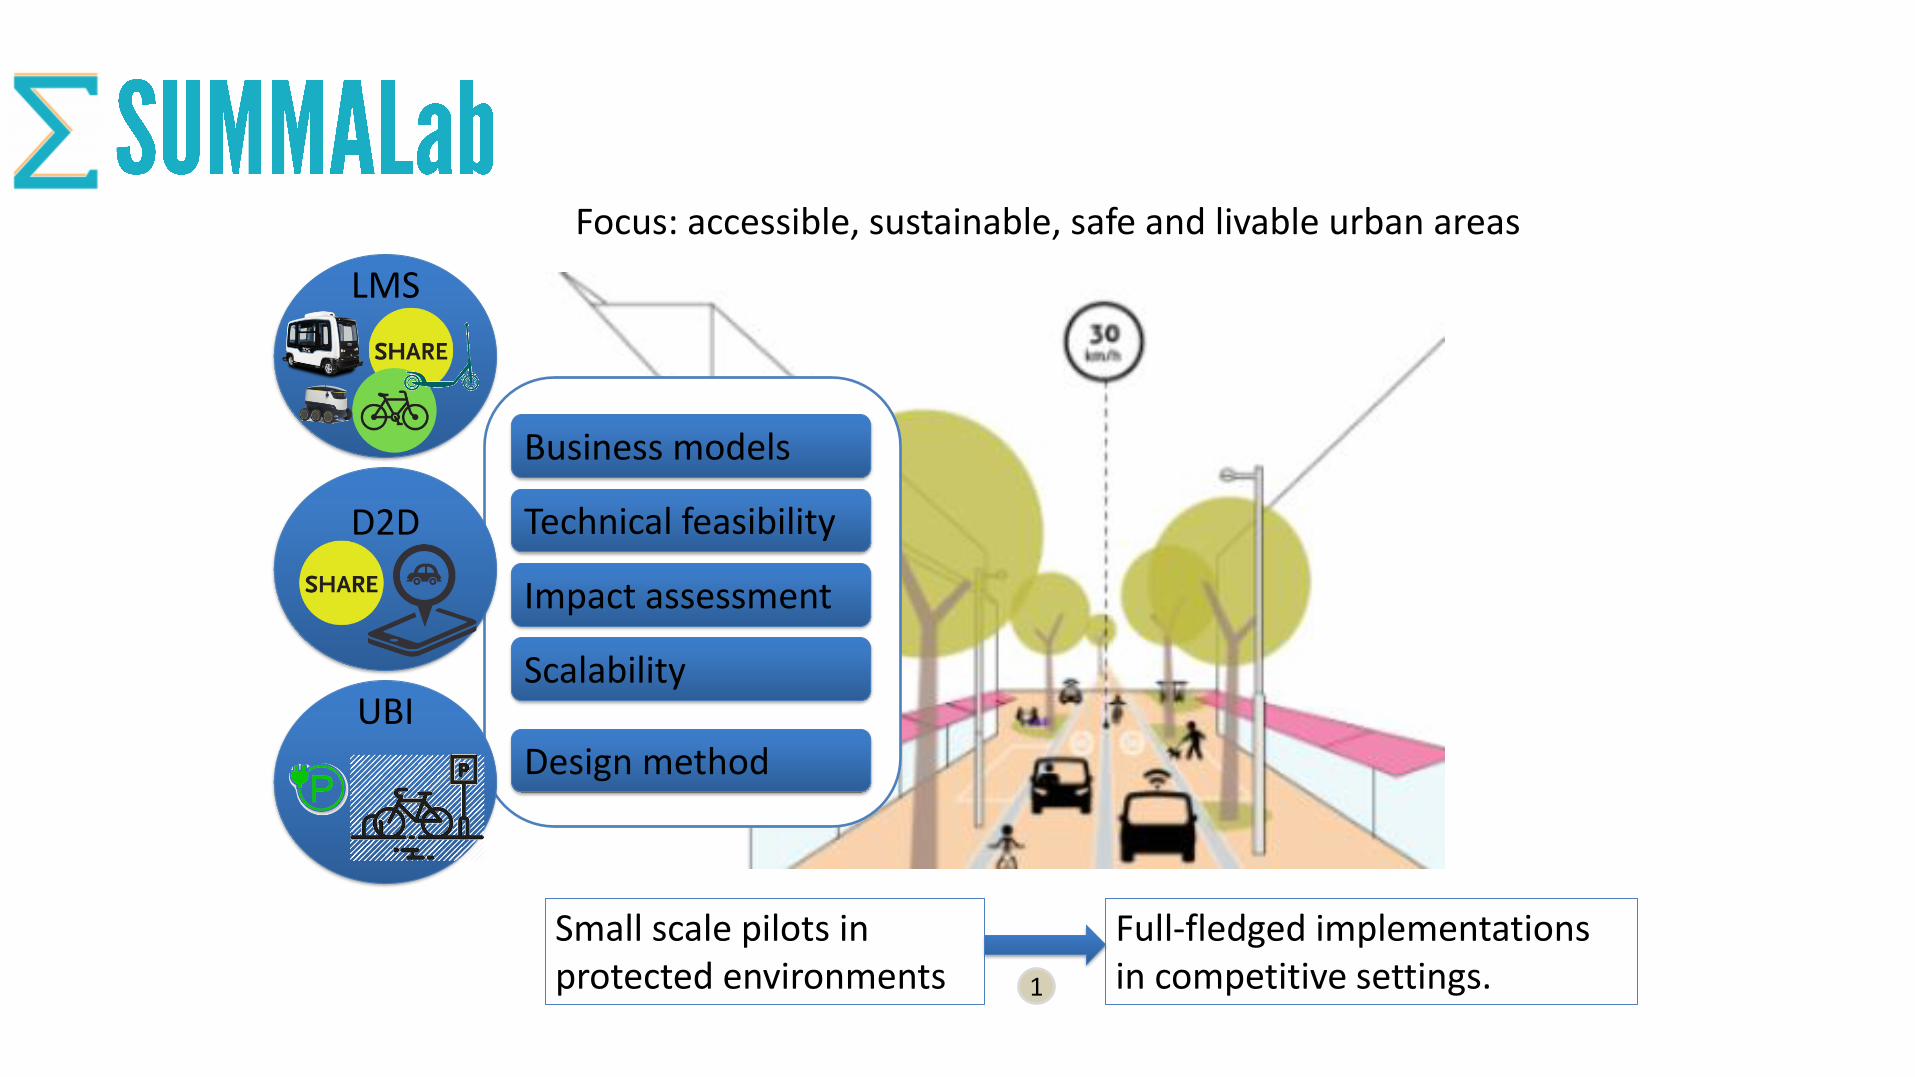
Small scale pilots in protected environments
Focus: accessible, sustainable, safe and livable urban areas
LMS
D2D
UBI
Full-fledged implementations in competitive settings.
Business models
Technical feasibility
Impact assessment
Scalability
Design method
1
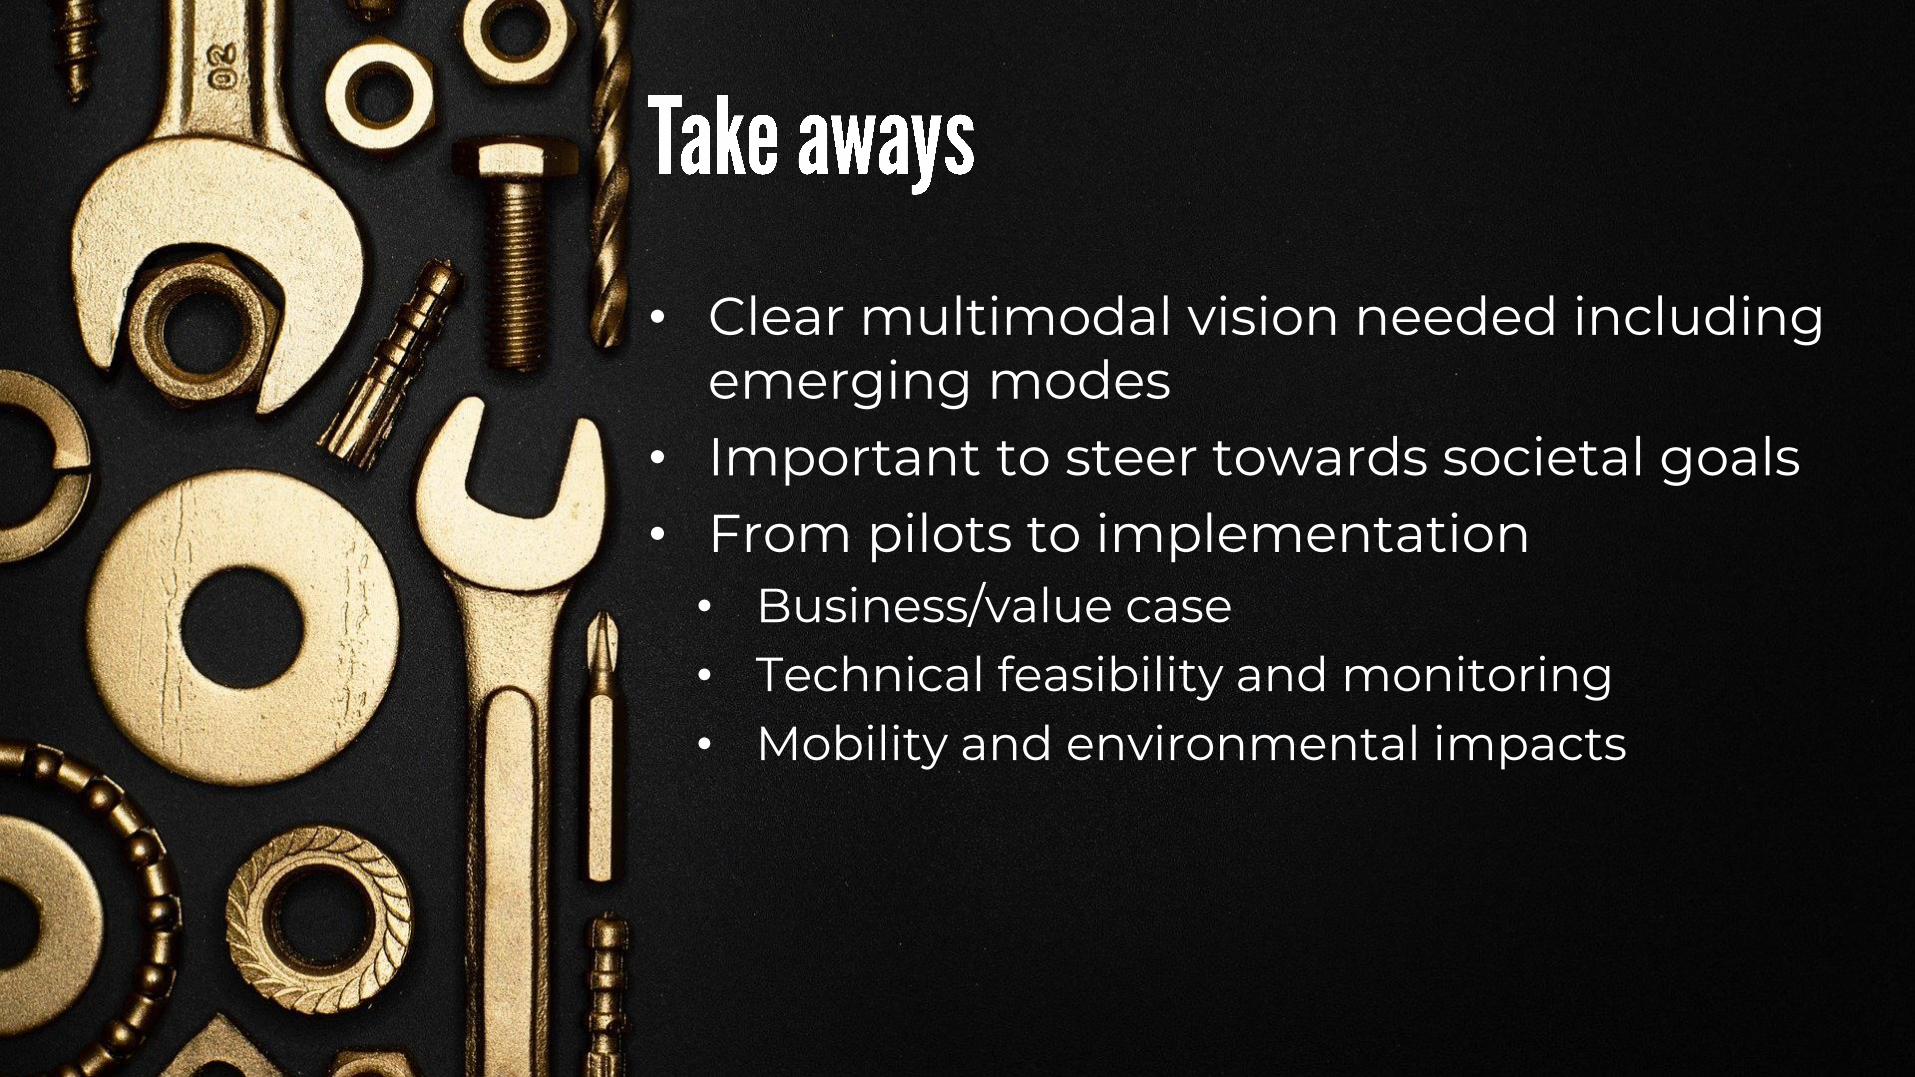
• Clear multimodal vision needed includingemerging modes
• Important to steer towards societal goals• From pilots to implementation
• Business/value case• Technical feasibility and monitoring• Mobility and environmental impacts
▪ Snelder, M., Wilmink, Isabel, van der Gun, J., Bergveld, H.J., Hoseini, P., van Arem, B. (2019) Mobility impacts of automated driving and shared mobility – explorative model and case study of the province of north-holland, European Journal of Transport and Infrastructure Research, vol. 19, n. 4 Doi: https://doi.org/10.18757/ejtir.2019.19.4.4282.
▪ https://www.researchgate.net/publication/339916105Automated_Buses_ in_Europe_An_Inventory_of_Pilots_version_10
▪ www.summalab.nl
▪ http://stad.tudelft.nl/

Do you have any question?
Maaike Snelder, [email protected]
EUROPE.URBANISMNEXT.ORG
@UrbanismNextEU #UNextEU