Net Suite AR
87
UNITED STATES SECURITIES AND EXCHANGE COMMISSION Washington, D.C. 20549 ___________ ____________ FORM 10-K ____________ _________ (Mark one) x ANNUAL REPORT PURSUANT TO SECTION 13 OR 15(d) OF THE SECURITIES EXCHANGE ACT OF 1934 For the fiscal year ended December 31, 2013 ¨ TRANSITION REPORT PURSUANT TO SECTION 13 OR 15(d) OF THE SECURITIES EXCHANGE ACT OF 1934 For the transition period from to . Commission file number 001-33870 ____________ __________ NetSuite Inc. (Exact name of registrant as specified in its charter) ___________ ____________ Delaware 94-3310471 (State or other jurisdiction of incorporation or organization) (I.R.S. Employer Identification No.) 2955 Campus Drive, Suite 100 San Mateo, California 94403-2511 (Address of principal executive offices) (Zip Code) (650) 627-1000 (Registrant's telephone number, including area code) ____________ ___________ Securities registered pursuant to Section 12(b) of the Act: Common Stock, $0.01 par value New York Stock Exchange, Inc. (Title of class) (Name of each exchange on which registered) Securities registered pursuant to Section 12(g) of the Act: None ____________ ___________ Indicate by check mark if the Registrant is a well-known seasoned issuer as defined in Rule 405 of the Securities Act. Yes x No ¨ Indicate by check mark if the Registrant is not required to file reports pursuant to Section 13 or Section 15(d) of the Act. Yes ¨ No x Indicate by check mark whether the Registrant (1) has filed all reports required to be filed by Section 13 or 15(d) of the Securities Exchange Act of 1934 during the preceding 12 months (or for such shorter period that the registrant was required to file such reports), and (2) has been subject to such filing requirements for the past 90 days. Yes x No ¨ Indicate by check mark whether the Registrant has submitted electronically and posted on its corporate Web site, if any, every Interactive Data File required to be submitted an d poste d pursua nt to Ru le 405 of Regula tion S-T during t he preced ing 12 months (or for su ch shor ter perio d that t he Regist rant was required to submit and post such files). Yes x No ¨ Indicate by check mark if disclosure of delinquent filers pursuant to Item 405 of Regulation S-K is not contained herein, and will not be contained, to the best of the Registrant's knowledge, in definitive proxy or information statements incorporated by referen ce in Part III of this Form 10-K or any amendment to this Form 10-K. ¨ Indicate by check mark whether the Registrant is a large accelerated filer, an accelera ted filer, a non-accelerated filer, or a smaller reporting company. See definitions of "large accelerated filer," "accelerated filer," and "smaller reporting company" in Rule 12b-2 of the Exchange Act. (Check one): Large accelerated filer x Accelerate d filer ¨ Non-accele rated filer (Do not check if a smaller reporting company) ¨ Smaller reporting company ¨ Indicate by check mark whether the Registrant is a shell company (as defined in Rule 12b-2 of the Exchange Act). Yes ¨ No x The aggregate market value of the Common Stock held by non-affiliates, based upon the closing sale price of the Common Stock on June 28, 2013, as reported by the New York Stock Exchange, was approximately $3,251 million. Shares of Common Stock held by each officer, director, and holder of 5% or more of the outstanding Common Stock have been excluded in that such persons may be deemed to b e affiliates. This calculation does not reflect a determination that persons are affiliates for any other purposes. On February 27, 2014, 75,547,791 shares of the registrant's Common Stock, $0.01 par value, were issued and outstanding.
Transcript of Net Suite AR

8/10/2019 Net Suite AR
http://slidepdf.com/reader/full/net-suite-ar 1/87
UNITED STATESSECURITIES AND EXCHANGE COMMISSION
Washington, D.C. 20549
_______________________
FORM 10-K
_____________________
(Mark one)
x ANNUAL REPORT PURSUANT TO SECTION 13 OR 15(d) OF THE SECURITIES EXCHANGE ACT
OF 1934
For the fiscal year ended December 31, 2013
¨ TRANSITION REPORT PURSUANT TO SECTION 13 OR 15(d) OF THE SECURITIES EXCHANGE
ACT OF 1934
For the transition period from to .
Commission file number 001-33870
______________________
NetSuite Inc.(Exact name of registrant as specified in its charter)
_______________________
Delaware 94-3310471
(State or other jurisdiction of incorporation or organization)
(I.R.S. Employer
Identification No.)
2955 Campus Drive, Suite 100
San Mateo, California 94403-2511
(Address of principal executive offices) (Zip Code)
(650) 627-1000(Registrant's telephone number, including area code)
_______________________
Securities registered pursuant to Section 12(b) of the Act:
Common Stock, $0.01 par value New York Stock Exchange, Inc.
(Title of class) (Name of each exchange on which registered)
Securities registered pursuant to Section 12(g) of the Act:None
_______________________
Indicate by check mark if the Registrant is a well-known seasoned issuer as defined in Rule 405 of the Securities Act. Yes x No ¨
Indicate by check mark if the Registrant is not required to file reports pursuant to Section 13 or Section 15(d) of the Act. Yes ¨ No x
Indicate by check mark whether the Registrant (1) has filed all reports required to be filed by Section 13 or 15(d) of the Securities Exchange Act of 1934during the preceding 12 months (or for such shorter period that the registrant was required to file such reports), and (2) has been subject to such filingrequirements for the past 90 days. Yes x No ¨
Indicate by check mark whether the Registrant has submitted electronically and posted on its corporate Web site, if any, every Interactive Data File required to
be submitted and posted pursuant to Rule 405 of Regulation S-T during the preceding 12 months (or for such shorter period that the Registrant was required tosubmit and post such files). Yes x No ¨
Indicate by check mark if disclosure of delinquent filers pursuant to Item 405 of Regulation S-K is not contained herein, and will not be contained, to the bestof the Registrant's knowledge, in definitive proxy or information statements incorporated by reference in Part III of this Form 10-K or any amendment to thisForm 10-K. ¨
Indicate by check mark whether the Registrant is a large accelerated filer, an accelerated filer, a non-accelerated filer, or a smaller reporting company. Seedefinitions of "large accelerated filer," "accelerated filer," and "smaller reporting company" in Rule 12b-2 of the Exchange Act. (Check one):
Large accelerated filer x Accelerated filer ¨ Non-accelerated filer (Do not check if a smaller reporting company) ¨ Smaller reporting company ¨
Indicate by check mark whether the Registrant is a shell company (as defined in Rule 12b-2 of the Exchange Act). Yes ¨ No x
The aggregate market value of the Common Stock held by non-affiliates, based upon the closing sale price of the Common Stock on June 28, 2013, asreported by the New York Stock Exchange, was approximately $3,251 million. Shares of Common Stock held by each officer, director, and holder of 5% or more of the outstanding Common Stock have been excluded in that such persons may be deemed to be affiliates. This calculation does not reflect adetermination that persons are affiliates for any other purposes.
On February 27, 2014, 75,547,791 shares of the registrant's Common Stock, $0.01 par value, were issued and outstanding.

8/10/2019 Net Suite AR
http://slidepdf.com/reader/full/net-suite-ar 2/87
DOCUMENTS INCORPORATED BY REFERENCE _______________________
Portions of the Registrant's definitive proxy statement for its fiscal 2014 Annual Meeting of Stockholders to be filed within 120 days of the Registrant's fiscalyear ended December 31, 2013 are incorporated by reference into Part III of this Annual Report on Form 10-K where indicated.
8/10/2019 Net Suite AR
http://slidepdf.com/reader/full/net-suite-ar 3/87
NetSuite Inc.
Index
PART I
Item 1. Business 2
Item 1A. Risk Factors 9Item 1B. Unresolved Staff Comments 19
Item 2. Properties 19
Item 3. Legal Proceedings 19
Item 4. Mine Safety Disclosures 19
PART II
Item 5. Market for Registrant's Common Equity, Related Stockholder Matters and Issuer Purchases of Equity Securities 19
Item 6. Selected Financial Data 21
Item 7. Management's Discussion and Analysis of Financial Condition and Results of Operations 22
Item 7A. Quantitative and Qualitative Disclosures About Market Risk 36
Item 8. Financial Statements and Supplementary Data 38
Item 9. Changes in and Disagreements with Accountants on Accounting and Financial Disclosure 6 9
Item 9A. Controls and Procedures 6 9
Item 9B. Other Information 6 9
PART III
Item 10. Directors, Executive Officers and Corporate Governance 6 9
Item 11. Executive Compensation 6 9
Item 12. Security Ownership of Certain Beneficial Owners and Management and Related Stockholder Matters 6 9
Item 13. Certain Relationships, and Related Transactions, and Director Independence 6 9
Item 14. Principal Accounting Fees and Services 6 9
PART IV
Item 15. Exhibits and Financial Statement Schedules 6 9
SIGNATURES AND EXHIBIT INDEX
Signatures 6 9
Exhibit Index 6 9
1

8/10/2019 Net Suite AR
http://slidepdf.com/reader/full/net-suite-ar 4/87
Table of Contents
PART I
Item 1. Business
Overview
NetSuite Inc. ("NetSuite" or the "Company" is the industry's leading provider of cloud-based financials / Enterprise Resource Planning (“ERP”) andomnichannel commerce software suites. In addition to financials/ERP and omnichannel commerce software suites, we offer a broad suite of applications,including financial management, Customer Relationship Management (“CRM”), Ecommerce and retail management, Professional Services Automation
(“PSA”) and Human Capital Management ("HCM") that enable companies to manage most of their core business operations in our single integrated suite. Our "real-time dashboard" technology provides an easy-to-use view into up-to-date, role-specific business information. We also offer customer support and
professional services related to implementing and supporting our suite of applications. We deliver our suite over the Internet as a subscription service using thesoftware-as-a-service ("SaaS") model.
Our revenue has grown from $17.7 million during the year ended December 31, 2004 to $414.5 million during the year ended December 31, 2013.For the years ended December 31, 2013 , 2012 and 2011 the percentage of our revenue generated outside of the United States was 26%, 26% and 27%,respectively.
Industry Background
The 1990s saw the widespread adoption among large enterprises of packaged business management software applications that automated a variety of departmental functions, such as accounting, finance, order and inventory management, human resources, professional services, sales and customer support.These sophisticated applications required significant cash outlays for the initial purchase and for ongoing maintenance and support. In addition, theseapplications were internally managed and maintained, requiring large staffs to support complex information technology infrastructures. Most importantly, theapplications generally were provided by multiple vendors, with each application providing only a departmental view of the enterprise. To gain an enterprise-wide view, organizations attempted to tie together their various incompatible packaged applications through long, complex and costly integration efforts. Many
of these attempts failed, in whole or in part, often after significant delay and expense. As a consequence, many large enterprises have transitioned frommultiple point products to comprehensive, integrated business management suites, such as those offered by Oracle Corporation ("Oracle") and SAP AG("SAP"), as their core business management platforms.
Medium-sized businesses and divisions of large enterprises have application software requirements that are similar, in many respects, to largeenterprises because their core business processes are substantially similar to those of large enterprises. These requirements include the integration of back-office activities, such as managing payroll and tracking inventory; front-office activities, including order management and customer support; and,increasingly, sophisticated Ecommerce capabilities.
Medium-sized businesses are generally less capable than large enterprises of performing the costly, complex and time-consuming integration of multiple point products from one or more vendors. As a result, medium-sized businesses can frequently derive greater benefits from a comprehensive businesssuite. Suites designed for, and broadly adopted by, large enterprises to provide a comprehensive, integrated platform for managing these core business
processes, however, generally are not well suited to medium-sized businesses due to the complexity and cost of such applications.
Medium-sized businesses and divisions of large enterprises have begun to benefit from the development of the cloud computing delivery model.Cloud computing uses the Internet to deliver software applications from a centrally hosted computing facility to end users through a web browser. Cloudcomputing eliminates the costs associated with installing and maintaining applications within the customer's information technology infrastructure. Cloudapplications are generally licensed for a monthly, quarterly or annual subscription fee, as opposed to on-premise enterprise applications that typically requirethe payment of a much larger, upfront license fee. As a result, cloud applications require substantially less initial and ongoing investment in software,hardware and implementation services and lower ongoing support and maintenance, making them substantially more cost effective to run for medium-sized businesses.
To date, the cloud computing software model has been applied to a variety of types of business software applications, including CRM, security,accounting, human resources management, messaging and others, and it has been adopted by a wide variety of businesses.
While cloud applications have enabled medium-sized businesses to benefit from enterprise-class capabilities, most are still point products thatrequire extensive, costly and time-consuming integration to work with other applications. Medium-sized businesses generally have been unable to purchase acomprehensive business management application suite at an affordable cost that enables them to run their businesses using a single system of record, providesreal-time views of their operations and can be readily customized and rapidly implemented. We believe NetSuite was the first company to provide a cloud-
based integrated suite of business management applications that addresses the needs of medium-sized businesses in the comprehensive manner that Oracle andSAP address the similar needs of large enterprises.
Our Solution
Our comprehensive business management application suite provides an integrated solution for running the core functions of a business. All elements
of our application suite share the same customer and transaction data, enabling seamless, cross-departmental business process automation and real-timemonitoring of core business metrics. Businesses can deploy our solution as a business management suite, or deploy specific applications such asfinancials/ERP, CRM, omnichannel commerce, PSA or HCM that can be integrated with existing application investments. In addition, our financials/ERP,CRM, omnichannel commerce, PSA and HCM capabilities provide users with real-time visibility and appropriate application functionality throughdashboards tailored to their particular job function and access rights.
2
8/10/2019 Net Suite AR
http://slidepdf.com/reader/full/net-suite-ar 5/87
Table of Contents
Because our offering is delivered as a cloud-based solution via the Internet, it is available wherever a user has Internet access, whether on a personal computer or a mobile device. The key advantages of our application suite for our customers are:
One Integrated Solution for Running a Business . Our integrated business application suite provides the functionality required to automate the coreoperations of medium-sized businesses, as well as divisions of large companies. This unified approach to managing a business enables companies to createcross-functional business processes; extend access to appropriate customers, partners, suppliers or other relevant constituencies; and efficiently share anddisseminate information in real time. Our suite is designed to be easy to use, while also providing in-depth functionality to meet the needs of our mostsophisticated customers. Our customers can use our application suite to manage mission-critical business processes, including complex financials/ERP(finance, accounting, inventory and payroll), CRM (sales, order management, marketing and customer support), PSA (projects, resources, time, expense and
billing) and Ecommerce (hosting, online stores and website analytics) functions. We also have tailored our offering to meet the specific needs of customers in
the wholesale/distribution, manufacturing, retail, professional services and software industries, to better serve those customers' distinct business requirementsand accelerate the implementation of our offerings for customers in those industries.
Role-Based Application Functionality and Real-Time Business Intelligence . Users access our suite through a role-based user interface, or dashboard, which delivers specific application functionality and information appropriate for each user's job responsibilities in a format familiar to them. For example, the dashboard for a salesperson would deliver functionality for managing contacts, leads and forecasts, while the dashboard for a warehousemanager would deliver capabilities appropriate for managing shipping, receiving and returns. These dashboards also incorporate sophisticated businessintelligence tools that enable users to track key performance indicators, analyze operational data to identify trends, issues and opportunities and makedecisions that can improve the performance of their business, all in real time.
Cloud Delivery Model . We deliver our suite over the Internet as a subscription service via the cloud, eliminating the need for customers to buy andmaintain on-premise hardware and software. Our suite is designed to achieve levels of reliability, scalability and security for our customers that have typicallyonly been available to large enterprises with substantial information technology resources. Our architecture enables us to maintain very high levels of availability, scale easily as our customers grow and provide a safe and secure environment for their business-critical data and applications.
Flexible Deployment . As larger organizations increasingly choose cloud computing software to take advantage of the resulting cost savings and business efficiencies, our solution can also be rapidly deployed as a standalone financials/ERP solution rather than as a business management suite. Thisflexible deployment allows businesses to use our cloud-based financials/ERP capabilities within line of business and integrate it with their existing CRM, PSAand Ecommerce investments, or grow into the suite over time. Additionally, global enterprises with entrenched enterprise-class financials/ERP investments attheir corporate headquarters can deploy NetSuite OneWorld using a “two-tier” approach. In this case, NetSuite OneWorld is deployed across subsidiaries,divisions or countries allowing the organization to standardize its previously heterogeneous on-premise financials/ERP investments on a cloud-based solutionwith all the cost savings and rapid deployment options the cloud enables.
Low Total Cost of Ownership. Our suite incorporates the functionality of multiple applications, thereby eliminating the costs associated withattempting to integrate disparate applications, whether managed on-premise or delivered on-demand. Our on-demand delivery model and our application's easeof use and configurability significantly reduce implementation costs for hardware, software and services and the need for dedicated information technology
personnel. Customers typically subscribe to our application suite for a quarterly or annual fee based on the number of users and the solutions they elect todeploy. Our subscription fees are generally significantly less than typical upfront costs to purchase perpetual licenses, and our on-demand delivery systemeliminates ongoing maintenance and upgrade charges.
Rapid Implementation. Because we offer a relatively comprehensive application suite that incorporates the functionality of multiple applications, wegenerally significantly reduce the time and risk associated with implementing and integrating multiple point products. Our cloud delivery model enables remoteimplementations and eliminates many of the steps associated with on-premise installations, such as purchasing and setting up hardware. In addition to our industry-specific offerings, our professional services organization is organized along customers' industries; therefore, knowledge gained through animplementation with one customer may be applied to other customers within that industry, thereby speeding implementations. Customers can implement our
offerings themselves, engage our professional services organization or utilize the services of our partners.
Ease of Customization and Configuration . We enable users to customize our application suite to the particular needs of their businesses. Our application suite can be configured by end users without software programming expertise. In contrast to traditional on-premise applications, as new versions of our application suite become available, each customer's customizations and configurations are maintained with little or no additional effort or expense required.
Our Business Strategy
Our goal is to enhance our position as a leading provider of cloud-based financials/ERP software suites for medium-sized businesses. The keyelements of our strategy include:
Expanding Our Leadership in Cloud-Based, Integrated Business Suites . We believe we were the first software vendor to integrate front-office, back-office and Ecommerce management capabilities into a single cloud-based software suite. We intend to improve our position in the cloud-basedapplications market by continuing to provide high-quality offerings that encompass the enterprise-class functionality and ease-of-use our customers require.We also intend to leverage our position as our customers' primary business management platform to add new and enhanced functionality that will help themrun their businesses more efficiently and expand our presence within their organizations.
Further Penetrate Global Enterprises. We believe there is a substantial opportunity to increase the presence of cloud-based financials/ERP
solutions within global enterprises through a “two-tier” deployment model. Under a “two-tier” approach, a global business retains its existing investment inenterprise-class on-premise financials/ERP applications at headquarters, but selects a different solution that is more cost effective to deploy and managethroughout its subsidiaries. We believe NetSuite OneWorld ("OneWorld") provides an ideal
8/10/2019 Net Suite AR
http://slidepdf.com/reader/full/net-suite-ar 6/87
Table of Contents
solution for this approach to global financials/ERP deployment, given that it provides multi-subsidiary, multi-currency and multi-tax intelligence in real-timewith local control for in-country operations, while being deployed as a cloud application for fast and cost-effective delivery.
Tailoring Our Offering to Customers' Specific Industries . While we provide a general purpose suite applicable to all businesses, we believe thattailoring our application to customers' specific industries has been and will continue to be important to our growth. We currently offer industry-specificeditions of our service for wholesale/distribution, manufacturing, professional services, retail and software companies. We will continue to enhance thecapabilities of our application by further tailoring the functionality for these and other industries.
Growing Our Customer Base and Expanding Use of Our Service Within Existing Accounts . We intend to broaden our offerings and expand our direct and indirect sales efforts to grow our customer base. In addition, we seek to increase ongoing subscription revenue from our existing customers by
broadening their use of our suite, thereby increasing the number of users and modules deployed.
Fostering the Continued Development of the NetSuite Partner Network . We provide tools and programs to foster the development of a network of value-added resellers, or ("VARs), systems integrators and independent software vendors. In addition to programs that enable our partners to resell our suite,our SuiteCloud Platform allows these partners to extend our platform by developing products of their own, including industry-specific versions of our application suite. We intend to continue to enhance our platform and establish distribution models to bring these new solutions to market.
Addressing the Multinational Business Requirements of our Clients . Medium-sized businesses are increasingly seeking global businessopportunities, in large part by leveraging the Internet. We believe that there is significant opportunity to address the needs of medium-sized businesses withmultinational business operations, and we currently offer a localized version of our suite in a number of countries and languages. We will continue to extendour application offerings to support the requirements of multinational medium-sized businesses.
Enabling our Clients to Deliver an Omni-Channel Customer Experience. Customers today demand a seamless experience regardless of how theyinteract with a business - whether online, in-store, via phone or in-person. We believe there is a significant opportunity to provide our clients with tools thatallow them to redefine the experience for any touch point and any business model: business-to-consumer, business-to-business or business-to-employee. Wewill continue to enhance and extend our SuiteCommerce offering and NetSuite Retail Anywhere point-of-sale offering to allow our clients to transform their
businesses and deliver this omni-channel experience to their customers.
Our Offerings
Our main offering is NetSuite, which is designed to provide the core business management capabilities that most of our customers require. NetSuite,OneWorld and NetSuite CRM+ are designed for use by most types of businesses. NetSuite OpenAir ("OpenAir") is designed for use specifically by professional services businesses. In addition, we offer industry-specific configurations for use by wholesale/distribution, manufacturing and softwarecompanies. We also sell additional cloud-based application modules that customers can purchase to obtain additional functionality required for their specific business needs.
NetSuite. NetSuite, which is targeted at medium-sized businesses and divisions of large companies, provides a single platform for financials/ERP,CRM, PSA and Ecommerce capabilities. It contains a broad array of features that enables users to do their individual jobs more effectively. In addition,
because all users are transacting business on the same database system, NetSuite can easily automate processes across departments. For example, when asales representative enters an order, upon approval it automatically appears on the warehouse manager's dashboard as an item to be shipped and, once the itemhas been shipped, it automatically appears on the finance manager's dashboard as an item to be billed. Each customer can automate its key business functionsacross all departments, including sales, marketing, service, finance, inventory, order fulfillment, purchasing and employee management. As with all of our offerings, users access the application and data through a role-based user interface, or dashboard, tailored to deliver specific functionality and informationappropriate for their position.
NetSuite OneWorld . OneWorld is targeted at global businesses and divisions of large companies operating in multinational and multi-subsidiaryenvironments. OneWorld allows users to utilize our single platform for financials/ERP, CRM, PSA and Ecommerce capabilities in multi-currencyenvironments across multiple subsidiaries and legal entities. OneWorld provides the ability to manage multiple companies or legal entities, with potentiallydifferent currencies, taxation rules, and reporting requirements, within a single NetSuite account. OneWorld has global CRM capabilities that allow for management of multi-currency quotas, forecasts, commission payments, sales tax calculations and real-time reporting for everyone in a global salesorganization from the local sales representative, to the regional vice president to the head of worldwide sales. Additionally, growing companies typically employmultiple sales channels for their global sales operations so OneWorld allows for automation of common sales channels employed internationally includingdirect sales, distribution partner networks and Ecommerce. Marketing and customer support operations can also be managed globally using OneWorld so
processes such as lead routing and trouble ticket assignment can easily be handled across regions or in-country, with global customer visibility and real-timemeasurement of marketing and service operational performance.
NetSuite CRM+. NetSuite CRM+ is targeted at a wide range of companies, including companies larger than our traditional medium-sized businesscustomers. Medium-sized businesses may use NetSuite CRM+ as an entry point into the entire suite, while larger enterprises often implement it as analternative to more limited CRM offerings. This application provides traditional sales force automation, marketing automation, customer support and servicemanagement functionality. NetSuite CRM+ contrasts with competitive CRM products by also incorporating order management and many other financials/ERPand Ecommerce capabilities without requiring additional integration. This provides users with a more comprehensive, real-time view of customer interactionsthan can be provided by traditional, stand-alone CRM products, whether on-premise or on-demand. NetSuite CRM+ also offers incentive management, project
tracking, website hosting and analytics and partner relationship management.
NetSuite OpenAir PSA. OpenAir is a Professional Services Automation ("PSA") solution that is used by professional services organizations and istargeted at some of the world’s largest companies with thousands of employees. OpenAir provides a clear view into the services organization’s performance and profitability with dashboards and reports. With OpenAir’s project accounting functionality,

8/10/2019 Net Suite AR
http://slidepdf.com/reader/full/net-suite-ar 7/87
8/10/2019 Net Suite AR
http://slidepdf.com/reader/full/net-suite-ar 8/87
Table of Contents
Client Support . Our technical support organization, with personnel in Canada, Europe and Asia, offers support 24 hours a day, seven days a week.Our system allows for skills-based and time zone-based routing to address general and technical inquiries across all aspects of our suite. For our directcustomers, we offer tiered customer support programs depending upon the service needs of our customers' deployments. Support contracts typically have aone-year term. For customers purchasing through resellers, primary product support is provided by our resellers, with escalation support provided by us.
Training . We offer complimentary training videos, public training courses and end-user training to facilitate the successful adoption of our suitethroughout the customer's organization.
Operations, Technology and Development
Our customers rely on our application suite to run their businesses and, as a result, we need to ensure the availability of our service. We havedeveloped our infrastructure with the goal of achieving high availability of our services, which are hosted on a highly-scalable network located in secure third-
party facilities. We host the NetSuite applications and serve our customers primarily from our California-based data center facilities, which we operate inconjunction with colocation services from CenturyLink Technology Solutions (“CenturyLink”). CenturyLink was formerly SAVVIS CommunicationsCorporation and effectively changed names in January 2014. We also have a Massachusetts-based data center facility, which we operate in conjunction withCenturyLink. The Massachusetts and California data centers serve as back-up facilities for purposes of disaster recovery. Our hosting operations incorporateindustry-standard hardware, the Linux open-source operating system and Oracle databases and application servers into a flexible, scalable architecture.Elements of our application suite's infrastructure can be replaced or added with no interruption in service, helping to ensure that the failure of any single deviceis not expected to cause a broad service outage of the NetSuite Service. Our OpenAir applications are hosted from a Massachusetts-based data center, which weoperate in conjunction with CenturyLink. Our Retail Anywhere ("RA") applications are hosted using a hardware solution provided by a partner with varioushosting from data centers based on the East Coast of the United States, which we also operate in conjunction with Amazon. The OrderMotion applications arehosted from a Texas-based datacenter which we operate in conjunction with RackSpace. The Element Fusion applications are hosted from a datacenter whichwe operate in conjunction with SoftLayer. The Tribe HR applications are hosted from a Canada-based datacenter which we operate in conjunction with VMFarms.
Our single-instance, multi-tenant architecture allows us to provide our customers with enterprise-class capabilities, high quality of service,scalability and security, all at an affordable price. Our architecture enables us to host multiple smaller customers on a single server while preserving the abilityto migrate any customer to its own server without material interruption or alteration when the customers' growth and business needs require it. In addition to theenhanced flexibility and scalability our architecture provides, it also is designed to work on inexpensive, industry-standard hardware, thereby providing us asignificant cost advantage that is reflected in the pricing we are able to offer our customers.
Unlike other SaaS companies that deploy major new releases to all customers at once, we roll out all major releases and many upgrades of our application suite to only a portion of our customer base at any one time. This "phased release process" is designed to allow us to mitigate the impact of major changes and new releases, ensuring that any potential issues affect only a portion of our customers before they are addressed.
The combination of our hosting infrastructure, robust networks, flexible architecture and phased release process enables us to offer a service-levelcommitment to our customers of 99.5% uptime per period, excluding designated periods of maintenance. Under the terms of this commitment, we offer tocredit a full month's service fees for any period where we do not meet this service level.
Product development expenses were $78.3 million, $52.7 million and $43.5 million during the years ended December 31, 2013, 2012 and 2011,respectively. In developing our service offerings, we rely on customer feedback and spend significant time with our customers in formal user testing sessionsas well as less formal "ride-alongs" and customer roundtables. We use the NetSuite service to track customer interest in service enhancements and actual work done on these enhancements. We develop our offerings using Java and the Oracle database on the server and Asynchronous JavaScript and XML on the client
with a goal of making our service scalable, high performance, robust and easy to use. Finally, we expose many development tools to third-party developers viaSuiteFlex to allow extensions to the service that extend and compliment the built-in capabilities we develop internally. Our use of the Oracle database is
pursuant to various software license agreements with Oracle USA, Inc., an affiliate of Oracle. Lawrence J. Ellison, who beneficially owns a majority of our common stock, is the Chief Executive Officer, a principal stockholder and a director of Oracle. See Note 17 to our Consolidated Financial Statements for afurther description of this software license agreement.
Customers
Our customers are diverse in size and type across a wide variety of industries, with a focus on medium-sized businesses and divisions of largecompanies. In 2013, the top 10 industries in which our customers operated, as measured by our recognized revenue, were as follows: Distribution &Wholesale; Professional, Consulting and Other Services; Computer Software; Ecommerce & Retail; Manufacturing; Computer & IT Services;Telecommunications Services; Financial Services; Healthcare Services; and Education. We had customers in approximately 80 countries in 2013. No singlecustomer accounted for more than 3% of our revenue in 2013, 2012 or 2011.
Competition
We compete with a broad array of financials/ERP, CRM, Ecommerce, PSA and HCM companies. Our markets are highly competitive, fragmentedand subject to rapid changes in technology.
Many of our potential customers evaluate a wide range of alternatives during their purchase process.Although we
believe that none of our larger competitors currently offer a cloud-based comprehensive business management suite, we face significant competition within eachof our markets from companies with broad product suites and greater name recognition and resources than we have, as well as smaller companies focused onspecialized solutions. In addition, some of our larger competitors have announced plans to launch new products that could compete more closely with our cloud-based application suite. Internationally, we face competition from local companies as well as larger competitors, each of which has products tailored for those local
8/10/2019 Net Suite AR
http://slidepdf.com/reader/full/net-suite-ar 9/87
Table of Contents
markets. To a lesser extent, we compete with internally developed and maintained solutions. Our current principal competitors include Epicor SoftwareCorporation, Intuit Inc., Microsoft Corporation, Oracle Corporation, SAP AG, The Sage Group plc and salesforce.com, inc.
We believe the principal competitive factors in our markets include:
• service breadth and functionality;
• service performance, security and reliability;
• ability to tailor and customize services for a specific company, vertical or industry;
• ease of use;
• speed and ease of deployment, integration and configuration;
• total cost of ownership, including price and implementation and support costs;
• sales and marketing approach; and
• financial resources and reputation of the vendor.
We believe that we compete favorably with most of our competitors on the basis of each of the factors listed above, except that certain of our
competitors have greater sales, marketing and financial resources, more extensive geographic presence and greater name recognition than we do. In addition,although we have extended the number of applications we have introduced for specific vertical markets, we may be at a disadvantage in certain verticalmarkets compared to certain of our competitors. We may face future competition in our markets from other large, established companies, as well as fromemerging companies. In addition, we expect that there is likely to be continued consolidation in our industry that could lead to increased price competition andother forms of competition.
Intellectual Property
Our success depends upon our ability to protect our core technology and intellectual property. To accomplish this, we rely on a combination of intellectual property rights, including trade secrets, patents, copyrights and trademarks, as well as customary contractual protections. We view our tradesecrets and know-how as a significant component of our intellectual property assets, as we have spent years designing and developing our cloud-based,integrated application suite, which we believe differentiates us from our competitors.
As of December 31, 2013, we have numerous issued US patents and pending US patent applications. We do not know whether any of our pending patent applications will result in the issuance of patents or whether the examination process will require us to narrow our claims. There can be no assurancesthat our patents, or our pending patent applications even if granted, will provide us with protection.
We have a number of registered and unregistered trademarks. We maintain a policy requiring our employees, consultants and other third parties toenter into confidentiality and proprietary rights agreements and to control access to software, documentation and other proprietary information.
In addition, we license third-party technologies that are incorporated into some elements of our services. Licenses of third-party technologies may notcontinue to be available to us at a reasonable cost, or at all. The steps we have taken to protect our intellectual property rights may not be adequate. Third
parties may infringe or misappropriate our proprietary rights. Competitors may also independently develop technologies that are substantially equivalent or superior to the technologies we employ in our services. Failure to protect our proprietary rights adequately could significantly harm our competitive positionand operating results.
The software and technology industries are characterized by the existence of a large number of patents, copyrights, trademarks and trade secrets and by frequent litigation based on allegations of infringement or other violations of intellectual property rights. As we face increasing competition, the possibilityof intellectual property rights claims against us grows. Many of our service agreements require us to indemnify our customers for certain third-partyintellectual property infringement claims, which would increase our costs as a result of defending those claims and might require that we pay damages if therewere an adverse ruling in any such claims. We, and certain of our customers, have in the past received correspondence from third parties alleging that certainof our services, or customers' use of our services, violate these third parties' patent rights. These types of correspondence and future claims could harm our relationships with our customers and might deter future customers from subscribing to our services.
With respect to any intellectual property rights claim against us or our customers, we may have to pay damages or stop using technology found to be
in violation of a third party's rights. We may have to seek a license for the technology, which may not be available on reasonable terms, significantly increaseour operating expenses or require us to restrict our business activities in one or more respects. The technology also may not be available for license to us at all.As a result, we may be required to develop alternative non-infringing technology, which could require significant effort and expense.
Employees
8/10/2019 Net Suite AR
http://slidepdf.com/reader/full/net-suite-ar 10/87
Table of Contents
As of December 31, 2013, we had 2,434 employees. We also engage a number of independent contractors and consultants. None of our employees isrepresented by a labor union with respect to his or her employment with us. We have not experienced any work stoppages, and we consider our relations withour employees to be good. Our future success will depend upon our ability to attract and retain qualified personnel. Competition for qualified personnelremains intense, and we may not be successful in retaining our key employees or attracting skilled personnel.
Available Information
You can obtain copies of our Form 10-K, Quarterly Reports on Form 10-Q, Current Reports on Form 8-K, and other filings with the Securities andExchange Commission ("SEC"), and all amendments to these filings, free of charge from our Web site at http://www.netsuite.com/investors as soon asreasonably practicable following our filing of any of these reports with the SEC. You can also obtain copies free of charge by contacting our Investor Relations
department at our corporate headquarters. The information found on our website is not a part of this or any other report we file with or furnish to the SEC.
You can also read and copy any materials we file with the SEC at the SEC's Public Reference Room at 100 F Street, N.E., Washington, DC 20549.You can obtain additional information about the operation of the Public Reference Room by calling the SEC at 1-800-SEC-0330. In addition, the SECmaintains a website (http://www.sec.gov ) that contains reports, proxy and information statements, and other information regarding issuers that fileelectronically with the SEC, including us.
Executive Officers of the Registrant
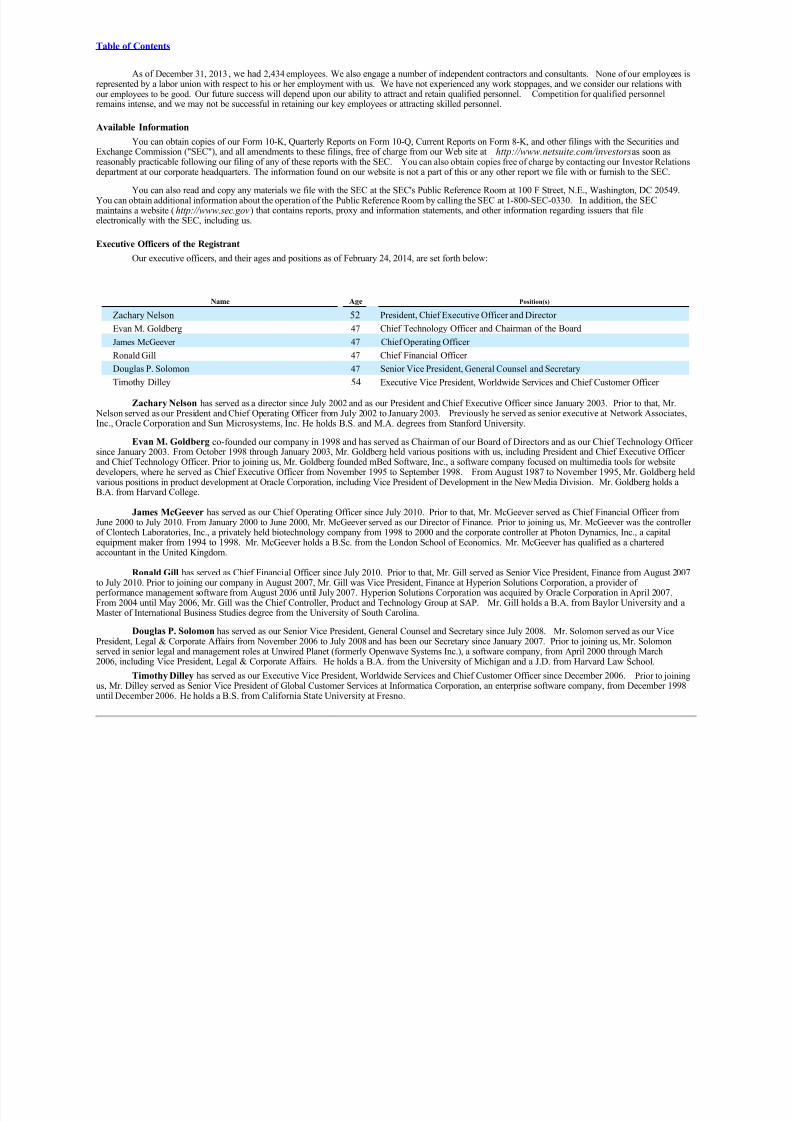
Our executive officers, and their ages and positions as of February 24, 2014, are set forth below:
Name Age Position(s)
Zachary Nelson 52 President, Chief Executive Officer and Director
Evan M. Goldberg 47 Chief Technology Officer and Chairman of the Board
James McGeever 47 Chief Operating Officer
Ronald Gill 47 Chief Financial Officer
Douglas P. Solomon 47 Senior Vice President, General Counsel and Secretary
Timothy Dilley 54 Executive Vice President, Worldwide Services and Chief Customer Officer
Zachary Nelson has served as a director since July 2002 and as our President and Chief Executive Officer since January 2003. Prior to that, Mr. Nelson served as our President and Chief Operating Officer from July 2002 to January 2003. Previously he served as senior executive at Network Associates,Inc., Oracle Corporation and Sun Microsystems, Inc. He holds B.S. and M.A. degrees from Stanford University.
Evan M. Goldberg co-founded our company in 1998 and has served as Chairman of our Board of Directors and as our Chief Technology Officer since January 2003. From October 1998 through January 2003, Mr. Goldberg held various positions with us, including President and Chief Executive Officer and Chief Technology Officer. Prior to joining us, Mr. Goldberg founded mBed Software, Inc., a software company focused on multimedia tools for websitedevelopers, where he served as Chief Executive Officer from November 1995 to September 1998. From August 1987 to November 1995, Mr. Goldberg heldvarious positions in product development at Oracle Corporation, including Vice President of Development in the New Media Division. Mr. Goldberg holds aB.A. from Harvard College.
James McGeever has served as our Chief Operating Officer since July 2010. Prior to that, Mr. McGeever served as Chief Financial Officer fromJune 2000 to July 2010. From January 2000 to June 2000, Mr. McGeever served as our Director of Finance. Prior to joining us, Mr. McGeever was the controllerof Clontech Laboratories, Inc., a privately held biotechnology company from 1998 to 2000 and the corporate controller at Photon Dynamics, Inc., a capitalequipment maker from 1994 to 1998. Mr. McGeever holds a B.Sc. from the London School of Economics. Mr. McGeever has qualified as a charteredaccountant in the United Kingdom.
Ronald Gill has served as Chief Financial Officer since July 2010. Prior to that, Mr. Gill served as Senior Vice President, Finance from August 2007to July 2010. Prior to joining our company in August 2007, Mr. Gill was Vice President, Finance at Hyperion Solutions Corporation, a provider of
performance management software from August 2006 until July 2007. Hyperion Solutions Corporation was acquired by Oracle Corporation in April 2007.From 2004 until May 2006, Mr. Gill was the Chief Controller, Product and Technology Group at SAP. Mr. Gill holds a B.A. from Baylor University and aMaster of International Business Studies degree from the University of South Carolina.
Douglas P. Solomon has served as our Senior Vice President, General Counsel and Secretary since July 2008. Mr. Solomon served as our VicePresident, Legal & Corporate Affairs from November 2006 to July 2008 and has been our Secretary since January 2007. Prior to joining us, Mr. Solomonserved in senior legal and management roles at Unwired Planet (formerly Openwave Systems Inc.), a software company, from April 2000 through March2006, including Vice President, Legal & Corporate Affairs. He holds a B.A. from the University of Michigan and a J.D. from Harvard Law School.
Timothy Dilley has served as our Executive Vice President, Worldwide Services and Chief Customer Officer since December 2006. Prior to joining
us, Mr. Dilley served as Senior Vice President of Global Customer Services at Informatica Corporation, an enterprise software company, from December 1998until December 2006. He holds a B.S. from California State University at Fresno.
8/10/2019 Net Suite AR
http://slidepdf.com/reader/full/net-suite-ar 11/87
Table of Contents
Item 1A. Risk Factors
description of the risks and uncertainties associated with our business is set forth below. If any of such risks and uncertainties actually occurs, our business, financial condition or operating results could differ materially from the plans, projections and other forward-looking statements included inthe section titled "Management's Discussion and Analysis of Financial Condition and Results of Operations" and elsewhere in this report and in our other public filings. In addition, if any of the following risks and uncertainties, or if any other risks and uncertainties, actually occurs, our business,inancial condition or operating results could be harmed substantially, which could cause the market price of our stock to decline, perhaps
significantly.
Risks Related to Our Business
Continued adverse economic conditions or reduced investments in cloud-based applications and information technology spending may harm our business.
Our business depends on the overall demand for cloud-based applications and information technology spending and on the economic health andgeneral willingness of our current and prospective customers to make capital commitments. If the conditions in the U.S. and global economic environmentremain uncertain or continue to be volatile, or if they deteriorate further, our business, operating results, and financial condition may be materially adverselyaffected. Continued weak or volatile economic conditions, or a reduction in spending for cloud-based applications and information technology even if economic conditions improve, would likely harm our business and operating results in a number of ways, including longer sales cycles, extended paymentterms, lower prices for our products and services, reduced sales, and lower customer retention rates.
We have a history of losses, and we may not achieve profitability in the future.
We have not been profitable on a generally accepted accounting principles (“GAAP”) basis during any quarterly or annual period since our formation. We experienced a net loss of $70.4 million for the year ended December 31, 2013. As of that date, our accumulated deficit was $449.2 million. Weexpect to make significant future expenditures related to the development and expansion of our business. As a result of these increased expenditures, we willhave to generate and sustain increased revenue to achieve and maintain future profitability. While historically our revenue has grown, this growth may not besustainable and we may not achieve sufficient revenue to achieve or maintain profitability. We may incur significant losses in the future for a number of reasons, including due to the other risks described in this Annual Report, and we may encounter unforeseen expenses, difficulties, complications and delaysand other unknown factors. Accordingly, we may not be able to achieve or maintain profitability and we may continue to incur significant losses for theforeseeable future.
Many of our customers are small- and medium‑ sized businesses and divisions of large companies, which may result in increased costs as weattempt to reach, acquire and retain customers.
We market and sell our application suite to small- and medium-sized businesses and divisions of large companies. To grow our revenue quickly, wemust add new customers, sell additional services to existing customers and encourage existing customers to renew their subscriptions. However, selling to andretaining small- and medium-sized businesses can be more difficult than selling to and retaining large enterprises because small- and medium-sized businesscustomers:
• are more price sensitive;
• are more difficult to reach with broad marketing campaigns;• have high churn rates in part because of the nature of their businesses;• often lack the staffing to benefit fully from our application suite’s rich feature set; and• often require higher sales, marketing and support expenditures by vendors that sell to them per revenue dollar generated for those vendors.
If we are unable to cost ‑effectively market and sell our service to our target customers, our ability to grow our revenue and become profitable will beharmed.
Our business depends substantially on customers renewing, upgrading and expanding their subscriptions for our services. Any decline in our customer renewals, upgrades and expansions would harm our future operating results.
We sell our application suite pursuant to service agreements that are generally one year in length. Our customers have no obligation to renew their subscriptions after their subscription period expires, and they may not renew their subscriptions at the same or higher levels. Moreover, under specificcircumstances, our customers have the right to cancel their service agreements before they expire. In addition, in the first year of a subscription, customersoften purchase a higher level of professional services than they do in renewal years. As a result, our ability to grow is dependent in part on customers purchasing additional subscriptions and modules after the first year of their subscriptions. We may not accurately predict future trends in customer renewals.Our customers’ renewal rates may decline or fluctuate because of several factors, including their satisfaction or dissatisfaction with our services, the prices of
our services, the prices of services offered by our competitors or reductions in our customers’ spending levels due to the macroeconomic environment or other factors. If our customers do not renew their subscriptions for our services, renew on less favorable terms, or do not purchase additional functionality or
9

8/10/2019 Net Suite AR
http://slidepdf.com/reader/full/net-suite-ar 12/87
Table of Contents
subscriptions, our revenue may grow more slowly than expected or decline and our profitability and gross margin may be harmed.
Any disruption of service at our data centers could interrupt or delay our ability to deliver our service to our customers.
We host our services, serve our customers and support our operations primarily from California-based data centers, which we operate in conjunctionwith CenturyLink. However, we host our OpenAir applications from a Massachusetts-based data center, which we also operate in conjunction withCenturyLink. We also operate some customer and partner accounts along with Release Preview and trial accounts from a Massachusetts-based data center,which we operate in conjunction with CenturyLink. The OrderMotion applications are hosted from a Texas-based datacenter which we operate in conjunctionwith RackSpace. The Element Fusion applications are hosted from a datacenter which we operate in conjunction with SoftLayer. The Tribe HR applicationsare hosted from a Canada-based datacenter which we operate in conjunction with VM Farms. We do not have sole control over the operations of these facilities.
These facilities are vulnerable to damage or interruption from earthquakes, hurricanes, floods, fires, cyber security attacks, terrorist attacks, power losses,telecommunications failures and similar events. The occurrence of a natural disaster or an act of terrorism, a decision to close the facilities without adequatenotice or other unanticipated problems could result in lengthy interruptions in our services. As part of our current disaster recovery arrangements, our customer data in our California-based data center production environment is replicated to a data center operated in conjunction with CenturyLink located onthe East coast of the United States. In particular, our California-based data facilities are located in an area known for seismic activity, increasing our susceptibility to the risk that an earthquake could significantly harm the operations of these facilities. Likewise, facilities operated on the East coast of theUnited States are susceptible to hurricanes, winter storms and other regionally disruptive events. The facilities also could be subject to break-ins, computer viruses, sabotage, intentional acts of vandalism and other misconduct.
Our data center facilities providers have no obligations to renew their agreements with us on commercially reasonable terms, or at all. If we are unableto renew our agreements with the facilities providers on commercially reasonable terms, if our agreements with our facility providers are prematurelyterminated, or if in the future we add additional data center facility providers, we may experience costs or downtime in connection with the transfer to, or theaddition of, new data center facilities.
Any errors, defects, disruptions or other performance problems with our services could harm our reputation and may damage our customers’ businesses. Interruptions in our services might reduce our revenue, cause us to issue credits to customers, subject us to potential liability, cause customers toterminate their subscriptions and harm our renewal rates.
We may become liable to our customers and lose customers if we have defects or disruptions in our service or if we provide poor service.
Because we deliver our application suite as a service, errors or defects in the software applications underlying our service, or a failure of our hostinginfrastructure, may make our service unavailable to our customers. We are also reliant on third-party software and infrastructure, including the infrastructureof the Internet, to provide our services. Any failure of or disruption to this software and infrastructure could also make our service unavailable to our customers. Since our customers use our suite to manage critical aspects of their business, any errors, defects, disruptions in service or other performance
problems with our suite, whether in connection with the day ‑to‑day operation of our suite, upgrades or otherwise, could damage our customers’ businesses. If we have any errors, defects, disruptions in service or other performance problems with our suite, customers could elect not to renew, or delay or withhold payment to us, we could lose future sales or customers may make warranty claims against us, which could result in an increase in our provision for doubtfulaccounts, an increase in collection cycles for accounts receivable or costly litigation.
The market for cloud-based applications may develop more slowly than we expect.
Our success will depend, to a large extent, on the willingness of medium-sized businesses to accept cloud-based services for applications that theyview as critical to the success of their business. Many companies have invested substantial effort and financial resources to integrate traditional enterprise
software into their businesses and may be reluctant or unwilling to switch to a different application or to migrate these applications to cloud-based services.Other factors that may affect market acceptance of our application include:
• the security capabilities, reliability and availability of cloud-based services;• customer concerns with entrusting a third party to store and manage their data, especially confidential or sensitive data;• our ability to minimize the time and resources required to implement our suite;• our ability to maintain high levels of customer satisfaction;• our ability to implement upgrades and other changes to our software without disrupting our service;• the level of customization or configuration we offer;• our ability to provide rapid response time during periods of intense activity on customer websites; and• the price, performance and availability of competing products and services.
The market for these services may not develop further, or may develop more slowly than we expect, either of which would harm our business.
10
8/10/2019 Net Suite AR
http://slidepdf.com/reader/full/net-suite-ar 13/87
Table of Contents
If our security measures are breached and unauthorized access is obtained to a customer’s data, we may incur significant liabilities, our servicemay be perceived as not being secure and customers may curtail or stop using our suite.
The services we offer involve the storage of large amounts of our customers’ sensitive and proprietary information. If our security measures are breached as a result of third‑ party action, employee error, malfeasance or otherwise, and someone disrupts the confidentiality, integrity, or availability our customers’ data, we could incur significant liability to our customers and to individuals or businesses whose information was being stored by our customers,our business may suffer and our reputation will be damaged. Because techniques used to obtain unauthorized access to, or to sabotage, systems changefrequently and generally are not recognized until launched against a target, we may be unable to anticipate these techniques or to implement adequate preventivemeasures. If an actual or perceived breach of our security occurs, the market perception of the effectiveness of our security measures could be harmed and wecould lose sales and customers. Such an actual or perceived breach could also cause a significant and rapid decline in our stock price and the value of our
convertible senior notes (the “Notes”).
We provide service-level commitments to our customers, which could cause us to issue credits for future services if the stated service levels are not met for a given period and could significantly harm our revenue.
Our customer agreements provide service-level commitments. If we are unable to meet the stated service-level commitments or suffer extended periodsof unavailability for our service, we may be contractually obligated to provide these customers with credits for future services. Our revenue could besignificantly impacted if we suffer unscheduled downtime that exceeds the allowed downtimes under our agreements with our customers. In light of our historical experience with meeting our service-level commitments, we do not currently have any liabilities on our balance sheet for these commitments. Our service-level commitment to customers is 99.5% uptime per period, excluding scheduled maintenance. The failure to meet this level of service availability mayrequire us to credit qualifying customers for the value of an entire month of their subscription fees, not just the value of the subscription fee for the period of the downtime. As a result, a failure to deliver services for a relatively short duration could cause us to issue these credits to all qualifying customers. Anyextended service outages could harm our reputation, revenue and operating results.
Assertions by a third party that we infringe its intellectual property, whether successful or not, could subject us to costly and time ‑ consuming
litigation or expensive licenses.
The software and technology industries are characterized by the existence of a large number of patents, copyrights, trademarks and trade secrets and by frequent and an increasing amount of litigation based on allegations of infringement or other violations of intellectual property rights. We have from time totime received claims from third parties alleging we are infringing their intellectual property, and as we continue to grow, the possibility of these and other intellectual property rights claims against us may increase. Our technologies or technologies that we license may not be able to withstand any third ‑ partyclaims that they infringe or otherwise violate intellectual property rights. Furthermore, many of our service agreements require us to indemnify our customersfor certain third‑ party intellectual property infringement claims, which could increase our costs as a result of defending such claims and may require that we
pay damages if there were an adverse ruling related to any such claims. These types of claims could harm our relationships with our customers, may deter future customers from subscribing to our services or could expose us to litigation for these claims. Even if we are not a party to any litigation between acustomer and a third party, an adverse outcome in any such litigation could make it more difficult for us to defend our intellectual property in any subsequentlitigation in which we are a named party.
Any intellectual property rights claim against us or our customers, with or without merit, could be time ‑consuming, expensive to litigate or settle andcould divert management attention and financial resources. An adverse determination also could prevent us from offering our suite to our customers and mayrequire that we procure or develop substitute services that do not infringe.
For any intellectual property rights claim against us or our customers, we may have to pay damages, license fees and/or stop using technology foundto be in violation of a third party’s rights. We may have to seek a license for the technology. Such license may not be available on reasonable terms, if at all,
and may significantly increase our operating expenses or may require us to restrict our business activities and limit our ability to deliver certain products andservices. As a result, we may also be required to develop alternative non ‑infringing technology, which could require significant effort and expense and/or causeus to alter our product and service offerings which could negatively affect our business.
Our success depends in large part on our ability to protect and enforce our intellectual property rights.
We rely on a combination of patent, copyright, service mark, trademark and trade secret laws, as well as confidentiality procedures and contractualrestrictions, to establish and protect our proprietary rights, all of which provide only limited protection. We have numerous issued US patents and pendingUS patent applications. We cannot assure you that any patents will issue from our currently pending patent applications in a manner that gives us the
protection that we seek, if at all, or that any of our current patents or future patents issued to us will not be challenged, invalidated or circumvented. Any of our current patents or patents that may issue in the future from pending or future patent applications may not provide sufficiently broad protection or theymay not prove to be enforceable in actions against alleged infringers. Additionally, although we have licensed from other parties proprietary technology covered
by patents, we cannot be certain that any such patents will not be challenged, invalidated or circumvented. Also, we cannot assure you that any future servicemark or trademark registrations will be issued for pending or future applications or that any registered service marks or trademarks will be enforceable or
provide adequate protection of our proprietary rights.
11

8/10/2019 Net Suite AR
http://slidepdf.com/reader/full/net-suite-ar 14/87
Table of Contents
We endeavor to enter into agreements with our employees and contractors and agreements with parties with whom we do business to limit access toand disclosure of our proprietary information. The steps we have taken, however, may not prevent unauthorized use or the reverse engineering of our technology. Moreover, others may independently develop technologies that are competitive to ours or infringe our intellectual property. Enforcement of our intellectual property rights also depends on our successful legal actions against these infringers, but these actions may not be successful, even when our rightshave been infringed.
Furthermore, effective patent, trademark, service mark, copyright and trade secret protection may not be available in every country in which our services are available. In addition, the legal standards relating to the validity, enforceability and scope of protection of intellectual property rights inInternet‑related industries are uncertain and still evolving.
Our quarterly and annual operating results may fluctuate in the future. As a result, we may fail to meet or exceed the expectations of researchanalysts or investors, which could cause our stock price to decline.
Our quarterly and annual operating results may fluctuate as a result of a variety of factors, many of which are outside of our control. A decline ingeneral macroeconomic conditions could adversely affect our customers’ ability or willingness to purchase our application suite, which could adversely affectour operating results or financial outlook. Fluctuations in our quarterly operating annual results or financial outlook may also be due to a number of additionalfactors, including the risks and uncertainties discussed elsewhere in this report.
Fluctuations in our operating results could cause our stock price to decline rapidly, may lead analysts to change their long ‑term model for valuing ourcommon stock, may impact our ability to retain or attract key personnel, or may cause other unanticipated issues. If our operating results or financial outlook fall below the expectations of research analysts or investors, the price of our common stock and the market value of the Notes could decline substantially.
We believe that our revenue and operating results may vary significantly in the future and that period ‑to‑ period comparisons of our operating resultsmay not be meaningful. You should not rely on the results of one quarter as an indication of future performance.
Our limited operating history makes it difficult to evaluate our current business and future prospects, and may increase the risk of your investment.
Our company has been in existence since 1998, and much of our growth has occurred since 2004, with our revenue increasing from $17.7 millionduring the year ended December 31, 2004 to $414.5 million during the year ended December 31, 2013. Our limited operating history may make it difficult toevaluate our current business and our future prospects. We have encountered and will continue to encounter risks and difficulties frequently experienced bygrowing companies in rapidly changing industries. If we do not address these risks successfully, our business may be harmed.
The markets in which we compete are intensely competitive, and if we do not compete effectively, our operating results may be harmed.
The markets for financials/ERP, CRM, Ecommerce, PSA and HCM applications are intensely competitive and rapidly changing with relatively low barriers to entry. With the introduction of new technologies and market entrants, we expect competition to intensify in the future. In addition, pricing pressuresand increased competition generally could result in reduced sales, reduced margins or the failure of our service to achieve or maintain more widespread marketacceptance. Often we compete to sell our application suite against existing systems that our potential customers have already made significant expenditures toinstall. Competition in our market is based principally upon service breadth and functionality; service performance, security and reliability; ability to tailor and customize services for a specific company, vertical or industry; ease of use of the service; speed and ease of deployment, integration and configuration;total cost of ownership, including price and implementation and support costs; professional services implementation; and financial resources of the vendor.
We face competition from both traditional software vendors and SaaS providers. Our principal competitors include Epicor Software Corporation,Intuit Inc., Microsoft Corporation, Oracle Corporation, SAP, The Sage Group plc and salesforce.com, inc. Many of our actual and potential competitors enjoysubstantial competitive advantages over us, such as greater name recognition, longer operating histories, more varied products and services and larger marketing budgets, as well as substantially greater financial, technical and other resources. In addition, many of our competitors have established marketingrelationships and access to larger customer bases, and have major distribution agreements with consultants, system integrators and resellers. If we are not ableto compete effectively, our operating results will be harmed.
Our brand name and our business may be harmed by aggressive marketing strategies of our competitors.
Because of the early stage of development of our markets, we believe that building and maintaining brand recognition and customer goodwill iscritical to our success. Our efforts in this area have, on occasion, been complicated by the marketing efforts of our competitors, which may includeincomplete, inaccurate and false statements about our company and our services that could harm our business. Our ability to respond to our competitors’misleading marketing efforts may be limited under certain circumstances by legal prohibitions on permissible public communications by us as a publiccompany.
12

8/10/2019 Net Suite AR
http://slidepdf.com/reader/full/net-suite-ar 15/87
Table of Contents
If the prices we charge for our services are unacceptable to our customers, our operating results will be harmed.
As the market for our services matures, or as new competitors introduce new products or services that compete with ours, we may be unable to renewour agreements with existing customers or attract new customers at the same price or based on the same pricing model as previously used. As a result, it is
possible that competitive dynamics in our market may require us to change our pricing model or reduce our prices, which could harm our revenue, grossmargin and operating results.
If we are unable to develop new services or sell our services into new markets, our revenue growth will be harmed and we may not be able toachieve profitability.
Our ability to attract new customers and increase revenue from existing customers will depend in large part on our ability to enhance and improve our existing application suite and to introduce new services and sell into new markets. The success of any enhancement or new service depends on several factors,including the timely completion, introduction and market acceptance of the enhancement or service. Any new service we develop or acquire may not beintroduced in a timely or cost‑effective manner and may not achieve the broad market acceptance necessary to generate significant revenue. Any new marketsinto which we attempt to sell our application, including new vertical markets and new countries or regions, may not be receptive. If we are unable tosuccessfully develop or acquire new services, enhance our existing services to meet customer requirements or sell our services into new markets, our revenuewill not grow as expected and we may not be able to achieve profitability.
Because we are a global organization and our long ‑ term success depends, in part, on our ability to expand our sales of our and operationsoutside of the United States, our business is susceptible to risks associated with international sales and operations.
We currently maintain offices outside of the United States and have sales personnel or independent consultants in several countries. Approximatelyone quarter of our employees are located in an office in the Philippines. We have limited experience operating in foreign jurisdictions and are rapidly buildingour international operations. Managing a global organization is difficult, time consuming and expensive. Our inexperience in operating our business outside of the United States increases the risk that any international expansion efforts that we may undertake will not be successful. In addition, conducting internationaloperations subjects us to new risks that we have not generally faced in the United States. These risks include:
• localization of our services, including translation into foreign languages and adaptation for local practices and regulatory requirements;• lack of familiarity with and unexpected changes in foreign regulatory requirements;• longer accounts receivable payment cycles and difficulties in collecting accounts receivable;• difficulties in managing and staffing international operations;• fluctuations in currency exchange rates;• potentially adverse tax consequences, including the complexities of foreign value added tax systems and restrictions on the repatriation of earnings;• dependence on certain third parties, including channel partners with whom we do not have extensive experience;• the burdens of complying with a wide variety of foreign laws and legal standards;• increased financial accounting and reporting burdens and complexities;• political, social and economic instability abroad, terrorist attacks and security concerns in general; and• reduced or varied protection for intellectual property rights in some countries.
Operating in international markets also requires significant management attention and financial resources. The investment and additional resourcesrequired to establish operations and manage growth in other countries may not produce desired levels of revenue or profitability.
We rely on third ‑ party software, including Oracle database software, which may be difficult to replace or could cause errors or failures of our service that could lead to lost customers or harm to our reputation.
We rely on software licensed from third parties to offer our service, including database software from Oracle. This software may not continue to beavailable to us on commercially reasonable terms, or at all. Any loss of the right to use any of this software could result in delays in the provisioning of our service until equivalent technology is either developed by us, or, if available, is identified, obtained and integrated, which could harm our business. Anyerrors or defects in third‑ party software could result in errors or a failure of our service which could harm our business.
If we fail to maintain proper and effective internal controls, our ability to produce accurate and timely financial statements could be impaired and
investors’ views of us could be harmed.
Ensuring that we have adequate internal financial and accounting controls and procedures in place so that we can produce accurate financialstatements on a timely basis is a costly and time ‑consuming effort that needs to be re ‑evaluated frequently. Our internal control over financial reporting is a
process designed to provide reasonable assurance regarding the reliability of financial reporting and the preparation of financial statements in accordance withGAAP. Although we have completed the process of documenting, reviewing and improving our internal controls and procedures for compliance withSection 404 of the Sarbanes‑Oxley Act of 2002, for the fiscal year ended December 31, 2013, there can be no assurances that control deficiencies will not beidentified in the future.
13

8/10/2019 Net Suite AR
http://slidepdf.com/reader/full/net-suite-ar 16/87
Table of Contents
Implementing any additional required changes to our internal controls may distract our officers and employees, entail substantial costs to modify our existing processes and add personnel and take significant time to complete. These changes may not, however, be effective in maintaining the adequacy of our internal controls. Any failure to maintain that adequacy, or as consequent inability to produce accurate financial statements on a timely basis, could increaseour operating costs and harm our business. In addition, investors’ perceptions that our internal controls are inadequate or that we are unable to produceaccurate financial statements on a timely basis may harm our stock price and make it more difficult for us to effectively market and sell our service to newand existing customers.
Our business is subject to changing regulations regarding corporate governance and public disclosure that will increase both our costs and the
risk of noncompliance.
As a public company, we incur significant legal, accounting and other expenses associated with compliance with applicable laws, rules, regulationsand listing requirements. In addition, the Sarbanes-Oxley Act, the Dodd-Frank Act, and rules subsequently implemented by the SEC and The New York Stock Exchange, have imposed a variety of compliance requirements on public companies, including requiring changes in corporate governance practices. Inaddition, the SEC and the U.S. Congress may continue to increase the scope of applicable disclosure and corporate governance-related rules. Our managementand other personnel may need to devote a substantial amount of time to the compliance requirements associated with being a public company. Moreover, theselaws, rules and regulations have increased and may continue to increase the scope, complexity and cost of our corporate governance, reporting and disclosure
practices.
Because we recognize subscription revenue over the term of the applicable agreement, the lack of subscription renewals or new service agreements
may not be reflected immediately in our operating results.
The majority of our quarterly revenue is attributable to service agreements entered into during previous quarters. A decline in new or renewed serviceagreements in any one quarter will not be fully reflected in our revenue in that quarter but will harm our revenue in future quarters. As a result, the effect of significant downturns in sales and market acceptance of our services in a particular quarter may not be fully reflected in our operating results until future
periods. Our subscription model also makes it difficult for us to rapidly increase our revenue through additional sales in any period, because revenue fromnew customers must be recognized over the applicable subscription term.
Material defects or errors in the software we use to deliver our services could harm our reputation, result in significant costs to us and impair our
ability to sell our services.
The software applications underlying our services are inherently complex and may contain material defects or errors, particularly when firstintroduced or when new versions or enhancements are released. We have from time to time found defects in our service, and new errors in our existing servicemay be detected in the future. Any defects that cause interruptions to the availability of our services could result in:
• a reduction in sales or delay in market acceptance of our services;
• sales credits or refunds to our customers;
• loss of existing customers and difficulty in attracting new customers;
• diversion of development resources;
• harm to our reputation; and
• increased warranty and insurance costs.
After the release of our services, defects or errors may also be identified from time to time by our internal team and by our customers. The costsincurred in correcting any material defects or errors in our services may be substantial and could harm our operating results.
Government regulation of the Internet and Ecommerce is evolving, and unfavorable changes or our failure to comply with regulations could
harm our operating results.
As Internet commerce continues to evolve, increasing regulation by federal, state or foreign agencies becomes more likely. For example, we believeincreased regulation is likely in the area of data privacy, and laws and regulations applying to the solicitation, collection, processing or use of personal or consumer information could affect our customers’ ability to use and share data, potentially reducing demand for financials/ERP, CRM, PSA and Ecommercesolutions and restricting our ability to store, process and share our customers’ data. In addition, taxation of services provided over the Internet or other chargesimposed by government agencies or by private organizations for accessing the Internet may also be imposed. Any regulation imposing greater fees for Internetuse or restricting information exchanged over the Internet could result in a decline in the use of the Internet and the viability of Internet ‑ based services, harming
our business and operating results.
14
8/10/2019 Net Suite AR
http://slidepdf.com/reader/full/net-suite-ar 17/87
Table of Contents
rivacy concerns and laws or other domestic or foreign regulations may reduce the effectiveness of our application suite and harm our business.
Our customers can use our service to store personal or identifying information regarding their customers and contacts. Federal, state and foreigngovernment bodies and agencies, however, have adopted or are considering adopting laws and regulations regarding the collection, use and disclosure of
personal information obtained from consumers and other individuals. The costs of compliance with, and other burdens imposed by, such laws andregulations that are applicable to the businesses of our customers may limit the use and adoption of our service and reduce overall demand for it.
In addition to government activity, privacy advocacy groups and the technology and other industries are considering various new, additional or different self ‑regulatory standards that may place additional burdens on us. If the gathering of personal information were to be curtailed, financials/ERP,CRM, Ecommerce, PSA and HCM solutions would be less effective, likely reducing demand for our service and harming our business.
If benefits currently available under the Czech Republic government subsidy program are reduced or disallowed, our product development costs
could increase.
At our product development facility in the Czech Republic, we participate in a government subsidy program for employing local residents. Under the program, the Czech Republic government will reimburse us for certain operating expenses we incur. The reimbursements are based upon qualifying productdevelopment expenditures which are primarily salaries for persons conducting product development activities. During the years ended December 31, 2013 andDecember 31, 2012, our product development operating expenses were reduced by approximately $2.5 million and $2.0 million, respectively, for reimbursements of eligible operating expenses incurred during the year ended December 31, 2013 and the period from November 2010 to December 31, 2012,respectively. We received approximately $2.0 million and $1.2 million in payments from the Czech Republic government during the years ended December 31,2013 and 2012, respectively. The Czech Republic government will determine if we met the program requirements and that our expenses are reimbursable. Thegovernment subsidy program terminates in 2014. If the Czech Republic government determines that our expense are ineligible for reimbursement, our financialcondition and operating results may be harmed.
Changes in financial accounting standards or practices may cause adverse, unexpected financial reporting fluctuations and harm our operating results.
A change in accounting standards or practices could harm our operating results and may even affect our reporting of transactions completed beforethe change is effective. New accounting pronouncements and varying interpretations of accounting pronouncements have occurred and may occur in thefuture. Changes to existing rules or the questioning of current practices may harm our operating results or the way we conduct our business.
Unanticipated changes in our effective tax rate could harm our future operating results.
We are subject to income taxes in the United States and various foreign jurisdictions, and our domestic and international tax liabilities are subject tothe allocation of expenses in differing jurisdictions. Our tax rate is affected by changes in the mix of earnings and losses in countries with differing statutorytax rates, certain non‑deductible expenses arising from the requirement to expense stock options and the valuation of deferred tax assets and liabilities,including our ability to utilize our net operating losses. Increases in our effective tax rate could harm our operating results.
We may be unable to integrate acquired businesses and technologies successfully or to achieve the expected benefits of such acquisitions. We may
acquire or invest in additional companies, which may divert our management’s attention, result in additional dilution to our stockholders and
consume resources that are necessary to sustain our business.
We have undertaken acquisitions during the year ended December 31, 2013 and in the past and may continue to evaluate and consider potentialstrategic transactions, including acquisitions and dispositions of businesses, technologies, services, products and other assets in the future. An acquisition,investment or business relationship may result in unforeseen operating difficulties and expenditures. In particular, we may encounter difficulties assimilatingor integrating the businesses, technologies, products, personnel or operations of the acquired companies, particularly if the key personnel of the acquiredcompany choose not to work for us, the company’s software is not easily adapted to work with ours or we have difficulty retaining the customers of anyacquired business due to changes in management or otherwise. Acquisitions may also disrupt our business, divert our resources and require significantmanagement attention that would otherwise be available for development of our business. Moreover, the anticipated benefits of any acquisition, investment or
business relationship may not be realized or we may be exposed to unknown liabilities.
We may in the future seek to acquire or invest in additional businesses, products, technologies or other assets. We also may enter into relationshipswith other businesses to expand our service offerings or our ability to provide service in foreign jurisdictions, which could involve preferred or exclusivelicenses, additional channels of distribution, discount pricing or investments in other companies. Negotiating these transactions can be time ‑consuming,difficult and expensive, and our ability
15
8/10/2019 Net Suite AR
http://slidepdf.com/reader/full/net-suite-ar 18/87

8/10/2019 Net Suite AR
http://slidepdf.com/reader/full/net-suite-ar 19/87

8/10/2019 Net Suite AR
http://slidepdf.com/reader/full/net-suite-ar 20/87
Table of Contents
substantial amounts of common stock, or the perception that such issuances and sales may occur, could adversely affect the trading price of the Notes andthe market price of our common stock and impair our ability to raise capital through the sale of additional equity securities.
The increase in the conversion rate for Notes converted in connection with a make-whole fundamental change may not adequately compensate theholders of the Notes for any lost value of their Notes as a result of such transaction and may cause our existing stockholders to experienceadditional dilution.
If a make-whole fundamental change occurs prior to the maturity date, under certain circumstances, we will increase the conversion rate by a number of additional shares of our common stock for Notes converted in connection with such make-whole fundamental change, which may cause our existingstockholders to experience additional dilution. The increase in the conversion rate will be determined based on the date on which the specified corporate
transaction becomes effective and the price paid (or deemed to be paid) per share of our common stock in such transaction. The increase in the conversion ratefor Notes converted in connection with a make-whole fundamental change may not adequately compensate the holders of the Notes for any lost value of their Notes as a result of such transaction. In addition, if the price of our common stock in the transaction is greater than $275.00 per share or less than $86.00 per share (in each case, subject to adjustment), no additional shares will be added to the conversion rate. Moreover, in no event will the conversion rate per $1,000
principal amount of Notes as a result of this adjustment exceed shares of common stock, subject to adjustment pursuant to the terms of the Notes.
Our obligation to increase the conversion rate for Notes converted in connection with a make-whole fundamental change could be considered a penalty, in which case the enforceability thereof would be subject to general principles of reasonableness and equitable remedies.
rovisions in the indenture for the Notes may deter or prevent a business combination that may be favorable to our stockholders.
If a fundamental change occurs prior to the maturity date of the Notes, holders of the Notes will have the right, at their option, to require us torepurchase all or a portion of their Notes. In addition, if a make-whole fundamental change occurs prior to the maturity date of the Notes, we will in somecases be required to increase the conversion rate for a holder that elects to convert its Notes in connection with such fundamental change. Furthermore, theindenture for the Notes prohibits us from engaging in certain mergers or acquisitions unless, among other things, the surviving entity assumes our obligationsunder the Notes. These and other provisions in the indenture could deter or prevent a third party from acquiring us even when the acquisition may befavorable to our stockholders.
Any adverse rating of the Notes may cause their trading price to fall, which may affect the trading price of our common stock.
We do not intend to seek a rating on the Notes. However, if a rating service were to rate the Notes and if such rating service were to lower its rating onthe Notes below the rating initially assigned to the Notes or otherwise announces its intention to put the Notes on credit watch, the trading price of the Notescould decline and the trading price of our common stock may be affected.
Anti ‑ takeover provisions contained in our amended and restated certificate of incorporation and amended and restated bylaws, as well asrovisions of Delaware law, could delay changes in management or impair a takeover attempt of us and, as a result, reduce the market price of
our common stock and the value of the Notes.
Our amended and restated certificate of incorporation, amended and restated bylaws and Delaware law contain provisions that could have the effectof rendering more difficult or discouraging an acquisition deemed undesirable by our Board of Directors. Our corporate governance documents include provisions:
• authorizing blank check preferred stock, which could be issued with voting, liquidation, dividend and other rights superior to our common stock;• limiting the liability of, and providing indemnification to, our directors and officers;• limiting the ability of our stockholders to call and bring business before special meetings and to take action by written consent in lieu of a meeting;• requiring advance notice of stockholder proposals for business to be conducted at meetings of our stockholders and for nominations of candidates
for election to our Board of Directors;• controlling the procedures for the conduct and scheduling of board and stockholder meetings;• providing the Board of Directors with the express power to postpone previously scheduled annual meetings and to cancel previously scheduled
special meetings;• limiting the determination of the number of directors on our board and the filling of vacancies or newly created seats on the board to our Board of
Directors then in office; and• providing that directors may be removed by stockholders only for cause.
These provisions, alone or together, could delay hostile takeovers and changes in control or changes in our management.
As a Delaware corporation, we are also subject to provisions of Delaware law, including Section 203 of the Delaware General Corporation law, which prevents some stockholders holding more than 15% of our outstanding common stock from engaging in certain business combinations without approval of the holders of substantially all of our outstanding common
18
8/10/2019 Net Suite AR
http://slidepdf.com/reader/full/net-suite-ar 21/87
Table of Contents
stock. Under Section 203, our majority stockholder, which is beneficially owned by Lawrence J. Ellison, and our current stockholders associated withmembers of Mr. Ellison’s family are not subject to the prohibition from engaging in such business combinations.
Any provision of our amended and restated certificate of incorporation or bylaws or Delaware law that has the effect of delaying or deterring a change in controlcould limit the opportunity for our stockholders to receive a premium for their shares of our common stock, and could also affect the price that some investorsare willing to pay for our common stock and the Notes.
Our failure to raise additional capital or generate the cash flows necessary to expand our operations and invest in our application services could
reduce our ability to compete successfully.
We may need to raise additional funds, and we may not be able to obtain additional debt or equity financing on favorable terms, if at all. If we raiseadditional equity or convertible debt financing, our stockholders may experience significant dilution of their ownership interests and the per share value of our common stock could decline. If we engage in additional debt financing, we may be required to accept terms that restrict our ability to incur additionalindebtedness and force us to maintain specified liquidity or other ratios. If we need additional capital and cannot raise it on acceptable terms, we may not beable to, among other things:
• develop or enhance our application and services;
• continue to expand our product development, sales and marketing organizations;
• acquire complementary technologies, products or businesses;
• expand operations, in the United States or internationally;
• hire, train and retain employees; or
• respond to competitive pressures or unanticipated working capital requirements.
Item 1B. Unresolved Staff Comments
None.
Item 2. Properties
Our corporate headquarters is located in San Mateo, California and comprises approximately 117,000 square feet of leased space. We also haveleased facilities in Denver, Las Vegas, Austin, Chicago, Atlanta, New York, Boston, Canada, the United Kingdom, Spain, the Czech Republic, Japan, HongKong, the Philippines, Singapore, Australia and Uruguay.
We believe that our existing properties are in good condition and are suitable for the conduct of our business. As our existing leases expire and as wecontinue to expand our operations, we believe that suitable space will be available to us on commercially reasonable terms.
Item 3. Legal Proceedings
From time to time, we are involved in various legal proceedings arising from the normal course of business activities. We are not presently a party toany litigation the outcome of which, we believe, if determined adversely to us, would individually or in the aggregate have a material adverse effect on our business, operating results or financial condition.
Item 4. Mine Safety Disclosures
Not Applicable.
PART II
Item 5. Market for the Registrant's Common Equity, Related Stockholder Matters and Issuer Purchases of Equity Securities
19
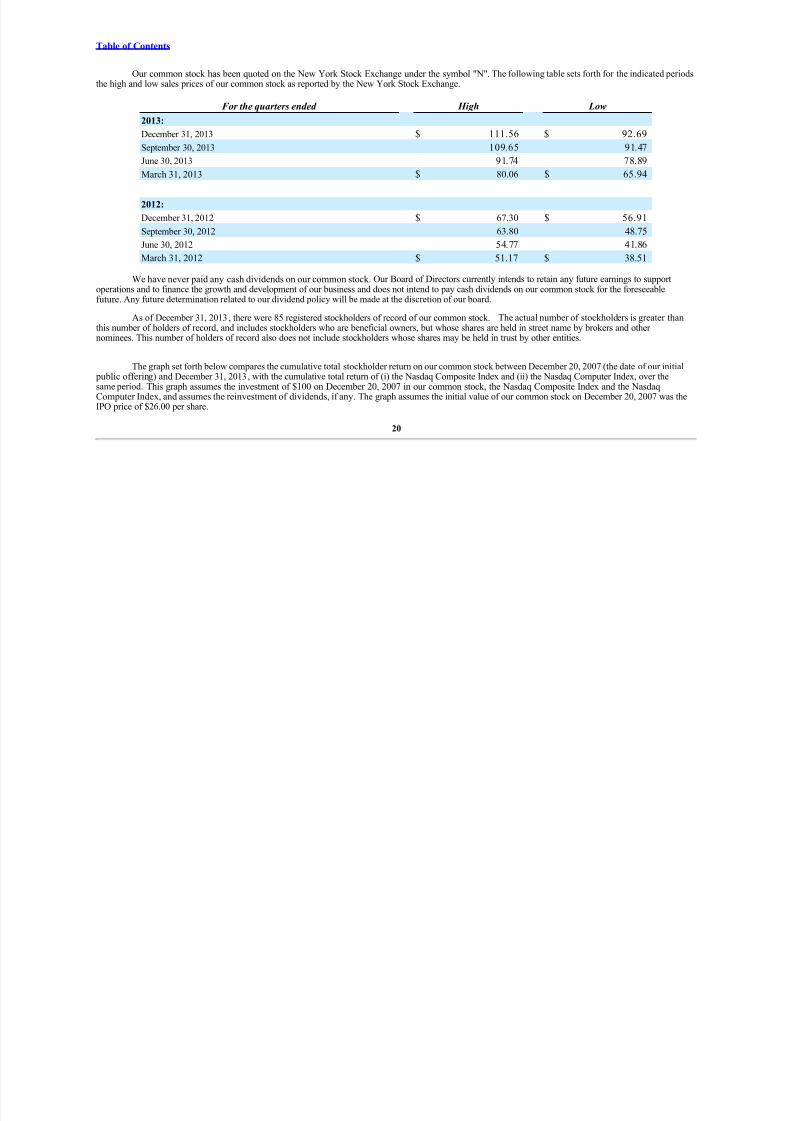
8/10/2019 Net Suite AR
http://slidepdf.com/reader/full/net-suite-ar 22/87
Table of Contents
Our common stock has been quoted on the New York Stock Exchange under the symbol "N". The following table sets forth for the indicated periodsthe high and low sales prices of our common stock as reported by the New York Stock Exchange.
For the quarters ended High Low
2013:
December 31, 2013 $ 111.56 $ 92.69
September 30, 2013 109.65 91.47
June 30, 2013 91.74 78.89
March 31, 2013 $ 80.06 $ 65.94
2012:
December 31, 2012 $ 67.30 $ 56.91
September 30, 2012 63.80 48.75
June 30, 2012 54.77 41.86
March 31, 2012 $ 51.17 $ 38.51
We have never paid any cash dividends on our common stock. Our Board of Directors currently intends to retain any future earnings to supportoperations and to finance the growth and development of our business and does not intend to pay cash dividends on our common stock for the foreseeablefuture. Any future determination related to our dividend policy will be made at the discretion of our board.
As of December 31, 2013, there were 85 registered stockholders of record of our common stock. The actual number of stockholders is greater thanthis number of holders of record, and includes stockholders who are beneficial owners, but whose shares are held in street name by brokers and other
nominees. This number of holders of record also does not include stockholders whose shares may be held in trust by other entities.
The graph set forth below compares the cumulative total stockholder return on our common stock between December 20, 2007 (the date of our initial public offering) and December 31, 2013, with the cumulative total return of (i) the Nasdaq Composite Index and (ii) the Nasdaq Computer Index, over thesame period. This graph assumes the investment of $100 on December 20, 2007 in our common stock, the Nasdaq Composite Index and the NasdaqComputer Index, and assumes the reinvestment of dividends, if any. The graph assumes the initial value of our common stock on December 20, 2007 was theIPO price of $26.00 per share.
20

8/10/2019 Net Suite AR
http://slidepdf.com/reader/full/net-suite-ar 23/87
Table of Contents
December 20,
2007
December 31,
2007
December 31,
2008
December 31,
2009
December 31,
2010
December 31,
2011
December 31,
2012
December 31,
2013
NetSuite $ 100 $ 151 $ 32 $ 61 $ 9 6 $ 156 $ 259 $ 396
Nasdaq Composite
Index $ 100 $ 100 $ 60 $ 86 $ 100 $ 9 9 $ 114 $ 158
Nasdaq Computer
Index $ 100 $ 101 $ 54 $ 92 $ 108 $ 108 $ 122 $ 161
The comparisons shown in the graph are based upon historical data. We caution that the stock price performance shown in the graph above is notnecessarily indicative of, nor is it intended to forecast, the potential future performance of our common stock.
Item 6. Selected Financial Data
The following selected condensed consolidated financial data should be read in conjunction with our audited consolidated financial statements andrelated notes thereto and with Management's Discussion and Analysis of Financial Condition and Results of Operations included elsewhere in this AnnualReport. The consolidated statement of operations data for the years ended December 31, 2013, 2012 and 2011 and the selected condensed consolidated balancesheet data as of December 31, 2013 and 2012 are derived from, and are qualified by reference to, the audited consolidated financial statements included in thisAnnual Report. The condensed consolidated statement of operations data for the fiscal years ended December 31, 2010 and 2009 and the consolidated balancesheet data as of December 31, 2011, 2010 and 2009 are derived from audited consolidated financial statements which are not included in this Annual Report.
Condensed Consolidated Statements of Operations Data
(Dollars and shares in thousands, except per share amounts)
Year ended December 31,
2013 2012 2011 2010 2009
Revenue:
Subscription and support $ 333,556 $ 252,903 $ 199,579 $ 163,964 $ 139,121
Professional services and other 80,952 55,922 36,747 29,185 27,419
Total revenue 414,508 308,825 236,326 193,149 166,540
Cost of revenue:
Subscription and support 5 5, 26 9 41,857 33,083 26,908 24,570
Professional services and other 79,925 53,706 37,777 34,741 31,535
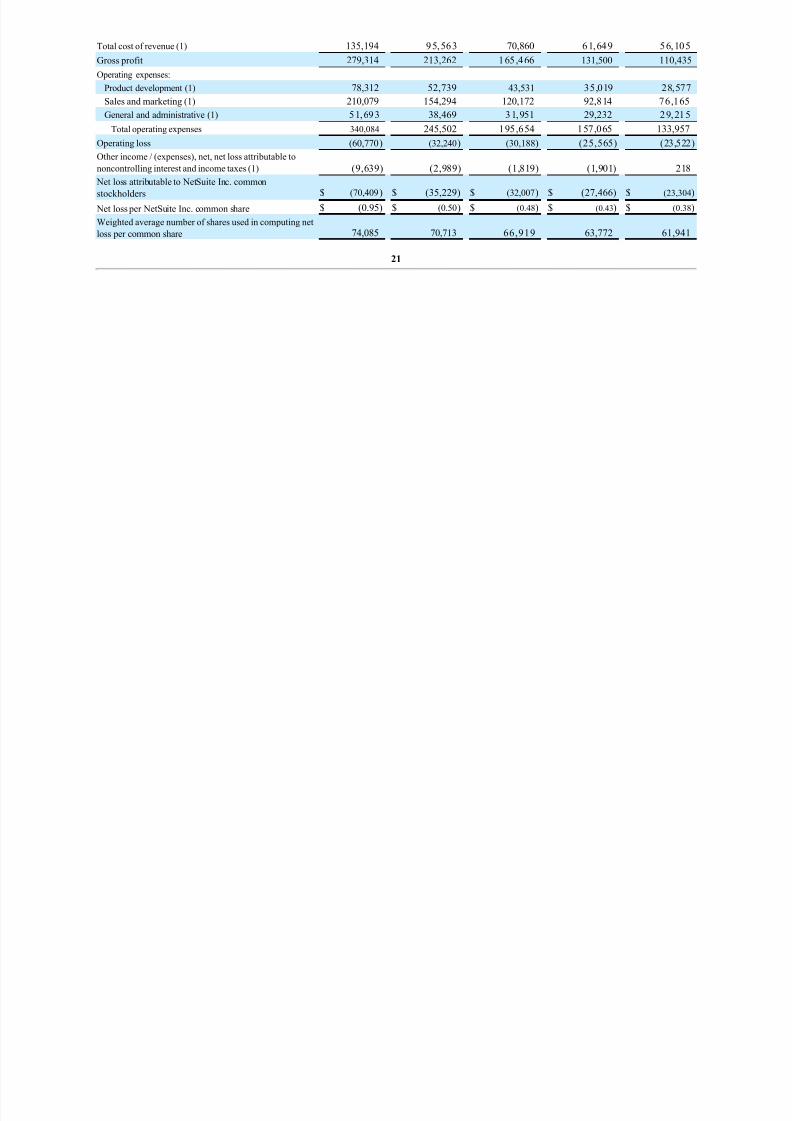
8/10/2019 Net Suite AR
http://slidepdf.com/reader/full/net-suite-ar 24/87
Total cost of revenue (1) 135,194 95,563 70,860 61,649 56,105
Gross profit 279,314 213,262 165,466 131,500 110,435
Operating expenses:
Product development (1) 78,312 52,739 43,531 35,019 28,577
Sales and marketing (1) 210,079 154,294 120,172 92,814 76,165
General and administrative (1) 51,693 38,469 31,951 29,232 29,215
Total operating expenses 340,084 245,502 195,654 157,065 133,957
Operating loss (60,770) (32,240) (30,188) (25,565) (23,522)
Other income / (expenses), net, net loss attributable to
noncontrolling interest and income taxes (1) (9,639) (2,989) (1,819) (1,901) 218 Net loss attributable to NetSuite Inc. common
stockholders $ (70,409) $ (35,229) $ (32,007) $ (27,466) $ (23,304)
Net loss per NetSuite Inc. common share $ (0.95) $ (0.50) $ (0.48) $ (0.43) $ (0.38)
Weighted average number of shares used in computing net
loss per common share 74,085 70,713 66,919 63,772 61,941
21
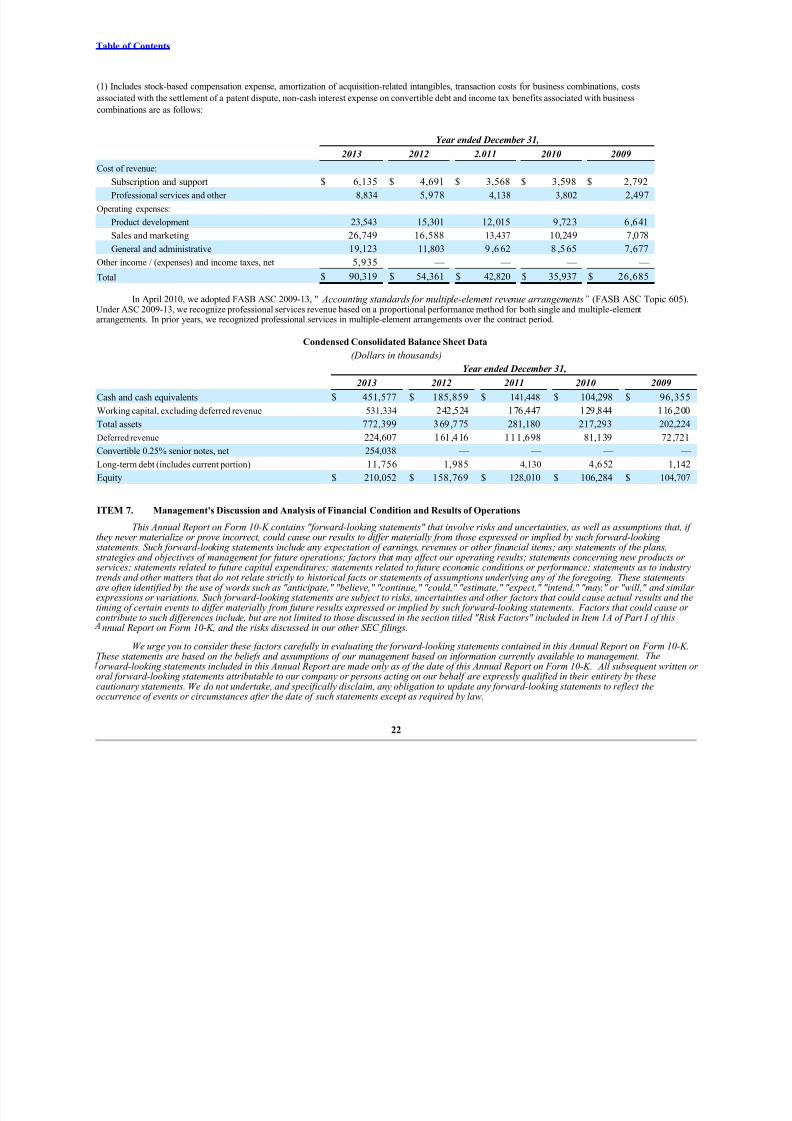
8/10/2019 Net Suite AR
http://slidepdf.com/reader/full/net-suite-ar 25/87
Table of Contents
(1) Includes stock-based compensation expense, amortization of acquisition-related intangibles, transaction costs for business combinations, costs
associated with the settlement of a patent dispute, non-cash interest expense on convertible debt and income tax benefits associated with business
combinations are as follows:
Year ended December 31,
2013 2012 2.011 2010 2009
Cost of revenue: Subscription and support $ 6,135 $ 4,691 $ 3,568 $ 3,598 $ 2,792
Professional services and other 8,834 5,978 4,138 3,802 2,497
Operating expenses:
Product development 23,543 15,301 12,015 9,723 6,641
Sales and marketing 26,749 16,588 13,437 10,249 7,078
General and administrative 19,123 11,803 9 ,6 62 8 ,5 65 7,677
Other income / (expenses) and income taxes, net 5,935 — — — —
Total $ 90,319 $ 54,361 $ 42,820 $ 35,937 $ 26,685
In April 2010, we adopted FASB ASC 2009-13, " Accounting standards for multiple-element revenue arrangements” (FASB ASC Topic 605).Under ASC 2009-13, we recognize professional services revenue based on a proportional performance method for both single and multiple-elementarrangements. In prior years, we recognized professional services in multiple-element arrangements over the contract period.
Condensed Consolidated Balance Sheet Data
(Dollars in thousands)
Year ended December 31,
2013 2012 2011 2010 2009
Cash and cash equivalents $ 451,577 $ 185,859 $ 141,448 $ 104,298 $ 96,355
Working capital, excluding deferred revenue 531,334 242,524 176,447 129,844 116,200
Total assets 772,399 369,775 281,180 217,293 202,224
Deferred revenue 224,607 161,416 111,698 81,139 72,721
Convertible 0.25% senior notes, net 254,038 — — — —
Long-term debt (includes current portion) 11,756 1,985 4,130 4,652 1,142
Equity $ 210,052 $ 158,769 $ 128,010 $ 106,284 $ 104,707
ITEM 7. Management's Discussion and Analysis of Financial Condition and Results of Operations
This Annual Report on Form 10-K contains "forward-looking statements" that involve risks and uncertainties, as well as assumptions that, if they never materialize or prove incorrect, could cause our results to differ materially from those expressed or implied by such forward-looking statements. Such forward-looking statements include any expectation of earnings, revenues or other financial items; any statements of the plans, strategies and objectives of management for future operations; factors that may affect our operating results; statements concerning new products or services; statements related to future capital expenditures; statements related to future economic conditions or performance; statements as to industrytrends and other matters that do not relate strictly to historical facts or statements of assumptions underlying any of the foregoing. These statementsare often identified by the use of words such as "anticipate," "believe," "continue," "could," "estimate," "expect," "intend," "may," or "will," and similar expressions or variations. Such forward-looking statements are subject to risks, uncertainties and other factors that could cause actual results and thetiming of certain events to differ materially from future results expressed or implied by such forward-looking statements. Factors that could cause or contribute to such differences include, but are not limited to those discussed in the section titled "Risk Factors" included in Item 1A of Part I of this
nnual Report on Form 10-K, and the risks discussed in our other SEC filings.
We urge you to consider these factors carefully in evaluating the forward-looking statements contained in this Annual Report on Form 10-K.These statements are based on the beliefs and assumptions of our management based on information currently available to management. Theorward-looking statements included in this Annual Report are made only as of the date of this Annual Report on Form 10-K. All subsequent written or
oral forward-looking statements attributable to our company or persons acting on our behalf are expressly qualified in their entirety by thesecautionary statements. We do not undertake, and specifically disclaim, any obligation to update any forward-looking statements to reflect theoccurrence of events or circumstances after the date of such statements except as required by law.
22
8/10/2019 Net Suite AR
http://slidepdf.com/reader/full/net-suite-ar 26/87
Table of Contents
Overview
We are the industry's leading provider of cloud-based financials/ERP and omnichannel commerce software suites. In addition to financials/ERP andomnichannel commerce software suites, we offer a broad suite of applications, including accounting, CRM, Ecommerce and retail management, PSA andHCM, which enable companies to manage most of their core business operations in our single integrated suite. Our "real-time dashboard" technology providesan easy-to-use view into up-to-date, role-specific business information. We also offer customer support and professional services related to implementing andsupporting our suite of applications. We deliver our suite over the Internet as a SaaS model.
In 1999, we released our first application, NetLedger, which focused on accounting applications. We then released Ecommerce functionality in 2000
and CRM and sales force automation functionality in 2001. In 2002, we released our next generation suite under the name NetSuite to which we have regularlyadded features and functionality. In December 2007, we went public. In 2008, we acquired OpenAir, and in 2009 we acquired QuickArrow Inc., both of which offer professional services automation and project portfolio management products.
Our headquarters are located in San Mateo, California. We were incorporated in California in September 1998 and reincorporated in Delaware in November 2007. We conduct our business worldwide, with international locations in Canada, Europe, Asia, Australia and Uruguay.
During 2013, we acquired a human resource capital management company and two companies to further develop our Ecommerce vertical business.In connection with these acquisitions, we incurred transaction costs totaling $3.0 million.
On November 1, 2013, we purchased all of the outstanding equity of TribeHR ("T-HR"), an on-line human capital management software provider.The T-HR product expands our product suite and the T-HR workforce augments our existing product development teams, which allows us to expand our
business capabilities in human resource management. The assets and operating results of T-HR are reflected in our consolidated financial statements from thedate of acquisition. On the closing date, we paid $24.8 million in cash of which $2.5 million is being held in escrow for up to 12 months following the closeof the transaction as indemnification against certain losses we may incur in the event of certain breaches of representations and warranties covered in the
purchase agreement. During the fourth quarter of 2013, the Company recorded $1.3 million in operating expenses related to transaction costs associated withthis business combination.
In June 2013, we issued at par value $310.0 million of 0.25% convertible senior notes due June 1, 2018 (the “Notes”). Interest is payable semi-annually in arrears on December 1 and June 1 of each year, commencing December 1, 2013. The initial conversion rate is 8.6133 shares of our common stock per $1,000 principal amount of Notes, subject to anti-dilution adjustments. The initial conversion price is approximately $116.10 per share of our commonstock and represents a conversion premium of approximately 35% based on the last reported sale price of our common stock of $86.00 on May 29, 2013, thedate the Notes offering was priced.
In connection with issuing the Notes, our Board of Directors approved the use of $30.0 million of the Note proceeds to repurchase 348,837 shares of our common stock for $86.00 per share. We have since repurchased and retired these shares. We intend to use the remaining net proceeds from the offering for working capital and other general corporate purposes, including to fund possible acquisitions of, or investments in, complementary businesses, products,services, technologies and capital expenditures.
On May 3, 2013, we purchased all of the outstanding equity of OrderMotion ("OM"). OM provides online ecommerce Order Management Servicesthat performs the back-end process for Ecommerce web stores. The OM product augments our existing product offering, which allows us to expand our
business capabilities in Ecommerce technology and services. The assets and operating results of OM are reflected in our consolidated financial statementsfrom the date of acquisition. On the closing date, we paid the former owners $23.5 million in cash. Additional consideration of $3.5 million in cash is beingwithheld up to the next 15 months following the close of the transaction as indemnification against certain losses we may incur in the event of certain breachesof representations and warranties covered in the purchase agreement. We also withheld $1.1 million as indemnification against losses we may incur fromcertain tax related matters of OM. This consideration is restricted until we determine that the matters have been properly settled. During the second quarter of 2013, we recorded $311,000 in employee termination costs and $1.1 million in operating expenses related to transaction costs associated with this businesscombination.
On March 6, 2013, we completed the purchase of all the outstanding equity of a website hosting provider company ("WH") that specializes inEcommerce technology and services. The WH workforce augments our existing product development teams, which allows us to expand our businesscapabilities in Ecommerce technology and services. The assets and operating results of WH are reflected in our consolidated financial statements from the dateof acquisition. On the closing date, we paid $10.2 million in cash. Additional consideration of $1.8 million in cash is being withheld for various periods up tothe next 24 months following the close of the transaction as indemnification against certain losses we may incur in the event of certain breaches of representations and warranties covered in the purchase agreement. During the first quarter of 2013, we recorded $560,000 in operating expenses related totransaction costs associated with this business combination.
On February 28, 2013, we entered into the third amendment to the perpetual software license agreement with Oracle USA ("Amendment"). TheAmendment provides for a 48 month extension to the May 2010 second amendment to the Oracle unlimited license agreement. The Amendment provides thatwe will pay a one-time fee of $13.1 million to extend the term for unlimited licenses from May 31, 2014 to May 31, 2018. The Amendment also provides for technical support services. We will pay $2.4 million for the support services from February 28, 2013 to February 27, 2014. We may renew Oracle supportservices for four subsequent annual periods for a fee of $4.3 million per year. The support services to be provided us by Oracle
23
8/10/2019 Net Suite AR
http://slidepdf.com/reader/full/net-suite-ar 27/87
Table of Contents
automatically renew unless we provide written notice of cancellation at least 60 days prior to the support renewal date. We financed the fees due under theAmendment pursuant to a note issued to Oracle Credit Corporation. The note bears interest at a rate of 2% per annum with payments scheduled over the termof the Amendment.
Key Components of Our Results of Operations
Revenue
Our revenue has grown from $17.7 million during the year ended December 31, 2004 to $414.5 million during the year ended December 31, 2013.
We generate sales directly through our sales team and, to a lesser extent, indirectly through channel partners. We sell our service to customers across a broad spectrum of industries, and we have tailored our service for wholesalers/distributors, manufacturers, e-tailers, services companies and softwarecompanies. The primary target customers for our service are medium-sized businesses and divisions of large companies. An increasing percentage of our customers and our revenue have been derived from larger businesses within this market. For the year ended December 31, 2013, we did not have any singlecustomer that accounted for more than 3% of our revenue.
We are pursuing a number of strategies that we believe will enable us to continue to grow. The goals of those strategic objectives are to continue tomove up-market, to increase the use of NetSuite as a platform, and to extend the verticalization of our product line. Although we have made progress towardour goals in recent periods, there are still many areas where we believe that we can continue to grow. To achieve these goals, we are focused on the followinginitiatives:
•
Growth of sales of OneWorld, our platform for ERP, CRM, PSA and Ecommerce capabilities in multi-currency environments across
multiple subsidiaries and legal entities, which supports the needs of large, standalone companies, and divisions of large enterprises;
•
Strengthening our offerings for targeted industries such as wholesale/distribution, manufacturing, e-tail, retail, technology and
professional services by adding deeper verticalized functionality; and
• Developing our SuiteCloud ecosystem to enable third parties to extend our offerings with their vertical expertise or horizontal solution.
We experience competitive pricing pressure when our products are compared with solutions that address a narrower range of customer needs or arenot fully integrated (for example, when compared with Ecommerce or CRM stand-alone solutions). In addition, since we sell primarily to medium-sized
businesses, we also face pricing pressure in terms of the more limited financial resources or budgetary constraints of many of our target customers. We do notcurrently experience significant pricing pressure from competitors that offer a similar cloud-based integrated business management suite.
We sell our application suite pursuant to subscription agreements. The duration of these agreements is generally one to three years. We rely in part ona large percentage of our customers to renew their agreements to drive our revenue growth. Our customers have no obligation to renew their subscriptions after the expiration of their subscription period.
We generally invoice our customers in advance in monthly, annual or quarterly installments, and typical payment terms provide that our clients payus within 30 to 60 days of invoice. Amounts that have been invoiced where the customer has a legal obligation to pay are recorded in accounts receivable anddeferred revenue. As of December 31, 2013, we had deferred revenue of $224.6 million.
Backlog was approximately $187.1 million and $110.4 million as of December 31, 2013 and 2012, respectively. Of the $187.1 million in backlogas of December 31, 2013, $116.2 million was short-term backlog and $70.9 million was long-term backlog. The $110.4 million in backlog as of December 31, 2012 included $73.4 million in short-term backlog and $37.0 million in long-term backlog. Backlog represents future billings under our subscriptionagreements that have not been invoiced or have not been recorded as deferred revenue. We expect that the amount of backlog may change from year-to-year for several reasons, including specific timing and duration of large customer subscription agreements, varying billing cycles of non-cancelable subscriptionagreements, the specific timing of customer renewals, foreign currency fluctuations, the timing of when unbilled deferred revenue is to be recognized as revenueand changes in customer financial circumstances. For multi-year subscription agreements billed annually, the associated backlog is typically high at the
beginning of the contract period, zero immediately prior to expiration and increases if the agreement is renewed. Low backlog attributable to a particular subscription agreement is typically associated with an impending renewal and is not an indicator of the likelihood of renewal or future revenue of thatcustomer. Accordingly, we expect that the amount of backlog may change from year to year depending in part upon the number of subscription agreements in
particular stages in their renewal cycle. Such fluctuations are not reliable indicators of future revenues.
24
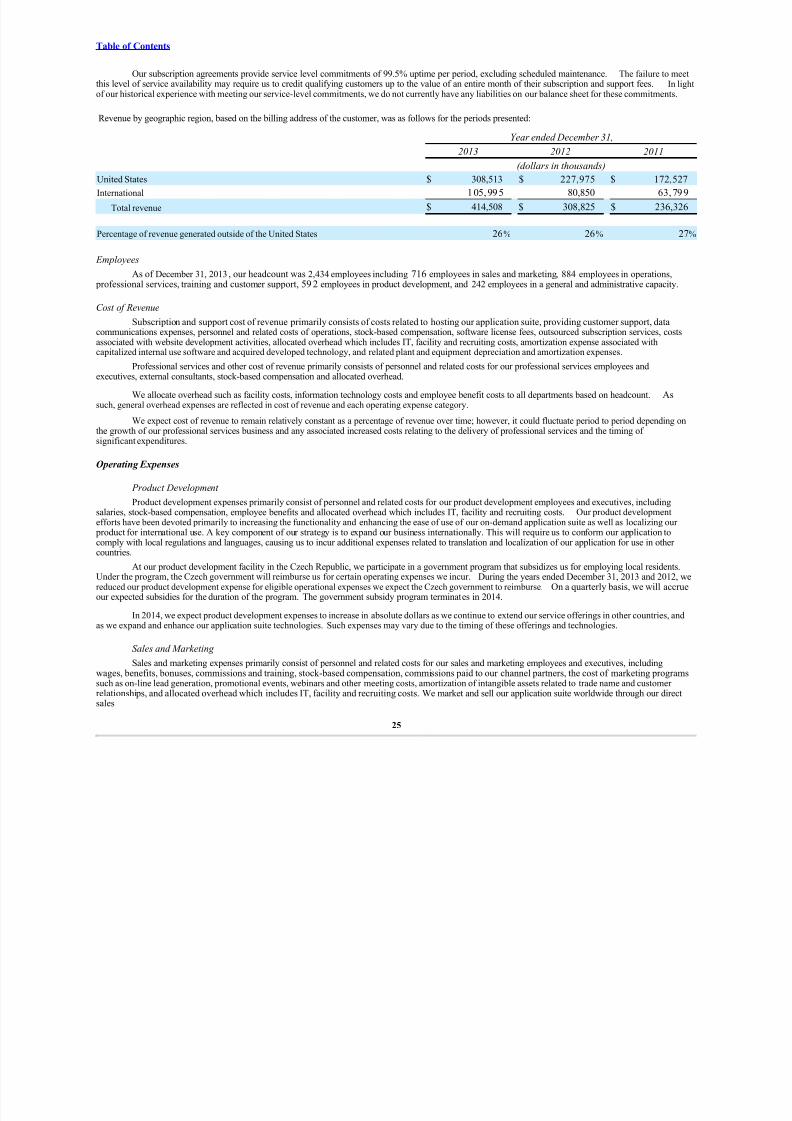
8/10/2019 Net Suite AR
http://slidepdf.com/reader/full/net-suite-ar 28/87
Table of Contents
Our subscription agreements provide service level commitments of 99.5% uptime per period, excluding scheduled maintenance. The failure to meetthis level of service availability may require us to credit qualifying customers up to the value of an entire month of their subscription and support fees. In lightof our historical experience with meeting our service-level commitments, we do not currently have any liabilities on our balance sheet for these commitments.
Revenue by geographic region, based on the billing address of the customer, was as follows for the periods presented:
Year ended December 31,
2013 2012 2011
(dollars in thousands)United States $ 308,513 $ 227,975 $ 172,527
International 105,995 80,850 63,799
Total revenue $ 414,508 $ 308,825 $ 236,326
Percentage of revenue generated outside of the United States 26% 26% 27%
Employees
As of December 31, 2013, our headcount was 2,434 employees including 716 employees in sales and marketing, 884 employees in operations, professional services, training and customer support, 59 2 employees in product development, and 242 employees in a general and administrative capacity.
Cost of Revenue
Subscription and support cost of revenue primarily consists of costs related to hosting our application suite, providing customer support, datacommunications expenses, personnel and related costs of operations, stock-based compensation, software license fees, outsourced subscription services, costs
associated with website development activities, allocated overhead which includes IT, facility and recruiting costs, amortization expense associated withcapitalized internal use software and acquired developed technology, and related plant and equipment depreciation and amortization expenses.
Professional services and other cost of revenue primarily consists of personnel and related costs for our professional services employees andexecutives, external consultants, stock-based compensation and allocated overhead.
We allocate overhead such as facility costs, information technology costs and employee benefit costs to all departments based on headcount. Assuch, general overhead expenses are reflected in cost of revenue and each operating expense category.
We expect cost of revenue to remain relatively constant as a percentage of revenue over time; however, it could fluctuate period to period depending onthe growth of our professional services business and any associated increased costs relating to the delivery of professional services and the timing of significant expenditures.
Operating Expenses
Product Development
Product development expenses primarily consist of personnel and related costs for our product development employees and executives, including
salaries, stock-based compensation, employee benefits and allocated overhead which includes IT, facility and recruiting costs. Our product developmentefforts have been devoted primarily to increasing the functionality and enhancing the ease of use of our on-demand application suite as well as localizing our
product for international use. A key component of our strategy is to expand our business internationally. This will require us to conform our application tocomply with local regulations and languages, causing us to incur additional expenses related to translation and localization of our application for use in other countries.
At our product development facility in the Czech Republic, we participate in a government program that subsidizes us for employing local residents.Under the program, the Czech government will reimburse us for certain operating expenses we incur. During the years ended December 31, 2013 and 2012, wereduced our product development expense for eligible operational expenses we expect the Czech government to reimburse. On a quarterly basis, we will accrueour expected subsidies for the duration of the program. The government subsidy program terminates in 2014.
In 2014, we expect product development expenses to increase in absolute dollars as we continue to extend our service offerings in other countries, andas we expand and enhance our application suite technologies. Such expenses may vary due to the timing of these offerings and technologies.
Sales and Marketing
Sales and marketing expenses primarily consist of personnel and related costs for our sales and marketing employees and executives, includingwages, benefits, bonuses, commissions and training, stock-based compensation, commissions paid to our channel partners, the cost of marketing programs
such as on-line lead generation, promotional events, webinars and other meeting costs, amortization of intangible assets related to trade name and customer relationships, and allocated overhead which includes IT, facility and recruiting costs. We market and sell our application suite worldwide through our directsales
25

8/10/2019 Net Suite AR
http://slidepdf.com/reader/full/net-suite-ar 29/87
Table of Contents
organization and indirect distribution channels such as strategic resellers. We capitalize and amortize our direct and channel sales commissions over the periodthe related revenue is recognized.
We expect to continue to invest in sales and marketing to pursue new customers and expand relationships with existing customers. As such, weexpect our sales and marketing expenses to increase in absolute dollars in 2014.
General and Administrative
General and administrative expenses primarily consist of personnel and related costs for executive, finance, human resources and administrative personnel, stock-based compensation, legal and other professional fees, other corporate expenses and allocated overhead.
In 2014, we expect our general and administrative expenses to increase in absolute dollars as we continue to expand our business.
Income Taxes
Since inception, we have incurred annual operating losses and, accordingly, have not recorded a provision for income taxes for any of the periods presented other than provisions for minimum and foreign income taxes.
Critical Accounting Policies and Judgments
Our consolidated financial statements are prepared in accordance with GAAP in the United States of America. The preparation of these consolidatedfinancial statements requires us to make estimates and assumptions that affect the reported amounts of assets, liabilities, revenue, costs and expenses andrelated disclosures. We base our estimates on historical experience and on various other assumptions that we believe to be reasonable under the circumstances.In many instances, we could have reasonably used different accounting estimates, and in other instances changes in the accounting estimates are reasonablylikely to occur from period-to-period. Accordingly, actual results could differ significantly from the estimates made by our management. To the extent that thereare material differences between these estimates and actual results, our future financial statement presentation, financial position, results of operations andcash flows will be affected.
In many cases, the accounting treatment of a particular transaction is specifically dictated by GAAP and does not require management's judgment inits application, while in other cases, significant judgment is required in selecting among available alternative accounting standards that allow differentaccounting treatment for similar transactions. We consider these policies requiring significant management judgment to be critical accounting policies. Thesecritical accounting policies are:
• Revenue recognition;
• Internal use software and website development costs;
• Deferred commissions;
• Accounting for stock-based compensation; and
• Goodwill and other intangible assets.
A description of our critical accounting policies and judgments for those areas are presented below. In addition, please refer to the Notes to ConsolidatedFinancial Statements for further discussion of our accounting policies.
Revenue Recognition
We generate revenue from two sources: (1) subscription and support services; and (2) professional services and other. Subscription and supportrevenue includes subscription fees from customers accessing our cloud-based application suite and support fees from customers purchasing support. Our arrangements with customers do not provide the customer with the right to take possession of the software supporting the cloud-based application service atany time. Professional services and other revenue include fees from consultation services to support the business process mapping, configuration, datamigration, integration and training. Amounts that have been invoiced are recorded in accounts receivable and in deferred revenue or revenue, depending onwhether the revenue recognition criteria have been met.
For the most part, subscription and support agreements are entered into for 12 to 36 months. In aggregate, more than 90% of the professional servicescomponent of the arrangements with customers is performed within 300 days of entering into a contract with the customer.
26

8/10/2019 Net Suite AR
http://slidepdf.com/reader/full/net-suite-ar 30/87
Table of Contents
The subscription agreements provide service-level commitments of 99.5% uptime per period, excluding scheduled maintenance. The failure to meetthis level of service availability may require us to credit qualifying customers up to the value of an entire month of their subscription and support fees. In lightof our historical experience with meeting our service-level commitments, we do not currently have any liabilities on our balance sheet for these commitments.
We commence revenue recognition when all of the following conditions are met:
• there is persuasive evidence of an arrangement;• the service is being provided to the customer;• the collection of the fees is reasonably assured; and• the amount of fees to be paid by the customer is fixed or determinable.
In most instances, revenue from a new customer acquisition is generated under sales agreements with multiple elements, comprised of subscriptionand support fees from customers accessing our cloud-based application suite and professional services associated with consultation services. We evaluate eachelement in a multiple-element arrangement to determine whether it represents a separate unit of accounting. An element constitutes a separate unit of accountingwhen the delivered item has standalone value and delivery of the undelivered element is probable and within our control. Subscription and support havestandalone value because we routinely sell it separately. For the most part, professional services have standalone value because we have sold professionalservices separately and there are several third party vendors that routinely provide similar professional services to our customers on a standalone basis.
We allocate revenue to each element in an arrangement based on a selling price hierarchy. The selling price for a deliverable is based on its vendor-specific objective evidence (“VSOE”), if available, third-party evidence (“TPE”), if VSOE is not available, or estimated selling price (“ESP”), if neither VSOE nor TPE is available. As we have been unable to establish VSOE or TPE for the elements of our sales arrangements, we establish the ESP for eachelement primarily by considering the weighted average of actual sales prices of professional services sold on a standalone basis and subscription and supportincluding various add-on modules when sold together without professional services, and other factors such as gross margin objectives, pricing practices andgrowth strategy. The consideration allocated to subscription and support is recognized as revenue over the contract period commencing when the subscriptionservice is made available to the customer. The consideration allocated to professional services is recognized as revenue using the proportional performancemethod.
The total arrangement fee for a multiple element arrangement is allocated based on the relative ESP of each element. However, since the professionalservices are generally completed prior to completion of delivery of subscription and support services, the revenue recognized for professional services in agiven reporting period does not include fees subject to delivery of subscription and support services. This results in the recognition of revenue for professionalservices that is generally no greater than the contractual fees for those professional services.
For single element sales agreements, subscription and support revenue is recognized ratably over the contract term beginning on the provisioning date of the contract. We recognize professional services revenue using the proportional performance method for single element arrangements.
Internal Use Software and Website Development Costs
The costs incurred in the preliminary stages of development are expensed as incurred. Once an application has reached the development stage,internal and external costs, if direct and incremental, are capitalized until the software is substantially complete and ready for its intended use. Capitalizationceases upon completion of all substantial testing. We also capitalize costs related to specific upgrades and enhancements when it is probable the expenditureswill result in additional functionality. Capitalized costs are recorded as part of property and equipment. Maintenance and training costs are expensed asincurred. Internal use software is amortized on a straight line basis over its estimated useful life, generally three years. Management evaluates the useful lives ofthese assets on an annual basis and tests for impairment whenever events or changes in circumstances occur that could impact the recoverability of theseassets. There were no impairments to internal use software during the years ended December 31, 2013, 2012 or 2011. We capitalized $3.2 million, $4.1
million and $1.3 million in internal use software during the years ended December 31, 2013, 2012 and 2011, respectively.
Deferred Commissions
We capitalize commission costs that are incremental and directly related to the acquisition of customer contracts. Commission costs are accrued andcapitalized upon execution of the sales contract by the customer. Payments to sales personnel are made shortly after the receipt of the related customer payment.Deferred commissions are amortized over the term of the related non-cancelable customer contract and are recoverable through the related future revenuestreams. We believe this is the preferable method of accounting as the commission costs are so closely related to the revenue from the customer contracts thatthey should be expensed over the same period that the related revenue is recognized. We capitalized commission costs of $70.4 million, $50.5 million and$44.4 million during the years ended December 31, 2013, 2012 and 2011, respectively.
ccounting for Stock-Based Compensation
We recognize the fair value of stock-based compensation in financial statements over the requisite service period of the individual grants, whichgenerally equals a four year vesting period. We recognize compensation expense for stock option awards, restricted stock awards and restricted stock unitawards on a straight-line basis over the requisite service period. We recognize compensation expense related to performance share awards based on theaccelerated method which recognizes a
27
8/10/2019 Net Suite AR
http://slidepdf.com/reader/full/net-suite-ar 31/87
Table of Contents
larger portion of the expense during the beginning of the vesting period than in the end of the vesting period. Estimates are used in determining the fair value of stock option awards using a Black-Scholes model. The fair value of restricted stock, restricted stock units performance share and performance share units isgenerally determined based on the intrinsic value of the award on the grant date. Our 2011 performance share unit grants included a market condition
performance criteria so we used a Monte Carlo simulation model to determine their fair value. Changes in the estimates used to determine the fair value of share-based equity compensation instruments could result in changes to our compensation charges. In 2013, performance metrics for certain performanceshares awarded for 2014 had not been set by our Board of Directors. As such, there is no accounting for these awards until the performances metrics are set.
In recent years, we have awarded more restricted stock, restricted stock units and performance share units than granted stock options. Consequentlyour restricted stock, restricted stock units and performance share units stock-based compensation expense represents a larger portion of total stock-basedcompensation expense recorded in our financial statements than stock options.
As a result of our stock-based compensation activity, we recorded $73.7 million, $48.4 million and $38.3 million of stock-based compensationduring the years ended December 31, 2013, 2012 and 2011, respectively.
Goodwill and Other Intangible Assets
Goodwill represents the excess of the purchase price over the fair value of net assets acquired. We allocated a portion of the purchase price of theacquisition of our acquired businesses to intangible assets, including customer relationships, developed technology and trade names that are being amortizedover their estimated useful lives of one to seven years. We also allocated a portion of the purchase price to tangible assets and assessed the liabilities to berecorded as part of the purchase price. The estimates we made in allocating the purchase price to tangible and intangible assets, and in assessing liabilitiesrecorded as part of the purchase, involved the application of judgment and the use of estimates and these could significantly affect our operating results andfinancial position.
We review the carrying value of goodwill for impairment annually and whenever events or changes in circumstances indicate that the carrying valueof goodwill may exceed its fair value. We evaluate impairment by comparing the estimated fair value of the reporting unit to its carrying value. Actual resultsmay differ materially from these estimates. The estimates we make in determining the fair value of the reporting unit involve the application of judgment
potentially affecting the timing and size of any future impairment charges. Impairment of our goodwill could significantly affect our operating results andfinancial position. Based on our most recent assessment, there was no goodwill impairment.
We continually evaluate whether events or circumstances have occurred that indicate that the estimated remaining useful life of our long-lived assets,including intangible assets, may warrant revision or that the carrying value of these assets may be impaired. Any write-downs are treated as permanentreductions in the carrying amount of the assets. We must use judgment in evaluating whether events or circumstances indicate that useful lives should changeor that the carrying value of assets has been impaired. Any resulting revision in the useful life or the amount of impairment also requires judgment. Any of these judgments could affect the timing or size of any future impairment charges. Revision of useful lives or impairment charges could significantly affect our operating results and financial position.
In 2009, we acquired QuickArrow (“QA”) for approximately $19.4 million and assigned $3.3 million to the developed technology intangible asset.The QA developed technology was being amortized over a four year period to cost of revenue. QA computing solutions for professional services businesseshas advanced our cloud computing application suite for services-based companies.
In the second quarter of 2012, certain QA customers transitioned from the QA service offering to a NetSuite service offering or terminated their service completely resulting in the carrying value of the QA developed technology assets exceeding the revised undiscounted expected future cash flows for theservice. As a result, we recorded a $401,000 impairment charge based on the excess of the carrying amount of the QA developed technology over the fair valueof such asset as of June 30, 2012. We amortized the remaining $481,000 net carrying value of the asset over the second half of 2012 which was the period theintangible asset generated revenue.
There were no impairment of goodwill during the years ended December 31, 2013, 2012 or 2011.
Results of Operations
Revenue, Cost of Revenue, Gross Profit and Gross Margin
28

8/10/2019 Net Suite AR
http://slidepdf.com/reader/full/net-suite-ar 32/87
Table of Contents
Our revenue, cost of revenue, gross profit and gross margin was as follows for the periods presented:
Year ended December 31,
2013 2012 2011
(dollars in thousands)
Revenue:
Subscription and support $ 333,556 $ 252,903 $ 199,579
Professional services and other 80,952 55,922 36,747
Total revenue 414,508 308,825 236,326
Cost of revenue (1):
Subscription and support 5 5, 26 9 41,857 33,083
Professional services and other 79,925 53,706 37,777
Total cost of revenue 135,194 95,563 70,860
Gross profit $ 279,314 $ 213,262 $ 165,466
Gross margin 67% 69% 70%
(1) Includes stock-based compensation expense and amortization of intangible assets of:
Cost of revenue:
Subscription and support $ 6,135 $ 4,691 $ 3,568
Professional services and other 8,834 5,978 4,138
$ 14,969 $ 10,669 $ 7,706
Twelve Months Ended December 31, 2013 as Compared to the Twelve Months Ended December 31, 2012
Revenue for the year ended December 31, 2013 increased $105.7 million, or 34%, compared to the same period in 2012.
Subscription and support revenue: Subscription and support revenue for the year ended December 31, 2013 increased $80.7 million, or 32%,compared to the same period in 2012. The increase was primarily the result of a $56.2 million increase in revenue resulting from the acquisition of newcustomers including the continued adoption of OneWorld, and a $24.5 million increase in revenue from existing customers. Additionally, subscriptions andsupport revenue increased during the year due to an increase in customer usage and an increase in the average selling price on deals for new customers.
Professional services and other revenue: Professional services and other revenue for the year ended December 31, 2013 increased $25.0 million, or45%, compared to the same period in 2012. The increase was primarily the result of a $42.8 million increase in revenue resulting from the acquisition of newcustomers. The increase in professional services and other revenue was partially offset by a $17.8 million decrease in revenue from existing customers relatedto services purchased in connection with the initial implementation of our product in 2012 that did not recur for those customers in 2013. Additionally,
demand for our professional services, particularly from our enterprise customers, has increased during 2013, however, our average consulting rates for professional services decreased slightly in 2013.
Revenue generated outside of the United States was $106.0 million, or 26%, of our revenue during the year ended December 31, 2013, as comparedto $80.9 million, or 26%, during the same period in 2012. Revenue generated outside the United States increased primarily due to our increased internationalsales efforts, particularly in Australia.
Cost of revenue for the year ended December 31, 2013 increased $39.6 million, or 41%, compared to the same period in 2012.
Subscription and support cost of revenue: Subscription and support cost of revenue for the year ended December 31, 2013 increased $13.4million, or 32%, compared to the same period in 2012. The increase was primarily due to a $6.4 million increase in personnel costs resulting from an increasein headcount and annual salary increases. The increase in personnel costs includes a $854,000 increase in stock-based compensation resulting from theissuance of equity awards to both existing and new employees. Additionally, data center and other costs increased by $6.9 million due to an increase insupport costs, depreciation, amortization of intangibles related to our 2013 and 2012 business acquisitions, amortization of capitalized internal use softwarecosts, and other operational costs associated with an increase in our data center capacity and activity.
Professional services and other cost of revenue: Professional services and other cost of revenue for the year ended December 31, 2013 increased$26.2 million, or 49%, compared to the same period in 2012. The increase was primarily the result of a $18.4 million increase in personnel costs, a $6.0million increase in fees related to outsourced consulting services and a $1.8 million increase in IT, facility and other operating expenses. Personnel costsincreased due to an increase in
29
8/10/2019 Net Suite AR
http://slidepdf.com/reader/full/net-suite-ar 33/87
Table of Contents
headcount, annual merit increases, incentive bonuses and training costs. The increase in personnel costs includes a $2.8 million increase in stock-basedcompensation resulting from the issuance of equity awards to both existing and new employees. Outsourced consulting fees increased due to an increase indemand for our professional services and an increase in training expenses for external consultants. IT, facility, recruiting and other operating expensesincreased primarily due to travel costs to engagements and costs to expand our global operations.
Our gross margin was 67% during the year ended December 31, 2013 and 69% for the same period in 2012. The decrease in our gross marginresulted primarily from an increase in demand for our professional services which represented a larger percentage of total revenue in 2013 compared to 2012and has lower gross margins than subscription and support revenue.
Twelve Months Ended December 31, 2012 as Compared to the Twelve Months Ended December 31, 2011
Revenue for the year ended December 31, 2012 increased $72.5 million, or 31%, compared to the same period in 2011.
Subscription and support revenue: Subscription and support revenue for the year ended December 31, 2012 increased $53.3 million, or 27%,compared to the same period in 2011. The increase was primarily the result of a $43.4 million increase in revenue resulting from the acquisition of newcustomers including the continued adoption of OneWorld, and a $9.9 million increase in revenue from existing customers. Additionally, subscriptions andsupport revenue increased during the year due to an increase in customer usage and an increase in the average selling price on deals for new customers.
Professional services and other revenue: Professional services and other revenue for the year ended December 31, 2012 increased $19.2 million,or 52%, compared to the same period in 2011. The increase was primarily the result of a $35.3 million increase in revenue resulting from the acquisition of new customers. The increase in professional services and other revenue was partially offset by a $16.1 million decrease in revenue from existing customersrelated to services purchased in connection with the initial implementation of our product in 2011 that did not recur for those customers in 2012. Additionally,demand for our professional services, particularly from our enterprise customers, has increased during 2012. Our consulting rates for professional servicesalso increased in 2012.
Revenue generated outside of the United States was $80.9 million, or 26%, of our revenue during the year ended December 31, 2012, as compared to$63.8 million, or 27%, during the same period in 2011. Revenue generated outside the United States increased primarily due to our increased international
sales efforts, particularly in Australia.
Cost of revenue for the year ended December 31, 2012 increased $24.7 million, or 35%, compared to the same period in 2011.
Subscription and support cost of revenue: Subscription and support cost of revenue for the year ended December 31, 2012 increased $8.8 million,or 27%, compared to the same period in 2011. The increase was primarily the result of a $4.3 million increase in personnel costs which resulted from anincrease in headcount and wages, a $1.7 million increase in data center expenses resulting from enhancements to our product delivery infrastructure, a $1.2million increase in depreciation expense associated with new equipment and a $1.6 million increase in overhead and other operational expenses due to anincrease in amortization expense associated with intangible assets. The increase in personnel costs includes a $630,000 increase in stock-based compensationresulting from the issuance of equity awards to both existing and new employees.
Professional services and other cost of revenue: Professional services and other cost of revenue for the year ended December 31, 2012 increased$15.9 million, or 42%, compared to the same period in 2011. The increase was primarily the result of a $10.3 million increase in personnel costs whichresulted from an increase in headcount, salary increases and other personnel costs, a $2.6 million increase in external consultants costs which resulted froman increase in customer demand for our professional services and $2.7 million increase in allocated overhead and other operational expenses due to an increasein allocations associated with an increase in headcount. The increase in personnel costs includes a $1.8 million increase in stock-based compensation resultingfrom the issuance of equity awards to both existing and new employees.
Our gross margin was 69% during the year ended December 31, 2012 and 70% for the same period in 2011. The decrease in our gross marginresulted primarily from an increase in demand for our professional services which represented a larger percentage of total revenue in 2012 compared to 2011.
30
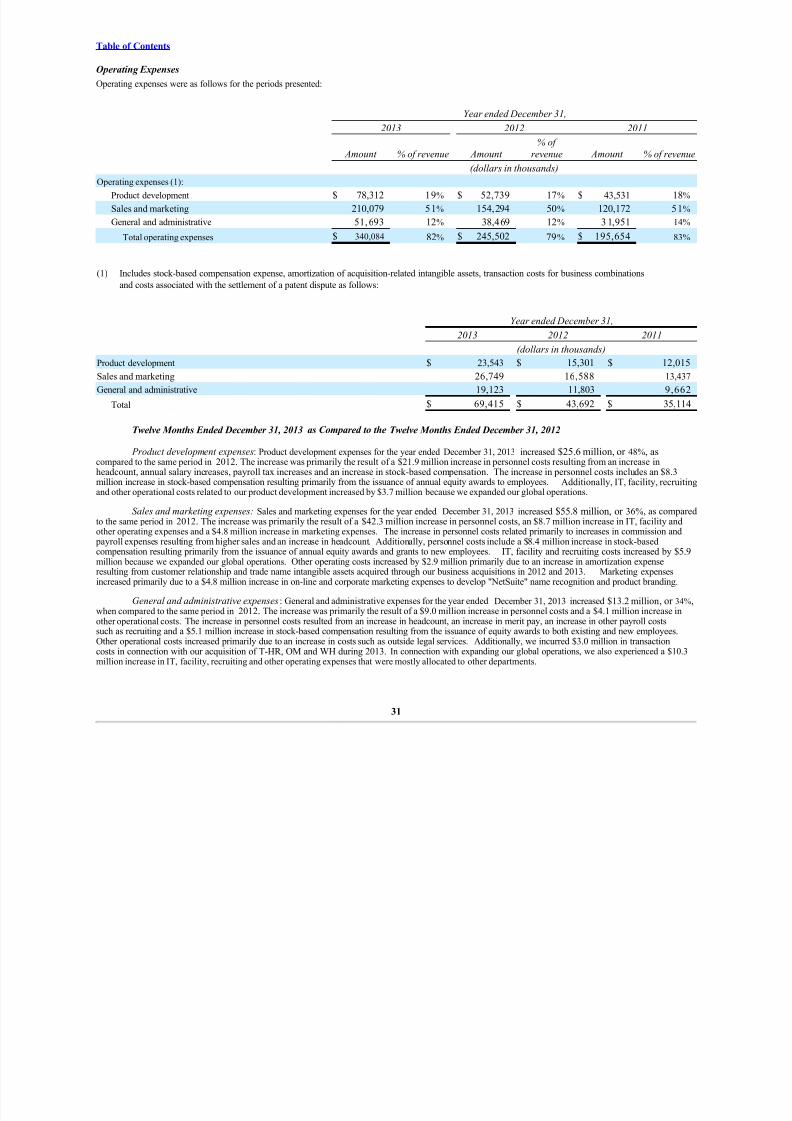
8/10/2019 Net Suite AR
http://slidepdf.com/reader/full/net-suite-ar 34/87
Table of Contents
Operating Expenses
Operating expenses were as follows for the periods presented:
Year ended December 31,
2013 2012 2011
Amount % of revenue Amount % of
revenue Amount % of revenue
(dollars in thousands)Operating expenses (1):
Product development $ 78,312 19% $ 52,739 17% $ 43,531 18%
Sales and marketing 210,079 51% 154,294 50% 120,172 51%
General and administrative 51,693 12% 38,469 12% 3 1,951 14%
Total operating expenses $ 340,084 82% $ 245,502 79% $ 195,654 83%
(1) Includes stock-based compensation expense, amortization of acquisition-related intangible assets, transaction costs for business combinations
and costs associated with the settlement of a patent dispute as follows:
Year ended December 31,
2013 2012 2011 (dollars in thousands)
Product development $ 23,543 $ 15,301 $ 12,015
Sales and marketing 26,749 16,588 13,437
General and administrative 19,123 11,803 9,662
Total $ 69,415 $ 43,692 $ 35,114
Twelve Months Ended December 31, 2013 as Compared to the Twelve Months Ended December 31, 2012
Product development expenses: Product development expenses for the year ended December 31, 2013 increased $25.6 million, or 48%, ascompared to the same period in 2012. The increase was primarily the result of a $21.9 million increase in personnel costs resulting from an increase inheadcount, annual salary increases, payroll tax increases and an increase in stock-based compensation. The increase in personnel costs includes an $8.3million increase in stock-based compensation resulting primarily from the issuance of annual equity awards to employees. Additionally, IT, facility, recruitingand other operational costs related to our product development increased by $3.7 million because we expanded our global operations.
Sales and marketing expenses: Sales and marketing expenses for the year ended December 31, 2013 increased $55.8 million, or 36%, as comparedto the same period in 2012. The increase was primarily the result of a $42.3 million increase in personnel costs, an $8.7 million increase in IT, facility andother operating expenses and a $4.8 million increase in marketing expenses. The increase in personnel costs related primarily to increases in commission and
payroll expenses resulting from higher sales and an increase in headcount. Additionally, personnel costs include a $8.4 million increase in stock-basedcompensation resulting primarily from the issuance of annual equity awards and grants to new employees. IT, facility and recruiting costs increased by $5.9million because we expanded our global operations. Other operating costs increased by $2.9 million primarily due to an increase in amortization expenseresulting from customer relationship and trade name intangible assets acquired through our business acquisitions in 2012 and 2013. Marketing expensesincreased primarily due to a $4.8 million increase in on-line and corporate marketing expenses to develop "NetSuite" name recognition and product branding.
General and administrative expenses : General and administrative expenses for the year ended December 31, 2013 increased $13.2 million, or 34%,when compared to the same period in 2012. The increase was primarily the result of a $9.0 million increase in personnel costs and a $4.1 million increase inother operational costs. The increase in personnel costs resulted from an increase in headcount, an increase in merit pay, an increase in other payroll costssuch as recruiting and a $5.1 million increase in stock-based compensation resulting from the issuance of equity awards to both existing and new employees.Other operational costs increased primarily due to an increase in costs such as outside legal services. Additionally, we incurred $3.0 million in transactioncosts in connection with our acquisition of T-HR, OM and WH during 2013. In connection with expanding our global operations, we also experienced a $10.3million increase in IT, facility, recruiting and other operating expenses that were mostly allocated to other departments.
31

8/10/2019 Net Suite AR
http://slidepdf.com/reader/full/net-suite-ar 35/87
Table of Contents
Twelve Months Ended December 31, 2012 as Compared to the Twelve Months Ended December 31, 2011
Product development expenses: Product development expenses for the year ended December 31, 2012 increased $9.2 million, or 21%, as comparedto the same period in 2011. The increase was primarily the result of a $10.0 million increase in personnel costs resulting from an increase in headcount,annual salary increases, payroll tax increases and an increase in stock-based compensation. The increase in personnel costs includes a $3.2 million increasein stock-based compensation resulting primarily from the issuance of annual equity awards to employees. Additionally, allocated overhead expense and other costs increased by $1.9 million due to higher overhead costs which are primarily facility costs and other operational costs associated with productdevelopment headcount. These cost increases were partially offset by expense reductions related to a $2.0 million employment development subsidy from theCzech Republic government for the period from November 2010 to December 31, 2012 and a $1.3 million increase in capitalized product development costsassociated with new product functionality.
Sales and marketing expenses: Sales and marketing expenses for the year ended December 31, 2012 increased $34.1 million, or 28%, as comparedto the same period in 2011. The increase was primarily the result of a $24.4 million increase in personnel costs, a $7.0 million increase in marketing and other costs and a $2.7 million increase in allocated overhead expense. The increase in personnel costs related primarily to an increase in headcount, commissionexpenses related to an increase in sales and a $2.8 million increase in stock-based compensation resulting from the issuance of equity awards to both existingand new employees. Marketing and other expenses increased primarily due to higher on-line marketing costs, an increase in costs associated with our annualuser conference, higher trade show fees and other promotional events.
General and administrative expenses : General and administrative expenses for the year ended December 31, 2012 increased $6.5 million, or 20%,when compared to the same period in 2011. The increase was primarily the result of a $3.6 million increase in personnel costs and a $2.9 million increase inother operational costs. The increase in personnel costs resulted from an increase in headcount, an increase in merit pay and an increase in other payroll costssuch as recruiting. Other operational costs increased primarily due to an increase in costs related to general administrative services and $797,000 in additionalsales taxes, partially offset by a decrease in patent costs due to a $720,000 patent settlement expense recorded in 2011, but not incurred in 2012. Additionally,we incurred $1.2 million in transaction costs in connection with our acquisition of SAC and RA during the year ended December 31, 2012. We alsoexperienced a $6.7 million increase in overhead expenses that are allocated to other departments due to an increase in costs such as facility costs, informationtechnology costs and recruiting costs.
Non-operating items, including interest income and expense, other income / (expense), income taxes and the effect of net loss attributable to noncontrolling
interest were as follows for the periods presented:
Year ended December 31,
2013 2012 2011
Amount % of revenue Amount % of
revenue Amount % of revenue
(dollars in thousands)
Interest income 67 — % 158 — % 167 — %
Interest expense (8,424) (2)% (192) — % (181) — %
Other expense, net (383) — % (412) — % (34) — %
Provision for income taxes 899 — % 2,543 1 % 1,771 1 %
Twelve Months Ended December 31, 2013 as Compared to the Twelve Months Ended December 31, 2012
Our interest expense increased by $8.2 million during the year ended December 31, 2013 as compared to the same period in 2012 primarily due to our issuance of $310.0 million in aggregate principal amount of 0.25% convertible senior notes in June 2013. In connection with these notes, we recorded $7.8million in interest costs consisting of amortization of debt discount, coupon interest and amortization of debt issuance costs during the year ended December 31, 2013. Additionally, related party interest increased by $349,000 because we amended our Oracle perpetual software license agreement in February 2013.
Our provision for income taxes decreased by $1.6 million during the year ended December 31, 2013 as compared to the same period in 2012 primarilydue to tax benefits associated with our 2013 business combinations. See Note 15 to our consolidated financial statements for more information regarding our income taxes.
Twelve Months Ended December 31, 2012 as Compared to the Twelve Months Ended December 31, 2011
Other expense, net for the year ended December 31, 2012 increased $378,000 as compared to the same period in 2011. The increase in other expense, netis primarily related to foreign currency losses during 2012.
32
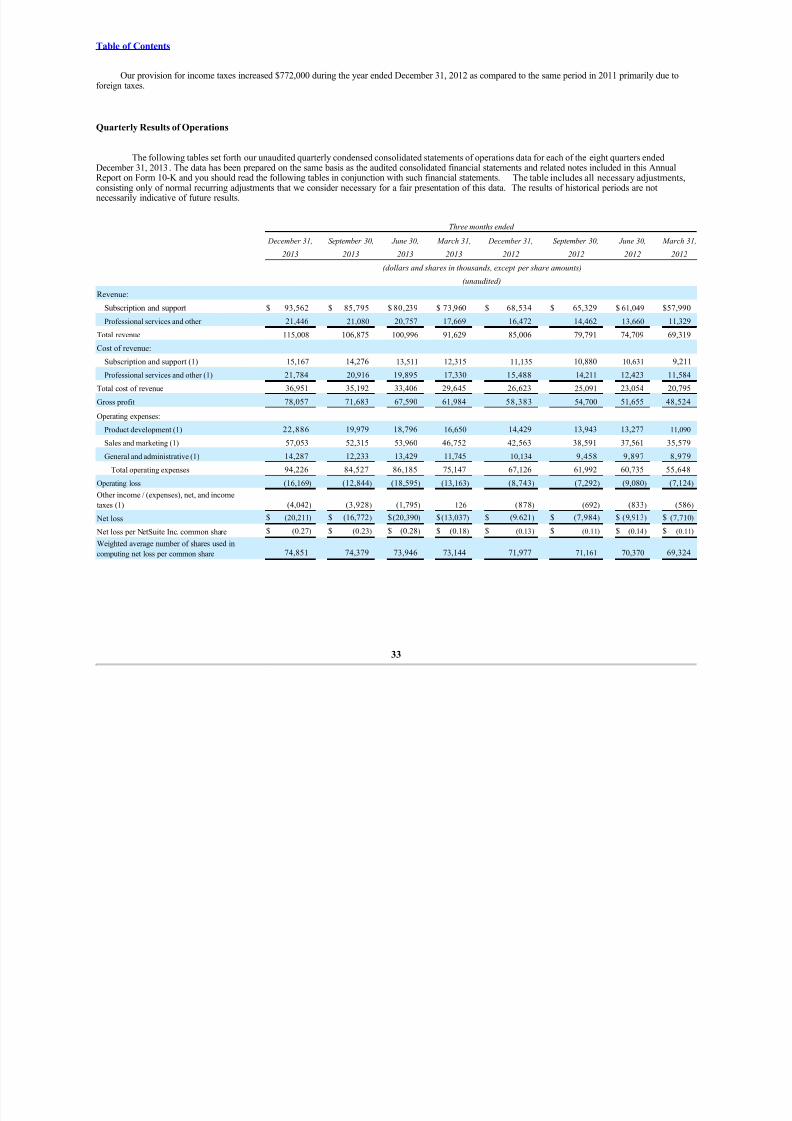
8/10/2019 Net Suite AR
http://slidepdf.com/reader/full/net-suite-ar 36/87
Table of Contents
Our provision for income taxes increased $772,000 during the year ended December 31, 2012 as compared to the same period in 2011 primarily due toforeign taxes.
Quarterly Results of Operations
The following tables set forth our unaudited quarterly condensed consolidated statements of operations data for each of the eight quarters ended
December 31, 2013. The data has been prepared on the same basis as the audited consolidated financial statements and related notes included in this AnnualReport on Form 10-K and you should read the following tables in conjunction with such financial statements. The table includes all necessary adjustments,consisting only of normal recurring adjustments that we consider necessary for a fair presentation of this data. The results of historical periods are notnecessarily indicative of future results.
Three months ended
December 31, September 30, June 30, March 31, December 31, September 30, June 30, March 31
2013 2013 2013 2013 2012 2012 2012 2012
(dollars and shares in thousands, except per share amounts)
(unaudited)
Revenue:
Subscription and support $ 93,562 $ 85,795 $ 80,239 $ 73,960 $ 68,534 $ 65,329 $ 61,049 $57,990
Professional services and other 21,446 21,080 20,757 17,669 16,472 14,462 13,660 11,329
Total revenue 115,008 106,875 100,996 91,629 85,006 79,791 74,709 69,319
Cost of revenue:
Subscription and support (1) 15,167 14,276 13,511 12,315 11,135 10,880 10,631 9,211
Professional services and other (1) 21,784 20,916 19,895 17,330 15,488 14,211 12,423 11,584
Total cost of revenue 36,951 35,192 33,406 29,645 26,623 25,091 23,054 20,795
Gross profit 78,057 71,683 67,590 61,984 58,383 54,700 51,655 48,524
Operating expenses:
Product development (1) 22,886 19,979 18,796 16,650 14,429 13,943 13,277 11,090
Sales and marketing (1) 57,053 52,315 53,960 46,752 42,563 38,591 37,561 35,579
General and administrative (1) 14,287 12,233 13,429 11,745 10,134 9,458 9,897 8,979
Total operating expenses 94,226 84,527 86,185 75,147 67,126 61,992 60,735 55,648
Operating loss (16,169) (12,844) (18,595) (13,163) (8,743) (7,292) (9,080) (7,124)
Other income / (expenses), net, and income
taxes (1) (4,042) (3,928) (1,795) 126 (878) (692) (833) (586)
Net loss $ (20,211) $ (16,772) $(20,390) $(13,037) $ (9,621) $ (7,984) $ (9,913) $ (7,710)
Net loss per NetSuite Inc. common share $ (0.27) $ (0.23) $ (0.28) $ (0.18) $ (0.13) $ (0.11) $ (0.14) $ (0.11)
Weighted average number of shares used in
computing net loss per common share 74,851 74,379 73,946 73,144 71,977 71,161 70,370 69,324
33
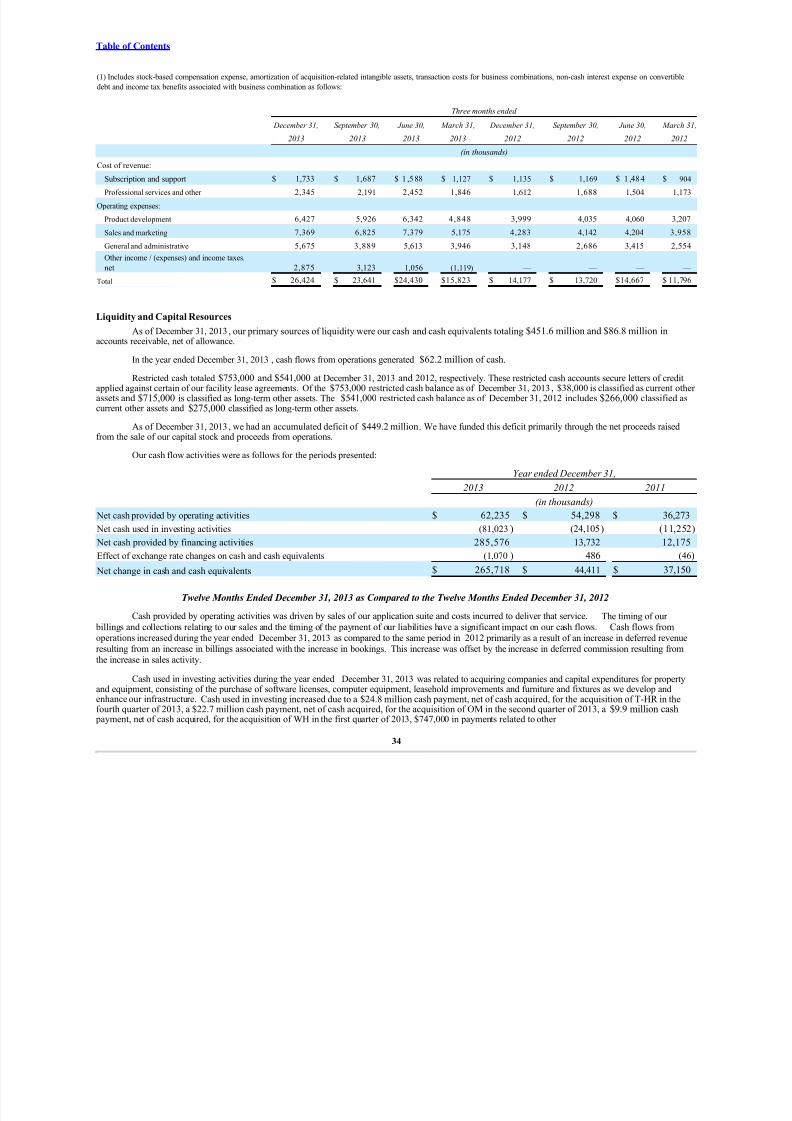
8/10/2019 Net Suite AR
http://slidepdf.com/reader/full/net-suite-ar 37/87
Table of Contents
(1) Includes stock-based compensation expense, amortization of acquisition-related intangible assets, transaction costs for business combinations, non-cash interest expense on convertible
debt and income tax benefits associated with business combination as follows:
Three months ended
December 31, September 30, June 30, March 31, December 31, September 30, June 30, March 31
2013 2013 2013 2013 2012 2012 2012 2012
(in thousands)
Cost of revenue:
Subscription and support $ 1,733 $ 1,687 $ 1 ,5 88 $ 1,127 $ 1,135 $ 1,169 $ 1 ,48 4 $ 904
Professional services and other 2,345 2,191 2,452 1,846 1,612 1,688 1,504 1,173
Operating expenses:
Product development 6,427 5,926 6,342 4,848 3,999 4,035 4,060 3,207
Sales and marketing 7,369 6,825 7,379 5,175 4,283 4,142 4,204 3,958
General and administrative 5,675 3,889 5,613 3,946 3,148 2,686 3,415 2,554
Other income / (expenses) and income taxes,
net 2,875 3,123 1,056 (1,119) — — — —
Total $ 26,424 $ 23,641 $24,430 $15,823 $ 14,177 $ 13,720 $14,667 $ 11,796
Liquidity and Capital Resources
As of December 31, 2013, our primary sources of liquidity were our cash and cash equivalents totaling $451.6 million and $86.8 million in
accounts receivable, net of allowance.
In the year ended December 31, 2013 , cash flows from operations generated $62.2 million of cash.
Restricted cash totaled $753,000 and $541,000 at December 31, 2013 and 2012, respectively. These restricted cash accounts secure letters of creditapplied against certain of our facility lease agreements. Of the $753,000 restricted cash balance as of December 31, 2013, $38,000 is classified as current otherassets and $715,000 is classified as long-term other assets. The $541,000 restricted cash balance as of December 31, 2012 includes $266,000 classified ascurrent other assets and $275,000 classified as long-term other assets.
As of December 31, 2013, we had an accumulated deficit of $449.2 million. We have funded this deficit primarily through the net proceeds raisedfrom the sale of our capital stock and proceeds from operations.
Our cash flow activities were as follows for the periods presented:
Year ended December 31,
2013 2012 2011
(in thousands)
Net cash provided by operating activities $ 62,235 $ 54,298 $ 36,273
Net cash used in investing activities (81,023) (24,105) (11,252)
Net cash provided by financing activities 285,576 13,732 12,175
Effect of exchange rate changes on cash and cash equivalents (1,070) 486 (46)
Net change in cash and cash equivalents $ 265,718 $ 44,411 $ 37,150
Twelve Months Ended December 31, 2013 as Compared to the Twelve Months Ended December 31, 2012
Cash provided by operating activities was driven by sales of our application suite and costs incurred to deliver that service. The timing of our billings and collections relating to our sales and the timing of the payment of our liabilities have a significant impact on our cash flows. Cash flows fromoperations increased during the year ended December 31, 2013 as compared to the same period in 2012 primarily as a result of an increase in deferred revenueresulting from an increase in billings associated with the increase in bookings. This increase was offset by the increase in deferred commission resulting fromthe increase in sales activity.
Cash used in investing activities during the year ended December 31, 2013 was related to acquiring companies and capital expenditures for propertyand equipment, consisting of the purchase of software licenses, computer equipment, leasehold improvements and furniture and fixtures as we develop andenhance our infrastructure. Cash used in investing increased due to a $24.8 million cash payment, net of cash acquired, for the acquisition of T-HR in thefourth quarter of 2013, a $22.7 million cash payment, net of cash acquired, for the acquisition of OM in the second quarter of 2013, a $9.9 million cash
payment, net of cash acquired, for the acquisition of WH in the first quarter of 2013, $747,000 in payments related to other
34

8/10/2019 Net Suite AR
http://slidepdf.com/reader/full/net-suite-ar 38/87
Table of Contents
acquisitions, an $8.5 million increase in capital expenditures for property and equipment to expand our global operations and a $500,000 equity investment ina small Ecommerce company in the first quarter of 2013.
The net cash provided by financing activities during the year ended December 31, 2013 increased from 2012 due to the $301.7 million in net proceeds received from the issuance of $310.0 million at par value of 0.25% convertible senior notes in June 2013 and a $1.0 million increase in proceedsreceived from employee stock option exercises. These increases were partially offset by the second quarter 2013 repurchase of 348,837 shares of our commonstock for $30.0 million or $86.00 per share and a $1.1 million increase in related party capital lease payments related primarily to the Oracle unlimited licenseagreement amended during the first quarter of 2013.
Twelve Months Ended December 31, 2012 as Compared to the Twelve Months Ended December 31, 2011
Cash provided by operating activities was driven by sales of our application suite and costs incurred to deliver that service. The timing of our billings and collections relating to our sales and the timing of the payment of our liabilities have a significant impact on our cash flows. Cash flows fromoperations increased during the year ended December 31, 2012 as compared to the same period in 2011 primarily as a result of an increase in deferred revenueresulting from an increase in billings associated with the increase in bookings. This increase was offset by the increase in deferred commission and anincrease in accounts receivable resulting from the increase in sales activity.
Cash used in investing activities during the year ended December 31, 2012 was related to capital expenditures for property and equipment, consistingof the purchase of software licenses, computer equipment, leasehold improvements and furniture and fixtures as we develop and enhance our infrastructure.Cash used in investing activities during the year ended December 31, 2012 increased primarily due to the acquisition of two small professional servicecompanies and an on-demand retail services company for a total of $9.2 million. Our property and equipment capital expenditures and our capitalized internal
use software costs also increased in 2012 compared to 2011. Included in the 2012 capitalized internal use software costs is a $1.3 million payment associatedwith the purchase of developed technology to enhance our data center production environment.
The net cash provided by financing activities during the year ended December 31, 2012 increased primarily due to an increase in proceeds from theissuance of common stock as a result of the exercise of stock options.
We intend to use our cash for general corporate purposes, including potential future acquisitions or other transactions. Further, we expect to incur additional expenses in connection with our international expansion. We believe that our cash and cash equivalents are adequate to fund those potential or anticipated activities.
While we believe that our uncommitted current working capital and anticipated cash flows from operations will be adequate to meet our cash needsfor daily operations and capital expenditures for at least the next 12 months, we may elect to raise additional capital through the sale of additional equity or debt securities, obtain a credit facility or sell certain assets. If additional funds are raised through the issuance of additional debt securities, these securitiescould have rights, preferences and privileges senior to holders of common stock or holders of the convertible notes, and terms of any debt could imposerestrictions on our operations. The sale of additional equity or convertible debt securities could result in additional dilution to our stockholders and additionalfinancing may not be available in amounts or on terms acceptable to us. If additional financing becomes necessary and we are unable to obtain the additionalfunds, we may be required to reduce the scope of our planned product development and marketing efforts, potentially harming our business, financialcondition and operating results.
Contractual Obligations
35
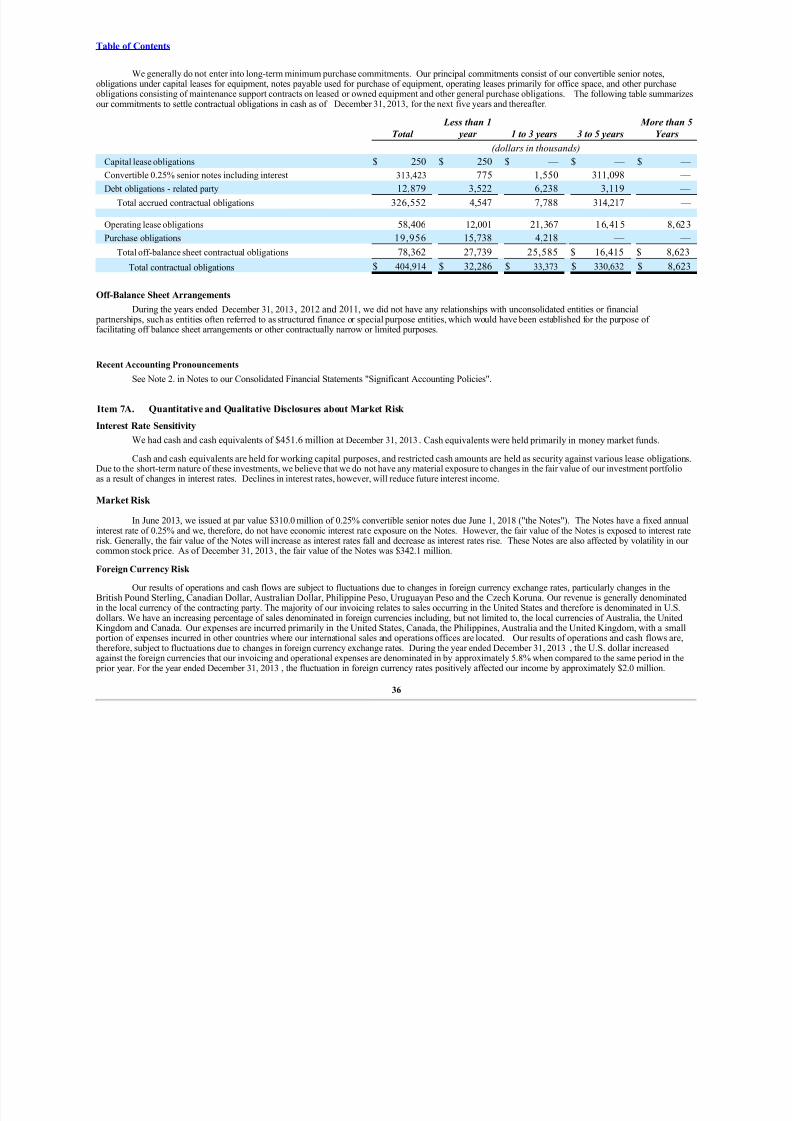
8/10/2019 Net Suite AR
http://slidepdf.com/reader/full/net-suite-ar 39/87
Table of Contents
We generally do not enter into long-term minimum purchase commitments. Our principal commitments consist of our convertible senior notes,obligations under capital leases for equipment, notes payable used for purchase of equipment, operating leases primarily for office space, and other purchaseobligations consisting of maintenance support contracts on leased or owned equipment and other general purchase obligations. The following table summarizesour commitments to settle contractual obligations in cash as of December 31, 2013, for the next five years and thereafter.
Total Less than 1
year 1 to 3 years 3 to 5 years More than 5
Years
(dollars in thousands)
Capital lease obligations $ 250 $ 250 $ — $ — $ —
Convertible 0.25% senior notes including interest 313,423 775 1,550 311,098 —
Debt obligations - related party 12,879 3,522 6,238 3,119 —
Total accrued contractual obligations 326,552 4,547 7,788 314,217 —
Operating lease obligations 58,406 12,001 21,367 16,415 8,623
Purchase obligations 19,956 15,738 4,218 — —
Total off-balance sheet contractual obligations 78,362 27,739 25,585 $ 16,415 $ 8,623
Total contractual obligations $ 404,914 $ 32,286 $ 33,373 $ 330,632 $ 8,623
Off-Balance Sheet Arrangements
During the years ended December 31, 2013, 2012 and 2011, we did not have any relationships with unconsolidated entities or financial partnerships, such as entities often referred to as structured finance or special purpose entities, which would have been established for the purpose of facilitating off balance sheet arrangements or other contractually narrow or limited purposes.
Recent Accounting Pronouncements
See Note 2. in Notes to our Consolidated Financial Statements "Significant Accounting Policies".
Item 7A. Quantitative and Qualitative Disclosures about Market Risk
Interest Rate Sensitivity
We had cash and cash equivalents of $451.6 million at December 31, 2013. Cash equivalents were held primarily in money market funds.
Cash and cash equivalents are held for working capital purposes, and restricted cash amounts are held as security against various lease obligations.Due to the short-term nature of these investments, we believe that we do not have any material exposure to changes in the fair value of our investment portfolioas a result of changes in interest rates. Declines in interest rates, however, will reduce future interest income.
Market Risk
In June 2013, we issued at par value $310.0 million of 0.25% convertible senior notes due June 1, 2018 ("the Notes"). The Notes have a fixed annualinterest rate of 0.25% and we, therefore, do not have economic interest rate exposure on the Notes. However, the fair value of the Notes is exposed to interest raterisk. Generally, the fair value of the Notes will increase as interest rates fall and decrease as interest rates rise. These Notes are also affected by volatility in ourcommon stock price. As of December 31, 2013, the fair value of the Notes was $342.1 million.
Foreign Currency Risk
Our results of operations and cash flows are subject to fluctuations due to changes in foreign currency exchange rates, particularly changes in theBritish Pound Sterling, Canadian Dollar, Australian Dollar, Philippine Peso, Uruguayan Peso and the Czech Koruna. Our revenue is generally denominatedin the local currency of the contracting party. The majority of our invoicing relates to sales occurring in the United States and therefore is denominated in U.S.dollars. We have an increasing percentage of sales denominated in foreign currencies including, but not limited to, the local currencies of Australia, the UnitedKingdom and Canada. Our expenses are incurred primarily in the United States, Canada, the Philippines, Australia and the United Kingdom, with a small
portion of expenses incurred in other countries where our international sales and operations offices are located. Our results of operations and cash flows are,therefore, subject to fluctuations due to changes in foreign currency exchange rates. During the year ended December 31, 2013, the U.S. dollar increasedagainst the foreign currencies that our invoicing and operational expenses are denominated in by approximately 5.8% when compared to the same period in the
prior year. For the year ended December 31, 2013 , the fluctuation in foreign currency rates positively affected our income by approximately $2.0 million.
36

8/10/2019 Net Suite AR
http://slidepdf.com/reader/full/net-suite-ar 40/87
Table of Contents
During the year ended December 31, 2013, we continued a hedging program initiated in 2008 to limit the exposure of foreign currency risk resultingfrom the revaluation of foreign denominated assets and liabilities through the use of forward exchange contracts. See “Balance Sheet Hedging - Hedging of Foreign Currency Assets and Liabilities” in Note 6 under the heading “Notes to the Consolidated Financial Statements” of Part 1, Item 1, “FinancialStatements” herein for further disclosures.
Fair Value of Financial Instruments
We do not have a material exposure to market risk with respect to investments, as our investments consist primarily of money market funds thatinvest primarily in highly liquid investments with maturities of two months or less. We do not use derivative financial instruments for speculative or trading purposes. However, this does not preclude our adoption of specific hedging strategies in the future.
37

8/10/2019 Net Suite AR
http://slidepdf.com/reader/full/net-suite-ar 41/87

8/10/2019 Net Suite AR
http://slidepdf.com/reader/full/net-suite-ar 42/87
Table of Contents
Report of Independent Registered Public Accounting Firm
The Board of Directors and Stockholders
NetSuite, Inc.:
We have audited the accompanying consolidated balance sheets of NetSuite Inc. and subsidiaries as of December 31, 2013 and 2012, and the related
consolidated statements of comprehensive loss, total equity, and cash flows for each of the years in the three-year period ended December 31, 2013. In
connection with our audits of the consolidated financial statements, we have also audited financial statement Schedule II, as set forth in Item 15(b). We also
have audited NetSuite Inc.'s internal control over financial reporting as of December 31, 2013, based on criteria established in Internal Control-Integrated
Framework (1992) issued by the Committee of Sponsoring Organizations of the Treadway Commission (COSO). NetSuite Inc.'s management is responsiblefor these consolidated financial statements and financial statement schedule, for maintaining effective internal control over financial reporting, and for its
assessment of the effectiveness of internal control over financial reporting, included in the accompanying Report of Management on Internal Control Over
Financial Reporting. Our responsibility is to express an opinion on these consolidated financial statements and financial statement schedule and an opinion on
NetSuite Inc.'s internal control over financial reporting based on our audits.
We conducted our audits in accordance with the standards of the Public Company Accounting Oversight Board (United States). Those standards require that
we plan and perform the audits to obtain reasonable assurance about whether the financial statements are free of material misstatement and whether effective
internal control over financial reporting was maintained in all material respects. Our audits of the consolidated financial statements included examining, on a
test basis, evidence supporting the amounts and disclosures in the financial statements, assessing the accounting principles used and significant estimates
made by management, and evaluating the overall financial statement presentation. Our audit of internal control over financial reporting included obtaining an
understanding of internal control over financial reporting, assessing the risk that a material weakness exists, and testing and evaluating the design and
operating effectiveness of internal control based on the assessed risk. Our audits also included performing such other procedures as we considered necessary
in the circumstances. We believe that our audits provide a reasonable basis for our opinions.
A company's internal control over financial reporting is a process designed to provide reasonable assurance regarding the reliability of financial reporting andthe preparation of financial statements for external purposes in accordance with generally accepted accounting principles. A company's internal control over
financial reporting includes those policies and procedures that (1) pertain to the maintenance of records that, in reasonable detail, accurately and fairly reflect
the transactions and dispositions of the assets of the company; (2) provide reasonable assurance that transactions are recorded as necessary to permit
preparation of financial statements in accordance with generally accepted accounting principles, and that receipts and expenditures of the company are being
made only in accordance with authorizations of management and directors of the company; and (3) provide reasonable assurance regarding prevention or
timely detection of unauthorized acquisition, use, or disposition of the company's assets that could have a material effect on the financial statements.
Because of its inherent limitations, internal control over financial reporting may not prevent or detect misstatements. Also, projections of any evaluation of
effectiveness to future periods are subject to the risk that controls may become inadequate because of changes in conditions, or that the degree of compliance
with the policies or procedures may deteriorate.
In our opinion, the consolidated financial statements referred to above present fairly, in all material respects, the financial position of NetSuite Inc. and
subsidiaries as of December 31, 2013 and 2012, and the results of their operations and their cash flows for each of the years in the three-year period ended
December 31, 2013, in conformity with U.S. generally accepted accounting principles. Also in our opinion, the related financial statement schedule, when
considered in relation to the basic consolidated financial statements taken as a whole, presents fairly, in all material respects, the information set forth therein.Also in our opinion, NetSuite Inc. maintained, in all material respects, effective internal control over financial reporting as of December 31, 2013, based on
criteria established in Internal Control-Integrated Framework (1992) issued by the Committee of Sponsoring Organizations of the Treadway Commission.
/s/ KPMG LLP
Santa Clara, California
February 28, 2014
39
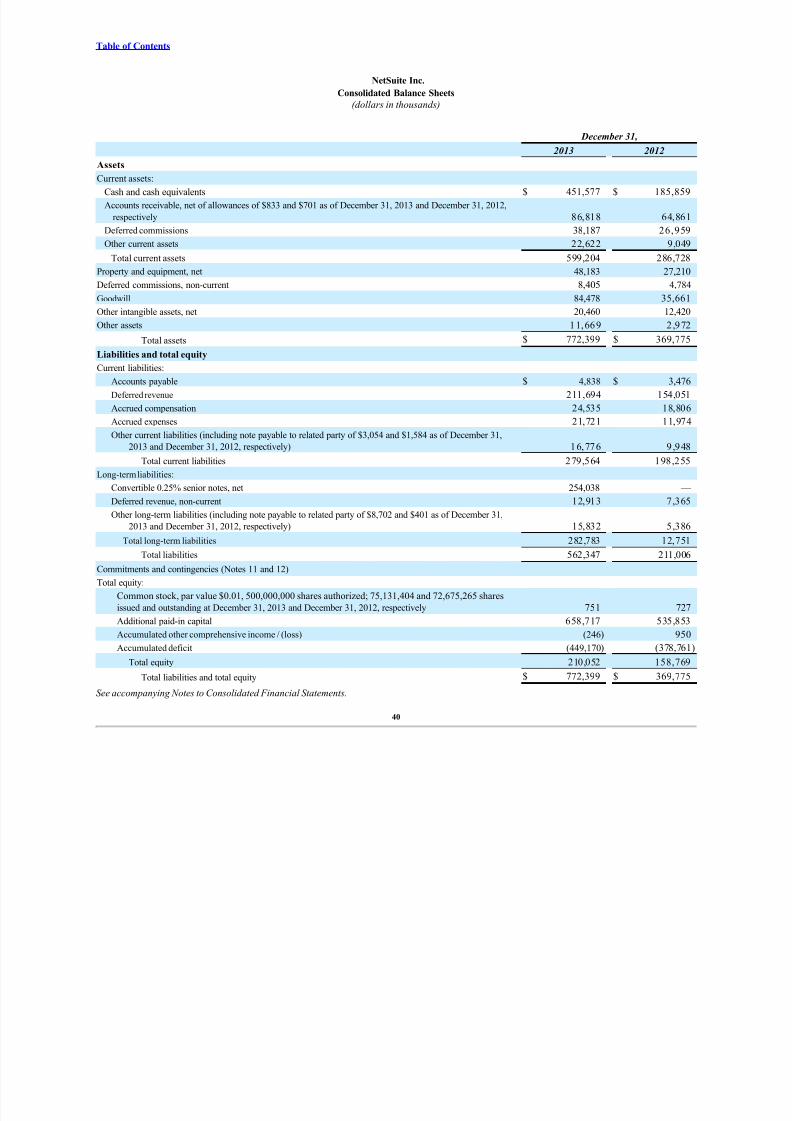
8/10/2019 Net Suite AR
http://slidepdf.com/reader/full/net-suite-ar 43/87
Table of Contents
NetSuite Inc.
Consolidated Balance Sheets
(dollars in thousands)
December 31,
2013 2012
Assets Current assets:
Cash and cash equivalents $ 451,577 $ 185,859
Accounts receivable, net of allowances of $833 and $701 as of December 31, 2013 and December 31, 2012,
respectively 86,818 64,861
Deferred commissions 38,187 26,959
Other current assets 22,622 9,049
Total current assets 599,204 286,728
Property and equipment, net 48,183 27,210
Deferred commissions, non-current 8,405 4,784
Goodwill 84,478 35,661
Other intangible assets, net 20,460 12,420
Other assets 11,669 2 ,972
Total assets $ 772,399 $ 369,775Liabilities and total equity
Current liabilities:
Accounts payable $ 4,838 $ 3,476
Deferred revenue 211,694 154,051
Accrued compensation 24,535 18,806
Accrued expenses 21,721 11,974
Other current liabilities (including note payable to related party of $3,054 and $1,584 as of December 31,
2013 and December 31, 2012, respectively) 16,776 9 ,948
Total current liabilities 279,564 198,255
Long-term liabilities:
Convertible 0.25% senior notes, net 254,038 —
Deferred revenue, non-current 12,913 7,365
Other long-term liabilities (including note payable to related party of $8,702 and $401 as of December 31,
2013 and December 31, 2012, respectively) 15,832 5,386
Total long-term liabilities 282,783 12,751
Total liabilities 562,347 211,006
Commitments and contingencies (Notes 11 and 12)
Total equity:
Common stock, par value $0.01, 500,000,000 shares authorized; 75,131,404 and 72,675,265 shares
issued and outstanding at December 31, 2013 and December 31, 2012, respectively 751 727
Additional paid-in capital 658,717 535,853
Accumulated other comprehensive income / (loss) (246) 950
Accumulated deficit (449,170) (378,761)
Total equity 210,052 158,769
Total liabilities and total equity $ 772,399 $ 369,775See accompanying Notes to Consolidated Financial Statements.
40
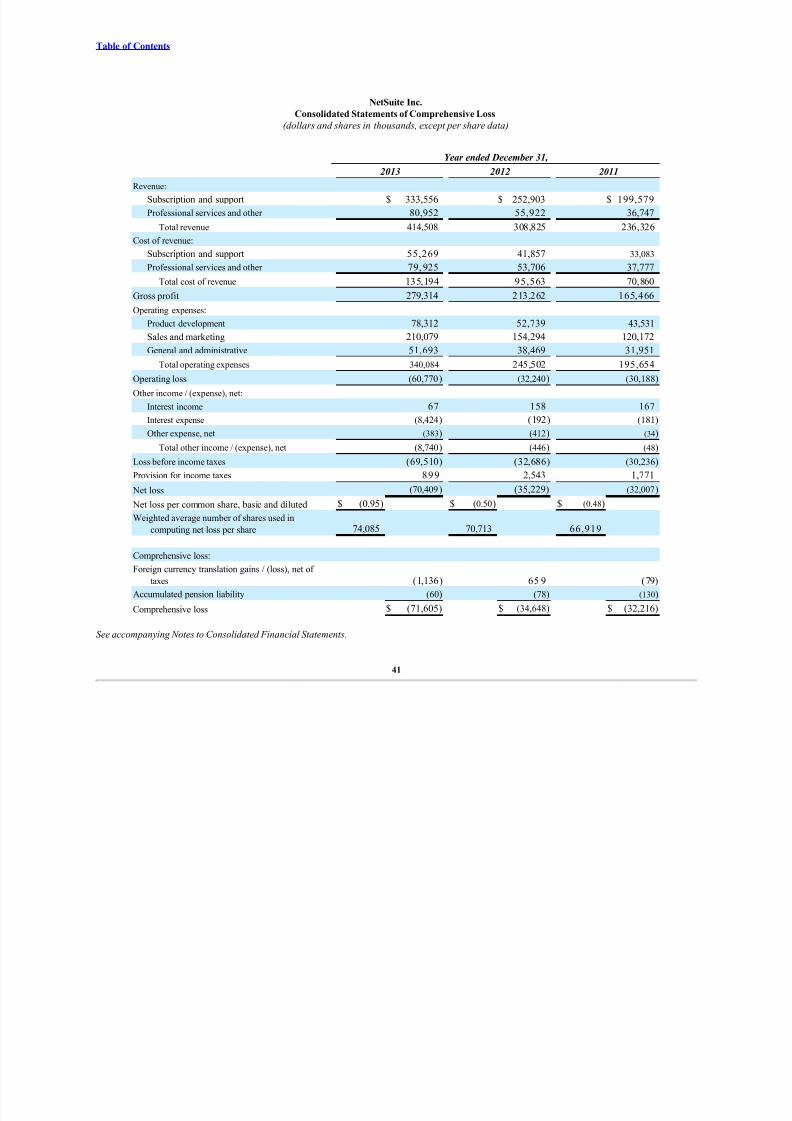
8/10/2019 Net Suite AR
http://slidepdf.com/reader/full/net-suite-ar 44/87
Table of Contents
NetSuite Inc.
Consolidated Statements of Comprehensive Loss
(dollars and shares in thousands, except per share data)
Year ended December 31,
2013 2012 2011
Revenue:
Subscription and support $ 333,556 $ 252,903 $ 199,579
Professional services and other 80,952 55,922 36,747
Total revenue 414,508 308,825 236,326
Cost of revenue:
Subscription and support 55,269 41,857 33,083
Professional services and other 79, 925 53,706 37,777
Total cost of revenue 135,194 95,563 70,860
Gross profit 279,314 213,262 165,466
Operating expenses:
Product development 78,312 52,739 43,531
Sales and marketing 210,079 154,294 120,172General and administrative 51,693 38,469 31,951
Total operating expenses 340,084 245,502 195,654
Operating loss (60,770) (32,240) (30,188)
Other income / (expense), net:
Interest income 67 158 167
Interest expense (8,424) (192) (181)
Other expense, net (383) (412) (34)
Total other income / (expense), net (8,740) (446) (48)
Loss before income taxes (69,510) (32,686) (30,236)
Provision for income taxes 899 2,543 1,771
Net loss (70,409) (35,229) (32,007)
Net loss per common share, basic and diluted $ (0.95) $ (0.50) $ (0.48)
Weighted average number of shares used in
computing net loss per share 74,085 70,713 66,919
Comprehensive loss:
Foreign currency translation gains / (loss), net of
taxes (1,136) 65 9 (79)
Accumulated pension liability (60) (78) (130)
Comprehensive loss $ (71,605) $ (34,648) $ (32,216)
See accompanying Notes to Consolidated Financial Statements.
41

8/10/2019 Net Suite AR
http://slidepdf.com/reader/full/net-suite-ar 45/87
Table of Contents
NetSuite Inc.
Consolidated Statements of Total Equity
(dollars in thousands)
Common Stock Additional
paid- in
Accumulated
other
comprehen-
sive Accumulated Total
Shares Amount capital income / (loss) deficit equity
BALANCES, January 1, 2011 64,887,677 $ 649 $ 416,582 $ 578 $ (311,525) $ 106,284
Exercise of stock options for cash 2,052,798 21 13,728 13,749 Repurchase and vesting of restricted
stock awards and units 1,806,719 18 (307) (289) Income tax expense - foreign stock-based
compensation 319 319
Capitalized stock-based compensation 448 448
Stock-based compensation 38,315 38,315
Shares issued to acquire SPC 38,102 — 1,400 1,400
Accumulated pension liability (130) (130)
Foreign currency translation adjustment (79) (79)
Net loss (32,007) (32,007)
BALANCES, December 31, 2011 68,785,296 68 8 470,485 369 (343,532) 128,010
Exercise of stock options for cash 2,028.576 20 15,915 15,935 Repurchase and vesting of restricted
stock awards and units 1,861,393 19 (276) (257) Excess tax benefit on stock-based
compensation 297 297
Capitalized stock-based compensation 990 990
Stock-based compensation 48,442 48,442
Comprehensive loss:
Accumulated pension liability (78) (78)
Foreign currency translation adjustment 659 659
Net loss (35,229) (35,229)
BALANCES, December 31, 2012 72,675,265 727 535,853 950 (378,761) 158,769
Exercise of stock options for cash 1,102.032 11 16,940 16,951 Repurchase and vesting of restricted
stock awards and units 1,702,944 17 (179) (162) Excess tax benefit on stock-based
compensation 410 410
Capitalized stock-based compensation 1,099 1,099
Stock-based compensation 73,660 73,660
Convertible 0.25% senior notes issuance 60,931 60,931
Comprehensive loss:
Repurchase and retirement of common
stock (348,837) (4) (29,997) (30,001)
Accumulated pension liability (60) (60)
Foreign currency translation adjustment (1,136) (1,136)
Net loss (70,409) $ (70,409)
BALANCES, December 31, 2013 75,131,404 $ 751 $ 658,717 $ (246) $ (449,170) $ 210,052 See accompanying Notes to Consolidated Financial Statements.
42
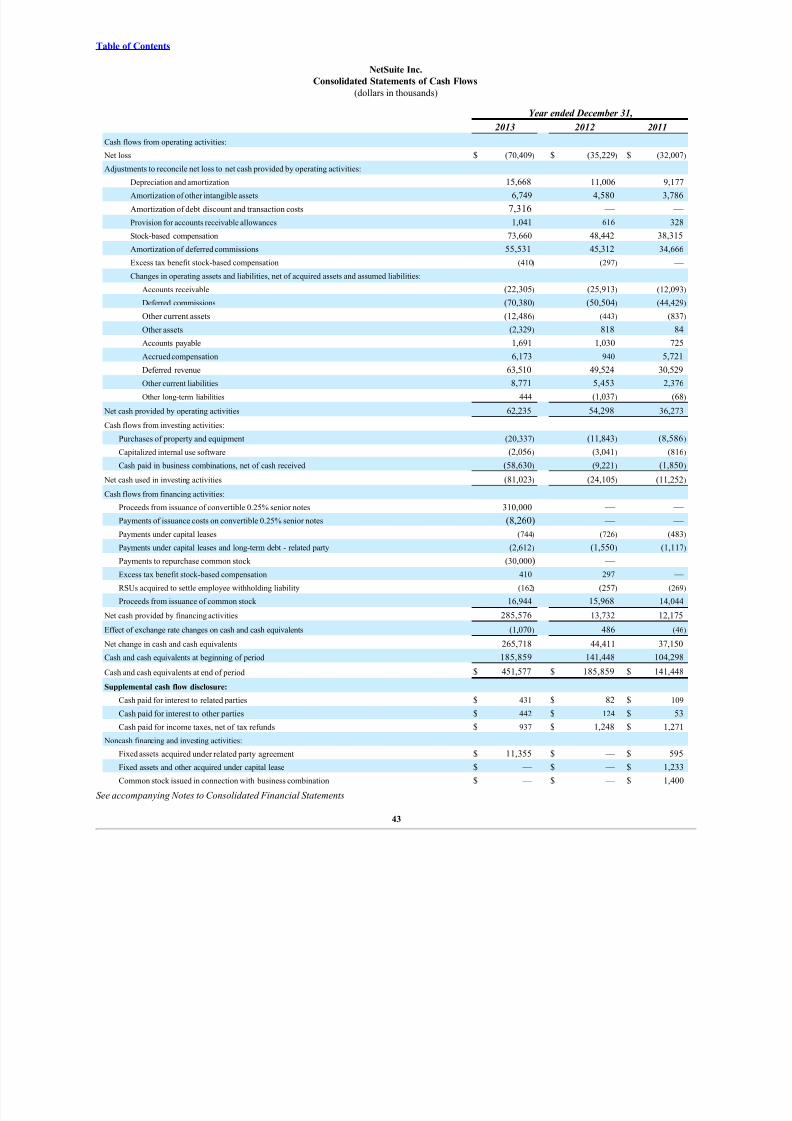
8/10/2019 Net Suite AR
http://slidepdf.com/reader/full/net-suite-ar 46/87
Table of Contents
NetSuite Inc.
Consolidated Statements of Cash Flows
(dollars in thousands)
Year ended December 31,
2013 2012 2011
Cash flows from operating activities:
Net loss $ (70,409) $ (35,229) $ (32,007)
Adjustments to reconcile net loss to net cash provided by operating activities: Depreciation and amortization 15,668 11,006 9,177
Amortization of other intangible assets 6,749 4,580 3,786
Amortization of debt discount and transaction costs 7,316 — —
Provision for accounts receivable allowances 1,041 616 328
Stock-based compensation 73,660 48,442 38,315
Amortization of deferred commissions 55,531 45,312 34,666
Excess tax benefit stock-based compensation (410) (297) —
Changes in operating assets and liabilities, net of acquired assets and assumed liabilities:
Accounts receivable (22,305) (25,913) (12,093)
Deferred commissions (70,380) (50,504) (44,429)
Other current assets (12,486) (443) (837)
Other assets (2,329) 818 84
Accounts payable 1,691 1,030 725
Accrued compensation 6,173 940 5,721
Deferred revenue 63,510 49,524 30,529
Other current liabilities 8,771 5,453 2,376
Other long-term liabilities 444 (1,037) (68)
Net cash provided by operating activities 62,235 54,298 36,273
Cash flows from investing activities:
Purchases of property and equipment (20,337) (11,843) (8,586)
Capitalized internal use software (2,056) (3,041) (816)
Cash paid in business combinations, net of cash received (58,630) (9,221) (1,850)
Net cash used in investing activities (81,023) (24,105) (11,252)
Cash flows from financing activities:
Proceeds from issuance of convertible 0.25% senior notes 310,000 — — Payments of issuance costs on convertible 0.25% senior notes (8,260) — —
Payments under capital leases (744) (726) (483)
Payments under capital leases and long-term debt - related party (2,612) (1,550) (1,117)
Payments to repurchase common stock (30,000) —
Excess tax benefit stock-based compensation 410 297 —
RSUs acquired to settle employee withholding liability (162) (257) (269)
Proceeds from issuance of common stock 16,944 15,968 14,044
Net cash provided by financing activities 285,576 13,732 12,175
Effect of exchange rate changes on cash and cash equivalents (1,070) 486 (46)
Net change in cash and cash equivalents 265,718 44,411 37,150
Cash and cash equivalents at beginning of period 185,859 141,448 104,298
Cash and cash equivalents at end of period $ 451,577 $ 185,859 $ 141,448
Supplemental cash flow disclosure:
Cash paid for interest to related parties $ 431 $ 82 $ 109
Cash paid for interest to other parties $ 442 $ 124 $ 53
Cash paid for income taxes, net of tax refunds $ 937 $ 1,248 $ 1,271
Noncash financing and investing activities:
Fixed assets acquired under related party agreement $ 11,355 $ — $ 595
Fixed assets and other acquired under capital lease $ — $ — $ 1,233
Common stock issued in connection with business combination $ — $ — $ 1,400
See accompanying Notes to Consolidated Financial Statements
43

8/10/2019 Net Suite AR
http://slidepdf.com/reader/full/net-suite-ar 47/87
Table of Contents
NetSuite Inc.
Notes to Consolidated Financial Statements
Note 1. Organization
NetSuite Inc. (the “Company”) provides cloud-based financials/Enterprise Resource Planning (“ERP”) and omnichannel commerce software suites.In addition, the Company offers a broad suite of applications, including financial management, Customer Relationship Management (“CRM”), Ecommerceand retail management, Professional Services Automation (“PSA”), Human Capital Management ("HCM") and that enable companies to manage most of their core business operations in its single integrated suite. The Company’s "real-time dashboard" technology provides an easy-to-use view into up-to-date, role-
specific business information. The Company also offers customer support and professional services related to implementing and supporting its suite of applications. The Company delivers its suite over the Internet as a subscription service using the software-as-a-service ("SaaS") model. The Company’sheadquarters are located in San Mateo, California. The Company conducts its business worldwide, with international locations in Canada, Europe, Asia,Australia and Uruguay.
Note 2. Significant Accounting Policies
Basis of Presentation and Principles of Consolidation
The consolidated financial statements include the accounts of the Company and its wholly-owned subsidiaries. Intercompany balances andtransactions have been eliminated.
ecent Accounting Standards
In February 2013, the Financial Accounting Standards Board ("FASB") issued Accounting Standards Update, Reporting of Amounts ReclassifiedOut of Accumulated Other Comprehensive Income, on disclosures about reclassifications out of accumulated other comprehensive income. Entities are nowrequired to disclose:
• For items reclassified out of accumulated other comprehensive income (AOCI) and into net income in their entirety, the effect of the reclassification on
each affected net income line item; and
• For AOCI reclassification items that are not reclassified in their entirety into net income, a cross reference to other required U.S. GAAP disclosures.
This information may be provided either in the notes or parenthetically on the face of the statement that reports net income as long as all theinformation is disclosed in a single location. However, an entity is prohibited from providing this information parenthetically on the face of the statement thatreports net income if it has items that are not reclassified in their entirety into net income. The Company adopted the revised standard in 2013 and the adoptiondid not have an impact on its consolidated results of operations for disclosure.
Use of Estimates
The preparation of financial statements in conformity with GAAP requires management to make certain estimates and assumptions. These estimatesand assumptions affect the reported amounts of assets and liabilities and disclosure of contingent assets and liabilities at the date of the financial statements,as well as reported amounts of revenue and expenses during the reporting period. Actual results could differ from those estimates.
Segments
The Company's chief operating decision maker is its Chief Executive Officer ("CEO"), who reviews financial information presented on aconsolidated basis, accompanied by information about revenue by geographic region. Accordingly, the Company has determined that it has a single reportablesegment, specifically, the provision of cloud-based business management application suites.
evenue Recognition
The Company generates revenue from two sources: (1) subscription and support; and (2) professional services and other. Subscription and supportrevenue includes subscription fees from customers accessing its cloud-based application suite and support fees from customers purchasing support.Arrangements with customers do not provide the customer with the right to take possession of the software supporting the cloud-based application service atany time. For the most part, professional services and other revenue include fees from consultation services to support the business process mapping,configuration, data migration, integration and training. Amounts that have been invoiced are recorded in accounts receivable and in deferred revenue or revenue, depending on whether the revenue recognition criteria have been met.
For the most part, subscription and support agreements are entered into for 12 to 36 months. In aggregate, more than 90% of the professional servicescomponent of the arrangements with customers is performed within 300 days of entering into a contract with the customer.
44
8/10/2019 Net Suite AR
http://slidepdf.com/reader/full/net-suite-ar 48/87
NetSuite Inc.
Notes to Consolidated Financial Statements
The subscription agreements provide service level commitments of 99.5% uptime per period, excluding scheduled maintenance. The failure to meet thislevel of service availability may require the Company to credit qualifying customers up to the value of an entire month of their subscription and support fees.In light of the Company’s historical experience with meeting its service level commitments, the Company does not currently have any liabilities on its balancesheet for these commitments.
The Company commences revenue recognition when all of the following conditions are met:
• There is persuasive evidence of an arrangement;
• The service is being provided to the customer;
• The collection of the fees is reasonably assured; and
• The amount of fees to be paid by the customer is fixed or determinable.
In most instances, revenue from new customer acquisition is generated under sales agreements with multiple elements, comprised of subscription andsupport fees from customers accessing its cloud-based application suite and professional services associated with consultation services. The Companyevaluates each element in a multiple-element arrangement to determine whether it represents a separate unit of accounting. An element constitutes a separate unitof accounting when the delivered item has standalone value and delivery of the undelivered element is probable and within the Company’s control.Subscription and support have standalone value because they are routinely sold separately by the Company. For the most part, professional services havestandalone value because the Company has sold professional services separately and there are several third party vendors that routinely provide similar
professional services to its customers on a standalone basis.
The Company allocates revenue to each element in an arrangement based on a selling price hierarchy. The selling price for a deliverable is based on itsvendor-specific objective evidence (“VSOE”), if available, third-party evidence (“TPE”), if VSOE is not available, or estimated selling price (“ESP”), if neither VSOE nor TPE is available. As the Company has been unable to establish VSOE or TPE for the elements of its arrangements, the Companyestablishes the ESP for each element primarily by considering the weighted average of actual sales prices of professional services sold on a standalone basisand subscription and support including various add-on modules when sold together without professional services, and other factors such as gross marginobjectives, pricing practices and growth strategy. The consideration allocated to subscription and support is recognized as revenue over the contract periodcommencing when the subscription service is made available to the customer. The consideration allocated to professional services is recognized as revenueusing the proportional performance method.
The total arrangement fee for a multiple element arrangement is allocated based on the relative ESP of each element. However, since the professionalservices are generally completed prior to completion of delivery of subscription and support services, the revenue recognized for professional services in agiven reporting period does not include fees subject to delivery of subscription and support services. This results in the recognition of revenue for professionalservices that is generally no greater than the contractual fees for those professional services.
For single element sales agreements, subscription and support revenue is recognized ratably over the contract term beginning on the provisioning date of the contract. The Company recognizes professional services revenue using the proportional performance method for single element arrangements.
Sales and other taxes collected from customers to be remitted to government authorities are excluded from revenues.
Deferred Revenue
Deferred revenue consists of billings or payments received in advance of revenue recognition and is recognized as the revenue recognition criteria aremet. The Company generally invoices its customers annually or in monthly or quarterly installments. Accordingly, the deferred revenue balance does notrepresent the total contract value of annual or multi-year, non-cancelable subscription agreements. Deferred revenue that will be recognized during thesucceeding 12 month period is recorded as current deferred revenue, and the remaining portion is recorded as non-current deferred revenue.
Cost of Revenue
Cost of revenue primarily consists of costs related to hosting the Company's cloud-based application suite, providing customer support, datacommunications expenses, salaries and benefits of operations and support personnel, software license fees, costs associated with website developmentactivities, allocated overhead, amortization expense associated with capitalized internal use software and acquired developed technology assets and propertyand equipment depreciation. Costs related to professional services are expensed as incurred.
Deferred Commissions
The Company capitalizes commission costs that are incremental and directly related to the acquisition of customer contracts. Commission costs areaccrued and capitalized upon execution of the sales contract by the customer. Payments to partners and sales personnel are made shortly after the receipt of therelated customer payment. Deferred commissions are
45
8/10/2019 Net Suite AR
http://slidepdf.com/reader/full/net-suite-ar 49/87
NetSuite Inc.
Notes to Consolidated Financial Statements
amortized over the term of the related non-cancelable customer contract and are recoverable through the related future revenue streams. The Companycapitalized commission costs of $70.4 million, $50.5 million and $44.4 million during the years ended December 31, 2013, 2012 and 2011, respectively.Commission amortization expense was $55.5 million, $45.3 million and $34.7 million during the years ended December 31, 2013, 2012 and 2011,respectively.
Internal Use Software and Website Development Costs
The Company capitalizes certain development costs incurred in connection with its internal use software and website. These capitalized costs are primarily related to the integrated business management application suite that is hosted by the Company and accessed by its customers on a subscription basis. Costs incurred in the preliminary stages of development are expensed as incurred. Once an application has reached the development stage, internal andexternal costs, if direct and incremental, are capitalized until the software is substantially complete and ready for its intended use. Capitalization ceases uponcompletion of all substantial testing. The Company also capitalizes costs related to specific upgrades and enhancements when it is probable the expenditureswill result in additional functionality. Capitalized costs are recorded as part of property and equipment. Maintenance and training costs are expensed asincurred. Internal use software is amortized on a straight line basis over its estimated useful life, generally three years. Management evaluates the useful lives ofthese assets on an annual basis and tests for impairment whenever events or changes in circumstances occur that could impact the recoverability of theseassets. There were no impairments to internal use software during the years ended December 31, 2013, 2012 and 2011. The Company capitalized $3.2million, $4.1 million and $1.3 million in internal use software during the years ended December 31, 2013, 2012 and 2011, respectively. Included in the 2013,2012 and 2011 capitalized development costs are $1.1 million, $990,000 and $448,000, respectively, in stock-based compensation costs. Amortizationexpense totaled $1.6 million, $629,000 and $302,000 during the years ended December 31, 2013, 2012 and 2011, respectively. The net book value of capitalized internal use software at December 31, 2013 and 2012 was $6.5 million and $5.0 million, respectively. In December 2012, the Company purchased $1.5 million in developed technology which was capitalized as internal use software. A total of $1.3 million was paid to the two former owners onthe purchase date and the remaining $225,000 is to be paid within 15 months after the purchase date. The $1.5 million total purchase price is included in the$4.1 million in development costs capitalized in 2012. During 2013, the Company integrated this developed technology into its data center productionenvironment.
Income Taxes
The Company accounts for income taxes under the asset and liability approach. Deferred income taxes reflect the impact of temporary differences between assets and liabilities recognized for financial reporting purposes and amounts recognized for income tax reporting purposes, net operating losscarryforwards and other tax credits measured by applying currently enacted tax laws. Valuation allowances are provided when necessary to reduce deferred taxassets to an amount that is more likely than not to be realized.
Compliance with income tax regulations requires the Company to make decisions relating to the transfer pricing of revenue and expenses betweeneach of its legal entities that are located in several countries. The Company's determinations include many decisions based on management's knowledge of theunderlying assets of the business, the legal ownership of these assets, and the ultimate transactions conducted with customers and other third parties. Thecalculation of the Company's tax liabilities involves dealing with uncertainties in the application of complex tax regulations in multiple tax jurisdictions. TheCompany may be periodically reviewed by domestic and foreign tax authorities regarding the amount of taxes due. These reviews may include questionsregarding the timing and amount of deductions and the allocation of income among various tax jurisdictions. In evaluating the exposure associated with variousfiling positions, the Company records estimated reserves when it is more likely than not that an uncertain tax position will not be sustained upon examination
by a taxing authority. Such estimates are subject to change. See Note 15 for information regarding the impact of the Company's accounting for uncertainty inincome taxes.
Cash and Cash EquivalentsThe Company considers all highly liquid investments purchased with a remaining maturity of three months or less to be cash equivalents. Cash
equivalents are comprised of investments in money market mutual funds. Cash and cash equivalents are recorded at cost, which approximates fair value.
Goodwill and Other Intangible Assets
The Company records goodwill when consideration paid in a purchase acquisition exceeds the fair value of the net tangible assets and the identifiedintangible assets acquired. Goodwill is not amortized, but rather is tested for impairment annually or more frequently if facts and circumstances warrant areview. The Company has determined that there is a single reporting unit for the purpose of goodwill impairment tests. For purposes of assessing theimpairment of goodwill, the Company annually estimates the fair value of the reporting unit and compares this amount to the carrying value of the reportingunit. If the Company determines that the carrying value of the reporting unit exceeds its fair value, an impairment charge is recognized in the amount by whichthe carrying amount of the asset exceeds its fair value. During the fourth quarter of fiscal 2013, the Company completed its annual impairment test of goodwill. Based upon that evaluation, the Company determined that its goodwill was not impaired at December 31, 2013.
Other intangible assets, consisting of developed technology, trade name and customer relationships, are stated at cost less accumulated amortization.All other intangible assets have been determined to have definite lives and are amortized on a straight-line basis over their estimated remaining economic lives,
ranging from one to seven years. Amortization expense related to developed technology is included in cost of subscription and support revenue whileamortization expense related to tradenames and customer relationships is included in sales and marketing expense.
46
8/10/2019 Net Suite AR
http://slidepdf.com/reader/full/net-suite-ar 50/87
NetSuite Inc.
Notes to Consolidated Financial Statements
Long-lived Assets
The Company continually monitors events and changes in circumstances that could indicate that carrying amounts of its long-lived assets,including property and equipment and intangible assets may not be recoverable. When such events or changes in circumstances occur, the Company assessesthe recoverability of long-lived assets by determining whether the carrying value of such assets will be recovered through their undiscounted expected futurecash flows. If the future undiscounted cash flows are less than the carrying amount of these assets, the Company recognizes an impairment loss based on theexcess of the carrying amount over the fair value of the assets.
Impairment of Intangible Asset
In 2009, the Company acquired QuickArrow (“QA”) for approximately $19.4 million and assigned $3.3 million to the developed technologyintangible asset. The QA developed technology was being amortized over a four year period to cost of revenue. In the second quarter of 2012, certain QAcustomers transitioned from the QA service offering to a NetSuite service offering or terminated their service completely. As a result, the QA expectedundiscounted cash flows decreased below the carrying value of the QA developed technology assets and the Company recorded a $401,000 impairment charge.$401,000 represented the excess of the carrying amount of the QA developed technology over the fair value of such asset as of June 30, 2012. The QAdeveloped technology fair value at June 30, 2012 was derived from the expected QA future cash flows which were based on revenue generated by customersusing the QA service, a Level 3 unobservable input as described in Note 5. The Company amortized the remaining $481,000 net carrying value of the assetover the second half of 2012.
The Company did not recognize any impairment charges on its long-lived assets during the years ended 2013 and 2011.
Leases
The Company leases worldwide facilities and certain other equipment under non-cancelable lease agreements. The terms of certain lease agreements provide for rental payments on a graduated basis. The Company recognizes rent expense on a straight-line basis over the lease period and accrues for rent
expense incurred but not paid.
Under certain leases, the Company also receives reimbursements for leasehold improvements. These reimbursements are lease incentives which arerecognized as a liability and are amortized on a straight-line basis over the term of the lease as a component of minimum rental expense. The leaseholdimprovements are included in property, plant and equipment and are amortized over the shorter of the estimated useful life of the improvements or the leaseterm.
roperty and Equipment
Property and equipment are stated at cost less accumulated depreciation and amortization. Depreciation is computed on a straight-line basis over theestimated asset lives. The estimated useful lives by asset classification are generally as follows:
Asset classification Estimated useful life in years
Office equipment 3
Furniture and fixtures 5
Computers 3Software, perpetual license 3 to 7
Software, license with stated term Term of the license
Amortization of leasehold improvements is computed on a straight-line basis over the shorter of the lease term or the estimated useful lives of theassets.
Upon retirement or disposition of property and equipment, the cost and related accumulated depreciation are removed from the accounts and anyresulting gain or loss is recognized in other income.
Warranties and Indemnification
The Company's cloud-based application service is typically warranted to perform in a manner consistent with general industry standards that arereasonably applicable and materially in accordance with the Company's on-line help documentation under normal use and circumstances.
The Company includes service level commitments to its customers warranting certain levels of uptime reliability and performance and permittingthose customers to receive credits in the event that the Company fails to meet those levels. To date, the Company has not incurred any material costs as a result
of such commitments and has not accrued any liabilities related to such obligations in the accompanying consolidated financial statements.
The Company has also agreed to indemnify its directors and executive officers for costs associated with any fees, expenses, judgments, fines andsettlement amounts incurred by any of these persons in any action or proceeding to which any of those persons is, or is threatened to be, made a party byreason of the person's service as a director or officer, including any action by the Company, arising out of that person's services as the Company's director or officer or that person's services
47
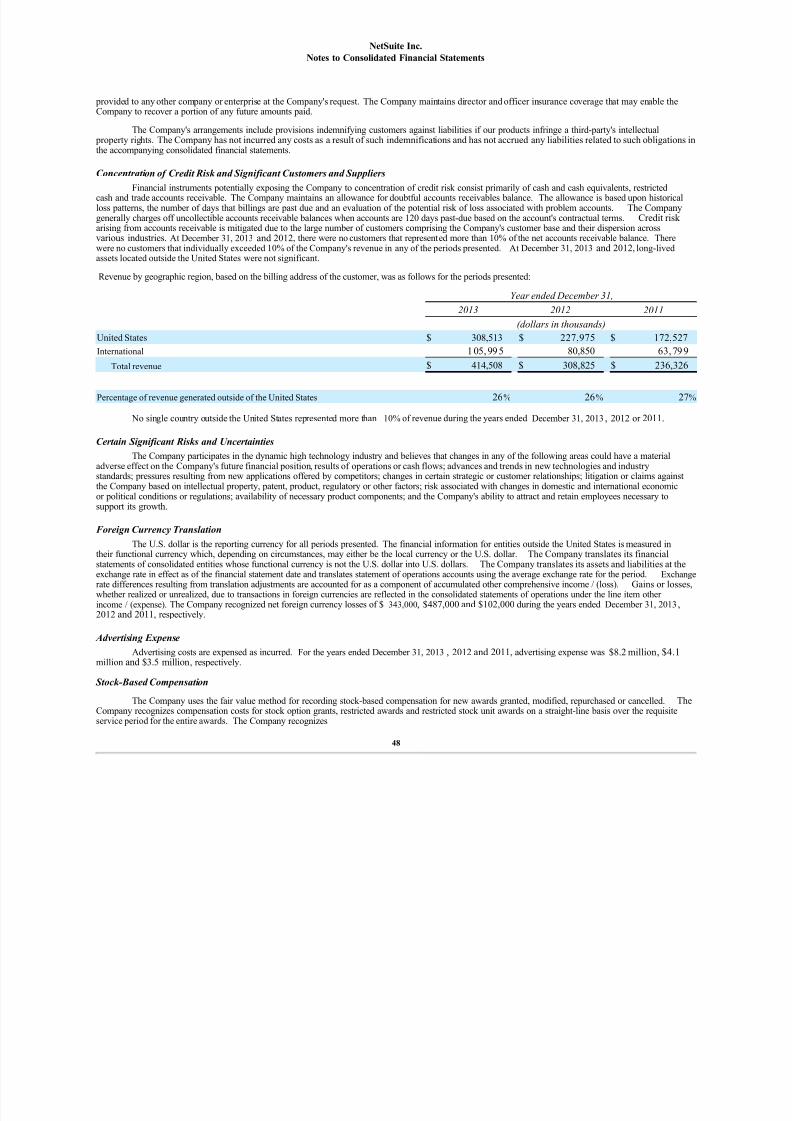
8/10/2019 Net Suite AR
http://slidepdf.com/reader/full/net-suite-ar 51/87
NetSuite Inc.
Notes to Consolidated Financial Statements
provided to any other company or enterprise at the Company's request. The Company maintains director and officer insurance coverage that may enable theCompany to recover a portion of any future amounts paid.
The Company's arrangements include provisions indemnifying customers against liabilities if our products infringe a third-party's intellectual property rights. The Company has not incurred any costs as a result of such indemnifications and has not accrued any liabilities related to such obligations inthe accompanying consolidated financial statements.
Concentration of Credit Risk and Significant Customers and Suppliers
Financial instruments potentially exposing the Company to concentration of credit risk consist primarily of cash and cash equivalents, restrictedcash and trade accounts receivable. The Company maintains an allowance for doubtful accounts receivables balance. The allowance is based upon historicalloss patterns, the number of days that billings are past due and an evaluation of the potential risk of loss associated with problem accounts. The Companygenerally charges off uncollectible accounts receivable balances when accounts are 120 days past-due based on the account's contractual terms. Credit risk arising from accounts receivable is mitigated due to the large number of customers comprising the Company's customer base and their dispersion acrossvarious industries. At December 31, 2013 and 2012, there were no customers that represented more than 10% of the net accounts receivable balance. Therewere no customers that individually exceeded 10% of the Company's revenue in any of the periods presented. At December 31, 2013 and 2012, long-livedassets located outside the United States were not significant.
Revenue by geographic region, based on the billing address of the customer, was as follows for the periods presented:
Year ended December 31,
2013 2012 2011
(dollars in thousands)
United States $ 308,513 $ 227,975 $ 172,527International 105,995 80,850 63,799
Total revenue $ 414,508 $ 308,825 $ 236,326
Percentage of revenue generated outside of the United States 26% 26% 27%
No single country outside the United States represented more than 10% of revenue during the years ended December 31, 2013, 2012 or 2011.
Certain Significant Risks and Uncertainties
The Company participates in the dynamic high technology industry and believes that changes in any of the following areas could have a materialadverse effect on the Company's future financial position, results of operations or cash flows; advances and trends in new technologies and industrystandards; pressures resulting from new applications offered by competitors; changes in certain strategic or customer relationships; litigation or claims againstthe Company based on intellectual property, patent, product, regulatory or other factors; risk associated with changes in domestic and international economicor political conditions or regulations; availability of necessary product components; and the Company's ability to attract and retain employees necessary to
support its growth.
Foreign Currency Translation
The U.S. dollar is the reporting currency for all periods presented. The financial information for entities outside the United States is measured intheir functional currency which, depending on circumstances, may either be the local currency or the U.S. dollar. The Company translates its financialstatements of consolidated entities whose functional currency is not the U.S. dollar into U.S. dollars. The Company translates its assets and liabilities at theexchange rate in effect as of the financial statement date and translates statement of operations accounts using the average exchange rate for the period. Exchangerate differences resulting from translation adjustments are accounted for as a component of accumulated other comprehensive income / (loss). Gains or losses,whether realized or unrealized, due to transactions in foreign currencies are reflected in the consolidated statements of operations under the line item other income / (expense). The Company recognized net foreign currency losses of $ 343,000, $487,000 and $102,000 during the years ended December 31, 2013,2012 and 2011, respectively.
Advertising Expense
Advertising costs are expensed as incurred. For the years ended December 31, 2013 , 2012 and 2011, advertising expense was $8.2 million, $4.1million and $3.5 million, respectively.
Stock-Based Compensation
The Company uses the fair value method for recording stock-based compensation for new awards granted, modified, repurchased or cancelled. TheCompany recognizes compensation costs for stock option grants, restricted awards and restricted stock unit awards on a straight-line basis over the requisiteservice period for the entire awards. The Company recognizes
48
8/10/2019 Net Suite AR
http://slidepdf.com/reader/full/net-suite-ar 52/87
NetSuite Inc.
Notes to Consolidated Financial Statements
compensation expense related to performance share awards based on the accelerated method which recognizes a larger portion of the expense during the beginning of the vesting period than in the end of the vesting period.
Under the 2007 Equity Incentive Plan (the "2007 Plan"), the Company has granted selected executives and other key employees performance shares("PS") and performance share units ("PSUs"), which are restricted stock units (“RSUs”). PS vesting is contingent upon meeting certain company-wide
performance goals while PSUs vesting is contingent upon meeting certain company-wide performance goals and market-based performance goals. UnforfeitedPS and PSUs generally will vest in three equal annual tranches over the service period. However, the 2011 PSU grants vested 1/12 per quarter with the initial
vesting event on February 15, 2012. The PS and PSUs grant date fair value, which is also the total stock-based compensation expense associated with the performance based awards, is determined based on the value of the underlying shares on the grant date and is recognized over the vesting term. On a quarterly basis, management estimates the number of PS and PSUs that will be granted at the end of the performance period. The PS fair value is based on marketvalue of shares on the grant date (the intrinsic value). The fair value of the market-based PSUs on the grant date (measurement date) is calculated using aMonte Carlo simulation model that estimates the distribution of the potential outcomes of the PSU grants based on simulated future stock prices of the peer group. In 2013, performance metrics for certain PS awarded for 2014 had not been set by the Company's Board of Directors. As such, there is no accountingfor these awards until the performances metrics are set.
The Company accounts for compensation expense related to stock options granted to consultants and other non-employees based on the fair valuesestimated using the Black-Scholes model on the date of grant and re-measured at each reporting date over the performance period. The compensation expense isamortized using the straight-line method over the related service term.
The Company issues new shares of its common stock upon the exercise of stock options and the vesting of restricted stock, RSUs, PSs and PSUs.
Qualified Operating Expense Reimbursements
At the Company's product development facility in the Czech Republic, the Company participates in a government subsidy program for employinglocal residents. Under the program, the Czech Republic government will reimburse the Company for certain operating expenses it incurs. While the Company became eligible to participate in this program in 2010, it did not record a subsidy credit in the financial statements until it was assured of collection in 2012.Effective January 2012, when the Company incurs reimbursable operating expenses, it records a reduction in product development expenses and a receivablefrom the Czech government. During the years ended December 31, 2013 and December 31, 2012, the Company's product development operating expenses werereduced by approximately $2.5 million and $2.0 million, respectively, for reimbursements of eligible operating expenses incurred during the year endedDecember 31, 2013 and the period from November 2010 to December 31, 2012, respectively. The Company received approximately $2.0 million and $1.2million in payments from the Czech Republic government during the years ended December 31, 2013 and 2012, respectively. As of December 31, 2013, $1.4million in reimbursements, adjusted for foreign currency valuations, are due the Company and included in other current assets. The government subsidy
program terminates in 2014.
Net Loss Per Common Share
Basic net loss per common share is computed by dividing net loss attributable to NetSuite Inc. common stockholders by the weighted-averagenumber of common shares outstanding during the period. Diluted net loss per common share is computed by giving effect to all potentially dilutive commonshares including options, restricted stock, restricted stock units, performance share units, performance shares and convertible debt shares. Basic and dilutednet loss per common share was the same for all periods presented as the impact of all potentially dilutive securities outstanding was anti-dilutive.
Accumulated Other Comprehensive Income / (Loss)
Accumulated other comprehensive income / (loss) is comprised of foreign currency translation gains and losses, net of tax, and an accumulated pension liability for employees located in the Philippines. The foreign currency translation gains /(losses), net of taxes as of December 31, 2013 and 2012 were$22,000, and $1.2 million, respectively. The unamortized defined benefit pension costs as of December 31, 2013 and 2012 was $(268,000) and $(200,000) ,respectively.
Note 3. Business Combinations
During 2013, the Company acquired TribeHR, an on-line human capital management software provider and, OrderMotion, an online Ecommercecompany and a website hosting provider company. In connections with these acquisitions, the Company incurred transaction costs totaling $3.0 million.
49
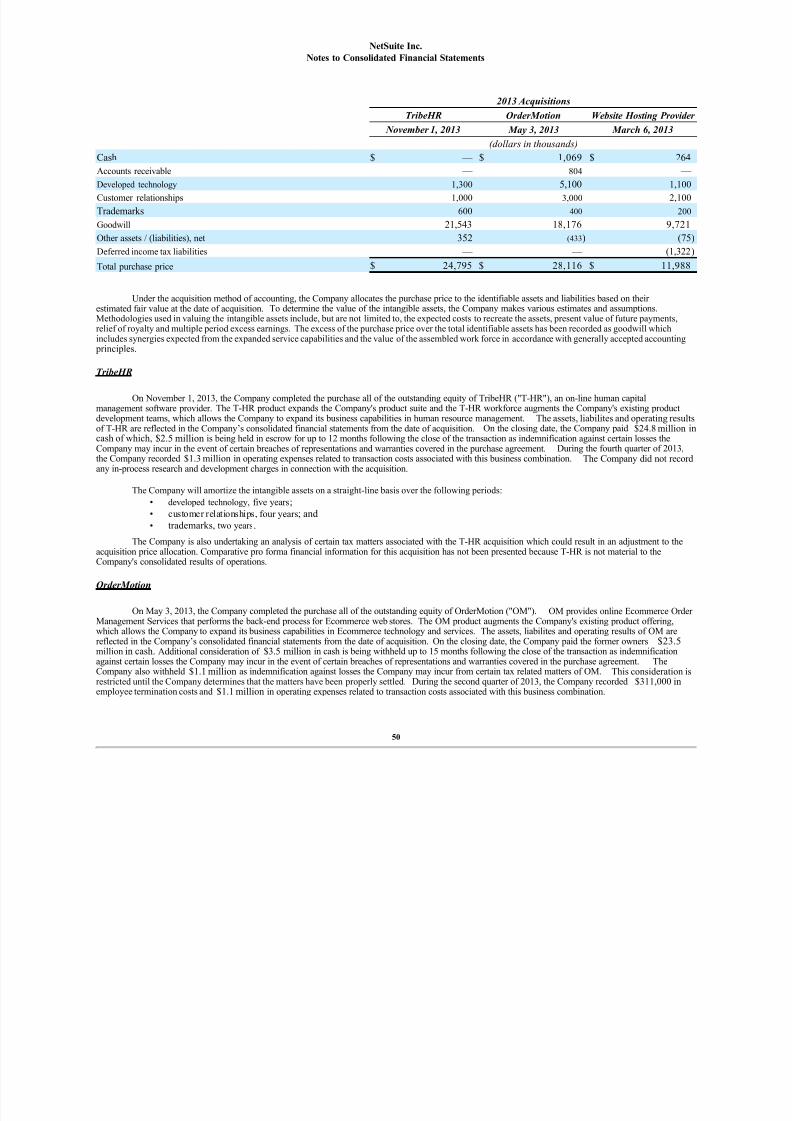
8/10/2019 Net Suite AR
http://slidepdf.com/reader/full/net-suite-ar 53/87
NetSuite Inc.
Notes to Consolidated Financial Statements
2013 Acquisitions
TribeHR OrderMotion Website Hosting Provider
November 1, 2013 May 3, 2013 March 6, 2013
(dollars in thousands)
Cash $ — $ 1,069 $ 264
Accounts receivable — 804 — Developed technology 1,300 5,100 1,100
Customer relationships 1,000 3,000 2,100
Trademarks 600 400 200
Goodwill 21,543 18,176 9,721
Other assets / (liabilities), net 352 (433) (75)
Deferred income tax liabilities — — (1,322)
Total purchase price $ 24,795 $ 28,116 $ 11,988
Under the acquisition method of accounting, the Company allocates the purchase price to the identifiable assets and liabilities based on their estimated fair value at the date of acquisition. To determine the value of the intangible assets, the Company makes various estimates and assumptions.Methodologies used in valuing the intangible assets include, but are not limited to, the expected costs to recreate the assets, present value of future payments,relief of royalty and multiple period excess earnings. The excess of the purchase price over the total identifiable assets has been recorded as goodwill which
includes synergies expected from the expanded service capabilities and the value of the assembled work force in accordance with generally accepted accounting principles.
TribeHR
On November 1, 2013, the Company completed the purchase all of the outstanding equity of TribeHR ("T-HR"), an on-line human capitalmanagement software provider. The T-HR product expands the Company's product suite and the T-HR workforce augments the Company's existing productdevelopment teams, which allows the Company to expand its business capabilities in human resource management. The assets, liabilites and operating resultsof T-HR are reflected in the Company’s consolidated financial statements from the date of acquisition. On the closing date, the Company paid $24.8 million incash of which, $2.5 million is being held in escrow for up to 12 months following the close of the transaction as indemnification against certain losses theCompany may incur in the event of certain breaches of representations and warranties covered in the purchase agreement. During the fourth quarter of 2013,the Company recorded $1.3 million in operating expenses related to transaction costs associated with this business combination. The Company did not recordany in-process research and development charges in connection with the acquisition.
The Company will amortize the intangible assets on a straight-line basis over the following periods:
• developed technology, five years;
• customer relationships, four years; and• trademarks, two years.
The Company is also undertaking an analysis of certain tax matters associated with the T-HR acquisition which could result in an adjustment to theacquisition price allocation. Comparative pro forma financial information for this acquisition has not been presented because T-HR is not material to theCompany's consolidated results of operations.
OrderMotion
On May 3, 2013, the Company completed the purchase all of the outstanding equity of OrderMotion ("OM"). OM provides online Ecommerce Order Management Services that performs the back-end process for Ecommerce web stores. The OM product augments the Company's existing product offering,which allows the Company to expand its business capabilities in Ecommerce technology and services. The assets, liabilites and operating results of OM arereflected in the Company’s consolidated financial statements from the date of acquisition. On the closing date, the Company paid the former owners $23.5million in cash. Additional consideration of $3.5 million in cash is being withheld up to 15 months following the close of the transaction as indemnificationagainst certain losses the Company may incur in the event of certain breaches of representations and warranties covered in the purchase agreement. TheCompany also withheld $1.1 million as indemnification against losses the Company may incur from certain tax related matters of OM. This consideration is
restricted until the Company determines that the matters have been properly settled. During the second quarter of 2013, the Company recorded $311,000 inemployee termination costs and $1.1 million in operating expenses related to transaction costs associated with this business combination.
50
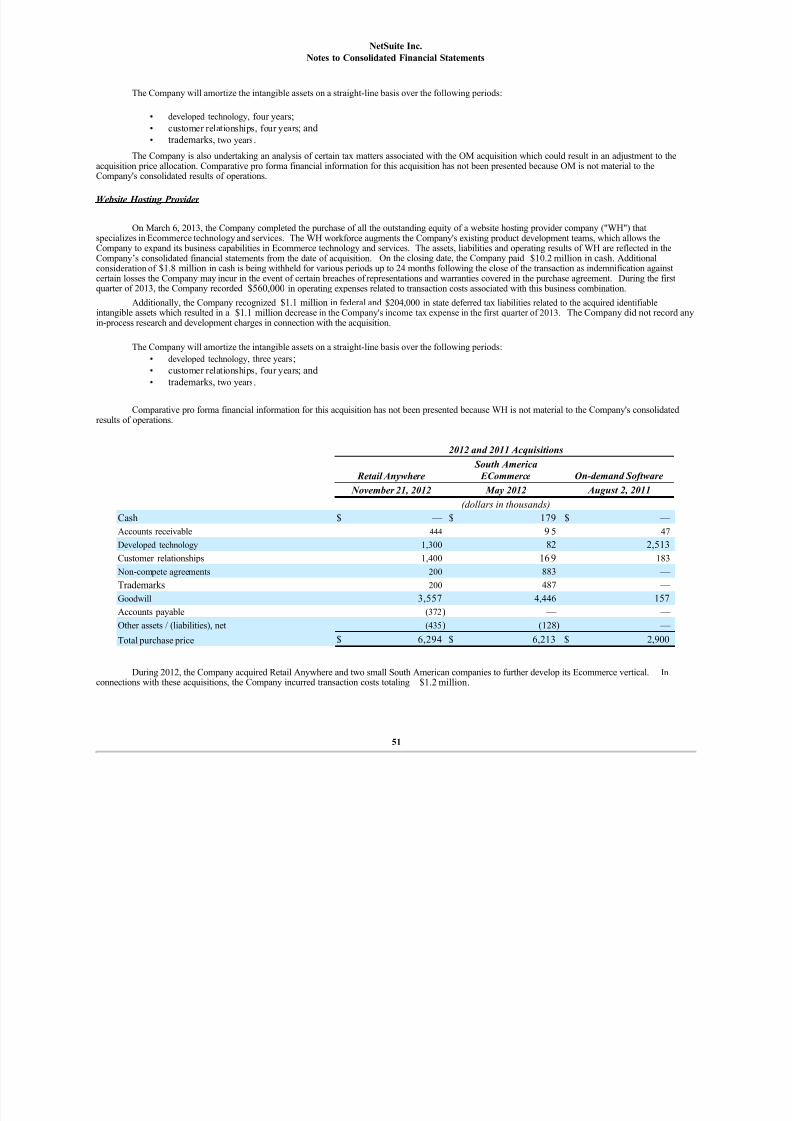
8/10/2019 Net Suite AR
http://slidepdf.com/reader/full/net-suite-ar 54/87
NetSuite Inc.
Notes to Consolidated Financial Statements
The Company will amortize the intangible assets on a straight-line basis over the following periods:
• developed technology, four years;• customer relationships, four years; and• trademarks, two years.
The Company is also undertaking an analysis of certain tax matters associated with the OM acquisition which could result in an adjustment to the
acquisition price allocation. Comparative pro forma financial information for this acquisition has not been presented because OM is not material to theCompany's consolidated results of operations.
Website Hosting Provider
On March 6, 2013, the Company completed the purchase of all the outstanding equity of a website hosting provider company ("WH") thatspecializes in Ecommerce technology and services. The WH workforce augments the Company's existing product development teams, which allows theCompany to expand its business capabilities in Ecommerce technology and services. The assets, liabilities and operating results of WH are reflected in theCompany’s consolidated financial statements from the date of acquisition. On the closing date, the Company paid $10.2 million in cash. Additionalconsideration of $1.8 million in cash is being withheld for various periods up to 24 months following the close of the transaction as indemnification againstcertain losses the Company may incur in the event of certain breaches of representations and warranties covered in the purchase agreement. During the firstquarter of 2013, the Company recorded $560,000 in operating expenses related to transaction costs associated with this business combination.
Additionally, the Company recognized $1.1 million in federal and $204,000 in state deferred tax liabilities related to the acquired identifiableintangible assets which resulted in a $1.1 million decrease in the Company's income tax expense in the first quarter of 2013. The Company did not record anyin-process research and development charges in connection with the acquisition.
The Company will amortize the intangible assets on a straight-line basis over the following periods:
• developed technology, three years;• customer relationships, four years; and• trademarks, two years.
Comparative pro forma financial information for this acquisition has not been presented because WH is not material to the Company's consolidatedresults of operations.
2012 and 2011 Acquisitions
Retail Anywhere
South America
ECommerce On-demand Software
November 21, 2012 May 2012 August 2, 2011
(dollars in thousands)
Cash $ — $ 179 $ —
Accounts receivable 444 9 5 47
Developed technology 1,300 82 2,513
Customer relationships 1,400 16 9 183
Non-compete agreements 200 883 —
Trademarks 200 487 —
Goodwill 3,557 4,446 157
Accounts payable (372) — —
Other assets / (liabilities), net (435) (128) —
Total purchase price $ 6,294 $ 6,213 $ 2,900
During 2012, the Company acquired Retail Anywhere and two small South American companies to further develop its Ecommerce vertical. In
connections with these acquisitions, the Company incurred transaction costs totaling $1.2 million.
51

8/10/2019 Net Suite AR
http://slidepdf.com/reader/full/net-suite-ar 55/87
NetSuite Inc.
Notes to Consolidated Financial Statements
etail Anywhere
In November 2012, the Company purchased certain assets from Retail Anywhere ("RA"), an on-line retail solution service provider. The Company purchased certain RA assets and assumed certain liabilities to expand its retail software solutions in the Ecommerce vertical. RA software allows the Companyto expand its Ecommerce services to brick and mortar store point of sale terminals. The RA assets, liabilities and operating results are reflected in the
Company’s consolidated financial statements from the date of acquisition. On the closing date, the Company paid $5.0 million in cash. Additionalconsideration of $1.3 million in cash was being withheld for up to the 15 months following the close of the transaction as protection against certain losses theCompany may incur in the event of certain breaches of representations and warranties covered in the purchase agreement. As of December 31, 2013, theCompany's remaining obligation was $1.1 million.
The Company will amortize the intangible assets on a straight-line basis over the following periods:
• developed technology, three years;• customer relationships, four years;• non-compete agreements, two years; and• trademarks, one year .
The RA operating results are not material for pro forma disclosure.
South American Ecommerce
In May 2012, the Company completed the purchase of all the outstanding equity of two small South American companies ("SAC") that specialize inEcommerce technology and services. The Company also purchased certain assets from two entities related to the SAC. The SAC workforce augments theCompany's existing professional services and product development teams which allows the Company to expand its business capabilities in Ecommercetechnology and services. The assets and operating results of the SAC are reflected in the Company’s condensed consolidated financial statements from the dateof acquisition. On the closing dates, the Company paid $4.0 million in cash. Additional consideration of $2.2 million in cash is being withheld for various
periods up to the next 10 years following the close of the transaction as protection against certain losses the Company may incur in the event of certain breachesof representations and warranties covered in the purchase agreement. As of December 31, 2013, the Company's remaining obligation was $1.6 million.
During the third quarter of 2012, the Company completed an analysis of the tax attributes of the assets acquired and liabilities assumed and, as aresult, the initial asset allocation prepared in the second quarter remained unchanged.
The Company will amortize the intangible assets on a straight-line basis over the following periods:• non-compete agreements, three years;• trademarks, five years;• customer relationships, one year to three years;• and developed technology, one year .
The SAC's operating results are not material for pro forma disclosure.
On-demand Software
On August 2, 2011, the Company completed the purchase of substantially all of the assets of a small private company ("SPC") that provides on-demand software. Accordingly, the assets and operating results of SPC are reflected in the Company’s condensed consolidated financial statements from thedate of acquisition. As consideration on the closing date, the Company paid $1.1 million in cash and issued 38,102 shares of the Company's common stock valued at $1.4 million on the closing date. Additional consideration of $375,000 in cash was paid in 2012 that was being withheld for a year following theclose of the transaction as protection against certain losses the Company may have incurred in the event of certain breaches of representations and warrantiescovered in the purchase agreement. Third-party costs associated with this transaction were negligible. The Company is integrating SPC's technology into its
product suite to enhance the functionality of its suite.
The Company will amortize the developed technology and customer relationships intangible assets ratably on a straight-line
basis over a four years term. The SPC's operating results are not material for pro forma disclosure.
Note 4. Cash and Cash Equivalents
52

8/10/2019 Net Suite AR
http://slidepdf.com/reader/full/net-suite-ar 56/87

8/10/2019 Net Suite AR
http://slidepdf.com/reader/full/net-suite-ar 57/87
Table of Contents
As of December 31, 2013, financial assets stated at fair value on a recurring basis were comprised of money market funds included within cash andequivalents and foreign exchange forward contracts included within other current assets and liabilities. The fair value of these financial assets was determinedusing the following inputs as of December 31, 2013 and 2012:
December 31, 2013 December 31, 2012
Fair value measurements at reporting
date using Fair value measurements at reporting
date using
Level 1 Level 2 Level 3 Total Level 1 Level 2 Level 3 Total
(dollars in thousands)
Assets:
Money market funds $ 122,527 $ — $ — $ 122,527 $ 72,467 $ — $ — $ 72,467
Foreign exchange contracts — 375 — 375 — 97 — 97
Total $ 122,527 $ 375 $ — $ 122,902 $ 72,467 $ 97 $ — $ 72,564
Liabilities:
Foreign exchange contracts $ — $ — $ — $ — $ — $ 231 $ — $ 231
Total $ — $ — $ — $ — $ — $ 231 $ — $ 231
Note 6. Hedging Activity
Balance Sheet Hedging - Hedging of Foreign Currency Assets and LiabilitiesDuring the year ended December 31, 2013, the Company hedged certain of its nonfunctional currency denominated assets and liabilities to reduce the
risk that earnings would be adversely affected by changes in exchange rates. The notional amount of derivative instruments acquired during the period was$198.2 million. The Company accounts for derivative instruments as other current assets and liabilities on the balance sheet and measures them at fair valuewith changes in the fair value recorded as other income / (expense). These derivative instruments do not subject the Company to material balance sheet risk dueto exchange rate movements because gains and losses on these derivatives are intended to offset gains and losses on the assets and liabilities being economicallyhedged.
As of December 31, 2013 and 2012, the Company had the following outstanding foreign exchange forward contracts:
December 31, 2013 December 31, 2012
Notional Value
Sold Notional Value
Purchased Notional Value
Sold Notional Value
Purchased
(US dollars in thousands)
British pound $ 7,537 $ 4,799 $ 7,188 $ 3,435
Australian dollar 11,416 4,979 9,360 4,793
Japanese yen 2,285 — 1,260 —
Canadian dollar 2,445 1,817 531 515
Euro 1,356 — 883 25 6
Czech crown 5,240 3,490 3,440 1,895
Mexican peso 158 116 161 —
Philippine peso 5,940 3,940 4,085 4,085
New Zealand dollar 287 — 73 —
Total $ 36,664 $ 19,141 $ 26,981 $ 14,979
54
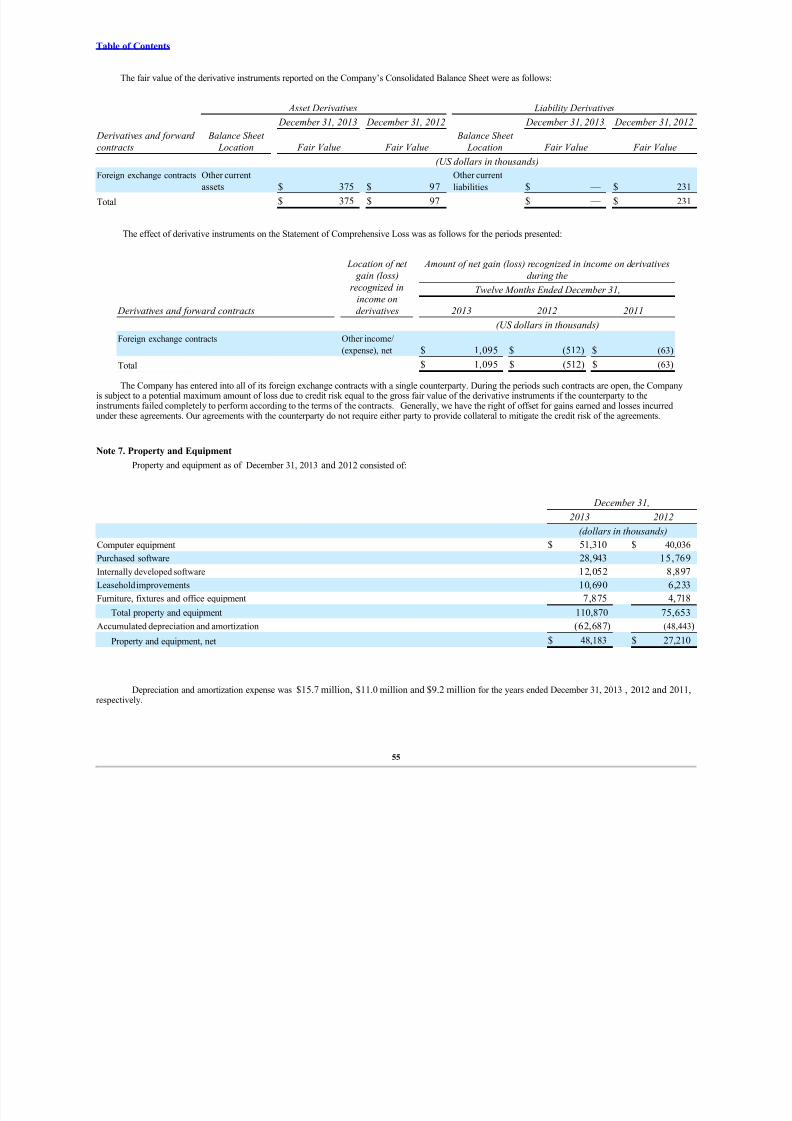
8/10/2019 Net Suite AR
http://slidepdf.com/reader/full/net-suite-ar 58/87
Table of Contents
The fair value of the derivative instruments reported on the Company’s Consolidated Balance Sheet were as follows:
Asset Derivatives Liability Derivatives
Balance Sheet
Location
December 31, 2013 December 31, 2012
Balance Sheet
Location
December 31, 2013 December 31, 2012
Derivatives and forward
contracts Fair Value Fair Value Fair Value Fair Value
(US dollars in thousands)
Foreign exchange contracts Other current
assets $ 375 $ 97Other current
liabilities $ — $ 231
Total $ 375 $ 97 $ — $ 231
The effect of derivative instruments on the Statement of Comprehensive Loss was as follows for the periods presented:
Location of net
gain (loss)
recognized in
income on
derivatives
Amount of net gain (loss) recognized in income on derivatives
during the
Twelve Months Ended December 31,
Derivatives and forward contracts 2013 2012 2011
(US dollars in thousands)
Foreign exchange contracts
Other income/(expense), net $ 1,095 $ (512) $ (63)
Total $ 1,095 $ (512) $ (63)
The Company has entered into all of its foreign exchange contracts with a single counterparty. During the periods such contracts are open, the Companyis subject to a potential maximum amount of loss due to credit risk equal to the gross fair value of the derivative instruments if the counterparty to theinstruments failed completely to perform according to the terms of the contracts. Generally, we have the right of offset for gains earned and losses incurredunder these agreements. Our agreements with the counterparty do not require either party to provide collateral to mitigate the credit risk of the agreements.
Note 7. Property and Equipment
Property and equipment as of December 31, 2013 and 2012 consisted of:
December 31,
2013 2012
(dollars in thousands)
Computer equipment $ 51,310 $ 40,036
Purchased software 28,943 15,769
Internally developed software 12,052 8,897
Leasehold improvements 10,690 6,233
Furniture, fixtures and office equipment 7,875 4,718
Total property and equipment 110,870 75,653
Accumulated depreciation and amortization (62,687) (48,443)
Property and equipment, net $ 48,183 $ 27,210
Depreciation and amortization expense was $15.7 million, $11.0 million and $9.2 million for the years ended December 31, 2013 , 2012 and 2011,respectively.
55

8/10/2019 Net Suite AR
http://slidepdf.com/reader/full/net-suite-ar 59/87
Table of Contents
Patent Cross License Agreement
In July 2011, the Company entered into a patent cross licensing agreement ("the Agreement") with a large technology company for $3.0 million which
it had paid as of December 31, 2013. The Agreement provides the Company with the right to use the large technology company's patents over a period that is
slightly in excess of six years and resolves any claims relating to alleged past usage of the large technology company's patents. The Agreement also provides the
large technology company with the right to use the Company's existing and future patents. The Company estimated the total present value of the historical
patent rights to be approximately $679,000 and recorded this amount as general and administrative expense in its consolidated statement of operations for the
second quarter of 2011. During the years ended December 31, 2013, 2012 and the second half of 2011, the Company recorded $246,000, $191,000 and
$79,000, respectively, in amortized patent license expense as cost of revenue. As of December 31, 2013, the Company's financial statements include short-term and long-term unamortized patent license costs of $309,000 and $1.3 million, respectively.
Note 8. Goodwill and Other Intangible Assets
The change in the carrying amount of goodwill for the years ended December 31, 2013 and 2012 was as follows:
(dollars in thousands)
Balance as of January 1, 2012 $ 27,564
Goodwill acquired:
SAC business combination May 2012 4,446
RA business combination Nov 2012 3,557
Foreign exchange adjustment 94
Balance as of December 31, 2012 35,661Goodwill acquired:
WH business combination March 2013 9,721
OM business combination May 2013 18,176
T-HR business combination November 2013 21,543
Foreign exchange adjustment $ (623)
Balance as of December 31, 2013 $ 84,478
The Company does not have a history of goodwill impairments.
56

8/10/2019 Net Suite AR
http://slidepdf.com/reader/full/net-suite-ar 60/87
Table of Contents
The carrying amount of other intangible assets was as follows:
Gross carrying
amount Accumulated
amortization Net carrying
amount
December 31, 2013
(dollars in thousands)
Developed technology $ 19,721 $ (11,324) $ 8,397
Trade name 2,827 (1,621) 1,206
Customer relationships 21,308 (10,946) 10,362
Non-competition agreements 1,076 (581) 495
Total $ 44,932 $ (24,472) $ 20,460
December 31, 2012
(dollars in thousands)
Developed technology $ 12,221 $ (8,954) $ 3,267
Trade name 1,627 (1,064) 563
Customer relationships 15,208 (7,578) 7,630
Non-competition agreements 1,168 (208) 960
Total $ 30,224 $ (17,804) $ 12,420
The total amortization expense for other intangible assets was $6.7 million, $4.6 million and $3.8 million for the years ended December 31, 2013 ,2012 and 2011, respectively.
57
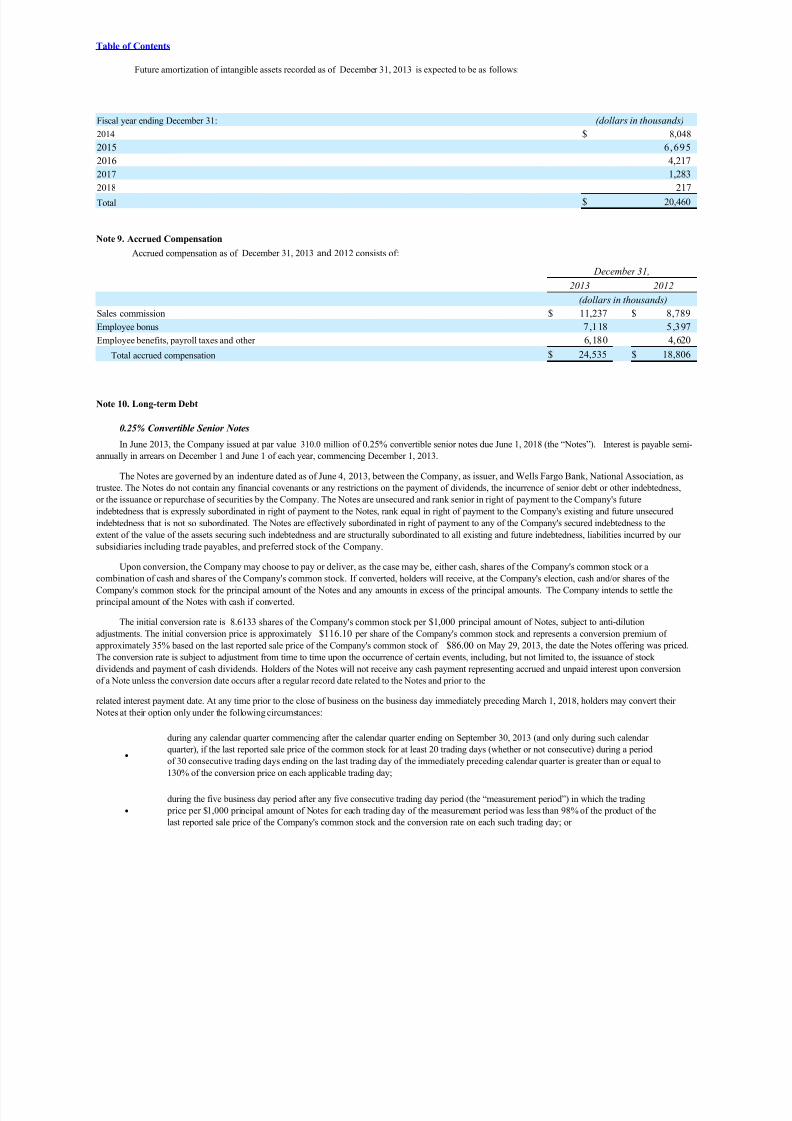
8/10/2019 Net Suite AR
http://slidepdf.com/reader/full/net-suite-ar 61/87
Table of Contents
Future amortization of intangible assets recorded as of December 31, 2013 is expected to be as follows:
Fiscal year ending December 31: (dollars in thousands)
2014 $ 8,048
2015 6,695
2016 4,217
2017 1,283
2018 217
Total $ 20,460
Note 9. Accrued Compensation
Accrued compensation as of December 31, 2013 and 2012 consists of:
December 31,
2013 2012
(dollars in thousands)
Sales commission $ 11,237 $ 8,789
Employee bonus 7,118 5,397
Employee benefits, payroll taxes and other 6,180 4,620Total accrued compensation $ 24,535 $ 18,806
Note 10. Long-term Debt
0.25% Convertible Senior Notes
In June 2013, the Company issued at par value 310.0 million of 0.25% convertible senior notes due June 1, 2018 (the “Notes”). Interest is payable semi-
annually in arrears on December 1 and June 1 of each year, commencing December 1, 2013.
The Notes are governed by an indenture dated as of June 4, 2013, between the Company, as issuer, and Wells Fargo Bank, National Association, as
trustee. The Notes do not contain any financial covenants or any restrictions on the payment of dividends, the incurrence of senior debt or other indebtedness,
or the issuance or repurchase of securities by the Company. The Notes are unsecured and rank senior in right of payment to the Company's future
indebtedness that is expressly subordinated in right of payment to the Notes, rank equal in right of payment to the Company's existing and future unsecuredindebtedness that is not so subordinated. The Notes are effectively subordinated in right of payment to any of the Company's secured indebtedness to the
extent of the value of the assets securing such indebtedness and are structurally subordinated to all existing and future indebtedness, liabilities incurred by our
subsidiaries including trade payables, and preferred stock of the Company.
Upon conversion, the Company may choose to pay or deliver, as the case may be, either cash, shares of the Company's common stock or a
combination of cash and shares of the Company's common stock. If converted, holders will receive, at the Company's election, cash and/or shares of the
Company's common stock for the principal amount of the Notes and any amounts in excess of the principal amounts. The Company intends to settle the
principal amount of the Notes with cash if converted.
The initial conversion rate is 8.6133 shares of the Company's common stock per $1,000 principal amount of Notes, subject to anti-dilution
adjustments. The initial conversion price is approximately $116.10 per share of the Company's common stock and represents a conversion premium of
approximately 35% based on the last reported sale price of the Company's common stock of $86.00 on May 29, 2013, the date the Notes offering was priced.
The conversion rate is subject to adjustment from time to time upon the occurrence of certain events, including, but not limited to, the issuance of stock
dividends and payment of cash dividends. Holders of the Notes will not receive any cash payment representing accrued and unpaid interest upon conversion
of a Note unless the conversion date occurs after a regular record date related to the Notes and prior to the
related interest payment date. At any time prior to the close of business on the business day immediately preceding March 1, 2018, holders may convert their
Notes at their option only under the following circumstances:
●
during any calendar quarter commencing after the calendar quarter ending on September 30, 2013 (and only during such calendar
quarter), if the last reported sale price of the common stock for at least 20 trading days (whether or not consecutive) during a period
of 30 consecutive trading days ending on the last trading day of the immediately preceding calendar quarter is greater than or equal to
130% of the conversion price on each applicable trading day;
●
during the five business day period after any five consecutive trading day period (the “measurement period”) in which the trading
price per $1,000 principal amount of Notes for each trading day of the measurement period was less than 98% of the product of the
last reported sale price of the Company's common stock and the conversion rate on each such trading day; or
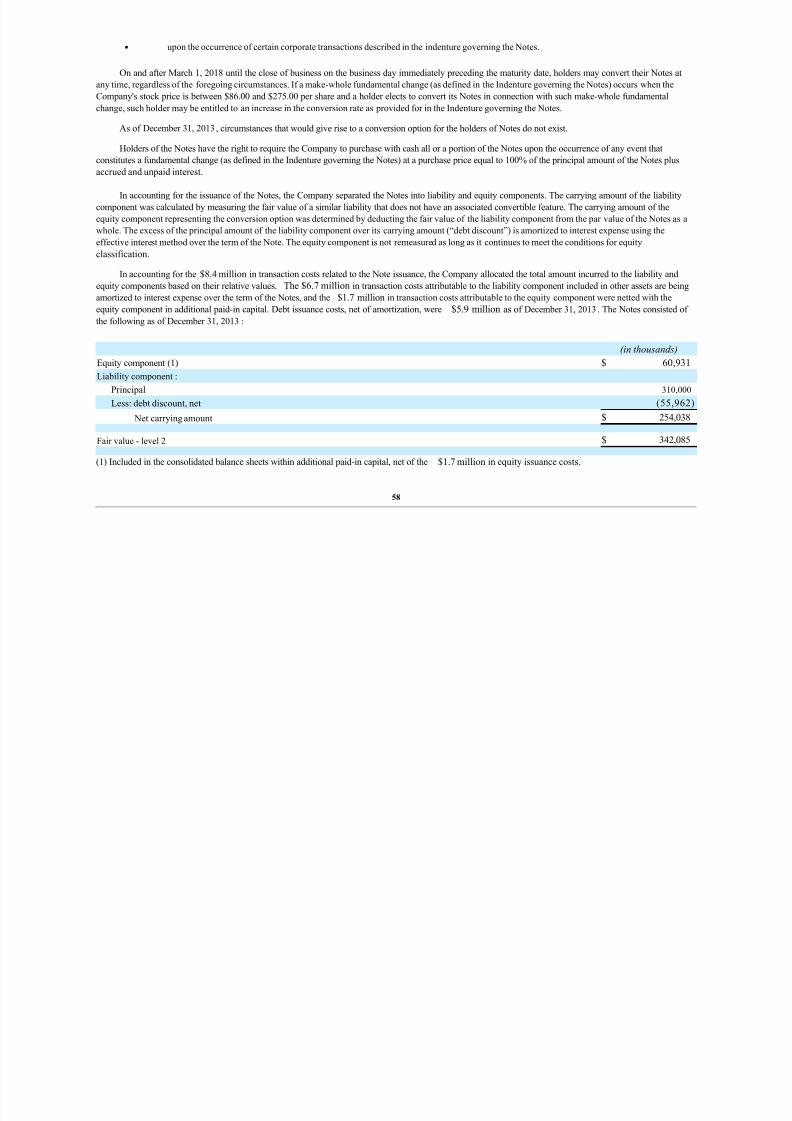
8/10/2019 Net Suite AR
http://slidepdf.com/reader/full/net-suite-ar 62/87
● upon the occurrence of certain corporate transactions described in the indenture governing the Notes.
On and after March 1, 2018 until the close of business on the business day immediately preceding the maturity date, holders may convert their Notes at
any time, regardless of the foregoing circumstances. If a make-whole fundamental change (as defined in the Indenture governing the Notes) occurs when the
Company's stock price is between $86.00 and $275.00 per share and a holder elects to convert its Notes in connection with such make-whole fundamental
change, such holder may be entitled to an increase in the conversion rate as provided for in the Indenture governing the Notes.
As of December 31, 2013, circumstances that would give rise to a conversion option for the holders of Notes do not exist.
Holders of the Notes have the right to require the Company to purchase with cash all or a portion of the Notes upon the occurrence of any event that
constitutes a fundamental change (as defined in the Indenture governing the Notes) at a purchase price equal to 100% of the principal amount of the Notes plus
accrued and unpaid interest.
In accounting for the issuance of the Notes, the Company separated the Notes into liability and equity components. The carrying amount of the liability
component was calculated by measuring the fair value of a similar liability that does not have an associated convertible feature. The carrying amount of the
equity component representing the conversion option was determined by deducting the fair value of the liability component from the par value of the Notes as a
whole. The excess of the principal amount of the liability component over its carrying amount (“debt discount”) is amortized to interest expense using the
effective interest method over the term of the Note. The equity component is not remeasured as long as it continues to meet the conditions for equity
classification.
In accounting for the $8.4 million in transaction costs related to the Note issuance, the Company allocated the total amount incurred to the liability and
equity components based on their relative values. The $6.7 million in transaction costs attributable to the liability component included in other assets are being
amortized to interest expense over the term of the Notes, and the $1.7 million in transaction costs attributable to the equity component were netted with the
equity component in additional paid-in capital. Debt issuance costs, net of amortization, were $5.9 million as of December 31, 2013. The Notes consisted of
the following as of December 31, 2013 :
(in thousands)
Equity component (1) $ 60,931
Liability component :
Principal 310,000
Less: debt discount, net (55,962)
Net carrying amount $ 254,038
Fair value - level 2 $ 342,085
(1) Included in the consolidated balance sheets within additional paid-in capital, net of the $1.7 million in equity issuance costs.
58

8/10/2019 Net Suite AR
http://slidepdf.com/reader/full/net-suite-ar 63/87
Table of Contents
The Notes are carried at face value less any unamortized debt discount and also require disclosure of an estimate of fair value. The Company considers
the fair value of the Notes at each balance sheet date to be a level 2 measurement because it is determined based on a recent quoted market price or dealer quote
for the Notes. The Notes quoted market price or dealer quote is based on the trading price of the Company's common stock and market activity that is less
than an active exchange.
As of December 31, 2013, the remaining life of the Notes is approximately 4.50 years.
The following table sets forth total interest expense recognized related to the Notes during the twelve months ended December 31, 2013:
(in thousands)
Contractual interest expense $ 446
Amortization of debt issuance costs 696
Amortization of debt discount 6,620
Total $ 7,762
Effective interest rate 5.4%
In connection with issuing at par value $310.0 million of 0.25% convertible senior notes due June 1, 2018, our Board of Directors approved the use of
$30.0 million of the net proceeds to repurchase 348,837 shares of our common stock for $30.0 million or $86.00 per share. The Company has since retired
these shares.
Related Party Debt
On October 31, 2007, the Company entered into a perpetual software license agreement with Oracle USA, Inc. (“Oracle USA”), a related party, tolicense Oracle database and application server software, along with technical support. This license agreement had a forty-two month term that allowed theCompany to download an unlimited number of perpetual licenses and was financed pursuant to notes issued to Oracle USA, Inc. at a rate of 6.20% per annum.
In May 2010, the Company entered into an amendment to the perpetual software license agreement with Oracle USA. The amendment provides for a 37-month extension of unlimited licenses to the October 2007 license agreement from Oracle and was financed pursuant to notes issued to Oracle USA, Inc. at arate of 2.12% per annum. On February 28, 2013, the Company entered into the third amendment to the perpetual software license agreement with Oracle USA("Amendment"). The Amendment provides for a 48 month extension to the May 2010 second amendment to the Oracle unlimited license agreement. TheAmendment provides that the Company will pay a one-time fee of $13.1 million to extend the term for unlimited licenses from May 31, 2014 to May 31, 2018.The Amendment also provides for technical support services. The Company will pay $2.4 million for the support services from February 28, 2013 toFebruary 27, 2014. The Company may renew support services for four subsequent annual periods for a fee of $4.3 million per year. The support services to
be provided to the Company by Oracle automatically renew unless the Company provides written notice of cancellation at least 60 days prior to the supportrenewal date. The Company financed the license fees due under the Amendment pursuant to a note issued to Oracle Credit Corporation. The note bears interestat a rate of 2.0% per annum with payments scheduled over the term of the amendment. The Company discounted the note at a rate of 4.5% because itapproximates the interest rate the Company would obtain on the open market. The $12.4 million discounted note value was recorded as an asset addition to
property and equipment that will be depreciated over seven years.
Future debt payments under notes payable (including $403,000 in payments related to the May 10, 2010 second amendment) as of December 31,2013 are as follows:
(dollars in thousands)
Years ending:
2014 $ 3,522
2015 3,119
2016 3,119
2017 3,119
Future debt payments 12,879
Amount representing interest 1,123
Present value of future debt payments $ 11,756
59

8/10/2019 Net Suite AR
http://slidepdf.com/reader/full/net-suite-ar 64/87
Table of Contents
The current and long-term portions of the notes payable, recorded in other current liabilities and other long-term liabilities, respectively, are as followsfor the periods indicated:
December 31,
2013 2012
(dollars in thousands)
Current portion $ 3,054 $ 1,584
Long-term portion 8,702 401
Total long-term debt $ 11,756 $ 1,985
The maximum amount outstanding under the notes and annual support agreement was $14.4 million and $3.5 million during the years endedDecember 31, 2013 and 2012, respectively.
The following table details payments to Oracle USA and Oracle Credit Corporation:
Twelve Months Ended December 31,
2013 2012 2011
(dollars in thousands)
License fee $ 2,612 $ 1,550 $ 1,117
Support 2,380 2,373 1,778
Interest 431 82 109
Total paid $ 5,423 $ 4,005 $ 3,004
Note 11. Lease Commitments
The Company leases computer equipment and purchased software from various parties under capital lease agreements that expire through December 2014. The total outstanding balance financed under capital leases was $ 247,000 and $1.0 million at December 31, 2013 and 2012, respectively. Accumulatedamortization on the leased assets was $2.1 million and $1.3 million at December 31, 2013 and 2012, respectively. Amortization of assets recorded under thecapital leases is included in depreciation expense. The current and long-term portions of the capital leases have been recorded in other current liabilities andother long-term liabilities, respectively, on the consolidated balance sheets. The current and long-term portions of capital lease were as follows:
December 31,
2013 2012
(dollars in thousands)
Current portion $ 247 $ 744
Long-term portion — 247
Total debt related to capital leases $ 247 $ 991
The Company also has several non-cancelable operating leases, primarily for its facilities, that expire through 2021. Certain of these leases containrenewal options for periods ranging from two to five years and require the Company to pay executory costs such as maintenance, taxes, and insurance. TheCompany leases office space in the U.S. and throughout the world with various expiration dates through 2021. Minimum rent payments under operatingleases are recognized on a straight-line basis over the term of the lease including any periods of free rent and rent concessions.
60
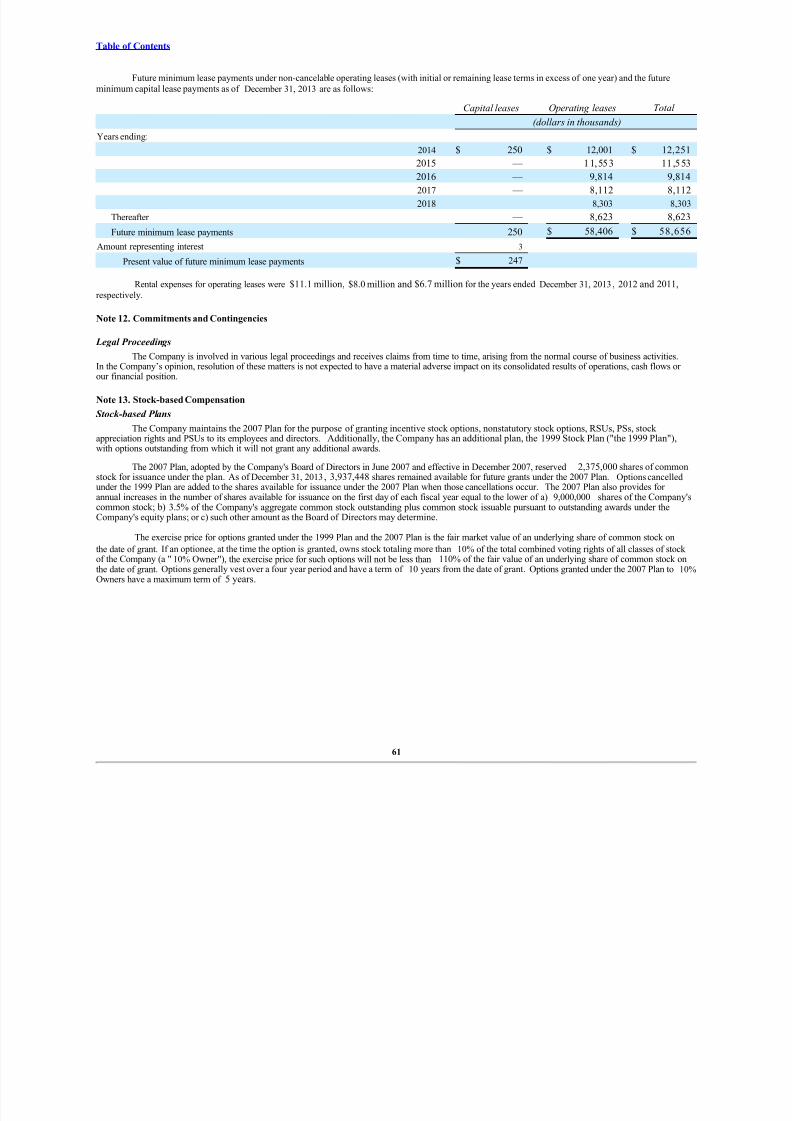
8/10/2019 Net Suite AR
http://slidepdf.com/reader/full/net-suite-ar 65/87
Table of Contents
Future minimum lease payments under non-cancelable operating leases (with initial or remaining lease terms in excess of one year) and the futureminimum capital lease payments as of December 31, 2013 are as follows:
Capital leases Operating leases Total
(dollars in thousands)
Years ending:
2014 $ 250 $ 12,001 $ 12,251
2015 — 11,553 11 ,553
2016 — 9,814 9,814
2017 — 8,112 8,112
2018 — 8,303 8,303
Thereafter — 8,623 8,623
Future minimum lease payments 250 $ 58,406 $ 58,656
Amount representing interest 3
Present value of future minimum lease payments $ 247
Rental expenses for operating leases were $11.1 million, $8.0 million and $6.7 million for the years ended December 31, 2013, 2012 and 2011,respectively.
Note 12. Commitments and Contingencies
Legal Proceedings
The Company is involved in various legal proceedings and receives claims from time to time, arising from the normal course of business activities.In the Company’s opinion, resolution of these matters is not expected to have a material adverse impact on its consolidated results of operations, cash flows or our financial position.
Note 13. Stock-based Compensation
Stock-based Plans
The Company maintains the 2007 Plan for the purpose of granting incentive stock options, nonstatutory stock options, RSUs, PSs, stock appreciation rights and PSUs to its employees and directors. Additionally, the Company has an additional plan, the 1999 Stock Plan ("the 1999 Plan"),with options outstanding from which it will not grant any additional awards.
The 2007 Plan, adopted by the Company's Board of Directors in June 2007 and effective in December 2007, reserved 2,375,000 shares of commonstock for issuance under the plan. As of December 31, 2013, 3,937,448 shares remained available for future grants under the 2007 Plan. Options cancelledunder the 1999 Plan are added to the shares available for issuance under the 2007 Plan when those cancellations occur. The 2007 Plan also provides for annual increases in the number of shares available for issuance on the first day of each fiscal year equal to the lower of a) 9,000,000 shares of the Company's
common stock; b) 3.5% of the Company's aggregate common stock outstanding plus common stock issuable pursuant to outstanding awards under theCompany's equity plans; or c) such other amount as the Board of Directors may determine.
The exercise price for options granted under the 1999 Plan and the 2007 Plan is the fair market value of an underlying share of common stock on
the date of grant. If an optionee, at the time the option is granted, owns stock totaling more than 10% of the total combined voting rights of all classes of stock of the Company (a "10% Owner"), the exercise price for such options will not be less than 110% of the fair value of an underlying share of common stock onthe date of grant. Options generally vest over a four year period and have a term of 10 years from the date of grant. Options granted under the 2007 Plan to 10%Owners have a maximum term of 5 years.
61

8/10/2019 Net Suite AR
http://slidepdf.com/reader/full/net-suite-ar 66/87
Table of Contents
Amounts recognized in the financial statements related to the 2007 Plan are as follows:
December 31,
2013 2012 2011
(dollars in thousands)
Total cost of stock-based plan during the year $ 74,759 $ 49,432 $ 38,763
Capitalized stock-based compensation (1,099) (990) (448)
Previously capitalized stock-based compensation amortizedduring the year 505 179 —
Stock-based compensation expense $ 74,165 $ 48,621 $ 38,315
Foreign income tax associated with stock-based compensation $ 249 $ 287 $ 326
The Company issues new shares of common stock upon the exercise of stock options, the granting of restricted stock and the vesting of RSUs, PSsand PSUs.
During the first quarter of 2012, the Company granted 341,750 PS, with a fair value of $50.38 per share, to selected executives and other keyemployees. These PS grants were equally divided into two tranches: shares that are subject to the Company's performance in 2012 and 2014. The PS vestingfor each tranche is contingent upon the Company meeting certain company-wide revenue and non-GAAP operating margin performance goals (performance- based) in 2012 and 2014, respectively. Additionally, in the first quarter of 2012, the Company also awarded these employees 170,875 PS for 2013 and anadditional 170,875 PS award for 2014. The Company's Board of Directors set the performance metrics for the 2013 award in first quarter 2013 and will setthe performance metrics for 2014 award in the first quarter 2014. As such, there is no accounting impact for these awards until the period the performance
metrics are set.
The PS are subject to term vesting conditions. The PS fair value and the related stock-based compensation expense are determined based on the valueof the underlying shares on the date of grant and is recognized over the vesting term. During the interim financial periods, management estimates the probablenumber of PS that will be granted until the achievement of the performance goals is known which is typically in the first quarter of the following year.
For the PS tranche granted for 2013, the Company achieved 137% of its company-wide performance goals resulting in the Company granting anadditional 72,542 shares to select executives and key employees. The 2013 PS grants vest 1/3 per year with the initial vesting event in February 2014.
For the PS tranche granted for 2012, the Company achieved 110% of its company-wide performance goals resulting in the Company granting anadditional 16,532 shares to select executives and key employees. The 2012 PS grants vest 1/3 per year with the initial vesting event on February 2013.
During the first quarter of fiscal 2011, the Company granted 162,558 PSUs to selected executives and other key employees. These PSUs weredivided into two sets: PSUs whose vesting is based upon the Company’s stock performance in relation to a group of peer companies (market-based) andPSUs whose vesting is contingent upon meeting certain company-wide performance goals (performance-based). The following company-wide performancegoals were set for 2011: 60% of the shares are contingent upon meeting revenue goals, 15% of the shares are contingent upon meeting a non-GAAP measure of operating margin and 25% are contingent upon meeting a non-GAAP measure of operating cash flows. These shares are subject to term vesting conditions.
For 2011, the Company achieved 175% of its market-based performance goals and 144% of its company-wide performance goals resulting in theCompany granting an additional 96,715 shares to select executive and key employees. The 2011 PSU grants vest 1/12 per quarter with the initial vestingevent in February 2012.
As of December 31, 2013 and 2012, all outstanding stock-based payment awards qualified for classification as equity.
Stock Options
62
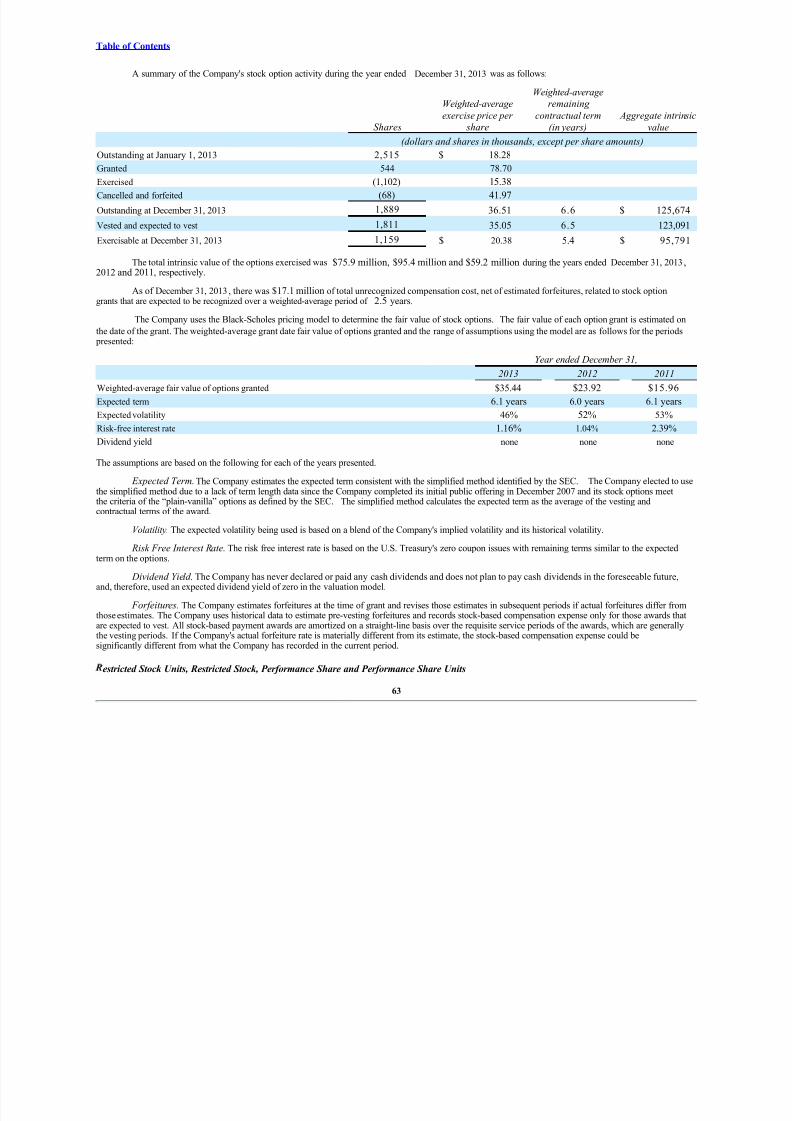
8/10/2019 Net Suite AR
http://slidepdf.com/reader/full/net-suite-ar 67/87
Table of Contents
A summary of the Company's stock option activity during the year ended December 31, 2013 was as follows:
Shares
Weighted-average
exercise price per
share
Weighted-average
remaining
contractual term
(in years) Aggregate intrinsic
value
(dollars and shares in thousands, except per share amounts)
Outstanding at January 1, 2013 2,515 $ 18.28
Granted 544 78.70 Exercised (1,102) 15.38
Cancelled and forfeited (68) 41.97
Outstanding at December 31, 2013 1,889 36.51 6.6 $ 125,674
Vested and expected to vest 1,811 35.05 6.5 123,091
Exercisable at December 31, 2013 1,159 $ 20.38 5.4 $ 95,791
The total intrinsic value of the options exercised was $75.9 million, $95.4 million and $59.2 million during the years ended December 31, 2013,2012 and 2011, respectively.
As of December 31, 2013, there was $17.1 million of total unrecognized compensation cost, net of estimated forfeitures, related to stock optiongrants that are expected to be recognized over a weighted-average period of 2.5 years.
The Company uses the Black-Scholes pricing model to determine the fair value of stock options. The fair value of each option grant is estimated on
the date of the grant. The weighted-average grant date fair value of options granted and the range of assumptions using the model are as follows for the periods
presented:
Year ended December 31,
2013 2012 2011
Weighted-average fair value of options granted $35.44 $23.92 $15.96
Expected term 6.1 years 6.0 years 6.1 years
Expected volatility 46% 52% 53%
Risk-free interest rate 1.16% 1.04% 2.39%
Dividend yield none none none
The assumptions are based on the following for each of the years presented.
Expected Term. The Company estimates the expected term consistent with the simplified method identified by the SEC. The Company elected to usethe simplified method due to a lack of term length data since the Company completed its initial public offering in December 2007 and its stock options meetthe criteria of the “plain-vanilla” options as defined by the SEC. The simplified method calculates the expected term as the average of the vesting and
contractual terms of the award.
Volatility. The expected volatility being used is based on a blend of the Company's implied volatility and its historical volatility.
Risk Free Interest Rate. The risk free interest rate is based on the U.S. Treasury's zero coupon issues with remaining terms similar to the expectedterm on the options.
Dividend Yield. The Company has never declared or paid any cash dividends and does not plan to pay cash dividends in the foreseeable future,and, therefore, used an expected dividend yield of zero in the valuation model.
Forfeitures. The Company estimates forfeitures at the time of grant and revises those estimates in subsequent periods if actual forfeitures differ fromthose estimates. The Company uses historical data to estimate pre-vesting forfeitures and records stock-based compensation expense only for those awards thatare expected to vest. All stock-based payment awards are amortized on a straight-line basis over the requisite service periods of the awards, which are generallythe vesting periods. If the Company's actual forfeiture rate is materially different from its estimate, the stock-based compensation expense could besignificantly different from what the Company has recorded in the current period.
estricted Stock Units, Restricted Stock, Performance Share and Performance Share Units
63

8/10/2019 Net Suite AR
http://slidepdf.com/reader/full/net-suite-ar 68/87
Table of Contents
A summary of the Company's RSU, RS, PS and PSU activity during the year ended December 31, 2013 is as follows:
Shares
Weighted-average
grant date fair value
per share Aggregate intrinsic
value
(dollars and shares in thousands, except per share amounts)
Nonvested at January 1, 2013 3,116 $32.57
Granted 1,450 80.50
Vested (1,705) 30.17 Cancelled and forfeited (193) 42.82
Nonvested at December 31, 2013 2,668 $59.35 $ 274,883
For the restricted stock units, restricted stock, performance shares and performance share units that vested during the years ended December 31, 2013, 2012and 2011, the total intrinsic value was $145.3 million, $94.6 million and $62.7 million , respectively.
In accordance with the T-HR acquisition agreement, at the close of the transaction, the Company granted certain former T-HR stockholders and now employeesof the Company, 37,852 restricted stock units valued at $4.0 million and will grant another $3.0 million in restricted stock units on the one year anniversaryof the close date. The restricted stock units will vest over four years in accordance with the terms of the Company's equity compensation plan. The costs of theequity grants will be recognized in the Company's statement of operations over the four year vesting period.
In connection with the SAC acquisitions, the Company entered into employment agreements with certain former SAC stockholders and granted them51,606 restricted stock units in total. The restricted stock units vest over the next three to four years in accordance with the terms of the Company's equitycompensation plan. The total fair value of the restricted stock units on the date of grant was $2.3 million. The cost of these equity grants will be recognized ascost of professional services and other in the Company's statement of operations over the three to four year vesting period.
In connection with the Company's acquisition of SPC in the third quarter of 2011, the Company entered into employment agreements with SPC's twostockholders. Each of the employment agreements included a 60,000 restricted stock unit grant which vests over the next four years in accordance with theterms of the Company's equity compensation plan. On August 2, 2011, the Company granted the new employees a total of 120,000 restricted stock units witha fair value of $4.4 million. The costs of the equity grants will be recognized as product development expense in the Company's statement of operations over the four year vesting period.
Compensation expense for RSUs, restricted stock, PS and PSUs is determined based on the value of the underlying shares on the date of grant. Thetypical RSUs, restricted stock, PS and PSU fair value is based on market value of shares on the grant date (the intrinsic value). The fair value of the market-
based PSUs on the grant date (measurement date) is calculated using a Monte Carlo simulation model that estimates the distribution of the potential outcomesof the PSU grants based on simulated future stock prices of the peer group. As of December 31, 2013, there were $116.6 million of total unrecognizedcompensation costs, net of estimated forfeitures, related to RSUs, restricted stock, PSs and PSUs that is expected to be recognized over a weighted-average
period of 2.1 years.
eserved for Future Issuance
The Company has reserved the following shares of authorized but unissued common stock for future issuance:
December 31, 2013
(shares in thousands)
Options outstanding 1,889
RSUs, PSs, PSUs and restricted stock awards outstanding 2,668
2013 and 2014 PS 206
Shares available for future grants 3,937
Total 8,700
Note 14. Other Employee Benefits Plans
The Company has a defined contribution retirement plan ("the Plan") that covers substantially all domestic employees of the Company. The Planallows employees to contribute gross salary through payroll deductions up to the legally mandated limit based on their jurisdiction. Effective January 1, 2013,the Company increased the maximum annual employer contribution match from $3,570 to $4,000. The Company also contributes to various retirement plansfor its employees outside the United States. The Company contributed $3.9 million, $2.7 million and $2.3 million to its various retirement plans for the years
ended December 31, 2013, 2012 and 2011, respectively.
64
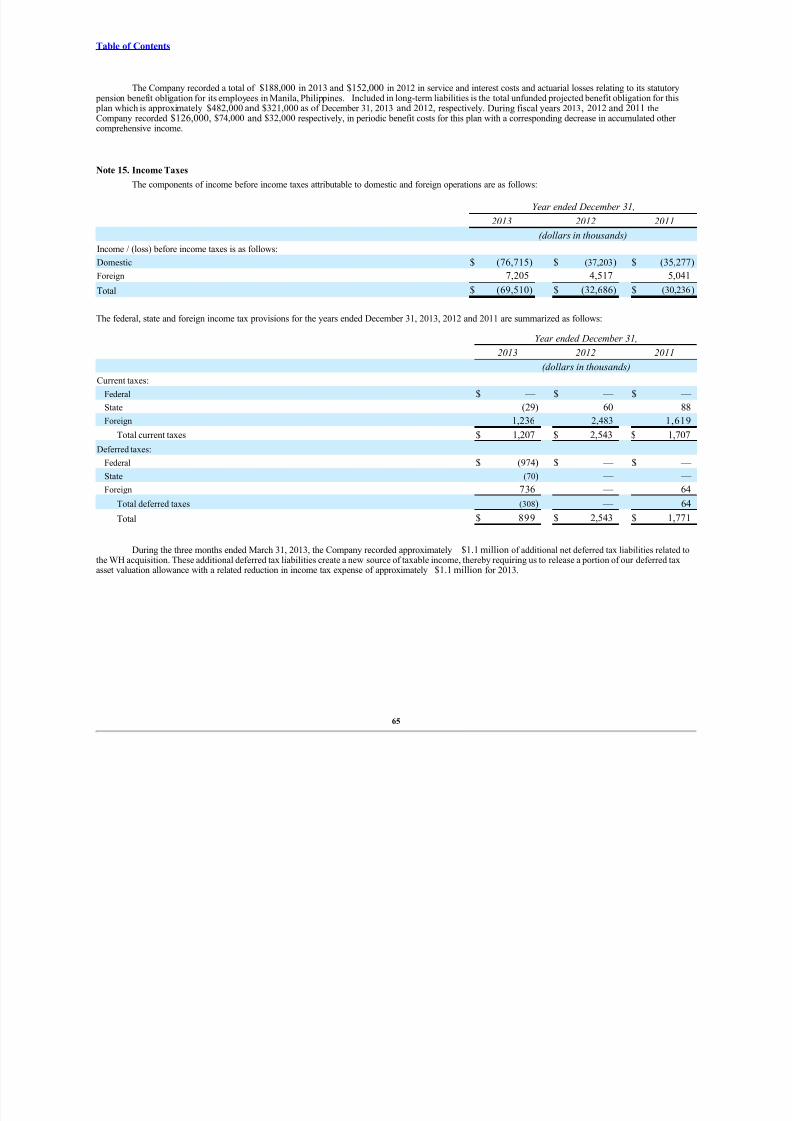
8/10/2019 Net Suite AR
http://slidepdf.com/reader/full/net-suite-ar 69/87
Table of Contents
The Company recorded a total of $188,000 in 2013 and $152,000 in 2012 in service and interest costs and actuarial losses relating to its statutory pension benefit obligation for its employees in Manila, Philippines. Included in long-term liabilities is the total unfunded projected benefit obligation for this plan which is approximately $482,000 and $321,000 as of December 31, 2013 and 2012, respectively. During fiscal years 2013, 2012 and 2011 theCompany recorded $126,000, $74,000 and $32,000 respectively, in periodic benefit costs for this plan with a corresponding decrease in accumulated other comprehensive income.
Note 15. Income Taxes
The components of income before income taxes attributable to domestic and foreign operations are as follows:
Year ended December 31,
2013 2012 2011
(dollars in thousands)
Income / (loss) before income taxes is as follows:
Domestic $ (76,715) $ (37,203) $ (35,277)
Foreign 7,205 4,517 5,041
Total $ (69,510) $ (32,686) $ (30,236)
The federal, state and foreign income tax provisions for the years ended December 31, 2013, 2012 and 2011 are summarized as follows:
Year ended December 31, 2013 2012 2011
(dollars in thousands)
Current taxes:
Federal $ — $ — $ —
State (29) 60 88
Foreign 1,236 2,483 1,619
Total current taxes $ 1,207 $ 2,543 $ 1,707
Deferred taxes:
Federal $ (974) $ — $ —
State (70) — —
Foreign 736 — 64
Total deferred taxes (308) — 64
Total $ 899 $ 2,543 $ 1,771
During the three months ended March 31, 2013, the Company recorded approximately $1.1 million of additional net deferred tax liabilities related tothe WH acquisition. These additional deferred tax liabilities create a new source of taxable income, thereby requiring us to release a portion of our deferred taxasset valuation allowance with a related reduction in income tax expense of approximately $1.1 million for 2013.
65
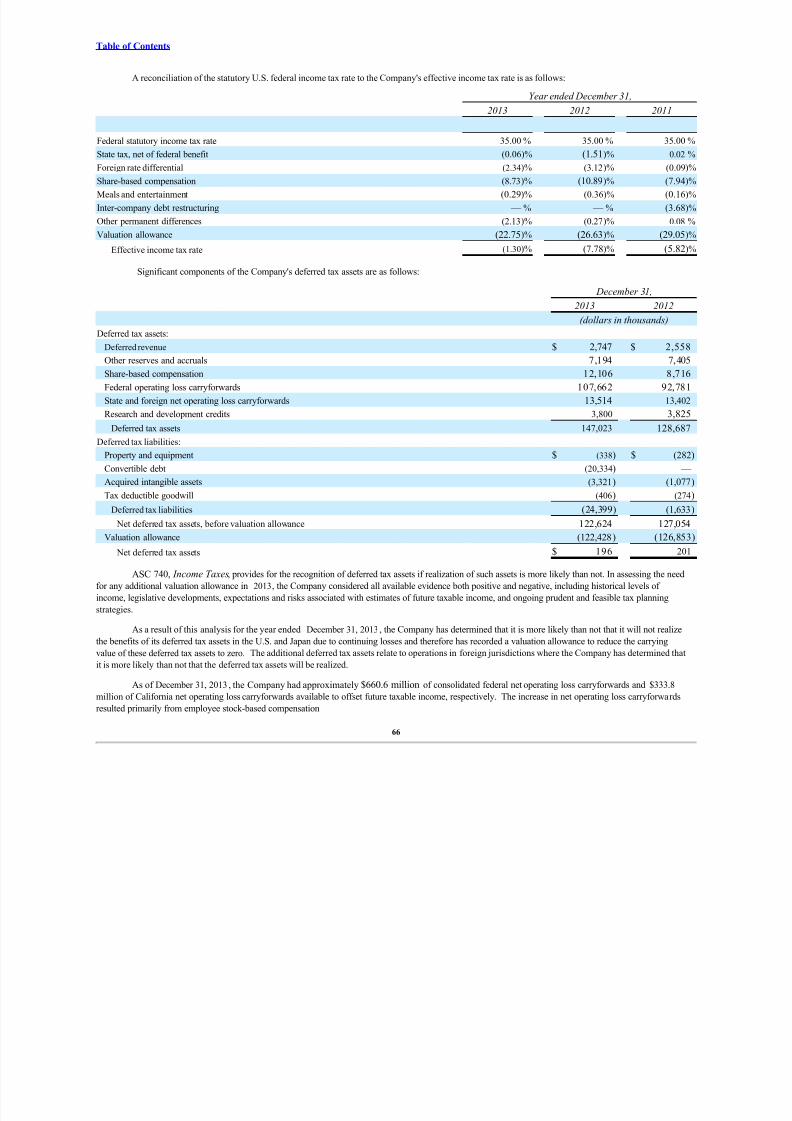
8/10/2019 Net Suite AR
http://slidepdf.com/reader/full/net-suite-ar 70/87
Table of Contents
A reconciliation of the statutory U.S. federal income tax rate to the Company's effective income tax rate is as follows:
Year ended December 31,
2013 2012 2011
Federal statutory income tax rate 35.00 % 35.00 % 35.00 %
State tax, net of federal benefit (0.06)% (1.51)% 0.02 %
Foreign rate differential (2.34)% (3.12)% (0.09)%Share-based compensation (8.73)% (10.89)% (7.94)%
Meals and entertainment (0.29)% (0.36)% (0.16)%
Inter-company debt restructuring — % — % (3.68)%
Other permanent differences (2.13)% (0.27)% 0.08 %
Valuation allowance (22.75)% (26.63)% (29.05)%
Effective income tax rate (1.30)% (7.78)% (5.82)%
Significant components of the Company's deferred tax assets are as follows:
December 31,
2013 2012
(dollars in thousands)
Deferred tax assets:
Deferred revenue $ 2,747 $ 2,558
Other reserves and accruals 7,194 7,405
Share-based compensation 12,106 8,716
Federal operating loss carryforwards 107,662 92,781
State and foreign net operating loss carryforwards 13,514 13,402
Research and development credits 3,800 3,825
Deferred tax assets 147,023 128,687
Deferred tax liabilities:
Property and equipment $ (338) $ (282)
Convertible debt (20,334) —
Acquired intangible assets (3,321) (1,077)
Tax deductible goodwill (406) (274)
Deferred tax liabilities (24,399) (1,633) Net deferred tax assets, before valuation allowance 122,624 127,054
Valuation allowance (122,428) (126,853)
Net deferred tax assets $ 196 201
ASC 740, Income Taxes, provides for the recognition of deferred tax assets if realization of such assets is more likely than not. In assessing the need
for any additional valuation allowance in 2013, the Company considered all available evidence both positive and negative, including historical levels of
income, legislative developments, expectations and risks associated with estimates of future taxable income, and ongoing prudent and feasible tax planning
strategies.
As a result of this analysis for the year ended December 31, 2013, the Company has determined that it is more likely than not that it will not realize
the benefits of its deferred tax assets in the U.S. and Japan due to continuing losses and therefore has recorded a valuation allowance to reduce the carrying
value of these deferred tax assets to zero. The additional deferred tax assets relate to operations in foreign jurisdictions where the Company has determined that
it is more likely than not that the deferred tax assets will be realized.
As of December 31, 2013, the Company had approximately $660.6 million of consolidated federal net operating loss carryforwards and $333.8
million of California net operating loss carryforwards available to offset future taxable income, respectively. The increase in net operating loss carryforwards
resulted primarily from employee stock-based compensation
66

8/10/2019 Net Suite AR
http://slidepdf.com/reader/full/net-suite-ar 71/87

8/10/2019 Net Suite AR
http://slidepdf.com/reader/full/net-suite-ar 72/87
Table of Contents
Basic net loss per common share is computed by dividing net loss by the weighted-average number of shares of common stock outstanding during
the period. Diluted net loss per share of common stock is computed by giving effect to all potential dilutive shares of common stock, including options,
restricted stock units ("RSUs"), performance share units ("PSUs"), performance shares ("PS") and convertible debt shares. Basic and diluted net loss per
share of common stock were the same for all periods presented as the impact of all potentially dilutive securities outstanding was anti-dilutive.
The following table presents the calculation of the numerator and denominator used in the basic and diluted net loss per common share:
December 31, 2013 2012 2011
(dollars and shares in thousands, except per share
amounts)
Numerator:
Net loss attributable to NetSuite Inc. common stockholders $ (70,409) $ (35,229) $ (32,007)
Denominator:
Weighted-average number of common shares outstanding used in computing
basic and diluted net loss per common share 74,085 70,713 66,919
Net loss per common share, basic and diluted $ (0.95) $ (0.50) $ (0.48)
The Company’s unvested RSUs, PSUs and PS do not contain non-forfeitable rights to dividends and dividend equivalents. As such, unvestedRSUs, PSUs and PS are not participating securities and the Company is not required to use the two-class method to calculate diluted earnings per share in
periods when the Company has net income.
The following table presents the weighted average potential shares that are excluded from the computation of diluted net loss per common share for the periods presented because including them would have had an anti-dilutive effect:
December 31,
2013 2012 2011
(shares in thousands)
Options to purchase shares of common stock 2 ,196 3 ,595 5,316
Unvested RSUs, PSs, PSUs and restricted stock awards 3,020 3,932 4,249
Total 5,216 7,527 9,565
The effect of the Notes is reflected in diluted earnings per share by application of the treasury stock method as the Company intends to settle the
principal amount of the Notes in cash upon conversion. During the year ended December 31, 2013, the Company's weighted average common stock price was
below the Notes conversion price for the periods during which the Notes were outstanding.
Note 17. Related Party Transactions
The Company has entered into various software license agreements with Oracle USA, Inc., an affiliate of Oracle Corporation. Lawrence J. Ellison,who beneficially owns a significant portion of the Company’s common stock, is the Chief Executive Officer, a director and a principal stockholder of OracleCorporation. In April 2005, the Company entered into a perpetual license for the use of Oracle database and application server software on a certain number of individual computers, along with technical support. This software license and support agreement has been amended with the latest amendment occuring inFebruary 2013. See Note 10. to the financial statements for the terms of this agreement.
In May 2011, the Company purchased an integrated database storage system from Oracle USA, Inc., an affiliate of Oracle Corporation, for $456,000. During the third quarter of 2011, the Company paid the $456,000 outstanding balance in full.
Commencing in 2004, the Company entered into a verbal agreement with Oracle Racing, Inc. ("Oracle Racing"), a sailboat racing syndicate.Lawrence J. Ellison, who beneficially owns the majority of the Company's stock, is the primary source of funding for Oracle Racing. Under the terms of theagreement, the Company agreed to supply certain of its cloud-based application services to Oracle Racing in exchange for logo placement on the sailboats. In
November 2011, the Company renewed its subscription and professional services agreement with Oracle Racing for an additional 40 months. According to the
terms of the agreement, the Company will provide services to Oracle Racing through the end of the American Cup racing
68

8/10/2019 Net Suite AR
http://slidepdf.com/reader/full/net-suite-ar 73/87
Table of Contents
season in exchange for logo placement and other advertising services. The estimated value of the Company's services over the term of the agreement is$342,000. Oracle Racing values its service to be approximately $400,000 over the term of the agreement. Based on the pricing for similar licenses to unaffiliatedthird parties, the Company calculated the fair market value of the services provided to Oracle Racing to be approximately $67,000, $62,000 and $65,000 for 2013, 2012 and 2011, respectively. The Company did not obtain an independent valuation of the logo placement rights received from Oracle Racing. Based onan estimate received from Oracle Racing, the Company determined the value of the logo placement on the sailboat to be approximately $33,000 during 2013,2012 and 2011. The incremental cost to the Company of providing cloud-based services and the incremental cost to Oracle Racing of providing logo placementrights on the sailboat was nominal. For accounting purposes, total revenue and total costs related to the Oracle Racing agreement will be equal and will berecognized as revenue and expense, respectively, at historical cost. In connection with the license agreements discussed above, the Company recognized$15,000, $112,000 and $65,000 in revenue for the years ended December 31, 2013, 2012 and 2011, respectively.
The Company has entered into various software license agreements RightNow Technologies. In October 2011, RightNow Technology was acquired by Oracle Corporation. Lawrence J. Ellison, who beneficially owns a significant portion of the Company’s common stock, is the Chief Executive Officer, adirector and a principal stockholder of Oracle Corporation. During 2013, the Company purchased $411,000 in services from RighNow Technologies. TheCompany paid RightNow Technologies $239,000 and $214,000 during the years ended December 31, 2013 and 2012, respectively, for services it received.During the years ended December 31, 2013 and 2012, the Company received payments totaling $123,000 and $115,000 from RightNow Technology for services it performed. The Company recognized $93,000, $128,000 and $159,000 in revenue for the years ended December 31, 2013 , 2012 and 2011,respectively. As of December 31, 2013, the Company had $127,000 in accounts receivable from RightNow Technologies.
In January 2011, the Company’s Chief Technology Officer and Chairman of the Board, purchased property from an entity affiliated withLawrence J. Ellison, a principal stockholder, (“seller”) for $8.0 million. The seller financed the transaction with a nine year loan. The Company analyzed thetransaction and determined that the fair value of the property approximated the fair value of the loan. Consequently, the Company determined there is nocompensation expense or a related capital contribution associated with this transaction.
In addition to the companies affiliated with Lawrence J. Ellison, the Company enters into sales and purchases agreements with various companiesthat have a relationship with the Company's executive officers or members of the Company's board of directors. The relationships are typically an equityinvestment by the executive officer or board member in the customer / vendor company or the Company's executive officer or board member is a member of thecustomer / vendor company's board of directors. The Company has renewed the license agreements and sold additional services to these customers or
purchased services from these vendors at various points in time. As of December 31, 2013, the Company had $540,000 in accounts receivable from other
related parties not affiliated with Mr. Ellison. Below is a summary of transactions between the Company and related parties other than Mr. Ellison:
December 31, 2013 December 31, 2012 December 31, 2011
(dollars in thousands)
Revenue earned from related party $ 2,311 $ 2,103 $ 1,983
Fees NetSuite paid for services $ 937 $ 596 $ 438
Item 9. Changes in and Disagreements With Accountants on Accounting and Financial Disclosure
Not applicable.
Item 9A. Controls and Procedures
Management's Report on Internal Control over Financial Reporting and Attestation Report of the Registered Accounting Firm
Our management is responsible for establishing and maintaining adequate internal control over financial reporting (as defined in Rules 13a-15(f) and15d-15(f) under the Exchange Act) to provide reasonable assurance regarding the reliability of our financial reporting and the preparation of financialstatements for external purposes in accordance with U.S. generally accepted accounting principles.
Management assessed the effectiveness of our internal control over financial reporting as of December 31, 2013, the end of our fiscal year.Management based its assessment on criteria established in Internal Control—Integrated Framework (1992) issued by the Committee of SponsoringOrganizations of the Treadway Commission ("COSO"). Management's assessment included evaluation of elements such as the design and operatingeffectiveness of key financial reporting controls, process documentation, accounting policies, and our overall control environment.
Based on this assessment, management has concluded that our internal control over financial reporting was effective as of the end of the fiscal year to provide reasonable assurance regarding the reliability of financial reporting and the preparation of financial statements for
69
8/10/2019 Net Suite AR
http://slidepdf.com/reader/full/net-suite-ar 74/87

8/10/2019 Net Suite AR
http://slidepdf.com/reader/full/net-suite-ar 75/87
8/10/2019 Net Suite AR
http://slidepdf.com/reader/full/net-suite-ar 76/87
SIGNATURES
Pursuant to the requirements of Section 13 or 15(d) of the Securities Exchange Act of 1934, the Registrant has duly caused this Annual Report on Form 10-K to be signed on its behalf by the undersigned, thereunto duly authorized, on March 3, 2014.
NETSUITE INC.
By: /S/ Zachary Nelson Zachary Nelson
President and Chief Executive Officer
Pursuant to the requirements of the Securities Exchange Act of 1934, this report has been signed below by the following persons on behalf of the Registrant andin the capacities and on the dates indicated.
Insert Title Here
Signature Title Date
/S/ Zachary Nelson
Zachary Nelson
Director, President and Chief
Executive Officer (Principal Executive
Officer)
March 3, 2014
/S/ Ronald Gill
Ronald Gill Chief Financial Officer (Principal
Financial and Accounting Officer) March 3, 2014
/S/ William L. Beane III
William L. Beane III Director
March 3, 2014
/S/ Deborah A. Farrington
Deborah A. Farrington Director
March 3, 2014
/S/ Evan M. Goldberg
Evan M. Goldberg Director
March 3, 2014
/S/ Steven Gomo
Steven Gomo Director March 3, 2014
/S/ Catherine Kinney
Catherine Kinney Director
March 3, 2014
/S/ Kevin Thompson
Kevin Thompson Director
March 3, 2014
/S/ Edward J. Zander
Edward J. Zander Director
March 3, 2014
72

8/10/2019 Net Suite AR
http://slidepdf.com/reader/full/net-suite-ar 77/87
Exhibit Index
The following exhibits are incorporated by reference or filed herewith.
Exhibit
number Description
3.1
Amended and Restated Certificate of Incorporation of the Registrant (incorporated by reference to Exhibit 3.2 of
Registrant's Form S-1 Registration No. 333-144257).
3.2
Amended and Restated Bylaws of the Registrant (incorporated by reference to Exhibit 3.4 of Registrant's Form S-1
Registration No. 333-144257).
4.1
Form of Common Stock Certificate of the Registrant (incorporated by reference to Exhibit 4.1 of Registrant's Form
S-1 Registration No. 333-144257). 4.2
Amended and Restated Investor Rights Agreement by and among the Registrant and certain stockholders dated
March 31, 2005, and amendments thereto (incorporated by reference to Exhibit 4.2 of Registrant's Form S-1
Registration No. 333-144257).
4.3
Limited Liability Company Operating Agreement of NetSuite Restricted Holdings LLC (incorporated by referenceto Exhibit 4.4 of Registrant's Form S-1 Registration No. 333-144257).
4.4
Board Resolutions Approving Corporate Opportunity Waiver (incorporated by reference to Exhibit 4.5 of
Registrant's Form S-1 Registration No. 333-144257).
4.5
Indenture between the Registrant and Wells Fargo Bank, National Association, as Trustee dated June 4, 2013
(incorporated by reference to Exhibit 4.1 of Registrant’s Current Report on Form 8-K filed on June 10, 2013).
4.6
Form of 0.25% Convertible Senior Notes due 2018 (incorporated by reference to Exhibit 4.2 of Registrant’s Current
Report on Form 8-K filed on June 10, 2013).
10.1+
Form of Indemnification Agreement between the Registrant and each of its directors and executive officers(incorporated by reference to Exhibit 10.1 of Registrant's Form S-1 Registration No. 333-144257).
10.2+
1999 Stock Plan and forms of agreements thereunder (incorporated by reference to Exhibit 10.2 of Registrant's
Form S-1 Registration No. 333-144257).
10.3+
2007 Equity Incentive Plan and forms of agreements thereunder (incorporated by reference to Exhibit 10.1 of
Registrant's Quarterly Report on Form 10-Q filed on August 13, 2008 and Exhibits 10.1 to 10.3 of Registrant's
Quarterly Report on Form 10-Q filed on May 7, 2012).
10.4+
2008 Executive Bonus Plan (incorporated by reference to Exhibit 10.1 of Registrant's Current Report on Form 8-K
filed on May 1, 2008).
10.5+
OpenAir, Inc. 2008 Restricted Stock Unit Plan and forms of agreement thereunder (incorporated by reference to
Exhibits 10.5 and 10.6 of Registrant's Quarterly Report on Form 10-Q filed on August 13, 2008).
73

8/10/2019 Net Suite AR
http://slidepdf.com/reader/full/net-suite-ar 78/87
10.6+
Offer Letter Agreement by and between the Registrant and Zachary Nelson effective July 1, 2007 (incorporated by
reference to Exhibit 10.6 of Registrant's Form S-1 Registration No. 333-144257).
10.7+
Offer Letter Agreement by and between the Registrant and Evan M. Goldberg effective July 1, 2007 (incorporated
by reference to Exhibit 10.7 of Registrant's Form S-1 Registration No. 333-144257).
10.8+ Offer Letter Agreement by and between the Registrant and James McGeever effective March 2, 2011.
10.9+
Letter Agreement by and between the Registrant and James Ramsey dated April 19, 2013 (incorporated by
reference to Exhibit 10.1 of Registrant’s Current Report on Form 8-K/A filed on April 22, 2013).
10.10+
Offer Letter Agreement by and between the Registrant and Timothy Dilley effective July 1, 2007 (incorporated by
reference to Exhibit 10.9 of Registrant's Form S-1 Registration No. 333-144257).
10.11
Office Lease Agreement by and between the Registrant and EOP-Peninsula Office Park, L.L.C. dated August 2,
2005 (incorporated by reference to Exhibit 10.12 of Registrant's Form S-1 Registration No. 333-144257).
10.12
First Amendment to the Office Lease Agreement by and between the Registrant and EOP-Peninsula Office Park,
L.L.C. dated April 24, 2008 (incorporated by reference to Exhibit 10.2 of Registrant's Current Report on Form 8-K
filed on April 28, 2008).
10.13
Second Amendment to the Office Lease Agreement by and between the Registrant and EOP- Peninsula Office
Park, L.L.C. dated October 8, 2010 (incorporated by reference to Exhibit 10.1 of Registrant's Current Report on
Form 8-K filed on December 15, 2011).
10.14
Third Amendment to the Office Lease Agreement by and between the Registrant and EOP- Peninsula Office Park,
L.L.C. dated December 9, 2011 (incorporated by reference to Exhibit 10.2 of Registrant's Current Report on Form
8-K filed on December 15, 2011).
10.15
Fourth Amendment to the Office Lease Agreement by and between the Registrant and EOP- Peninsula Office
Park, L.L.C. dated February 1, 2013 (incorporated by reference to Exhibit 10.1 of Registrant's Current Report on
Form 8-K filed on February 5, 2013).
10.16
Distribution Agreement by and between the Registrant and NetSuite KK dated March 8, 2006 (incorporated by
reference to Exhibit 10.14 of Registrant's Form S-1 Registration No. 333-144257).
10.17
Software License Agreement by and between the Registrant and Oracle USA, Inc. dated May 11, 2007
(incorporated by reference to Exhibit 10.19 of Registrant's Form S-1 Registration No. 333-144257).
10.18+
Severance and Change of Control Agreement by and between the Registrant and Zachary Nelson effective
December 24, 2008. (incorporated by reference to Exhibit 10.18 of Registrant's Annual Report on Form 10-K filed
on March 13, 2009)
10.19+
Severance and Change of Control Agreement by and between the Registrant and Evan M. Goldberg effectiveDecember 24, 2008. (incorporated by reference to Exhibit 10.19 of Registrant's Annual Report on Form 10-K filed
on March 13, 2009)
74
8/10/2019 Net Suite AR
http://slidepdf.com/reader/full/net-suite-ar 79/87
10.20+
Severance and Change of Control Agreement by and between the Registrant and James McGeever effective
December 24, 2008. (incorporated by reference to Exhibit 10.20 of Registrant's Annual Report on Form 10-K filed
on March 13, 2009)
10.21+
Severance and Change of Control Agreement by and between the Registrant and Timothy Dilley effective
December 24, 2008. (incorporated by reference to Exhibit 10.21 of Registrant's Annual Report on Form 10-K filed
on March 13, 2009).
10.22+
Severance and Change of Control Agreement by and between the Registrant and Douglas P. Solomon effective
December 24, 2008. (incorporated by reference to Exhibit 10.23 of Registrant's Annual Report on Form 10-K filed
on March 13, 2009)
10.23+
Severance and Change of Control Agreement by and between the Registrant and James Ramsey effective August
4, 2009 (incorporated by reference to Exhibit 10.1 of Registrant's Quarterly Report on Form 10-Q filed on August
10, 2009).
10.24
Ordering Document by and between the Registrant and Oracle USA, Inc. dated October 31, 2007 and as amended
(incorporated by reference to Exhibit 10.21 of Registrant's Annual Report on Form 10-K filed on March 3, 2011).
10.25
Ordering Document by and between the Registrant and Oracle America, Inc. dated May 10, 2011 (incorporated byreference to Exhibit 10.1 of Registrant's Current Report on Form 8-K filed on May 13, 2011).
10.26
Amendment Three to the Ordering Document between the Registrant and Oracle America, Inc. dated February
28, 2013 (incorporated by reference to Exhibit 10.1 of Registrant's Current Report on Form 8-K filed on March 6,
2013).
10.27
Amended and Restated Master Services Agreement between the Registrant and SAVVIS Communications
Corporation dated May 14, 2010 thereunder (incorporated by reference to Exhibit 10.1 of Registrant's Form 8-K
filed on May 21, 2010).
21.1 Subsidiaries of the Registrant.
23.1 Consent of KPMG LLP, Independent Registered Public Accounting Firm.
31.1 Certification of the Chief Executive Officer pursuant to Section 302 of the Sarbanes-Oxley Act.
31.2 Certification of the Chief Financial Officer pursuant to Section 302 of the Sarbanes-Oxley Act.
32.1
Certification of the Chief Executive Officer and the Chief Financial Officer pursuant to Section 906 of the
Sarbanes-Oxley Act.
101.INS** XBRL Instance Document
101.SCH** XBRL Taxonomy Extension Schema Document
101.CAL** XBRL Taxonomy Extension Calculation Linkbase Document
101.DEF** XBRL Taxonomy Extension Definition Linkbase Document
101.LAB** XBRL Taxonomy Extension Label Linkbase Document
75

8/10/2019 Net Suite AR
http://slidepdf.com/reader/full/net-suite-ar 80/87
101.PRE** XBRL Taxonomy Extension Presentation Linkbase Document
** The information in these XBRL documents is unaudited.
76

8/10/2019 Net Suite AR
http://slidepdf.com/reader/full/net-suite-ar 81/87

8/10/2019 Net Suite AR
http://slidepdf.com/reader/full/net-suite-ar 82/87
Exhibit 21.1
SUBSIDIARIES OF THE REGISTRANT
Subsidiary name Jurisdiction of incorporation / formation
LightCMS LLC Oklahoma
NetSuite Australia Pty. Ltd. Australia
NetSuite Canada Inc. Canada
NetSuite Hong Kong Limited Hong Kong
NetSuite K.K. Japan
NetSuite (Philippines) Inc. Philippines
NetSuite Software (Asia Pacific) Pte. Ltd. Singapore
NetSuite Spain, S.L. Spain
NetSuite UK Limited United Kingdom
Order Motion, Inc. Delaware
OrderMotion, Inc. New York
NetSuite Czech Republic s.r.o Czech Republic
Raferil S.A. Uruguay
SavinWest S.A. Uruguay
Tribe HR Corp. Canada
`

8/10/2019 Net Suite AR
http://slidepdf.com/reader/full/net-suite-ar 83/87
Exhibit 23.1
Consent of Independent Registered Public Accounting Firm
The Board of Directors
NetSuite Inc.:
We consent to the incorporation by reference in the registration statements (Nos. 333-193964, 333-186972, 333-179467, 333-172245, 333-164864, 333-
157307, 333-153039, and 333-148290) on Form S-8 of NetSuite Inc. of our report dated February 28, 2014, with respect to the consolidated balance sheets of
NetSuite Inc. and subsidiaries as of December 31, 2013 and 2012, and the related consolidated statements of comprehensive loss, total equity, and cash flows
for each of the years in the three-year period ended December 31, 2013, the related financial statement schedule, and the effectiveness of internal control over
financial reporting as of December 31, 2013, which report appears in the December 31, 2013 Annual Report on Form 10-K of NetSuite Inc.
/s/KPMG LLP
Santa Clara, California
February 28, 2014

8/10/2019 Net Suite AR
http://slidepdf.com/reader/full/net-suite-ar 84/87
Exhibit 31.1
CERTIFICATION PURSUANT TO RULE 13a-14(a) OR 15d-14(a) OF
THE SECURITIES EXCHANGE ACT OF 1934,
AS ADOPTED PURSUANT TO SECTION 302 OF
THE SARBANES-OXLEY ACT OF 2002
I, Zachary Nelson, certify that:
1. I have reviewed this Annual Report on Form 10-K of NetSuite Inc.;
2. Based on my knowledge, this report does not contain any untrue statement of a material fact or omit to state a material fact necessary to make the
statements made, in light of the circumstances under which such statements were made, not misleading with respect to the period covered by this report;
3. Based on my knowledge, the financial statements, and other financial information included in this report, fairly present in all material respects the
financial condition, results of operations and cash flows of the registrant as of, and for, the periods presented in this report;
4. The registrant’s other certifying officer and I are responsible for establishing and maintaining disclosure controls and procedures (as defined in
Exchange Act Rules 13a-15(e) and 15d-15(e)) and internal control over financial reporting (as defined in Exchange Act Rules 13a-15(f) and 15d-15(f)) for the
registrant and have:
a) Designed such disclosure controls and procedures, or caused such disclosure controls and procedures to be designed under our supervision,
to ensure that material information relating to the registrant, including its consolidated subsidiaries, is made known to us by others within those entities,
particularly during the period in which this report is being prepared;
b) Designed such internal control over financial reporting, or caused such internal control over financial reporting to be designed under our
supervision, to provide reasonable assurance regarding the reliability of financial reporting and the preparation of financial statements for external purposes in accordance with generally accepted accounting principles;
c) Evaluated the effectiveness of the registrant’s disclosure controls and procedures and presented in this report our conclusions about the
effectiveness of the disclosure controls and procedures, as of the end of the period covered by this report based on such evaluation; and
d) Disclosed in this report any change in the registrant’s internal control over financial reporting that occurred during the registrant’s most recent
fiscal quarter (the registrant’s fourth fiscal quarter in the case of an annual report) that has materially affected, or is reasonably likely to materially affect,
the registrant’s internal control over financial reporting; and
5. The registrant’s other certifying officer and I have disclosed, based on our most recent evaluation of internal control over financial reporting, to the
registrant’s auditors and the audit committee of the registrant’s board of directors (or persons performing the equivalent functions):
a) All significant deficiencies and material weaknesses in the design or operation of internal control over financial reporting which are reasonably
likely to adversely affect the registrant’s ability to record, process, summarize and report financial information; and
b) Any fraud, whether or not material, that involves management or other employees who have a significant role in the registrant’s internal
control over financial reporting.
Date: March 3, 2014 By: /s/ Zachary Nelson
Zachary Nelson
President and Chief Executive Officer
(Principal Executive Officer)
8/10/2019 Net Suite AR
http://slidepdf.com/reader/full/net-suite-ar 85/87

8/10/2019 Net Suite AR
http://slidepdf.com/reader/full/net-suite-ar 86/87
Exhibit 32.1
CERTIFICATION OF CHIEF EXECUTIVE OFFICER AND CHIEF FINANCIAL OFFICER
PURSUANT TO
18 U.S.C. SECTION 1350,
AS ADOPTED PURSUANT TO
SECTION 906 OF THE SARBANES-OXLEY ACT OF 2002
In connection with the Annual Report on Form 10-K of NetSuite Inc. for the year ended December 31, 2013 , as filed with the Securities and Exchange
Commission on the date hereof (the "Report"), Zachary Nelson, as Chief Executive Officer of NetSuite Inc., hereby certifies, pursuant to 18 U.S.C.Section 1350, as adopted pursuant to Section 906 of the Sarbanes-Oxley Act of 2002, that, to the best of his knowledge, the Report fully complies with the
requirements of Section 13(a) or 15(d) of the Securities Exchange Act of 1934, and the information contained in the Report fairly presents, in all material
respects, the financial condition and results of operations of NetSuite Inc.
Date: March 3, 2014 By: /s/ Zachary Nelson
Zachary Nelson
President and Chief Executive Officer
(Principal Executive Officer)
In connection with the Annual Report on Form 10-K of NetSuite Inc. for the year ended December 31, 2013 , as filed with the Securities and Exchange
Commission on the date hereof (the "Report"), Ronald Gill, as Chief Financial Officer of NetSuite Inc., hereby certifies, pursuant to 18 U.S.C. Section 1350,
as adopted pursuant to Section 906 of the Sarbanes-Oxley Act of 2002, that, to the best of his knowledge, the Report fully complies with the requirements of
Section 13(a) or 15(d) of the Securities Exchange Act of 1934, and the information contained in the Report fairly presents, in all material respects, the
financial condition and results of operations of NetSuite Inc.
Date: March 3, 2014 By: /s/ Ronald Gill
Ronald Gill
Chief Financial Officer
(Principal Financial Officer)

8/10/2019 Net Suite AR
http://slidepdf.com/reader/full/net-suite-ar 87/87


![Users manual mx suite [nl]](https://static.fdocuments.nl/doc/165x107/5482def1b07959600c8b48da/users-manual-mx-suite-nl.jpg)