Nascholing Diëtisten Netwerk Nutrition et Sante 4 October 2014 Wim H.M. Saris Nutrition Research...
53
Nascholing Diëtisten Netwerk Nutrition et Sante 4 October 2014 Wim H.M. Saris Nutrition Research Institute NUTRIM Faculty of Health, Medicine and Life Science Maastricht University The Netherlands
-
Upload
melvyn-mccarthy -
Category
Documents
-
view
218 -
download
4
Transcript of Nascholing Diëtisten Netwerk Nutrition et Sante 4 October 2014 Wim H.M. Saris Nutrition Research...

Nascholing Diëtisten Netwerk
Nutrition et Sante4 October 2014
Wim H.M. SarisNutrition Research Institute NUTRIM
Faculty of Health, Medicine and Life ScienceMaastricht University
The Netherlands
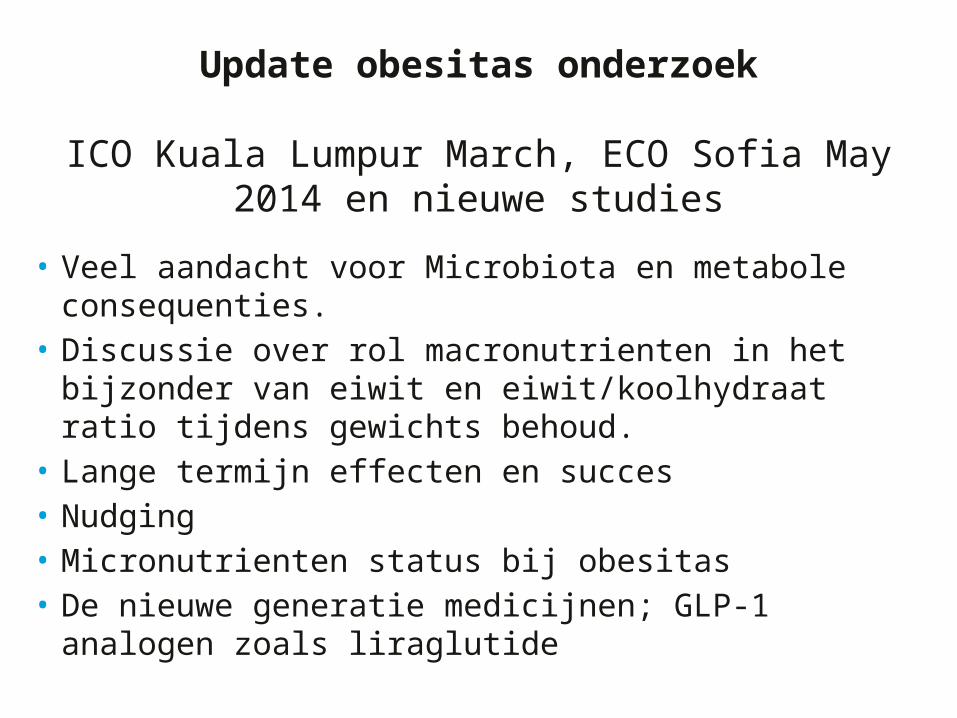
• Veel aandacht voor Microbiota en metabole consequenties.
• Discussie over rol macronutrienten in het bijzonder van eiwit en eiwit/koolhydraat ratio tijdens gewichts behoud.
• Lange termijn effecten en succes• Nudging• Micronutrienten status bij obesitas• De nieuwe generatie medicijnen; GLP-1 analogen
zoals liraglutide
Update obesitas onderzoek
ICO Kuala Lumpur March, ECO Sofia May 2014 en nieuwe studies
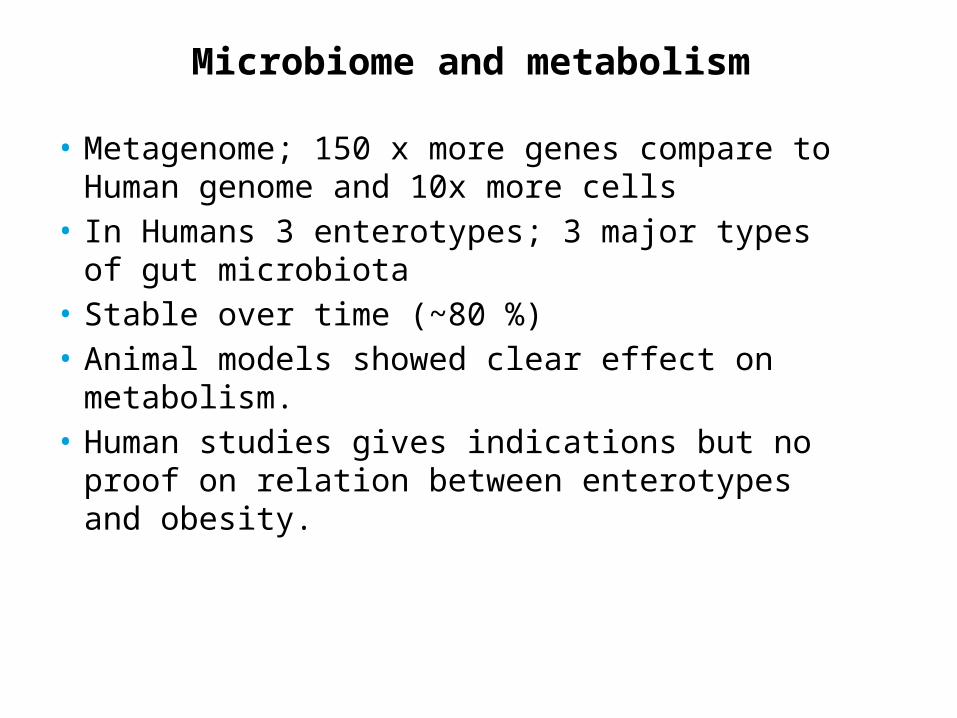
Microbiome and metabolism
• Metagenome; 150 x more genes compare to Human genome and 10x more cells
• In Humans 3 enterotypes; 3 major types of gut microbiota
• Stable over time (~80 %)• Animal models showed clear effect on
metabolism.• Human studies gives indications but no proof
on relation between enterotypes and obesity.
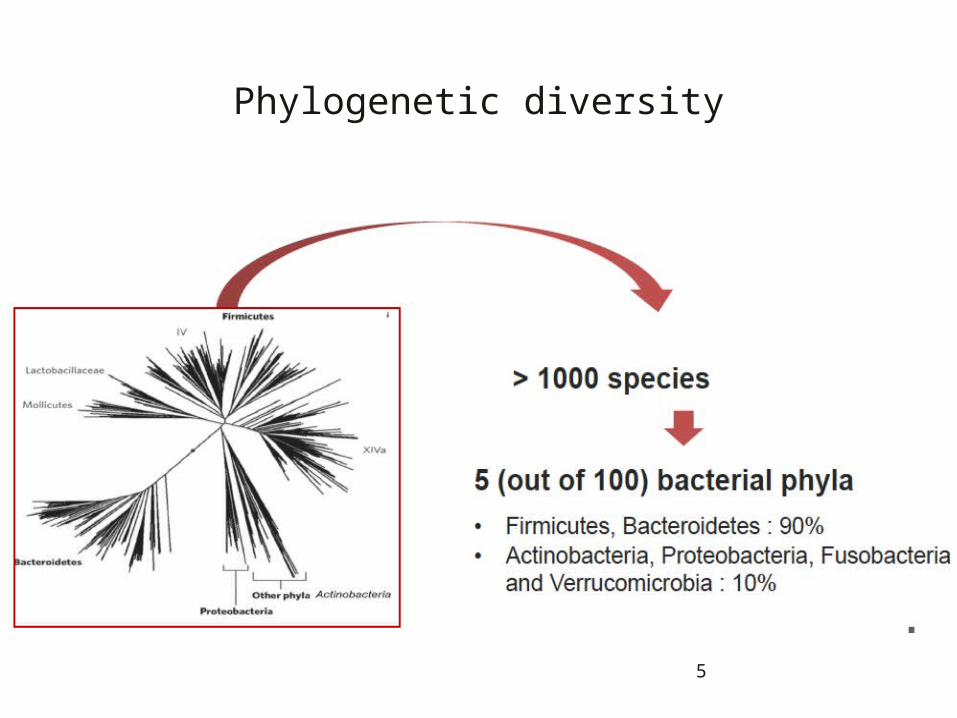
Phylogenetic diversity
5
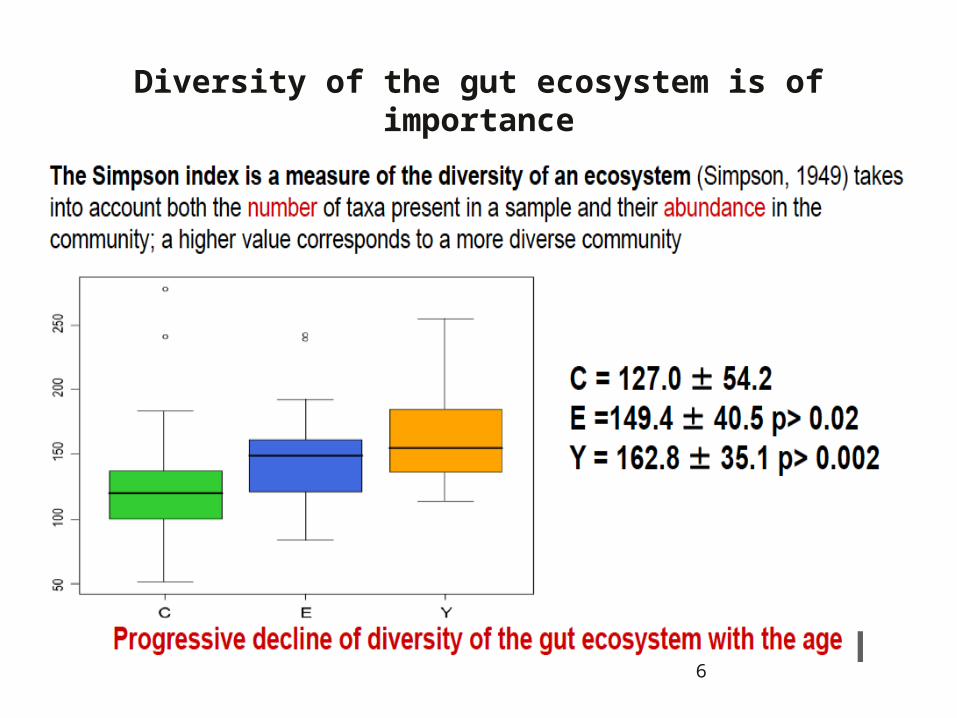
Diversity of the gut ecosystem is of importance
6
7
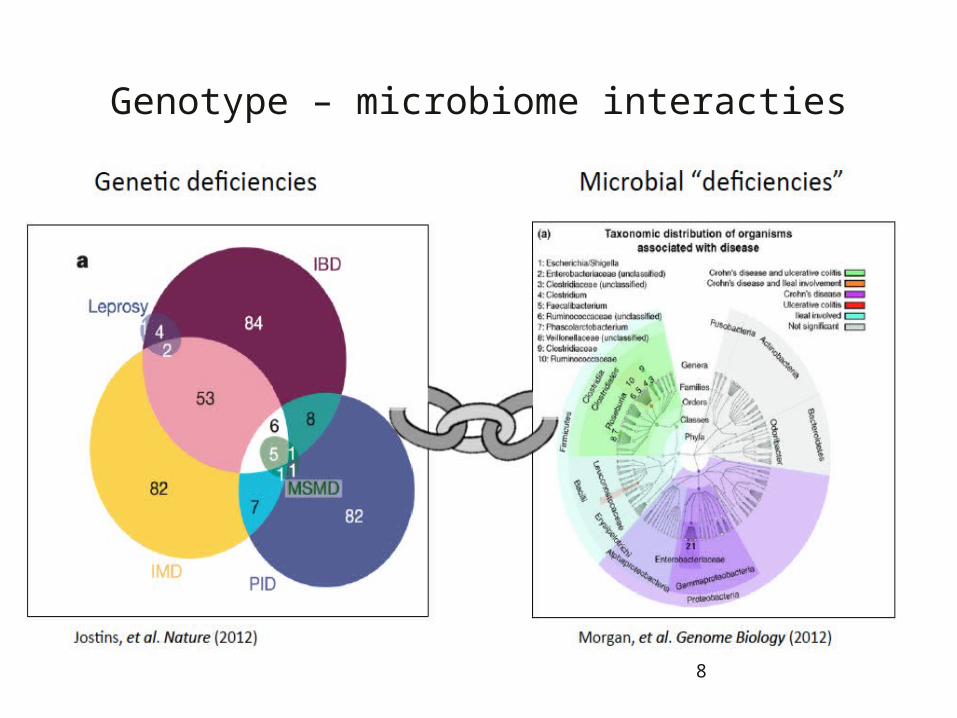
Genotype – microbiome interacties
8
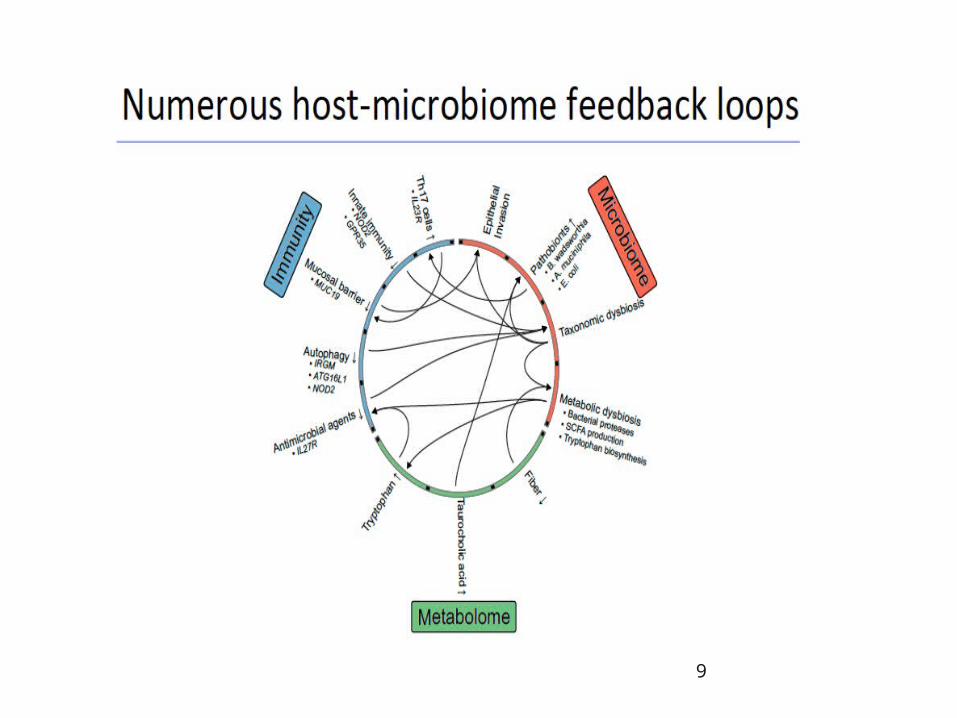
9
10
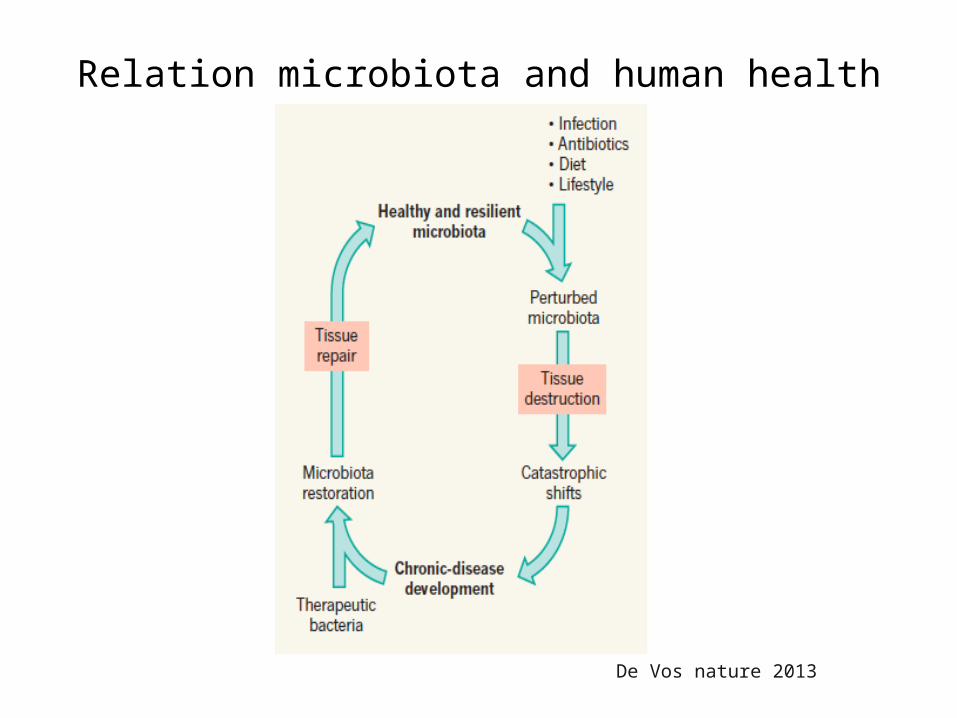
Relation microbiota and human health
De Vos nature 2013
12
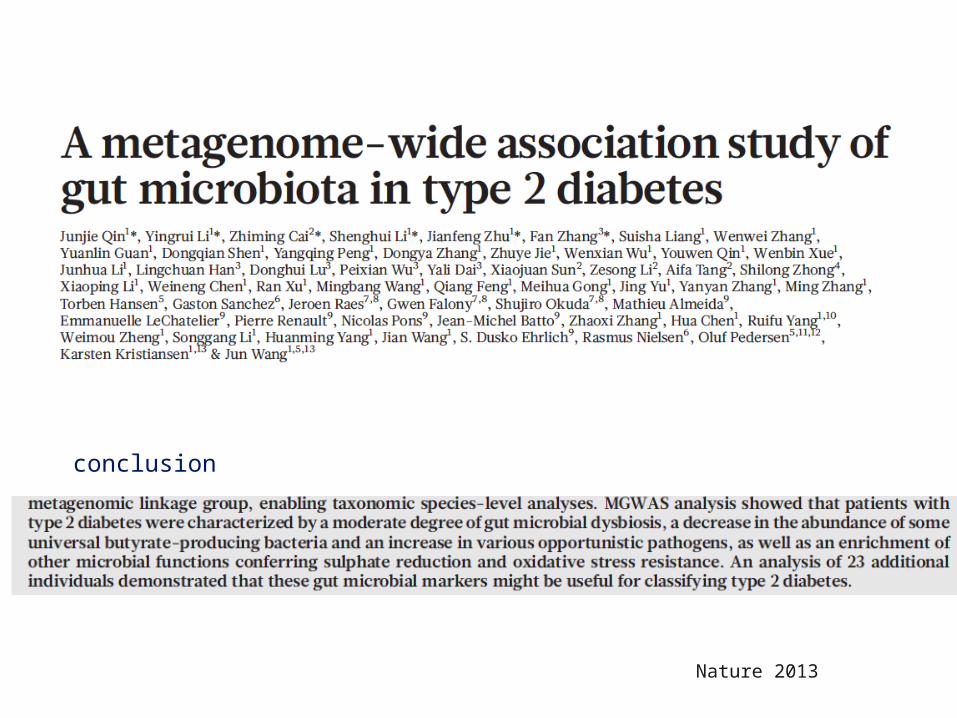
Nature 2013
conclusion
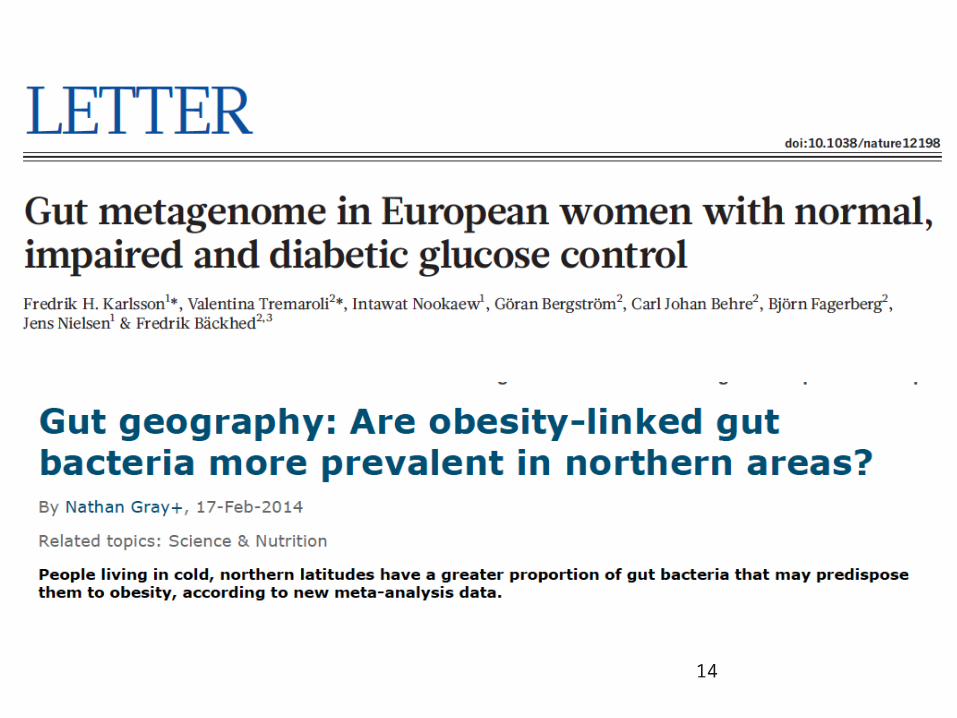
14
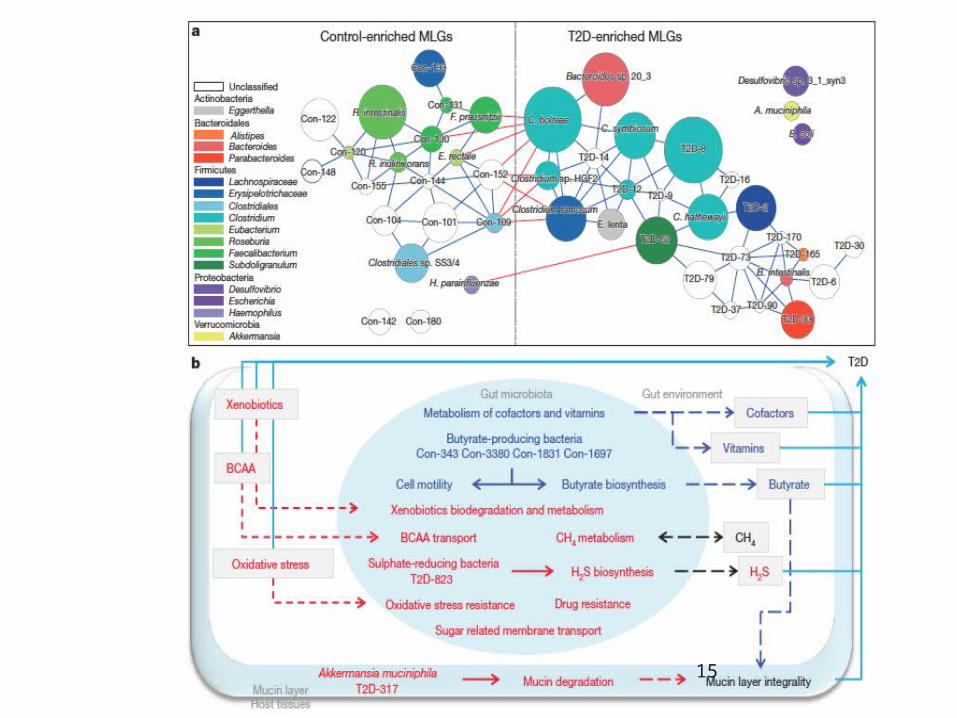
15
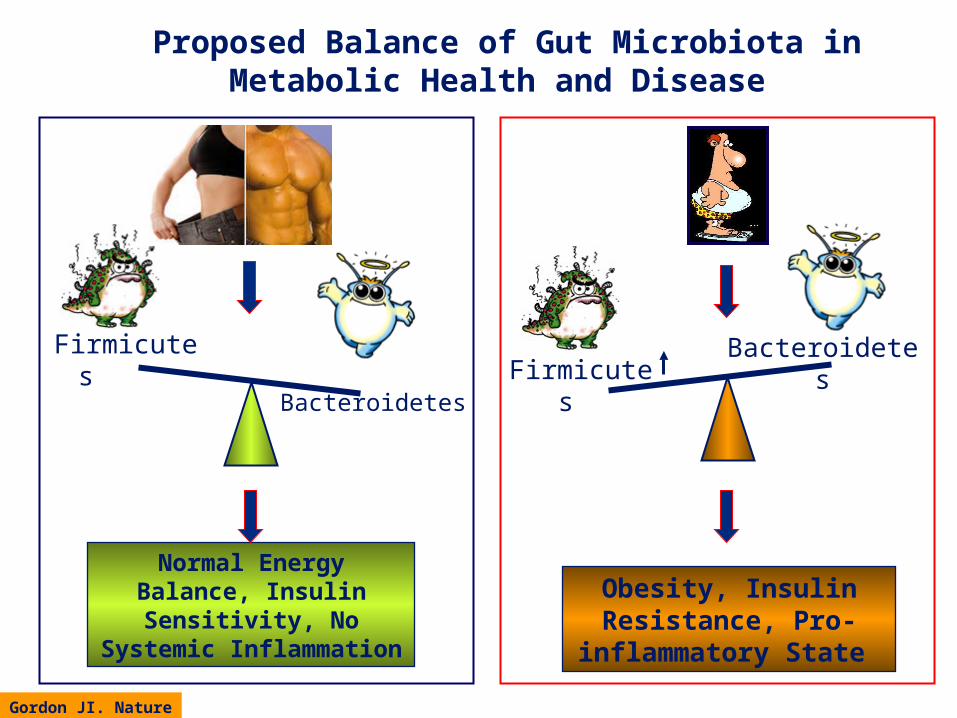
Proposed Balance of Gut Microbiota in Metabolic Health and Disease
BacteroidetesFirmicutes
Normal Energy Balance, Insulin Sensitivity, No
Systemic Inflammation
Gordon JI. Nature
Firmicutes Bacteroidetes
Obesity, Insulin Resistance, Pro-
inflammatory State
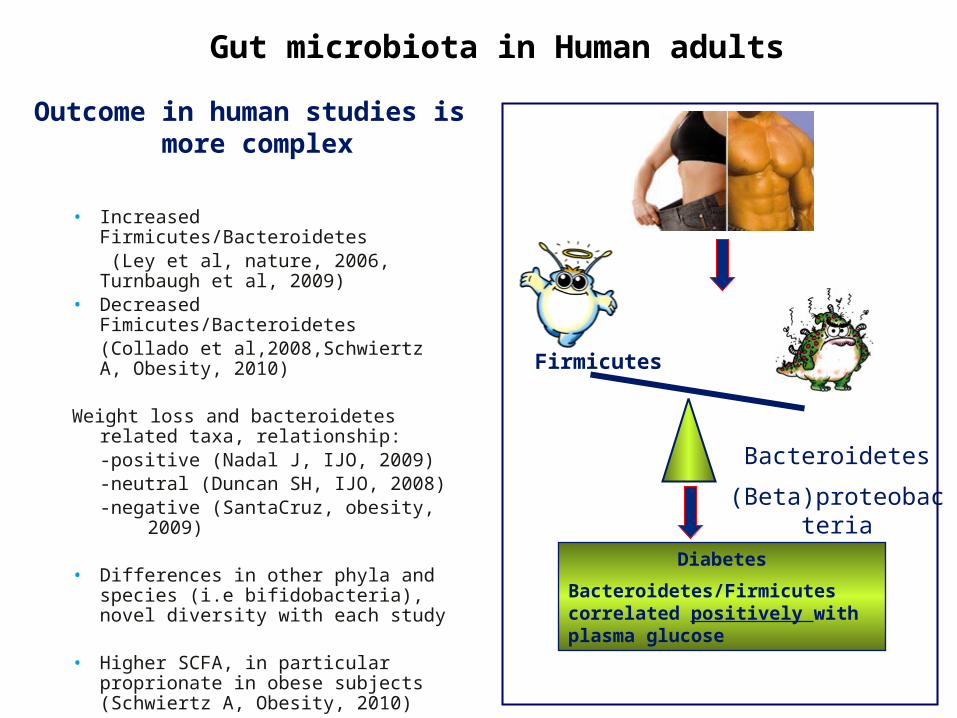
Gut microbiota in Human adults
Bacteroidetes
(Beta)proteobacteria
Firmicutes
Diabetes
Bacteroidetes/Firmicutes correlated positively with plasma glucose
• Increased Firmicutes/Bacteroidetes (Ley et al, nature, 2006, Turnbaugh et al, 2009)
• Decreased Fimicutes/Bacteroidetes(Collado et al,2008,Schwiertz A, Obesity, 2010)
Weight loss and bacteroidetes related taxa, relationship:-positive (Nadal J, IJO, 2009)-neutral (Duncan SH, IJO, 2008)-negative (SantaCruz, obesity,
2009)
• Differences in other phyla and species (i.e bifidobacteria), novel diversity with each study
• Higher SCFA, in particular proprionate in obese subjects (Schwiertz A, Obesity, 2010)
Outcome in human studies is more complex
18
-30
-25
-20
-15
-10
-5
0
5
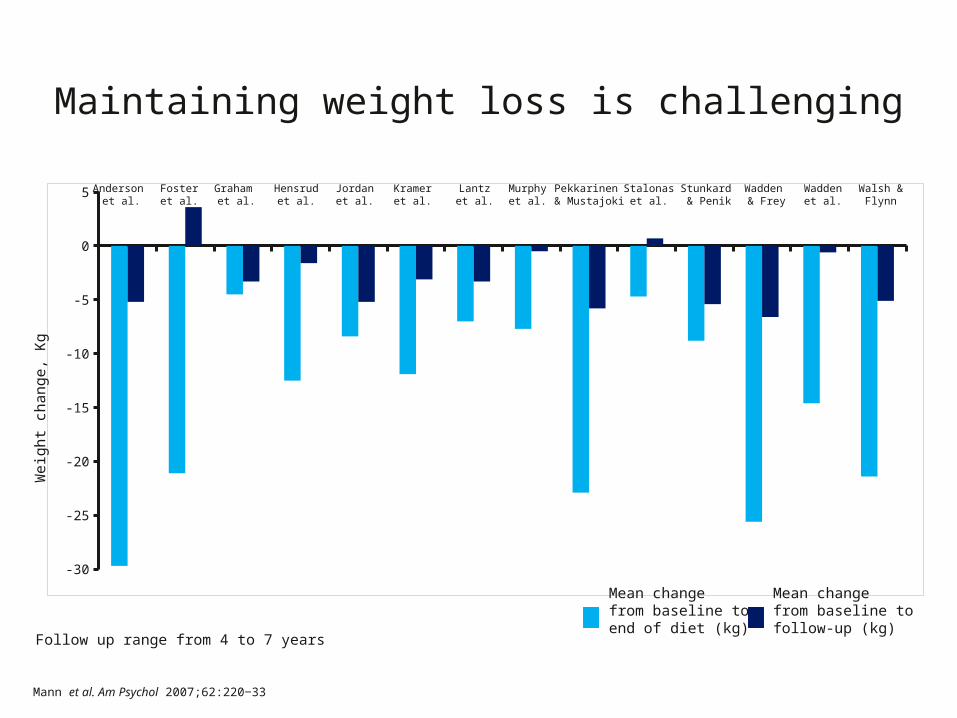
Maintaining weight loss is challenging
Mann et al. Am Psychol 2007;62:220‒33
Weig
ht
change, K
g
Mean changefrom baseline toend of diet (kg)
Mean changefrom baseline tofollow-up (kg)
Follow up range from 4 to 7 years
Anderson et al.
Fosteret al.
Graham et al.
Hensrudet al.
Jordanet al.
Krameret al.
Lantzet al.
Murphyet al.
Stalonaset al.
Waddenet al.
Walsh &Flynn
Wadden & Frey
Pekkarinen & Mustajoki
Stunkard & Penik
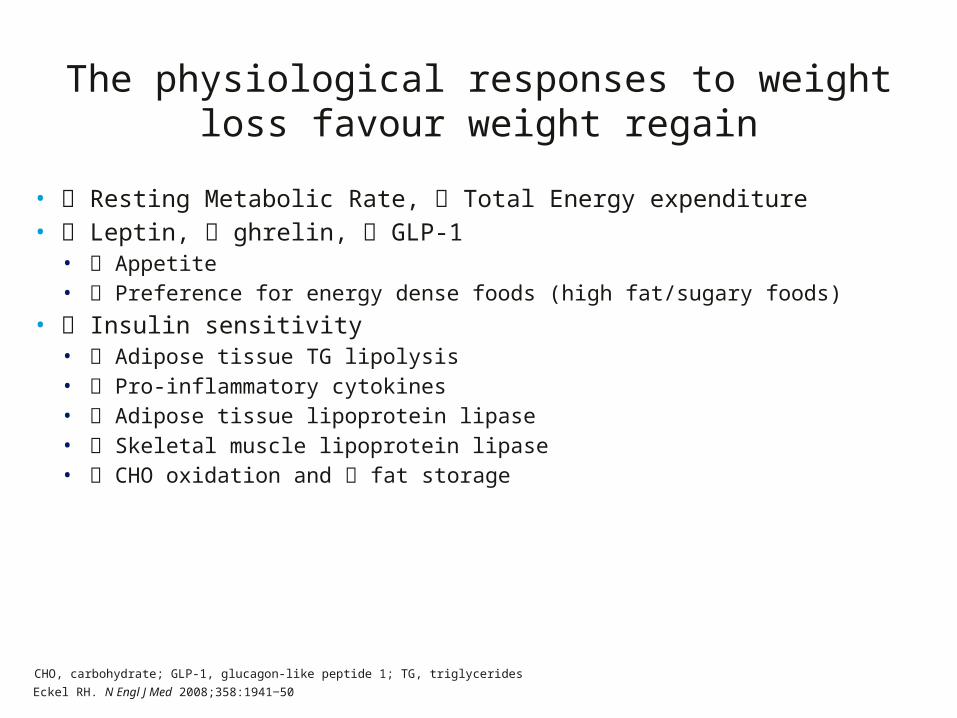
• Resting Metabolic Rate, Total Energy expenditure • Leptin, ghrelin, GLP-1
• Appetite• Preference for energy dense foods (high fat/sugary foods)
• Insulin sensitivity• Adipose tissue TG lipolysis• Pro-inflammatory cytokines• Adipose tissue lipoprotein lipase• Skeletal muscle lipoprotein lipase• CHO oxidation and fat storage
The physiological responses to weight loss favour weight regain
Eckel RH. N Engl J Med 2008;358:1941‒50
CHO, carbohydrate; GLP-1, glucagon-like peptide 1; TG, triglycerides
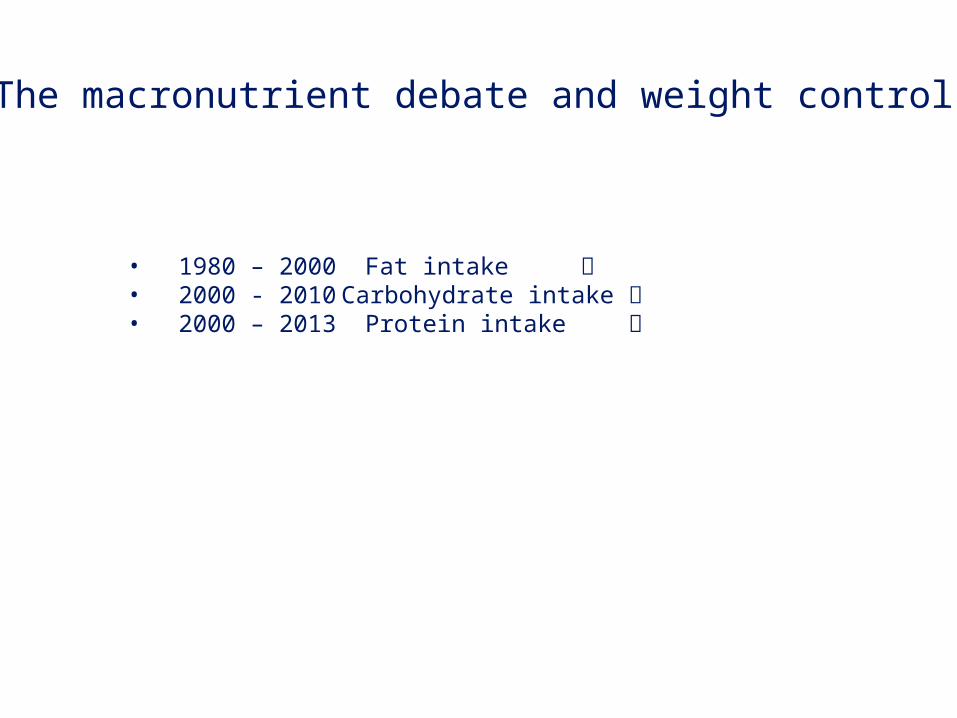
The macronutrient debate and weight control
• 1980 – 2000 Fat intake • 2000 - 2010 Carbohydrate intake • 2000 – 2013 Protein intake
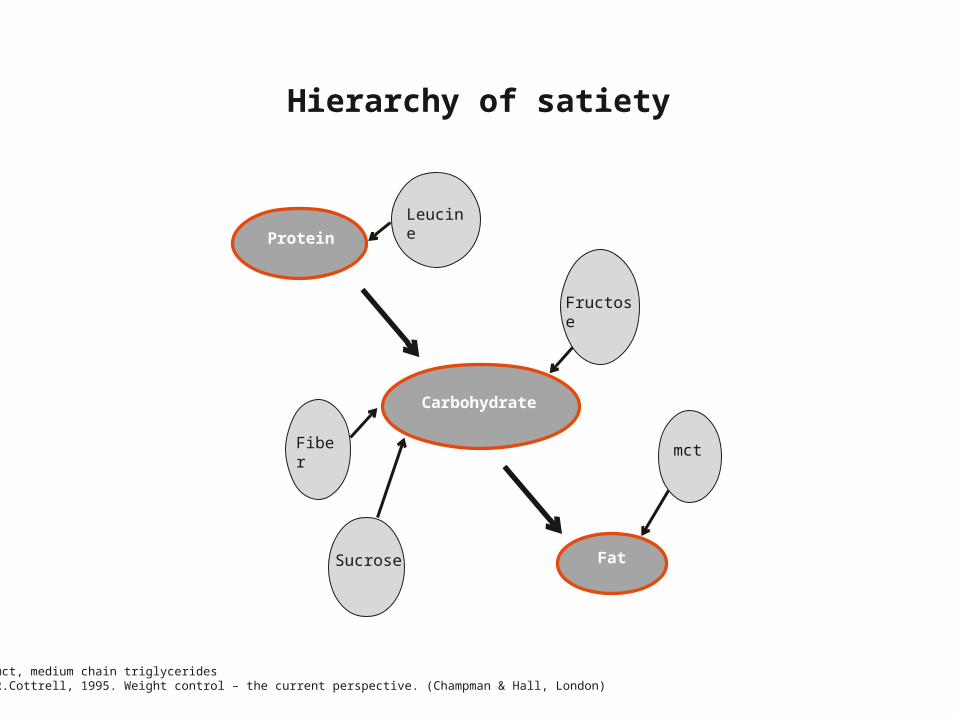
Hierarchy of satiety
mct, medium chain triglycerides R.Cottrell, 1995. Weight control – the current perspective. (Champman & Hall, London)
Leucine
Fructose
mct
Sucrose
Fiber
Protein
Carbohydrate
Fat
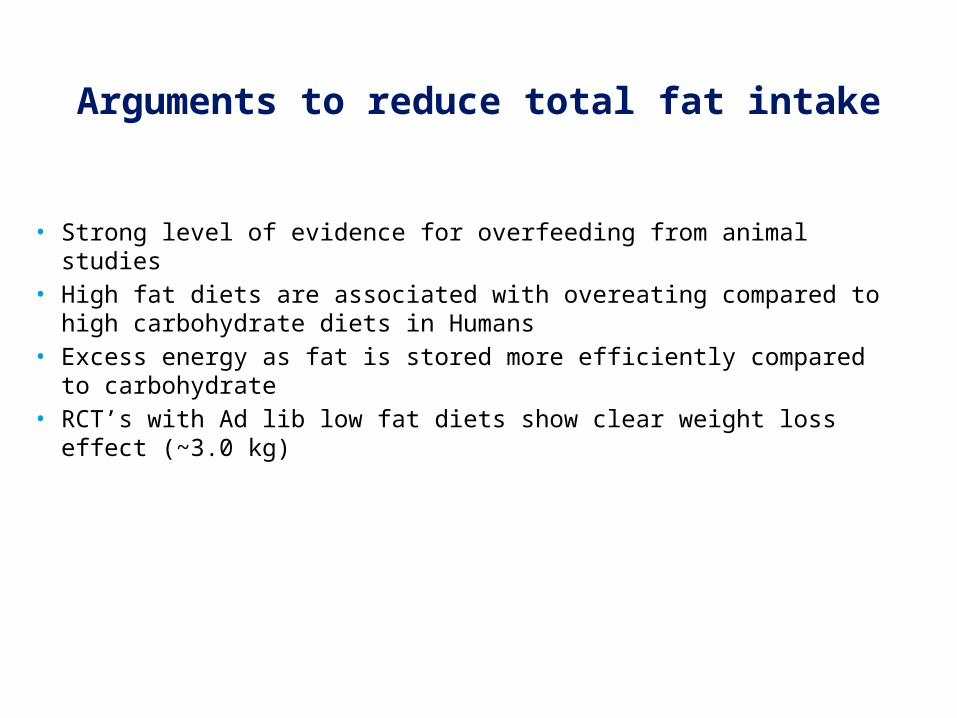
Arguments to reduce total fat intake
• Strong level of evidence for overfeeding from animal studies• High fat diets are associated with overeating compared to high
carbohydrate diets in Humans• Excess energy as fat is stored more efficiently compared to
carbohydrate• RCT’s with Ad lib low fat diets show clear weight loss effect (~3.0 kg)
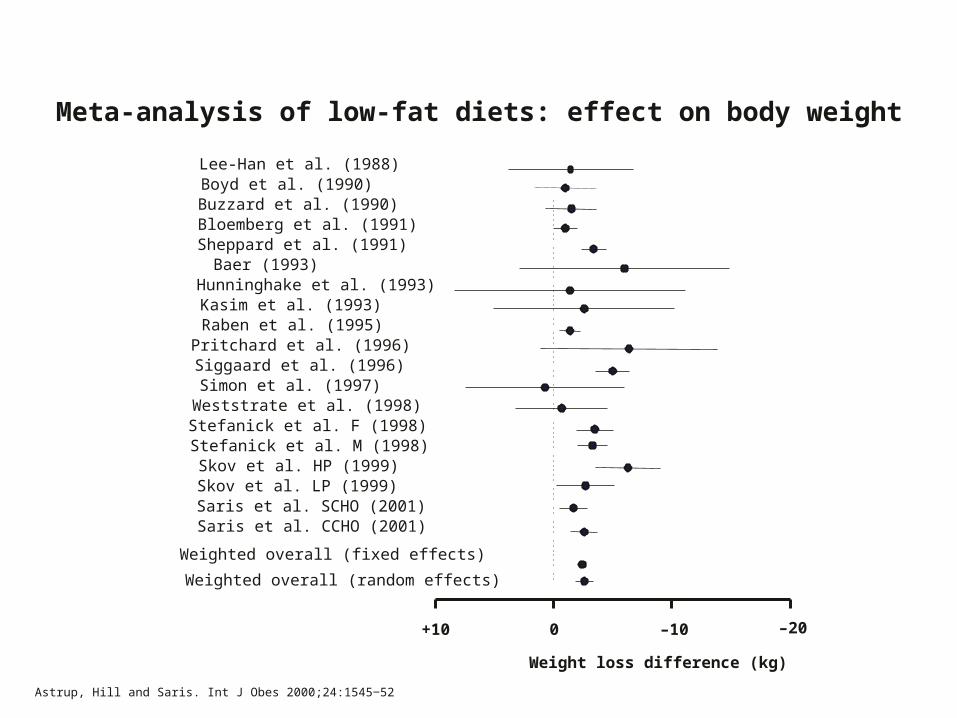
Weight loss difference (kg)
+10 0 –10 –20
Saris et al. CCHO (2001)Saris et al. SCHO (2001)Skov et al. LP (1999)Skov et al. HP (1999)Stefanick et al. M (1998)Stefanick et al. F (1998)Weststrate et al. (1998)Simon et al. (1997)Siggaard et al. (1996)Pritchard et al. (1996)Raben et al. (1995)Kasim et al. (1993)Hunninghake et al. (1993)Baer (1993)Sheppard et al. (1991)Bloemberg et al. (1991)Buzzard et al. (1990)Boyd et al. (1990)Lee-Han et al. (1988)
Weighted overall (fixed effects)
Weighted overall (random effects)
Astrup, Hill and Saris. Int J Obes 2000;24:1545‒52
Meta-analysis of low-fat diets: effect on body weight
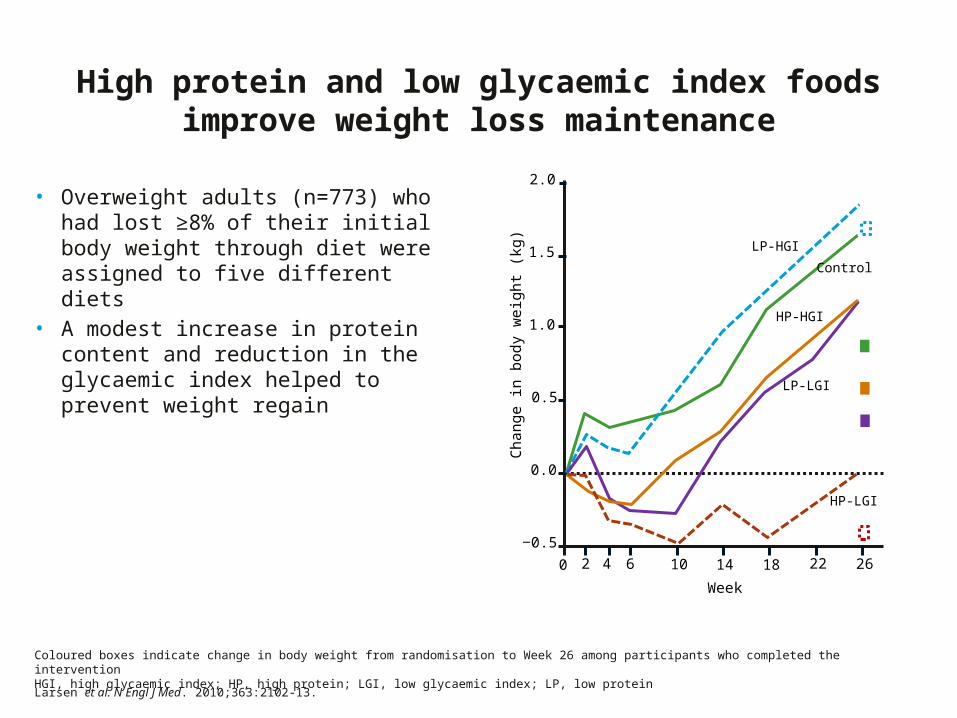
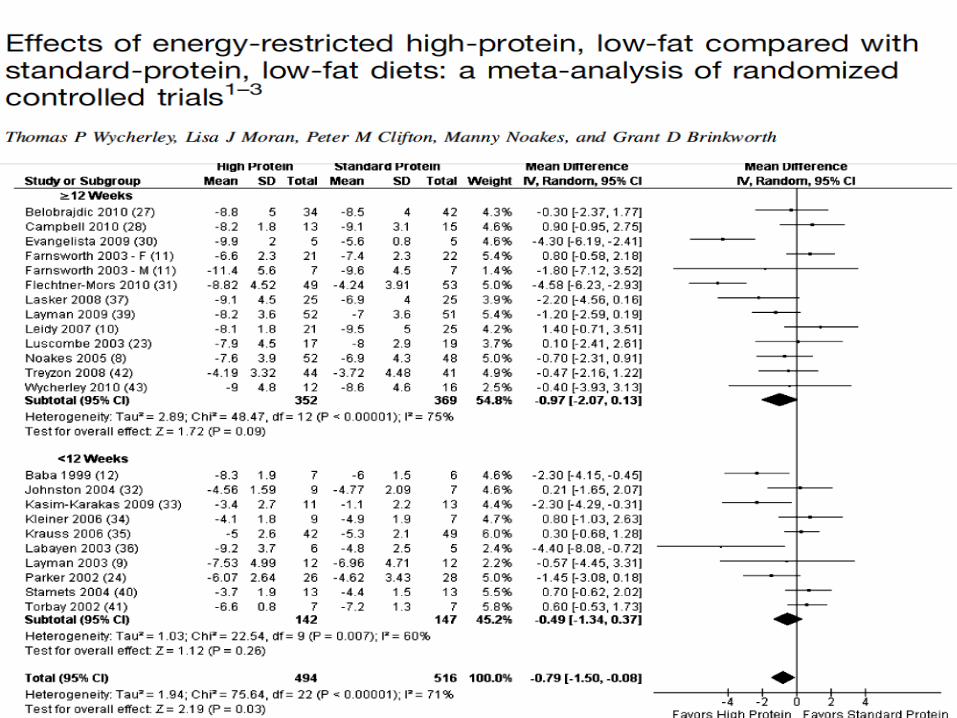
High protein and low glycaemic index foods improve weight loss maintenance
Larsen et al. N Engl J Med. 2010;363:2102-13.
• Overweight adults (n=773) who had lost ≥8% of their initial body weight through diet were assigned to five different diets
• A modest increase in protein content and reduction in the glycaemic index helped to prevent weight regain
Coloured boxes indicate change in body weight from randomisation to Week 26 among participants who completed the interventionHGI, high glycaemic index; HP, high protein; LGI, low glycaemic index; LP, low protein
2.0
1.5
1.0
0.5
0.0
‒0.5
0 102 4 6 14 18 22 26
Week
Chang
e in b
ody w
eig
ht
(kg)
LP-HGI
HP-HGI
Control
LP-LGI
HP-LGI
27
28

29

30
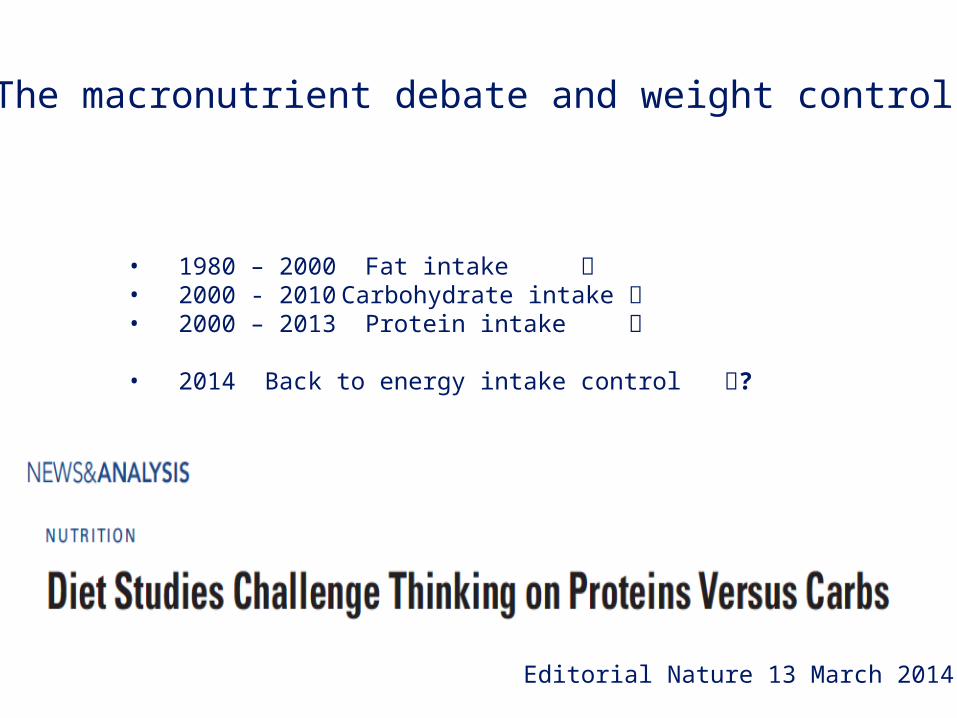
The macronutrient debate and weight control
• 1980 – 2000 Fat intake • 2000 - 2010 Carbohydrate intake • 2000 – 2013 Protein intake
• 2014 Back to energy intake control ?
Editorial Nature 13 March 2014
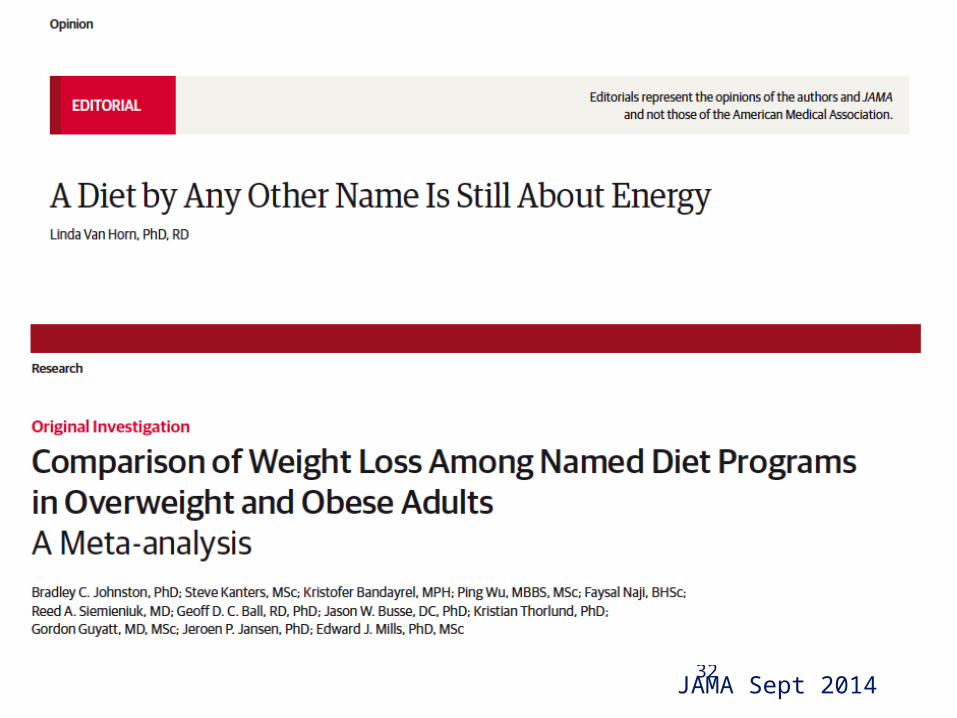
32JAMA Sept 2014
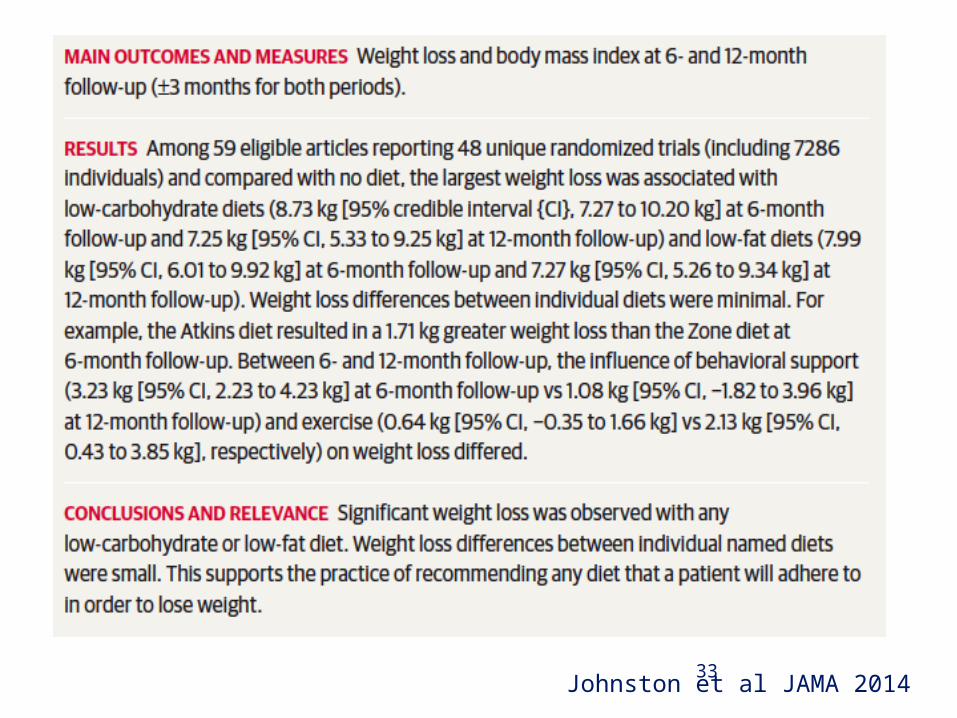
33Johnston et al JAMA 2014

Second law of thermodynamics
a calorie is still a calorie
- 600 Kcal deficit diet
• High fat diet (40 En% fat, 43 En% Carb)
• Low fat diet (25 En% fat, 57 En% Carb)
Petersen et al IJO 2005
Randomised, multi- centre trial of two hypo-energetic diets with different fat content in obese subjects
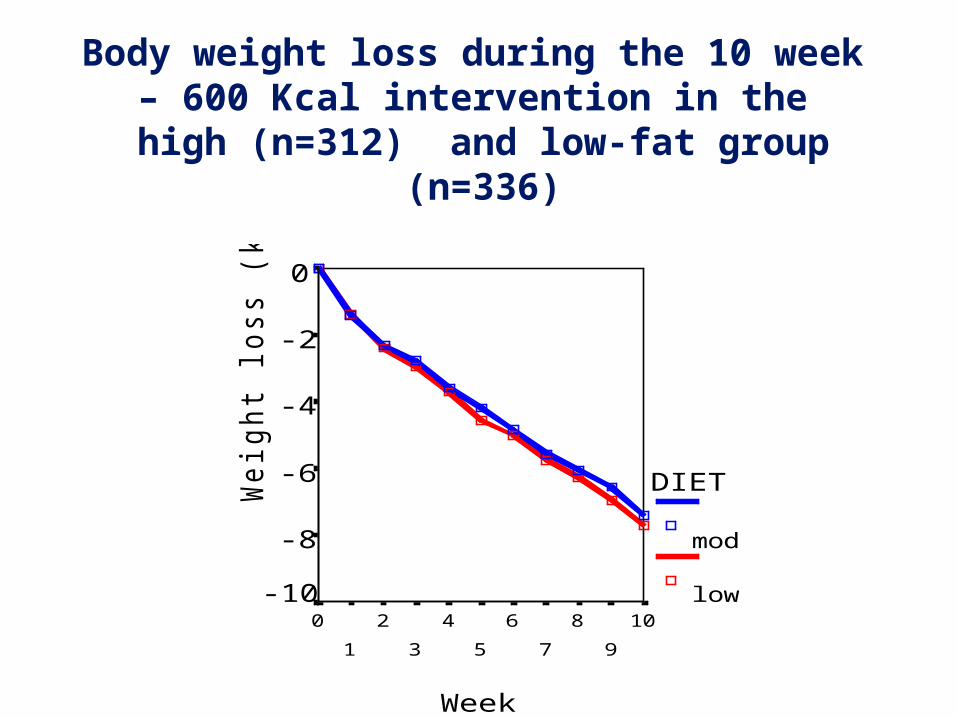
Body weight loss during the 10 week – 600 Kcal intervention in the
high (n=312) and low-fat group (n=336)
Week
10
9
8
7
6
5
4
3
2
1
0
Weig
ht
loss (
kg) 0
-2
-4
-6
-8
-10
DIET
mod
low
- 6.6 ± 0.2
-6..9 ± 0.2ns
36
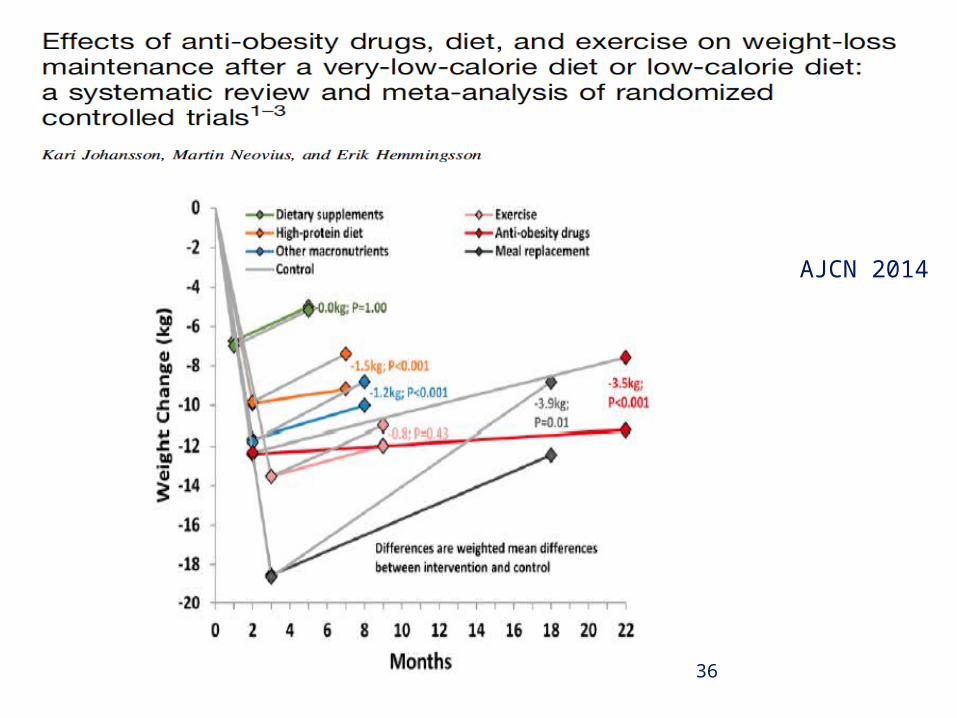
AJCN 2014
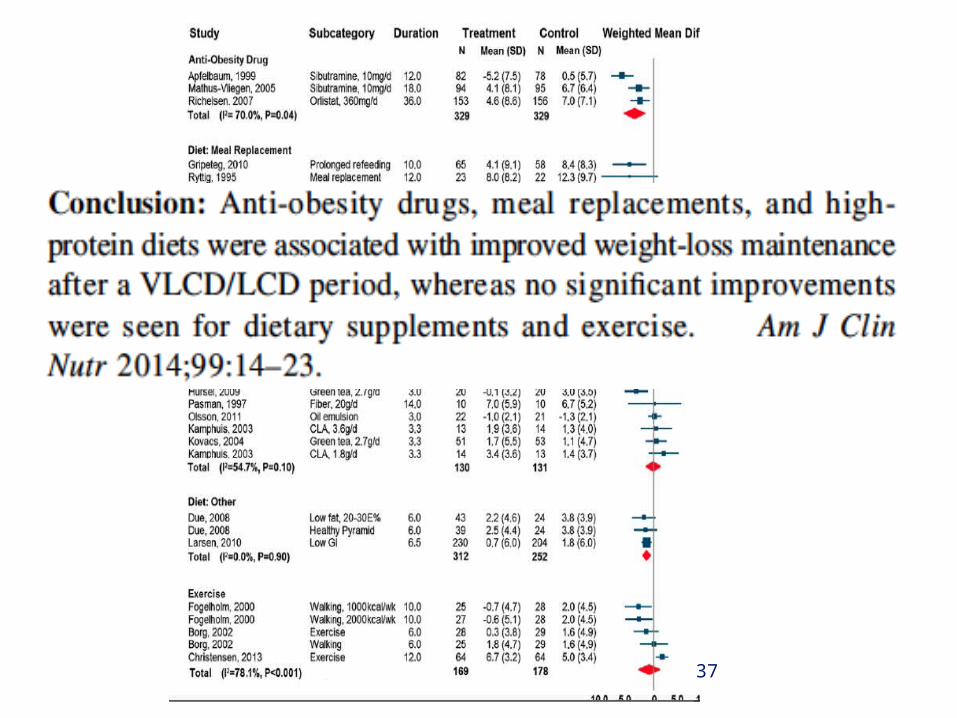
37
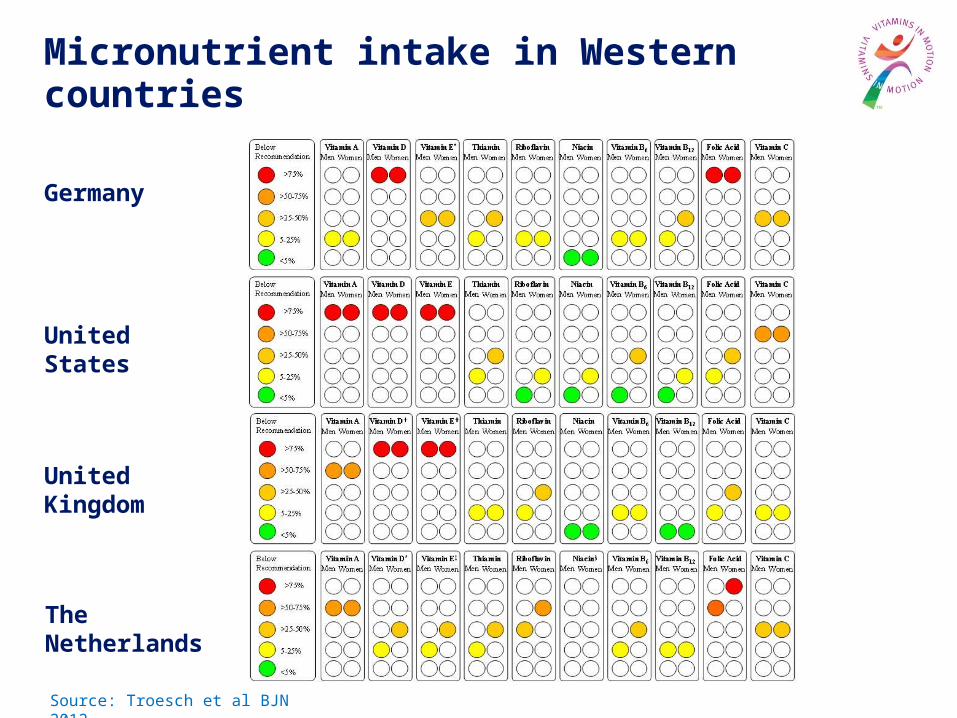
Germany
The Netherlands
United States
United Kingdom
Source: Troesch et al BJN 2012
Micronutrient intake in Western countries
39
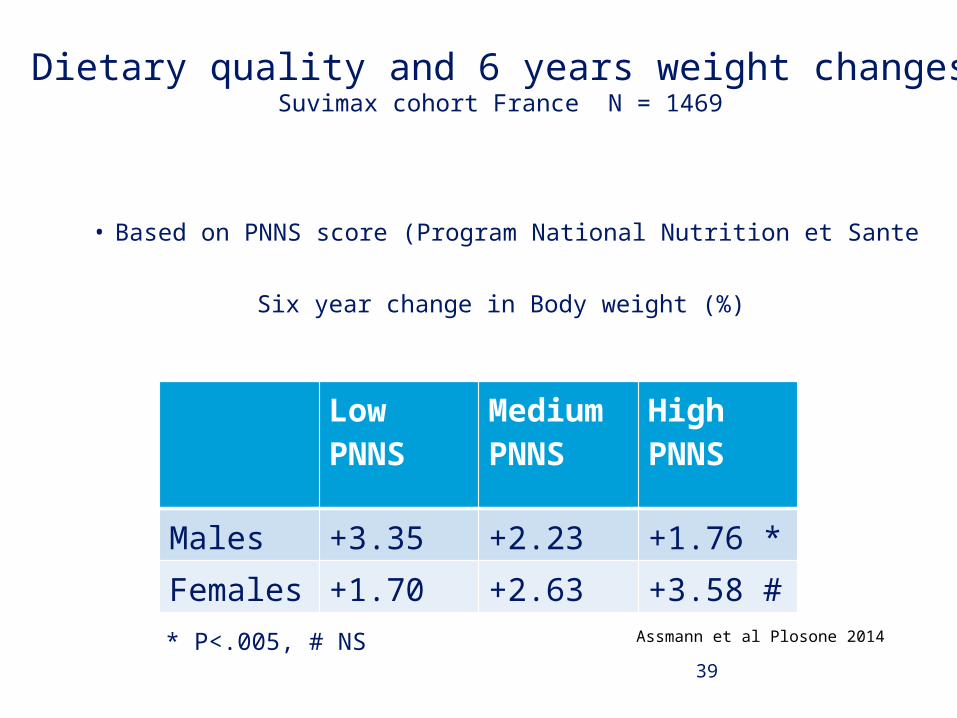
Dietary quality and 6 years weight changesSuvimax cohort France N = 1469
Assmann et al Plosone 2014
• Based on PNNS score (Program National Nutrition et Sante
Six year change in Body weight (%)
Low PNNS
Medium PNNS
HighPNNS
Males +3.35 +2.23 +1.76 *
Females +1.70 +2.63 +3.58 #
* P<.005, # NS
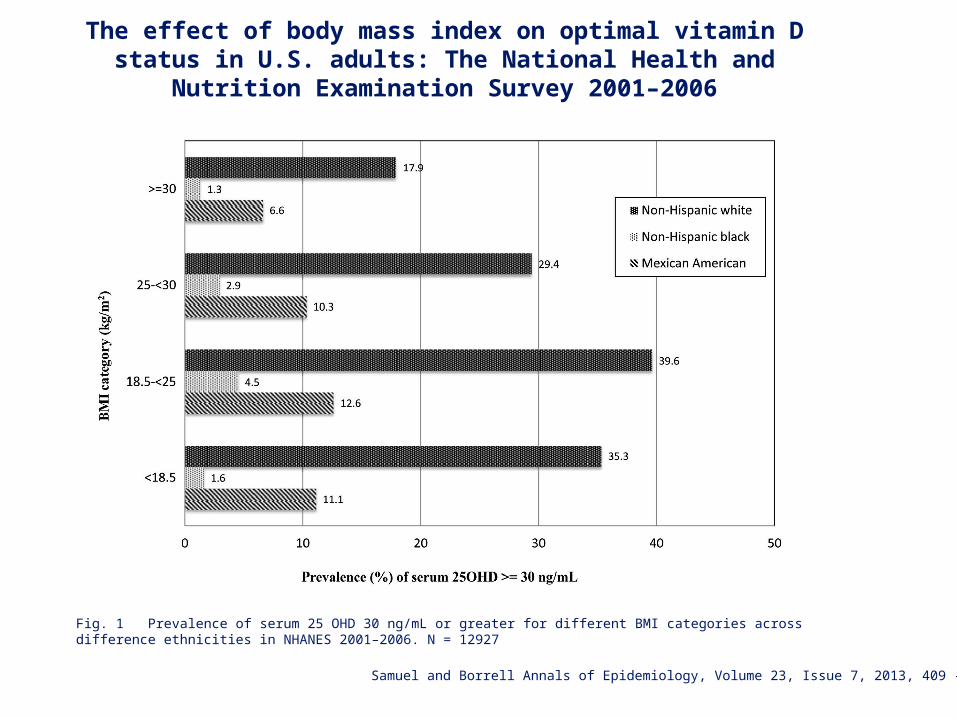
Fig. 1 Prevalence of serum 25 OHD 30 ng/mL or greater for different BMI categories across difference ethnicities in NHANES 2001–2006. N = 12927
Samuel and Borrell Annals of Epidemiology, Volume 23, Issue 7, 2013, 409 - 414
The effect of body mass index on optimal vitamin D status in U.S. adults: The National Health and Nutrition
Examination Survey 2001–2006
41
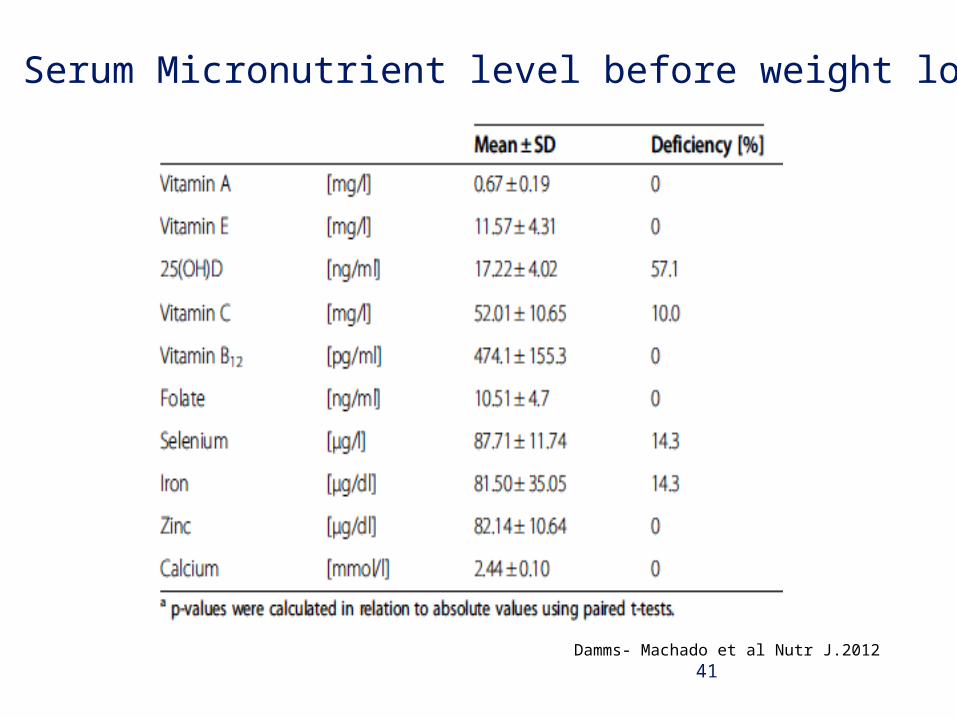
Serum Micronutrient level before weight loss
Damms- Machado et al Nutr J.2012
42
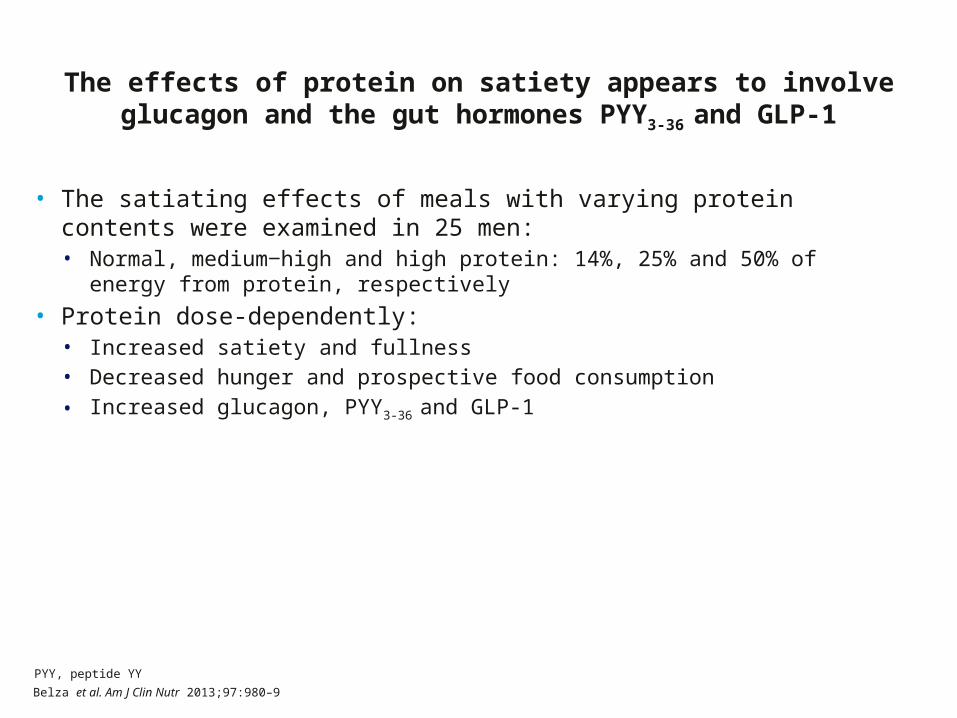
• The satiating effects of meals with varying protein contents were examined in 25 men:• Normal, medium‒high and high protein: 14%, 25% and 50% of energy from
protein, respectively
• Protein dose-dependently: • Increased satiety and fullness• Decreased hunger and prospective food consumption• Increased glucagon, PYY3-36 and GLP-1
The effects of protein on satiety appears to involve glucagon and the gut hormones PYY3-36 and GLP-1
Belza et al. Am J Clin Nutr 2013;97:980–9
PYY, peptide YY
30
70
4-h
VA
S s
ati
ety
(m
m) 60
50
40
20
10
0
0 30 60 90 120 150 180 210 240
Time (min)
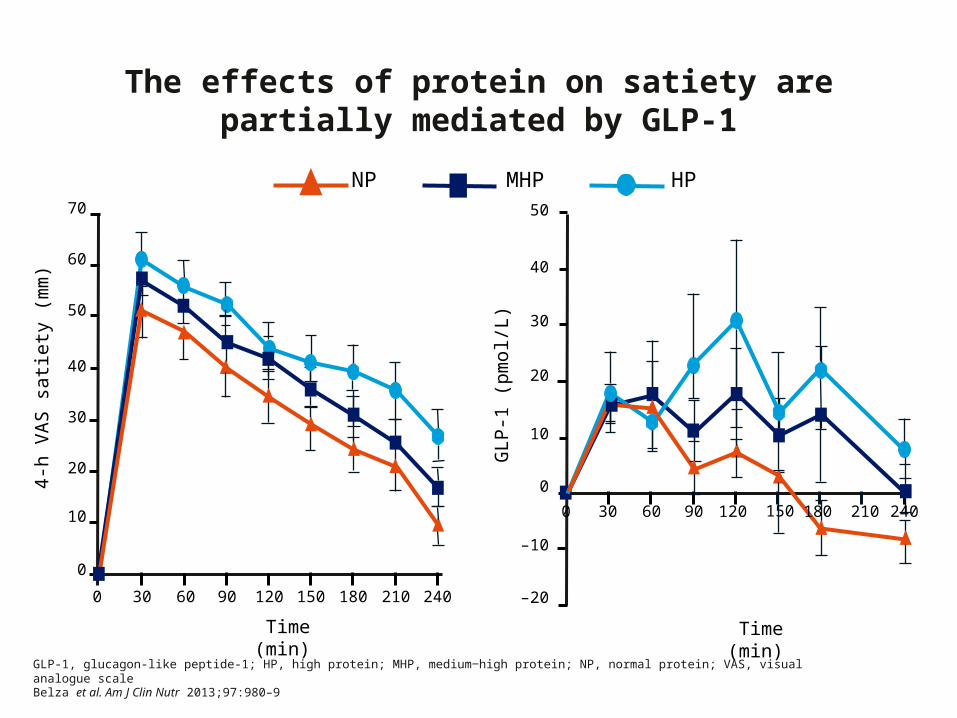
The effects of protein on satiety are partially mediated by GLP-1
GLP-1, glucagon-like peptide-1; HP, high protein; MHP, medium‒high protein; NP, normal protein; VAS, visual analogue scale
Belza et al. Am J Clin Nutr 2013;97:980–9
HPNP MHP50
40
30
20
10
0
–10
–20
GLP
-1 (
pm
ol/L)
Time (min)
150 2400 30 60 90 120 180 210
Series10
1000
2000
3000
4000
5000
3592
3004 3024
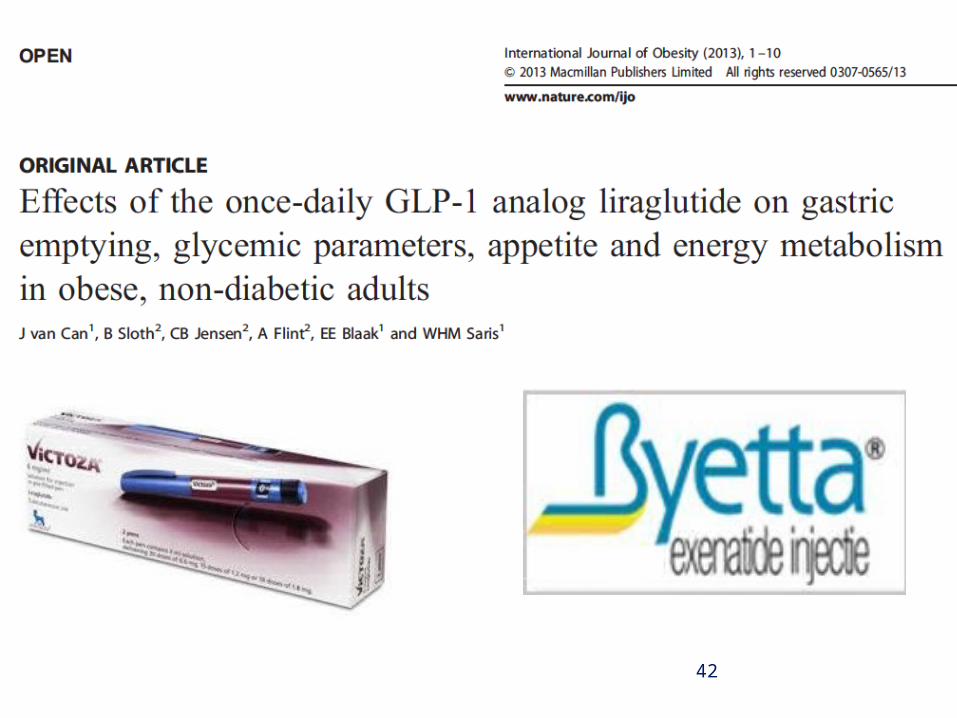
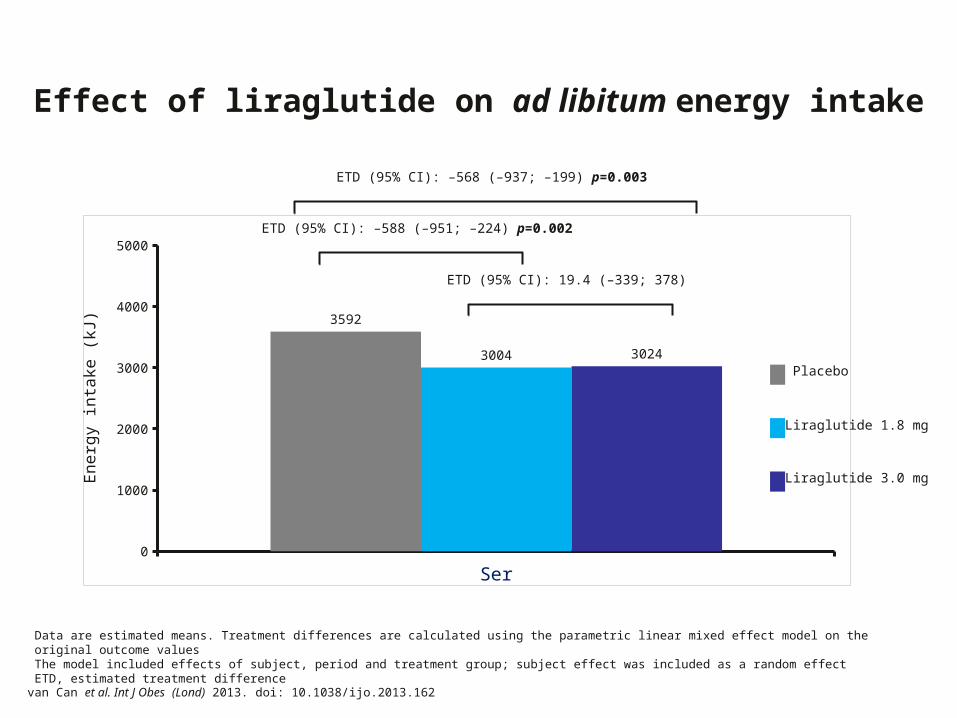
Effect of liraglutide on ad libitum energy intake
Data are estimated means. Treatment differences are calculated using the parametric linear mixed effect model on the original outcome values The model included effects of subject, period and treatment group; subject effect was included as a random effect ETD, estimated treatment difference
Energ
y inta
ke (
kJ)
ETD (95% CI): 19.4 (–339; 378)
ETD (95% CI): –588 (–951; –224) p=0.002
ETD (95% CI): –568 (–937; –199) p=0.003
Liraglutide 3.0 mg
Placebo
Liraglutide 1.8 mg
van Can et al. Int J Obes (Lond) 2013. doi: 10.1038/ijo.2013.162
Series10
250
500
750
492.9 478.3 468.8
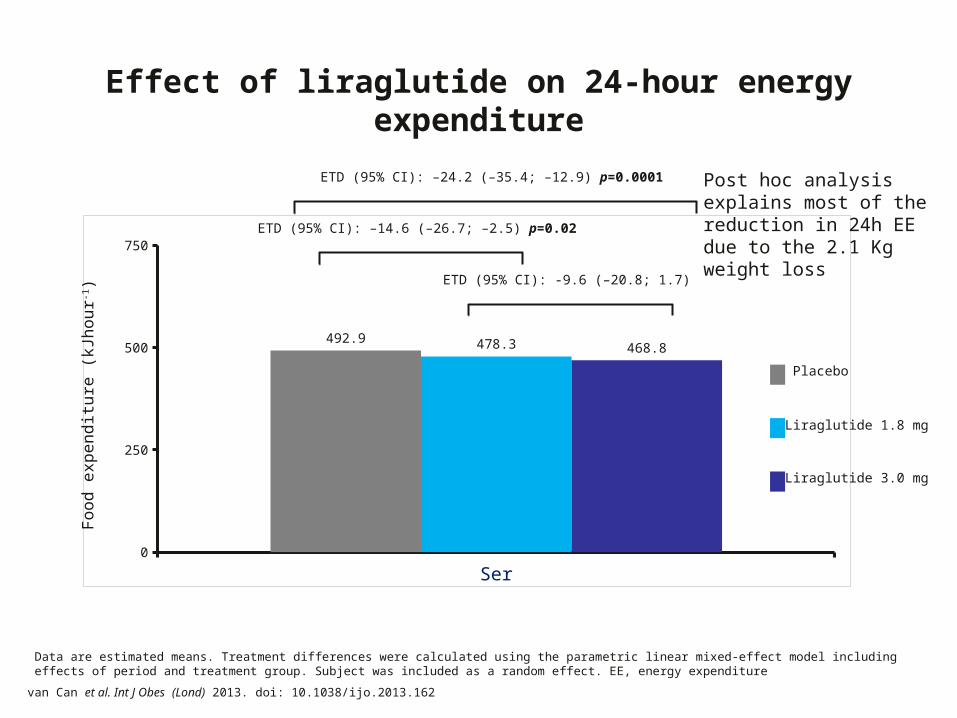
Effect of liraglutide on 24-hour energy expenditure
Data are estimated means. Treatment differences were calculated using the parametric linear mixed-effect model including effects of period and treatment group. Subject was included as a random effect. EE, energy expenditure
Food e
xpendit
ure
(kJh
our-
1)
ETD (95% CI): -9.6 (–20.8; 1.7)
ETD (95% CI): –14.6 (–26.7; –2.5) p=0.02
ETD (95% CI): –24.2 (–35.4; –12.9) p=0.0001 Post hoc analysisexplains most of thereduction in 24h EEdue to the 2.1 Kg weight loss
van Can et al. Int J Obes (Lond) 2013. doi: 10.1038/ijo.2013.162
Liraglutide 3.0 mg
Placebo
Liraglutide 1.8 mg
Schiphol

Nudge to nobesity
Change default choice
Middle vs. edge, spoon or plier

• Fluor toothpaste• Lowering salt, fat and sugar• Lowering trans fat• Adaptations in food ingredients to get a healthy logo
Big challenges for the food industry
Making the healthier choice the easy choice
‘Stealth’ changes without consumer notice
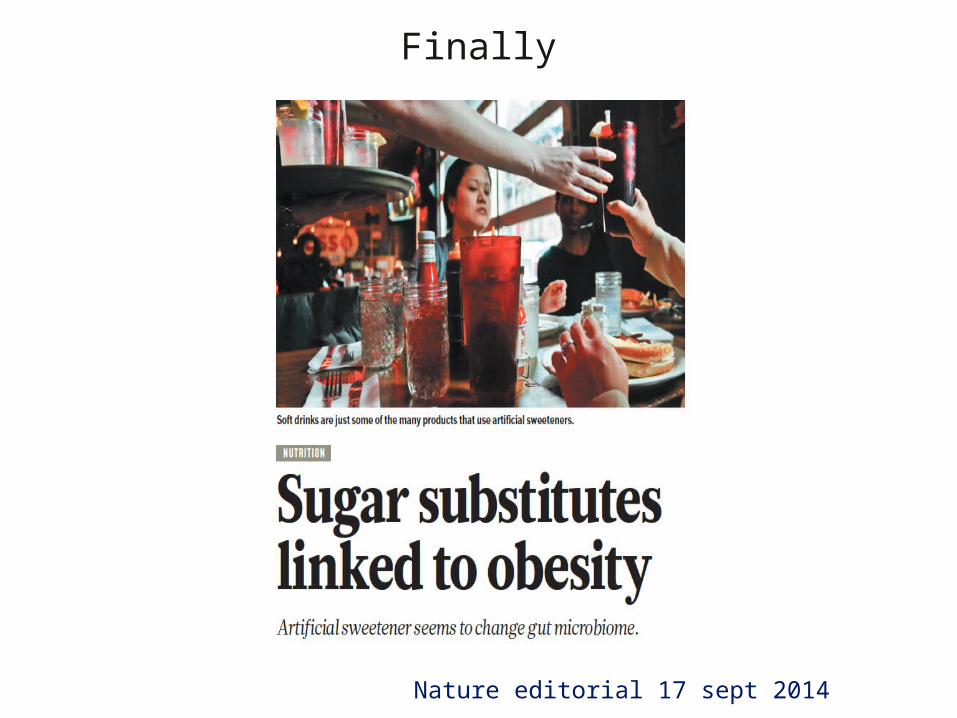
Finally
Nature editorial 17 sept 2014
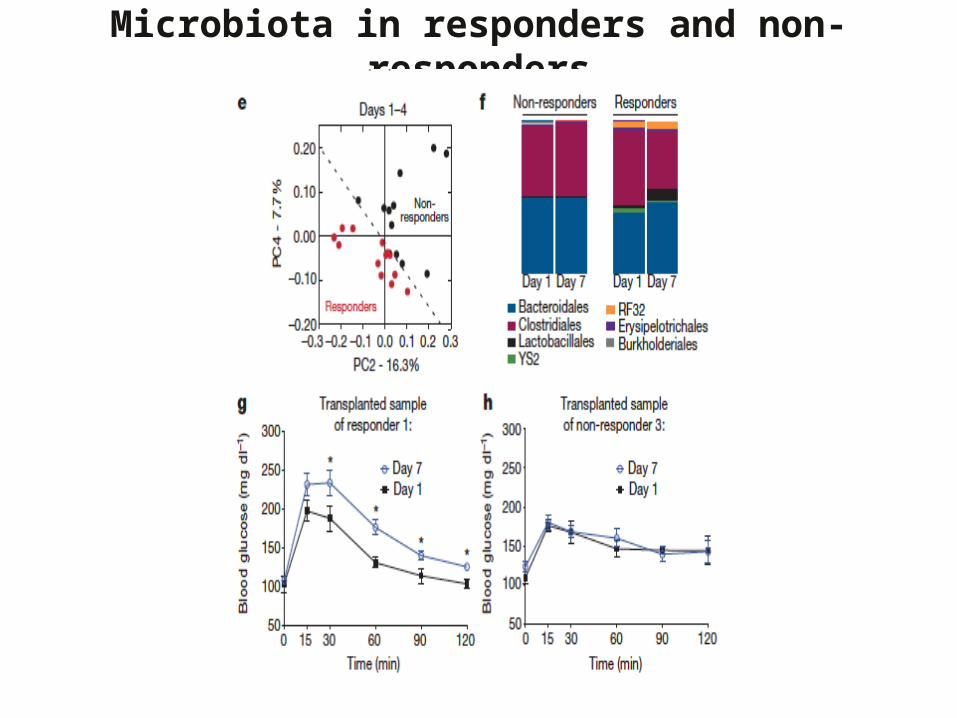
Microbiota in responders and non-responders
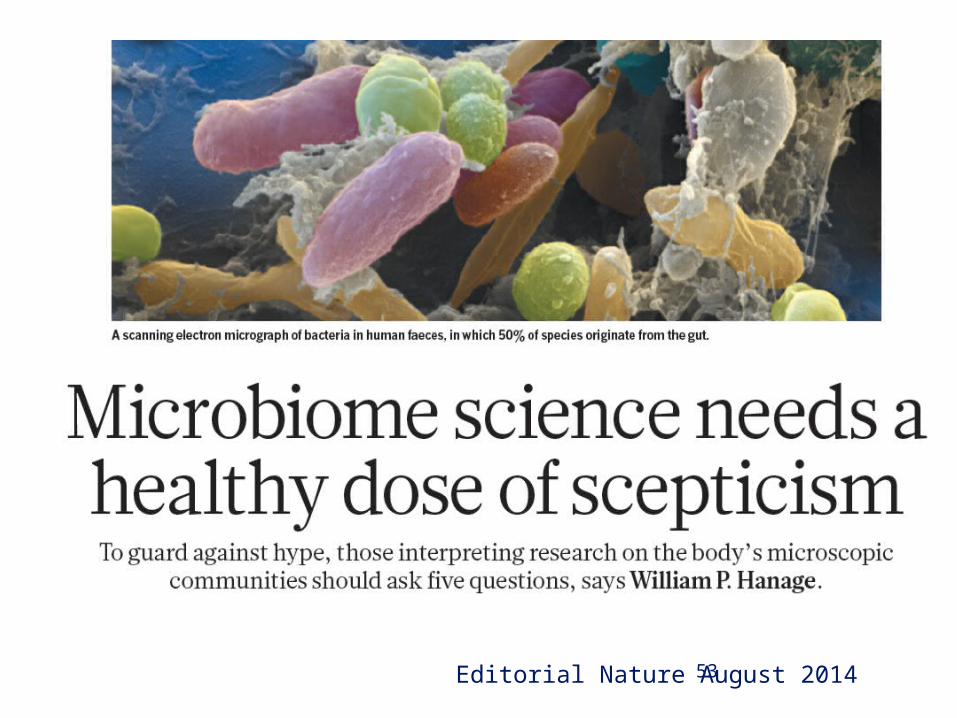
53Editorial Nature August 2014