Monte Carlo simulations for system modeling in emission ... · Monte Carlo simulations for system...
274
Monte Carlo simulations for system modeling in emission tomography Monte-Carlosimulaties voor systeemmodellering in emissietomografie Steven Staelens Promotoren: Prof. dr. I. Lemahieu Prof. dr. ir.R. Van de Walle Proefschrift ingediend tot het behalen van de graad van Doctor in de Toegepaste Wetenschappen Vakgroep Elektronica en Informatiesystemen Voorzitter: Prof. dr. ir. J. Van Campenhout Faculteit Toegepaste Wetenschappen Academiejaar 2004 – 2005
Transcript of Monte Carlo simulations for system modeling in emission ... · Monte Carlo simulations for system...
Monte Carlo simulationsfor system modeling
in emission tomography
Monte-Carlosimulatiesvoor systeemmodellering
in emissietomografie
Steven Staelens
Promotoren: Prof. dr. I. LemahieuProf. dr. ir. R. Van de Walle
Proefschrift ingediend tot het behalen van de graad vanDoctor in de Toegepaste Wetenschappen
Vakgroep Elektronica en InformatiesystemenVoorzitter: Prof. dr. ir. J. Van CampenhoutFaculteit Toegepaste WetenschappenAcademiejaar 2004 – 2005

-
i
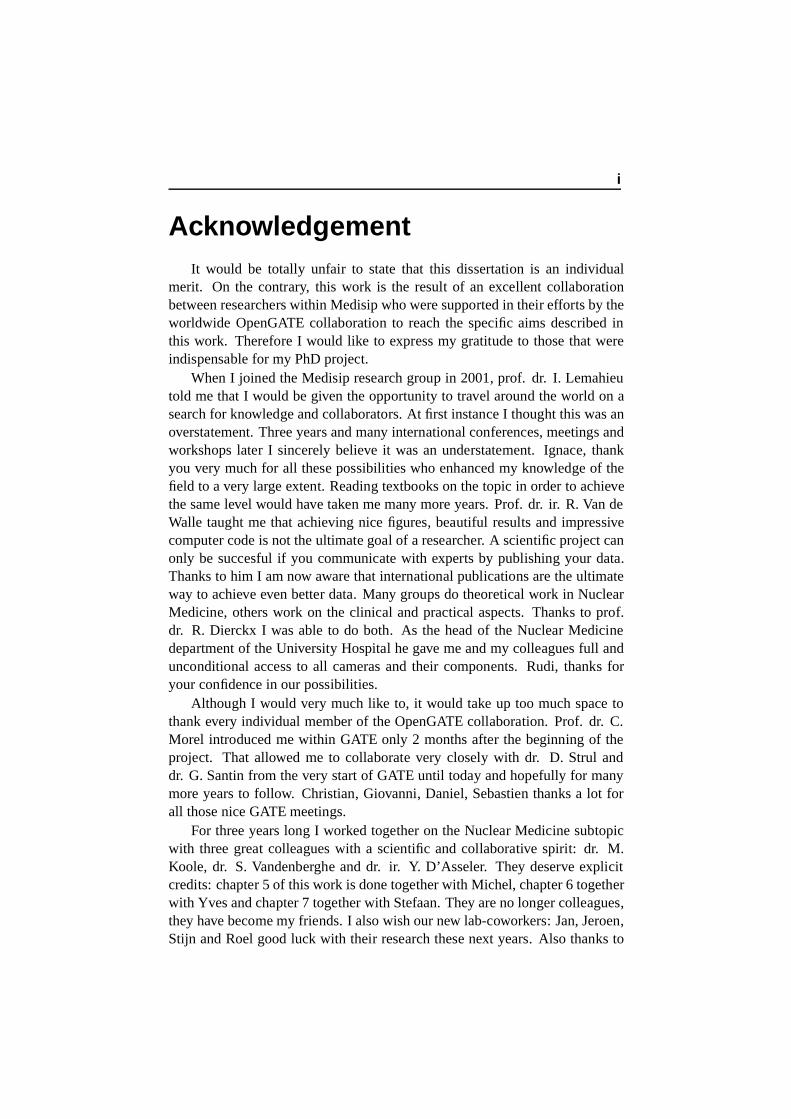
AcknowledgementIt would be totally unfair to state that this dissertation is an individual
merit. On the contrary, this work is the result of an excellent collaborationbetween researchers within Medisip who were supported in their efforts by theworldwide OpenGATE collaboration to reach the specific aims described inthis work. Therefore I would like to express my gratitude to those that wereindispensable for my PhD project.
When I joined the Medisip research group in 2001, prof. dr. I. Lemahieutold me that I would be given the opportunity to travel around the world on asearch for knowledge and collaborators. At first instance I thought this was anoverstatement. Three years and many international conferences, meetings andworkshops later I sincerely believe it was an understatement. Ignace, thankyou very much for all these possibilities who enhanced my knowledge of thefield to a very large extent. Reading textbooks on the topic in order to achievethe same level would have taken me many more years. Prof. dr. ir. R. Van deWalle taught me that achieving nice figures, beautiful results and impressivecomputer code is not the ultimate goal of a researcher. A scientific project canonly be succesful if you communicate with experts by publishing your data.Thanks to him I am now aware that international publications are the ultimateway to achieve even better data. Many groups do theoretical work in NuclearMedicine, others work on the clinical and practical aspects. Thanks to prof.dr. R. Dierckx I was able to do both. As the head of the Nuclear Medicinedepartment of the University Hospital he gave me and my colleagues full andunconditional access to all cameras and their components. Rudi, thanks foryour confidence in our possibilities.
Although I would very much like to, it would take up too much space tothank every individual member of the OpenGATE collaboration. Prof. dr. C.Morel introduced me within GATE only 2 months after the beginning of theproject. That allowed me to collaborate very closely with dr. D. Strul anddr. G. Santin from the very start of GATE until today and hopefully for manymore years to follow. Christian, Giovanni, Daniel, Sebastien thanks a lot forall those nice GATE meetings.
For three years long I worked together on the Nuclear Medicine subtopicwith three great colleagues with a scientific and collaborative spirit: dr. M.Koole, dr. S. Vandenberghe and dr. ir. Y. D’Asseler. They deserve explicitcredits: chapter 5 of this work is done together with Michel, chapter 6 togetherwith Yves and chapter 7 together with Stefaan. They are no longer colleagues,they have become my friends. I also wish our new lab-coworkers: Jan, Jeroen,Stijn and Roel good luck with their research these next years. Also thanks to

ii
our former system administrator ing. E. Nolf and to mevr. Rita Breems, oursecretary.
Next to all those collaborators I would like to thank my parents. Mymother for her beloved concern and my father for teaching me that it isimportant to be pragmatic, even in science. The most important person in allthis however is my girlfriend Katrijn. Countless are the weekends and thenights she had to spend alone because I was working on yet another deadlineor was abroad for some meeting or conference. She beared everything witha smile, moreover she supported and encouraged me to do even better. I canbest express her share in this PhD thesis by using the following quote of acolleague: ’damned, Steven, for you it’s easy to achieve all your results, it isthe only thing you need to do in life, Katrijn takes care of all the rest.’ I couldnot have said it any better....
Thanks to all.
ir. S. StaelensAugust 16th 2004

Content
0 Nederlandstalige Samenvatting 10.1 Inleiding . . . . . . . . . . . . . . . . . . . . . . . . . . . . . 10.2 Monte-Carlosimulaties in emissietomografie . . . . . . . . . . 2
0.2.1 Nucleaire geneeskunde . . . . . . . . . . . . . . . . . 20.2.2 GATE, een simulatieplatform voor SPECT en PET . . 50.2.3 Belang van nauwkeurige Monte-Carlomodellering in
nucleaire geneeskunde . . . . . . . . . . . . . . . . . 110.2.4 Besluit en originele bijdragen . . . . . . . . . . . . . 13
0.3 Validatie . . . . . . . . . . . . . . . . . . . . . . . . . . . . . 140.3.1 Inleiding . . . . . . . . . . . . . . . . . . . . . . . . 140.3.2 Modellering van de basisgeometrie . . . . . . . . . . 140.3.3 Evaluatie van de energiespectra . . . . . . . . . . . . 160.3.4 Sensitiviteitsvalidatie . . . . . . . . . . . . . . . . . . 160.3.5 Verstrooiingsprofielen . . . . . . . . . . . . . . . . . 180.3.6 Vergelijking van de spatiale resolutie . . . . . . . . . 200.3.7 Besluit en originele bijdragen . . . . . . . . . . . . . 20
0.4 Correctietechnieken voor attenuatie en verstrooiing . . . . . . 220.4.1 Inleiding . . . . . . . . . . . . . . . . . . . . . . . . 220.4.2 Beacon-attenuatiecorrectie voor gammacamera-PET
en SPECT . . . . . . . . . . . . . . . . . . . . . . . . 220.4.3 Verstrooiingsanalyse bij PET . . . . . . . . . . . . . . 290.4.4 Besluit en originele bijdragen . . . . . . . . . . . . . 32
0.5 Beeldvormingssystemen en collimatorontwerp . . . . . . . . . 350.5.1 Inleiding . . . . . . . . . . . . . . . . . . . . . . . . 350.5.2 Solstice-detector: basiskenmerken . . . . . . . . . . . 350.5.3 Algemene geometrische transfertfunctie voor een
vlakkencollimator op een strookvormige detector . . . 390.5.4 Studie van waarnemersperformantie . . . . . . . . . . 440.5.5 Conclusie . . . . . . . . . . . . . . . . . . . . . . . . 46
iv CONTENT
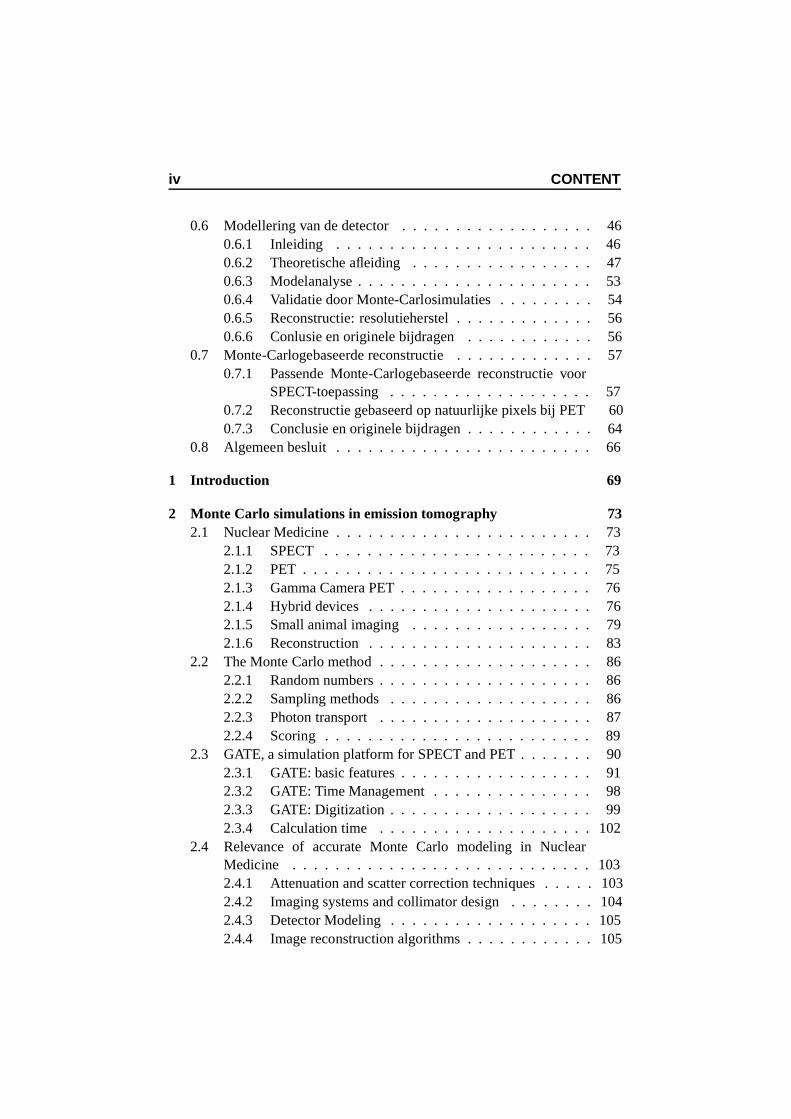
0.6 Modellering van de detector . . . . . . . . . . . . . . . . . . 460.6.1 Inleiding . . . . . . . . . . . . . . . . . . . . . . . . 460.6.2 Theoretische afleiding . . . . . . . . . . . . . . . . . 470.6.3 Modelanalyse . . . . . . . . . . . . . . . . . . . . . . 530.6.4 Validatie door Monte-Carlosimulaties . . . . . . . . . 540.6.5 Reconstructie: resolutieherstel . . . . . . . . . . . . . 560.6.6 Conlusie en originele bijdragen . . . . . . . . . . . . 56
0.7 Monte-Carlogebaseerde reconstructie . . . . . . . . . . . . . 570.7.1 Passende Monte-Carlogebaseerde reconstructie voor
SPECT-toepassing . . . . . . . . . . . . . . . . . . . 570.7.2 Reconstructie gebaseerd op natuurlijke pixels bij PET 600.7.3 Conclusie en originele bijdragen . . . . . . . . . . . . 64
0.8 Algemeen besluit . . . . . . . . . . . . . . . . . . . . . . . . 66
1 Introduction 69
2 Monte Carlo simulations in emission tomography 732.1 Nuclear Medicine . . . . . . . . . . . . . . . . . . . . . . . . 73
2.1.1 SPECT . . . . . . . . . . . . . . . . . . . . . . . . . 732.1.2 PET . . . . . . . . . . . . . . . . . . . . . . . . . . . 752.1.3 Gamma Camera PET . . . . . . . . . . . . . . . . . . 762.1.4 Hybrid devices . . . . . . . . . . . . . . . . . . . . . 762.1.5 Small animal imaging . . . . . . . . . . . . . . . . . 792.1.6 Reconstruction . . . . . . . . . . . . . . . . . . . . . 83
2.2 The Monte Carlo method . . . . . . . . . . . . . . . . . . . . 862.2.1 Random numbers . . . . . . . . . . . . . . . . . . . . 862.2.2 Sampling methods . . . . . . . . . . . . . . . . . . . 862.2.3 Photon transport . . . . . . . . . . . . . . . . . . . . 872.2.4 Scoring . . . . . . . . . . . . . . . . . . . . . . . . . 89
2.3 GATE, a simulation platform for SPECT and PET . . . . . . . 902.3.1 GATE: basic features . . . . . . . . . . . . . . . . . . 912.3.2 GATE: Time Management . . . . . . . . . . . . . . . 982.3.3 GATE: Digitization . . . . . . . . . . . . . . . . . . . 992.3.4 Calculation time . . . . . . . . . . . . . . . . . . . . 102
2.4 Relevance of accurate Monte Carlo modeling in NuclearMedicine . . . . . . . . . . . . . . . . . . . . . . . . . . . . 1032.4.1 Attenuation and scatter correction techniques . . . . . 1032.4.2 Imaging systems and collimator design . . . . . . . . 1042.4.3 Detector Modeling . . . . . . . . . . . . . . . . . . . 1052.4.4 Image reconstruction algorithms . . . . . . . . . . . . 105
CONTENT v
2.4.5 Application in other domains . . . . . . . . . . . . . . 1062.5 Conclusion and original contributions . . . . . . . . . . . . . 107
3 Validation 1093.1 Introduction . . . . . . . . . . . . . . . . . . . . . . . . . . . 1093.2 Basic geometry modeling . . . . . . . . . . . . . . . . . . . . 110
3.2.1 Collimator . . . . . . . . . . . . . . . . . . . . . . . 1103.2.2 Detector head design . . . . . . . . . . . . . . . . . . 111
3.3 Energy spectra evaluation . . . . . . . . . . . . . . . . . . . . 1153.3.1 Energy resolution module . . . . . . . . . . . . . . . 1153.3.2 Shape of the energy spectra of various isotopes . . . . 116
3.4 Sensitivity validation . . . . . . . . . . . . . . . . . . . . . . 1163.5 Scatter profiles . . . . . . . . . . . . . . . . . . . . . . . . . 1213.6 Spatial resolution comparison . . . . . . . . . . . . . . . . . . 1213.7 Conclusion and original contributions . . . . . . . . . . . . . 125
4 Attenuation and scatter correction techniques 1314.1 Introduction . . . . . . . . . . . . . . . . . . . . . . . . . . . 1314.2 Beacon attenuation correction for gamma camera PET and
SPECT . . . . . . . . . . . . . . . . . . . . . . . . . . . . . 1324.2.1 Methods . . . . . . . . . . . . . . . . . . . . . . . . 1334.2.2 Gamma Camera PET . . . . . . . . . . . . . . . . . . 1354.2.3 Beacon-SPECT . . . . . . . . . . . . . . . . . . . . . 139
4.3 PET scatter analysis . . . . . . . . . . . . . . . . . . . . . . . 1444.3.1 Methods . . . . . . . . . . . . . . . . . . . . . . . . 1454.3.2 NEMA phantom study . . . . . . . . . . . . . . . . . 1454.3.3 Anthropomorphic phantom study . . . . . . . . . . . 1474.3.4 Reconstruction . . . . . . . . . . . . . . . . . . . . . 151
4.4 Conclusion and original contributions . . . . . . . . . . . . . 151
5 Imaging systems and collimator design 1555.1 Introduction . . . . . . . . . . . . . . . . . . . . . . . . . . . 1555.2 Solstice detector: basic characteristics . . . . . . . . . . . . . 1555.3 General Geometric Transfer Function for a slat collimator
mounted on a strip detector . . . . . . . . . . . . . . . . . . . 1595.3.1 Formalism . . . . . . . . . . . . . . . . . . . . . . . 1625.3.2 Analysis . . . . . . . . . . . . . . . . . . . . . . . . 167
5.4 Observer performance study . . . . . . . . . . . . . . . . . . 1735.4.1 Study setup . . . . . . . . . . . . . . . . . . . . . . . 1735.4.2 Reconstruction . . . . . . . . . . . . . . . . . . . . . 1745.4.3 Performance Analysis: ROC study . . . . . . . . . . . 175
vi CONTENT
5.5 Conclusion . . . . . . . . . . . . . . . . . . . . . . . . . . . 178
6 Detector modeling 1816.1 Introduction . . . . . . . . . . . . . . . . . . . . . . . . . . . 1816.2 Theoretical derivation . . . . . . . . . . . . . . . . . . . . . . 182
6.2.1 Perpendicular incidences . . . . . . . . . . . . . . . . 1826.2.2 Oblique incidences . . . . . . . . . . . . . . . . . . . 184
6.3 Model analysis . . . . . . . . . . . . . . . . . . . . . . . . . 1916.3.1 Perpendicular incidences . . . . . . . . . . . . . . . . 1926.3.2 Oblique incidences . . . . . . . . . . . . . . . . . . . 192
6.4 Validation by Monte Carlo simulations . . . . . . . . . . . . . 1936.5 Reconstruction: resolution recovery . . . . . . . . . . . . . . 2016.6 Conclusion + original contributions . . . . . . . . . . . . . . 203
7 Monte Carlo based reconstruction 2057.1 Dedicated Monte Carlo based reconstruction for SPECT ap-
plication . . . . . . . . . . . . . . . . . . . . . . . . . . . . . 2057.1.1 Implementation . . . . . . . . . . . . . . . . . . . . . 2067.1.2 Recovery of ME on LEHR photon spread . . . . . . . 207
7.2 Natural Pixel based reconstruction for PET . . . . . . . . . . 2107.2.1 Theoretical background and geometrical results . . . . 2127.2.2 Enhancements by using GATE . . . . . . . . . . . . . 216
7.3 Conclusion + original contributions . . . . . . . . . . . . . . 219
8 General Conclusion 221

List of Figures
1 Gammacamera : technisch schema. . . . . . . . . . . . . . . . 32 (a) SPECT/CT: Siemens TruePoint, (b) PET/CT: Philips Gemini 43 De digitalisator bestaat uit een keten van verwerkingsmodules
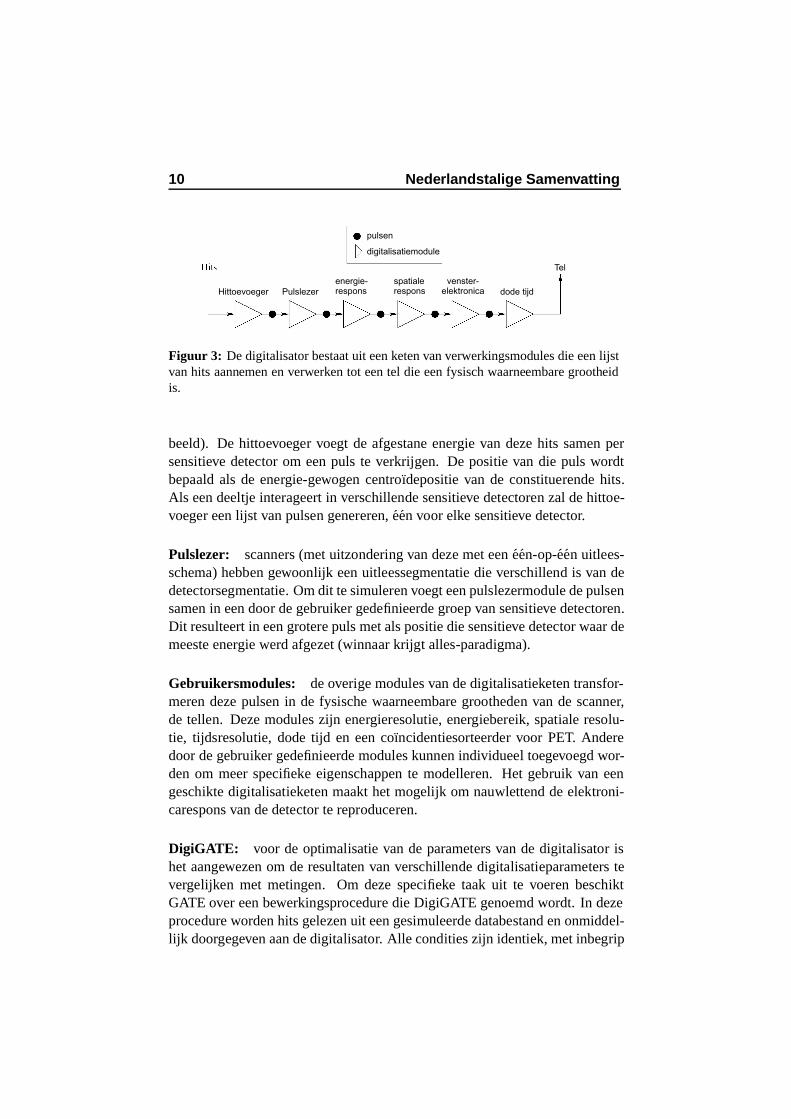
die een lijst van hits aannemen en verwerken tot een tel die eenfysisch waarneembare grootheid is. . . . . . . . . . . . . . . . 10
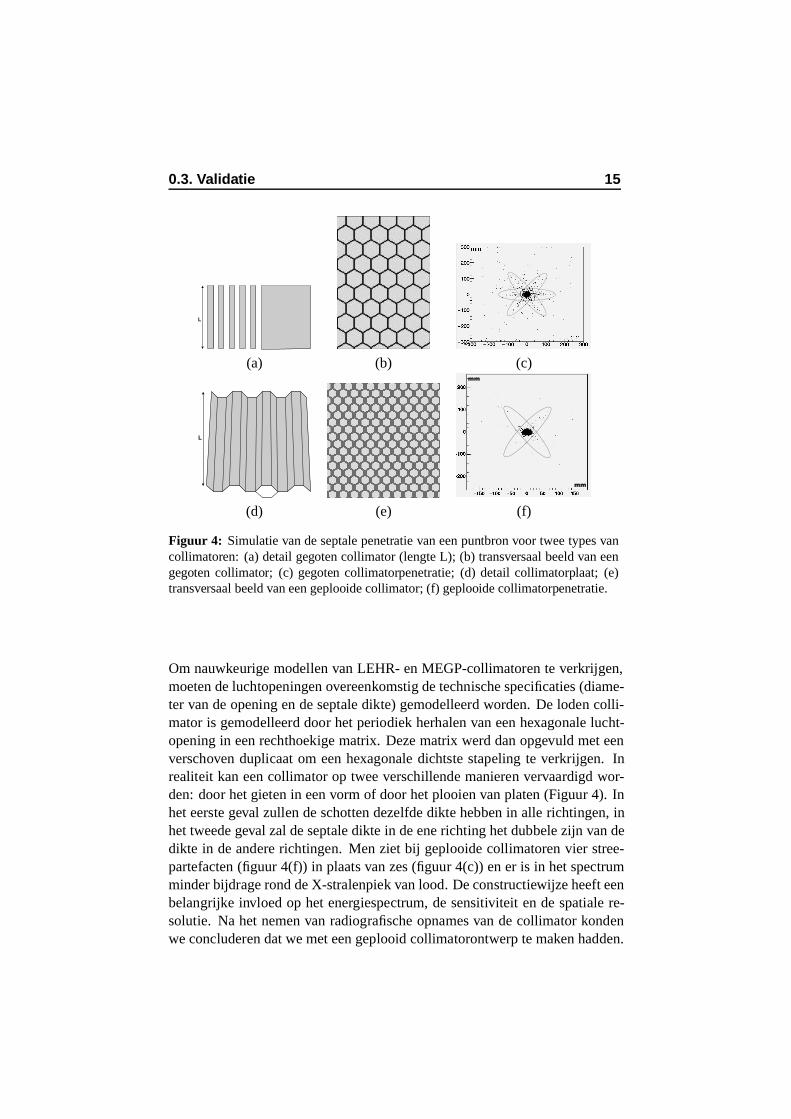
4 Simulatie van de septale penetratie van een puntbron voortwee types van collimatoren: (a) detail gegoten collimator(lengte L); (b) transversaal beeld van een gegoten collimator;(c) gegoten collimatorpenetratie; (d) detail collimatorplaat; (e)transversaal beeld van een geplooide collimator; (f) geplooidecollimatorpenetratie. . . . . . . . . . . . . . . . . . . . . . . 15
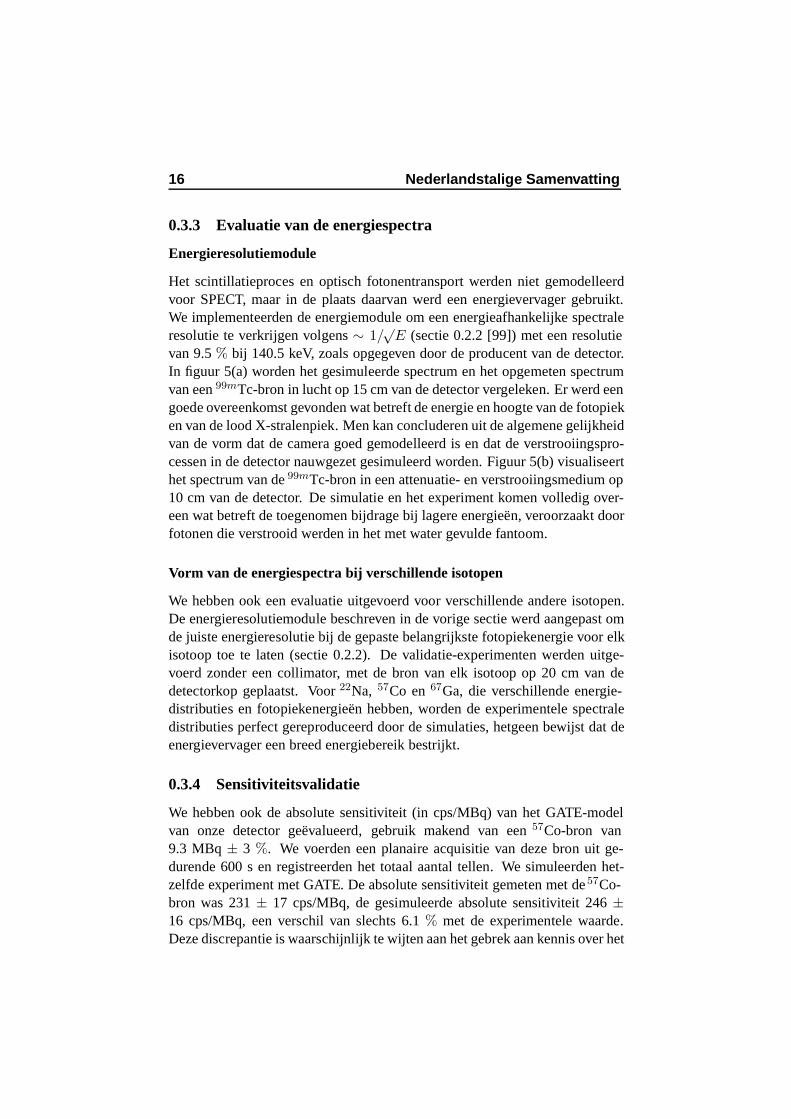
5 Vergelijking van het gesimuleerde en gemeten99mTc-spectrum: (a) bron in lucht; (b) met H20-verstrooiingsmedium. Zwarte lijn: meting, grijze lijn:simulatieresultaten in histogramvorm. . . . . . . . . . . . . . 17
6 Sensitiviteit: (a) LEHR-collimator; (b) MEGP-collimator. FP= fotopiekvenster (129-151 keV), SF = verstrooiing in hetbereik 92-126 keV (Comptonbereik). . . . . . . . . . . . . . . 19
7 Vergelijking van de spatiale resolutie voor een LEHR- en vooreen MEGP-collimator (LE = lage energie, ME = medium en-ergie, sim = gesimuleerde waarden, exp = experimentele waar-den): LEsim toont de gesimuleerde spatiale resolutie, LEexpde verkregen spatiale resolutie voor de LEHR-collimator, ter-wijl MEsim en MEexp gesimuleerde en verkregen spatiale res-olutie voor de MEGP-collimator illustreren; er werd een lin-eaire curve gefit aan elke dataplot. . . . . . . . . . . . . . . . 21
8 BeaconTM acquisitiesetup: 133Ba-fotonen worden uitgezon-den door een bewegende puntbron die de tegenoverliggendedetector bestraalt: asymmetrische beeldvorming met stralen inwaaiervorm. . . . . . . . . . . . . . . . . . . . . . . . . . . . 23
viii LIST OF FIGURES
9 Gesimuleerd model van een tweekoppige AXIS-camera: col-limator, kristal in zijn aluminium verpakking, lichtgeleider,PMT’s, compressieplaat, luchtisolatie en loden afsluiter zijnafgebeeld voor elke detectorkop. Een watergevuld cilindrischfantoom werd gemodelleerd in het centrum van de FOV: (a)detail van de fotonemissies van de bewegende133Ba puntbron-nen, (b) rotatie van de detector; (c) idem. . . . . . . . . . . . . 25
10 18F-spectrum van een gammacamera-PET-opstelling: intrin-sieke verstrooiingscontaminatie van 18F in het emissieven-ster (30% rond 511 keV) en neerwaartse verstrooiingscontam-inatie van 18F in het 133Ba-transmissie-energiebereik (45%rond 356 keV) werden gearceerd, eerste- en tweede-orde-verstrooiingsbijdragen van de 511 keV emissiefotonen werdenafgebeeld. . . . . . . . . . . . . . . . . . . . . . . . . . . . . 26
11 Opstelling van gammacamera-PET : dik kristal, openframecol-limatoren: (a) verstrooiingsclassificatie en (b) relatief belangvan elk detectoronderdeel. . . . . . . . . . . . . . . . . . . . 27
12 Verstrooiingsorde voor de drie opstellingen: LEHR-dik kristal,LEHR-dun kristal, MEGP-dik kristal; verstrooiingsorde = 0duidt op primaries. . . . . . . . . . . . . . . . . . . . . . . . 28
13 Relatief belang van elk detectordeel bij de drie opstellingen:LEHR-dik kristal, LEHR-dun kristal, MEGP-dik kristal doortelling van de verstrooiingsgebeurtenis in elke afzonderlijkdeel, gedeeld door het totaal aantal gedetecteerde gebeurtenissen. 29
14 133Ba-spectrum van een typische opstelling:neerwaartse ver-strooiingscontaminatie van de 133Ba fotonen in het en-ergiebereik van de 99mTc-emissie en intrinsieke verstrooiing inhet 133Ba-transmissievenster zijn gearceerd, eerste- en tweede-orde-verstrooiingsbijdragen voor de 356 keV transmissiefoto-nen werden afgebeeld. . . . . . . . . . . . . . . . . . . . . . 30
15 Sensitiviteit van de drie opstellingen: LEHR-dik kristal,LEHR-dun kristal, MEGP-dik kristal; vergeleken met een typ-ische 99mTc emissieopname. . . . . . . . . . . . . . . . . . . 31
16 (a) NEC: T 2/(T + S); (b) sensitiviteit: gedetecteerdetellen/emissies. . . . . . . . . . . . . . . . . . . . . . . . . . 33
17 Illustratie van de relatieve verstrooiingsbijdragen bij GSO. . . 34
18 Solstice: (a) illustratie van de Solstice-detector; (b) model vandeze opstelling: visualisatie van de CZT-strook en de collima-torschotten. . . . . . . . . . . . . . . . . . . . . . . . . . . . 36
LIST OF FIGURES ix
19 Vergelijking van de spatiale resolutie van een traditioneleAXIS-SPECT-camera (zwart) met Solstice (grijs). . . . . . . . 37
20 Vergelijking van sensitiviteit: (a) voor ontwerp met roterendevlakken (kernwoord: CZT-RV); (b) voor de gepixeliseerdevaste-stofdetector met parallelle-bundelcollimator (kernwo-ord: CZT-PB); (c) voor de klassieke NaI-Angercamera (kern-woord: ANG) met diezelfde parallelle-bundelcollimator. . . . 37
21 Verstrooiingscontaminatie in het fotopiekbereik voor de drietoestellen, CZT-RV = kernwoord voor toestel met roterende-vlakkencollimator, CZT-PB = kernwoord voor parallelle-bundelcollimator en ANG = kernwoord voor een klassiekeAngercamera. . . . . . . . . . . . . . . . . . . . . . . . . . . 38
22 Detail van twee naburige schotten om de overlap van het ac-tieve detectoroppervlak en de projectie van de openingsfunctieop het collimatoroppervlak in dat gebied te visualiseren. Deoverlappingsgraad tussen a(r, rc) en a′(r, rc) zal het gedragvan de detector in dat punt bepalen. . . . . . . . . . . . . . . 40
23 Vergelijking tussen het gesimuleerde en het berekende sensi-tiviteitsverloop: resultaten voor de hoekafhankelijkheid. . . . . 42
24 Resolutiegedrag voor puntbronnen op een afstand Z = 10 cmvan het voorvlak van de vlakkencollimator. . . . . . . . . . . 42
25 Vergelijking van de gesimuleerde (streeplijn) en de berekendetransaxiale profielen van een lijnbron geplaatst in een vlakevenwijdig aan het collimatoroppervlak; (a) op 2,5 cm vande collimator; (b) op 20 cm van de collimator. De abscis isuitgedrukt in pixels (1.8 mm periode) die in dit geval de 192openingen van het detectorsysteem (34.56 cm) langs de x-aszijn. De lijnbron is geplaatst op pixel 95. . . . . . . . . . . . . 43
26 Vergroten van het stripvullend oppervlak achter de schotten:ROC-curve (kernwoord:Vos). . . . . . . . . . . . . . . . . . . 45
27 Loodrecht invallende fotonen met tegenoverliggende positievan de detectorkoppen, D = afstand tussen de detectorkoppen,θ = incidentiehoek. . . . . . . . . . . . . . . . . . . . . . . . 48
28 In rekening brengen van de kristaldikte d. . . . . . . . . . . . 50
29 (a) Schuin invallende fotonen met tegenoverliggende posi-tie van de detectorkoppen: 3D-uitbreiding, (b) effect van dekristaldikte in beide transversale richtingen. . . . . . . . . . . 52
30 Pdf’s voor loodrecht invallende fotonen en tegenoverliggendedetectoren: (a) grijswaardenbeeld, (b) oppervlakteplot. . . . . 53
x LIST OF FIGURES
31 Pdf voor schuin invallende fotonen en tegenoverliggende de-tectoren: (a) grijswaardenbeeld en (b) oppervlakteplot: kristalvan 1.9 cm. . . . . . . . . . . . . . . . . . . . . . . . . . . . 54
32 Monte-Carlovalidatie van het theoretisch model: vergelijkingvan de FWHM. . . . . . . . . . . . . . . . . . . . . . . . . . 55
33 Systeemrespons: (a) eendimensionale gemiddelde systeemre-spons voor 128 vlakken parallel aan de detector bij een MEGP-opstelling, (b) eendimensionale gemiddelde systeemresponsvoor 128 vlakken parallel aan de detector bij een LEHR-collimatoropstelling. . . . . . . . . . . . . . . . . . . . . . . 58
34 Gereconstrueerde beelden (axiaal zicht) van een puntbron met300 keV medium energie. De detector is voorzien van eenLEHR-collimator: (a) parallelprojectie MLEM, (b) Monte-Carlogebaseerde MLEM. . . . . . . . . . . . . . . . . . . . . 59
35 Gereconstrueerde beelden van een puntbron met 300 keVmedium energie. De detector is voozien van een LEHR-collimator: FWHM parallelprojectie MLEM (puntlijn),FWHM Monte-Carlogebaseerde MLEM (volle lijn). . . . . . . 60
36 Gereconstrueerde beelden (axiaal zicht) van een puntbron-nenfantoom met 170 keV medium energie: evaluatie van re-constructieperformanties voor LEHR- en MEGP-collimator:(a) MEGP-collimator en parallelprojectie MLEM, (b) LEHR-collimator en parallelprojectie MLEM, (c) MEGP-collimatoren Monte-Carlogebaseerde MLEM, (d) LEHR-collimator enMonte-Carlogebaseerde MLEM. . . . . . . . . . . . . . . . . 61
37 (a) berekening van de natuurlijke pixelwaarde gevormd doorLOR i en LOR j. De grijswaarde van de niet-uniforme stripsis de waarschijnlijkheid dat een detectie in een LOR afkomstigwas van een bepaald punt in de FOV, (b) matrix M bevat denatuurlijke pixelwaarden voor een PETring van 20 detectoren.Elke detector kan combineren met 10 overliggende detectoren.Dit resulteert in 200 mogelijke LORs. . . . . . . . . . . . . . 63
38 Gesimuleerde responsen voor BGO 2D PET-scanner (7 mmbreed): geen positieblurring, alleen kristalverstrooiing enkristalpenetratie. . . . . . . . . . . . . . . . . . . . . . . . . . 65
2.1 Gamma Camera : (a) technical scheme, (b) detailed view, (c)optical photon transport. . . . . . . . . . . . . . . . . . . . . 74
2.2 (a) SPECT: Philips Irix, (b) PET camera: Philips Allegro. . . . 752.3 Positron range and gamma-gamma non-collinearity. . . . . . . 76
LIST OF FIGURES xi
2.4 (a) SPECT/CT: Siemens TruePoint, (b) PET/CT: Philips Gemini 772.5 (a) whole body SPECT scan, (b) CT, (c) SPECT, (d)
SPECT/CT hardware image fusion : lesion at the edge of thevertebral body. . . . . . . . . . . . . . . . . . . . . . . . . . 78
2.6 (a) a coronal PET image showing focal FDG uptake in a rightanterior para-aortic lymph node, (b) transaxial CT image (up-per) and fused PET/CT image (lower) taken at the level in-dicate by the line in (a), (c) the fused PET/CT image, corre-sponding to the PET image in (a), (d) coronal PET image, (e)CT image (upper) and fused PET/CT image (lower) taken atthe level indicate by the line in (d), (f) the fused PET/CT im-age, corresponding to the PET image in (d). . . . . . . . . . . 80
2.7 (a) Philips Mosaic small animal scanner, (b) clinical image ofa rat. . . . . . . . . . . . . . . . . . . . . . . . . . . . . . . . 81
2.8 (a) pinhole imaging , (b) multiple pinhole imaging [12], (c) slitcollimator [145], (d) slat collimator [43]. . . . . . . . . . . . . 82
2.9 Detail of a collimator modeling process. . . . . . . . . . . . . 932.10 Example scanner types modeled in GATE: (a) SPECT system
(IRIX-Beacon), (b) PET system (ECAT HR+). . . . . . . . . . 942.11 Example of analytical sources: (a) simple phantom, (b)
Derenzo phantom. . . . . . . . . . . . . . . . . . . . . . . . . 942.12 Clinical extension for an inhomogeneous image: example of
how an emission and attenuation map are represented by thesimulator: (a) emission map (left: digital Hoffman phantomdata - right: read in by the simulator), (b) attenuation map(left:actual patient data - right:read in by the simulator). . . . . 96
2.13 Interfile reader : simulated projection data of the Hoffmanbrain phantom: (a) without attenuation; (b) with a voxelizedattenuation geometry based on the same phantom. . . . . . . . 97
2.14 Midway horizontal profile of the simulated voxelized sourcesagittal projection data of the Hoffman brain phantom with(dashed line) and without (full line) the voxelized attenuationgeometry. . . . . . . . . . . . . . . . . . . . . . . . . . . . . 97
2.15 The digitizer is organized as a chain of several modules thatprocesses the hits to yield a single, which represents a physicalobservable. . . . . . . . . . . . . . . . . . . . . . . . . . . . 100
3.1 Dual-headed Philips AXIS camera. . . . . . . . . . . . . . . . 1103.2 Detector model: view of the modeled AXIS detector heads
with a zoom on the collimator. . . . . . . . . . . . . . . . . . 112
xii LIST OF FIGURES
3.3 Simulation of the septal penetration from a point source fortwo types of collimators: (a) detail cast collimator (length L);(b) transversal image of a cast collimator; (c) cast collimatorpenetration; (d) detail collimator plate; (e) transversal imageof a folded collimator; (f) folded collimator penetration. . . . . 113
3.4 (a) Axial view of the detector head model with 1: collimator,2: cover 3: crystal in its aluminum casing, 4: light guide, 5:PMTs, 6: compression plate, 7: air gap and 8: lead ending(top and bottom shielding of the crystal are omitted for visu-alization purposes); (b) relative importance of every layer for140.5 keV. . . . . . . . . . . . . . . . . . . . . . . . . . . . . 114
3.5 Comparison of simulated and measured 99mTc spectrum : (a)source in air; (b) with H2O scattering medium. Black line :measurement, gray line: binned simulation. . . . . . . . . . . 117
3.6 Comparison of simulated and measured spectra in air: (a)spectrum of 22Na; (b) spectrum of 57Co; (c) spectrum of 67Ga.Black line : measurement, gray line: binned simulation. . . . . 118
3.7 Sensitivity: (a) LEHR collimator; (b) MEGP collimator. FP= photopeak window (129-151 keV), SF=scatter in the 92-126 keV range (Compton window). . . . . . . . . . . . . . . 120
3.8 Simulated scatter profiles of a point source in air for the pho-topeak window at different distances from the LEHR collimator. 122
3.9 Simulated and measured scatter profiles of a point source inthe Compton window in air: (a) 5 cm; (b) 15 cm; (c) 25 cm;(d) 30 cm. LEHR collimator attached. . . . . . . . . . . . . . 123
3.10 Simulated and measured scatter profiles of a line source inthe photopeak window with H2O scattering medium: (a) 1 cmdepth; (b) 5 cm depth; (c) 10 cm depth; (d) 15 cm depth; (e)20 cm depth. LEHR collimator attached. . . . . . . . . . . . . 124
3.11 Comparison of spatial resolution for a LEHR and for a MEGPcollimator (LE = Low Energy, ME = Medium Energy, sim =simulated values, exp = experimental values): LE sim showsthe simulated spatial resolution, LE exp shows the acquiredspatial resolution for the LEHR collimator while ME sim andME exp illustrate simulated and acquired spatial resolution forthe MEGP collimator; a linear curve is fitted to each data plot. 126
LIST OF FIGURES xiii
4.1 BeaconTM acquisition setup: photons emitted by a moving133Ba point source irradiating the opposite detector (zoom onthe collimator): asymmetric (Beacon attached to side of thedetector) fan beam (emisison confined to plane) imaging. . . . 132
4.2 (a) realistic Beacon setup; (b) simulated counterpart with acylindrical phantom shown; (c) axial projection of cylindricalphantom acquisition; (d) transaxial profile of cylindrical phan-tom acquisition. . . . . . . . . . . . . . . . . . . . . . . . . . 134
4.3 Illustration of the collimator, modeled in the detector headsdiscussed above: detail of the collimator hole pattern that wasomitted in previous figures; hole dimensions are purely illus-trative. . . . . . . . . . . . . . . . . . . . . . . . . . . . . . . 135
4.4 Simulated model of a dual headed AXIS-camera: collimator,cover, crystal in its aluminum casing, light guide, PMTs, com-pression plate, air gap and lead ending are shown for each de-tector head (top and bottom shielding of the crystal are omittedfor visualization purposes as well as the detail of the collima-tor holes). A water filled cylindrical phantom is modeled in thecenter of the field of view: (a) detail of the photon emissionsof the moving 133Ba point sources, (b) rotation of the detector,(c) idem. . . . . . . . . . . . . . . . . . . . . . . . . . . . . . 136
4.5 Simulated model of a triple headed IRIX-camera: two of thethree heads have a Beacon transmission imaging device at-tached, the third head is only used for the emission acquisition:(a) water filled cylindrical phantom in the center of the field ofview with three hot spheres (filled with 99mTc ) for emissionimaging purposes; (b) detailed view of the phantom. . . . . . . 137
4.6 18F spectrum of a coincidence gamma camera PET setup: in-trinsic scatter contamination of the 18F emission source in theemission window and downscatter of the 18F emission sourcein the 133Ba transmission energy window are shown as wellas first and second order scatter contributions of the 511 keVphotons. Higher order scatter is not shown here since it mostlyinfluences the spectrum around lower energies (0.2 MeV). . . 138
4.7 Gamma Camera PET setup: thick crystal, openframe collima-tors : (a) scatter order and (b) relative importance of each de-tector part by counting the scattered events in each particularpart, divided by the total number of detected events. . . . . . . 140
xiv LIST OF FIGURES
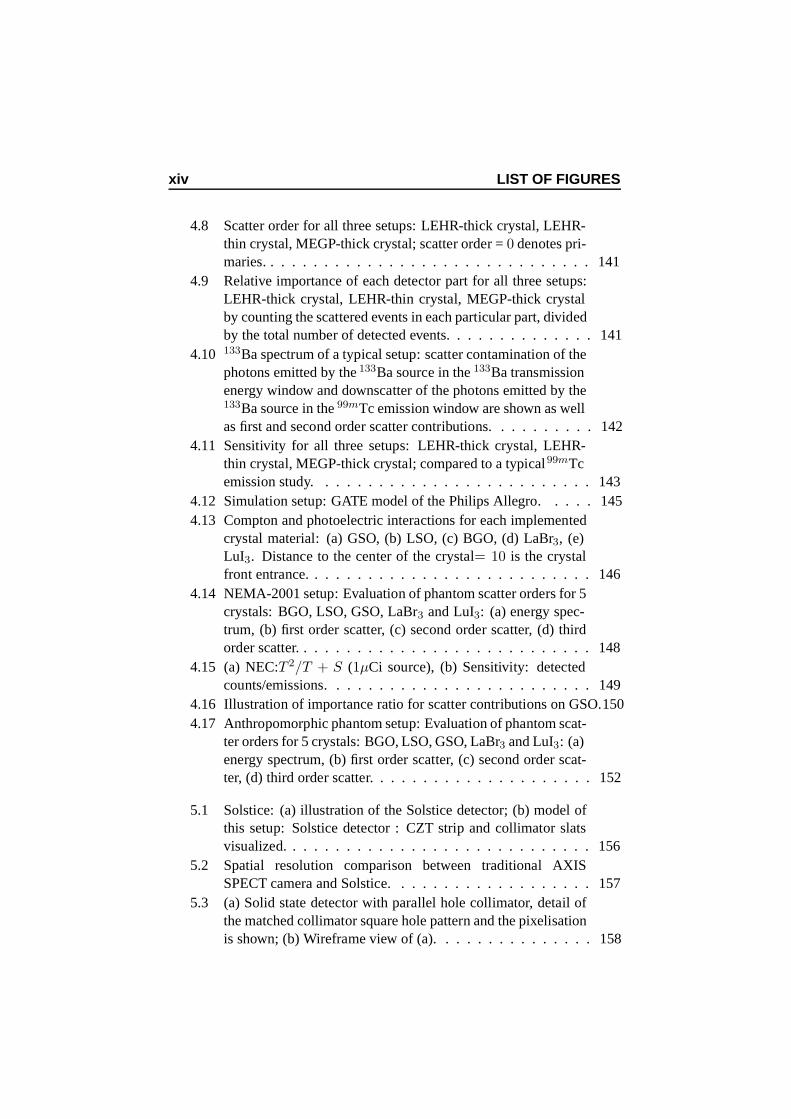
4.8 Scatter order for all three setups: LEHR-thick crystal, LEHR-thin crystal, MEGP-thick crystal; scatter order = 0 denotes pri-maries. . . . . . . . . . . . . . . . . . . . . . . . . . . . . . . 141
4.9 Relative importance of each detector part for all three setups:LEHR-thick crystal, LEHR-thin crystal, MEGP-thick crystalby counting the scattered events in each particular part, dividedby the total number of detected events. . . . . . . . . . . . . . 141
4.10 133Ba spectrum of a typical setup: scatter contamination of thephotons emitted by the 133Ba source in the 133Ba transmissionenergy window and downscatter of the photons emitted by the133Ba source in the 99mTc emission window are shown as wellas first and second order scatter contributions. . . . . . . . . . 142
4.11 Sensitivity for all three setups: LEHR-thick crystal, LEHR-thin crystal, MEGP-thick crystal; compared to a typical99mTcemission study. . . . . . . . . . . . . . . . . . . . . . . . . . 143
4.12 Simulation setup: GATE model of the Philips Allegro. . . . . 1454.13 Compton and photoelectric interactions for each implemented
crystal material: (a) GSO, (b) LSO, (c) BGO, (d) LaBr3, (e)LuI3. Distance to the center of the crystal= 10 is the crystalfront entrance. . . . . . . . . . . . . . . . . . . . . . . . . . . 146
4.14 NEMA-2001 setup: Evaluation of phantom scatter orders for 5crystals: BGO, LSO, GSO, LaBr3 and LuI3: (a) energy spec-trum, (b) first order scatter, (c) second order scatter, (d) thirdorder scatter. . . . . . . . . . . . . . . . . . . . . . . . . . . . 148
4.15 (a) NEC:T 2/T + S (1µCi source), (b) Sensitivity: detectedcounts/emissions. . . . . . . . . . . . . . . . . . . . . . . . . 149
4.16 Illustration of importance ratio for scatter contributions on GSO.1504.17 Anthropomorphic phantom setup: Evaluation of phantom scat-
ter orders for 5 crystals: BGO, LSO, GSO, LaBr3 and LuI3: (a)energy spectrum, (b) first order scatter, (c) second order scat-ter, (d) third order scatter. . . . . . . . . . . . . . . . . . . . . 152
5.1 Solstice: (a) illustration of the Solstice detector; (b) model ofthis setup: Solstice detector : CZT strip and collimator slatsvisualized. . . . . . . . . . . . . . . . . . . . . . . . . . . . . 156
5.2 Spatial resolution comparison between traditional AXISSPECT camera and Solstice. . . . . . . . . . . . . . . . . . . 157
5.3 (a) Solid state detector with parallel hole collimator, detail ofthe matched collimator square hole pattern and the pixelisationis shown; (b) Wireframe view of (a). . . . . . . . . . . . . . . 158
LIST OF FIGURES xv
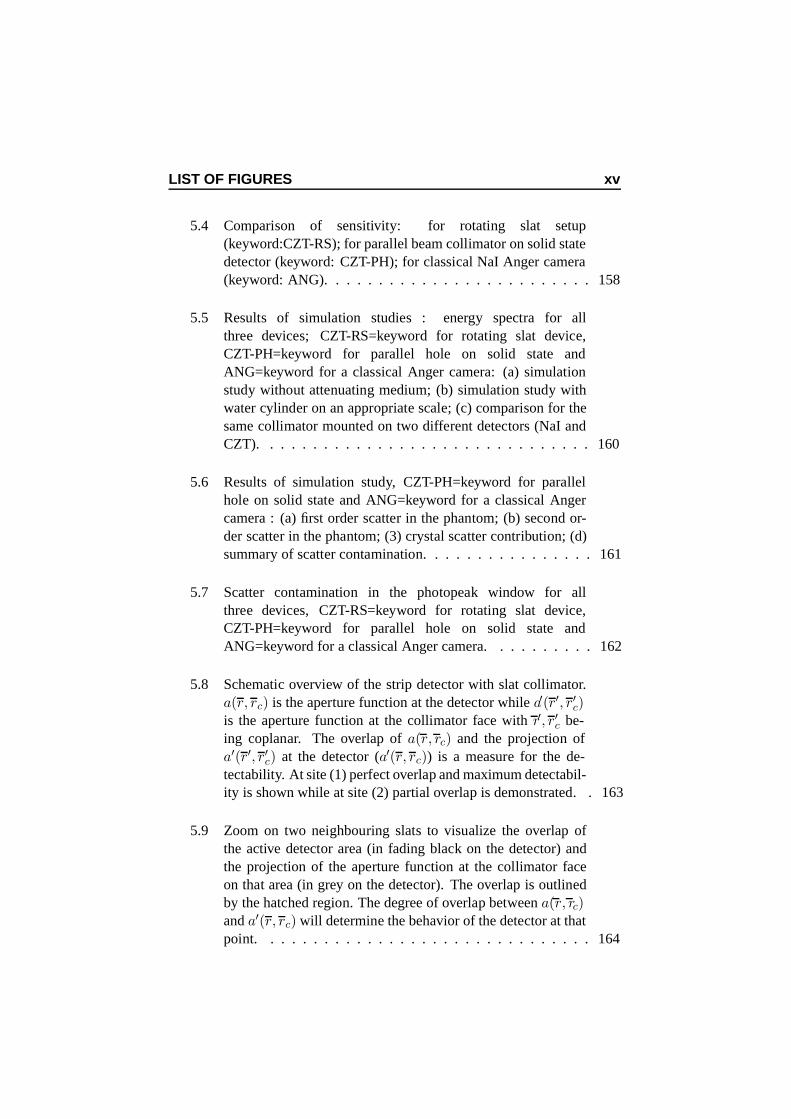
5.4 Comparison of sensitivity: for rotating slat setup(keyword:CZT-RS); for parallel beam collimator on solid statedetector (keyword: CZT-PH); for classical NaI Anger camera(keyword: ANG). . . . . . . . . . . . . . . . . . . . . . . . . 158
5.5 Results of simulation studies : energy spectra for allthree devices; CZT-RS=keyword for rotating slat device,CZT-PH=keyword for parallel hole on solid state andANG=keyword for a classical Anger camera: (a) simulationstudy without attenuating medium; (b) simulation study withwater cylinder on an appropriate scale; (c) comparison for thesame collimator mounted on two different detectors (NaI andCZT). . . . . . . . . . . . . . . . . . . . . . . . . . . . . . . 160
5.6 Results of simulation study, CZT-PH=keyword for parallelhole on solid state and ANG=keyword for a classical Angercamera : (a) first order scatter in the phantom; (b) second or-der scatter in the phantom; (3) crystal scatter contribution; (d)summary of scatter contamination. . . . . . . . . . . . . . . . 161
5.7 Scatter contamination in the photopeak window for allthree devices, CZT-RS=keyword for rotating slat device,CZT-PH=keyword for parallel hole on solid state andANG=keyword for a classical Anger camera. . . . . . . . . . 162
5.8 Schematic overview of the strip detector with slat collimator.a(r, rc) is the aperture function at the detector while a′(r′, r′c)is the aperture function at the collimator face with r′, r′c be-ing coplanar. The overlap of a(r, rc) and the projection ofa′(r′, r′c) at the detector (a′(r, rc)) is a measure for the de-tectability. At site (1) perfect overlap and maximum detectabil-ity is shown while at site (2) partial overlap is demonstrated. . 163
5.9 Zoom on two neighbouring slats to visualize the overlap ofthe active detector area (in fading black on the detector) andthe projection of the aperture function at the collimator faceon that area (in grey on the detector). The overlap is outlinedby the hatched region. The degree of overlap between a(r, rc)and a′(r, rc) will determine the behavior of the detector at thatpoint. . . . . . . . . . . . . . . . . . . . . . . . . . . . . . . 164
xvi LIST OF FIGURES
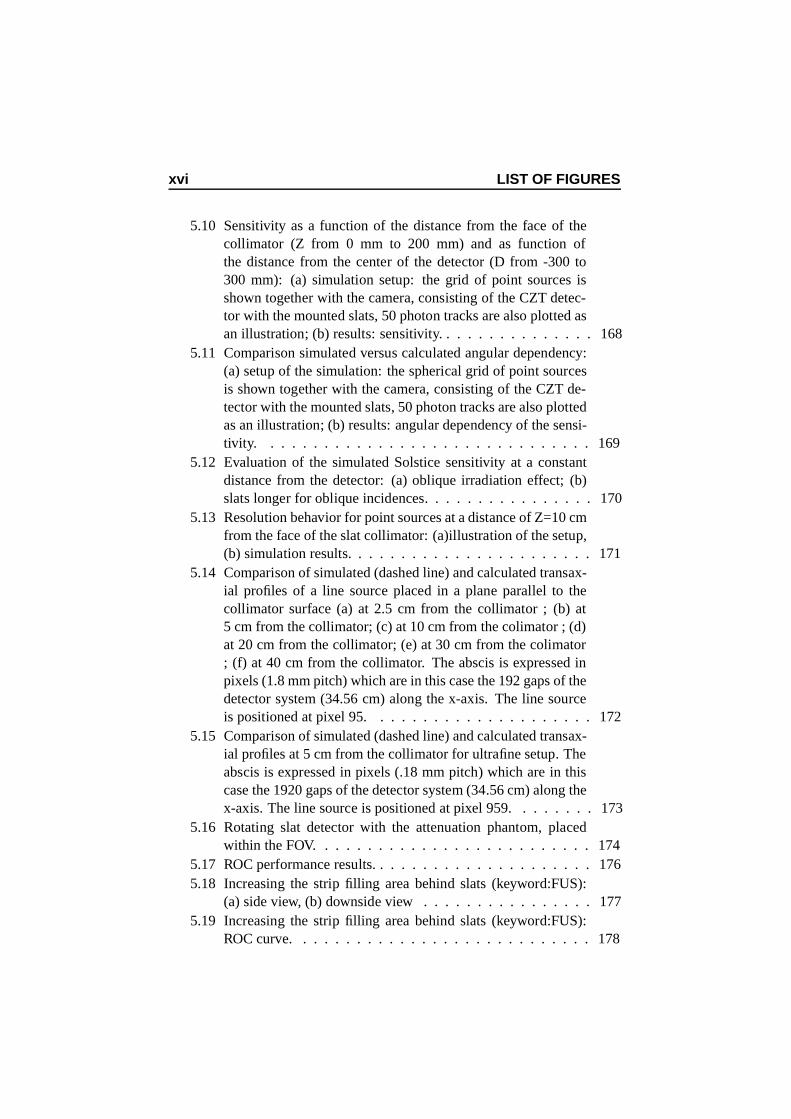
5.10 Sensitivity as a function of the distance from the face of thecollimator (Z from 0 mm to 200 mm) and as function ofthe distance from the center of the detector (D from -300 to300 mm): (a) simulation setup: the grid of point sources isshown together with the camera, consisting of the CZT detec-tor with the mounted slats, 50 photon tracks are also plotted asan illustration; (b) results: sensitivity. . . . . . . . . . . . . . . 168
5.11 Comparison simulated versus calculated angular dependency:(a) setup of the simulation: the spherical grid of point sourcesis shown together with the camera, consisting of the CZT de-tector with the mounted slats, 50 photon tracks are also plottedas an illustration; (b) results: angular dependency of the sensi-tivity. . . . . . . . . . . . . . . . . . . . . . . . . . . . . . . 169
5.12 Evaluation of the simulated Solstice sensitivity at a constantdistance from the detector: (a) oblique irradiation effect; (b)slats longer for oblique incidences. . . . . . . . . . . . . . . . 170
5.13 Resolution behavior for point sources at a distance of Z=10 cmfrom the face of the slat collimator: (a)illustration of the setup,(b) simulation results. . . . . . . . . . . . . . . . . . . . . . . 171
5.14 Comparison of simulated (dashed line) and calculated transax-ial profiles of a line source placed in a plane parallel to thecollimator surface (a) at 2.5 cm from the collimator ; (b) at5 cm from the collimator; (c) at 10 cm from the colimator ; (d)at 20 cm from the collimator; (e) at 30 cm from the colimator; (f) at 40 cm from the collimator. The abscis is expressed inpixels (1.8 mm pitch) which are in this case the 192 gaps of thedetector system (34.56 cm) along the x-axis. The line sourceis positioned at pixel 95. . . . . . . . . . . . . . . . . . . . . 172
5.15 Comparison of simulated (dashed line) and calculated transax-ial profiles at 5 cm from the collimator for ultrafine setup. Theabscis is expressed in pixels (.18 mm pitch) which are in thiscase the 1920 gaps of the detector system (34.56 cm) along thex-axis. The line source is positioned at pixel 959. . . . . . . . 173
5.16 Rotating slat detector with the attenuation phantom, placedwithin the FOV. . . . . . . . . . . . . . . . . . . . . . . . . . 174
5.17 ROC performance results. . . . . . . . . . . . . . . . . . . . . 1765.18 Increasing the strip filling area behind slats (keyword:FUS):
(a) side view, (b) downside view . . . . . . . . . . . . . . . . 1775.19 Increasing the strip filling area behind slats (keyword:FUS):
ROC curve. . . . . . . . . . . . . . . . . . . . . . . . . . . . 178
LIST OF FIGURES xvii
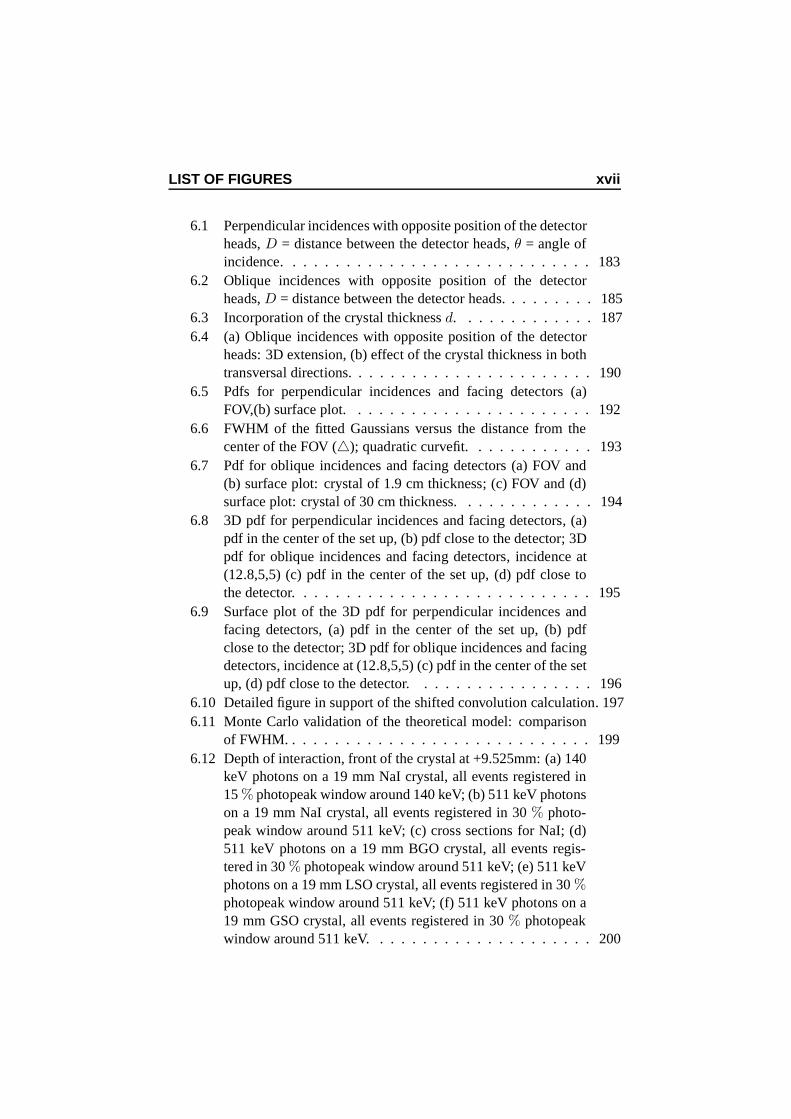
6.1 Perpendicular incidences with opposite position of the detectorheads, D = distance between the detector heads, θ = angle ofincidence. . . . . . . . . . . . . . . . . . . . . . . . . . . . . 183
6.2 Oblique incidences with opposite position of the detectorheads, D = distance between the detector heads. . . . . . . . . 185
6.3 Incorporation of the crystal thickness d. . . . . . . . . . . . . 1876.4 (a) Oblique incidences with opposite position of the detector
heads: 3D extension, (b) effect of the crystal thickness in bothtransversal directions. . . . . . . . . . . . . . . . . . . . . . . 190
6.5 Pdfs for perpendicular incidences and facing detectors (a)FOV,(b) surface plot. . . . . . . . . . . . . . . . . . . . . . . 192
6.6 FWHM of the fitted Gaussians versus the distance from thecenter of the FOV (4); quadratic curvefit. . . . . . . . . . . . 193
6.7 Pdf for oblique incidences and facing detectors (a) FOV and(b) surface plot: crystal of 1.9 cm thickness; (c) FOV and (d)surface plot: crystal of 30 cm thickness. . . . . . . . . . . . . 194
6.8 3D pdf for perpendicular incidences and facing detectors, (a)pdf in the center of the set up, (b) pdf close to the detector; 3Dpdf for oblique incidences and facing detectors, incidence at(12.8,5,5) (c) pdf in the center of the set up, (d) pdf close tothe detector. . . . . . . . . . . . . . . . . . . . . . . . . . . . 195
6.9 Surface plot of the 3D pdf for perpendicular incidences andfacing detectors, (a) pdf in the center of the set up, (b) pdfclose to the detector; 3D pdf for oblique incidences and facingdetectors, incidence at (12.8,5,5) (c) pdf in the center of the setup, (d) pdf close to the detector. . . . . . . . . . . . . . . . . 196
6.10 Detailed figure in support of the shifted convolution calculation. 1976.11 Monte Carlo validation of the theoretical model: comparison
of FWHM. . . . . . . . . . . . . . . . . . . . . . . . . . . . . 1996.12 Depth of interaction, front of the crystal at +9.525mm: (a) 140
keV photons on a 19 mm NaI crystal, all events registered in15 % photopeak window around 140 keV; (b) 511 keV photonson a 19 mm NaI crystal, all events registered in 30 % photo-peak window around 511 keV; (c) cross sections for NaI; (d)511 keV photons on a 19 mm BGO crystal, all events regis-tered in 30 % photopeak window around 511 keV; (e) 511 keVphotons on a 19 mm LSO crystal, all events registered in 30 %photopeak window around 511 keV; (f) 511 keV photons on a19 mm GSO crystal, all events registered in 30 % photopeakwindow around 511 keV. . . . . . . . . . . . . . . . . . . . . 200
xviii LIST OF FIGURES
6.13 Voxel contribution within pdf range dependent on LOR orien-tation. . . . . . . . . . . . . . . . . . . . . . . . . . . . . . . 202
7.1 Detector response : (a) one-dimensional averaged system re-sponse for 128 planes parallel to the detector and for a MEGPsetup, (b) one-dimensional averaged system response for 128planes parallel to the detector and for a LEHR collimator setup. 206
7.2 Reconstructed images (axial view) of a 300 keV medium en-ergy point source. The detector is mounted with a LEHR col-limator: (a) parallel projection MLEM, (b) Monte Carlo basedMLEM. . . . . . . . . . . . . . . . . . . . . . . . . . . . . . 208
7.3 Reconstructed images of a 300 keV medium energy pointsource. The detector is mounted with a LEHR collima-tor: FWHM parallel projection MLEM (dotted line), FWHMMonte Carlo based MLEM (full line). . . . . . . . . . . . . . 208
7.4 Reconstructed images (axial view-high intensity scale) of a170 keV medium energy point source phantom: evaluation ofreconstruction performances for LEHR and MEGP collima-tor: (a) MEGP collimator and parallel projection MLEM, (b)LEHR collimator and parallel projection MLEM, (c) MEGPcollimator and Monte Carlo based MLEM, (d) LEHR collima-tor and Monte Carlo based MLEM. . . . . . . . . . . . . . . . 209
7.5 Reconstructed images (axial view-high intensity scale) of a245 keV medium energy point source phantom: evaluation ofreconstruction performances for LEHR and MEGP collima-tor : (a) MEGP collimator and parallel projection MLEM, (b)LEHR collimator and parallel projection MLEM, (c) MEGPcollimator and Monte Carlo based MLEM, (d) LEHR collima-tor and Monte Carlo based MLEM. . . . . . . . . . . . . . . . 211
7.6 (a) calculation of the natural pixel value formed by LOR i andLOR j. The gray value of the non-uniform strips is the proba-bility that a detection in a LOR originated at a certain point inthe FOV, (b) matrix M containing the natural pixel values fora PET ring with 20 detectors. Each detector combines with 10detectors on the opposite side of the ring. This results in 200possible LORs. . . . . . . . . . . . . . . . . . . . . . . . . . 215
LIST OF FIGURES xix
7.7 (a)Monte Carlo generation of matrix M′
for a PET ring with20 detectors and a virtual parallel projection system: FOV isfilled with uniform activity, (b) an element at each projectionangle is updated with one. The matrix is only square if thenumber of projections equals the number of LORs. . . . . . . 217
7.8 Simulated responses for BGO 2D PET scanner (7 mm large):no position blurring, only crystal scatter and crystal penetration. 218

xx LIST OF FIGURES

List of Tables
1 Bijdragen tot de verstrooiingsorde van het fantoom. . . . . . . 32
3.1 The validation result summaries of commercial systems al-ready or currently considered for GATE validation in SPECT.The column labeled Agreement indicates the percent differ-ences of the Figure Of Merit (FOM) between real and simu-lated data. . . . . . . . . . . . . . . . . . . . . . . . . . . . . 127
3.2 The validation result summaries of commercial systems al-ready or currently considered for GATE validation in PET. Thecolumn labeled Agreement indicates the percent differences ofthe Figure of Merit (FOM) between real and simulated data. . 128
3.3 Prototypes dedicated to small animal imaging modeled usingGATE and features that have been studied using simulateddata. The column labeled Agreement indicates the percent dif-ferences of the Figure of Merit (FOM) between real and simu-lated data. . . . . . . . . . . . . . . . . . . . . . . . . . . . . 129
4.1 Detection chain parameters. . . . . . . . . . . . . . . . . . . . 1474.2 Phantom scatter order contributions. . . . . . . . . . . . . . . 147

xxii LIST OF TABLES
Hoofdstuk 0
NederlandstaligeSamenvatting
0.1 Inleiding
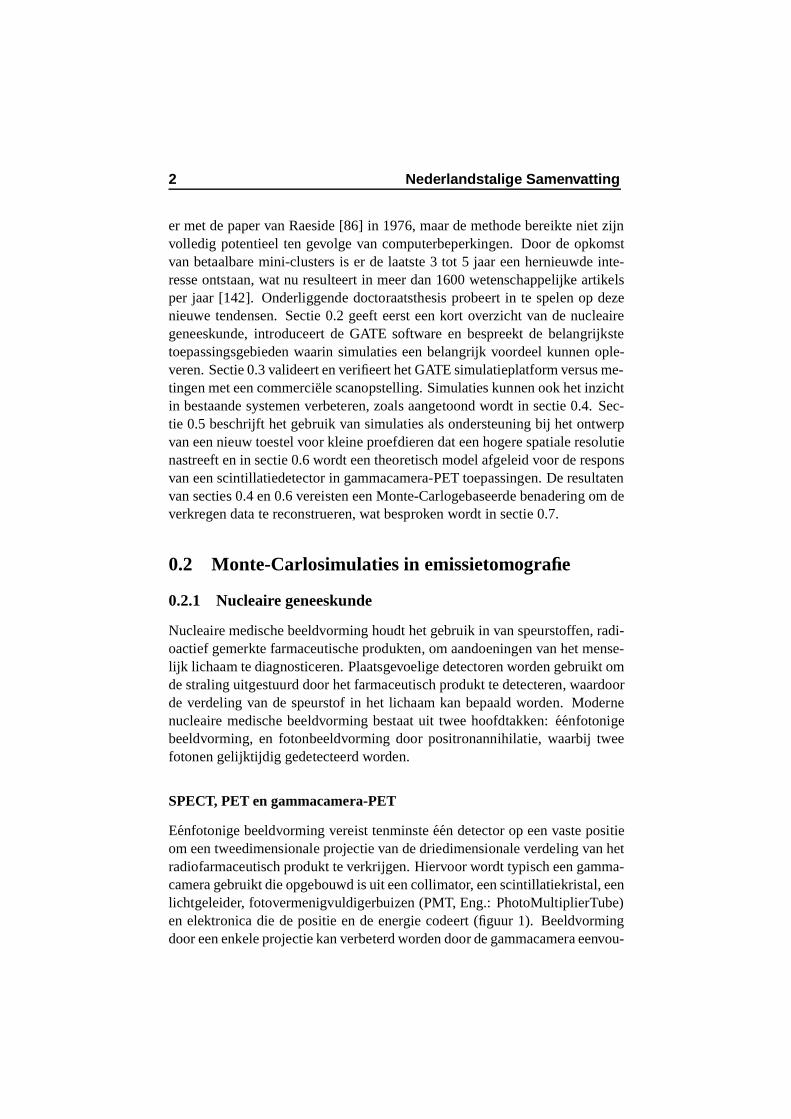
Niet-invasieve diagnostische beeldvorming kan uitgevoerd worden door mid-del van verschillende technieken: technieken die anatomische informatie ge-ven, zoals bijvoorbeeld magnetische-resonantiebeeldvorming (MRI) en ge-computerizeerde tomografie (CT), en technieken die functionele informatieopleveren, onder andere SPECT (Eng.: Single Photon Emission Tomography)en PET (Eng.: Positron Emission Tomography). Recente toestellen combi-neren twee modaliteiten (SPECT/CT-PET/CT) om hardwarematig anatomi-sche en functionele beeldfusie te verkrijgen. Nucleaire geneeskunde heefteen grote maatschappelijke impact gezien men in de oncologie steeds meergeınteresseerd is in een diagnostisch middel dat kwaadaardige aandoeningenin een vroeg stadium kan ontdekken en dat kan gebruikt worden voor classifi-catie van de ziekte. Bij onderzoeken in de nucleaire geneeskunde wordt een ra-diofarmaceutisch produkt ingespoten bij de patient. De gegenereerde fotonenworden gedetecteerd en de verkregen data worden achteraf gereconstrueerdom een driedimensionale verdeling van de radioactieve speurstof in de patientte verkrijgen. Optimalisatie, evaluatie en herontwerp van de elementen in dezebeeldvormingsketen wordt meestal gedaan door gebruik te maken van Monte-Carlosimulaties. Monte-Carlomethoden zijn numerieke berekeningsmethodengebaseerd op willekeurige bemonstering van de variabele. Von Neumann [78]verwees bijgevolg in de naamgeving naar het beroemd gokcentrum in Mo-naco. Deze methoden zijn heel geschikt voor de medische fysica gezien destochastische aard van de stralingsemissie, het deeltjestransport en de detec-tieprocessen. De doorbraak voor Monte-Carlomethoden in dit domein kwam
2 Nederlandstalige Samenvatting
er met de paper van Raeside [86] in 1976, maar de methode bereikte niet zijnvolledig potentieel ten gevolge van computerbeperkingen. Door de opkomstvan betaalbare mini-clusters is er de laatste 3 tot 5 jaar een hernieuwde inte-resse ontstaan, wat nu resulteert in meer dan 1600 wetenschappelijke artikelsper jaar [142]. Onderliggende doctoraatsthesis probeert in te spelen op dezenieuwe tendensen. Sectie 0.2 geeft eerst een kort overzicht van de nucleairegeneeskunde, introduceert de GATE software en bespreekt de belangrijkstetoepassingsgebieden waarin simulaties een belangrijk voordeel kunnen ople-veren. Sectie 0.3 valideert en verifieert het GATE simulatieplatform versus me-tingen met een commerciele scanopstelling. Simulaties kunnen ook het inzichtin bestaande systemen verbeteren, zoals aangetoond wordt in sectie 0.4. Sec-tie 0.5 beschrijft het gebruik van simulaties als ondersteuning bij het ontwerpvan een nieuw toestel voor kleine proefdieren dat een hogere spatiale resolutienastreeft en in sectie 0.6 wordt een theoretisch model afgeleid voor de responsvan een scintillatiedetector in gammacamera-PET toepassingen. De resultatenvan secties 0.4 en 0.6 vereisten een Monte-Carlogebaseerde benadering om deverkregen data te reconstrueren, wat besproken wordt in sectie 0.7.
0.2 Monte-Carlosimulaties in emissietomografie
0.2.1 Nucleaire geneeskunde
Nucleaire medische beeldvorming houdt het gebruik in van speurstoffen, radi-oactief gemerkte farmaceutische produkten, om aandoeningen van het mense-lijk lichaam te diagnosticeren. Plaatsgevoelige detectoren worden gebruikt omde straling uitgestuurd door het farmaceutisch produkt te detecteren, waardoorde verdeling van de speurstof in het lichaam kan bepaald worden. Modernenucleaire medische beeldvorming bestaat uit twee hoofdtakken: eenfotonigebeeldvorming, en fotonbeeldvorming door positronannihilatie, waarbij tweefotonen gelijktijdig gedetecteerd worden.
SPECT, PET en gammacamera-PET
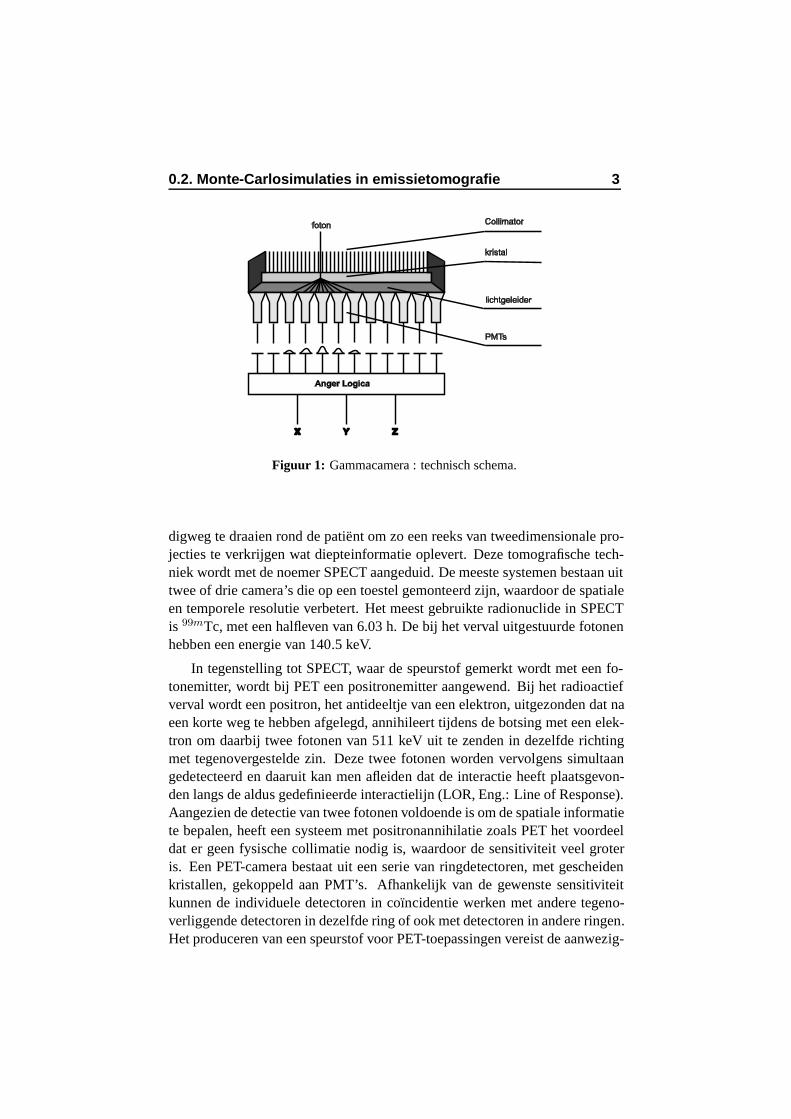
Eenfotonige beeldvorming vereist tenminste een detector op een vaste positieom een tweedimensionale projectie van de driedimensionale verdeling van hetradiofarmaceutisch produkt te verkrijgen. Hiervoor wordt typisch een gamma-camera gebruikt die opgebouwd is uit een collimator, een scintillatiekristal, eenlichtgeleider, fotovermenigvuldigerbuizen (PMT, Eng.: PhotoMultiplierTube)en elektronica die de positie en de energie codeert (figuur 1). Beeldvormingdoor een enkele projectie kan verbeterd worden door de gammacamera eenvou-
0.2. Monte-Carlosimulaties in emissietomografie 3
Anger Logica
X Y Z
Collimator
kristal
lichtgeleider
PMTs
foton
Figuur 1: Gammacamera : technisch schema.
digweg te draaien rond de patient om zo een reeks van tweedimensionale pro-jecties te verkrijgen wat diepteinformatie oplevert. Deze tomografische tech-niek wordt met de noemer SPECT aangeduid. De meeste systemen bestaan uittwee of drie camera’s die op een toestel gemonteerd zijn, waardoor de spatialeen temporele resolutie verbetert. Het meest gebruikte radionuclide in SPECTis 99mTc, met een halfleven van 6.03 h. De bij het verval uitgestuurde fotonenhebben een energie van 140.5 keV.
In tegenstelling tot SPECT, waar de speurstof gemerkt wordt met een fo-tonemitter, wordt bij PET een positronemitter aangewend. Bij het radioactiefverval wordt een positron, het antideeltje van een elektron, uitgezonden dat naeen korte weg te hebben afgelegd, annihileert tijdens de botsing met een elek-tron om daarbij twee fotonen van 511 keV uit te zenden in dezelfde richtingmet tegenovergestelde zin. Deze twee fotonen worden vervolgens simultaangedetecteerd en daaruit kan men afleiden dat de interactie heeft plaatsgevon-den langs de aldus gedefinieerde interactielijn (LOR, Eng.: Line of Response).Aangezien de detectie van twee fotonen voldoende is om de spatiale informatiete bepalen, heeft een systeem met positronannihilatie zoals PET het voordeeldat er geen fysische collimatie nodig is, waardoor de sensitiviteit veel groteris. Een PET-camera bestaat uit een serie van ringdetectoren, met gescheidenkristallen, gekoppeld aan PMT’s. Afhankelijk van de gewenste sensitiviteitkunnen de individuele detectoren in coıncidentie werken met andere tegeno-verliggende detectoren in dezelfde ring of ook met detectoren in andere ringen.Het produceren van een speurstof voor PET-toepassingen vereist de aanwezig-
4 Nederlandstalige Samenvatting
(a) (b)
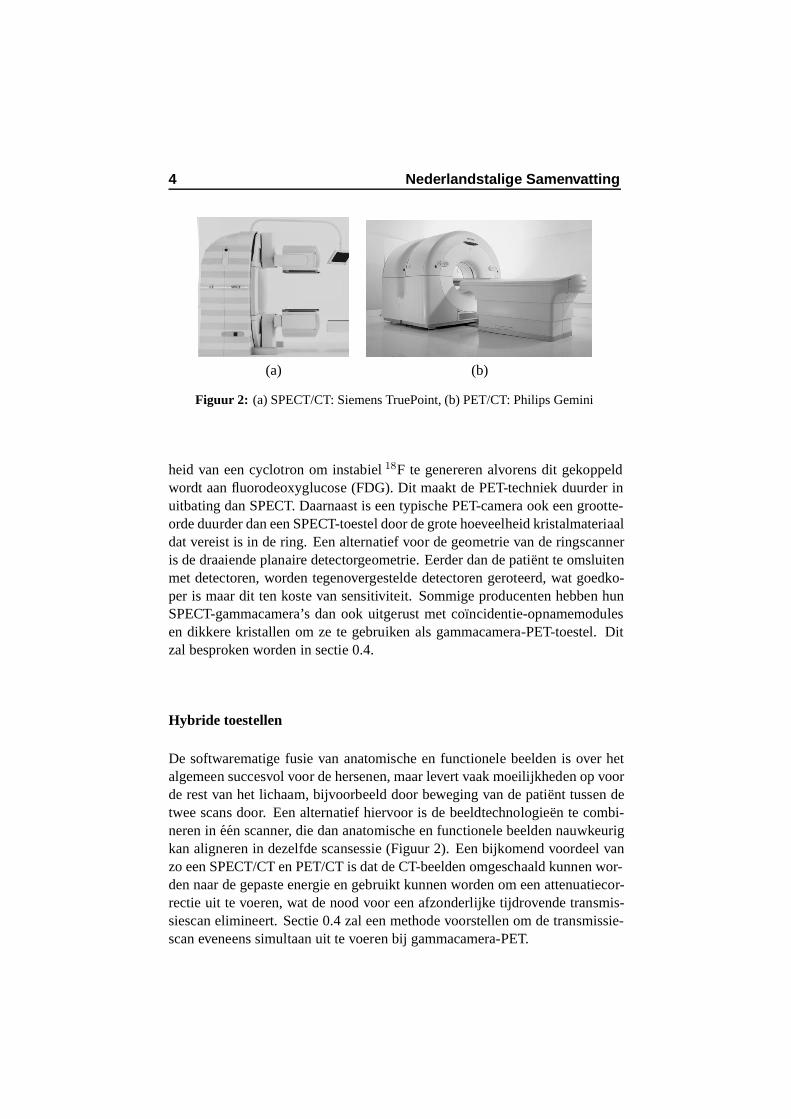
Figuur 2: (a) SPECT/CT: Siemens TruePoint, (b) PET/CT: Philips Gemini
heid van een cyclotron om instabiel 18F te genereren alvorens dit gekoppeldwordt aan fluorodeoxyglucose (FDG). Dit maakt de PET-techniek duurder inuitbating dan SPECT. Daarnaast is een typische PET-camera ook een grootte-orde duurder dan een SPECT-toestel door de grote hoeveelheid kristalmateriaaldat vereist is in de ring. Een alternatief voor de geometrie van de ringscanneris de draaiende planaire detectorgeometrie. Eerder dan de patient te omsluitenmet detectoren, worden tegenovergestelde detectoren geroteerd, wat goedko-per is maar dit ten koste van sensitiviteit. Sommige producenten hebben hunSPECT-gammacamera’s dan ook uitgerust met coıncidentie-opnamemodulesen dikkere kristallen om ze te gebruiken als gammacamera-PET-toestel. Ditzal besproken worden in sectie 0.4.
Hybride toestellen
De softwarematige fusie van anatomische en functionele beelden is over hetalgemeen succesvol voor de hersenen, maar levert vaak moeilijkheden op voorde rest van het lichaam, bijvoorbeeld door beweging van de patient tussen detwee scans door. Een alternatief hiervoor is de beeldtechnologieen te combi-neren in een scanner, die dan anatomische en functionele beelden nauwkeurigkan aligneren in dezelfde scansessie (Figuur 2). Een bijkomend voordeel vanzo een SPECT/CT en PET/CT is dat de CT-beelden omgeschaald kunnen wor-den naar de gepaste energie en gebruikt kunnen worden om een attenuatiecor-rectie uit te voeren, wat de nood voor een afzonderlijke tijdrovende transmis-siescan elimineert. Sectie 0.4 zal een methode voorstellen om de transmissie-scan eveneens simultaan uit te voeren bij gammacamera-PET.
0.2. Monte-Carlosimulaties in emissietomografie 5
Beeldvorming van kleine proefdieren
Deze nieuwe beeldvormingssystemen laten onderzoekers toe om proefdierenop een niet-invasieve wijze te onderzoeken op mutaties of pathologieen, omde progressie van de ziekte vast te stellen en om de reactie op therapie weer tegeven. Op die manier kunnen nieuwe technologieen en geneesmiddelen onder-zocht worden op potentiele humane toepassingen. Verschillende modaliteitenzijn reeds gevalideerd en beschikbaar voor onderzoeksdoelen zoals microCT,microPET, microSPECT (enkel- en meervoudige kegelgatcollimator, spleet-collimator, vlakkencollimator) en optische beeldvorming.
Reconstructie
Beeldreconstructie van projectiedata verkregen onder verschillende hoekenkan op verschillende manieren uitgevoerd worden: analytische reconstructie,deterministische iteratieve reconstructie en statistische iteratieve reconstructie.Een deterministisch model wordt verkregen wanneer de systeemkarakteristie-ken in rekening gebracht zijn. Dit systeem kan dan algebraısch opgelost wor-den. Het reconstructieprobleem kan ook statistisch voorgesteld worden metals grote voordeel dat een kleinere variantie verkregen wordt als de geschiktemodellen, zoals een Poissonmodel voor radioactief verval, en een Gaussiaansmodel voor detectorrespons, gebruikt worden. Iteratieve reconstructietechnie-ken zijn in staat om beelddegraderende effecten in het reconstructiealgoritmein te bouwen om de resulterende kwaliteit van het gereconstrueerde beeld teverbeteren. Het succes van een iteratief algoritme hangt grotendeels af van dejuistheid waarmee de systeemmatrix gemodelleerd wordt. De meest realisti-sche oplossing maakt gebruik van een Monte-Carlogesimuleerde driedimensi-onele projector. Dit wordt in meer detail besproken in sectie 0.7
0.2.2 GATE, een simulatieplatform voor SPECT en PET
Er was nood aan een Monte-Carlocode die in staat is om complexe PET-,en SPECT-geometrieen alsook andere beeldvormingsconfiguraties op een ge-bruiksvriendelijke manier te implementeren, rekening houdend met tijdssyn-chronisatie, en waarbij de uitgebreide en accurate fysische modelleringsmoge-lijkheden van algemene simulatiepakketten behouden blijven. Zo een simula-tieplatform werd ontwikkeld binnen het OpenGATE-samenwerkingsverband.
OpenGATE collaboratie: geschiedenis en doelstellingen
De oorsprong van GATE loopt terug tot een werkvergadering georganiseerd injuli 2001 in Parijs, waar de aandacht uitging naar de toekomst van Monte-
6 Nederlandstalige Samenvatting
Carlosimulaties in de nucleaire geneeskunde. De consensus was om deGeant4-simulatietoolkit ontwikkeld in C++ te kiezen als vertrekpunt, en omlangetermijn ondersteuning en in onderhoud te voorzien door de ontwikkelingvan de code te verdelen over meerdere onderzoeksgroepen. De onderzoeks-groepen betrokken bij de initiele ontwikkeling van de GATE-software, UNILte Lausanne, ELIS te Gent en LPC te Clermont-Ferrand, besloten in januari2002 een OpenGATE-samenwerkingsverband op te starten. De basisimple-mentatie en validatie van GATE werd door deze onderzoeksgroepen uitgevoerden resulteerde in 4 publicaties over de grondslagen van GATE [73,92,107,111].Nadien groeide het samenwerkingsverband heel snel tot het 21 leden uit Eu-ropa, Noord-Amerika en Azie telde. Er werd ook een grote inspanning ge-daan om GATE voldoende flexibiliteit mee te geven met als doel het gemak-kelijk modelleren van nieuwe detectiesystemen [104] zodanig dat het platformonafhankelijk is van zijn conceptietijdstip, wat veelal niet het geval is metspecifieke PET- en SPECT-simulatiepakketten. Een praktisch voorbeeld zaltoegelicht worden in sectie 0.5. Na een initiele validatie, die in sectie 0.3 be-sproken zal worden, werden meer inspanningen gedaan om te verifieren ofhet GATE-simulatieplatform nuttig zou zijn in klinische toepassingen [106].Dit zal het geval blijken te zijn in sectie 0.4. Momenteel wordt geconcen-treerd op verdere verbetering van de digitalisator om het rekenproces nauw-keuriger te maken [91, 97, 103]. Sectie 0.6 zal een accuraat theoretisch mo-del voor de spatiale resolutie in continue detector PET voorstellen dat kangeıncorporeerd worden als een nauwkeurige resolutiemodule in de digitali-sator. Op de “Satellite Workshop” over GATE (MIC 2003, Portland USA)kondigde het OpenGATE-samenwerkingsverband de eerste openbare vrijgavevan GATE aan, die plaatsvond op 7 mei 2004. De ultieme doelstelling van hetOpenGATE-samenwerkingsverband is om GATE verder te ontwikkelen en tevalideren, zodat het een gouden standaard wordt voor Monte-Carlosimulatiesin de nucleaire geneeskunde [4, 68].
Onderliggend manuscript heeft in eerste instantie bijgedragen tot de ont-wikkeling en validatie voor SPECT vanaf de beginfase. In een later stadiumheeft dit onderzoek de ontwikkeling van PET-digitalisatormodules opgeleverdnaast uitbreidingen voor Monte-Carlogebaseerde reconstructies. Bovendienheeft deze doctoraatsthesis het gebruik van gevoxelizeerde patientdata moge-lijk gemaakt.
GATE: basiseigenschappen
Softwarearchitectuur: de softwarecomponenten van GATE moeten alge-meen genoeg zijn om herbruikt te kunnen worden van de ene context naar
0.2. Monte-Carlosimulaties in emissietomografie 7
de andere en een modulaire opbouw moet ervoor zorgen dat GATE in staat isom te evolueren wanneer innovatieve toepassingen in zicht komen. Daaromwerd een gelaagde softwarestructuur geımplementeerd met een kernlaag, eentoepassingslaag en een gebruikerslaag. De kernlaag bevat alle klasses die ver-eist zijn in Geant4-gebaseerde simulaties: gebeurtenisgeneratie, interactiefy-sica,... en bovendien ook klasses die specifiek zijn voor GATE-simulaties zoalshet virtueel klokobject dat alle processen synchroniseert. De kernlaag bestaatdaarnaast ook uit basisklasses, dit zijn klasses die een groep componentenbepalen met een set gemeenschappelijke eigenschappen. Met andere woor-den, de kernlaag omvat dus de basismechanismen die in GATE beschikbaarzijn voor geometriebepaling, tijdsbeheer, bronbepaling, digitalisatie en data-uitvoer. De toepassingslaag daarentegen bestaat uit klasses die afgeleid zijnvan de basisklasses om specifieke processen of objecten te modelleren zoalsbijvoorbeeld translaties afgeleid van de bewegingsbasisklasse. Elke GATE-klasse voorziet in een aanvulling die de opdracht vertaalt, zodat de functiona-liteit van de klasse beschikbaar is door middel van tekstcommando’s die ophun beurt de gebruikerslaag vormen. Een compleet simulatiescript kan in achtstappen omschreven worden: (1) camerageometrie, (2) fantoomgeometrie, (3)acquisitiesysteem, (4) tijdsparameters, (5) formaat van de data-uitvoer, (6) fy-sische processen, (7) radioactieve bron(nen) en (8) commentaarniveau. Voorelke stap kan een specifieke macro gedefinieerd worden, opgebouwd uit stan-daard GATE-commandolijnen.
De fysica: de elektromagnetische interacties gebruikt in GATE, zijn afgeleidvan Geant4. Zoals in Geant4, kan ook GATE twee verschillende pakketten ge-bruiken om elektromagnetische processen te simuleren: het standaardenergie-pakket en het lage-energiepakket. Voor biomedische toepassingen levert hetlage-energiepakket een nauwkeuriger model van de interacties, maar dit tenkoste van een toegenomen rekentijd. GATE omvat ook twee specifieke modu-les voor PET. De eerste module gebruikt het von Neumannalgoritme [133] omeen analytisch β+ spectrum te bemonsteren, en in de tweede module wordt deintrinsieke niet-collineariteit van de twee annihilatiefotonen geıncorporeerd,wat immers niet in rekening gebracht wordt bij Geant4. GATE erft de mo-gelijkheid van Geant4 om grenzen te stellen aan de productie van secundaireelektronen, X-stralen en deltastralen. Ook worden alle boven de grens gege-nereerde deeltjes gevolgd tot het einde van hun bereik, dit in tegenstelling totandere Monte-Carlocodes.
Geometrie: het volume van de “wereld” is de top van de volumehierarchieen bepaalt het referentiekader van de simulatie. Het kan een of meerdere sub-
8 Nederlandstalige Samenvatting
volumes bevatten, dochtervolumes genoemd. Zoals in Geant4 gebruikt ookGATE erfelijkheid tussen klassen om die bijzondere volumehierarchie af teleiden. Een logisch volume wordt bepaald door al zijn eigenschappen (naam,vorm, grootte en materiaalsamenstelling) behalve zijn positie in de wereld.Toegang tot een materiaaldatabasebestand is de methode om materiaaleigen-schappen toe te kennen aan volumes en om hun werkzame doorsnedes te ken-nen. Wanneer logische volumes op bepaalde posities geplaatst worden, vor-men ze fysische volumes. Dit laatste kan gebeuren door elementaire geome-trische transformaties die logische volumes in meerdere posities en orientatiesrepliceren en plaatsen om aldus fysische volumes te vormen.
Een van de kerneigenschappen van GATE is de mogelijkheid om hits telokaliseren in individuele detectoren en vervolgens pulsen te creeren. De be-paling van de posities van de individuele detectoren in een scanner is echter eenbelangrijke en moeilijke taak in het genereren van de uitvoer. Om het modelle-ringsproces te vereenvoudigen en om in een toegewijde hierarchische uitvoerte voorzien, worden voorgedefinieerde globale systemen gebruikt. De meestevan de geometrische concepten zijn immers gemeenschappelijk aan verschil-lende beeldvormingssystemen. Een PET scanner bijvoorbeeld bestaat typischuit een of meerdere ringen die opgebouwd zijn uit blokken, onderverdeeld inindividuele kristallen. Die opbouw is bijgevolg ondergebracht in een systeemdat bestaat uit een groep van geometrieen dat compatibel is met een of meer-dere formaten van data-uitvoer. Het gebruik van systemen bij het modellerenvan nieuwe acquisitieopstellingen zal aangewend worden in sectie 0.5.
Brondefinities: de ruimtelijke verdeling van een GPS-bron (Eng.: GeneralParticle Source) kan gespecificeerd worden door gebruik te maken van vijftweedimensionale vormen (cirkel, annulus, ellips, vierkant en rechthoek) envier driedimensionale vormen (bol, ellipsoıde, cilinder en parallellepipedum).Een GPS kan bovendien gelimiteerd worden tot een willekeurig element van degeometrie. De emissiesectoren kunnen afgelijnd worden door middel van eenazimuthale en een polaire hoek. Positronbereik en gamma-acollineariteit kanaan de brondefinitie toegevoegd worden voor PET-toepassingen. Een belang-rijke klinische uitbreiding zijn de gevoxelizeerde, niet-homogene, antropo-morfe bronnen, gebaseerd op ingelezen digitale fantoom- of patientdata [105].Naast de bronverdeling kan ook de patientgeometrie als gevoxelizeerde attenu-atiemap ingelezen worden om de meest realistische simulaties te kunnen na-streven.
0.2. Monte-Carlosimulaties in emissietomografie 9
GATE: tijdsbeheer
Een van de kenmerkende eigenschappen van GATE is het beheer van de tijds-afhankelijke verschijnselen, zoals beweging van een detector of de kinetiekvan het bronverval. De synchronisatie van de bronkinetiek met de bewegingvan de geometrie laat toe om realistische acquisities te simuleren, met inbegripvan beweging, ademhaling en hartritmes van de patient, rotatie van de scannerof veranderingen van de activiteitsverdeling in de tijd. Vanuit het oogpunt vantijdsbeheer kan de simulatie ingedeeld worden in: (a) bepaling van de bewe-gingen geassocieerd met de fysische volumes die de detector en het fantoomof de patient beschrijven; (b) beschrijving van de radioactieve bronnen, en(c) specificatie van de start- en stoptijden van de acquisitie. Een correcte enaccurate synchronisatie van gebeurtenissen laat de modellering toe van tijds-afhankelijke processen zoals telkadans, toevallige coıncidenties, opeenhopingvan pulsen, dode tijd in de detector en simultane emissie/transmissiestudies,hetgeen besproken zal worden in sectie 0.4.
GATE: digitalisatie
De digitalisatie is het proces waarbij de elektronicarespons van een detectorgesimuleerd wordt. Dit houdt de omzetting in van de deeltjesinteracties naarenergiebins, detectieposities en naar coıncidenties bij PET. Dit is een sleutelei-genschap in GATE die het nauwkeurig simuleren van het gedrag van realisti-sche scanners toelaat. Om dit te doen zijn delen van de geometrie ontworpenals sensitieve detectoren, die deeltjesinteracties (hierna hits genoemd) in diewelbepaalde fysische volumes registreren en opslaan. Informatie over interac-ties in niet-sensitieve volumes wordt niet bijgehouden. In GATE zijn twee ty-pes sensitieve detectoren gedefinieerd: de kristalsensitieve detector (kristalSD)en de fantoomsensitieve detector (fantoomSD). De kristalSD wordt gebruiktom hits (interacties), die in de detectoronderdelen van de scanner voorkomen,te genereren. De fantoomSD wordt gebruikt om Compton- en Rayleighin-teracties, die voorkomen in het gezichtsveld (FOV, Eng.: Field of View) vande scanner, te detecteren en te tellen. De bedoeling van de digitalisatieketenis het reproduceren van een realistisch waarnemingsproces door de relevantefysische waarneembare grootheden uit de hits af te leiden. De digitalisatorbestaat uit een keten van verwerkingsmodules (Figuur 3) die een lijst van hitsaannemen van de sensitieve detectoren en deze transformeert in pulsen, tellengenoemd. De sleutelelementen van deze keten worden hierna kort besproken.
Hittoevoeger: een deeltje dat een sensitieve detector binnendringt kan meer-dere hits genereren (ten gevolge van meerdere Comptoninteracties bijvoor-
10 Nederlandstalige Samenvatting
Hittoevoeger Pulslezer
energie-respons
spatialerespons
venster-elektronica dode tijd
pulsen
digitalisatiemodule
Tel
Figuur 3: De digitalisator bestaat uit een keten van verwerkingsmodules die een lijstvan hits aannemen en verwerken tot een tel die een fysisch waarneembare grootheidis.
beeld). De hittoevoeger voegt de afgestane energie van deze hits samen persensitieve detector om een puls te verkrijgen. De positie van die puls wordtbepaald als de energie-gewogen centroıdepositie van de constituerende hits.Als een deeltje interageert in verschillende sensitieve detectoren zal de hittoe-voeger een lijst van pulsen genereren, een voor elke sensitieve detector.
Pulslezer: scanners (met uitzondering van deze met een een-op-een uitlees-schema) hebben gewoonlijk een uitleessegmentatie die verschillend is van dedetectorsegmentatie. Om dit te simuleren voegt een pulslezermodule de pulsensamen in een door de gebruiker gedefinieerde groep van sensitieve detectoren.Dit resulteert in een grotere puls met als positie die sensitieve detector waar demeeste energie werd afgezet (winnaar krijgt alles-paradigma).
Gebruikersmodules: de overige modules van de digitalisatieketen transfor-meren deze pulsen in de fysische waarneembare grootheden van de scanner,de tellen. Deze modules zijn energieresolutie, energiebereik, spatiale resolu-tie, tijdsresolutie, dode tijd en een coıncidentiesorteerder voor PET. Anderedoor de gebruiker gedefinieerde modules kunnen individueel toegevoegd wor-den om meer specifieke eigenschappen te modelleren. Het gebruik van eengeschikte digitalisatieketen maakt het mogelijk om nauwlettend de elektroni-carespons van de detector te reproduceren.
DigiGATE: voor de optimalisatie van de parameters van de digitalisator ishet aangewezen om de resultaten van verschillende digitalisatieparameters tevergelijken met metingen. Om deze specifieke taak uit te voeren beschiktGATE over een bewerkingsprocedure die DigiGATE genoemd wordt. In dezeprocedure worden hits gelezen uit een gesimuleerde databestand en onmiddel-lijk doorgegeven aan de digitalisator. Alle condities zijn identiek, met inbegrip
0.2. Monte-Carlosimulaties in emissietomografie 11
van de tijdsafhankelijkheid zodanig dat nieuwe tijdsrovende simulaties verme-den worden bij het evalueren van de digitalisatorparameters.
Rekentijd
Een typische PET-simulatie genereert en volgt 852 gebeurtenissen per secondeop een 1 GHz computer. Dit resulteert typisch in 16 coıncidenties per secondevoor de GATE testopstelling die bestaat uit een hypothetische PET-scanner.Voor de SPECT-testopstelling worden 417 gebeurtenissen gegenereerd en ge-volgd wat slechts resulteert in 0.83 detecties per seconde. Er zijn vier oorza-ken voor de hoge rekentijd bij de simulaties met collimator. Het totaal aantalgeregistreerde tellen in SPECT is minder dan 0.02 % van de gegenereerde ge-beurtenissen, omdat de collimator voor het kristal de meeste van de inkomendefotonen stopt en daarbij alle optredende processen registreert. Een tweede oor-zaak is dat GATE elk foton doorheen elk object van het experiment volgt.Ten derde werden tot nu toe geen variantiereductiemethoden gebruikt, maardaarop wordt onderzoek uitgevoerd binnen onze groep [34]. Tenslotte werdde emissiehoek niet beperkt tot een vast bereik om de verstrooiingsproces-sen in de fantomen of de terugverstrooiing van de tweede detectorkop niet tebeınvloeden.
0.2.3 Belang van nauwkeurige Monte-Carlomodellering in nucle-aire geneeskunde
Monte Carlo is de enige mogelijke benadering voor alle toepassingen waar me-tingen niet uitvoerbaar zijn en waar analytische modellen niet beschikbaar zijnten gevolge van de complexe aard van het probleem [2, 76]. De vier hoofd-toepassingsgebieden van Monte-Carlomodellering in de nucleaire medischebeeldvorming worden hieronder in detail besproken.
Correctietechnieken voor attenuatie en verstrooiing
De aanwezigheid van verstrooiing en attenuatie in nucleaire medische beeldenbeperkt de nauwkeurigheid van de activiteitskwantificatie. Verstrooiing brengtgeen belangrijke artefacten teweeg, in tegenstelling tot attenuatie, maar ver-mindert het contrast door laagfrequente vaagheid toe te voegen in het beeld.Monte-Carloberekeningen zijn krachtige instrumenten in attenuatie- en ver-strooiingscorrectie, aangezien de gebruiker de mogelijkheid heeft om de ge-detecteerde fotonen op te delen in hun componenten of naargelang hun inter-actiegeschiedenis. Monte-Carlomodellering laat dus een gedetailleerd onder-zoek toe van de ruimtelijke- en de energieverdeling van Comptonverstrooiing:
12 Nederlandstalige Samenvatting
energiespectra, puntspreidingsfuncties en verstrooiingsfracties kunnen gesi-muleerd worden. Heel wat onderzoek en ontwikkeling werd geconcentreerdop verstrooiingscompensatie voor kwantitatieve SPECT [6, 8, 9, 11]. Vooral ingevallen waar simultaan een transmissie- en een emissiescan wordt opgeno-men blijken Monte-Carlosimulaties onmisbaar. Dit zal geıllustreerd wordenin sectie 0.4. In PET zijn enkele basisbenaderingen gevolgd voor verstrooi-ingscorrectie [58]. Hier zijn Monte-Carlosimulaties vooral belangrijk om deinvloed van de verstrooiingsorde en de verhouding tussen object- en detector-verstrooiing te kunnen inschatten, om er vervolgens op een afdoende maniervoor te kunnen corrigeren in een iteratief algoritme. Dit zal eveneens toegelichtworden in sectie 0.4.
Afbeeldingssystemen en ontwerp van collimatoren
Modellering van beeldformatie is een van de belangrijkste redenen van hetbestaan van Monte-Carlosimulaties in de nucleaire geneeskunde. Monte-Carlomethodes kunnen belangrijke bijdragen leveren tot de ontwikkeling vannieuwe collimatorontwerpen, nieuwe detectorconstructie, nieuwe elektronicaen geoptimaliseerde camerabewegingen [137]. In sectie 0.5 zullen de simu-laties toegelicht worden voor een nieuw SPECT-ontwerp dat een hogere reso-lutie beoogt. Het bestaat uit een vaste-stof-strookdetector gekoppeld aan eenroterende-vlakkencollimator. De laatste jaren werden Monte-Carlosimulatiesin systeemontwerp ook vaak gebruikt om potentiele ontwerpen van positron-tomografen voor kleine proefdieren te bestuderen [56, 97].
Modellering van de detector
Monte-Carlosimulaties van detectorresponsen en -efficienties zijn uitermatebelangrijk aangezien het scintillatiekristal de kritieke component is in emis-sietomografie. Een belangrijk interesseveld is resolutieherstel bij PET. Depenetratie van annihilatiefotonen in het detectormateriaal voor de interactie,is een statistisch proces dat leidt tot aanzienlijke verplaatsing en anisotropievan de puntspreidingsfunctie [60, 103]. Compensatie voor kristalpenetratie isdus de belangrijkste uitdaging om de spatiale resolutie bij PET te verbeteren.Theoretische modellen voor die anisotrope spatiale resolutie kunnen alleen ge-verifieerd worden door Monte-Carlosimulaties aangezien deze experimentenafhangen van de interactiediepte, wat heel moeilijk empirisch te bepalen ismet de huidige toestellen. Dit zal uitgebreid besproken worden in sectie 0.6.Monte-Carlosimulaties bewijzen ook hun nut bij het ontwerp van TOF (Eng.:Time Of Flight) PET, waar verschillende detectorkristallen getest kunnen wor-den en waar de invloed van tijdsresolutie op variantiereductie kan gesimuleerd
0.2. Monte-Carlosimulaties in emissietomografie 13
worden [15, 80, 112].
Algoritmen voor beeldreconstructie
Monte-Carlosimulaties zijn heel nuttig gebleken voor validatie en vergelij-kende evaluatie van beeldreconstructietechnieken, aangezien het mogelijk isom een referentiebeeld te verkrijgen waarmee de gereconstrueerde beeldenvergeleken dienen te worden. Een ander onderzoeksdomein is de Monte-Carlogebaseerde reconstructie. In parallelle-bundel-SPECT gebeurt de recon-structie meestal als een verzameling van 2D analytische of iteratieve recon-structies. Om expliciet rekening te houden met het 3D karakter van het beeld-vormingsproces, kan een gesimuleerde 3D projector, die de 3D fotonspreidingmodelleert en ook alle andere beelddegraderende effecten in rekening brengt,gebruikt worden in een volledig 3D reconstructiealgoritme. Bij PET is dehoofddoelstelling het resolutieherstel door incorporatie van detectorrespons-functies in de reconstructie. Sectie 0.7 zal het incorporeren in de reconstructievan gesimuleerde responsfuncties bespreken daar sectie 0.4 en sectie 0.6 zul-len aantonen dat interkristalverstrooiing en kristalpenetratie belangrijke beeld-degraderende effecten zijn. De detectorrespons simuleren vermijdt dat dezeanalytisch berekend moet worden.
Toepassingen in andere domeinen
Monte-Carlosimulaties worden in radionuclidebehandelingen, brachytherapie,hadrontherapie en radiotherapieonderzoek in grote mate gebruikt voor dosi-metrische doeleinden. Hybride toestellen zoals SPECT/CT en PET/CT zullenin radiotherapeutische behandelingen toelaten om het geplande doelvolumeop CT beter af te lijnen. Nauwkeurige Monte-Carlosimulaties moeten over-eenkomstig gebruikt worden in het virtuele planningsysteem van de behande-ling om de meest precieze schattingen van de dosis te handhaven [25]. DeSPECT/CT- of PET/CT-beelden samen met de precisie van de dosimetrischeMonte-Carlosimulaties zullen dus rechtstreeks de accuraatheid van de bestra-lingen beınvloeden en de colaterale schade aan functionele organen verminde-ren.
0.2.4 Besluit en originele bijdragen
In deze sectie werd een kort overzicht gegeven van nucleaire geneeskundeen bijhorende instrumentatie om de doelstellingen van onderliggend proef-schrift te situeren. De GATE-implementatie waartoe dit proefschrift bijgedra-gen heeft, resulteerde in twee samenwerkingsartikels [4, 68]. Daarnaast werd
14 Nederlandstalige Samenvatting
de klinische aanvulling besproken die ervoor zorgt dat digitale patientendatakunnen ingelezen worden door de simulator als een bronverdeling of als een at-tenuatiegeometrie [105]. Tenslotte werd een grondige literatuurstudie voorge-steld in deze sectie waaruit vier hoofdtoepassingen van Monte-Carlomethodesin nucleaire medische beeldvorming blijken. Deze worden in het vervolg vandit hoofdstuk in afzonderlijke secties besproken na de GATE-validatie die be-discussieerd wordt in de volgende sectie.
0.3 Validatie
0.3.1 Inleiding
In deze sectie tonen we validatieresultaten van GATE gebaseerd op devergelijking van simulaties versus experimentele data, verkregen met eenstandaard SPECT-camera. Fotoelektrisch effect, Compton- en Rayleigh-verstrooiing zijn inbegrepen in de simulaties van het gammatransportproces.De belangrijkste componenten van de scintillatiecamera werden gemodel-leerd. Meer specifiek werden een lage-energie en hoge-resolutie (LEHR, Eng.:Low Energy High Resolution) parallelle-bundelcollimator en een medium-energie en algemeen-gebruik (MEGP, Eng.: Medium Energy General Pur-pose) parallelle-bundelcollimator gemodelleerd, zo accuraat mogelijk gelij-kend op de reele vorm. In deze validatiestudie vergeleken we de gesimuleerdeen gemeten energiespectra van verschillende isotopen: 99mTc, 22Na, 57Co en67Ga. De sensitiviteit werd geevalueerd door gebruik te maken van bronnen opvarierende afstanden tot het detectoroppervlak. Onderzoek van de verstrooi-ingscomponent werd uitgevoerd in verschillende energievensters bij verschil-lende afstanden tot de detector en voor verschillende attenuatiegeometrieen.Spatiale resolutie werd geevalueerd door gebruik te maken van een99mTc bronop varierende afstanden.
0.3.2 Modellering van de basisgeometrie
De camera die gebruikt werd voor de validatie is een tweekoppige AXIS-camera, gefabriceerd door Philips Medical Systems. Elke detectorkop be-vat een 54 cm (transaxiaal) op 38 cm (axiaal) NaI-kristal met een dikte van0.95 cm. De uitlezing gebeurt door PMT’s en in optimale condities is de ener-gieresolutie 9.5 % bij 140.5 keV en is de intrinsieke spatiale resolutie 0.33 cm.Het gedetailleerd simulatiemodel van de geometrie van de detectorkop vertrektvan de collimator, dan het kristal in zijn verpakking, de lichtgeleider, de PMT’sen de compressieplaat, de luchtisolatie, de loden sluiting tot de beschermkap.
0.3. Validatie 15
L
(a) (b) (c)
L
mm
mm
(d) (e) (f)
Figuur 4: Simulatie van de septale penetratie van een puntbron voor twee types vancollimatoren: (a) detail gegoten collimator (lengte L); (b) transversaal beeld van eengegoten collimator; (c) gegoten collimatorpenetratie; (d) detail collimatorplaat; (e)transversaal beeld van een geplooide collimator; (f) geplooide collimatorpenetratie.
Om nauwkeurige modellen van LEHR- en MEGP-collimatoren te verkrijgen,moeten de luchtopeningen overeenkomstig de technische specificaties (diame-ter van de opening en de septale dikte) gemodelleerd worden. De loden colli-mator is gemodelleerd door het periodiek herhalen van een hexagonale lucht-opening in een rechthoekige matrix. Deze matrix werd dan opgevuld met eenverschoven duplicaat om een hexagonale dichtste stapeling te verkrijgen. Inrealiteit kan een collimator op twee verschillende manieren vervaardigd wor-den: door het gieten in een vorm of door het plooien van platen (Figuur 4). Inhet eerste geval zullen de schotten dezelfde dikte hebben in alle richtingen, inhet tweede geval zal de septale dikte in de ene richting het dubbele zijn van dedikte in de andere richtingen. Men ziet bij geplooide collimatoren vier stree-partefacten (figuur 4(f)) in plaats van zes (figuur 4(c)) en er is in het spectrumminder bijdrage rond de X-stralenpiek van lood. De constructiewijze heeft eenbelangrijke invloed op het energiespectrum, de sensitiviteit en de spatiale re-solutie. Na het nemen van radiografische opnames van de collimator kondenwe concluderen dat we met een geplooid collimatorontwerp te maken hadden.
16 Nederlandstalige Samenvatting
0.3.3 Evaluatie van de energiespectra
Energieresolutiemodule
Het scintillatieproces en optisch fotonentransport werden niet gemodelleerdvoor SPECT, maar in de plaats daarvan werd een energievervager gebruikt.We implementeerden de energiemodule om een energieafhankelijke spectraleresolutie te verkrijgen volgens ∼ 1/
√E (sectie 0.2.2 [99]) met een resolutie
van 9.5 % bij 140.5 keV, zoals opgegeven door de producent van de detector.In figuur 5(a) worden het gesimuleerde spectrum en het opgemeten spectrumvan een 99mTc-bron in lucht op 15 cm van de detector vergeleken. Er werd eengoede overeenkomst gevonden wat betreft de energie en hoogte van de fotopieken van de lood X-stralenpiek. Men kan concluderen uit de algemene gelijkheidvan de vorm dat de camera goed gemodelleerd is en dat de verstrooiingspro-cessen in de detector nauwgezet gesimuleerd worden. Figuur 5(b) visualiseerthet spectrum van de 99mTc-bron in een attenuatie- en verstrooiingsmedium op10 cm van de detector. De simulatie en het experiment komen volledig over-een wat betreft de toegenomen bijdrage bij lagere energieen, veroorzaakt doorfotonen die verstrooid werden in het met water gevulde fantoom.
Vorm van de energiespectra bij verschillende isotopen
We hebben ook een evaluatie uitgevoerd voor verschillende andere isotopen.De energieresolutiemodule beschreven in de vorige sectie werd aangepast omde juiste energieresolutie bij de gepaste belangrijkste fotopiekenergie voor elkisotoop toe te laten (sectie 0.2.2). De validatie-experimenten werden uitge-voerd zonder een collimator, met de bron van elk isotoop op 20 cm van dedetectorkop geplaatst. Voor 22Na, 57Co en 67Ga, die verschillende energie-distributies en fotopiekenergieen hebben, worden de experimentele spectraledistributies perfect gereproduceerd door de simulaties, hetgeen bewijst dat deenergievervager een breed energiebereik bestrijkt.
0.3.4 Sensitiviteitsvalidatie
We hebben ook de absolute sensitiviteit (in cps/MBq) van het GATE-modelvan onze detector geevalueerd, gebruik makend van een 57Co-bron van9.3 MBq ± 3 %. We voerden een planaire acquisitie van deze bron uit ge-durende 600 s en registreerden het totaal aantal tellen. We simuleerden het-zelfde experiment met GATE. De absolute sensitiviteit gemeten met de 57Co-bron was 231 ± 17 cps/MBq, de gesimuleerde absolute sensitiviteit 246 ±16 cps/MBq, een verschil van slechts 6.1 % met de experimentele waarde.Deze discrepantie is waarschijnlijk te wijten aan het gebrek aan kennis over het
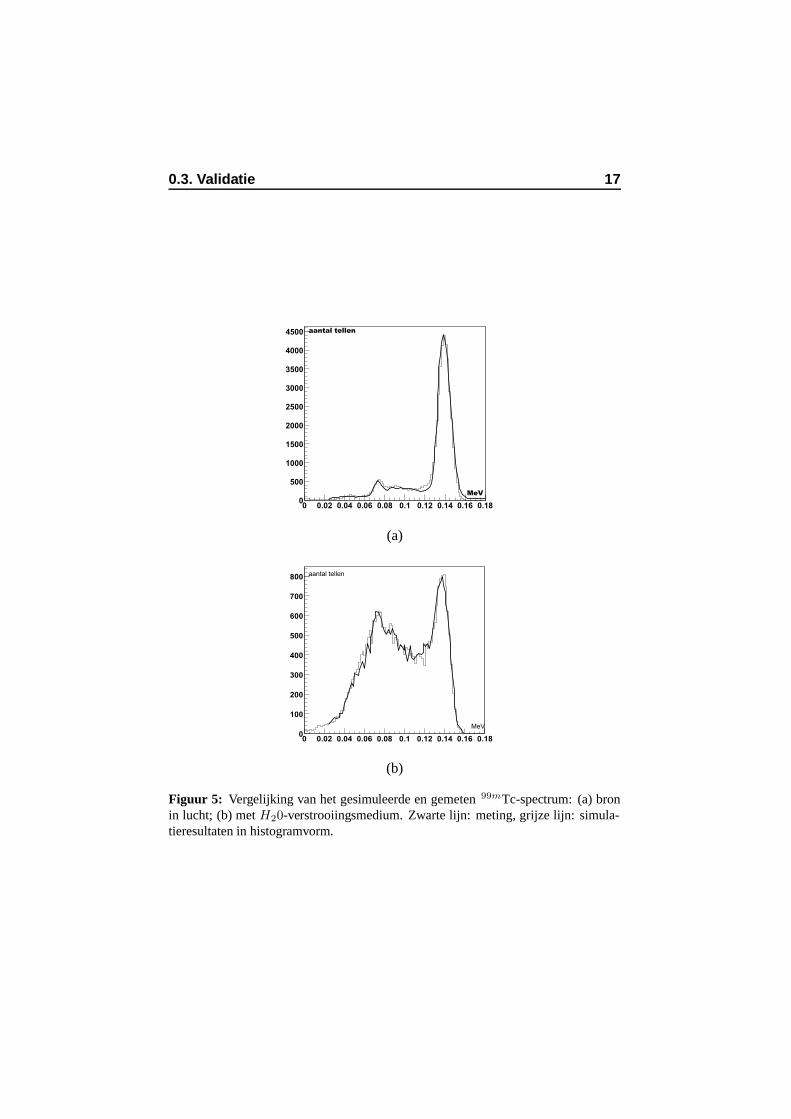
0.3. Validatie 17
aantal tellen
MeV
0 0.02 0.04 0.06 0.08 0.1 0.12 0.14 0.16 0.180
500
1000
1500
2000
2500
3000
3500
4000
4500
(a)
aantal tellen
MeV
0 0.02 0.04 0.06 0.08 0.1 0.12 0.14 0.16 0.180
100
200
300
400
500
600
700
800
(b)
Figuur 5: Vergelijking van het gesimuleerde en gemeten 99mTc-spectrum: (a) bronin lucht; (b) met H20-verstrooiingsmedium. Zwarte lijn: meting, grijze lijn: simula-tieresultaten in histogramvorm.
18 Nederlandstalige Samenvatting
gedrag van de camera beneden 40 keV in de meting. In dit experiment werdengeen energievensters opgelegd, en de mogelijkheid bestaat dus dat processenwerden overschat in een energiebereik en onderschat in een ander. Daaromhebben we de sensitiviteit bijkomend geevalueerd in twee afzonderlijke ener-giebereiken om zeker te zijn dat er geen additionele effecten aanwezig warenin de simulaties. In het eerste experiment voerden we een statische scan (metde LEHR-collimator) uit van een puntbron op verschillende afstanden van dedetector. We namen data op in het fotopiekbereik en in het Comptonbereik.We startten overeenkomstige simulaties voor elk experiment en vergelekende gesimuleerde en experimentele sensitiviteiten. In figuur 6(a) zien we eengoede overeenkomst tussen beide. We herhaalden een gelijkaardig experimentmet de MEGP-collimator waarbij dezelfde bron gebruikt werd. De experi-menten werden opnieuw gereproduceerd door gebruik te maken van GATE.De resultaten zijn afgebeeld in figuur 6(b) waar de sensitiviteit in beide ener-giebereiken is weergegeven, en waarbij we opnieuw een goede overeenkomstzien tussen simulaties en realiteit. Deze goede overeenkomsten, die binnende foutenmarge liggen, sluiten de mogelijkheid van inter-bereik compensatie-fouten uit en bevestigen een positieve sensitiviteitsvalidatie. Bovendien bleefde sensitiviteit constant met de afstand zoals theoretisch bewezen werd voorparallelle-bundelcollimatoren. Toepassing van een van de dode-tijdmodellenvan GATE in de simulaties was overbodig in al deze lage telstudies.
0.3.5 Verstrooiingsprofielen
We breidden de validatie uit door verstrooiingsprofielen op verschillende af-standen van de detector op te meten, met en zonder attenuatie, in het Compton-en in het fotopiekbereik. In het eerste experiment voerden we een statischescan uit van een puntbron in lucht, op verschillende afstanden van de detec-tor met de LEHR-collimator. Dit werd opgemeten voor het fotopiekbereik envoor het Comptonbereik. De afstand had effect op de breedte op halve hoogte(FWHM, Eng.: Full Width at Half Maximum) in het fotopiekbereik zoals ver-wacht voor een parallelle-bundelcollimator. De goede overeenkomst tussen degesimuleerde en gemeten verstrooiingsprofielen in het Comptonbereik bevesti-gen de accurate simulatie van de verstrooiingsinteracties in de collimator en inde andere delen van de detectorkop wat reeds bleek uit de goede sensitiviteits-overeenkomst in een gelijkaardig experiment (zonder attenuerend medium),besproken in de vorige sectie. In een tweede experiment werd de puntbron ver-vangen door een lijnbron geplaatst in een met water gevuld cilindrisch fantoomvan 22.3 cm diameter op 10 cm van de detectorkoppen, in dit geval uitgerustmet de LEHR-collimatoren. Ook hier konden we besluiten dat de verstrooi-
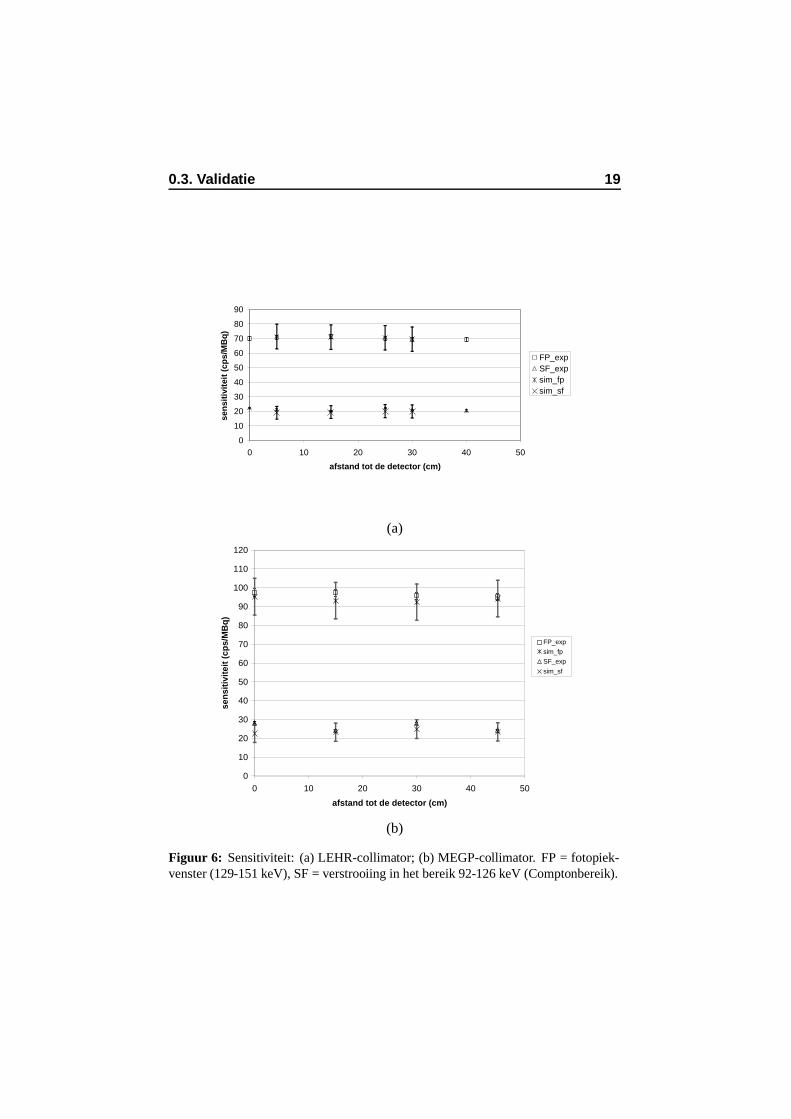
0.3. Validatie 19
0
10
20
30
40
50
60
70
80
90
0 10 20 30 40 50
afstand tot de detector (cm)
sen
siti
vite
it (
cps/
MB
q)
FP_expSF_expsim_fpsim_sf
(a)
0
10
20
30
40
50
60
70
80
90
100
110
120
0 10 20 30 40 50
afstand tot de detector (cm)
sen
siti
vite
it (
cps/
MB
q)
FP_exp
sim_fp
SF_exp
sim_sf
(b)
Figuur 6: Sensitiviteit: (a) LEHR-collimator; (b) MEGP-collimator. FP = fotopiek-venster (129-151 keV), SF = verstrooiing in het bereik 92-126 keV (Comptonbereik).
20 Nederlandstalige Samenvatting
ingsprocessen in het fantoom gepast gemodelleerd zijn voor alle gevallen endat de FWHM, zoals verwacht, toeneemt met de diepte van de lijnbron in hetfantoom.
0.3.6 Vergelijking van de spatiale resolutie
Er werd een “spatiale vervager”-module gecreeerd om de intrinsieke spati-ale resolutie, veroorzaakt door de kristalverstrooiing en door uitlezing van hetsignaal, te modelleren, terwijl de extrinsieke resolutie (veroorzaakt door alleandere delen van de detector) gesimuleerd werd. De spatiale vervager-modulevervangt de opgenomen positie van elke tel in het kristal door een Gaussiaansvervaagde positie. De werkelijke waarde van de intrinsieke resolutie werdin de simulaties gelijkgesteld aan de waarde opgegeven door de producent(0.33 cm). De bijdrage van de collimator aan de spatiale resolutie werd volle-dig gesimuleerd. Om de validiteit van de spatiale vervager voor de intrinsiekeresolutie en het collimatormodel te onderzoeken, werden de simulaties geveri-fieerd aan de hand van additionele experimenten. Figuur 7 toont de resultatenvan deze experimenten, waarbij de gesimuleerde FWHM’s vergeleken wordenmet de gemeten FWHM’s van lijnbronnen op verschillende afstanden in lucht.Er is een goede overeenstemming bereikt binnen de foutenmarges, zowel voorde LEHR- als voor de MEGP-collimator. Tenslotte werd de experimentelesetup voor de LEHR collimator verruimd door de lijnbron in het centrum vaneen met water gevuld fantoom in te brengen. Het fantoom werd op 10 cmvan de detectorkop geplaatst zodat de lijnbron op 21 cm van de detector stond.We vonden een FWHM van 1.3 cm ± 0.1 cm bij de reele data, en 1.36 cm ±0.02 cm in de simulatie, hetgeen bevestigt dat de spatiale resolutie nauwkeuriggesimuleerd wordt, ook in de aanwezigheid van een attenuerend medium.
0.3.7 Besluit en originele bijdragen
In deze sectie hebben we de softwareuitbreidingen besproken diegeımplementeerd werden om GATE tot een nauwkeurig simulatieplatformvoor SPECT-beeldvorming te maken. De resultaten van dit validatieproces wa-ren nauwkeurig en veelbelovend voor toekomstige toepassingen. We hebbenkunnen aantonen dat GATE heel weinig benaderingen nodig heeft wanneerechte cameraontwerpen gesimuleerd worden, wat het simulatieplatform heelflexibel maakt. Het werk beschreven in deze sectie resulteerde in de eerstetijdschriftpublicatie wereldwijd over GATE-validatie [107]. Sindsdien heb-ben andere onderzoeksgroepen de validatie uitgebreid naar andere SPECT ca-mera’s, naar PET-acquisitieopstellingen en naar beeldvormingssystemen voor
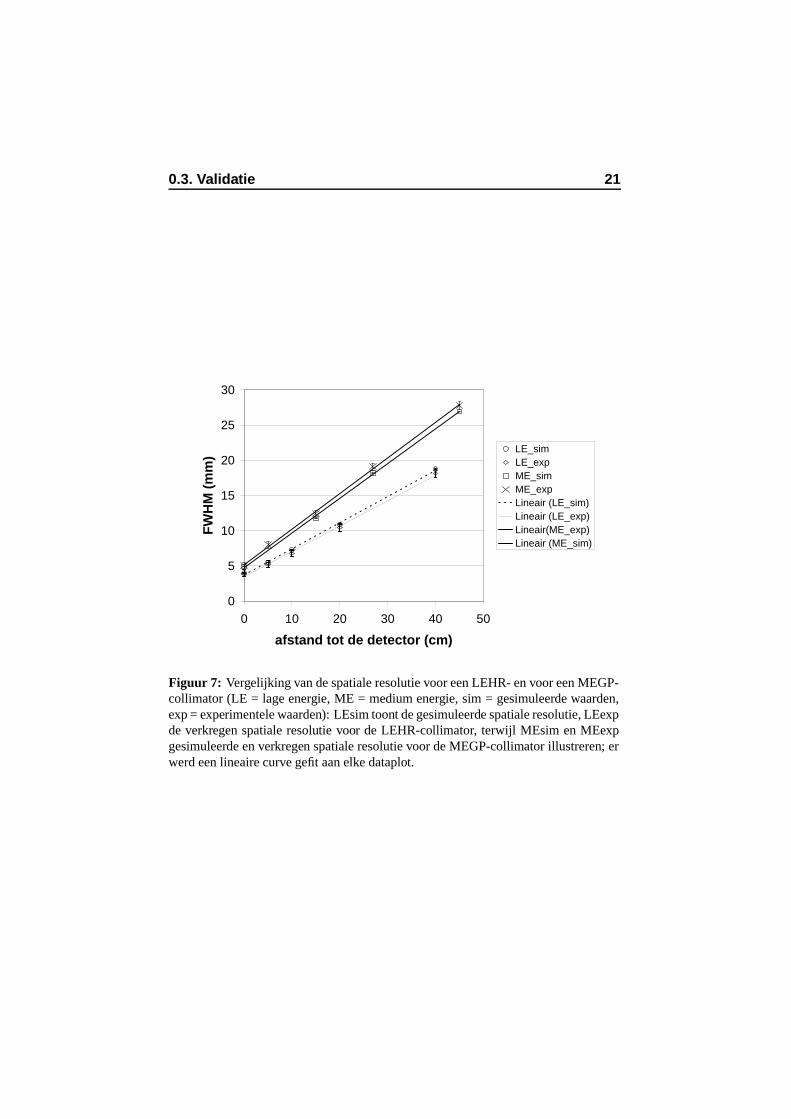
0.3. Validatie 21
0
5
10
15
20
25
30
0 10 20 30 40 50
afstand tot de detector (cm)
FW
HM
(m
m)
LE_simLE_expME_simME_expLineair (LE_sim)Lineair (LE_exp)Lineair(ME_exp)Lineair (ME_sim)
Figuur 7: Vergelijking van de spatiale resolutie voor een LEHR- en voor een MEGP-collimator (LE = lage energie, ME = medium energie, sim = gesimuleerde waarden,exp = experimentele waarden): LEsim toont de gesimuleerde spatiale resolutie, LEexpde verkregen spatiale resolutie voor de LEHR-collimator, terwijl MEsim en MEexpgesimuleerde en verkregen spatiale resolutie voor de MEGP-collimator illustreren; erwerd een lineaire curve gefit aan elke dataplot.
22 Nederlandstalige Samenvatting
kleine proefdieren. Het OpenGATE samenwerkingsverband concentreert zichin verder onderzoek op de validatie van GATE voor dosimetrische applicaties.
0.4 Correctietechnieken voor attenuatie en verstrooi-ing
0.4.1 Inleiding
Monte-Carlosimulaties laten toe om gedetecteerde fotonen op te splitsen inhun componenten of in hun gebeurtenislokatie. Een toepassing daarvan inSPECT en gammacamera-PET is simultane emissie- en transmissiebeeldvor-ming. Simulaties zullen in deze sectie gebruikt worden om richtlijnen inzakeprotocoloptimalisatie voor te stellen. Bij volledige-ring-PET hebben Monte-Carlosimulaties onder andere een meerwaarde bij het verifieren welke ver-strooiingsorde het meest bijdraagt tot de beelddegradatie. Ook de relatie tussenobjectverstrooiing en kristalverstrooiing is relevant om zo optimaal mogelijkte corrigeren voor verstrooiing in een reconstructiealgoritme. Deze twee as-pecten zullen in dit hoofdstuk besproken worden door de gelijktijdige emissie-en transmissiescans met Beacon te behandelen en door het relatief belang vanhogere-orde-patientverstrooiing in PET-beelden te onderzoeken.
0.4.2 Beacon-attenuatiecorrectie voor gammacamera-PET enSPECT
Niet-uniforme patientattenuatiemappen verkregen met transmissiescans zijneen belangrijk middel om de kwaliteit van SPECT- en PET-beelden te ver-beteren. In sommige gevallen wordt dit gedaan door gebruik te maken van eenaxiaal bewegende puntbron met een hoge-energie-isotoop die een waaier vanfotonen uitzendt (figuur 8), wat resulteert in een asymmetrische waaierbundel-beeldvormingsgeometrie [148]. Transmissiescans worden dikwijls simultaanopgenomen met de emissiestudie om de scantijd van de patient te verlagenen om de efficientie te verhogen. Verschillende methodes werden al voorge-steld om een onderscheid te kunnen maken tussen fotonen afkomstig van eenemissiebron en fotonen afkomstig van een transmissiebron [10, 42, 117]. Ingammacamera-PET en in SPECT echter blijft er nog een intervenstercontami-natie bestaan: van de emissiebron in het attenuatievenster voor gammacamera-PET en van de attenuatiebron in het emissievenster voor SPECT. De meestefabrikanten raden een additionele tijdsrovende correctiescan aan. Door mid-del van simulaties onderzoeken we de protocoloptimalisatie wat intervenster-contaminatie betreft. Het BeaconTM (Philips)-toestel werd gebruikt om onze
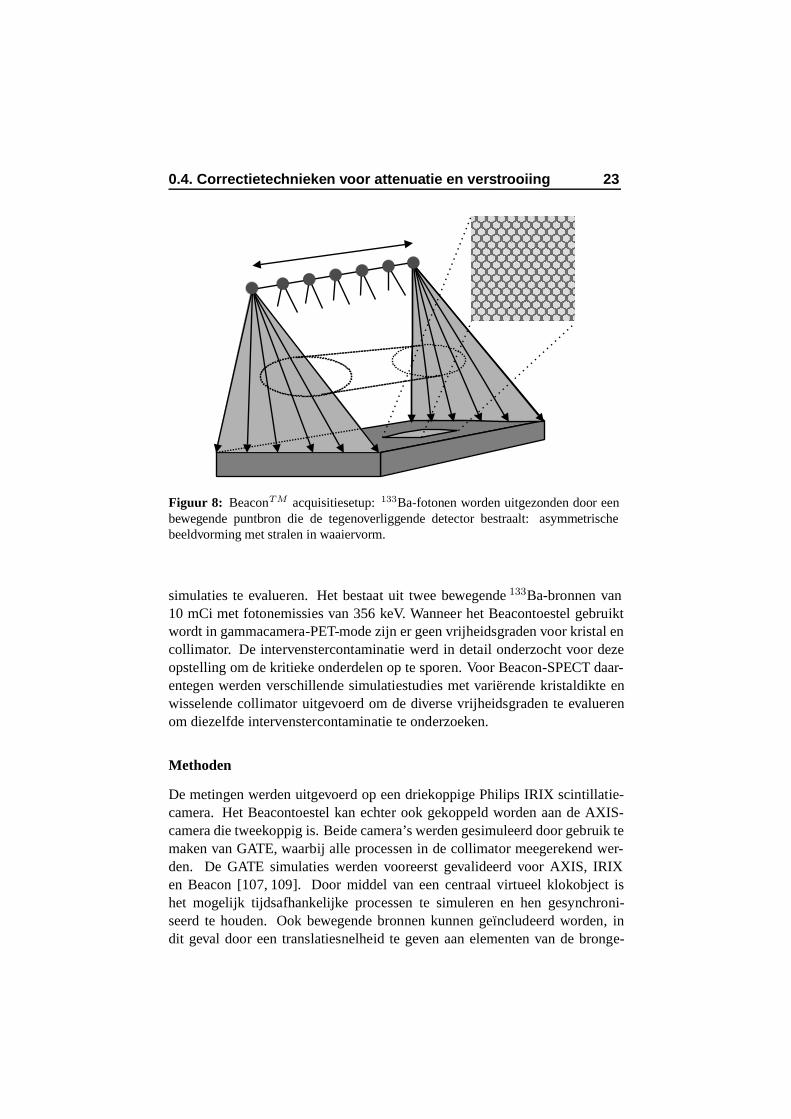
0.4. Correctietechnieken voor attenuatie en verstrooiing 23
Figuur 8: BeaconTM acquisitiesetup: 133Ba-fotonen worden uitgezonden door eenbewegende puntbron die de tegenoverliggende detector bestraalt: asymmetrischebeeldvorming met stralen in waaiervorm.
simulaties te evalueren. Het bestaat uit twee bewegende 133Ba-bronnen van10 mCi met fotonemissies van 356 keV. Wanneer het Beacontoestel gebruiktwordt in gammacamera-PET-mode zijn er geen vrijheidsgraden voor kristal encollimator. De intervenstercontaminatie werd in detail onderzocht voor dezeopstelling om de kritieke onderdelen op te sporen. Voor Beacon-SPECT daar-entegen werden verschillende simulatiestudies met varierende kristaldikte enwisselende collimator uitgevoerd om de diverse vrijheidsgraden te evaluerenom diezelfde intervenstercontaminatie te onderzoeken.
Methoden
De metingen werden uitgevoerd op een driekoppige Philips IRIX scintillatie-camera. Het Beacontoestel kan echter ook gekoppeld worden aan de AXIS-camera die tweekoppig is. Beide camera’s werden gesimuleerd door gebruik temaken van GATE, waarbij alle processen in de collimator meegerekend wer-den. De GATE simulaties werden vooreerst gevalideerd voor AXIS, IRIXen Beacon [107, 109]. Door middel van een centraal virtueel klokobject ishet mogelijk tijdsafhankelijke processen te simuleren en hen gesynchroni-seerd te houden. Ook bewegende bronnen kunnen geıncludeerd worden, indit geval door een translatiesnelheid te geven aan elementen van de bronge-
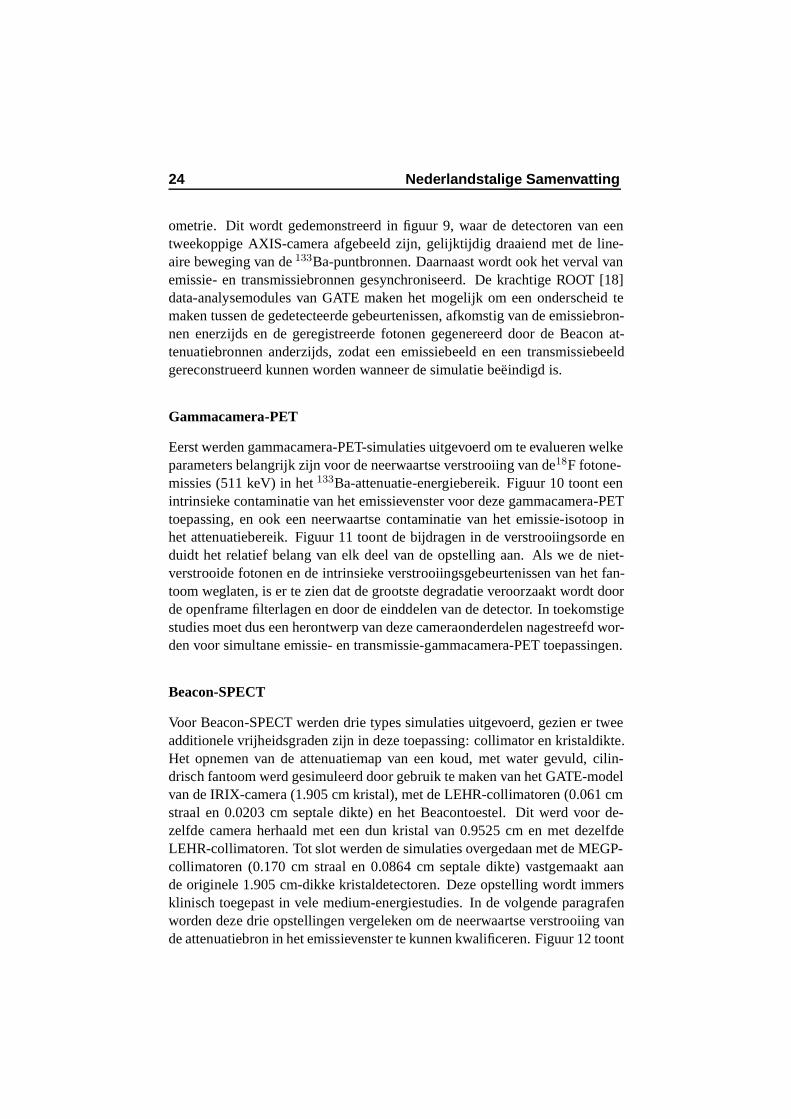
24 Nederlandstalige Samenvatting
ometrie. Dit wordt gedemonstreerd in figuur 9, waar de detectoren van eentweekoppige AXIS-camera afgebeeld zijn, gelijktijdig draaiend met de line-aire beweging van de 133Ba-puntbronnen. Daarnaast wordt ook het verval vanemissie- en transmissiebronnen gesynchroniseerd. De krachtige ROOT [18]data-analysemodules van GATE maken het mogelijk om een onderscheid temaken tussen de gedetecteerde gebeurtenissen, afkomstig van de emissiebron-nen enerzijds en de geregistreerde fotonen gegenereerd door de Beacon at-tenuatiebronnen anderzijds, zodat een emissiebeeld en een transmissiebeeldgereconstrueerd kunnen worden wanneer de simulatie beeindigd is.
Gammacamera-PET
Eerst werden gammacamera-PET-simulaties uitgevoerd om te evalueren welkeparameters belangrijk zijn voor de neerwaartse verstrooiing van de18F fotone-missies (511 keV) in het 133Ba-attenuatie-energiebereik. Figuur 10 toont eenintrinsieke contaminatie van het emissievenster voor deze gammacamera-PETtoepassing, en ook een neerwaartse contaminatie van het emissie-isotoop inhet attenuatiebereik. Figuur 11 toont de bijdragen in de verstrooiingsorde enduidt het relatief belang van elk deel van de opstelling aan. Als we de niet-verstrooide fotonen en de intrinsieke verstrooiingsgebeurtenissen van het fan-toom weglaten, is er te zien dat de grootste degradatie veroorzaakt wordt doorde openframe filterlagen en door de einddelen van de detector. In toekomstigestudies moet dus een herontwerp van deze cameraonderdelen nagestreefd wor-den voor simultane emissie- en transmissie-gammacamera-PET toepassingen.
Beacon-SPECT
Voor Beacon-SPECT werden drie types simulaties uitgevoerd, gezien er tweeadditionele vrijheidsgraden zijn in deze toepassing: collimator en kristaldikte.Het opnemen van de attenuatiemap van een koud, met water gevuld, cilin-drisch fantoom werd gesimuleerd door gebruik te maken van het GATE-modelvan de IRIX-camera (1.905 cm kristal), met de LEHR-collimatoren (0.061 cmstraal en 0.0203 cm septale dikte) en het Beacontoestel. Dit werd voor de-zelfde camera herhaald met een dun kristal van 0.9525 cm en met dezelfdeLEHR-collimatoren. Tot slot werden de simulaties overgedaan met de MEGP-collimatoren (0.170 cm straal en 0.0864 cm septale dikte) vastgemaakt aande originele 1.905 cm-dikke kristaldetectoren. Deze opstelling wordt immersklinisch toegepast in vele medium-energiestudies. In de volgende paragrafenworden deze drie opstellingen vergeleken om de neerwaartse verstrooiing vande attenuatiebron in het emissievenster te kunnen kwalificeren. Figuur 12 toont
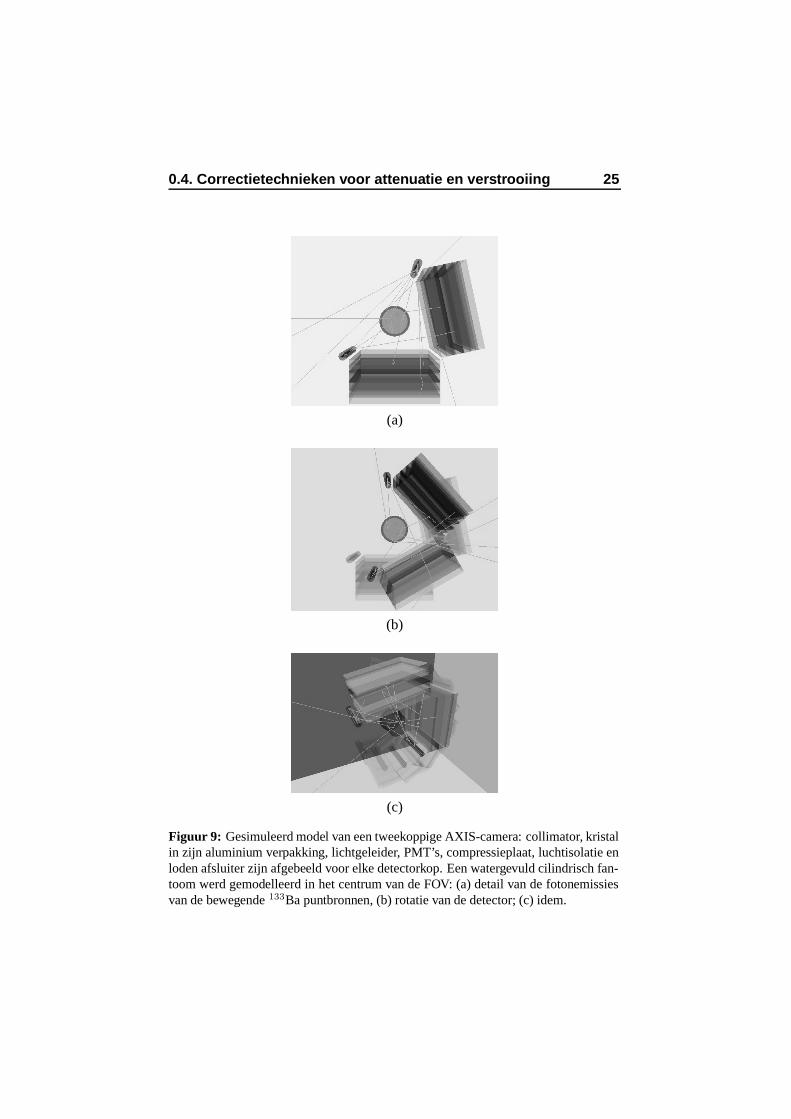
0.4. Correctietechnieken voor attenuatie en verstrooiing 25
(a)
(b)
(c)
Figuur 9: Gesimuleerd model van een tweekoppige AXIS-camera: collimator, kristalin zijn aluminium verpakking, lichtgeleider, PMT’s, compressieplaat, luchtisolatie enloden afsluiter zijn afgebeeld voor elke detectorkop. Een watergevuld cilindrisch fan-toom werd gemodelleerd in het centrum van de FOV: (a) detail van de fotonemissiesvan de bewegende 133Ba puntbronnen, (b) rotatie van de detector; (c) idem.
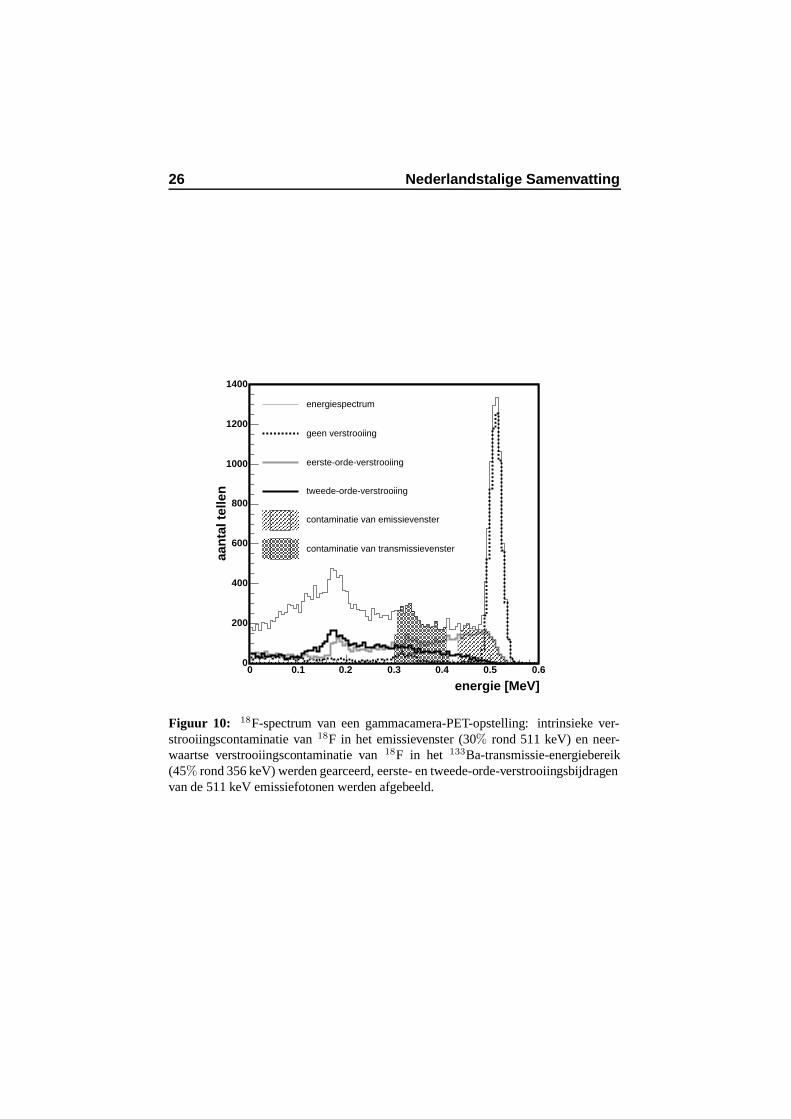
26 Nederlandstalige Samenvatting
energie [MeV]0 0.1 0.2 0.3 0.4 0.5 0.6
aan
tal t
elle
n
0
200
400
600
800
1000
1200
1400
energiespectrum
geen verstrooiing
eerste-orde-verstrooiing
tweede-orde-verstrooiing
contaminatie van emissievenster
contaminatie van transmissievenster
Figuur 10: 18F-spectrum van een gammacamera-PET-opstelling: intrinsieke ver-strooiingscontaminatie van 18F in het emissievenster (30% rond 511 keV) en neer-waartse verstrooiingscontaminatie van 18F in het 133Ba-transmissie-energiebereik(45% rond 356 keV) werden gearceerd, eerste- en tweede-orde-verstrooiingsbijdragenvan de 511 keV emissiefotonen werden afgebeeld.
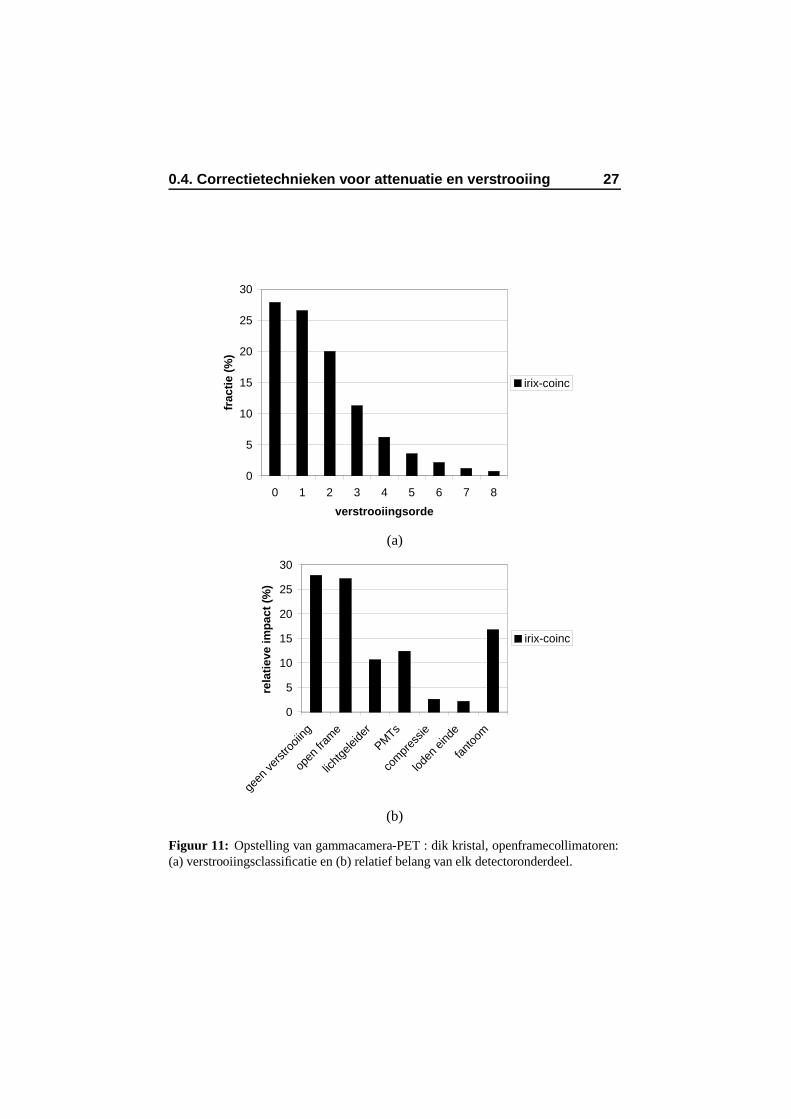
0.4. Correctietechnieken voor attenuatie en verstrooiing 27
0
5
10
15
20
25
30
0 1 2 3 4 5 6 7 8
verstrooiingsorde
frac
tie
(%)
irix-coinc
(a)
0
5
10
15
20
25
30
geen
vers
trooii
ng
open
fram
e
licht
gelei
der
PMTs
com
pres
sie
loden
eind
e
fant
oom
rela
tiev
e im
pac
t (%
)
irix-coinc
(b)
Figuur 11: Opstelling van gammacamera-PET : dik kristal, openframecollimatoren:(a) verstrooiingsclassificatie en (b) relatief belang van elk detectoronderdeel.
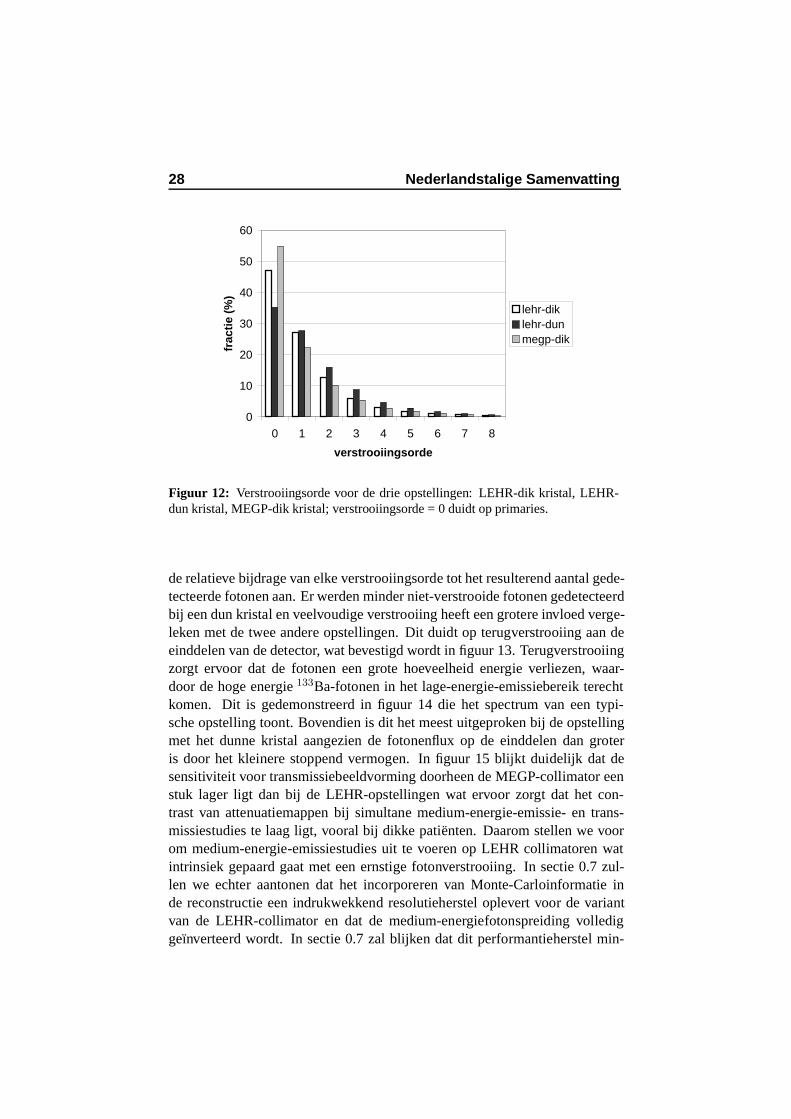
28 Nederlandstalige Samenvatting
0
10
20
30
40
50
60
0 1 2 3 4 5 6 7 8
verstrooiingsorde
frac
tie
(%)
lehr-diklehr-dunmegp-dik
Figuur 12: Verstrooiingsorde voor de drie opstellingen: LEHR-dik kristal, LEHR-dun kristal, MEGP-dik kristal; verstrooiingsorde = 0 duidt op primaries.
de relatieve bijdrage van elke verstrooiingsorde tot het resulterend aantal gede-tecteerde fotonen aan. Er werden minder niet-verstrooide fotonen gedetecteerdbij een dun kristal en veelvoudige verstrooiing heeft een grotere invloed verge-leken met de twee andere opstellingen. Dit duidt op terugverstrooiing aan deeinddelen van de detector, wat bevestigd wordt in figuur 13. Terugverstrooiingzorgt ervoor dat de fotonen een grote hoeveelheid energie verliezen, waar-door de hoge energie 133Ba-fotonen in het lage-energie-emissiebereik terechtkomen. Dit is gedemonstreerd in figuur 14 die het spectrum van een typi-sche opstelling toont. Bovendien is dit het meest uitgeproken bij de opstellingmet het dunne kristal aangezien de fotonenflux op de einddelen dan groteris door het kleinere stoppend vermogen. In figuur 15 blijkt duidelijk dat desensitiviteit voor transmissiebeeldvorming doorheen de MEGP-collimator eenstuk lager ligt dan bij de LEHR-opstellingen wat ervoor zorgt dat het con-trast van attenuatiemappen bij simultane medium-energie-emissie- en trans-missiestudies te laag ligt, vooral bij dikke patienten. Daarom stellen we voorom medium-energie-emissiestudies uit te voeren op LEHR collimatoren watintrinsiek gepaard gaat met een ernstige fotonverstrooiing. In sectie 0.7 zul-len we echter aantonen dat het incorporeren van Monte-Carloinformatie inde reconstructie een indrukwekkend resolutieherstel oplevert voor de variantvan de LEHR-collimator en dat de medium-energiefotonspreiding vollediggeınverteerd wordt. In sectie 0.7 zal blijken dat dit performantieherstel min-
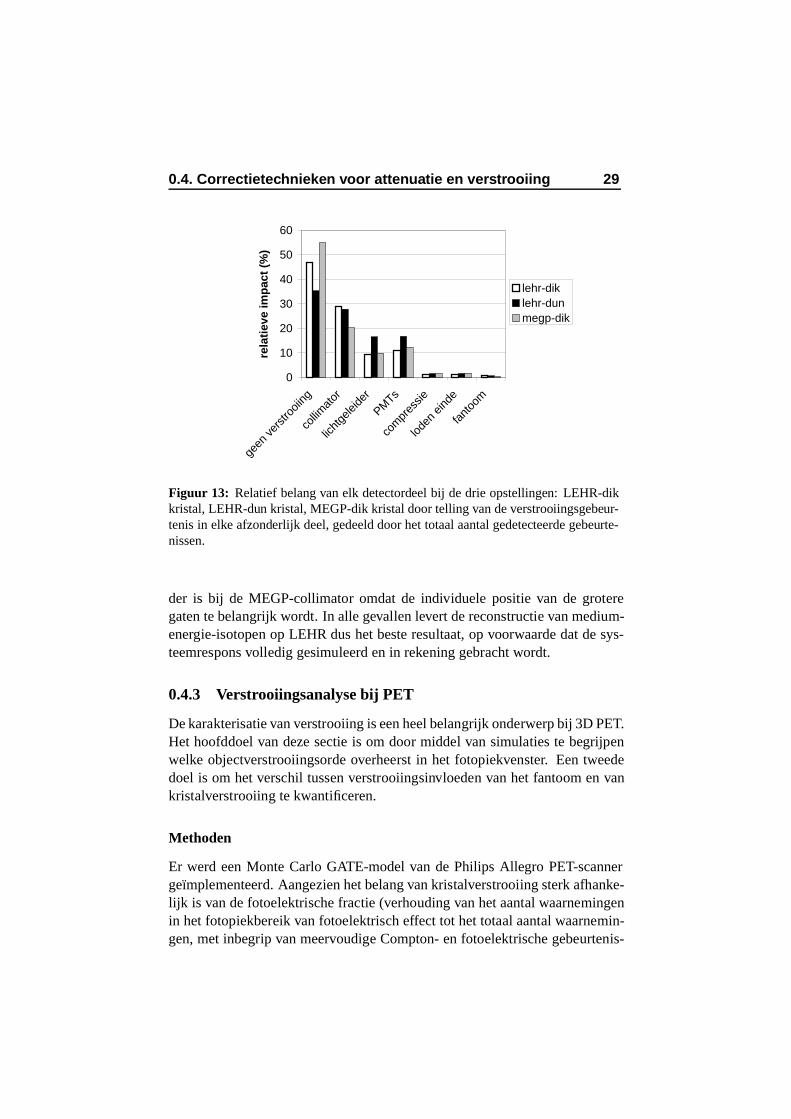
0.4. Correctietechnieken voor attenuatie en verstrooiing 29
0
10
20
30
40
50
60
geen
vers
trooii
ng
collim
ator
licht
gelei
der
PMTs
com
pres
sie
loden
eind
e
fant
oom
rela
tiev
e im
pac
t (%
)
lehr-diklehr-dunmegp-dik
Figuur 13: Relatief belang van elk detectordeel bij de drie opstellingen: LEHR-dikkristal, LEHR-dun kristal, MEGP-dik kristal door telling van de verstrooiingsgebeur-tenis in elke afzonderlijk deel, gedeeld door het totaal aantal gedetecteerde gebeurte-nissen.
der is bij de MEGP-collimator omdat de individuele positie van de groteregaten te belangrijk wordt. In alle gevallen levert de reconstructie van medium-energie-isotopen op LEHR dus het beste resultaat, op voorwaarde dat de sys-teemrespons volledig gesimuleerd en in rekening gebracht wordt.
0.4.3 Verstrooiingsanalyse bij PET
De karakterisatie van verstrooiing is een heel belangrijk onderwerp bij 3D PET.Het hoofddoel van deze sectie is om door middel van simulaties te begrijpenwelke objectverstrooiingsorde overheerst in het fotopiekvenster. Een tweededoel is om het verschil tussen verstrooiingsinvloeden van het fantoom en vankristalverstrooiing te kwantificeren.
Methoden
Er werd een Monte Carlo GATE-model van de Philips Allegro PET-scannergeımplementeerd. Aangezien het belang van kristalverstrooiing sterk afhanke-lijk is van de fotoelektrische fractie (verhouding van het aantal waarnemingenin het fotopiekbereik van fotoelektrisch effect tot het totaal aantal waarnemin-gen, met inbegrip van meervoudige Compton- en fotoelektrische gebeurtenis-
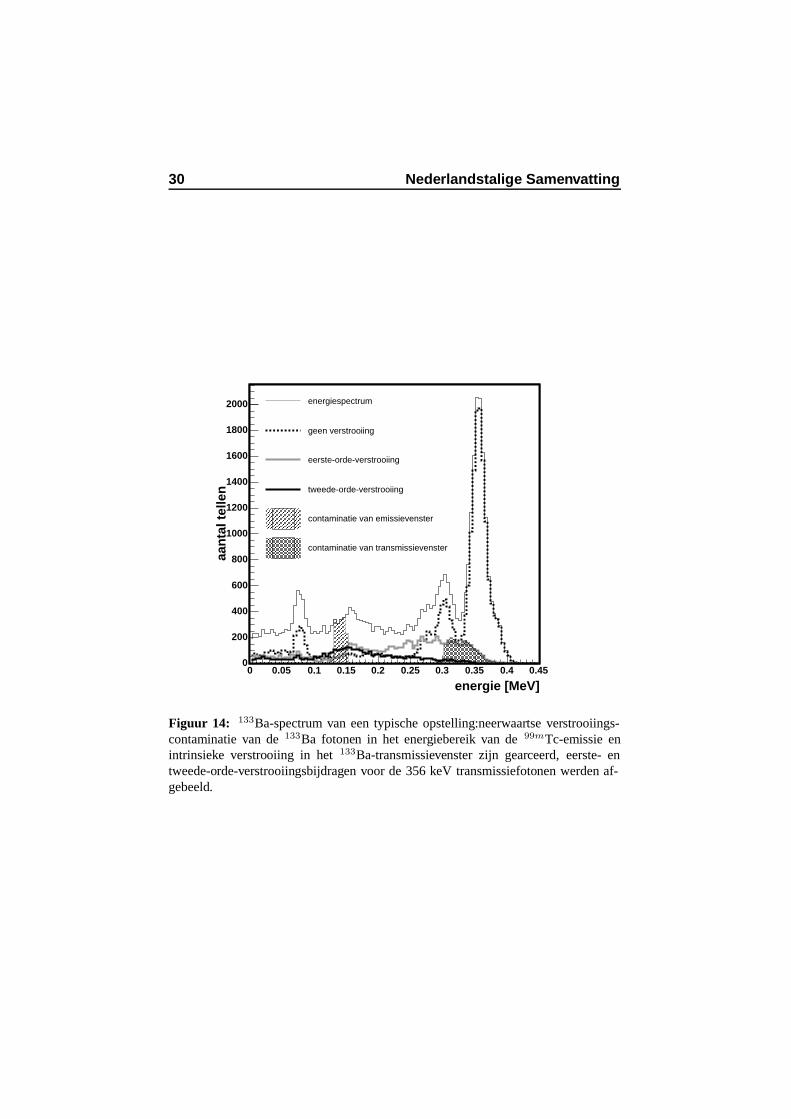
30 Nederlandstalige Samenvatting
energie [MeV]0 0.05 0.1 0.15 0.2 0.25 0.3 0.35 0.4 0.45
aan
tal t
elle
n
0
200
400
600
800
1000
1200
1400
1600
1800
2000 energiespectrum
geen verstrooiing
eerste-orde-verstrooiing
tweede-orde-verstrooiing
contaminatie van emissievenster
contaminatie van transmissievenster
Figuur 14: 133Ba-spectrum van een typische opstelling:neerwaartse verstrooiings-contaminatie van de 133Ba fotonen in het energiebereik van de 99mTc-emissie enintrinsieke verstrooiing in het 133Ba-transmissievenster zijn gearceerd, eerste- entweede-orde-verstrooiingsbijdragen voor de 356 keV transmissiefotonen werden af-gebeeld.

0.4. Correctietechnieken voor attenuatie en verstrooiing 31
0
5000
10000
15000
20000
25000
30000
35000
40000
lehr-thick (Ba) lehr-thin (Ba) megp-thick (Ba) lehr-thin (Tc)
sen
siti
vity
(cp
s/M
Bq
)
Figuur 15: Sensitiviteit van de drie opstellingen: LEHR-dik kristal, LEHR-dun kris-tal, MEGP-dik kristal; vergeleken met een typische 99mTc emissieopname.
sen), werd deze scanner gesimuleerd met verschillende materiaaltypes: GSO,LSO, BGO, en twee nieuwe materialen (LaBr3 en LuI3). Geometrische as-pecten van de Allegro werden constant gehouden. Voor elk kristalmateriaalwerd een geschikte energieresolutie en dode tijd toegepast. Er werden tweefantoomstudies uitgevoerd.
NEMA-fantoomstudie en antropomorfe fantoomstudie
Een eerste fantoomstudie, een gesimuleerde 6 min durende acquisitie van hetNEMA 2001 verstrooiingsfantoom [83] gevuld met een 18F bron van 1µCi,werd gebruikt om de ruisequivalente telkadans (NEC) van de kristalmateri-alen als een waardemeter te bepalen. Aangezien willekeurige coıncidentiesverwaarloosbaar zijn bij deze lage activiteit, definieren we de NEC als volgt:NEC = T 2
T+S met T de ware coıncidenties en S de verstrooide gebeurtenis-sen. Tabel 1 toont dat de fantoomverstrooiing van eerste orde de fantoom-verstrooiing van tweede en hogere orde overheerst in het fotopiekbereik vooralle courante en nieuwe kristallen. Wanneer we de performantie van de ge-bruikte detectormaterialen vergeleken, vonden we dat de NEC van LSO enBGO superieur was aan de andere (figuur 16(a)). Dit is vooral te wijten aanhun hogere sensitiviteit (figuur 16(b)) aangezien de fotoelektrische fractie indeze systemen hoger is. Een hogere fotoelektrische fractie betekent ook dat de
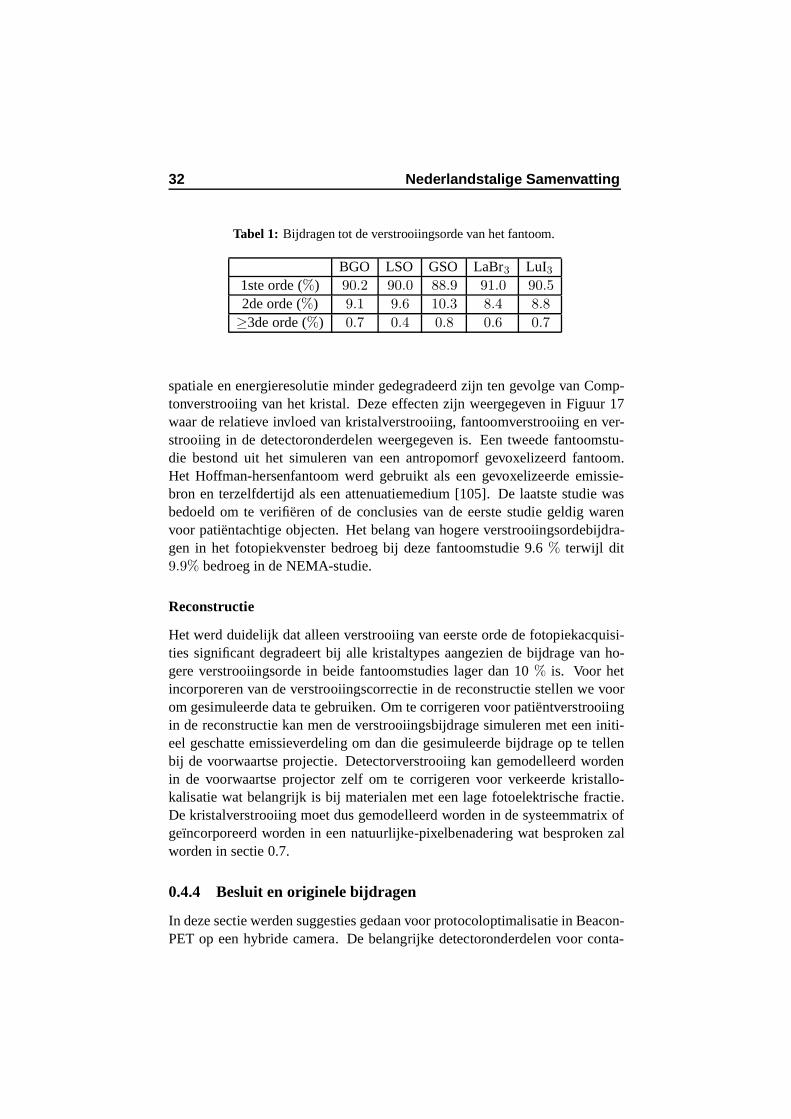
32 Nederlandstalige Samenvatting
Tabel 1: Bijdragen tot de verstrooiingsorde van het fantoom.
BGO LSO GSO LaBr3 LuI31ste orde (%) 90.2 90.0 88.9 91.0 90.5
2de orde (%) 9.1 9.6 10.3 8.4 8.8
≥3de orde (%) 0.7 0.4 0.8 0.6 0.7
spatiale en energieresolutie minder gedegradeerd zijn ten gevolge van Comp-tonverstrooiing van het kristal. Deze effecten zijn weergegeven in Figuur 17waar de relatieve invloed van kristalverstrooiing, fantoomverstrooiing en ver-strooiing in de detectoronderdelen weergegeven is. Een tweede fantoomstu-die bestond uit het simuleren van een antropomorf gevoxelizeerd fantoom.Het Hoffman-hersenfantoom werd gebruikt als een gevoxelizeerde emissie-bron en terzelfdertijd als een attenuatiemedium [105]. De laatste studie wasbedoeld om te verifieren of de conclusies van de eerste studie geldig warenvoor patientachtige objecten. Het belang van hogere verstrooiingsordebijdra-gen in het fotopiekvenster bedroeg bij deze fantoomstudie 9.6 % terwijl dit9.9% bedroeg in de NEMA-studie.
Reconstructie
Het werd duidelijk dat alleen verstrooiing van eerste orde de fotopiekacquisi-ties significant degradeert bij alle kristaltypes aangezien de bijdrage van ho-gere verstrooiingsorde in beide fantoomstudies lager dan 10 % is. Voor hetincorporeren van de verstrooiingscorrectie in de reconstructie stellen we voorom gesimuleerde data te gebruiken. Om te corrigeren voor patientverstrooiingin de reconstructie kan men de verstrooiingsbijdrage simuleren met een initi-eel geschatte emissieverdeling om dan die gesimuleerde bijdrage op te tellenbij de voorwaartse projectie. Detectorverstrooiing kan gemodelleerd wordenin de voorwaartse projector zelf om te corrigeren voor verkeerde kristallo-kalisatie wat belangrijk is bij materialen met een lage fotoelektrische fractie.De kristalverstrooiing moet dus gemodelleerd worden in de systeemmatrix ofgeıncorporeerd worden in een natuurlijke-pixelbenadering wat besproken zalworden in sectie 0.7.
0.4.4 Besluit en originele bijdragen
In deze sectie werden suggesties gedaan voor protocoloptimalisatie in Beacon-PET op een hybride camera. De belangrijke detectoronderdelen voor conta-
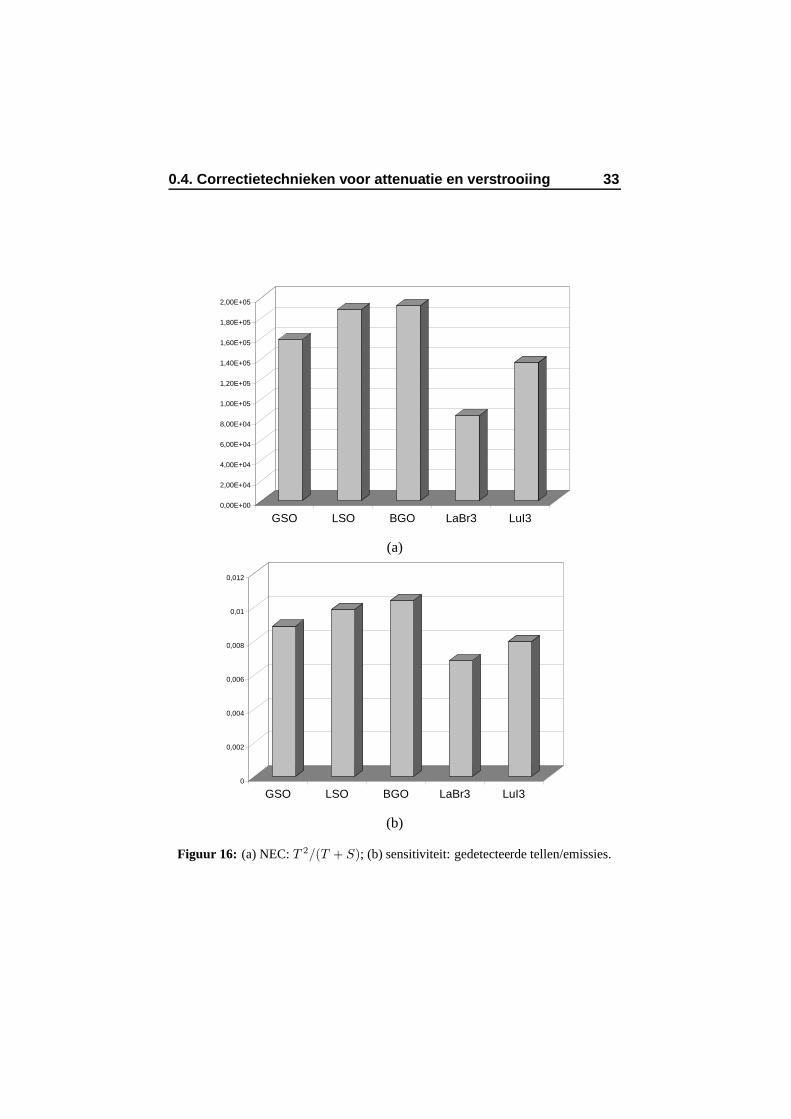
0.4. Correctietechnieken voor attenuatie en verstrooiing 33
0,00E+00
2,00E+04
4,00E+04
6,00E+04
8,00E+04
1,00E+05
1,20E+05
1,40E+05
1,60E+05
1,80E+05
2,00E+05
GSO LSO BGO LaBr3 LuI3
(a)
0
0,002
0,004
0,006
0,008
0,01
0,012
GSO LSO BGO LaBr3 LuI3
(b)
Figuur 16: (a) NEC: T 2/(T + S); (b) sensitiviteit: gedetecteerde tellen/emissies.
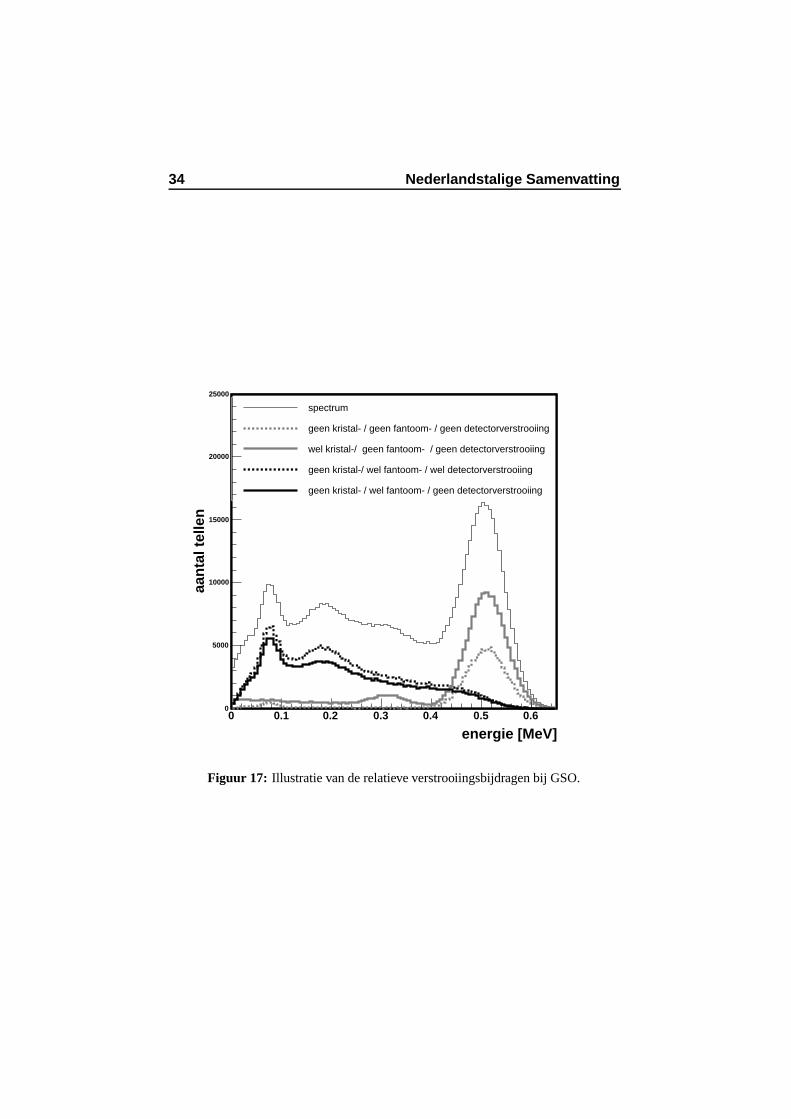
34 Nederlandstalige Samenvatting
energie [MeV]0 0.1 0.2 0.3 0.4 0.5 0.6
aan
tal t
elle
n
0
5000
10000
15000
20000
25000
spectrum
geen kristal- / geen fantoom- / geen detectorverstrooiing
wel kristal-/ geen fantoom- / geen detectorverstrooiing
geen kristal-/ wel fantoom- / wel detectorverstrooiing
geen kristal- / wel fantoom- / geen detectorverstrooiing
Figuur 17: Illustratie van de relatieve verstrooiingsbijdragen bij GSO.
0.5. Beeldvormingssystemen en collimatorontwerp 35
minatie van het attenuatiebeeld door neerwaartse verstrooiing van het emissie-isotoop werden uitgetekend en ontwerpinspanningen moeten hierop geconcen-treerd worden. De hoofdconclusie voor Beacon-SPECT anderzijds is dat eendikke kristaldetector gekoppeld aan een LEHR-collimator de beste oplossing isom attenuatiemappen in lage- en in medium-energietoepassingen te verkrijgen.Voor medium-energie-emissiestudies moet wel de Monte-Carlogebaseerde re-constructie gebruikt worden die in sectie 0.7 gedetailleerd uitgewerkt wordt.Daarnaast werd ook een kwalitatieve interpretatie getoond voor het belang vanmeervoudige verstrooiing in 3D-PET. Het werd duidelijk dat alleen verstrooi-ing van eerste orde de fotopiekacquisities significant degradeert voor alle de-tectormaterialen. Het werk voorgesteld in deze sectie resulteerde in een tijd-schriftartikel [106] en in drie publicaties in de proceedings van internationaleconferenties [105, 108, 109]. Het is de eerste simulatiestudie die zo uitgebreidgebruik maakt van de virtuele GATE-kloksynchronisatie. Het is ook de eer-ste simulatiestudie in het domein die het belang van patientverstrooiing vanveelvoudige orde op antropomorfe fantomen evalueert voor verschillende kris-talmaterialen, in het bijzonder wat LaBr3 en LuI3 betreft.
0.5 Beeldvormingssystemen en collimatorontwerp
0.5.1 Inleiding
Beeldformatiemodellering is een van de belangrijkste bestaansredenen vanMonte-Carlosimulaties in de nucleaire geneeskunde. In deze sectie gebrui-ken we Monte-Carlosimulaties om een nieuw SPECT-ontwerp, bestaandeuit een roterende-vlakkencollimator geplaatst op een strookvormige vaste-stofdetector, te onderzoeken. De studie bestond meer specifiek uit het model-leren van het Solstice prototype (Eng.: Solid State with Compact Electronics)dat een hogere spatiale resolutie bij een vergelijkbare sensitiviteit beoogt.
0.5.2 Solstice-detector: basiskenmerken
Het concept van de Solstice-camera (figuur 18(a)) [43, 52] bestaat uit eenroterende-vlakkencollimator geplaatst op een strookvormige detector, ver-vaardigd uit Cadmium Zink Telluride (CZT). De collimatorschotten zijn ge-maakt uit wolfraam en lood. We modelleerden de CZT-strook met de cor-recte pixelisatie-periode van 1.8 mm (CZT-RV). Elke fysische interactie, be-halve de productie van elektron-gat paren en het verval naar subniveau’s,werd gemodelleerd (figuur 18(b)). Figuur 19 toont dat de spatiale resolu-tie van het ontwerp met de roterende schotten beter is dan bij een klassiek
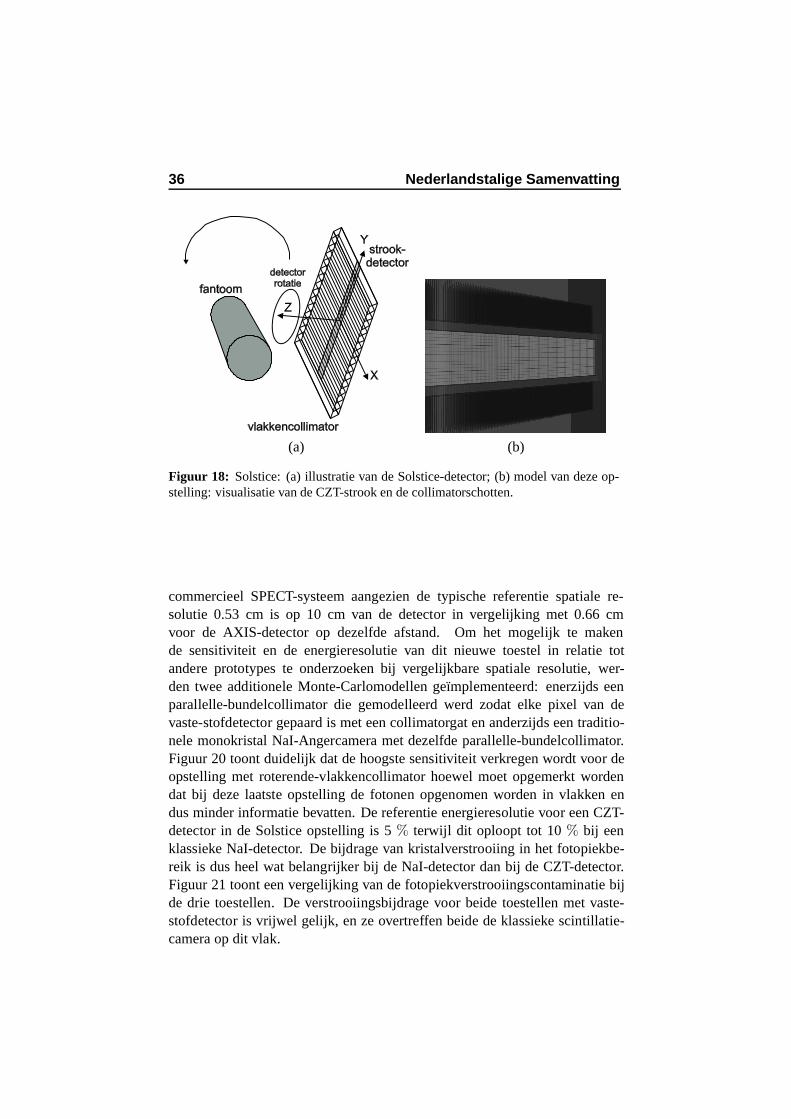
36 Nederlandstalige Samenvatting
strook-
detector
vlakkencollimator
X
Y
Z
fantoom
detector
rotatie
(a) (b)
Figuur 18: Solstice: (a) illustratie van de Solstice-detector; (b) model van deze op-stelling: visualisatie van de CZT-strook en de collimatorschotten.
commercieel SPECT-systeem aangezien de typische referentie spatiale re-solutie 0.53 cm is op 10 cm van de detector in vergelijking met 0.66 cmvoor de AXIS-detector op dezelfde afstand. Om het mogelijk te makende sensitiviteit en de energieresolutie van dit nieuwe toestel in relatie totandere prototypes te onderzoeken bij vergelijkbare spatiale resolutie, wer-den twee additionele Monte-Carlomodellen geımplementeerd: enerzijds eenparallelle-bundelcollimator die gemodelleerd werd zodat elke pixel van devaste-stofdetector gepaard is met een collimatorgat en anderzijds een traditio-nele monokristal NaI-Angercamera met dezelfde parallelle-bundelcollimator.Figuur 20 toont duidelijk dat de hoogste sensitiviteit verkregen wordt voor deopstelling met roterende-vlakkencollimator hoewel moet opgemerkt wordendat bij deze laatste opstelling de fotonen opgenomen worden in vlakken endus minder informatie bevatten. De referentie energieresolutie voor een CZT-detector in de Solstice opstelling is 5 % terwijl dit oploopt tot 10 % bij eenklassieke NaI-detector. De bijdrage van kristalverstrooiing in het fotopiekbe-reik is dus heel wat belangrijker bij de NaI-detector dan bij de CZT-detector.Figuur 21 toont een vergelijking van de fotopiekverstrooiingscontaminatie bijde drie toestellen. De verstrooiingsbijdrage voor beide toestellen met vaste-stofdetector is vrijwel gelijk, en ze overtreffen beide de klassieke scintillatie-camera op dit vlak.
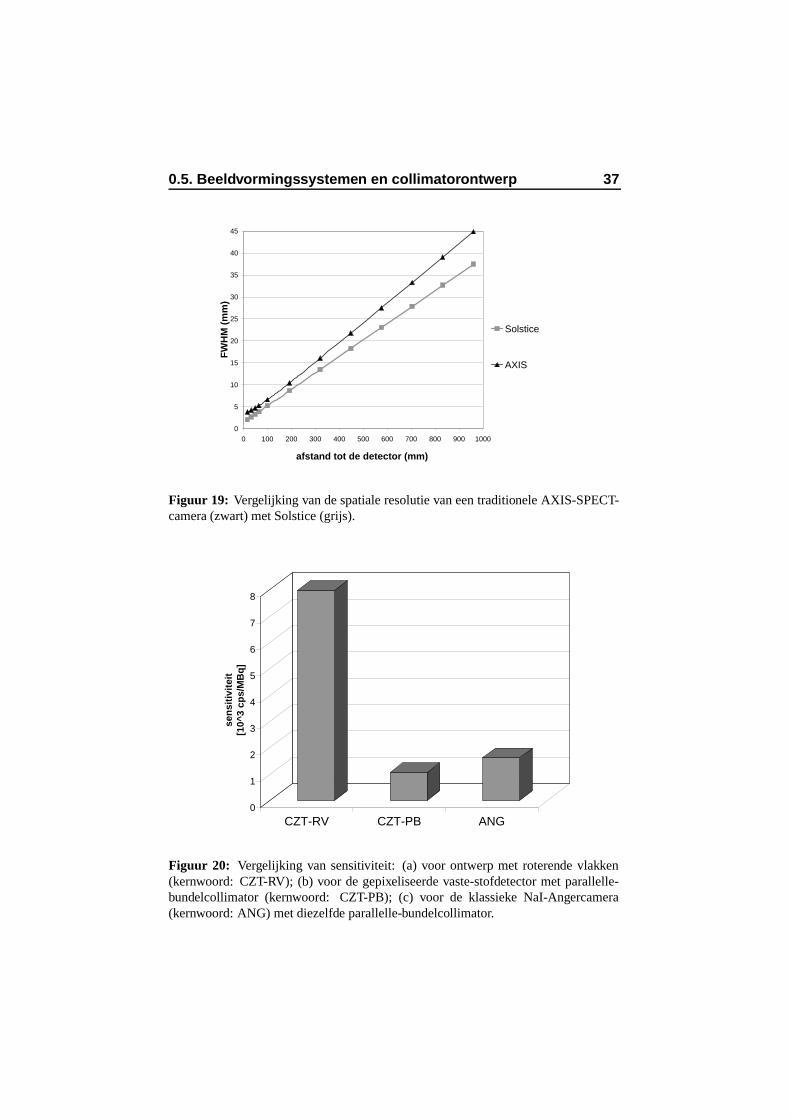
0.5. Beeldvormingssystemen en collimatorontwerp 37
0
5
10
15
20
25
30
35
40
45
0 100 200 300 400 500 600 700 800 900 1000
afstand tot de detector (mm)
FW
HM
(m
m)
Solstice
AXIS
Figuur 19: Vergelijking van de spatiale resolutie van een traditionele AXIS-SPECT-camera (zwart) met Solstice (grijs).
0
1
2
3
4
5
6
7
8
sen
siti
vite
it
[10^
3 cp
s/M
Bq
]
CZT-RV CZT-PB ANG
Figuur 20: Vergelijking van sensitiviteit: (a) voor ontwerp met roterende vlakken(kernwoord: CZT-RV); (b) voor de gepixeliseerde vaste-stofdetector met parallelle-bundelcollimator (kernwoord: CZT-PB); (c) voor de klassieke NaI-Angercamera(kernwoord: ANG) met diezelfde parallelle-bundelcollimator.
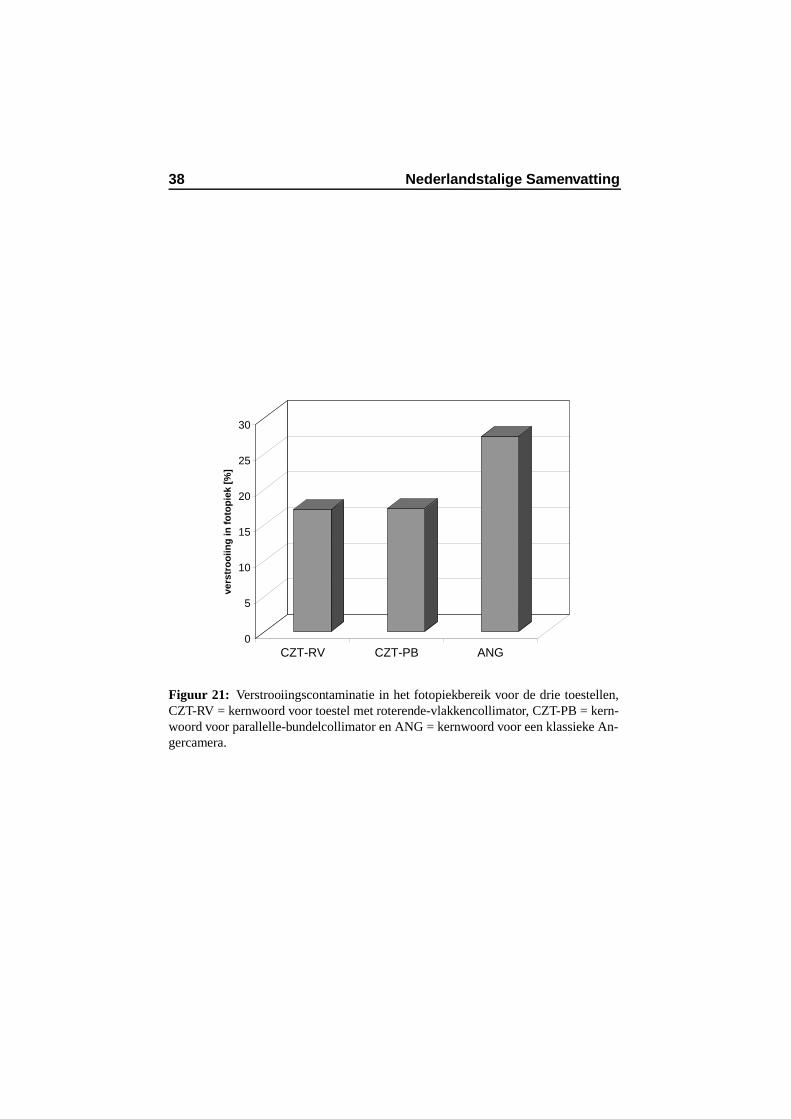
38 Nederlandstalige Samenvatting
0
5
10
15
20
25
30
vers
tro
oiin
g in
fo
top
iek
[%]
CZT-RV CZT-PB ANG
Figuur 21: Verstrooiingscontaminatie in het fotopiekbereik voor de drie toestellen,CZT-RV = kernwoord voor toestel met roterende-vlakkencollimator, CZT-PB = kern-woord voor parallelle-bundelcollimator en ANG = kernwoord voor een klassieke An-gercamera.
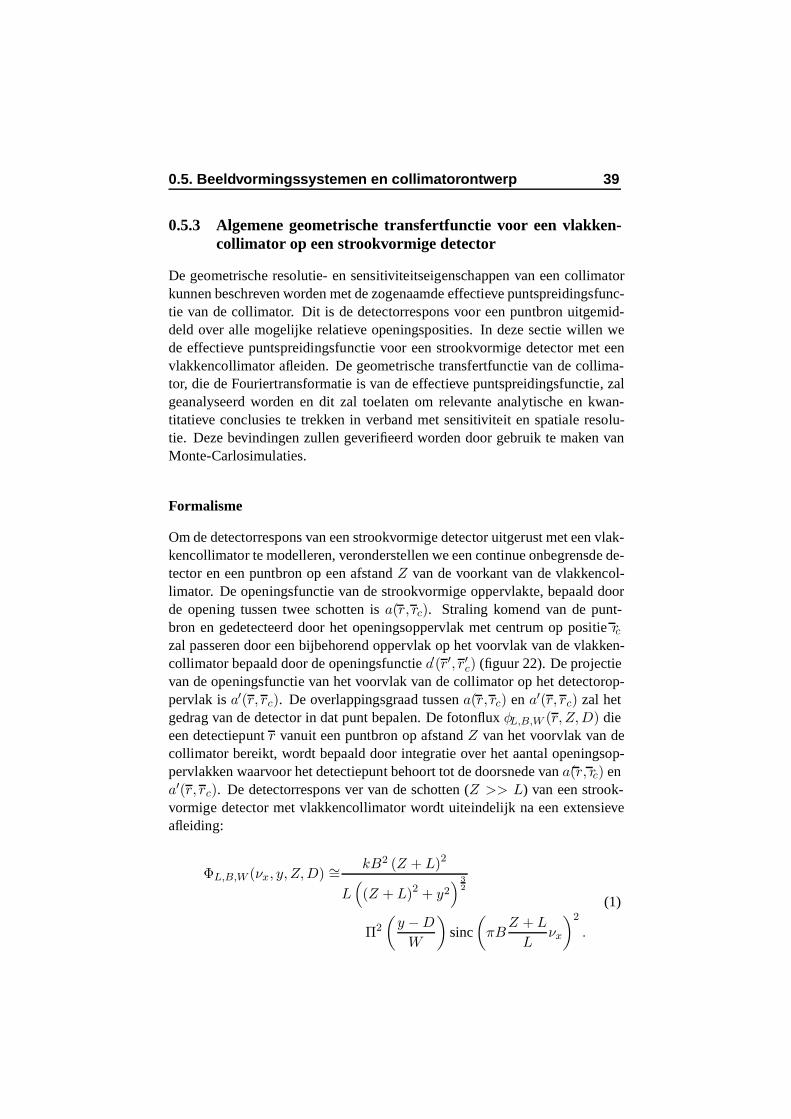
0.5. Beeldvormingssystemen en collimatorontwerp 39
0.5.3 Algemene geometrische transfertfunctie voor een vlakken-collimator op een strookvormige detector
De geometrische resolutie- en sensitiviteitseigenschappen van een collimatorkunnen beschreven worden met de zogenaamde effectieve puntspreidingsfunc-tie van de collimator. Dit is de detectorrespons voor een puntbron uitgemid-deld over alle mogelijke relatieve openingsposities. In deze sectie willen wede effectieve puntspreidingsfunctie voor een strookvormige detector met eenvlakkencollimator afleiden. De geometrische transfertfunctie van de collima-tor, die de Fouriertransformatie is van de effectieve puntspreidingsfunctie, zalgeanalyseerd worden en dit zal toelaten om relevante analytische en kwan-titatieve conclusies te trekken in verband met sensitiviteit en spatiale resolu-tie. Deze bevindingen zullen geverifieerd worden door gebruik te maken vanMonte-Carlosimulaties.
Formalisme
Om de detectorrespons van een strookvormige detector uitgerust met een vlak-kencollimator te modelleren, veronderstellen we een continue onbegrensde de-tector en een puntbron op een afstand Z van de voorkant van de vlakkencol-limator. De openingsfunctie van de strookvormige oppervlakte, bepaald doorde opening tussen twee schotten is a(r, rc). Straling komend van de punt-bron en gedetecteerd door het openingsoppervlak met centrum op positie rczal passeren door een bijbehorend oppervlak op het voorvlak van de vlakken-collimator bepaald door de openingsfunctie a′(r′, r′c) (figuur 22). De projectievan de openingsfunctie van het voorvlak van de collimator op het detectorop-pervlak is a′(r, rc). De overlappingsgraad tussen a(r, rc) en a′(r, rc) zal hetgedrag van de detector in dat punt bepalen. De fotonflux φL,B,W (r, Z,D) dieeen detectiepunt r vanuit een puntbron op afstand Z van het voorvlak van decollimator bereikt, wordt bepaald door integratie over het aantal openingsop-pervlakken waarvoor het detectiepunt behoort tot de doorsnede van a(r, rc) ena′(r, rc). De detectorrespons ver van de schotten (Z >> L) van een strook-vormige detector met vlakkencollimator wordt uiteindelijk na een extensieveafleiding:
ΦL,B,W (νx, y, Z,D) ∼= kB2 (Z + L)2
L(
(Z + L)2 + y2)
32
Π2
(
y − D
W
)
sinc
(
πBZ + L
Lνx
)2
.
(1)
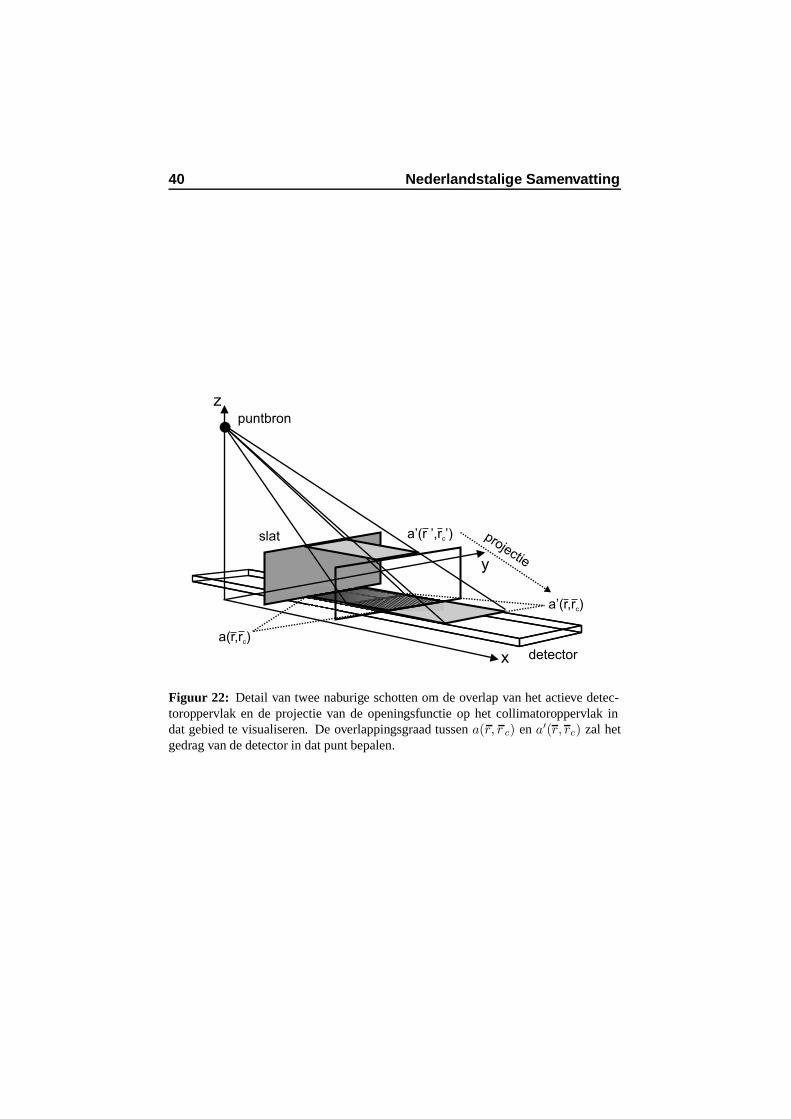
40 Nederlandstalige Samenvatting
x
z
y
puntbron
detector
slat a’(r ’,r ’)c
a(r,r )c
a’(r,r )c
projectie
Figuur 22: Detail van twee naburige schotten om de overlap van het actieve detec-toroppervlak en de projectie van de openingsfunctie op het collimatoroppervlak indat gebied te visualiseren. De overlappingsgraad tussen a(r, r c) en a′(r, rc) zal hetgedrag van de detector in dat punt bepalen.

0.5. Beeldvormingssystemen en collimatorontwerp 41
met L de hoogte van de vlakkencollimator, W de breedte van de strookvormigedetector, B de afstand tussen twee schotten en
Π(x) =
0 for| x | > 12
12 for| x | = 1
2
1 for| x | < 12 .
Analyse
Aan de hand van deze geometrische transfertfunctie analyseerden we de spa-tiale resolutie, de sensitiviteit en de lijnspreidingsfuncties en verifieerden deresultaten door middel van nauwkeurige GATE Monte-Carlosimulaties.
Sensitiviteit: uit uitdrukking 1 bekomt men voor een detectiepunt r = (x, y)dat deel uitmaakt van de strookvormige detector een DC-frequentiecomponent
die benaderend gewogen is door een factor evenredig met cos2(θ)
((Z+L)2+y2)12
, met
θ de incidentiehoek tussen een straal van de puntbron en de normaalvector op
de detector en met(
(Z + L)2 + y2)
12
de afstand tussen puntbron en detector.
Deze wegingsfactor bepaalt de sensitiviteit voor een locatie in de FOV. Als ve-rificatie werd een rechthoekig grid van puntbronnen gesimuleerd in de FOV opverschillende afstanden van het voorvlak van de vlakkencollimator en van hetcentrum van de detectorstrip. De resultaten van deze simulatiestudie bevestig-den dat het verloop van de sensitiviteit omgekeerd evenredig is met de afstand.We voerden bijkomende simulaties uit om de invloed van de incidentiehoek opde sensitiviteit te evalueren. De vergelijking tussen de simulatieresultaten ende theoretische berekeningen is getoond in figuur 23. De hoogste sensitiviteitwerd geregistreerd bij puntbronnen voor de detector, terwijl de sensitiviteit ver-mindert volgens cos2(θ) voor schuin invallende fotonen, hetgeen theoretischvoorspeld wordt door vergelijking 1.
Spatiale resolutie: afgezien van de wegingsfactor is uitdrukking 1 enkel af-hankelijk van Z of dus van de verticale afstand tussen de puntbron en het col-limatoroppervlak. Vandaar dat het resolutiegedrag van een strookvormige de-tector met een vlakkencollimator alleen bepaald zal worden door de loodrechteafstand tussen de bron en het collimatoroppervlak. Om dit gedrag te verifierenwerden vier afzonderlijke puntbronnen in de FOV geplaatst op zekere afstandvan het voorvlak van de collimatorschotten en op verschillende afstand van het
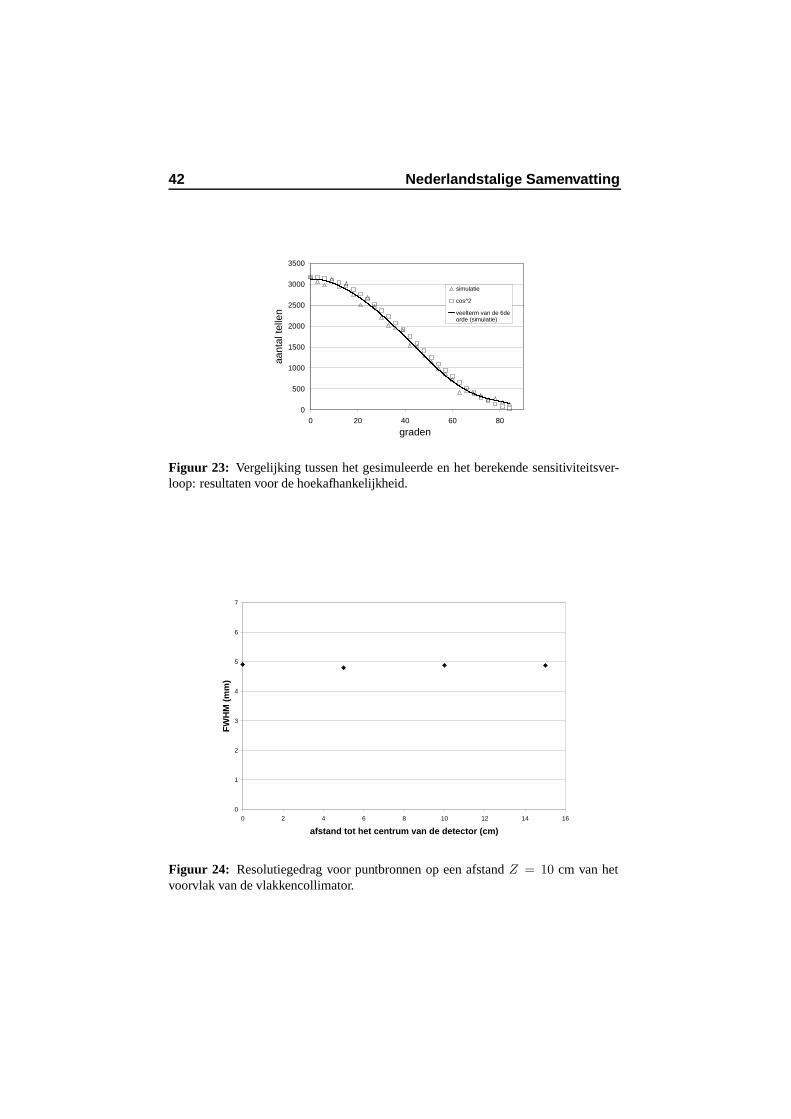
42 Nederlandstalige Samenvatting
0
500
1000
1500
2000
2500
3000
3500
0 20 40 60 80
graden
aant
al te
llen
simulatie
cos^2
veelterm van de 6deorde (simulatie)
Figuur 23: Vergelijking tussen het gesimuleerde en het berekende sensitiviteitsver-loop: resultaten voor de hoekafhankelijkheid.
0
1
2
3
4
5
6
7
0 2 4 6 8 10 12 14 16
afstand tot het centrum van de detector (cm)
FW
HM
(m
m)
Figuur 24: Resolutiegedrag voor puntbronnen op een afstand Z = 10 cm van hetvoorvlak van de vlakkencollimator.
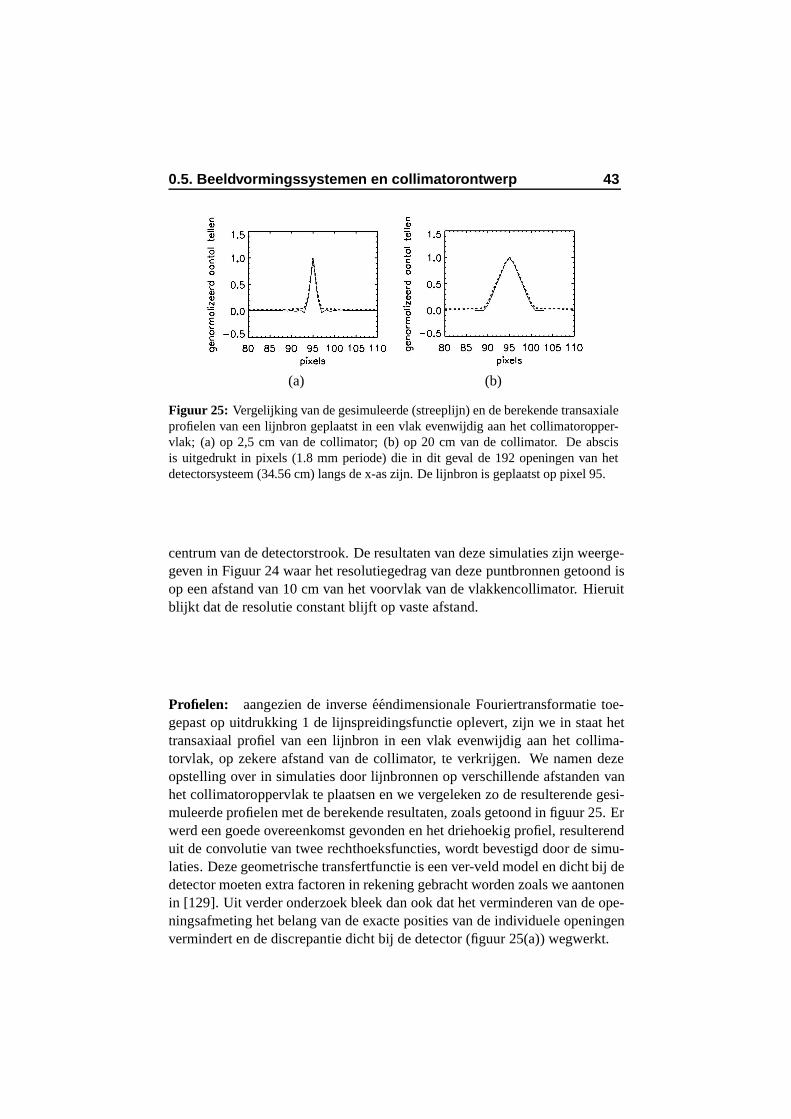
0.5. Beeldvormingssystemen en collimatorontwerp 43
(a) (b)
Figuur 25: Vergelijking van de gesimuleerde (streeplijn) en de berekende transaxialeprofielen van een lijnbron geplaatst in een vlak evenwijdig aan het collimatoropper-vlak; (a) op 2,5 cm van de collimator; (b) op 20 cm van de collimator. De abscisis uitgedrukt in pixels (1.8 mm periode) die in dit geval de 192 openingen van hetdetectorsysteem (34.56 cm) langs de x-as zijn. De lijnbron is geplaatst op pixel 95.
centrum van de detectorstrook. De resultaten van deze simulaties zijn weerge-geven in Figuur 24 waar het resolutiegedrag van deze puntbronnen getoond isop een afstand van 10 cm van het voorvlak van de vlakkencollimator. Hieruitblijkt dat de resolutie constant blijft op vaste afstand.
Profielen: aangezien de inverse eendimensionale Fouriertransformatie toe-gepast op uitdrukking 1 de lijnspreidingsfunctie oplevert, zijn we in staat hettransaxiaal profiel van een lijnbron in een vlak evenwijdig aan het collima-torvlak, op zekere afstand van de collimator, te verkrijgen. We namen dezeopstelling over in simulaties door lijnbronnen op verschillende afstanden vanhet collimatoroppervlak te plaatsen en we vergeleken zo de resulterende gesi-muleerde profielen met de berekende resultaten, zoals getoond in figuur 25. Erwerd een goede overeenkomst gevonden en het driehoekig profiel, resulterenduit de convolutie van twee rechthoeksfuncties, wordt bevestigd door de simu-laties. Deze geometrische transfertfunctie is een ver-veld model en dicht bij dedetector moeten extra factoren in rekening gebracht worden zoals we aantonenin [129]. Uit verder onderzoek bleek dan ook dat het verminderen van de ope-ningsafmeting het belang van de exacte posities van de individuele openingenvermindert en de discrepantie dicht bij de detector (figuur 25(a)) wegwerkt.
44 Nederlandstalige Samenvatting
0.5.4 Studie van waarnemersperformantie
De informatieinhoud van een foton gedetecteerd op de drie systemen bespro-ken in voorgaande paragrafen, is verschillend. Dit zorgt ervoor dat de sensiti-viteit geen objectieve waardemeter is en bijgevolg werd additioneel een ROC-studie (Eng.: Receiver Operating Characteristics) [115] uitgevoerd op gesimu-leerde datasets om de hotspot-detecteerbaarheid van de drie systemen te evalu-eren. Daartoe werden de datasets van hotspots gesimuleerd terwijl de achter-gronden gereproduceerd werden, daarbij gebruik makend van de bootstrapme-thode [20] op gesimuleerde lijstmodebestanden (LMF, Eng.: List Mode Files).
Studieontwerp
Om de datasets van de hierboven besproken performantiestudie te genere-ren, werden drie simulatiestudies uitgevoerd: simulatiestudie 1 met een niet-attenuerend medium, simulatiestudie 2 met een attenuerend fantoom en simu-latiestudie 3 met een hotspot in datzelfde fantoom.
Reconstructie
Er werd een pas ontwikkelde reconstructietechniek, gebaseerd op natuurlijkepixels, gebruikt om de lijstmodebestanden, die resulteren uit de eerder ver-melde simulatiestudies, te reconstrueren. Natuurlijke-pixelreconstructie wordtbesproken in sectie 0.7. De eerste simulatiestudie (zonder attenuerend fan-toom) werd gebruikt om de systeemmatrices voor de verschillende systemente genereren. De Algebraısche Reconstructietechniek (ART) werd gekozen omde reconstructievergelijking iteratief op te lossen.
Performantieanalyse: ROC-studie
Voor de vaste-stofdetector met roterende-vlakkencollimator, voor de vaste-stofdetector met parallelle-bundelcollimator en voor de klassieke Anger-camera werden drie reeksen van beelden opgesteld. We toonden die 3 reek-sen van 100 beelden aan 4 menselijke waarnemers: 50 als set om te oefenenen 50 beelden die moesten geevalueerd worden. In 25 beelden van elke setwas een hotspot aanwezig terwijl de andere 25 beelden alleen bestonden uitachtergrondactiviteit. Daartoe werden simulatiestudie 2 en simulatiestudie 3toegepast voor alle drie de acquisitiesetups. Simulatiestudie 2 werd voor elkereeks eenmaal uitgevoerd om de achtergrondactiviteit te simuleren. Die uit-voer werd dan 50 maal gereproduceerd door middel van bootstrapping. Ditlevert dezelfde menselijke waarnemersperformantie op, op voorwaarde dat de
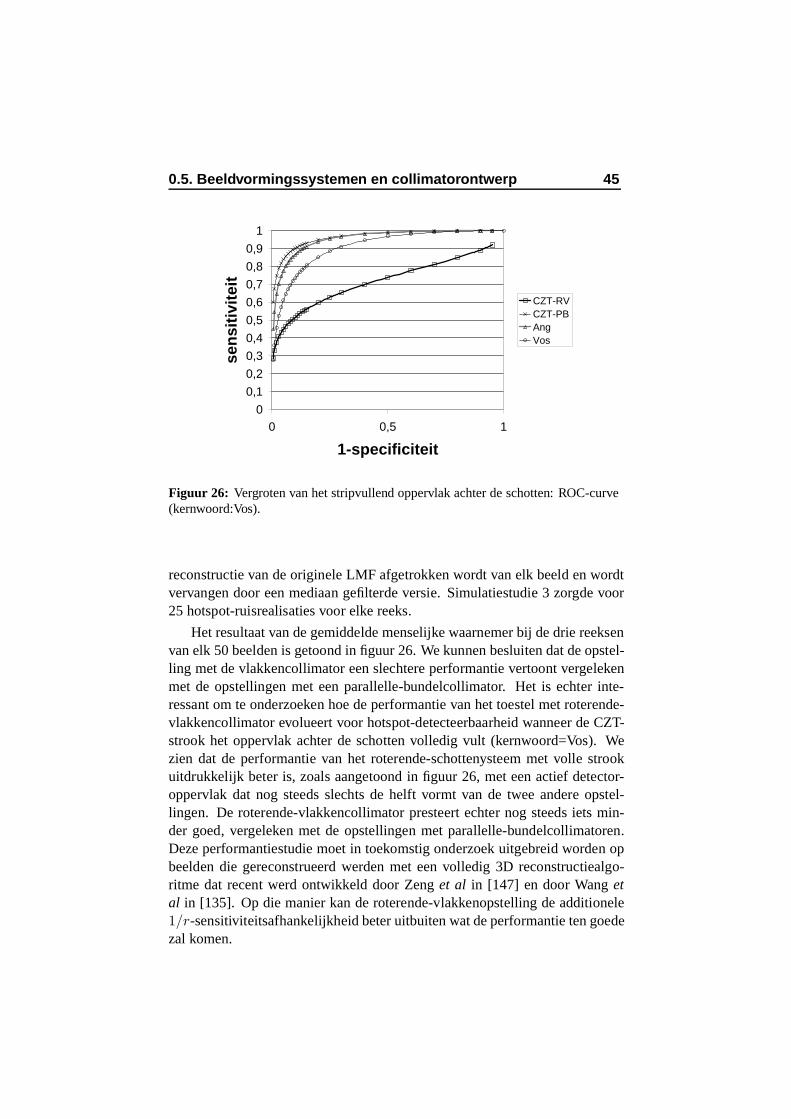
0.5. Beeldvormingssystemen en collimatorontwerp 45
0
0,1
0,2
0,3
0,4
0,5
0,6
0,7
0,8
0,9
1
0 0,5 1
1-specificiteit
sen
siti
vite
it
CZT-RVCZT-PBAngVos
Figuur 26: Vergroten van het stripvullend oppervlak achter de schotten: ROC-curve(kernwoord:Vos).
reconstructie van de originele LMF afgetrokken wordt van elk beeld en wordtvervangen door een mediaan gefilterde versie. Simulatiestudie 3 zorgde voor25 hotspot-ruisrealisaties voor elke reeks.
Het resultaat van de gemiddelde menselijke waarnemer bij de drie reeksenvan elk 50 beelden is getoond in figuur 26. We kunnen besluiten dat de opstel-ling met de vlakkencollimator een slechtere performantie vertoont vergelekenmet de opstellingen met een parallelle-bundelcollimator. Het is echter inte-ressant om te onderzoeken hoe de performantie van het toestel met roterende-vlakkencollimator evolueert voor hotspot-detecteerbaarheid wanneer de CZT-strook het oppervlak achter de schotten volledig vult (kernwoord=Vos). Wezien dat de performantie van het roterende-schottenysteem met volle strookuitdrukkelijk beter is, zoals aangetoond in figuur 26, met een actief detector-oppervlak dat nog steeds slechts de helft vormt van de twee andere opstel-lingen. De roterende-vlakkencollimator presteert echter nog steeds iets min-der goed, vergeleken met de opstellingen met parallelle-bundelcollimatoren.Deze performantiestudie moet in toekomstig onderzoek uitgebreid worden opbeelden die gereconstrueerd werden met een volledig 3D reconstructiealgo-ritme dat recent werd ontwikkeld door Zeng et al in [147] en door Wang etal in [135]. Op die manier kan de roterende-vlakkenopstelling de additionele1/r-sensitiviteitsafhankelijkheid beter uitbuiten wat de performantie ten goedezal komen.
46 Nederlandstalige Samenvatting
0.5.5 Conclusie
We onderzochten een nieuw acquisitiesysteem met een strookvormige vaste-stofdetector en met een vlakkencollimator. We vergeleken dit systeem met op-stellingen bestaande uit een parallelle-bundelcollimator op een gepixeliseerdevaste-stofdetector en bestaande uit diezelfde collimator op een monokristalNaI-detector. Verder werd er een theoretische formulering afgeleid voor deeffectieve puntspreidingsfunctie van een vlakkencollimator op een strookvor-mige detector en werd additioneel een performantiestudie uitgevoerd die dedrie bovenvermelde systemen vergeleek wat hotspot-detecteerbaarheid betreft.Suggesties werden gemaakt voor het vergroten van de strook en voor het uit-breiden van de performantiestudies. We breidden het werk van Metz [79] enTsui [121] over de geometrische transfertfunctie van een vlakkencollimator opeen strookvormige detector uit. Bovendien beschrijft dit hoofdstuk de eerstemenselijke-waarnemerstudie over de Solstice beeldvormingsperformantie. Ditwerk resulteerde in twee tijdschriftartikels [104, 130] en in drie publicaties inde proceedings van internationale conferenties [70, 102, 129].
0.6 Modellering van de detector
0.6.1 Inleiding
In de vorige sectie bespraken we het gebruik van Monte-Carlosimulaties voorhet modelleren van prototype-acquisitiesystemen. Een ander belangrijk inte-resseveld is het simuleren van intrinsieke detectoreigenschappen. De belang-rijkste toepassing daarvan is resolutieherstel in PET. De eindige pixelisatie enhet beperkte aantal PMT’s veroorzaken een intrinsieke puntspreidingsfunctieop alle detectielokaties. In deze sectie zullen we dan ook een theoretisch modelvoor deze spatiale onzekerheid van een LOR beschrijven, te wijten aan de on-volmaakte lokalisatie van gebeurtenissen op de detectorkoppen. De penetratievan fotonen in het kristal zorgt echter voor een verplaasting en een anisotropiein deze puntspreidingsfunctie zodat het nodig zal blijken om de kristalpene-tratie in rekening te brengen voor schuin invallende fotonen. Voor alle geval-len zal een grondige afleiding van het theoretisch model besproken worden envoorbeelden van probabiliteitsdichtheidsfuncties (pdf’s) zullen gegeven wor-den. Bovendien zullen geschikte functies gefit worden aan de transversale pro-fielen van deze pdf’s en hun karakteristieken zullen onderzocht worden. Eva-luatie van het model dient te gebeuren aan de hand van Monte-Carlosimulatiesaangezien de hedendaagse technolgie niet voldoende resolutiebereik heeft omde vereiste diepteafhankelijke informatie op te leveren. Na deze verificatie kanhet beschreven model dan gebruikt worden om het intrinsiek resolutie-effect
0.6. Modellering van de detector 47
in te bouwen in de reconstructie door middel van een beter gedefinieerd ac-quisitieproces. In deze sectie zullen we daartoe twee reconstructiemethodesvoorstellen waarvan de meestbelovende in sectie 0.7 gedetailleerd besprokenzal worden.
0.6.2 Theoretische afleiding
We behandelen eerst het tweedimensionaal geval van loodrecht invallende fo-tonen op een acquisitieopstelling bestaande uit twee parallelle detectorkoppenwaarna we dit uitbreiden tot drie dimensies. Vervolgens zullen we schuin in-vallende fotonen in twee en drie dimensies bestuderen.
Loodrecht invallende fotonen
We hebben een model nodig voor het voorwaarts probleem van de onzekerheidop de detectielocatie. We veronderstellen een Gaussverdeling (standdaardde-viatie σ0y) voor de actuele interactiepositie op de detectorkop, gecentreerd opde gemeten positie. We zijn geınteresseerd in de a posteriori waarschijnlijk-heid S(p, q) dat een gebeurtenis voortkomt uit een punt (p, q) in de FOV alsde detectielocaties gegeven zijn. Daartoe integreren we alle mogelijke LOR’sdoor dat punt, gewogen met de Gaussiaanse detectiewaarschijnlijkheid aande eindpunten van die respectievelijke LOR’s (figuur 27). Deze a posterioriwaarschijnlijkheidsfunctie kan dan overgenomen worden in een meer accurateversie van een lijstmodereconstructiealgoritme. We verkrijgen de volgendeuitdrukking voor de waarschijnlijkheid:
S(p, q) =
∫ |θmax|
−|θmin|s(θ)dθ
S(p, q) =1
2πσ20y
∫ |θmax|
−|θmin|ew(θ)dθ
w(θ) = − [(D/2 − p) tan θ + q]2 + [−(D/2 + p) tan θ + q]2
2σ0y2
. (2)
We nemen aan dat de kristaldikte geen invloed heeft op de detectiewaarschijn-lijkheid, wat in dit geval zinvol is aangezien de incidentiehoek van beide fo-tonen heel klein is wanneer σ0y realistisch gekozen wordt. Wanneer we voorde interactiepositie op de detectorkoppen een tweedimensionale Gaussverde-ling aannemen, wordt de resulterende formule voor de waarschijnlijkheid in
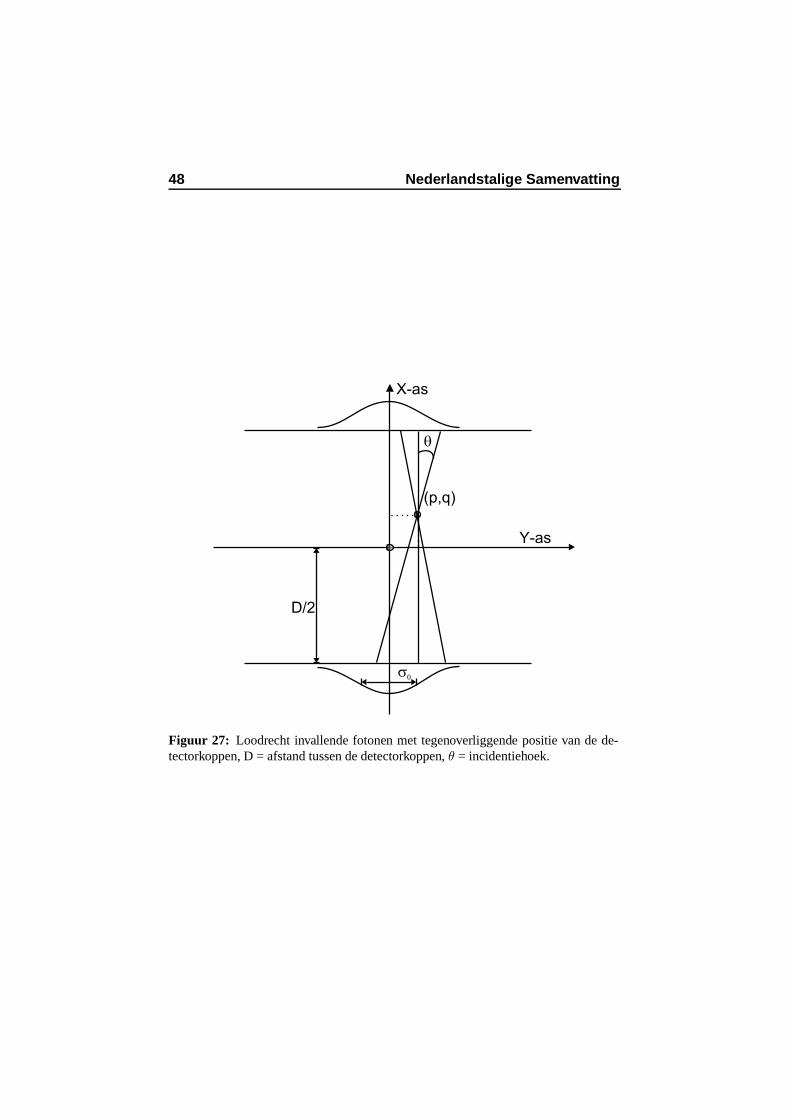
48 Nederlandstalige Samenvatting
(p,q)
Y-as
X-as
D/2
s0
q
Figuur 27: Loodrecht invallende fotonen met tegenoverliggende positie van de de-tectorkoppen, D = afstand tussen de detectorkoppen, θ = incidentiehoek.
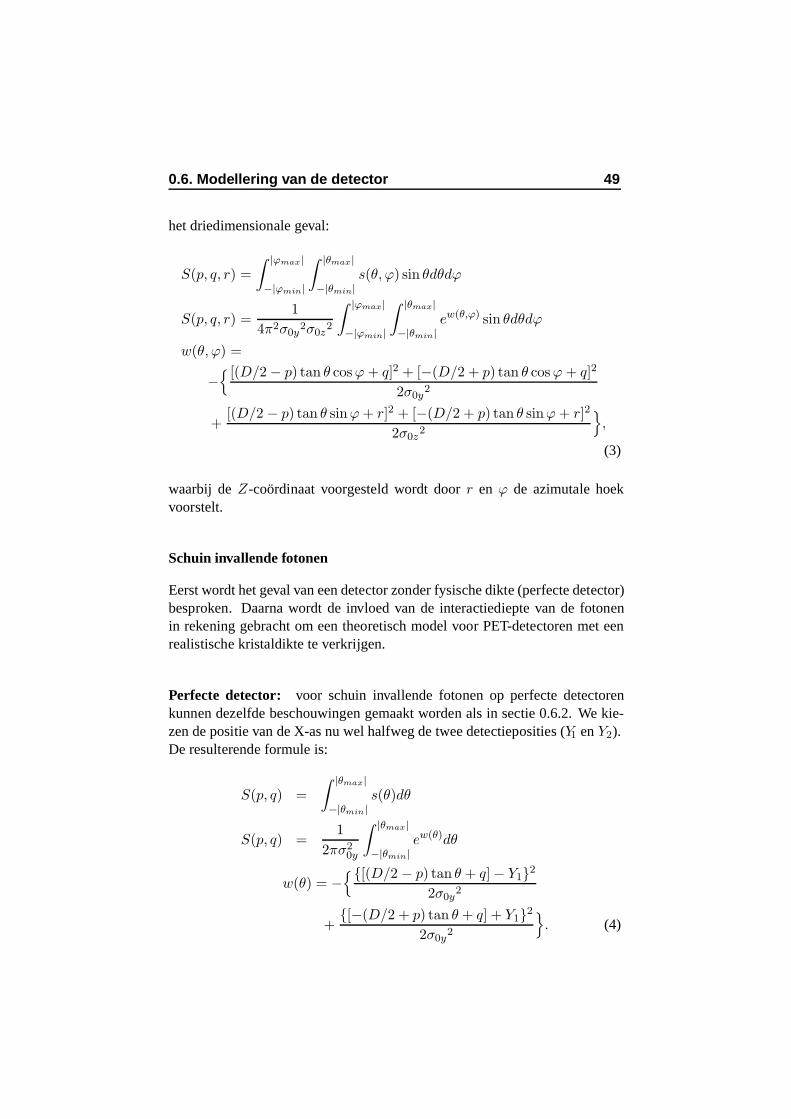
0.6. Modellering van de detector 49
het driedimensionale geval:
S(p, q, r) =
∫ |ϕmax|
−|ϕmin|
∫ |θmax|
−|θmin|s(θ, ϕ) sin θdθdϕ
S(p, q, r) =1
4π2σ0y2σ0z
2
∫ |ϕmax|
−|ϕmin|
∫ |θmax|
−|θmin|ew(θ,ϕ) sin θdθdϕ
w(θ, ϕ) =
−{ [(D/2 − p) tan θ cos ϕ + q]2 + [−(D/2 + p) tan θ cos ϕ + q]2
2σ0y2
+[(D/2 − p) tan θ sinϕ + r]2 + [−(D/2 + p) tan θ sinϕ + r]2
2σ0z2
}
,
(3)
waarbij de Z-coordinaat voorgesteld wordt door r en ϕ de azimutale hoekvoorstelt.
Schuin invallende fotonen
Eerst wordt het geval van een detector zonder fysische dikte (perfecte detector)besproken. Daarna wordt de invloed van de interactiediepte van de fotonenin rekening gebracht om een theoretisch model voor PET-detectoren met eenrealistische kristaldikte te verkrijgen.
Perfecte detector: voor schuin invallende fotonen op perfecte detectorenkunnen dezelfde beschouwingen gemaakt worden als in sectie 0.6.2. We kie-zen de positie van de X-as nu wel halfweg de twee detectieposities (Y1 en Y2).De resulterende formule is:
S(p, q) =
∫ |θmax|
−|θmin|s(θ)dθ
S(p, q) =1
2πσ20y
∫ |θmax|
−|θmin|ew(θ)dθ
w(θ) = −{{[(D/2 − p) tan θ + q] − Y1}2
2σ0y2
+{[−(D/2 + p) tan θ + q] + Y1}2
2σ0y2
}
. (4)
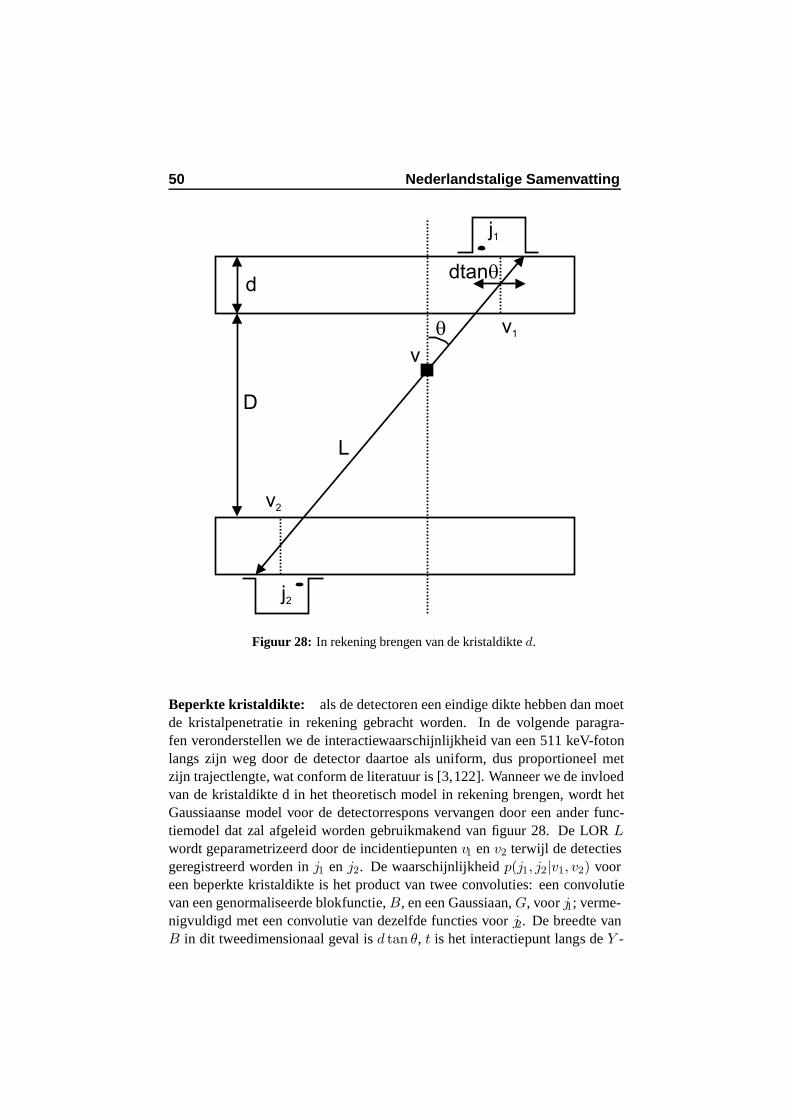
50 Nederlandstalige Samenvatting
v1
j1
v2
j2
L
v
d
D
q
dtanq
Figuur 28: In rekening brengen van de kristaldikte d.
Beperkte kristaldikte: als de detectoren een eindige dikte hebben dan moetde kristalpenetratie in rekening gebracht worden. In de volgende paragra-fen veronderstellen we de interactiewaarschijnlijkheid van een 511 keV-fotonlangs zijn weg door de detector daartoe als uniform, dus proportioneel metzijn trajectlengte, wat conform de literatuur is [3,122]. Wanneer we de invloedvan de kristaldikte d in het theoretisch model in rekening brengen, wordt hetGaussiaanse model voor de detectorrespons vervangen door een ander func-tiemodel dat zal afgeleid worden gebruikmakend van figuur 28. De LOR Lwordt geparametrizeerd door de incidentiepunten v1 en v2 terwijl de detectiesgeregistreerd worden in j1 en j2. De waarschijnlijkheid p(j1, j2|v1, v2) vooreen beperkte kristaldikte is het product van twee convoluties: een convolutievan een genormaliseerde blokfunctie, B, en een Gaussiaan, G, voor j1; verme-nigvuldigd met een convolutie van dezelfde functies voor j2. De breedte vanB in dit tweedimensionaal geval is d tan θ, t is het interactiepunt langs de Y -
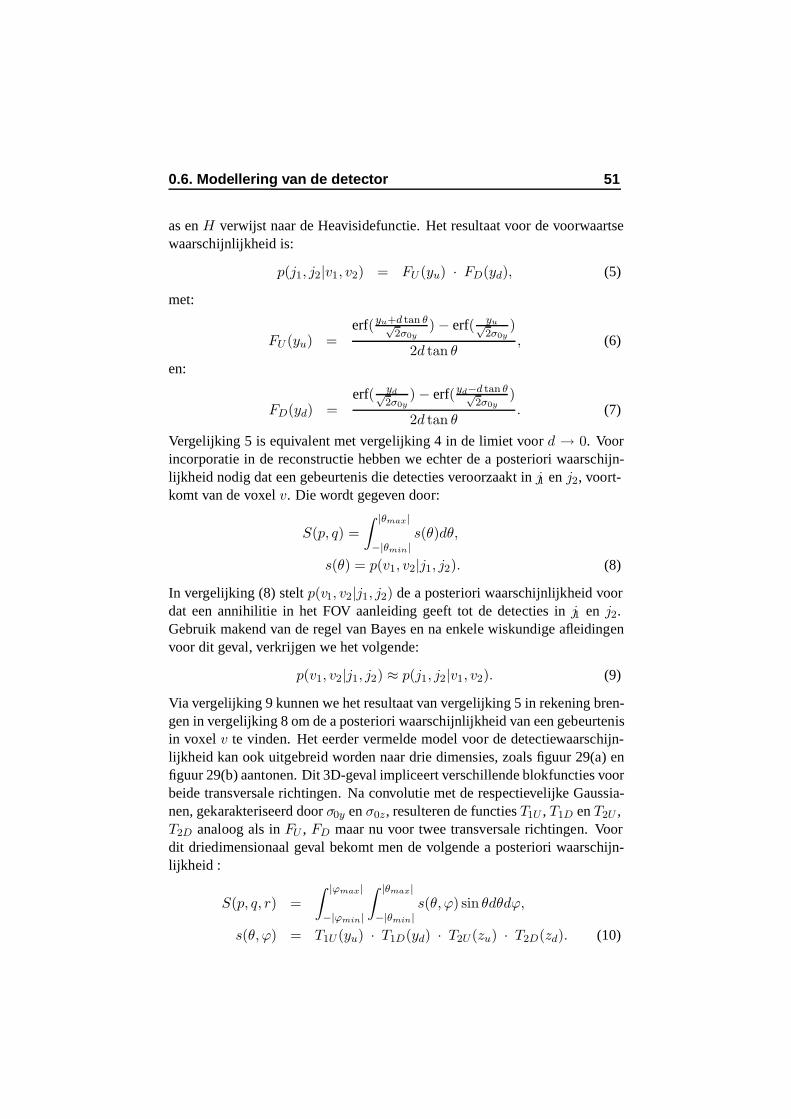
0.6. Modellering van de detector 51
as en H verwijst naar de Heavisidefunctie. Het resultaat voor de voorwaartsewaarschijnlijkheid is:
p(j1, j2|v1, v2) = FU (yu) · FD(yd), (5)
met:
FU (yu) =erf(yu+d tan θ√
2σ0y) − erf( yu√
2σ0y)
2d tan θ, (6)
en:
FD(yd) =erf( yd√
2σ0y) − erf(yd−d tan θ√
2σ0y)
2d tan θ. (7)
Vergelijking 5 is equivalent met vergelijking 4 in de limiet voor d → 0. Voorincorporatie in de reconstructie hebben we echter de a posteriori waarschijn-lijkheid nodig dat een gebeurtenis die detecties veroorzaakt in j1 en j2, voort-komt van de voxel v. Die wordt gegeven door:
S(p, q) =
∫ |θmax|
−|θmin|s(θ)dθ,
s(θ) = p(v1, v2|j1, j2). (8)
In vergelijking (8) stelt p(v1, v2|j1, j2) de a posteriori waarschijnlijkheid voordat een annihilitie in het FOV aanleiding geeft tot de detecties in j1 en j2.Gebruik makend van de regel van Bayes en na enkele wiskundige afleidingenvoor dit geval, verkrijgen we het volgende:
p(v1, v2|j1, j2) ≈ p(j1, j2|v1, v2). (9)
Via vergelijking 9 kunnen we het resultaat van vergelijking 5 in rekening bren-gen in vergelijking 8 om de a posteriori waarschijnlijkheid van een gebeurtenisin voxel v te vinden. Het eerder vermelde model voor de detectiewaarschijn-lijkheid kan ook uitgebreid worden naar drie dimensies, zoals figuur 29(a) enfiguur 29(b) aantonen. Dit 3D-geval impliceert verschillende blokfuncties voorbeide transversale richtingen. Na convolutie met de respectievelijke Gaussia-nen, gekarakteriseerd door σ0y en σ0z , resulteren de functies T1U , T1D en T2U ,T2D analoog als in FU , FD maar nu voor twee transversale richtingen. Voordit driedimensionaal geval bekomt men de volgende a posteriori waarschijn-lijkheid :
S(p, q, r) =
∫ |ϕmax|
−|ϕmin|
∫ |θmax|
−|θmin|s(θ, ϕ) sin θdθdϕ,
s(θ, ϕ) = T1U (yu) · T1D(yd) · T2U (zu) · T2D(zd). (10)
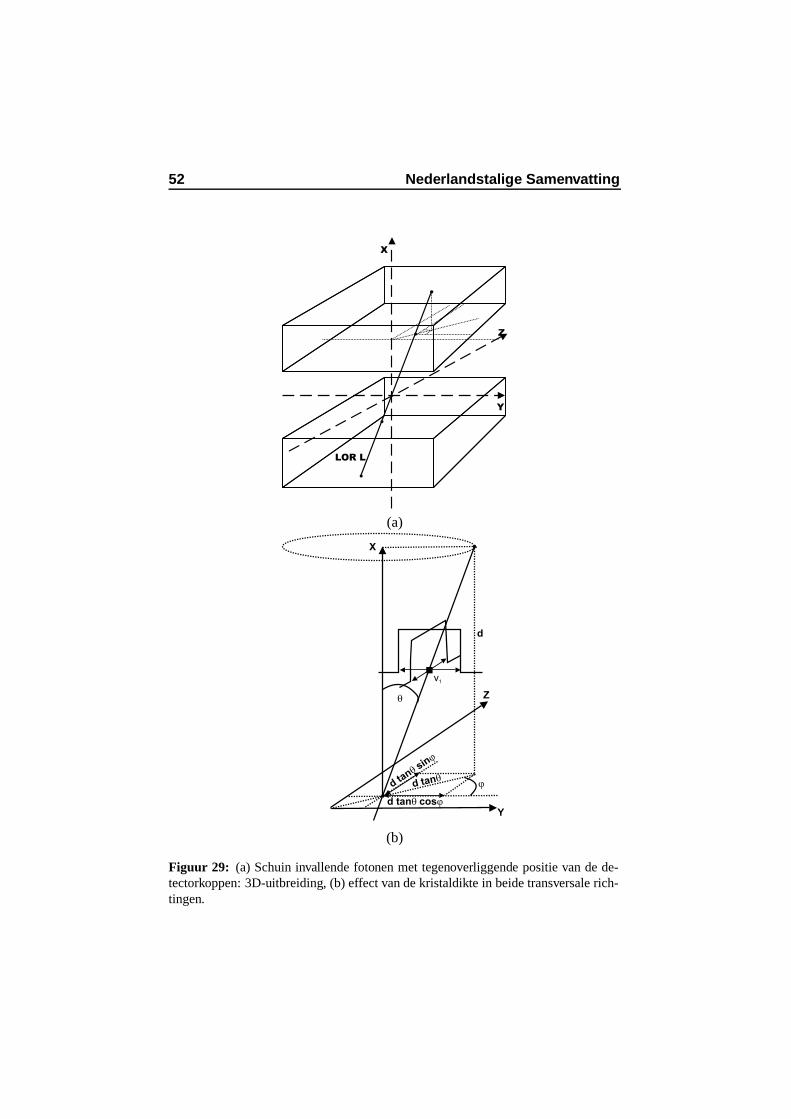
52 Nederlandstalige Samenvatting
Y
X
Z
LOR L
(a)
j
q
d tanq
d
d tan cosq j
d tan
sinq
j
Y
X
Z
v1
(b)
Figuur 29: (a) Schuin invallende fotonen met tegenoverliggende positie van de de-tectorkoppen: 3D-uitbreiding, (b) effect van de kristaldikte in beide transversale rich-tingen.
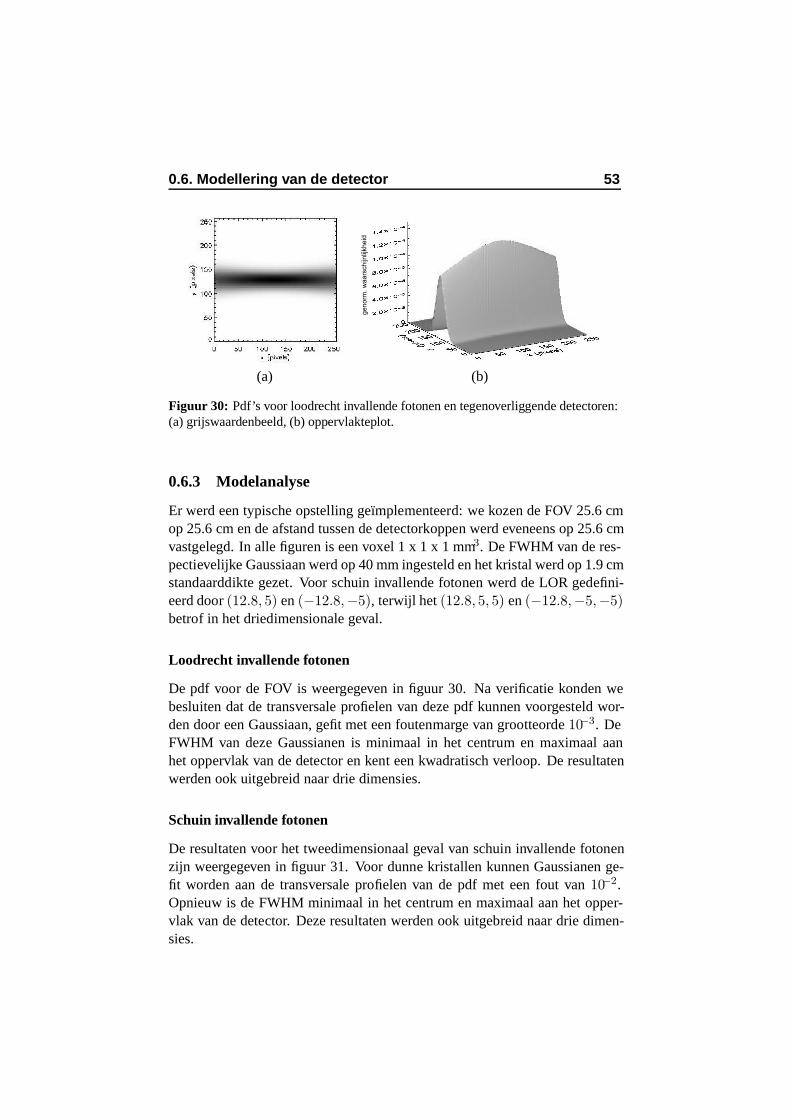
0.6. Modellering van de detector 53
ge
no
rm.
wa
ars
ch
ijnlij
kh
eid
(a) (b)
Figuur 30: Pdf’s voor loodrecht invallende fotonen en tegenoverliggende detectoren:(a) grijswaardenbeeld, (b) oppervlakteplot.
0.6.3 Modelanalyse
Er werd een typische opstelling geımplementeerd: we kozen de FOV 25.6 cmop 25.6 cm en de afstand tussen de detectorkoppen werd eveneens op 25.6 cmvastgelegd. In alle figuren is een voxel 1 x 1 x 1 mm3. De FWHM van de res-pectievelijke Gaussiaan werd op 40 mm ingesteld en het kristal werd op 1.9 cmstandaarddikte gezet. Voor schuin invallende fotonen werd de LOR gedefini-eerd door (12.8, 5) en (−12.8,−5), terwijl het (12.8, 5, 5) en (−12.8,−5,−5)betrof in het driedimensionale geval.
Loodrecht invallende fotonen
De pdf voor de FOV is weergegeven in figuur 30. Na verificatie konden webesluiten dat de transversale profielen van deze pdf kunnen voorgesteld wor-den door een Gaussiaan, gefit met een foutenmarge van grootteorde 10−3. DeFWHM van deze Gaussianen is minimaal in het centrum en maximaal aanhet oppervlak van de detector en kent een kwadratisch verloop. De resultatenwerden ook uitgebreid naar drie dimensies.
Schuin invallende fotonen
De resultaten voor het tweedimensionaal geval van schuin invallende fotonenzijn weergegeven in figuur 31. Voor dunne kristallen kunnen Gaussianen ge-fit worden aan de transversale profielen van de pdf met een fout van 10−2.Opnieuw is de FWHM minimaal in het centrum en maximaal aan het opper-vlak van de detector. Deze resultaten werden ook uitgebreid naar drie dimen-sies.
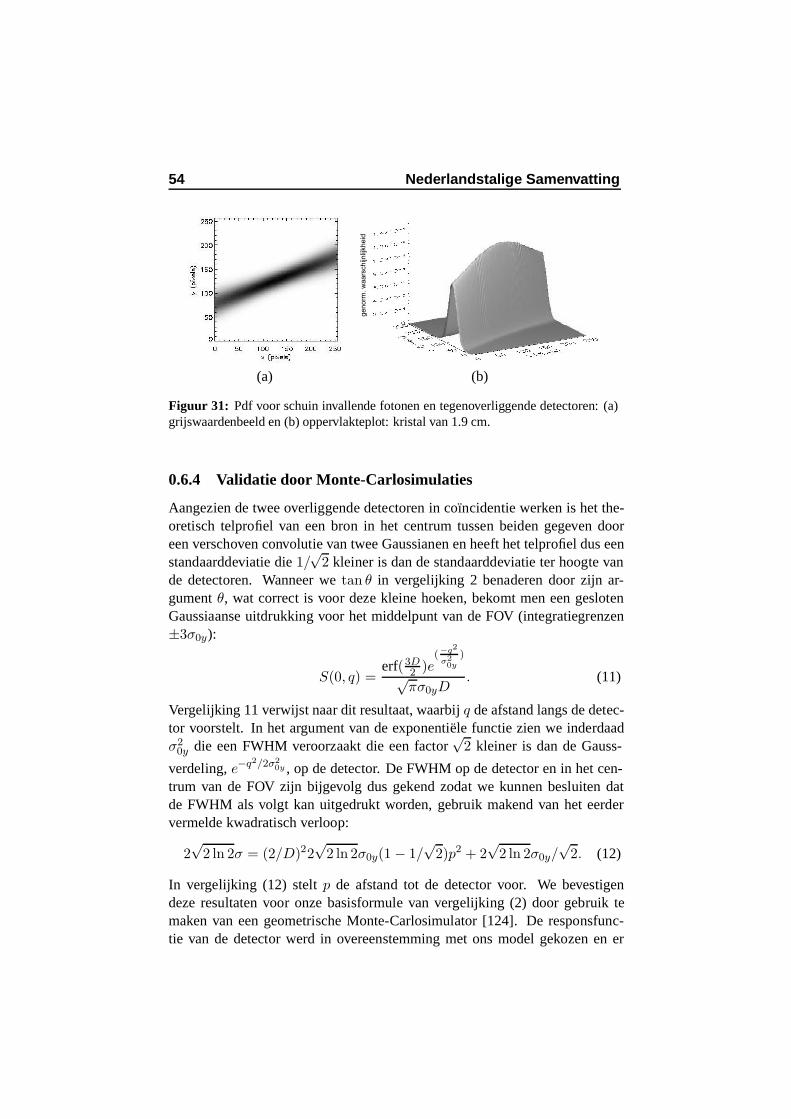
54 Nederlandstalige Samenvatting
ge
no
rm.
wa
ars
ch
ijnlij
kh
eid
(a) (b)
Figuur 31: Pdf voor schuin invallende fotonen en tegenoverliggende detectoren: (a)grijswaardenbeeld en (b) oppervlakteplot: kristal van 1.9 cm.
0.6.4 Validatie door Monte-Carlosimulaties
Aangezien de twee overliggende detectoren in coıncidentie werken is het the-oretisch telprofiel van een bron in het centrum tussen beiden gegeven dooreen verschoven convolutie van twee Gaussianen en heeft het telprofiel dus eenstandaarddeviatie die 1/
√2 kleiner is dan de standaarddeviatie ter hoogte van
de detectoren. Wanneer we tan θ in vergelijking 2 benaderen door zijn ar-gument θ, wat correct is voor deze kleine hoeken, bekomt men een geslotenGaussiaanse uitdrukking voor het middelpunt van de FOV (integratiegrenzen±3σ0y):
S(0, q) =erf(3D
2 )e(−q2
σ20y
)
√πσ0yD
. (11)
Vergelijking 11 verwijst naar dit resultaat, waarbij q de afstand langs de detec-tor voorstelt. In het argument van de exponentiele functie zien we inderdaadσ2
0y die een FWHM veroorzaakt die een factor√
2 kleiner is dan de Gauss-
verdeling, e−q2/2σ20y , op de detector. De FWHM op de detector en in het cen-
trum van de FOV zijn bijgevolg dus gekend zodat we kunnen besluiten datde FWHM als volgt kan uitgedrukt worden, gebruik makend van het eerdervermelde kwadratisch verloop:
2√
2 ln 2σ = (2/D)22√
2 ln 2σ0y(1 − 1/√
2)p2 + 2√
2 ln 2σ0y/√
2. (12)
In vergelijking (12) stelt p de afstand tot de detector voor. We bevestigendeze resultaten voor onze basisformule van vergelijking (2) door gebruik temaken van een geometrische Monte-Carlosimulator [124]. De responsfunc-tie van de detector werd in overeenstemming met ons model gekozen en er
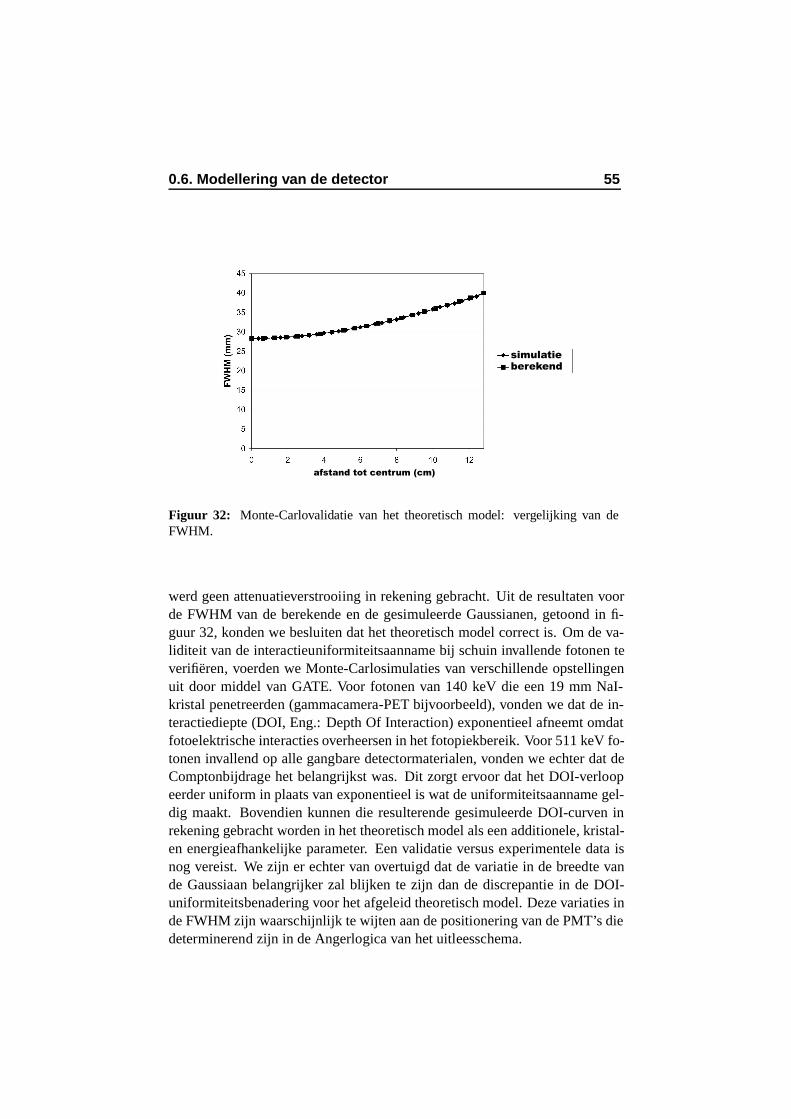
0.6. Modellering van de detector 55
afstand tot centrum (cm)
simulatieberekend
Figuur 32: Monte-Carlovalidatie van het theoretisch model: vergelijking van deFWHM.
werd geen attenuatieverstrooiing in rekening gebracht. Uit de resultaten voorde FWHM van de berekende en de gesimuleerde Gaussianen, getoond in fi-guur 32, konden we besluiten dat het theoretisch model correct is. Om de va-liditeit van de interactieuniformiteitsaanname bij schuin invallende fotonen teverifieren, voerden we Monte-Carlosimulaties van verschillende opstellingenuit door middel van GATE. Voor fotonen van 140 keV die een 19 mm NaI-kristal penetreerden (gammacamera-PET bijvoorbeeld), vonden we dat de in-teractiediepte (DOI, Eng.: Depth Of Interaction) exponentieel afneemt omdatfotoelektrische interacties overheersen in het fotopiekbereik. Voor 511 keV fo-tonen invallend op alle gangbare detectormaterialen, vonden we echter dat deComptonbijdrage het belangrijkst was. Dit zorgt ervoor dat het DOI-verloopeerder uniform in plaats van exponentieel is wat de uniformiteitsaanname gel-dig maakt. Bovendien kunnen die resulterende gesimuleerde DOI-curven inrekening gebracht worden in het theoretisch model als een additionele, kristal-en energieafhankelijke parameter. Een validatie versus experimentele data isnog vereist. We zijn er echter van overtuigd dat de variatie in de breedte vande Gaussiaan belangrijker zal blijken te zijn dan de discrepantie in de DOI-uniformiteitsbenadering voor het afgeleid theoretisch model. Deze variaties inde FWHM zijn waarschijnlijk te wijten aan de positionering van de PMT’s diedeterminerend zijn in de Angerlogica van het uitleesschema.
56 Nederlandstalige Samenvatting
0.6.5 Reconstructie: resolutieherstel
Het afgeleide en geverifieerde theoretisch model kan in rekening gebracht wor-den in een reconstructiealgoritme om de spatiale resolutie van de resulterendegereconstrueerde beelden te verbeteren. Twee mogelijke invalshoeken voor in-corporatie in de reconstructie worden voorgesteld. De eerste benaderingswijzeis de incorporatie van dit model in een iteratief lijstmode Maximum Likeli-hood Expectation Maximization algoritme. Niet alleen de voxels doorkruistdoor de LOR moeten in rekening gebracht worden, maar ook de voxels binnenhet bereik van de pdf ten gevolge van detectieonzekerheid. Hierbij moet hetobject geparametrizeerd worden aan de hand van symmetrische basisfunctieszodanig dat de voxelbijdrage enkel afhankelijk is van de afstand tot de LORen niet van de orientatie. Een tweede, elegantere, benaderingswijze bestaaterin natuurlijke pixels te gebruiken om het object te parametrizeren wat in sec-tie 0.7 besproken zal worden. Hier zijn discrete projecties aan de continuebeelddistributiefunctie gerelateerd door een ruimtelijk varierende fotondistri-butiefunctie die de geometrische respons van de detector modelleert, in ditgeval dus Gaussianen met varierende breedte afhankelijk van de afstand tot dedetector.
0.6.6 Conlusie en originele bijdragen
We hebben een theoretisch model afgeleid om de onzekerheid van de detectie-locatie in rekening te brengen in continue detector-PET. Loodrecht en schuininvallende fotonen werden bestudeerd in twee en drie dimensies. We con-cludeerden dat transversale profielen van de pdf’s konden benaderd wordendoor Gaussianen, zowel voor loodrechte (10−3 foutenmarge) als voor schuineinval (10−2 foutenmarge). De resultaten die we bekwamen werden geveri-fieerd door middel van theoretische voorspellingen en geometrische Monte-Carlosimulaties en een goede overeenstemming werd bereikt. In het gevalvan schuin invallende fotonen konden we afleiden dat de interactiediepte vaneen foton in belangrijke mate bijdraagt tot de detectieonzekerheid. Door mid-del van realistische Monte-Carlosimulaties konden we ook bevestigen dat deinteractiewaarschijnlijkheid van een 511 keV foton quasi uniform is in allegangbare PET-detectormaterialen. Na evaluatie bleek dat het gebruikte modelgeschikt is voor incorporatie in een reconstructiealgoritme, met als doel het ac-quisitieproces accurater te modelleren en de spatiale resolutie van de tomogra-fische beelden te verbeteren. Dit theoretisch model kan ook gebruikt wordenom de spatiale resolutie te berekenen van systemen die nog in ontwerp zijn.Naar wij weten is dit het eerste theoretisch LOR-model voor PET-systemenmet continue detectoren dat de detectieonzekerheid van de annihilatiefotonen
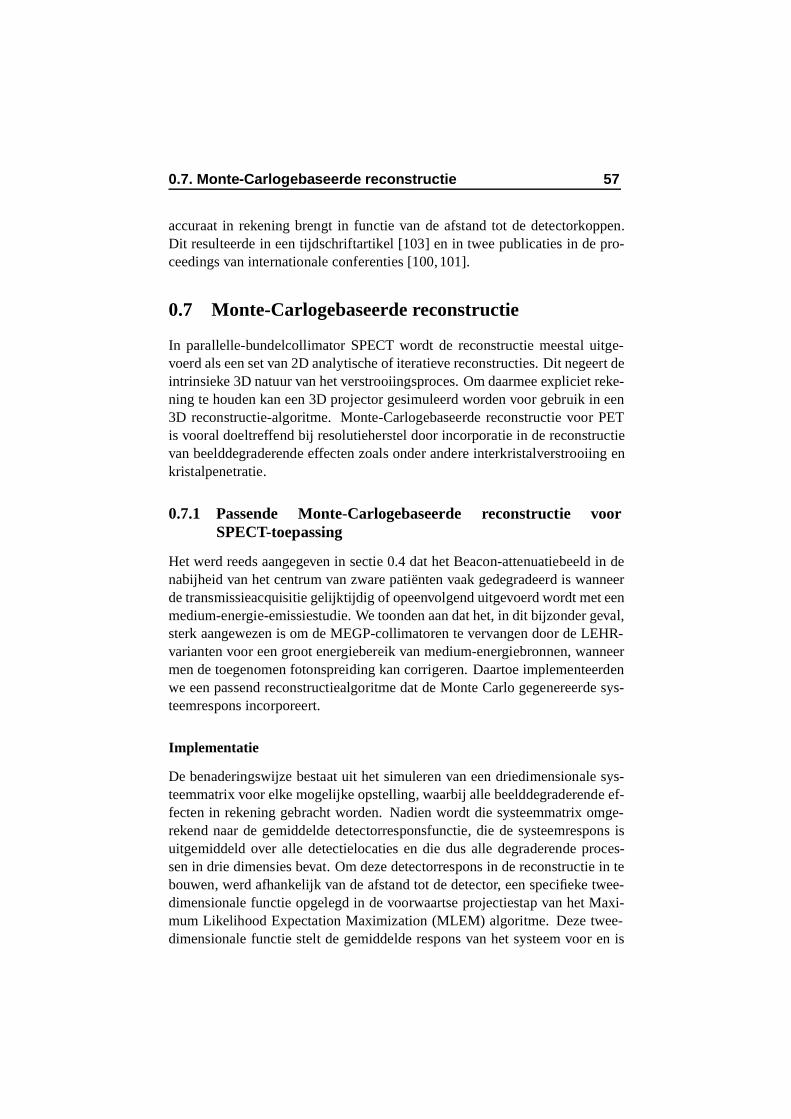
0.7. Monte-Carlogebaseerde reconstructie 57
accuraat in rekening brengt in functie van de afstand tot de detectorkoppen.Dit resulteerde in een tijdschriftartikel [103] en in twee publicaties in de pro-ceedings van internationale conferenties [100, 101].
0.7 Monte-Carlogebaseerde reconstructie
In parallelle-bundelcollimator SPECT wordt de reconstructie meestal uitge-voerd als een set van 2D analytische of iteratieve reconstructies. Dit negeert deintrinsieke 3D natuur van het verstrooiingsproces. Om daarmee expliciet reke-ning te houden kan een 3D projector gesimuleerd worden voor gebruik in een3D reconstructie-algoritme. Monte-Carlogebaseerde reconstructie voor PETis vooral doeltreffend bij resolutieherstel door incorporatie in de reconstructievan beelddegraderende effecten zoals onder andere interkristalverstrooiing enkristalpenetratie.
0.7.1 Passende Monte-Carlogebaseerde reconstructie voorSPECT-toepassing
Het werd reeds aangegeven in sectie 0.4 dat het Beacon-attenuatiebeeld in denabijheid van het centrum van zware patienten vaak gedegradeerd is wanneerde transmissieacquisitie gelijktijdig of opeenvolgend uitgevoerd wordt met eenmedium-energie-emissiestudie. We toonden aan dat het, in dit bijzonder geval,sterk aangewezen is om de MEGP-collimatoren te vervangen door de LEHR-varianten voor een groot energiebereik van medium-energiebronnen, wanneermen de toegenomen fotonspreiding kan corrigeren. Daartoe implementeerdenwe een passend reconstructiealgoritme dat de Monte Carlo gegenereerde sys-teemrespons incorporeert.
Implementatie
De benaderingswijze bestaat uit het simuleren van een driedimensionale sys-teemmatrix voor elke mogelijke opstelling, waarbij alle beelddegraderende ef-fecten in rekening gebracht worden. Nadien wordt die systeemmatrix omge-rekend naar de gemiddelde detectorresponsfunctie, die de systeemrespons isuitgemiddeld over alle detectielocaties en die dus alle degraderende proces-sen in drie dimensies bevat. Om deze detectorrespons in de reconstructie in tebouwen, werd afhankelijk van de afstand tot de detector, een specifieke twee-dimensionale functie opgelegd in de voorwaartse projectiestap van het Maxi-mum Likelihood Expectation Maximization (MLEM) algoritme. Deze twee-dimensionale functie stelt de gemiddelde respons van het systeem voor en is

58 Nederlandstalige Samenvatting
(a) (b)
Figuur 33: Systeemrespons: (a) eendimensionale gemiddelde systeemrespons voor128 vlakken parallel aan de detector bij een MEGP-opstelling, (b) eendimensionalegemiddelde systeemrespons voor 128 vlakken parallel aan de detector bij een LEHR-collimatoropstelling.
afhankelijk van de afstand tot de detector en van de energie van het isotoop. Infiguur 33 is een voorbeeld weergegeven. Figuur 33(a) toont de gemiddelde sys-teemrespons in een dimensie voor 128 vlakken parallel aan de detector en voorfotonen met een (medium-)energie van 245 keV op een MEGP-collimator, ter-wijl figuur 33(b) de penetratie van dezelfde fotonen op een LEHR-collimatorweergeeft. Om de opslagvereisten van onze systeemmatrix te beperken enom de ruisgerelateerde problemen beschreven in [22] op te lossen, kan de ge-simuleerde systeemmatrix gebruikt worden in een reconstructie gebaseerd opnatuurlijke pixels, of de beeldmatrix kan geroteerd worden met bilineaire inter-polatie. Op die manier bekomt men steeds een beeldmatrix die loodrecht staatop de detector zodat de afgeleide systeemrespons kan toegepast worden voorelke afstand. In het laatste geval blijft het bovendien mogelijk om attenuatie inrekening te brengen in de reconstructie.
Herstel van medium-energie-fotonspreiding op LEHR
Figuur 34 toont de reconstructie van een puntbron van 1 cm doorsnede op30 cm van de detector, gevuld met een emissiebron van 300 keV, na gesi-muleerde acquisitie op een LEHR-collimator. Figuur 34(a) is een beeld datgereconstrueerd is door middel van traditionele parallelprojectie MLEM, ter-wijl figuur 34(b) gereconstrueerd is met incorporatie van de driedimensionaleMonte-Carlosysteemrespons. Aan de profielen van beide beelden werd eenGaussiaan gefit: voor figuur 34(a) resulteert een Full Width at Half Maxi-mum (FWHM) van 22.6 mm, wat op die afstand niet meer dan 14.3 mm mag
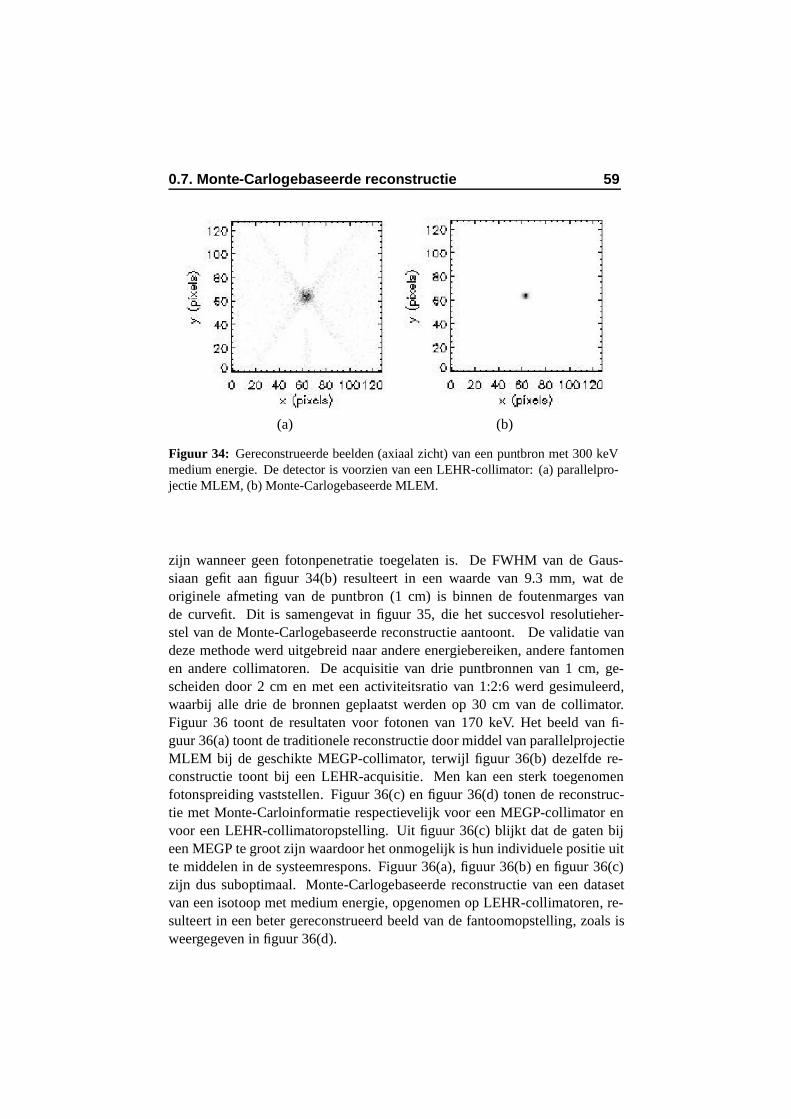
0.7. Monte-Carlogebaseerde reconstructie 59
(a) (b)
Figuur 34: Gereconstrueerde beelden (axiaal zicht) van een puntbron met 300 keVmedium energie. De detector is voorzien van een LEHR-collimator: (a) parallelpro-jectie MLEM, (b) Monte-Carlogebaseerde MLEM.
zijn wanneer geen fotonpenetratie toegelaten is. De FWHM van de Gaus-siaan gefit aan figuur 34(b) resulteert in een waarde van 9.3 mm, wat deoriginele afmeting van de puntbron (1 cm) is binnen de foutenmarges vande curvefit. Dit is samengevat in figuur 35, die het succesvol resolutieher-stel van de Monte-Carlogebaseerde reconstructie aantoont. De validatie vandeze methode werd uitgebreid naar andere energiebereiken, andere fantomenen andere collimatoren. De acquisitie van drie puntbronnen van 1 cm, ge-scheiden door 2 cm en met een activiteitsratio van 1:2:6 werd gesimuleerd,waarbij alle drie de bronnen geplaatst werden op 30 cm van de collimator.Figuur 36 toont de resultaten voor fotonen van 170 keV. Het beeld van fi-guur 36(a) toont de traditionele reconstructie door middel van parallelprojectieMLEM bij de geschikte MEGP-collimator, terwijl figuur 36(b) dezelfde re-constructie toont bij een LEHR-acquisitie. Men kan een sterk toegenomenfotonspreiding vaststellen. Figuur 36(c) en figuur 36(d) tonen de reconstruc-tie met Monte-Carloinformatie respectievelijk voor een MEGP-collimator envoor een LEHR-collimatoropstelling. Uit figuur 36(c) blijkt dat de gaten bijeen MEGP te groot zijn waardoor het onmogelijk is hun individuele positie uitte middelen in de systeemrespons. Figuur 36(a), figuur 36(b) en figuur 36(c)zijn dus suboptimaal. Monte-Carlogebaseerde reconstructie van een datasetvan een isotoop met medium energie, opgenomen op LEHR-collimatoren, re-sulteert in een beter gereconstrueerd beeld van de fantoomopstelling, zoals isweergegeven in figuur 36(d).
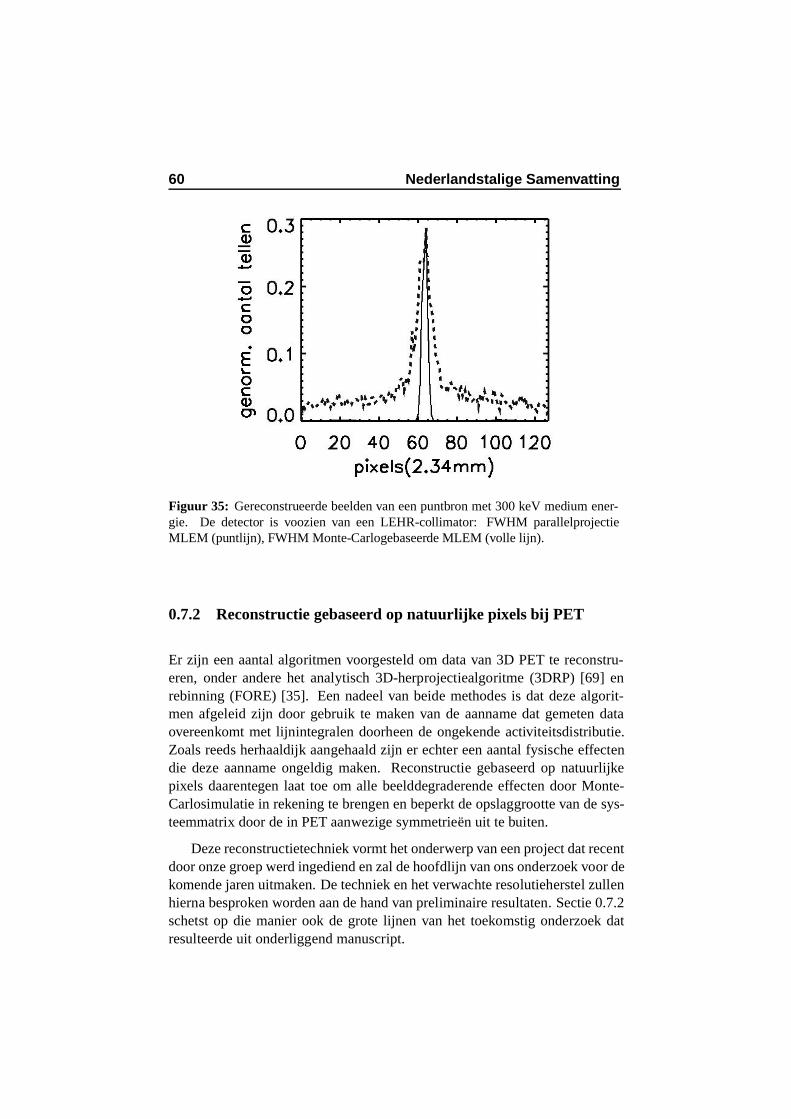
60 Nederlandstalige Samenvatting
Figuur 35: Gereconstrueerde beelden van een puntbron met 300 keV medium ener-gie. De detector is voozien van een LEHR-collimator: FWHM parallelprojectieMLEM (puntlijn), FWHM Monte-Carlogebaseerde MLEM (volle lijn).
0.7.2 Reconstructie gebaseerd op natuurlijke pixels bij PET
Er zijn een aantal algoritmen voorgesteld om data van 3D PET te reconstru-eren, onder andere het analytisch 3D-herprojectiealgoritme (3DRP) [69] enrebinning (FORE) [35]. Een nadeel van beide methodes is dat deze algorit-men afgeleid zijn door gebruik te maken van de aanname dat gemeten dataovereenkomt met lijnintegralen doorheen de ongekende activiteitsdistributie.Zoals reeds herhaaldijk aangehaald zijn er echter een aantal fysische effectendie deze aanname ongeldig maken. Reconstructie gebaseerd op natuurlijkepixels daarentegen laat toe om alle beelddegraderende effecten door Monte-Carlosimulatie in rekening te brengen en beperkt de opslaggrootte van de sys-teemmatrix door de in PET aanwezige symmetrieen uit te buiten.
Deze reconstructietechniek vormt het onderwerp van een project dat recentdoor onze groep werd ingediend en zal de hoofdlijn van ons onderzoek voor dekomende jaren uitmaken. De techniek en het verwachte resolutieherstel zullenhierna besproken worden aan de hand van preliminaire resultaten. Sectie 0.7.2schetst op die manier ook de grote lijnen van het toekomstig onderzoek datresulteerde uit onderliggend manuscript.
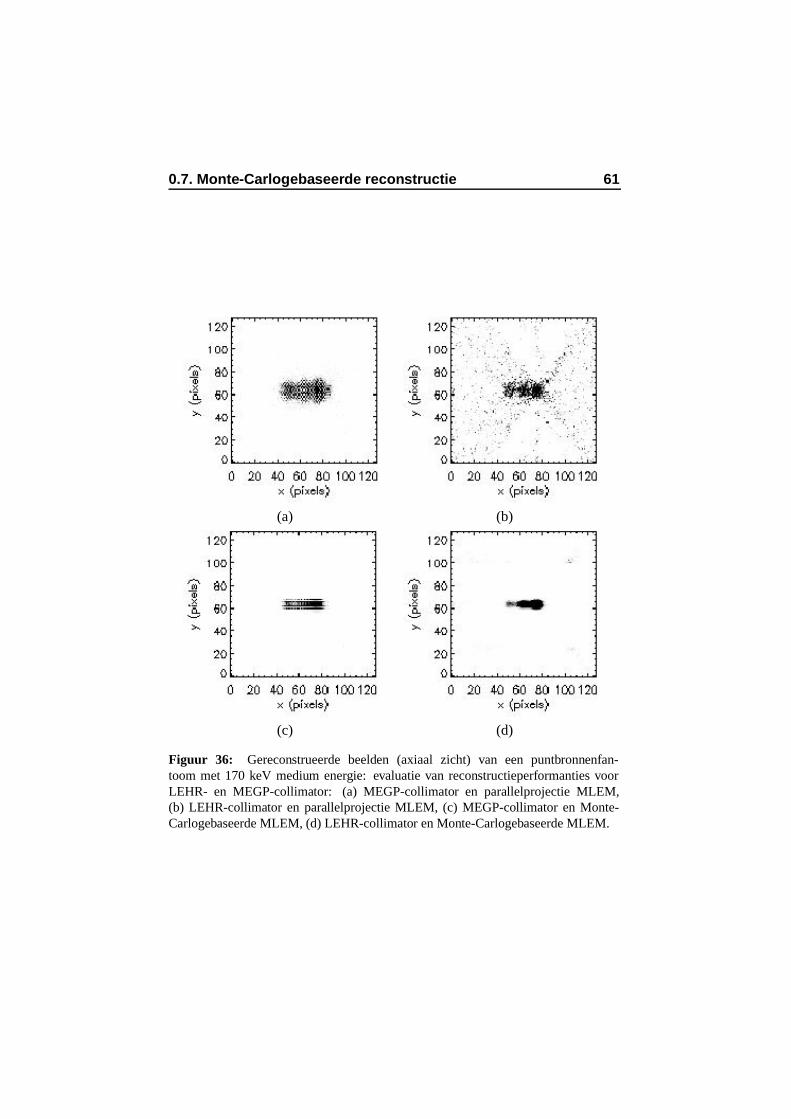
0.7. Monte-Carlogebaseerde reconstructie 61
(a) (b)
(c) (d)
Figuur 36: Gereconstrueerde beelden (axiaal zicht) van een puntbronnenfan-toom met 170 keV medium energie: evaluatie van reconstructieperformanties voorLEHR- en MEGP-collimator: (a) MEGP-collimator en parallelprojectie MLEM,(b) LEHR-collimator en parallelprojectie MLEM, (c) MEGP-collimator en Monte-Carlogebaseerde MLEM, (d) LEHR-collimator en Monte-Carlogebaseerde MLEM.
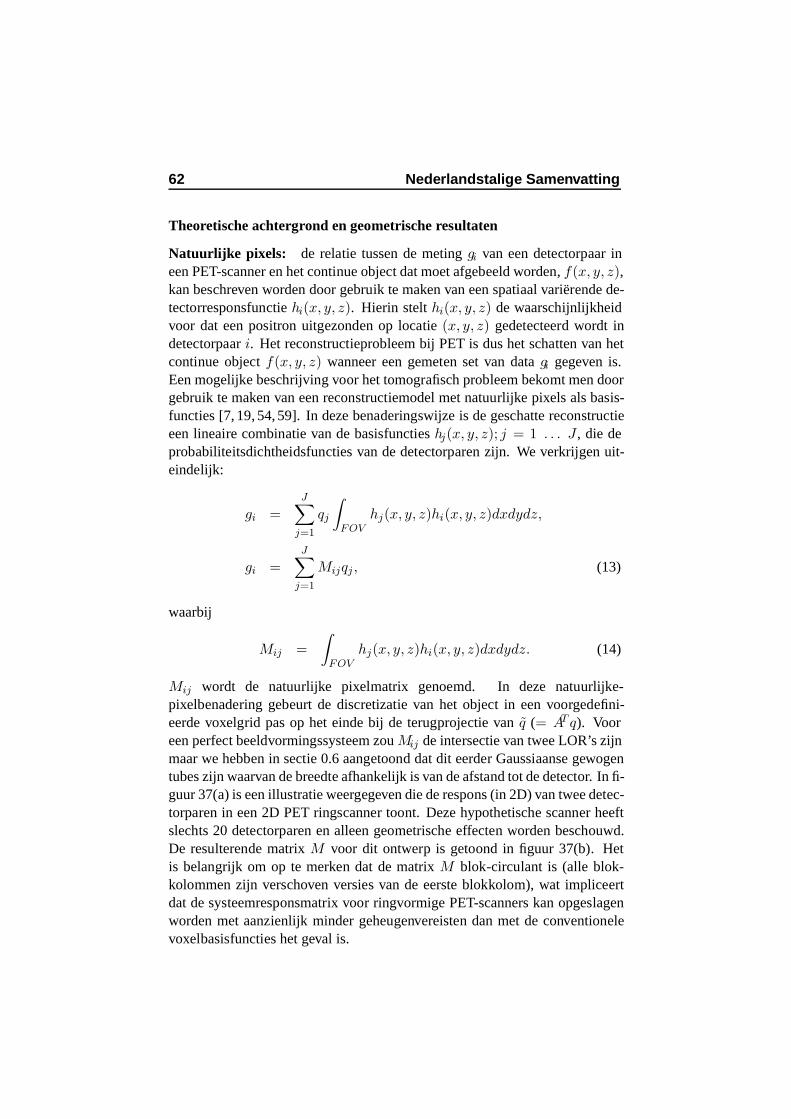
62 Nederlandstalige Samenvatting
Theoretische achtergrond en geometrische resultaten
Natuurlijke pixels: de relatie tussen de meting gi van een detectorpaar ineen PET-scanner en het continue object dat moet afgebeeld worden, f(x, y, z),kan beschreven worden door gebruik te maken van een spatiaal varierende de-tectorresponsfunctie hi(x, y, z). Hierin stelt hi(x, y, z) de waarschijnlijkheidvoor dat een positron uitgezonden op locatie (x, y, z) gedetecteerd wordt indetectorpaar i. Het reconstructieprobleem bij PET is dus het schatten van hetcontinue object f(x, y, z) wanneer een gemeten set van data gi gegeven is.Een mogelijke beschrijving voor het tomografisch probleem bekomt men doorgebruik te maken van een reconstructiemodel met natuurlijke pixels als basis-functies [7, 19, 54, 59]. In deze benaderingswijze is de geschatte reconstructieeen lineaire combinatie van de basisfuncties hj(x, y, z); j = 1 . . . J , die deprobabiliteitsdichtheidsfuncties van de detectorparen zijn. We verkrijgen uit-eindelijk:
gi =
J∑
j=1
qj
∫
FOVhj(x, y, z)hi(x, y, z)dxdydz,
gi =J
∑
j=1
Mijqj , (13)
waarbij
Mij =
∫
FOVhj(x, y, z)hi(x, y, z)dxdydz. (14)
Mij wordt de natuurlijke pixelmatrix genoemd. In deze natuurlijke-pixelbenadering gebeurt de discretizatie van het object in een voorgedefini-eerde voxelgrid pas op het einde bij de terugprojectie van q (= AT q). Vooreen perfect beeldvormingssysteem zou Mij de intersectie van twee LOR’s zijnmaar we hebben in sectie 0.6 aangetoond dat dit eerder Gaussiaanse gewogentubes zijn waarvan de breedte afhankelijk is van de afstand tot de detector. In fi-guur 37(a) is een illustratie weergegeven die de respons (in 2D) van twee detec-torparen in een 2D PET ringscanner toont. Deze hypothetische scanner heeftslechts 20 detectorparen en alleen geometrische effecten worden beschouwd.De resulterende matrix M voor dit ontwerp is getoond in figuur 37(b). Hetis belangrijk om op te merken dat de matrix M blok-circulant is (alle blok-kolommen zijn verschoven versies van de eerste blokkolom), wat impliceertdat de systeemresponsmatrix voor ringvormige PET-scanners kan opgeslagenworden met aanzienlijk minder geheugenvereisten dan met de conventionelevoxelbasisfuncties het geval is.
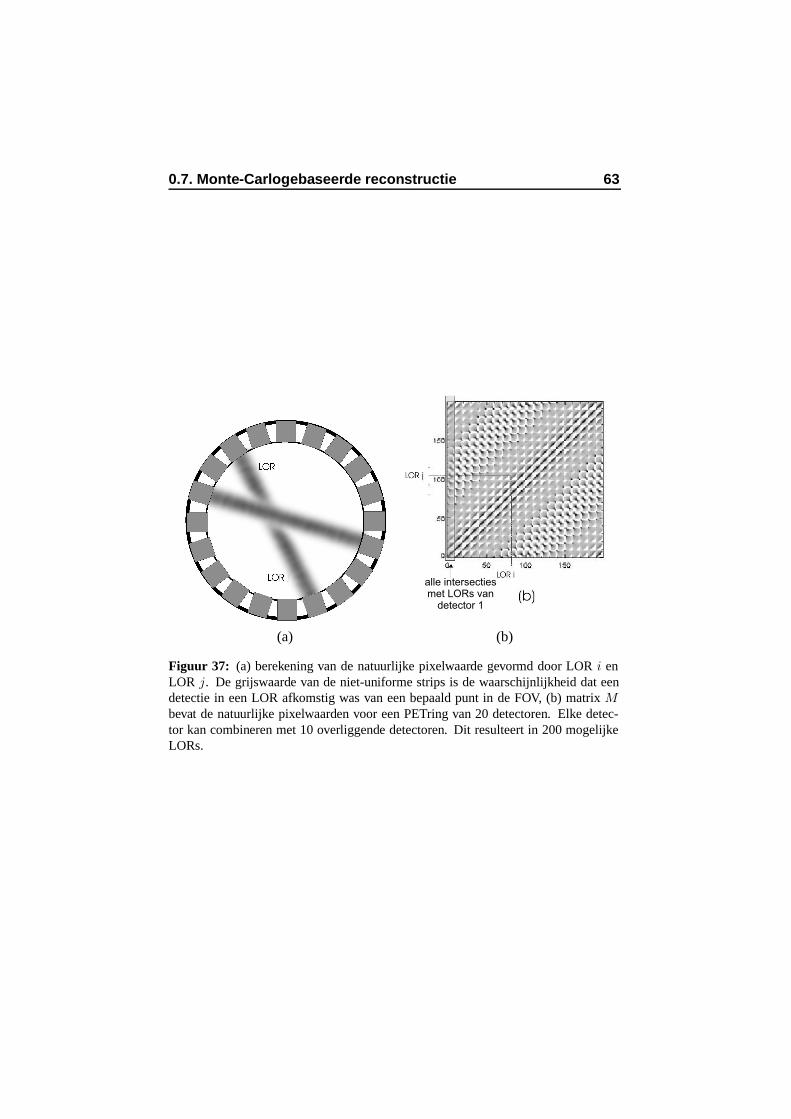
0.7. Monte-Carlogebaseerde reconstructie 63
alle intersecties
met LORs van
detector 1
(a) (b)
Figuur 37: (a) berekening van de natuurlijke pixelwaarde gevormd door LOR i enLOR j. De grijswaarde van de niet-uniforme strips is de waarschijnlijkheid dat eendetectie in een LOR afkomstig was van een bepaald punt in de FOV, (b) matrix Mbevat de natuurlijke pixelwaarden voor een PETring van 20 detectoren. Elke detec-tor kan combineren met 10 overliggende detectoren. Dit resulteert in 200 mogelijkeLORs.
64 Nederlandstalige Samenvatting
Gegeneraliseerde natuurlijke pixels: de uiteindelijke terugprojectieopera-tie bij de natuurlijke pixelreconstructie leidt tot een grote computerbelasting,en daarom stellen we voor om een gegeneraliseerde natuurlijke pixelbasiste gebruiken, die gevormd wordt door de combinatie van een verschillendeprojectie- en terugprojectieoperator. Een snelle en efficiente terugprojectordie we voorstellen is een strookvormige terugprojector met parallelle geome-trie in 2D of een vierkante tube in 3D. Om de gegeneralizeerde natuurlijke-pixelmatrix te verkrijgen wordt een Monte-Carlomethode gebruikt. Daarbijwordt een willekeurig gelokaliseerde annihilatie gedetecteerd in een zeker de-tectorpaar i. Een tweede LOR wordt dan geprojecteerd vanuit dezelfde emis-sielocatie naar de detectoren die georienteerd zijn in een parallelle geometrie.Door gebruik te maken van Monte-Carlosimulaties om de gegeneraliseerdenatuurlijke-pixelmatrix te verkrijgen, kunnen alle beelddegraderende effectenin rekening gebracht worden en moeten de sensitiviteitsfuncties van de detec-tor niet analytisch berekend worden.
Verbeteringen door gebruik te maken van GATE
Recent werk door onze groep [125, 126, 131] toonde aan dat er een resolutie-verbetering van 1 mm verkregen wordt bij de gegeneraliseerde natuurlijke-pixelreconstructie, in vergelijking met een standaard lijstmode MLEM-algoritme. Daarnaast was ook het ruisgedrag en de hotspot-detecteerbaarheidsuperieur bij de gegeneralizeerde natuurlijke-pixelreconstructie. De resultatenwerden verkregen door gebruik te maken van een zeer eenvoudige Monte-Carlosimulator die alleen geometrische effecten in rekening bracht om degegeneralizeerde natuurlijke-pixelmatrix te simuleren. Krachtiger resolutie-herstel kan verkregen worden door gebruik te maken van GATE aangezienwe in sectie 0.4 en sectie 0.6 hebben aangetoond dat interkristalverstrooi-ing en kristalpenetratie belangrijke beelddegraderende effecten zijn. Dit isgeıllustreerd in figuur 38. We geloven dat Monte-Carlogebaseerde (gegene-raliseerde) natuurlijke-pixelreconstructie een van de elegantste en krachtigstemanieren is om beelddegraderende effecten in rekening te brengen in de re-constructie, rekening houdend met een beperkte opslaggrootte dankzij de in-trinsieke symmetrieen.
0.7.3 Conclusie en originele bijdragen
We beschreven een benaderingswijze die de gemiddelde systeemrespons si-muleert voor een medium-energiestudie op LEHR collimatoren met de be-doeling de MEGP-collimatoren te vervangen door de LEHR-variant. Uit sec-tie 0.4 volgde immers dat de Beacon transmissiebeeldvorming gekoppeld aan
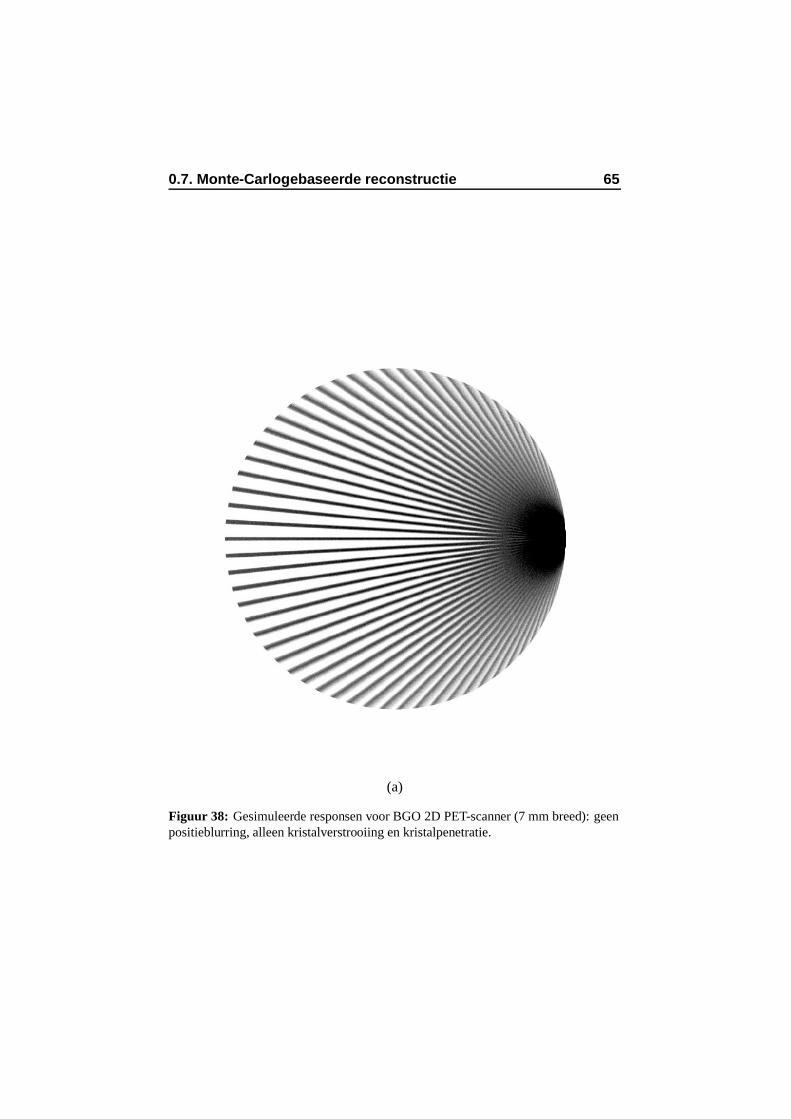
0.7. Monte-Carlogebaseerde reconstructie 65
(a)
Figuur 38: Gesimuleerde responsen voor BGO 2D PET-scanner (7 mm breed): geenpositieblurring, alleen kristalverstrooiing en kristalpenetratie.

66 Nederlandstalige Samenvatting
een medium-energie-emissiestudie attenuatiemappen met een laag contrastoplevert. We toonden aan dat het aangewezen is ook een medium-energie-emissiestudie uit te voeren op een LEHR op voorwaarde dat de gesimuleerdesysteemrespons in rekening gebracht wordt in de reconstructie. We heb-ben bijgevolg een belangrijke richtlijn afgeleid voor transmissiebeeldvormingin medium-energie-emissiestudies. Dit werk resulteerde in een tijdschrift-artikel [106]. Er werd ook een meerjarenproject vastgelegd waarin de po-tentiele voordelen van natuurlijke-pixelreconstructie beschreven zijn en waarinwe toekomstig onderzoekswerk belichten. Onderzoek naar gegeneraliseerdenatuurlijke-pixelreconstructie gebaseerd op Monte-Carlosimulaties zal een vanonze belangrijkste onderzoekthema’s zijn voor de volgende vijf jaar. De im-plementatie besproken in sectie 0.7.2 beschrijft hoe onze groep in staat was om1 mm reconstructieresolutie te winnen door gebruik te maken van een gege-neraliseerde natuurlijke-pixelreconstructie waarin de systeemmatrix gesimu-leerd werd met een eenvoudige geometrische Monte-Carlosimulator. We zijnervan overtuigd dat het simuleren van de natuurlijke-pixelmatrix gebruikma-kend van GATE een additionele resolutiewinst zal opleveren aangezien we insectie 0.4 en sectie 0.6 hebben aangetoond dat interkristalverstrooiing en kris-talpenetratie belangrijke beelddegraderende effecten zijn. Het bovenvermeldeonderzoeksproject moet resulteren in een van de meest performante methodesom resolutie te herstellen bij PET.
0.8 Algemeen besluit
In sectie 0.2 werd een kort overzicht gegeven van de nucleaire geneeskunde,met inbegrip van reconstructie, met als doel onderliggend proefschrift te kade-ren. Verder werd het GATE-simulatiepakket geıntroduceerd als bovenlaag vanGeant4. Overeenkomstig werd een grondige literatuurstudie voorgesteld diede vier hoofdtoepassingsgebieden belichtte waarin Gate van significant belangkan zijn. Specifiek onderzoek op deze vier subdomeinen wordt toegelicht indit manuscript.
Sectie 0.3 beschrijft de SPECT-validatiestudie die uitgevoerd werd omde accuraatheid van GATE-simulaties versus metingen op een commercieelSPECT-acquisitiesysteem te verifieren. Dit leidt tot het gebruik van GATEvoor het simuleren van bestaande cameraopstellingen in verschillende acquisi-tiemodes, met diverse parameters, verschillende isotopen en verscheidene col-limatoren. Multiprocessordistributie en gridificatie zijn naast de validatie voordosimetrische toepassingen de belangrijkste interessevelden voor toekomstigonderzoek.
Sectie 0.4 handelde over attenuatie- en verstrooiingscorrectie bij
0.8. Algemeen besluit 67
Beacon(gammacamera)-PET en Beacon-SPECT. Het is de eerste simulatie-studie die in zo een belangrijke mate gebruik maakt van de virtuele GATE-kloksynchronisatie om protocoloptimalizaties voor te stellen. We onderzoch-ten simultane emissie- en transmissiestudies. Voor gammacamera-PET bleekdat vooral de ingangsfilters en de einddelen van de detector een intrinsiekeinter-venstercontaminatie veroorzaakten. Bij Beacon-SPECT concludeerdenwe dat de laagste inter-venstercontaminatie en het beste transmissiecontrastbereikt wordt als een LEHR collimator gekoppeld aan een dik kristal gebruiktwordt, zelfs voor medium-energie-emissiestudies. In dit laatste geval moet welde fotonspreiding van de medium-energiefotonen op de suboptimale LEHRcollimator geıncorporeerd worden in een Monte-Carlogebaseerde reconstruc-tie zoals besproken werd in sectie 0.7. Ook werd in sectie 0.4 een kwalitatieveinterpretatie gegeven voor het belang van meervoudige verstrooiing bij 3DPET. Het werd duidelijk dat alleen objectverstrooiing van eerste orde de foto-piekacquisities significant degradeert. De incorporatie van kristalverstrooiingin de reconstructie bleek vereist en daartoe werden twee oplossingen voorge-steld waarvan een werd toegelicht in sectie 0.7.
In sectie 0.5 onderzochten we een nieuw ontwerp voor een SPECT-acquisitiesysteem dat een hogere resolutie bij een vergelijkbare sensitivi-teit nastreeft. Het Solstice-prototype bestond uit een strookvormige vaste-stofdetector met een roterende vlakkencollimator. We vergeleken de prestatiesvan dit prototype met een parallelle-bundelcollimator op een overeenkomstiggepixeliseerde vaste-stofdetector en met een typische monokristal NaI-detectorgekoppeld aan diezelfde collimator. We vonden een betere resolutie en een ho-gere sensitiviteit, gekoppeld aan een superieure energieresolutie. We breiddenook het werk van Metz (parallelle-bundelcollimator) en Tsui (waaierbundel-en kegelbundelcollimator) uit voor de geometrische transfertfunctie van eenvlakkencollimator op een strookvormige detector. Daar een foton opgeno-men op een roterende vlakkencollimator niet evenveel informatie bezit als opeen parallelle-bundelcollimator voerden we additioneel ook nog een hotspot-detecteerbaarheidsstudie met menselijke waarnemers uit voor alle drie de sys-temen. We vonden een lagere performantie-waardemeter voor de roterende-vlakkencollimator op de strookvormige vaste-stofdetector. Deze projectiestu-die moet echter uitgebreid worden op 3D beeldensets, gereconstrueerd met derecent ontwikkelde algoritmes van Zeng [147] en Wang [135].
In sectie 0.6 hebben we een theoretisch model voor incorporatie van de on-zekerheid omtrent detectielocatie in continue detector PET afgeleid. De resul-terende detectorsensitiviteitsfunctie kan niet analytisch uitgedrukt worden enwerd dus telkens berekend door middel van numerieke integratie. We vondendat de transversale profielen van de probabiliteitsdensiteitsfuncties door een
68 Nederlandstalige Samenvatting
Gaussiaan konden benaderd worden. We incorporeerden ook het effect vande kristaldikte in het theoretisch model en concludeerden dat de traditioneleGaussiaan voor de spatiale onzekerheid in dit geval moet vervangen wordendoor een meer accurate functie die rekening houdt met de kristalpenetratie. Naevaluatie bleek het model geschikt voor incorporatie in de reconstructie maardit theoretisch model kan ook gebruikt worden om de spatiale resolutie te be-rekenen van systemen die nog in ontwerp zijn. Dit is het eerste theoretischeLOR-model voor een PET-systeem met continue detector, dat de detectieon-zekerheid van de annihilatiefotonen nauwkeurig in rekening brengt in functievan de afstand tot de detectorkoppen.
In sectie 0.7 beschreven we een reconstructie-implementatie die de gemid-delde systeemrespons afleidt uit een volledig 3D gesimuleerde systeemmatrixen dit voor medium-energiestudies op LEHR-collimatoren. Het in rekeningbrengen van de systeemrespons in een gepaste Monte-Carlogebaseerde recon-structie herstelt op een accurate wijze de medium-energiefotonspreiding opeen LEHR en recupereert op die manier het resolutieverlies. In alle gevallengaf de reconstructie van medium-energie-isotopen op LEHR het beste resultaat(mits incorporatie van de systeemrespons), omdat de gaten van de aangewezenMEGP collimator te groot zijn om uitgemiddeld te kunnen worden in de sys-teemrespons. Daarnaast werd een meerjarenproject vastgelegd waarin de po-tentiele voordelen van natuurlijke-pixelreconstructie beschreven worden. Sec-tie 0.4 en sectie 0.6 toonden immers aan dat kristalverstrooiing en kristalpene-tratie belangrijk zijn in PET-resolutieherstel. Toekomstig werk zal onderzoe-ken welk additioneel resolutieherstel kan verkregen worden door middel vaneen gegeneralizeerde natuurlijke-pixelreconstructie waarbij de systeemmatrixgesimuleerd wordt met GATE. Op die manier kan kristalverstrooiing en kris-talpenetratie voor verschillende detectormaterialen in rekening gebracht wor-den, resulterend in nauwkeurige detectorsensitiviteitsfuncties. Gezien GATEeen van de meest accurate simulatietools is voor SPECT en PET, en geziende veelbelovende inleidende resultaten van de gegeneraliseerde natuurlijke-pixelreconstructie, zijn we ervan overtuigd dat deze methode zich kan ontwik-kelen tot een van de belangrijkste technieken van resolutieherstel die beschik-baar zijn in de nucleaire geneeskunde.
Chapter 1
Introduction
Non-invasive diagnostic imaging can be performed with different technolo-gies: X-ray radiography, computed radiography, direct radiography, mammog-raphy, Computed Tomography (CT), UltraSound (US), and Magnetic Reso-nance Imaging (MRI), which all give anatomical information, and also withfunctional MRI (fMRI), optical imaging, thermography, planar isotope imag-ing, Single Photon Emission Tomography (SPECT), Positron Emission To-mography (PET), and gamma camera PET which return functional informa-tion. Recent devices combine two modalities on the same gantry in order toachieve hardware fusion of anatomical and functional images. Given the de-mographic aging in Western Europe, there exists a large interest in what ispopularly referred to as a GPS-tool for cancer, i.e. a diagnostic tool for oncol-ogy that detects small malignant lesions in a very early stadium and that can beused for disease staging. Therefore research in nuclear medicine has a socialsupport and bearing. In nuclear medicine examinations, a radiopharmaceuti-cal is injected in the patient, marked with a radionuclide emitting one singlephoton with an energy of 100-200 keV in SPECT and a positron emitting ra-dionuclide in PET. The emission of a positron finally results in two annihilationphotons of 511 keV. Those photons are detected, mostly using a scintillationcrystal that generates optical photons which travel through a light guide beforereaching the PhotoMultiplierTubes (PMTs). Those PMTs convert the opticalphotons to electrons, which are in their turn used to generate a position andenergy encoding signal. In PET there is an electronic collimation to acquiredirectional information while this information is obtained by applying a leadcollimator in SPECT. The acquired data is afterwards reconstructed to result ina threedimensional radioactive tracer distribution within the patient. Optimiza-tion, evaluation and (re)design of all elements in this detection chain is mostlydone using simulations. Given the possibility of modeling different physical
70 Introduction
processes, the Monte Carlo method has also been applied in nuclear medicineto a wide range of problems that could not be addressed by experimental oranalytical approaches.
Monte Carlo methods are numerical calculation methods based on randomvariable sampling. This approach has been used to solve mathematical prob-lems since 1770 and has been named ’Monte Carlo’ by Von Neumann [78]because of the similarity of statistical simulations to games of chance, repre-sented by the most well known center for gambling: the Monte Carlo district inthe Monaco principality. The Monte Carlo method is very appropriate for med-ical physics due to the stochastic nature of radiation emission, particle transportand detection processes. Moreover nuclear medicine was advantaged by thepossibility of using general purpose codes developed for high-energy physicsexperiments. Dr. Anger (who gave his name to the Anger gamma camera)was in the early 1960’s the first researcher to predict the physical response ofhis new scintillation camera using simulations. The breakthrough for MonteCarlo methods in the medical physics field came with the review paper of Rae-side [86] in 1976 and since then simulations are applied for detector modeling,system design, scatter correction technique evaluation, protocol optimization,reconstruction, dosimetry, external beam radiotherapy, radionuclide therapy,brachytherapy and pharmokinetic modeling. Due to computer limitations themethod has not yet fully lived up to its potential. With the market of affordablemini-clusters rapidly gaining importance in nuclear medicine there has beena renewed interest in the topic for the past 3-5 years. Around 1976 only 175scientific papers on Monte Carlo in medical physics were published a year,while this is now more than 1600 a year [142]. The major aim of the workdiscussed in this dissertation was to contribute to these new trends in nuclearmedicine research.
Chapter 2 of this manuscript gives the reader a short overview of the nu-clear medicine field, introduces the GATE software package and details againthe relevance of accurate Monte Carlo modeling in emission tomography. Thisextensive introduction will highlight and select the most important applicationfields in which simulations can be of significant benefit for breakthrough per-formance: attenuation and scatter correction technique evaluation, design ofacquisition systems and collimators, detector response modeling, up to MonteCarlo based reconstruction. All these different subtopics will be discussed inthe remaining chapters. Chapter 3 describes a validation and a verification ofthe GATE simulation package versus measurements on a commercial scannersetup. Simulations can also enhance understanding of existing systems as isshown in chapter 4 where a transmission imaging device is modeled in orderto optimize the specific clinical attenuation correction protocol. A scatter cor-
71
rection study has been performed for 3D PET which will also be discussedin this chapter. Chapter 5 describes the use of simulations for assisting in thedesign of a new small animal device using a novel collimator setup, aiming fora higher spatial resolution. In chapter 6 a theoretical model is deduced for thedetector response in order to recover the intrinsic spatial resolution of a contin-uous detector PET system after iterative reconstruction. Simulations were usedto verify this non-measurable analytical model. The results of Chapter 4 andChapter 6 obviate the need for a Monte Carlo based approach to reconstructthe acquired data. Accurate simulations of the system matrix are necessary forincorporation in a dedicated reconstruction algorithm that solved storage andcomputer time issues. This will be discussed in chapter 7 and significant im-provement in the reconstructed image quality will be shown since simulationsallow to take into account all image degrading effects.
Research performed within the context of this PhD thesis resulted in 4 arti-cles as a first author in peer reviewed high-impact international journals and in9 publications as first author in international conference proceedings. Another5 coauthored peer reviewed journal articles and 12 coauthored internationalproceedings resulted. References to these publications are given in a separatebibliographic section at the end of this dissertation.

72 Introduction
Chapter 2
Monte Carlo simulations inemission tomography
2.1 Nuclear Medicine
Nuclear medicine imaging involves the use of radioactively labelled pharma-ceuticals to diagnose and assess disease in the human body. The radiopharma-ceutical is intravenously injected, inhaled or ingested: the choice of pharma-ceutical and route of administration depends on the disease under investigation.Position sensitive detectors are used to detect the radiation emitted from thepharmaceutical and so, in principle, both the temporal and spatial distributionof the pharmaceutical within the body can be determined. Nuclear medicinestands in contrast to other medical imaging modalities. Ultrasound, MRIand X-ray CT predominantly give anatomical information, whereas nuclearmedicine imaging gives functional information. Modern nuclear medicineimaging primarily consists of two main branches: single photon imaging andpositron annihilation photon imaging, in which two annihilation photons aredetected simultaneously [26, 88, 99].
2.1.1 SPECT
Single photon imaging requires at minimum just one detector fixed in one po-sition to obtain a twodimensional projection of a threedimensional radiophar-maceutical distribution. A typical imaging system suitable for this task is thegamma camera (figure 2.1). A typical gamma camera consists of a collimatorwhich limits the angle of incidence of the detected photons to almost perpen-dicular to the detector. The deposited energy is converted by a scintillator tovisible light which travels through the crystal and the light guide towards a set
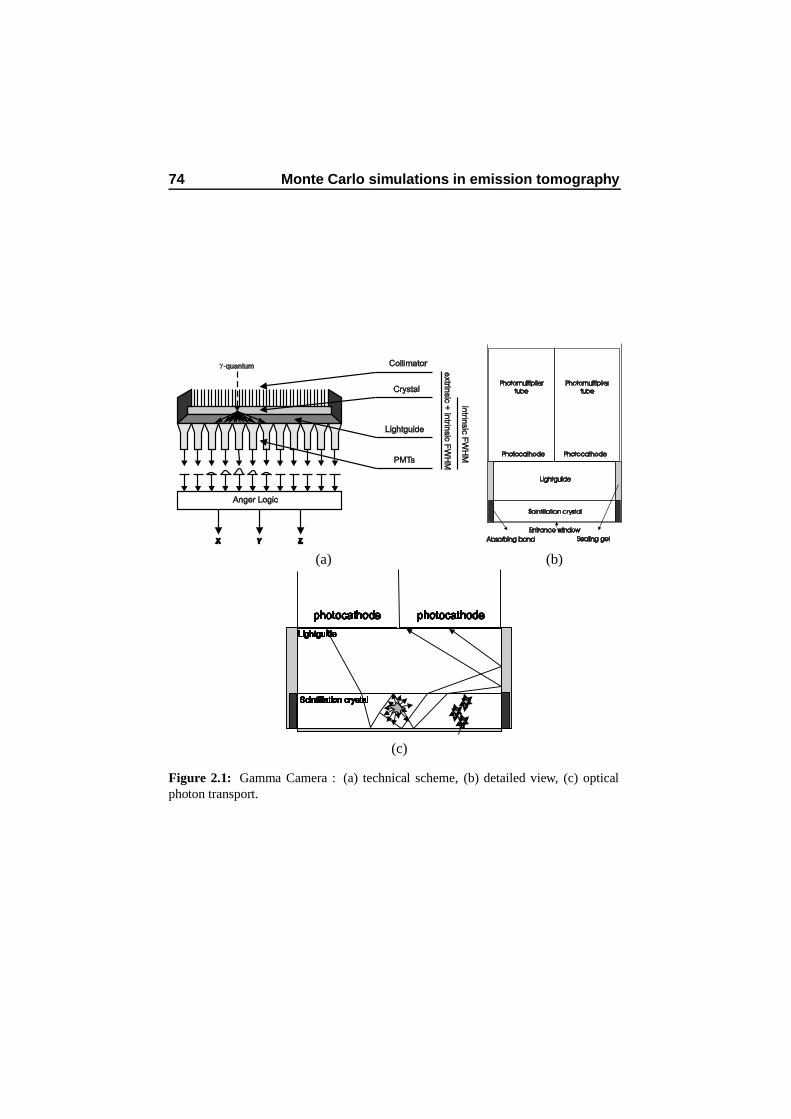
74 Monte Carlo simulations in emission tomography
Anger Logic
X Y Z
-quantum Collimator
Crystal
Lightguide
PMTs
extrin
sic
+F
WH
Min
trinsic
intrin
sic
FW
HM
Scintillation crystal
Lightguide
Photocathode Photocathode
Photomultiplier
tube
Photomultiplier
tube
Absorbing band Sealing gel
Entrance window
(a) (b)
Scintillation crystal
Lightguide
photocathode photocathode
(c)
Figure 2.1: Gamma Camera : (a) technical scheme, (b) detailed view, (c) opticalphoton transport.
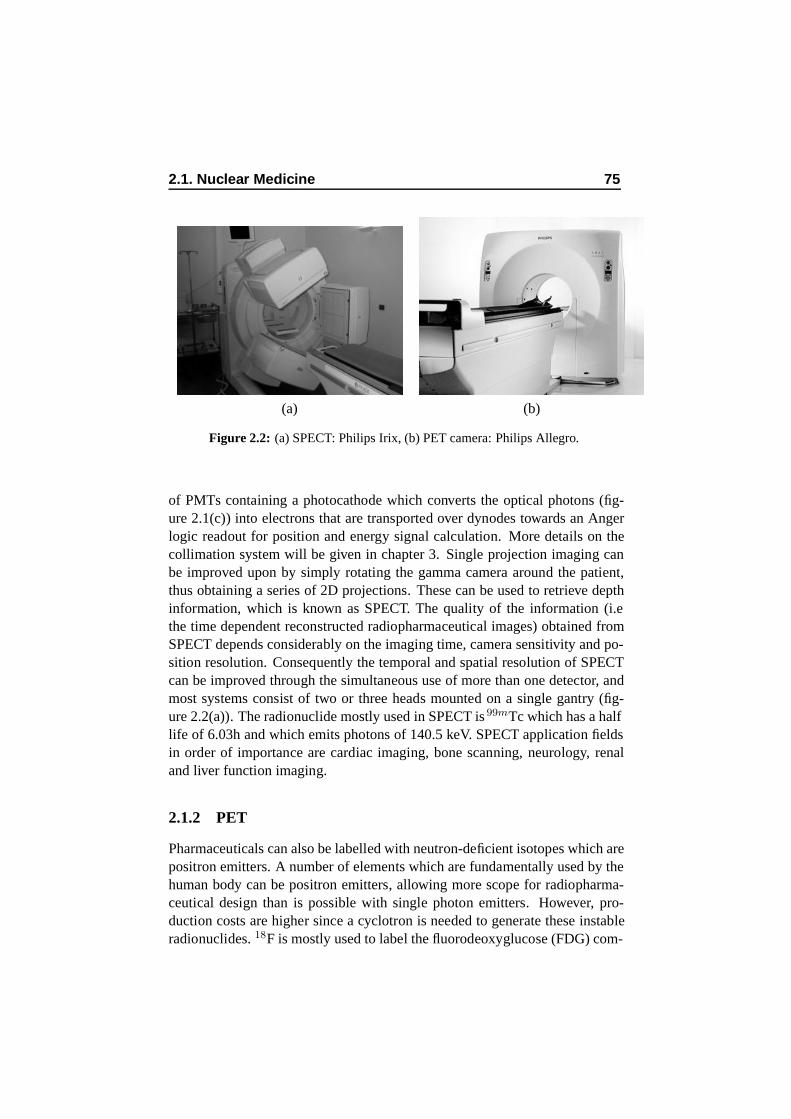
2.1. Nuclear Medicine 75
(a) (b)
Figure 2.2: (a) SPECT: Philips Irix, (b) PET camera: Philips Allegro.
of PMTs containing a photocathode which converts the optical photons (fig-ure 2.1(c)) into electrons that are transported over dynodes towards an Angerlogic readout for position and energy signal calculation. More details on thecollimation system will be given in chapter 3. Single projection imaging canbe improved upon by simply rotating the gamma camera around the patient,thus obtaining a series of 2D projections. These can be used to retrieve depthinformation, which is known as SPECT. The quality of the information (i.ethe time dependent reconstructed radiopharmaceutical images) obtained fromSPECT depends considerably on the imaging time, camera sensitivity and po-sition resolution. Consequently the temporal and spatial resolution of SPECTcan be improved through the simultaneous use of more than one detector, andmost systems consist of two or three heads mounted on a single gantry (fig-ure 2.2(a)). The radionuclide mostly used in SPECT is 99mTc which has a halflife of 6.03h and which emits photons of 140.5 keV. SPECT application fieldsin order of importance are cardiac imaging, bone scanning, neurology, renaland liver function imaging.
2.1.2 PET
Pharmaceuticals can also be labelled with neutron-deficient isotopes which arepositron emitters. A number of elements which are fundamentally used by thehuman body can be positron emitters, allowing more scope for radiopharma-ceutical design than is possible with single photon emitters. However, pro-duction costs are higher since a cyclotron is needed to generate these instableradionuclides. 18F is mostly used to label the fluorodeoxyglucose (FDG) com-
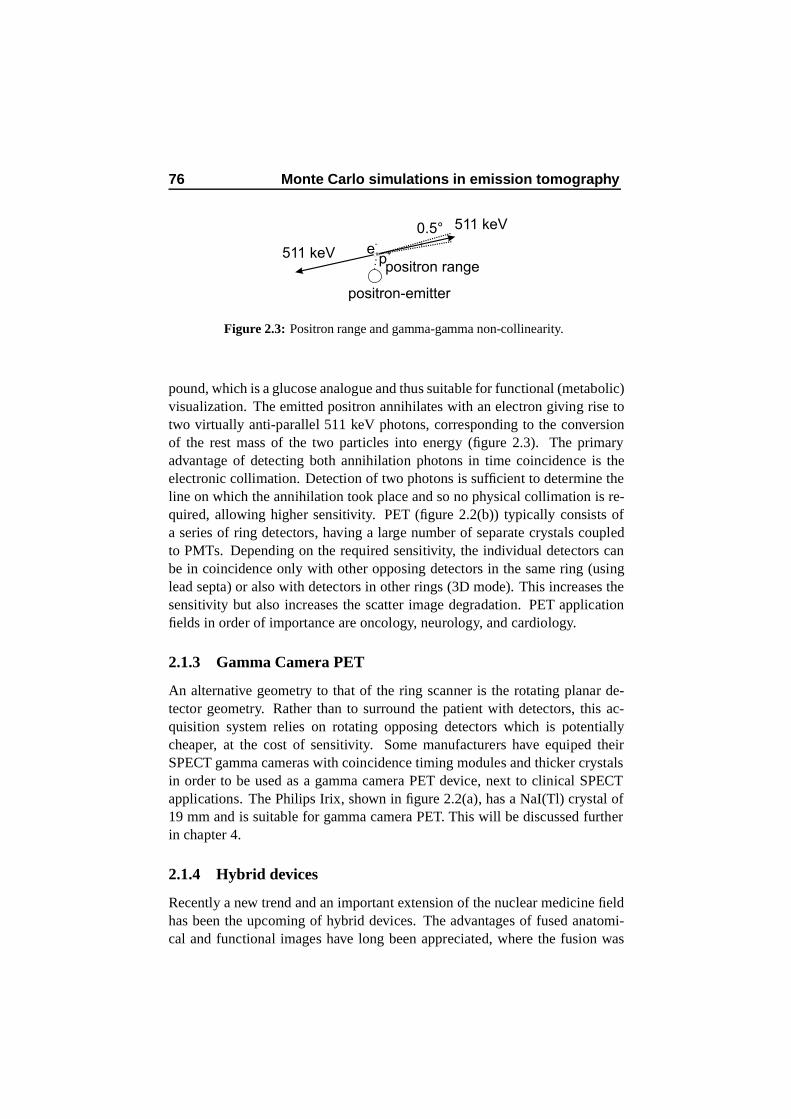
76 Monte Carlo simulations in emission tomography
p+e
-
positron-emitter
511 keV
511 keV
0.5°
positron range
Figure 2.3: Positron range and gamma-gamma non-collinearity.
pound, which is a glucose analogue and thus suitable for functional (metabolic)visualization. The emitted positron annihilates with an electron giving rise totwo virtually anti-parallel 511 keV photons, corresponding to the conversionof the rest mass of the two particles into energy (figure 2.3). The primaryadvantage of detecting both annihilation photons in time coincidence is theelectronic collimation. Detection of two photons is sufficient to determine theline on which the annihilation took place and so no physical collimation is re-quired, allowing higher sensitivity. PET (figure 2.2(b)) typically consists ofa series of ring detectors, having a large number of separate crystals coupledto PMTs. Depending on the required sensitivity, the individual detectors canbe in coincidence only with other opposing detectors in the same ring (usinglead septa) or also with detectors in other rings (3D mode). This increases thesensitivity but also increases the scatter image degradation. PET applicationfields in order of importance are oncology, neurology, and cardiology.
2.1.3 Gamma Camera PET
An alternative geometry to that of the ring scanner is the rotating planar de-tector geometry. Rather than to surround the patient with detectors, this ac-quisition system relies on rotating opposing detectors which is potentiallycheaper, at the cost of sensitivity. Some manufacturers have equiped theirSPECT gamma cameras with coincidence timing modules and thicker crystalsin order to be used as a gamma camera PET device, next to clinical SPECTapplications. The Philips Irix, shown in figure 2.2(a), has a NaI(Tl) crystal of19 mm and is suitable for gamma camera PET. This will be discussed furtherin chapter 4.
2.1.4 Hybrid devices
Recently a new trend and an important extension of the nuclear medicine fieldhas been the upcoming of hybrid devices. The advantages of fused anatomi-cal and functional images have long been appreciated, where the fusion was
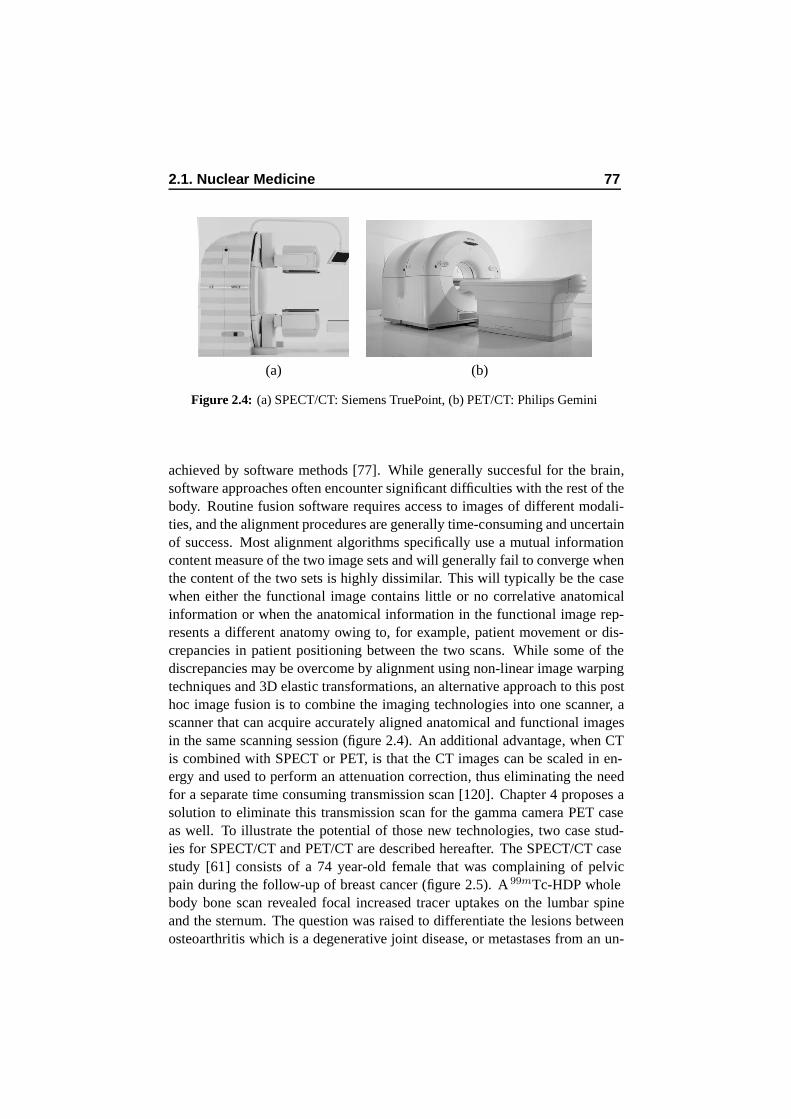
2.1. Nuclear Medicine 77
(a) (b)
Figure 2.4: (a) SPECT/CT: Siemens TruePoint, (b) PET/CT: Philips Gemini
achieved by software methods [77]. While generally succesful for the brain,software approaches often encounter significant difficulties with the rest of thebody. Routine fusion software requires access to images of different modali-ties, and the alignment procedures are generally time-consuming and uncertainof success. Most alignment algorithms specifically use a mutual informationcontent measure of the two image sets and will generally fail to converge whenthe content of the two sets is highly dissimilar. This will typically be the casewhen either the functional image contains little or no correlative anatomicalinformation or when the anatomical information in the functional image rep-resents a different anatomy owing to, for example, patient movement or dis-crepancies in patient positioning between the two scans. While some of thediscrepancies may be overcome by alignment using non-linear image warpingtechniques and 3D elastic transformations, an alternative approach to this posthoc image fusion is to combine the imaging technologies into one scanner, ascanner that can acquire accurately aligned anatomical and functional imagesin the same scanning session (figure 2.4). An additional advantage, when CTis combined with SPECT or PET, is that the CT images can be scaled in en-ergy and used to perform an attenuation correction, thus eliminating the needfor a separate time consuming transmission scan [120]. Chapter 4 proposes asolution to eliminate this transmission scan for the gamma camera PET caseas well. To illustrate the potential of those new technologies, two case stud-ies for SPECT/CT and PET/CT are described hereafter. The SPECT/CT casestudy [61] consists of a 74 year-old female that was complaining of pelvicpain during the follow-up of breast cancer (figure 2.5). A 99mTc-HDP wholebody bone scan revealed focal increased tracer uptakes on the lumbar spineand the sternum. The question was raised to differentiate the lesions betweenosteoarthritis which is a degenerative joint disease, or metastases from an un-
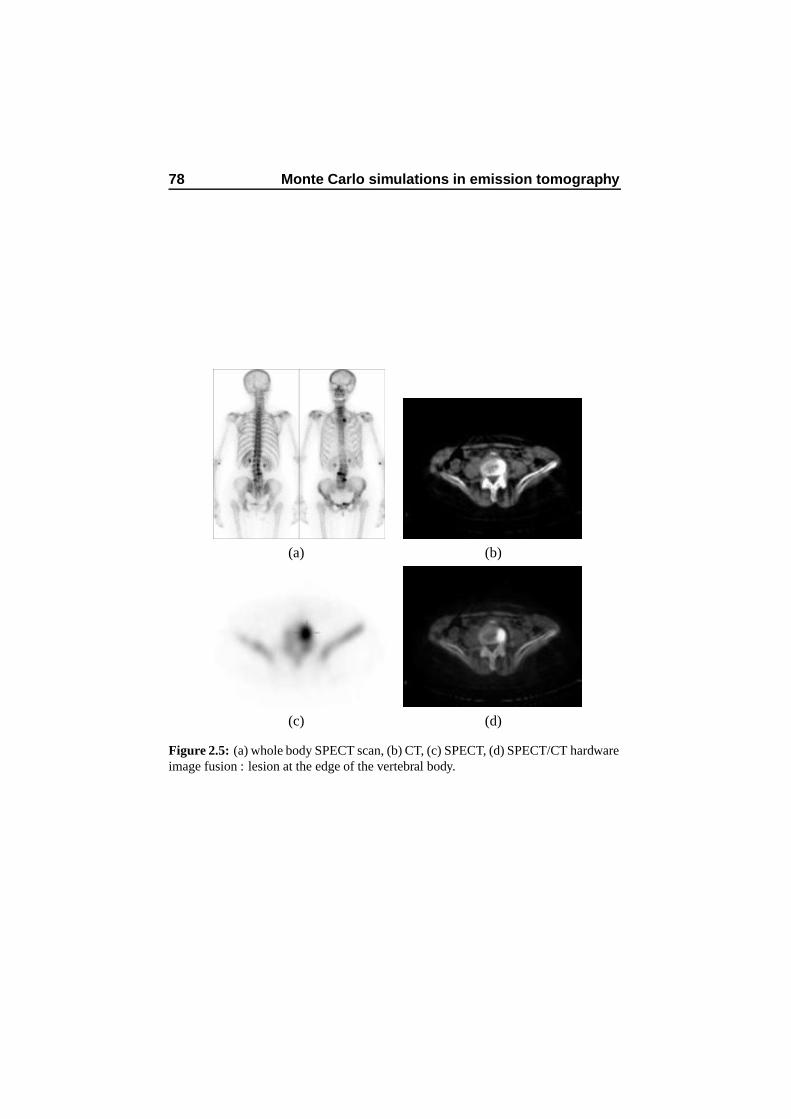
78 Monte Carlo simulations in emission tomography
(a) (b)
(c) (d)
Figure 2.5: (a) whole body SPECT scan, (b) CT, (c) SPECT, (d) SPECT/CT hardwareimage fusion : lesion at the edge of the vertebral body.
2.1. Nuclear Medicine 79
known primary cancer. An abdominal and pelvic SPECT/CT scan was thenperformed. Bone SPECT confirmed the spinal lesions in the lumbar area, withan intense tracer uptake. CT images revealed high density lesions at the edge ofthe vertebral bodies. Fused images demonstrated perfect correlation betweenCT and SPECT lesions. Final diagnosis was osteoarthritis. The PET/CT casestudy consists of a 73-year old male with a history of colorectal cancer whohad undergone a sigmoidectomy, which is the surgical removal of the sigmoidcolon, and chemotherapy [120] (figure 2.6). A CT scan suggested a possi-ble liver lesion and an abnormal para-aortic node. The PET/CT scan clearlyshowed intense uptake of FDG in a right anterior para-aortic lymph node andin a liver lesion both consistent with a malignancy.
2.1.5 Small animal imaging
The previous section discussed the recent advances in human SPECT/PET de-vices. However, the past four to five years were also a major breakthrough forsmall animal imaging, which has received considerable attention in the fieldof medical imaging. Dedicated high-resolution small animal imaging systemshave recently emerged as important new tools for cancer research. These newimaging systems permit researchers to noninvasively screen animals for muta-tions or pathologies and to monitor disease progression and response to ther-apy. Several research groups have extended the use of imagers from humanto small animal applications. Multiple modalities are already validated andavailable for research purposes.
• small animal MRI: research areas of growth pertaining to MR mi-croscopy studies are focused on phenotyping of genetically engineeredmice models of human neurological diseases and of rodent brain at-lases [14].
• microCT: microCT systems provide high-resolution images (typically50 microns or less), rapid data acquisition (typically 5 to 30 minutes),excellent sensitivity to skeletal tissue and good sensitivity to soft tissue,particularly when contrast-enhancing media are employed [85].
• microPET: application fields are neurosciences, neuroradiology, oncol-ogy, and gene expression imaging. Most small animal PET scanners [24]make use of recently developed high-end electronics, of new scintillatormaterials and are able to return a Depth of Interaction (DOI) estimate ifusing dual layer crystals (figure 2.7 [62]).
• microSPECT: microSPECT has been used to study cerebral bindingsites, to image the expression of reporter genes, and for applications
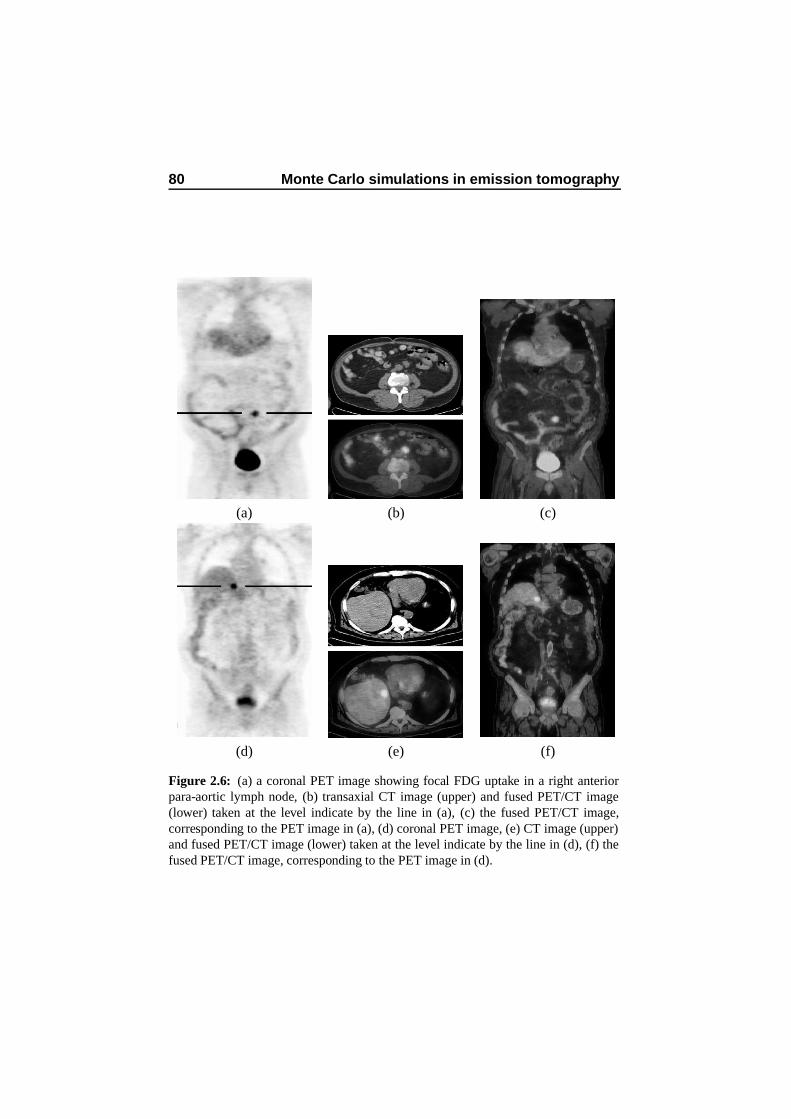
80 Monte Carlo simulations in emission tomography
(a) (b) (c)
(d) (e) (f)
Figure 2.6: (a) a coronal PET image showing focal FDG uptake in a right anteriorpara-aortic lymph node, (b) transaxial CT image (upper) and fused PET/CT image(lower) taken at the level indicate by the line in (a), (c) the fused PET/CT image,corresponding to the PET image in (a), (d) coronal PET image, (e) CT image (upper)and fused PET/CT image (lower) taken at the level indicate by the line in (d), (f) thefused PET/CT image, corresponding to the PET image in (d).
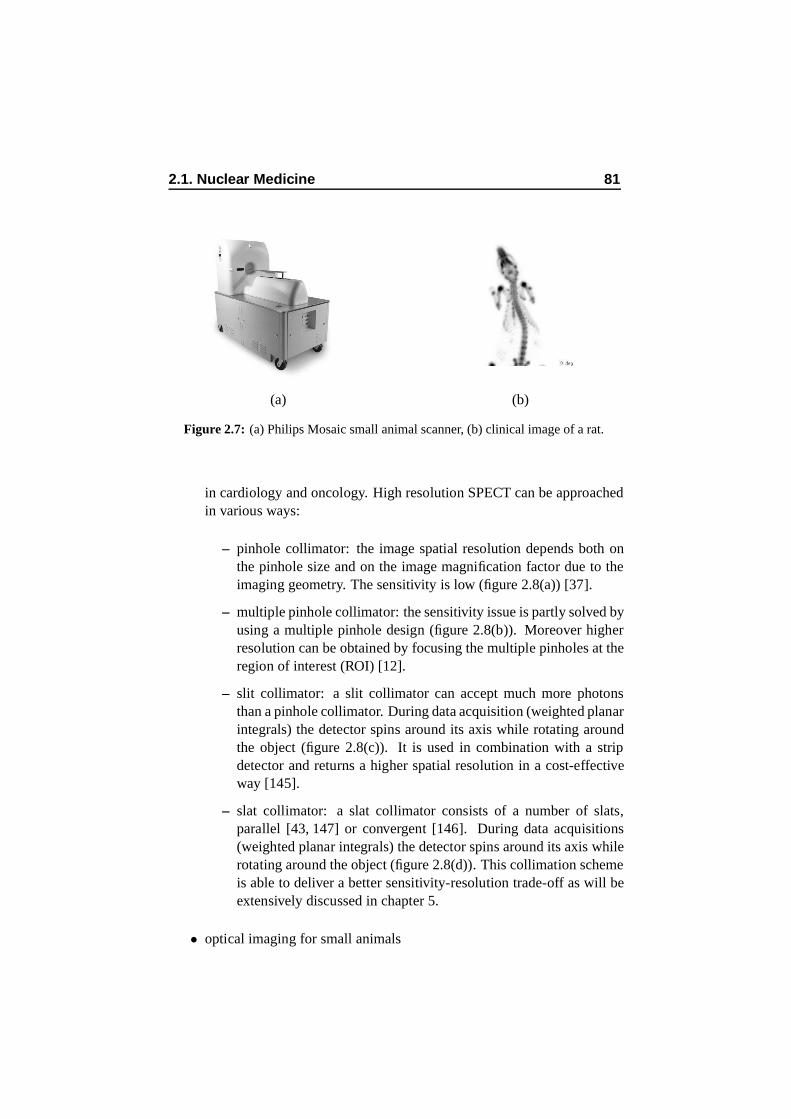
2.1. Nuclear Medicine 81
(a) (b)
Figure 2.7: (a) Philips Mosaic small animal scanner, (b) clinical image of a rat.
in cardiology and oncology. High resolution SPECT can be approachedin various ways:
– pinhole collimator: the image spatial resolution depends both onthe pinhole size and on the image magnification factor due to theimaging geometry. The sensitivity is low (figure 2.8(a)) [37].
– multiple pinhole collimator: the sensitivity issue is partly solved byusing a multiple pinhole design (figure 2.8(b)). Moreover higherresolution can be obtained by focusing the multiple pinholes at theregion of interest (ROI) [12].
– slit collimator: a slit collimator can accept much more photonsthan a pinhole collimator. During data acquisition (weighted planarintegrals) the detector spins around its axis while rotating aroundthe object (figure 2.8(c)). It is used in combination with a stripdetector and returns a higher spatial resolution in a cost-effectiveway [145].
– slat collimator: a slat collimator consists of a number of slats,parallel [43, 147] or convergent [146]. During data acquisitions(weighted planar integrals) the detector spins around its axis whilerotating around the object (figure 2.8(d)). This collimation schemeis able to deliver a better sensitivity-resolution trade-off as will beextensively discussed in chapter 5.
• optical imaging for small animals
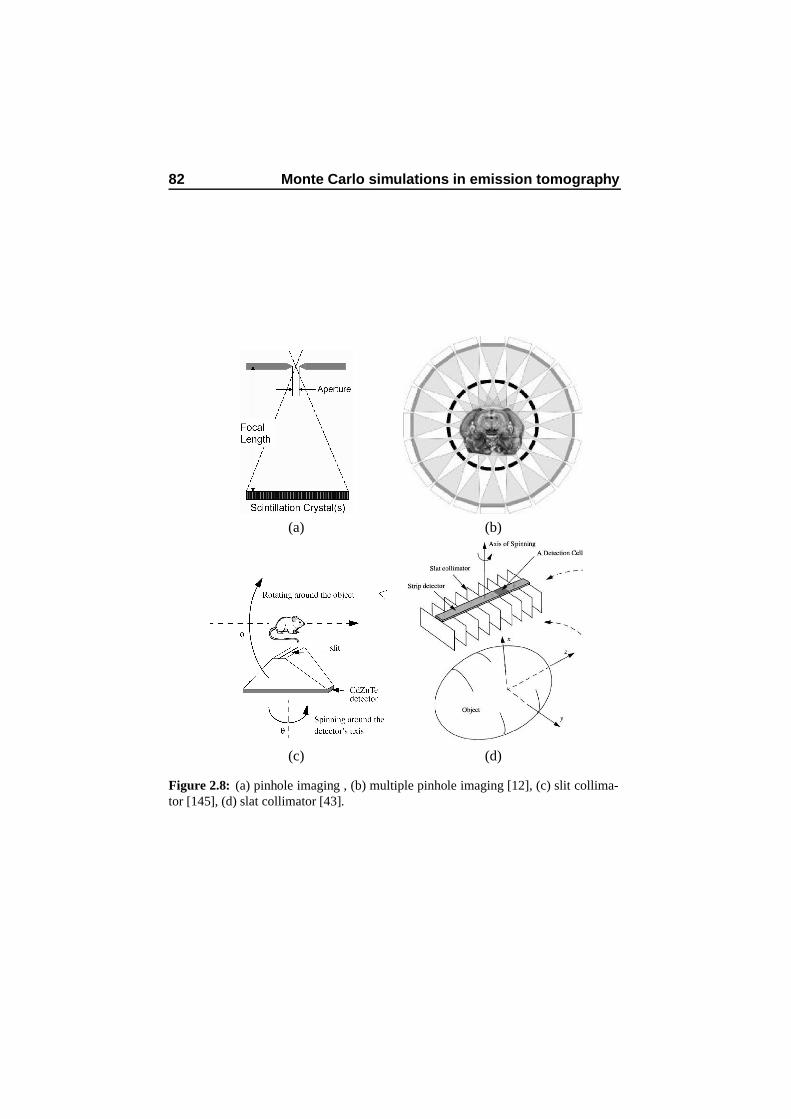
82 Monte Carlo simulations in emission tomography
(a) (b)
(c) (d)
Figure 2.8: (a) pinhole imaging , (b) multiple pinhole imaging [12], (c) slit collima-tor [145], (d) slat collimator [43].
2.1. Nuclear Medicine 83
– bioluminescence: this technique provides information on both spa-tial localization as well as the number of metabolically active cellsand may also report function. Photoactive reporters linked to spe-cific gene promoters provide information on gene expression invivo [29].
– fluorescence: this imaging modality is emerging as an importantalternative because of its operational simplicity, safety, and cost-effectiveness. Fluorescence imaging has recently become partic-ularly interesting because of advances in fluorescent probe tech-nology, including targeted fluorochromes as well as fluorescentswitches sensitive to specific biochemical events [51].
2.1.6 Reconstruction
Image reconstruction from projection data acquired under different angles canbe performed in several ways [26, 95]:
• analytical reconstruction
– Filtered BackProjection: analytical inversion of the X-Ray Trans-form based on the Central Slice Theorem
• deterministic iterative reconstruction
– ART: Algebraic Reconstruction Technique
– SIRT: Simultaneous Iterative Reconstruction Technique
• statistical iterative reconstruction
– MLEM: Maximum Likelihood Expectation Maximization
– MAP: Maximum a Posteriori
A deterministic model is obtained when the system characteristics are in-corporated. Accordingly, the reconstruction problem can be solved analyti-cally. If we assume the acquisition process to be statistical, then a statisticalreconstruction technique is mandatory. Often used statistics are the Poissonmodel for the radioactive decay process and the Gaussian model for acquisi-tion intrinsic features (detector response). The main advantage of a statisticalmodel is that a smaller variance results in the reconstructed image if the ap-propriate models are used. Iterative reconstruction techniques are capable ofincorporating image degrading effects in the reconstruction algorithm in order
84 Monte Carlo simulations in emission tomography
to improve the reconstructed image quality. MLEM [95, 132], which is an al-gorithm that incorporates the Poisson statistics of the radioactive decay in thereconstruction will be discussed as a basic statistical iterative reconstructiontechnique hereafter.
Let us consider a parametrized family of probability density functions:F → f(F |P ) with F the reconstructed image and P the measurement. Whenf(F |P ) is viewed as a function of F with P fixed, it is a probability densityfunction, and when viewed as a function of P with F fixed, it is a likelihoodfunction. When we write down the Bayes’ rule, we find:
Pr(F |P ) =Pr(P |F )Pr(F )
Pr(P ), (2.1)
wherein Pr(P |F ) is the likelihood (true forward probability) that the true tracerdistribution F gives rise to a particular measurement P . This is the well-studied forward problem of the acquisition setup, commonly referred to asthe detector response function. Pr(F |P ) however is the probability of an im-age, given the measurements. This is the a posteriori probability which is notknown. For a posteriori knowledge of the true tracer distribution: Pr(F |P ), thelikelihood Pr(P |F ) is needed. Assuming that the acquisition model (systemmatrix A) is known, the following expression for the expected value r in theprojectionbin i is:
ri =N
∑
j=1
aijfj, (2.2)
With N the number of pixels in the image. In reality pi is measured rather thanri. pi is Poisson distributed with the expectation value ri as mean:
Pr(pi|ri) = exp (−ri)ri
pi
pi!. (2.3)
All measured photons are independent and the total likelihood is the multipli-cation of the individual likelihoods:
Pr(P |F ) =∏
i
exp (−ri)ri
pi
pi!. (2.4)
Maximizing this term is equivalent to maximizing the logarithm which is lesscomplicated. This function is referred to as the log-likelihood function:
L(P |F ) =∑
i
(−ri + pi ln ri − ln pi!). (2.5)
2.1. Nuclear Medicine 85
The projection data can not be altered, so the last term is omitted. Maxi-mization of this expression can be done in various ways but the Expectation-Maximization algorithm guarantees convergence. The derivation will not bediscussed in detail [95, 96, 132]. The iterative EM algorithm is given by thefollowing expression:
f(k+1)j =
f(k)j
∑
i=1 aij
M∑
i=1
aijpi
∑Nj′=1 aij′f
(k)j′
, (2.6)
where M is the number of detection bins and∑N
j′=1 aij′fkj′ is the forward
projection of the previous estimation fk in the projection bin i. The ratio ofthe measured value pi and this estimation is backprojected for each projectionbin. These values are normalized and then multiplied with the current im-age estimate to obtain an updated estimate of the true tracer distribution. In aMAP reconstruction, a priori anatomical or analytical information is includedin the reconstruction algorithm which accordingly includes a penalisation fac-tor (Pr(F )) next to the data-fit term (Pr(P |F )) [48, 49, 74]. This is illustratedusing the formula for the one-step-late algoritm:
f(k+1)j =
f(k)j
∑
i=1 aij + β ∂U
∂f(k)j
M∑
i=1
aijpi
∑Nj′=1 aij′f
(k)j′
, (2.7)
where the function U is called the total energy function. U can for instance beexpressed as a weighted sum of potential functions given by quadratic differ-ences between pixel intensities. The influence of this regularization is tunedby an additional parameter β which expresses the relative importance of thedata-fit term and of the smoothing regularization. If β is small, then the recon-structions are forced to fit the data, resulting in noisier images.
In the previous discussion we assumed the system matrix to be known ex-actly. The success of an iterative algorithm is indeed mainly dependent onthe accuracy of modeling the system matrix: aij denotes the possibility thata decay in voxel i will be detected in bin j. The reconstruction problem isaddressed in the most realistic way when reconstructions are performed usinga Monte Carlo simulated projector in an iterative algorithm. Moreover, scatterand gamma camera spatial response are processes that can not be accountedfor when reconstructing twodimensional slices from onedimensional projec-tions as the photon distibution spreads over several slices. Therefore optimalreconstruction quality is obtained with a fully 3D projector. Limitations bycomputing power have to be accounted for [22], although feasible techniqueshave been proposed [13]. Monte Carlo based reconstruction will be discussedin chapter 7 showing results for a dedicated SPECT implementation.
86 Monte Carlo simulations in emission tomography
2.2 The Monte Carlo method
Monte Carlo methods are statistical simulation methods wherein a statisticalsimulation is any simulation that uses a sequence of random numbers. In orderto do Monte Carlo calculations some a priori information about the occuringphysics processes in the simulations is needed; this information is expressedin the form of probability density functions (pdfs). When simulating photoninteractions, the partial and total cross section data (based on the material con-stitution) represent such information used to calculate path length and type ofinteraction. Afterwards these pdfs are sampled by predefined sampling rulesusing randomly generated numbers. The energy of such a photon can be dis-sipated along its path or the photon can penetrate all scattering and attenuat-ing media to reach the detector where a new pdf-sampling decides whetherit should be accounted for in the scoring region or whether it should be dis-carded [141].
2.2.1 Random numbers
Random numbers are key important when modeling a physical system by astatistical model. Therefore, every random number generator has to deliveruncorrelated, uniform and reproducable sequences with a very long period ina short amount of time. A computer algorithm can be used to generate thatrandom number from seed numbers. An example of such an algorithm is thelinear congruental algorithm where a series of random numbers In is calculatedfrom a first seed value I0, according to the relationship
In+1 = (aIn + b)mod(2k), (2.8)
where a en b are constants and k is the integer word size of the computer. Theseed value must be randomly changed, for instance by triggering a value froma call to the system clock.
2.2.2 Sampling methods
To obtain a stochastic variable that follows a particular pdf three different sam-pling methods can be used.
The distribution function method: a cumulated distribution functioncpdf(x) is constructed from the integral of pdf(x) over the interval [a, x] ac-cording to:
cpdf(x) =
∫ x
apdf(x′)dx′. (2.9)
2.2. The Monte Carlo method 87
The variable x is then sampled by replacing cpdf(x) in (2.9) with a uniformlydistributed random number in the range of [0, 1] and solving for x. This sam-pling method is used if the inverse of the cpdf(x) is easily obtainable.
The rejection method: possibly there can arise some mathematical diffi-culties in calculating the inverse of the cpdf . In the latter case the rejectionmethod can be used. Let the pdf(x) be defined in the range [a, b] and calculatethe normalized pdf∗(x) as in
pdf∗(x) =pdf(x)
max[pdf(x)], (2.10)
so the maximum of pdf∗(x) is 1. Then sample a uniform distributed value ofx within the range [a, b] from the relation
x = a + R1(b − a), (2.11)
where R1 is a random number. Let a second random number decide whetherthe sampled x should be accepted. This is done by checking
R2 < pdf∗(x). (2.12)
If this relation is fulfilled, then x is accepted as a properly distributed stochasticvalue, otherwise x needs to be resampled.
Mixed methods: when the previous two methods are impractical, a mixtureof the two methods above is used. Accordingly, the pdf∗(x) is the productof two probability distribution functions pdf∗A(x).pdf∗
B(x), both normalizedto unity. Now one determines an x value using the distribution method onpdf∗
A(x) and applies then (with that x) the rejection method to pdf∗B(x) [76].
Non analog sampling: a direct Monte Carlo simulation using true pdfs mayrequire an unacceptable long time to produce statistically relevant results. Itmay thus be desirable to bias the sampling by introducing stratification (limitsource distribution), importance sampling (splitting or Russian Roulette usingproduction tables) or by implementing forced detection (by imposing a regis-tration in a scoring region).
2.2.3 Photon transport
Compton incoherent scattering and photoelectric effect are the two most im-portant interaction mechanisms in nuclear medicine simulations. The total

88 Monte Carlo simulations in emission tomography
photoelectric cross section for a given energy, E, is calculated using discretizedlibraries by means of interpolation. The incident photon is absorbed and anelectron is emitted in the same direction of the incident photon. The kineticenergy of the electron is defined as the difference between the energy of theoriginal photon and the binding energy of the electron. The subshell of emis-sion is again randomly sampled, thereby using cross sectional data for all sub-shells. When simulating the Compton scattering of a photon from an atomicelectron on the other hand, an empirical cross section formula is used and sam-pling of the final state is done by a variant of the mixed Monte Carlo methodas noted in 2.2.2. The quantum mechanical Klein-Nishina differential crosssection per atom is:
dσ
dε= πr2
e
mec2
E0Z[
1
ε+ ε][
1 − εsin2 θ
1 + ε2], (2.13)
wherere = classical electron radiusmec
2 = electron massE0 = energy of the incident photonE1 = energy of the scattered photonε = E1
E0.
Assuming an elastic collision, the scattering angle θ is defined by the Comptonformula:
E1 = E0mec
2
mec2+E0(1 − cos θ). (2.14)
The value of ε corresponding to the minimum photon energy (backscatter) isgiven by:
ε0 =mec
2
mec2+2E0, (2.15)
hence ε ∈ [ε0, 1]. One may state that:
Φε ≈ [1
ε+ ε][
1 − εsin2 θ
1 + ε2]
= f(ε).g(ε)
= [α1f1(ε)+α2f2(ε)].g(ε), (2.16)

2.2. The Monte Carlo method 89
where
α1 = ln(1
ε0)
f1(ε) =1
α1ε
α2 =(1 − ε20)
2
f2(ε) =ε
α2. (2.17)
f1 and f2 are probability density functions defined on the interval [ε0, 1], andg(ε) is set to:
g(ε) = [1 − εsin2 θ
1 + ε2], (2.18)
being the rejection function ∀ ε ∈ [ε0, 1] ⇒ 0 < g(ε) ≤ 1. Given a set of 3 ran-dom numbers r,r′,r′′ uniformly distributed on the interval [0, 1], the samplingprocedure for ε is the following:
1. decide whether to sample from f1(ε) or f2(ε): if r < α1(α1+α2)
selectf1(ε) otherwise select f2(ε),
2. sample ε from the distributions to f1 or f2:for f1 : ε=εr′
0 (≡ exp(−r′α1))for f2 : ε2=ε2
0+(1 − ε20)r’,
3. calculate sin2 θ=t(t − 1) where t ≡ (1 − cos θ)=mec2(1−ε)E0ε ,
4. test the rejection function: if g(ε) ≥ r′′ accept ε, otherwise go to (i).
The polar angle θ is deduced from the sampled ε value and in the azimuthaldirection the angular distributions of both the scattered photon as the recoilelectron are considered to be isotropic [1].
2.2.4 Scoring
A selection of relevant physical quantities such as energy, detection locationand scatter events must be accumulated into tallies or scores. Also, an estimateof the statistical error as a function of the number of trials (and other quantities)must be determined.
90 Monte Carlo simulations in emission tomography
2.3 GATE, a simulation platform for SPECT and PET
Dedicated codes exists to address problems specific to Single Photon Emis-sion Computed Tomography (SPECT) such as SimSET [55], SIMIND [75],SimSPECT [140], and to Positron Emission Tomography (PET) such as PET-SIM [119] and Eidolon [143]. Dedicated packages are very powerful for theirspecific design-goal but are both not detailed and flexible enough to allow real-istic simulations of emission tomography detector geometries. Moreover, theydo not account for time explicitly, which limits their use for modeling timedependent processes such as decay, tracer kinetics, patient and bed motion,dead time or detector orbits. One may therefore prefer to use general pur-pose nuclear physics codes such as EGS4 [16], Geant4 [1, 46] or MCNP [17].The main advantages of these general purpose codes are: they are widely usedand extensively tested, they can be regarded as long-term existent as well assupported, and they are continuously evolving and therefore use the best ofcurrent hardware and software capabilities. There are fewer limitations ontheir possible applications, and fewer simplifying assumptions are made: forexample, the processes taking place in the collimator can be thoroughly sim-ulated whereas dedicated codes often use a parametric model. Next to that,time-dependent processes can be simulated and their non-specific design alsooffers the opportunity to implement future developments in SPECT and PETcameras [21], whereas dedicated codes are limited by the time of their design.
Therefore a new code-concept was designed as an upper layer for theGeant4 nuclear physics code and was tuned for use in nuclear medicine, morespecifically to fulfill its role as a simulation platform for PET and SPECT in-corporating all Geant4 features including well-validated physics models, basicevent timing information, geometry modeling tools, visualization, and a script-ing language for commanding the simulation. Object-oriented software designwas envisaged to ensure high modularity and re-usability and the implemen-tation effort was shared by a large research community in order to providelong-term support and maintenance.
Final specifications were circulated in December 2001 [110]. The develop-ment strategy was defined by the research groups involved in the GATE soft-ware development at Lausanne University (UNIL), Ghent University (ELIS)and Clermont-Ferrand University (LPC) who decided to start the Open-GATE collaboration [45]. The initial coding and validation of GATE was doneby those research groups which resulted in 4 publications on the basics ofGATE [73, 92, 107, 111].
Afterwards the collaboration grew very rapidly and focused mainly on thevalidation of GATE by evaluating simulation results versus measurements on
2.3. GATE, a simulation platform for SPECT and PET 91
both commercial and experimental imaging systems. This was done for PET,for SPECT and for small animal imaging systems. This will be further dis-cussed in chapter 3 which is dedicated to validation.
A large effort was also invested in order to provide GATE with enoughflexibility to model novel detection systems [104] still under design. Chapter 5will provide a detailed discussion on a case study demonstrating this flexibility.After initial validation more effort was spent to verify whether the GATE sim-ulation platform would be useful in clinical practice [106]. Results on thissubtopic will be discussed in chapter 4. Finally, current work focuses moston further improvement of the digitization process in order to mimick the ac-quisition process (electronics) more accurately [91, 97, 103]. Chapter 6 willdescribe a deduced theoretical model that can be included in the digitizer toimplement the accurate spatial resolution in continuous detector PET.
At the 2003 IEEE Medical Imaging Conference, the OpenGATE collabo-ration announced the first public release of GATE which took place on May 7th2004. The ultimate aim of the OpenGATE collaboration is to further developand validate GATE so that it becomes the gold standard in nuclear medicineMonte Carlo simulations [4, 68].
The research project discussed in the underlying manuscript contributedsubstantially, from the early beginning of GATE, to the development and val-idation of the SPECT platform. Also, an interface for voxelized clinical datawas implemented within this context. A complex theoretical model was de-rived to be implemented as a continuous detector PET spatial resolution mod-ule. The last stage of this research project succeeded in developing the neces-sary GATE interface modules for Monte Carlo based reconstruction.
2.3.1 GATE: basic features
Software architecture
GATE is a C++ design, enabling a modular structure built on three funda-mental layers: the core layer which defines the basic mechanisms available inGATE for geometry definition, time management, source definition, digitiza-tion, and data output, the application layer that is composed of classes derivedfrom the base classes to model specific objects or processes and finally the userlayer. The latter enables the user to simulate a setup through the use of script-ing. Each functionality has its own messenger that translates the commandto a straightforward instruction. Accordingly, a complete nuclear medicineexperiment can be defined using this particular script language, including thecamera geometry, the phantom geometry, detector electronics, the passing oftime and the kinematic parameters, the output format, the physics processes,
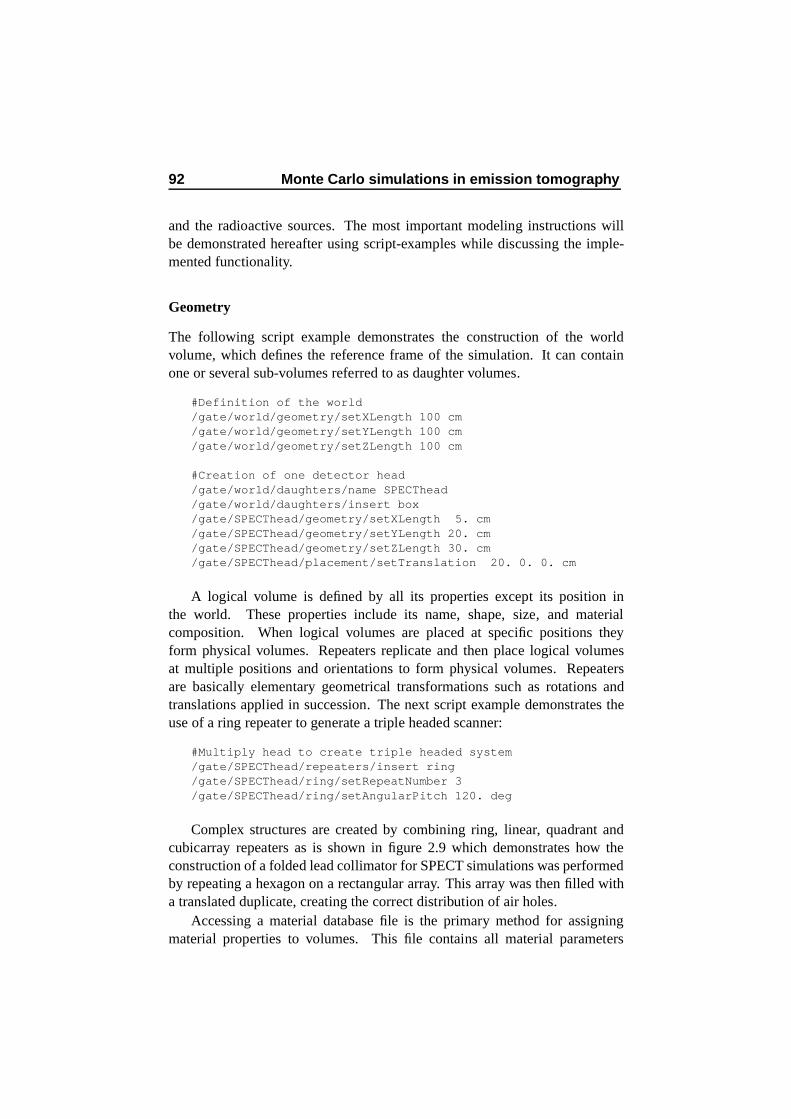
92 Monte Carlo simulations in emission tomography
and the radioactive sources. The most important modeling instructions willbe demonstrated hereafter using script-examples while discussing the imple-mented functionality.
Geometry
The following script example demonstrates the construction of the worldvolume, which defines the reference frame of the simulation. It can containone or several sub-volumes referred to as daughter volumes.
#Definition of the world/gate/world/geometry/setXLength 100 cm/gate/world/geometry/setYLength 100 cm/gate/world/geometry/setZLength 100 cm
#Creation of one detector head/gate/world/daughters/name SPECThead/gate/world/daughters/insert box/gate/SPECThead/geometry/setXLength 5. cm/gate/SPECThead/geometry/setYLength 20. cm/gate/SPECThead/geometry/setZLength 30. cm/gate/SPECThead/placement/setTranslation 20. 0. 0. cm
A logical volume is defined by all its properties except its position inthe world. These properties include its name, shape, size, and materialcomposition. When logical volumes are placed at specific positions theyform physical volumes. Repeaters replicate and then place logical volumesat multiple positions and orientations to form physical volumes. Repeatersare basically elementary geometrical transformations such as rotations andtranslations applied in succession. The next script example demonstrates theuse of a ring repeater to generate a triple headed scanner:
#Multiply head to create triple headed system/gate/SPECThead/repeaters/insert ring/gate/SPECThead/ring/setRepeatNumber 3/gate/SPECThead/ring/setAngularPitch 120. deg
Complex structures are created by combining ring, linear, quadrant andcubicarray repeaters as is shown in figure 2.9 which demonstrates how theconstruction of a folded lead collimator for SPECT simulations was performedby repeating a hexagon on a rectangular array. This array was then filled witha translated duplicate, creating the correct distribution of air holes.
Accessing a material database file is the primary method for assigningmaterial properties to volumes. This file contains all material parameters
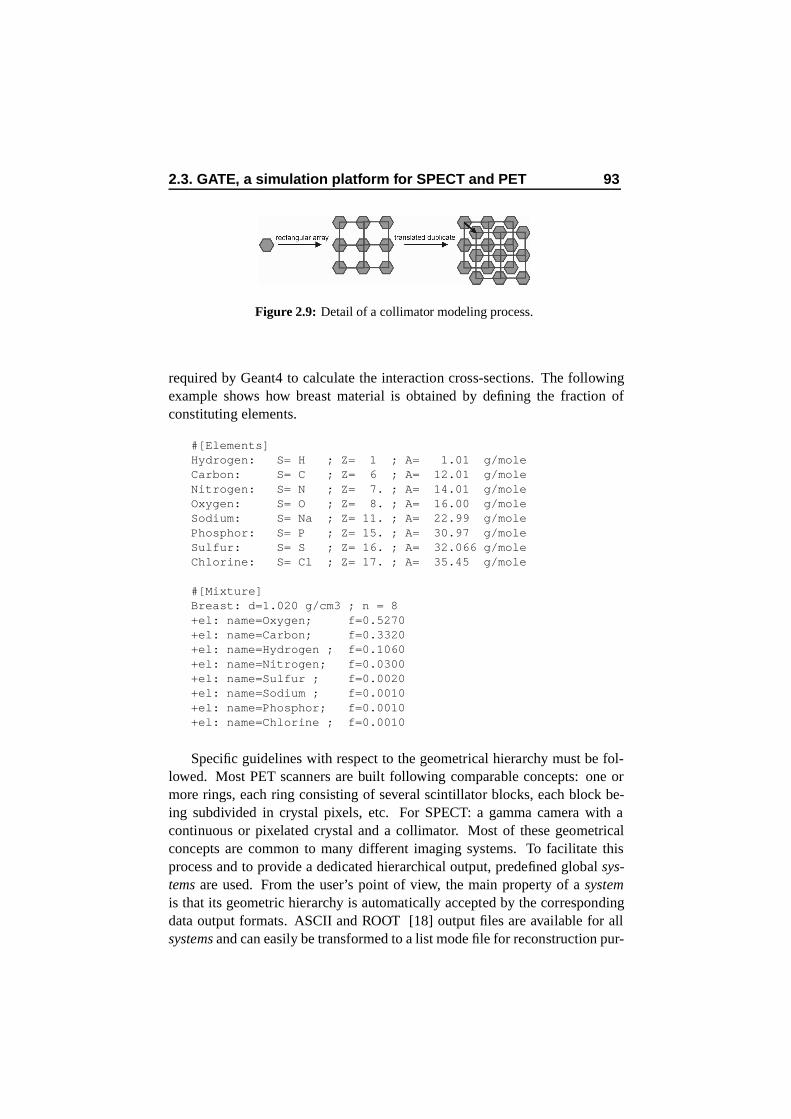
2.3. GATE, a simulation platform for SPECT and PET 93
Figure 2.9: Detail of a collimator modeling process.
required by Geant4 to calculate the interaction cross-sections. The followingexample shows how breast material is obtained by defining the fraction ofconstituting elements.
#[Elements]Hydrogen: S= H ; Z= 1 ; A= 1.01 g/moleCarbon: S= C ; Z= 6 ; A= 12.01 g/moleNitrogen: S= N ; Z= 7. ; A= 14.01 g/moleOxygen: S= O ; Z= 8. ; A= 16.00 g/moleSodium: S= Na ; Z= 11. ; A= 22.99 g/molePhosphor: S= P ; Z= 15. ; A= 30.97 g/moleSulfur: S= S ; Z= 16. ; A= 32.066 g/moleChlorine: S= Cl ; Z= 17. ; A= 35.45 g/mole
#[Mixture]Breast: d=1.020 g/cm3 ; n = 8+el: name=Oxygen; f=0.5270+el: name=Carbon; f=0.3320+el: name=Hydrogen ; f=0.1060+el: name=Nitrogen; f=0.0300+el: name=Sulfur ; f=0.0020+el: name=Sodium ; f=0.0010+el: name=Phosphor; f=0.0010+el: name=Chlorine ; f=0.0010
Specific guidelines with respect to the geometrical hierarchy must be fol-lowed. Most PET scanners are built following comparable concepts: one ormore rings, each ring consisting of several scintillator blocks, each block be-ing subdivided in crystal pixels, etc. For SPECT: a gamma camera with acontinuous or pixelated crystal and a collimator. Most of these geometricalconcepts are common to many different imaging systems. To facilitate thisprocess and to provide a dedicated hierarchical output, predefined global sys-tems are used. From the user’s point of view, the main property of a systemis that its geometric hierarchy is automatically accepted by the correspondingdata output formats. ASCII and ROOT [18] output files are available for allsystems and can easily be transformed to a list mode file for reconstruction pur-
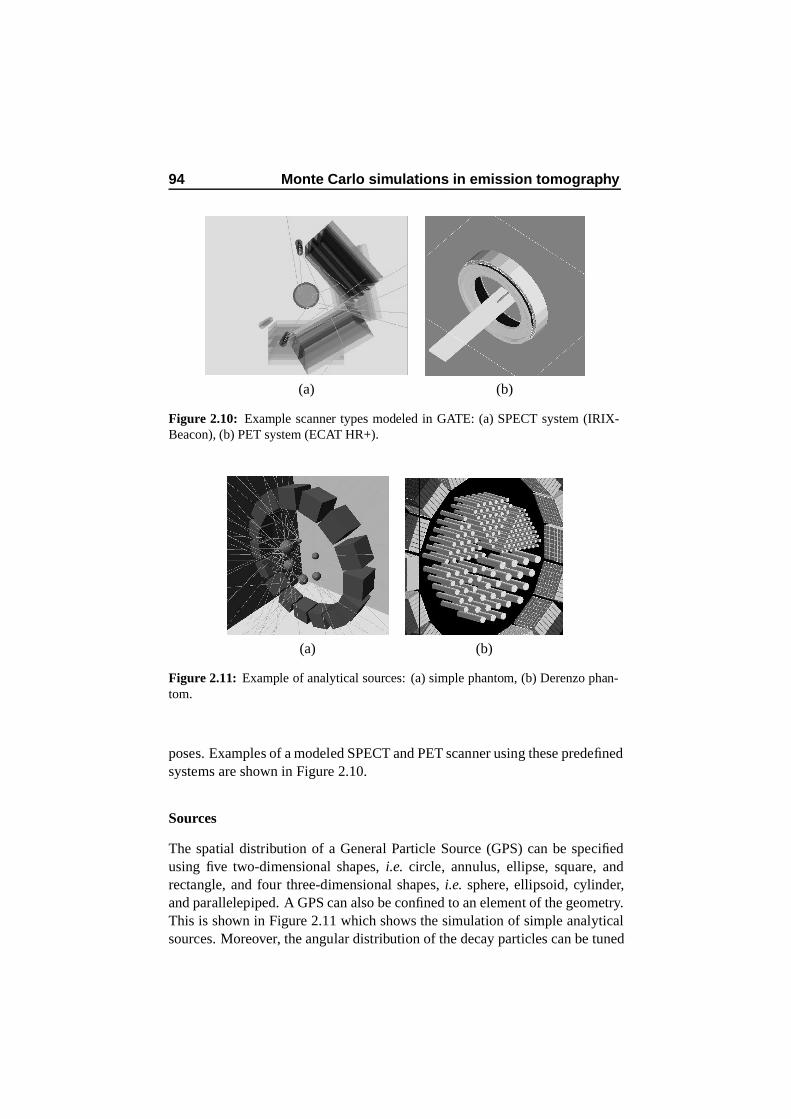
94 Monte Carlo simulations in emission tomography
(a) (b)
Figure 2.10: Example scanner types modeled in GATE: (a) SPECT system (IRIX-Beacon), (b) PET system (ECAT HR+).
(a) (b)
Figure 2.11: Example of analytical sources: (a) simple phantom, (b) Derenzo phan-tom.
poses. Examples of a modeled SPECT and PET scanner using these predefinedsystems are shown in Figure 2.10.
Sources
The spatial distribution of a General Particle Source (GPS) can be specifiedusing five two-dimensional shapes, i.e. circle, annulus, ellipse, square, andrectangle, and four three-dimensional shapes, i.e. sphere, ellipsoid, cylinder,and parallelepiped. A GPS can also be confined to an element of the geometry.This is shown in Figure 2.11 which shows the simulation of simple analyticalsources. Moreover, the angular distribution of the decay particles can be tuned
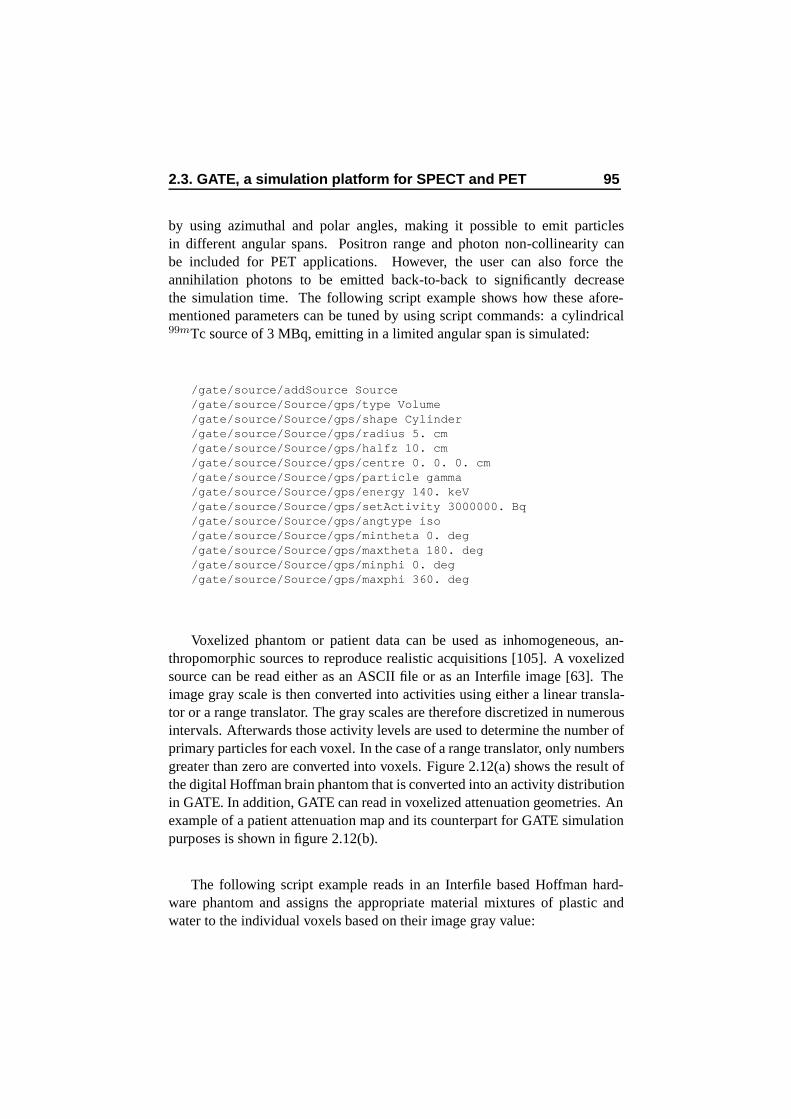
2.3. GATE, a simulation platform for SPECT and PET 95
by using azimuthal and polar angles, making it possible to emit particlesin different angular spans. Positron range and photon non-collinearity canbe included for PET applications. However, the user can also force theannihilation photons to be emitted back-to-back to significantly decreasethe simulation time. The following script example shows how these afore-mentioned parameters can be tuned by using script commands: a cylindrical99mTc source of 3 MBq, emitting in a limited angular span is simulated:
/gate/source/addSource Source/gate/source/Source/gps/type Volume/gate/source/Source/gps/shape Cylinder/gate/source/Source/gps/radius 5. cm/gate/source/Source/gps/halfz 10. cm/gate/source/Source/gps/centre 0. 0. 0. cm/gate/source/Source/gps/particle gamma/gate/source/Source/gps/energy 140. keV/gate/source/Source/gps/setActivity 3000000. Bq/gate/source/Source/gps/angtype iso/gate/source/Source/gps/mintheta 0. deg/gate/source/Source/gps/maxtheta 180. deg/gate/source/Source/gps/minphi 0. deg/gate/source/Source/gps/maxphi 360. deg
Voxelized phantom or patient data can be used as inhomogeneous, an-thropomorphic sources to reproduce realistic acquisitions [105]. A voxelizedsource can be read either as an ASCII file or as an Interfile image [63]. Theimage gray scale is then converted into activities using either a linear transla-tor or a range translator. The gray scales are therefore discretized in numerousintervals. Afterwards those activity levels are used to determine the number ofprimary particles for each voxel. In the case of a range translator, only numbersgreater than zero are converted into voxels. Figure 2.12(a) shows the result ofthe digital Hoffman brain phantom that is converted into an activity distributionin GATE. In addition, GATE can read in voxelized attenuation geometries. Anexample of a patient attenuation map and its counterpart for GATE simulationpurposes is shown in figure 2.12(b).
The following script example reads in an Interfile based Hoffman hard-ware phantom and assigns the appropriate material mixtures of plastic andwater to the individual voxels based on their image gray value:
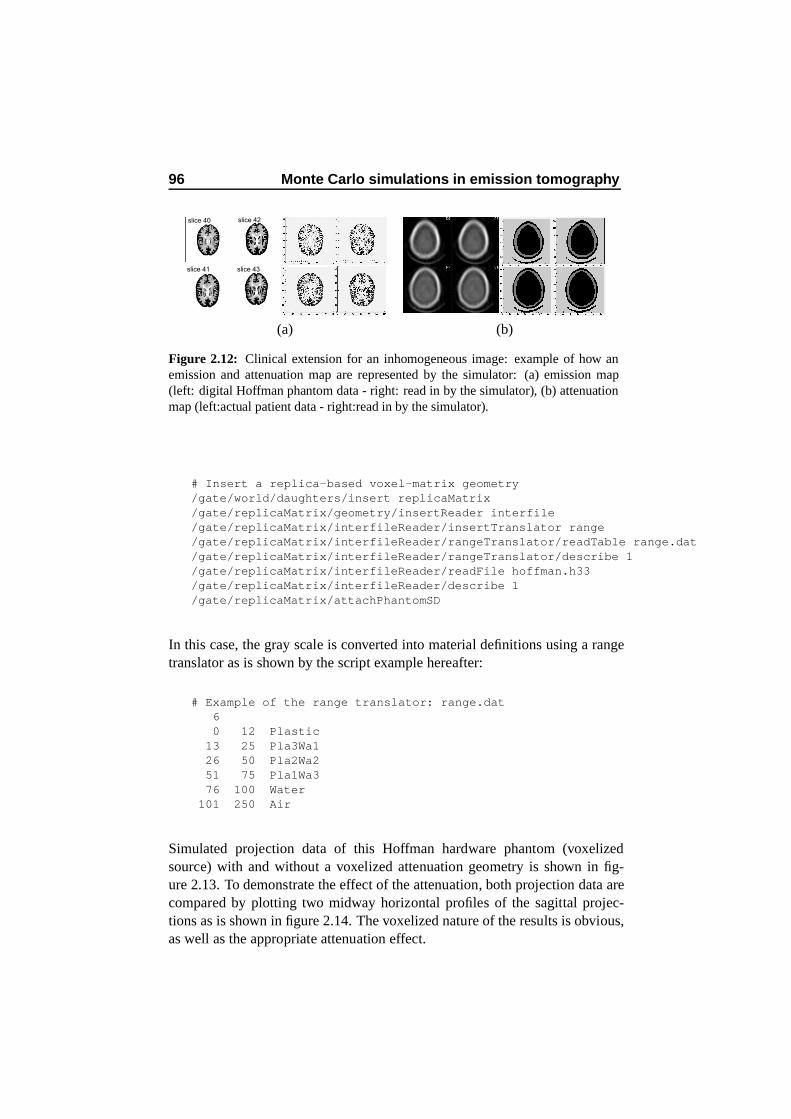
96 Monte Carlo simulations in emission tomography
slice 40
slice 41
slice 42
slice 43
(a) (b)
Figure 2.12: Clinical extension for an inhomogeneous image: example of how anemission and attenuation map are represented by the simulator: (a) emission map(left: digital Hoffman phantom data - right: read in by the simulator), (b) attenuationmap (left:actual patient data - right:read in by the simulator).
# Insert a replica-based voxel-matrix geometry/gate/world/daughters/insert replicaMatrix/gate/replicaMatrix/geometry/insertReader interfile/gate/replicaMatrix/interfileReader/insertTranslator range/gate/replicaMatrix/interfileReader/rangeTranslator/readTable range.dat/gate/replicaMatrix/interfileReader/rangeTranslator/describe 1/gate/replicaMatrix/interfileReader/readFile hoffman.h33/gate/replicaMatrix/interfileReader/describe 1/gate/replicaMatrix/attachPhantomSD
In this case, the gray scale is converted into material definitions using a rangetranslator as is shown by the script example hereafter:
# Example of the range translator: range.dat60 12 Plastic
13 25 Pla3Wa126 50 Pla2Wa251 75 Pla1Wa376 100 Water
101 250 Air
Simulated projection data of this Hoffman hardware phantom (voxelizedsource) with and without a voxelized attenuation geometry is shown in fig-ure 2.13. To demonstrate the effect of the attenuation, both projection data arecompared by plotting two midway horizontal profiles of the sagittal projec-tions as is shown in figure 2.14. The voxelized nature of the results is obvious,as well as the appropriate attenuation effect.
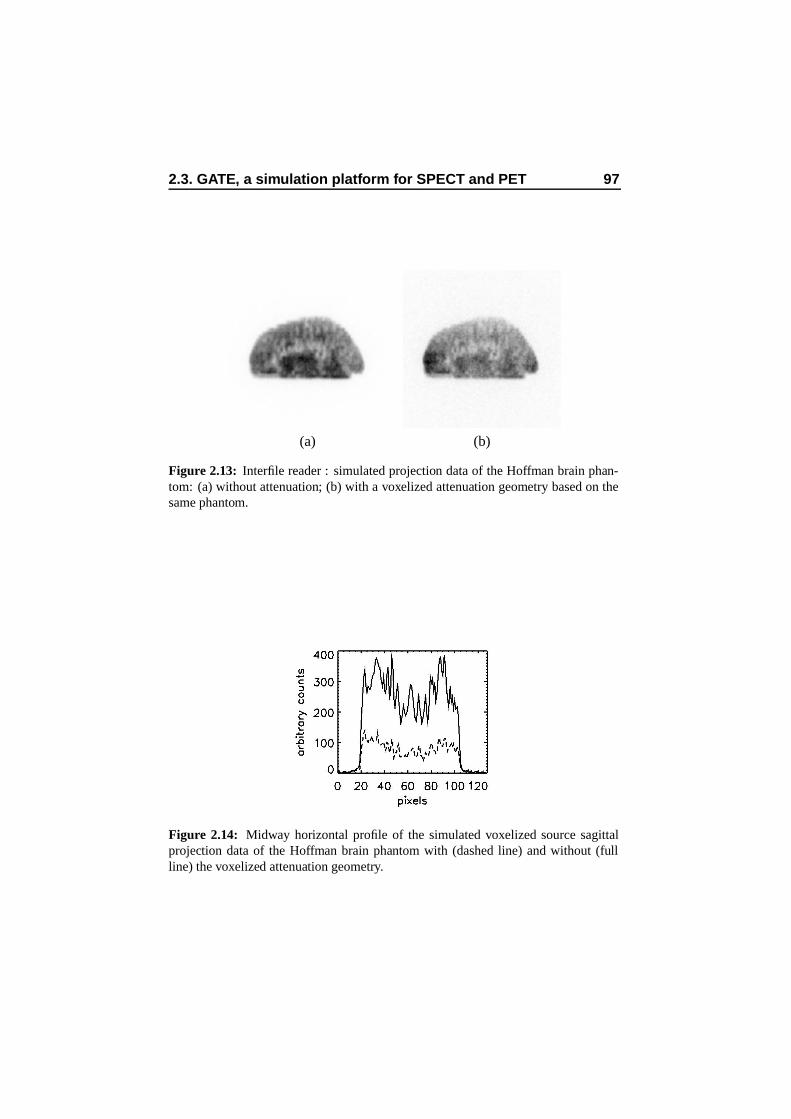
2.3. GATE, a simulation platform for SPECT and PET 97
(a) (b)
Figure 2.13: Interfile reader : simulated projection data of the Hoffman brain phan-tom: (a) without attenuation; (b) with a voxelized attenuation geometry based on thesame phantom.
Figure 2.14: Midway horizontal profile of the simulated voxelized source sagittalprojection data of the Hoffman brain phantom with (dashed line) and without (fullline) the voxelized attenuation geometry.
98 Monte Carlo simulations in emission tomography
Physics
The electromagnetic interactions used in GATE are derived from Geant4 . Theelectromagnetic physics package manages electrons, positrons, γ-rays, X-rays,optical photons, muons, hadrons, and ions. When using the low energy pack-age, the treatment of photons and electrons is extended and verified down to250 eV and includes Rayleigh scattering. This is the most accurate package forbiomedical applications but comes at the price of increased computing time.
The non-collinearity of two annihilation photons for PET applciations isnot taken into account by Geant4. An additional module has been incorporatedin GATE that models the angular distribution model of these photons basedupon a Gaussian angular distribution in water (0.58o FWHM) [64].
The following script command lines show how the physics of the simula-tion can be adapted:
/gate/physics/gamma/selectRayleigh lowenergy/gate/physics/gamma/selectPhotoelectric lowenergy/gate/physics/gamma/selectCompton lowenergy/gate/physics/gamma/selectGammaConversion inactive/gate/physics/gamma/listProcesses/gate/physics/setXRayCut 200. keV/gate/physics/setElectronCut 1. km/gate/physics/setDeltaRayCut 1. GeV
2.3.2 GATE: Time Management
One of the most important features of GATE is the management of time-dependent phenomena, such as detector movement or source decay kinetics,which are kept synchronized to allow a coherent description of the acquisitionprocess [92,106]. This will appear to be mandatory for the simultaneous emis-sion and transmission imaging study, to be discussed in chapter 4. The follow-ing script example shows the movement of the gantry at a speed of 1 deg persecond as well as a translation of the patient support. Moreover, the rotation ofthe gantry and the translation of the table are kept synchronized which allowsto simulate whole body acquisitions.

2.3. GATE, a simulation platform for SPECT and PET 99
#Movement of the gantry/gate/SPECThead/moves/insert orbiting/gate/SPECThead/orbiting/setSpeed 1 deg/s/gate/SPECThead/orbiting/setPoint1 0 0 0 cm/gate/SPECThead/orbiting/setPoint2 0 0 1 cm#Movement of the patient support/gate/Table/moves/insert translation/gate/Table/translation/setSpeed 0 0 1. cm/s
/gate/application/setTimeSlice 1. s/gate/application/setTimeStart 0. s/gate/application/setTimeStop 360. s/gate/application/startDAQ
Next to synchonizing the geometry movements, the synchronization of thesource kinetics with those movements allows for the simulation of realistic ac-quisition conditions including patient movement, respiratory and cardiac mo-tions, scanner rotation, or changes in activity distribution over time. Therefore,the start (0 sec in the previous example) and stop time (6 min here) of the ac-qusition must be provided by the user, as well as the sampling interval (1 sec inthis case). In such a time slice, the geometry is kept at rest while the update isperformed at the time slice transition. The sources are allowed to decay withinthe time slice and the particle transport proceeds. Count rates, random coinci-dences, event pile-up, and detector dead time [97] can be simulated using thisintrinsic event sequence timing.
2.3.3 GATE: Digitization
Parts of the scanner geometry are designated as sensitive detectors, and inter-actions are recorded within these regions. Sensitive detectors are used to storeinformation about particle interactions. Two types of sensitive detectors aredefined in GATE: the crystal sensitive detector (crystalSD) and the phantomsensitive detector (phantomSD) as is shown in the following script example:
/gate/crystal/attachCrystalSD
/gate/lightguide/attachPhantomSD/gate/isolation/attachPhantomSD/gate/phantom/attachPhantomSD/gate/shielding/attachPhantomSD
The crystalSD is used to generate hits from interactions that occur insidethe detector parts of the scanner (in this example the crystal). The data con-tained in these hits include the energy deposition, interaction positions, originof the particle, type of interaction, volume name, and time information. The
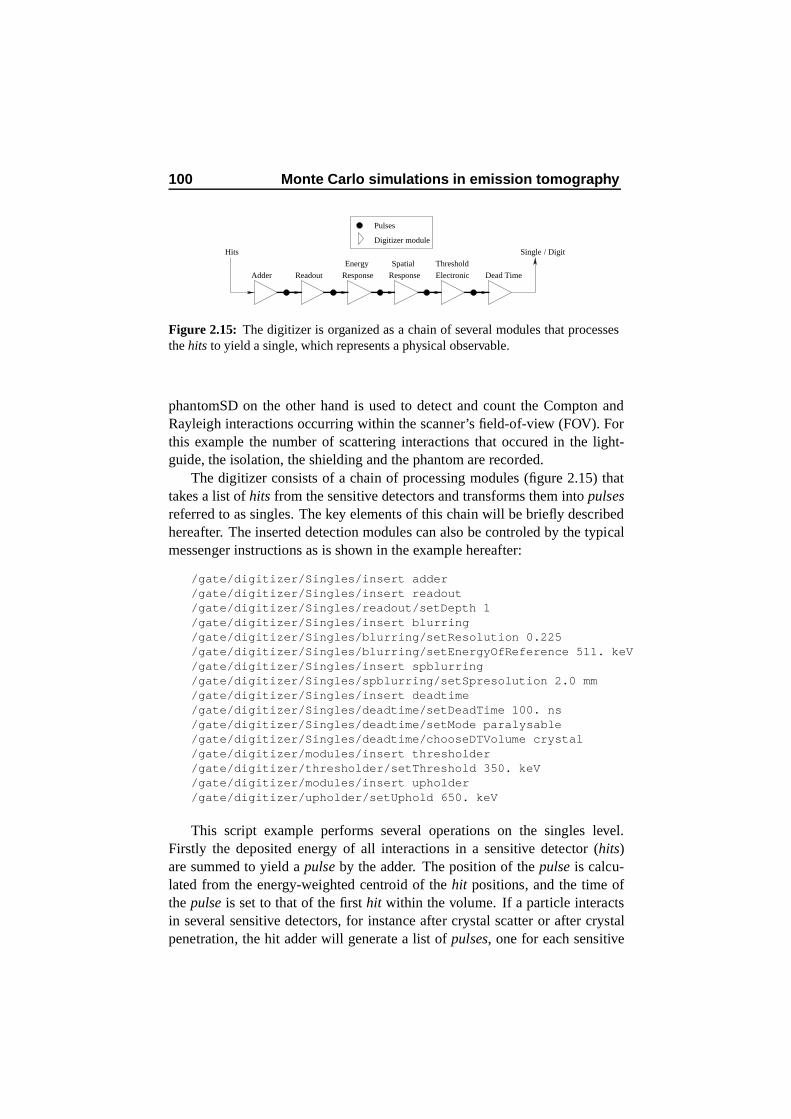
100 Monte Carlo simulations in emission tomography
Single / DigitHits
Adder Readout
Energy
Response
Spatial
Response
Threshold
Electronic Dead Time
Digitizer module
Pulses
Figure 2.15: The digitizer is organized as a chain of several modules that processesthe hits to yield a single, which represents a physical observable.
phantomSD on the other hand is used to detect and count the Compton andRayleigh interactions occurring within the scanner’s field-of-view (FOV). Forthis example the number of scattering interactions that occured in the light-guide, the isolation, the shielding and the phantom are recorded.
The digitizer consists of a chain of processing modules (figure 2.15) thattakes a list of hits from the sensitive detectors and transforms them into pulsesreferred to as singles. The key elements of this chain will be briefly describedhereafter. The inserted detection modules can also be controled by the typicalmessenger instructions as is shown in the example hereafter:
/gate/digitizer/Singles/insert adder/gate/digitizer/Singles/insert readout/gate/digitizer/Singles/readout/setDepth 1/gate/digitizer/Singles/insert blurring/gate/digitizer/Singles/blurring/setResolution 0.225/gate/digitizer/Singles/blurring/setEnergyOfReference 511. keV/gate/digitizer/Singles/insert spblurring/gate/digitizer/Singles/spblurring/setSpresolution 2.0 mm/gate/digitizer/Singles/insert deadtime/gate/digitizer/Singles/deadtime/setDeadTime 100. ns/gate/digitizer/Singles/deadtime/setMode paralysable/gate/digitizer/Singles/deadtime/chooseDTVolume crystal/gate/digitizer/modules/insert thresholder/gate/digitizer/thresholder/setThreshold 350. keV/gate/digitizer/modules/insert upholder/gate/digitizer/upholder/setUphold 650. keV
This script example performs several operations on the singles level.Firstly the deposited energy of all interactions in a sensitive detector (hits)are summed to yield a pulse by the adder. The position of the pulse is calcu-lated from the energy-weighted centroid of the hit positions, and the time ofthe pulse is set to that of the first hit within the volume. If a particle interactsin several sensitive detectors, for instance after crystal scatter or after crystalpenetration, the hit adder will generate a list of pulses, one for each sensitive
2.3. GATE, a simulation platform for SPECT and PET 101
detector. The second instruction (readout) implements the readout segmenta-tion of the scanner. The position of this pulse is set to that of the pulse fromthe adder that has the most energy (winner-takes-all paradigm).
After this adding and readout instruction the remaining commands of thescript example transform these counts into the physical observables of thescanner (i.e. singles). The blurring instruction applies a Gaussian blur to theenergy of the pulse, E, with a full width half maximum (FWHM), R × E.A simple model assumes that the FWHM energy resolution, R, is inverselyproportional to
√E parametrized by R0, the user defined FWHM energy res-
olution (22,5 % in the example) at a given energy, E0 (511 keV here). A moreelaborate model is available that propagates the relative variances of the phys-ical processes involved with light collection and detection in a spectrometricchain. The spblurring instruction applies a Gaussian blur of the position forSPECT (2 mm in the example). For PET, spatial resolution is calculated bythe pulse reader which simulates the intrinsic spatial resolution of the detector.More elaborate models are derived for continuous crystal detector PET sys-tems [103] and will be discussed in chapter 6. Both paralyzable (the detectoris dead for a period t after every event, even if the event arrives during the deadperiod of the previous event) and non-paralyzable dead times (the detector isdead for a period t after every event) can be modeled on an event-by-eventbasis. In this script example a paralysable model is chosen to implement a100 ns deadtime on the singles at the crystal level. Finally an energy discrimi-nation is performed to set an acceptance window of 350-650 keV (thresholder-upholder).
Other user defined modules can be added individually to model more spe-cific properties: time resolution, light yield, transfer and quantum efficiencyand so on. Moreover, at the end of a digitizer chain a coincidence sorter canbe added to find pairs of singles that are in coincidence (whenever the timeinterval between the singles is less than a user-defined coincidence window).Using the event number and the Compton flag, randoms and scatter events canbe differentiated from trues. Multiple coincidences and auto-coincidences arealso taken into account.
The optimization of the digitizer chain parameters is very time-consuming.This is best done by comparing the results from different sets of digitizer pa-rameters using the same series of hits. To perform this specific task, GATE of-fers an operating mode named DigiGATE. In this mode, hits are read froma data file generated by GATE and fed directly into the digitizer chain. Allconditions are kept identical in the simulations including time dependencies.
102 Monte Carlo simulations in emission tomography
2.3.4 Calculation time
An important issue of GATE Monte Carlo simulations is the computation time.Benchmark simulations were performed to estimate the simulation time forrealistic nuclear medicine setups.
For PET, a whole-body scanner was implemented, consisting of eight de-tector heads arranged within a 88 cm diameter by 40 cm axial length octagonalcylinder. Each head is made of 400 detector blocks and each block is a 5 × 5array of dual-layer LSO-BGO crystals. The heads are equipped with partialsepta that rotate in a step-and-shoot mode. The phantom in this benchmark isa 70 cm long water cylinder with one 18F (half-life = 109.8 min) and one 15O(half-life = 2.07 min) line source each with an activity of 100 kBq. The sim-ulated acquisition is 4 min in duration, which represents approximately two15O half-lives. The computing time for the PET benchmark averaged aroundtwelve hours on a 1.0 GHz processor. This results in 852 generated and trackedevents per second and 16 simulated coincidence detections per second.
For SPECT, the following typical setup was implemented: a gamma cam-era is comprised of 4 heads at 90 degrees each. All heads are identical, con-sisting of a parallel hole lead collimator (hole diameter: 0.3 cm, collimatorthickness: 3 cm, and septa thickness: 0.6 mm), a 1 cm thick NaI crystal, a2.5 cm thick back-compartment in Perspex, and a 2 cm thick lead shielding.Also, a cylindrical phantom (5 cm in diameter and 20 cm long) filled with wa-ter with an inner cylinder (2 cm in diameter, 5 cm long) filled with 30 kBq of99mTc. The phantom lies on a table (0.6 cm thick, 8 cm wide, and 34 cm long).During the simulated acquisition, the table and phantom translate together at0.04 cm/s. The simulated acquisition consists of 64 projections (16 projectionsper head), acquired along a circular orbit with a 7 cm radius of rotation and aspeed of 0.15 deg/s. Sixteen runs of 37.5 s each are performed to simulate the16 positions of the 4 gamma camera heads. Calculation time comprised elevenhours on a 1 GHz processor, this results in 417 generated and tracked eventsper second and 0.83 detections per second or 1.2 second per detection.
The reasons for the high computation time in the SPECT simulations witha collimator are fourfold. The total number of registered counts in SPECT isless than 0.02 % of the generated events because the collimator in front of thecrystal stops most of the incoming photons and registers all processes present.This effect is most pronounced in high resolution collimator variants. Sec-ondly, GATE tracks every photon through every object of the experiment, anda typical Low Energy High Resolution (LEHR) collimator for instance consistsof 161120 individual air holes. The use of parametrized replicas for the colli-mator hole arrays can speed up the simulations for certain applications. Thirdlyno variance reduction methods were used so far. We are performing research
2.4. Relevance of accurate Monte Carlo modeling in NuclearMedicine 103
on the latter two [34]. Bootstrapping and jackknifing will also be investigatedin that context. Bootstrapping is a method for estimating the sampling distribu-tion of an estimator by resampling with replacement from the original sample,for instance on list mode files. Jackknifing is a another resampling techniquewhere each event is eliminated from the list after selection [36]. Finally theemission angle was not limited into a certain range so as not to influence thescatter processes in the phantoms or the backscattering from the other detectorheads.
2.4 Relevance of accurate Monte Carlo modeling inNuclear Medicine
In the most recent review article on the relevance of accurate Monte Carlomodeling in nuclear medical imaging [141] four important application fieldswere highlighted. Moreover, Monte Carlo is the only possible approach forall applications where measurements are not feasible or where analytic modelsare not available due to the complex nature of the problem [2, 76]. Those fourmain application fields will now be discussed in detail.
2.4.1 Attenuation and scatter correction techniques
The presence of the scatter and attenuation effect in nuclear medicine imageslimits the accuracy of activity quantitation. Scatter does not produce majorartifacts comparable to attenuation but reduces contrast by including a low-frequency blur in the image. The impact of scatter generally depends on thephoton energy, camera energy resolution and energy window settings, as wellas the object shape, detector geometry and the source distribution. Many ofthese parameters are non-stationary which implies a potential difficulty whendeveloping proper scatter and attenuation correction techniques. Scatter cor-rection is not only important for quantitation but also for lesion detection andimage segmentation. Monte Carlo calculations have been found to be powerfultools to quantify and correct for photon attenuation and scattering in nuclearmedicine imaging since the user has the ability to separate the detected photonsaccording to their interaction history: primary events, scatter events, contribu-tion of downscatter events, scatter in patient or detector, etc. [144]. MonteCarlo modeling thus allows a detailed investigation of the spatial and energydistribution of Compton scatter: energy spectra, point-spread functions andscatter fractions can be simulated [107]. This would be impossible to performusing present experimental techniques, even with very good energy resolutiondetectors.
104 Monte Carlo simulations in emission tomography
Much research and development has been concentrated on scatter com-pensation for quantitative SPECT [6, 8, 9, 11]: factor analysis, dual windowmethods (DW), triple energy window (TEW) corrections, scatter line spreadfunction correction (SLSF), convolution methods (CV), etc. [23]. Attenuationand scatter correction techniques are particularly important for simultaneousemission and transmission imaging where several methods have been proposedto differentiate between the emission and attenuation source [10,42,117] sincedownscatter of the attenuation source in the emission window is an image de-grading factor when performing low- and medium-energy SPECT studies. Thesame remark is valid for downscatter of the emission source in the attenuationwindow for gamma camera PET (section 2.1.3) applications. The main ob-jective of Monte Carlo simulations is to characterize this interwindow scatterand to investigate by what parameters it is particularly influenced in order toperform a protocol optimization [106]. This will be discussed in chapter 4.
In PET some basic approaches are followed for scatter correction [58]:multi-energy window approaches, integral transformations, curve fitting,model-based approaches, and direct Monte Carlo techniques. Especially inPET, Monte Carlo simulations are important to verify which scatter order iscontributing the most in image degradation. Moreover, the relation betweenobject scatter and crystal scatter is relevant to optimally correct for scatter inan iterative algorithm [28, 108]. This will also be discussed to a larger extentin chapter 4.
2.4.2 Imaging systems and collimator design
Image formation modeling is one of the most important reasons for the exis-tence of Monte Carlo simulations in nuclear medicine. By using Monte Carlomethods, the image formation process can be assessed both qualitatively andquantitatively and Monte Carlo methods can assist in the development of newcollimator designs, new detector construction, evaluation of new electronicsand in optimization of camera motions [137]. Monte Carlo simulations wereextensively used to analyze the performance of new long bore parallel collima-tors as well as fan beam [30], cone beam and pinhole collimators [98]. For thelatter, simulations were performed with various aperture span angles, differenthole sizes and various materials to evaluate the penetration [123]. The wellknown imaging performance parameters of parallel hole collimators could becompared with those for fan beam and cone beam which have enjoyed con-siderable success for brain SPECT in recent years [84]. Monte Carlo methodsalso play an important role in new system design, for instance in the researchfield of solid state detectors with improved energy resolution and low-noise
2.4. Relevance of accurate Monte Carlo modeling in NuclearMedicine 105
electronics [43,52,104]. Chapter 5 will give a detailed discussion on the lattertwo aspects by describing the simulation of a prototype CZT design coupledto a new collimation approach aiming for a higher spatial resolution at a com-parable sensitivity. Similarly, in the PET field, Monte Carlo techniques wereused to determine the effects of several crystal materials and of interplane septawith varying constitution [53], thickness and geometry, to compare single totrue coincidence events ratios in single-slice, multi-slice and open collimator3D configurations [118], and to assess the effect of collimation on scatter frac-tion. Moreover, Monte Carlo simulations have been used in the past years tostudy potential designs of dedicated small animal positron tomographs [56,97].
2.4.3 Detector Modeling
Monte Carlo simulations of detector responses and efficiencies are extremelyimportant since the scintillation crystal is the critical component in emissiontomography. Increased light per gamma ray interaction, faster rise and decaytimes, greater stopping power and improved energy resolution are the desiredcharacteristics. Improvements in these characteristics enable detectors to bedivided in smaller elements, thus increasing resolution and minimizing deadtime losses. An important field of interest is resolution recovery in PET. Thepenetration of annihilation photons into the detector material before interactionis a statistical process which leads to significant displacement and anisotropyof the point spread function [60, 103]. Compensation for crystal penetration isthus the most important issue in order to recover the spatial resolution in PET.Theoretical models for that anisotrope spatial resolution can only be verifiedby Monte Carlo simulations since those depth of interaction (DOI) dependentexperiments are very hard to perform with current devices. In chapter 6 a com-plex mathematical model will be derived for this intrinsic spatial resolution inthe case of continuous detector PET systems. This model will be validated inthe same chapter by geometrical Monte Carlo simulations [103]. Moreover,Monte Carlo methods can assist in the design of new detectors with DOI infor-mation by simulating multilayer crystals and by estimating the gain in recon-structed resolution through incorporation of DOI information [72, 81]. MonteCarlo simulations also prove their usefulness in Time-of-Flight PET (TOF)design. They can be used to test several detector crystals and to simulate theinfluence of timing resolution on variance reduction [15, 80, 112].
2.4.4 Image reconstruction algorithms
Monte Carlo simulations have shown to be very useful for validation and com-parative evaluation of image reconstruction techniques since it is possible to
106 Monte Carlo simulations in emission tomography
obtain a reference image to which the reconstructed images should be com-pared. Another research area is Monte Carlo based reconstruction. In parallelhole collimator SPECT, image reconstruction is usually performed as a set of2D analytical or iterative reconstructions. This ignores the 3D intrinsic natureof the scatter process. Approximate analytical models to account for scatterhave been proposed [6, 8, 9, 11]. To explicitly deal with the 3D nature of theimage formation process, a simulated 3D projector modeling the 3D photonspread and thus including all image degrading effects (attenuation, scatter andcamera point spread function) can be used [39,40] in a fully 3D reconstructionalgorithm. This will be of particular interest for reconstructing SPECT projec-tion data with a severe photon spread due to a suboptimal collimator choice, aproblem that will be discussed in chapter 4. Chapter 7 will discuss the MonteCarlo based reconstruction solution for this in more detail [106]. Emphasiswill especially be on the way the storage and reconstruction time issues weresolved. Monte Carlo based reconstruction for PET is particularly interesting toperform an intrinsic resolution recovery and to incorporate intercrystal scatter.In chapter 7 it will be explained how the detector response function, dicussedin chapter 6, can be incorporated in a Monte Carlo based reconstruction, againavoiding storage and computation time issues [125].
2.4.5 Application in other domains
Monte Carlo simulations are used in dosimetry and radiotherapy research toa large extent. One application is the individual treatment planning in ra-dionuclide or radioimmunotherapy [116] where prospective dose estimates aremade in the latter by using a tracer activity of a radiolabeled antibody to ob-tain biodistribution information prior to administration of a larger therapeuticactivity. The Monte Carlo simulations return a dosimetric evaluation of thequantitative tracer distribution image. The clinical implementability of treat-ment planning algorithms will depend on the time required to generate thoseabsorbed dose estimates for each individual.
Monte Carlo simulations are also used for the evaluation of external beamradiotherapy setups [41]. A complete simulation model of the accelerator head,including scatter foil or X-ray target and flattening filter, multileaf collimator,support plates and so on, is necessary for this purpose. Hybrid devices suchas SPECT/CT and PET/CT (section 2.1.4) will allow to better delineate thePlanned Target Volume (PTV) on CT using the functional information of theregistered nuclear medicine images, thus fundamentally increasing the accu-racy. Precise Monte Carlo simulations should be used accordingly in the vir-tual treatment planning system to maintain the most precise dose estimates [25]
2.5. Conclusion and original contributions 107
and to further improve the treatment plan before sending the patients to thelinac simulator for hardware alignment. The latter is done by comparing thebeam’s eye view of the treatment simulator with the digitally reconstructedradiograph. Meanwhile the practical feasibility of the resulting beams is veri-fied. The actual treatment will only start after verification of the alignments byportal imaging. The SPECT/CT or PET/CT delineations together with the pre-cision of the dosimetric Monte Carlo simulations will thus directly influencethe accuracy of the treatment and will assist in further reducing the colateraldamage to functional organs at risk.
Another field of interest is to perform a Monte Carlo based dosimetry forbrachytherapy applications [89] to provide detailed descriptions of local doses.Hadrontherapy is a Monte Carlo assisted research area [44] where simulationsreproduce the beam-induced β+ emissions of the irradiated target nuclei alongthe beam path in order to assist to the design of in-beam PET systems withhigh sensitivity and high spatial resolution.
2.5 Conclusion and original contributions
In this chapter a short overview of nuclear medicine (SPECT, PET, gammacamera PET, hybrid devices, small animal imagers and reconstruction) wasgiven in order to set the scope of the underlying dissertation. The GATEsimulation package was introduced as an upper layer of the general-purposehigh energy physics code, Geant4. The presented implementation frameworkof GATE, to which this dissertation contributed, resulted in two peer reviewcollaboration papers [4, 68]. The clinical usefulness of GATE depends on itsability to use voxelized datasets. Therefore a clinical extension was writtenso that digital patient data can be read in by the simulator as a source distri-bution or as an attenuating geometry. This resulted in the following journalpublication [105].
A thorough literature study was presented in this chapter which highlightedfour main application fields of Monte Carlo methods in nuclear medicine imag-ing: attenuation and scatter correction techniques, imaging systems and colli-mator design, intrinsic detector modeling and Monte Carlo based reconstruc-tion. Specific research on these four topics will be presented respectively inchapter 4, 5, 6 and 7. Chapter 3 however will start with reporting the SPECTvalidation study that was performed to verify the accuracy of GATE simula-tions versus measurements on a commercial SPECT acquisition system.

108 Monte Carlo simulations in emission tomography
Chapter 3
Validation
3.1 Introduction
After the GATE simulation platform was developed, extensive validation wasneeded to verify whether all designed modules were functioning appropriatelyand whether the simulation package was accurately mimicking realistic acqui-sitions. In this chapter we present validation results of GATE based on thecomparison of simulations against experimental data, acquired with a standardSPECT camera. Photoelectric effect, Compton and Rayleigh scatter are in-cluded in simulations of the gamma transport process. The most importantcomponents of the scintillation camera were modeled: the cover, the crystal inits aluminum casing, the light guide, the PMTs, the compression plate, the airgap, the lead ending and a collimator. More specifically, a Low Energy HighResolution (LEHR) and a Medium Energy General pupose (MEGP) collima-tor were modeled as closely as possible with respect to their shape and dimen-sions. GATE is the only simulation package that allows to model a collimatorwithout using simplifying parametric models. Consequently, investigation ofall physics processes involved in the collimator such as scatter, penetration andlead fluorescence becomes possible. In this validation study, we compared thesimulated and measured energy spectra of different isotopes: 99mTc, 22Na,57Co and 67Ga. The sensitivity was evaluated by using sources at varying dis-tances from the detector surface. Scatter component analysis was performed indifferent energy windows at different distances from the detector and for dif-ferent attenuation geometries. Spatial resolution was evaluated using a99mTcsource at various distances.
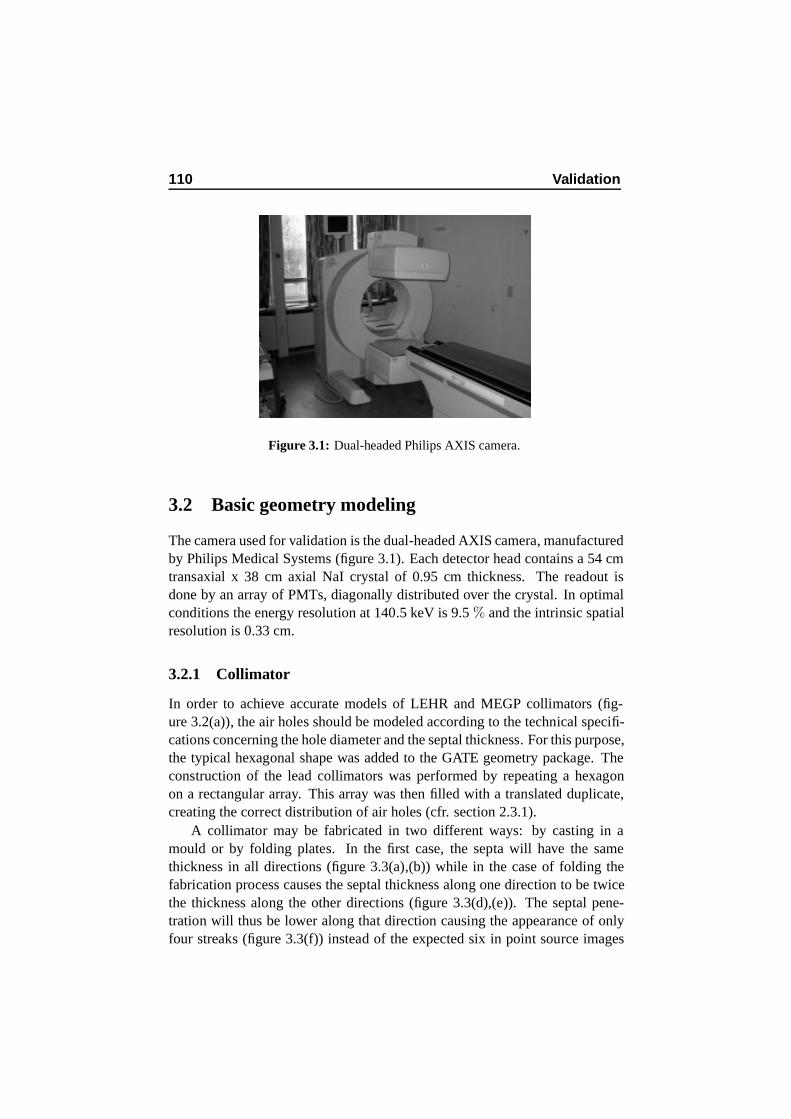
110 Validation
Figure 3.1: Dual-headed Philips AXIS camera.
3.2 Basic geometry modeling
The camera used for validation is the dual-headed AXIS camera, manufacturedby Philips Medical Systems (figure 3.1). Each detector head contains a 54 cmtransaxial x 38 cm axial NaI crystal of 0.95 cm thickness. The readout isdone by an array of PMTs, diagonally distributed over the crystal. In optimalconditions the energy resolution at 140.5 keV is 9.5 % and the intrinsic spatialresolution is 0.33 cm.
3.2.1 Collimator
In order to achieve accurate models of LEHR and MEGP collimators (fig-ure 3.2(a)), the air holes should be modeled according to the technical specifi-cations concerning the hole diameter and the septal thickness. For this purpose,the typical hexagonal shape was added to the GATE geometry package. Theconstruction of the lead collimators was performed by repeating a hexagonon a rectangular array. This array was then filled with a translated duplicate,creating the correct distribution of air holes (cfr. section 2.3.1).
A collimator may be fabricated in two different ways: by casting in amould or by folding plates. In the first case, the septa will have the samethickness in all directions (figure 3.3(a),(b)) while in the case of folding thefabrication process causes the septal thickness along one direction to be twicethe thickness along the other directions (figure 3.3(d),(e)). The septal pene-tration will thus be lower along that direction causing the appearance of onlyfour streaks (figure 3.3(f)) instead of the expected six in point source images
3.2. Basic geometry modeling 111
(figure 3.3(c)). Apart from these artefacts, the construction type also has im-plications on the energy spectrum (folding implies weaker X-ray peaks at 70-80 keV), on the sensitivity, and on the spatial resolution.
When imaging 99mTc point sources on the AXIS acquisition system withthe LEHR and MEGP collimators, we found four-streak patterns, an effect thatwas even more obvious when using 111In. With this folded collimator geom-etry incorporated in the simulator, the appropriate collimator penetration andlead-interactions were registered on the crystal, as could be concluded fromthe energy spectra around 70-80 keV (X-ray peak of lead). If we replacedthe folded collimator model by the inadequate cast model, then an overshootaround this peak would occur due to the overestimation of the septal penetra-tion along one direction. The folded construction of the collimators was con-firmed by acquiring X-ray images of their surfaces. These images were used tocomplete the specifications of the manufacturer concerning hole radius, septalthickness and collimator length for both collimators.
3.2.2 Detector head design
Figure 3.4(a) shows the detailed model of the detector head geometry start-ing from the collimator and incorporating the crystal in its casing before thelight guide, the PMTs and the compression plate, further on to the air gap, thelead ending, and the shielding. Different materials (aluminum, crown glass,NaI, lead, plastic), linked to their cross sections for photon interaction, werespecified in order to provide a realistic model for the AXIS detector head. Ad-ditionally, the polymethylmethacrylate (PMMA) plastic material was definedto model perspex phantoms, needed for evaluation purposes.
The detector head model was thus composed of an aluminum cover aroundthe NaI crystal of 54 cm x 38 cm x 0.9525 cm. A light guide made of thickcrown glass was positioned behind the embedded crystal, followed by thePMTs, modeled as realistically as feasible: glass entrance window, backpartand casings. The back compartment of the detector was ended by an aluminumcompression plate, an air gap, and a lead shielding covering all three sides ofthe detector.
Figure 3.4(b) demonstrates the relative importance of every layer in themodel at 140.5 keV by counting the scattered events in each particular part,divided by the total number of scattered events. The phantom used in thissimulation is a water filled cylinder of 20 cm in diameter, with a99mTc sourcepositioned in its center. The end parts such as light guide, PMTs, compressionplate and lead ending become more important as the photopeak energy of theisotope increases or if the crystal thickness decreases. In those cases the photon
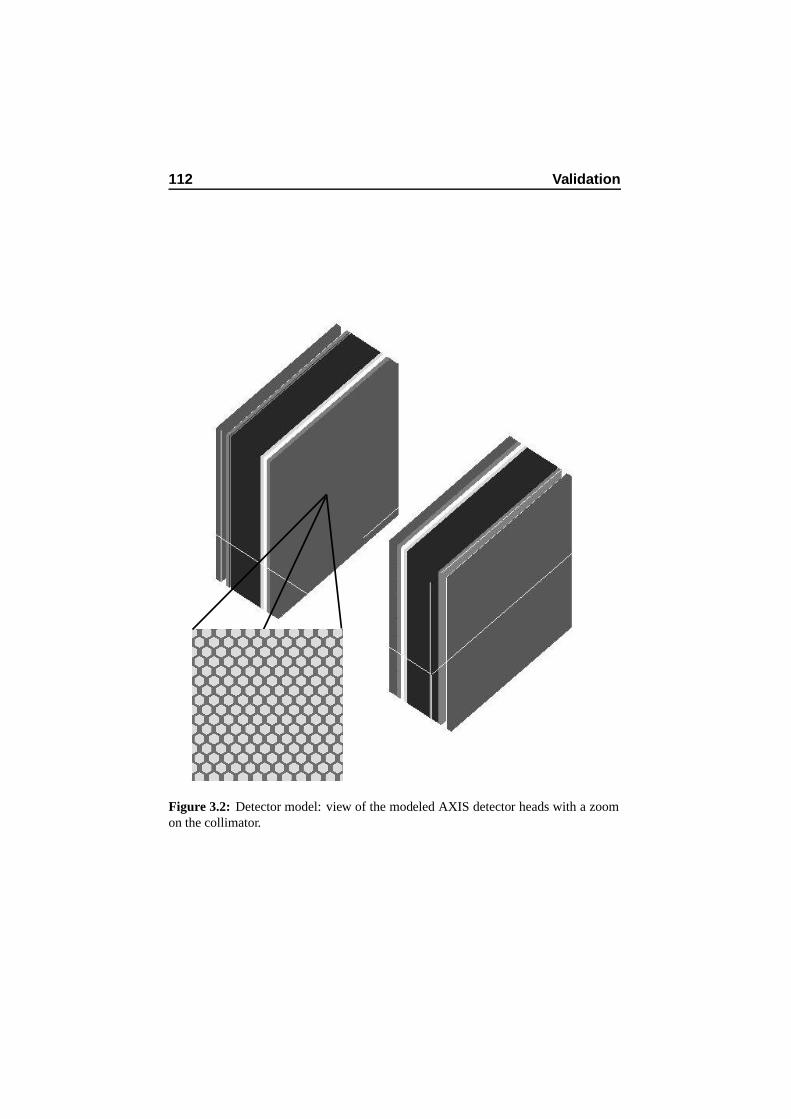
112 Validation
Figure 3.2: Detector model: view of the modeled AXIS detector heads with a zoomon the collimator.
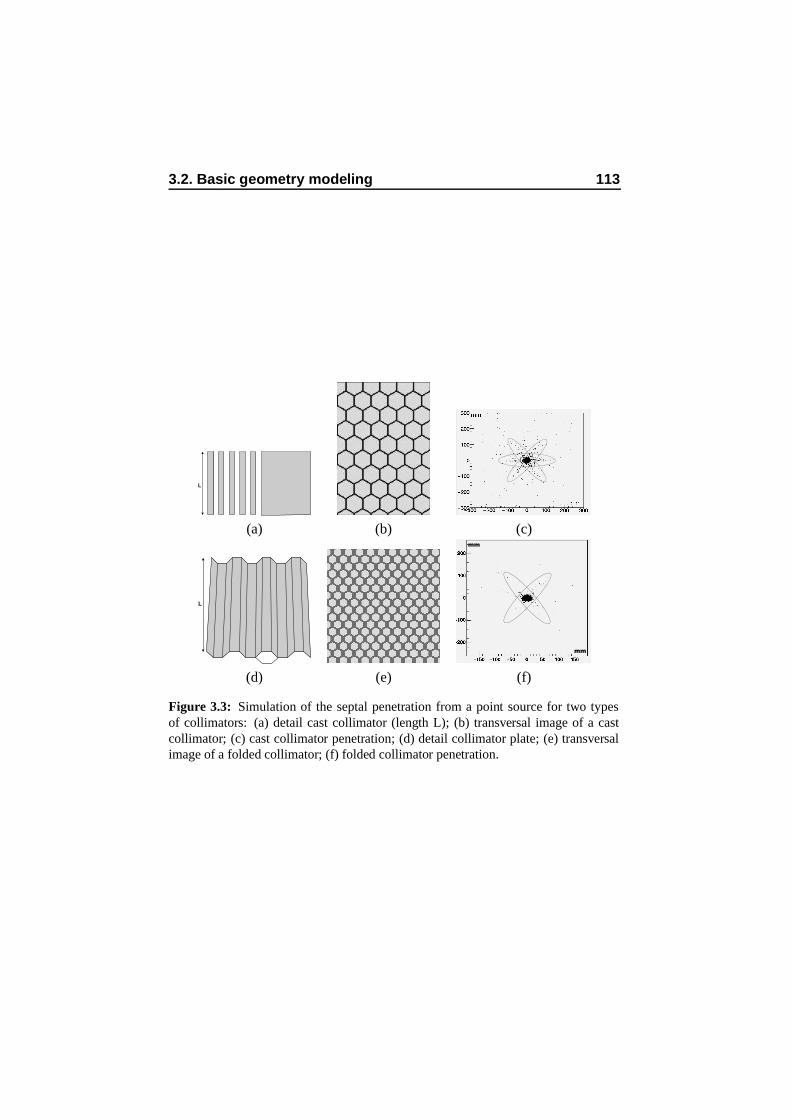
3.2. Basic geometry modeling 113
L
(a) (b) (c)
L
mm
mm
(d) (e) (f)
Figure 3.3: Simulation of the septal penetration from a point source for two typesof collimators: (a) detail cast collimator (length L); (b) transversal image of a castcollimator; (c) cast collimator penetration; (d) detail collimator plate; (e) transversalimage of a folded collimator; (f) folded collimator penetration.
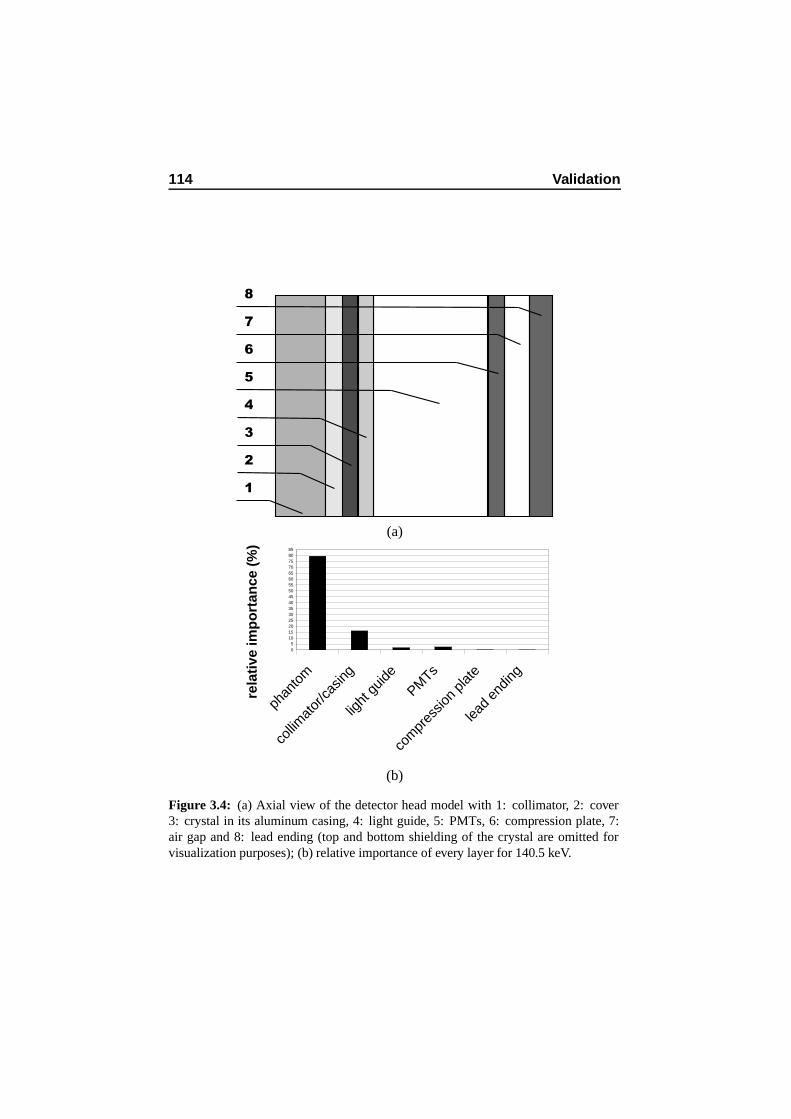
114 Validation
1
2
3
4
5
6
7
8
(a)
05
10152025303540455055606570758085
phan
tom
collim
ator
/casin
g
light
guid
e
PMTs
com
pres
sion
plate
lead
endin
g
rela
tive
imp
ort
ance
(%
)
(b)
Figure 3.4: (a) Axial view of the detector head model with 1: collimator, 2: cover3: crystal in its aluminum casing, 4: light guide, 5: PMTs, 6: compression plate, 7:air gap and 8: lead ending (top and bottom shielding of the crystal are omitted forvisualization purposes); (b) relative importance of every layer for 140.5 keV.
3.3. Energy spectra evaluation 115
flux on the end parts is larger, augmenting their relative importance. As theAXIS camera is a dual headed camera, both detector heads are modeled inthe simulations so that backscattering from one head onto the other can beincorporated, which is important for the sensitivity, spectra, scatter profiles,and for resolution analysis.
3.3 Energy spectra evaluation
3.3.1 Energy resolution module
The scintillation process and the optical photon transport were not modeledfor SPECT. An ’energy blurrer’ was used instead, introducing a Gaussian en-ergy distribution with user-defined mean and standard deviation σ. We imple-mented the energy module to obtain an energy-dependent spectral resolutionfollowing ∼ 1/
√E [99] with an overall resolution of 9.5 % at 140.5 keV, as
stated by the manufacturer for the real detector (cfr. section 2.3.3) [90]. Thebehavior of the energy blurrer for the energy resolution satisfies most needsof SPECT studies, since there is only one crystal block in SPECT, so that thescintillation photons are averaged over a high number of PMTs. Moreover,with a LEHR or MEGP collimator, all incidences are nearly perpendicular.
The energy resolution at 140.5 keV was confirmed by the following study:real data were taken with a 99mTc (peak energy at 140.5 keV) point sourceof 29 MBq, 15 cm away from the detector surface (with collimator), and theresults were compared to the energy spectrum simulated with GATE in anidentical configuration. In a second phase the same source was inserted in acylindrical water filled phantom, placed at 10 cm from the detector. The di-mensions of the Perspex cylinder were: 10.75 cm inner and 11.25 cm outerradius and 20 cm height. In both experiments 500×106 events were simu-lated. The spectrum from the Pulse Height Analyzer (PHA) of the camera wasplotted together with the simulation results, normalized to the peak height andanalyzed with ROOT [18].
In figure 3.5(a) the simulated spectrum and the acquired spectrum of a99mTc source in air at 15 cm from the detector are compared. Good agreementwas found regarding the position and height of the photopeak and of the leadpeak. Slight differences may be observed at some points but these discrepan-cies remain fairly limited. It can be concluded from the general shape align-ment that the camera is well modeled and that scatter processes in the detectorare accurately simulated. Additionally the good alignment of the 70-80 keVpeak indicates that the appropriate amount of lead X-rays are simulated. Fig-ure 3.5(b) visualizes the spectrum of a radioactive99mTc source in an attenuat-
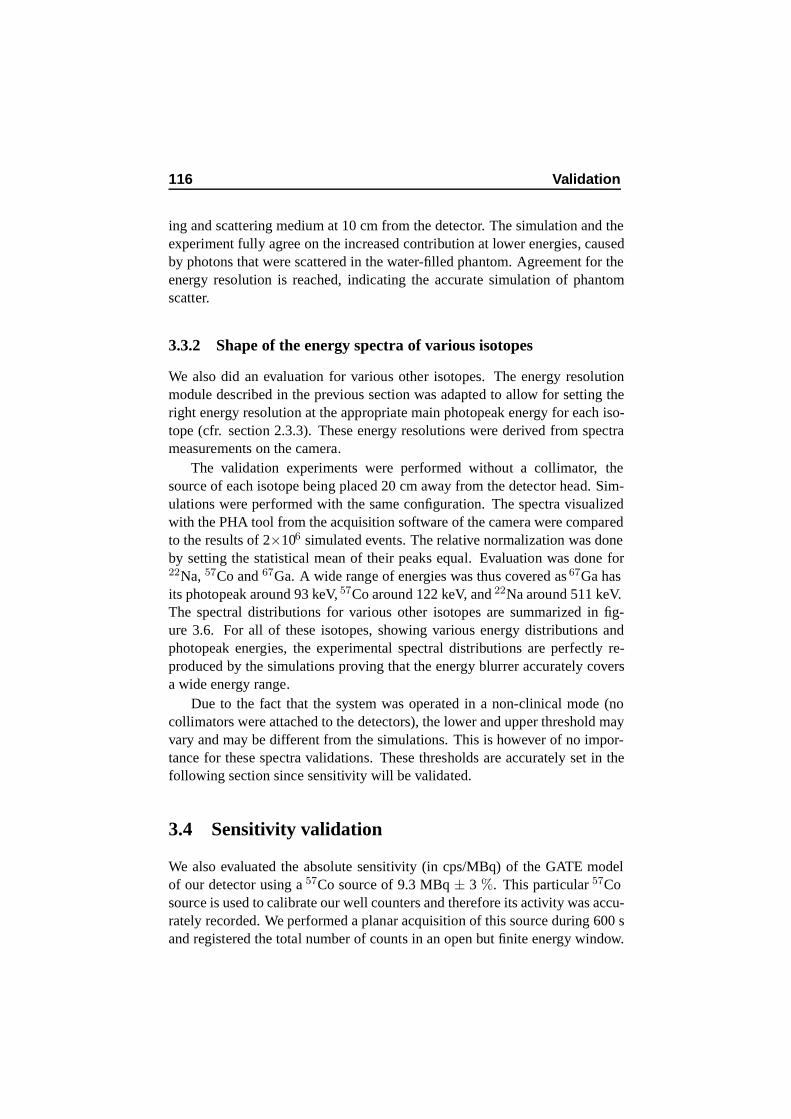
116 Validation
ing and scattering medium at 10 cm from the detector. The simulation and theexperiment fully agree on the increased contribution at lower energies, causedby photons that were scattered in the water-filled phantom. Agreement for theenergy resolution is reached, indicating the accurate simulation of phantomscatter.
3.3.2 Shape of the energy spectra of various isotopes
We also did an evaluation for various other isotopes. The energy resolutionmodule described in the previous section was adapted to allow for setting theright energy resolution at the appropriate main photopeak energy for each iso-tope (cfr. section 2.3.3). These energy resolutions were derived from spectrameasurements on the camera.
The validation experiments were performed without a collimator, thesource of each isotope being placed 20 cm away from the detector head. Sim-ulations were performed with the same configuration. The spectra visualizedwith the PHA tool from the acquisition software of the camera were comparedto the results of 2×10⁶ simulated events. The relative normalization was doneby setting the statistical mean of their peaks equal. Evaluation was done for22Na, 57Co and 67Ga. A wide range of energies was thus covered as 67Ga hasits photopeak around 93 keV, 57Co around 122 keV, and 22Na around 511 keV.The spectral distributions for various other isotopes are summarized in fig-ure 3.6. For all of these isotopes, showing various energy distributions andphotopeak energies, the experimental spectral distributions are perfectly re-produced by the simulations proving that the energy blurrer accurately coversa wide energy range.
Due to the fact that the system was operated in a non-clinical mode (nocollimators were attached to the detectors), the lower and upper threshold mayvary and may be different from the simulations. This is however of no impor-tance for these spectra validations. These thresholds are accurately set in thefollowing section since sensitivity will be validated.
3.4 Sensitivity validation
We also evaluated the absolute sensitivity (in cps/MBq) of the GATE modelof our detector using a 57Co source of 9.3 MBq ± 3 %. This particular 57Cosource is used to calibrate our well counters and therefore its activity was accu-rately recorded. We performed a planar acquisition of this source during 600 sand registered the total number of counts in an open but finite energy window.
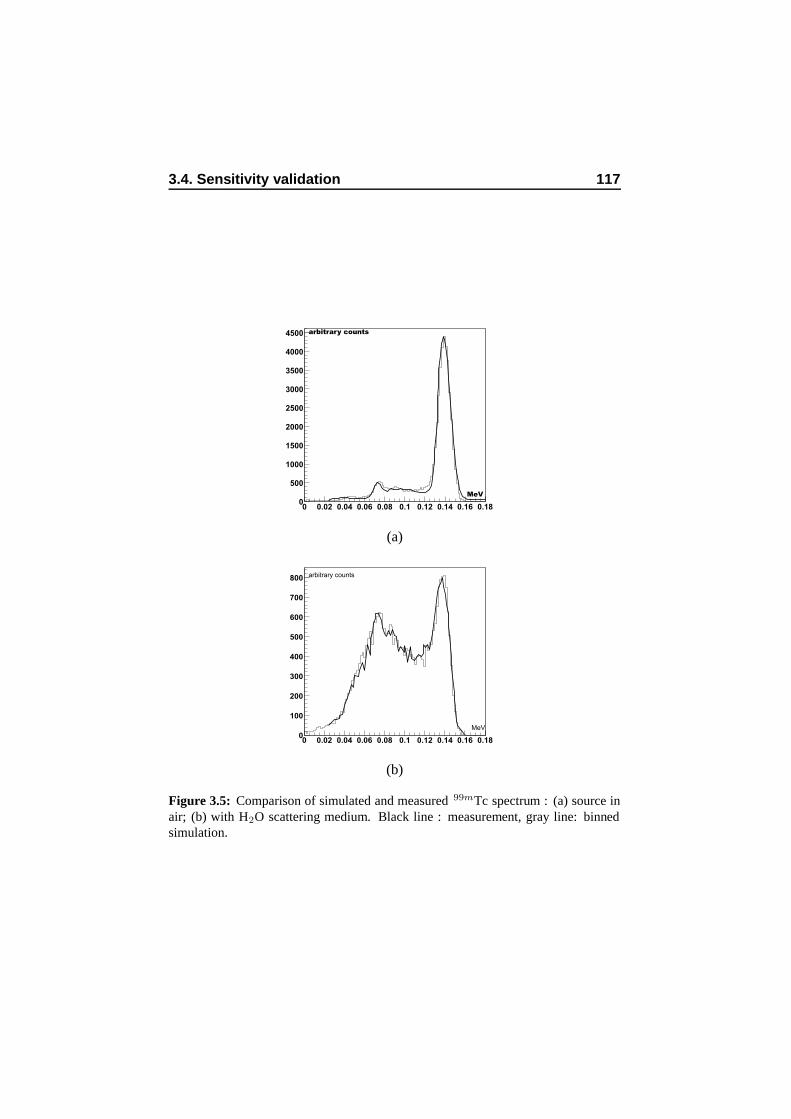
3.4. Sensitivity validation 117
arbitrary counts
MeV
0 0.02 0.04 0.06 0.08 0.1 0.12 0.14 0.16 0.180
500
1000
1500
2000
2500
3000
3500
4000
4500
(a)
arbitrary counts
MeV
0 0.02 0.04 0.06 0.08 0.1 0.12 0.14 0.16 0.180
100
200
300
400
500
600
700
800
(b)
Figure 3.5: Comparison of simulated and measured 99mTc spectrum : (a) source inair; (b) with H2O scattering medium. Black line : measurement, gray line: binnedsimulation.
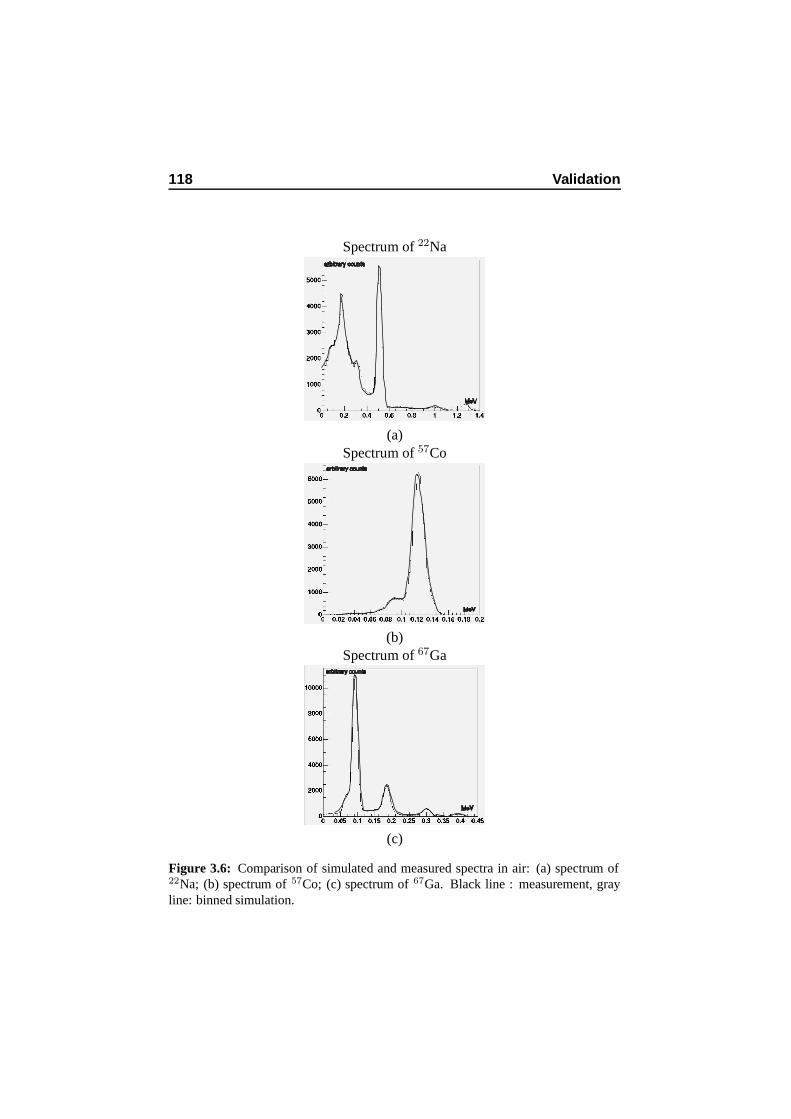
118 Validation
Spectrum of 22Na
MeV
arbitrary counts
(a)Spectrum of 57Co
MeV
arbitrary counts
(b)Spectrum of 67Ga
MeV
arbitrary counts
(c)
Figure 3.6: Comparison of simulated and measured spectra in air: (a) spectrum of22Na; (b) spectrum of 57Co; (c) spectrum of 67Ga. Black line : measurement, grayline: binned simulation.
3.4. Sensitivity validation 119
Dead time correction was not necessary because of the resulting low count rateat the detector. We simulated the same experiment with GATE.
For error bar determination we can assume both the source distribution asthe data to be Gaussian based on the central limit theorem. The convolutionof two Gaussians is a Gaussian distribution and the variance equals the sumof the variances. The absolute sensitivity measured with the57Co source wasaccordingly 231 ± 17 cps/MBq and the simulated absolute sensitivity was 246± 16 cps/MBq, showing a difference on the mean of only 6.1 % which iswithin the error bars. This small discrepancy was probably due to the lack ofknowledge on the behavior of the camera below 40 keV in the measurement.
However, in this experiment no energy windows were set and the possi-bility existed that processes were overestimated in one energy range and un-derestimated in another. So, additionally we evaluated the sensitivity in twoseparate windows to make sure that there were no errors compensating eachother in the simulations. In the first experiment we performed a static scan(with the LEHR collimator) of a point source (1 ml sphere, 2.6 MBq99mTc) atdifferent distances from the detector: 5, 15, 25, 30 cm. We acquired data in thephotopeak window (129-151 keV) and in the Compton window (92-126 keV).We set up corresponding simulations for each experiment and we comparedthe simulated and experimental sensitivities. For each simulation 150×106
events were tracked. In figure 3.7(a) the results are shown for the photopeakand the Compton window. We can conclude a good agreement between theexperiments and the simulations.
We repeated a similar experiment with the MEGP collimator where thesame source was used and acquisitions were made at 0, 15, 30, and 45 cmfrom the detector. Again the experiments were reproduced using GATE. Theresults of the MEGP experiments are shown in figure 3.7(b) where again thesensitivity in both energy windows is plotted, demonstrating a good agreementbetween simulations and reality.
We could conclude that the simulated values for both windows and forboth collimator types were equal within the error bars that arise from the un-certainty in the activity determination of the99mTc source (for the experiment)and from Poisson statistics (for the simulations). This rules out the possibilityof interwindow compensating errors and confirms a positive sensitivity valida-tion. This also supports the analysis (camera behavior < 40 keV) made for thesmall 6.1% absolute sensitivity discrepancy. Furthermore the sensitivity stayedconstant with distance, as is analytically proven for parallel hole collimators.Applying one of GATE’s dead time models in the simulations was redundantin all these low count studies.
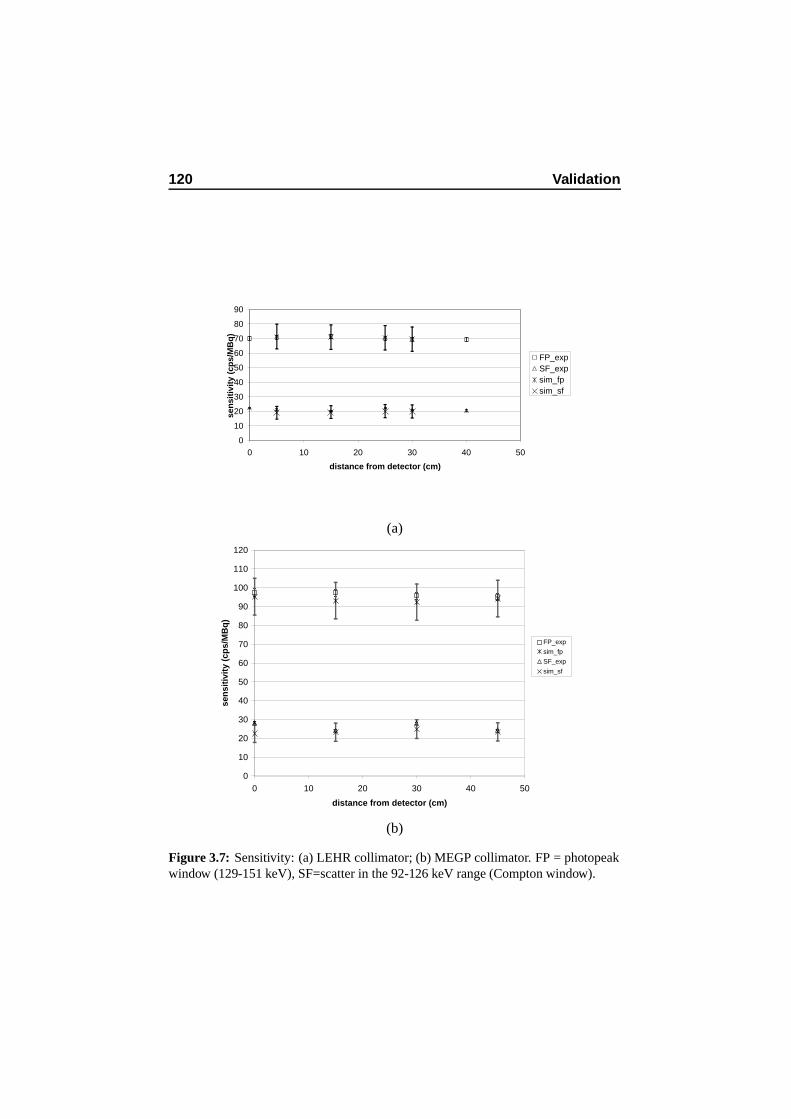
120 Validation
0
10
20
30
40
50
60
70
80
90
0 10 20 30 40 50
distance from detector (cm)
sen
siti
vity
(cp
s/M
Bq
)
FP_expSF_expsim_fpsim_sf
(a)
0
10
20
30
40
50
60
70
80
90
100
110
120
0 10 20 30 40 50
distance from detector (cm)
sen
siti
vity
(cp
s/M
Bq
)
FP_exp
sim_fp
SF_exp
sim_sf
(b)
Figure 3.7: Sensitivity: (a) LEHR collimator; (b) MEGP collimator. FP = photopeakwindow (129-151 keV), SF=scatter in the 92-126 keV range (Compton window).
3.5. Scatter profiles 121
3.5 Scatter profiles
We extended the validation by acquiring scatter profiles at different distancesfrom the detector, with and without attenuation, in the Compton (92-126 keV)and photopeak window (129-151 keV).
In the first experiment we performed a static scan of a point source (1 mlsphere, 2.6 MBq 99mTc) in air at 5, 15, 25, 30 cm from the detector with theLEHR collimator. This was done for the photopeak window and for the Comp-ton window. Simulated point spread functions of a point source in air for thephotopeak window are plotted in figure 3.8 as an indication for the effect ofdistance on the FWHM. Figure 3.9 shows the simulated and measured scatterprofiles of point sources in air for the Compton window (92-126 keV) at dif-ferent distances, thus evaluating the simulation of scatter within the detectorhead. The good sensitivity agreement in the Compton window for the LEHRand MEGP collimators (section 3.4) was a first indication of the correct simu-lation of scattered events in the collimator and in the other parts of the detectorhead as there was also no phantom present in that particular sensitivity exper-iment. The scatter profiles for the Compton window confirm this expectationas can be concluded from the good agreement between experiment and simu-lation. In a second experiment the point source was replaced by a line source(0.1 cm diameter, 10 cm long, 2MBq 99mTc) placed in a water-filled cylindri-cal phantom of 22.3 cm diameter at 10 cm from the detector heads with theLEHR collimators attached. Acquisitions were made in the photopeak win-dow at both detector heads for the line source in the center of the phantom, at1 cm, 5 cm, 10 cm, 15 cm and 20 cm depth. For each simulation 500×106
events were tracked and the simulated scatter profiles were compared with ex-perimental acquisitions through a best fit plot. This is shown in figure 3.10.
We may thus conclude that the scatter processes in the phantom are ap-propriately modeled for all cases and that the FWHM increases with depth, asexpected.
3.6 Spatial resolution comparison
A ’spatial blurrer’ module (cfr. section 2.3.3) was created to model the intrin-sic spatial resolution, caused by crystal scatter and signal readout, while theextrinsic resolution (caused by all other parts of the detector) was simulated.The spatial blurrer replaces the recorded position of every count in the crystalby a Gaussian blurred position, in the same way as explained in section 3.3.1for the energy resolution. This is a reasonable assumption, based on the factthat at 140.5 keV (99mTc was used in the following experiments) the scatter
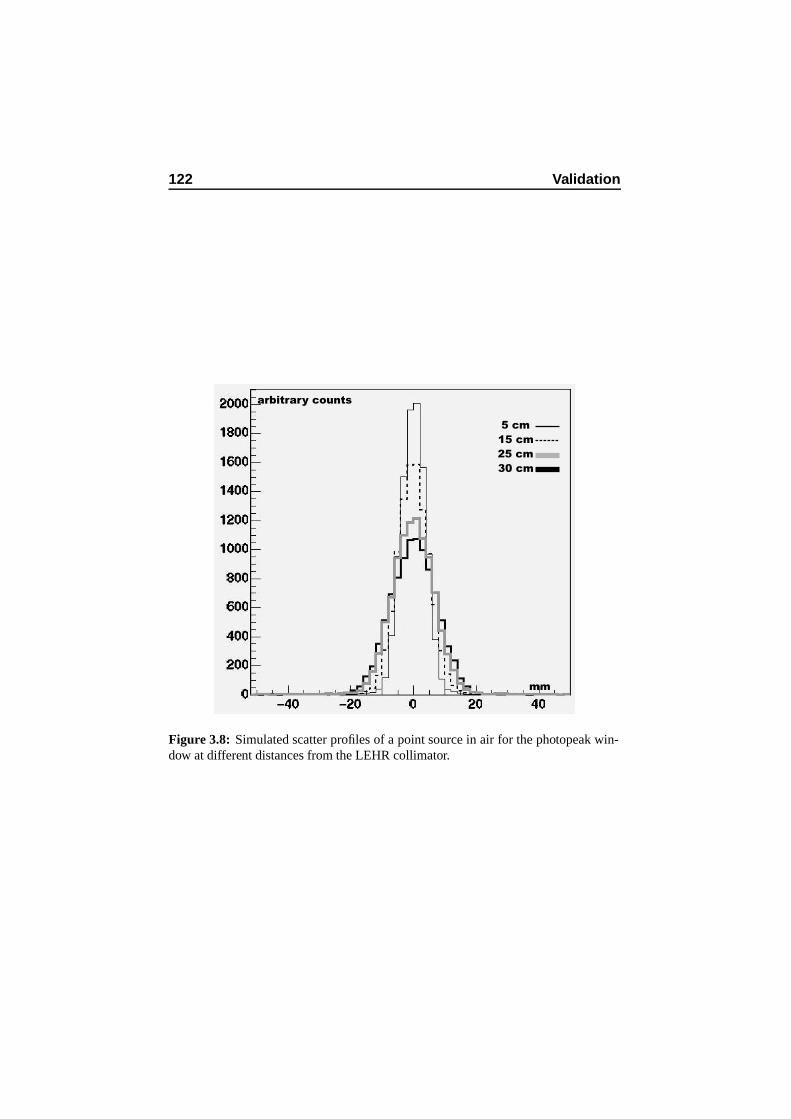
122 Validation
5 cm
15 cm
25 cm
30 cm
mm
arbitrary counts
Figure 3.8: Simulated scatter profiles of a point source in air for the photopeak win-dow at different distances from the LEHR collimator.
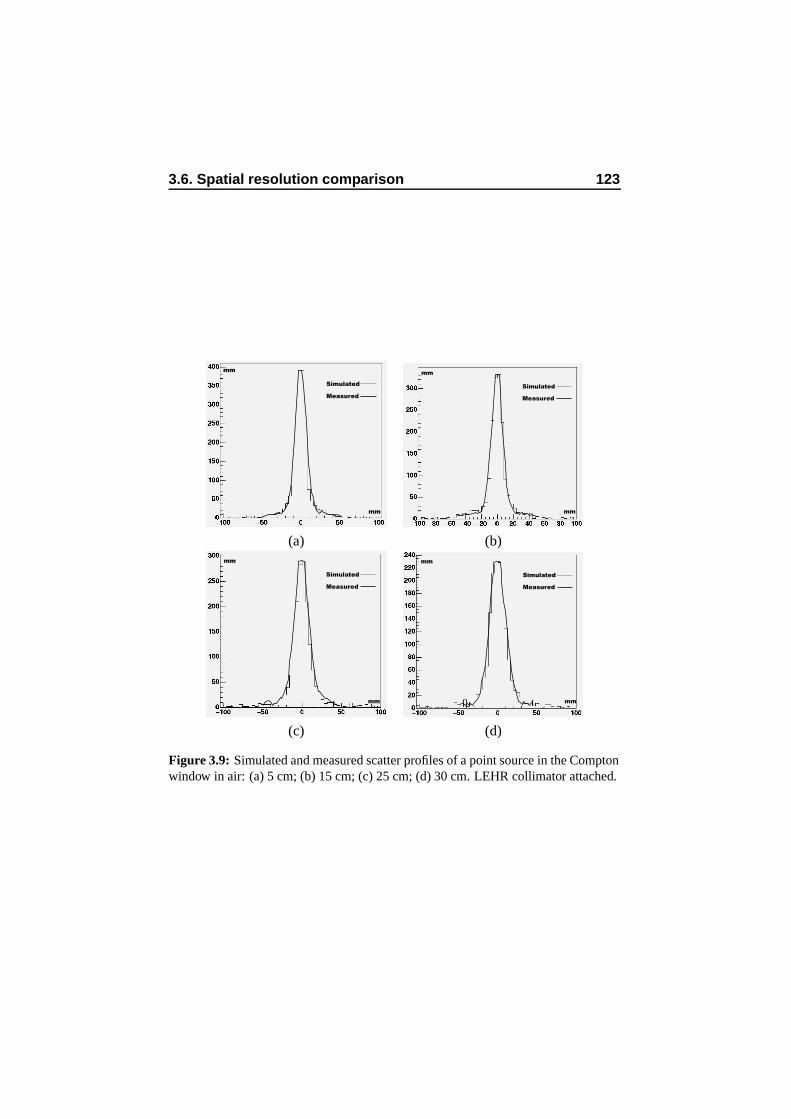
3.6. Spatial resolution comparison 123
Simulated
Measured
mm
mm
Simulated
Measured
mm
mm
(a) (b)
Simulated
Measured
mm
mm
Simulated
Measured
mm
mm
(c) (d)
Figure 3.9: Simulated and measured scatter profiles of a point source in the Comptonwindow in air: (a) 5 cm; (b) 15 cm; (c) 25 cm; (d) 30 cm. LEHR collimator attached.
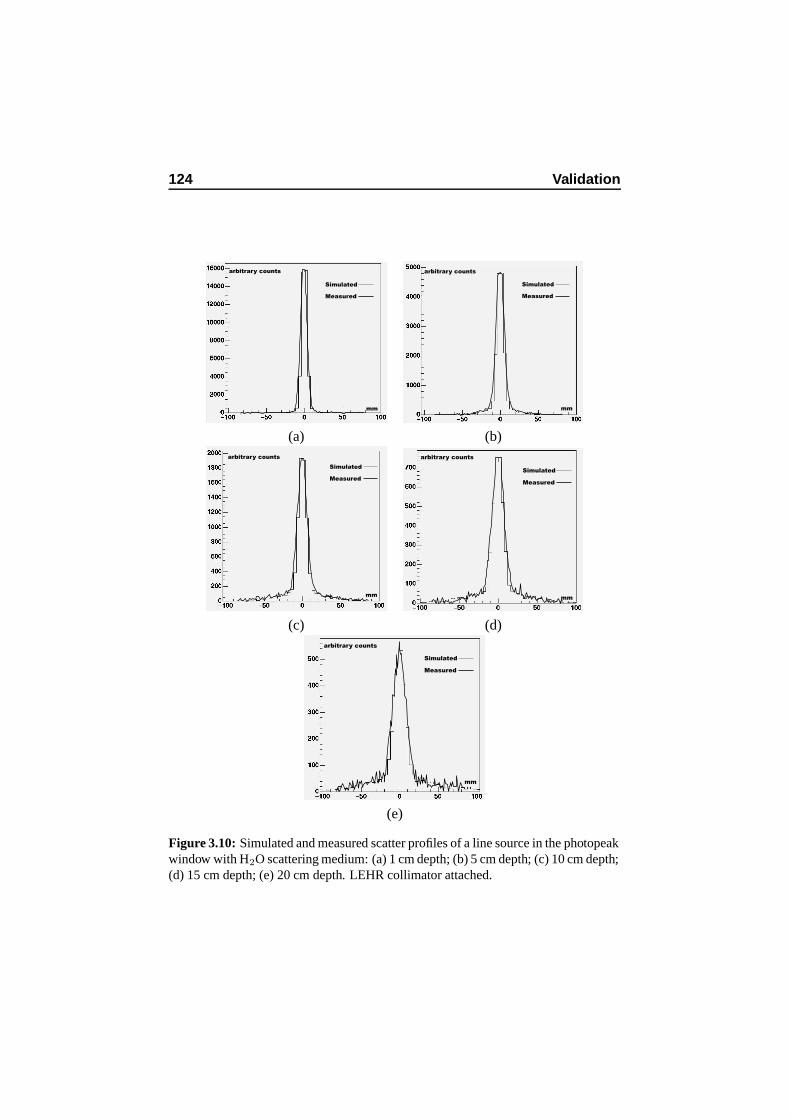
124 Validation
mm
arbitrary counts
Simulated
Measured
mm
arbitrary counts
Simulated
Measured
(a) (b)
mm
arbitrary counts
Simulated
Measured
mm
arbitrary counts
Simulated
Measured
(c) (d)
mm
arbitrary counts
Simulated
Measured
(e)
Figure 3.10: Simulated and measured scatter profiles of a line source in the photopeakwindow with H2O scattering medium: (a) 1 cm depth; (b) 5 cm depth; (c) 10 cm depth;(d) 15 cm depth; (e) 20 cm depth. LEHR collimator attached.
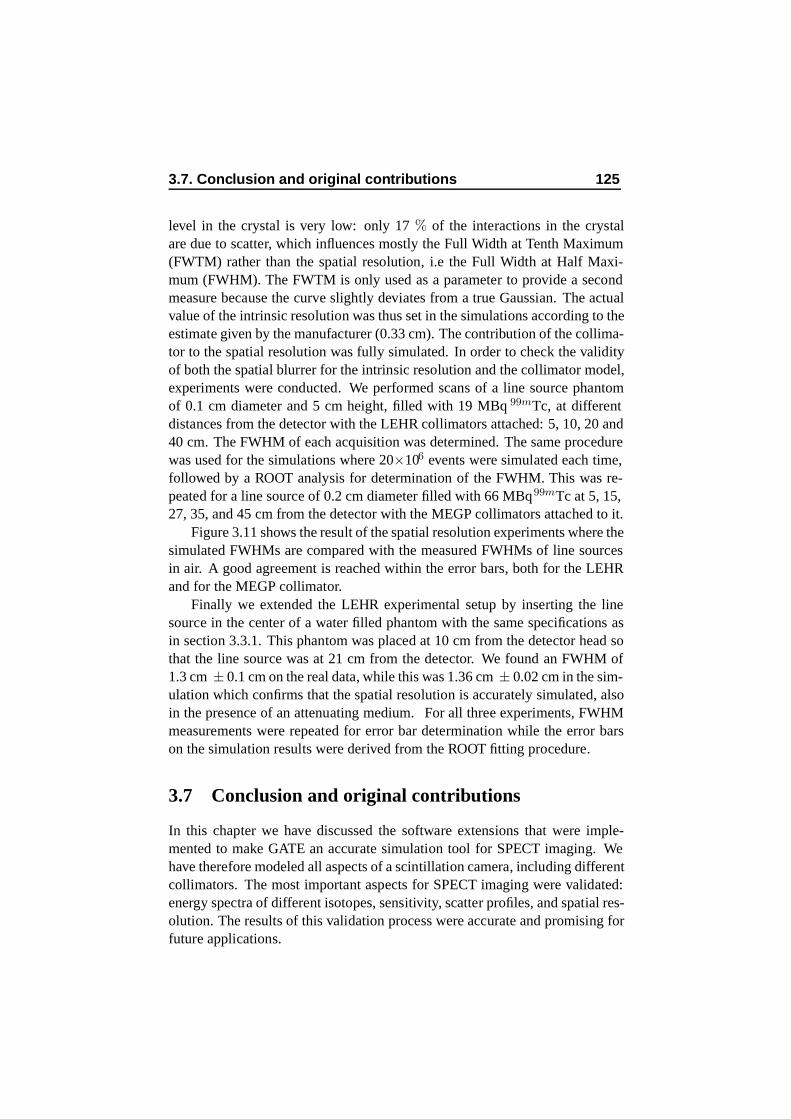
3.7. Conclusion and original contributions 125
level in the crystal is very low: only 17 % of the interactions in the crystalare due to scatter, which influences mostly the Full Width at Tenth Maximum(FWTM) rather than the spatial resolution, i.e the Full Width at Half Maxi-mum (FWHM). The FWTM is only used as a parameter to provide a secondmeasure because the curve slightly deviates from a true Gaussian. The actualvalue of the intrinsic resolution was thus set in the simulations according to theestimate given by the manufacturer (0.33 cm). The contribution of the collima-tor to the spatial resolution was fully simulated. In order to check the validityof both the spatial blurrer for the intrinsic resolution and the collimator model,experiments were conducted. We performed scans of a line source phantomof 0.1 cm diameter and 5 cm height, filled with 19 MBq 99mTc, at differentdistances from the detector with the LEHR collimators attached: 5, 10, 20 and40 cm. The FWHM of each acquisition was determined. The same procedurewas used for the simulations where 20×106 events were simulated each time,followed by a ROOT analysis for determination of the FWHM. This was re-peated for a line source of 0.2 cm diameter filled with 66 MBq99mTc at 5, 15,27, 35, and 45 cm from the detector with the MEGP collimators attached to it.
Figure 3.11 shows the result of the spatial resolution experiments where thesimulated FWHMs are compared with the measured FWHMs of line sourcesin air. A good agreement is reached within the error bars, both for the LEHRand for the MEGP collimator.
Finally we extended the LEHR experimental setup by inserting the linesource in the center of a water filled phantom with the same specifications asin section 3.3.1. This phantom was placed at 10 cm from the detector head sothat the line source was at 21 cm from the detector. We found an FWHM of1.3 cm ± 0.1 cm on the real data, while this was 1.36 cm ± 0.02 cm in the sim-ulation which confirms that the spatial resolution is accurately simulated, alsoin the presence of an attenuating medium. For all three experiments, FWHMmeasurements were repeated for error bar determination while the error barson the simulation results were derived from the ROOT fitting procedure.
3.7 Conclusion and original contributions
In this chapter we have discussed the software extensions that were imple-mented to make GATE an accurate simulation tool for SPECT imaging. Wehave therefore modeled all aspects of a scintillation camera, including differentcollimators. The most important aspects for SPECT imaging were validated:energy spectra of different isotopes, sensitivity, scatter profiles, and spatial res-olution. The results of this validation process were accurate and promising forfuture applications.
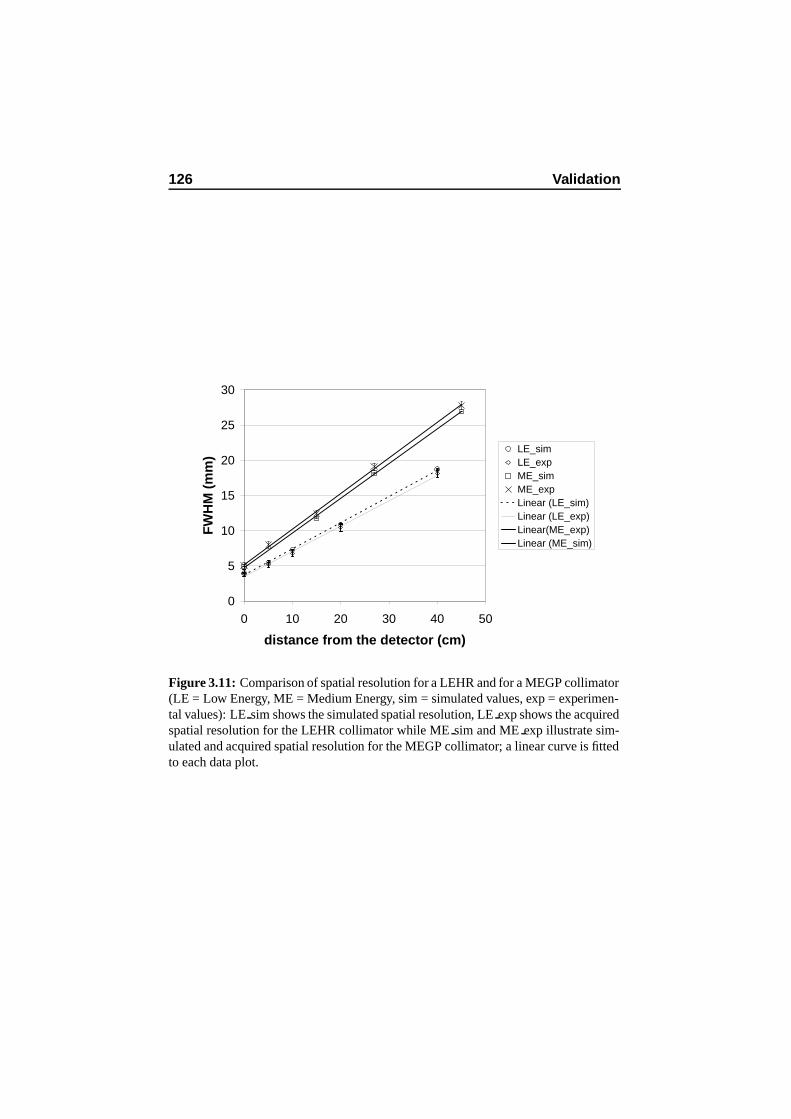
126 Validation
0
5
10
15
20
25
30
0 10 20 30 40 50
distance from the detector (cm)
FW
HM
(m
m)
LE_simLE_expME_simME_expLinear (LE_sim)Linear (LE_exp)Linear(ME_exp)Linear (ME_sim)
Figure 3.11: Comparison of spatial resolution for a LEHR and for a MEGP collimator(LE = Low Energy, ME = Medium Energy, sim = simulated values, exp = experimen-tal values): LE sim shows the simulated spatial resolution, LE exp shows the acquiredspatial resolution for the LEHR collimator while ME sim and ME exp illustrate sim-ulated and acquired spatial resolution for the MEGP collimator; a linear curve is fittedto each data plot.
3.7. Conclusion and original contributions 127
Table 3.1: The validation result summaries of commercial systems already or cur-rently considered for GATE validation in SPECT. The column labeled Agreement in-dicates the percent differences of the Figure Of Merit (FOM) between real and simu-lated data.
SPECT system Studied FOM Agreement References
IRIX, Philips None reported n/a Staelens et al [106]
AXIS, Philips Spatial resolution <5% Staelens et al [107]
Energy resolution <1%
Energy spectra visual assessment
Sensitivity <4.6%
Scatter profiles visual assessment
Solstice, Philips Sensitivity good with theoretical data Staelens et al [107]
Staelens et al [104]
Staelens et al [102]
DST Xli, GEMS Energy spectra excellent Assie et al [5]
Spatial resolution <2% in air, <12% in water
Sensitivity <4%
We believe to have demonstrated that GATE needs very little simplifica-tions when describing real camera designs. More specifically, the fact that noessential parts of the camera needed to be represented by an approximativemodel led to the possibility of using GATE for simulating existing camera se-tups in different acquisition modes with different parameters, different isotopesand different collimators.
The work described in this Chapter resulted in the first peer reviewed jour-nal publication worldwide on GATE validation [107]. Since then, many col-laboration members have extended the validation to other camera types and toother modalities such as PET and small animal imagers with reference to thisoriginal work [5, 27, 65–67, 71, 73, 87, 91, 93]. A comprehensive summary ofthe global validation effort is given in Table 3.1, 3.2 and 3.3. Ongoing work isbeing performed on the validation of GATE for dosimetric applications.

128 Validation
Table 3.2: The validation result summaries of commercial systems already or cur-rently considered for GATE validation in PET. The column labeled Agreement indi-cates the percent differences of the Figure of Merit (FOM) between real and simulateddata.
PET system Studied FOM Agreement References
ECAT EXACT HR+, CPS Spatial resolution ∼ 3% Jan et al [66]
Sensitivity <7%
Count rates good at activity
concentrations
<20 kBq/ml
Scatter fraction about 3%
Allegro, Philips Count rate <8% Lamare et al [71]
Scatter fraction 8%
GE Advance, GE MS Energy spectra qualitative Schmidtlein et al [93]
Scatter fraction <1%
MicroPET 4, Concorde Spatial resolution about 7% Jan et al [65]
Sensitivity <4%
Miniature Derenzo visual assessment
phantom
MicroPET Focus, Concorde Spatial resolution about 5% Jan et al [67]
Sensitivity about 3%
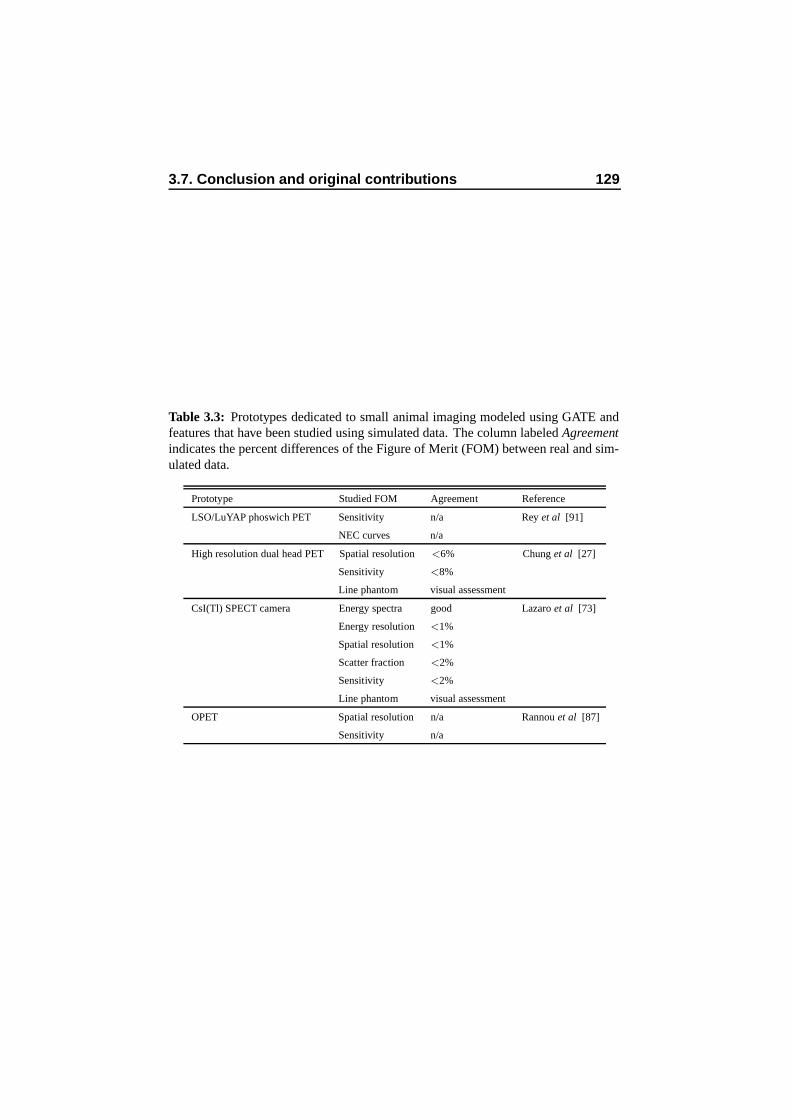
3.7. Conclusion and original contributions 129
Table 3.3: Prototypes dedicated to small animal imaging modeled using GATE andfeatures that have been studied using simulated data. The column labeled Agreementindicates the percent differences of the Figure of Merit (FOM) between real and sim-ulated data.
Prototype Studied FOM Agreement Reference
LSO/LuYAP phoswich PET Sensitivity n/a Rey et al [91]
NEC curves n/a
High resolution dual head PET Spatial resolution <6% Chung et al [27]
Sensitivity <8%
Line phantom visual assessment
CsI(Tl) SPECT camera Energy spectra good Lazaro et al [73]
Energy resolution <1%
Spatial resolution <1%
Scatter fraction <2%
Sensitivity <2%
Line phantom visual assessment
OPET Spatial resolution n/a Rannou et al [87]
Sensitivity n/a

130 Validation
Chapter 4
Attenuation and scattercorrection techniques
4.1 Introduction
Monte Carlo calculations enable the user to separate detected photons intotheir components or into their event location: primary events, scatter events,contribution of downscatter events, scatter in patient or detector, etc. MonteCarlo modeling thus allows a detailed investigation of the spatial and energydistribution of Compton scatter: energy spectra, pointspread functions andscatter fractions can be simulated as was discussed in chapter 2. In SPECT,attenuation and scatter correction techniques are particularly important for si-multaneous emission and transmission imaging where several methods havebeen proposed to differentiate between emission and attenuation source. WithSPECT/CT and PET/CT (section 2.1.4) this is intrinsically feasible, while thischapter will present guidelines for protocol optimization in simultaneous emis-sion and transmission for gamma camera PET and for SPECT as well. InPET, Monte Carlo simulations are important to verify which scatter order iscontributing the most in image degradation. Also the relation between objectscatter and crystal scatter is relevant to optimally correct for scatter in a recon-struction algorithm.
In this chapter we will discuss the latter two aspects of attenuation and scat-ter correction techniques by addressing the simultaneous emission and trans-mission scans with the Beacon transmission imaging setup and by investigatingthe relative importance of multiple patient scatter order in PET images.
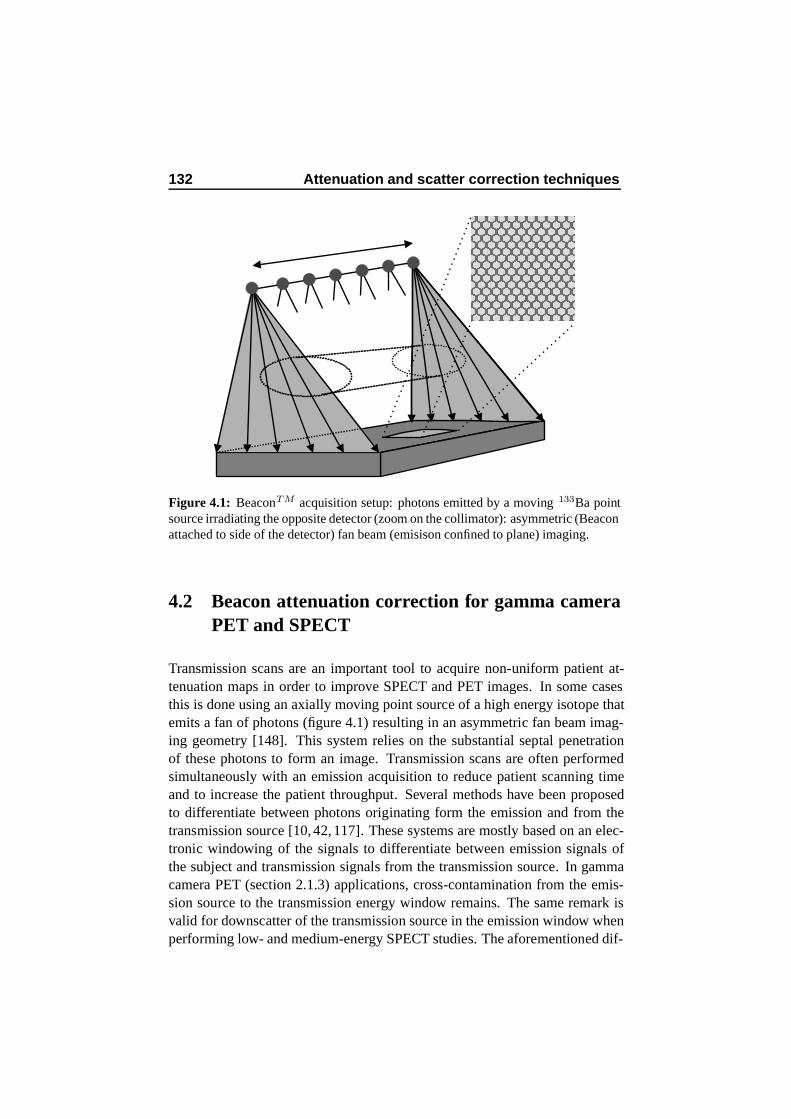
132 Attenuation and scatter correction techniques
Figure 4.1: BeaconTM acquisition setup: photons emitted by a moving 133Ba pointsource irradiating the opposite detector (zoom on the collimator): asymmetric (Beaconattached to side of the detector) fan beam (emisison confined to plane) imaging.
4.2 Beacon attenuation correction for gamma cameraPET and SPECT
Transmission scans are an important tool to acquire non-uniform patient at-tenuation maps in order to improve SPECT and PET images. In some casesthis is done using an axially moving point source of a high energy isotope thatemits a fan of photons (figure 4.1) resulting in an asymmetric fan beam imag-ing geometry [148]. This system relies on the substantial septal penetrationof these photons to form an image. Transmission scans are often performedsimultaneously with an emission acquisition to reduce patient scanning timeand to increase the patient throughput. Several methods have been proposedto differentiate between photons originating form the emission and from thetransmission source [10, 42, 117]. These systems are mostly based on an elec-tronic windowing of the signals to differentiate between emission signals ofthe subject and transmission signals from the transmission source. In gammacamera PET (section 2.1.3) applications, cross-contamination from the emis-sion source to the transmission energy window remains. The same remark isvalid for downscatter of the transmission source in the emission window whenperforming low- and medium-energy SPECT studies. The aforementioned dif-
4.2. Beacon attenuation correction for gamma camera PET andSPECT 133
ferentation methods reduce the scatter contamination to a large extent but inall cases an image degradation persists. Some manufacturers advise an ad-ditional scatter (mock) scan to estimate the remaining contamination. TheBeaconTM (Philips) device (figure 4.2) was studied in particular to evaluateour simulations. It consists of two moving 133Ba sources of 10 mCi. Whenusing the Beacon device in PET mode there are no degrees of freedom forcrystal (19 mm) and collimator. The openframe collimator. The openframecollimators allow to measure coincidences in 3D mode. The casing is plas-tic and entrance sheets made of lead, tin, copper and aluminum filter out lowenergies. The interwindow contamination was thus examined in order to de-rive possible protocol optimizations for that dedicated setup. For the case ofBeacon-SPECT, we performed multiple types of simulations including differ-ent crystal thicknesses and different collimators to evaluate the interwindowcontamination in order to propose protocol guidelines.
4.2.1 Methods
Measurements have been performed on Philips’ IRIX triple headed scintilla-tion camera. The Beacon device can also be coupled to the AXIS camera whichis a dual headed camera. Both cameras were simulated using GATE includingall processes in the collimator. An example of a realistic (AXIS) Beacon setupand its simulated counterpart is shown in figure 4.2. Figure 4.3 shows a detailof the modeled folded collimator (hypothetical hole dimensions) of the detec-tor heads described above. As described in chapter 3 GATE was validated forthe AXIS SPECT acquisition system. The code was also validated for a typicalBeacon experiment [109].
As discussed in section 2.3.2, a central virtual clock object models thepassing of time during an acquisition so that it becomes possible to simulatetime-dependent processes and keep them synchronized. It is also possible tosimulate moving sources, like the 133Ba point sources of a Beacon transmis-sion imaging device, in this case by giving a translation speed to source geom-etry elements. This particular aspect is demonstrated in figure 4.4 where thedetectors of a dual headed AXIS-camera are shown, rotating simultaneouslywith the linear movement of the 133Ba point sources that are decaying accord-ing to their simulated activity and according to the half-life of 133Ba. Thelatter physical effect is neglible since 133Ba has a half life of 10.54 year whichis useful since it avoids the replacement of the transmission source. The vir-tual clock keeps these three time-dependent processes (detector rotation, linearmovement, and decay of the 133Ba point sources) synchronized. Additionallythe virtual clock can also synchronize decay of emission sources with respect
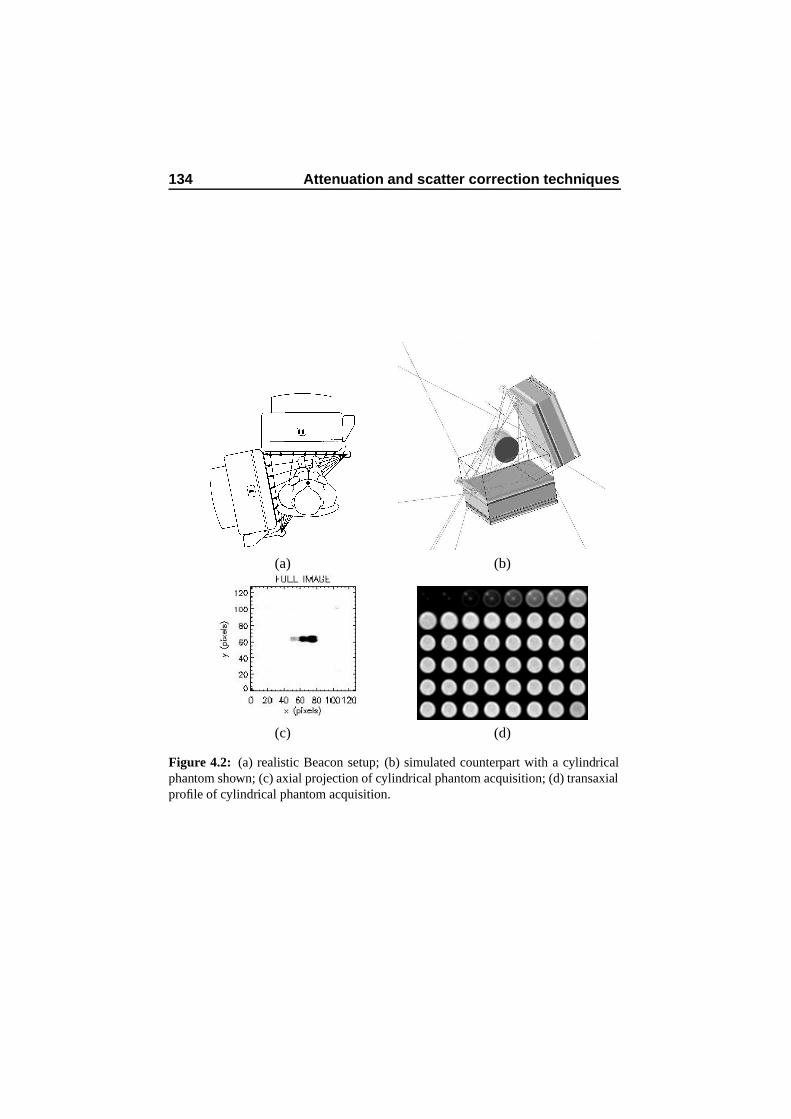
134 Attenuation and scatter correction techniques
(a) (b)
(c) (d)
Figure 4.2: (a) realistic Beacon setup; (b) simulated counterpart with a cylindricalphantom shown; (c) axial projection of cylindrical phantom acquisition; (d) transaxialprofile of cylindrical phantom acquisition.
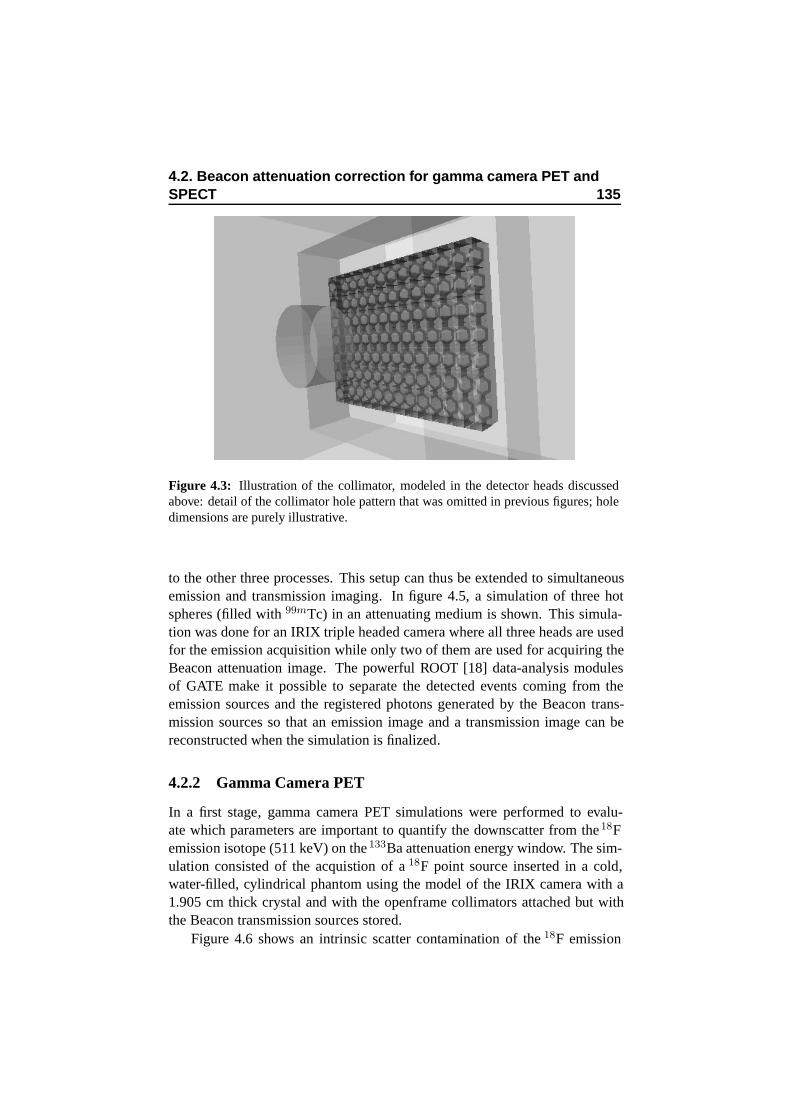
4.2. Beacon attenuation correction for gamma camera PET andSPECT 135
Figure 4.3: Illustration of the collimator, modeled in the detector heads discussedabove: detail of the collimator hole pattern that was omitted in previous figures; holedimensions are purely illustrative.
to the other three processes. This setup can thus be extended to simultaneousemission and transmission imaging. In figure 4.5, a simulation of three hotspheres (filled with 99mTc) in an attenuating medium is shown. This simula-tion was done for an IRIX triple headed camera where all three heads are usedfor the emission acquisition while only two of them are used for acquiring theBeacon attenuation image. The powerful ROOT [18] data-analysis modulesof GATE make it possible to separate the detected events coming from theemission sources and the registered photons generated by the Beacon trans-mission sources so that an emission image and a transmission image can bereconstructed when the simulation is finalized.
4.2.2 Gamma Camera PET
In a first stage, gamma camera PET simulations were performed to evalu-ate which parameters are important to quantify the downscatter from the18Femission isotope (511 keV) on the 133Ba attenuation energy window. The sim-ulation consisted of the acquistion of a 18F point source inserted in a cold,water-filled, cylindrical phantom using the model of the IRIX camera with a1.905 cm thick crystal and with the openframe collimators attached but withthe Beacon transmission sources stored.
Figure 4.6 shows an intrinsic scatter contamination of the 18F emission
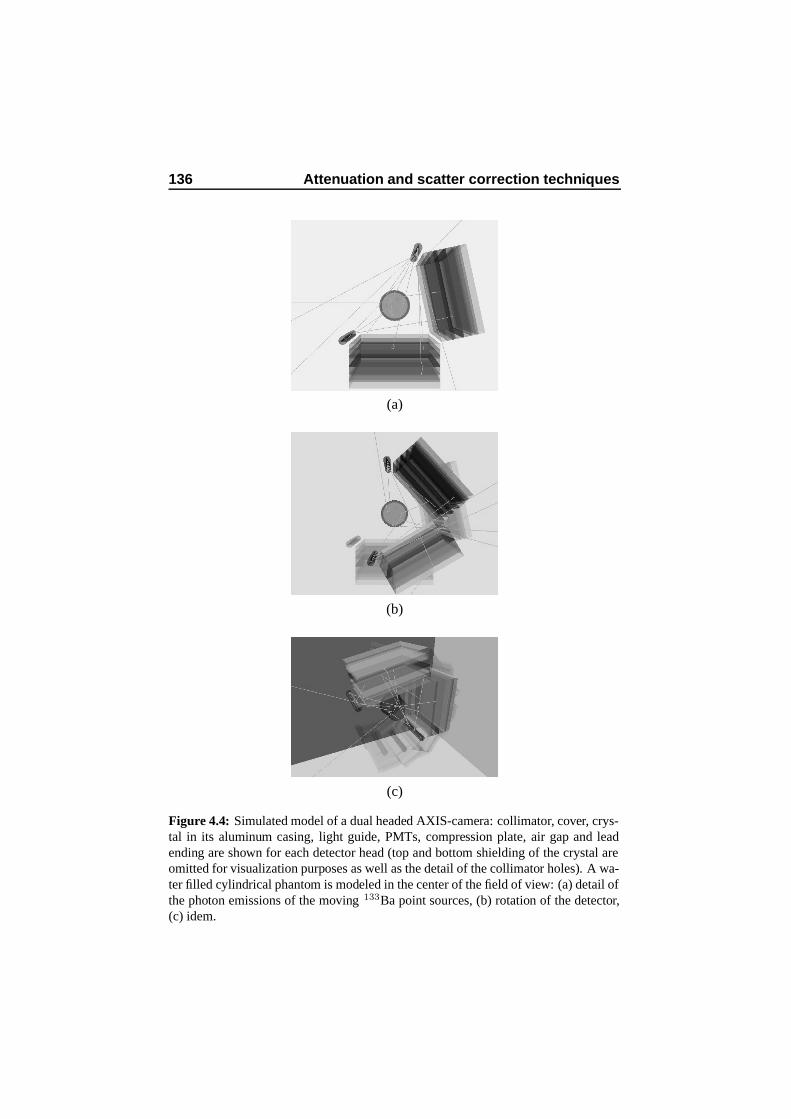
136 Attenuation and scatter correction techniques
(a)
(b)
(c)
Figure 4.4: Simulated model of a dual headed AXIS-camera: collimator, cover, crys-tal in its aluminum casing, light guide, PMTs, compression plate, air gap and leadending are shown for each detector head (top and bottom shielding of the crystal areomitted for visualization purposes as well as the detail of the collimator holes). A wa-ter filled cylindrical phantom is modeled in the center of the field of view: (a) detail ofthe photon emissions of the moving 133Ba point sources, (b) rotation of the detector,(c) idem.
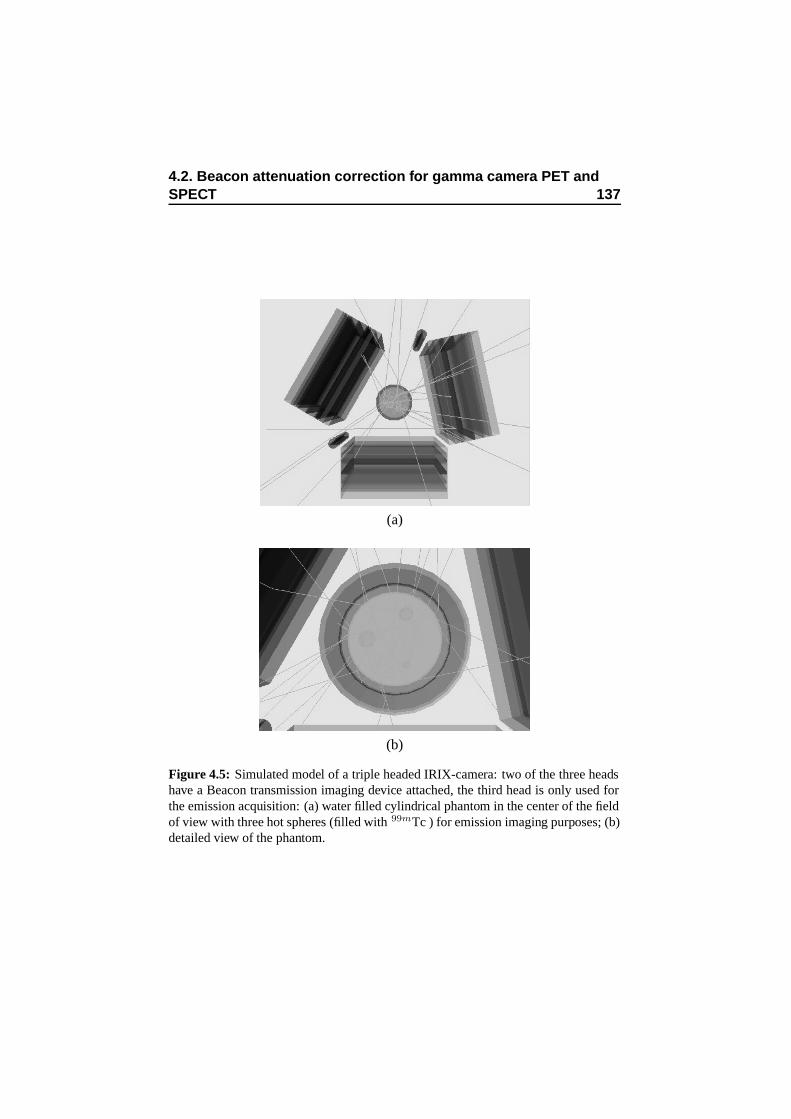
4.2. Beacon attenuation correction for gamma camera PET andSPECT 137
(a)
(b)
Figure 4.5: Simulated model of a triple headed IRIX-camera: two of the three headshave a Beacon transmission imaging device attached, the third head is only used forthe emission acquisition: (a) water filled cylindrical phantom in the center of the fieldof view with three hot spheres (filled with 99mTc ) for emission imaging purposes; (b)detailed view of the phantom.
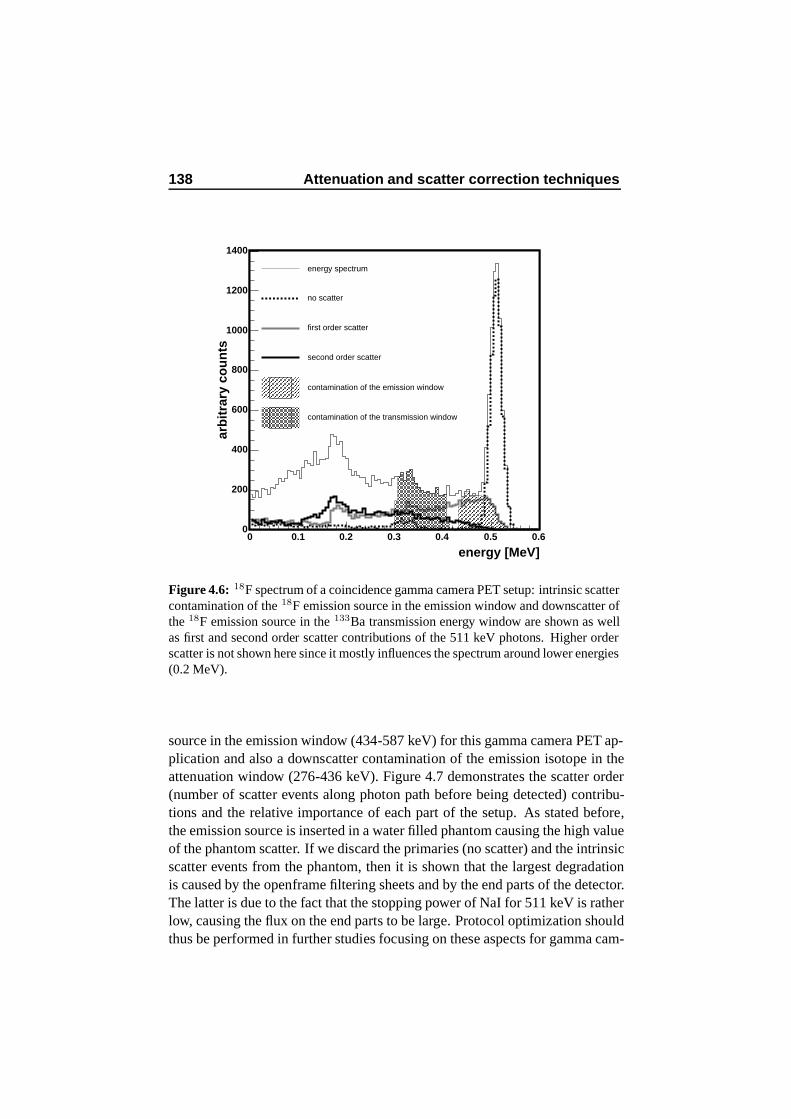
138 Attenuation and scatter correction techniques
energy [MeV]0 0.1 0.2 0.3 0.4 0.5 0.6
arb
itra
ry c
ou
nts
0
200
400
600
800
1000
1200
1400
energy spectrum
no scatter
first order scatter
second order scatter
contamination of the emission window
contamination of the transmission window
Figure 4.6: 18F spectrum of a coincidence gamma camera PET setup: intrinsic scattercontamination of the 18F emission source in the emission window and downscatter ofthe 18F emission source in the 133Ba transmission energy window are shown as wellas first and second order scatter contributions of the 511 keV photons. Higher orderscatter is not shown here since it mostly influences the spectrum around lower energies(0.2 MeV).
source in the emission window (434-587 keV) for this gamma camera PET ap-plication and also a downscatter contamination of the emission isotope in theattenuation window (276-436 keV). Figure 4.7 demonstrates the scatter order(number of scatter events along photon path before being detected) contribu-tions and the relative importance of each part of the setup. As stated before,the emission source is inserted in a water filled phantom causing the high valueof the phantom scatter. If we discard the primaries (no scatter) and the intrinsicscatter events from the phantom, then it is shown that the largest degradationis caused by the openframe filtering sheets and by the end parts of the detector.The latter is due to the fact that the stopping power of NaI for 511 keV is ratherlow, causing the flux on the end parts to be large. Protocol optimization shouldthus be performed in further studies focusing on these aspects for gamma cam-
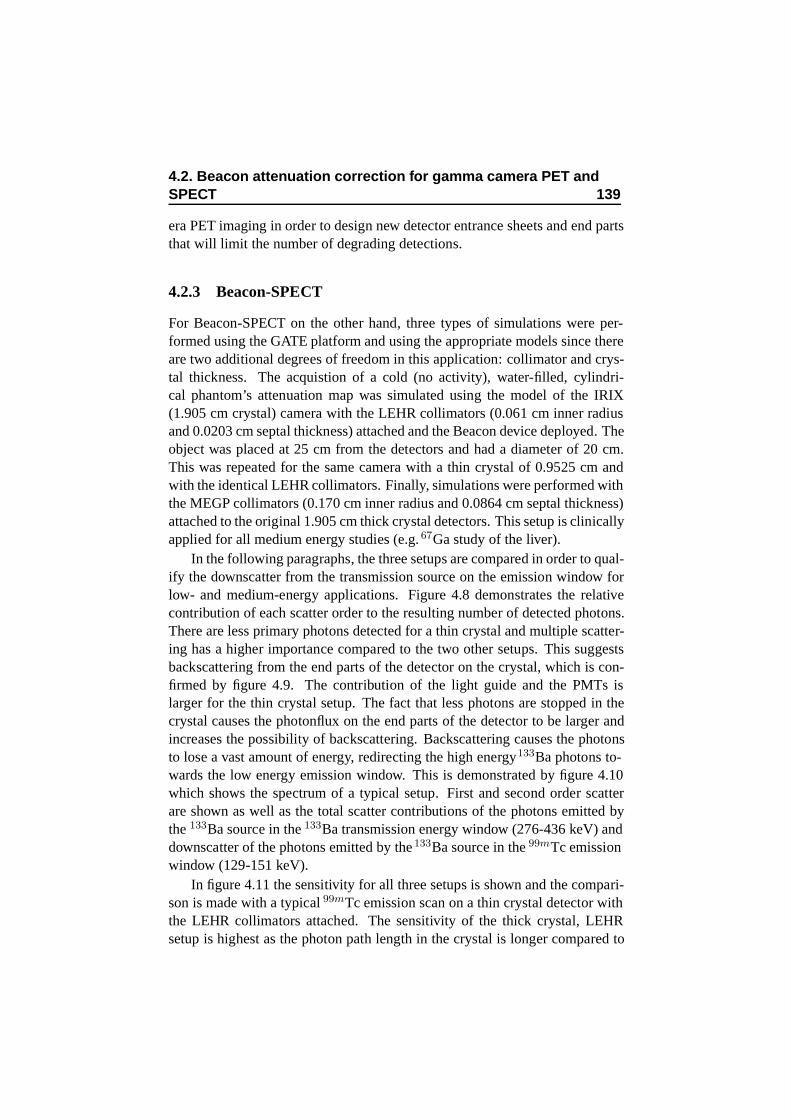
4.2. Beacon attenuation correction for gamma camera PET andSPECT 139
era PET imaging in order to design new detector entrance sheets and end partsthat will limit the number of degrading detections.
4.2.3 Beacon-SPECT
For Beacon-SPECT on the other hand, three types of simulations were per-formed using the GATE platform and using the appropriate models since thereare two additional degrees of freedom in this application: collimator and crys-tal thickness. The acquistion of a cold (no activity), water-filled, cylindri-cal phantom’s attenuation map was simulated using the model of the IRIX(1.905 cm crystal) camera with the LEHR collimators (0.061 cm inner radiusand 0.0203 cm septal thickness) attached and the Beacon device deployed. Theobject was placed at 25 cm from the detectors and had a diameter of 20 cm.This was repeated for the same camera with a thin crystal of 0.9525 cm andwith the identical LEHR collimators. Finally, simulations were performed withthe MEGP collimators (0.170 cm inner radius and 0.0864 cm septal thickness)attached to the original 1.905 cm thick crystal detectors. This setup is clinicallyapplied for all medium energy studies (e.g. 67Ga study of the liver).
In the following paragraphs, the three setups are compared in order to qual-ify the downscatter from the transmission source on the emission window forlow- and medium-energy applications. Figure 4.8 demonstrates the relativecontribution of each scatter order to the resulting number of detected photons.There are less primary photons detected for a thin crystal and multiple scatter-ing has a higher importance compared to the two other setups. This suggestsbackscattering from the end parts of the detector on the crystal, which is con-firmed by figure 4.9. The contribution of the light guide and the PMTs islarger for the thin crystal setup. The fact that less photons are stopped in thecrystal causes the photonflux on the end parts of the detector to be larger andincreases the possibility of backscattering. Backscattering causes the photonsto lose a vast amount of energy, redirecting the high energy133Ba photons to-wards the low energy emission window. This is demonstrated by figure 4.10which shows the spectrum of a typical setup. First and second order scatterare shown as well as the total scatter contributions of the photons emitted bythe 133Ba source in the 133Ba transmission energy window (276-436 keV) anddownscatter of the photons emitted by the 133Ba source in the 99mTc emissionwindow (129-151 keV).
In figure 4.11 the sensitivity for all three setups is shown and the compari-son is made with a typical 99mTc emission scan on a thin crystal detector withthe LEHR collimators attached. The sensitivity of the thick crystal, LEHRsetup is highest as the photon path length in the crystal is longer compared to

140 Attenuation and scatter correction techniques
0
5
10
15
20
25
30
0 1 2 3 4 5 6 7 8
scatter order
frac
tio
n (
%)
irix-coinc
(a)
0
5
10
15
20
25
30
no sc
atte
r
open
fram
e
light
guid
e
PMTs
com
pres
sion
lead
endin
g
phan
tom
rela
tive
imp
ort
ance
(%
)
irix-coinc
(b)
Figure 4.7: Gamma Camera PET setup: thick crystal, openframe collimators : (a)scatter order and (b) relative importance of each detector part by counting the scatteredevents in each particular part, divided by the total number of detected events.
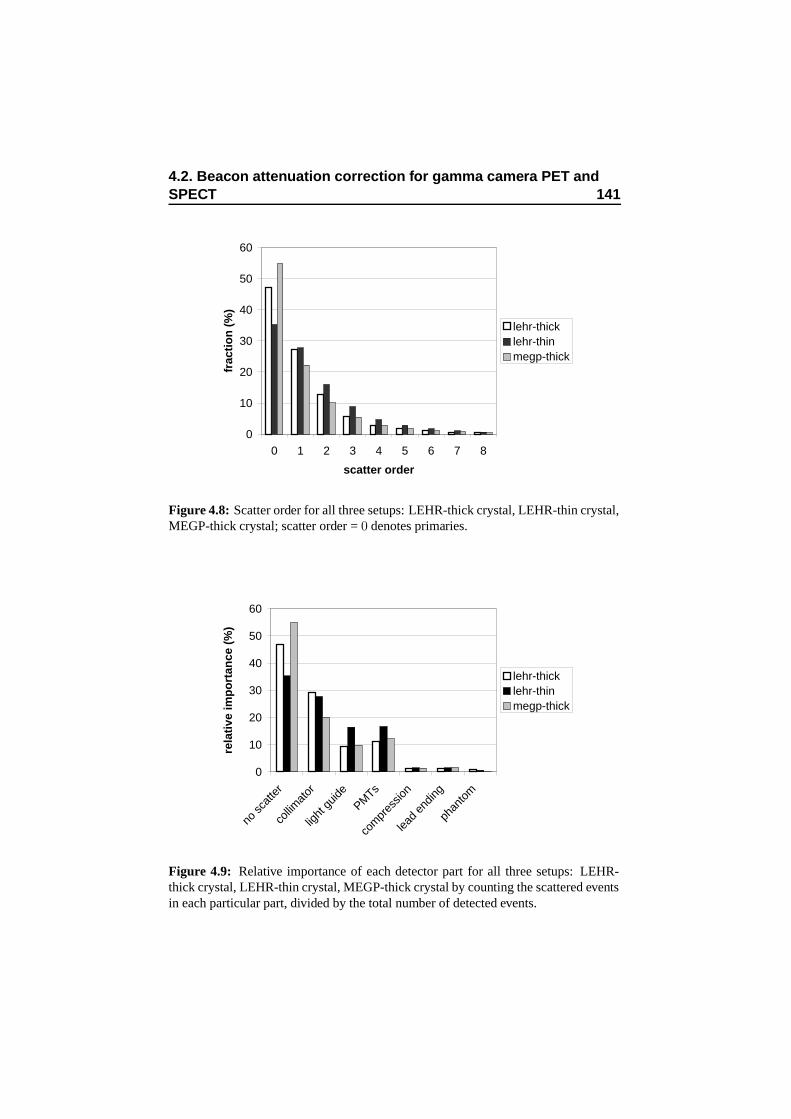
4.2. Beacon attenuation correction for gamma camera PET andSPECT 141
0
10
20
30
40
50
60
0 1 2 3 4 5 6 7 8
scatter order
frac
tio
n (
%)
lehr-thicklehr-thinmegp-thick
Figure 4.8: Scatter order for all three setups: LEHR-thick crystal, LEHR-thin crystal,MEGP-thick crystal; scatter order = 0 denotes primaries.
0
10
20
30
40
50
60
no sc
atte
r
collim
ator
light
guid
e
PMTs
com
pres
sion
lead
endin
g
phan
tom
rela
tive
imp
ort
ance
(%
)
lehr-thicklehr-thinmegp-thick
Figure 4.9: Relative importance of each detector part for all three setups: LEHR-thick crystal, LEHR-thin crystal, MEGP-thick crystal by counting the scattered eventsin each particular part, divided by the total number of detected events.
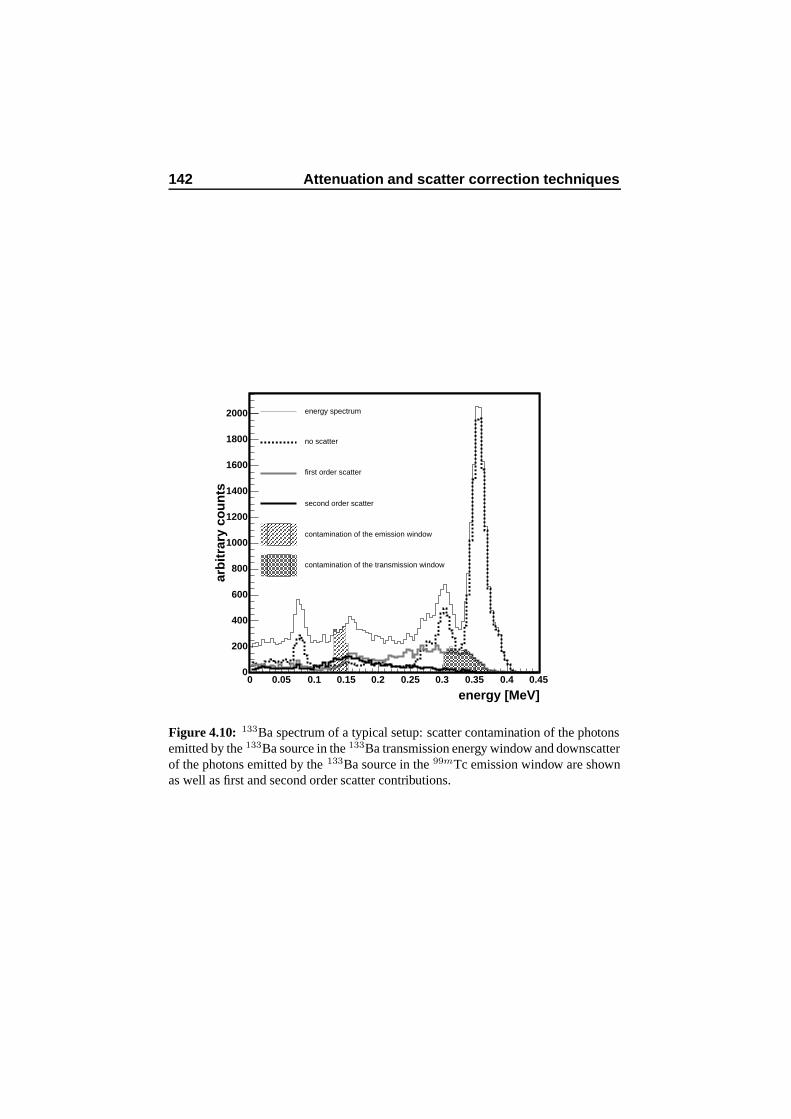
142 Attenuation and scatter correction techniques
energy [MeV]0 0.05 0.1 0.15 0.2 0.25 0.3 0.35 0.4 0.45
arb
itra
ry c
ou
nts
0
200
400
600
800
1000
1200
1400
1600
1800
2000 energy spectrum
no scatter
first order scatter
second order scatter
contamination of the emission window
contamination of the transmission window
Figure 4.10: 133Ba spectrum of a typical setup: scatter contamination of the photonsemitted by the 133Ba source in the 133Ba transmission energy window and downscatterof the photons emitted by the 133Ba source in the 99mTc emission window are shownas well as first and second order scatter contributions.
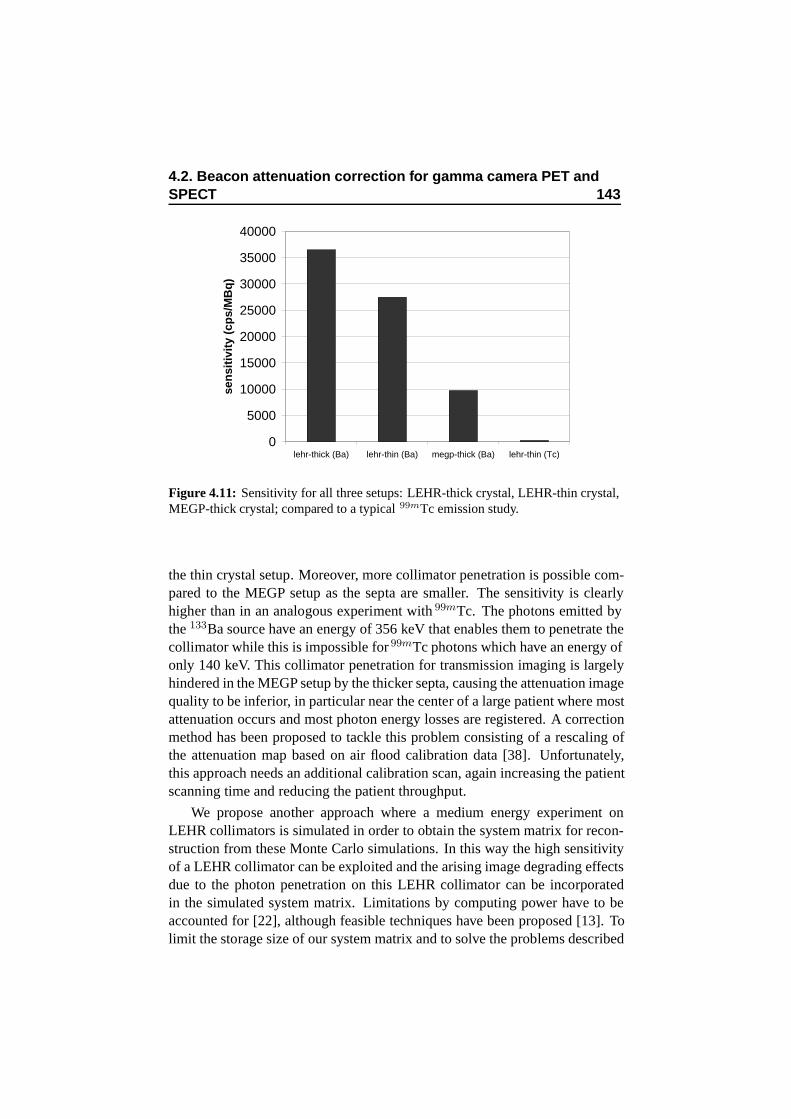
4.2. Beacon attenuation correction for gamma camera PET andSPECT 143
0
5000
10000
15000
20000
25000
30000
35000
40000
lehr-thick (Ba) lehr-thin (Ba) megp-thick (Ba) lehr-thin (Tc)
sen
siti
vity
(cp
s/M
Bq
)
Figure 4.11: Sensitivity for all three setups: LEHR-thick crystal, LEHR-thin crystal,MEGP-thick crystal; compared to a typical 99mTc emission study.
the thin crystal setup. Moreover, more collimator penetration is possible com-pared to the MEGP setup as the septa are smaller. The sensitivity is clearlyhigher than in an analogous experiment with 99mTc. The photons emitted bythe 133Ba source have an energy of 356 keV that enables them to penetrate thecollimator while this is impossible for 99mTc photons which have an energy ofonly 140 keV. This collimator penetration for transmission imaging is largelyhindered in the MEGP setup by the thicker septa, causing the attenuation imagequality to be inferior, in particular near the center of a large patient where mostattenuation occurs and most photon energy losses are registered. A correctionmethod has been proposed to tackle this problem consisting of a rescaling ofthe attenuation map based on air flood calibration data [38]. Unfortunately,this approach needs an additional calibration scan, again increasing the patientscanning time and reducing the patient throughput.
We propose another approach where a medium energy experiment onLEHR collimators is simulated in order to obtain the system matrix for recon-struction from these Monte Carlo simulations. In this way the high sensitivityof a LEHR collimator can be exploited and the arising image degrading effectsdue to the photon penetration on this LEHR collimator can be incorporatedin the simulated system matrix. Limitations by computing power have to beaccounted for [22], although feasible techniques have been proposed [13]. Tolimit the storage size of our system matrix and to solve the problems described
144 Attenuation and scatter correction techniques
in [22] the simulated system matrix can be used in a natural pixel based re-construction [59, 125] or the image matrix can be bilinearly rotated in orderto apply an averaged system response blur. In the latter way it remains pos-sible to include attenuation in the reconstruction which is not the case at firstsight for natural pixel based SPECT reconstruction. We succeeded in solvingthese issues and in implementing a dedicated Monte Carlo based reconstruc-tion. Incorporating Monte Carlo information in the reconstruction results in animpressive resolution recovery if the LEHR collimator is used and cancels outthe medium energy photon spread. This recovery performance is inferior forthe MEGP collimator where the individual hole positions become importantgiven their size, since this is not accounted for in an averaged system response.In all cases the reconstruction of medium energy isotopes on LEHR gives thebest result, provided that the system response is fully simulated and incorpo-rated. This will be discussed in further detail in Chapter 7. We will show thatit is recommendable to replace the MEGP collimators by the LEHR variantsfor a large range of medium energy sources (170 keV - 300 keV).
4.3 PET scatter analysis
The characterization of scatter is a very important issue in 3D PET. The mainobjective of this section is to understand by means of simulations which pa-tient scatter order is significantly predominating in the photopeak window. Asecond goal is to qualify the difference between phantom and crystal scat-ter influences. Since this is dependent of the photo-electric fraction (ratio ofthe number of detections in the photopeak window after photo-electric effectto the total of the detections including multiple Compton and photo-electricevents), several crystal materials were investigated: GSO, LSO, BGO. Wealso included two new materials: LaBr3 and LuI3. Figure 4.13 shows thedetected events after photo-electric interaction and after multiple Compton in-teractions for the photopeak window and for various detector materials. If thephoto-electric fraction of a crystal material is large then the total (Comptonand photo-electric interactions) number of detections in function of the depthof interaction will be exponentially decreasing while this is a more uniformdistribution if the photo-electric fraction is lower. A low photo-electric frac-tion implies a large contribution of multiple Compton events in the photopeak.The Compton interaction process needs a build-up region causing the uniformdistribution in thin crystals.
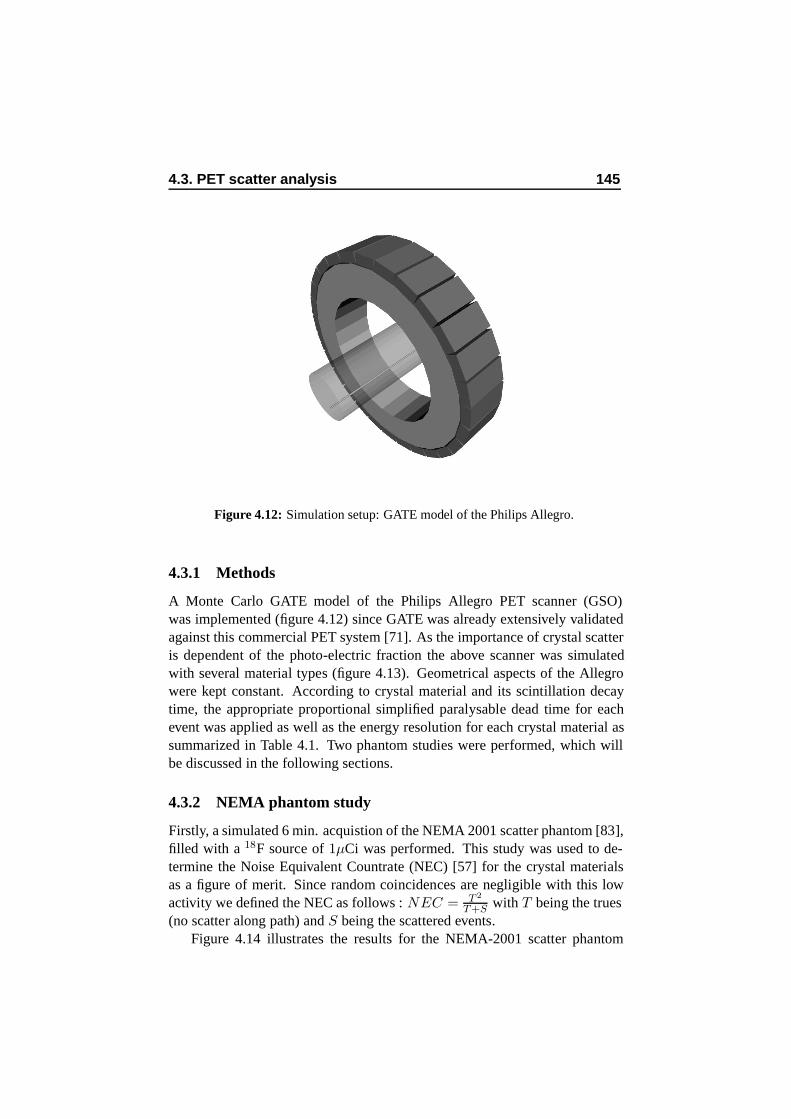
4.3. PET scatter analysis 145
Figure 4.12: Simulation setup: GATE model of the Philips Allegro.
4.3.1 Methods
A Monte Carlo GATE model of the Philips Allegro PET scanner (GSO)was implemented (figure 4.12) since GATE was already extensively validatedagainst this commercial PET system [71]. As the importance of crystal scatteris dependent of the photo-electric fraction the above scanner was simulatedwith several material types (figure 4.13). Geometrical aspects of the Allegrowere kept constant. According to crystal material and its scintillation decaytime, the appropriate proportional simplified paralysable dead time for eachevent was applied as well as the energy resolution for each crystal material assummarized in Table 4.1. Two phantom studies were performed, which willbe discussed in the following sections.
4.3.2 NEMA phantom study
Firstly, a simulated 6 min. acquistion of the NEMA 2001 scatter phantom [83],filled with a 18F source of 1µCi was performed. This study was used to de-termine the Noise Equivalent Countrate (NEC) [57] for the crystal materialsas a figure of merit. Since random coincidences are negligible with this lowactivity we defined the NEC as follows : NEC = T 2
T+S with T being the trues(no scatter along path) and S being the scattered events.
Figure 4.14 illustrates the results for the NEMA-2001 scatter phantom
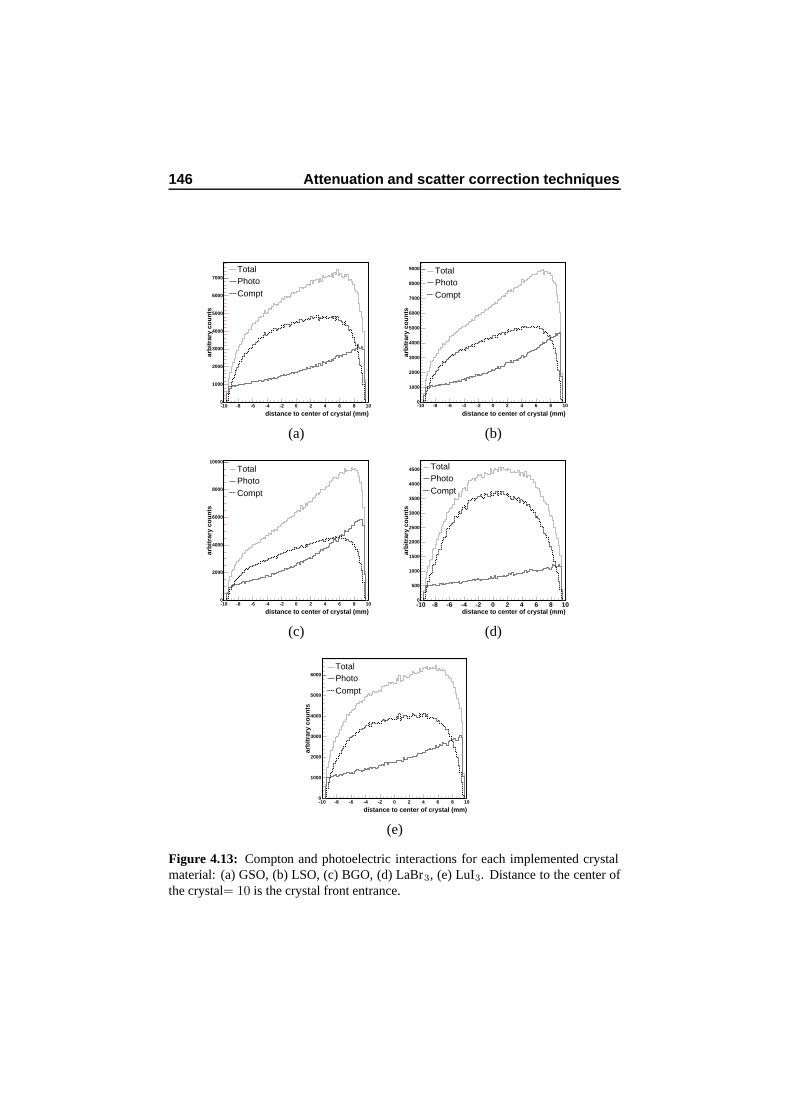
146 Attenuation and scatter correction techniques
distance to center of crystal (mm)-10 -8 -6 -4 -2 0 2 4 6 8 10
arb
itra
ry c
ou
nts
0
1000
2000
3000
4000
5000
6000
7000
TotalPhotoCompt
distance to center of crystal (mm)-10 -8 -6 -4 -2 0 2 4 6 8 10
arb
itra
ry c
ou
nts
0
1000
2000
3000
4000
5000
6000
7000
8000
9000 TotalPhotoCompt
(a) (b)
distance to center of crystal (mm)-10 -8 -6 -4 -2 0 2 4 6 8 10
arb
itra
ry c
ou
nts
0
2000
4000
6000
8000
10000
TotalPhotoCompt
distance to center of crystal (mm)-10 -8 -6 -4 -2 0 2 4 6 8 10
arb
itra
ry c
ou
nts
0
500
1000
1500
2000
2500
3000
3500
4000
4500 TotalPhotoCompt
(c) (d)
distance to center of crystal (mm)-10 -8 -6 -4 -2 0 2 4 6 8 10
arb
itra
ry c
ou
nts
0
1000
2000
3000
4000
5000
6000TotalPhotoCompt
(e)
Figure 4.13: Compton and photoelectric interactions for each implemented crystalmaterial: (a) GSO, (b) LSO, (c) BGO, (d) LaBr3, (e) LuI3. Distance to the center ofthe crystal= 10 is the crystal front entrance.
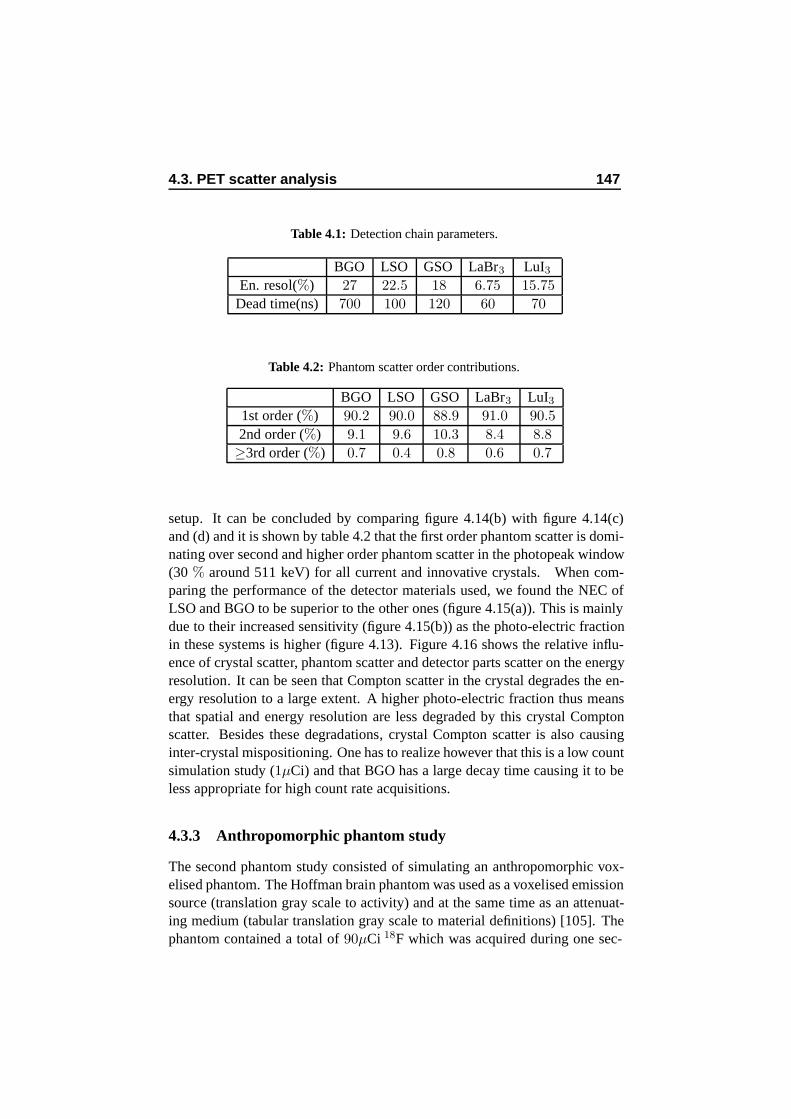
4.3. PET scatter analysis 147
Table 4.1: Detection chain parameters.
BGO LSO GSO LaBr3 LuI3En. resol(%) 27 22.5 18 6.75 15.75
Dead time(ns) 700 100 120 60 70
Table 4.2: Phantom scatter order contributions.
BGO LSO GSO LaBr3 LuI31st order (%) 90.2 90.0 88.9 91.0 90.5
2nd order (%) 9.1 9.6 10.3 8.4 8.8
≥3rd order (%) 0.7 0.4 0.8 0.6 0.7
setup. It can be concluded by comparing figure 4.14(b) with figure 4.14(c)and (d) and it is shown by table 4.2 that the first order phantom scatter is domi-nating over second and higher order phantom scatter in the photopeak window(30 % around 511 keV) for all current and innovative crystals. When com-paring the performance of the detector materials used, we found the NEC ofLSO and BGO to be superior to the other ones (figure 4.15(a)). This is mainlydue to their increased sensitivity (figure 4.15(b)) as the photo-electric fractionin these systems is higher (figure 4.13). Figure 4.16 shows the relative influ-ence of crystal scatter, phantom scatter and detector parts scatter on the energyresolution. It can be seen that Compton scatter in the crystal degrades the en-ergy resolution to a large extent. A higher photo-electric fraction thus meansthat spatial and energy resolution are less degraded by this crystal Comptonscatter. Besides these degradations, crystal Compton scatter is also causinginter-crystal mispositioning. One has to realize however that this is a low countsimulation study (1µCi) and that BGO has a large decay time causing it to beless appropriate for high count rate acquisitions.
4.3.3 Anthropomorphic phantom study
The second phantom study consisted of simulating an anthropomorphic vox-elised phantom. The Hoffman brain phantom was used as a voxelised emissionsource (translation gray scale to activity) and at the same time as an attenuat-ing medium (tabular translation gray scale to material definitions) [105]. Thephantom contained a total of 90µCi 18F which was acquired during one sec-
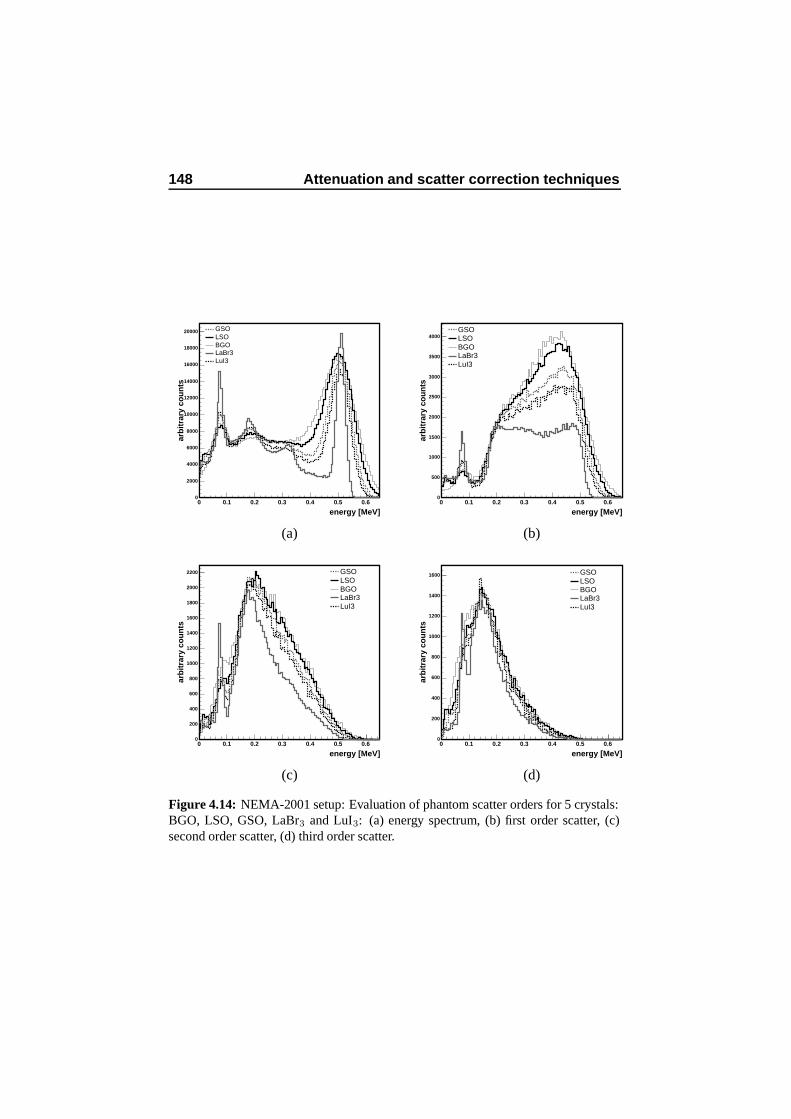
148 Attenuation and scatter correction techniques
energy [MeV]0 0.1 0.2 0.3 0.4 0.5 0.6
arb
itra
ry c
ou
nts
0
2000
4000
6000
8000
10000
12000
14000
16000
18000
20000 GSOLSOBGOLaBr3LuI3
energy [MeV]0 0.1 0.2 0.3 0.4 0.5 0.6
arb
itra
ry c
ou
nts
0
500
1000
1500
2000
2500
3000
3500
4000GSOLSOBGOLaBr3LuI3
(a) (b)
energy [MeV]0 0.1 0.2 0.3 0.4 0.5 0.6
arb
itra
ry c
ou
nts
0
200
400
600
800
1000
1200
1400
1600
1800
2000
2200 GSOLSOBGOLaBr3LuI3
energy [MeV]0 0.1 0.2 0.3 0.4 0.5 0.6
arb
itra
ry c
ou
nts
0
200
400
600
800
1000
1200
1400
1600 GSOLSOBGOLaBr3LuI3
(c) (d)
Figure 4.14: NEMA-2001 setup: Evaluation of phantom scatter orders for 5 crystals:BGO, LSO, GSO, LaBr3 and LuI3: (a) energy spectrum, (b) first order scatter, (c)second order scatter, (d) third order scatter.
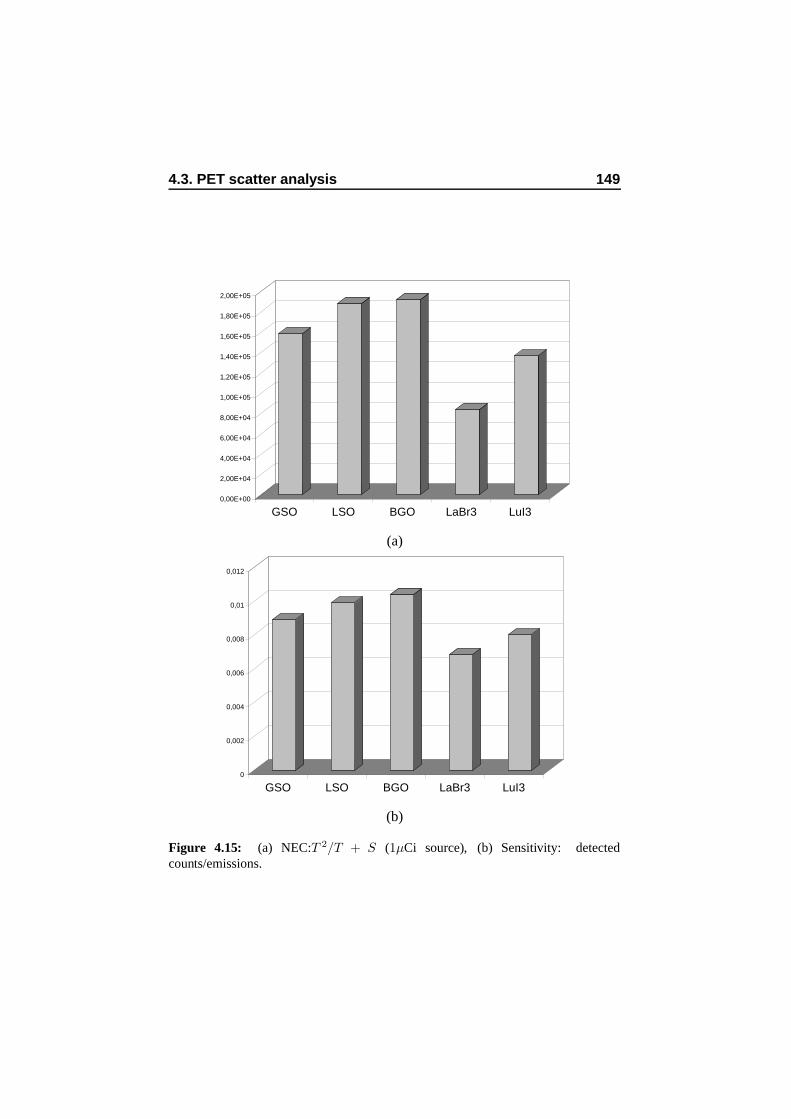
4.3. PET scatter analysis 149
0,00E+00
2,00E+04
4,00E+04
6,00E+04
8,00E+04
1,00E+05
1,20E+05
1,40E+05
1,60E+05
1,80E+05
2,00E+05
GSO LSO BGO LaBr3 LuI3
(a)
0
0,002
0,004
0,006
0,008
0,01
0,012
GSO LSO BGO LaBr3 LuI3
(b)
Figure 4.15: (a) NEC:T 2/T + S (1µCi source), (b) Sensitivity: detectedcounts/emissions.
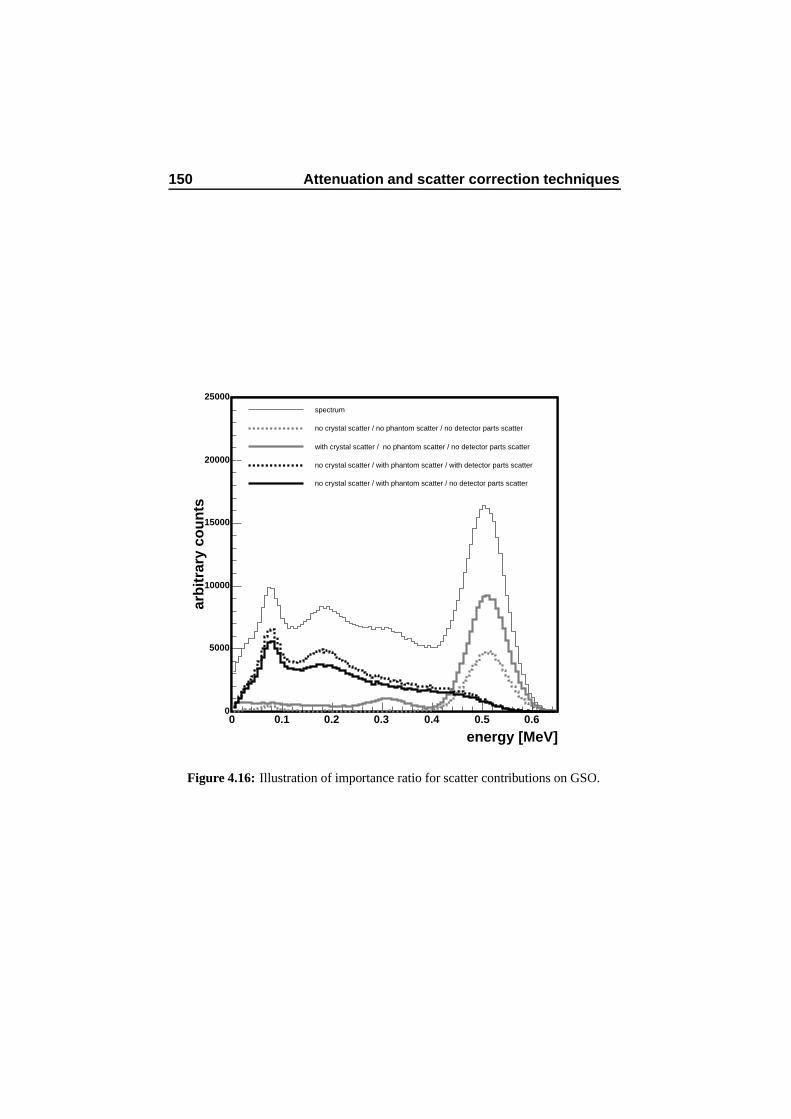
150 Attenuation and scatter correction techniques
energy [MeV]0 0.1 0.2 0.3 0.4 0.5 0.6
arb
itra
ry c
ou
nts
0
5000
10000
15000
20000
25000spectrum
no crystal scatter / no phantom scatter / no detector parts scatter
with crystal scatter / no phantom scatter / no detector parts scatter
no crystal scatter / with phantom scatter / with detector parts scatter
no crystal scatter / with phantom scatter / no detector parts scatter
Figure 4.16: Illustration of importance ratio for scatter contributions on GSO.
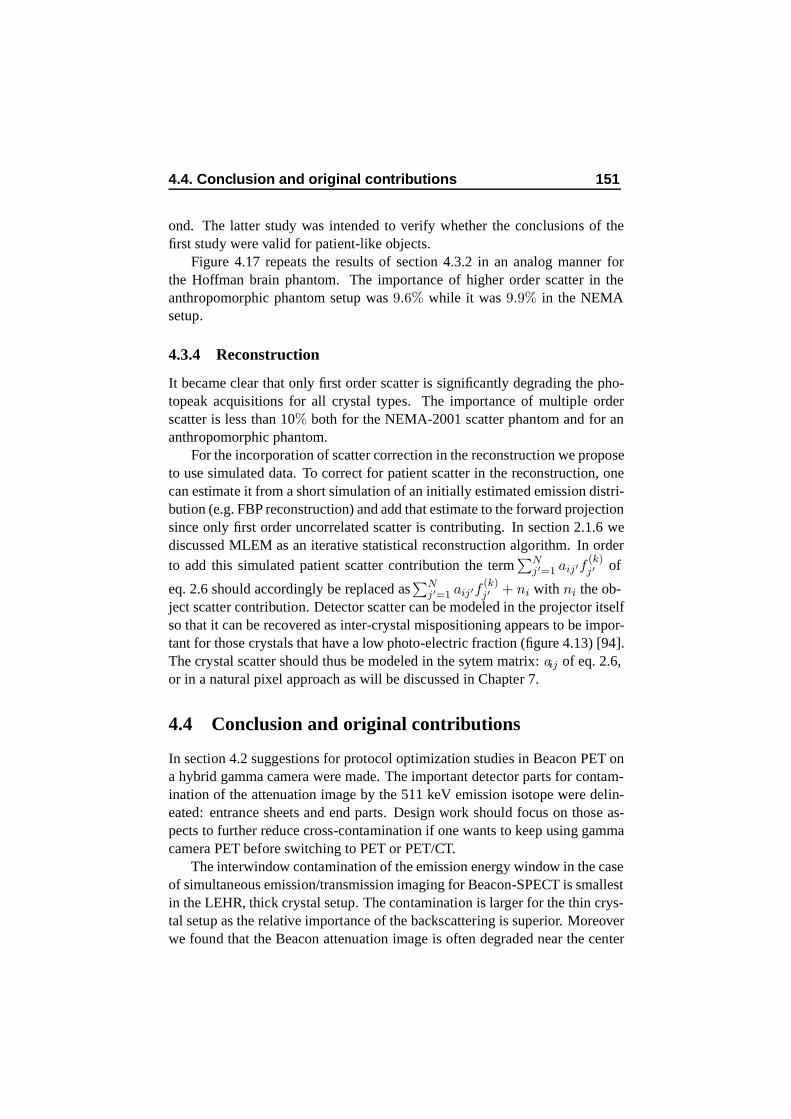
4.4. Conclusion and original contributions 151
ond. The latter study was intended to verify whether the conclusions of thefirst study were valid for patient-like objects.
Figure 4.17 repeats the results of section 4.3.2 in an analog manner forthe Hoffman brain phantom. The importance of higher order scatter in theanthropomorphic phantom setup was 9.6% while it was 9.9% in the NEMAsetup.
4.3.4 Reconstruction
It became clear that only first order scatter is significantly degrading the pho-topeak acquisitions for all crystal types. The importance of multiple orderscatter is less than 10% both for the NEMA-2001 scatter phantom and for ananthropomorphic phantom.
For the incorporation of scatter correction in the reconstruction we proposeto use simulated data. To correct for patient scatter in the reconstruction, onecan estimate it from a short simulation of an initially estimated emission distri-bution (e.g. FBP reconstruction) and add that estimate to the forward projectionsince only first order uncorrelated scatter is contributing. In section 2.1.6 wediscussed MLEM as an iterative statistical reconstruction algorithm. In orderto add this simulated patient scatter contribution the term
∑Nj′=1 aij′f
(k)j′ of
eq. 2.6 should accordingly be replaced as∑N
j′=1 aij′f(k)j′ + ni with ni the ob-
ject scatter contribution. Detector scatter can be modeled in the projector itselfso that it can be recovered as inter-crystal mispositioning appears to be impor-tant for those crystals that have a low photo-electric fraction (figure 4.13) [94].The crystal scatter should thus be modeled in the sytem matrix: aij of eq. 2.6,or in a natural pixel approach as will be discussed in Chapter 7.
4.4 Conclusion and original contributions
In section 4.2 suggestions for protocol optimization studies in Beacon PET ona hybrid gamma camera were made. The important detector parts for contam-ination of the attenuation image by the 511 keV emission isotope were delin-eated: entrance sheets and end parts. Design work should focus on those as-pects to further reduce cross-contamination if one wants to keep using gammacamera PET before switching to PET or PET/CT.
The interwindow contamination of the emission energy window in the caseof simultaneous emission/transmission imaging for Beacon-SPECT is smallestin the LEHR, thick crystal setup. The contamination is larger for the thin crys-tal setup as the relative importance of the backscattering is superior. Moreoverwe found that the Beacon attenuation image is often degraded near the center
152 Attenuation and scatter correction techniques
energy [MeV]0 0.1 0.2 0.3 0.4 0.5 0.6
arb
itra
ry c
ou
nts
0
200
400
600
800
1000
1200
1400
1600
1800
2000
2200GSOLSOBGOLaBr3LuI3
energy [MeV]0 0.1 0.2 0.3 0.4 0.5 0.6
arb
itra
ry c
ou
nts
0
50
100
150
200
250
GSOLSOBGOLaBr3LuI3
(a) (b)
energy [MeV]0 0.1 0.2 0.3 0.4 0.5 0.6
arb
itra
ry c
ou
nts
0
20
40
60
80
100 GSOLSOBGOLaBr3LuI3
energy [MeV]0 0.1 0.2 0.3 0.4 0.5 0.6
arb
itra
ry c
ou
nts
0
10
20
30
40
50
60
70
80GSOLSOBGOLaBr3LuI3
(c) (d)
Figure 4.17: Anthropomorphic phantom setup: Evaluation of phantom scatter ordersfor 5 crystals: BGO, LSO, GSO, LaBr3 and LuI3: (a) energy spectrum, (b) first orderscatter, (c) second order scatter, (d) third order scatter.
4.4. Conclusion and original contributions 153
of large patients when a medium energy emission study is performed simul-taneously or sequentially with the transmission acquisition. This is due to thefact that the 133Ba sources have to form an image through the collimator of theopposite detector head, which has thick septa in a medium energy emissionsetup. It was shown that, in this particular case, it would be recommendableto replace the MEGP collimators by the LEHR variants for a large range ofmedium energy sources (170 keV - 300 keV). Incorporating Monte Carlo in-formation in the reconstruction will be necessary to perform a resolution re-covery for the LEHR collimator variant and to cancel out the medium energyphoton spread. The main conclusion for Beacon-SPECT is that a thick crystaldetector coupled to a LEHR collimator is the best solution for acquiring at-tenuation maps in low and medium energy applications if one uses the MonteCarlo based reconstruction that will be detailed in Chapter 7.
In section 4.3 a qualitative interpretation was shown for the importance ofmultiple order scatter in 3D PET. Various crystal types, including innovativematerials such as LaBr3 and LuI3, were examined. It became clear that onlyfirst order scatter is significantly degrading the photopeak acquisitions for allcrystal types. The importance of multiple order scatter is less than 10% bothfor the NEMA-2001 scatter phantom and for an anthropomorphic phantom. Itwas also shown that BGO and LSO give rise to higher NECs on the NEMA-scatter study. This will not be the case for BGO in higher count rate studiessince dead time effects will become predominant due to the slow scintillationtime of the crystal material. Simulation studies showed that only first orderscatter is significantly degrading PET image quality. The effect of higher orderscatter in the photopeak window is negligible.
The work presented in this chapter resulted in a peer reviewed journal ar-ticle [106] and in three publications in the proceedings of international confer-ences [105, 108, 109]. It is the first simulation study using the GATE virtualclock synchronisation to such a large extent: detector rotation, linear move-ment, decay of the 133Ba point sources and decay of emission sources aresynchronized. Also it is the first simulation study in the field evaluating theimportance of multiple order patient scatter on anthropomorphic phantoms forvarious crystal materials, especially for LaBr3 and LuI3.

154 Attenuation and scatter correction techniques
Chapter 5
Imaging systems andcollimator design
5.1 Introduction
Image formation modeling is one of the most important reasons for the exis-tence of Monte Carlo simulations in nuclear medicine. Monte Carlo methodscan be used to assess the image formation process both qualitatively and quan-titatively and can assist in the development of new collimator designs, newdetector construction, new electronics and in optimized camera motions. Inthis chapter we use GATE to investigate a new design of SPECT acquisitionwith a rotating slat collimator mounted on a strip detector. Although gammacameras with parallel hole collimators have been optimized during the pastyears, their major limitation remains the limited sensitivity for an acceptablespatial resolution. The sensitivity-resolution tradeoff can be improved by usingfocusing collimators like fan beam and cone beam collimators, but those arelimited by their FOV. The main purpose of the aforementioned new design isto improve the resolution versus sensitivity tradeoff by the rotating collimator,coupled to an improved energy resolution by using the semiconductor detector.The study consisted of modeling the prototype of the Solid State with Com-pact Electronics (Solstice) camera which aims for a higher spatial resolution ata comparable sensitivity of classical SPECT devices.
5.2 Solstice detector: basic characteristics
The concept of the Solstice detector (figure 5.1(a)) [43] consists of a rotatingslat collimator mounted on a strip detector (35 cm×5.6 cm×0.5 cm), made of
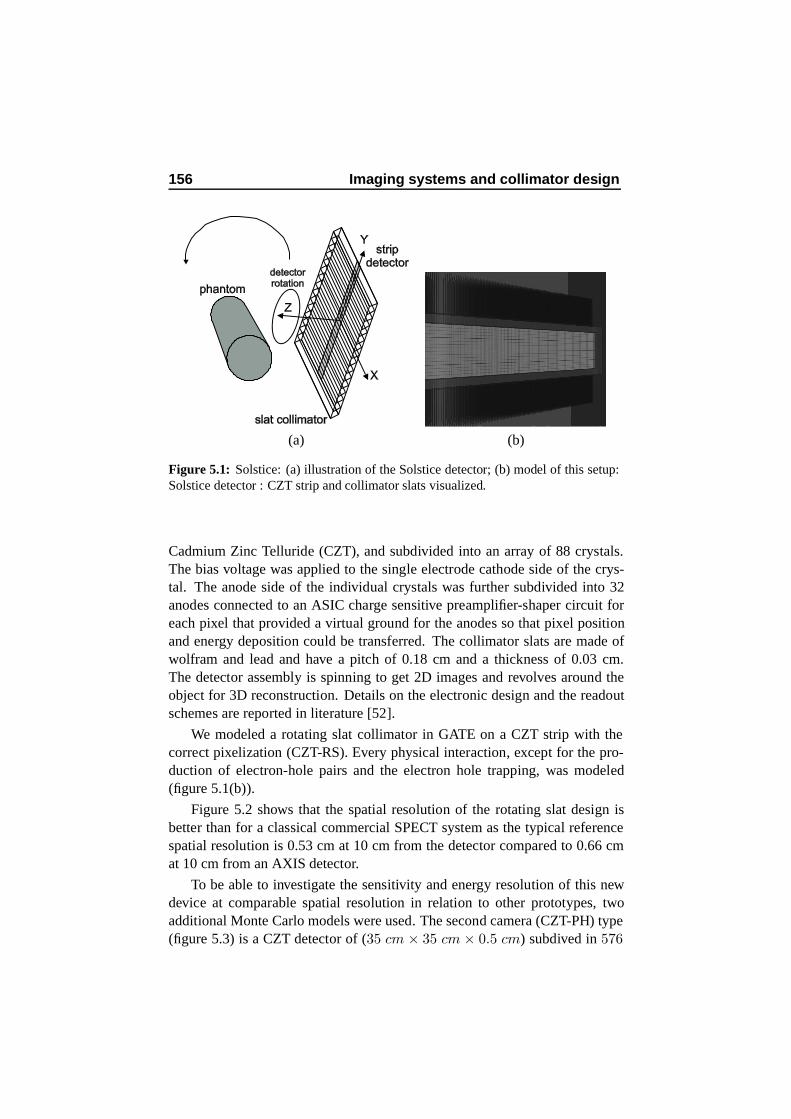
156 Imaging systems and collimator design
stripdetector
slat collimator
X
Y
Z
phantom
detectorrotation
(a) (b)
Figure 5.1: Solstice: (a) illustration of the Solstice detector; (b) model of this setup:Solstice detector : CZT strip and collimator slats visualized.
Cadmium Zinc Telluride (CZT), and subdivided into an array of 88 crystals.The bias voltage was applied to the single electrode cathode side of the crys-tal. The anode side of the individual crystals was further subdivided into 32anodes connected to an ASIC charge sensitive preamplifier-shaper circuit foreach pixel that provided a virtual ground for the anodes so that pixel positionand energy deposition could be transferred. The collimator slats are made ofwolfram and lead and have a pitch of 0.18 cm and a thickness of 0.03 cm.The detector assembly is spinning to get 2D images and revolves around theobject for 3D reconstruction. Details on the electronic design and the readoutschemes are reported in literature [52].
We modeled a rotating slat collimator in GATE on a CZT strip with thecorrect pixelization (CZT-RS). Every physical interaction, except for the pro-duction of electron-hole pairs and the electron hole trapping, was modeled(figure 5.1(b)).
Figure 5.2 shows that the spatial resolution of the rotating slat design isbetter than for a classical commercial SPECT system as the typical referencespatial resolution is 0.53 cm at 10 cm from the detector compared to 0.66 cmat 10 cm from an AXIS detector.
To be able to investigate the sensitivity and energy resolution of this newdevice at comparable spatial resolution in relation to other prototypes, twoadditional Monte Carlo models were used. The second camera (CZT-PH) type(figure 5.3) is a CZT detector of (35 cm × 35 cm × 0.5 cm) subdived in 576
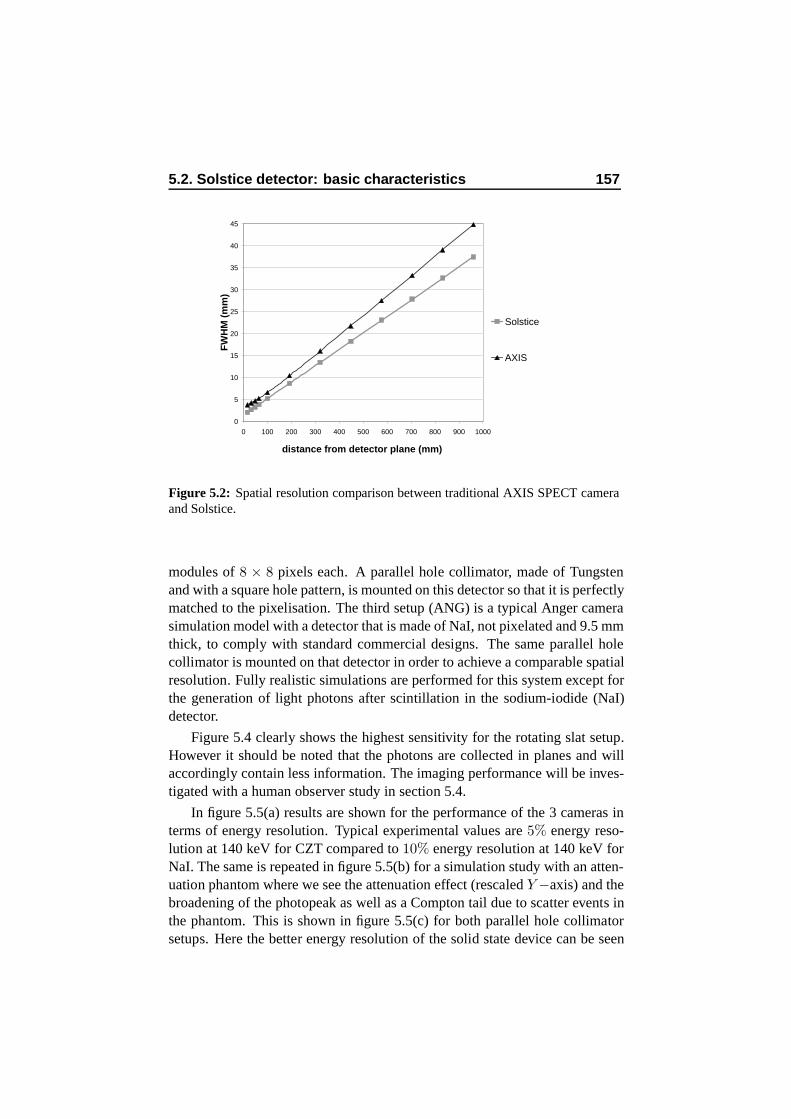
5.2. Solstice detector: basic characteristics 157
0
5
10
15
20
25
30
35
40
45
0 100 200 300 400 500 600 700 800 900 1000
distance from detector plane (mm)
FW
HM
(m
m)
Solstice
AXIS
Figure 5.2: Spatial resolution comparison between traditional AXIS SPECT cameraand Solstice.
modules of 8 × 8 pixels each. A parallel hole collimator, made of Tungstenand with a square hole pattern, is mounted on this detector so that it is perfectlymatched to the pixelisation. The third setup (ANG) is a typical Anger camerasimulation model with a detector that is made of NaI, not pixelated and 9.5 mmthick, to comply with standard commercial designs. The same parallel holecollimator is mounted on that detector in order to achieve a comparable spatialresolution. Fully realistic simulations are performed for this system except forthe generation of light photons after scintillation in the sodium-iodide (NaI)detector.
Figure 5.4 clearly shows the highest sensitivity for the rotating slat setup.However it should be noted that the photons are collected in planes and willaccordingly contain less information. The imaging performance will be inves-tigated with a human observer study in section 5.4.
In figure 5.5(a) results are shown for the performance of the 3 cameras interms of energy resolution. Typical experimental values are 5% energy reso-lution at 140 keV for CZT compared to 10% energy resolution at 140 keV forNaI. The same is repeated in figure 5.5(b) for a simulation study with an atten-uation phantom where we see the attenuation effect (rescaled Y −axis) and thebroadening of the photopeak as well as a Compton tail due to scatter events inthe phantom. This is shown in figure 5.5(c) for both parallel hole collimatorsetups. Here the better energy resolution of the solid state device can be seen
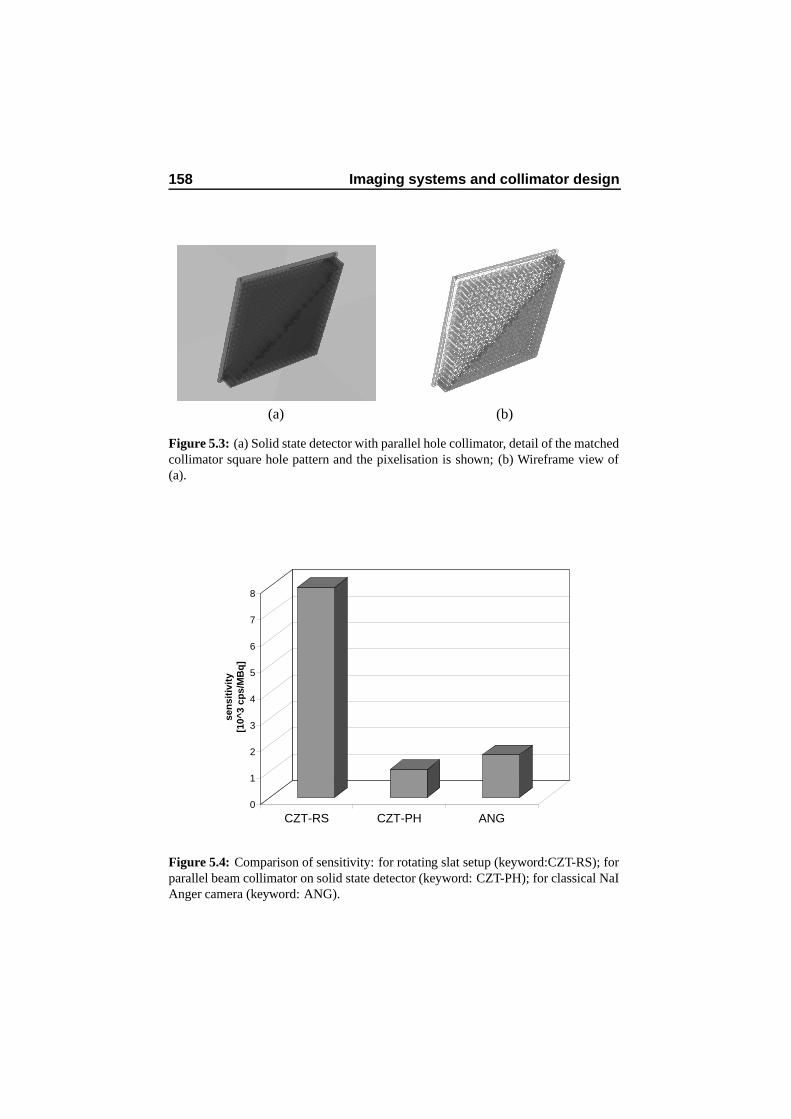
158 Imaging systems and collimator design
(a) (b)
Figure 5.3: (a) Solid state detector with parallel hole collimator, detail of the matchedcollimator square hole pattern and the pixelisation is shown; (b) Wireframe view of(a).
0
1
2
3
4
5
6
7
8
sen
siti
vity
[1
0^3
cps/
MB
q]
CZT-RS CZT-PH ANG
Figure 5.4: Comparison of sensitivity: for rotating slat setup (keyword:CZT-RS); forparallel beam collimator on solid state detector (keyword: CZT-PH); for classical NaIAnger camera (keyword: ANG).
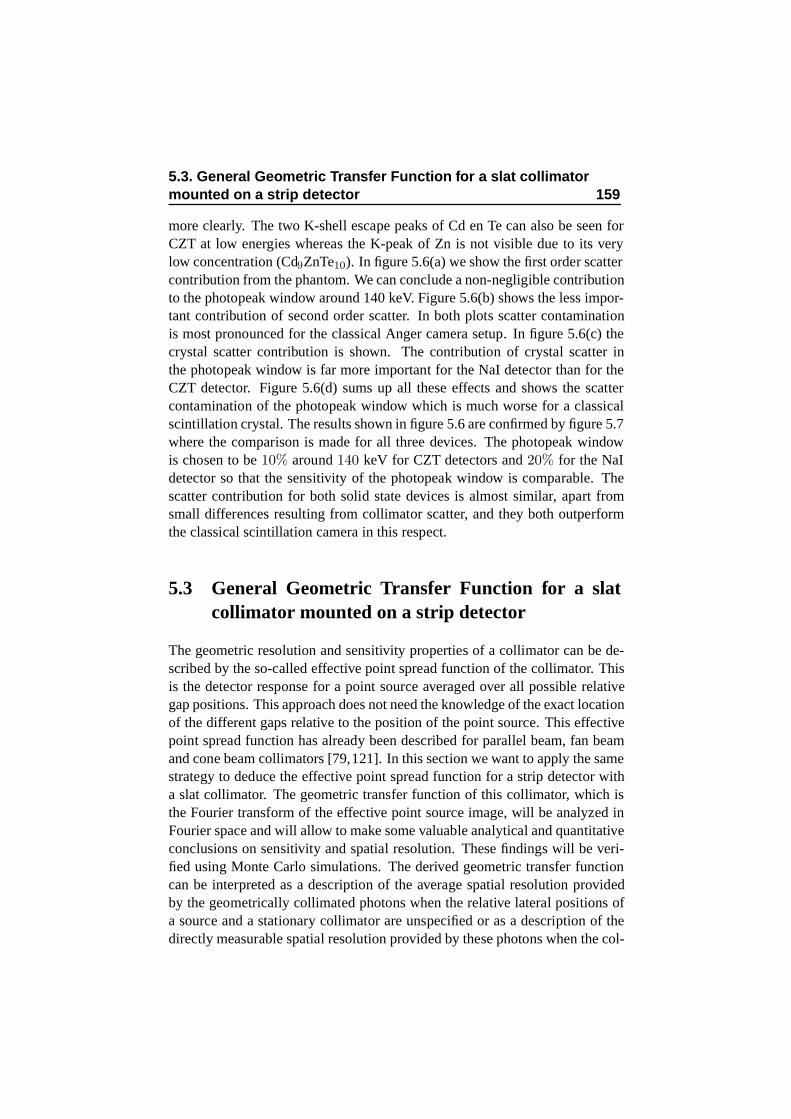
5.3. General Geometric Transfer Function for a slat collimatormounted on a strip detector 159
more clearly. The two K-shell escape peaks of Cd en Te can also be seen forCZT at low energies whereas the K-peak of Zn is not visible due to its verylow concentration (Cd9ZnTe10). In figure 5.6(a) we show the first order scattercontribution from the phantom. We can conclude a non-negligible contributionto the photopeak window around 140 keV. Figure 5.6(b) shows the less impor-tant contribution of second order scatter. In both plots scatter contaminationis most pronounced for the classical Anger camera setup. In figure 5.6(c) thecrystal scatter contribution is shown. The contribution of crystal scatter inthe photopeak window is far more important for the NaI detector than for theCZT detector. Figure 5.6(d) sums up all these effects and shows the scattercontamination of the photopeak window which is much worse for a classicalscintillation crystal. The results shown in figure 5.6 are confirmed by figure 5.7where the comparison is made for all three devices. The photopeak windowis chosen to be 10% around 140 keV for CZT detectors and 20% for the NaIdetector so that the sensitivity of the photopeak window is comparable. Thescatter contribution for both solid state devices is almost similar, apart fromsmall differences resulting from collimator scatter, and they both outperformthe classical scintillation camera in this respect.
5.3 General Geometric Transfer Function for a slatcollimator mounted on a strip detector
The geometric resolution and sensitivity properties of a collimator can be de-scribed by the so-called effective point spread function of the collimator. Thisis the detector response for a point source averaged over all possible relativegap positions. This approach does not need the knowledge of the exact locationof the different gaps relative to the position of the point source. This effectivepoint spread function has already been described for parallel beam, fan beamand cone beam collimators [79,121]. In this section we want to apply the samestrategy to deduce the effective point spread function for a strip detector witha slat collimator. The geometric transfer function of this collimator, which isthe Fourier transform of the effective point source image, will be analyzed inFourier space and will allow to make some valuable analytical and quantitativeconclusions on sensitivity and spatial resolution. These findings will be veri-fied using Monte Carlo simulations. The derived geometric transfer functioncan be interpreted as a description of the average spatial resolution providedby the geometrically collimated photons when the relative lateral positions ofa source and a stationary collimator are unspecified or as a description of thedirectly measurable spatial resolution provided by these photons when the col-
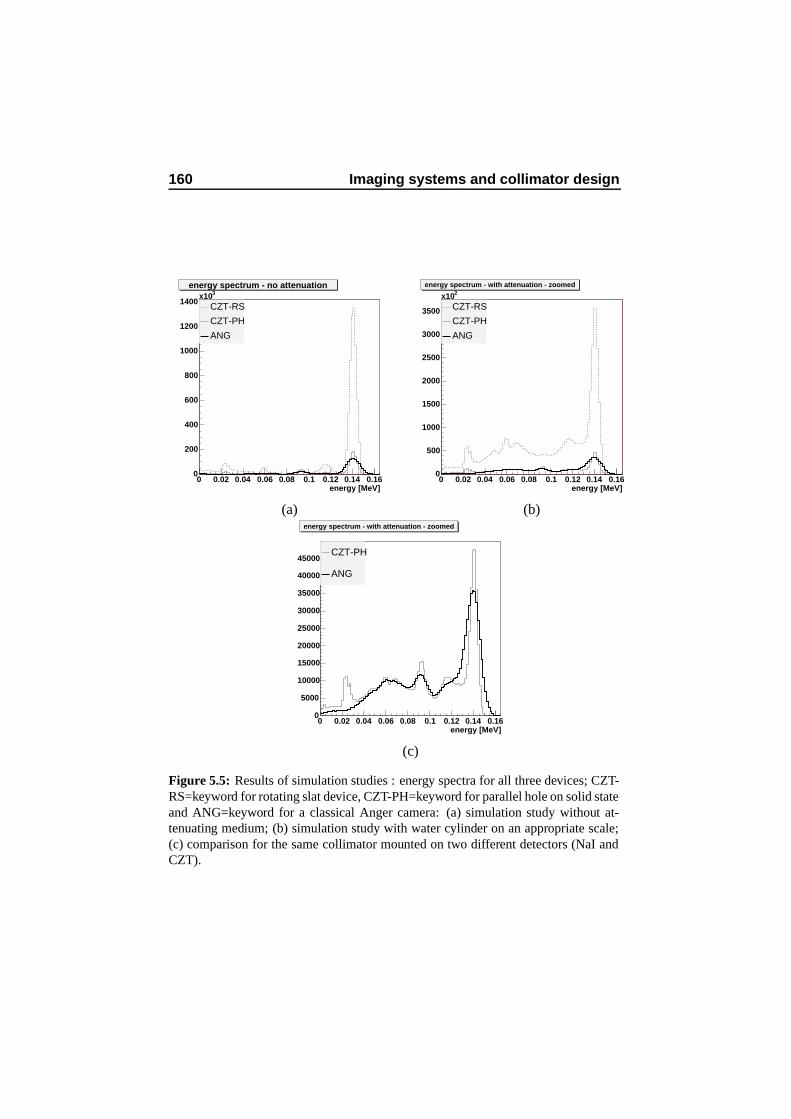
160 Imaging systems and collimator design
energy [MeV]0 0.02 0.04 0.06 0.08 0.1 0.12 0.14 0.16
0
200
400
600
800
1000
1200
14003x10CZT-RS
CZT-PH
ANG
energy spectrum - no attenuation
energy [MeV]0 0.02 0.04 0.06 0.08 0.1 0.12 0.14 0.16
0
500
1000
1500
2000
2500
3000
3500
2x10CZT-RS
CZT-PH
ANG
energy spectrum - with attenuation - zoomed
(a) (b)
energy [MeV]0 0.02 0.04 0.06 0.08 0.1 0.12 0.14 0.16
0
5000
10000
15000
20000
25000
30000
35000
40000
45000CZT-PH
ANG
energy spectrum - with attenuation - zoomed
(c)
Figure 5.5: Results of simulation studies : energy spectra for all three devices; CZT-RS=keyword for rotating slat device, CZT-PH=keyword for parallel hole on solid stateand ANG=keyword for a classical Anger camera: (a) simulation study without at-tenuating medium; (b) simulation study with water cylinder on an appropriate scale;(c) comparison for the same collimator mounted on two different detectors (NaI andCZT).
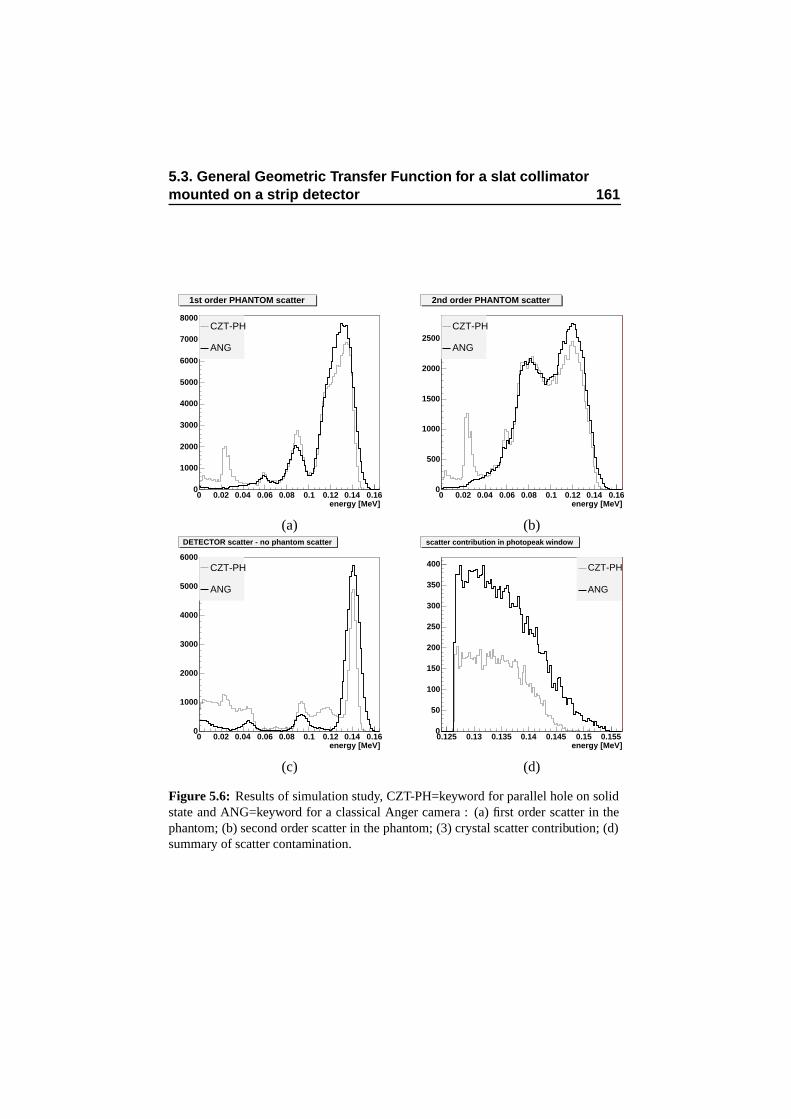
5.3. General Geometric Transfer Function for a slat collimatormounted on a strip detector 161
energy [MeV]0 0.02 0.04 0.06 0.08 0.1 0.12 0.14 0.16
0
1000
2000
3000
4000
5000
6000
7000
8000CZT-PH
ANG
1st order PHANTOM scatter
energy [MeV]0 0.02 0.04 0.06 0.08 0.1 0.12 0.14 0.16
0
500
1000
1500
2000
2500CZT-PH
ANG
2nd order PHANTOM scatter
(a) (b)
energy [MeV]0 0.02 0.04 0.06 0.08 0.1 0.12 0.14 0.16
0
1000
2000
3000
4000
5000
6000CZT-PH
ANG
DETECTOR scatter - no phantom scatter
energy [MeV]0.125 0.13 0.135 0.14 0.145 0.15 0.1550
50
100
150
200
250
300
350
400 CZT-PH
ANG
scatter contribution in photopeak window
(c) (d)
Figure 5.6: Results of simulation study, CZT-PH=keyword for parallel hole on solidstate and ANG=keyword for a classical Anger camera : (a) first order scatter in thephantom; (b) second order scatter in the phantom; (3) crystal scatter contribution; (d)summary of scatter contamination.
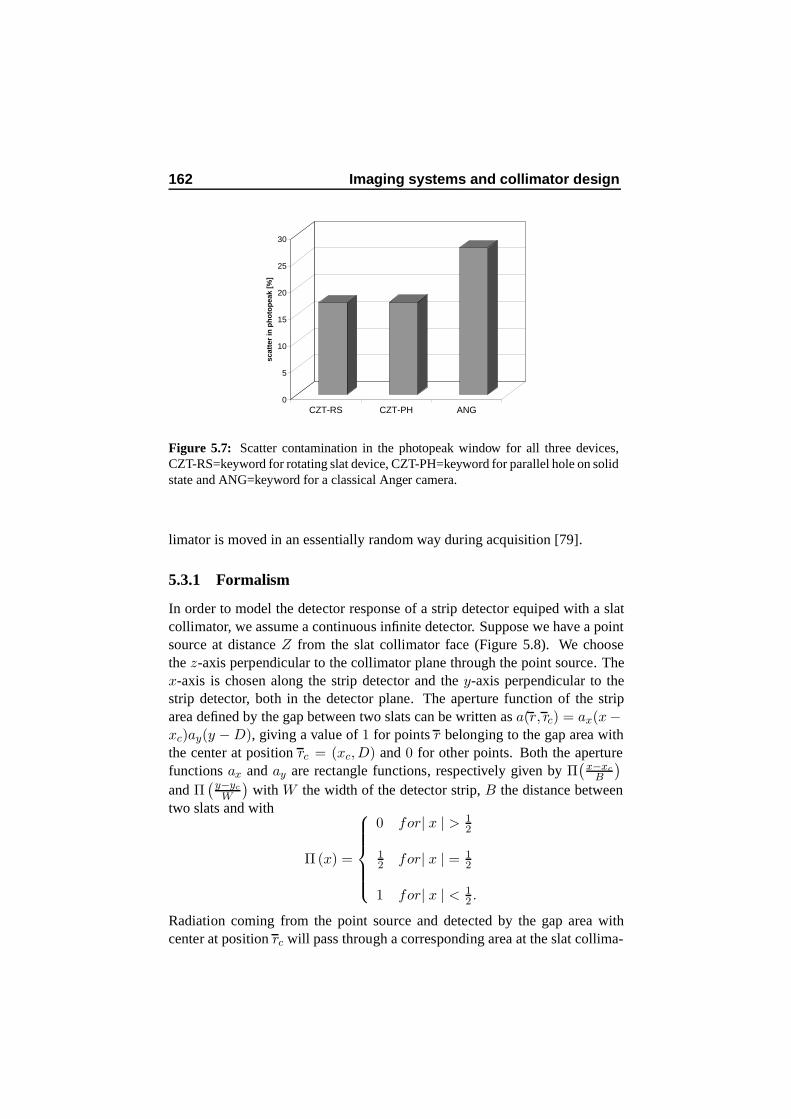
162 Imaging systems and collimator design
0
5
10
15
20
25
30
scat
ter
in p
ho
top
eak
[%]
CZT-RS CZT-PH ANG
Figure 5.7: Scatter contamination in the photopeak window for all three devices,CZT-RS=keyword for rotating slat device, CZT-PH=keyword for parallel hole on solidstate and ANG=keyword for a classical Anger camera.
limator is moved in an essentially random way during acquisition [79].
5.3.1 Formalism
In order to model the detector response of a strip detector equiped with a slatcollimator, we assume a continuous infinite detector. Suppose we have a pointsource at distance Z from the slat collimator face (Figure 5.8). We choosethe z-axis perpendicular to the collimator plane through the point source. Thex-axis is chosen along the strip detector and the y-axis perpendicular to thestrip detector, both in the detector plane. The aperture function of the striparea defined by the gap between two slats can be written as a(r, rc) = ax(x −xc)ay(y − D), giving a value of 1 for points r belonging to the gap area withthe center at position rc = (xc,D) and 0 for other points. Both the aperturefunctions ax and ay are rectangle functions, respectively given by Π
(
x−xc
B
)
and Π(y−yc
W
)
with W the width of the detector strip, B the distance betweentwo slats and with
Π(x) =
0 for| x | > 12
12 for| x | = 1
2
1 for| x | < 12 .
Radiation coming from the point source and detected by the gap area withcenter at position rc will pass through a corresponding area at the slat collima-
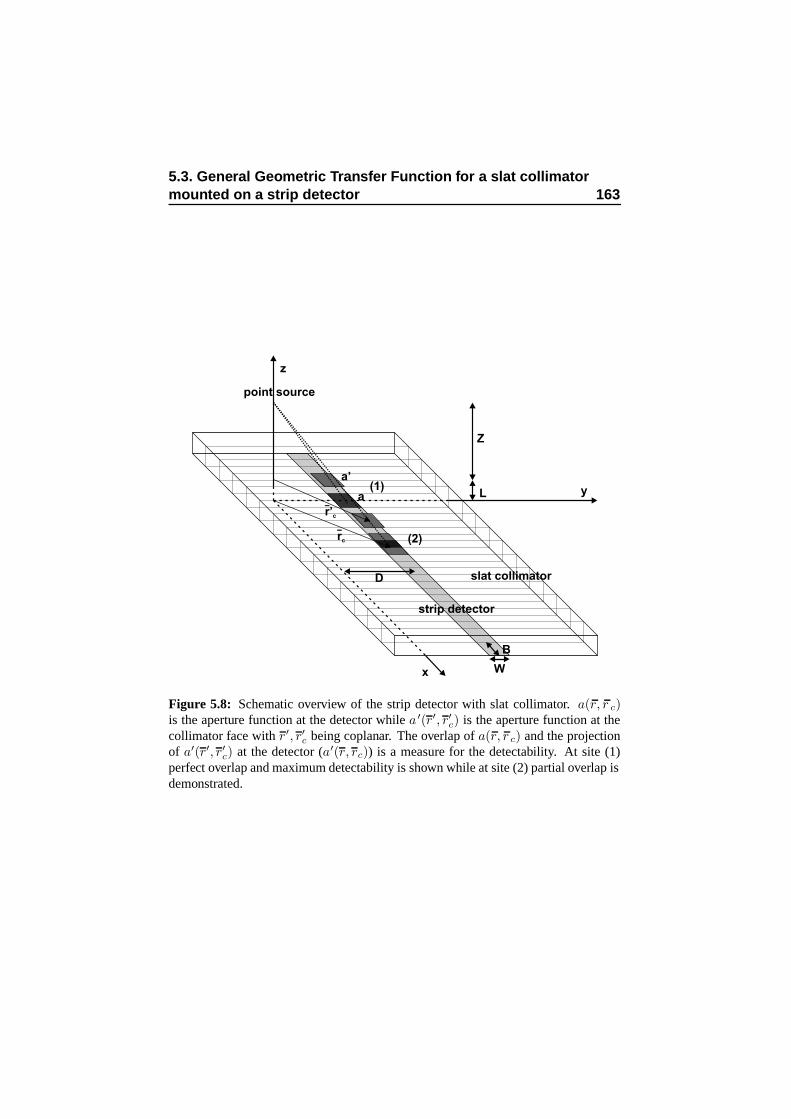
5.3. General Geometric Transfer Function for a slat collimatormounted on a strip detector 163
x
y
z
a’
a
point source
(1)
strip detector
slat collimator
(2)
L
Z
D
B
W
rc
r’c
Figure 5.8: Schematic overview of the strip detector with slat collimator. a(r, r c)is the aperture function at the detector while a ′(r′, r′
c) is the aperture function at the
collimator face with r′, r′c being coplanar. The overlap of a(r, r c) and the projectionof a′(r′, r′
c) at the detector (a′(r, rc)) is a measure for the detectability. At site (1)
perfect overlap and maximum detectability is shown while at site (2) partial overlap isdemonstrated.
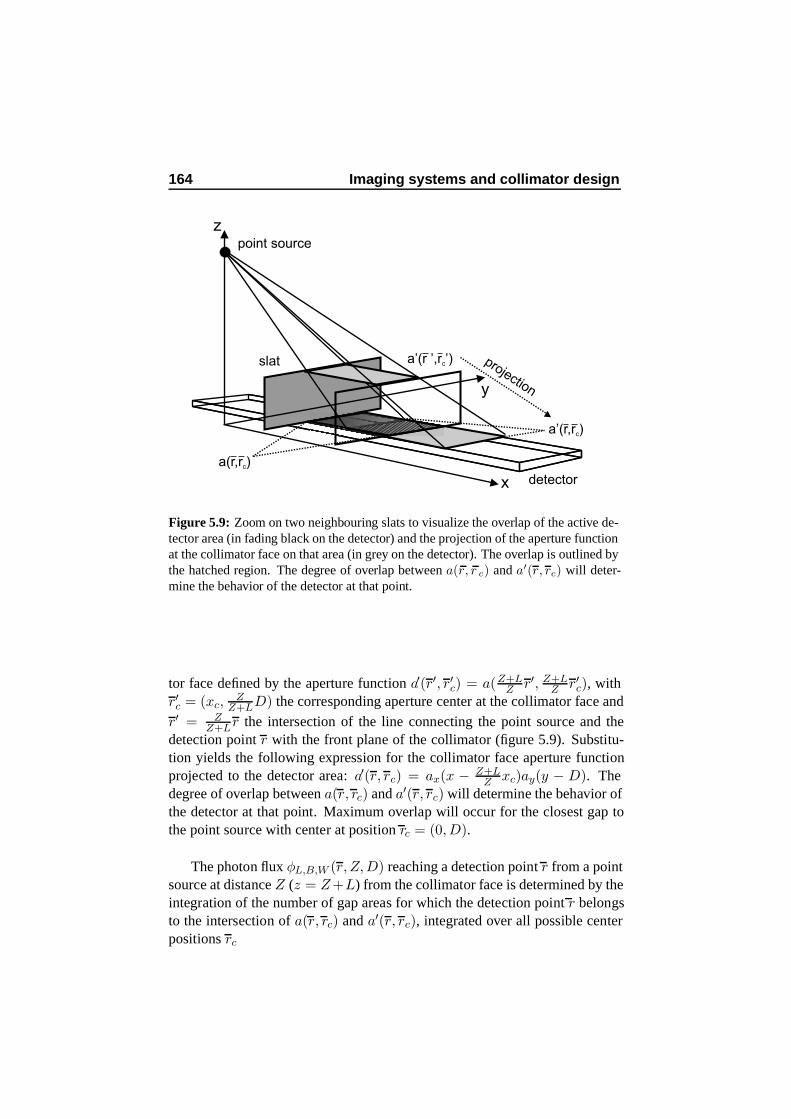
164 Imaging systems and collimator design
x
z
y
point source
detector
slat a’(r ’,r ’)c
a(r,r )c
a’(r,r )c
projection
Figure 5.9: Zoom on two neighbouring slats to visualize the overlap of the active de-tector area (in fading black on the detector) and the projection of the aperture functionat the collimator face on that area (in grey on the detector). The overlap is outlined bythe hatched region. The degree of overlap between a(r, r c) and a′(r, rc) will deter-mine the behavior of the detector at that point.
tor face defined by the aperture function a′(r′, r′c) = a(Z+LZ r′, Z+L
Z r′c), withr′c = (xc,
ZZ+LD) the corresponding aperture center at the collimator face and
r′ = ZZ+Lr the intersection of the line connecting the point source and the
detection point r with the front plane of the collimator (figure 5.9). Substitu-tion yields the following expression for the collimator face aperture functionprojected to the detector area: a′(r, rc) = ax(x − Z+L
Z xc)ay(y − D). Thedegree of overlap between a(r, rc) and a′(r, rc) will determine the behavior ofthe detector at that point. Maximum overlap will occur for the closest gap tothe point source with center at position rc = (0,D).
The photon flux φL,B,W (r, Z,D) reaching a detection point r from a pointsource at distance Z (z = Z+L) from the collimator face is determined by theintegration of the number of gap areas for which the detection point r belongsto the intersection of a(r, rc) and a′(r, rc), integrated over all possible centerpositions rc
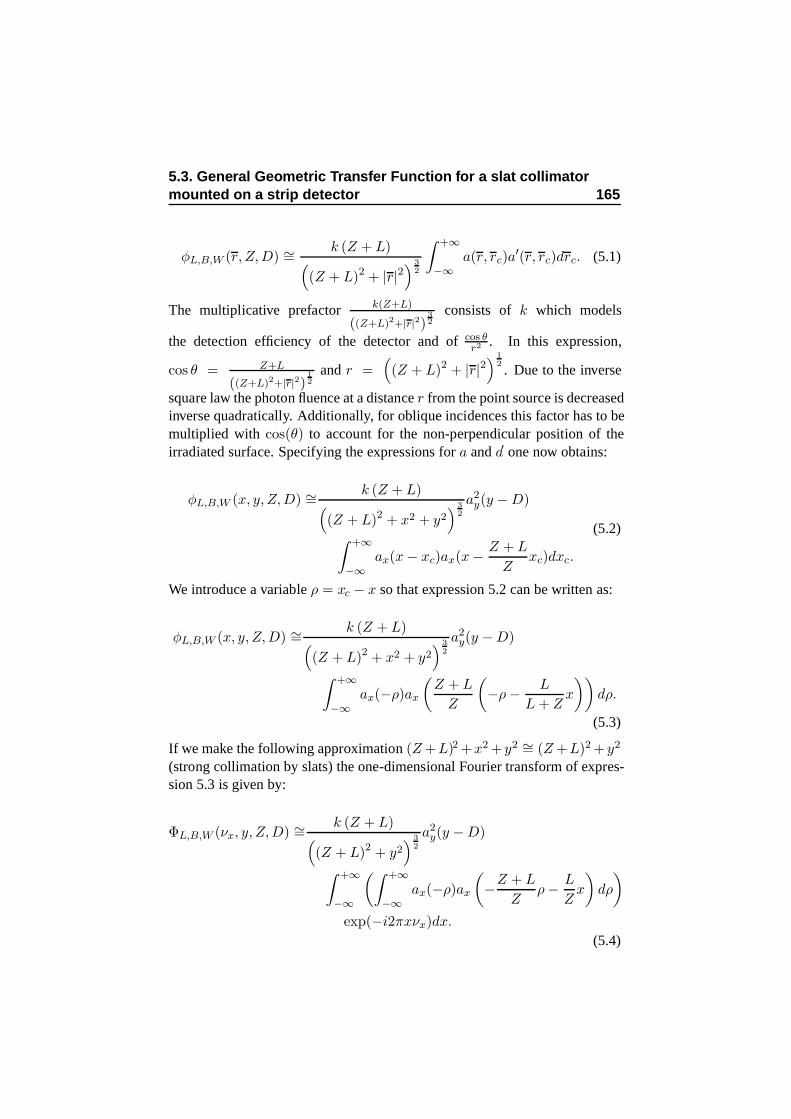
5.3. General Geometric Transfer Function for a slat collimatormounted on a strip detector 165
φL,B,W (r, Z,D) ∼= k (Z + L)(
(Z + L)2 + |r|2)
32
∫ +∞
−∞a(r, rc)a
′(r, rc)drc. (5.1)
The multiplicative prefactor k(Z+L)
((Z+L)2+|r|2)32
consists of k which models
the detection efficiency of the detector and of cos θr2 . In this expression,
cos θ = Z+L
((Z+L)2+|r|2)12
and r =(
(Z + L)2 + |r|2)
12. Due to the inverse
square law the photon fluence at a distance r from the point source is decreasedinverse quadratically. Additionally, for oblique incidences this factor has to bemultiplied with cos(θ) to account for the non-perpendicular position of theirradiated surface. Specifying the expressions for a and a′ one now obtains:
φL,B,W (x, y, Z,D) ∼= k (Z + L)(
(Z + L)2 + x2 + y2)
32
a2y(y − D)
∫ +∞
−∞ax(x − xc)ax(x − Z + L
Zxc)dxc.
(5.2)
We introduce a variable ρ = xc − x so that expression 5.2 can be written as:
φL,B,W (x, y, Z,D) ∼= k (Z + L)(
(Z + L)2 + x2 + y2)
32
a2y(y − D)
∫ +∞
−∞ax(−ρ)ax
(
Z + L
Z
(
−ρ − L
L + Zx
))
dρ.
(5.3)
If we make the following approximation (Z +L)2 +x2 +y2 ∼= (Z +L)2 +y2
(strong collimation by slats) the one-dimensional Fourier transform of expres-sion 5.3 is given by:
ΦL,B,W (νx, y, Z,D) ∼= k (Z + L)(
(Z + L)2 + y2)
32
a2y(y − D)
∫ +∞
−∞
(∫ +∞
−∞ax(−ρ)ax
(
−Z + L
Zρ − L
Zx
)
dρ
)
exp(−i2πxνx)dx.
(5.4)
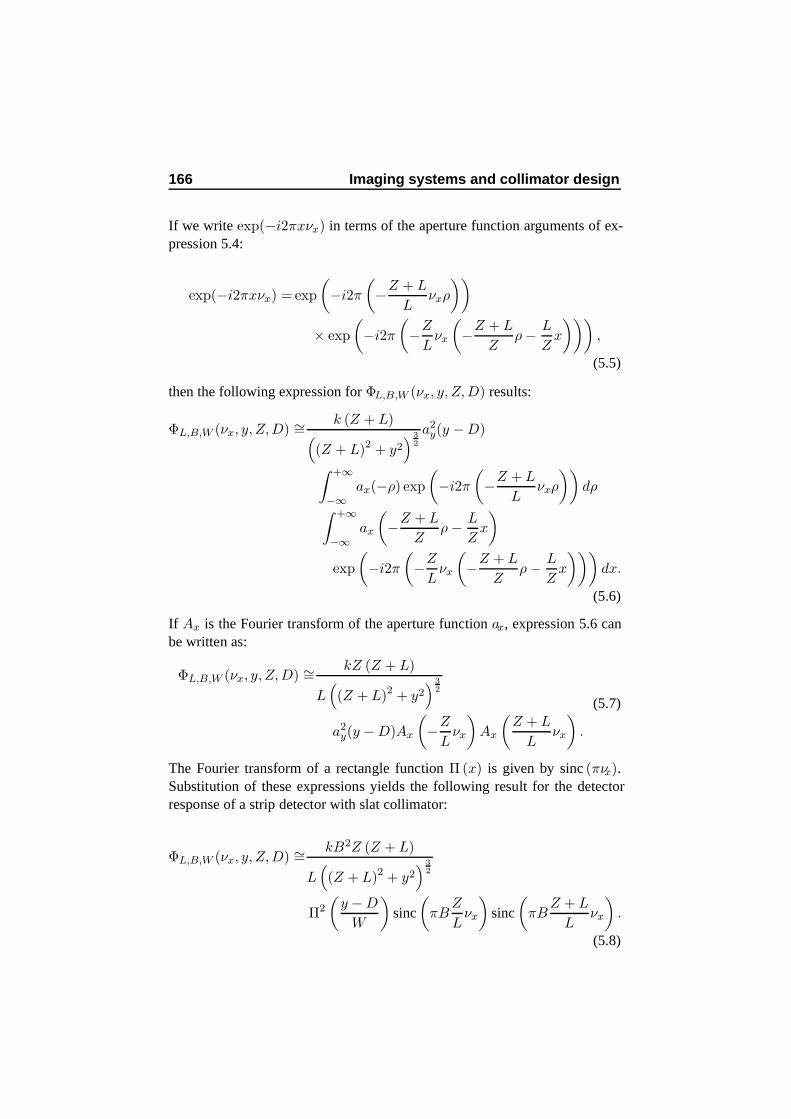
166 Imaging systems and collimator design
If we write exp(−i2πxνx) in terms of the aperture function arguments of ex-pression 5.4:
exp(−i2πxνx) = exp
(
−i2π
(
−Z + L
Lνxρ
))
× exp
(
−i2π
(
−Z
Lνx
(
−Z + L
Zρ − L
Zx
)))
,
(5.5)
then the following expression for ΦL,B,W (νx, y, Z,D) results:
ΦL,B,W (νx, y, Z,D) ∼= k (Z + L)(
(Z + L)2 + y2)
32
a2y(y − D)
∫ +∞
−∞ax(−ρ) exp
(
−i2π
(
−Z + L
Lνxρ
))
dρ
∫ +∞
−∞ax
(
−Z + L
Zρ − L
Zx
)
exp
(
−i2π
(
−Z
Lνx
(
−Z + L
Zρ − L
Zx
)))
dx.
(5.6)
If Ax is the Fourier transform of the aperture function ax, expression 5.6 canbe written as:
ΦL,B,W (νx, y, Z,D) ∼= kZ (Z + L)
L(
(Z + L)2 + y2)
32
a2y(y − D)Ax
(
−Z
Lνx
)
Ax
(
Z + L
Lνx
)
.
(5.7)
The Fourier transform of a rectangle function Π(x) is given by sinc (πνx).Substitution of these expressions yields the following result for the detectorresponse of a strip detector with slat collimator:
ΦL,B,W (νx, y, Z,D) ∼= kB2Z (Z + L)
L(
(Z + L)2 + y2)
32
Π2
(
y − D
W
)
sinc
(
πBZ
Lνx
)
sinc
(
πBZ + L
Lνx
)
.
(5.8)
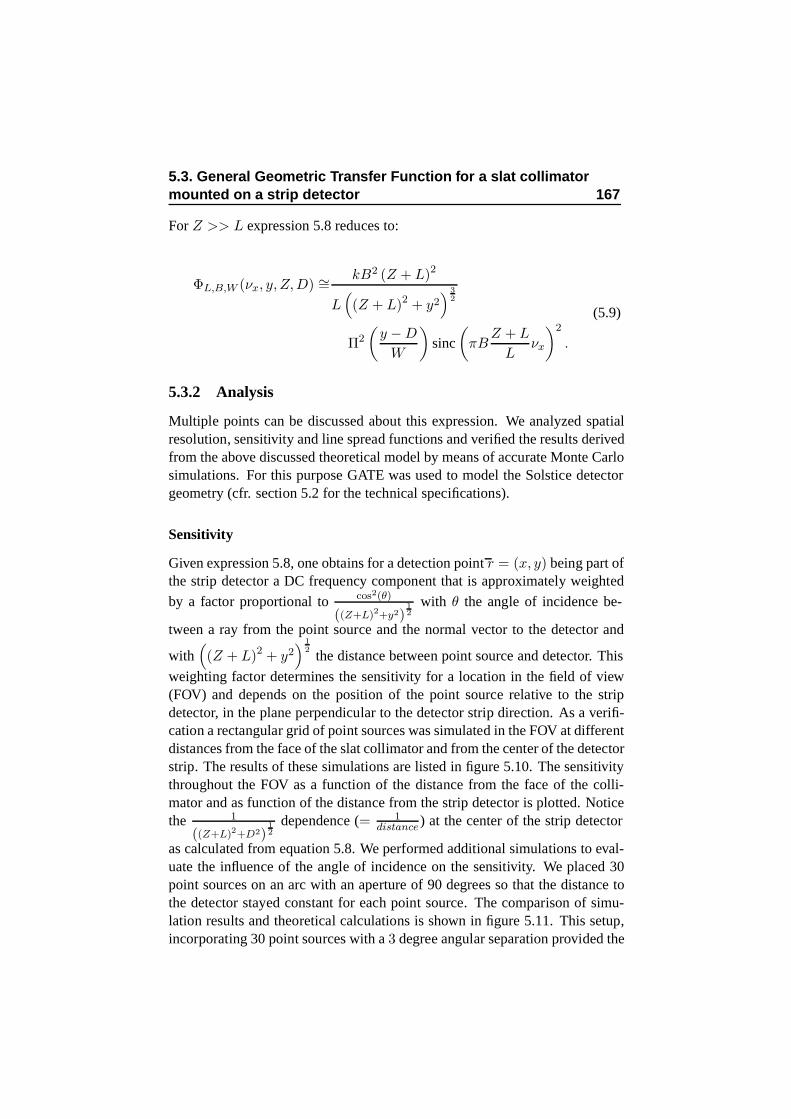
5.3. General Geometric Transfer Function for a slat collimatormounted on a strip detector 167
For Z >> L expression 5.8 reduces to:
ΦL,B,W (νx, y, Z,D) ∼= kB2 (Z + L)2
L(
(Z + L)2 + y2)
32
Π2
(
y − D
W
)
sinc
(
πBZ + L
Lνx
)2
.
(5.9)
5.3.2 Analysis
Multiple points can be discussed about this expression. We analyzed spatialresolution, sensitivity and line spread functions and verified the results derivedfrom the above discussed theoretical model by means of accurate Monte Carlosimulations. For this purpose GATE was used to model the Solstice detectorgeometry (cfr. section 5.2 for the technical specifications).
Sensitivity
Given expression 5.8, one obtains for a detection point r = (x, y) being part ofthe strip detector a DC frequency component that is approximately weighted
by a factor proportional to cos2(θ)
((Z+L)2+y2)12
with θ the angle of incidence be-
tween a ray from the point source and the normal vector to the detector and
with(
(Z + L)2 + y2)
12
the distance between point source and detector. This
weighting factor determines the sensitivity for a location in the field of view(FOV) and depends on the position of the point source relative to the stripdetector, in the plane perpendicular to the detector strip direction. As a verifi-cation a rectangular grid of point sources was simulated in the FOV at differentdistances from the face of the slat collimator and from the center of the detectorstrip. The results of these simulations are listed in figure 5.10. The sensitivitythroughout the FOV as a function of the distance from the face of the colli-mator and as function of the distance from the strip detector is plotted. Noticethe 1
((Z+L)2+D2)12
dependence (= 1distance ) at the center of the strip detector
as calculated from equation 5.8. We performed additional simulations to eval-uate the influence of the angle of incidence on the sensitivity. We placed 30point sources on an arc with an aperture of 90 degrees so that the distance tothe detector stayed constant for each point source. The comparison of simu-lation results and theoretical calculations is shown in figure 5.11. This setup,incorporating 30 point sources with a 3 degree angular separation provided the
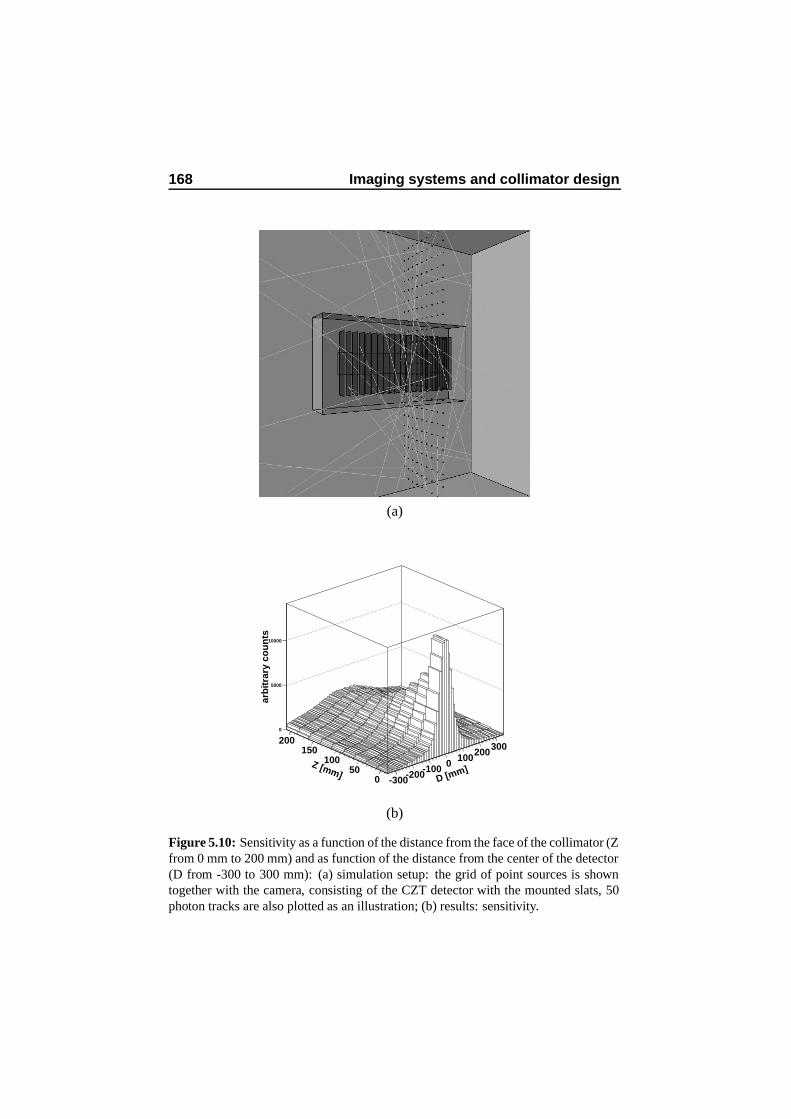
168 Imaging systems and collimator design
(a)
D [mm]-300-200-100 0 100200300
Z [mm] 050
100150
200
arb
itra
ry c
ou
nts
0
5000
10000
(b)
Figure 5.10: Sensitivity as a function of the distance from the face of the collimator (Zfrom 0 mm to 200 mm) and as function of the distance from the center of the detector(D from -300 to 300 mm): (a) simulation setup: the grid of point sources is showntogether with the camera, consisting of the CZT detector with the mounted slats, 50photon tracks are also plotted as an illustration; (b) results: sensitivity.
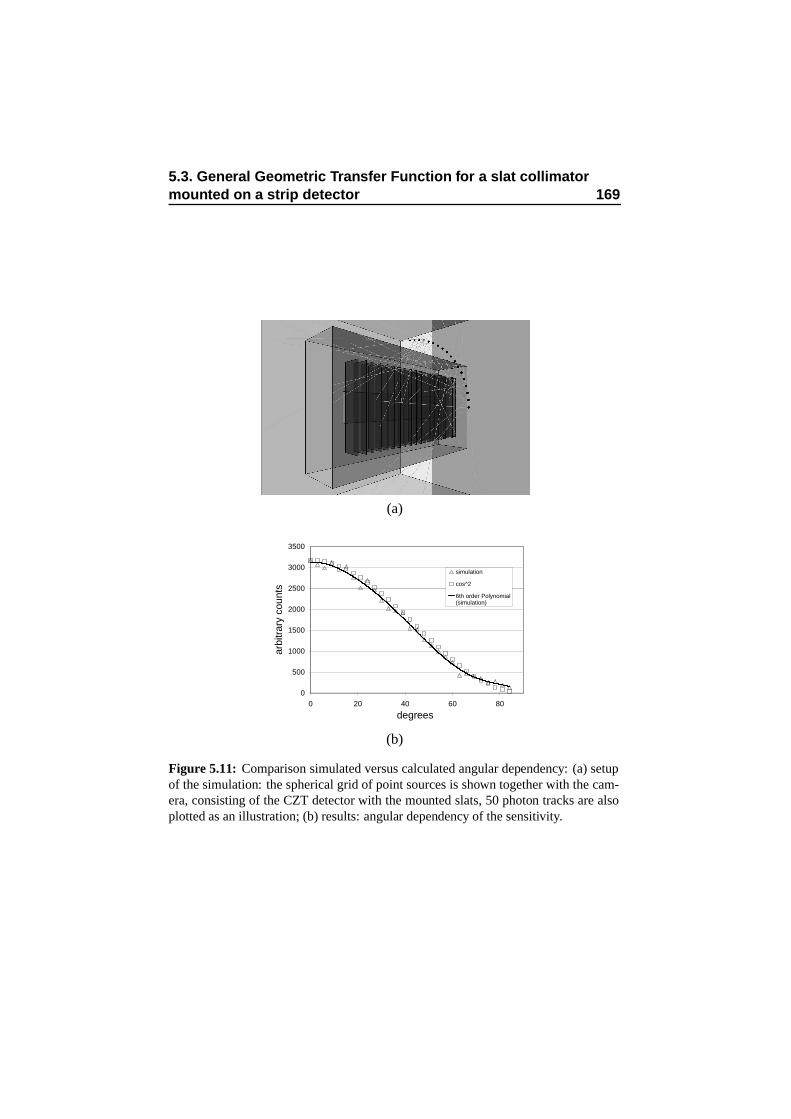
5.3. General Geometric Transfer Function for a slat collimatormounted on a strip detector 169
(a)
0
500
1000
1500
2000
2500
3000
3500
0 20 40 60 80
degrees
arbi
trar
y co
unts
simulation
cos^2
6th order Polynomial(simulation)
(b)
Figure 5.11: Comparison simulated versus calculated angular dependency: (a) setupof the simulation: the spherical grid of point sources is shown together with the cam-era, consisting of the CZT detector with the mounted slats, 50 photon tracks are alsoplotted as an illustration; (b) results: angular dependency of the sensitivity.
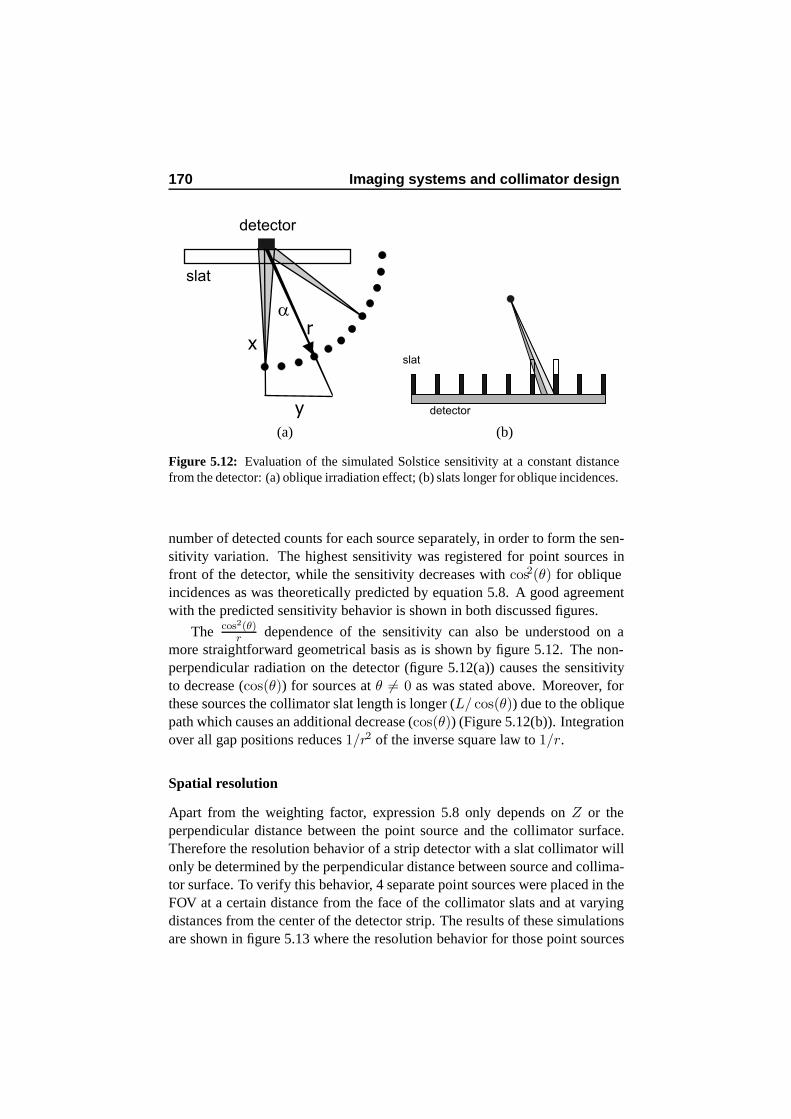
170 Imaging systems and collimator design
a
rx
y
slat
detector
slat
detector
(a) (b)
Figure 5.12: Evaluation of the simulated Solstice sensitivity at a constant distancefrom the detector: (a) oblique irradiation effect; (b) slats longer for oblique incidences.
number of detected counts for each source separately, in order to form the sen-sitivity variation. The highest sensitivity was registered for point sources infront of the detector, while the sensitivity decreases with cos2(θ) for obliqueincidences as was theoretically predicted by equation 5.8. A good agreementwith the predicted sensitivity behavior is shown in both discussed figures.
The cos2(θ)r dependence of the sensitivity can also be understood on a
more straightforward geometrical basis as is shown by figure 5.12. The non-perpendicular radiation on the detector (figure 5.12(a)) causes the sensitivityto decrease (cos(θ)) for sources at θ 6= 0 as was stated above. Moreover, forthese sources the collimator slat length is longer (L/ cos(θ)) due to the obliquepath which causes an additional decrease (cos(θ)) (Figure 5.12(b)). Integrationover all gap positions reduces 1/r2 of the inverse square law to 1/r.
Spatial resolution
Apart from the weighting factor, expression 5.8 only depends on Z or theperpendicular distance between the point source and the collimator surface.Therefore the resolution behavior of a strip detector with a slat collimator willonly be determined by the perpendicular distance between source and collima-tor surface. To verify this behavior, 4 separate point sources were placed in theFOV at a certain distance from the face of the collimator slats and at varyingdistances from the center of the detector strip. The results of these simulationsare shown in figure 5.13 where the resolution behavior for those point sources
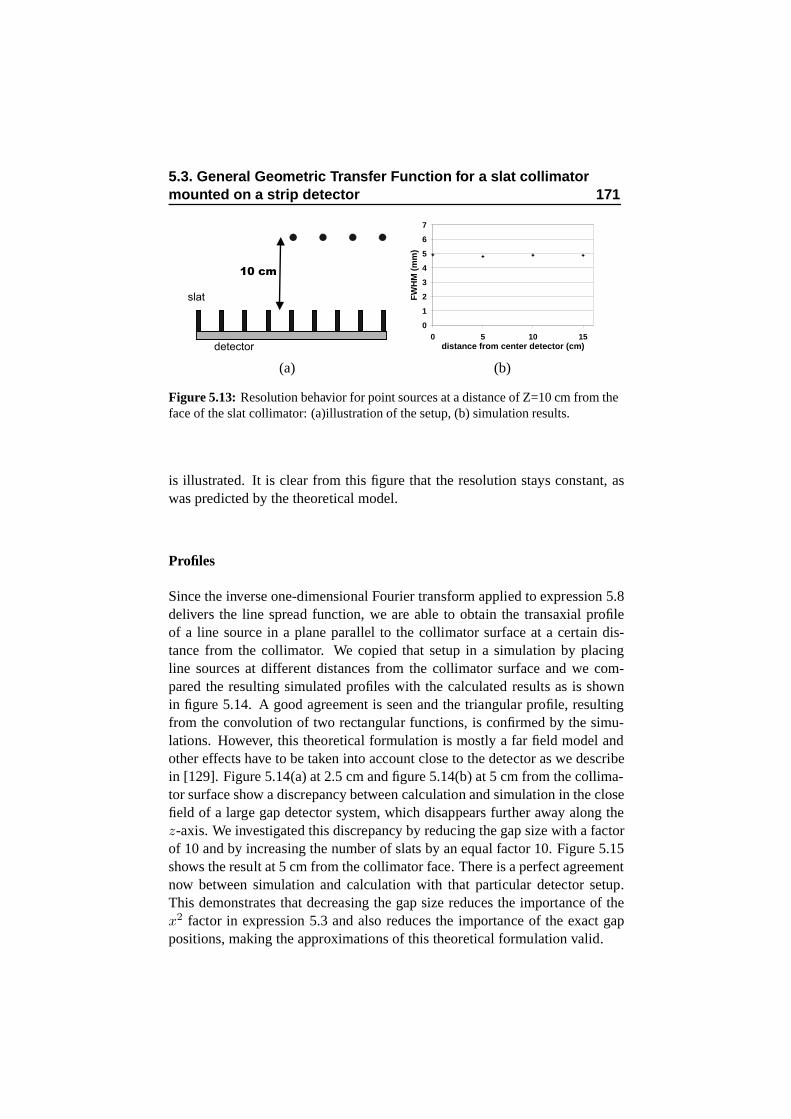
5.3. General Geometric Transfer Function for a slat collimatormounted on a strip detector 171
slat
detector
10 cm
0
1
2
3
4
5
6
7
0 5 10 15distance from center detector (cm)
FW
HM
(m
m)
(a) (b)
Figure 5.13: Resolution behavior for point sources at a distance of Z=10 cm from theface of the slat collimator: (a)illustration of the setup, (b) simulation results.
is illustrated. It is clear from this figure that the resolution stays constant, aswas predicted by the theoretical model.
Profiles
Since the inverse one-dimensional Fourier transform applied to expression 5.8delivers the line spread function, we are able to obtain the transaxial profileof a line source in a plane parallel to the collimator surface at a certain dis-tance from the collimator. We copied that setup in a simulation by placingline sources at different distances from the collimator surface and we com-pared the resulting simulated profiles with the calculated results as is shownin figure 5.14. A good agreement is seen and the triangular profile, resultingfrom the convolution of two rectangular functions, is confirmed by the simu-lations. However, this theoretical formulation is mostly a far field model andother effects have to be taken into account close to the detector as we describein [129]. Figure 5.14(a) at 2.5 cm and figure 5.14(b) at 5 cm from the collima-tor surface show a discrepancy between calculation and simulation in the closefield of a large gap detector system, which disappears further away along thez-axis. We investigated this discrepancy by reducing the gap size with a factorof 10 and by increasing the number of slats by an equal factor 10. Figure 5.15shows the result at 5 cm from the collimator face. There is a perfect agreementnow between simulation and calculation with that particular detector setup.This demonstrates that decreasing the gap size reduces the importance of thex2 factor in expression 5.3 and also reduces the importance of the exact gappositions, making the approximations of this theoretical formulation valid.
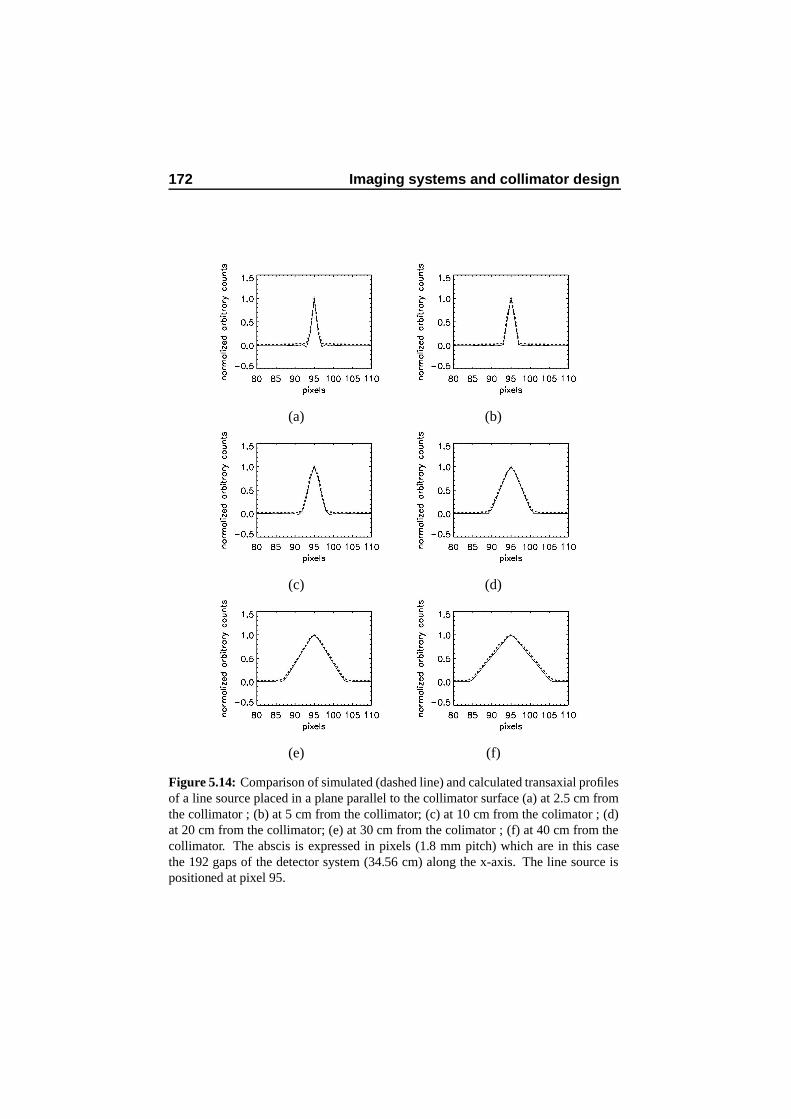
172 Imaging systems and collimator design
(a) (b)
(c) (d)
(e) (f)
Figure 5.14: Comparison of simulated (dashed line) and calculated transaxial profilesof a line source placed in a plane parallel to the collimator surface (a) at 2.5 cm fromthe collimator ; (b) at 5 cm from the collimator; (c) at 10 cm from the colimator ; (d)at 20 cm from the collimator; (e) at 30 cm from the colimator ; (f) at 40 cm from thecollimator. The abscis is expressed in pixels (1.8 mm pitch) which are in this casethe 192 gaps of the detector system (34.56 cm) along the x-axis. The line source ispositioned at pixel 95.
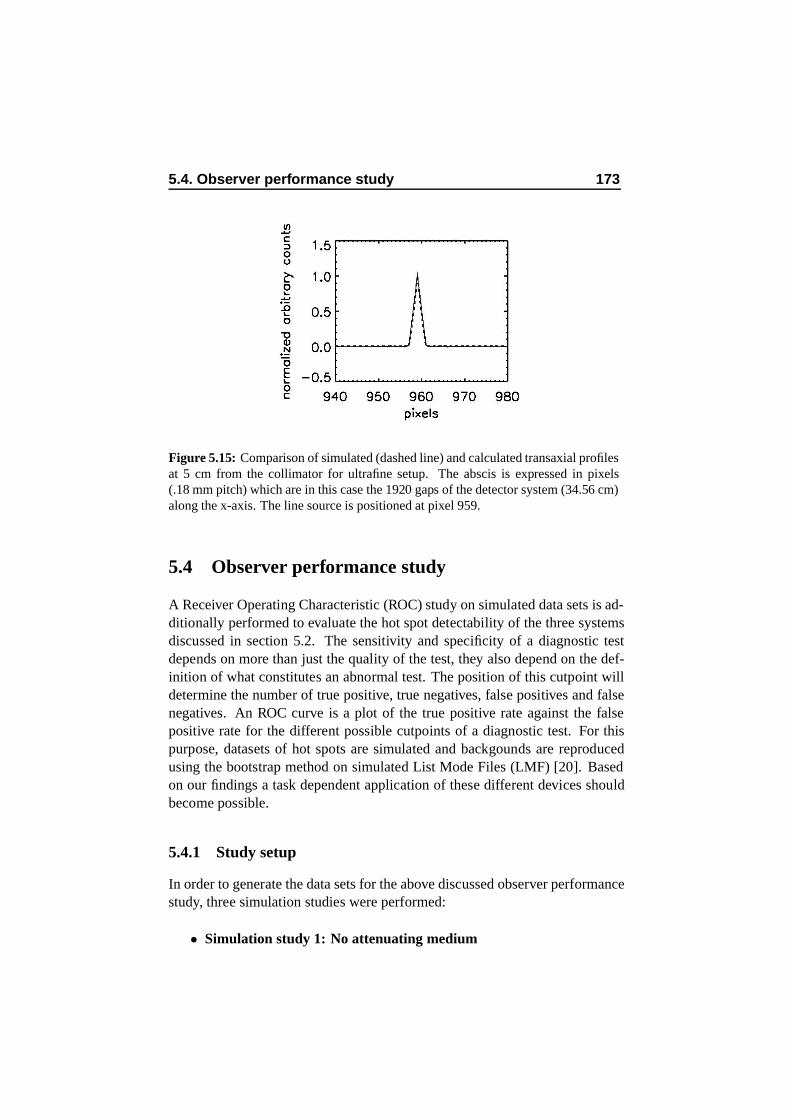
5.4. Observer performance study 173
Figure 5.15: Comparison of simulated (dashed line) and calculated transaxial profilesat 5 cm from the collimator for ultrafine setup. The abscis is expressed in pixels(.18 mm pitch) which are in this case the 1920 gaps of the detector system (34.56 cm)along the x-axis. The line source is positioned at pixel 959.
5.4 Observer performance study
A Receiver Operating Characteristic (ROC) study on simulated data sets is ad-ditionally performed to evaluate the hot spot detectability of the three systemsdiscussed in section 5.2. The sensitivity and specificity of a diagnostic testdepends on more than just the quality of the test, they also depend on the def-inition of what constitutes an abnormal test. The position of this cutpoint willdetermine the number of true positive, true negatives, false positives and falsenegatives. An ROC curve is a plot of the true positive rate against the falsepositive rate for the different possible cutpoints of a diagnostic test. For thispurpose, datasets of hot spots are simulated and backgounds are reproducedusing the bootstrap method on simulated List Mode Files (LMF) [20]. Basedon our findings a task dependent application of these different devices shouldbecome possible.
5.4.1 Study setup
In order to generate the data sets for the above discussed observer performancestudy, three simulation studies were performed:
• Simulation study 1: No attenuating medium
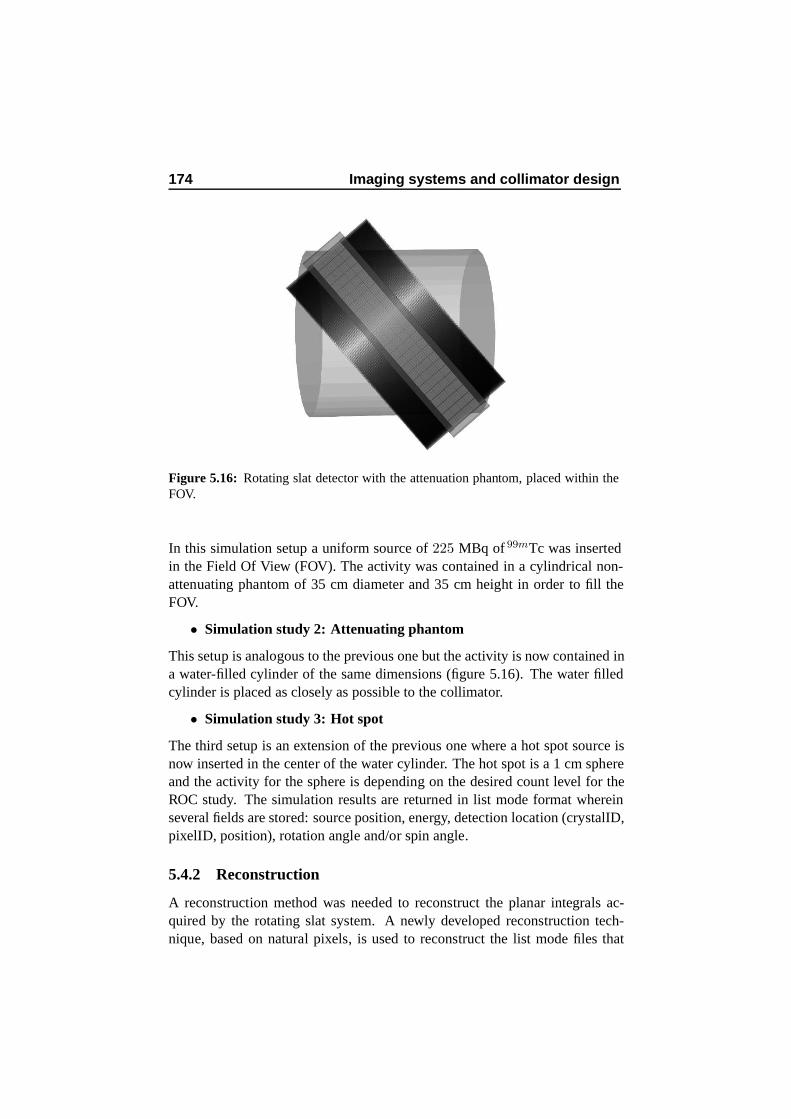
174 Imaging systems and collimator design
Figure 5.16: Rotating slat detector with the attenuation phantom, placed within theFOV.
In this simulation setup a uniform source of 225 MBq of 99mTc was insertedin the Field Of View (FOV). The activity was contained in a cylindrical non-attenuating phantom of 35 cm diameter and 35 cm height in order to fill theFOV.
• Simulation study 2: Attenuating phantom
This setup is analogous to the previous one but the activity is now contained ina water-filled cylinder of the same dimensions (figure 5.16). The water filledcylinder is placed as closely as possible to the collimator.
• Simulation study 3: Hot spot
The third setup is an extension of the previous one where a hot spot source isnow inserted in the center of the water cylinder. The hot spot is a 1 cm sphereand the activity for the sphere is depending on the desired count level for theROC study. The simulation results are returned in list mode format whereinseveral fields are stored: source position, energy, detection location (crystalID,pixelID, position), rotation angle and/or spin angle.
5.4.2 Reconstruction
A reconstruction method was needed to reconstruct the planar integrals ac-quired by the rotating slat system. A newly developed reconstruction tech-nique, based on natural pixels, is used to reconstruct the list mode files that
5.4. Observer performance study 175
result from the aforementioned simulation studies [125]. This natural pixelapproach will be discussed in Chapter 7. The first simulation study (withoutattenuating phantom) is used to generate system matrices for the different se-tups. For each detected event, the source position is stored in these list modefiles making it possible to obtain a system matrix in that way. The AlgebraicReconstruction Technique (ART) (section 2.1.6) is chosen to solve the recon-struction equation iteratively as the convergence is faster than for other algo-rithms and as it is not constrained to positive values only so that subdivisionsof image space can be eliminated in the backprojection.
5.4.3 Performance Analysis: ROC study
In order to evaluate the hot spot detectability for different collimator setupswe compared the two solid state devices with respectively a parallel beam androtating slat collimator together with the NaI setup using a dedicated ROC-analysis [115]. We presented four human observers 3 series of 100 images:50 as a training set and 50 images to be scored. In 25 images of each set ahot spot was present while the other 25 images consisted of only backgroundactivity. For this purpose Simulation study 2 and Simulation study 3 (sec-tion 5.4.1) were applied for all acquisition setups. The count level in the hotspot was chosen so that the ROC area under the curve would be around 0.8to 0.9 for the rotating slat acquistion module. This resulted in a backgroundfile of 1.7 million counts registered over a 35 cm by 5.76 cm area for the 360spin angles. The detected number of counts for the hot spot was 7.5 kcountsfor a sphere of 1 cm diameter, again for the 360 spin angles. We then simu-lated the same activity for the parallel hole setups and generated in that waytwo other series of 50 images of which half contained a hot spot signal. Inorder to obtain these three datasets, 3 × 25 signal (hot spot) realisations weresimulated while only one background file was simulated for each series. Thatbackground list mode file was then bootstrapped [20] in order to achieve 50separate background files. In recent literature this was proven to be a correcttechnique for ROC analysis with numerical observers [31, 47]. We showedvery recently [32,33] that this technique is also extensible to human observers,preserved that the background of all reconstructed files is replaced by a me-dian smoothed version of the original background file. The main differencebetween bootstrapped images and noisy realisations is this mean background.For the bootstrapped images this is the reconstruction of the original file whichresults in a doubled variance. In numerical observer studies the background issubtracted which solves this issue. Human observers however can not do thisand therefore the reconstructed image of the original background list mode file
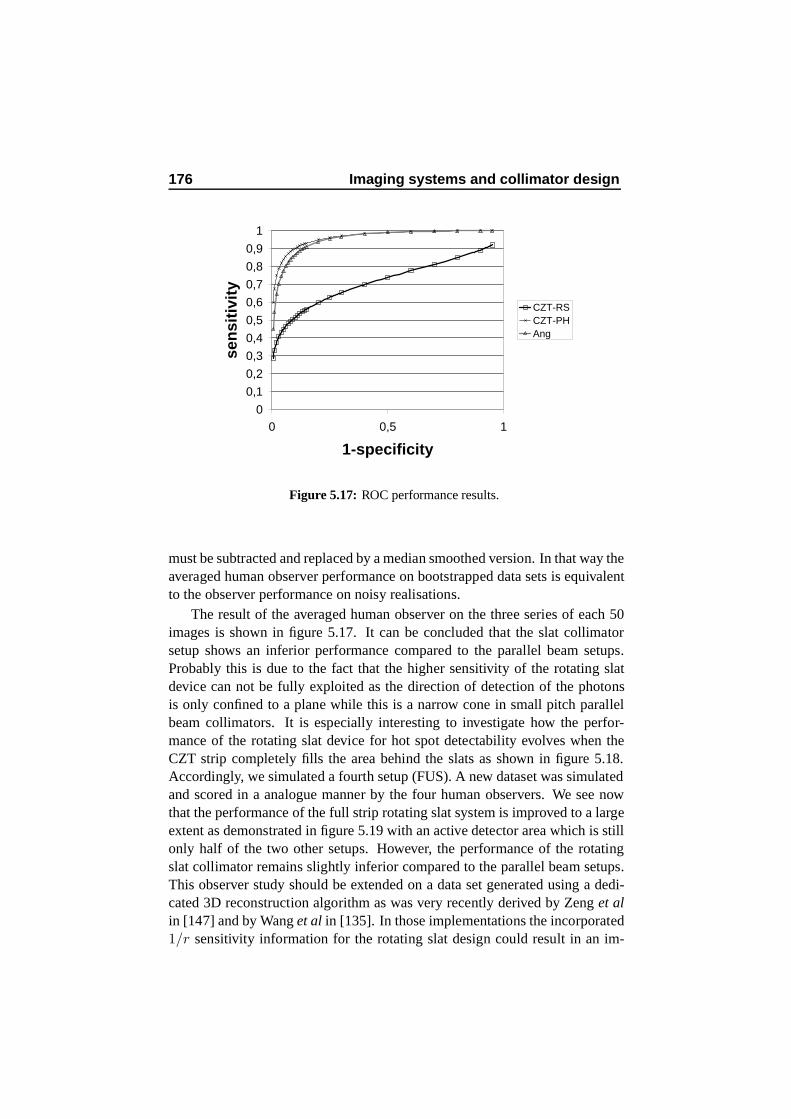
176 Imaging systems and collimator design
0
0,1
0,2
0,3
0,4
0,5
0,6
0,7
0,8
0,9
1
0 0,5 1
1-specificity
sen
siti
vity
CZT-RSCZT-PHAng
Figure 5.17: ROC performance results.
must be subtracted and replaced by a median smoothed version. In that way theaveraged human observer performance on bootstrapped data sets is equivalentto the observer performance on noisy realisations.
The result of the averaged human observer on the three series of each 50images is shown in figure 5.17. It can be concluded that the slat collimatorsetup shows an inferior performance compared to the parallel beam setups.Probably this is due to the fact that the higher sensitivity of the rotating slatdevice can not be fully exploited as the direction of detection of the photonsis only confined to a plane while this is a narrow cone in small pitch parallelbeam collimators. It is especially interesting to investigate how the perfor-mance of the rotating slat device for hot spot detectability evolves when theCZT strip completely fills the area behind the slats as shown in figure 5.18.Accordingly, we simulated a fourth setup (FUS). A new dataset was simulatedand scored in a analogue manner by the four human observers. We see nowthat the performance of the full strip rotating slat system is improved to a largeextent as demonstrated in figure 5.19 with an active detector area which is stillonly half of the two other setups. However, the performance of the rotatingslat collimator remains slightly inferior compared to the parallel beam setups.This observer study should be extended on a data set generated using a dedi-cated 3D reconstruction algorithm as was very recently derived by Zeng et alin [147] and by Wang et al in [135]. In those implementations the incorporated1/r sensitivity information for the rotating slat design could result in an im-
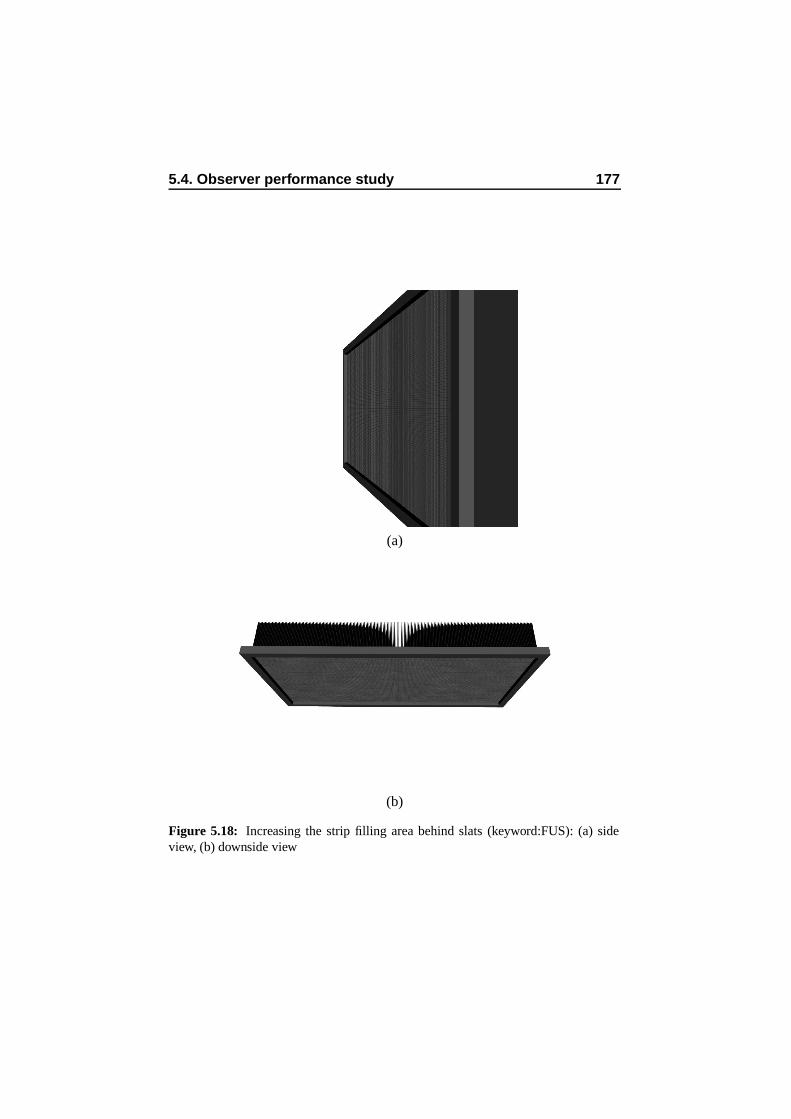
5.4. Observer performance study 177
(a)
(b)
Figure 5.18: Increasing the strip filling area behind slats (keyword:FUS): (a) sideview, (b) downside view
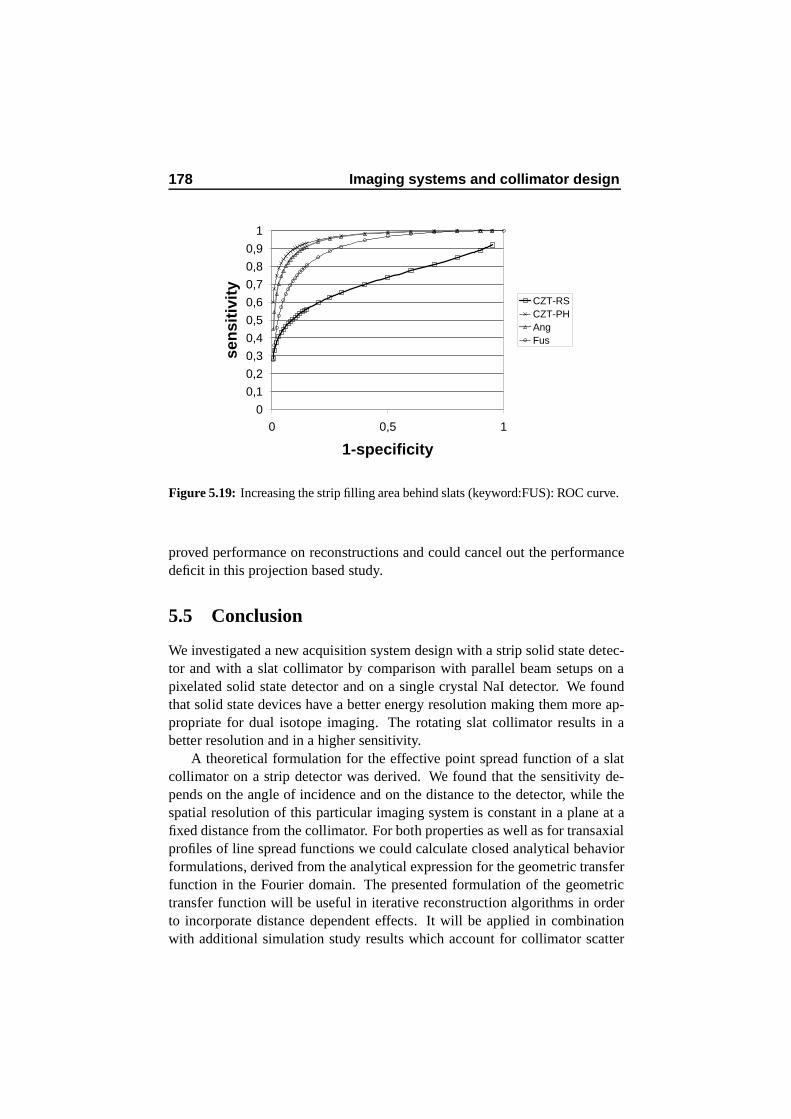
178 Imaging systems and collimator design
0
0,1
0,2
0,3
0,4
0,5
0,6
0,7
0,8
0,9
1
0 0,5 1
1-specificity
sen
siti
vity
CZT-RSCZT-PHAngFus
Figure 5.19: Increasing the strip filling area behind slats (keyword:FUS): ROC curve.
proved performance on reconstructions and could cancel out the performancedeficit in this projection based study.
5.5 Conclusion
We investigated a new acquisition system design with a strip solid state detec-tor and with a slat collimator by comparison with parallel beam setups on apixelated solid state detector and on a single crystal NaI detector. We foundthat solid state devices have a better energy resolution making them more ap-propriate for dual isotope imaging. The rotating slat collimator results in abetter resolution and in a higher sensitivity.
A theoretical formulation for the effective point spread function of a slatcollimator on a strip detector was derived. We found that the sensitivity de-pends on the angle of incidence and on the distance to the detector, while thespatial resolution of this particular imaging system is constant in a plane at afixed distance from the collimator. For both properties as well as for transaxialprofiles of line spread functions we could calculate closed analytical behaviorformulations, derived from the analytical expression for the geometric transferfunction in the Fourier domain. The presented formulation of the geometrictransfer function will be useful in iterative reconstruction algorithms in orderto incorporate distance dependent effects. It will be applied in combinationwith additional simulation study results which account for collimator scatter
5.5. Conclusion 179
and septal penetration of the slats, a contribution that only gains importancewith higher energy isotopes.
A rotating slat collimator has a higher sensitivity but each photon is col-lected in a plane and thus contains less information. So, additionally, a compar-ison between three types of imaging devices has been performed. As far as thecontrast and hot spot detectability is concerned, the classical collimator setupon a CZT and on a NaI detector outperforms the rotating slat equivalent. How-ever when we increased the strip width behind the slats, the performance ofthe rotating slat collimator closed in on the parallel beam setup performances.This is promising since the active detector area in the rotating slat design is,in this case, still only half of the two other acquisition models. The solid statesetups have the disadvantage of economic cost however as the CZT material isfar more expensive than a NaI crystal.
This work resulted in two peer reviewed journal articles [104, 130] andin three publications in the proceedings of international conferences [70, 102,129]. We extended the work of Metz [79], and Tsui [121] for the geomet-ric transfer function of a slat collimator on a strip detector. Additionally, thischapter describes the first human observer study on Solstice imaging perfor-mance in order to allow a task dependent application of those modalities infuture clinical practice.

180 Imaging systems and collimator design
Chapter 6
Detector modeling
6.1 Introduction
In the previous chapter we demonstrated the use of Monte Carlo simulationsfor new acquisition system design. Another important application field ofMonte Carlo simulations is intrinsic detector modeling: detector responses,efficiencies, light per gamma ray interaction, rise and decay times, stoppingpower, spatial and energy resolution. One of the main fields of interest is res-olution recovery in PET. Due to the finite pixelization and due to the limitednumber of PMTs there is an intrinsic detection location uncertainty causingan inherent pointspread function on all registrations. However, the penetrationof annihilation photons into the detector material before interaction is a sta-tistical process which leads to significant displacement and anisotropy of thispointspread function.
Iterative reconstruction algorithms for PET imaging require an accuratemodeling of the acquisition process. In the past, our group has developed a listmode reconstruction algorithm for continuous detector PET, making use of asimple line of response (LOR) model [127,128], in which intersection lengthsdescribe the probability that an emission occured in a voxel of the Field OfView (FOV). This simple model does not account for the intrinsic resolutiondiscussed above. In this chapter we will describe a theoretical model of thespatial uncertainty for a line of response, due to the imperfect localization ofevents on the detector heads in order to recover this intrinsic spatial resolution.
For oblique incidences the incorporation of the effect of the crystal thick-ness will appear to be necessary to account for the aforementioned crystal pen-etration. A thorough study of the theoretical model and examples of probabil-ity density functions (pdfs) will be described for all cases. Moreover, appro-priate functions will be fit to the transversal profiles of these pdfs and their
182 Detector modeling
characteristics will be investigated. The features of the derived model can onlybe verified by Monte Carlo simulations since those Depth of Interaction (DOI)-dependent experiments are very hard to perform with current state of the arttechnology (limited resolution). After an affirmative accuracy verification, thedescribed model can be used to incorporate the intrinsic resolution effect inthe reconstruction process by means of a better defined acquisition process.This should improve the spatial resolution of the resulting tomographic im-ages. Two different approaches for incorporation in reconstruction algorithmswill be proposed. The most promising of those reconstruction methods willthen be discussed in Chapter 7.
6.2 Theoretical derivation
We will deal with the twodimensional case of perpendicular incidences onan acquisition setup consisting of two parallel continuous detector heads first,and extend it into three dimensions afterwards. We will then study obliqueincidences in two and three dimensions.
6.2.1 Perpendicular incidences
We will start with the twodimensional case of perpendicular incidences. Forthis purpose we need a model for the forward problem of the uncertainty indetection location. This detector response function is well studied in litera-ture [50, 113, 114]. We assume a Gaussian distribution (standard deviationσ0y) for the actual position of interaction on the detector head, centered at themeasured position for the likelihood that an event at a given point in the field ofview gives rise to that particular detection location. For the evaluation of the aposteriori probability S(p, q) that an event originates from a point (p, q) in theFOV, given the detection locations, we integrate all possible LORs through thatpoint, weighted with the Gaussian detection likelihood at the LOR’s end points(figure 6.1). This a posteriori probability density function can then be incor-porated in an upgraded version of the aforementioned list mode reconstructionalgorithm. We obtain the following expression for the probability:
S(p, q) =
∫ |θmax|
−|θmin|s(θ)dθ
S(p, q) =1
2πσ20y
∫ |θmax|
−|θmin|ew(θ)dθ
w(θ) = − [(D/2 − p) tan θ + q]2 + [−(D/2 + p) tan θ + q]2
2σ0y2
.(6.1)
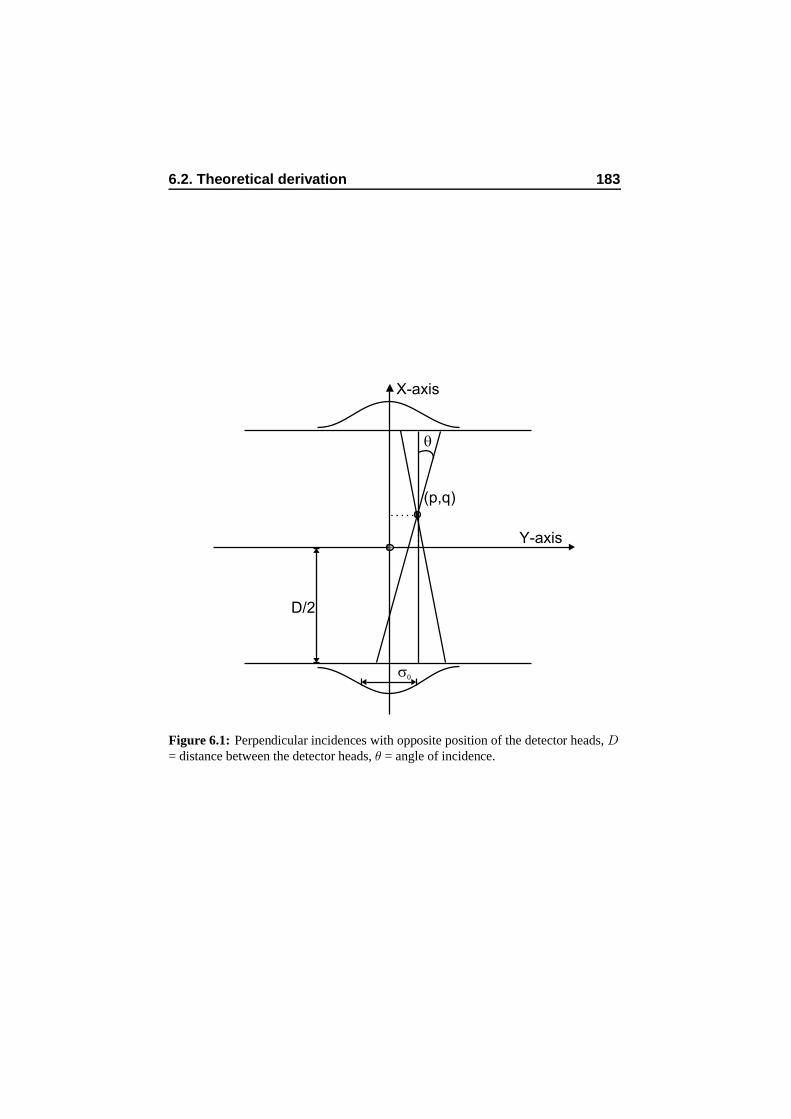
6.2. Theoretical derivation 183
(p,q)
Y-axis
X-axis
D/2
s0
q
Figure 6.1: Perpendicular incidences with opposite position of the detector heads, D= distance between the detector heads, θ = angle of incidence.
184 Detector modeling
In equation (6.1) [(D/2 − p) tan θ + q] is the position of interaction on theupper detector while [−(D/2+p) tan θ+q] is the position of interaction on thelower detector head, both expressed in the coordinate system of figure 6.1. Weassume that the crystal thickness has no influence on the detection probability,which is appropiate in this case as the angle of incidence of both photons isvery small when σ0y is realistically chosen.
This theoretical model can be extended to three dimensions by assuminga twodimensional Gaussian distribution for the position of interaction on thedetector heads. The Z-axis is perpendicular to the X- and Y -axis (cfr. fig-ure 6.1). The resulting formula is:
S(p, q, r) =
∫ |ϕmax|
−|ϕmin|
∫ |θmax|
−|θmin|s(θ, ϕ) sin θdθdϕ
S(p, q, r) =1
4π2σ0y2σ0z
2
∫ |ϕmax|
−|ϕmin|
∫ |θmax|
−|θmin|ew(θ,ϕ) sin θdθdϕ
w(θ, ϕ) =
−{ [(D/2 − p) tan θ cosϕ + q]2 + [−(D/2 + p) tan θ cos ϕ + q]2
2σ0y2
+[(D/2 − p) tan θ sinϕ + r]2 + [−(D/2 + p) tan θ sinϕ + r]2
2σ0z2
}
.
(6.2)
In equation (6.2) the Z-coordinate is denoted by r and ϕ denotes the azimuthalangle.
6.2.2 Oblique incidences
We will discuss the case of oblique incidences in the next paragraphs. A detec-tor with no physical thickness (perfect detector) is discussed first. Afterwardsthe influence of the photons’ depth of interaction is incorporated in order toobtain a theoretical model for PET dedicated detectors with a realistic finitecrystal thickness.
Perfect detector
The same considerations as in paragraph 6.2.1 can be made for the case wherethe incidences are oblique (figure 6.2). We chose the position of the X-axis to
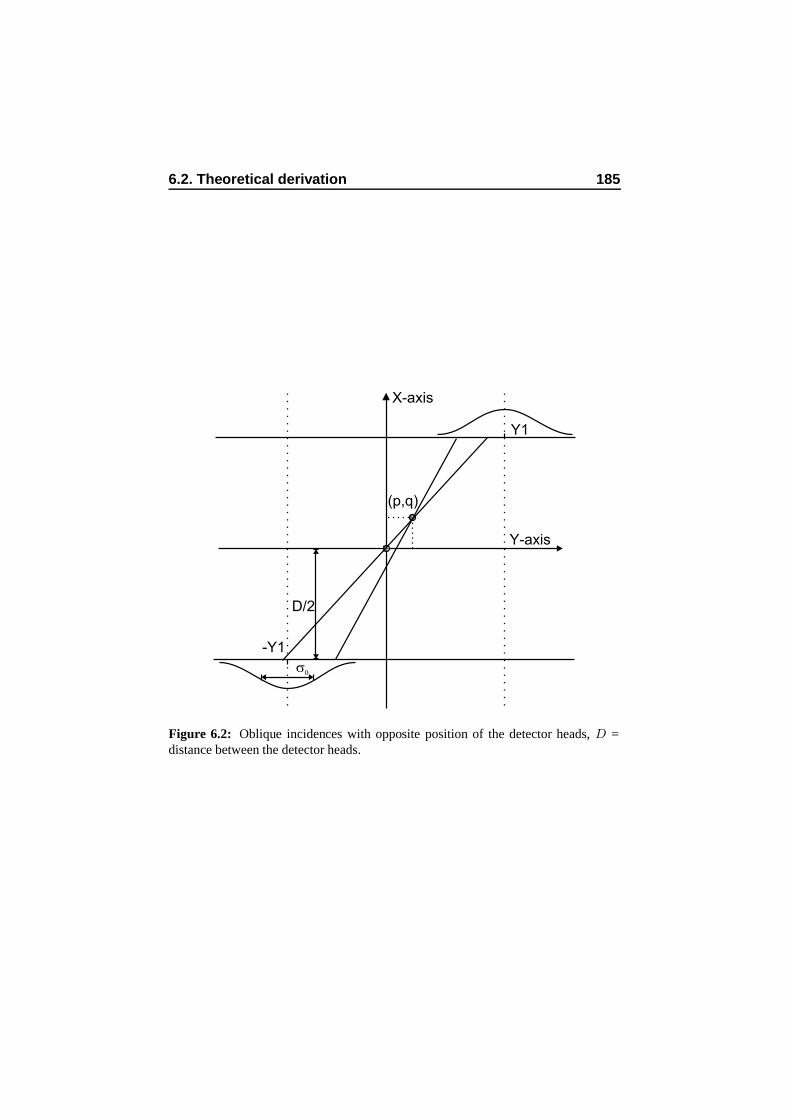
6.2. Theoretical derivation 185
(p,q)
Y-axis
X-axis
D/2
s0
Y1
-Y1
Figure 6.2: Oblique incidences with opposite position of the detector heads, D =distance between the detector heads.
186 Detector modeling
be half way the two detection positions. The resulting formula is:
S(p, q) =
∫ |θmax|
−|θmin|s(θ)dθ
S(p, q) =1
2πσ20y
∫ |θmax|
−|θmin|ew(θ)dθ
w(θ) = −{{[(D/2 − p) tan θ + q] − Y1}2
2σ0y2
+{[−(D/2 + p) tan θ + q] + Y1}2
2σ0y2
}
. (6.3)
In equation (6.3) the positions of interactions on the upper and the lower de-tector are now [(D/2 − p) tan θ + q] − Y1, relative to the upper detector mea-surement in Y1, and [−(D/2+p) tan θ+q]+Y1, relative to the lower detectormeasurement in −Y1 respectively. Equation (6.3) is only correct for a detectorwith no physical thickness.
Finite crystal thickness
In the next paragraphs we state the interaction probability of a 511 keV photonalong its path through the detector to be uniform. Literature [3, 122] confirmsthat this hypothesis is a valid approximation for (gamma camera) PET appli-cations on NaI(Tl) detectors. The total interaction probability of 511 keV pho-tons is thus assumed to be proportional to its path length through the detector.When we incorporate the influence of the crystal thickness d in the theoreticalmodel, the Gaussian model for the detector response is replaced by anotherfunction as will be derived using figure 6.3. The LOR L is parametrized by thepoints of incidence v1 and v2 (defined in the middle of the crystal) while thedetections are registered in j1 and j2. The likelihood p(j1, j2|v1, v2) for a finitecrystal thickness is the product of two convolutions: a convolution of a normal-ized boxcar function, B, and a Gaussian, G, for j1; multiplied with a convolu-tion of the same functions for j2. The width of B in this twodimensional case isd tan θ, t is the interaction point along the Y-axis: t ∈ [v1− d tan θ
2 ; v1 + d tan θ2 ]
for the upper detector and H refers in the following equations to the Heaviside
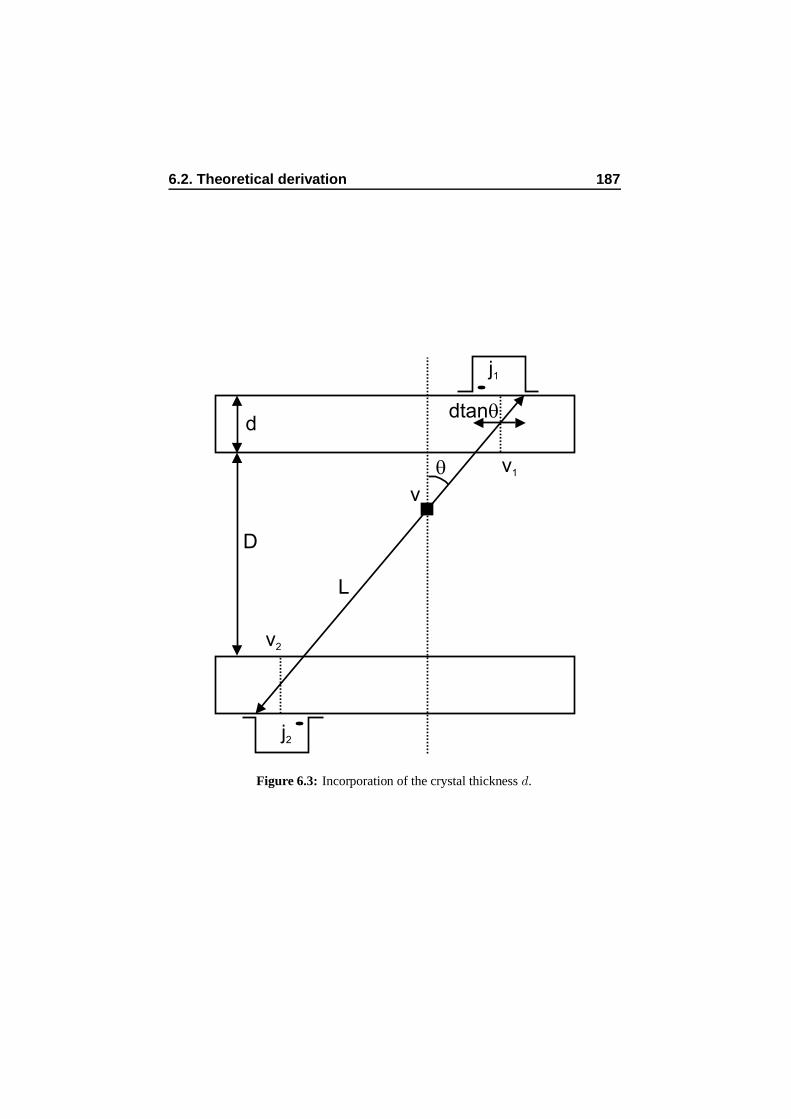
6.2. Theoretical derivation 187
v1
j1
v2
j2
L
v
d
D
q
dtanq
Figure 6.3: Incorporation of the crystal thickness d.
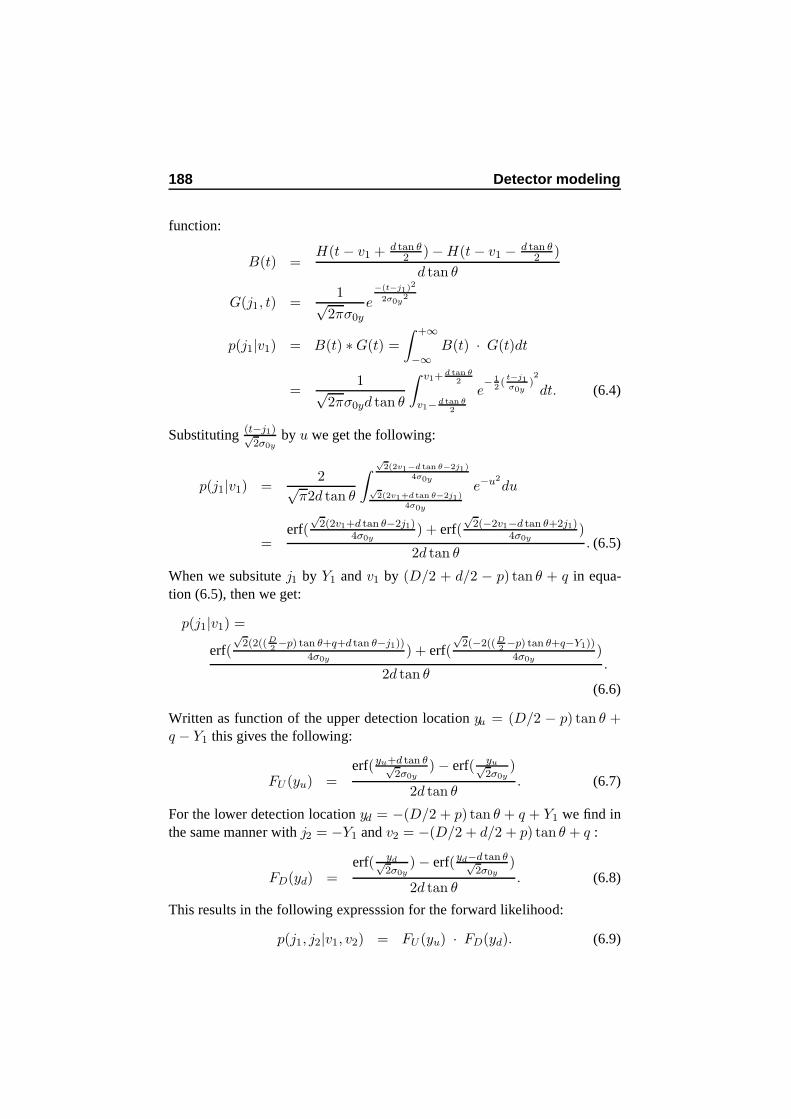
188 Detector modeling
function:
B(t) =H(t − v1 + d tan θ
2 ) − H(t − v1 − d tan θ2 )
d tan θ
G(j1, t) =1√
2πσ0y
e−(t−j1)2
2σ0y2
p(j1|v1) = B(t) ∗ G(t) =
∫ +∞
−∞B(t) · G(t)dt
=1√
2πσ0yd tan θ
∫ v1+ d tan θ2
v1− d tan θ2
e− 1
2(
t−j1σ0y
)2
dt. (6.4)
Substituting (t−j1)√2σ0y
by u we get the following:
p(j1|v1) =2√
π2d tan θ
∫
√2(2v1−d tan θ−2j1)
4σ0y
√2(2v1+d tan θ−2j1)
4σ0y
e−u2du
=erf(
√2(2v1+d tan θ−2j1)
4σ0y) + erf(
√2(−2v1−d tan θ+2j1)
4σ0y)
2d tan θ. (6.5)
When we subsitute j1 by Y1 and v1 by (D/2 + d/2 − p) tan θ + q in equa-tion (6.5), then we get:
p(j1|v1) =
erf(√
2(2((D2−p) tan θ+q+d tan θ−j1))
4σ0y) + erf(
√2(−2((D
2−p) tan θ+q−Y1))
4σ0y)
2d tan θ.
(6.6)
Written as function of the upper detection location yu = (D/2 − p) tan θ +q − Y1 this gives the following:
FU (yu) =erf(yu+d tan θ√
2σ0y) − erf( yu√
2σ0y)
2d tan θ. (6.7)
For the lower detection location yd = −(D/2 + p) tan θ + q + Y1 we find inthe same manner with j2 = −Y1 and v2 = −(D/2 + d/2 + p) tan θ + q :
FD(yd) =erf( yd√
2σ0y) − erf(yd−d tan θ√
2σ0y)
2d tan θ. (6.8)
This results in the following expresssion for the forward likelihood:
p(j1, j2|v1, v2) = FU (yu) · FD(yd). (6.9)
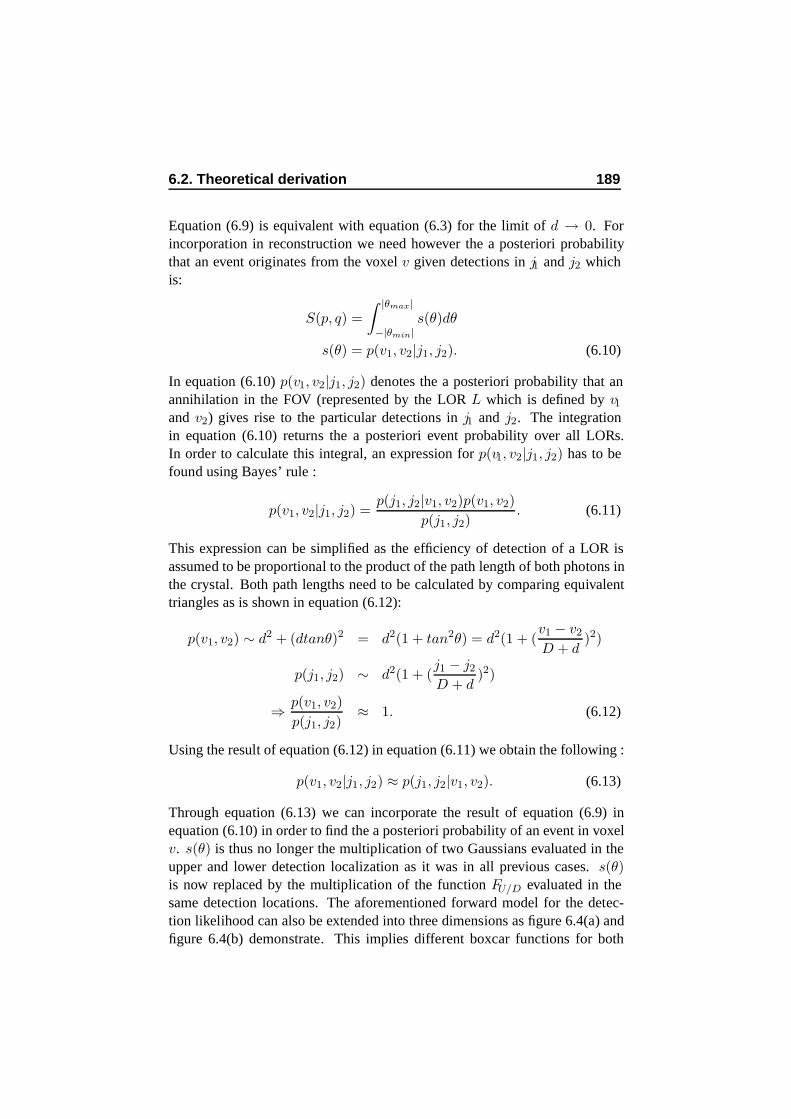
6.2. Theoretical derivation 189
Equation (6.9) is equivalent with equation (6.3) for the limit of d → 0. Forincorporation in reconstruction we need however the a posteriori probabilitythat an event originates from the voxel v given detections in j1 and j2 whichis:
S(p, q) =
∫ |θmax|
−|θmin|s(θ)dθ
s(θ) = p(v1, v2|j1, j2). (6.10)
In equation (6.10) p(v1, v2|j1, j2) denotes the a posteriori probability that anannihilation in the FOV (represented by the LOR L which is defined by v1and v2) gives rise to the particular detections in j1 and j2. The integrationin equation (6.10) returns the a posteriori event probability over all LORs.In order to calculate this integral, an expression for p(v1, v2|j1, j2) has to befound using Bayes’ rule :
p(v1, v2|j1, j2) =p(j1, j2|v1, v2)p(v1, v2)
p(j1, j2). (6.11)
This expression can be simplified as the efficiency of detection of a LOR isassumed to be proportional to the product of the path length of both photons inthe crystal. Both path lengths need to be calculated by comparing equivalenttriangles as is shown in equation (6.12):
p(v1, v2) ∼ d2 + (dtanθ)2 = d2(1 + tan2θ) = d2(1 + (v1 − v2
D + d)2)
p(j1, j2) ∼ d2(1 + (j1 − j2
D + d)2)
⇒ p(v1, v2)
p(j1, j2)≈ 1. (6.12)
Using the result of equation (6.12) in equation (6.11) we obtain the following :
p(v1, v2|j1, j2) ≈ p(j1, j2|v1, v2). (6.13)
Through equation (6.13) we can incorporate the result of equation (6.9) inequation (6.10) in order to find the a posteriori probability of an event in voxelv. s(θ) is thus no longer the multiplication of two Gaussians evaluated in theupper and lower detection localization as it was in all previous cases. s(θ)is now replaced by the multiplication of the function FU/D evaluated in thesame detection locations. The aforementioned forward model for the detec-tion likelihood can also be extended into three dimensions as figure 6.4(a) andfigure 6.4(b) demonstrate. This implies different boxcar functions for both

190 Detector modeling
Y
X
Z
LOR L
(a)
j
q
d tanq
d
d tan cosq j
d tan
sinq
j
Y
X
Z
v1
(b)
Figure 6.4: (a) Oblique incidences with opposite position of the detector heads: 3Dextension, (b) effect of the crystal thickness in both transversal directions.
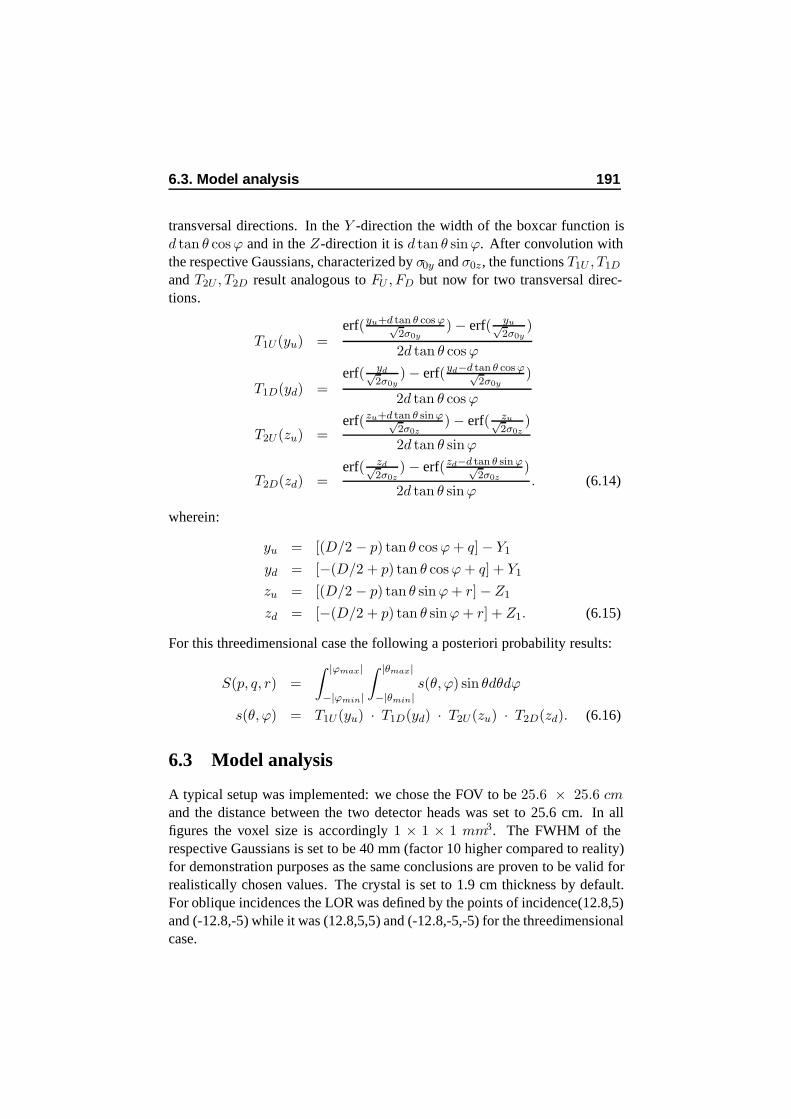
6.3. Model analysis 191
transversal directions. In the Y -direction the width of the boxcar function isd tan θ cos ϕ and in the Z-direction it is d tan θ sinϕ. After convolution withthe respective Gaussians, characterized by σ0y and σ0z , the functions T1U , T1D
and T2U , T2D result analogous to FU , FD but now for two transversal direc-tions.
T1U (yu) =erf(yu+d tan θ cos ϕ√
2σ0y) − erf( yu√
2σ0y)
2d tan θ cos ϕ
T1D(yd) =erf( yd√
2σ0y) − erf(yd−d tan θ cos ϕ√
2σ0y)
2d tan θ cos ϕ
T2U (zu) =erf(zu+d tan θ sinϕ√
2σ0z) − erf( zu√
2σ0z)
2d tan θ sinϕ
T2D(zd) =erf( zd√
2σ0z) − erf(zd−d tan θ sin ϕ√
2σ0z)
2d tan θ sinϕ. (6.14)
wherein:
yu = [(D/2 − p) tan θ cos ϕ + q] − Y1
yd = [−(D/2 + p) tan θ cos ϕ + q] + Y1
zu = [(D/2 − p) tan θ sinϕ + r] − Z1
zd = [−(D/2 + p) tan θ sinϕ + r] + Z1. (6.15)
For this threedimensional case the following a posteriori probability results:
S(p, q, r) =
∫ |ϕmax|
−|ϕmin|
∫ |θmax|
−|θmin|s(θ, ϕ) sin θdθdϕ
s(θ, ϕ) = T1U (yu) · T1D(yd) · T2U (zu) · T2D(zd). (6.16)
6.3 Model analysis
A typical setup was implemented: we chose the FOV to be 25.6 × 25.6 cmand the distance between the two detector heads was set to 25.6 cm. In allfigures the voxel size is accordingly 1 × 1 × 1 mm3. The FWHM of therespective Gaussians is set to be 40 mm (factor 10 higher compared to reality)for demonstration purposes as the same conclusions are proven to be valid forrealistically chosen values. The crystal is set to 1.9 cm thickness by default.For oblique incidences the LOR was defined by the points of incidence(12.8,5)and (-12.8,-5) while it was (12.8,5,5) and (-12.8,-5,-5) for the threedimensionalcase.
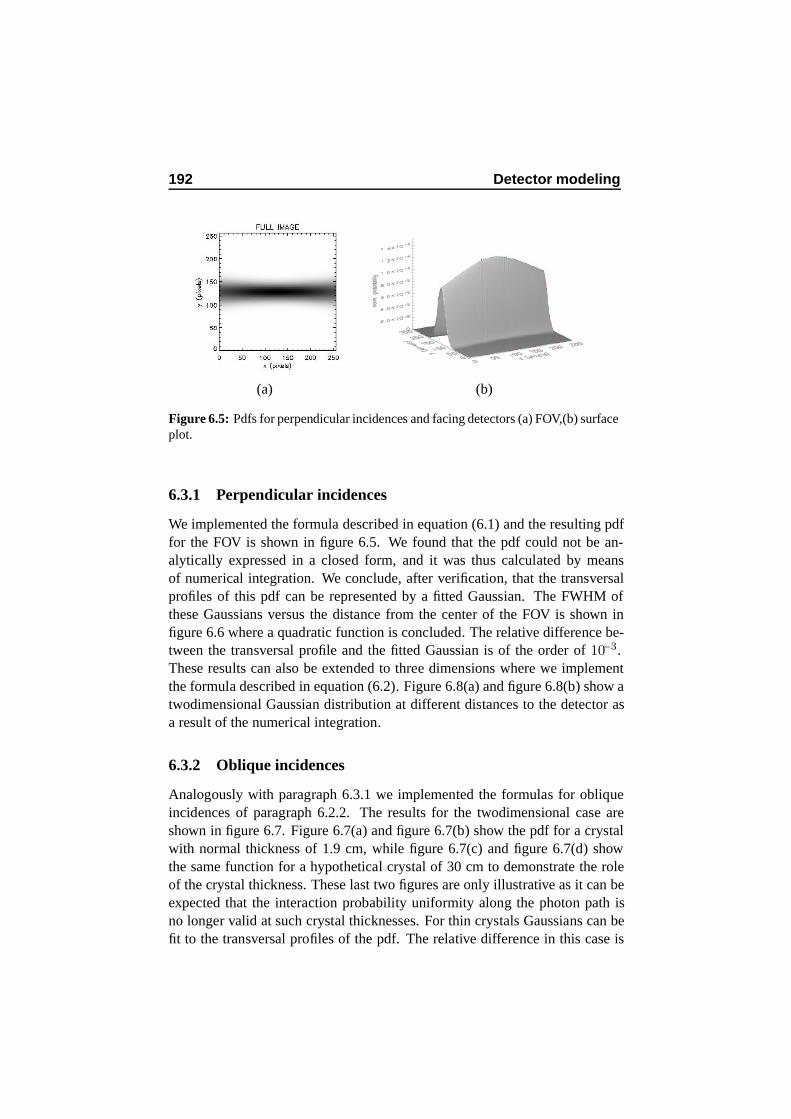
192 Detector modeling
(a) (b)
Figure 6.5: Pdfs for perpendicular incidences and facing detectors (a) FOV,(b) surfaceplot.
6.3.1 Perpendicular incidences
We implemented the formula described in equation (6.1) and the resulting pdffor the FOV is shown in figure 6.5. We found that the pdf could not be an-alytically expressed in a closed form, and it was thus calculated by meansof numerical integration. We conclude, after verification, that the transversalprofiles of this pdf can be represented by a fitted Gaussian. The FWHM ofthese Gaussians versus the distance from the center of the FOV is shown infigure 6.6 where a quadratic function is concluded. The relative difference be-tween the transversal profile and the fitted Gaussian is of the order of 10−3.These results can also be extended to three dimensions where we implementthe formula described in equation (6.2). Figure 6.8(a) and figure 6.8(b) show atwodimensional Gaussian distribution at different distances to the detector asa result of the numerical integration.
6.3.2 Oblique incidences
Analogously with paragraph 6.3.1 we implemented the formulas for obliqueincidences of paragraph 6.2.2. The results for the twodimensional case areshown in figure 6.7. Figure 6.7(a) and figure 6.7(b) show the pdf for a crystalwith normal thickness of 1.9 cm, while figure 6.7(c) and figure 6.7(d) showthe same function for a hypothetical crystal of 30 cm to demonstrate the roleof the crystal thickness. These last two figures are only illustrative as it can beexpected that the interaction probability uniformity along the photon path isno longer valid at such crystal thicknesses. For thin crystals Gaussians can befit to the transversal profiles of the pdf. The relative difference in this case is
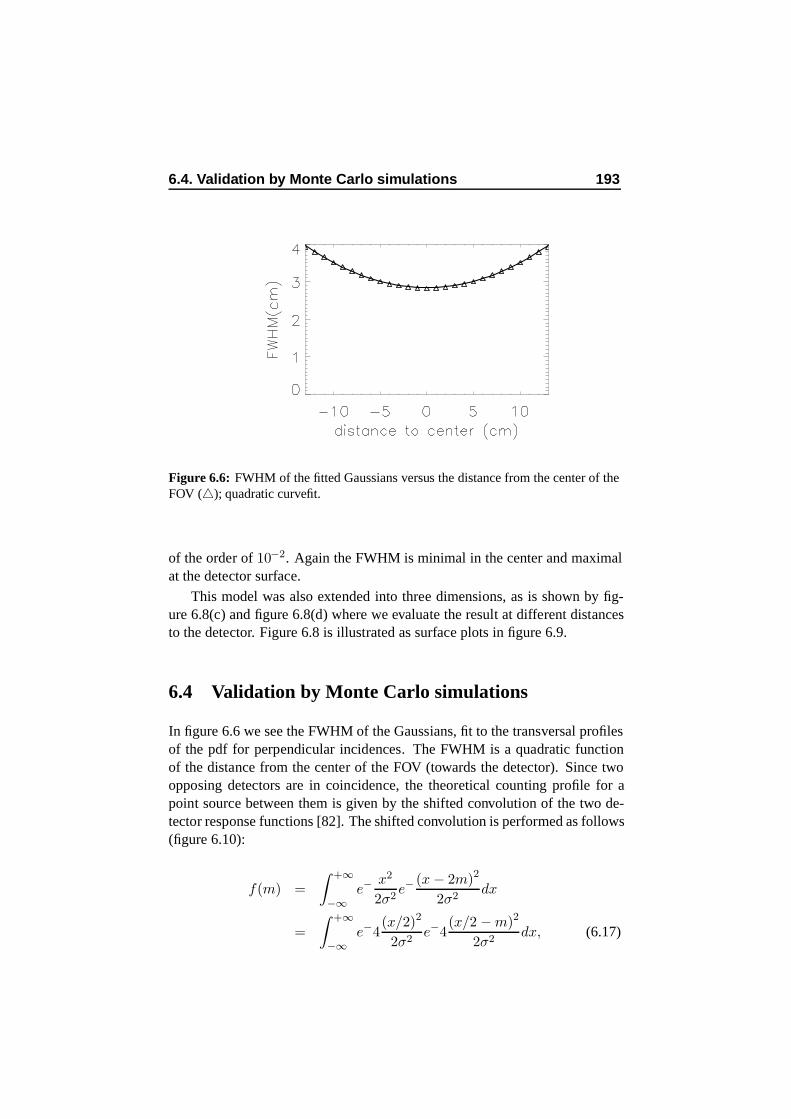
6.4. Validation by Monte Carlo simulations 193
Figure 6.6: FWHM of the fitted Gaussians versus the distance from the center of theFOV (4); quadratic curvefit.
of the order of 10−2. Again the FWHM is minimal in the center and maximalat the detector surface.
This model was also extended into three dimensions, as is shown by fig-ure 6.8(c) and figure 6.8(d) where we evaluate the result at different distancesto the detector. Figure 6.8 is illustrated as surface plots in figure 6.9.
6.4 Validation by Monte Carlo simulations
In figure 6.6 we see the FWHM of the Gaussians, fit to the transversal profilesof the pdf for perpendicular incidences. The FWHM is a quadratic functionof the distance from the center of the FOV (towards the detector). Since twoopposing detectors are in coincidence, the theoretical counting profile for apoint source between them is given by the shifted convolution of the two de-tector response functions [82]. The shifted convolution is performed as follows(figure 6.10):
f(m) =
∫ +∞
−∞e−
x2
2σ2e−
(x − 2m)2
2σ2dx
=
∫ +∞
−∞e−4
(x/2)2
2σ2e−4
(x/2 − m)2
2σ2dx, (6.17)
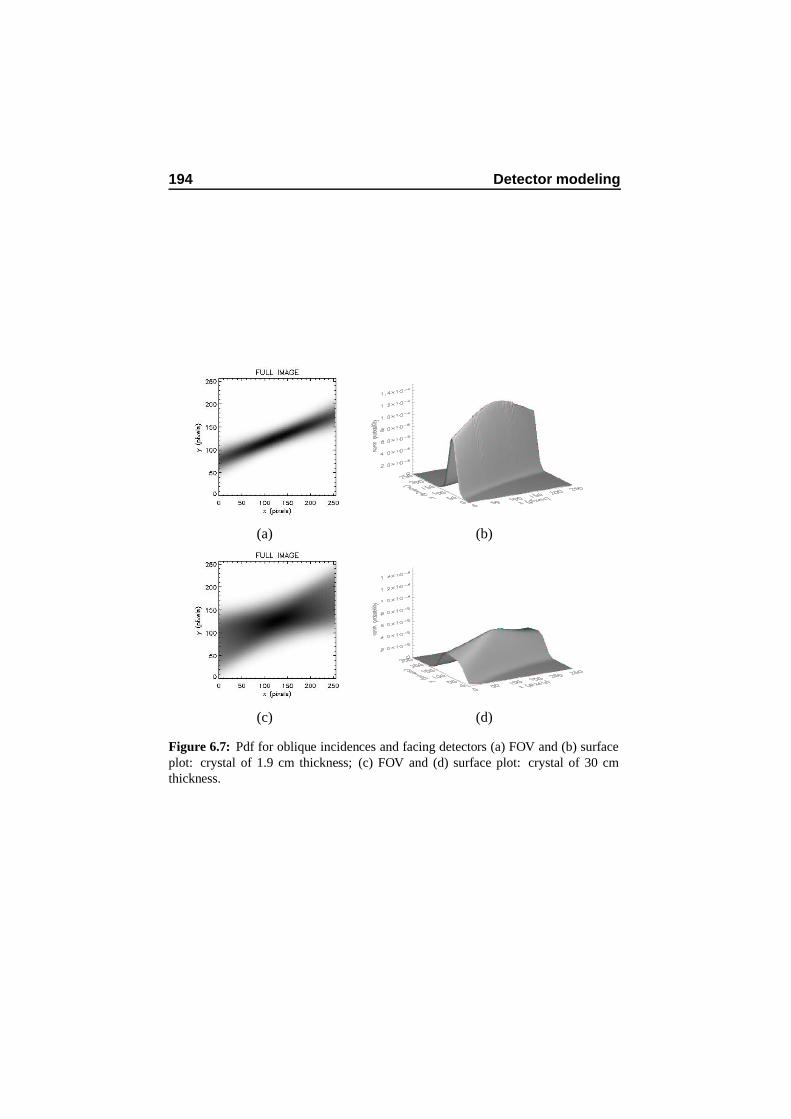
194 Detector modeling
(a) (b)
(c) (d)
Figure 6.7: Pdf for oblique incidences and facing detectors (a) FOV and (b) surfaceplot: crystal of 1.9 cm thickness; (c) FOV and (d) surface plot: crystal of 30 cmthickness.
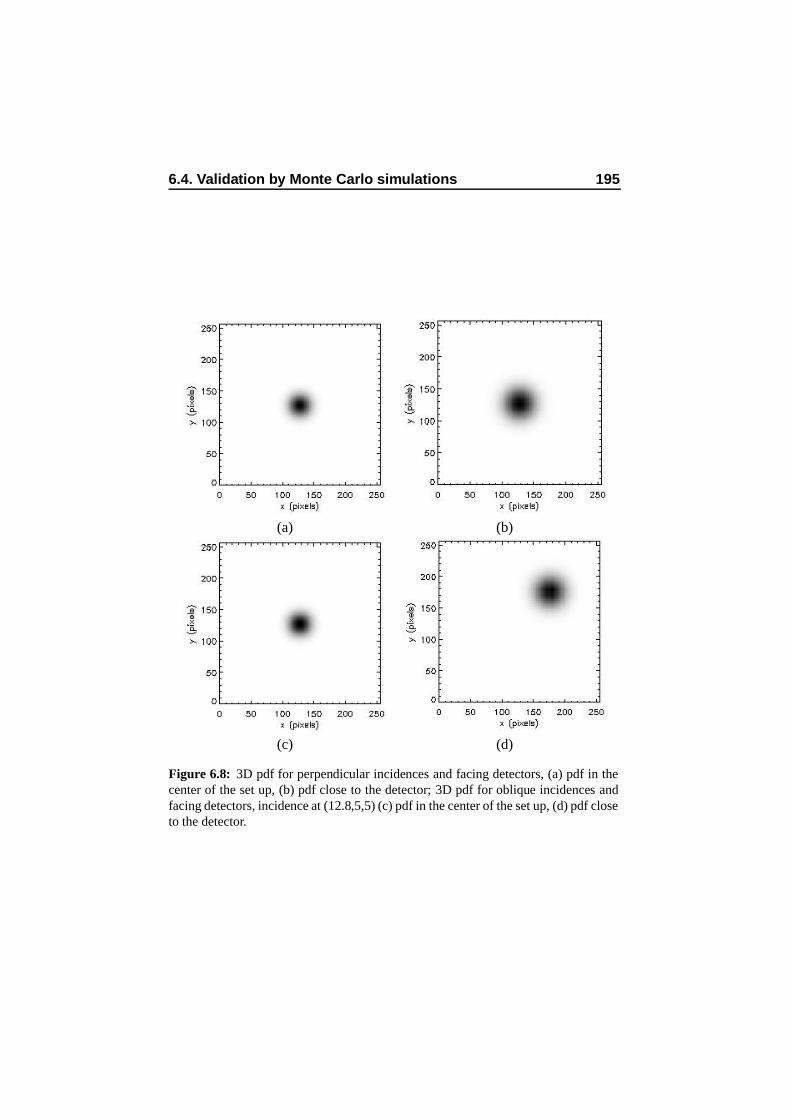
6.4. Validation by Monte Carlo simulations 195
(a) (b)
(c) (d)
Figure 6.8: 3D pdf for perpendicular incidences and facing detectors, (a) pdf in thecenter of the set up, (b) pdf close to the detector; 3D pdf for oblique incidences andfacing detectors, incidence at (12.8,5,5) (c) pdf in the center of the set up, (d) pdf closeto the detector.
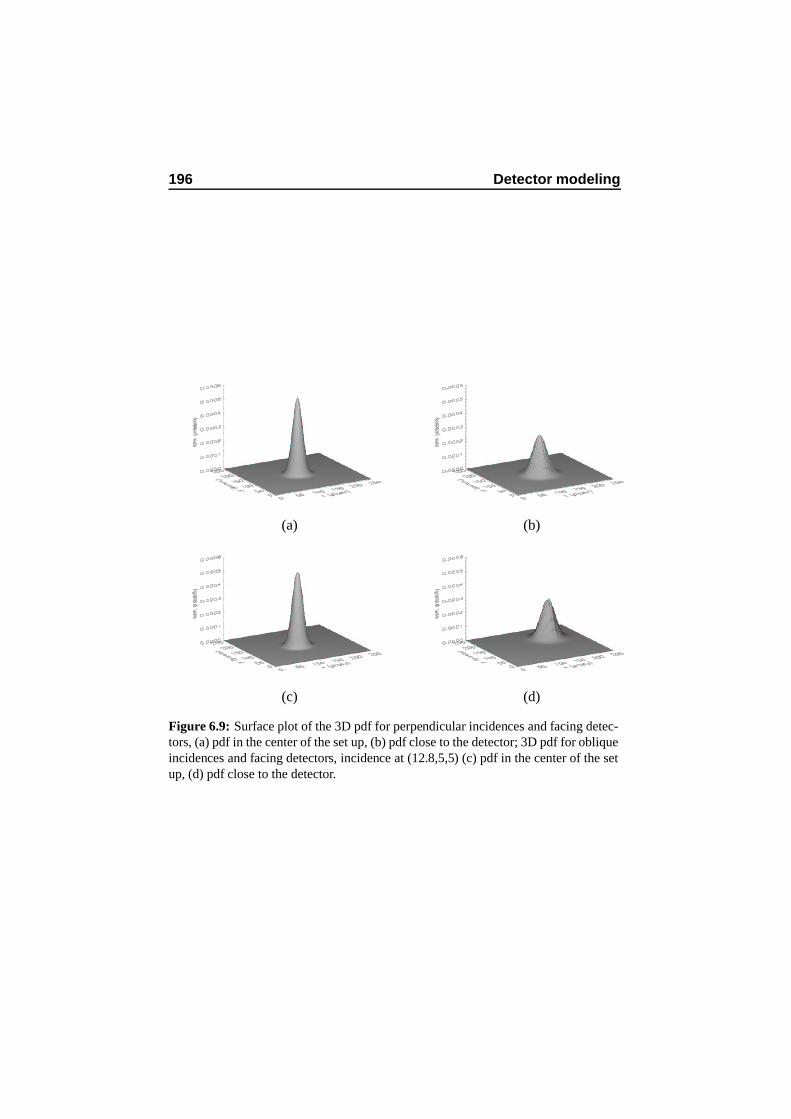
196 Detector modeling
(a) (b)
(c) (d)
Figure 6.9: Surface plot of the 3D pdf for perpendicular incidences and facing detec-tors, (a) pdf in the center of the set up, (b) pdf close to the detector; 3D pdf for obliqueincidences and facing detectors, incidence at (12.8,5,5) (c) pdf in the center of the setup, (d) pdf close to the detector.
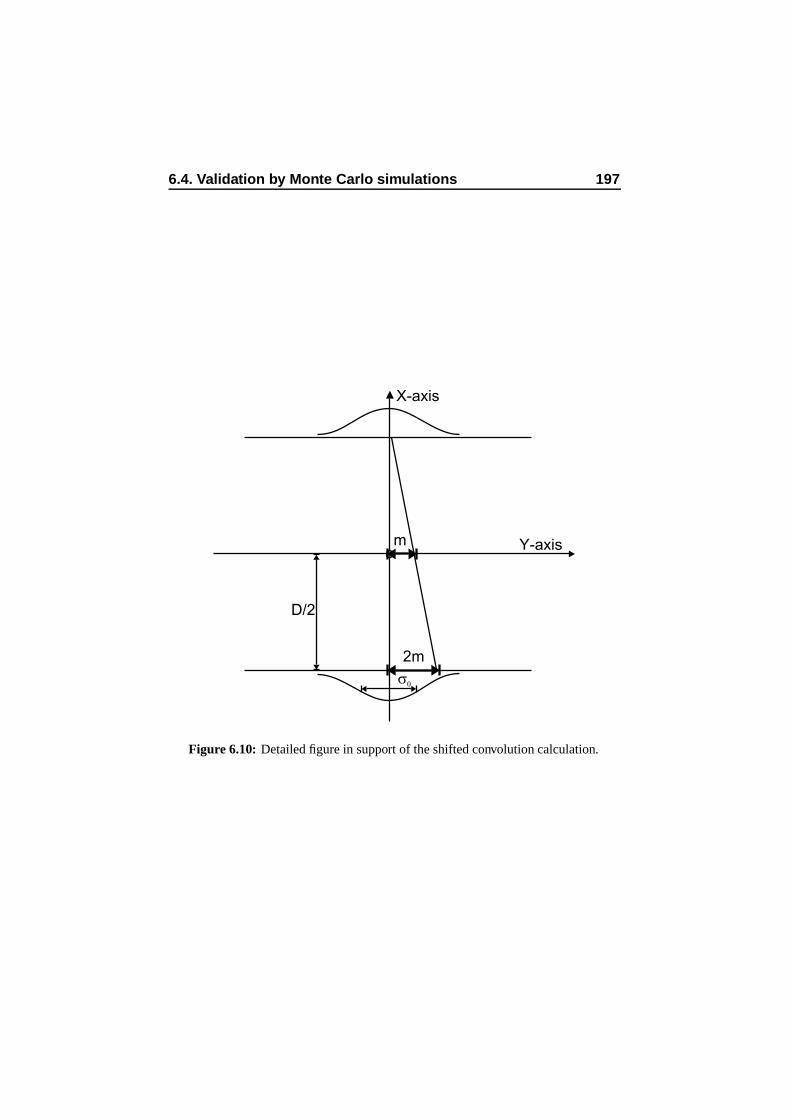
6.4. Validation by Monte Carlo simulations 197
Y-axis
X-axis
D/2
s0
m
2m
Figure 6.10: Detailed figure in support of the shifted convolution calculation.
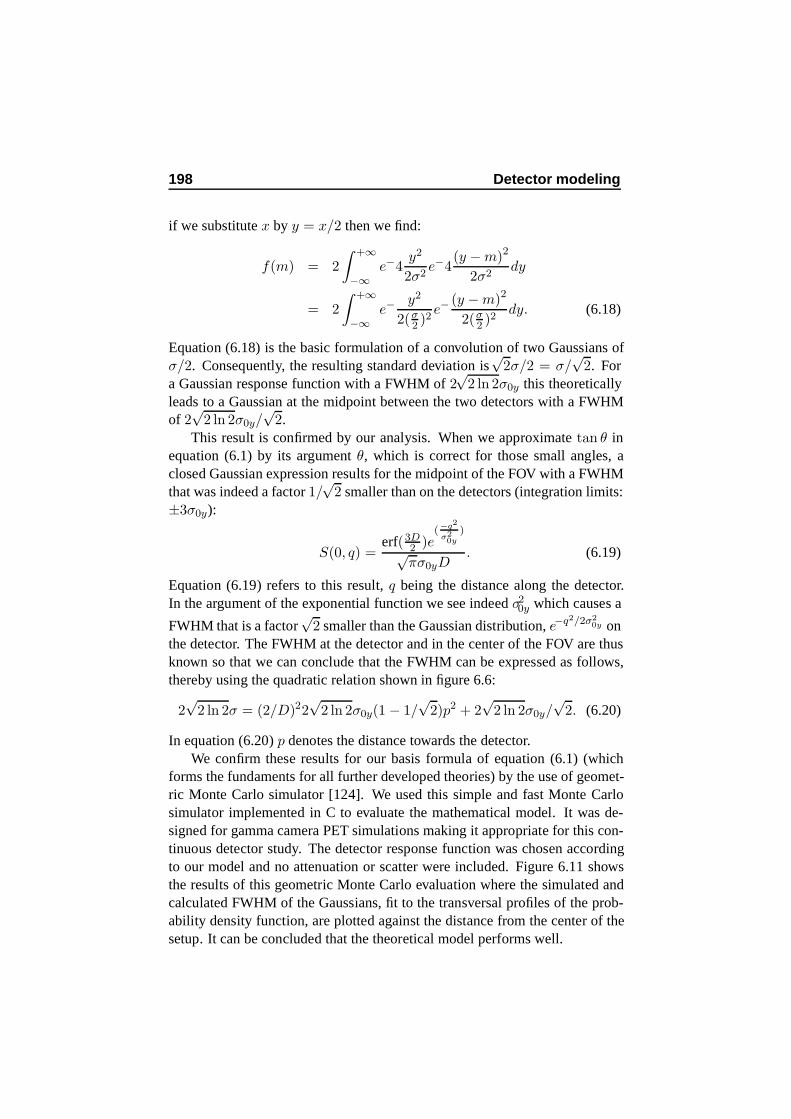
198 Detector modeling
if we substitute x by y = x/2 then we find:
f(m) = 2
∫ +∞
−∞e−4
y2
2σ2e−4
(y − m)2
2σ2dy
= 2
∫ +∞
−∞e−
y2
2(σ2 )2
e−(y − m)2
2(σ2 )2
dy. (6.18)
Equation (6.18) is the basic formulation of a convolution of two Gaussians ofσ/2. Consequently, the resulting standard deviation is
√2σ/2 = σ/
√2. For
a Gaussian response function with a FWHM of 2√
2 ln 2σ0y this theoreticallyleads to a Gaussian at the midpoint between the two detectors with a FWHMof 2
√2 ln 2σ0y/
√2.
This result is confirmed by our analysis. When we approximate tan θ inequation (6.1) by its argument θ, which is correct for those small angles, aclosed Gaussian expression results for the midpoint of the FOV with a FWHMthat was indeed a factor 1/
√2 smaller than on the detectors (integration limits:
±3σ0y):
S(0, q) =erf(3D
2 )e(−q2
σ20y
)
√πσ0yD
. (6.19)
Equation (6.19) refers to this result, q being the distance along the detector.In the argument of the exponential function we see indeed σ2
0y which causes a
FWHM that is a factor√
2 smaller than the Gaussian distribution, e−q2/2σ20y on
the detector. The FWHM at the detector and in the center of the FOV are thusknown so that we can conclude that the FWHM can be expressed as follows,thereby using the quadratic relation shown in figure 6.6:
2√
2 ln 2σ = (2/D)22√
2 ln 2σ0y(1 − 1/√
2)p2 + 2√
2 ln 2σ0y/√
2. (6.20)
In equation (6.20) p denotes the distance towards the detector.We confirm these results for our basis formula of equation (6.1) (which
forms the fundaments for all further developed theories) by the use of geomet-ric Monte Carlo simulator [124]. We used this simple and fast Monte Carlosimulator implemented in C to evaluate the mathematical model. It was de-signed for gamma camera PET simulations making it appropriate for this con-tinuous detector study. The detector response function was chosen accordingto our model and no attenuation or scatter were included. Figure 6.11 showsthe results of this geometric Monte Carlo evaluation where the simulated andcalculated FWHM of the Gaussians, fit to the transversal profiles of the prob-ability density function, are plotted against the distance from the center of thesetup. It can be concluded that the theoretical model performs well.
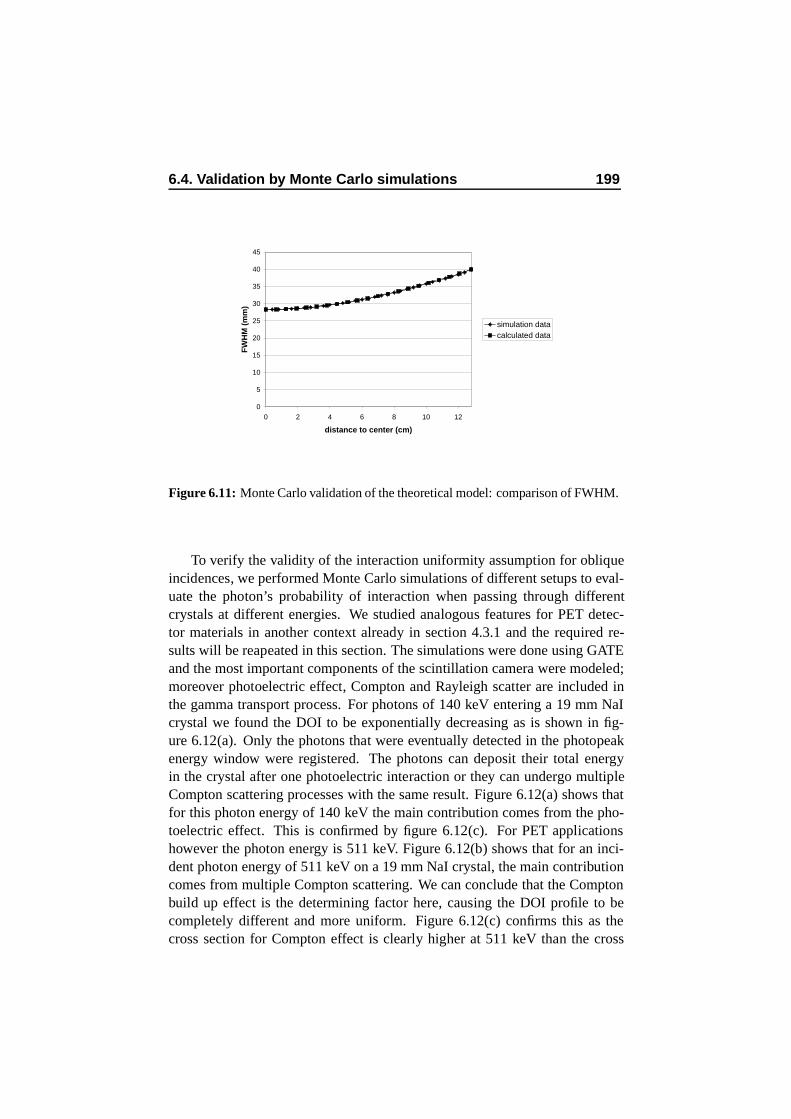
6.4. Validation by Monte Carlo simulations 199
0
5
10
15
20
25
30
35
40
45
0 2 4 6 8 10 12
distance to center (cm)
FW
HM
(m
m)
simulation datacalculated data
Figure 6.11: Monte Carlo validation of the theoretical model: comparison of FWHM.
To verify the validity of the interaction uniformity assumption for obliqueincidences, we performed Monte Carlo simulations of different setups to eval-uate the photon’s probability of interaction when passing through differentcrystals at different energies. We studied analogous features for PET detec-tor materials in another context already in section 4.3.1 and the required re-sults will be reapeated in this section. The simulations were done using GATEand the most important components of the scintillation camera were modeled;moreover photoelectric effect, Compton and Rayleigh scatter are included inthe gamma transport process. For photons of 140 keV entering a 19 mm NaIcrystal we found the DOI to be exponentially decreasing as is shown in fig-ure 6.12(a). Only the photons that were eventually detected in the photopeakenergy window were registered. The photons can deposit their total energyin the crystal after one photoelectric interaction or they can undergo multipleCompton scattering processes with the same result. Figure 6.12(a) shows thatfor this photon energy of 140 keV the main contribution comes from the pho-toelectric effect. This is confirmed by figure 6.12(c). For PET applicationshowever the photon energy is 511 keV. Figure 6.12(b) shows that for an inci-dent photon energy of 511 keV on a 19 mm NaI crystal, the main contributioncomes from multiple Compton scattering. We can conclude that the Comptonbuild up effect is the determining factor here, causing the DOI profile to becompletely different and more uniform. Figure 6.12(c) confirms this as thecross section for Compton effect is clearly higher at 511 keV than the cross
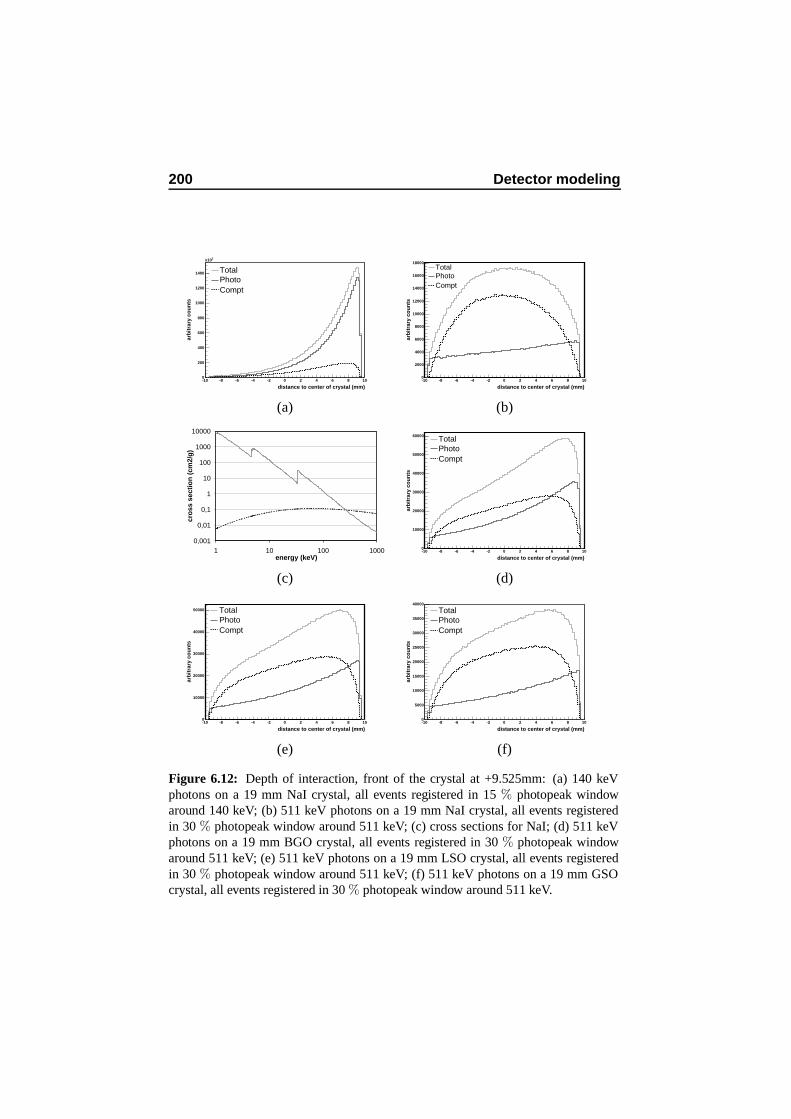
200 Detector modeling
distance to center of crystal (mm)-10 -8 -6 -4 -2 0 2 4 6 8 10
arb
itra
ry c
ou
nts
0
200
400
600
800
1000
1200
1400
2x10
TotalPhotoCompt
distance to center of crystal (mm)-10 -8 -6 -4 -2 0 2 4 6 8 10
arb
itra
ry c
ou
nts
0
2000
4000
6000
8000
10000
12000
14000
16000
18000TotalPhotoCompt
(a) (b)
0,001
0,01
0,1
1
10
100
1000
10000
1 10 100 1000energy (keV)
cro
ss s
ecti
on
(cm
2/g
)
distance to center of crystal (mm)-10 -8 -6 -4 -2 0 2 4 6 8 10
arb
itra
ry c
ou
nts
0
10000
20000
30000
40000
50000
60000 TotalPhotoCompt
(c) (d)
distance to center of crystal (mm)-10 -8 -6 -4 -2 0 2 4 6 8 10
arb
itra
ry c
ou
nts
0
10000
20000
30000
40000
50000 TotalPhotoCompt
distance to center of crystal (mm)-10 -8 -6 -4 -2 0 2 4 6 8 10
arb
itra
ry c
ou
nts
0
5000
10000
15000
20000
25000
30000
35000
40000
TotalPhotoCompt
(e) (f)
Figure 6.12: Depth of interaction, front of the crystal at +9.525mm: (a) 140 keVphotons on a 19 mm NaI crystal, all events registered in 15 % photopeak windowaround 140 keV; (b) 511 keV photons on a 19 mm NaI crystal, all events registeredin 30 % photopeak window around 511 keV; (c) cross sections for NaI; (d) 511 keVphotons on a 19 mm BGO crystal, all events registered in 30 % photopeak windowaround 511 keV; (e) 511 keV photons on a 19 mm LSO crystal, all events registeredin 30 % photopeak window around 511 keV; (f) 511 keV photons on a 19 mm GSOcrystal, all events registered in 30 % photopeak window around 511 keV.
6.5. Reconstruction: resolution recovery 201
section for photoelectric interaction. Due to the low cross section for photo-electric effect at this energy the sensitivity of the crystal is lower than for 140keV photons (optimal sensitivity for 19 mm NaI) causing less detections to beregistered. The expected exponential decay of beam particles after photoelec-tric absorption can be approximated in first order by a linear curve. Results areshown in figure 6.12(d) for BGO, in figure 6.12(e) for LSO and in figure 6.12(f)for GSO. The same conclusion can be made regarding the Compton build up.These simulated DOI curves could also be incorporated into the theoreticalmodel as an extra, crystal and energy dependent, parameter without having toperform the aforementioned simplification. A validation of this against experi-mental data is still needed. We believe however that the variation on the widthof the Gaussians will appear to be more important than the discrepancy on theDOI uniformity approximation for the derived theoretical model. These vari-ations on the FWHM are probably due to the positioning of the PMTs whichare determining in the Anger logic of the readout.
6.5 Reconstruction: resolution recovery
The theoretical model described above can be incorporated in a reconstruc-tion algorithm in order to enhance the spatial resolution of the resulting recon-structed images. Two possible approaches for incorporation into reconstruc-tion will be discussed. The first approach is incorporation of this model into aniterative listmode Maximum Likelihood Expectation Maximization (MLEM:section 2.1.6) algorithm. In this case, not only the voxels intersected by theLOR are accounted for but also the voxels within the reach of the pdf due tothe detection uncertainty. This raises some difficulties: either the numerical in-tegral has to be calculated on the fly or a lookup table for the pdf values has tobe present. Calculation of the integral during the reconstruction is not feasibledue to computer limitations. For the lookup table one has to use symmetri-cal basis functions to parametrize the image as otherwise the contribution of acertain voxel becomes dependent on the LOR orientation which would lead toa very large lookup table. Figure 6.13 demonstrates LOR-orientation depen-dency if the image is parametrized by pixels: the gray part is additional for aLOR with another orientation at the same distance from the center of the pixel.When using radially symmetric basis functions as, for instance, blobs, the con-tribution of each voxel is only dependent on the distance between the LOR andthe center of that particular voxel, whatever the orientation of the LOR is. Thesecond, more elegant approach, consists of using natural pixels [59]. Here,discrete projections are related to the continuous image distribution functionby a spatially varying photon distribution function that models the geometric
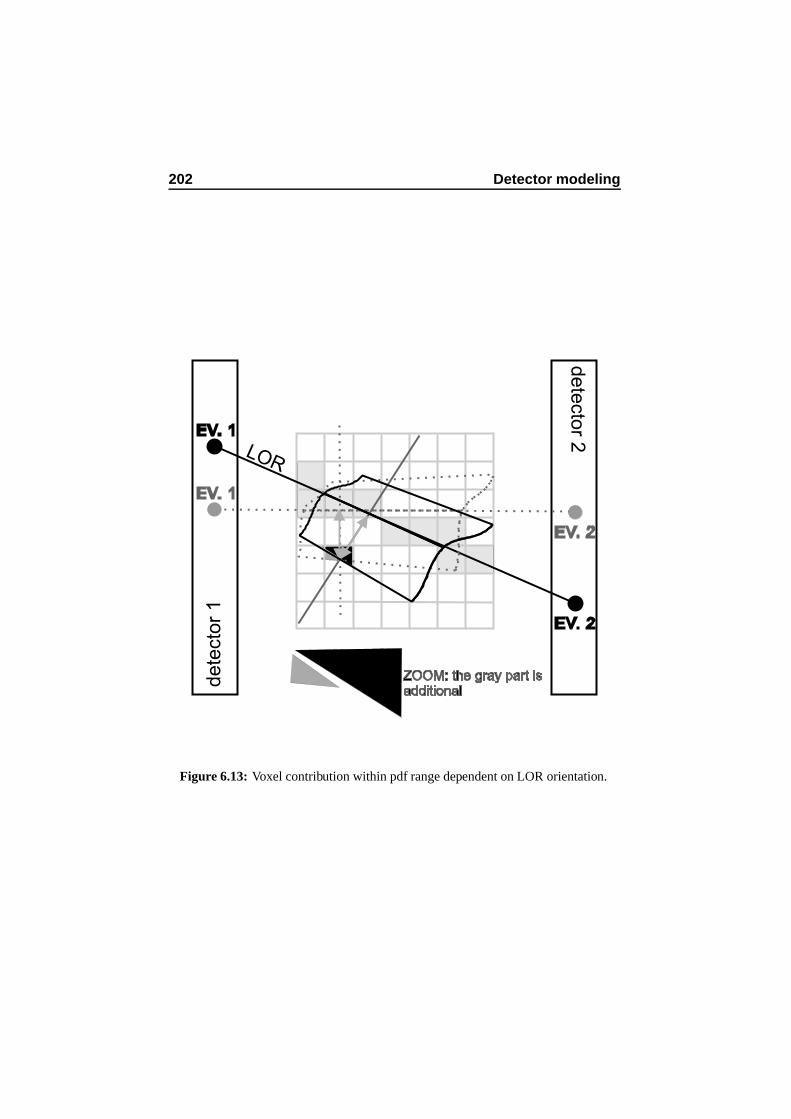
202 Detector modeling
dete
cto
r 1
dete
cto
r 2EV. 1
EV. 2
LOR
EV. 2
EV. 1
ZOOM: the gray part isadditional
Figure 6.13: Voxel contribution within pdf range dependent on LOR orientation.
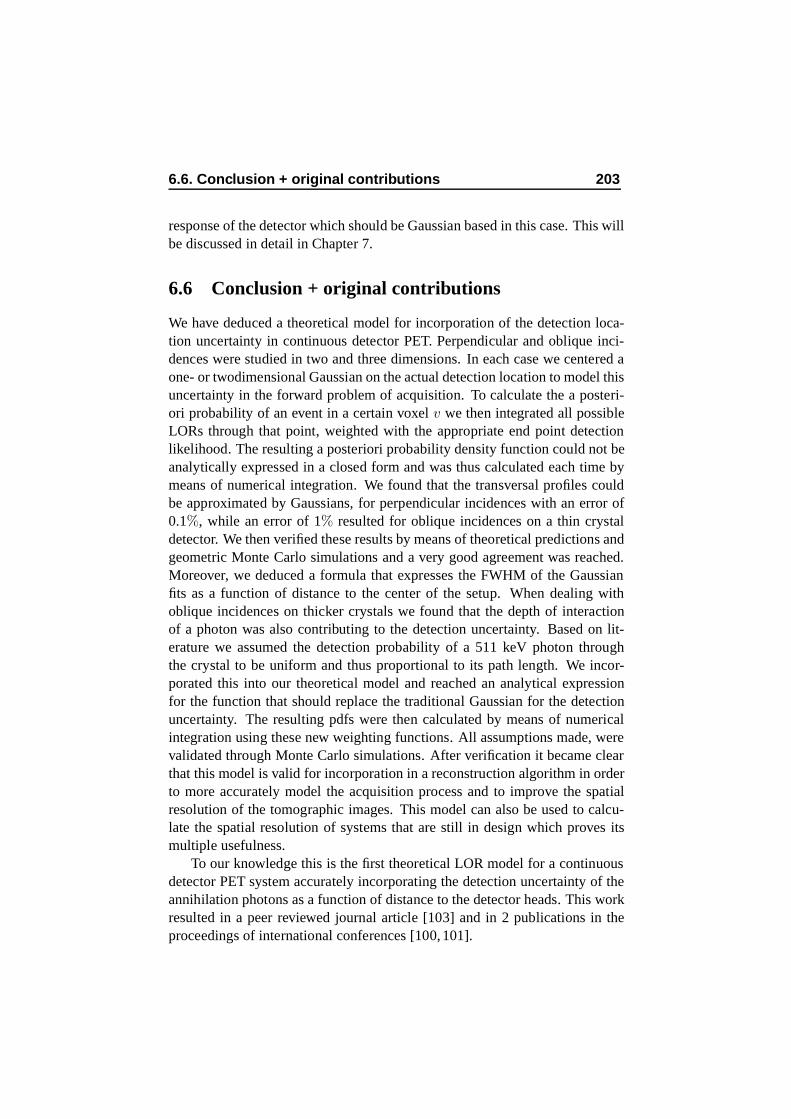
6.6. Conclusion + original contributions 203
response of the detector which should be Gaussian based in this case. This willbe discussed in detail in Chapter 7.
6.6 Conclusion + original contributions
We have deduced a theoretical model for incorporation of the detection loca-tion uncertainty in continuous detector PET. Perpendicular and oblique inci-dences were studied in two and three dimensions. In each case we centered aone- or twodimensional Gaussian on the actual detection location to model thisuncertainty in the forward problem of acquisition. To calculate the a posteri-ori probability of an event in a certain voxel v we then integrated all possibleLORs through that point, weighted with the appropriate end point detectionlikelihood. The resulting a posteriori probability density function could not beanalytically expressed in a closed form and was thus calculated each time bymeans of numerical integration. We found that the transversal profiles couldbe approximated by Gaussians, for perpendicular incidences with an error of0.1%, while an error of 1% resulted for oblique incidences on a thin crystaldetector. We then verified these results by means of theoretical predictions andgeometric Monte Carlo simulations and a very good agreement was reached.Moreover, we deduced a formula that expresses the FWHM of the Gaussianfits as a function of distance to the center of the setup. When dealing withoblique incidences on thicker crystals we found that the depth of interactionof a photon was also contributing to the detection uncertainty. Based on lit-erature we assumed the detection probability of a 511 keV photon throughthe crystal to be uniform and thus proportional to its path length. We incor-porated this into our theoretical model and reached an analytical expressionfor the function that should replace the traditional Gaussian for the detectionuncertainty. The resulting pdfs were then calculated by means of numericalintegration using these new weighting functions. All assumptions made, werevalidated through Monte Carlo simulations. After verification it became clearthat this model is valid for incorporation in a reconstruction algorithm in orderto more accurately model the acquisition process and to improve the spatialresolution of the tomographic images. This model can also be used to calcu-late the spatial resolution of systems that are still in design which proves itsmultiple usefulness.
To our knowledge this is the first theoretical LOR model for a continuousdetector PET system accurately incorporating the detection uncertainty of theannihilation photons as a function of distance to the detector heads. This workresulted in a peer reviewed journal article [103] and in 2 publications in theproceedings of international conferences [100, 101].

204 Detector modeling

Chapter 7
Monte Carlo basedreconstruction
In parallel hole collimator SPECT, image reconstruction is usually performedas a set of 2D analytical or iterative reconstructions. This ignores the intrinsic3D nature of the scatter process. Approximate analytical models to accountfor scatter have been proposed [6, 8, 9, 11]. To explicitly deal with the 3D na-ture of the image formation process, a simulated 3D projector modeling the3D photon spread and thus including all image degrading effects (attenuation,scatter and camera point spread function) can be used [39, 40] in a fully 3Dreconstruction algorithm. Monte Carlo based reconstruction for PET is partic-ularly interesting to perform an intrinsic resolution recovery and to incorporate(inter)crystal scatter.
7.1 Dedicated Monte Carlo based reconstruction forSPECT application
It was pointed out in chapter 4 that the Beacon attenuation image is oftendegraded near the center of large patients when the transmission acquisitionis performed simultaneously or sequentially with a medium energy emissionstudy. This is due to the fact that the 133Ba sources have to form an imagethrough the collimator of the opposite detector head, which has thick septa in amedium energy emission setup. In chapter 4 we showed that, in this particularcase, it would be highly recommendable to replace the MEGP collimators bythe LEHR variants for a large range of medium energy sources if one couldrecover the increased photon spread on this LEHR collimator. We thereforeimplemented a dedicated solution that accounts for this issue, as will be dis-
206 Monte Carlo based reconstruction
(a) (b)
Figure 7.1: Detector response : (a) one-dimensional averaged system response for128 planes parallel to the detector and for a MEGP setup, (b) one-dimensional aver-aged system response for 128 planes parallel to the detector and for a LEHR collimatorsetup.
cussed hereafter.
7.1.1 Implementation
Our approach consists of simulating a three-dimensional system matrix foreach possible setup incorporating all image degrading effects: fluorescence,scatter and penetration in the collimator, intrinsic crystal resolution, etc. Eachelement of the system matrix denotes the probability that an emission froma certain voxel is detected in a particular projection bin. This system ma-trix is recalculated afterwards in the detector response function which is thesystem response averaged over all possible FOV locations in a plane at a cer-tain distance to the detector and which includes all image degrading effects inthree dimensions. The aforementioned system response is based on the rela-tive difference in detection and emission location. To incorporate this detectorresponse in the reconstruction, a two-dimensional function for each distance tothe detector was applied in the forward projection step of the Maximum Like-lihood Expectation Maximization (MLEM) algorithm. This two-dimensionalfunction represents the averaged response of the system as discussed above,and depends on the energy of the isotope. An example is shown in figure 7.1.Figure 7.1(a) shows the detector response in one dimension for 128 planesparallel to the detector and for medium energy photons (245 keV) on a MEGPcollimator while figure 7.1(b) shows the severe penetration for the same pho-tons on a LEHR collimator. To limit the storage size of our system matrix andto solve the projector noise problems described in [22], the simulated system
7.1. Dedicated Monte Carlo based reconstruction for SPECTapplication 207
matrix can be used in a natural pixel based reconstruction or the image matrixcan be bilinearly rotated. If applying a rotator [134], then a matrix perpen-dicular to the detector is obtained for each projection angle so that the abovediscussed detector response blur can be applied. In the latter way it remainspossible to include attenuation in the reconstruction which is not the case atfirst sight for natural pixel based reconstruction as will become clear in sec-tion 7.2.
Downside of this approach is the computation time necessary to gener-ate the system matrix. An elegant implementation was obtained however ona minicluster of 17 dual processor Intel Xeon 2.4GHz nodes that allows tocalculate the Monte Carlo information for each possible setup overnight.
7.1.2 Recovery of ME on LEHR photon spread
Figure 7.2 shows the reconstruction of a 1 cm point source at 30 cm distance,filled with a 300 keV emission source, after Monte Carlo simulated acquisi-tion using a LEHR collimator. Figure 7.2(a) is a traditional parallel projectionMLEM reconstructed image while figure 7.2(b) is reconstructed incorporatingthe three-dimensional Monte Carlo detector response as discussed in 4.2.1. AGaussian was fit to the profiles of both images and for figure 7.2(a) a Full Widthat Half Maximum (FWHM) of 22.6 mm results. The trend lines of figure 3.11showed in Chapter 3 that the resolution should not be more than 14.3 mm whenno photon penetration is allowed by the LEHR collimator and when no reso-lution recovery is applied in the reconstruction. As was expected the LEHRcollimator performs suboptimally for these medium energy photons. If theMonte Carlo detector response is incorporated it should hypothetically be fea-sible to recover the extrinsic resolution at that distance and also the intrinsicspatial resolution of the camera (3.3 mm). The FWHM of the Gaussian fit offigure 7.2(b) returns a value of 9.3 mm which is the original size of the pointsource (1 cm) within the error bars of the curve fit. This is summarized byfigure 7.3 which demonstrates the succesful resolution recovery of the MonteCarlo based reconstruction.
The validation of this method was extended towards other energy rangesand towards other phantoms and collimators as will be discussed below. Theacquisition of three 1 cm point sources, separated by 2 cm and with an activityratio of 1:2:6 was simulated, all three sources were placed at 30 cm from thecollimator. Figure 7.4 shows the results for photons of 170 keV while figure 7.5shows the analogous images for photons of 245 keV, both on a high intensityscale.
The image of figure 7.4(a) shows the traditional parallel projection recon-
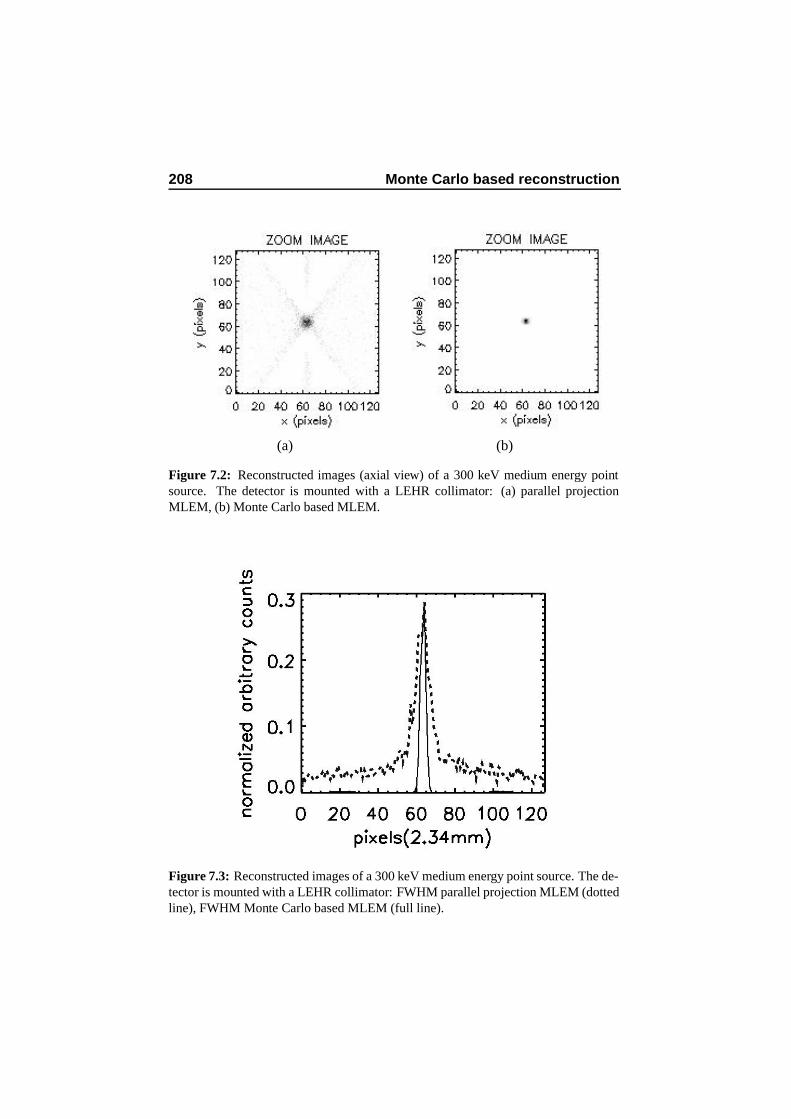
208 Monte Carlo based reconstruction
(a) (b)
Figure 7.2: Reconstructed images (axial view) of a 300 keV medium energy pointsource. The detector is mounted with a LEHR collimator: (a) parallel projectionMLEM, (b) Monte Carlo based MLEM.
Figure 7.3: Reconstructed images of a 300 keV medium energy point source. The de-tector is mounted with a LEHR collimator: FWHM parallel projection MLEM (dottedline), FWHM Monte Carlo based MLEM (full line).
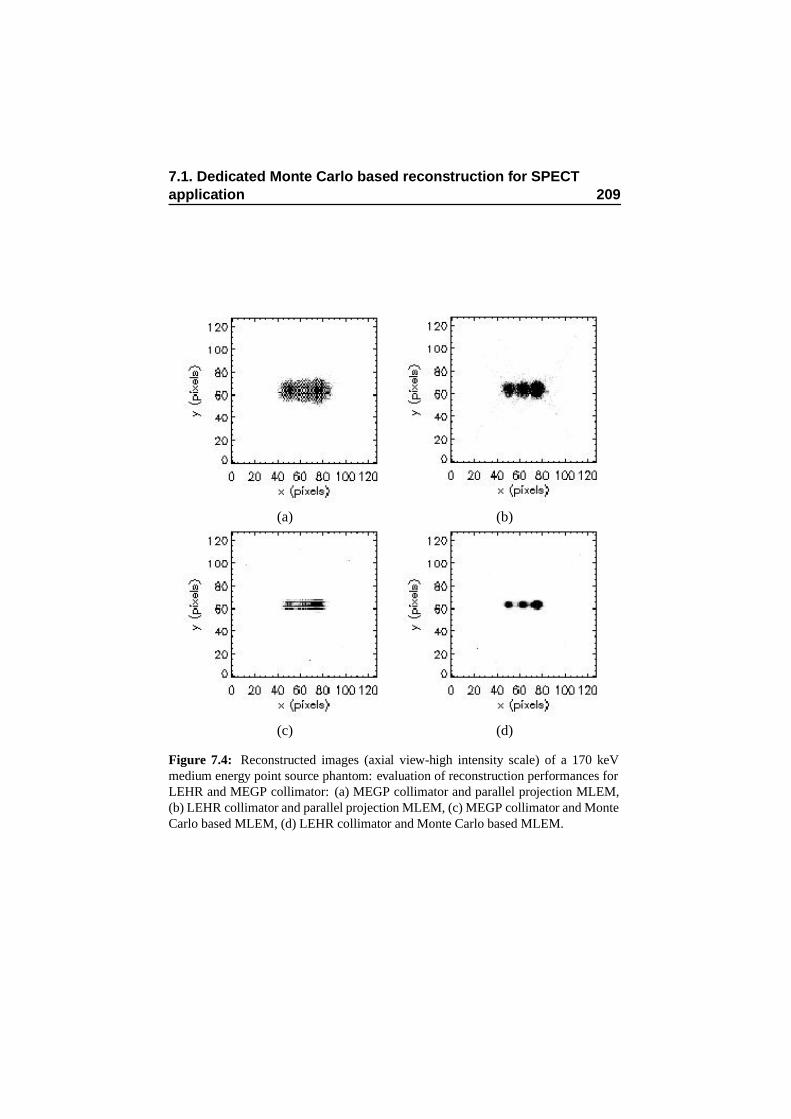
7.1. Dedicated Monte Carlo based reconstruction for SPECTapplication 209
(a) (b)
(c) (d)
Figure 7.4: Reconstructed images (axial view-high intensity scale) of a 170 keVmedium energy point source phantom: evaluation of reconstruction performances forLEHR and MEGP collimator: (a) MEGP collimator and parallel projection MLEM,(b) LEHR collimator and parallel projection MLEM, (c) MEGP collimator and MonteCarlo based MLEM, (d) LEHR collimator and Monte Carlo based MLEM.
210 Monte Carlo based reconstruction
struction on the appropriate MEGP collimator while figure 7.4(b) shows thesame reconstruction on a LEHR acquisition. Figure 7.4(c) and (d) show thereconstructions with Monte Carlo information for a MEGP collimator, and aLEHR collimator setup. The image of figure 7.4(a) is suboptimal due to thelimited spatial resolution caused by the large hole openings of the MEGP colli-mator (0.170 cm inner radius) and due to the 0.0864 cm septal thickness. Thisinferior spatial resolution is also shown in figure 3.11, compared to a LEHRcollimator. Figure 7.4(b) is suboptimal due the substantial photon penetration,caused by the 0.0203 cm low septal thickness of the LEHR collimator. Fig-ure 7.4(c) shows the Monte Carlo based reconstruction for a medium energyisotope on an appropriate MEGP collimator. This image is also suboptimal dueto the fact that the averaged Monte Carlo generated system response can not ac-count for the individual positions of the large MEGP collimator holes, whichcauses artefacts in the resulting image. Finally, Monte Carlo based recon-struction of a medium energy isotope data set acquired on LEHR collimators,results in an optimal reconstructed image of the phantom setup as is shownin figure 7.4(d). The method performs a valid resolution recovery resulting inhigher quality images. Figure 7.5 analogously demonstrates that the above dis-cussed conclusions are still valid for higher energy isotopes which was alreadypredicted by figure 7.2. Figure 7.5(b) clearly shows the four streak artefactscaused by photon penetration on the LEHR while figure 7.5(d) shows a magni-fied version of the resulting reconstructions after incorporation of Monte Carloinformation and also shows the appropriate resolution recovery.
The aforementioned reconstruction implementation is computationally de-manding since the detector response, which also comes at a computationalcost, has to be applied for each detection angle in each iteration step. How-ever, the PC’s graphics board provides a cost-effective means for an efficientimplementation. GPUs have been used for computed tomography recentlysince manufacturers now provide high point precision and a larger instructionset [136, 138, 139]. Ongoing research is being performed and future researchis scheduled within our group to implement this repetitive detector responseblurring on a GPU.
7.2 Natural Pixel based reconstruction for PET
A number of algorithms have been proposed for reconstructing 3D PET data.An early approach that has been implemented on a number of clinical scannersis the analytic 3D reprojection (3DRP) algorithm [69]. Another commonlyused approach is rebinning (FORE) which involves converting the 3D data toa 2D set [35], and then reconstructing using a 2D algorithm. One disadvantage
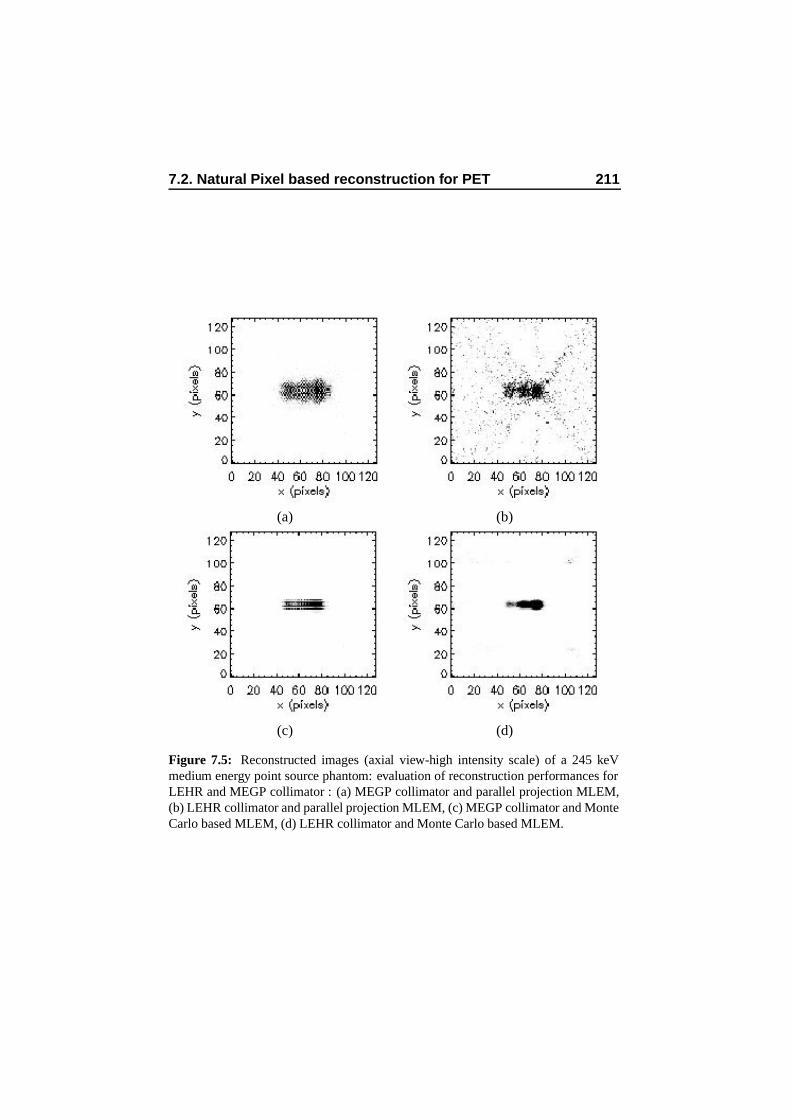
7.2. Natural Pixel based reconstruction for PET 211
(a) (b)
(c) (d)
Figure 7.5: Reconstructed images (axial view-high intensity scale) of a 245 keVmedium energy point source phantom: evaluation of reconstruction performances forLEHR and MEGP collimator : (a) MEGP collimator and parallel projection MLEM,(b) LEHR collimator and parallel projection MLEM, (c) MEGP collimator and MonteCarlo based MLEM, (d) LEHR collimator and Monte Carlo based MLEM.
212 Monte Carlo based reconstruction
of both the 3DRP and FORE methods is that these algorithms are derived us-ing the assumptions that measured data correspond to line integrals throughthe unknown activity distribution. There are a number of physical effectshowever that invalidate this assumption, including: positron range, gamma-gamma non-collinearity, spatially variant geometric efficiency, crystal scatterand (inter-)crystal penetration. All of these degradations contribute to the spa-tially variant detector response that reduces spatial resolution if not accountedfor. In chapter 4 we discussed the influence of crystal scatter in several detectormaterials and the main conclusion was that correction in the reconstruction forcrystal scatter is imperative for resolution recovery. In chapter 6 we derivedan analytical model for the detector response. This clearly demonstrated theinaccuracy of line integrals and proposed Gaussian tubes with varying width,depending on the distance to the detector. A necessary correction in the re-construction for intrinsic detection resolution and crystal penetration was con-cluded. These effects can accordingly be included in an iterative reconstructionby fully simulating the system matrix. Unfortunately, due to the large numberof scintillation crystals present in current PET scanners, this system matrixcan be very large, typically 3× 10¹⁴ elements. Natural pixel based reconstruc-tion allows to account for all image degrading effects through Monte Carlosimulation and limits the storage size of the system matrix by exploiting thesymmetries present in PET. This will be discussed hereafter.
We recently filed a multiyear project on this reconstruction technique dec-sribing the fundamentals and the expected resolution recovery. Next to dis-cussing the work in progress using preliminary results, section 7.2 will alsoline out the future reserach topics that resulted from this manuscript.
7.2.1 Theoretical background and geometrical results
Natural pixels
The relationship between the measurement gi of a detector pair in a PET scan-ner and the continuous object to be imaged f(x, y, z) can be described using aspatially variant detector response function hi(x, y, z)
gi =
∫
FOVf(x, y, z)hi(x, y, z)dxdydz, (7.1)
where hi(x, y, z) describes the probability that a positron emitted at location(x, y, z) is detected in detector pair i. Thus the PET reconstruction problemis to estimate the continuous object f(x, y, z) given a measured set of datagi. The conventional approach to formulating this problem is to approximatef(x, y, z) by the linear combination of J cubic voxel basis functions, denoted
7.2. Natural Pixel based reconstruction for PET 213
here by cj(x, y, z) where the subscript j refers to the jth basis function. Withthese voxel basis functions, the object can be approximated by:
f(x, y, z) =
J∑
j=1
fjcj(x, y, z), (7.2)
where fj are coefficients that weight each object voxel. In this formulation,f(x, y, z) is substituted in Eq. 7.1 for f(x, y, z) and the reconstruction problembecomes finding the estimate of the cubic voxel weighting coefficientsfj . ThePET data measurement process can then be expressed as:
gi =J
∑
j=1
ai,j fj, (7.3)
where
ai,j =
∫
FOVhi(x, y, z)cj(x, y, z)dxdydz (7.4)
is the contribution of the jth voxel to the ith detector pair. Eq. 7.3 can bewritten in matrix-vector form as:
g = Af. (7.5)
The tomographic problem can also be described using a reconstruction modelwith natural pixel image basis functions [7,19,54,59]. These natural pixels areformed using the detector sensitivity functions naturally provided by the PETscanner. In this approach, the estimated reconstruction is constrained to be alinear combination of basis functions hj(x, y, z); j = 1 . . . J , which are theprobability density functions of the detector pairs:
f(x, y, z) =
J∑
j=1
qjhj(x, y, z). (7.6)
Substituting f(x, y, z) into Eq. 7.1 for f(x, y, z) gives:
gi =
J∑
j=1
qj
∫
FOVhj(x, y, z)hi(x, y, z)dxdydz,
gi =J
∑
j=1
Mijqj , (7.7)
214 Monte Carlo based reconstruction
where
Mij =
∫
FOVhj(x, y, z)hi(x, y, z)dxdydz. (7.8)
Mij is refered to as a natural pixel matrix. Note that because the final estimateof the object has to be represented in terms of voxels, Eq. 7.6 can be writtenin matrix-vector form as f = AT q. Instead of solving for f using the inverseproblem of Eq. 7.5, one can also solve the inverse problem of Eq. 7.7 whichcan be expressed in matrix-vector form as:
g = Mq. (7.9)
The solution of this inverse problem q is a representation of the object in pro-jection space. The backprojection of q (= AT q) then results in the estimateof the object f . By using this approach with natural pixels, one avoids thediscretization of the object into a predefined voxelized grid until the final step(AT q). The object is represented by a sum of natural basis functions and theelements of the matrix M are the natural pixel values. An element at row i andcolumn j in the matrix M represents the natural pixel formed by the intersec-tion of LORs i and j. For a perfect imaging system this would be the intersec-tion of two parallel strips and the natural pixel value would be the area of theintersection. However, it is well known that PET scanners do not measure stripintegrals. For example we have shown in chapter 6 that for continuous detectorPET these strips are better modeled as Gaussian weighted tubes with distance-dependent width. Figure 7.6(a) shows the response (in 2D) from two detectorpairs in a 2D PET ring scanner. This hypothetical scanner only has 20 detectorpairs and only geometrical effects are considered (the physics of the photontransport: light spread, Anger logic, crystal scatter, crystal penetration are notmodeled). The integral over the product of these two response functions givesthe natural pixel value, which is one element in the matrix M . The resultingmatrix M for this hypothetical design is shown in Figure 7.6(b). It is importantto note that the matrix M is block-circulant. A block-circulant matrix is one inwhich all block columns are simply shifted versions of the first block column.The block-circulant property arises due to the rotational symmetry of the ba-sis functions and the ring detector geometry. Accordingly, the block-circulantfeature obtained by a natural pixel basis implies that the system matrix for ringPET scanners can be stored with substantially less memory requirements thanwith conventional voxel basis functions.
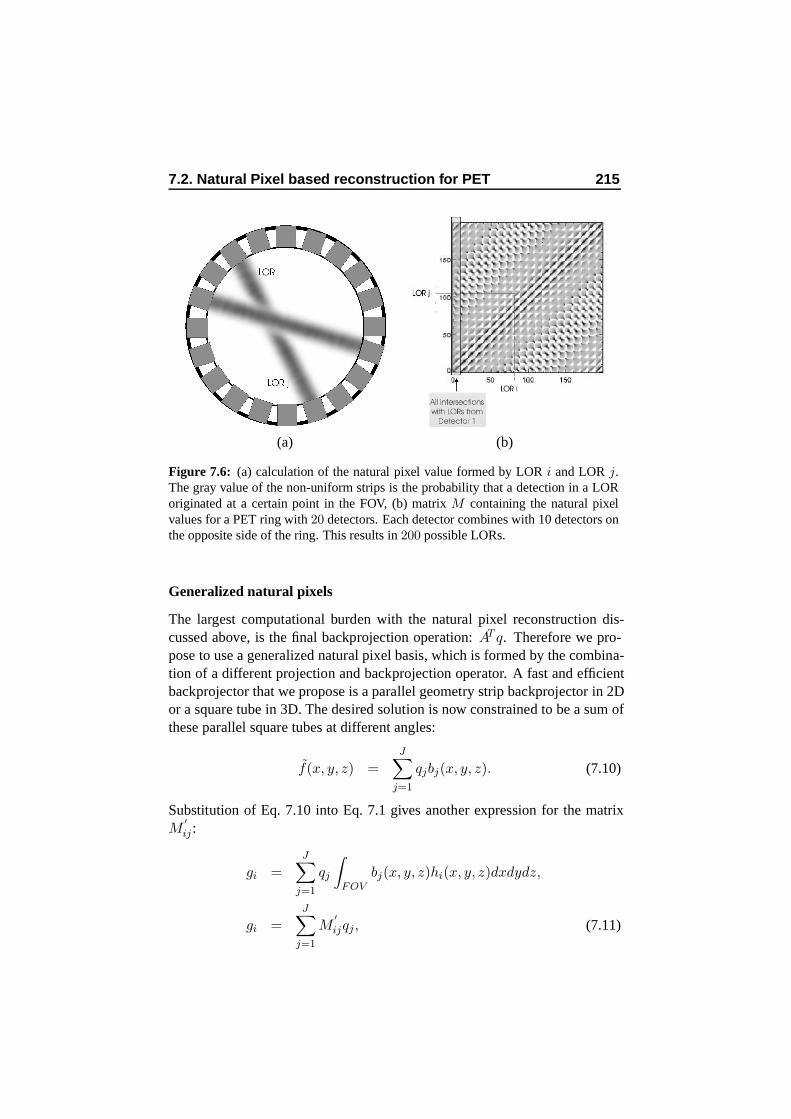
7.2. Natural Pixel based reconstruction for PET 215
(a) (b)
Figure 7.6: (a) calculation of the natural pixel value formed by LOR i and LOR j.The gray value of the non-uniform strips is the probability that a detection in a LORoriginated at a certain point in the FOV, (b) matrix M containing the natural pixelvalues for a PET ring with 20 detectors. Each detector combines with 10 detectors onthe opposite side of the ring. This results in 200 possible LORs.
Generalized natural pixels
The largest computational burden with the natural pixel reconstruction dis-cussed above, is the final backprojection operation: AT q. Therefore we pro-pose to use a generalized natural pixel basis, which is formed by the combina-tion of a different projection and backprojection operator. A fast and efficientbackprojector that we propose is a parallel geometry strip backprojector in 2Dor a square tube in 3D. The desired solution is now constrained to be a sum ofthese parallel square tubes at different angles:
f(x, y, z) =
J∑
j=1
qjbj(x, y, z). (7.10)
Substitution of Eq. 7.10 into Eq. 7.1 gives another expression for the matrixM
′
ij :
gi =
J∑
j=1
qj
∫
FOVbj(x, y, z)hi(x, y, z)dxdydz,
gi =J
∑
j=1
M′
ijqj, (7.11)
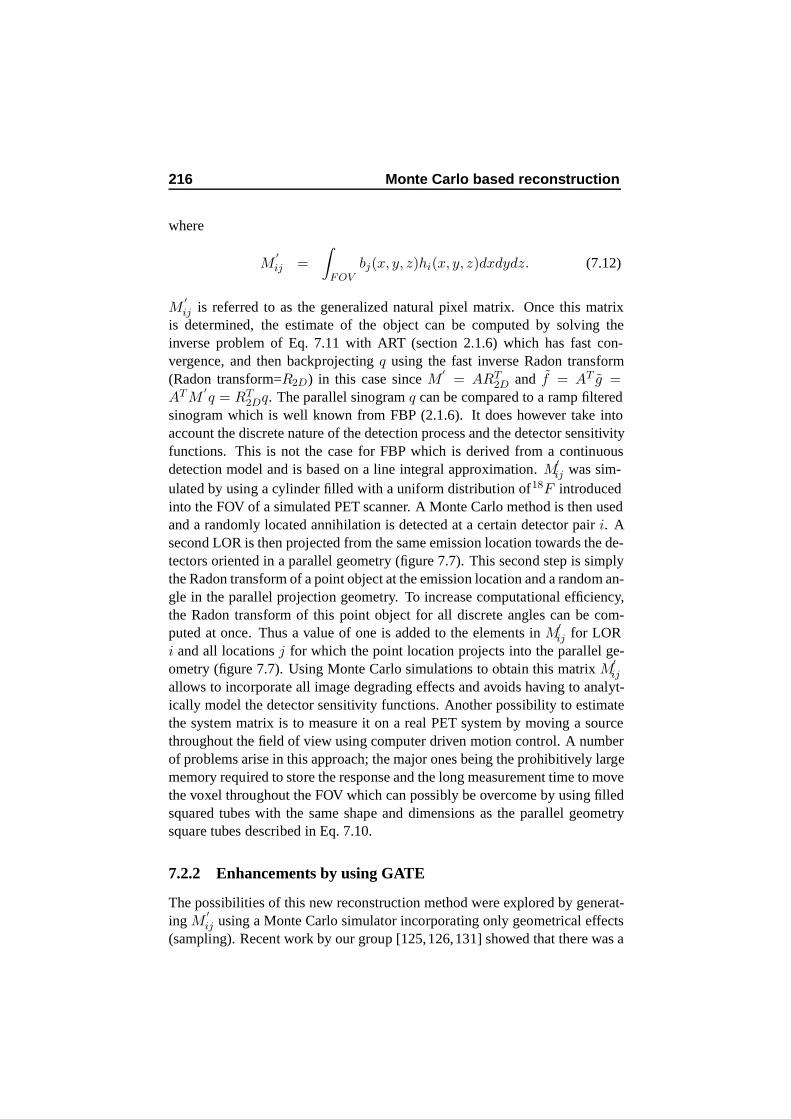
216 Monte Carlo based reconstruction
where
M′
ij =
∫
FOVbj(x, y, z)hi(x, y, z)dxdydz. (7.12)
M′
ij is referred to as the generalized natural pixel matrix. Once this matrixis determined, the estimate of the object can be computed by solving theinverse problem of Eq. 7.11 with ART (section 2.1.6) which has fast con-vergence, and then backprojecting q using the fast inverse Radon transform(Radon transform=R2D) in this case since M
′= ART
2D and f = AT g =AT M
′q = RT
2Dq. The parallel sinogram q can be compared to a ramp filteredsinogram which is well known from FBP (2.1.6). It does however take intoaccount the discrete nature of the detection process and the detector sensitivityfunctions. This is not the case for FBP which is derived from a continuousdetection model and is based on a line integral approximation. M
′
ij was sim-ulated by using a cylinder filled with a uniform distribution of18F introducedinto the FOV of a simulated PET scanner. A Monte Carlo method is then usedand a randomly located annihilation is detected at a certain detector pair i. Asecond LOR is then projected from the same emission location towards the de-tectors oriented in a parallel geometry (figure 7.7). This second step is simplythe Radon transform of a point object at the emission location and a random an-gle in the parallel projection geometry. To increase computational efficiency,the Radon transform of this point object for all discrete angles can be com-puted at once. Thus a value of one is added to the elements in M
′
ij for LORi and all locations j for which the point location projects into the parallel ge-ometry (figure 7.7). Using Monte Carlo simulations to obtain this matrix M
′
ij
allows to incorporate all image degrading effects and avoids having to analyt-ically model the detector sensitivity functions. Another possibility to estimatethe system matrix is to measure it on a real PET system by moving a sourcethroughout the field of view using computer driven motion control. A numberof problems arise in this approach; the major ones being the prohibitively largememory required to store the response and the long measurement time to movethe voxel throughout the FOV which can possibly be overcome by using filledsquared tubes with the same shape and dimensions as the parallel geometrysquare tubes described in Eq. 7.10.
7.2.2 Enhancements by using GATE
The possibilities of this new reconstruction method were explored by generat-ing M
′
ij using a Monte Carlo simulator incorporating only geometrical effects(sampling). Recent work by our group [125,126,131] showed that there was a
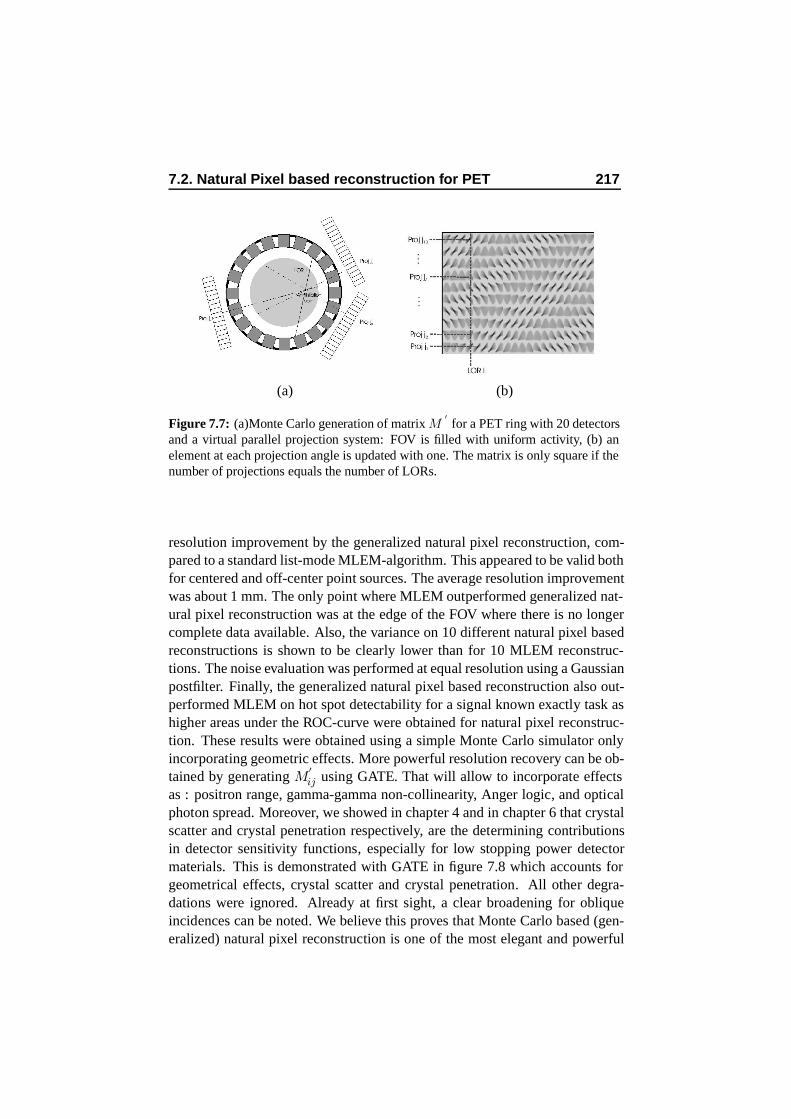
7.2. Natural Pixel based reconstruction for PET 217
(a) (b)
Figure 7.7: (a)Monte Carlo generation of matrix M′
for a PET ring with 20 detectorsand a virtual parallel projection system: FOV is filled with uniform activity, (b) anelement at each projection angle is updated with one. The matrix is only square if thenumber of projections equals the number of LORs.
resolution improvement by the generalized natural pixel reconstruction, com-pared to a standard list-mode MLEM-algorithm. This appeared to be valid bothfor centered and off-center point sources. The average resolution improvementwas about 1 mm. The only point where MLEM outperformed generalized nat-ural pixel reconstruction was at the edge of the FOV where there is no longercomplete data available. Also, the variance on 10 different natural pixel basedreconstructions is shown to be clearly lower than for 10 MLEM reconstruc-tions. The noise evaluation was performed at equal resolution using a Gaussianpostfilter. Finally, the generalized natural pixel based reconstruction also out-performed MLEM on hot spot detectability for a signal known exactly task ashigher areas under the ROC-curve were obtained for natural pixel reconstruc-tion. These results were obtained using a simple Monte Carlo simulator onlyincorporating geometric effects. More powerful resolution recovery can be ob-tained by generating M
′
ij using GATE. That will allow to incorporate effectsas : positron range, gamma-gamma non-collinearity, Anger logic, and opticalphoton spread. Moreover, we showed in chapter 4 and in chapter 6 that crystalscatter and crystal penetration respectively, are the determining contributionsin detector sensitivity functions, especially for low stopping power detectormaterials. This is demonstrated with GATE in figure 7.8 which accounts forgeometrical effects, crystal scatter and crystal penetration. All other degra-dations were ignored. Already at first sight, a clear broadening for obliqueincidences can be noted. We believe this proves that Monte Carlo based (gen-eralized) natural pixel reconstruction is one of the most elegant and powerful
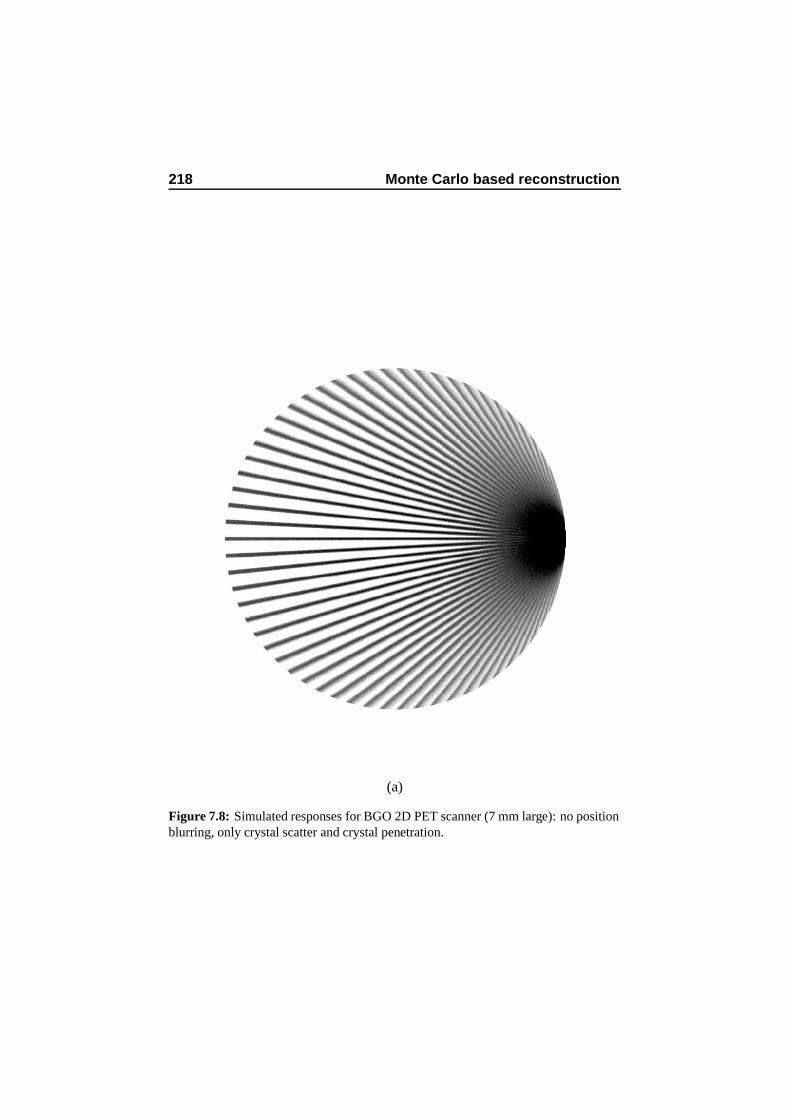
218 Monte Carlo based reconstruction
(a)
Figure 7.8: Simulated responses for BGO 2D PET scanner (7 mm large): no positionblurring, only crystal scatter and crystal penetration.
7.3. Conclusion + original contributions 219
ways to incorporate image degrading effects into the reconstruction using onlya limited storage size by exploiting the intrinsic symmetries.
7.3 Conclusion + original contributions
Chapter 4 showed that a Beacon attenuation image is often degraded near thecenter of large patients in a medium energy emission study and that it wouldbe recommendable to replace the MEGP collimators by the LEHR variants ifa recovery for the increased photon spread is implemented.
We described an approach that derives the detector response from a fully3D simulated system matrix, for medium energy studies on low energy colli-mators in order to replace the MEGP collimators by the LEHR variants. Weincorporated this detector response in a dedicated Monte Carlo based recon-struction that accurately recovers the medium energy isotope photon spreadon a LEHR. This recovery performance is inferior for the MEGP collimatorwhere the individual hole positions become important given their size, sincethis is not accounted for in the averaged system response. In all cases thereconstruction of medium energy isotopes on LEHR gives the best result, pro-vided that the detector response is fully simulated and incorporated. Since themarket of miniclusters is rapidly gaining importance in the scientific commu-nity and is becoming affordable we believe this approach to be useful in pro-tocol optimization, and reconstruction technique examination for the mediumenergy studies discussed above. We believe to have derived a very importantguideline for transmission imaging in a medium energy emission study. Thiswork resulted in a peer reviewed journal publication [106]. The influence ofthe resolution recovery on noise magnification for realistic images still has tobe investigated in more detail.
A multiyear project has been filed in which the potential benefits of natu-ral pixel reconstruction are described and in which we highlight future researchwork. Investigating Monte Carlo based generalized natural pixel reconstruc-tion will be one of our main research topics for the next 5 years. The imple-mentation discussed in section 7.2.1 describes how we were able to gain 1 mmreconstructed resolution by using a generalized natural pixel reconstruction inwhich the system matrix was simulated using a geometric Monte Carlo simu-lator. The geometric simulator only accounts for the geometric sampling anddoes not include Anger logic and light spread. Moreover, the main degrada-tion factors are crystal scatter (chapter 4) and crystal penetration (chapter 6)which were also not accounted for by the geometric simulator. Future workwill investigate what additional resolution recovery can be achieved by sim-ulating the generalized natural pixel representation of the system matrix with

220 Monte Carlo based reconstruction
GATE, incorporating crystal scatter and crystal penetration for several detectormaterials as was described in section 7.2.2.
Chapter 8
General Conclusion
This finalizing chapter will give an overview of the research discussed in thismanuscript and will delineate the envisioned future research projects that orig-inated from this work.
In chapter 2 a short overview of nuclear medicine, including reconstruc-tion, was given in order to frame the underlying dissertation. Furthermore, theGATE simulation package was introduced as an upper layer of the general-purpose high energy physics code, Geant4. GATE is a Monte Carlo code ca-pable of accomodating complex scanner geometry and imaging configurationsin a user-friendly way, accounting for timing information while retaining thecomprehensive physics modeling abilities of Geant4. A thorough literaturestudy was presented in chapter 2 about the applications of Monte Carlo meth-ods in nuclear medicine which highlighted four main fields in which GATEcould be of significant relevance: attenuation and scatter correction techniques,imaging systems and collimator design, intrinsic detector modeling and MonteCarlo based reconstruction. Specific research on these four topics is presentedin this dissertation.
Chapter 3 starts with reporting the SPECT validation study that was per-formed to verify the accuracy of GATE simulations versus measurements ona commercial SPECT acquisition system. For this purpose we have modeledall aspects of a scintillation camera, including different collimators. The mostimportant aspects for SPECT imaging were validated and it was demonstratedthat GATE needs very little assumptions to accurately describe real cameradesigns, making it in that way very flexible. This leads to the possibility of us-ing GATE for simulating existing camera setups in different acquisition modeswith different parameters, different isotopes and different collimators. Ongo-ing work is being performed on the validation of GATE for dosimetric appli-cations. The latter is one of the most important future research aspects of the
222 General Conclusion
OpenGATE collaboration next to gridification and cluster distribution.
Chapter 4 deals with attenuation and scatter correction on Beacon (gammacamera) PET and Beacon-SPECT. It is the first simulation study using thevirtual GATE clock synchronisation to such a large extent. Suggestions forprotocol optimization studies in Beacon PET on a hybrid gamma camera weremade. The important detector parts for contamination of the attenuation im-age by the 511 keV emission isotope were pinpointed: entrance sheets andend parts. Design work should focus on those aspects to further reduce cross-contamination if one wants to keep using gamma camera PET without thetime-consuming mock scan before switching to PET or PET/CT. We showedthat the interwindow contamination of the emission energy window in the caseof simultaneous emission/transmission imaging for Beacon-SPECT is small-est in the LEHR collimator, thick crystal setup. Moreover we found that theBeacon attenuation image is often degraded near the center of large patientswhen a transmission acquisition is performed simultaneously or sequentiallywith the medium energy emission study. In this particular case, it would berecommendable to replace the MEGP collimators by the LEHR variants if oneuses the Monte Carlo based reconstruction method, discussed in chapter 7, thataccounts for the increased photon spread.
Chapter 4 also discusses a qualitative interpretation for the importance ofmultiple order scatter in 3D PET. Various crystal types, including innovativematerials as LaBr3 and LuI3, were examined. It became clear that only firstorder patient scatter is significantly degrading the photopeak acquisitions forall crystal types. The importance of multiple order scatter is less than 10%.It was also shown that BGO and LSO give rise to higher NEC’s. This willnot be the case for BGO in higher count rate studies since dead time effectswill become predominant due to the slow scintillation time of the crystal ma-terial. Incorporation of the effect of crystal scatter in reconstruction appearedto be mandatory. Two approaches were suggested, of which one was furtherdiscussed in chapter 7.
In chapter 5 we investigated a new acquisition system design with a stripsolid state detector and with a slat collimator by comparison with parallel beamsetups on a pixelated solid state detector and on a single crystal NaI detector.Solid state devices have a better energy resolution making them more appro-priate for dual isotope imaging. The rotating slat collimator results in a betterresolution and in a higher sensitivity. As far as the contrast and hot spot de-tectability is concerned, the classical collimator setup on a CZT and on a NaIdetector outperforms the rotating slat equivalent. However when we increasedthe strip width behind the slats, the rotating slat performance closed in on theparallel beam setup performances. This is promising since the active detector
223
area in the rotating slat design is, in this case, still only half of the two otheracquisition models. The solid state setups have the disadvantage of economiccost however as the CZT material is far more expensive than a NaI crystal.Observer studies should be extended on a data set generated using a dedicated3D reconstruction algorithm as was very recently derived by Zeng [147] andby Wang [135]. In those implementations the additional distance-dependentsensitivity information for the rotating slat design could result in an improvedperformance on reconstructions and could cancel out the performance deficit inthe aforementioned projection study. This will be subject to further research.We also extended the work of Metz (parallel hole), and Tsui (fanbeam andconebeam) for the geometric transfer function of a slat collimator on a stripdetector. For sensitivity and resolution as well as for transaxial profiles of linespread functions we could calculate closed analytical behavior formulations,derived from the analytical expression for the geometric transfer function inthe Fourier domain. We found that the sensitivity depends on the angle of in-cidence and on the distance to the detector, while the spatial resolution of thisparticular imaging system is constant in a plane at a fixed distance from thecollimator. We also concluded that the line spread functions were triangular.The presented formulation of the geometric transfer function will be useful initerative reconstruction algorithms in order to incorporate distance dependenteffects. It will be applied in combination with additional simulation study re-sults which account for collimator scatter and septal penetration of the slats, acontribution that only gains importance with higher energy isotopes.
In chapter 6 we have derived a theoretical model for incorporation of thedetection location uncertainty in continuous detector PET. The resulting de-tector sensitivity function could not be analytically expressed in a closed formand was thus calculated each time by means of numerical integration. Wefound that the transversal profiles could be approximated by Gaussians, forperpendicular incidences with an error of 0.1%, while an error of 1% resultedfor oblique incidences on a thin crystal detector. We incorporated the depthof interaction of a photon into our theoretical model for oblique incidenceson thicker crystals and reached an analytical expression for the function thatshould replace the traditional Gaussian for the detection uncertainty. We alsoconfirmed the statement that the interaction probability of a 511 keV photonthrough the PET-crystal is almost uniform. After verification it became clearthat this model is valid for incorporation in a reconstruction algorithm in orderto more accurately model the acquisition process and to improve the spatialresolution of the tomographic images. This model can also be used to calcu-late the spatial resolution of systems that are still in design which proves itsmultiple usefulness. To our knowledge this is the first theoretical LOR model
224 General Conclusion
for a continuous detector PET system accurately incorporating the detectionuncertainty of the annihilation photons as a function of distance to the detectorheads.
In chapter 7 we described a reconstruction implementation that derives thedetector response from a fully 3D Monte Carlo simulated system matrix, formedium energy studies on low energy collimators. We incorporated this detec-tor response in a dedicated Monte Carlo based reconstruction that accuratelyrecovers the medium energy isotope photon spread on a LEHR. In all casesthe reconstruction of medium energy isotopes on LEHR gives the best result,provided that the detector response is fully simulated and incorporated. Inthis way we solved the issue, raised by chapter 4, which showed that a Bea-con attenuation image is often degraded near the center of large patients in amedium energy emission study and that it would be recommendable to replacethe MEGP collimators by the LEHR variants if a recovery for the increasedphoton spread is incorporated. We believe to have derived in that way a veryimportant guideline for transmission imaging in a medium energy emissionstudy. Since the market of miniclusters is rapidly gaining importance in thescientific community and is becoming affordable, the approach of Monte Carlobased reconstruction will be useful in protocol optimization, and reconstruc-tion technique examination for the medium energy studies discussed above.
Apart from this dedicated Monte Carlo based reconstruction, a multiyearproject has been filed in which the potential benefits of natural pixel recon-struction are described and in which we highlight future research work. Inves-tigating Monte Carlo based generalized natural pixel reconstruction will be oneof our main research topics for the next years. The implementation discussedin chapter 7 describes how we were able to gain 1 mm reconstructed resolu-tion by using a generalized natural pixel reconstruction in which the systemmatrix was simulated using a geometric Monte Carlo simulator. The geomet-ric simulator only accounts for the geometric sampling and does not includeAnger logic and light spread. Moreover, the main degradation factors are crys-tal scatter which was extensively analyzed in chapter 4 and crystal penetrationwhich showed to be determining in chapter 6. The latter two effects were alsonot accounted for by the geometric simulator. Future work will investigatewhat additional resolution recovery can be achieved by simulating the gen-eralized natural pixel representation of the system matrix with GATE, incor-porating crystal scatter and crystal penetration for several detector materials.A Gaussian blurring can be added to account for the Anger logic and for thelight spread although a realistic optical model will be derived using dedicatedsoftware to achieve a more accurate representation of the intrinsic crystal res-olution. Extension of the generalized natural pixel reconstruction to 3D will
225
be of future interest by using a Fourier transformation for the block diagonal-ization of the block circulant system matrix. Since GATE is one of the mostaccurate simulation tools for SPECT and PET, and given the promising pre-liminary results of the generalized natural pixel reconstruction, we believe thismethod can evolve to one of the most powerful resolution recovery techniquesavailable in nuclear medicine research.

226 General Conclusion

Bibliography
[1] S. Agnostelli et al., “Geant4: a simulation toolkit,” Nuclear Instrumentsand Methods A, vol. 506, pp. 250–303, 2003.
[2] P. Andreo, “Monte Carlo techniques in medical radiation physics,”Physics in Medicine and Biology, vol. 36, pp. 861–920, 1991.
[3] H. Anger, “Gamma ray efficiency and image resolution in sodium io-dide,” Review of Scientific Instruments, vol. 35, pp. 693–697, 1964.
[4] K. Assie, V. Breton, I. Buvat, C. Comtat, S. Jan, M. Krieguer, D. Lazaro,C. Morel, M. Rey, G. Santin, L. Simon, S. Staelens, D. Strul, J. Vieira,and R. Van de Walle, “Monte Carlo simulation in PET and SPET in-strumentation using GATE,” Nuclear Instruments and Methods A, vol.527/1-2, pp. 180–189, 2004.
[5] K. Assie, I. Gardin, P. Vera, and I. Buvat, “Validation of Monte Carlosimulations of Indium11 SPECT using GATE,” Journal of NuclearMedicine, vol. 45, no. 5, p. 1298, 2004.
[6] C. Bai, G. Zeng, and G. Gullberg, “A slice by slice blurring modeland kernel evaluation using the Klein-Nishina formula for 3D scat-ter compensation in parallel and converging beam SPECT,” Physics inMedicine and Biology, vol. 45, pp. 1275–1307, 2000.
[7] J. Baker, T. Budinger, and R. Huesman, “Generalized approach to in-verse problems in tomography: image reconstruction for spatially vari-ant systems using natural pixels,” Critical Reviews in Biomedical Engi-neering, vol. 20, pp. 47–71, 1992.
[8] F. Beekman, H. de Jong, and E. Slijpen, “Efficient SPECT scatter calcu-lation in non-uniform media using correlated Monte Carlo simulation,”Physics in Medicine and Biology, vol. 44, pp. 183–192, 1999.
228 BIBLIOGRAPHY
[9] F. Beekman, J. den Harder, M. Viergever, and P. van Rijk, “SPECT scat-ter modeling in non-uniform attenuating objects,” Physics in Medicineand Biology, vol. 42, pp. 1133–1142, 1997.
[10] F. Beekman, C. Kamphuis, B. Hutton, and P. van Rijk, “Half-fanbeamcollimators combined with scanning point sources for simultaneousemission-transmission imaging,” Journal of Nuclear Medicine, vol. 39,pp. 1996–2002, 1998.
[11] F. Beekman, C. Kamphuis, and M. Viergever, “Improved SPECT quan-titation using fully three-dimensional iterative spatially variant scat-ter response compensation,” IEEE Transactions on Medical Imaging,vol. 15, pp. 491–499, 1996.
[12] F. Beekman, B. Vastenhouw, and F. Van der Have, “Towards 3D nu-clear microscopy using locally focussing many pinhole small animalSPECT,” in Proceedings of the Fully 3D Conference, Saint Malo,France, 2003, pp. Th PM 1–6.
[13] F. Beekman, H. W. de Jong, and S. van Geloven, “Efficient fully 3D iter-ative SPECT reconstruction with Monte Carlo based scatter correction,”IEEE Transactions on Medical Imaging, vol. 21, pp. 867–877, August2002.
[14] H. Benveniste and S. Blackband, “MR microscopy and high res-olution’small animal MRI: applications in neuroscience research,”Progress in Neurobiology, vol. 67, no. 5, pp. 393–420, 2002.
[15] A. Bice, T. Lewellen, R. Miyaoka, R. Harrison, D. Haynor, K. Pol-lard, C. Hanson, and S. Gillispie, “Monte Carlo simulations of BaF2
detectors used in time of flight positron emission tomography,” IEEETransactions on Nuclear Science, vol. 37, pp. 696–701, 1990.
[16] A. Bielajew, H. Hirayama, W. Nelson, and D. Rogers, “History,overview and recent improvements of EGS4,” National Research Coun-cil, Ottawa, Canada, Tech. Rep., 1994.
[17] J. Briesmeister, “MCNP - A general Monte Carlo N-particle transportcode,” Los Alamos National Laboratory, Los Alamos, NM, USA, Tech.Rep., 1993.
[18] R. Brun and F. Rademakers, “ROOT, an object oriented data analysisframework,” Nuclear Instruments and Methods A, vol. 389, pp. 81–86,1997.
BIBLIOGRAPHY 229
[19] H. Buonocore, W. Brody, and A. Macowski, “A natural pixel decompo-sition for twodimensional image reconstruction,” IEEE Transactions onBiomedical Engineering, vol. 2, pp. 69–78, 1981.
[20] I. Buvat, “A non-parametric bootstrap approach for analysing the sta-tistical properties of SPET and PET images,” Physics in Medicine andBiology, vol. 47, pp. 1761–1775, 2002.
[21] I. Buvat and I. Castiglioni, “Monte Carlo simulations in SPET andPET,” Quarterly Journal of Nuclear Medicine, vol. 46, pp. 48–61, 2002.
[22] I. Buvat, D. Lazaro, and V. Breton, “Fully 3D Monte Carlo reconstruc-tion in SPECT: Proof of concept and is it worthwile?” in Proceedingsof the Fully 3D Conference, Saint Malo, France, 2003, pp. We AM1–1.
[23] I. Buvat, M. Rodriguezvillafuerte, A. Toddpokropek, H. Benali, andR. Dipaolo, “Comparative assessment of 9 scatter correction methodsbased on spectral-analysis using Monte Carlo simulations,” Journal ofNuclear Medicine, vol. 36, no. 8, pp. 1476–1488, 1995.
[24] S. Cherry, Y. Shao, R. Silverman, K. Meadors, S. Siegel, A. Chatzi-ioannou, J. Young, W. Jones, J. Moyers, D. Newport, A. Boutef-nouchet, T. Farquhar, M. Andreaco, M. Paulus, D. Binkley, R. Nutt,and M. Phelps, “MicroPET: A high resolution PET scanner for imagingsmall animals,” IEEE Transactions on Nuclear Science, vol. 44, no. 3,pp. 1161–1166, 1997.
[25] O. Chibani and X. Li, “Monte Carlo dose calculations in homoge-neous media and at interfaces: A comparison between GEPTS, EGSnrc,MCNP, and measurements,” Medical Physics, vol. 29, no. 5, pp. 835–847, 2003.
[26] Z. Cho, J. Jones, and M. Singh, Foundations of medical imaging. JohnWiley & sons Inc., 1993.
[27] Y. Chung, Y. Choi, G. Cho, Y. Choe, K. Lee, and B. Kim, “Optimizationof dual layer phoswich detector consisting of LSO and LuYAP for smallanimal PET,” in Proceedings of the IEEE Medical Imaging Conference,Portland, USA, 2003, pp. M7–12.
[28] K. Comanor, P. Virador, and W. Moses, “Algorithms to identify detec-tor Compton scatter in PET modules,” IEEE Transactions on NuclearScience, vol. 43, pp. 2213–2218, 1996.
230 BIBLIOGRAPHY
[29] C. Contag and B. Ross, “It’s not just about anatomy: In vivo biolu-minescence imaging as an eyepiece into biology,” Journal of MagneticResonance Imaging, vol. 16, no. 4, pp. 378–387, 2002.
[30] A. Cot, J. Sempau, D. Pareto, S. Bullich, J. Pavia, F. Calvino, andD. Ros, “Evaluation of the geometric, scatter, and septal penetrationcomponents in fan-beam collimators using Monte Carlo simulation,”IEEE Transactions on Nuclear Science, vol. 49, no. 1, pp. 12–16, 2002.
[31] Y. D’Asseler, C. Croiselle, H. Gifford, S. Vandenberghe, R. Vande Walle, I. Lemahieu, and S. Glick, “Calculating numerical observerperformance for list mode PET using the bootstrap method,” in Pro-ceedings of the Fully 3D Conference, Saint Malo, France, 2003, pp. ThPM2–4.
[32] Y. D’Asseler, C. Croiselle, H. Gifford, S. Vandenberghe, R. Vande Walle, I. Lemahieu, and S. Glick, “Evaluating human observer per-formance for list mode pet using the bootstrap method,” in Proceedingsof the IEEE Medical Imaging Conference, Portland, USA, 2003, pp.M14–207.
[33] Y. D’Asseler, C. Groiselle, H. Gifford, S. Vandenberghe, S. Staelens,R. Van de Walle, I. Lemahieu, and S. Glick, “Evaluating human ob-server performance for list mode PET using the bootstrap method,” au-gust 2004, submitted for IEEE Transactions on Nuclear Science.
[34] J. De Beenhouwer, S. Staelens, Y. D’Asseler, S. Vandenberghe,I. Lemahieu, and R. Van de Walle, “Geomterical importance samplingand pulse height tallies in GATE,” April 2004, accepted for the EMBSConference, San Fransisco, USA.
[35] M. Defrise, “A factorization method for the 3D X-ray transform,” In-verse Problems, vol. 11, pp. 983–994, 1997.
[36] B. Efron, The jackknife, bootstrap and other resampling plans. Siam,1982.
[37] K. Erlandsson, M. Ivanovic, S. Strand, K. Sjorgen, and D. Weber, “Highresolution pinhole SPECT for small animal imaging,” Journal of Nu-clear Medicine, vol. 34, no. 5, p. 9, 1993.
[38] J. Feng and B. Penney, “Determination of attenuation maps using a Ba-133 source and medium energy collimators in SPECT,” in Proceedingsof the IEEE Medical Imaging Conference, vol. 2, 2002, pp. 1264 – 1266.
BIBLIOGRAPHY 231
[39] C. Floyd, R. Jaszczak, and R. Coleman, “Inverse Monte Carlo: a unifiedreconstruction algorithm for SPECT,” IEEE Transactions on NuclearScience, vol. 32, pp. 779–785, 1985.
[40] C. Floyd, R. Jaszczak, K. Greer, and R. Coleman, “Inverse MonteCarlo: a unified reconstruction algorithm for ECT,” Journal of NuclearMedicine, vol. 27, pp. 1577–1585, 1996.
[41] B. Fraass, J. Smathers, and J. Deye, “Summary and recommendations ofa national cancer institute workshop on issues limiting the clinical useof Monte Carlo dose calculation algorithms for megavoltage externalbeam radiation therapy,” Medical Physics, vol. 30, no. 12, pp. 3206–3216, 2003.
[42] D. Gagnon, C. Tung, L. Zeng, and W. Hawkins, “Design and early test-ing of a new medium-energy transmission device for attenuation correc-tion in SPECT and PET,” in Proceedings of the IEEE Medical ImagingConference, vol. 3, 1999, pp. 1349 – 1353.
[43] D. Gagnon, G. Zeng, M. Links, J. Griesmer, and C. Valentino, “De-sign considerations for a new solid state gammacamera: SOLSTICE,”in Nuclear Science Symposium Conference Record, vol. 2, 2001, pp.1156–1160.
[44] S. Garelli, S. Giordano, G. Piemontese, and S. Squaricia, “InteractiveFLUKA: a World Wide Web version for a simulation code in proton-therapy,” Journal de Chimie Physique et de Physico-Chimie Biologique,vol. 95, no. 4, pp. 767–771, 1998.
[45] GATE, http://www-lphe.epfl.ch/GATE/.
[46] Geant4, http://wwwasd.web.cern.ch/wwwasd/geant4/geant4.html.
[47] H. Gifford and M. King, “Comparison of human- and model-observerLROC studies,” in Proceedings of the SPIE Medical Imaging confer-ence, vol. 5034, San Diego, USA, 2003, pp. 16–24.
[48] G. Gindi, M. Lee, A. Rangarajan, and I. Zubal, Bayesian Reconstructionof Functional Images using Anatomical Information as Priors. Colch-ester, A.C.F. and Hawkes, D.J.Springer, New York, 1991, pp. 121–131.
[49] G. Gindi, M. Lee, A. Rangarajan, and I. Zubal, “Bayesian reconstruc-tion of functional images using anatomical information as priors,” IEEETransactions on Medical Imaging, vol. 12, pp. 351–359, 1993.
232 BIBLIOGRAPHY
[50] S. Glick, “The effect of intrinsic spatial resolution on the quantitativeaccuracy of SPECT imaging,” IEEE Transactions on Nuclear Science,vol. 46, pp. 1009–1015, 1999.
[51] E. Graves, R. Weissleder, and V. Ntziachristos, “Fluorescence molecularimaging of small animal tumor models,” Current Molecular Medicine,vol. 4, no. 4, pp. 419–430, 2004.
[52] J. Griesmer, B. Kline, J. Grosholz, K. Parnham, and D. Gagnon,“Performance evaluation of a new CZT detector for nuclearmedicine:SOLSTICE,” in Nuclear Science Symposium ConferenceRecord, vol. 2, 2001, pp. 1050–1054.
[53] C. Groiselle, Y. D’Asseler, J. Kolthammer, C. Matthews, and S. Glick,“A Monte Carlo simulation study to evaluate septal spacing using triple-head hybrid PET imaging,” IEEE Transactions on Nuclear Science,vol. 50, no. 5, pp. 1339–1346, 2003.
[54] G. Gullberg, Y. Hsieh, and G. Zeng, “An SVD reconstruction algorithmusing the natural pixel representation of the attenuated radon transform,”IEEE Transactions on Nuclear Science, vol. 43, pp. 295–303, 1996.
[55] R. Harrison, S. Vannoy, D. Haynor, S. Gillipsie, M. Kaplan, andT. Lewellen, “Preliminary experience with the photon generator mod-ule of a public-domain simulation system for emission tomography,” inProceedings of the IEEE Medical Imaging Conference, San Fransico,USA, 1993, pp. 1154–1158.
[56] U. Heinrichs, U. Pietrzyk, and K. Ziemons, “Design optimization of thePMT-ClearPET prototypes based on simulation studies with GEANT3,”IEEE Transactions on Nuclear Science, vol. 50, no. 5, pp. 1428–1432,2003.
[57] E. Hoffman, S. Huang, M. Phelps, and D. Kuhl, “Quantitation inpositron emission computed tomography: 4 effects of accidental coin-cidences,” Journal of Computer Assisted Tomography, vol. 5, pp. 391–440, 1981.
[58] C. Holdsworth, C. Levin, M. Janecek, M. Dahlbom, and E. Hoffman,“Performance analysis of an improved 3-D PET Monte Carlo simulationand scatter correction,” IEEE Transactions on Nuclear Science, vol. 49,no. 1, pp. 83–89, 2002.
BIBLIOGRAPHY 233
[59] Y. Hsieh, G. Zeng, and G. Gullberg, “Projection space image recon-struction using strip functions to calculate pixels more natural for mod-eling the geometric response of the SPECT collimator,” IEEE Transac-tions on Medical Imaging, vol. 17, pp. 24–44, 1998.
[60] H. Huesman, E. Salmeron, and J. Baker, “Compensation for crystal pen-etration in high resolution positron tomography,” IEEE Transactions onNuclear Science, vol. 36, pp. 1100–1107, 1989.
[61] Images courtesy of GE Healthcare, “SPECT/CT case study.”
[62] Images courtesy of Philips Medical Systems, “Mosaic small animalPET.”
[63] Interfile, “http://gamma.wustl.edu/interfile33.”
[64] S. Jan, “Simulateur Monte Carlo et camera a xenon liquide pour laTomographie a Emission de Positons,” Ph.D. dissertation, UniversiteJoseph Fourier, Grenoble, France, 2002.
[65] S. Jan, A. Chatziioannou, C. Comtat, D. Strul, G. Santin, and R. Tre-bossen, “Monte Carlo simulation for the microPET P4 system usingGATE,” in Proceedings of the HiRes Conference, vol. 5, Academy ofMolecular Imaging, Madrid, 2003, p. 138.
[66] S. Jan, C. Comtat, D. Strul, and R. Trebossen, “Monte Carlo Simulationfor the ECAT EXACT HR+ system using GATE,” in Proceedings of theIEEE Medical Imaging Conference, Portland, USA, 2003, pp. M10–178.
[67] S. Jan, C. Comtat, R. Trebossen, and A. Syrota, “Monte Carlo simu-lation of the MicroPET Focus for small animal,” Journal of NuclearMedicine, vol. 45, no. 5, p. 1313, 2004.
[68] S. Jan, G. Santin, D. Strul, S. Staelens, K. Assie, D. Autret, D. Avner,R. Barbier, M. Bardies, P. Bloomfield, D. Brasse, V. Breton, P. Bruyn-donckx, I. Buvat, A. Chatziioannou, Y. Choi, Y. Chung, C. Comtat,D. Donnarieix, L. Ferrer, S. Glick, C. Groiselle, S. Kerhoas-Cavata,A. Kirov, V. Kohli, M. Koole, M. Krieguer, J. van der Laan, F. Lamare,G. Largeron, C. Lartizien, D. Lazaro, M. Maas, L. Maigne, F. Mayet,F. Melot, S. Nehmeh, E. Pennacchio, J. Perez, U. Pietrzyk, F. Ran-nou, M. Rey, D. Schaart, R. Schmidtlein, L. Simon, T. Song, J. Vieira,
234 BIBLIOGRAPHY
D. Visvikis, R. Van de Walle, E. Wieers, and C. Morel, “GATE: a sim-ulation toolkit for PET and SPECT,” Physics in Medicine and Biology,vol. 49, no. 19, pp. 4543–4561, 2004.
[69] P. Kinahan, “Analytic 3D image reconstruction using all detectedevents,” IEEE Transactions on Nuclear Science, vol. 36, no. 1, pp. 964–968, 1989.
[70] M. Koole, S. Staelens, S. Vandenberghe, Y. D’Asseler, R. Van de Walle,and I. Lemahieu, “Analytical model for Solstice detector response,” inProceedings of the IEEE Medical Imaging Conference, Portland, USA,2003, pp. M14–270.
[71] F. Lamare, A. Turzo, Y. Bizais, and D. Visvikis, “Simulation of theAllegro PET system using GATE,” in Proceedings of the SPIE MedicalImaging conference, vol. 5368, San Diego, USA, 2004, pp. 890–897.
[72] C. Lartizien, A. Reilhac, N. Costes, M. Janier, and D. Sappey-Marinier,“Monte Carlo simulation-based design study of a LSO-LuAP small an-imal pet system,” IEEE Transactions on Nuclear Science, vol. 50, no. 5,pp. 1433–1438, 2003.
[73] D. Lazaro, I. Buvat, G. Loudos, D. Strul, G. Santin, N. Giokaris,D. Donnarieix, L. Maigne, V. Spanoudaki, S. Styliaris, S. Staelens, andV. Breton, “Monte Carlo simulation of a CsI(Tl) gamma camera dedi-cated to small animal imaging using GATE,” Physics in Medicine andBiology, vol. 49, no. 2, pp. 271–286, 2004.
[74] R. Leahy and X. Yan, Incorporation of Anatomical MR data for Im-proved Functional Imaging with PET. Colchester, A.C.F. and Hawkes,D.J.Springer, New York, 1991, pp. 121–131.
[75] M. Ljungberg and S. Strand, “A Monte Carlo program for the simu-lation of scintillation camera characteristics,” Computer Methods andPrograms in Biomedicine, vol. 29, pp. 257–272, 1989.
[76] M. Ljungberg, S. Strand, and M. King, Monte Carlo simulations innuclear medicine: applications in Diagnostic imaging. Institute ofPhysics, 1998.
[77] F. Maes, A. Collignin, D. Vandermeulen, G. Marchal, and P. Suetens,“Multimodality image registration by maximization of mutual informa-tion,” IEEE Transactions on Medical Imaging, vol. 16, pp. 187–198,1997.
BIBLIOGRAPHY 235
[78] D. McCracken, “The Monte Carlo method,” Scientific American, vol.192, pp. 90–96, 1955.
[79] C. Metz, F. Atkins, and R. Beck, “The geometric transfer function com-ponent for scintillation camera collimators with straight parallel holes,”Physics in Medicine and Biology, vol. 25, no. 6, pp. 1059–1070, 1980.
[80] W. Moses, “Time of flight in PET revisited,” IEEE Transactions on Nu-clear Science, vol. 50, no. 5, pp. 1325–1330, 2003.
[81] W. Moses and S. Derenzo, “Design studies for a PET detector moduleusing a PIN photodiode to measure depth of interaction,” IEEE Trans-actions on Nuclear Science, vol. 41, pp. 1441–1445, 1994.
[82] G. Muehllehner and J. Karp, “Positron emission tomography-technicalconsiderations,” Seminars on Nuclear Medicine, vol. 14, pp. 35–50,1986.
[83] NEMA standars publication NU 2-2001 : Performance measurementsof positron emission tomographs, National electric manufacturers asso-ciation, Rosslyn, VA, 2001.
[84] D. Pareto, A. Cot, J. Pavia, C. Falcon, I. Juvells, F. Lomena, and D. Ros,“Iterative reconstruction with correction of the spatially variant fan-beam collimator response in neurotransmission SPET imaging,” Eu-ropean Journal of Nuclear Medicine, vol. 30, no. 10, pp. 1322–1329,2003.
[85] M. Paulus, S. Gleason, S. Kennel, P. Hunsicker, and D. Johnson, “Highresolution X-ray computed tomography: An emerging tool for smallanimal cancer research,” Neoplasia, vol. 2, no. 1-2, pp. 62–70, 2000.
[86] D. Raeside, “Monte Carlo principles and applications,” Physics inMedicine and Biology, vol. 21, pp. 181–197, 1976.
[87] F. Rannou, V. Kohli, D. Prout, and A. Chatziioannou, “Investigationof OPET performance using GATE, a Geant4-based simulation soft-ware,” in Proceedings of the IEEE Medical Imaging Conference, Nor-folk, USA, 2002, pp. M6–8.
[88] A. Reader, “Image reconstruction and correction techniques for positronvolume imaging with rotating planar detectors,” Ph.D. dissertation, Uni-versity of London, 1999.
236 BIBLIOGRAPHY
[89] B. Reniers, F. Verhaegen, and S. Vynckier, “The radial dose function oflow-energy brachytherapy seeds in different solid phantoms: compari-son between calculations with the EGSnrc and MCNP4C Monte Carlocodes and measurements,” Physics in Medicine and Biology, vol. 49,no. 8, pp. 1569–1582, 2004.
[90] M. Rey, “Rapport de TP 4ieme,” Lausanne University, Tech. Rep., 2002.
[91] M. Rey, L. Simon, D. Strul, J. Vieira, and C. Morel, “Design study ofthe ClearPET LSO/LuYAP phoswich detector head using GATE,” inProceedings of the HiRes Conference, vol. 5, Academy of MolecularImaging, Madrid, 2003, p. 119.
[92] G. Santin, D. Strul, D. Lazaro, L. Simon, M. Krieguer, M. Vieira Mar-tins, V. Breton, and C. Morel, “GATE, a Geant4-based simulation plat-form for PET and SPECT integrating movement and time management,”IEEE Transactions on Nuclear Science, vol. 50, pp. 1516–1521, 2003.
[93] C. Schmidtlein, S. Nehmeh, L. Bidaut, Y. Erdi, J. Humm, H. Amols,and A. Kirov, “Validation of GATE Monte Carlo simulations for the GEAdvance PET scanner,” Journal of Nuclear Medicine, vol. 45, no. 5, p.1283, 2004.
[94] Y. Shao, S. Cherry, S. Siegel, and W. Silverman, “A study of inter-crystal scatter in small scintillator arrays designed for high resolutionPET imaging,” IEEE Transactions on Nuclear Science, vol. 43, pp.1938–1944, 1996.
[95] L. A. Shepp and Y. Vardi, “Maximum likelihood reconstruction foremission tomography,” IEEE Transactions on Medical Imaging, vol. 1,no. 2, pp. 113–122, October 1982.
[96] L. A. Shepp, Y. Vardi, J. B. Ra, S. K. Hilal, and Z. H. Cho, “Maximumlikelihood PET with real data,” IEEE Transactions on Nuclear Science,vol. 31, pp. 910–912, April 1984.
[97] L. Simon, D. Strul, G. Santin, M. Krieguer, and C. Morel, “Simulationof time curves in small animal PET using GATE,” Nuclear Instrumentsand Methods A, vol. 527, pp. 190–194, 2004.
[98] T. Song, Y. Choi, Y. Chung, J. Jung, Y. Choe, K. Lee, S. Kim, andB. Kim, “Optimization of pinhole collimator for small animal SPECTusing Monte Carlo simulation,” IEEE Transactions on Nuclear Science,vol. 50, no. 3, pp. 327–332, 2003.
BIBLIOGRAPHY 237
[99] J. Sorenson and M. Phelps, Physics in Nuclear Medicine. W.B. Saun-ders Company, 1987.
[100] S. Staelens, Y. D’Asseler, S. Vandenberghe, M. Koole, I. Lemahieu,and R. Van de Walle, “A 3D model incorporating spatial detection un-certainty in continuous detector PET: Monte Carlo evaluation of a the-oretical study,” in Proceedings of the Fully 3D Conference, Saint Malo,France, 2003, pp. We AM1–3.
[101] S. Staelens, Y. D‘Asseler, S. Vandenberghe, M. Koole, I. Lemahieu, andR. Van de Walle, “A theoretical lor model incorporating spatial uncer-tainty in continuous detector pet,” in Proceedings of the SPIE MedicalImaging conference, vol. 5030, San Diego, USA, 2003, pp. 667–676.
[102] S. Staelens, Y. D’Asseler, S. Vandenberghe, M. Koole, I. Lemahieu,and R. Van de Walle, “A simulation study comparing the imaging per-formance of a solid state detector with a rotating slat collimator versusa traditional scintillation camera,” in Proceedings of the SPIE MedicalImaging conference, vol. 5372-36, San Diego, USA, 2004, pp. 301–310.
[103] S. Staelens, Y. D’Asseler, S. Vandenberghe, M. Koole, I. Lemahieu, andR. Van de Walle, “A threedimensional theoretical model incorporatingspatial detection uncertainty in continuous detector PET,” Physics inMedicine and Biology, vol. 49, no. 11, pp. 2337–2351, 2004.
[104] S. Staelens, M. Koole, S. Vandenberghe, Y. D’Asseler, I. Lemahieu, andR. Van de Walle, “The geometric transfer function for a slat collimatormounted on a strip detector,” november 2004, in press and to appear inIEEE Transactions on Nuclear Science.
[105] S. Staelens, G. Santin, D. Strul, M. Koole, S. Vandenberghe,Y. D‘Asseler, V. Breton, C. Morel, I. Lemahieu, and R. Van de Walle,“Monte Carlo simulations of Interfile based emission and attenuationmaps for clinical applications,” Journal of Nuclear Medicine, vol. 44,no. 5, p. 1048, 2003.
[106] S. Staelens, G. Santin, S. Vandenberghe, D. Strul, M. Koole,Y. D’Asseler, I. Lemahieu, and R. Van de Walle, “Transmission imagingwith a moving point source: influence of crystal thickness and collima-tor type,” november 2004, in press and to appear in IEEE Transactionson Nuclear Science.
238 BIBLIOGRAPHY
[107] S. Staelens, D. Strul, S. Vandenberghe, G. Santin, M. Koole,Y. D’Asseler, I. Lemahieu, and R. Van de Walle, “Monte Carlo sim-ulations of a scintillation camera using GATE: validation and applica-tion modeling,” Physics in Medicine and Biology, vol. 48, no. 18, pp.3021–3042, 2003.
[108] S. Staelens, S. Vandenberghe, S. Glick, Y. D’Asseler, I. Lemahieu, andR. Van de Walle, “Simulation of patient and crystal scatter in 3D PET forvarious crystals,” October 2004, accepted for the IEEE Medical ImagingConference, Roma, Italy.
[109] S. Staelens, S. Vandenberghe, M. Koole, D. Strul, G. Santin,H. Van Steendam, Y. D‘Asseler, R. Dierckx, I. Lemahieu, and R. Van deWalle, “Monte Carlo simulations of transmission measurements witha medium energy moving point source,” European Journal of NuclearMedicine, vol. 30, p. 223, 8 2003.
[110] D. Strul, “Specification of a Geant4-based nuclear medicine simulationframework,” UNIL, Lausanne, Switzerland, Tech. Rep., 2001, clear-PET.
[111] D. Strul, G. Santin, D. Lazaro, V. Breton, and C. Morel, “GATE (Geant4Application for Tomographic Emission): a PET/SPECT general-purpose simulation platform,” Nuclear Physics B, vol. 125C, pp. 75–79,2003.
[112] S. Surti, J. Karp, G. Muehllehner, and P. Raby, “Investigation of lan-thanum scintillators for 3-D PET,” IEEE Transactions on Nuclear Sci-ence, vol. 50, no. 3, pp. 348–354, 2003.
[113] J. Svedberg, “On the intrinsic resolution of a gamma camera system,”Physics in Medicine and Biology, vol. 17, pp. 514–524, 1972.
[114] J. Svedberg, “Computed intrinsic efficiencies and modulation trans-fer functions for gamma cameras,” Physics in Medicine and Biology,vol. 18, pp. 658–664, 1973.
[115] R. Swensson, “Unified measurement of observer performance in detect-ing and localizing target objects on images,” Medical Physics, vol. 23,pp. 1709–1725, 1996.
[116] A. Syme, C. Kirkby, T. Riauka, B. Fallone, and S. McQuarrie, “MonteCarlo investigation of single cell beta dosimetry for intraperitoneal ra-

BIBLIOGRAPHY 239
dionuclide therapy,” Physics in Medicine and Biology, vol. 49, no. 10,pp. 1959–1972, 2004.
[117] P. Tan, D. Bailey, S. Meikle, S. Eberl, R. Fulton, and B. Hutton, “Ascanning line source for simultaneous emission and transmission mea-surements in SPECT,” Journal of Nuclear Medicine, vol. 34, pp. 1752–1760, 1993.
[118] C. Thompson, “The effect of collimation on singles rates in multi-slicePET,” IEEE Transactions on Nuclear Science, vol. 35, pp. 598–602,1988.
[119] C. Thomson, J. Cantu, and Y. Picard, “PETSIM: Monte Carlo programsimulation of all sensitivity and resolution parameters of cylindricalpositron imaging systems,” Physics in Medicine and Biology, vol. 37,pp. 731–749, 1992.
[120] D. Townsend and T. Beyer, “A combined PET/CT scanner: the path totrue image fusion,” British Journal of Nuclear Medicine, vol. SpecialIssue, pp. S24–S30, 2002.
[121] B. Tsui and G. Gullberg, “The geometric transfer function for cone andfan beam collimators,” Physics in Medicine and Biology, vol. 35, pp.81–93, 1990.
[122] T. Turkington and C. Laymon, “Imaging properties of a half-inchSodium Iodide gamma camera,” IEEE Transactions on Nuclear Science,vol. 44, pp. 1262–1265, 1997.
[123] F. van der Have and F. Beekman, “Photon penetration and scatterin micro-pinhole imaging: a Monte Carlo investigation,” Physics inMedicine and Biology, vol. 49, no. 8, pp. 1369–1386, 2004.
[124] S. Vandenberghe, “Iteratieve lijstmode reconstructie voor coınciden-tiebeeldvorming,” Ph.D. dissertation, Ghent university, 2002.
[125] S. Vandenberghe, C. Byrne, E. Soares, I. Lemahieu, and S. Glick, “Re-construction of 2D PET data with Monte Carlo generated natural pix-els,” in Proceedings of the IEEE ISBI (Biomedical imaging) Conference,Arlington, USA, 2004, pp. 356–359.
[126] S. Vandenberghe, C. Byrne, E. Soares, I. Lemahieu, and S. Glick, “Re-construction of 2D PET data with monte carlo generated natural pixels,”June 2004, submitted to the IEEE Transactions on Medical Imaging.
240 BIBLIOGRAPHY
[127] S. Vandenberghe, Y. D’Asseler, J. Kolthammer, R. Van de Walle,I. Lemahieu, and R. Dierckx, “Influence of the angle of incidence onthe sensitivity of gamma gamera based PET,” Physics in Medicine andBiology, vol. 47, pp. 289–303, 2002.
[128] S. Vandenberghe, Y. D’Asseler, M. Koole, L. Bouwens, R. V. Walle,R. A. Dierckx, and I. Lemahieu, “Iterative list mode reconstruction forcoincidence data of gamma camera,” in Proceedings of the SPIE Medi-cal Imaging, vol. 3977, San Diego, USA, 2000, pp. 1538–1546.
[129] S. Vandenberghe, S. Staelens, M. Koole, R. Van de Walle, andI. Lemahieu, “Sensitivity of SPECT with rotating slat collimators,” inProceedings of the IEEE Medical Imaging Conference, Portland, USA,2003, pp. M11–269.
[130] S. Vandenberghe, S. Staelens, M. Koole, R. Van de Walle, andI. Lemahieu, “Sensitivity of SPECT with rotating slat collimators,”november 2003, accepted for publication in IEEE Transactions on Nu-clear Science.
[131] S. Vandenberghe, S. Staelens, E. Soares, C. Byrne, and S. Glick, “Nat-ural pixel reconstruction of 3D PET data,” May 2004, submitted to theMedical Imaging Conference, Roma, Italy.
[132] Y. Vardi, L. A. Shepp, and L. Kaufman, “A statistical model for positronemission tomography,” Journal of the American Statistical Association,vol. 80, no. 389, pp. 8–20, March 1985.
[133] J. von Neumann, “Various techniques in connection with random digits-Monte Carlo methods,” National Bureau Standards, Tech. Rep. AMS12, 1951.
[134] J. Wallis and T. Miller, “An optimal rotator for iterative reconstruction,”IEEE Transactions on Medical Imaging, vol. 16, no. 1, pp. 118–123,1997.
[135] W. Wang, W. Hawkins, and D. Gagnon, “3D RBI-EM reconstructionwith spherically-symmetric basis function for SPECT rotating slat col-limator,” Physics in Medicine and Biology, vol. 49, no. 11, pp. 2273–2292, 2004.
[136] Z. Wang, T. Li, G. Han, and Z. Liang, “Pc graphics card-based accelaer-ation for OSEM image reconstruction of quantitative SPECT with vary-
BIBLIOGRAPHY 241
ing focal-length fan-beam collimators,” Journal of Nuclear Medicine,vol. 45, no. 5, p. 1295, 2004.
[137] S. Webb, D. Binnie, M. Flower, and R. Ott, “Monte Carlo modeling ofthe performace of a rotating slit collimator for improved planar gammacamera imaging,” Physics in Medicine and Biology, vol. 37, pp. 1095–1108, 1992.
[138] F. Xu and K. Mueller, “Towards a unified framework for rapid computedtomography on commodity GPUs,” in Proceedings of the IEEE MedicalImaging Conference, Portland, USA, 2003, pp. M10–331.
[139] F. Xu and K. Mueller, “Ultra-fast 3d filtered backprojection on com-modity graphics hardware,” in Proceedings of the IEEE ISBI (Biomedi-cal imaging) Conference, Arlington, USA, 2004, pp. 571–574.
[140] J. Yanch, A. Dobrzeniecki, C. Ramanathan, and R. Behrman, “Physi-cally realistic Monte Carlo simulation of source, collimator and tomo-graphic data acquisition for emission computed tomography,” Physicsin Medicine and Biology, vol. 37, pp. 853–870, 1992.
[141] H. Zaidi, “Relevance of accurate Monte Carlo modeling in nuclear med-ical imaging,” Medical Physics, vol. 26, pp. 574–608, 1999.
[142] H. Zaidi, “Addendum to Relevance of accurate Monte Carlo modelingin nuclear medical imaging [Med. Phys. 26, 574-608 (1999)],” MedicalPhysics, vol. 27, pp. 816–817, 2000.
[143] H. Zaidi, A. Hermann Scheurer, and C. Morel, “An Object-OrientedMonte-Carlo simulator for 3D cylindrical positron tomographs,” Com-puter Methods and Programs in Biomedicine, vol. 58, pp. 133–145,1999.
[144] H. Zaidi and K. Koral, “Scatter modeling and compensation in emissiontomography,” European Journal of Nuclear Medicine, vol. 31, no. 5, pp.761–782, 2004.
[145] G. Zeng and D. Gagnon, “CdZnTe strip detector SPECT imaging witha slit collimator,” Physics in Medicine and Biology, vol. 49, no. 11, pp.2257–2271, 2004.
[146] G. Zeng and D. Gagnon, “Image reconstruction algorithm for a SPECTsystem with a convergent rotating slat collimator,” IEEE Transactionson Nuclear Science, vol. 51, no. 1, pp. 142–148, 2004.

242 BIBLIOGRAPHY
[147] G. Zeng, D. Gagnon, C. Matthews, J. Kolthammer, J. Radachy, andW. Hawkins, “Image reconstruction algorithm for a rotating slat colli-mator,” Medical Physics, vol. 29, no. 7, pp. 1406–1412, 2002.
[148] G. Zeng, G. Gullberg, P. Christian, D. Gagnon, and C.-H. Tung, “Asym-metric cone-beam transmission tomography,” IEEE Transactions onNuclear Science, vol. 48, pp. 117 – 124, 2001.

Publications author: JournalPapers
[1] K. Assie, V. Breton, I. Buvat, C. Comtat, S. Jan, M. Krieguer, D. Lazaro,C. Morel, M. Rey, G. Santin, L. Simon, S. Staelens, D. Strul, J. Vieira, andR. Van de Walle. Monte Carlo simulation in PET and SPET instrumenta-tion using GATE. Nuclear Instruments and Methods A, 527/1-2:180–189,2004.
[2] Y. D’Asseler, C. Groiselle, H. Gifford, S. Vandenberghe, S. Staelens,R. Van de Walle, I. Lemahieu, and S. Glick. Evaluating human observerperformance for list mode PET using the bootstrap method. submitted forIEEE Transactions on Nuclear Science, august 2004.
[3] S. Jan, G. Santin, D. Strul, S. Staelens, K. Assie, D. Autret, D. Avner,R. Barbier, M. Bardies, P. Bloomfield, D. Brasse, V. Breton, P. Bruyndon-ckx, I. Buvat, A. Chatziioannou, Y. Choi, Y. Chung, C. Comtat, D. Don-narieix, L. Ferrer, S. Glick, C. Groiselle, S. Kerhoas-Cavata, A. Kirov,V. Kohli, M. Koole, M. Krieguer, J. van der Laan, F. Lamare, G. Larg-eron, C. Lartizien, D. Lazaro, M. Maas, L. Maigne, F. Mayet, F. Melot,S. Nehmeh, E. Pennacchio, J. Perez, U. Pietrzyk, F. Rannou, M. Rey,D. Schaart, R. Schmidtlein, L. Simon, T. Song, J. Vieira, D. Visvikis,R. Van de Walle, E. Wieers, and C. Morel. GATE: a simulation toolkit forPET and SPECT. Physics in Medicine and Biology, 49(19):4543–4561,2004.
[4] D. Lazaro, I. Buvat, G. Loudos, D. Strul, G. Santin, N. Giokaris, D. Don-narieix, L. Maigne, V. Spanoudaki, S. Styliaris, S. Staelens, and V. Breton.Monte Carlo simulation of a CsI(Tl) gamma camera dedicated to small an-imal imaging using GATE. Physics in Medicine and Biology, 49(2):271–286, 2004.
244 PUBLICATIONS AUTHOR: JOURNAL PAPERS
[5] S. Staelens, Y. D’Asseler, S. Vandenberghe, M. Koole, I. Lemahieu, andR. Van de Walle. A threedimensional theoretical model incorporating spa-tial detection uncertainty in continuous detector PET. Physics in Medicineand Biology, 49(11):2337–2351, 2004.
[6] S. Staelens, M. Koole, S. Vandenberghe, Y. D’Asseler, I. Lemahieu, andR. Van de Walle. The geometric transfer function for a slat collimatormounted on a strip detector. in press and to appear in IEEE Transactionson Nuclear Science, september 2004.
[7] S. Staelens, G. Santin, S. Vandenberghe, D. Strul, M. Koole, Y. D’Asseler,I. Lemahieu, and R. Van de Walle. Transmission imaging with a movingpoint source: influence of crystal thickness and collimator type. in pressand to appear in IEEE Transactions on Nuclear Science, september 2004.
[8] S. Staelens, D. Strul, S. Vandenberghe, G. Santin, M. Koole, Y. D’Asseler,I. Lemahieu, and R. Van de Walle. Monte Carlo simulations of a scintilla-tion camera using GATE: validation and application modeling. Physics inMedicine and Biology, 48(18):3021–3042, 2003.
[9] S. Vandenberghe, S. Staelens, M. Koole, R. Van de Walle, andI. Lemahieu. Sensitivity of SPECT with rotating slat collimators. acceptedfor IEEE Transactions on Nuclear Science, november 2003.
Publications author:Conference Proceedings
[1] Y. D’Asseler, S. Staelens, S. Vandenberghe, S. Glick, and I. Lemahieu.Patient-specific optimization of iterative reconstruction for a search-detection task using the bootstrap method. accepted for the EANM Con-ference, Helsinki, Finland, August 2004.
[2] J. De Beenhouwer, S. Staelens, Y. D’Asseler, I. Lemahieu, and R. Vande Walle. Variance reduction techniques for Monte Carlo simulationsin nuclear medicine. In Book of abstracts of the 4th Phd Symposium ofGhent University, page 96, Gent, Belgium, 2003.
[3] J. De Beenhouwer, S. Staelens, Y. D’Asseler, S. Vandenberghe,I. Lemahieu, and R. Van de Walle. Geometrical importance samplingand pulse height tallies in GATE. accepted for the EMBS Conference,San Fransisco, USA, April 2004.
[4] P. De Bondt, S. Vandenberghe, O. De Winter, J. De Sutter, S. Staelens,P. Segers, C. Vandewiele, P. Verdonck, and R. Dierckx. Development andvalidation of a dynamic ventricle phantom for planar and tomographic ra-dionuclide ventriculography studies. Eur. J. Nucl. Med., 29:367, August2002.
[5] M. Koole, Y. D’Asseler, S. Staelens, S. Vandenberghe, K. Van Laere,I. Lemahieu, and R. Van de Walle. Influence of rebinning on the re-constructed resolution of fanbeam SPECT. In Proceedings of the WorldConference on Nuclear Medicine, volume 1, page 160, Santiago de Chile,Chile, 2002.
[6] M. Koole, S. Staelens, Y. D‘Asseler, S. Vandenberghe, K. Van Laere,I. Lemahieu, and R. Van de Walle. Influence of rebinning on the recon-structed resolution of fan-beam SPECT. In C. Veraart and P. Verdonck,
246 PUBLICATIONS AUTHOR: CONFERENCE PROCEEDINGS
editors, Book of abstracts of the 2nd National Day on Biomedical Engi-neering, page 33, Brussel, 10 2002.
[7] M. Koole, S. Staelens, I. Lemahieu, R. Van de Walle, and R. Dierckx.Iterative reconstruction of grey matter activity in perfusion brain spetimaging. Eur. J. Nucl. Med., 30:208, 8 2003.
[8] M. Koole, S. Staelens, R. Van de Walle, and I. Lemahieu. Correctionfor partial volume effects in brain perfusion ect imaging. In Proceedingsof the SPIE Medical Imaging Conference, volume 5032, pages 986–994,San Diego, 2003.
[9] M. Koole, S. Staelens, K. Van Laere, I. Lemahieu, and R. Van de Walle.Modelling the senstivity of fan beam collimation in SPECT imaging. InC. Veraart and P. Verdonck, editors, Book of abstracts of the 1st NationalDay on Biomedical Engineering, volume 4, page 10, Brussel, 2001.
[10] M. Koole, S. Staelens, S. Vandenberghe, Y. D’Asseler, R. Van de Walle,and I. Lemahieu. Analytical model for Solstice detector response. InProceedings of the IEEE Medical Imaging Conference, pages M14–270,Portland, USA, 2003.
[11] D. Lazaro, I. Buvat, D. Donnarieix, G. Loudos, D. Strul, G. Santin,N. Giokaris, L. Maigne, V. Spanoudaki, S. Styliaris, S. Staelens, andV. Breton. Monte Carlo simulation of a CsI(Tl) gamma camera dedi-cated to small animal imaging using GATE. J. Nucl. Med., 44(5):1032, 12003.
[12] S. Staelens. Quantitative reconstruction of brain SPECT images. In Bookof abstracts of the 2nd Phd Symposium of Ghent University, page 59,Gent, Belgium, 2001.
[13] S. Staelens. Spatial uncertainty in continuous detector PET : a theoreti-cal approach. In Book of abstracts of the 3rd Phd Symposium of GhentUniversity, page 87, Gent, Belgium, 2002.
[14] S. Staelens, Y. D‘Asseler, S. Vandenberghe, M. Koole, I. Lemahieu, andR. Van de Walle. Characteristics of a theoretical LOR model for PETrepresenting spatial uncertainty in detection. In C. Veraart and P. Ver-donck, editors, Book of abstracts of the 2nd National Day on BiomedicalEngineering, page 37, Brussel, 10 2002.
PUBLICATIONS AUTHOR: CONFERENCE PROCEEDINGS 247
[15] S. Staelens, Y. D’Asseler, S. Vandenberghe, M. Koole, I. Lemahieu, andR. Van de Walle. A 3D model incorporating spatial detection uncer-tainty in continuous detector PET: Monte Carlo evaluation of a theoreti-cal study. In Proceedings of the Fully 3D Conference, pages We AM1–3,Saint Malo, France, 2003.
[16] S. Staelens, Y. D‘Asseler, S. Vandenberghe, M. Koole, I. Lemahieu, andR. Van de Walle. A theoretical lor model incorporating spatial uncertaintyin continuous detector pet. In Proceedings of the SPIE Medical Imagingconference, volume 5030, pages 667–676, San Diego, 2003.
[17] S. Staelens, Y. D’Asseler, S. Vandenberghe, M. Koole, I. Lemahieu, andR. Van de Walle. A simulation study comparing the imaging performanceof a solid state detector with a rotating slat collimator versus a traditionalscintillation camera. In Proceedings of the SPIE Medical Imaging con-ference, volume 5372-36, pages 301–310, San Diego, 2004.
[18] S. Staelens, J. de Beenhouwer, M. Koole, Y. D’Asseler, S. Vandenberghe,I. Lemahieu, and R. Van de Walle. Monte Carlo simulations for SPECT:object-oriented flexibility benchmark. In C. Veraart and P. Verdonck,editors, Book of abstracts of the 3rd National Day on Biomedical Engi-neering, Brussel, 10 2003.
[19] S. Staelens, I. Lemahieu, and R. Van de Walle. GATE, a Geant4 basedsimulation platform for nuclear medicine : development, validation andapplication modeling. In Book of abstracts of the 4th Phd Symposium ofGhent University, page 99, Gent, Belgium, 2003.
[20] S. Staelens, G. Santin, D. Strul, M. Koole, S. Vandenberghe,Y. D‘Asseler, V. Breton, C. Morel, I. Lemahieu, and R. Van de Walle.Monte carlo simulations of interfile based emission and attenuation mapsfor clinical applications. J. Nucl. Med., 44(5):1048, 5 2003.
[21] S. Staelens, S. Vandenberghe, S. Glick, Y. D’Asseler, I. Lemahieu, andR. Van de Walle. Patient and crystal scatter analysis in 3D PET. J. Nucl.Med., 45(5):123, 2004.
[22] S. Staelens, S. Vandenberghe, S. Glick, Y. D’Asseler, I. Lemahieu, andR. Van de Walle. Simulation of patient and crystal scatter in 3D PETfor various crystals. accepted for the IEEE Medical Imaging Conference,Roma, Italy, October 2004.
[23] S. Staelens, S. Vandenberghe, M. Koole, Y. D‘Asseler, P. Debondt,I. Van den Eede, I. Lemahieu, and R. Van de Walle. Comparison of FBP
248 PUBLICATIONS AUTHOR: CONFERENCE PROCEEDINGS
and OSEM for volume determination in SPECT imaging. In Proceed-ings of the 2nd joint EMBS/BMES conference, pages 973–974, Houston,2002.
[24] S. Staelens, S. Vandenberghe, M. Koole, D. Strul, G. Santin,H. Van Steendam, Y. D‘Asseler, R. Dierckx, I. Lemahieu, and R. Van deWalle. Monte carlo simulations of transmission measurements with amedium energy moving point source. Eur. J. Nucl. Med., 30:223, 8 2003.
[25] S. Staelens, S. Vandenberghe, M. Koole, H. Van Steendam, Y. D’Asseler,I. Lemahieu, and R. Van de Walle. Transmission imaging with a mov-ing point source: influence of crystal thickness and collimator type. InProceedings of the IEEE Medical Imaging Conference, pages M10–274,Portland, USA, 2003.
[26] S. Vandenberghe, S. Staelens, S. Glick, and I. Lemahieu. Methods forgenerating system matrices for natural pixel reconstruction. J. Nucl.Med., 45(5):291, 2004.
[27] S. Vandenberghe, S. Staelens, M. Koole, R. Van de Walle, andI. Lemahieu. Sensitivity of SPECT with rotating slat collimators. InProceedings of the IEEE Medical Imaging Conference, pages M11–269,Portland, USA, 2003.
[28] S. Vandenberghe, S. Staelens, E. Soares, C. Byrne, and S. Glick. Nat-ural pixel reconstruction of 3d pet data. submitted to the IEEE MedicalImaging Conference, Roma, Italy, May 2004.
[29] J. Verhaeghe, Y. D’Asseler, S. Vandenberghe, S. Staelens, andI. Lemahieu. Ml reconstruction from dynamic list-mode PET data usingtemporal splines. accepted for the IEEE Medical Imaging Conference,Roma, Italy, October 2004.

-

250 PUBLICATIONS AUTHOR: CONFERENCE PROCEEDINGS