
Modelling of Rotary Kilns - Universiteit Twente within a rotary kiln. In the active layer, particles...
123
i MODELLING OF ROTARY KILNS PROEFSCHRIFT ter verkrijging van de graad van doctor aan de Universiteit Twente, op gezag van de rector magnificus, Prof.dr. F.A. van Vught, volgens besluit van het College voor Promosies in het openbaar te verdedigen op vrijdag 26 januari 2001 te 16:45 uur door Michael David Heydenrych geboren op 13 juni 1959 te Pietersburg, Zuid-Afrika
Transcript of Modelling of Rotary Kilns - Universiteit Twente within a rotary kiln. In the active layer, particles...

i
MODELLING OF ROTARY KILNS
PROEFSCHRIFT
ter verkrijging van
de graad van doctor aan de Universiteit Twente,
op gezag van de rector magnificus,
Prof.dr. F.A. van Vught,
volgens besluit van het College voor Promosies
in het openbaar te verdedigen
op vrijdag 26 januari 2001 te 16:45 uur
door
Michael David Heydenrych
geboren op 13 juni 1959
te Pietersburg, Zuid-Afrika

ii
Dit proefschrift is goedgekeurd door de promoteren
Prof.dr.ir. G.F. Versteeg
en
Prof.dr.ir. J.A.M. Kuipers
en de assistent-promotor
Dr.ir. A.B.M. Heesink

iii
to my father

iv
Samestelling promotiecommissie:
prof.dr. W.E van der Linden, voorsitter Universiteit Twente
prof.dr.ir. J.A.M. Kuipers, promotor Universiteit Twente
prof.dr.ir. G.F. Versteeg, promotor Universiteit Twente
dr.ir. A.B.M. Heesink, ass. promotor Universiteit Twente
prof.dr.ir. C.J. Asselbergs Universiteit Twente
prof.dr.ir. L. Lefferts Universiteit Twente
prof.dr.ir. P.L. de Vaal Universiteit Pretoria
prof.dr.ir. G. Brem Universiteit Twente
Cover: Effectiveness factor vs k/ω for the passive layer model overlaid by a rotary kiln
cross-section showing evaporative mass transfer in the active layer.
Copyright © 2001 M.D. Heydenrych, Centurion, South Africa
No part of this book may be reproduced in any form by any means, nor
transmitted, nor translated into a machine language without written
permission from the author.
Heydenrych, M.D.
Modelling of Rotary Kilns
Thesis University of Twente, The Netherlands
ISBN 90-36515440
Printing and binding: grafisch centrum twente, Enschede, The Netherlands

v
SUMMARY
This work primarily covers mass transfer in rotary kilns. The most
important contribution is the identification of the dimensionless numbers
that contribute to mass transfer in rotary kilns, and their relation to each
other. In this respect, this work is also applicable to heat transfer in rotary
kilns, where analogous dimensionless numbers can be identified. Another
important contribution is the recognition of the important contribution of
the passive layer in mass transfer.
Fig. 1 shows the nomenclature used in this summary, and the various zones
found within a rotary kiln. In the active layer, particles slide over each
other in granular flow. They are returned to the top part of the bed in the
passive layer, where particles move as a solid mass concentrically around
the axis of the kiln.
Figure 1. Radial cross section of a kiln, showing the nomenclature.
The first part of the work considers the reaction of the gas as it moves in
plug flow through the passive layer within the interparticle voids; the active

vi
layer is considered to be infinitely thin. The effectiveness factor η for the
bed is found to be dependent on the bed fill (represented by h/R) and the
ratio of the rate constant to the rotation speed (k/ω), shown in Fig. 2.
Comparison against experimental data shows that this relationship is only
applicable to slower reactions (k/ω < 1).
Figure 2. Effectiveness factor increases with decreasing bed fill.
The effect of diffusion within the passive layer was investigated based on a
two-dimensional continuity equation for the radial cross section, again with
the assumption of an infinitely thin active layer. This requires the use of an
additional dimensionless constant: either a Peclet number (εωR2/De) or a
Thiele modulus ( eDkR / ). It was shown that for practical values of
Peclet number, diffusion within the passive layer can be neglected, but at
higher values of k/ω, active layer modelling is necessary to correctly
predict mass transfer.
By making the (justified) assumption that the velocity gradient of particles
(m) within the active layer is constant at any point, the active layer depth
can be estimated at any distance x along the bed surface using

vii
1/
222
−−−=
ωm
hxRd
The action of particles sliding over each other promotes movement of gas
through the interparticle voids. A correlation for an active layer dispersion
coefficient has been derived:
Dal = 0.246fm dp2 + ε2Da
where f is a directionality factor; with equal dispersion in all directions,
f = 1/6. With fast reactions mass transfer can be estimated in terms of a
mass transfer coefficient on the bed surface using:
kDk als ε=
This does not fully predict the dependence of mass transfer on rotation
speed. It is also necessary to take into account the periodic renewal of gas
in the voids between the particles within the active layer. This is done by
adapting the value of the kinetic constant using
( )mkemk /1'
−−=
where k′ is the effective rate constant applicable to the active layer region.
Using m = 70ω, and the above assumptions, a good prediction of mass
transfer could be obtained for fast reactions.
Finally, a model was developed that built on the principles established for
both the active and passive layers. This combined model assumes
continuity of concentration at the interface of the active and passive layers,
where gas is entrained into the bed through rotation (Fig. 3).

viii
Figure 3. A typical concentration profile using the combined model
(clockwise rotation).
This model predicts that it is seldom possible to use either the passive layer
model alone, or the active layer model alone to accurately predict mass
transfer, and that usually both regions in a rotary kiln contribute
significantly to mass transfer. We also find that when dispersion effects
dominate over molecular diffusion effects in the active layer (expected for
particle size > 3 mm), then scale-up effects can be represented by the ratio
of kiln radius to particle diameter (R/dp) instead of the active layer Thiele
modulus.
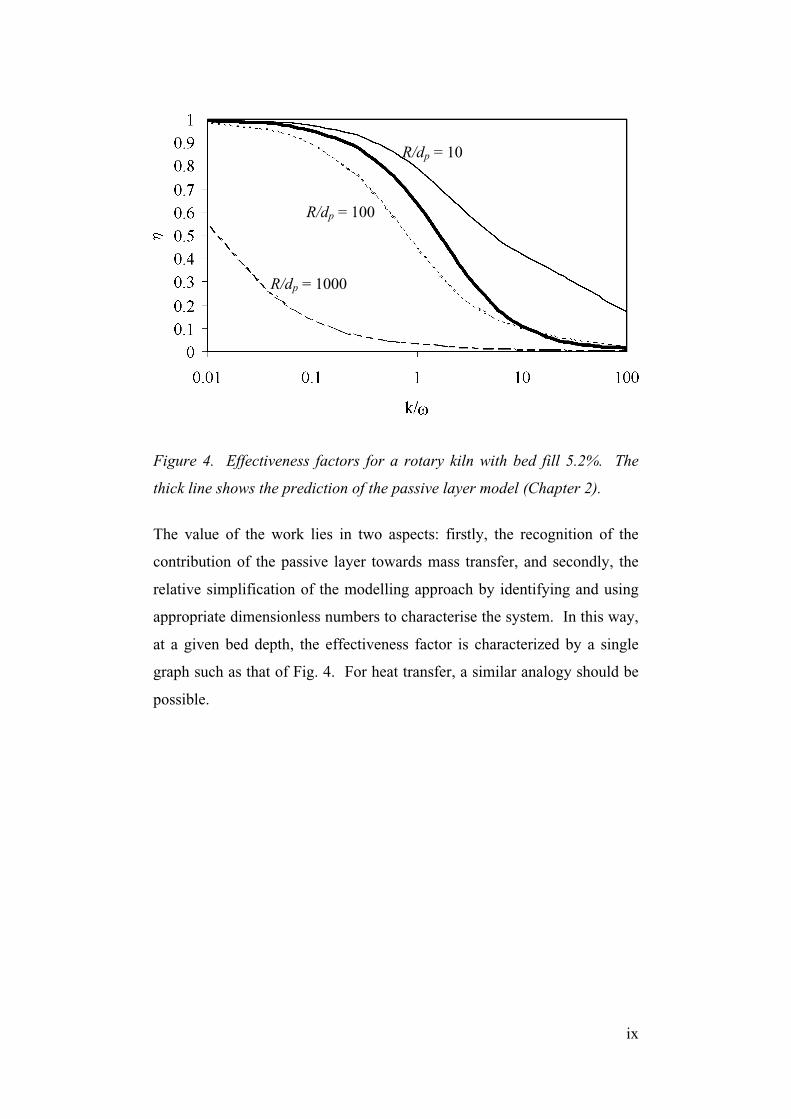
An example of the predictions of the combined model is given in Fig. 4 for
a bed fill of 5.2%. For such a shallow bed, the effectiveness factor is
strongly dependent on R/dp. It is also clear from the shape of the curves
that the passive layer model alone is inadequate at predicting the
effectiveness factor, even for low k/ω.
ix
Figure 4. Effectiveness factors for a rotary kiln with bed fill 5.2%. The
thick line shows the prediction of the passive layer model (Chapter 2).
The value of the work lies in two aspects: firstly, the recognition of the
contribution of the passive layer towards mass transfer, and secondly, the
relative simplification of the modelling approach by identifying and using
appropriate dimensionless numbers to characterise the system. In this way,
at a given bed depth, the effectiveness factor is characterized by a single
graph such as that of Fig. 4. For heat transfer, a similar analogy should be
possible.
R/dp = 100
R/dp = 10
R/dp = 1000

x
SAMENVATTING
Dit proefschrift behandelt stofoverdracht in roterende ovens. Dergelijke
gas-vast reactoren worden veelvuldig in de industrie toegepast, waarbij de
cement oven wellicht het bekendste voorbeeld vormt. De opschaling van
deze reactoren geschiedt vaak nog op basis van empirie omdat een gedegen
theoretische beschrijving van de processen nog ontbreekt. Met dit
proefschrift wordt getracht om deze leemte op te vullen. Er wordt met
name aandacht besteed aan de identificatie van dimensieloze kentallen die
het stoftransport in roterende ovens karakteriseren en hun onderlinge
afhankelijkheid. Door toepassing van deze dimensieloze kentallen zijn de
resultaten ook toepasbaar voor de beschrijving van het analoge warmte
transport in roterende ovens. Daarnaast vormt de analyse van de
afzonderlijke stoftransportmechanismen een belangrijk onderdeel van dit
proefschrift.
Figuur 1. Dwarsdoorsnee van een roterende oven
Figuur 1 laat de verschillende zones zien, zoals die in een roterende oven
worden onderscheiden. In de actieve laag bewegen de deeltjes langs en
over elkaar heen naar beneden. Door de roterende beweging van de oven

xi
worden de deeltjes die het eind van de actieve laag hebben bereikt, via een
roterende beweging door de onderliggende passieve laag weer naar het
bovenste gedeelte van de actieve laag getransporteerd. De passieve laag
roteert hierbij als een star lichaam om de as van de oven. Zowel in de
actieve als in de passieve laag kunnen de deeltjes reageren met het gas dat
vanuit het “lege” deel van de oven (het zogenaamde freeboard) continu
wordt aangevoerd.
Na een inleiding over de relevantie van roterende ovens voor de industrie,
wordt in het tweede hoofdstuk van dit proefschrift het transport en de
reactie van het gas in de passieve laag beschouwd. Het gas, opgesloten
tussen de deeltjes, beweegt daarbij als het ware in propstroom concentrisch
door de passieve laag. De actieve laag wordt daarbij oneindig dun
verondersteld. Er wordt een effectiviteitsfactor η gedefinieerd als de
verhouding tussen de werkelijke omzettingssnelheid in het bed en de
snelheid die zou worden bereikt wanneer overal in het bed de concentratie
van de gasvormige reactant gelijk zou zijn aan de concentratie in het
freeboard boven het bed. Deze blijkt sterk afhankelijk te zijn van de
vulhoogte van de oven (1-h/R) en de verhouding tussen de reactiesnelheids-
Figuur 2. Effectiviteitsfactor bij verschillende vulhoogtes.

xii
constante en de rotatiesnelheid (k/ω), zoals weergegeven in Figuur 2. Een
vergelijking met experimentele data (afkomstig uit de literatuur en eigen
data) laat zien dat de gevonden afhankelijkheid alleen toepasbaar voor
relatief langzame reacties (k/ω < 1).
In het derde hoofdstuk wordt het effect van diffusie binnen de passieve
zone bestudeerd met behulp van de continuïteitsvergelijking voor een
dwarsdoorsnee van de roterende oven. Hierbij is wederom aangenomen dat
de actieve laag oneindig dun is. Dit model resulteert in een extra
dimensieloos kental: ofwel een Peclet-kental (εωR2/De) ofwel een Thiele
modulus ( eDkR / ). In de praktijk blijkt diffusie in de passieve zone een
verwaarloosbaar kleine bijdrage aan het stoftransport te leveren. Voor hoge
waarden van k/ω (k/ω >1) blijkt ook dit aangepaste passieve-zone model
niet in staat om de experimentele resultaten te beschrijven. Geconcludeerd
wordt dan ook dat een nadere beschouwing van de processen die optreden
in de actieve laag noodzakelijk is.
In hoofdstuk 4 worden de hydrodynamica van en de
stofoverdrachtsprocessen in de actieve laag nader onder de loep genomen.
Door de (gerechtvaardigde) aanname dat de snelheidsgradiënt van de
deeltjes (m) binnen de actieve laag constant is op elke positie binnen die
laag, kan de dikte van de actieve laag worden afgeschat voor elke positie x
(zie Figuur 1) langs het grensvlak volgens:
1/
222
−−−=
ωm
hxRd
De beweging van de deeltjes over en langs elkaar heen veroorzaakt
gastransport door het steeds weer creëren en opbreken van interstitiële
ruimtes. Op basis hiervan is een overall dispersiecoëfficiënt voor de gasfase
afgeleid:

xiii
Dal = 0.246fm dp2 + ε2Da
In deze vergelijking verdisconteert f de richting van het transport. Voor
gelijke dispersie in elk van de orthogonale richtingen geldt f = 1/6. De
symbolen dp en Da staan respectievelijk voor de deeltjesdiameter en de
moleculaire diffusiecoëfficiënt van het reagerende gas, terwijl ε de
(gemiddelde) porositeit van de actieve laag voorstelt. In het geval van
snelle gas-vast reacties kan de stofoverdracht worden geïnterpreteerd in
termen van een stofoverdrachtscoëfficiënt ks, betrokken op het totale bed-
oppervlak:
kDk als ε=
Hierbij wordt echter het effect van de rotatie-snelheid op het stoftransport
niet volledig verdisconteerd. Het is noodzakelijk om ook het effect van de
periodieke verversing van gas in de holtes tussen de deeltjes te
verdisconteren. Dit kan worden gedaan door aanpassing van de
kinetiekconstante, volgens:
( )mkemk /1'
−−=
waarin k′ de effectieve reactiesnelheidsconstante voor de actieve zone
voorstelt. Voor m=70ω en bovengenoemde aannames wordt een goede
beschrijving van de in de literatuur gerapporteerde experimentele data
gevonden.
Tot slot wordt in hoofdstuk 5 een model ontwikkeld dat gebaseerd is op de
eerder genoemde beginselen voor de actieve en passieve zones. Dit
gecombineerde model gaat uit van een continu concentratie-profiel aan het
grensvlak tussen de actieve en de passieve zones. Het gecombineerde

xiv
Figuur 3. Een typisch concentratieprofiel volgens het gecombineerde
model (kloksgewijze rotatie)
model voorspelt dat slechts bij hoge uitzondering alleen het passieve zone
model of alleen het actieve zone model voldoet. Meestal zijn beide zones
belangrijk in het beschrijven van het stoftransport in een roterende oven.
Wanneer in de actieve zone moleculaire diffusie te verwaarlozen is ten
opzichte van gasfase dispersie (en dit is aannemelijk voor deeltjes groter
dan 3 mm), kunnen opschaaleffecten worden verdisconteerd via de
verhouding van ovenstraal ten opzichte van deeltjesdiameter (R/dp).
In Figuur 4 is een voorbeeld van een berekeningsresultaat van het
gecombineerde model gegeven voor een kleine vulhoogte. De effectiviteits-
Figuur 4. Effectiviteitsfactor voor een roterende oven met een vulgraad
van 5.2%. Dikke lijn geeft de voorspelling van het passieve-zone model.
R/dp = 100
R/dp = 10
R/dp = 1000

xv
factor blijkt sterk af te hangen van (R/dp). Ook blijkt duidelijk dat het
passieve-zone model alleen niet in staat is de effectiviteitsfactor goed te
beschrijven, zelfs niet voor lage waarden van k/ω.
De resultaten van dit proefschrift tonen het belang aan van zowel de actieve
als de passieve laag voor het totale stoftransport. De term “passief” is zeker
niet altijd op zijn plaats. Door enkele vereenvoudigende aannamen en het
gebruik van de juiste dimensieloze kentallen kan de stofoverdracht in
roterende ovens goed worden gekarakteriseerd. Op deze wijze kan, voor
een gegeven vulgraad van de oven, de effectiviteitsfactor als functie van de
procesparameters in een enkele grafiek worden weergegeven. Voor
warmtetransport is een analoge analyse mogelijk.

xvi
CONTENTS
1. Introduction 1
The radial vs. axial direction
The flow regimes in rotary kilns
The need for modelling of rotary kilns
An overview of this work
2. Mass transfer in rolling rotary kilns: a novel approach 11
Introduction
Modelling studies
Model development
Total depletion model
Model validation
Conclusion
3. Diffusion effects in rotating rotary kilns 37
Introduction
Mathematical model
Results
Discussion
Conclusions
4. Hydrodynamics and dispersion in the active layer of
rolling rotary kilns
53
Introduction
Hydrodynamics of the active layer
Dispersion within the active layer
Concentration profiles and mass transfer
Model validation
Discussion and conclusion

xvii
5. A combined mass transfer model for both active and
passive layers in rolling rotary kilns
77
Introduction
Combined model
Model predictions
Comparison with measured data
Conclusions
Publications
101
Acknowledgements
103
Curriculum Vitae
105

Chapter 1 - Introduction
1
Chapter 1 - Introduction
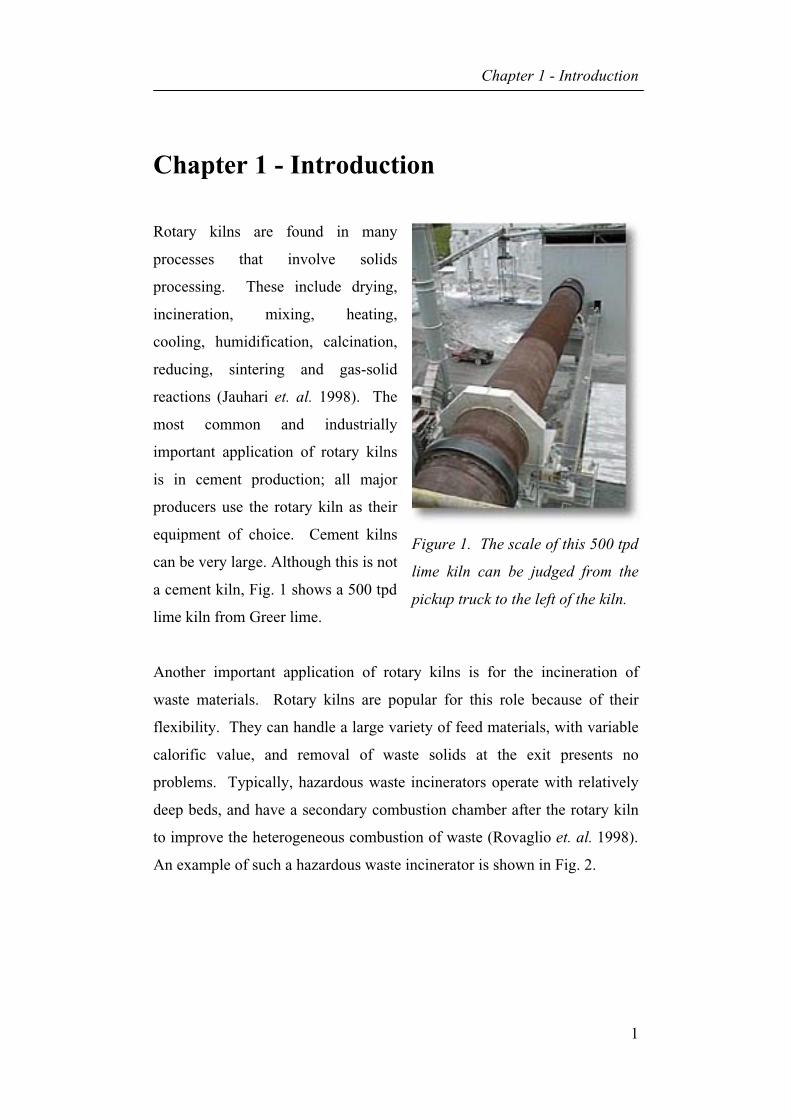
Rotary kilns are found in many
processes that involve solids
processing. These include drying,
incineration, mixing, heating,
cooling, humidification, calcination,
reducing, sintering and gas-solid
reactions (Jauhari et. al. 1998). The
most common and industrially
important application of rotary kilns
is in cement production; all major
producers use the rotary kiln as their
equipment of choice. Cement kilns
can be very large. Although this is not
a cement kiln, Fig. 1 shows a 500 tpd
lime kiln from Greer lime.
Figure 1. The scale of this 500 tpd
lime kiln can be judged from the
pickup truck to the left of the kiln.
Another important application of rotary kilns is for the incineration of
waste materials. Rotary kilns are popular for this role because of their
flexibility. They can handle a large variety of feed materials, with variable
calorific value, and removal of waste solids at the exit presents no
problems. Typically, hazardous waste incinerators operate with relatively
deep beds, and have a secondary combustion chamber after the rotary kiln
to improve the heterogeneous combustion of waste (Rovaglio et. al. 1998).
An example of such a hazardous waste incinerator is shown in Fig. 2.

Chapter 1 – Introduction
2
Figure 2. A rotary
kiln waste incinerator
with a vertical
secondary combustion
chamber.
In the mineral processing industry, there are many applications of rotary
kilns: Some of the applications that have been published are magnetite
oxidation (Davis, 1996), induration of iron ore pellets (Young et. al. 1979),
coke calcining, (Bui et. al. 1995) and drying (Friedman & Marshall, 1949).
Rotary kilns are amongst the most well-established unit operations in the
process industry, yet are amongst the least understood. They can be used
for 3 purposes: heating, reacting and drying of solid material, and in many
cases, they are used to achieve a combination of these aims. In the design
of kilns, there are four important aspects to consider from a process
engineering point of view, and these are heat transfer, flow of material
through the rotary kiln, gas-solid mass transfer and reaction.
Heat transfer rates amongst the most important of these aspects, because in
many cases, it is the heat transfer that limits the performance of the rotary
kiln. This is reflected in the number of papers published on the modelling
of heat transfer in rotary kilns. However, the first aspect of rotary kilns that
was modelled was the movement of material through a rotary kiln. The
first such modelling was done by Saeman (1951), based on data measured
by Sullivan et. al. (1927).
Chapter 1 - Introduction
3
The subject of mass transfer in rotary kilns has been neglected until Jauhari
et. al. (1998) published an article on gas-solid mass transfer in a rotating
drum. The purpose of this thesis is to model mass transfer and reaction in
rotating drums, but the novel approach adopted by the author is firmly
based on the foundations of chemical engineering science, can equally well
be applied to the modelling of heat transfer.
The radial plane vs axial direction
In the literature on rotary kilns, we typically find diagrams of a radial cross-
section through a rotary kiln, such as that shown in Fig. 3. This shows the
movement of particles within the bed of a rotary kiln: particles move
concentrically with the wall of the rotary kiln in the passive layer until they
reach the surface of the bed, where they slide downwards in the active
layer. Considering a single particle, this repeated process can cause the
particle to move in the axial direction every time it moves down the active
layer, as long as the rotary kiln is tilted in the axial direction. This is the
basis for models that predict the movement of particles through a rotary
kiln in an axial direction. These models can predict the bed fill (fractional
area of the bed in a radial cross section) along the length of a rotary kiln as
a function of solids feed rate.

Chapter 1 – Introduction
4
Figure 3. Radial cross section of a rotary kiln
In operation, solids heat/cool/react/dry progressively as they move through
the kiln. In this thesis, we will refer to the operation as reaction. (This
approach encompasses drying as a subset of reaction.) Simultaneously
with the movement of the particles, gas may be flowing through the
freeboard of the kiln, either co-currently or counter-currently. Therefore, at
any point along the length of a rotary kiln, we can expect a different set of
conditions to apply to both the solid and the gas. We will assume (as most
researchers in the field do) that if we can understand and model the
processes that occur in the radial cross-section, then we can use that radial
cross-section as a differential element to model the rotary kiln as a whole in
the axial direction using established engineering practices.
Chapter 1 - Introduction
5
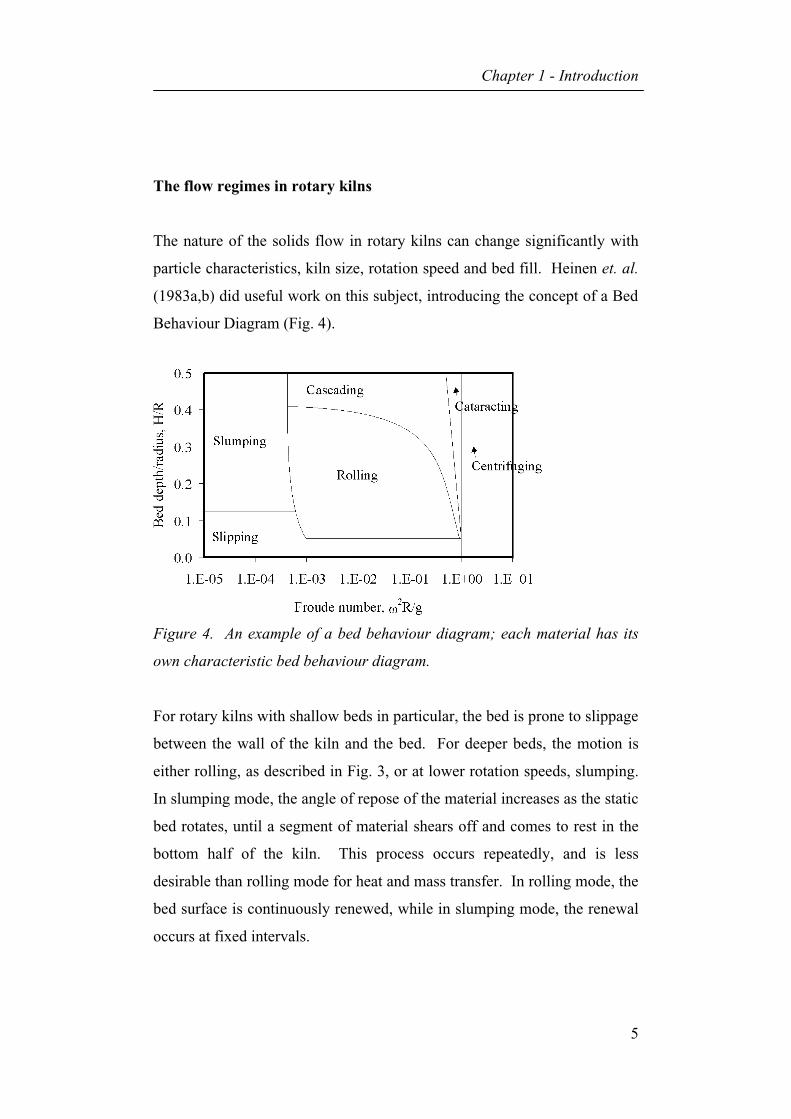
The flow regimes in rotary kilns
The nature of the solids flow in rotary kilns can change significantly with
particle characteristics, kiln size, rotation speed and bed fill. Heinen et. al.
(1983a,b) did useful work on this subject, introducing the concept of a Bed
Behaviour Diagram (Fig. 4).
Figure 4. An example of a bed behaviour diagram; each material has its
own characteristic bed behaviour diagram.
For rotary kilns with shallow beds in particular, the bed is prone to slippage
between the wall of the kiln and the bed. For deeper beds, the motion is
either rolling, as described in Fig. 3, or at lower rotation speeds, slumping.
In slumping mode, the angle of repose of the material increases as the static
bed rotates, until a segment of material shears off and comes to rest in the
bottom half of the kiln. This process occurs repeatedly, and is less
desirable than rolling mode for heat and mass transfer. In rolling mode, the
bed surface is continuously renewed, while in slumping mode, the renewal
occurs at fixed intervals.

Chapter 1 – Introduction
6
At higher bed fills and rotation speeds, the momentum of the particles as
they reach the surface of the bed becomes important, and they fall down the
surface of the bed in a trajectory. This causes a distortion in the surface of
the bed (which is normally flat). Further increasing the rotation speed
finally results in centrifugation, where particles are flung to the wall of the
kiln. This is also an undesirable regime of operation, because the particles
do not mix, resulting in poor mass and heat transfer.
Each of these modes of operation produces different conditions for particles
within the rotary kiln, and therefore should be modelled differently. In this
thesis, and in most literature articles, modelling is applicable to the rolling
mode – the preferred mode of operation industrially.
The need for the modelling of rotary kilns
The need for a deep understanding of kilns and the need for effective
fundamental models has been expressed very well by Barr et. al. (1989):
“Rotary kilns are ubiquitous fixtures of the metallurgical and chemical
process industries. Despite challenges from newer and more specialised
gas-solids reactors, they continue to find applications in the drying, heating
(or cooling), calcining, reducing, roasting and sintering of a variety of
materials. Rotary kilns can handle feed stocks with broad particle size
distributions or whose physical properties change significantly during
processing, while the long residence time of the material within the kiln
promotes uniform product quality. In addition, dirty fuels often are utilised
without serious product contamination, and multiple fuel capability is
possible. Paradoxically, this versatility, which has in the past ensured the
survival of the rotary kiln, now threatens its future. Because a thorough
understanding of the processes occurring within rotary kilns has not been a
prerequisite for their apparently satisfactory operation, research has not

Chapter 1 - Introduction
7
progressed apace with competing, less tolerant, reactors. Until all the
internal processes are understood and become predictable, rotary kilns will
remain in the position of operating below their optimal performance in an
increasingly sophisticated marketplace.”
An overview of this work
This work considers mass transfer in rotary kilns, by starting in Chapter 2
with a passive layer model.
In the passive layer model, we consider the movement of gas through that
part of the bed that moves as a concentrically around the axis of the kiln.
The gas is entrained in the interstices between the particles, reacting as it is
transported through the bed. The model was based on chemical reactor
theory, because mass transfer can be considered as a subset of reactor
theory – mass transfer becomes limiting for very fast reactions. In this first
model we show that the effectiveness factor of the bed is dependent on just
two variables: the ratio of the rate constant to the angular velocity (k/ω),
and the bed fill.
In the next chapter we consider passive layer diffusion, which involves
solving a partial differential equation in the two dimensions of the radial
cross section. This model is not flexible enough to be used over a wide
range of k/ω because of the need to consider the active layer. However, it
does provide useful insight into the dimensional groups that are required to
describe scale-up effects in a rotary kiln: either a Peclet number (εωR2/De)
or a Thiele modulus ( eDkR / ) should be used in addition to k/ω and bed
fill.

Chapter 1 – Introduction
8
In Chapter 4, some fundamental models for the active layer are presented: a
hydrodynamic model that predicts the depth and shape of the active layer,
and a dispersion model for predicting mass transfer within the active layer.
In the final chapter, a combined model is presented that expands on the
theory established in Chapter 4 for the active layer, and uses the principles
of Chapter 2 for modelling the passive layer. We find that it is seldom
possible to use either the passive layer model alone or active layer model
alone to accurately predict mass transfer, and that usually both regions in a
rotary kiln contribute significantly to mass transfer. We also find that when
dispersion effects dominate over molecular diffusion effects in the active
layer (expected for particle size > 3 mm), then scale-up effects can be be
represented by the ratio of kiln radius to particle diameter (R/dp) instead of
the Thiele modulus.

Chapter 1 - Introduction
9
REFERENCES
Barr, P.V., Brimacombe, J.K., & Watkinson, A.P., (1989). ‘A heat-transfer
model for the rotary kiln: Part 1. Pilot plant trials’, Metall. Trans., 20B,
1989, 391-402
Boateng, A.A. & Barr, P.V., (1997), ‘Granular flow behaviour in the
transverse plane of a partially filled rotating cylinder, J. Fluid Mech., 330,
233-249
Bui, R.T., Simard, G., Charette, A., Kocaefe, Y. and Perron, J., (1995),
Can. J. Chem. Eng., 73, 534-545.
Davis, R.A., (1996), ‘Mathematical model of magnetite oxidation in a
rotary kiln furnace’, Can. J. Chem. Eng., 74, 1004-1009.
Friedman, S.J. & Marshall, J.R., (1949), ‘Studies in rotary drying’, Chem.
Eng. Prog., August 1949, 482-493.
Heinen, H., Brimacombe, J.K., & Watkinson, A.P. (1983a). ‘Experimental
study of transverse bed motion in rotary kilns’, Metall. Trans., 14B, 1983,
191-205
Heinen, H., Brimacombe, J.K., & Watkinson, A.P. (1983b). The modelling
of transverse solids motion in rotary kilns’, Metall. Trans., 14B, 1983, 207-
220
Heydenrych, M.D., Greeff, P., Heesink, A.B.M., Versteeg, G.F., (2001),
‘Mass transfer in rolling rotary kilns: A novel approach’, Submitted to
Chem. Eng. Sci, 2001.

Chapter 1 – Introduction
10
Heydenrych, M.D., Schieke, J., Heesink, A.B.M., Kuipers, J.A.M. (2001),
‘Diffusion effects in rotating rotary kilns’, Accepted for publication at the
6th
World Congress of Chemical Engineering, Melbourne, 2001.
Jauhari, R., Gray, M.R., & Masliya, J.H. (1988). Gas-solid mass transfer in
a rotating drum, Can. J. Chem. Eng, 76, 224-232.
Kramers, H., & Crookewit, P. (1952). The passage of granular solids
through inclined rotary kilns. Chemical Engineering Science, 1, 259
Rovaglio, M., Manca, D. & Biardi, G., (1998). ‘Dynamic modeling of
waste incineration plants with rotary kilns: comparisons between
experimental and simulation data’, Chem. Eng. Sci., 53(15) p 2727-2742
Saeman, WC, “Passage of solids through rotary kilns”, Chem. Eng. Prog.,
47, 1951, 508-514.
Sullivan, J.D., Maier, C.G., & Ralston, O.C., (1927). Passage of solid
particles through rotary cylindrical kilns. US Bureau of Mines, Technical Papers 384, 1-42
Tscheng, S.H. and Watkinson, A.P., (1979). Convective heat transfer in a
Rotary Kiln. Can. J. Chem. Eng., 57, 433-443.
Young, R.W., Cross, M., and Gibson, R.D., (1979), ‘Mathematical model
of Grate-kiln-cooler process used for induration of iron ore pellets’,
Ironmaking Steelmaking 1, 1-13.

Chapter 2 – Passive layer model
11
Chapter 2 - Mass transfer in rolling rotary
kilns: a novel approach
ABSTRACT
A novel approach to modeling mass transfer in rotary kilns is explored. The
movement of gas in the interparticle voids in the bed of the kiln is
considered, where particles move concentrically with the geometry of the
kiln and gas is entrained by these particles. A reactor modeling approach
has been used to derive effectiveness factors for the bed as a function of
bed fill, reaction kinetics and rotation speed. In many cases, the entrained
gas becomes depleted within the bed, leading to a simplified model for the
bed effectiveness factor. Experimental data confirms the validity of this
model for slower rates. At faster rates, mass transfer can be much higher
than the model predicts, indicating that other mechanisms, such as
dispersion or diffusion are also important in these conditions.
1. INTRODUCTION
Rotary kilns are used industrially in many applications such as drying,
incineration, mixing, pre-heating, humidification, calcining, reducing,
sintering and gas-solid reactions (Barr, 1989; Jauhari, 1998).
For many rotary kilns, heat transfer is the limiting factor, both in the
heating section of the rotary kiln, and in the reaction zone (Barr, 1989).
Consequently, most focus in the literature has been directed at
understanding the heat transfer processes in rotary kilns. It is important
Chapter 2 – Passive layer model
12
though to understand all of the processes that occur in rotary kilns on a
fundamental level before rotary kilns can be designed and operated
optimally.
With physical processes like drying and humidification for example, mass
transfer is also important, as well as in gas-solid reacting systems with high
specific reaction rates such as incineration. In this work we will examine
the mass transfer in rolling rotary kilns and propose a novel approach to
describe the phenomena that determine the rate of mass transfer.
2. MODELLING STUDIES
The first published experimental studies on rotary kilns recorded the
relationship of rotation speed and kiln inclination on bed depth and solids
residence time (Sullivan et al, 1927). A model was later developed based
on the assumption that particles in a rolling bed move in a circular motion
with the rotation of the kiln, and then fall down the surface of the bed in a
thin layer (Saeman et al, 1951). The time taken to fall down the surface was
assumed to be small compared to the time for a particle to move with the
kiln from the bottom half to the top half of the bed. Using the geometry of
an inclined rotary kiln, the angle of inclination necessary to maintain a
constant bed height over the length of the rotary kiln could be determined
for a given rotation speed. This basic model predicted the original data
(Sulllivan et al, 1927) well, and the model was further refined to predict
axial movement of particles with different bed fills, taking into account the
time for particles to fall down the surface of the bed (Kramers and
Crookewit 1952). In later work that specifically measured the movement
of particles at the surface of the kiln, the validity of the model of Kramers
and Crookewit (1952), with minor exceptions, was confirmed (Lebas et al,
1995). More recently, the same fundamental model of the path of particles

Chapter 2 – Passive layer model
13
was shown to be correct in a study of particle motion where there is no nett
axial flow of particles in a rotating drum (Spurling et al, 2000).
The conditions that determine the mode in which a rotary kiln operates -
slipping, slumping, rolling, cascading, cataracting, centrifuging - have been
extensively examined, and can be represented using a Bed Behavior
Diagram (Heinen et al, 1983a). An example of a Bed Behavior Diagram is
shown in Fig. 1. In this paper, we will focus on kilns operating in the
preferred mode for most circumstances - rolling.
Figure 1. An example of a Bed Behavior Diagram (Heinen et al 1983a).
The time for a colored particle to move down the surface of the bed was
measured with video photography (Lebas et al, 1995), and this typically
takes 15 - 30% of a full cycle. However, this ratio does not change with
rotation speed, and the velocity of the particles moving down the surface of
the bed was interpreted to be directly proportional to rotation speed (Lebas
et al, 1995).

Chapter 2 – Passive layer model
14
The layer of particles moving down the face of the bed leads to improved
mass transfer, therefore the surface layer is often referred to as the “active
layer” (See Fig. 2). Heinen et al (1983a) measured particle velocities
inside this layer as well as the thickness of it, and found that it is relatively
thin for beds with a depth that is much larger than the diameter of the
particles. In most cases, the active layer is typically less than 8 particle
diameters deep, except for deep beds with small particles, where the depth
of the active layer is less than 12% of the bed depth, falling to as low as 4%
for slowly rotating kilns (Heinen et al, 1983a).
Figure 2. The various zones within a rotary kiln.
3. MODEL DEVELOPMENT
For most of the volume of the bed of a rotary kiln (the passive layer),
particles move concentrically with the wall of the bed, with no slippage
between particles. As the particles approach the bed surface due to the kiln
rotation, they slip down the face of the bed, and come to rest near the

Chapter 2 – Passive layer model
15
bottom of the surface of the bed. We will attempt to quantify the
volumetric flow rate and reaction rate of the gas that is trapped in the
interparticle voids in the passive layer.
3.1 Gas volumetric flow rate
The volume of entrained gas can be determined for a single rotation of the
kiln (for convenience, the bed has been represented horizontally):
Figure 3. Overall displacement of particles at the surface of a kiln
(irrespective of the path). Note that the bed surface will normally be
inclined, but for convenience has been drawn horizontally.
The differential area within ABC can be approximated by ½ base x
perpendicular height. The perpendicular height dx can be found as follows:
dx = (sin θ) R dθ = (c/R) R dθ = cdθ (1)
dAx = ½ c dx = ½ c2 dθ (2)

Chapter 2 – Passive layer model
16
The area useful for the entrainment of gas is proportional to the void
fraction of gas in the bed:
( ) θεdhRdAxg
22
2−= (3)
Integrating this expression over 1 radian, and converting to angular
velocity, the volume flow rate of gas is:
Q = ½ εωL(R2 – h2
) (4)
This gives the volume flow rate of entrained gas through the bed of a rotary
kiln. By estimating the concentration of the gas as it leaves the bed, the
overall reaction rate can be determined.
To understand how the active layer influences the movement of gas,
consider a line extending from the radial centre of the kiln, passing
perpendicularly through the bed surface to the deepest part of the bed. All
entrained gas will pass this line. If the active layer is infinitely thin, the
flow rate Q can easily be shown to be as in Eq. (4). A mass balance of the
particles also means that the particles will move infinitely fast over the
surface of the bed with the assumption of an infinitely thin active layer. In
practice, the particles fill move down at a finite velocity, with a finite active
layer thickness. However, for the purposes of this paper, the admittedly
unrealistic assumption of an infinitely thin layer, not affecting the
entrainment of gas perpendicular to the bed surface, will be taken through
to its conclusion.

Chapter 2 – Passive layer model
17
3.2 Nature of concentration profiles within the bed
The movement of the gas in the voids is assumed to be a circular arc,
following the geometry of the kiln, until the gas reaches the surface of the
bed again (Saeman et al, 1951). For a half-filled kiln, the retention time of
such gas will be the same, regardless of the radius of the arc. Furthermore,
this retention time for the half-full kiln will be the time it takes for half of a
revolution: τ = π/ω. If we assume that the gas following this path will
move in plug flow, we can expect a concentration profile fitting an
exponential decay. Therefore, we can expect the concentration profile
within the bed of a rotary kiln to be as follows:
Figure. 4. For a half-filled kiln, the residence time at any radius is
equal, yielding concentration profiles shown here for a first-order reaction
with k/ω = 1.
Diffusion and dispersion will no doubt play a role in the kiln, especially in
the centre of the kiln, where several concentrations converge. In this part,
the effect of the active layer will be important, and dispersion effects will
predominate. The inclusion of dispersion will require a more complex
model, not discussed here.

Chapter 2 – Passive layer model
18
For bed fills of less than 50%, the residence time at each radius will be
different, and the expected concentration profiles can be calculated.
Figure 5. Definition of angles for the determination of iso-residence time
lines.
( )ω
θω
θθθτ rhR
1
0 sin),(
−−=−
= (5)
( )ω
θτ rh1sin
−−= (6)
)sin( ωτθ −=r
h (7)
ωτωτ sincosr
x
r
y −= (8)
)cos()tan(
ωτωτ h
xy += (9)
This applies to any reaction kinetics, and different reaction kinetics will
simply determine the spacing of the lines. As an example, let us consider a
1st order reaction.

Chapter 2 – Passive layer model
19
-PA = εkCA (10)
where PA is the reaction rate of A per unit of bed volume and k is the
reaction rate constant with respect to the gas phase. Then
−=
0
lnA
A
C
Ckτ (11)
Substitute τ into Eq. (4) for 1st order iso-concentration lines, shown in
Fig. 6.
Figure 6. Concentration profiles for k/ω =1 at CA/CA0 intervals of 0.1.
3.3 Effectiveness factors
For convenience, such concentration profiles can rather be expressed by an
effectiveness factor. This factor is defined as the ratio of the actual rate of
the reaction over the bed to the rate that would be obtained if the whole bed
were exposed to gas at the highest gas concentration - the concentration
above the bed.

Chapter 2 – Passive layer model
20
In the general case of kilns with a given fill, actual rate is the average rate
over the entire cross-sectional area. (See Fig. 6.)
( )( )
dzddrrekCdVzrPR
r
rhk
A
V
bedA
= ∫ ∫∫
−−−2
1 1
1sin
0),,(
θ
θ
θω θεθ (12)
( ) ( ) θπθθ sinsinsin1
1
2
1
1hrRhRh =−== −−
(13)
From the definition of the effectiveness factor and realising that the cross-
sectional area of the bed equals ½ ( )( )1212
2sin θθθθ −−−R ,
bedA
bedA
VkC
dVzrP
0
),,(
ε
θη ∫= (14)
( )( )( )( )
∫ ∫−−−
−−−=
2
1 1
1sin
1212
2sin
2θ
θ
θω θ
θθθθη
R
r
rhk
ddrrreR
(15)
This function is represented graphically in Fig. 7 for different bed fillings
as a function of the k over ω ratio. It is interesting to note that the size of
the rotary kiln is irrelevant using this model. The only variables in this
model are the bed fill and k/ω. Later in the paper, we will discuss the role
of other parameters that are dependent on the scale of the rotary kiln.

Chapter 2 – Passive layer model
21
Figure 7. Effectiveness factors increase as bed fill decreases, and are
independent of bed radius R. Fill fractions shown are 0.5 (solid line), 0.37,
0.25, 0.14, 0.052, 0.019, 0.007 and 0.0017 (thin line).
As expected, for a given k/ω, the effectiveness increases for shallower beds.
For the special case of a half-filled cylinder, h = 0:
∫ ∫−
=π θ
ω θπ
η0 0
2
2ddrre
R
R k
(16)
θπ
π θω de
R
R
k
∫−
=0
2
22
2 (17)
−=
−ωπ
πω k
ek
1 (18)
This is also easily derived from first principles. Taking a mole balance for
a given volume of bed, where CA is the concentration of gas leaving the
bed,

Chapter 2 – Passive layer model
22
-PAdVbed = Q(CA0 - CA) (19)
ηεkCA0Vbed = Q(CA0 - CA) (20)
−=
0
1
A
Abed C
CQLkAηε (21)
−=
−ωπεωπηε k
eLRLRk
122
22
(22)
−=
−ωπ
πωη
k
ek
1 (23)
4. TOTAL DEPLETION MODEL
The double integral of equation (15) is cumbersome to work with; a
simplified approach for estimating η would be more useful. For high k/ω
values such a simple approach is quite possible.
For high k/ω, the gas leaving the system at the surface of the bed can be
assumed to be fully depleted (or saturated, in the case of drying). In this
case, we assume complete reaction and use Eq. (4) to estimate the volume
flow rate of entrained gas.
Choosing 95% conversion as the criterion, CA/CA0 = 0.05.
3ln
0
=
−=
A
A
C
Ckτ (24)

Chapter 2 – Passive layer model
23
For a half-filled kiln, all paths through the kiln have the same residence
time, and τ = π/ω. For lesser fill fractions, we will choose ½ of the
maximum angle. The angle subtended by this path is:
( )( )Rh1cos2
2
1 −=θ (25)
( )
ωωθτ Rh1
cos−
== (26)
The criterion for using the simplified model is therefore
( )Rh
k1
cos
3−>
ω (27)
Using an effectiveness factor and assuming total conversion,
0AbedA QCVP =− (28)
( )0
22
02
AbedA LChRVkC −= εωηε (29)
( )22
2hR
Ak
x
−= ωη (30)

Chapter 2 – Passive layer model
24
Table 1. The error caused by using the simplified model at the
criterion values is less than 6% in all relevant cases.
h/R Fill
fraction
k/ωω ηη
(Eq.
15)
Ax
(m2, basis
R = 1m)
ηη, total
conversion
model
(Eq. 30)
Error
(%)
0 0.5 1.91 0.164 1.571 0.1667 1.65
0.2 0.374 2.19 0.1849 1.173 0.1867 0.97
0.4 0.252 2.59 0.2006 0.793 0.2047 2.09
0.6 0.142 3.24 0.214 0.447 0.2211 3.33
0.8 0.052 4.66 0.2259 0.164 0.2361 4.56
0.9 0.0187 6.65 0.2313 0.0587 0.2432 5.16
0.95 0.00666 9.45 0.2338 0.0209 0.2466 5.45
0.98 0.00169 14.97 0.2354 0.00532 0.2487 5.63
5. MODEL VALIDATION
5.1 Literature data
Jauhari et al. (1998) measured mass transfer in a rotating drum by
measuring the evaporation rate of decane from impregnated alumina
particles. Most of the measurements were done using shallow beds with
baffles (flights) fitted to the rotary kiln. This gives rise to a geometry that
is not well described by the model in this paper. However, one set of data
was reported for a shallow rolling bed (4,3% fill), and only this set of data
will be used here.

Chapter 2 – Passive layer model
25
Mass transfer rates were measured for various kiln conditions, assuming an
ideally mixed gas phase. The results were expressed in the form of a
volumetric mass transfer coefficient ksA/Vbed, defined as:
( ) bedoutdecanesatdecanebed
soutdecane VCC
V
AkQC
,,,−= (31)
We can make use of the ksA/Vbed data by comparing those with the
equivalent data predicted by our model.
QCdecane,out = ∫ PdecanedVbed = ηεk(Cdecane,sat –Cdecane,out)Vbed
(32)
As mass transfer from the surface of the alumina particles is the rate
determining step (as long as the pores are sufficiently filled), the first order
reaction rate constant (with respect to the gas phase), follows from
ε
εε p
gsgs
d
kakk
)1(6 −== (33)
with kgs being the mass transfer coefficient at the surface of the alumina
particles. We should thus compare the ksA/Vbed data of Jauhari et al with
the pgs dk /)1(6 εη − data that we can produce with our model using eq. (15)
or (30). Before doing so, we must find an appropriate value for kgs. For
that purpose, we use the findings of Sφrensen and Stewart (1974) who
studied mass transfer in packed beds. For a stagnant fluid they derived:
p
gs d
DShk
⋅= with Sh = 3.8 (34)

Chapter 2 – Passive layer model
26
As the gas entrained into the bed of a kiln is regarded to have no slip
velocity with regard to the particles in the bed, and the bed porosity is
comparable to that of a packed bed, eq. (34) is assumed to be appropriate.
If we now apply the precise conditions at which Jauhari et al. have
produced their ksA/Vbed data, we are able to calculate the corresponding
pgs dk /)1(6 εη − data with our model. These conditions are summarised in
Table 2:
Table 2: Conditions used in our model.
Total volume : 20.3 liters
Bed volume: 0.875 liters
h/R: 0.824
R: 0.145 m
h: 0.1195 m
Cross-sectional bed area (Ax): 0.00284 m2
Particle diameter (dp): 3 x 10⁻³
m
Binary diffusion coefficient of decane
in nitrogen at 20°C (Dab): 6 x 10
-6 m
2 s
-1
Interparticle voidage (ε): 0.45 (assumed)
Sherwood number (Sh): 3.8
Gas-solid mass transfer coeff. (kgs):
7.6 x 10
-3 m s
-1
k
=
−
p
gs
d
k
εε )1(6 18.6 s
-1
Below we compare our results with the data measured by Jauhari et al:

Chapter 2 – Passive layer model
27
Table 3. Comparison of measured data and model predictions.
Rotation
speed N
(rpm)
Angular
velocity ωω
(s -1)
Measured
data ksA/Vbed
(s -1)
k
(s -1)
Total
depletion
model: ηηεεk
(s-1)
0.29 0.031 0.121 612 0.0164
0.59 0.062 0.198 301 0.0329
1.23 0.128 0.411 144 0.0685
1.67 0.175 0.502 106 0.0933
1.97 0.206 0.604 90 0.1101
In all cases, k/ω is much higher than the value of the criterion given by
Eqn. (29) (i.e. 0.09), meaning that saturation is easily reached within the
bed, and that the mass transfer contribution by the convective model is
practically insensitive to the calculated rate constant k.
Fig. 8. Mass transfer data measured by Jauhari et al is significantly higher
than that predicted by our model. Present model (total depletion)
o Data for 0.043 fill (Jauhari et. al. 1998)

Chapter 2 – Passive layer model
28
5.2 Measured data
In order to test our model at conditions where kinetics are much slower, we
performed similar experiments to Jauhari et al (1998), but using larger
particles, allowing the evaporation to continue until the particles were dry.
In this way, mass transfer within the pores of the particles became the rate
limiting process in the final drying stage.
Figure 9. Flow diagram of experimental apparatus
The rotating drum used has a diameter of 0.15 m and a length of just
0.041 m (Fig. 9). It is made of steel with a polycarbonate observation
window. It was only operated in the rolling mode at two speeds: 0,052
radians/s and 0,266 radians/s. Air was introduced through a rotameter and
blown through a 1 mm jet directly away from the bed towards the circular
wall of the rotating drum, in order to ensure good mixing of the gas above
the bed and to prevent any bypassing of gas to the central exit. Like
Jauhari et. al. (1998), hydrocarbon concentration was measured

Chapter 2 – Passive layer model
29
continuously using a sensor. The sensor was calibrated so that the sensor
reading could be transformed to a linear hydrocarbon concentration
reading. Because the hydrocarbon concentration and air flow rate were
known at all times during a run, it was possible to calculate what fraction of
hydrocarbon liquid had evaporated at any time. The fraction of liquid
remaining in the particle (liquid loading, z) has been used as a parameter to
characterise the particle at a given set of conditions.
The experimental technique to measure mass transfer rates differs from that
used by Jauhari et. al. (1998), because the sensor was placed within the
rotating drum, near the gas exit. This allowed us to directly measure the
build-up of concentration within the freeboard gas after the gas flow had
been stopped.
For the experiments reported here, we used spherical tab-alumina particles
of average diameter 16 mm ± 1 mm soaked in 1-pentanol. The 44 pellets
that were used gave an average fill fraction of 0.27. The particles were
wiped dry before being loaded in the rotating drum. During the
experiment, air flowed through the rotating drum. At suitable intervals, the
gas flow was stopped, and the rate of increase of hydrocarbon
concentration was measured until it came close to saturation. The
characteristic rate of the system (ηεk) was calculated from the exponential
rise in the hydrocarbon concentration as a function of time:
( )dt
dCVVCCk fbedsat =−ηε (35)
which can be integrated to give:
tkV
V
CC
CC
f
bed
sat
sat ⋅=
−−
− ηε0
ln (36)
Chapter 2 – Passive layer model
30
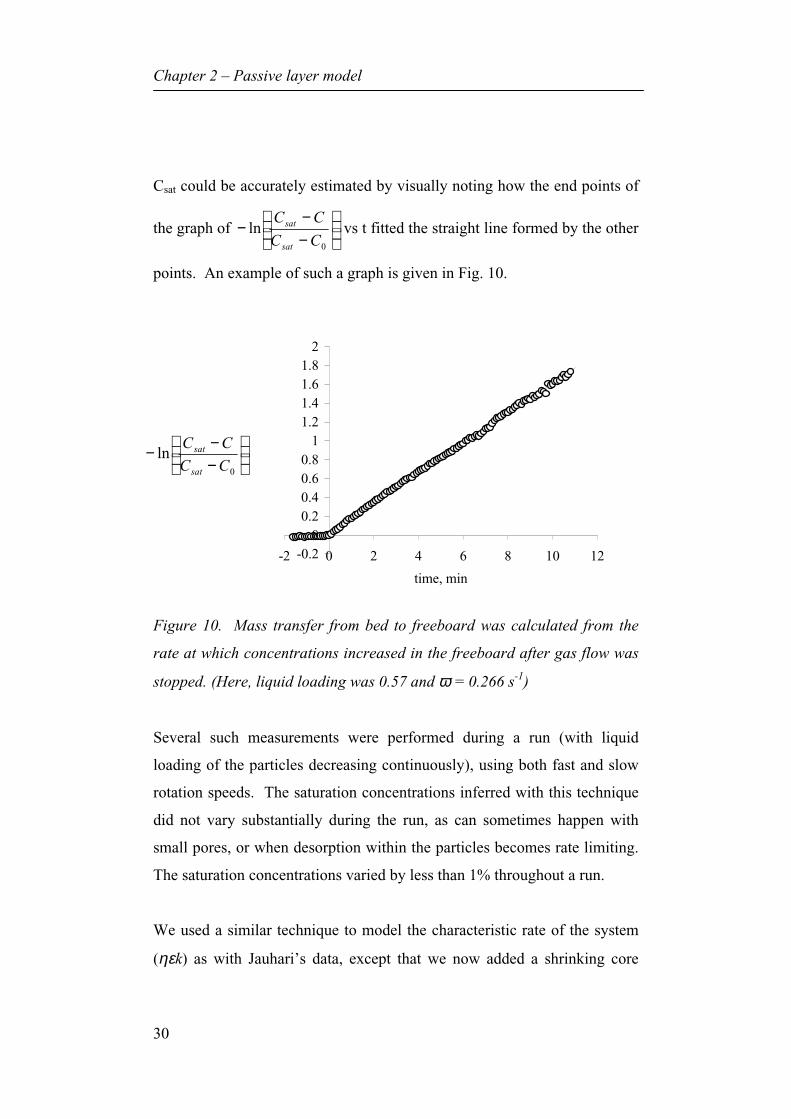
Csat could be accurately estimated by visually noting how the end points of
the graph of
−−
−0
lnCC
CC
sat
sat vs t fitted the straight line formed by the other
points. An example of such a graph is given in Fig. 10.
-0.2
0
0.2
0.4
0.6
0.8
1
1.2
1.4
1.6
1.8
2
-2 0 2 4 6 8 10 12
time, min
Figure 10. Mass transfer from bed to freeboard was calculated from the
rate at which concentrations increased in the freeboard after gas flow was
stopped. (Here, liquid loading was 0.57 and ω = 0.266 s-1)
Several such measurements were performed during a run (with liquid
loading of the particles decreasing continuously), using both fast and slow
rotation speeds. The saturation concentrations inferred with this technique
did not vary substantially during the run, as can sometimes happen with
small pores, or when desorption within the particles becomes rate limiting.
The saturation concentrations varied by less than 1% throughout a run.
We used a similar technique to model the characteristic rate of the system
(ηεk) as with Jauhari’s data, except that we now added a shrinking core
−−−
0
lnCC
CC
sat
sat

Chapter 2 – Passive layer model
31
model to the resistance term. The term L is liquid loading, and εpart is the
intraparticle porosity:
−+−= 1
111)1(6
3122
zShd
Dk
partp εεε
(37)
The effective dispersion coefficient within the particle was estimated as
Dpart2ε , and the value of εpart (0.15) was inferred from the experimental data
taken at the slowest drying rates. The parameters used in the model are
given in Table 4.
Table 4. Parameters used for the modelling of our data.
Parameter Value
Binary diffusion coefficient,
pentanol-air (D)
8.25 x 10⁻⁶
m2/s
Bed porosity (ε) 0.636
Particle porosity (εpart) 0.15
Particle diameter (dp) 0.016 m
Sherwood number (Sh) 3.8
The total depletion model was not applicable at these experimental
conditions, so η was estimated using Eq. (15). This enabled us to plot our
model ηεk values with those that we obtained by experiment:

Chapter 2 – Passive layer model
32
Figure 11. Characteristic rate is well predicted by the model for both fast
rotation x (0,266 s-1), and slow rotation ---¯--- (0,052 s-1)
The predicted mass transfer rates follow the trend of the experimental data
quite well. By using the model prediction of k at the various liquid
loadings (Eq. 37), it is possible to calculate the effectiveness factor η and
k/ω at each of the experimental data points. These points (Fig. 12) follow
the expected trend quite well, but show some scatter. The experimental
data for 0.6 < k/ω < 2 were measured with wet pellets, and the values
measured for 0.02 < k/ω < 0.1 using externally dry pellets are higher than
expected, possibly due to uneven drying on the surface of the pellets.

Chapter 2 – Passive layer model
33
Fig. 12. Effectiveness factors follow the predicted trend as a function
of k/ω. model, × ω = 0,266 s-1, ¯ ω = 0,052 s-1.
6. CONCLUSION
A novel model to predict mass transfer inside a rolling rotary kiln was
presented. This model only considers convection inside the voids between
the particles inside the bed, which are assumed to be filled with entrapped
gas from the freeboard.
The model was found to underestimate mass transfer rates for fast reacting
systems (k/ω > 1), showing that other mechanisms like dispersion and/or
surface phenomena are also important for such systems. Active layer
models are to be preferred in these cases. However, for slower reactions
(k/ω < 1) the presented model appears to perform much better. It then
provides a useful alternative to active layer models, which are clearly
inappropriate if the whole bed contributes to mass transfer. For more
general applicability, it would be useful to include diffusion/dispersion
effects, which will be done in a future paper.

Chapter 2 – Passive layer model
34
SYMBOLS
a pellet outer surface area per bed volume [m-1
]
A area [m2]
Ax radial cross-sectional area of the bed [m-2
]
C concentration [mol m-3
]
D binary diffusion coefficient [m2 s
-1]
dp particle diameter [m]
F solid fill fraction: bed volume/kiln volume
g gravitational acceleration [m s-2
]
h perpendicular distance from radial center of the kiln to the bed
surface [m]
k reaction rate constant [s-1
]
kgs mass transfer coefficient on the surface of particles [m s-1
]
ks mass transfer coefficient of active layer [m s-1
]
L length of the rotary kiln in axial direction [m]
PA reaction rate of A [moles m3(bed) s
-1]
Q volumetric gas flow rate [m3 s
-1]
R radius of rotary kiln [m]
r distance from radial center of bed to the surface of the bed at angle
2 [m]
s half of the chord length formed by the bed surface [m]
V volume [m3]
Vbed volume of bed [m3]
Vf volume of freeboard [m3]
z liquid loading in particles: volume fraction of pores filled by liquid

Chapter 2 – Passive layer model
35
Greek symbols
ε bed voidage [m3(gas) m
-3(bed)]
η effectiveness factor of reaction
τ residence time of gas in the bed [s-1
]
θ angle [rad]
φ gas flow rate [m3(gas) s
-1]
ω angular velocity [s-1
]
REFERENCES
Heinen, H., Brimacombe, J.K., & Watkinson, A.P. (1983a). Experimental
study of transverse bed motion in rotary kilns, Metall. Trans., 14B, 1983,
191-205
Heinen, H., Brimacombe, J.K., & Watkinson, A.P. (1983b). The modelling
of transverse bed motion in rotary kilns”, Metall Trans., 14B, 1983, 207-
220
Jauhari, R., Gray, M.R., & Masliya, J.H. (1988). Gas-solid mass transfer in
a rotating drum, Can. J. Chem. Eng, 76, 224-232.
Kramers, H., & Crookewit, P. (1952). The passage of granular solids
through inclined rotary kilns. Chemical Engineering Science, 1, 259
Lebas, E.F., Hanrot, F., Ablitzer, D. & Houzelot, J.L. (1995).
“Experimental study of residence time, particle movement and bed depth
profile in rotary kilns”, Can. J. Chem. Eng, 73, 173-179.

Chapter 2 – Passive layer model
36
Saeman, WC, “Passage of solids through rotary kilns”, Chem. Eng. Prog.,
47, 1951, 508-514.
Sørensen, JP, Stewart, WE, 1974, Effect of fluid dispersion coefficients on
particle-to-fluid mass transfer coefficients in packed beds”, Chem. Eng. Sci,
33, 1374-1384
Spurling, R.J., Davidson, J.F., & Scott, D.M. (2000). The no-flow problem
for granular material in rotating kilns and dish granulators. Chemical
Engineering Science, 55, 2303-2313
Sullivan, J.D., Maier, C.G., & Ralston, O.C., (1927). Passage of solid
particles through rotary cylindrical kilns. US Bureau of Mines, Technical
Papers 384, 1-42
Tscheng, S.H. and Watkinson, A.P., (1979). Convective heat transfer in a
Rotary Kiln. Can. J. Chem. Eng., 57, 433-443.

Chapter 3 – Diffusion in the passive layer
37
Chapter 3 - Diffusion effects in rotating
rotary kilns
ABSTRACT
A novel approach to the modeling of mass transfer in rotary kilns has been
described (Heydenrych et al, 2001). It considers the mass transfer to occur
by the inclusion of gas in the interparticle voids in between the particles
that move concentrically with the kiln. By doing so, the rate of mass
transfer was found to be dependent on bed fill and the ratio of reaction rate
constant to angular velocity (k/ω). The model was found to be valid at
slow to medium fast reactions. For fast reactions it under-predicted mass
transfer. Therefore in this paper, the model will be extended to include
diffusion effects. An additional dimensionless number is necessary then to
describe the system. This can either be a Peclet number (ωR2/De) or a
Thiele modulus (kR2/De)
½. The solution of the 2-dimensional partial
differential equations that describe the extended model gives a handle on
the effect of scale-up in rotary kilns. For industrial-scale kilns, the Peclet
number is large, which means that diffusion within the lower (passive)
layer of the bed is unimportant for slower rates. With high reaction rates,
iso-concentration lines are closely stacked near the surface of the bed,
implying that it is important to model the active layer rather than the bed as
a whole in these circumstances. However, the stiff differential equations
are not easily solved then, and other methods of solution are advisable.

Chapter 3 – Diffusion in the passive layer
38
1. INTRODUCTION
Traditionally, mass transfer in rotary kilns has been modelled as a mass
transfer coefficient at the surface of the bed of a rotary kiln (Jauhari et. al.
1998). Recently, a novel approach to the modelling of mass transfer has
been suggested though (Heydenrych et al, 2001). This approach takes into
account the inclusion of gas in the interparticle voids in between the
concentrically moving particles in the passive layer of the bed. In that
work, the role of the active layer where particles move along the surface of
the bed was ignored by assuming that the thickness of the active layer
region is infinitely thin. They concluded that their concentric movement
model has merit, but that the effect of diffusion and dispersion within the
bed must also be taken into account in the case of fast reactions. In this
paper we will explore the effect of diffusion within the concentric flow
region, and how it affects the overall mass transfer, again under the
assumption of an infinitely thin active layer.
Figure 1. Shows the concentric movement and active layer regions

Chapter 3 – Diffusion in the passive layer
39
2. MATHEMATICAL MODEL
To take diffusion into account, consider the mass balance for a differential
element within the bed (i.e. concentric flow region):
AA r
t
C+⋅−∇=
∂∂
AN (1)
After substituting equations for the transport of gaseous A (Fick’s diffusion
plus convection) into the above equation, the concentration profile of A
follows from
( ) AAAeA rcCD
t
C +−∇⋅∇=∂
∂Vε (2)
AAeAA rCDC
t
C +∇=∇⋅+∂
∂ 2Vε (3)
Sharp concentration gradients are expected in the radial cross-section of
kilns [Heydenrych et al, 2000]. In the axial direction, relatively low
concentration gradients can be expected due to the high length to diameter
ratio found in typical rotary kilns. This makes it a reasonable assumption
to simplify the governing equation to the two dimensions that represent the
radial cross-section. Although polar coordinates may be a more natural
choice of coordinate system, we have chosen rectangular coordinates
because of software restrictions. Assuming steady-state operation:
02
2
2
2
=+∂
∂+
∂∂
+∂
∂+
∂∂
AA
eA
eA
yA
x ry
CD
x
CD
y
CV
x
CV εε (4)

Chapter 3 – Diffusion in the passive layer
40
Here, De is the effective diffusivity and e is interparticle voidage. Both are
assumed to be constant. Vx and Vy are the x and y components respectively
of the velocity of particles (and gas) in the bed, and are described by the
concentric motion of the bed. Zero flux at the solid walls gives a simple
boundary condition: 0=∇⋅ ACnv
where nv
denotes the normal vector at the
kiln wall. For the bed surface, various boundary conditions can be used as
appropriate, discussed later in the paper.
Rewriting Eqn. 4 in terms of dimensionless variables, for an nth
order
reaction with nAA kCr ε=− :
011
1
,
2
2
2
2
=Ψ+∂
Ψ∂+∂
Ψ∂+∂
Ψ∂+∂
Ψ∂ −n
nsA
yy
xx
yx
kC
PePe ωε
λυ
λυ
λλ (5)
where
sA
A
C
C
,
=Ψ dimensionless concentration,
R
xx
=λ , R
yy
=λ , R
Vxx ω
υ = , R
Vyy ω
υ = ,
eD
RPe
2ωε= , a Peclet number modified for rotary kilns. The
reaction term ω
1
,
−nsAkC
is similar to the k/ω term used by Heydenrych et. al.
(2001) to describe concentration terms within the bed of a rotary kiln in
which a first order reaction takes place.
Noting that υx is simply the x-component of the velocity divided by the
velocity at the wall, it follows from the concentric movement geometry that
yx λυ = and xy λυ −= using the coordinate system given in Fig. 2. See the
Appendix for more detail.

Chapter 3 – Diffusion in the passive layer
41
Figure 2: Applied coordinate system. We assumed that the active layer
was infinitely thin.
In addition to the no-flux condition at the wall, the Danckwerts boundary
condition for non-ideal flow in a plug flow reactor was used as the
boundary condition at the bed surface:
∂
∂+
∂∂
−=y
C
x
C
V
DCC AA
x
eAsA ε,
(6)
The condition may also be written in dimensionless form as
xxyx
PePe υψυλψ
λψ −=−
∂∂+
∂∂
where ω
υR
Vxx = . (7)
The no-flux condition at the wall is given in dimensionless form by
0
1
=∂
Ψ∂+∂
Ψ∂
=λλλ y
yx
x nn (8)

Chapter 3 – Diffusion in the passive layer
42
where nx and ny are the components normal to the wall confining the
particulate solids.
The model described here (Eqns. 5, 7 and 8) is dependent on two
dimensionless variables: Pe and ω
1
,
−nsAkC
. Note that the square of the Thiele
modulus ω
φ1
,2
−
⋅=n
sAkCPe . This means that the system can be described by
any two of the dimensionless groups Pe, φ orω
1
,
−nsAkC
. In this paper we have
chosen to use ω
1
,
−nsAkC
because it is the only variable that is required to
describe the no-diffusion case, and Pe. The rate constant k typically
changes significantly along the length of the kiln, as the solid phase
approaches full conversion (or total drying). Pe only needs to be calculated
once for a given kiln because it does not typically change along the length
of a rotary kiln.
Fraction fill is the third independent dimensionless variable that is
necessary to describe this model. It is also interesting to note that the
fraction fill does not affect the governing equations (Eqn. 5), but only the
geometry of the boundary conditions.
Solution of the model
This model was solved using Matlab’s partial differential equation toolbox.
Although it would be possible to model nth
order reactions using the same
toolbox, in this case, we have restricted our analysis to 1st order reactions.
For future reference, we will refer to the second dimensionless variable in
its form for first-order reaction, k/ω.

Chapter 3 – Diffusion in the passive layer
43
The solution gives the concentration profile within the bed of the kiln, and
the effectiveness factor of the bed is calculated from that concentration
profile. The effectiveness factor of a rotary kiln is defined analogously to
the effectiveness factor of a catalyst pellet.
bed
A
n
bedn
SA
A
nA
nSA
V
nA
V
SA
V
A
A
dA
AC
dAC
VkC
dVkC
dVP
dVP ∫∫∫∫∫ Ψ
==−
−=
−
−=
,,,ε
εη (6)
where –PA is the local reaction rate in the bed and –PA,s is the reaction rate
that would occur if the entire cross section of the bed was exposed to the
conditions at the surface of the bed.
For 1st order reactions,
bed
A
A
dA∫=
ψη ,
where area A is calculated in terms of λx and λy. (7)
Given that the solution of the partial differential equation (Eq. 5) is the
concentration profile over the bed, the effectiveness factor can be
determined from the average dimensionless concentration over the bed
cross section.
3. RESULTS
The effectiveness factor curves for a 50%, 20% and 10% filled kiln that
were generated using the model are shown in figures 3 to 6. The curve for
an infinite Peclet number represents the no-diffusion case reported earlier
by Heydenrych et. al. (2001).

Chapter 3 – Diffusion in the passive layer
44
Figure 3: Effectiveness factors as a function of k/ω for a 50% filled kiln;
1st order reaction.
As expected, the inclusion of diffusion effects in the model increases the
effectiveness factor in all conditions. It should also be noted that for a
given Peclet number (i.e. kiln size and rotation speed), the effect of
diffusion as a fraction of the contribution by gas inclusion, is far higher at
high values of k/ω, where high concentration gradients occur in the bed
(predominantly near the surface of the bed). For commercial scale rotary
kilns, Peclet numbers are typically greater than 1000, discussed later in the
paper.
At higher Peclet numbers (Pe > 10), the numerical method was unable to
converge on a solution. The dashed lines on Figure 3 are extrapolations,
where the model failed to solve. A possible reason for the poor
convergence of the model at large Peclet numbers, is that the numerical
methods used to solve the model were based on techniques suited for an
elliptical (second-order) partial differential equation, with the first-order
term simply being handled as a source term. At high Peclet numbers, the
second-order terms of the partial differential equation become less
important, and the numerical method is unsuited to the solution of what
effectively becomes a first-order hyperbolic pde that dominates the model.

Chapter 3 – Diffusion in the passive layer
45
Similar solutions have been found for kilns with bed fills of 20% and 10%
(Figs. 4 and 5 respectively)
Figure 4. Effectiveness factors as a function of k/ω for a 20% filled kiln;
1st order reaction
.
Figure 5: Effectiveness factors as a function of k/ω for a 10% filled kiln; 1st
order reaction.
As the fill fraction decreases, the effect of diffusion appears to become
more important. The concentration profiles generated at certain Pe and k/ω
values are interesting, and are shown in Fig. 6 for a half-filled kiln:

Chapter 3 – Diffusion in the passive layer
46
Pe =
1
Fill = 10% Fill = 20% Fill = 50%
k/ω
= 0
.1
k/ω
=1
k/ω
= 1
0
k/ω
= 1
00
Figure 6: Concentration profiles at Pe = 1; 1st order reaction.
The straight iso-concentration lines predicted for the no-diffusion case
(Heydenrych et. al, 2001), Fig. 7, are only readily evident for the diagram

Chapter 3 – Diffusion in the passive layer
47
where k/ω = 0.1. For the other cases, diffusion effects dominate the shape
of the concentration profile, and the rotation of the kiln does not distort the
profile significantly.
Figure 7. If diffusion is not taken into account, straight iso-concentration
lines are expected.
4. DISCUSSION
Scale-up effects
The models have shown that for Peclet numbers less than 100, diffusion
effects are important. But under what circumstances can we expect such
low Peclet numbers, and what Peclet numbers are typical for rotary kilns?
The diffusivities of a gas at atmospheric pressure vary between 10-4
-10-6
m2/s (Knudsen et. al., 1997). Values of 2 x 10
-4 m
2/s, 2 x 10
-5 m
2/s and 2 x
10-6
m2/s were used to for the diffusivity of the reactant gas DA.
The effective diffusivity in the bed of the kiln can be estimated as follows:
τεA
e
DD = (Knudsen et. al., 1997)

Chapter 3 – Diffusion in the passive layer
48
Using a tortuosity (τ) of 2 and voidage (ε) of 0.5, we can expect effective
diffusivities within the bed of 5 x 10⁻⁵
m2/s (max.), 5 x 10
-6 m
2/s and
5 x 10⁻⁷
m2/s (min.).
Kiln rotation speeds vary less, because at lower rotation speeds, slumping
of the bed can occur. At higher rotation speeds, centrifugation begins. For
this reason, only two angular velocities are considered, 0,5 rad/s and
0,1 rad/s.
The effect of scale is largely dependent on the radius, because Pe ∝ R2.
Table 1 shows Peclet numbers for selected De and ω values as a function of
radius.
Table 1. Peclet numbers for typical rotation speeds and effective diffusion
coefficients. Cells with Pe < 1000 are not shaded to indicate that this only
occurs in laboratory-scale kilns with high De values.
De, m2/s 5 x 10
-5 5 x 10
-6 5 x 10
-7
ω, rad/s 0.1 0.5 0.1 0.5 0.1 0.5
0.05 5 25 50 250 500 2500
0.1 20 100 200 1000 2000 10000
0.5 500 2500 5000 25000 50000 250000
1 2000 10000 20000 100000 200000 1000000
r
adiu
s (m
)
5 50000 250000 500000 2500000 5000000 25000000
As an example, the Peclet numbers for the rotating drum used by Jauhari et.
al. (1998), with a rotating drum of radius 0.145 m, varies from 530 to 3600,
depending on rotation speed. It is obvious that diffusion as a possible extra
transport mechanism to gas entrapment can safely be neglected for practical
applications as well as for most lab experiments.

Chapter 3 – Diffusion in the passive layer
49
5. CONCLUSIONS
A mathematical model has been presented that improves on the previous
model (Heydenrych et al, 2001) by adding diffusion effects to gas
entrapment in the concentric flow region of a rotary kiln. The technique,
but not the model, is limited to moderate Pe numbers. For practical values
of Pe, a modified solution technique is required. Heydenrych et al, 2001
have shown that k/ω is the parameter that describes mass transfer at low to
moderate reaction rates. In this paper, Peclet number was implemented (in
addition to k/ω) to model diffusion effects. This number is defined as
ωR2/De. The Peclet number provides a tool for predicting scale-up effects,
and even though the model presented here is oversimplified due to the
assumption of an infinitely thin active layer, it nevertheless provides an
insight to the use of the Peclet number for the scale-up of rotary kilns.
Diffusion in the concentric flow region was found not to add much to the
mass transfer at realistic conditions where the Peclet number is much
higher than 1. At high k/ω values, however, concentration gradients
become fully concentrated near the surface of the bed, and here the
assumption that the active layer is infinitely thin becomes a poor
assumption as all mass transfer is occurring within this layer. This model
shows that the entrapment of gas perpendicular to the bed is relatively
unimportant compared to diffusion effects at these higher k/ω values.
Further work should be concentrated at developing a suitable model for the
active layer, where a 1-dimensional dispersion model would be a fair
assumption, based on the results of this work. It will also be important to
determine the depth of the active layer, and how the movement of particles
over each other affects the dispersion of the gas in the direction
perpendicular to the bed surface. This information will give the boundary
Chapter 3 – Diffusion in the passive layer
50
conditions for the concentric flow region, with the aim of generating a
comprehensive model including all mechanisms for mass transfer.
SYMBOLS
A Cross sectional area of the bed of the rotary kiln [m2]
CA Concentration of reactant A in the bed of the rotary kiln [kmol/m3]
CA,s Concentration of reactant A at the surface of the bed [kmol/m3]
De Effective diffusivity of reactant A [m3/s]
Pe Peclet number modified to suit a rotary kiln
R Radius of kiln [m]
r Reaction rate of a reactant A [kmol/m3/s]
V Velocity of gas within the bed [m/s]
x Co-ordinate in x direction
y Co-ordinate in y direction
Greek Letters
ε Voidage of the bed of the rotary kiln
φ Thiele modulus
η Effectiveness factor
λ Dimensionless distance
τ Tortuosity
υ Dimensionless velocity
ω Angular velocity of kiln [rad/s]
ψ Dimensionless concentration

Chapter 3 – Diffusion in the passive layer
51
REFERENCES
Heydenrych, M.D., Greeff, P., Heesink, A.B.M., Versteeg, G.F., (2001),
‘Mass transfer in rolling rotary kilns: A novel approach’, Submitted to
Chem. Eng. Sci, 2001.
Jauhari, R., Gray, M.R., & Masliya, J.H. (1988). Gas-solid mass transfer in
a rotating drum, Can. J. Chem. Eng, 76, 224-232.
Knudsen J.G., Hottel, H.C., Sarofim, A.F., Wankat, P.C. and Knaebel, K.S.
(1997) in Perry’s Chemical Engineer’s Handbook, Seventh Edition, D.W.
Green (Ed.), McGraw-Hill, New York, 5-1 to 5-79.
Thiele, E.W. (1939) ‘Relation between catalytic activity and size of
particle’, Industrial and Engineering Chemistry, 31 (7), 916-920

Chapter 3 – Diffusion in the passive layer
52
APPENDIX
Proof that υx = λy and υy = -λx
Consider a point on the radius, which is at λ = 1 in dimensionless
coordinates. By definition,
R
Vxx ω
υ =
Substituting for Vx,
θω
θωυ sinsin ==R
Rx
From the diagram,
xy υθλ == sin
At points away from the wall, υx and λy decrease proportionately. It can
similarly be shown that υy = -λx.

Chapter 4 – Active layer models
53
Chapter 4 - Hydrodynamics and dispersion
in the active layer of rolling rotary kilns
ABSTRACT
In previous works (Heydenrych et. al. 2001a,b), it was shown that the top
layer (or active layer) of a rolling bed is the only active place in the case of
a fast reaction. The bottom part of the bed (also referred to as the
concentric flow region) is almost depleted and therefore hardly reacting.
Therefore in this work we focus on that active layer. A hydrodynamic
model is prepared to predict its shape. A mass balance on particles moving
within a rotary kiln gives the shape of the active layer, defined as that part
of the bed where particles move past each other. The derivation is based on
the assumption that there is a linear velocity gradient of particles in the
direction perpendicular to the surface of the bed that is constant at any
place on the bed surface. Published data was used to establish a
relationship between this velocity gradient on the one hand, and bed fill and
rotation speed on the other. A dispersion model was derived to predict the
mass transfer of gaseous reactant within the active layer. As void spaces
are created and destroyed due to the action of particles moving over each
other, mixing of gas occurs. A dispersion coefficient was derived, based on
this gas mixing, and was found to be proportional to the velocity gradient
and to the square of particle diameter. Applying these relationships to a
1-dimensional concentration gradient model gave a correlation for the mass
transfer coefficient at the bed surface. This model does not correctly
predict the proportionality of mass transfer with bed speed reported in the
literature. We conclude that another effect, probably the granular
temperature of the particles, is important for modeling of dispersion and
mass transfer in the active layer of rolling rotary kilns.
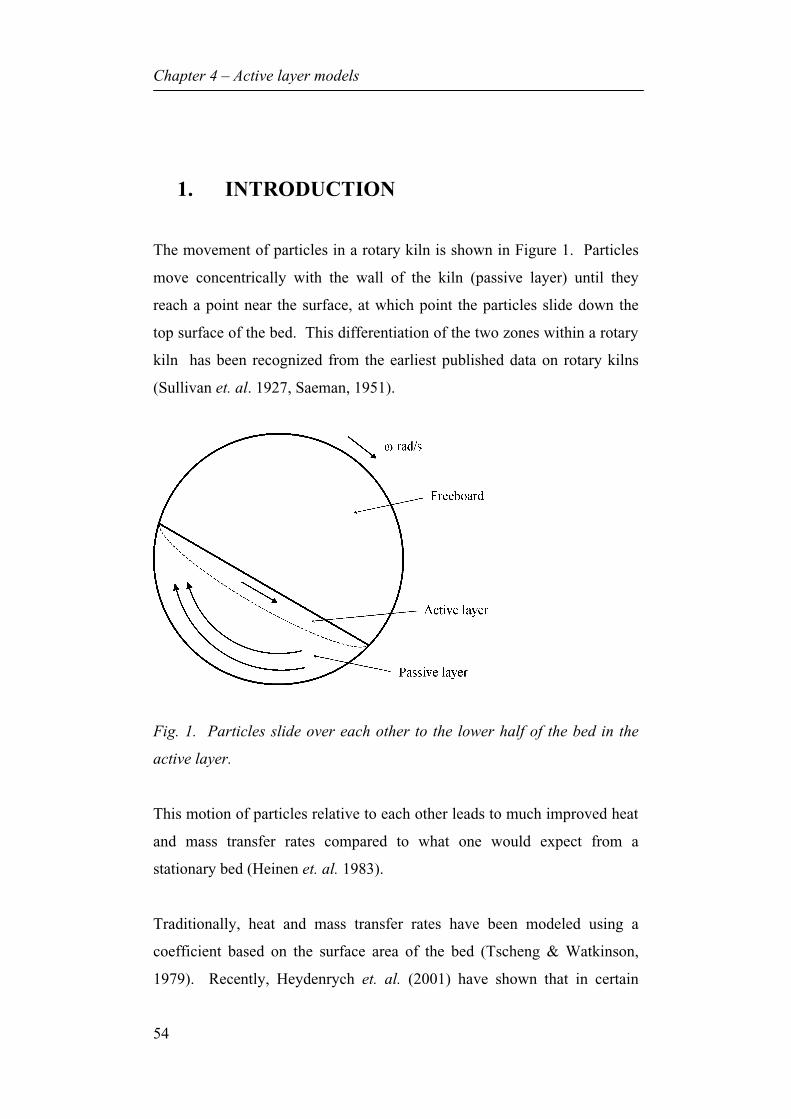
Chapter 4 – Active layer models
54
1. INTRODUCTION
The movement of particles in a rotary kiln is shown in Figure 1. Particles
move concentrically with the wall of the kiln (passive layer) until they
reach a point near the surface, at which point the particles slide down the
top surface of the bed. This differentiation of the two zones within a rotary
kiln has been recognized from the earliest published data on rotary kilns
(Sullivan et. al. 1927, Saeman, 1951).
Fig. 1. Particles slide over each other to the lower half of the bed in the
active layer.
This motion of particles relative to each other leads to much improved heat
and mass transfer rates compared to what one would expect from a
stationary bed (Heinen et. al. 1983).
Traditionally, heat and mass transfer rates have been modeled using a
coefficient based on the surface area of the bed (Tscheng & Watkinson,
1979). Recently, Heydenrych et. al. (2001) have shown that in certain

Chapter 4 – Active layer models
55
cases, particularly for slow processes, the active layer, and the volume of
the bed can also become important. Those models were developed for
mass transfer, and in this paper we will continue to model mass transfer as
an example of transfer processes that occur in rotary kilns.
In this paper, we explore the physical processes that occur within the active
layer in order to model the depth and shape of the active layer, and to
predict the dispersion that can be expected. With these models, we
estimate concentration profiles and finally calculate the effective mass
transfer coefficient (based on bed surface area) for the active layer for a
given rotation speed, particle size and bed depth.
2. HYDRODYNAMICS OF THE ACTIVE
LAYER
2.1 The shape of the active layer
The movement of particles sliding over each other in the active layer causes
dispersion of the gas in the voids. This dispersion effect is typically much
greater than the effect of gaseous diffusion in the active layer, and
concentration gradients in this layer are much less than one would predict
by the diffusion model presented by Heydenrych et. al. (2001).
The most important parameter for predicting the degree of dispersion will
be the gradient of the velocity profile near the surface of the bed.
If we take any line from a point on the bed surface to a point on the wall
within the bed, the mass on either side of that line must remain constant in

Chapter 4 – Active layer models
56
time. We will use a line extending from 1 to 2 to 3 on Fig. 1; we expect the
mass within the volume 1, 2, 3, 4 to remain constant.
Figure 1. Mass balance over envelope described by 1-2-3-4
The volume flow rate out of the control volume (using solids in this case)
has earlier been shown (Heydenrych et. al., 2001) to be:
( )222)(
2
)1(dhxR
LQ +−−−= εω
( 1)
Boateng & Barr (1997) have measured the velocity profiles in the active
layers of rotary kilns, and found that for certain materials, the gradient of
the velocity profile is substantially linear in the direction perpendicular to
the bed surface (1-2) on Fig. (1). They also found that this gradient does
not change along the x-direction in Fig. 1. We will make this assumption
to calculate the volume flow rate into the control volume through the
envelope extending from 1 to 2 in Fig. 1. It would be useful to understand
through granular dynamics simulations (Hoomans, 2000) how the choice of
materials affects these assumptions.

Chapter 4 – Active layer models
57
Firstly, let us define the gradient of the velocity profile (called shear rate by
Boateng and Barr (1997)) as the variable m. Also, defining the velocity of
particles at the surface and at depth d as υs and υd respectively, it follows
that
dmdS =−υυ ( 2)
and assuming that υd is determined by the x-component velocity of the
passive layer,
ωθωυ )(sin dhrd +−=−= ( 3)
Substituting for υd into Eq. (2),
ωυ )( dhdmS +−= ( 4)
The volume flow rate of solids between points 1 and 2 can now be
calculated, using the average velocity between these two points:
2
)()1( dSLdQ
υυε +−= ( 5)
Eliminating Q using Eqns. (1) and (5), we get:
( )222)( dhxR
ddS +−−=+ ωυυ ( 6)

Chapter 4 – Active layer models
58
Substituting Eq. (3) for υd and Eq. (4) for υS and simplifying,
1/
222
−−−=
ωm
hxRd ( 7)
Note that with d and m/ω known, υS can be determined as a function of x
from Eq. (4).
The m/ω term is interesting. It means that m has to be greater than ω to
have any physical significance. If we choose a linear relationship for m =
bω, (b is a constant), it means that b must be greater than 1. Literature data
suggests b is about 15. Also, if (as the data suggests), m = bω+ c, then the
only requirement is that c>ω, or b>1. In reality, this constraint is easily
met.
A constraint that is not as easily met is the constraint that the active layer
depth d must be less than the bed depth H, where H = R - h. This constraint
can be represented by
d(x=0) < R – h ( 8)
Substituting Eqn. (6) for maximum active layer thickness at x = 0, we can
show that this constraint simplifies to
H
Rm 2>ω
( 9)
The relationship between m and ω has been measured by Boateng & Barr
(1997). They measured particle velocities at various depths using an
optical probe. Their measurements indicate that for a given material and
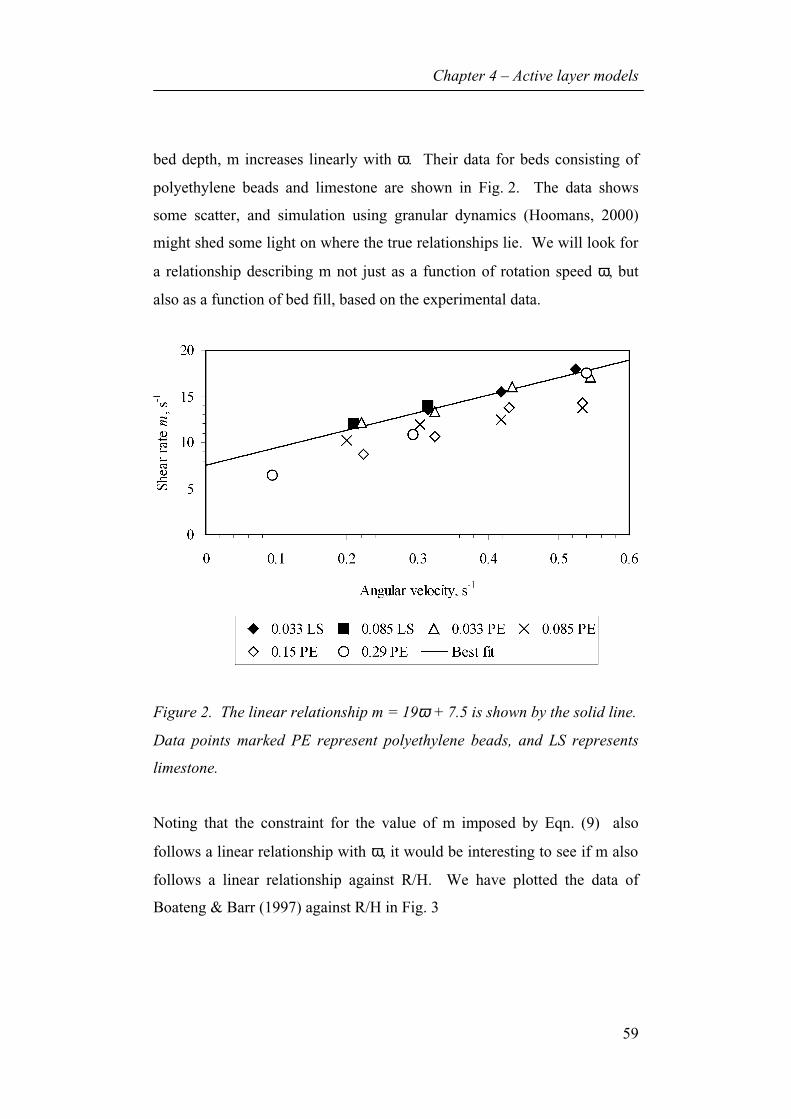
Chapter 4 – Active layer models
59
bed depth, m increases linearly with ω. Their data for beds consisting of
polyethylene beads and limestone are shown in Fig. 2. The data shows
some scatter, and simulation using granular dynamics (Hoomans, 2000)
might shed some light on where the true relationships lie. We will look for
a relationship describing m not just as a function of rotation speed ω, but
also as a function of bed fill, based on the experimental data.
Figure 2. The linear relationship m = 19ω + 7.5 is shown by the solid line.
Data points marked PE represent polyethylene beads, and LS represents
limestone.
Noting that the constraint for the value of m imposed by Eqn. (9) also
follows a linear relationship with ω, it would be interesting to see if m also
follows a linear relationship against R/H. We have plotted the data of
Boateng & Barr (1997) against R/H in Fig. 3

Chapter 4 – Active layer models
60
Figure 3. Shear stress m shown as a function of R/H for polyethylene
particles. - -¯- - 5 rpm ««««r«««« 3 rpm o 2 rpm
The data appears to correlate reasonably well with R/H, indicating that the
shear stress is indeed dependent on R/H. In fact for shallower beds (high
R/H), there appears to be a linear relationship, and the slope of the lines
correlates well with the slope of 2ω suggested by the criterion of Eqn. (9).
In fact, a suggested relationship for small bed depths
cH
Rm += ω2 ( 10)
is shown on Fig.3, with c = 9.5 s-1
. This model fits the data for R/H > 3
very well. The intercept is apparently independent of rotation speed, and
represents the shear stress that will result from particles sliding down the
surface of an inclined chute with an infinitely deep bed, and will depend on
particle characteristics only. In this case, one can expect a layer of finite
thickness, and constant m as flow increases – i.e. bed depth proportional to
flow rate of particles.

Chapter 4 – Active layer models
61
Noting from the data of Boateng & Barr (1997) that a typical value for
shear stress m/ω is 10, we conclude that the constraint (Eqn. 9) will become
important when R/H < 5. In terms of bed fill, it means that for bed fill less
than 5.2%, m must be larger than the narrow range expected from the data
shown in Fig. 2.
A further implication of the bed height expression, Eqn. (7), is that
ωω−
∝m
d . Substituting for m using Eqn. (10),
( ) 5.91/2 +−∝ ωω HRd . This means that at low rotation speeds,
d ∝ ω0.5. As rotation speed increases, d becomes less dependent on rotation
speed.
Our model does not predict the shear stress well at lower R/H values (fuller
beds). In this case, geometric constraints and perhaps centrifugal forces
may affect the shear stress profile.
Substituting Eqn. (10) into Eqn. (7), we can determine the shape of the
active layer at any point in the active layer, at any given kiln rotation speed.
The active layer profile predicted by this model for various bed depths and
rotation speeds is shown in Fig. 4.

Chapter 4 – Active layer models
62
Figure 4. Active layer profile is an elliptical shape, shown here for H/R
values of 0.2, 0.5 and 0.8. The depth of the active layer does not increase
linearly with rotation speed (ω=0,1 s-1 dotted and ω=0,2 s-1 dash shown).
Heinen et. al. (1983) have published a good deal of data showing observed
active layer thickness as a function of bed depth and rotation speed. Fig. 5
shows how the measured data at the deepest part of the active layer
compares with our model for predicting bed depth (at x = 0).

Chapter 4 – Active layer models
63
Figure 5. Our model predicts a deeper active layer than visually measured
data at x = 0, probably due to wall effects that were confirmed by Boateng
& Barr (1997).
Some of the scatter in the data can be attributed to the fact that Heinen et.
al. (1983) reported rotation speeds within limits, rather than the exact
values. We used the average values within those limits.
2.2 The volume of the active layer
In some cases, it is useful to know the volume of the active layer, and
Jauhari et. al. (1998) presented a model for predicting mass transfer rates
based on the volume of the active layer. To calculate the volume of the
active layer, it is useful to show that, using our model, the shape of the
active layer is described by an ellipse with the central axis located on the
bed surface.

Chapter 4 – Active layer models
64
An ellipse (Fig. 6) is described by
1)(
2
2
2
2
=+−a
x
b
cy ( 11)
Figure 6. Definition of parameters describing an ellipse.
We would like to rewrite the expression for active layer depth in the form
shown in Eqn. (11).
22221 hxRd
m −−=
−
ω ( 12)
Substitute for d2 using the relationship y = - d – h
222
2
1
)(hRx
m
hy −=+−
+ω
( 13)
( )( ) 11
)(22
2
22
2
=−
+−−
+hR
x
hRm
hy
ω ( 14)

Chapter 4 – Active layer models
65
Writing in terms of the dimensions of Fig (6),
22 hRa −=
122 −−= ωmhRb
hc −=
Because the axis of the ellipse lies along the surface of the bed, the area of
the active layer is half of the area of the ellipse. Therefore the volume of
the active layer is
( )
122
22
−−=⋅=
ωππ
m
hRLLabVal ( 15)
Consider the points on the ellipse where y = h. The slope of the tangent =
∞ for all h. Because the slope of the wall is finite for h < 0, it implies that
there is always a point where the active layer theoretically extends beyond
the bed (for h < 0, all m/ω). For practical purposes, this is usually
insignificant, and should not detract from the usefulness of the model.
3. DISPERSION WITHIN THE ACTIVE
LAYER
As particles slide over each other, the size of inter-particle voids changes.
This gas moves to adjoining voids, where it mixes with gas at another
concentration, assuming that a concentration gradient exists. Consider
Figure 7, where successive layers of particles are separated by a distance
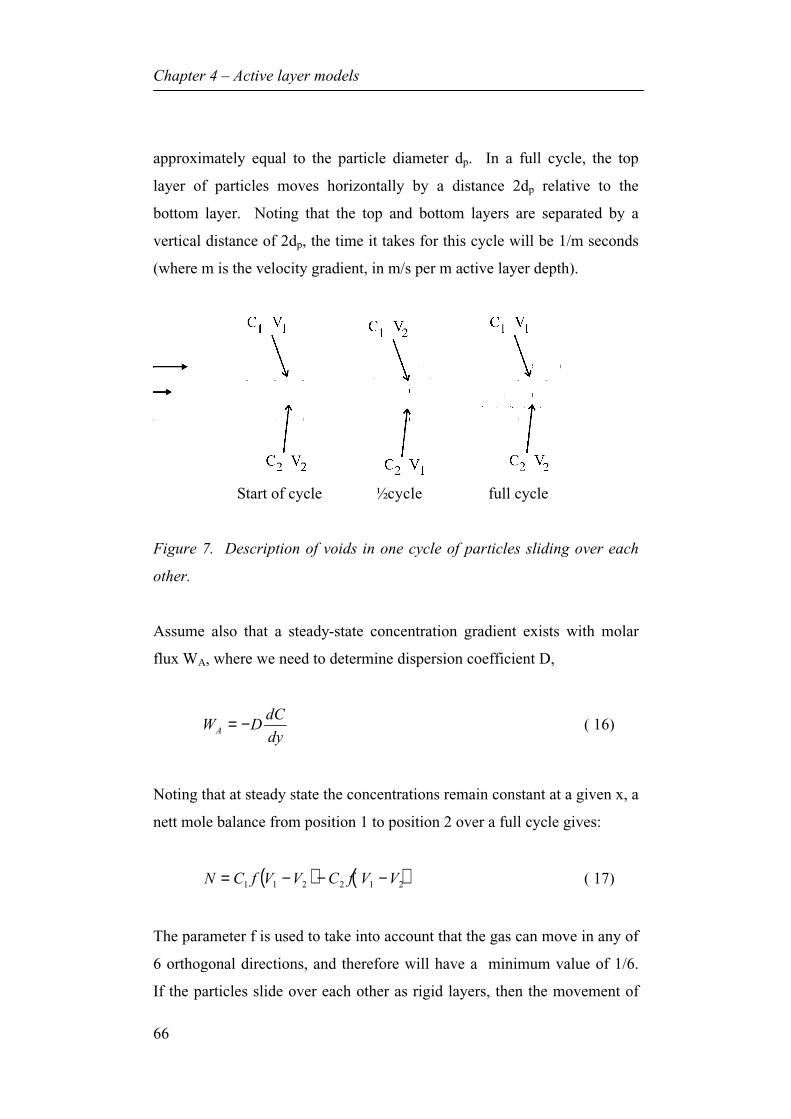
Chapter 4 – Active layer models
66
approximately equal to the particle diameter dp. In a full cycle, the top
layer of particles moves horizontally by a distance 2dp relative to the
bottom layer. Noting that the top and bottom layers are separated by a
vertical distance of 2dp, the time it takes for this cycle will be 1/m seconds
(where m is the velocity gradient, in m/s per m active layer depth).
Start of cycle ½ cycle full cycle
Figure 7. Description of voids in one cycle of particles sliding over each
other.
Assume also that a steady-state concentration gradient exists with molar
flux WA, where we need to determine dispersion coefficient D,
dy
dCDWA −= ( 16)
Noting that at steady state the concentrations remain constant at a given x, a
nett mole balance from position 1 to position 2 over a full cycle gives:
( ) ( )212211
VVfCVVfCN −−−= ( 17)
The parameter f is used to take into account that the gas can move in any of
6 orthogonal directions, and therefore will have a minimum value of 1/6.
If the particles slide over each other as rigid layers, then the movement of

Chapter 4 – Active layer models
67
the gas will primarily be in the y-direction (perpendicular to the bed
surface), and f could have a value as large as ½. We will use f = 1/6 as our
default value.
Substitute α = V2/V1 – this will later be estimated from the change of
voidage from a loosely packed solid to a tightly packed solid.
))(1(211
CCfVN −−= α ( 18)
The time required for one cycle is 1/m. It follows then that the molar flow
rate FA = Nm, and from the definition of molar flux WA, WA = FA/A.
))(1(21
1 CCA
mfVWA −−= α ( 19)
pp d
A
Ad
A
V1
11 εε
== (ε1 is voidage for loose-packed solid.) ( 20)
))(1(211
CCmfdW pA −−= αε ( 21)
pd
CC
dy
dC 21−
= ( 22)
D is determined by dividing Eqn. (21) by Eqn. (22):
)1(1
2 αε −= mfdD p ( 23)
α can be determined from the ratio of the voidage of loosely packed
spheres vs tightly packed spheres.

Chapter 4 – Active layer models
68
11
111
1
1−=⇒
+=
εε
V
V
VV
V S
S
( 24)
1
2
2
1
2
1
1
2
1
1
11
11
εε
εε
ε
εα
−−
=−
−==
V
V ( 25)
For loose-packed spheres, 1 - ε1 = π/6
ε1 = 0,4764
For tight-packed spheres,
ε2 = 0,32
2
246.0 pfmdD = ( 26)
The effect of binary diffusion must be adjusted to take account of the
reduced area for diffusion due to the solid particles, and the tortuosity of
the path. This diffusion contribution De is commonly estimated by De =
ε2Da. The overall dispersion coefficient for the active layer Dal will be the
sum of D and De:
Dal = 0.246fm dp2 + ε2Da ( 27)
4. CONCENTRATION PROFILES AND
MASS TRANSFER
Having established the dispersion coefficient applicable to the active layer,
we now need to establish the concentration profile that exists within the
active layer in order to predict mass transfer. For the purposes of this
paper, we will assume that the gas is fully depleted at the boundary of the

Chapter 4 – Active layer models
69
active and passive layers. If the thickness of the layer containing
undepleted gas is much smaller than the width of the bed surface, then wall
effects can be neglected, and we have the situation of gas dispersion and
reaction in a flat plate. This analysis has already been done by Thiele
(1937) for diffusion in a catalyst.
Thiele (1937) showed that the concentration profile in a flat plate can be
determined (using our notation) as
φφ
λφλφ
−
−
++=Ψ
ee
ee, where
alD
kd
εφ = ( 28)
and the effectiveness factor is then
φ
φη )tanh(= ( 29)
The above equations (28) and (29) are valid for d being measured from the
catalyst surface to the center of the plate, where there is no flux at the
center due to symmetry. In our case, we have assumed more stringent
conditions, needing to assume that there is no flux at the bottom of the
active layer due to depletion of the gas (we do not have symmetry). In this
case, Eq. (29) reduces to
η = 1/φ ( 30)
For this model, with reaction only occurring at the surface of the bed, we
will find it convenient to express the reaction rate for the system in terms of
a mass transfer coefficient at the bed surface ks:

Chapter 4 – Active layer models
70
alsAsAs
V
A VkCACkdVPal
⋅==∫ ,,ηε ( 31)
Neglecting end effects, d = Val/A. Then we can rewrite Eqn. (31) in terms
of ks, and substitute Eqn. (29) to get
kDkdk als εηε == ( 32)
The rate constant εk can be calculated (Heydenrych et. al. 2001) using
2
)1(6
p
a
d
DShk
⋅−=
εε , Sh = 3.8 ( 33)
5. MODEL VALIDATION
Jauhari et. al. (1998) reported their mass transfer coefficients as ksA,
enabling us to make a direct comparison of our model with their results, by
multiplying Eqn. (33) by bed surface area A. We note that the results of
Jauhari et. al. (1998), measured at a bed fill of 4.3%, are substantially
proportional to rotation speed (Fig. 8), whereas our model predicts a much
smaller dependency on rotation speed, although the predicted values are in
the correct range.

Chapter 4 – Active layer models
71
Figure 8. Our model does not correctly predict the linearity of ksA with
rotation speed, but predicts values in the correct order of magnitude.
f = 1/6, dp = 3 mm.
The very small dependency of m on rotation speed (using Eqn. (10) to
estimate m, with c = 9.5 s-1
), results in a similarly low dependency of Dal on
rotation speed. Using Eqn. (33) we calculated εk = 8.36 s-1
.
Clearly, this model does not accurately predict mass transfer rates for the
conditions used by Jauhari et. al. (1998). There may be two reasons for
this. The first is that mass transfer at the top surface of the bed, where the
freeboard gas slip velocity becomes important, has not been taken into
account in this model. In their measurements, Jauhari et. al. (1998)
operated under the constraint that the superficial axial gas velocity was less
than the drum wall velocity. This could lead to particularly low slip
velocities on the outer surface of the bed at the slower rotation speeds. This
could lead to the lower than expected mass transfer rates that were
measured at rotation speeds lower than 1 rpm.
The second possible reason for deviation from our model could be due to
the nature of the movement of particles in the active layer. Our model
Chapter 4 – Active layer models
72
assumes that the particles slide over each other, creating and destroying
voids in an orderly fashion. Boateng and Barr (1997) have measured the
granular temperature of particles in the active layer: a term that describes
the random movement of particles due to collisions within the active layer.
The frequency of these collisions may be much higher than the frequency
predicted by our model. Moreover, the granular temperature measured by
Boateng and Barr (1997) is dependent on depth (d) within the active layer,
which means that Dal changes with bed depth, giving a different
dependency of ksA on rotation speed. It may also affect the mass transfer
resistance at the surface of the bed.
6. DISCUSSION AND CONCLUSIONS
A relatively simple model has been derived to predict bed depth and the
surface velocity of particles, based on the assumption that the shear stress
in the active layer is constant for a given bed depth and rotation speed.
A correlation was presented to predict the shear stress within the active
layer as a function of bed depth and rotation speed, m = 2(R/H)ω + c. The
constant c is expected to depend on the properties of the bed material; data
for polyethylene beads gives c = 9.5 s-1
.
By examining the effect of particles sliding over each other within the
active layer, where void spaces are filled and formed again, a correlation
was established for prediction of the effective dispersion coefficient Dal.
Our model predicts that as long as the reactant does not occur deeper than
the active layer in significant concentrations, the mass transfer coefficient
for the bed surface can be calculated as kDk als ε= .

Chapter 4 – Active layer models
73
These attempts to fundamentally predict the mass transfer coefficient were
not successful, based on the data measured by Jauhari et. al. (1998). The
most probable reason for the poor correlation of our model with experiment
was the fact that neither bed surface effects nor the granular temperature of
the bed material were considered in the determination of the effective
dispersion coefficient De. Future work should be directed at a means of
predicting ksA based on granular temperatures within the active layer.

Chapter 4 – Active layer models
74
SYMBOLS
A bed surface area, m2
a, b, c symbols used to describe an ellipse (Fig. 6)
CA gas-phase concentration, mol m-3
CA0 gas-phase concentration at t = 0, mol m-3
CA,s gas-phase concentration at the bed surface. mol m-3
d active layer depth, m
D binary diffusion coefficient, m2 s
-1
Dal total dispersion coefficient for the active layer, m2 s
-1
h perpendicular distance from radial center of the kiln to the bed
surface, m
H bed depth at the deepest point (H = R-h), m
k gas-phase reaction constant, s-1
k’ gas-phase reaction constant for use in active layer, s-1
ks mass transfer coefficient, m s-1
L axial distance, m
m shear stress in the active layer (velocity gradient of particles) s-1
PA reaction rate, mol s-1
m-3
Q volumetric flow rate, m3 s
-1
R kiln radius, m
V volume, m3
f factor for the directionality of dispersion, 2
1
6
1 << f
W molar flux, mol s-1

Chapter 4 – Active layer models
75
Greek letters
η effectiveness factor, dimensionless
ε bed voidage, dimensionless
λ dimensionless distance; depth below bed surface/active layer depth
φ thiele modulus, dimensionless
ψ concentration, dimensionless
REFERENCES
Boateng, A.A. & Barr, P.V., (1997), ‘Granular flow behaviour in the
transverse plane of a partially filled rotating cylinder, J. Fluid Mech., 330,
233-249
Heydenrych, M.D., Greeff, P., Heesink, A.B.M., Versteeg, G.F., (2001),
‘Mass transfer in rolling rotary kilns: A novel approach’, Submitted to
Chem. Eng. Sci, 2001.
Heydenrych, M.D., Schieke, J., Heesink, A.B.M., Kuipers, J.A.M. (2001),
‘Diffusion effects in rotating rotary kilns’, Accepted for publication at the
6th
World Congress of Chemical Engineering, Melbourne, 2001.
Heinen, H., Brimacombe, J.K., & Watkinson, A.P. (1983a). Experimental
study of transverse bed motion in rotary kilns, Metall. Trans., 14B, 1983,
191-205
Hoomans, B.P.B. (2000), ‘Granular dynamics of gas-solid two-phase
flows’, Doctoral thesis, University of Twente.

Chapter 4 – Active layer models
76
Jauhari, R., Gray, M.R., & Masliya, J.H. (1988). Gas-solid mass transfer in
a rotating drum, Can. J. Chem. Eng, 76, 224-232.
Kramers, H., & Crookewit, P. (1952). The passage of granular solids
through inclined rotary kilns. Chemical Engineering Science, 1, 259
Lebas, E.F., Hanrot, F., Ablitzer, D. & Houzelot, J.L. (1995).
“Experimental study of residence time, particle movement and bed depth
profile in rotary kilns”, Can. J. Chem. Eng, 73, 173-179.
Saeman, WC, “Passage of solids through rotary kilns”, Chem. Eng. Prog.,
47, 1951, 508-514.
Sullivan, J.D., Maier, C.G., & Ralston, O.C., (1927). Passage of solid
particles through rotary cylindrical kilns. US Bureau of Mines, Technical
Papers 384, 1-42
Tscheng, S.H. and Watkinson, A.P., (1979). Convective heat transfer in a
Rotary Kiln. Can. J. Chem. Eng., 57, 433-443.

Chapter 5 – Combined model
77
Chapter 5 - A combined mass transfer
model for both active and passive layers in
rolling rotary kilns
ABSTRACT
A mass transfer model for rotary kilns that incorporates both the active and
passive layer concentrations, is applicable over a wide range of rates.
Dispersion effects are included in the active layer model, and convection
(gas entrainment) effects are included in the passive layer model. At high
k/ω, it is not sufficient to use the contribution of the active layer alone. Gas
entrained into the passive layer at the wall of the kiln makes an important
contribution to mass transfer. At low k/ω, the passive layer model alone
can be used only for deep beds and low Thiele modulus φ, otherwise the
combined model is recommended.
By making two assumptions: 1) that molecular diffusion is unimportant
compared to dispersion, and 2) that the particle velocity profile in the active
layer (m) is proportional to rotation speed, then the effectiveness factor for
the bed is dependent on k/ω, h/R and R/dp. Of these, only R/dp is dependent
on the scale of the kiln.

Chapter 5 – Combined model
78
1. INTRODUCTION
In rolling rotary kilns, there are two distinct regions within the bed: the
passive layer, where particles are transported concentrically with the kiln
until they reach a point near the surface of the bed, and the active layer,
where these particles cascade down the surface of the bed. It has
previously been assumed that the active layer is the most important area for
mass or heat transfer. Heydenrych et. al. (2001a) have shown that for
slower reactions (or drying), mass transfer in the passive layer can also play
an important role. In this paper, we explore the transition from mass
transfer domination in the active layer, to kinetic domination in the passive
layer.
Figure 1. The regions found in a rotary kiln.
The work of Heydenrych et. al. (2001a) explores how gas entrapped in the
voids between particles in the active layer, gets depleted as it moves
concentrically in plug flow through the passive layer with the particles.

Chapter 5 – Combined model
79
They used an effectiveness factor to characterise the radial concentration
profile, and a gas-phase volumetric rate constant to include mass transfer
limitation, for example, for 1st order processes:
-PA = ηεkCA (1)
By rewriting Eqn. (1) in terms of dimensionless units, they showed that the
effectiveness factor depends only on k/ω and the bed fill. In later work
(Heydenrych et. al. 2001b), the effect of diffusion within the passive layer
was investigated. They showed that diffusion effects in the passive layer
are unimportant for slower reactions (k/ω < 1), but importantly, they also
showed that an additional dimensionless number must be used to describe
mass transfer in faster reactions when diffusion effects are to be taken into
account. This can either be a Thiele modulus, or (as they chose), a Peclet
number, defined as
eD
RPe
2εω= (2)
Jauhari et. al. (1998) have measured mass transfer rates for the drying of
relatively small silica-alumina particles soaked with decane. These results
gave far greater mass transfer rates than the passive layer model
(Heydenrych et. al. 2001a) predicts. Jauhari et. al. (1998) used an
empirical model based on the volume of the active layer to predict mass
transfer as a function of rotation speed.
Heydenrych et. al. (2001c) developed a more fundamental model to predict
the shape and volume of the active layer. This model was largely based on
the assumption that the velocity gradient (m) of particles within the active
layer is constant at any point within the active layer, given a set of

Chapter 5 – Combined model
80
conditions such as bed depth and rotation speed. They predicted that bed
depth could be described by
1/
222
−−−=
ωm
hxRd (3)
This model was further extended to predict the dispersion coefficient in the
active layer caused by the change of void volumes that mix the gas as
particles slide over each other. If successive layers of particles in the active
layer move as rigid layers, then the dispersion of gas will occur
predominantly in the direction perpendicular to the surface of the bed, and
the volume of gas dispersed in this way can be calculated from the
difference in voidage of a loose-packed structure and a tight-packed
structure. Using these assumptions, they derived the following expression
to calculate dispersion in the active layer:
Dal = 0.123 m dp2 + ε2Da ( 4)
They further showed that a relatively simple 1-dimensional model could be
derived to predict the concentration gradients in the active layer in the case
of fast reactions (k/ω > 10), giving rise to a correlation for a mass transfer
coefficient for the surface of the bed:
kDk als ε= ( 5)
Using published data to predict the change of the velocity gradient m with
rotation speed, they showed that the model represented by equations (3), (4)
and (5) is inadequate for predicting the mass transfer rates measured by
Jauhari et. al. (1998). In this paper, we would like to adapt the fundamental
approach adopted by Heydenrych et. al. (2001c) to one that better predicts

Chapter 5 – Combined model
81
the measured data of Jauhari et. al. (1998), for use as a design tool for
rotary kilns and applicable to reaction rates that cover a large range. As a
design tool, we need a model that is relatively easy to use, and some
simplifying assumptions will be made so that the model can easily be
solved on a spreadsheet.
2. COMBINED MODEL
We continue with the approach of Heydenrych et. al. (2001a), but we now
explore whether the rate constant k from Eqn. (5) is affected by the
continuous mixing of gas as the layers of particles slide over each other.
On the basis of Sørensen & Stewart (1974) the “rate constant” describing
the rate of evaporation of gas from the surface of wet particles in a stagnant
packed bed can be formulated:
ε
ε−= 162
p
a
d
ShDk , Sh = 3.8 (6)
Heydenrych et. al. (2001a) have shown that estimation of k using Eqn. (6)
works well to predict the slow rate of evaporation from relatively large
particles in the passive layer of rotary kilns, where there is a batch-wise
saturation of gas in the voids as the gas rotates with the kiln. The gas
concentration in the voids changes according to
( )dt
dCCCk A
Asat =− (7)

Chapter 5 – Combined model
82
Integrating Eqn. (7),
kt
Asat
Asat eCC
CC −=−−
0
(8)
In the active layer, the same process can be expected to occur, except that
at regular intervals, the gas volume is flushed out with fresh gas. The
frequency of this cycle is given by the shear rate m, and therefore, time (t)
in Eqn. (8) is the inverse of m.
We wish to determine the rate of generation within a control volume V in
the active layer:
( ) ( )( ) dVmeCCdVmCtCdVP mkAsatAAA εε /
001)(
−−−=−= (9)
Replacing the generation term PA with a more conventional rate expression,
as we have used in previous work,
( ) ( )( ) mdVeCCdVCCk mkAsatAsat εε /
001'
−−−=− (10)
( )mkemk /1'
−−= (11)
Lastly, we assume an alternative correlation to describe the relationship of
m with rotation speed. This is essentially an empirical correlation, chosen
to reflect the mass transfer rates measured by Jauhari et. al. (1998):
m = 70ω (12)
It is interesting to note that by substituting m in Eqn. (12) into Eqn. (3), we
find that the shape and volume of the active layer is not dependent on

Chapter 5 – Combined model
83
rotation speed. Fig. 2 shows how this model predicts the maximum active
layer depth (x = 0) compared to the maximum active layer depths that were
measured for various materials and drum sizes, and reported by Heinen et.
al. (1983). For each material type, the active layer depth was measured at a
range of rotation speeds.
Figure 2. Surprisingly, relatively the steep particle velocity gradient of
Eqn. (12) predicts deeper active layer depths than those measured visually.
Using this correlation for m and replacing k with k′ of Eqn. (11), we predict
the mass transfer rates measured by Jauhari et. al. (1998) as follows:

Chapter 5 – Combined model
84
Figure 3: By using m = 70ω and ( )mkemk /1'
−−= we can reasonably
predict measured mass transfer rates from 'kDk als ε= . The data of
Jauhari et. al. (1998) is represented by ¿, and the line represents model predictions.
Within the active layer, we predict concentration profiles at the deepest part
(x = 0), and assume that at any other part of the bed (x ≠ 0) the same
concentrations will be found at a given depth y from the surface. The
dimensionless concentration is estimated as:
φφ
λφλφλ−
−
++==Ψ
ee
ee
C
C
A
A
0
)(, where
alD
kd
'max
εφ = (13)
Heydenrych et. al. (2001b) have shown that k/ω and either Pe or φ can be
used to describe concentration profiles in a rotary kiln. In this case, we
prefer to use φ because we have assumed that all diffusion effects take
place in the active layer. When binary diffusion is negligible, we can have
Dal = 0.123 m dp2 (14)

Chapter 5 – Combined model
85
We can now determine φ from Eqn. (13) by substituting for dmax using
Eqn. (3), Dal using Eqn. (14), k′ using Eqn. (11) and finally m using
Eqn. (11):
−
−=
− 2
70
1
1172.9R
he
d
Rk
p
ωεφ (15)
This reduces the model to the same dimensionless numbers that were
introduced by Heydenrych et. al. (2001a), but with the addition of the third
term R/dp. This is the only term that takes dispersion (and therefore scale-
up effects) into account, bearing in mind that Eqn. (15) is only valid when
dispersion effects are much greater than molecular diffusion.
We will solve the model using the Thiele modulus φ as the third
independent variable (rather than R/dp), because it increases the validity of
the simulation results: it is possible to include binary diffusion effects, or to
use any other model to determine the Thiele modulus φ.
The active layer model described above predicts the concentrations that
occur at the interface between the active and passive layers of a rotary kiln.
We use these concentrations as the starting concentrations for the gas as it
moves concentrically around the kiln in the passive layer, getting depleted
as it moves as it would in a plug flow reactor. This is similar to the model
described by Heydenrych et. al. (2001a), except that the surface boundary
is not flat, but in the shape of the active layer interface, and the starting
concentrations vary along the boundary. This is not easily solved
analytically, but it can be quite easily solved numerically.
Both the active layer model and the concentric flow model described above
give a concentration profile over the radial cross-section of the bed. The

Chapter 5 – Combined model
86
effectiveness factor for a bed area (active or passive layer) is found by
integrating the dimensionless concentrations over that area as described by
Heydenrych et. al. (2001b):
al
alAal A
dA∫= )(
ψη and
pl
plApl A
dA∫= )(
ψη with
0A
A
C
C=ψ (16)
We use the same CA0 for both the active and passive layers; CA0 is the
freeboard gas concentration. We need to calculate the effectiveness of the
active layer ηal separately from the effectiveness of the passive layer ηpl in
order to get an overall effectiveness factor η, defined in terms of k.
plplalalbed kAAkkA εηεηηε += ' (17)
bed
plpl
bed
alal A
A
A
A
k
k ηηη += ' (18)
The term k′/k is determined by substituting m (Eqn. 12) in Eqn. (11):
−=
−ωω
70170'
k
ekk
k (19)
Note that k′/k is only a function of k/ω. Therefore the model for predicting
the dependent variable η is a function of three independent variables (we
consider ε as a constant): k/ω, h/R and φ. We could replace φ with R/dp
using Eqn. (15), but then the results we show would be limited to the model
represented by Eqn. (15), so we have chosen φ.

Chapter 5 – Combined model
87
3. MODEL PREDICTIONS
A contour plot of the concentrations found using the model developed here
is shown in Fig. 4, where h/R = 0.5 and k/ω = 1 for a clockwise rotating
kiln. This shows the continuity of concentrations on the right hand side
active/passive layer interface, where the gas moves into the bed. On the
left hand side of Fig. 4, there is a very steep concentration gradient, which
is unlikely to occur in practice due to diffusion effects there, and the
transport of depleted gas from the active/passive layer interface into the
active layer. We expect, from the findings of Heydenrych et. al. (2001b,c),
that the diffusion effects in the active layer will predominate over the
transport effects in the passive layer. If this is the case, then the model
should be a reasonable indication of what happens in practice.
Figure 4. A contour plot of dimensionless concentrations using the
combined active/passive layer model with h/R = 0.5 and k/ω = 1.
Note how we find a high concentration at the wall of the kiln, because at
the wall, the active layer depth is very small, and gas enters the concentric
region at almost the maximum concentration.
Effectiveness factors at various φ are shown as a function of k/ω in Fig. 4.

Chapter 5 – Combined model
88
Figure 5. Effectiveness factors at various φ for a bed fill of 37% (h = 0.2).
The thick line represents the passive layer model (Heydenrych et. al.
2001a).
Not surprisingly, for larger kilns (larger φ) we always have a lower
effectiveness factor. It is interesting to note that the active layer does not
simply add to the mass transfer predicted by the passive layer model
(Heydenrych et. al. 2001a), but predicts lower values than that model. This
is due to the depletion of gas within the active layer, effectively blocking
reactive gas from entering the passive layer.
Fig. 6 shows lines of constant R/dp. These are useful because typically we
find that k varies along the length of a kiln as the solid dries (intraparticle
diffusion limiting) or as the solid material becomes converted, in the case
of reaction. This means that φ is not constant along the length of a kiln, and
as reaction proceeds, we move from right to left on Figure 3 along a line of
constant R/dp.
φ = 0.1 and 0.3
φ = 1
φ = 10
φ = 30
φ = 3

Chapter 5 – Combined model
89
Figure 6. Lines of constant R/dp are useful because typically R/dp remains
constant over the length of a rotary kiln.
Fig. 7 shows a similar plot to Fig. 5, but with a shallow bed, with bed fill of
5.2% (h = 0.8). The trends are similar, but the effectiveness factor here is
less dependent on k/ω because of the increased ratio of bed surface area
(active layer) to bed volume. Here, the passive layer model of Heydenrych
et. al. (2001a) is poor at predicting the shape of the curves, and cannot be
used even for slow reactions. As bed fill decreases, the active layer volume
increases relative to the passive layer volume. Therefore, even with slow
reactions (low k/ω), the active layer predominates and we do not benefit
fully from the entrainment effect of the passive layer as it draws gases into
the bed.
R/dp = 10
R/dp = 100
R/dp = 1000
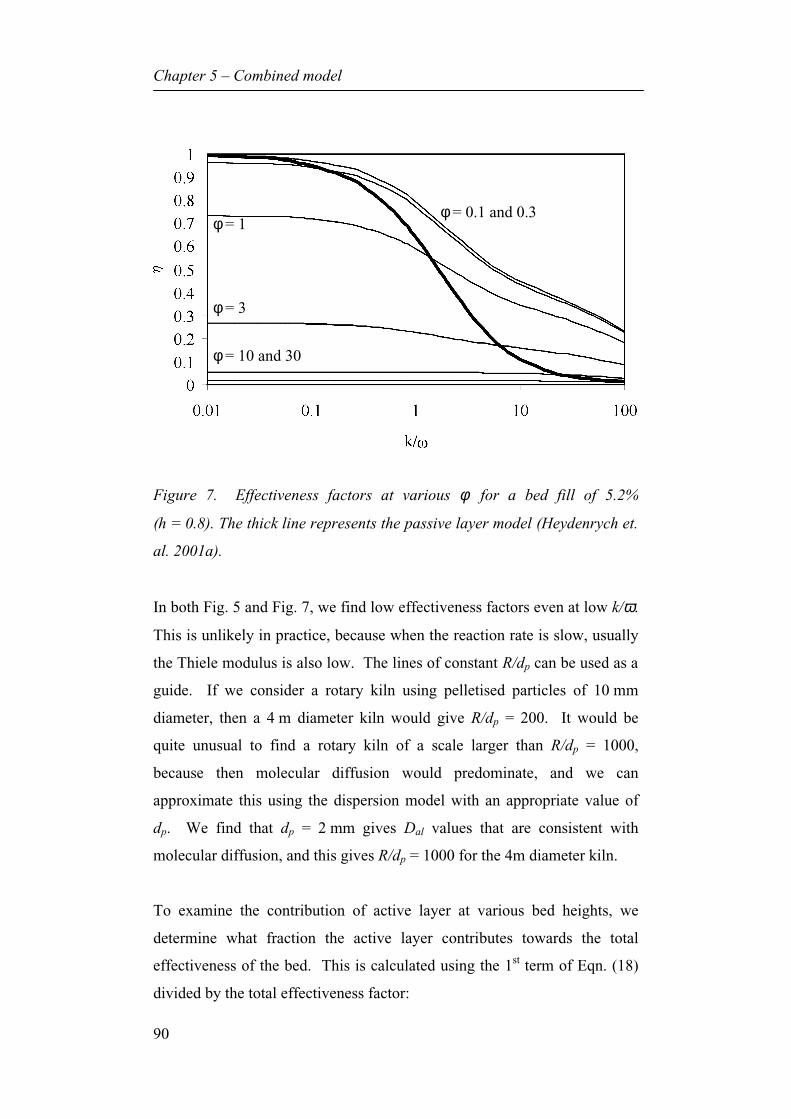
Chapter 5 – Combined model
90
Figure 7. Effectiveness factors at various φ for a bed fill of 5.2%
(h = 0.8). The thick line represents the passive layer model (Heydenrych et.
al. 2001a).
In both Fig. 5 and Fig. 7, we find low effectiveness factors even at low k/ω.
This is unlikely in practice, because when the reaction rate is slow, usually
the Thiele modulus is also low. The lines of constant R/dp can be used as a
guide. If we consider a rotary kiln using pelletised particles of 10 mm
diameter, then a 4 m diameter kiln would give R/dp = 200. It would be
quite unusual to find a rotary kiln of a scale larger than R/dp = 1000,
because then molecular diffusion would predominate, and we can
approximate this using the dispersion model with an appropriate value of
dp. We find that dp = 2 mm gives Dal values that are consistent with
molecular diffusion, and this gives R/dp = 1000 for the 4m diameter kiln.
To examine the contribution of active layer at various bed heights, we
determine what fraction the active layer contributes towards the total
effectiveness of the bed. This is calculated using the 1st term of Eqn. (18)
divided by the total effectiveness factor:
φ = 0.1 and 0.3 φ = 1
φ = 3
φ = 10 and 30

Chapter 5 – Combined model
91
η
ηbed
alal
al
A
A
k
k
f
'
= (20)
Fig. 8 shows for φ = 3 how the active layer is always more important for
shallower beds. It is also interesting to note that for deep beds, the passive
layer continues to play a significant part in mass transfer even at high
reaction rates.
Figure 8. The contribution of the active layer is always more for shallower
beds (φ = 3). From top to bottom, curves show bed fills of 5.2%, 9.4%,
14%, 20%, 25%, 31% and 37%, corresponding to h = 0.8, 0.7, 0.6, 0.5,
0.4, 0.3 and 0.2.
The fraction contributable to the active layer does not approach unity for a
combination of two reasons. The first is that even for fast reactions that
occur very close to the surface of the bed, there is always an appreciable
amount of gas that moves into the passive layer at the wall of the kiln,
where the depth of the active layer tends to zero. The second effect is that
Bed fill 5.2%
Bed fill 37%

Chapter 5 – Combined model
92
the weighting due to the term k′/k comes into play, lessening the active
layer contribution. For k/ω = 100, for instance, k′/k = 0.23.
Noting that we typically get higher effectiveness factors using shallower
beds, and that commercially operated kilns typically use shallow beds, it
would be interesting to see if there is a maximum mass transfer that can be
achieved for a given kiln radius. Fig. 9 shows an effectiveness factor based
on total volume, rather than the bed volume that the previous effectiveness
factor was based on. We see that there may be a maximum at the highest
reaction rates (k/ω = 100), but in general, a deeper kiln gives better mass
transfer.
Figure 9. For fast reactions, it is possible to get an optimum bed fill, but in
most cases better mass transfer will be obtained with a deeper bed.
k/ω = 100
k/ω = 0.01, 0.1
k/ω = 10
k/ω = 1

Chapter 5 – Combined model
93
Figure 10. Active layer contribution for a deep bed (fill 37%) does not
change much as dispersion increases. φ (top to bottom) = 0.1, 0.3, 1, 3
and 10.
Figure 11. Active layer contribution for shallow beds (fill = 5.2%) is
highest for the larger kilns.
φ = 0.1 - 1
φ = 0.1 and 0.3
φ = 1
φ = 10
φ = 3
φ = 10

Chapter 5 – Combined model
94
For a shallow bed, we see a reversal in the order (Fig. 11), and we find that
the active layer contribution becomes increasingly important as φ increases.
4. COMPARISON WITH MEASURED DATA
Applying the combined model to Jauhari’s data (Fig. 12) gives small but
significant changes to the active layer model that was fitted using
Eqn. (12).
Figure 12. The combined model ⋅⋅⋅⋅⋅⋅⋅⋅⋅ predicts improved mass transfer
rates at the higher rotation speeds compared to the active layer model
. Jauhari’s data is represented by ♦.
The increase in the slope of the line predicted by the combined model is
due to two effects: Firstly, at lower rotation speeds, dispersion is low, and
the omission of binary diffusion from the model results in the prediction of
lower mass transfer rates. The second effect is the additional effect of the
passive layer. Figure 11 shows that for shallow beds, even at high k/ω,
there is still a significant contribution by the passive layer that the active
layer model does not account for.

Chapter 5 – Combined model
95
The data of Heydenrych et. al. (2001a) is shown in Fig. 13 against their
passive layer model (thick line) and the combined model (thin line), using
R/dp = 4.7. Although the scatter of the data does not allow definite
conclusions to be made, it appears that the combined model fits the data
better than the passive model alone.
Figure 13. The combined model (thin line) fits the data of Heydenrych et.
al. (2001a) somewhat better than the passive layer model (thick line).
5. CONCLUSIONS
In attempting to simplify the relationship for the velocity gradient in the
active layer to m = 70ω, we arrive at some useful relationships that provide
insight into the scale-up of rotary kilns. In particular, we showed that the
dimensionless number R/dp describes the dispersion effect within a rotary
kiln, and therefore it is the parameter that is important for scaling of rotary
kilns.

Chapter 5 – Combined model
96
Practically, we find a large range of R/dp in rotary kilns. An active layer
layer model that calculates the mass transfer coefficient ks at the surface of
the kiln can be used when the fraction contribution of the active layer is
high. In many cases, this is not true, and the combined model presented
here should be used. Also, the passive layer model used alone will in most
cases incorrectly predict the mass transfer, having a totally different form
(as a function of k/ω) to that predicted by the combined model.
It would also be incorrect to assume that the mass transfer predicted by an
active layer model can be added to the mass transfer from a passive layer
model: we have shown that in many cases the depletion of gas in the active
layer prevents activity in the passive layer.

Chapter 5 – Combined model
97
SYMBOLS
A cross-sectional area [m2]
CA gas-phase concentration, [mol m-3
]
CA0 gas-phase conc. at t = 0 or freeboard gas conc., [mol m-3
]
CA,s gas-phase concentration at the bed surface. [mol m-3
]
d active layer depth, [m]
dmax active layer depth at x = 0, [m]
Da binary diffusion coefficient, [m2 s
-1]
Dal total dispersion coefficient for the active layer, [m2 s
-1]
De effective dispersion coefficient for a packed bed [m2 s
-1]
dp particle diameter [m]
fal fraction contribution of active layer towards total effectiveness
factor []
h perpendicular distance from radial center of the kiln to the bed
surface [m]
k gas-phase reaction rate constant [s-1
]
k′ gas-phase reaction constant for use in active layer, s-1
kgs mass transfer coefficient on the surface of particles [m s-1
]
ks mass transfer coefficient of active layer [m s-1
]
L length of the rotary kiln in axial direction [m]
m shear stress in the active layer (velocity gradient of particles) s-1
PA reaction rate of A [moles m3(bed) s
-1]
Q volumetric gas flow rate [m3 s
-1]
R internal radius of the rotary kiln [m]
V volume [m3]
Vbed volume of bed [m3]
Val volume of the active layer [m3]
x direction parallel to the surface of the bed in the radial cross-
section; x = 0 is at the centre [m]
y direction perpendicular to the surface of the bed [m]

Chapter 5 – Combined model
98
Greek symbols
ε bed voidage [m3(gas) m
-3(bed)]
λ dimensionless distance; depth below bed surface/active layer depth
η effectiveness factor of reaction
φ Thiele modulus
ψ concentration, dimensionless
ω angular velocity [s-1
]
REFERENCES
Boateng, A.A. & Barr, P.V., (1997), ‘Granular flow behaviour in the
transverse plane of a partially filled rotating cylinder, J. Fluid Mech., 330,
233-249
Heydenrych, M.D., Greeff, P., Heesink, A.B.M., Versteeg, G.F., (2001),
‘Mass transfer in rolling rotary kilns: A novel approach’, Submitted to Can.
J. Chem. Eng., 2001.
Heydenrych, M.D., Schieke, J., Heesink, A.B.M., Kuipers, J.A.M. (2001),
‘Diffusion effects in rotating rotary kilns’, Accepted for publication at the
6th
World Congress of Chemical Engineering, Melbourne, 2001.
Heydenrych, M.D., Heesink, A.B.M., Kuipers, J.A.M. (2001), Versteeg,
G.F., ‘Hydrodynamics and dispersion in the active layer of rolling rotary
kilns’, Submitted to Can. J. Chem. Eng., 2001.

Chapter 5 – Combined model
99
Heinen, H., Brimacombe, J.K., & Watkinson, A.P. (1983a). Experimental
study of transverse bed motion in rotary kilns, Metall. Trans., 14B, 1983,
191-205
Jauhari, R., Gray, M.R., & Masliya, J.H. (1988). Gas-solid mass transfer in
a rotating drum, Can. J. Chem. Eng, 76, 224-232.
Kramers, H., & Crookewit, P. (1952). The passage of granular solids
through inclined rotary kilns. Chemical Engineering Science, 1, 259
Lebas, E.F., Hanrot, F., Ablitzer, D. & Houzelot, J.L. (1995).
“Experimental study of residence time, particle movement and bed depth
profile in rotary kilns”, Can. J. Chem. Eng, 73, 173-179.
Saeman, WC, “Passage of solids through rotary kilns”, Chem. Eng. Prog.,
47, 1951, 508-514.
Sørensen, JP, Stewart, WE, 1974, Effect of fluid dispersion coefficients on
particle-to-fluid mass transfer coefficients in packed beds”, Chem. Eng. Sci,
33, 1374-1384
Sullivan, J.D., Maier, C.G., & Ralston, O.C., (1927). Passage of solid
particles through rotary cylindrical kilns. US Bureau of Mines, Technical Papers 384, 1-42
Tscheng, S.H. and Watkinson, A.P., (1979). Convective heat transfer in a
Rotary Kiln. Can. J. Chem. Eng., 57, 433-443.


Publications
101
Publications
Van Vuuren, D.S. and Heydenrych, M.D., (1985), ‘Multicomponent
modeling of Fischer-Tropsch slurry reactors’, CSIR rep. CENG-581, 46 pp.
Van Vuuren, D.S., Hunter, J.R. and Heydenrych, M.D., (1988), ‘The
solubility of various gases in Fischer-Tropsch reactor wax’, Chem. Eng.
Sci., 43(6) 1291-1296.
Heydenrych, M.D. and Van Vuuren, D.S. (1989) ‘Catalytic process for the
oligomerisation of olefins’, South African patent ZA 89 02,236.
Heydenrych, M.D. (1989) ‘Intrinsic kinetics of olefin oligomerisation on a
supported nickel catalyst’, Thesis, University of the Witwatersrand.
Heydenrych, M.D., Scurrel, M.S. and Nicolaides, C.P., (2001),
‘Oligomerization of ethene in a slurry reactor using a nickel(II)-exchanged
silica-alumina catalyst’, Applied catalysis, Accepted for publication
Heydenrych, M.D., Reid, C. and Manzini, D. (2001), ‘Pressure drop over
fluidised bed distributor caps’, S.A.J. Chem. Eng., Accepted for publication
Moolman, F.S. and Heydenrych, M.D. (2001), ‘Fluorination of zircon in a
fluidized bed’, Can. J. Chem. Eng., Accepted for publication
Heydenrych, M.D., Greeff, P., Heesink, A.B.M., Versteeg, G.F., (2001),
‘Mass transfer in rolling rotary kilns: A novel approach’, Submitted to Can.
J. Chem. Eng., 2001.

Publications
102
Heydenrych, M.D., Schieke, J., Heesink, A.B.M., Kuipers, J.A.M. (2001),
‘Diffusion effects in rotating rotary kilns’, Accepted for publication at the
6th
World Congress of Chemical Engineering, Melbourne, 2001.
Heydenrych, M.D., Heesink, A.B.M., Kuipers, J.A.M. (2001), Versteeg,
G.F., ‘Hydrodynamics and dispersion in the active layer of rolling rotary
kilns’, Submitted to Can. J. Chem. Eng., 2001.

Acknowledgements
103
Acknowledgements
At first glance, a doctoral thesis would seem to be an individual task, but it
ultimately involves many people. I would like to acknowledge the support
and contributions of the following people in particular:
My wife René, who supported my move to the academic world, and indeed
supported me in this doctorate all the way. My whole family needs to be
thanked, because an endeavour such as this inevitably encroaches on the
time spent with them. And when I am with them physically, they will attest
that I often seem far away . . .
To the University of Pretoria, and in particular Prof. Uys Grimsehl, who
did many things to provide the environment for completing this thesis. He
ensured that, apart from the core educational tasks that I was responsible
for, my time was free to concentrate on my research. He supported my
application to complete my studies at the University of Twente in every
way. In that respect, I also owe a debt of gratitude to the other members of
the Department of Chemical Engineering at the University of Pretoria for
taking up some of my duties when I left the Department on study leave to
the University of Twente.
Finally, to the University of Twente and my promotors Prof. Geert
Versteeg and Prof. Hans Kuipers for initiating and funding my stay at the
University of Twente. Special thanks go to my assistant promotor Dr. Bert
Heesink who taught me how to add value to papers in review – a skill that I
hope to be able apply much more effectively in my career in future. He
spent a lot of his time not only on the thesis, but both he and Prof. Geert
Versteeg spent a lot of time hosting me and my family in our stay in
Enschede – something I value greatly.

Acknowledgements
104
My hope is that in future we will be able to keep regular contact, and
strengthen the friendships we have established here, by actively promoting
the co-operation agreement between our respective Universities.

Curriculum Vitae
105
Curriculum vitae
Mike Heydenrych spent his primary and secondary school years in
Rustenburg, a town about 100 km west of Pretoria. He obtained his
bachelors degree at the University of the Witwatersrand in 1982 and then
completed two years of compulsory National Service. From 1984 he
worked at CSIR (a contract research organisation) as a team member,
determining the hydrodynamics of Fischer-Tropsch slurry reactors. The
information was used by SASOL to scale up their slurry reactors, and these
are now used industrially.
Still working for CSIR, he completed an MSc (at the University of the
Witwatersrand) on the determination of the intrinsic kinetics of the
oligomerisation of ethene on a supported nickel catalyst. He then spent two
years as a consulting engineer for Megkon, a company specialising in
systems engineering. In 1993 he returned to CSIR to work on fluidised bed
combustors: full-scale design, supplying units to industry. After that, he
headed a large minerals processing development project that that sparked
his interest in mass transfer in rotary kilns.
In 1997, he joined the University of Pretoria where he is responsible for the
undergraduate and postgraduate courses in Reactor design and for the Final
year plant design project.
He is married to René with 2 children, Nicole and Graeme.