Modelling and characterization of an airlift-loop bioreactor
131
Modelling and characterization of an airlift-loop bioreactor CENTRALE LANDBOUWCATALOGUS 0000 0248 1147
Transcript of Modelling and characterization of an airlift-loop bioreactor
Modelling and characterization of an airlift-loop bioreactor
CENTRALE LANDBOUWCATALOGUS
0000 0248 1147

Promotoren: dr. ir. K. van 't Riet, hoogleraar in de levensmiddelenproceskunde
ir. K. Ch. A. M. Luyben, hoogleraar in de bioprocestechnologie aan de Technische Universiteit Delft
H W O « > - « D ^ S .
P. Verlaan
Modelling and characterization of an airlift-loop bioreactor
Proefschrift ter verkrijging van de graad van doctor in de landbouwwetenschappen,
op gezag van de rector magnificus, dr. C. C. Oosterlee,
in het openbaar te verdedigen
op vrijdag 20 november 1987 des namiddags te vier uur in de aula
van de Landbouwuniversiteit te Wageningen.
IS ,\) v̂ e> V s
/VJWO%^°V« ^ '
STELLINGEN
In de historische beeldvorming is de door Nederland in 1901 inge-zette "Ethische politiek" nagenoeg uitsluitend met Oost-Indie in verband gebracht, in West-Indie is echter een zelfde beleid gevoerd, maar door het nadelige effect ervan is dat niet als zodanig onderkend.
E.B. Pultrum, doctoraalverslag, Rijksuniversiteit Leiden, 1986.
Het karakteriseren van axiale dispersie in een bellenkolom door middel van het dimensieloze Bodenstein kental dient vermeden te worden.
De veronderstelling dat het uitwisselingsoppervlak tussen de gas-en de vloeistoffase in een airlift-loop reactor door expansie en coalescentie van de gasbellen constant is over de hoogte, lijkt in tegenspraak met de resultaten uit dit proefschrift.
C.S. Ho et al., Biotechnol. and Bioeng. , 19 (1977) 1503-1522.
4. Naarmate de schaal van een airlift-loop reactor toeneemt, neemt het belang van een juist ontwerp van de gasverdeler met betrekking tot de zuurstofoverdracht, af.
In de exacte wetenschappen wordt bij de opzet van mathematische modelvergelijkingen ten onrechte veelvuldig gebruik gemaakt van het germanisme " aanname ", daar waar men veronderstelling bedoelt.
6. De definitie: " Een model is een vereenvoudigde voorstelling van de werkelijkheid " doet aan de voorstelling van de werkelijkheid van sommige onderzoekers ernstige twijfel ontstaan.
Het is te hopen dat de taakuitbreiding van de brandweer met de rampenbestrijding hier te lande, door deze organisatie zodanig zal worden opgevat dat die bestrijding tot een sanering van de diverse opleidingen tot brandweerfunctionaris zal kunnen leiden.
Het verdient aanbeveling om voor het besturen van motorrijwielen met een zuigerverplaatsing van meer dan 500 cm3 behalve een rij-bewijs ook een psychologische test verplicht te stellen.
Stellingen behorende bij het proefschrift: "Modelling and characterization of an airlift-loop bioreactor" van P. Verlaan. Wageningen, 20 november 1987.
Ter nagedachtenis aan mijn vader.
VOORHOORD
Dit werk had niet tot stand kunnen komen zonder de medewerking van een groot
aantal personen. In het bijzonder geldt dit voor de studenten die, als
onderdeel van hun doctoraalwerk, onder mijn leiding aan het airlift-project
hebben bijgedragen. Aan al deze mensen ben ik veel dank verschuldigd.
Toch wil ik er enkelen bij name noemen en persoonlijk bedanken:
Prof. dr. ir. J. Tramper, voor de inzet waarmee je de taak als "dagelijks
begeleider", uitvoerde en voor de boeiende discussies over syntaxis en
semantiek tijdens het schrijven van de artikelen.
De beide promotoren, prof. dr. ir. K. van ' t Riet en prof. ir. K.Ch.A.H.
Luyben, voor jullie inzet en vooral ook voor de enthousiaste wijze waarop
jullie ideeen naar voren brachten tijdens onze werkbesprekingen.
CONTENTS
CHAPTER 1: General introduction.
page
CHAPTER 2: A hydrodynamic model for an airlift-loop
bioreactor with external loop. 11
CHAPTER 3: Estimation of axial dispersion in individual
sections of an airlift-loop reactor. 31
CHAPTER 4: Isobaric and non-isobaric modelling of
dynamic gas-liquid oxygen transfer in an
airlift-loop bioreactor. 53
CHAPTER 5: From bubble column to airlift-loop reactor:
Hydrodynamics of the transition flow regime. 75
CHAPTER 6: From bubble column to airlift-loop reactor:
Axial dispersion and oxygen transfer. 93
CHAPTER 7: Hydrodynamics, axial dispersion and gas-liquid
oxygen transfer in an airlift-loop bioreactor
with three-phase flow. 107
CHAPTER 8: Summary/Samenvatting. 121
CHAPTER ONE
GENERAL INTRODUCTION
Biotechnology is currently a rapidly expanding field of interdisciplinary
research. This appears amongst others from the development of a number of
new types of bioreactors. The traditional stirred-tank reactor is no longer
a priori the standard bioreactor, mainly because of economic considerations
and the intrinsic properties of the bio-phase used [1,2]. Especially the
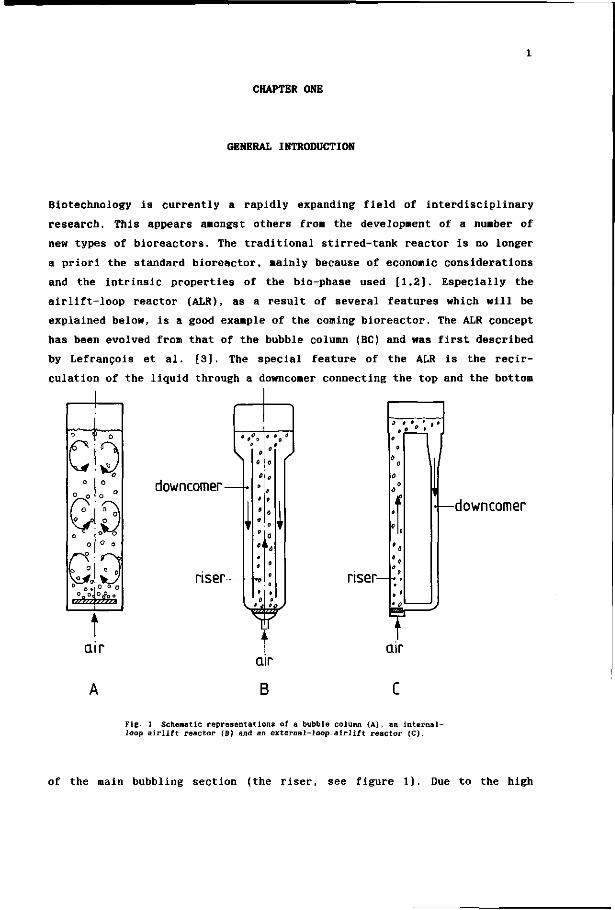
airlift-loop reactor (ALR), as a result of several features which will be
explained below, is a good example of the coming bioreactor. The ALR concept
has been evolved from that of the bubble column (BC) and was first described
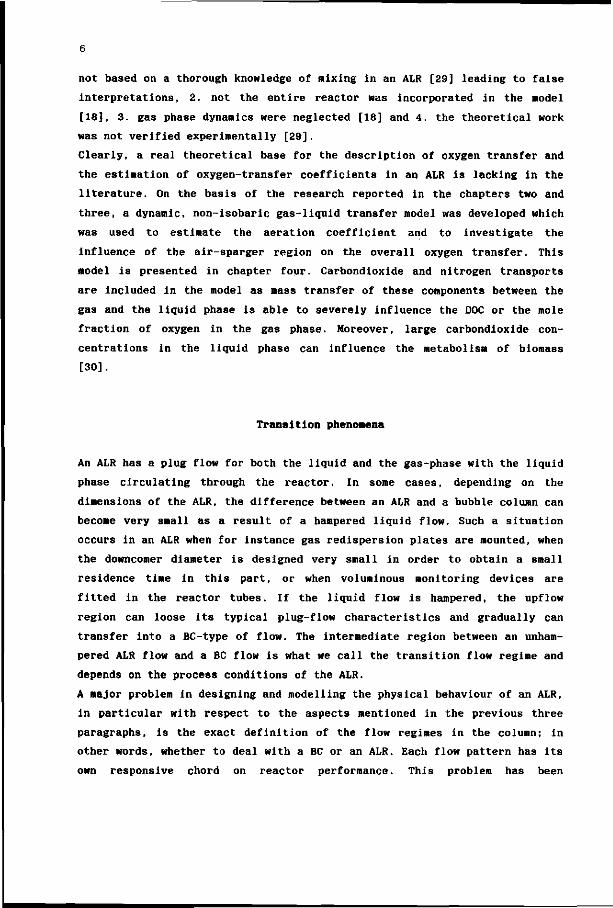
by Lefrancois et al. [3]. The special feature of the ALR is the recir
culation of the liquid through a downcomer connecting the top and the bottom
air
\
down comer -
nser- nser-
air
C
—downcomer
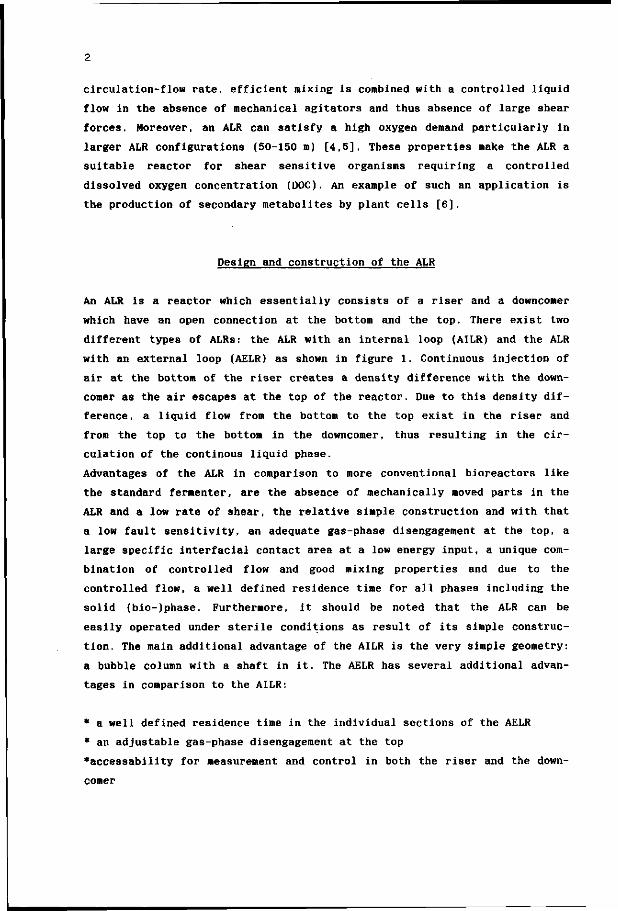
Fig. 1 Schematic representations of a bubble column (A), an internal-loop airlift reactor (B) and an external-loop-airlift reactor (C).
of the main bubbling section (the riser, see figure 1). Due to the high
circulation-flow rate, efficient mixing is combined with a controlled liquid
flow in the absence of mechanical agitators and thus absence of large shear
forces. Moreover, an ALR can satisfy a high oxygen demand particularly in
larger ALR configurations (50-150 m) [4,5], These properties make the ALR a
suitable reactor for shear sensitive organisms requiring a controlled
dissolved oxygen concentration (DOC). An example of such an application is
the production of secondary metabolites by plant cells [6].
Design and construction of the ALR
An ALR is a reactor which essentially consists of a riser and a downcomer
which have an open connection at the bottom and the top. There exist two
different types of ALRs: the ALR with an internal loop (AILR) and the ALR
with an external loop (AELR) as shown in figure 1. Continuous injection of
air at the bottom of the riser creates a density difference with the down-
comer as the air escapes at the top of the reactor. Due to this density dif
ference, a liquid flow from the bottom to the top exist in the riser and
from the top to the bottom in the downcomer, thus resulting in the cir
culation of the continous liquid phase.
Advantages of the ALR in comparison to more conventional bioreactors like
the standard fermenter, are the absence of mechanically moved parts in the
ALR and a low rate of shear, the relative simple construction and with that
a low fault sensitivity, an adequate gas-phase disengagement at the top, a
large specific interfacial contact area at a low energy input, a unique com
bination of controlled flow and good mixing properties and due to the
controlled flow, a well defined residence time for all phases including the
solid (bio-)phase. Furthermore, it should be noted that the ALR can be
easily operated under sterile conditions as result of its simple construc
tion. The main additional advantage of the AILR is the very simple geometry:
a bubble column with a shaft in it. The AELR has several additional advan
tages in comparison to the AILR:
* a well defined residence time in the individual sections of the AELR
* an adjustable gas-phase disengagement at the top
•accessability for measurement and control in both the riser and the down
comer
* A simple valve between the riser and the downcomer enables control of the
liquid velocity Independent of the gas-input rate
* An excellent heat exchange and temperature control
*A simple geometry of the individual parts (tubes) justifies the use of a
simple model
*An optimal hydraulic diameter for both the riser and downcomer and there
fore a low friction rate
•Visual admittance to the process if the AELR is constructed of transparant
elements
For the present study the above-mentioned features tipped the balance in the
advantage of the AELR to use this type of ALR for our experiments. An
extended overview of the characteristics for the ALR and other type of loop
reactors is given by Blenke [7].
Aim
The aim of the present research is the modelling and characterization of the
physical behaviour of a multi-phase flow in an ALR in order to give unam
biguous information for the design and scale-up of an ALR for a given
biotechnological production process using immobilized biocatalysts.
Scope and objectives
The study of this type of reactor was at the time initiated in view of its
application as bioreactor for conversion with immobilized biocatalysts [8]
and plant cells [6,9,10]. From the viewpoint of this, efficient oxygen
transfer and a controlled DOC in the ALR has to be realized, which requires
knowledge of hydrodynamic, mixing and oxygen transfer characteristics. In
the present study these are the basic elements of investigation.
Hydrodynamics
The behaviour of an ALR (and of a bioreactor in general) is determined not
only by its geometry but also by its hydrodynamic properties. Therefore
knowledge of liquid velocity and (local) gas hold-up is a requisite for
reliable predictions of mixing and mass transfer characteristics. In
contrast to bubble columns, in an ALR the above-mentioned hydrodynamic para
meters predetermine each other, thereby impeding a fundamental prediction of
gas hold-up and liquid velocity. Several investigators have reported work on
characterising an ALR by liquid velocities, gas hold-ups and reactor
geometries for air-water systems [11-19]. From this literature can be
concluded that correlations and a few empirical hydrodynamical models con
cerning air-water systems are available. Several of these models have been
proposed in order to describe flow behaviour in an ALR but in most cases
these models have been based on empirical correlations specific to the par
ticular ALR used [17,18,20]. A more general description of the hydrodynamics
does not exists, while some authors present contradictory findings [13,14].
Chapter 2 deals with the hydrodynamic properties of an ALR for an air water
system aiming at a more general description and understanding for reactor
design and scale-up.
Nixing
Mixing in an ALR is a result of two different phenomena: axial dispersion
and liquid circulation. Axial dispersion is mass transport by diffusion-like
disturbances on a plug flow occuring in the reactor tubes of an ALR. The
liquid circulation cumulates the individual axial dispersion contributions
during one liquid circulation, to a final mixing result generally expressed
by a single parameter: the mixing time. In an ALR, axial dispersion has an
influence on oxygen and other substrate profiles, thus effecting the kine
tics of (immobilized) biocatalysts and with that the design of the ALR.
Fields and Slater [21] for instance, investigated the influence of liquid
mixing in an ALR on the respiration of micro-organisms and found that
respiratory quotients are affected by the local mixing behaviour. In view of
biological processes in which small characteristic times (time constants)
are of importance, it is essential to investigate not only axial dispersion
for the reactor as a whole, but also for the different sections of the ALR:
riser, topsection (gasdisengagement section) and downconer.
In contrast to bubble columns, where numerous investigators reported results
on the characterization of axial dispersion [22-24], there is a lack of
knowledge on the mixing behaviour in ALRs, especially in the individual sec
tions of the ALR. Several investigators reported results on axial dispersion
in the ALR as a whole and in the individual sections [10,17,18,25,26], but
the mathematical methods they applied to assess these values entailed
serious problems due to the liquid circulation in the ALR [18,21].
In chapter three a parameter estimation method is presented yielding the
axial dispersion parameter which is not affected by the nature of the tracer
nor by the circulation flow of the loop reactor. It will also be shown that
axial dispersion in the reactor as a whole can be calculated from the
contributions of the individual sections.
Oxygen transfer
As the ALR is especially a reactor for aerobic biotechnological processes,
the aeration capacity and performance is of main interest for its applica
tion as a bioreactor. Moreover, because of the controlled liquid flow, the
geometry of the reactor and the hydrostatic pressure differences, into
lerable variations in the local DOC may occur during a fermentation. As a
result, the characterisation of the aeration in an ALR does not only require
a thorough knowledge of the overall aeration characteristics but also of
local gas-liquid oxygen transfer, including oxygen transfer in the gas-
sparger region.
Several investigations have been carried out on the mass transfer capacity
of airlift contactors [15,17,25,27], however these results are based on
emperical correlations which in most cases are specific to the situation and
often do not contribute to a more perspicacious view on this matter. A few
workers introduced mathematical models describing oxygen transfer in an ALR
[18,28,29]. Unfortunately, the assumptions proposed, restricts a more
general approach. In one case for instance, only the steady-state situation
was considered [28], while in other cases fundamental parameters were
obtained from emperical correlations making large scale predictions doubtful
[28,29]. Other examples are: 1. the assumption on the mixing behaviour was
not based on a thorough knowledge of mixing in an ALR [29] leading to false
interpretations, 2. not the entire reactor was incorporated in the model
[18], 3. gas phase dynamics were neglected [18] and 4. the theoretical work
was not verified experimentally [29].
Clearly, a real theoretical base for the description of oxygen transfer and
the estimation of oxygen-transfer coefficients in an ALR is lacking in the
literature. On the basis of the research reported in the chapters two and
three, a dynamic, non-isobaric gas-liquid transfer model was developed which
was used to estimate the aeration coefficient and to investigate the
influence of the air-sparger region on the overall oxygen transfer. This
model is presented in chapter four. Carbondioxide and nitrogen transports
are included in the model as mass transfer of these components between the
gas and the liquid phase is able to severely influence the DOC or the mole
fraction of oxygen in the gas phase. Moreover, large carbondioxide con
centrations in the liquid phase can influence the metabolism of biomass
[30].
Transition phenomena
An ALR has a plug flow for both the liquid and the gas-phase with the liquid
phase circulating through the reactor. In some cases, depending on the
dimensions of the ALR, the difference between an ALR and a bubble column can
become very small as a result of a hampered liquid flow. Such a situation
occurs in an ALR when for instance gas redispersion plates are mounted, when
the downcomer diameter is designed very small in order to obtain a small
residence time in this part, or when voluminous monitoring devices are
fitted in the reactor tubes. If the liquid flow is hampered, the upflow
region can loose its typical plug-flow characteristics and gradually can
transfer into a BC-type of flow. The intermediate region between an unham
pered ALR flow and a BC flow is what we call the transition flow regime and
depends on the process conditions of the ALR.
A major problem in designing and modelling the physical behaviour of an ALR,
in particular with respect to the aspects mentioned in the previous three
paragraphs, is the exact definition of the flow regimes in the column; in
other words, whether to deal with a BC or an ALR. Each flow pattern has its
own responsive chord on reactor performance. This problem has been
recognized earlier in the literature but until now, little results have been
reported on this topic. Merchuk and Stein [12] investigated the hydrodyna
mics in the transition flow regime and summarized their results in an
emperical correlation from which no general prediction for the onset of
change in flow pattern can be obtained.
A few workers investigated axial dispersion [15,25] and oxygen transfer [15]
in an ALR and compared the results between bubble column and airlift opera
tion in the same unit, but no information of axial dispersion and oxygen
transfer in the transition flow regime between an ALR and a BC is existing.
Chapter five is dedicated to the hydrodynamics of the transition flow
regime. A criterium is presented by which transition from bubble column to
ALR hydrodynamics can be predicted. This criterium also indicates whether
the general hydrodynamic model for an ALR, presented in chapter two, is
valid or not.
Chapter six is dedicated to axial dispersion and oxygen transfer in the
transition flow regime, The results presented in that chapter can be an
important tool in scaling-up and designing ALRs.
Three-phase flow
The research mentioned in the previous sections concerned the physical beha
viour of gas-liquid flow in an ALR. In many cases immobilized biocatalysts
or micro-organisms growing in aggregates are used in biotechnological pro
duction processes. This means that the biophase in the reactor is con
centrated in or on beads with diameters up to several millimeters. Also in
this case an ALR seems a suitable reactor having excellent suspension
characteristics due to the high liquid velocity.
Little research has been reported until now on the influence on bioreactor
performance of relatively large (2-3 mm) particles with a neutral buoyancy
e.g. gel-entrapped biocatalysts. Recently, results were published on the
influence of neutral buoyant calcium alginate beads with a diameter of
2,2 mm on oxygen transfer in a stirred-tank reactor [31]. For ALRs no such
data is available. Therefore the aim of chapter 7 is to give a concise over
view of the physical ALR properties and the interaction with relatively
large solid particles in order to provide essential information for
three-phase-ALR design. In chapter 7, results are reported on the physical
influence on ALR performance of neutral buoyant polystyrene or calcium-
alginate beads with diameters ranging from 2,4 to 2,7 mm.
Notes on thesis lay out
The chapters in this thesis all are similarly presented as independent
contributions, each of which forms a part that can be read apart from the
others. Each chapter has been closed with literature references and a list
of symbols used.
REFERENCES
[I] P. Verlaan. Airlift-loop bioreactor. PT-procestechniek. 40 nr.10 (1985) 60-63 (in Dutch).
[2] P. Verlaan. Karakterisering van een airlift-loop bioreactor. Voedingsmiddelentechnologie (VMT). 12 (1987) 31-34 (in Dutch).
[3] M.L. Lefrancois, C.G. Mariller and J.V. Mejane. Effectionnements aux procedes de cultures forgiques et de fermentations industrielles. Brevet d'Invention, France, no. 1 102 200 (1955).
[4] M.L. Hemming. General biological aspects of waste-water treatment including the deep-shaft process. Wat. Pollut. Control. 78 (1979) 312-325.
[5] S. Shioya, N.D.P. Dang and I.J. Dunn. Bubble column fermenter modeling: a comparison for pressure effects. Chem. Eng. Sci. 33 (1978) 1025-1030.
[6] A.C. Hulst, P. Verlaan, H. Breteler and D.H. Ketel. Thiophene production by Tagetes patula in a pilot plant airlift-loop reactor. Proc. 4 t h Europ. Congress on Biotechnology. 2 (1987) 401-404. (O.M. Neijssel, R.R. van der Meer, K.Ch.A.M. Luyben eds. ) Elsevier Science Publishers B.V., Amsterdam.
[7] H. Blenke. Biochemical loop reactors, VCH, Weinheim, 1985. [8] J. Tramper and J. Vlak. Some engineering and economic aspects of con
tinuous cultivation of insect cells for the production of Baculoviruses. Ann. N.Y. Acad. Sci. 469 (1986) 279-288.
[9] D.H. Ketel. Callus and cell culture of Tagetes species in relation to production of thiophenes. Thesis, Agricultural University, Wageningen, 1987.
[10] P. Verlaan, A.C. Hulst, J. Tramper, K. van ' t Riet and K.Ch.A.M. Luyben. Immobilization of plant cells and some, aspects of the application in an airlift fermentor. Proc. 3 r d Europ. Congress on Biotechnol., vol. 1, Munchen, GDR, 10-14 sept. (1984) 151-157.
[II] U. Onken and P. Weiland. Hydrodynamics and mass transfer in an airlift loop fermentor. Eur. J. Appl. Microbiol. Biotechnol. 10 (1980) 31.
[12] J.C. Merchuk and Y. Stein. Local hold up and liquid velocity in airlift reactors. AIChE J. 27 (1981) 377-388.
[13] D.G. Mercer. Flow characteristics of a pilot-scale airlift fermentor. Biotechnol. & Bioeng., 23 (1981) 2421-2431.
[14] W.J. McManamey, D.A.J. Wase, S. Raymahasay and K. Thayamithy. The influence of gas inlet design on gas hold-up values for water and various solutions in a loop-type air-lift fermenter. J. Chem. Technol. Biotechnol., 34B (1984) 151-164.
[15] R.A. Bello, C.W. Robinson and M. Moo-Young. Gas hold-up and overall volumetric oxygen transfer coefficient in airlift contactors. Biotechnol. & Bioeng. 27 (1985) 369-381.
[16] N.N. Clark and R.L. Flemmer. Predicting the hold up in two-phase bubble upflow and downflow using the Zuber and Findlay drift-flux model. AIChE J., 31 (1985) 500-503.
[17] R.T. Hatch. Experimental and theoretical studies of oxygen transfer
in the airlift fermentor. Thesis, M.I.T., Cambridge, 1973. [18] R.G.J.M. van der Lans. Hydrodynamics of a bubble column loop reactor,
Thesis, Delft University of Technology, Delft, 1985. [19] A.G. Jones. Liquid circulation in a draft-tube bubble column. Chem.
Eng. Sci. 40 (1985) 449-462. [20] H. Kubota, Y. Hosono and K. Fujie. Characteristic evaluations of ICI
air-lift type deep shaft aerator. J. Chem. Eng. Jap., 11 (1978) 319-325.
[21] P.R. Fields and N.K.H. Slater. The influence of fluid mixing upon respiratory patterns for extended growth of a methylotroph in an air-lift fermentor. Biotechnol. & Bioengng. 26 (1984) 719-726.
[22] R.W. Field and J.F. Davidson. Axial dispersion in bubble columns. Trans. I. Chem. Eng. 58 (1980) 228-235.
[23] K.H. Mangartz and Th. Pilhofer. Interpretation of mass transfer measurements in bubble columns considering dispersion of both phases. Chem. Engng. Sci. 36 (1981) 1069-1077.
[24] J.B. Joshi and Y.T. Shah. Hydrodynamic and mixing models for bubble column reactors. Chem. Eng. Commun. 11 (1981) 165-199.
[25] P. Weiland. Untersuchung eines Airliftreaktors mit AiijSerem Umlauf im Hinblick auf seine Anwendung als Bioreaktor. Thesis, University of Dortmund, Dortmund, 1978.
[26] P.R. Fields and N.K.H. Slater. Tracer dispersion in a laboratory air-lift reactor. Chem. Engng. Sci. 38 (1983) 647-653.
[27] C.H. Lin, B.S. Fang, C.S. Wu, H.Y. Fang, T.F. Kuo and C.Y. Hu. Oxygen transfer and mixing in a tower cycling fermentor. Biotechnol. & Bioeng. 18 (1976) 1557-1572.
[28] J.C. Merchuk and Y. Stein. A distributed parameter model for an airlift fermentor. Biotechnol. & Bioeng. 22 (1980) 1189-1211.
[29] C.S. Ho, L.E. Erickson and L.T. Fan. Modeling and simulation of oxygen transfer in airlift fermentors. Biotechnol. and Bioeng. 19 (1977) 1503-1522.
[30] A.V. Quirk and R.W.H. Plank. The effect of carbondioxide on the production of an extracellular nuclease of staphylococcus aureus. Biotechnol. & Bioeng. 25 (1983) 1083-1093.
[31] J.J. Frijlink. Physical aspects of gassed suspension reactors. Thesis, University of Technology, Delft, 1987.
11
CHAPTER TWO
A HYDRODYNAMIC MODEL FOR AN AIRLIFT-LOOP BIOREACTOR
WITH EXTERNAL LOOP
P. Verlaan, J. Tramper and K. van 't Riet,
Department of Food Science, Food and Bioengineering Group,
Agricultural University,
De Dreyen 12, 6703 BC Wageningen, The Netherlands.
K.Ch.A.M. Luyben, Department of Biochemical Engineering,
Delft University of Technology,
Julianalaan 67, 2628 BC Delft.
ABSTRACT
A simple model is introduced for the hydrodynamic description of an airlift-
loop bioreactor with external loop. The model is based on the drift flux
model of Zuber and Findlay (1965) for a two-phase flow and predicts the
liquid velocity and the local gas hold-up in both the upflow and downflow
region in relation to the gas input rate and the reactor dimensions. The
model is non-isobaric and takes into account non-uniform flow profiles.
Liquid velocity and local gas hold up in airlift-loop reactors from labora
tory to pilot plant scales are predicted to within 5-10% accuracy.
Published in: Chem. Engng. J., 33 (1986) B43-B53.
12
INTRODUCTION
At present, various types of bioreactors are used in biotechnological pro
cesses, e.g. the conventional stirred tank reactor and the more modern
airlift-loop reactor. An airlift-loop reactor (ALR) combines efficient oxy
gen transfer and mixing with controlled liquid flow and low shear forces.
The behaviour of a bioreactor is determined not only by the reactor geometry
but also by its hydrodynamic properties. Therefore knowledge of liquid velo
city and (local) gas hold-up is essential for reliable predictions of mixing
and mass transfer characteristics. In contrast to bubble columns, in an ALR
the above-mentioned hydrodynamic parameters predetermine each other which
impedes a fundamental prediction of gas hold-up and liquid velocity. Several
investigators have reported work on characterising an ALR by liquid veloci
ties, gas hold-ups and reactor geometries for air-water systems.
Onken and Weiland [1], for instance, have measured gas hold-ups for an 0.12
ms ALR with external loop (height: 10 m) and found the gas hold-up in the
reactor to be independent of the initial bubble size generated by the gas
sparger. In contrast to Onken and Weiland, Merchuk and Stein [2] found that
even in tall columns, the measured values of the local gas hold-up in an ALR
with external loop depend on the geometry of the gassparger (single orifice
or multiple orfices) and on the friction in the reactor. Mercer [3] men
tioned diminishing average bubble sizes in a pilot-scale ALR with increasing
aeration rates which enhances gas hold-up. In contrast McManamey et al. [4]
reported an increasing bubble size due to coalescence when the reactor was
operated at high aeration rates. However, Mercer determined the gas hold-up
photographically and it is possible that only bubbles at the wall-side were
observed which were not necessarily representative for the whole reactor.
The results of McManamey et al. were obtained by visual observations.
Merchuk and Stein [2] did not observe bubble coalescence or bubble disper
sion in their reactor. Bello et al. [5] investigated gas hold-ups in both an
external and internal loop airlift reactor with various diameter ratios for
the upflow and downflow regions and presented empirical relations for gas
fractions in relation to the gas input rate, the liquid velocity and the
ratio of downcomer and riser tube cross-area. The discrepant interpretations
in literature of gas hold-up characteristics in an ALR hamper a more perspi
cacious view.
A similar trend is observed for liquid flow behaviour in ALRs which, in
13
contrast to the gas hold-up measurements, is due mainly to the application
of different experimental techniques. Mercer [3] investigated flow charac
teristics of a pilot-scale airlift (working volume: 0.55 m 3 ) , using a flow
follower technique. Because of this technique, the results were affected by
secondary flow patterns in the upward flowpath; as a result the velocity
gradient of the riser and downcomer appeared to be of opposite sign for
increasing gas injection rate. The same method was also applied by Clark and
Flemmer [6] in a two-phase bubble upflow and downflow. They reported secon
dary circulation patterns which disturbed experiments in such a way that the
circulation rate could not be measured accurately. Onken and Weiland [1]
measured liquid velocity using an inductive flow meter which enables an
accurate estimation of the flow velocity in a tube; Merchuk and Stein [2]
used a liquid flow meter. Both teams [1,2] found an exponential correlation
between the liquid flow and the gasvelocity in the riser.
Several models have been proposed in order to describe flow behaviour in an
ALR but in most cases these models have been based on empirical correlations
specific to the particular ALR used. Hatch [7] for instance, applied the
drift-flux model of Zuber and Findlay [8] , supplemented with empirical
correlations for an internal loop ALR with a working volume of 0.2 m3, in
order to calculate liquid velocities and gas hold-up fractions in both the
riser (draft) and the downcomer (annulus). The semi-empirical model which
did not take into account pressure effects, predicted the hydrodynamic para
meters to within 10%. Van der Lans [9] and Kubota et al. [10] have studied
and modelled hydrodynamics in pilot-plant deep shaft reactors with an exter
nal loop and working volumes of 0.6 m3 and 0.2 m3 respectively. In both
models the rise velocity of the gas bubbles was obtained experimentally.
Kubota et al. also included in their model gas exchange by biological acti
vity but did not verify their calculations experimentally. Van der Lans pre
dicted deep-shaft hydrodynamics for his experimental set up, within the
experimental accuracy. Jones [11] introduced a simple model on the basis of
an energy balance in the upflow region, but gas hold-up in the downflow
region was neglected. In this model it was assumed that the work performed
by the ascending air bubbles is equal to the work performed in accomplishing
liquid circulation. Nevertheless, a discrepancy occurred between the model
and the experiments in a concentric tube airlift with a working volume of
0.06 m3 (about 33%), especially for large draft diameters. No friction
calculations were included.
14
Clearly, some data, correlations and empirical hydrodynamical models con
cerning air-water systems are available but a more general description of
hydrodynamics does not exist, while some authors even present contradictory
findings. The present work concerns hydrodynamic properties of an ALR aiming
at a more general description and understanding. A simple model based on the
drift-flux model of Zuber and Findlay [8] for a two-phase flow is intro
duced, on the basis of which the liquid velocity and the local gas hold-up
in both the riser and downcomer can be predicted in relation to the gas
input rate and the reactor dimensions, taking into account non-uniform flow
profiles. An iterative procedure is necessary since the liquid velocity and
the gas hold up are not independent. The model is non-isobaric and has been
used to predict the liquid velocities and local gas hold-ups in external
loop reactors of various sizes (0.004 m3-0.6m3).
MATERIALS AND METHODS
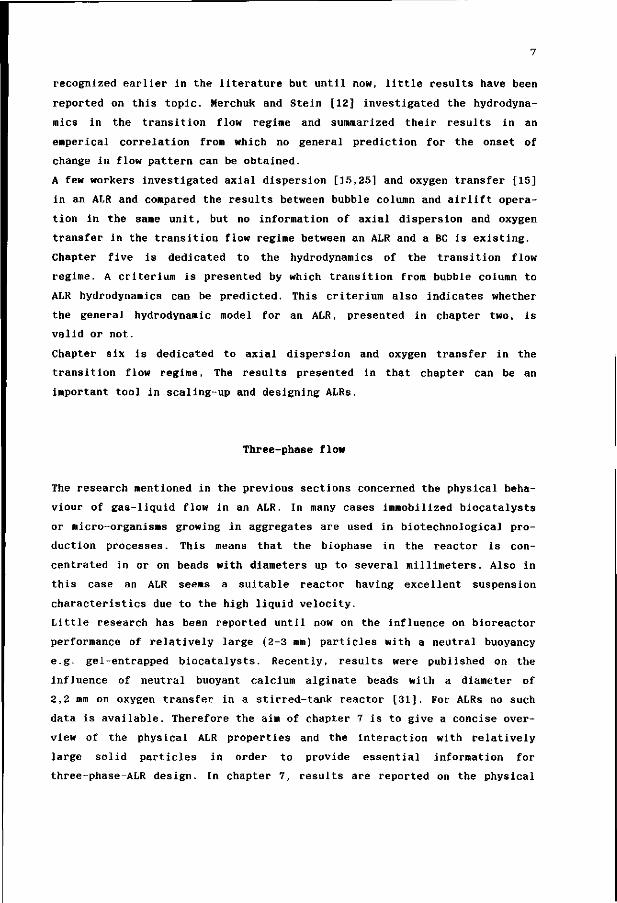
Two different pilot-plant ALR ' s have been used for the evaluation of the
hydrodynamic model one with a height of 3.23 m and another with a height of
10.5 m. The smaller ALR has a reactor volume of 0.165 m3 and a riser and
downcomer constructed of borosilicate glass pipe sections with diameters of
0.2 m and 0.1 m respectively. The top of this reactor consists of a
stainless steel cistern which has a length of 0.7 m and a width of 0.22 m
thus allowing for a certain amount of foaming (Figure 1). It was designed to
obtain complete deaeration without gas entrainment into the downcomer. The
liquid level was kept at 0.13 m above the bottom of the cistern in the
absence of gas in order to maintain about the same liquid velocity in the
riser and in the topsection. The funnel shaped top of the downcomer
accomplishes a smooth diameter change. A gas sparger has been designed which
produces bubbles of about the equilibrium diameter (djj= 6 mm) of air bubbles
in water [12]. At the bottom of the reactor air and water can be supplied.
Temperature control is provided by a contact-element heater fixed on the
stainless-steel pipe element of the top section.
The larger ALR has a working volume of 0.6 m3 and a riser and downcomer
diameter of 0.225 m and 0.1 m respectively. The whole reactor consists of
borosilicate glas pipe sections and has the same geometry as the 0.165 m3
ALR except for the topsection which, in this case, consists of a glas pipe

15
section with a length of 0.85 nt and
diameter of 0.15 m. In this reactor, tem
perature control is performed by a heater
positioned in the riser liquid flow. The
ALR is provided with a vacuum pump by
which the pressure at the top of the
reactor can be lowered to a value of 3-5
kPa, depending on the gas input rate.
This reactor is situated at the Delft
University of Technology and more details
about this reactor have been reported by
van der Lans [9].
In both reactors the liquid flow in the
downcomer was measured by means of an
inductive flow meter. A reversed U-tube
manometer was used to measure the
pressure difference over the length of
interest. For this purpose the riser is
equipped with various pressure points
(Figure 1). The gas fraction in the riser
was estimated from the pressure dif
ference between two points which is
represented by the following equation:
pH— heater -
P-S
P~
riser—
XT
stainless steel topsection
-viewwindow
-pH
tf Jnductive
flow meter -downcomer
D„= 01m
drain | tap water air
Fig. 1 The a irl i ft- loop reactor
Ap= pgL(l-a) (1)
Here, a is the mean gas volume fraction in the relevant part of the tube
with length L, p is the liquid density and g the gravitational constant.
Friction and acceleration terms were assumed to contribute negligibly to the
changes in gas hold-up along the column. From eq (1) the mean gas hold up
over a tube length L can be calculated.
16
THE MODEL
As stated above, the liquid velocity and the gas hold-up have to be esti
mated in relation to the main input parameter of an ALR, the injected gas
flow. The density differences due to a gas hold-up a r in the riser and a^ in
the downcomer result in a liquid flow in the ALR. In a stationary situation
the driving force has to be equal to the friction losses in the ALR:
L L
0 / ar(z) dz -0/ ad(z) dz = Kf/(2g).vjs (2)
where Kf is the friction coefficient and v l s the superficial liquid velo
city. Thus the liquid velocity can be calculated when both the riser and the
downcomer gas hold-up are known. However, the gas hold-up is a function of
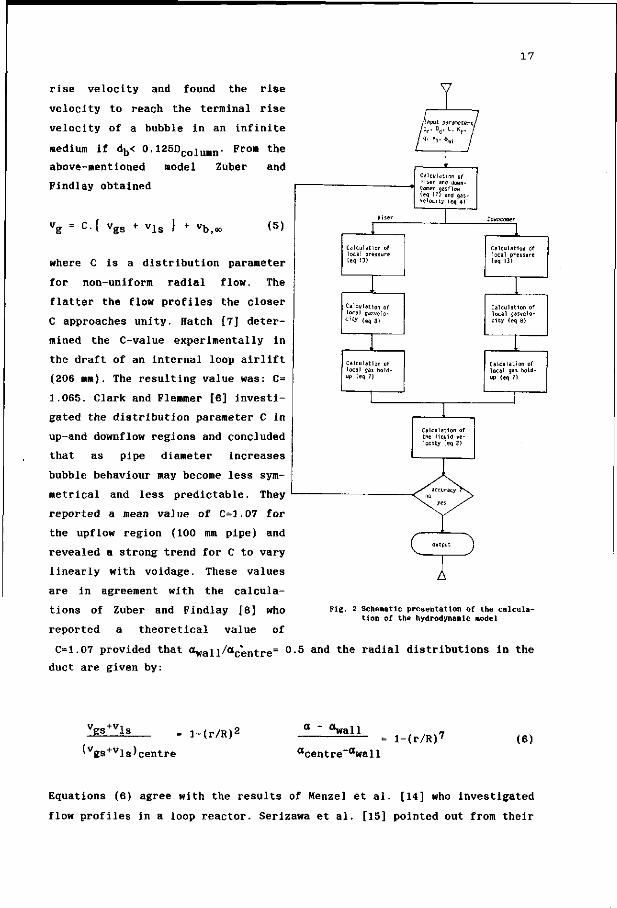
the liquid velocity. Therefore an iterative procedure has been used for this
calculation, which is shown in Figure 2 and explained below.
The local gas fraction is expressed by the following equation:
a(z)= vgs(z)/vg(z) (3)
In this equation v„(z) is the local gas velocity and v_s(z) the local
superficial gas velocity:
vgs(z)= $vg(z)/A (4)
with $vg(z) equal to the local volumetric gas flow rate and A is the tube
cross-sectional area. The gas velocity, vg, is a function of the liquid
velocity, the superficial gas velocity and the local relative velocity bet
ween the bubble and the liquid phase.
In the present research the two-phase drift-flux model of Zuber and Findlay
[8], taking into account non-uniform flow and hold-up distributions across
the duct, has been used in order to calculate the gas hold-up in the column.
Zuber and Findlay made the initial assumption that the drift velocity is
independent of the void fraction and proposed the drift velocity term to be
equal to the terminal rise velocity of a single bubble in an infinite
medium. Wallis [13] reviewed the influence of column diameters on the bubble
17
rise velocity and found the rise
velocity to reach the terminal rise
velocity of a bubble in an infinite
medium if db< 0.125Dcoiumn. From the
above-mentioned model Zuber and
Findlay obtained
'g = C.{ v, gs 'Is } + Vb,o (5)
where C is a distribution parameter
for non-uniform radial flow. The
flatter the flow profiles the closer
C approaches unity. Hatch [7] deter
mined the C-value experimentally in
the draft of an internal loop airlift
(206 mm). The resulting value was: C=
1.065. Clark and Flemmer [6] investi
gated the distribution parameter C in
up-and downflow regions and concluded
that as pipe diameter increases
bubble behaviour may become less sym
metrical and less predictable. They
reported a mean value of C=1.07 for
the upflow region (100 mm pipe) and
revealed a strong trend for C to vary
linearly with voidage. These values
are in agreement with the calcula
tions of Zuber and Findlay [8] who
reported a theoretical value of
Calculation of Mser and down-comer gasflow (eq 17) and gas-velocity leq 41'
Calculation of local pressure (eq 13)
Calculation of local gasvelo-city ( e q 8 )
Calculation of local gas holdup (eq 7)
Calculation of the liquid velocity (eq I)
( output J
1 Calculation of local pressure (eq 13)
Calculation of local gasvelo-city (eq 8)
Calculation of local gas holdup (eq 7)
Fig. 2 Schematic presentation of the calcula
tion of the hydrodynamic model
C=1.07 provided that S*all//acentre= °-5 an<* t n e rac*ial distributions in the
duct are given by:
vgs+vls
'vgs+vls)centre
= l-(r/R)2 °wall
"centre awall l-(r/R)7 (6)
Equations (6) agree with the results of Menzel et al. [14] who investigated
flow profiles in a loop reactor. Serizawa et al. [15] pointed out from their
18
experiments that the gas hold-up profiles in a 60 mm vertical tube were
fairly flat, confirming the high value of the exponent in eqns (6). From
this work the plausability of the condition <*Wal lucent re= °-5 * s a l s o con
firmed.
Substitution of eqn(5) into eqn(3) yields:
a(z) = vgs(z)/{ C.(vls(z) + vgs(z)) + v b o o } (7)
Owing to pressure effects, the superficial gasvelocity varies in the ALR.
Assuming one-dimensional isothermal flow, steady state and negligible mass
transfer effects between the phases, the gasvelocity can be expressed as
follows:
vgs(z)= vgs(0).p(0)/p(z) (8)
where vgs(0) and p(0) are the superficial gas velocity and the pressure at
the bottom of the reactor respectively. The local pressure in the ALR is
represented by:
z
p(z)= p(0) - p.g.{ z - / a(z) dz } (9)
0
Substitution of eqn (9) and (8) into eqn (7) shows that eqn (7) is implicit
for o(z). To overcome this problem an approximation for o(z) in eq (9) is
employed as is proposed by van der Lans [9] and which will be denoted by
o'(z):
a'(z)= a(0).ph(0)/ph(z) (10)
In this equation, p n is the hydrostatic pressure which seems a reasonable
approximation for the real pressure if o(z)«l. The hydrostatic pressure is
defined as:
Ph(z)= P(0) - Pgz (11)
Substitution of eqns (11) and (10) into eqn (9) gives:
19
Ph(z) p(z)=ph(z) - p(0)o(0)./l/ph(z).d(ph(z)) (12)
0
Integration of eq (12) yields:
p(z) = p(0) - pgz - p(0).a(0).ln{l - pgz/p(0)} (13)
With this approximation for the local pressure instead of eqn (9), the
implicity for a(z), (eqn 7 ) , has disappeared. Substitution of eqn (13)
together with eqn (8) into eqn (7) gives an expression by which the local
gas hold up in the riser of the ALR can be calculated if the liquid velocity
is known and gas is absent from the downcomer. In practice, gas hold-up in
the downflow region is present in most cases and will contribute to the
total hydrodynamic behaviour of the ALR.
Gas hold-up in the downco»er
Gas hold-up in the downcomer may result from incomplete deaeration at the
top of the reactor or it can be accomplished deliberately by forced gas
injection into this section. Assuming no influence of turbulence on the rise
velocity of a bubble, the condition for complete deaeration at the top of
the ALR is:
*vl/(L.B.vs) > 1 (14)
Here, * v j is the liquid flow rate, L and B the length and width respectively
of the topsection and vs the bubble rise velocity. Equation (14) shows that
the rate of deaeration at the top is independent of the liquid level in the
topsection.
The mass flow rate of gas in the riser is defined as:
*mgr= *mgi + *mgd ( 1 5 )
where * m g i is the injected mass flow of air in the sparger and *mgc| is the
mass flow of air in the downcomer. If the gas flow in the downcomer is given
as a fraction q of the riser gas flow:
20
substitution of eqn (16) into eqn (15) yields:
*mgr= *mgi/(1 - <l) a n d *mgd=*mgi•q/(X " q ) ( 1 7 )
*mgr an(* *mgd a r e u s e d t 0 calculate the superficial gasvelocity in the riser
and downcomer (eqn (4)) which enables the use of eqn(7) to derive the local
gas hold-up in the pertinent reactor part, taking into account the sign of
the bubble rize velocity vj, „, and the proper superficial liquid velocity
vis-Clark and Flemmer [6] showed in their literature review that there exists a
discrepancy in published values for the distribution parameter, C, for dif
ferent flow regimes. Some authors assumed the profile constant to have the
same value in both the riser and downcomer. Others assumed C to differ bet
ween the two sections. Although Clark and Flemmer report contradictory
results in their own work, for the downcomer they observe consistent values
for C. In downcomers with diameters of 50 mm and 100 mm, almost the same
values for C were found: C= 1.16 and C= 1.17 respectively.
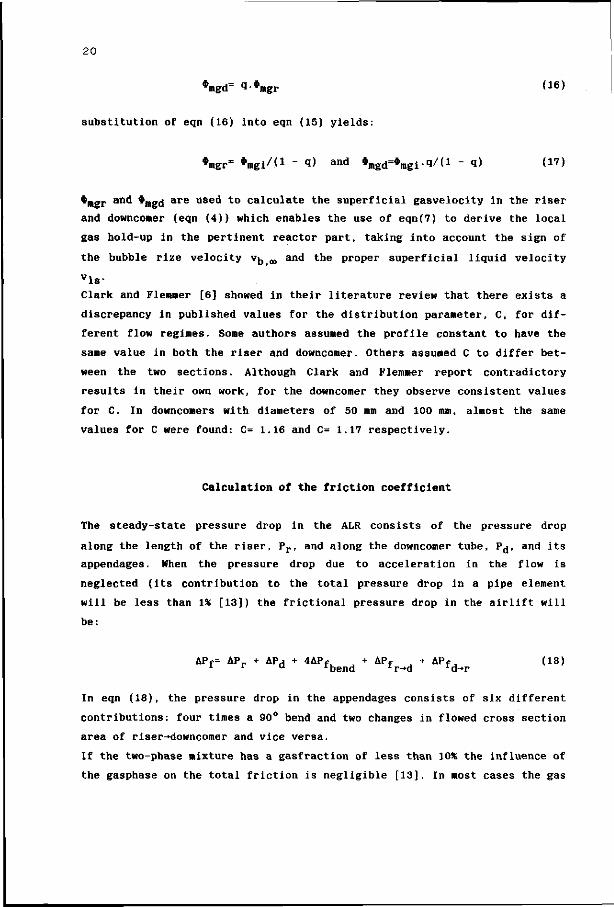
Calculation of the friction coefficient
The steady-state pressure drop in the ALR consists of the pressure drop
along the length of the riser, Pr, and along the downcomer tube, Pj, and its
appendages. When the pressure drop due to acceleration in the flow is
neglected (its contribution to the total pressure drop in a pipe element
will be less than 1* [13]) the frictional pressure drop in the airlift will
be:
APf= AP_ + APri + 4APfl + APf + A P f j (18) 1 ' u Lbend Ar->d 'd-*r
In eqn (18), the pressure drop in the appendages consists of six different
contributions: four times a 90° bend and two changes in flowed cross section
area of riser-»downcomer and vice versa.
If the two-phase mixture has a gasfraction of less than 10% the influence of
the gasphase on the total friction is negligible [13]. In most cases the gas

21
fraction in airlift-loop reactors will be below this value. The total fric-
tional pressure drop through the turnaround referred to the superficial
downcomer liquid velocity can now be written as:
APf= ^Kfpr a.vid (19)
where pra is the average density of the gas-liquid mixure in the riser and
downcomer. Kf can be divided into eight contributions according to eqn
(18):
f= Ad/Ap.(Kf +3K* +Kf }+Kf +Kf +Kf i a r rr t b e n d td^ri fb e n d fr_>d fd Kf = (20)
The expressions used to calculate the friction coefficients of the pipe ele
ments and the appendages are mentioned in the appendix. Use of eqn (20) to
calculate the total friction coefficient of the two pertinent ALRs yields
the following values: Kf= 1.8 for the smaller ALR and Kf= 4.75 for the
larger ALR. When Kf is known, the liquid velocity and the (local) gas hold
up can be predicted on the basis of eqn(7) with the superficial gasvelocity
as the sole input parameter.
working volume
0.165 m3
0.6 m3
0.004 m3
Weiland [21]
Merchuk [2]
Kfr
0.1
0.4
0.32
0.1
0.58
Kfd
0.7
2.0
0.12
4.0
0.58
^bend
0.38
1.5
4.5*
0.55
5.2
f r«d
0.62
1.1
-
0.9
6.0**
Kftot
1.8
4.75
4.95
5.55
11.36
KfexP
1.84
4.43
4.5
4.9
11.2
Table 1 Calculated and experimental friction coefficients * Revealed from Blenke [16] ** Estimated
22
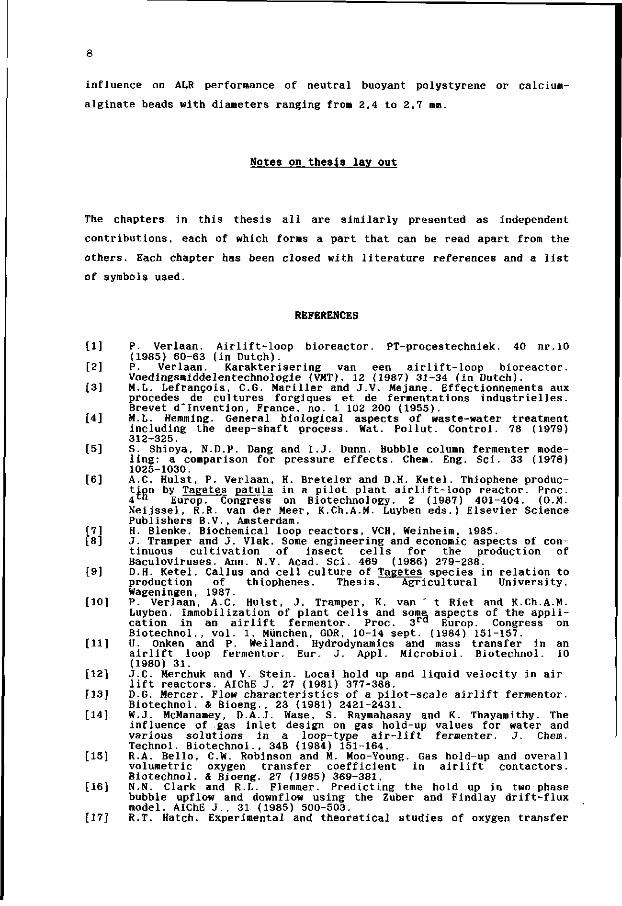
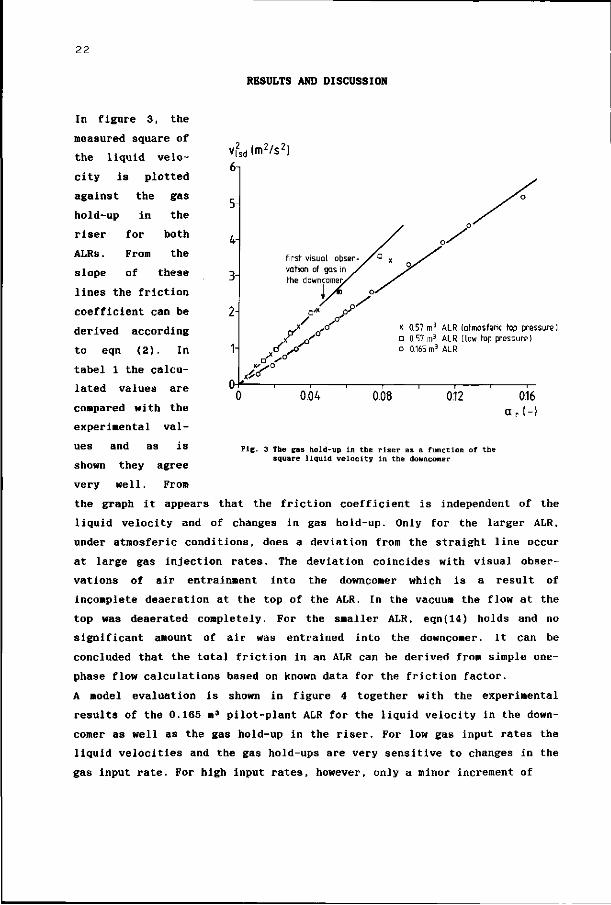
RESULTS AND DISCUSSION
In figure 3, the
measured square of
the liquid velo
city is plotted
against the gas
hold-up in the
riser for both
ALRs. From the
slope of these
lines the friction
coefficient can be
derived according
to eqn (2). In
tabel 1 the calcu
lated values are
compared with the
experimental val
ues and as is
shown they agree
very well. From
v2sd(m2/s2)
6-.
5-
4
3H
2
1-
0-
first visual vation of gi the downcomer.
x 0.57 m3 ALR (atmosferic top pressure) • 0.57 m3 ALR (low top pressure) o 0.165 m3 ALR
0.04 0.08 0.12 0.16 a r ( - )
Fig. 3 The gas hold-up in the riser as a function of the square liquid velocity in the downcomer
the graph it appears that the friction coefficient is independent of the
liquid velocity and of changes in gas hold-up. Only for the larger ALR,
under atmosferic conditions, does a deviation from the straight line occur
at large gas injection rates. The deviation coincides with visual obser
vations of air entrainment into the downcomer which is a result of
incomplete deaeration at the top of the ALR. In the vacuum the flow at the
top was deaerated completely. For the smaller ALR, eqn(14) holds and no
significant amount of air was entrained into the downcomer. It can be
concluded that the total friction in an ALR can be derived from simple one-
phase flow calculations based on known data for the friction factor.
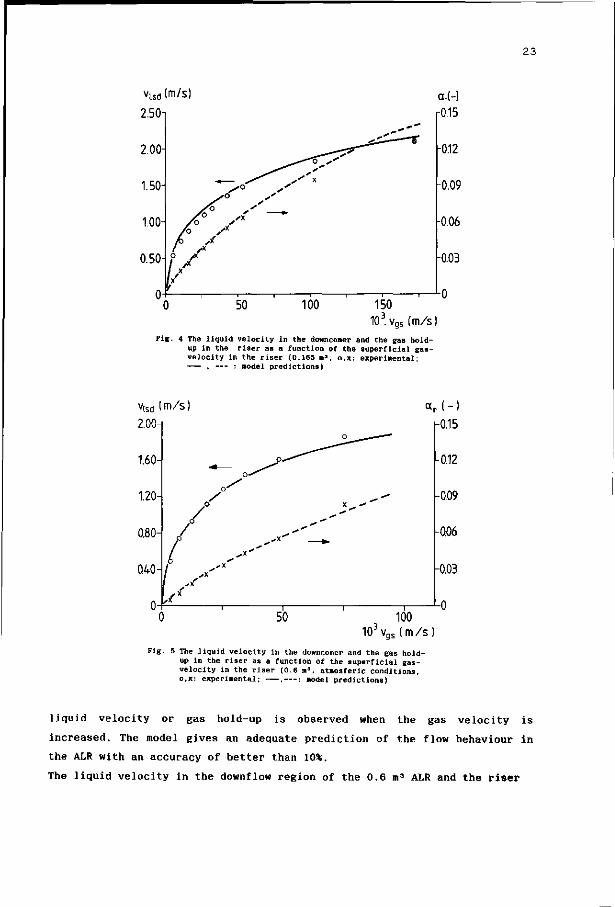
A model evaluation is shown in figure 4 together with the experimental
results of the 0.165 m3 pilot-plant ALR for the liquid velocity in the down
comer as well as the gas hold-up in the riser. For low gas input rates the
liquid velocities and the gas hold-ups are very sensitive to changes in the
gas input rate. For high input rates, however, only a minor increment of
23
vlSd (m/s)
2.50T
Fie- 4 The liquid velocity in the downcomer and the gas holdup in the riser as a function of the superficial gas-velocity in the riser (0.165 a*, o,x: experimental;
, : model predictions)
Visd (m/s)
2.00
10 vgs ( m / s !
Pig. 5 The liquid velocity in the downcomer and the gas holdup in the riser as a function of the superficial gas-velocity in the riser (0.6 mJ. atmosferic conditions, o,x: experimental; , : nodel predictions)
liquid velocity or gas hold-up is observed when the gas velocity is
increased. The model gives an adequate prediction of the flow behaviour in
the ALR with an accuracy of better than 10%.
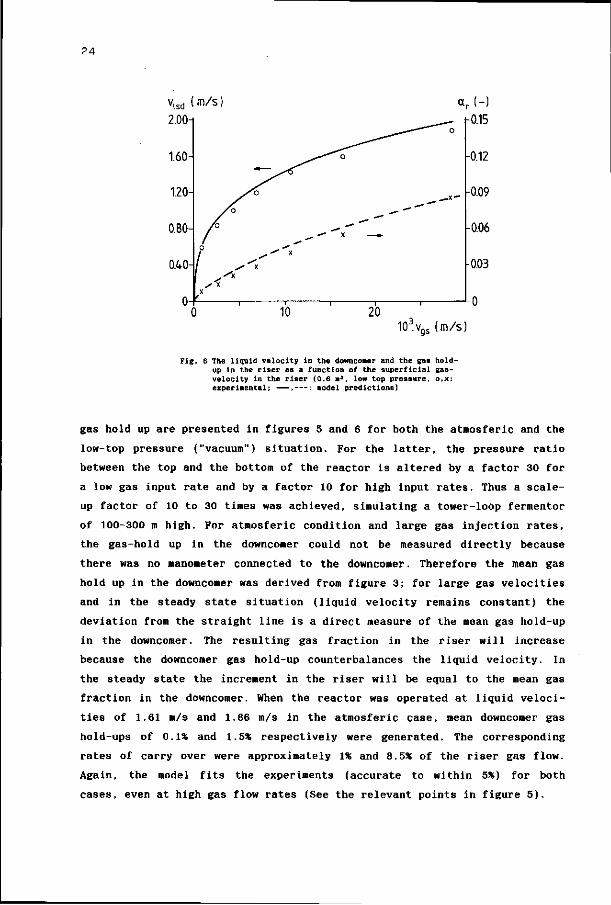
The liquid velocity in the downflow region of the 0.6 m3 ALR and the riser
2 4
V l5d ( m / s
2.00
10 3 v g s (m / s )
Fig. 6 The liquid velocity in the downconer and the gas holdup in the riser as a function of the superficial gas-velocity in the riser (0.6 na, IOM top pressure, o,x: experinental; , : model predictions)
gas hold up are presented in figures 5 and 6 for both the atmosferic and the
low-top pressure ("vacuum") situation. For the latter, the pressure ratio
between the top and the bottom of the reactor is altered by a factor 30 for
a low gas input rate and by a factor 10 for high input rates. Thus a scale-
up factor of 10 to 30 times was achieved, simulating a tower-loop fermentor
of 100-300 m high. For atmosferic condition and large gas injection rates,
the gas-hold up in the downcomer could not be measured directly because
there was no manometer connected to the downcomer. Therefore the mean gas
hold up in the downcomer was derived from figure 3; for large gas velocities
and in the steady state situation (liquid velocity remains constant) the
deviation from the straight line is a direct measure of the mean gas hold-up
in the downcomer. The resulting gas fraction in the riser will increase
because the downcomer gas hold-up counterbalances the liquid velocity. In
the steady state the increment in the riser will be equal to the mean gas
fraction in the downcomer. When the reactor was operated at liquid veloci
ties of 1.61 m/s and 1.86 m/s in the atmosferic case, mean downcomer gas
hold-ups of 0.1% and 1.5* respectively were generated. The corresponding
rates of carry over were approximately 1* and 8.5* of the riser gas flow.
Again, the model fits the experiments (accurate to within 5*) for both
cases, even at high gas flow rates (See the relevant points in figure 5 ) .
25
<M-I
100 z 1-)
Fig. 7 Local gas hold-up In the 0.6 m3
ALR (atmosferlc top pressure). Experiments compared with model calculations
O =1.6 x =1.42 • =1.2 i =1.0
0 0.25 0.50 0.75 1.00
Fig. 8 Local gas hold-up In the 0.6 n> ALR (low top pressure). Experiments compared with model calculations
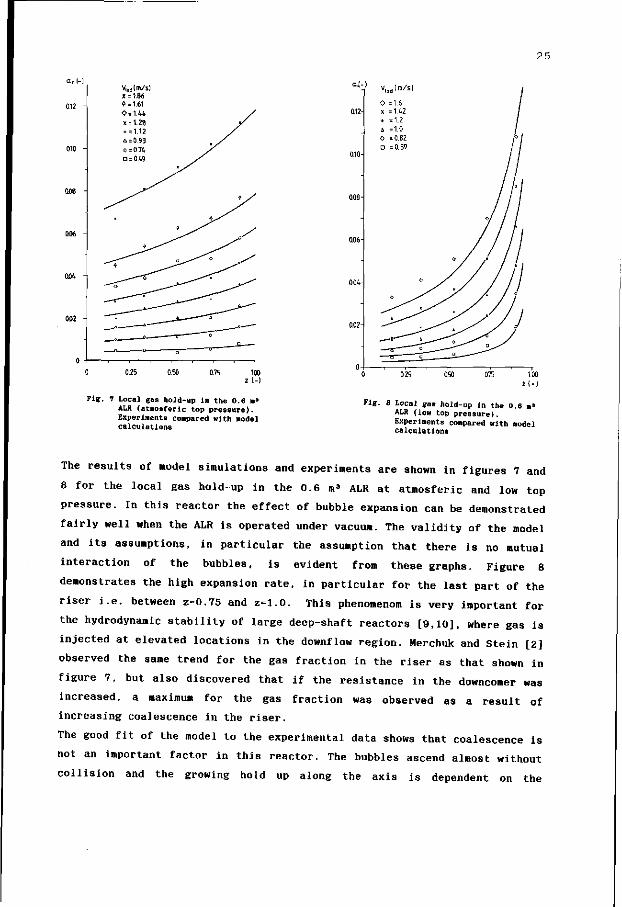
The results of model simulations and experiments are shown in figures 7 and
8 for the local gas hold-up in the 0.6 m3 ALR at atmosferic and low top
pressure. In this reactor the effect of bubble expansion can be demonstrated
fairly well when the ALR is operated under vacuum. The validity of the model
and its assumptions, in particular the assumption that there is no mutual
interaction of the bubbles, is evident from these graphs. Figure 8
demonstrates the high expansion rate, in particular for the last part of the
riser i.e. between z=0.75 and z=1.0. This phenomenon! is very important for
the hydrodynamic stability of large deep-shaft reactors [9,10], where gas is
injected at elevated locations in the downflow region. Merchuk and Stein [2]
observed the same trend for the gas fraction in the riser as that shown in
figure 7, but also discovered that if the resistance in the downcomer was
increased, a maximum for the gas fraction was observed as a result of
increasing coalescence in the riser.
The good fit of the model to the experimental data shows that coalescence is
not an important factor in this reactor. The bubbles ascend almost without
collision and the growing hold up along the axis is dependent on the
26
0.16
0.12
0.08
0.04
0
. ̂ =19.3 .10 m/s
0 0.1 0.2 0.3 0.4 0.5 I (mol/l)
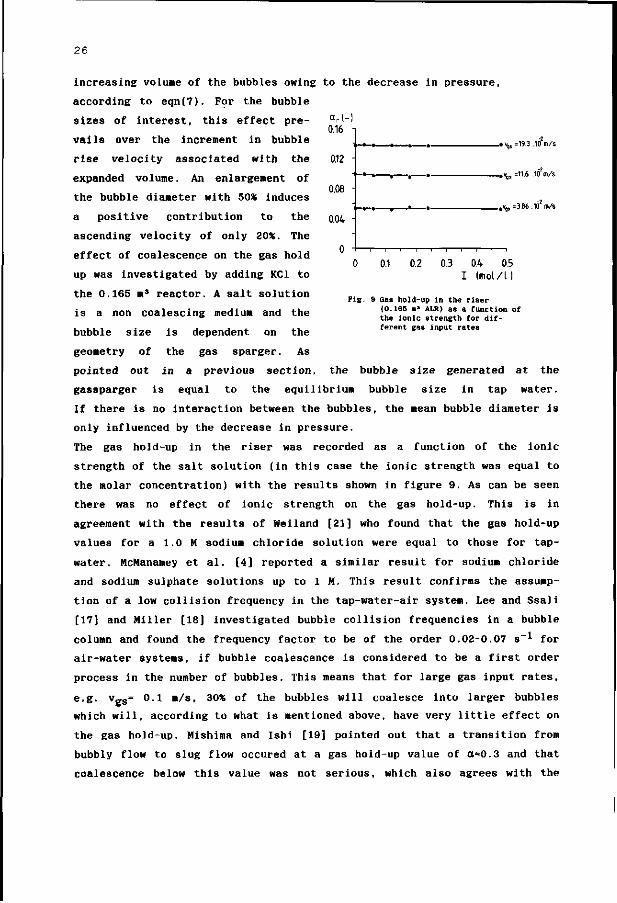
Fig. 9 Gas hold-up in the riser (0.165 »' ALR) as a function of the ionic strength for different gas input rates
increasing volume of the bubbles owing to the decrease in pressure,
according to eqn(7). For the bubble
sizes of interest, this effect pre
vails over the increment in bubble
rise velocity associated with the
expanded volume. An enlargement of
the bubble diameter with 50* induces
a positive contribution to the
ascending velocity of only 20%. The
effect of coalescence on the gas hold
up was investigated by adding KC1 to
the 0.165 ms reactor. A salt solution
is a non coalescing medium and the
bubble size is dependent on the
geometry of the gas sparger. As
pointed out in a previous section, the bubble size generated at the
gassparger is equal to the equilibrium bubble size in tap water.
If there is no interaction between the bubbles, the mean bubble diameter is
only influenced by the decrease in pressure.
The gas hold-up in the riser was recorded as a function of the ionic
strength of the salt solution (in this case the ionic strength was equal to
the molar concentration) with the results shown in figure 9. As can be seen
there was no effect of ionic strength on the gas hold-up. This is in
agreement with the results of Wei land [21] who found that the gas hold-up
values for a 1.0 M sodium chloride solution were equal to those for tap-
water. McManamey et al. [4] reported a similar result for sodium chloride
and sodium sulphate solutions up to 1 M. This result confirms the assump
tion of a low collision frequency in the tap-water-air system. Lee and Ssali
[17] and Miller [18] investigated bubble collision frequencies in a bubble
column and found the frequency factor to be of the order 0.02-0.07 s _ 1 for
air-water systems, if bubble coalescence is considered to be a first order
process in the number of bubbles. This means that for large gas input rates,
e.g. vg s= 0.1 m/s, 30% of the bubbles will coalesce into larger bubbles
which will, according to what is mentioned above, have very little effect on
the gas hold-up. Mishima and Ishi [19] pointed out that a transition from
bubbly flow to slug flow occured at a gas hold-up value of a=0.3 and that
coalescence below this value was not serious, which also agrees with the
27
present results.
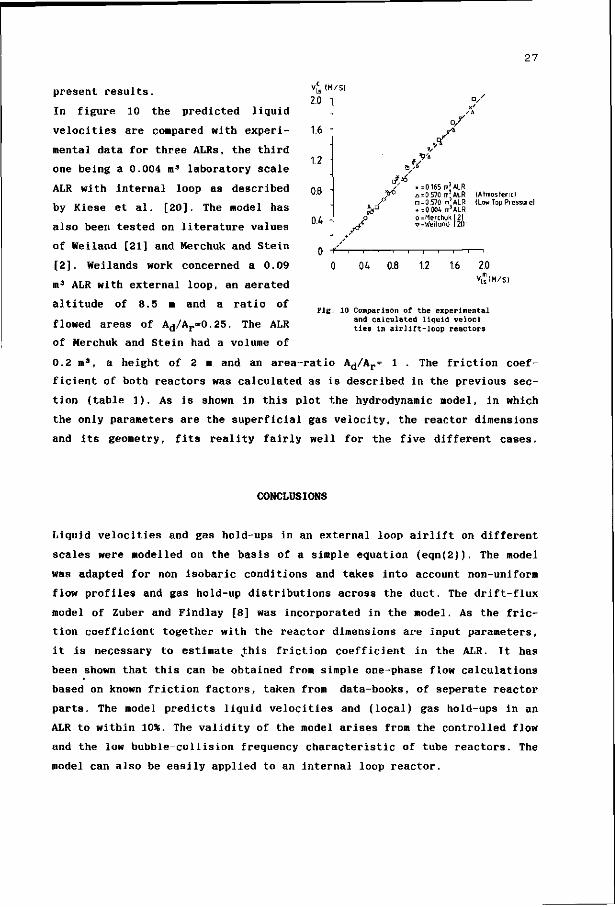
In figure 10 the predicted liquid
velocities are compared with experi
mental data for three ALRs, the third
one being a 0.004 m3 laboratory scale
ALR with internal loop as described
by Kiese et al. [20]. The model has
also been tested on literature values
of Weiland [21] and Merchuk and Stein
[2]. Wei lands work concerned a 0.09
m3 ALR with external loop, an aerated
altitude of 8.5 m and a ratio of
flowed areas of Ad/Ar=0.25. The ALR
of Merchuk and Stein had a volume of
V,ls (M/S)
2.0 "
1.6 •
1.2
0.8 "
0.4 -
/ V
0
&D p
/?
1
0.1*
q / '
J,* / x=0165 m ! ALR y ° a = 0 570 m5 ALR
' ° D =0.570 m3ALR » =0.004 m3ALR o=Merct iuk[2l <7=Weilond [2ft
i i l l i
0.8 1.2 16
A
(Atmosferic) (Low Top Pressure)
1
20 V,s (M/S)
Fig. 10 Comparison of the experimental and calculated liquid veloci ties in airlift-loop reactors
0.2 m3, a height of 2 m and an area-ratio Ad/Ar= 1 . The friction coef
ficient of both reactors was calculated as is described in the previous sec
tion (table 1). As is shown in this plot the hydrodynamic model, in which
the only parameters are the superficial gas velocity, the reactor dimensions
and its geometry, fits reality fairly well for the five different cases.
CONCLUSIONS
Liquid velocities and gas hold-ups in an external loop airlift on different
scales were modelled on the basis of a simple equation (eqn(2)). The model
was adapted for non isobaric conditions and takes into account non-uniform
flow profiles and gas hold-up distributions across the duct. The drift-flux
model of Zuber and Findlay [8] was incorporated in the model. As the fric
tion coefficient together with the reactor dimensions are input parameters,
it is necessary to estimate .this friction coefficient in the ALR. It has
been shown that this can be obtained from simple one-phase flow calculations
based on known friction factors, taken from data-books, of seperate reactor
parts. The model predicts liquid velocities and (local) gas hold-ups in an
ALR to within 10%. The validity of the model arises from the controlled flow
and the low bubble-collision frequency characteristic of tube reactors. The
model can also be easily applied to an internal loop reactor.
28
ACKNOWLEDGEMENT
The authors are grateful to prof J.M. Smith, Laboratory of Physical
Technology, Delft University of Technology, for the use of the pilot plant
(0.6 m3) airlift-loop reactor.
REFERENCES
[I] U. Onken and P. Wei land. Hydrodynamics and mass transfer in an airlift loop fermenter. Eur. J. Appl. Microbiol. Biotechnol., 10 (1980) 31-40.
[2] J.C. Merchuk and Y. Stein. Local hold up and liquid velocity in airlift reactors. AIChE J., 27 (1981) 377-388.
[3] D.G. Mercer. Flow characteristics of a pilot-scale airlift fermentor. Biotechnol. & Bioeng., 23 (1981) 2421.
[4] W.J. McManamey, D.A.J. Wase, S. Raymahasay and K. Thayamithy. The influence of gas inlet design on gas hold-up values for water and various solutions in a loop-type air-lift fermenter. J. Chem. Technol. Biotechnol., 34B (1984) 151-164.
[5] R.A. Bello, C.W. Robinson and M. Moo-Young. Gas hold up and overall volumetric oxygen transfer coefficient in airlift contactors Biotechnol. & Bioeng., 27 (1985) 369-381.
[6] N.N. Clark and R.L. Flemmer. Predicting the hold up in two-phase bubble upflow and downflow using the Zuber and Findlay drift-flux model. AIChE J., 31 (1985) 500-503.
[7] R.T. Hatch. Experimental and theoretical studies of oxygen transfer in the airlift fermentor, Thesis, M.I.T., Cambridge, 1973.
[8] N. Zuber and J.A. Findlay. Average volumetric concentration in two-phase flow systems. J. Heat Transfer, Nov. (1965) 453-468.
[9] R.G.J.M. van der Lans. Hydrodynamics of a bubble column loop reactor, Dissertation, Delft University of Technology, Delft, 1985.
[10] H. Kubota, Y. Hosono and K. Fujie. Characteristic evaluations of ICI air-lift type deep shaft aerator. J. Chem. Eng. Jap., 11 (1978) 319-325.
[II] A.G. Jones. Liquid circulation in a draft-tube bubble column. Chem. Eng. Sci., 40 (1985) 449-462.
[12] J.J. Heynen and K. van " t Riet. Mass transfer, mixing and heat transfer phenomena in low viscous bubble column reactors. Proc. 4 t n
Eur. Conf. Mixing, Noordwijkerhout, 1982. [13] G.B. Wall is. One dimensional two phase flow, McGraw-Hill, New York,
1969. [14] T. Menzel, H.J. Kantorek, K. Franz, R. Buchholz and U. Onken. Zur
stroraungsstruktur in Airlift-Schlaufenreaktoren. Chem. Ing. Tech., 57 (1985) 139-141.
[15] A. Serizawa, I. Kataoka and I. Michiyoshi. Turbulence structure of air-water bubbly flow-II. Local properties. Int. J. Multiphase Flow, 2 (1975) 235-246. H. Blenke. Biochemical loop reactors,VCH, Weinheim, 1985. J.C. Lee and G.W.K. Ssali. Bubble transport and coalescence in a vertical pipe, VDI, Berlin, 1973, Sl-6.1 Sl-6.6.
[18] D.N. Miller. Interfacial area, bubble coalescence and mass transfer in bubble column reactors. AIChE J., 29 (1983) 312-319.
[19] K. Mishima and M. Ishii. Flow regime transition criteria for upward two-phase flow in vertical tubes. Int. J. Heat Mass Transfer, 27 (1984) 723-737.
[20] S. Kiese, H.G. Ebner and U. Onken. A simple laboratory airlift fermentor. Biotechnol. Letters, 8 (1980) 345-350.
[21] P. Weiland. Untersuchung eines Airliftreaktors mit Au/3erem Umlauf im Hinblick auf seine Anwendung als Bioreaktor, Dissertation, University of Dortmund, Dortmund, 1978.
i;?i
29
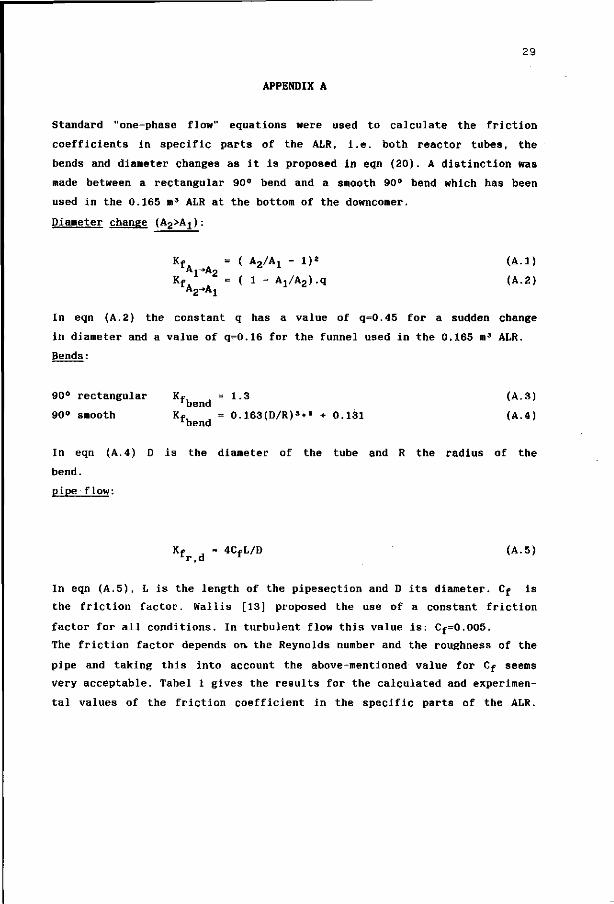
APPENDIX A
Standard "one-phase flow" equations were used to calculate the friction
coefficients in specific parts of the ALR, i.e. both reactor tubes, the
bends and diameter changes as it is proposed in eqn (20). A distinction was
made between a rectangular 90° bend and a smooth 90° bend which has been
used in the 0.165 m3 ALR at the bottom of the downcomer.
Diameter change (A2>A1):
KfA ^ = ( A2/A! - 1)* (A.l)
K f / 2 = ( 1 - Aj/AaJ.q (A.2) A2"A1
In eqn (A.2) the constant q has a value of q=0.45 for a sudden change
in diameter and a value of q=0.16 for the funnel used in the 0.165 m3 ALR.
Bends:
90° rectangular Kf = 1.3 (A.3) 1bend
90° smooth Kf, = 0.163(D/R)3«5 + 0.131 (A.4) Lbend
In eqn (A.4) D is the diameter of the tube and R the radius of the
bend.
pipe-flow:
Kf = 4CfL/D (A.5) lr,d L
In eqn (A.5), L is the length of the pipesection and D its diameter. Cj is
the friction factor. Wallis [13] proposed the use of a constant friction
factor for all conditions. In turbulent flow this value is: Cf=0.005.
The friction factor depends on. the Reynolds number and the roughness of the
pipe and taking this into account the above-mentioned value for Cf seems
very acceptable. Tabel 1 gives the results for the calculated and experimen
tal values of the friction coefficient in the specific parts of the ALR.
30
A
B
C
D,d
K
L
P.P
R
g
q
V
z
NOMENCLATURE
area
width
distribution parameter
diameter
friction coefficient
length
pressure
radius of the bend
gravitational constant
constant
velocity
coordinate
[m2]
[•]
[-]
[•]
[-]
[•]
[Pa]
[•]
[m/s2]
[-]
[m/s]
[m]
Greek symbols
a
a'
A
P
*
gas hold up
approximation
difference
density
flow
of the gas hold
Subscripts
up
[-]
[-]
[-]
[kg/m3]
[m3/s]
bubble
downcomer
friction
gas
hydrostatic
liquid
mass,mixture
riser
slip,superficial
volumetric
31
CHAPTER THREE
ESTIMATION OF AXIAL DISPERSION IN INDIVIDUAL SECTIONS
OF AN AIRLIFT-LOOP REACTOR
P. Verlaan, A.M.M. van Eijs, J. Tramper and K. van 't Riet,
Department of Food Science, Food and Bioengineering Group,
Agricultural University,
De Dreyen 12, 6703 BC Wageningen, The Netherlands.
K.Ch.A.M. Luyben, Department of Biochemical Engineering,
Delft University of Technology,
Julianalaan 67, 2628 BC Delft.
ABSTRACT
Axial dispersion in the riser, downcomer and gas-disengagement section of an
airlift-loop reactor (ALR) with external loop was estimated and expressed by
the Bodenstein number. In contrast to existing methods, the new developed
procedure yields reliable results for the individual sections. Values of
Bo= 30-40 for the riser, 40-50 for the downcomer and 10 for the gas-disenga
gement section show that, except for this last section, the flow behaves
like plug flow with superimposed dispersion. Depending on the Bodenstein
number, the pertinent ALR is fully mixed within 4-7 circulations. This
complete mixing time is used as a characteristic time in the presented
parameter-estimation method.
Submitted for publication.
32
INTRODUCTION
In biotechnological processes different types of bioreactors are presently
used, e.g. the conventional stirred tank reactors, bubble columns and the
more modern airlift-loop reactors. In an airlift-loop reactor (ALR), due to
the high circulation flow rate, efficient mixing is combined with a
controlled liquid flow. In such an ALR, axial dispersion has an influence on
oxygen and other substrate profiles, effecting the kinetics of (immobilized)
biocatalysts and thus the design of the ALR. Fields and Slater [1] for
instance, investigated the influence of liquid mixing in an ALR on the
respiration of micro-organisms and found that respiratory quotients are
affected by the local mixing behaviour. For such reasons it is important to
characterize liquid mixing in an ALR. Moreover, knowledge of the mixing
behaviour in a bioreactor is required for adequate modelling of biotech
nological processes.
Several investigators reported results on the characterization of axial
dispersion in bubble columns [2-4], However, in contrast to bubble columns
there is a lack of knowledge on the mixing behaviour in ALRs, especially in
the seperate parts of these loop reactors, i.e. the up and downflow region
and the gasdisengagement section. Weiland [5] and van der Lans [6] for
instance, presented axial dispersion coefficients in an individual section
of an ALR, viz. the riser [5] and the downcomer [6]. The mathematical method
they applied to asses these values (moment analysis and Laplace transformed
transfer functions) entailed serious problems due to the liquid circulation
in the ALR [6]. From their results it can be derived that the liquid flow in
these reactor sections behaves more or less like plug flow. The same authors
also determined dispersion coefficients for the reactor as a whole. Pulse
response techniques were applied to determine the overall dispersion parame
ters. Using this technique in an ALR with a plug flow character, the results
were severely influenced by the "quality" of the initial Dirac pulse. Fields
and Slater [7] who investigated axial dispersion in the head section of a
laboratory scale ALR with internal loop (working volume: 0.019-0.037 m 3 ) ,
also distinguished the problems mentioned above. Hatch [8] used a method of
moments for the estimation of axial dispersion coefficients in the upflow
section of an 0.2 m3 ALR with internal loop, for both the liquid and gas
phase. However, the author did not report on serious problems in determining
liquid phase dispersion coefficients due to liquid circulation. Verlaan et

33
al. [9] characterized axial dispersion in a laboratory-scale ALR (working
volume 0.004 m3) based on a pulse response technique and found a large
scatter in their results. Warnecke et al. [10,11] considered axial disper
sion and residence time distribution in a laboratory-scale liquid jet-loop
reactor. The authors discriminated between sections of different mixing
behaviour and developed a procedure to determine the main model parameters
of the reactor as a whole and of the individual sections. However for a high
degree of axial dispersion (small Bodenstein numbers) this method showed a
considerable scatter. From these references it can be concluded that the
initial tracer distribution and the circulating flow in an ALR impedes the
use of existing parameter estimation methods, especially for individual sec
tions of such a reactor.
In view of biological processes in which small characteristic times (time
constants) are of importance, it is essential to investigate axial disper
sion for the different sections of the ALR: riser, topsection
(gasdisengagement section) and downcomer. In the present work the mixing
performances of these three sections of a pilot plant ALR are presented. In
contrast to the above-mentioned mathematical methods, the parameter estima
tion method we developed is not affected by the shape of the tracer nor by
the circulation flow of the loop reactor. It will be shown that axial
dispersion for the reactor as a whole can be calculated from the contribu
tions of the individual sections.
THEORY
An axial dispersion model has been used to estimate the axial dispersion
coefficient in our loop reactor. The model assumes plug flow with disturban
ces caused by molecular diffusion, small eddies, dead zones and the liquid-
velocity profile (radial velocity gradients) lumped in an axial dispersion
coefficient. A mass balance over a liquid volume part in the reactor
neglecting radial concentration gradients, gives:
ae/ae = i/Bo.32c/ax2 - ae/ax d)
In this equation, c is the dimensionless concentration (c-c0)/(c00-c0), 8 the
dimensionless time t/tc, x the dimensionless axial <
dimensionless mixing parameter (Bodenstein number):
dimensionless time t/tc, x the dimensionless axial coordinate z/L and Bo the
34
Bo = (v.L)/D (2)
where v is the liquid velocity [m/s], L the length of interest [in] and D the
dispersion coefficient [m2/s]. The value of the Bodenstein number expresses
the degree of axial mixing. If Bodenstein is equal to zero mixing is
complete, whilst for very large Bodenstein numbers conditions approach plug
flow.
The solution of eqn(l) for an initial Dirac pulse in the ALR, taking into
account the circulating flow, is represented by [12]:
. Bo k oo -(x-e)2Bo 8- ( ) . I exp( ) (3)
4n8 x=l 40
Fitting the model to an experimental respons on an initial Dirac pulse
yields the Bodenstein number for the reactor. For large Bo-numbers the time
delay between the peaks of the response curve can be used as good approxima
tion for the circulation time [12]. This pulse response technique has been
commonly used in the literature [5-9]. However, since it is not possible to
create an ideal Dirac pulse, an experimental error is already included when
using this technique.
The Fourier transformed transfer function
When dispersion in an individual section of the reactor is considered the
circulation flow severly impedes the use of existing estimation methods
because the tail of a response is influenced by the sequential character of
the response. From this it is clear that characterization of axial disper
sion by the Bodenstein number in specific parts of an ALR requires a more
sophisticate approach.
The dispersion characteristics of a given linear system, such as in one
dimensional flow, are represented by the following convolution-product
[13]:
z(6)= / h(e).y(6-f)dt (4) o
This means that for an arbitrary input signal y(t) the output signal z(t)
can be calculated when the transfer function h(t) is known. In case of the
35
axial dispersion model, this transfer function is the response on an initial
Dirac pulse and can be analytically derived from eqn(l).
When eqn(4) is transformed to the Laplace domain defined by:
00
H(p)= / h(6).exp(-p.e)d8 (5) 0
the convolution becomes a mathematical product:
Z(p) = H(p).Y(p) (6)
In this equation, Z(p) and Y(p) are the Laplace transformed output and input
functions, respectively. H(p) is the Laplace transformed transfer function
and p the dimensionless Laplace operator. From eqn(5) the transfer function
in the Fourier domain can be calculated (see the appendix) when the imagi
nary part, iw, of the Laplace operator is considered:
H(i«,x) = Re(H(iu))+i.Im(H(iu)) (7)
Combination of eqns (6) and (7) yields the Fourier transformed output func
tion, calculated from the (experimental) input function.
Time domain analysis
As pointed out by Fahim and Wakao [14] time domain analysis is in favour of
other existing parameter estimation methods; with this method the most
reliable values are obtained. Therefore the Fourier transformed output func
tion calculated from eqn(6), is transferred by an inverse Fourier transfor
mation to the time domain, defined by:
00
h(6)= / H(p).exp(p.e)dp (8) -00
The calculated output signal is fitted to the experimental output
signal according to the least square criterium. This method yields a
36
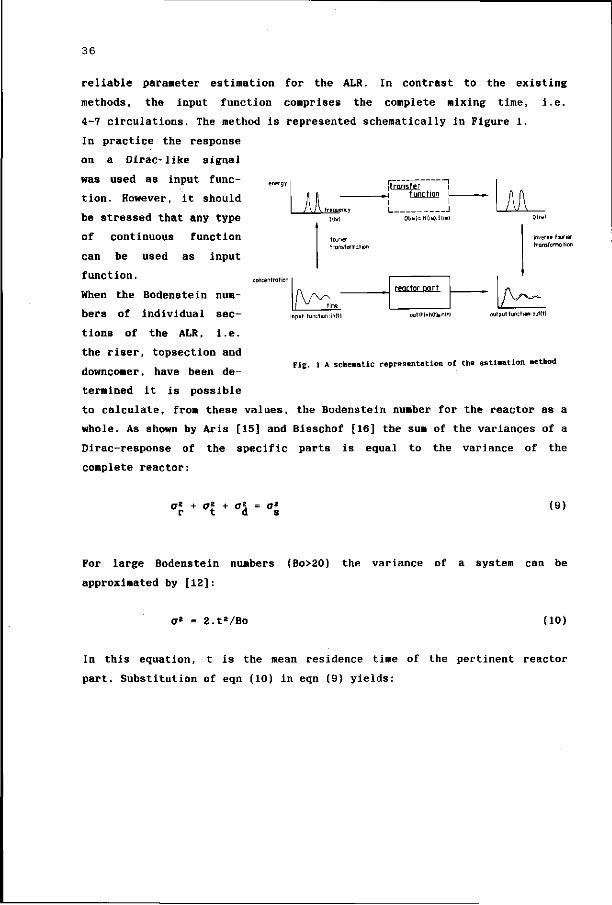
reliable parameter estimation for the ALR. In contrast to the existing
methods, the input function comprises the complete mixing time, i.e.
4-7 circulations. The method is represented schematically in Figure 1.
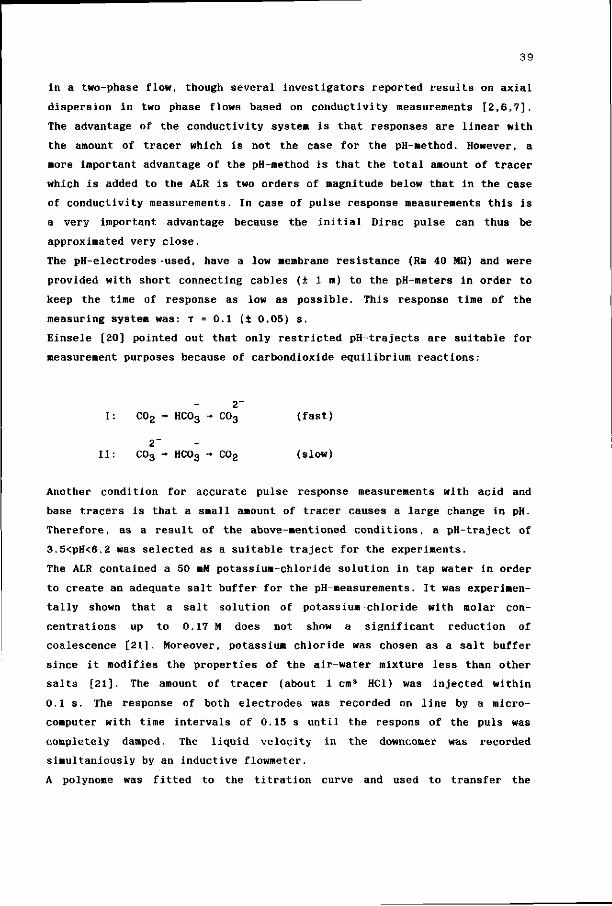
In practice the response
on a Dirac-like signal
was used as input func
tion. However, it should
be stressed that any type
of continuous function
can be used as input
function.
When the Bodenstein num
bers of individual sec
tions of the ALR, i.e.
the riser, topsection and
downcomer, have been de
termined it is possible
to calculate, from these values, the Bodenstein number for the reactor as a
whole. As shown by Aris [15] and Bisschof [16] the sum of the variances of a
Dirac-response of the specific parts is equal to the variance of the
complete reactor:
energy
concentration
A
/v nput fun
\ Itiwl
founer transformation
time
tion: in(t]
transfer function
- J Oliw)=H[iw).Hiw
reactor part
out(t)=h(tkin{t ou
A/ \ Odwl
inverse founer transforma tion
put function out(t)
Fig. 1 A schematic representation of the estimation method
gZ + gZ + gZ = gZ
r t d s (9)
For large Bodenstein numbers (Bo>20) the variance of a system can be
approximated by [12]:
2.WBo (10)
In this equation, t is the mean residence time of the pertinent reactor
part. Substitution of eqn (10) in eqn (9) yields:
37
t|/Bos = t£/Bor + t|/Bot + t^/Bod (11)
From eqn (11) the Bodenstein number for the ALR is calculated, provided that
the mean residence time in the pertinent sections are known and Bo > 20 in
these sections.
Application of a digital computer for the Fourier transformed
transfer function
Non-periodical functions like the damped sinoidal input function we use, can
be transformed to the Fourier domain. In this case the function is made
periodic by using the mixing time as a period (characteristic time). As a
result, the complete response on a Dirac-like pulse is considered as one
period.
The Fourier transformation (CFT) gives a continuous spectrum in the fre
quency domain. A digital computer cannot perform the integration indicated
by eqn (5). Thus the CFT has to be approximated at discrete frequencies by a
method known as the discrete Fourier transformation (DFT). The DFT is repre
sented mathematically as:
H(-5- ) = f h(k.dt).exp(-i.2irn*) (n= 0,1,...N-l) (12) N.dt k=0 N
The mathematical expression of the inverse DFT is:
h(k.dt) = 1 [ H ( — — ).exp(i.27rn-) (k=0,l...,N-1) (13) N n=0 N.dt N
In the equations above, dt and N are the time intervals between two measured
points and the total number of points, respectively. The frequency spectrum
of the CFT has now been replaced by a number (n) of frequencies:
f = n/(N.dt) (14)
38
This means that the time interval between two points, dt, has to be chosen
carefully in order not to loose essential information. A condition for this
is that the function to be transferred must be sampled at a rate greater
than twice the highest frequency component of interest in the function.
The DFT we applied was a special variant namely the Fast-Fourier transfor
mation (FFT) [17]. The FFT provides an efficient means of numerically
approximating analytical or continuous Fourier transforms. When a FFT or a
DFT is used one has to take into account that in fact the product of three
functions are transferred to the Fourier domain: the continuous function,
the discretisation function and in the case of a FFT, the boundary function.
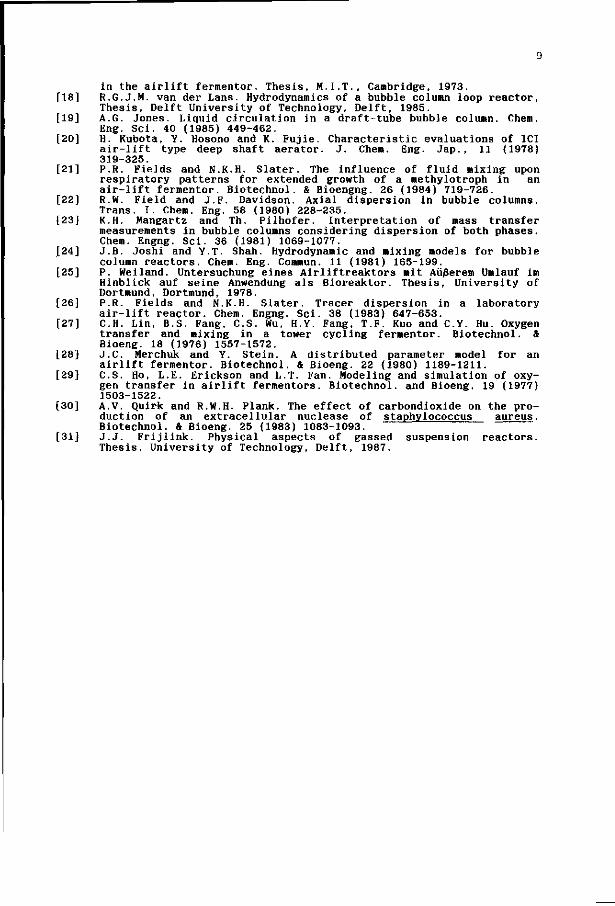
MATERIALS AND METHODS
stainless steel topsection viewwindow
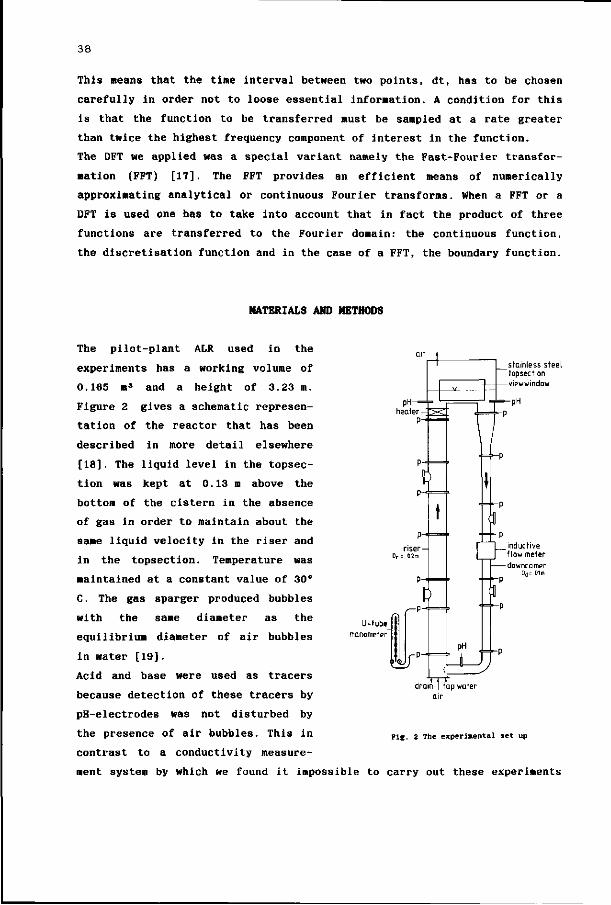
The pilot-plant ALR used in the
experiments has a working volume of
0.165 m3 and a height of 3.23 m.
Figure 2 gives a schematic represen
tation of the reactor that has been
described in more detail elsewhere
[18]. The liquid level in the topsec
tion was kept at 0.13 m above the
bottom of the cistern in the absence
of gas in order to maintain about the
same liquid velocity in the riser and
in the topsection. Temperature was
maintained at a constant value of 30°
C. The gas sparger produced bubbles
with the same diameter as the
equilibrium diameter of air bubbles
in water [19].
Acid and base were used as tracers
because detection of these tracers by
pH-electrodes was not disturbed by
the presence of air bubbles. This in plE 2 The experimental set up
contrast to a conductivity measure
ment system by which we found it impossible to carry out these experiments
drain 1 tap water air
39
in a two-phase flow, though several investigators reported results on axial
dispersion in two phase flows based on conductivity measurements [2,6,7].
The advantage of the conductivity system is that responses are linear with
the amount of tracer which is not the case for the pH-method. However, a
more important advantage of the pH-method is that the total amount of tracer
which is added to the ALR is two orders of magnitude below that in the case
of conductivity measurements. In case of pulse response measurements this is
a very important advantage because the initial Dirac pulse can thus be
approximated very close.
The pH-electrodes used, have a low membrane resistance (Rs 40 MQ) and were
provided with short connecting cables (± 1 m) to the pH-meters in order to
keep the time of response as low as possible. This response time of the
measuring system was: T = 0.1 (± 0.05) s.
Einsele [20] pointed out that only restricted pH-trajects are suitable for
measurement purposes because of carbondioxide equilibrium reactions:
I: C02 - HC03 - C0 3 (fast)
2~ II: C03 - HCO3 - C02 (slow)
Another condition for accurate pulse response measurements with acid and
base tracers is that a small amount of tracer causes a large change in pH.
Therefore, as a result of the above-mentioned conditions, a pH-traject of
3.5<pH<6.2 was selected as a suitable traject for the experiments.
The ALR contained a 50 mM potassium-chloride solution in tap water in order
to create an adequate salt buffer for the pH-measurements. It was experimen
tally shown that a salt solution of potassium-chloride with molar con
centrations up to 0.17 M does not show a significant reduction of
coalescence [21]. Moreover, potassium chloride was chosen as a salt buffer
since it modifies the properties of the air-water mixture less than other
salts [21]. The amount of tracer (about 1 cm3 HC1) was injected within
0.1 s. The response of both electrodes was recorded on line by a micro
computer with time intervals of 0.15 s until the respons of the puis was
completely damped. The liquid velocity in the downcomer was recorded
simultaniously by an inductive flowmeter.
A polynome was fitted to the titration curve and used to transfer the
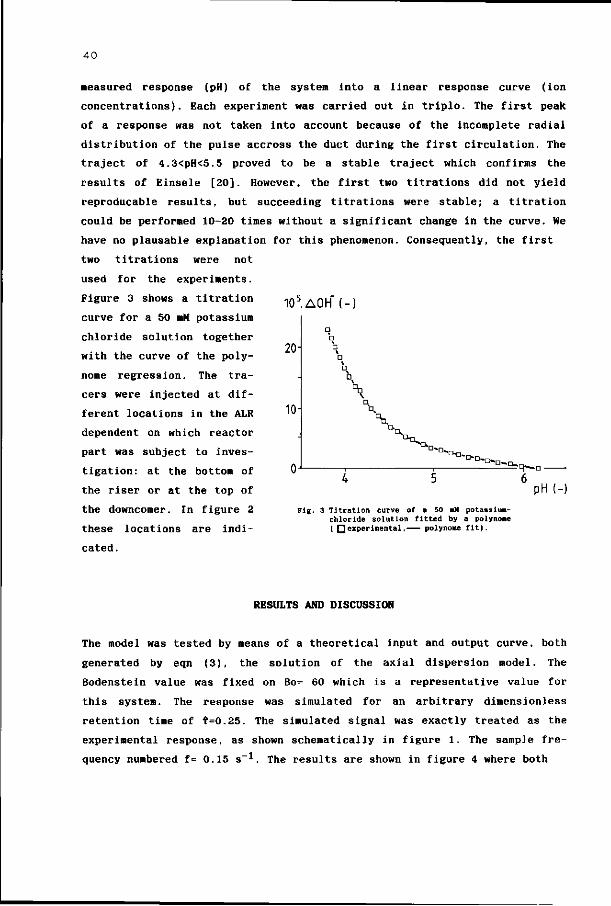
40
measured response (pH) of the system into a linear response curve (ion
concentrations). Each experiment was carried out in triplo. The first peak
of a response was not taken into account because of the incomplete radial
distribution of the pulse accross the duct during the first circulation. The
traject of 4.3<pH<5.5 proved to be a stable traject which confirms the
results of Einsele [20]. However, the first two titrations did not yield
reproducable results, but succeeding titrations were stable; a titration
could be performed 10-20 times without a significant change in the curve. We
have no plausable explanation for this phenomenon. Consequently, the first
two titrations were not
used for the experiments.
Figure 3 shows a titration
curve for a 50 mM potassium
chloride solution together
with the curve of the poly-
nome regression. The tra
cers were injected at dif
ferent locations in the ALR
dependent on which reactor
part was subject to inves
tigation: at the bottom of
the riser or at the top of
the downcomer. In figure 2
these locations are indi
cated.
10bAOH (-)
20
10 \
^ ~n-o..
D-D-o>n. -R-~D-
pH (-)
Fig. 3 Titration curve of a 50 mM potassium-chloride solution fitted by a polynone ( Q experimental, polynome fit).
RESULTS AND DISCUSSION
The model was tested by means of a theoretical input and output curve, both
generated by eqn (3), the solution of the axial dispersion model. The
Bodenstein value was fixed on Bo= 60 which is a representative value for
this system. The response was simulated for an arbitrary dimensionless
retention time of t=0.25. The simulated signal was exactly treated as the
experimental response, as shown schematically in figure 1. The sample fre
quency numbered f= 0.15 s- 1. The results are shown in figure 4 where both
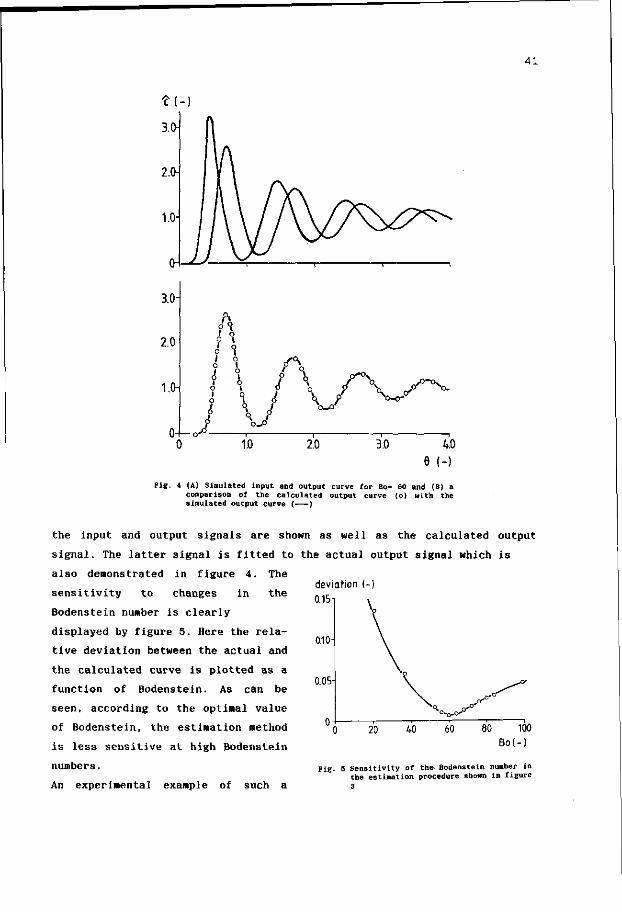
41
?(-)
3.0-
2.0-
1.0
3.0-
2.0-
1.0-
fk 1 o ? • ? f <? 1 <! ° 1 o
0 1 1 o O 1
P %n
* \ ? \ i ' i
o'
0-1- C b-0
1.0 2.0 3.0 4.0 6 (-)
Fig. 4 (A) Simulated input and output curve for Bo= 60 and (B) a comparison of the calculated output curve (o) with the simulated output curve ( )
the input and output signals are shown as well as the calculated output
signal. The latter signal is fitted to the actual output signal which is
also demonstrated in figure 4. The
sensitivity to changes in the
Bodenstein number is clearly
displayed by figure 5. Here the rela
tive deviation between the actual and
the calculated curve is plotted as a
function of Bodenstein. As can be
seen, according to the optimal value
of Bodenstein, the estimation method
is less sensitive at high Bodenstein
numbers.
An experimental example of such a
deviation
0.1B-.
0.10
0.05
20 40 60 80 100
Bo(-)
Fig. 5 Sensitivity of the. Bodenstein number in the estimation procedure shown in figure
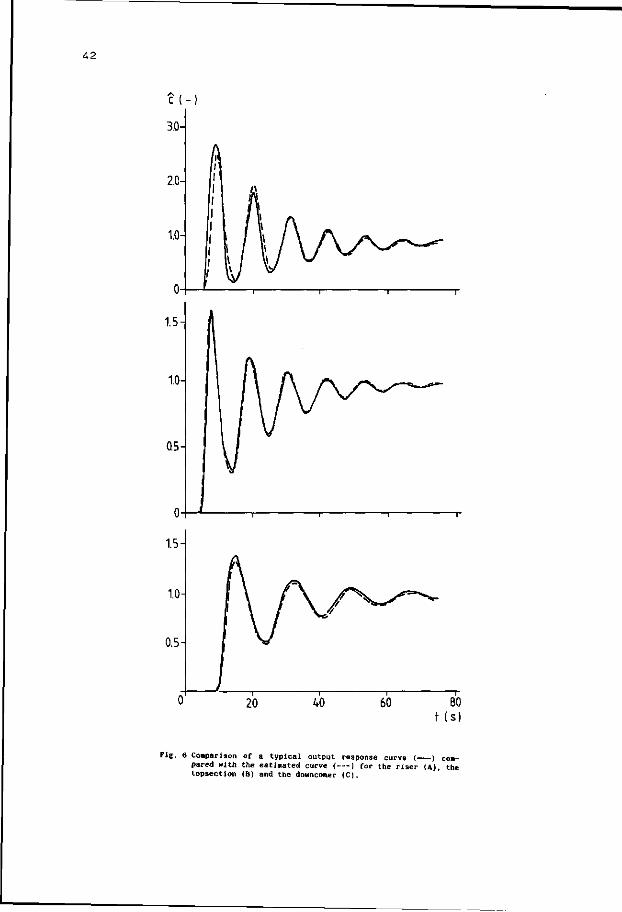
42
Fig. 6 Comparison of a typical output response curve ( ) con-pared with the estimated curve ( ) for the riser (A), the topsection (B) and the downcomer (C).
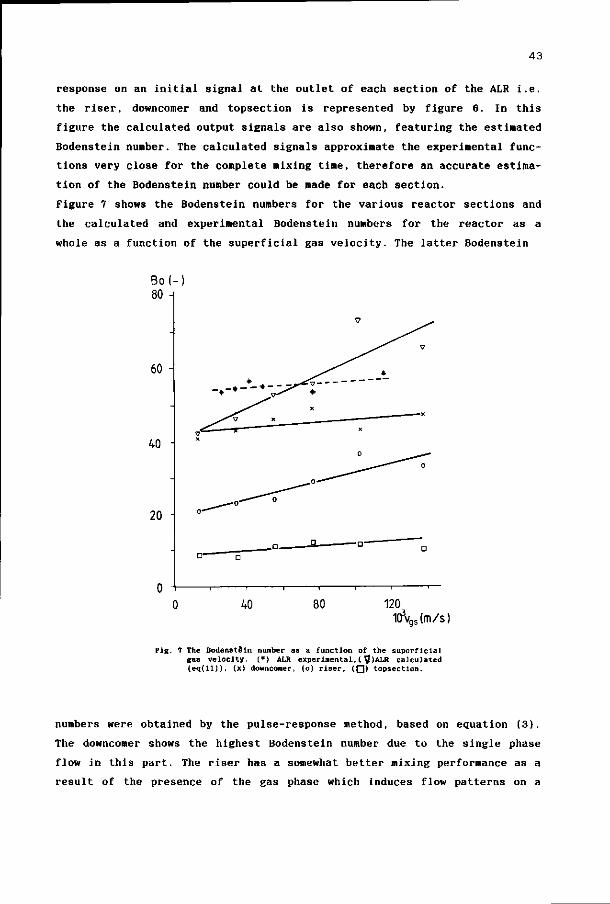
43
response on an initial signal at the outlet of each section of the ALR i.e.
the riser, downcomer and topsection is represented by figure 6. In this
figure the calculated output signals are also shown, featuring the estimated
Bodenstein number. The calculated signals approximate the experimental func
tions very close for the complete mixing time, therefore an accurate estima
tion of the Bodenstein number could be made for each section.
Figure 7 shows the Bodenstein numbers for the various reactor sections and
the calculated and experimental Bodenstein numbers for the reactor as a
whole as a function of the superficial gas velocity. The latter Bodenstein
Bo(-) 80
60
40 -
20
°" Q
40 80 120 lO'vgsfm/s)
Fig. 7 The Bodenste'in nunber as a function of the superficial gas velocity. (*) ALR experimental.( y)ALR calculated (eq(ll)), (x) downcomer, (o) riser. (Q) topsection.
numbers were obtained by the pulse-response method, based on equation (3).
The downcomer shows the highest Bodenstein number due to the single phase
flow in this part. The riser has a somewhat better mixing performance as a
result of the presence of the gas phase which induces flow patterns on a
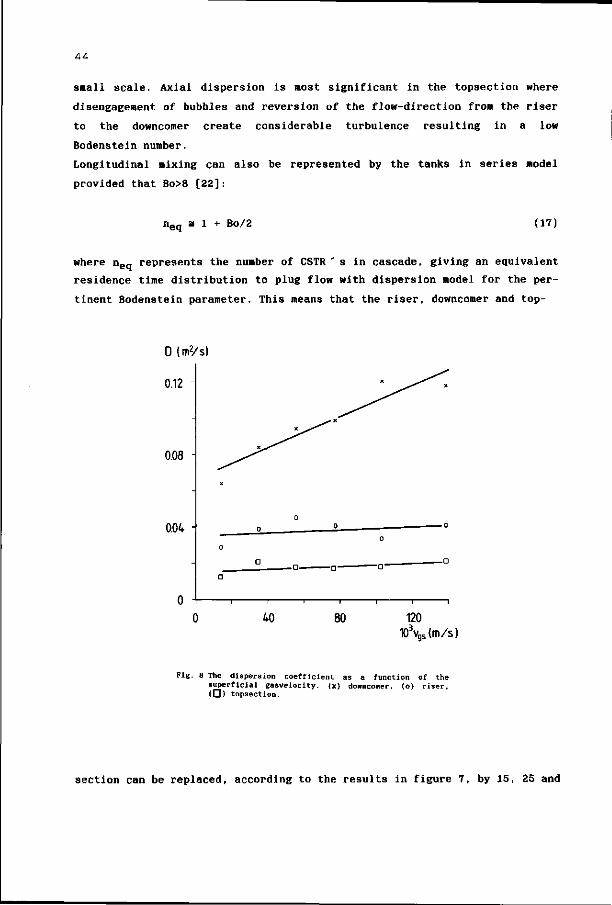
44
small scale. Axial dispersion is most significant in the topsection where
disengagement of bubbles and reversion of the flow-direction from the riser
to the downcomer create considerable turbulence resulting in a low
Bodenstein number.
Longitudinal mixing can also be represented by the tanks in series model
provided that 8o>8 [22]:
n e q a l + Bo/2 (17)
where n e q represents the number of CSTR ' s in cascade, giving an equivalent
residence time distribution to plug flow with dispersion model for the per
tinent Bodenstein parameter. This means that the riser, downcomer and top-
D (m2/s)
0.12 -
0.08
0.04
40 80 120 103VgS(m/s)
Pig. 8 The dispersion coefficient as a function of the superficial gasvelocity. (x) donncomer. (o) riser, ( Q ) topsection.
section can be replaced, according to the results in figure 7, by 15, 25 and
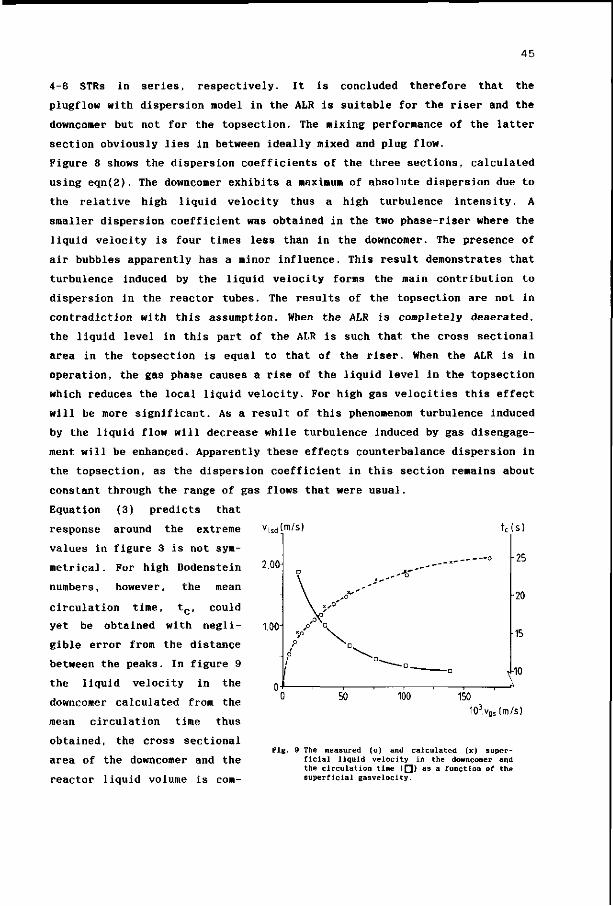
45
4-6 STRs in series, respectively. It is concluded therefore that the
plugflow with dispersion model in the ALR is suitable for the riser and the
downcomer but not for the topsection. The mixing performance of the latter
section obviously lies in between ideally mixed and plug flow.
Figure 8 shows the dispersion coefficients of the three sections, calculated
using e q n ( 2 ) . The downcomer exhibits a maximum of absolute dispersion due to
the relative high liquid velocity thus a high turbulence intensity. A
smaller dispersion coefficient was obtained in the two phase-riser where the
liquid velocity is four times less than in the downcomer. The presence of
air bubbles apparently has a minor influence. This result demonstrates that
turbulence induced by the liquid velocity forms the main contribution to
dispersion in the reactor tubes. The results of the topsection are not in
contradiction with this assumption. When the ALR is completely deaerated,
the liquid level in this part of the ALR is such that the cross sectional
area in the topsection is equal to that of the riser. When the ALR is in
operation, the gas phase causes a rise of the liquid level in the topsection
which reduces the local liquid velocity. For high gas velocities this effect
will be more significant. As a result of this phenomenom turbulence induced
by the liquid flow will decrease while turbulence induced by gas disengage
ment will be enhanced. Apparently these effects counterbalance dispersion in
the topsection, as the dispersion coefficient in this section remains about
constant through the range of gas flows that were usual.
Equation (3) predicts that
response around the extreme
values in figure 3 is not sym
metrical. For high Bodenstein
numbers, however, the mean
circulation time, t c , could
yet be obtained with negli
gible error from the distance
between the peaks. In figure 9
the liquid velocity in the
downcomer calculated from the
mean circulation time thus
obtained, the cross sectional
area of the downcomer and the
reactor liquid volume is com-
(m/s)
2.00
1.00
Ms)
-25
•20
1 10
50 100 150
Pig. 9 The measured (o) and calculated (x) superficial liquid velocity in the downcomer and the circulation time ( Q ) as a function of the superficial gasvelocity.

46
pared with the measured liquid velocity in the downcomer at various gas-
velocities [18]. As is shown in this figure, both curves agree well.
The mixing behaviour of the ALR can also be classified according to the
dimensionless mixing time (circulation number), tm, required to achieve a
certain degree of mixing throughout the reactor. The degree of mixing is
described in terms of the homogeneity h defined as:
h= c ~ cend (17) cend
The homogeneity h can be obtained from the envelope of the extremi of the
response curve (eq.(3)). When the dimensionless mixing time, tra, for a homo
geneity h=0.05 is correlated with the Bodenstein number, the following
emperic equation results:
tm = 0.093*Bo (18)
Equation (18) agrees with the results of Blenke [22] and with the results of
Murakami et al. [23] who derived a general expression for the dimensionless
mixing time, fm, in relation to the Bodenstein number for loop reactors. The
real mixing time, tm, is calculated from the dimensionless mixing time by:
tm " tc*tm (19)
From equation (18) it is derived that, depending on the Bodenstein number,
it takes about 4-7 circulations for the ALR to be mixed (h<0.05).
Accordingly, from eq (19) it follows that the mixing time, tm, varies from
93 to 61 seconds, respectively.
The experimental results are in agreement with the values found by Hatch [8]
who investigated axial dispersion in the draft tube of an internal loop ALR
and reported values of Bo=30-60 for a gas velocity in the range of
0.05<v„s<0.3 m/s. Weiland [5] reported values of Bo=60-80 for the upflow
region in an external loop ALR (0.005<v„s<0.05 m/s). These values represent
a fully established flow in a tall ALR (8.5 m) and are somewhat higher than
the values obtained in our study which represent the riser and its lower
appendages (90° bend plus a diameter change) . Van der Lans [6] reported
values of Bo= 70-80 for an ALR as a whole (0.005<vgs<0.03 m/s). The ALR
47
used, consisted of tall columns (10.5 m) with diameters of 0.225 m (riser)
and 0.1 m (downcomer). Because of its length the flow was better established
than in the present one, resulting in higher Bodenstein values.
CONCLUSIONS
The newly developed parameter estimation procedure has proven to be reliable
for determining the mixing behaviour in individual sections of an ALR. From
the results it can be concluded that in an ALR the liquid flow behaves like
plug flow with superimposed dispersion. This is expressed by the Bodenstein
number which reaches values of Bo=40-60 for the reactor as a whole, Bo=30-40
for the riser, Bo=40-50 for the downcomer and Bo=10 for the topsection. From
the latter result it follows that it is not reasonable to assume plug flow
in this last section. According to the mixing performance and the tank in
series model the topsection can be described by 4-6 tanks in series.
ACKNOWLEDGEMENT
The authors wish to thank Dr. H.N.J. Poulisse for his helpful discussions
during the preparation of the manuscript.
REFERENCES
[1] P.R. Fields and N.K.H. Slater. The influence of fluid mixing upon respiratory patterns for extended growth of a methylotroph in an air-lift fermentor. Biotechnol. & Bioengng. 26 (1984) 719-726.
[2] R.W. Field and J.F. pavidson. Axial dispersion in bubble columns. Trans. I. Chem. Eng. 58 (1980) 228-235.
[3] K.H. Mangartz and Th. Pilhofer. Interpretation of mass transfer measurements in bubble columns considering dispersion of both phases. Chem. Engng. Sci. 36 (1981) 1069-1077.
[4] J.B. Joshi and Y.T. Shah. Hydrodynamic and mixing models for bubble column reactors. Chem. Engng. Commun. 11 (1981) 165-199.
[5] P. Weiland. Untersuchung eines Airliftreaktors mit Au/3erem Umlauf im Hinblick auf seine Anwendung als Bioreaktor, Thesis, University of Dortmund, Dortmund GDR 1978.
[6] R.G.J.M. van der Lans. Hydrodynamics of a bubble column loop reactor. Thesis, Delft University of Technology, Delft the Netherlands 1986.
[7] P.R. Fields and N.K.H. Slater. Tracer dispersion in a laboratory airlift reactor. Chem. Engng. Sci. 38 (1983) 647-653.
[8] R.T. Hatch. Experimental and theoretical studies of oxygen transfer in the airlift fermentor. Thesis, M.I.T., Cambridge, Massachussetts 1973.
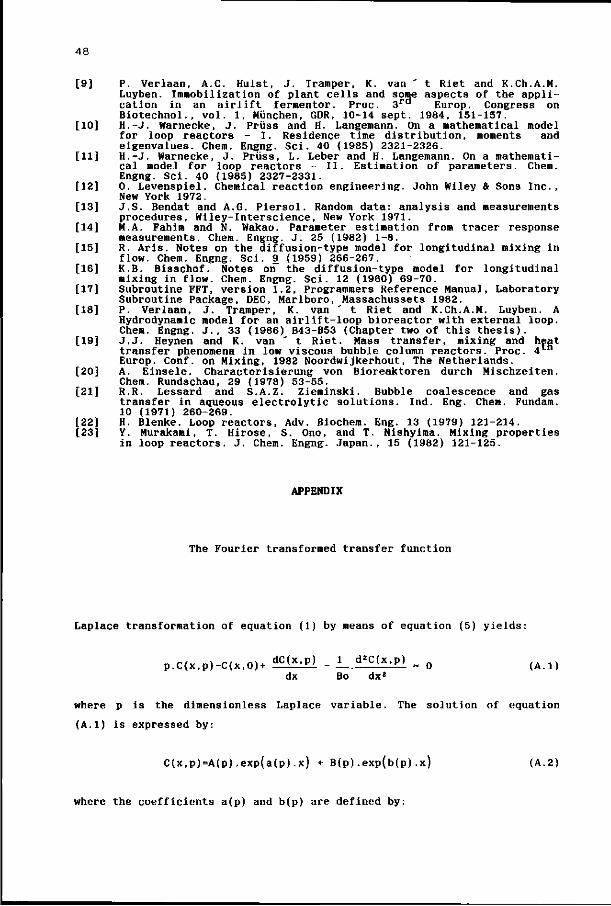
48
9] P. Verlaan, A.C. Hulst, J. Tramper, K. van ' t Riet and K.Ch.A.M. Luyben. Immobilization of plant cells and some aspects of the application in an airlift fermentor. Proc. 3 r d Europ. Congress on Biotechnol., vol. 1, Munchen, GDR, 10-14 sept. 1984, 151-157.
10] H.-J. Warnecke, J. Priiss and H. Langemann. On a mathematical model for loop reactors - I. Residence time distribution, moments and eigenvalues. Chem. Engng. Sci. 40 (1985) 2321-2326.
11] H.-J. Warnecke, J. Priiss, L. Leber and H. Langemann. On a mathematical model for loop reactors - II. Estimation of parameters. Chem. Engng. Sci. 40 (1985) 2327-2331.
12] 0. Levenspiel. Chemical reaction engineering. John Wiley & Sons Inc., New York 1972.
13] J.S. Bendat and A.G. Piersol. Random data: analysis and measurements procedures, Wiley-Interscience, New York 1971.
14] M.A. Fahim and N. Wakao. Parameter estimation from tracer response measurements. Chem. Engng. J. 25 (1982) 1-8.
15] R. Aris. Notes on the diffusion-type model for longitudinal mixing in flow. Chem. Engng. Sci. 9 (1959) 266-267.
16] K.B. Bisschof. Notes on the diffusion-type model for longitudinal mixing in flow. Chem. Engng. Sci. 12 (1960) 69-70.
17] Subroutine FFT, version 1.2, Programmers Reference Manual, Laboratory Subroutine Package, DEC, Marlboro, Massachussets 1982.
18] P. Verlaan, J. Tramper, K. van ' t Riet and K.Ch.A.M. Luyben. A Hydrodynamic model for an airlift-loop bioreactor with external loop. Chem. Engng. J., 33 (1986) B43-B53 (Chapter two of this thesis).
19] J.J. Heynen and K. van ' t Riet. Mass transfer, mixing and heat transfer phenomena in low viscous bubble column reactors. Proc. 4 Europ. Conf. on Mixing, 1982 Noordwijkerhout, The Netherlands.
20] A. Einsele. Characterisierung von Bioreaktoren durch Mischzeiten. Chem. Rundschau, 29 (1978) 53-55.
21] R.R. Lessard and S.A.Z. Zieminski. Bubble coalescence and gas transfer in aqueous electrolytic solutions. Ind. Eng. Chem. Fundam. 10 (1971) 260-269.
22] H. Blenke. Loop reactors, Adv. Biochem. Eng. 13 (1979) 121-214. 23] Y. Murakami, T. Hirose, S. Ono, and T. Nishyima. Mixing properties
in loop reactors. J. Chem. Engng. Japan., 15 (1982) 121-125.
APPENDIX
The Fourier transformed transfer function
Laplace transformation of equation (1) by means of equation (5) yields:
„ , > r*t n\ dC(x,p) 1 d2C(x,p) „ .. „, p.C(x,p)-C(x,0)+ —:—li_i - — -—-Z-L = 0 (A.l)
dx Bo dx*
where p is the dimensionless Laplace variable. The solution of equation
(A.l) is expressed by:
C(x,p)=A(p).exp(a(p).x) + B(p).exp(b(p).x) (A.2)
where the coefficients a(p) and b(p) are defined by:
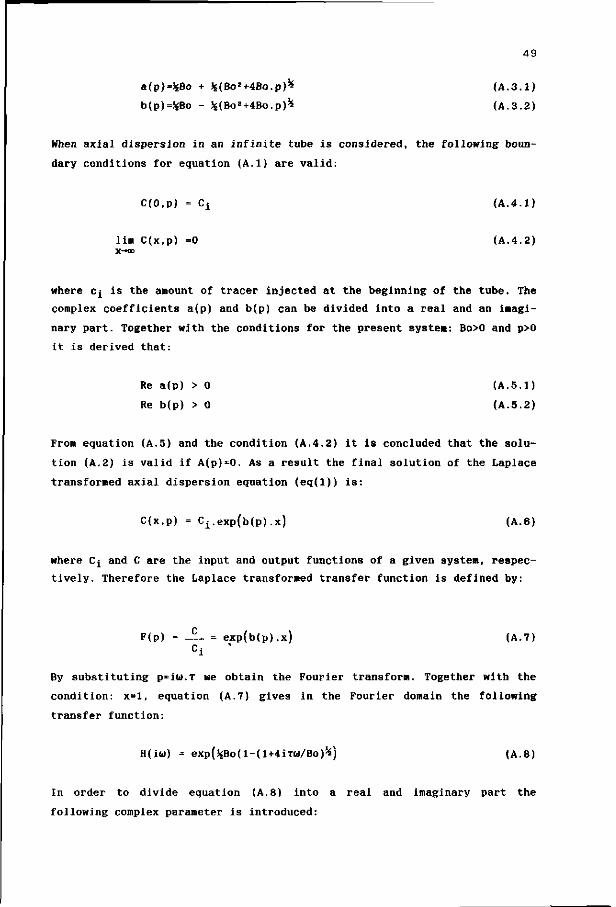
49
a(p)=%Bo + %(Bo8+4Bo.p)^ (A.3.1)
b(p)=)*Bo - %(Bo2+4Bo.p)^ (A.3.2)
When axial dispersion in an infinite tube is considered, the following boun
dary conditions for equation (A.l) are valid:
C(0,p) = Ci (A.4.1)
lim C(x,p) =0 (A.4.2) X-*oo
where Cj is the amount of tracer injected at the beginning of the tube. The
complex coefficients a(p) and b(p) can be divided into a real and an imagi
nary part. Together with the conditions for the present system: BOO and p>0
it is derived that:
Re a(p) > 0 (A.5.1)
Re b(p) > 0 (A.5.2)
From equation (A.5) and the condition (A.4.2) it is concluded that the solu
tion (A.2) is valid if A(p)=0. As a result the final solution of the Laplace
transformed axial dispersion equation (eq(l)) is:
C(x,p) = Cj.expfMpJ.x) (A.6)
where Cj and C are the input and output functions of a given system, respec
tively. Therefore the Laplace transformed transfer function is defined by:
F(p) = — = exp(b(p).x) (A.7) ci *
By substituting p=iw.T we obtain the Fourier transform. Together with the
condition: x=l, equation (A.7) gives in the Fourier domain the following
transfer function:
H(iu) = exp(^Bo(l-(l+4iTW/Bo)^) (A.8)
In order to divide equation (A.8) into a real and imaginary part the
following complex parameter is introduced:
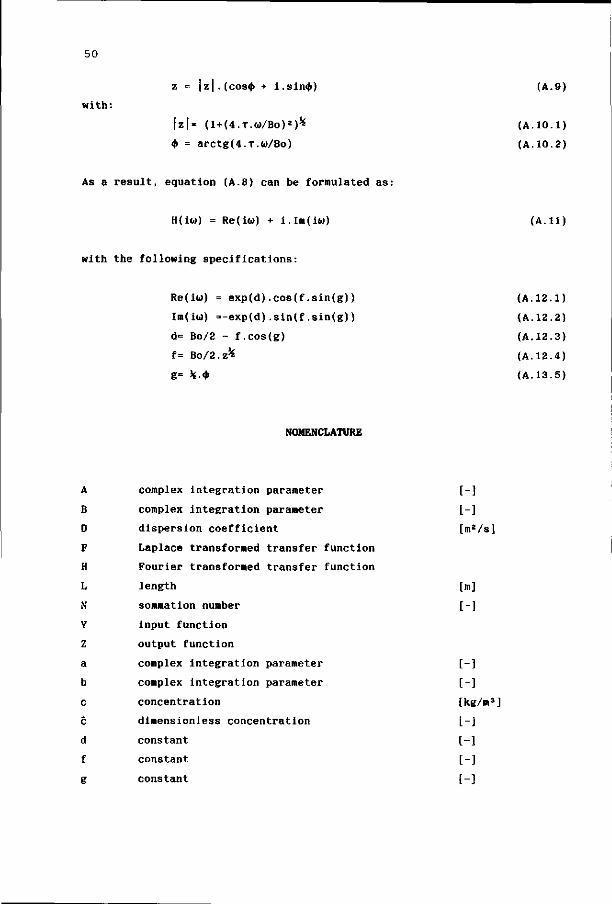
50
with:
z = |z|.(cos<(> + i.sin(|>) (A.9)
|z|= (l+(4.T.w/Bo)8)% (A.10.1)
<f> = arctg(4.T.w/Bo) (A.10.2)
As a result, equation (A.8) can be formulated as:
H(iw) = Re(iw) + i.Im(iw) (A.11)
with the following specifications:
Re(iw) = exp(d).cos(f.sin(g)) (A.12.1)
Im(iw) =-exp(d).sin(f.sin(g)) (A.12.2)
d= Bo/2 - f.cos(g) (A.12.3)
f= Bo/2.z^ (A.12.4)
g= %.$ (A.13.5)
NOMENCLATURE
A complex integration parameter [-]
B complex integration parameter [-]
D dispersion coefficient [m2/s]
F Laplace transformed transfer function
H Fourier transformed transfer function
L length [m]
N sommation number [-]
Y input function
Z output function
a complex integration parameter [-]
b complex integration parameter [-]
c concentration [kg/m3]
c dimensionless concentration [-]
d constant [-]
f constant [-]
g constant [-]
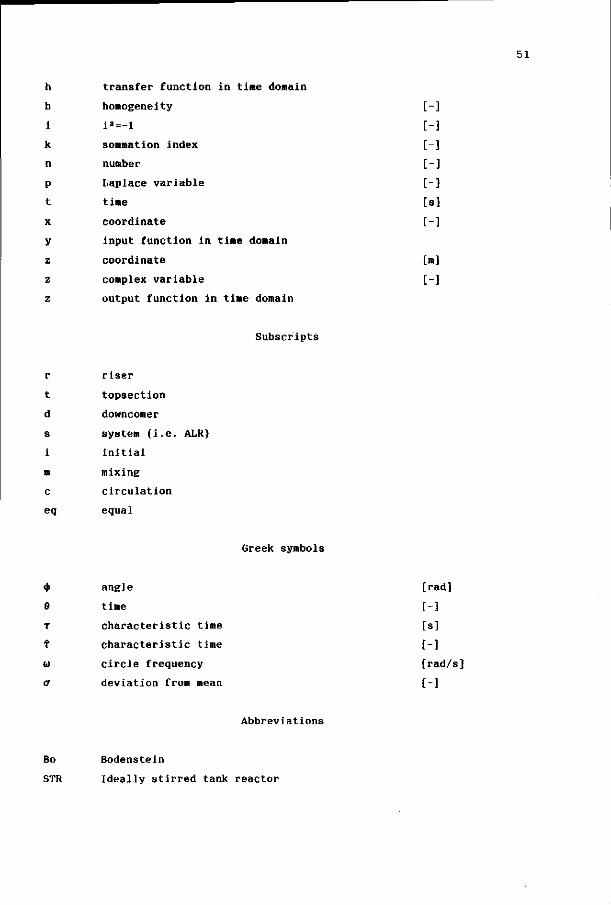
51
h
h
i
k
n
P
t
X
y
z
z
z
r
t
d
s
i
m
c
eq
transfer function in time domain
homogeneity
i2=-l
sommation index
number
Laplace variable
time
coordinate
input function in time domain
coordinate
complex variable
output function in time domain
Subscripts
riser
topsection
downcomer
system (i.e. ALR)
initial
mixing
circulation
equal
Greek symbols
e
T
t
fa)
a
angle
time
characteristic time
characteristic time
circle frequency
deviation from mean
[rad]
[-]
[s]
[-]
frad/s]
[-]
Abbreviations
Bo Bodenstein
STR Ideally stirred tank reactor
53
CHAPTER FOUR
ISOBARIC AND NON-ISOBARIC MODELLING OF DYNAMIC GAS-LIQUID
OXYGEN TRANSFER IN AN AIRLIFT-LOOP BIOREACTOR
P. Verlaan and M.A.F. Hermans.
Department of Food Science, Food and Bioengineering Group,
Agricultural University,
De Dreyen 12, 6703 BC Wageningen, The Netherlands.
R.G.J.M. van der Lans.
Department of Biochemical Engineering,
Delft University of Technology,
Julianalaan 67, 2628 BC Delft, the Netherlands.
ABSTRACT
Oxygen transfer in an airlift-loop reactor with external loop has been
modelled in two different ways. An isobaric model on the basis of a con
tinuous stirred tank reactor and a non-isobaric model on the basis of plug-
flow characteristics of the reactor produced consistent results in relation
to the overall volumetric oxygen transfer coefficient kja. The non-isobaric
model predicts kja-values and steady-state dissolved oxygen concentrations
in the individual sections of the pilot-plant ALR and includes oxygen deple
tion of the gas phase. In contrast to what is stated in the literature, the
local kja-value of the gas-sparger region does not necessarily have to
differ from the overall kja-value of the ALR.
It is shown that injection of a relative small amount of gas in the down-
comer up to 5% of the riser gas injection enhances the overall volumetric
kja with 16%. This effect will be reduced when the gas injection rate in the
riser is enlarged.
Submitted for publication.
54
INTRODUCTION
At present, different types of bioreactors are used for aerobic processes of
which the airlift-loop reactor (ALR) is a recent development. In an ALR, due
to the high circulation flow rate, economic oxygen transfer is combined with
a controlled liquid flow and efficient mixing. Because of the controlled
liquid flow and the geometry of the reactor intolarable variations in the
dissolved oxygen concentration (DOC) may however occur during a fermen
tation. Numerous investigations have been carried out on the mass transfer
capability of airlift contactors [1-4] but the results so far do not yield
much more than empirical correlations.
Merchuk and Stein [5] introduced a stationary mathematical model for the
oxygen mass transfer in an ALR. They regarded the flow in the ALR as a plug
flow except for the topsection which was assumed to be well mixed. The
downflow region was considered as a one phase flow. The fundamental parame
ters were obtained from experimental correlations making large scale predic
tions doubtful. Ho et al. [6] presented an ALR with internal loop having a
number of interconnected compartments, each assumed to be well mixed. In
this way, the mixing behaviour of the column determines the number of stages
in the model whilst axial dispersion for both the liquid and the gas phase
is approximated to the same extent. The topsection was considered to be well
mixed. The model was used to simulate steady state oxygen transfer in an
ALR. The aeration constant, kja, was assumed to be pressure invariant. The
work was based mostly on experimental data and information provided by Hatch
[3] and the results were not experimentally verified.
A real theoretical basis for the description of mass transfer and the esti
mation of mass transfer coefficients in an ALR is thus actually lacking in
the literature. On the basis of earlier research [7-9] a steady state, non-
isobaric gas-liquid oxygen transfer model was developed and is presented
here. With this model, the aeration constant, kja, in a pilot-plant ALR can
be estimated by a dynamic measurement procedure. The model was also used to
investigate the influence of the air sparger region on the overall oxygen
transfer. Carbondioxide and nitrogen transport are included in the model as
mass transfer of these components between the gas and the liquid phase is
able to severely influence the DOC and the mole fraction of oxygen in the
gas phase. Moreover, large carbondioxide concentrations in the liquid phase
can influence the metabolism of biomass [10]. The model predicts stationary
55
oxygen concentration profiles through the entire column (riser and
downcomer). The results of the dynamic measurement procedure are compared
with the results of an isobaric and quite simple STR-model [11] which has
been adapted to the ALR.
THEORY
Estimation of the volumetric oxygen transfer coefficient, kja, in the ALR by
a dynamic method requires modelling of the complete system dynamics. In the
present work the liquid and gas-phase dynamics were investigated for a sta
tionary and non-stationary situation. Typical ALR characteristics allowed us
to treat the modelling of mass transfer in two different ways. On the one
hand the ALR behaves like a loop reactor with relative high circulation
rates. From this point of view the reactor can be modelled as a STR. On the
other hand the ALR is a tube reactor in which the liquid phase as well as
the gas phase behave like plug-flow which has been experimentally verified
earlier [8]. Of course, the real flow pattern of the ALR is intermediate.
The first estimation method, based on ideal mixing, considers an isobaric
situation while the second method, based on plug flow, takes into account
pressure variations in the ALR. Both methods utilize a step change in the
inlet oxygen pressure in order to induce a time varying DOC in the batch
liquid phase.
Isobaric model
The STR-method is a generally known estimation method which is quite simple
to handle with , under the proper circumstances, acceptable accuracy [12].
The unsteady-state oxygen balance for the liquid phase is
dc(t) = ki a(cs - c(t)) (1)
dt
where c(t) is the actual DOC, cs the saturation DOC and kja the volumetric
oxygen transfer coefficient. In this isobaric model, the liquid phase is
assumed to be well mixed and not exposed to any local gas and pressure
variation. The gas phase composition is assumed to remain constant during
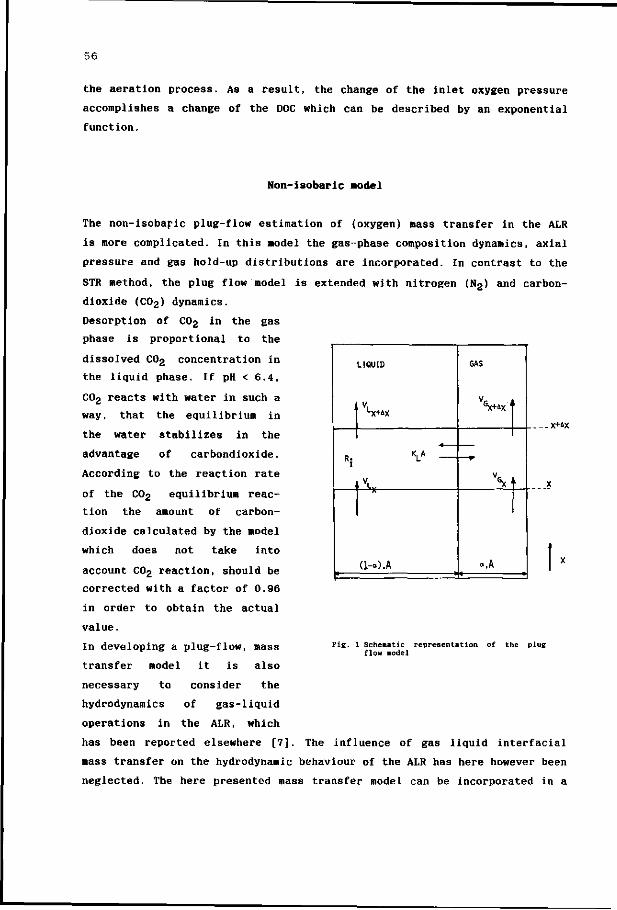
56
the aeration process. As a result, the change of the inlet oxygen pressure
accomplishes a change of the DOC which can be described by an exponential
function.
Non-isobaric model
-X+'X
The non-isobaric plug-flow estimation of (oxygen) mass transfer in the ALR
is more complicated. In this model the gas-phase composition dynamics, axial
pressure and gas hold-up distributions are incorporated. In contrast to the
STR method, the plug flow model is extended with nitrogen (N2) and carbon-
dioxide (C02) dynamics.
Desorption of C02 in the gas
phase is proportional to the
dissolved CO2 concentration in
the liquid phase. If pH < 6.4,
C02 reacts with water in such a
way, that the equilibrium in
the water stabilizes in the
advantage of carbondioxide.
According to the reaction rate
of the C0 2 equilibrium reac
tion the amount of carbon-
dioxide calculated by the model
which does not take into
account C0 2 reaction, should be
corrected with a factor of 0.96
in order to obtain the actual
value.
In developing a plug-flow, mass
transfer model it is also
necessary to consider the
hydrodynamics of gas-liquid
operations in the ALR, which
has been reported elsewhere [7]. The influence of gas liquid interfacial
mass transfer on the hydrodynamic behaviour of the ALR has here however been
neglected. The here presented mass transfer model can be incorporated in a
I
LIQUID
V, LX+4X
K, A
\ \
(l-o).A I -
GAS
GX
°.A
L
Fig. 1 Schematic representation of the plug flow model
57
hydrodynamic model for very large ALRs.
When a cross sectional volume element of the reactor tube is considered, a
mass balance can be drawn over the element for the liquid and the gas phase
(Figure 1). The volume element is chosen with a length Ax and a cross-
sectional area of the local tube, A. Mass transfer of 0 2 and N 2 is charac
terized by an overall volumetric mass transfer coefficient, kja. As the dif
fusion coefficients of N 2 and 0 2 in water approximately have the same
values, it is assumed in this model that the actual transfer coefficient k
for each component, will be equal to the liquid side mass transfer coef
ficient, kj, due to the low solubility of the components in the liquid
phase. According to the Higbie model [13], a value of 0.83.kj has been used
for the C02 component as the diffusion coefficient of C02 has a value of
about 30% below that of N 2 and 02.
For the gas phase in a stationary situation the mass balance for each com
ponent yields:
d
— (Vgs-Pi) = " kla(cs< " ci) <2) dx i
where v_s is the superficial gas velocity and p the density; i denotes the
specific component i.e. 02, N 2 or C02. For the liquid phase the mass balance
is:
d — (vl s.C i) = ki a(cs. - Ci) - rd (3)
dx i
where v l s is the superficial liquid velocity and r^ a respiration contribu
tion of the micro-organisms which is assumed not to contribute in the nitro
gen mass balance. As x is the only spatial variable, no radial gradients are
incorporated. The contribution of axial dispersion is neglected in the pre
sent model because both the lir-̂ 'd and gas phase behave like plug flow
[3,8].
The gas phase concentration is related to the mole fraction, yj, of com
ponent i in the gas phase:
58
RT p(x).yi (4)
where Mj is the molar mass of component i, T its temperature and R the gas
constant. Substitution of eq(4) in eq(2) and enumerating eq(2) over the com
ponents i yields an expression for the local superficial gas velocity, pro
vided that Eyi=i:
dx [v, gs.p(x)] = RTl:-k1a(cSl-ci)/M1 (5)
In eq.(5), the superficial gas velocity, v g s is given as a function of the
local pressure and interfacial mass transfer of the components.
Combination of eq(2), eq(4) and eq(5) yields a system of differential
equations for the mole fraction of a component i in the gas phase:
vg s P ( x )
RT.kja
y0„
yN,
VC0.
( vNj,+yCo 2 )
«o2
yJz «o2
vco^
VOg
%2
- ( y 0 a+ y N p )
MN2
yco .
"o,
M co 2
M co 2
M C0 o
C s o 2 - c o 2
% ' %
C s C0 2 " C c 0 2|
(6)
where y denotes the derivative of y to x. As a result, 7 coupled li
near differential equations are generated, expressed by eq.(3) for each com
ponent, eq(5) and eq(6). These equations are integrated simultaneously by a
numeric procedure.
According to Henrys law, the partial pressure of the component i in the gas
phase at equilibrium with liquid is proportional to the concentration of
oxygen in the liquid film:
P(x).pi
He; (7)
where pj and Hej are the gas phase concentration and the Henry constant of
component i, respectively.
As the model is non-isobaric the local pressure is defined by
59
L p(x) = p(0) - p,g(x - /a(x)dx) (8)
0
where a(x) is the local gas fraction which is integrated over the specific
reactor part (riser or downcomer) with a length L. The non-isobaric con
dition in the reactor will involve an axial dependency of the specific
interfacial area, a,
6.o(x) a(x) = (9)
where d^fx) is the local bubble diameter defined by:
db(0).p(0)1/3
d b ( x ) = TTT73 ( 1 0 )
p(x) 1 ' J
where djj(O) and p(0) are the local bubble diameter and pressure at the bot
tom of the reactor, respectively. In order to calculate the local pressure
by eq.(8), the local gas hold up is approximated by of (x) as otherwise eq(8)
becomes implicit for the gas hold-up [7,9]:
a(0).p(0) of (x) = (11)
P(x)
In the model, the respirative contribution, r0 , is represented by the
Michaelis-Menten model with the 0 2 rate limiting substrate:
J2 0 2 -
vm • c , Km
C°P- „ (12)
where Vm and Kra are the intrinsic Michaelis-Menten parameters. The C02 pro
duction term is deduced from eq(12) provided that glucose is totally oxi
dized to C02 and H20.
The model assumes no interaction of the bubbles during their stay in the
column. It was experimentally proved in previous work [7] that this is a
reasonable assumption in the present ALR.
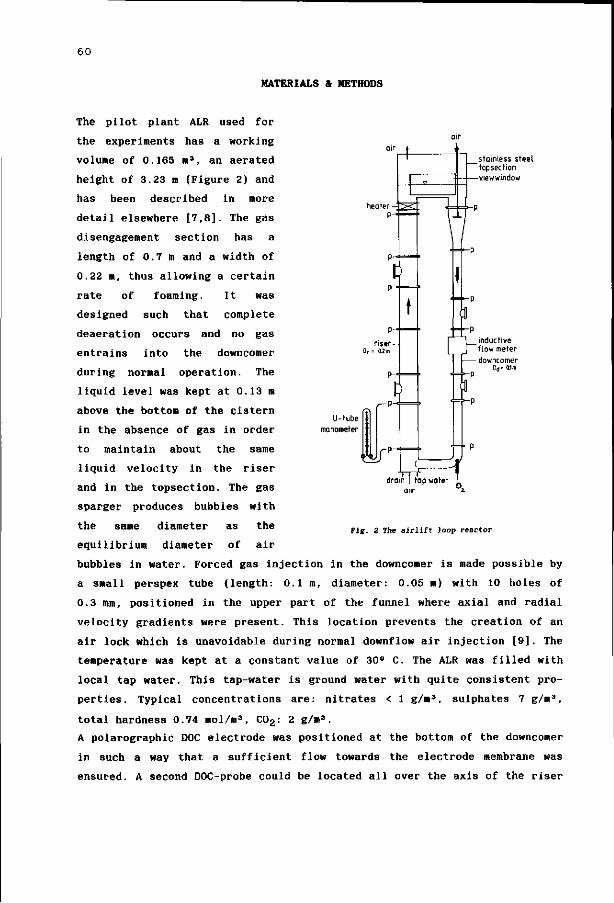
60
MATERIALS & METHODS
inductive flow meter downcomer
Dd= aim
The pilot plant ALR used for
the experiments has a working
volume of 0.165 m3, an aerated
height of 3.23 m (Figure 2) and
has been described in more
detail elsewhere [7,8]. The gas
disengagement section has a
length of 0.7 m and a width of
0.22 m, thus allowing a certain
rate of foaming. It was
designed such that complete
deaeration occurs and no gas
entrains into the downcomer
during normal operation. The
liquid level was kept at 0.13 m
above the bottom of the cistern
in the absence of gas in order
to maintain about the same
liquid velocity in the riser
and in the topsection. The gas
sparger produces bubbles with
the same diameter as the
equilibrium diameter of air
bubbles in water. Forced gas injection in the downcomer is made possible by
a small perspex tube (length: 0.1 m, diameter: 0.05 m) with 10 holes of
0.3 mm, positioned in the upper part of the funnel where axial and radial
velocity gradients were present. This location prevents the creation of an
air lock which is unavoidable during normal downflow air injection [9]. The
temperature was kept at a constant value of 30° C. The ALR was filled with
local tap water. This tap-water is ground water with quite consistent pro
perties. Typical concentrations are: nitrates < 1 g/m3, sulphates 7 g/m3,
total hardness 0.74 mol/m3, C02: 2 g/m3.
A polarographic DOC electrode was positioned at the bottom of the downcomer
in such a way that a sufficient flow towards the electrode membrane was
ensured. A second DOC-probe could be located all over the axis of the riser
Fie- 2 The airlift loop reactor
61
in order to measure local DOCs. This probe had a small propellor stirrer in
front of the membrane to ensure a sufficiently high liquid approach velocity
[11]. The time constant of both electrodes was about 4.5 s. Probe dynamics
were not influenced by the pressure variations. Each electrode was connected
to a DOC-meter which in turn was connected to a transmitter. The transmitter
was coupled to a micro-computer by which data-sampling was performed.
As the present ALR has a limited height, the DOC profile was not very pro
nounced. Moreover, the accuracy of the steady state DOC experiments was very
poor. Nevertheless an attempt has been made to measure the steady state DOC
profiles by monitoring the local DOC on line for several minutes. The time
averaged value thus obtained, was used as the final result. A valve, posi
tioned at the bottom of the reactor, between the downcomer and the riser,
was used to control the liquid velocity independent of the gas injection
rate in order to enhance the maximum DOC difference over the length of the
column [21].
A gas-analyzer was connected to the inlet and outlet gasflow of the reactor
in order to monitor the gas phase composition. For this purpose, the outlet
gas phase was dried by a countercurrent membrane tube before its composition
was analysed.
Isobaric Method
The isobaric k^a-estimation method consisted of the STR-method which was
applied to an ALR. For that several assumptions and simplifications have
been introduced [11]. An oxygen mass balance over the the liquid in the
riser of the ALR yields:
dc (l-a).Vr.— = <J>v.c(t-td) - <f>v.c(t) + k1A(cs-c(t)) (13)
dt
Here, tj is the mean residence time of the liquid in the downcomer, <J>V the
liquid volume flow through the reactor tubes and A the absolute interfacial
area. If the mean residence time in the downcomer, td, is relatively small
in relation to the total circulation time, tc,
right hand-side of eq(13) can be approximated by:
in relation to the total circulation time, tc, the first two terms of the
62
lin -<(c(t)-c(t-td)>
<Ov.td. ? -dc(t)
. (14) dt
where V<j is the volume of the downcomer tube. Combination of eq.(14) and
eq.(13) results into eq(l) where the specific interfacial area, a, is con
cerned to the total liquid volume V of the ALR. Integration of eq(l)
yields:
cs-c(t) — = exp^kja.t) (15) cs-c(0)
where c(0) is the initial concentration. With a non linear regression method
based on the least square criterium according to CQ, C S and kja [14] it is
possible to determine kja without the need of knowing the initial and
saturation concentration. Moreover the method provides a weighing for the
measured response curve in the essential part. A starting concentration of
about 0.3cs is used to avoid any lingering effects of the deoxygenation
technique [15]. This method can also be applied with a respirative system in
the ALR.
Non-isobaric Method
The non-isobaric kja-estimation method consists of a stationary plug-flow
model which is used to predict steady-state DOC-profiles through the column.
This model has also been used to characterize the gas-liquid mass transfer
by estimating kja values with the dynamic method. For this purpose the
steady state model defined by equations 3, 5 and 6, has been adapted to pre
dict dynamic mass transfer. As time and place in the present plug flow reac
tor are unambiguously related to each other, the following time-place trans
formation is introduced:
dx dt= _ (l-a(x)) (16a)
vls
where <x(x) is the local gas hold-up. An analogous transformation exists for
the gas phase:
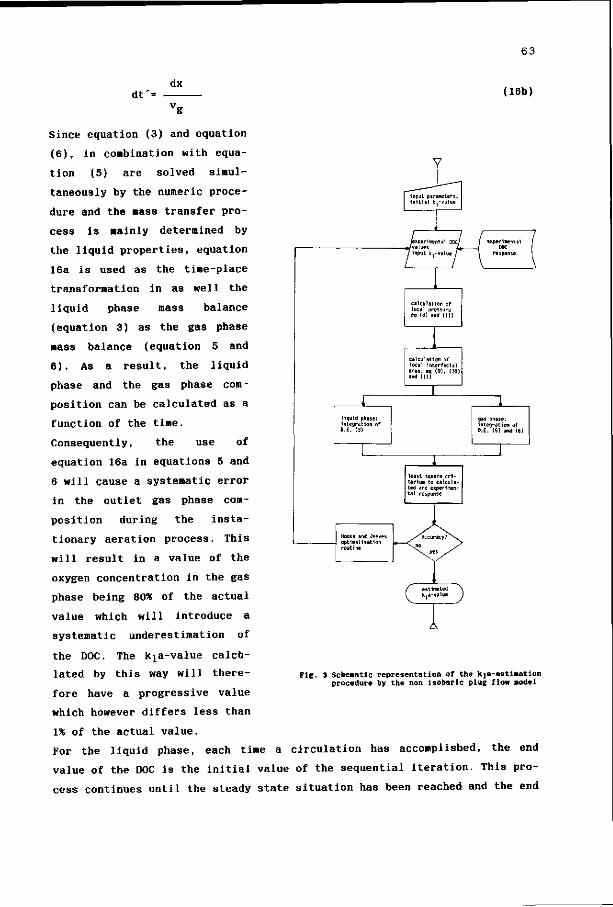
dt'= dx
g
63
(16b)
Since equation (3) and equation
(6), in combination with equa
tion (5) are solved simul
taneously by the numeric proce
dure and the mass transfer pro
cess is mainly determined by
the liquid properties, equation
16a is used as the time-place
transformation in as well the
liquid phase mass balance
(equation 3) as the gas phase
mass balance (equation 5 and
6 ) . As a result, the liquid
phase and the gas phase com
position can be calculated as a
function of the time.
Consequently, the use of
equation 16a in equations 5 and
6 will cause a systematic error
in the outlet gas phase com
position during the insta-
tionary aeration process. This
will result in a value of the
oxygen concentration in the gas
phase being 80* of the actual
value which will introduce a
systematic underestimation of
the DOC. The k^a-value calcu
lated by this way will there
fore have a progressive value
which however differs less than
1% of the actual value.
For the liquid phase, each time a
value of the DOC is the initial value
cess continues until the steady state
l i qu id phase: in tegrat ion of O.E. (3)
Hooke and Jeeves o p t i m i s a t i o n routine
calculation of local interfaclal area, eq (9). [JO) and [111
gas phase: integration D.E. 15) an<
least square cri-teriunt to calculated and experimental response
PiB. 3 Schematic representation of the kia-esti«ation procedure by the non isobaric plug flow model
circulation has accomplished, the end
of the sequential iteration. This pro-
situation has been reached and the end
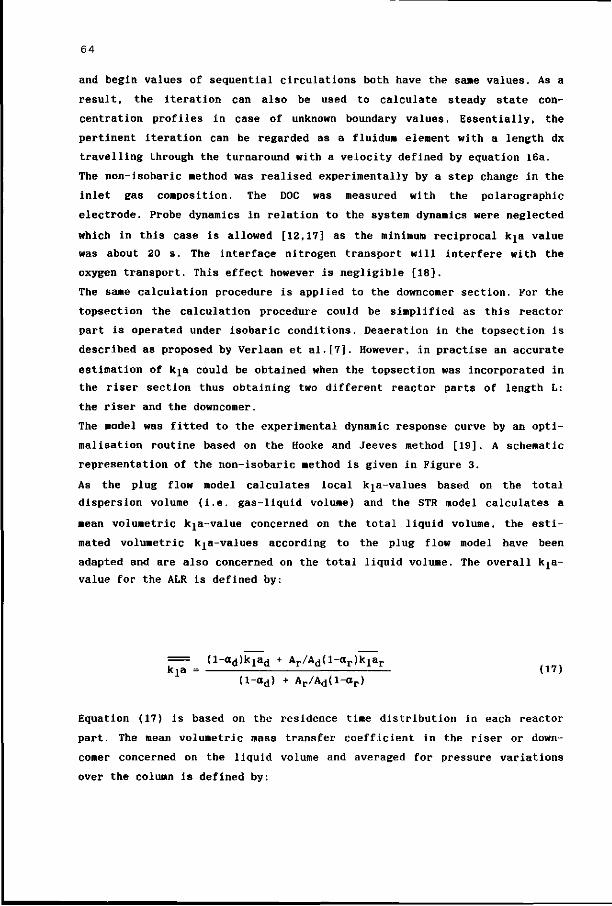
64
and begin values of sequential circulations both have the same values. As a
result, the iteration can also be used to calculate steady state con
centration profiles in case of unknown boundary values. Essentially, the
pertinent iteration can be regarded as a fluidum element with a length dx
travelling through the turnaround with a velocity defined by equation 16a.
The non-isobaric method was realised experimentally by a step change in the
inlet gas composition. The DOC was measured with the polarographic
electrode. Probe dynamics in relation to the system dynamics were neglected
which in this case is allowed [12,17] as the minimum reciprocal kja value
was about 20 s. The interface nitrogen transport will interfere with the
oxygen transport. This effect however is negligible [18].
The same calculation procedure is applied to the downcomer section. For the
topsection the calculation procedure could be simplified as this reactor
part is operated under isobaric conditions. Deaeration in the topsection is
described as proposed by Verlaan et al.[7]. However, in practise an accurate
estimation of k^a could be obtained when the topsection was incorporated in
the riser section thus obtaining two different reactor parts of length L:
the riser and the downcomer.
The model was fitted to the experimental dynamic response curve by an opti-
malisation routine based on the Hooke and Jeeves method [19]. A schematic
representation of the non-isobaric method is given in Figure 3.
As the plug flow model calculates local kja-values based on the total
dispersion volume (i.e. gas-liquid volume) and the STR model calculates a
mean volumetric kja-value concerned on the total liquid volume, the esti
mated volumetric kja-values according to the plug flow model have been
adapted and are also concerned on the total liquid volume. The overall kja-
value for the ALR is defined by:
= = (l-ad)kiacl + Ar/Ad(l-ar)kiar k1a = (17)
(l-od) + Ar/Ad(l-cer)
Equation (17) is based on the residence time distribution in each reactor
part. The mean volumetric mass transfer coefficient in the riser or down
comer concerned on the liquid volume and averaged for pressure variations
over the column is defined by:
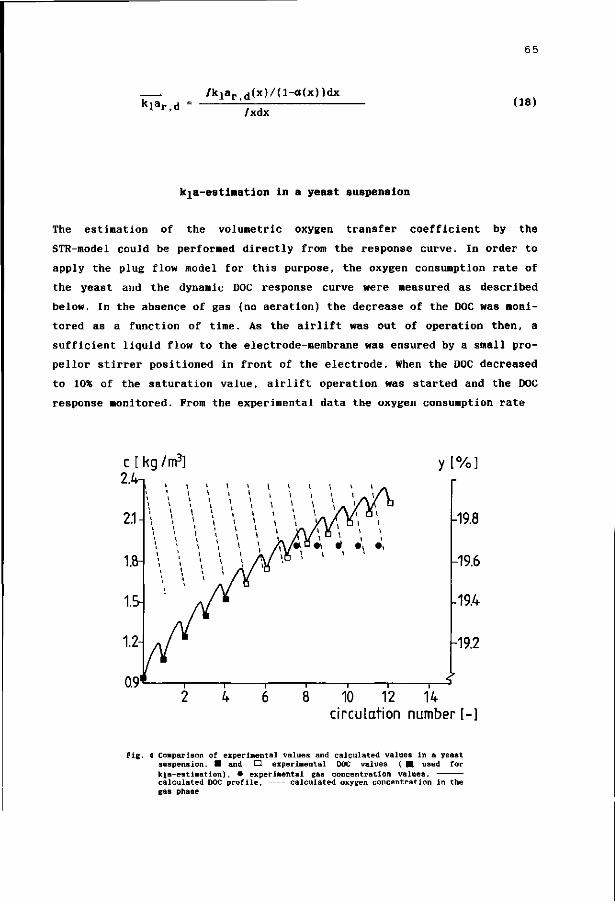
6 5
/ k i a r d ( x ) / ( l - a ( x ) ) d x k l a r , d = —
/xdx (18)
kja-estiaation in a yeast suspension
The estimation of the volumetric oxygen transfer coefficient by the
STR-model could be performed directly from the response curve. In order to
apply the plug flow model for this purpose, the oxygen consumption rate of
the yeast and the dynamic DOC response curve were measured as described
below. In the absence of gas (no aeration) the decrease of the DOC was moni
tored as a function of time. As the airlift was out of operation then, a
sufficient liquid flow to the electrode-membrane was ensured by a small pro-
pellor stirrer positioned in front of the electrode. When the DOC decreased
to 10% of the saturation value, airlift operation was started and the DOC
response monitored. From the experimental data the oxygen consumption rate
c [ kg /m3] y [ % ]
10 12 14 circulation number [-]
Pig. 4 Comparison of experimental values and calculated values in a yeast suspension. B and O experimental DOC values ( • used for kia-estimation), • experimental gas concentration values. calculated DOC profile, calculated oxygen concentration in the gas phase
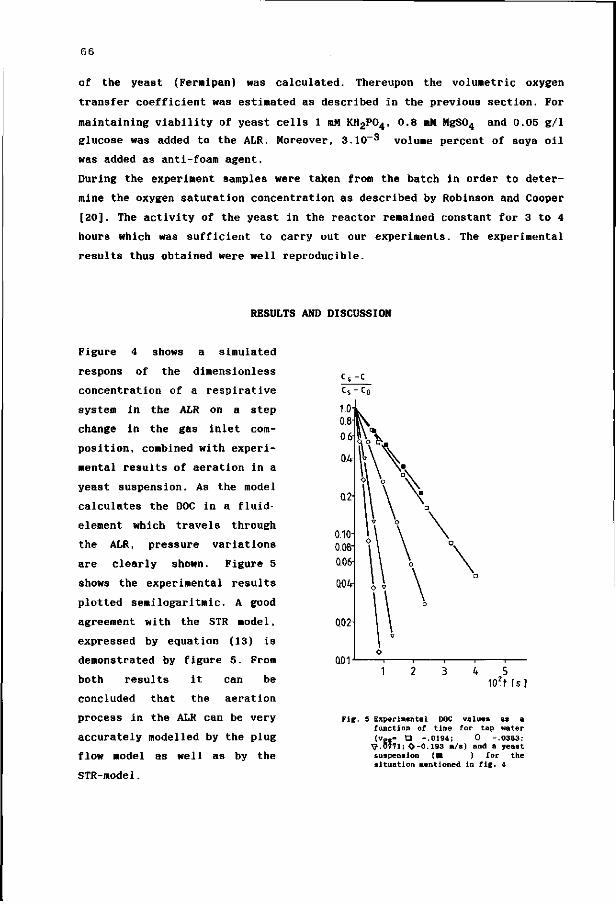
66
of the yeast (Fermipan) was calculated. Thereupon the volumetric oxygen
transfer coefficient was estimated as described in the previous section. For
maintaining viability of yeast cells 1 mM KH2P04, 0.8 mM MgS04 and 0.05 g/1
glucose was added to the ALR. Moreover, 3.10-3 volume percent of soya oil
was added as anti-foam agent.
During the experiment samples were taken from the batch in order to deter
mine the oxygen saturation concentration as described by Robinson and Cooper
[20]. The activity of the yeast in the reactor remained constant for 3 to 4
hours which was sufficient to carry out our experiments. The experimental
results thus obtained were well reproducible.
RESULTS AND DISCUSSION
Figure 4 shows a simulated
respons of the dimensionless
concentration of a respirative
system in the ALR on a step
change in the gas inlet com
position, combined with experi
mental results of aeration in a
yeast suspension. As the model
calculates the DOC in a fluid-
element which travels through
the ALR, pressure variations
are clearly shown. Figure 5
shows the experimental results
plotted semilogaritmic. A good
agreement with the STR model,
expressed by equation (13) is
demonstrated by figure 5. From
both results it can be
concluded that the aeration
process in the ALR can be very
accurately modelled by the plug
flow model as well as by the
STR-model.
Cs-C
WA [s]
Pig. 5 Experimental DOC values as a function of time for tap water (vgS- n -.0194; 0 -.0383;
V-0771; ̂ -0.193 m/s) and a yeast suspension (•. ) for the situation mentioned in fig. 4
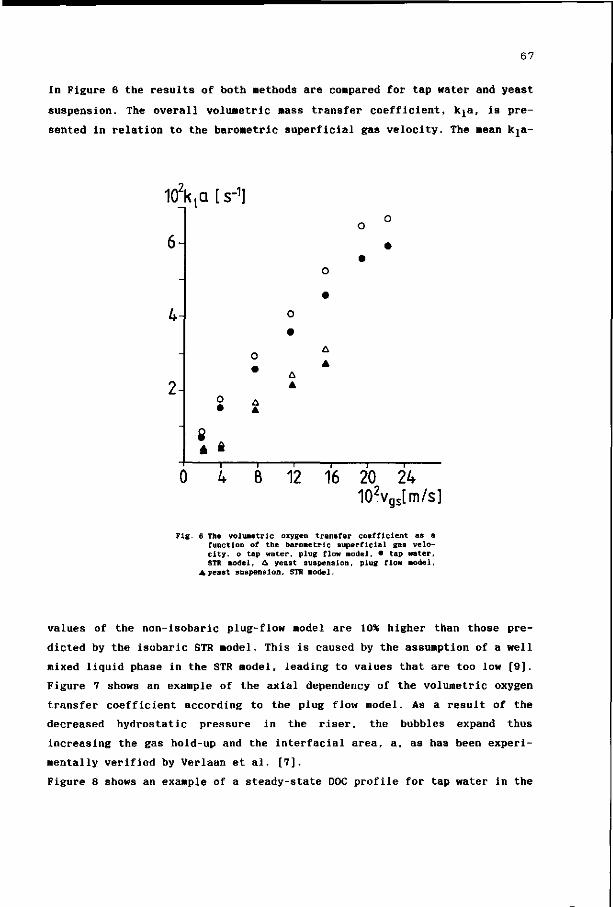
67
In Figure 6 the results of both Methods are compared for tap water and yeast
suspension. The overall volumetric mass transfer coefficient, kja, is pre
sented in relation to the barometric superficial gas velocity. The mean kja-
2-
•tv 10zk,Q[s-1]
6-
4-
• A
8 A &
o
A A
O
A A
12 16 20 24 102vas[m/s] 'gsi
Fig. 6 The volumetric oxygen transfer coefficient as a function of the baronetric superficial gas velocity, o tap water, plug flow model, • tap water, STR model, A yeast suspension, plug flow model,
• yeast suspension, STR model.
values of the non-isobaric plug-flow model are 10% higher than those pre
dicted by the isobaric STR model. This is caused by the assumption of a well
mixed liquid phase in the STR model, leading to values that are too low [9].
Figure 7 shows an example of the axial dependency of the volumetric oxygen
transfer coefficient according to the plug flow model. As a result of the
decreased hydrostatic pressure in the riser, the bubbles expand thus
increasing the gas hold-up and the interfacial area, a, as has been experi
mentally verified by Verlaan et al. [7].
Figure 8 shows an example of a steady-state DOC profile for tap water in the
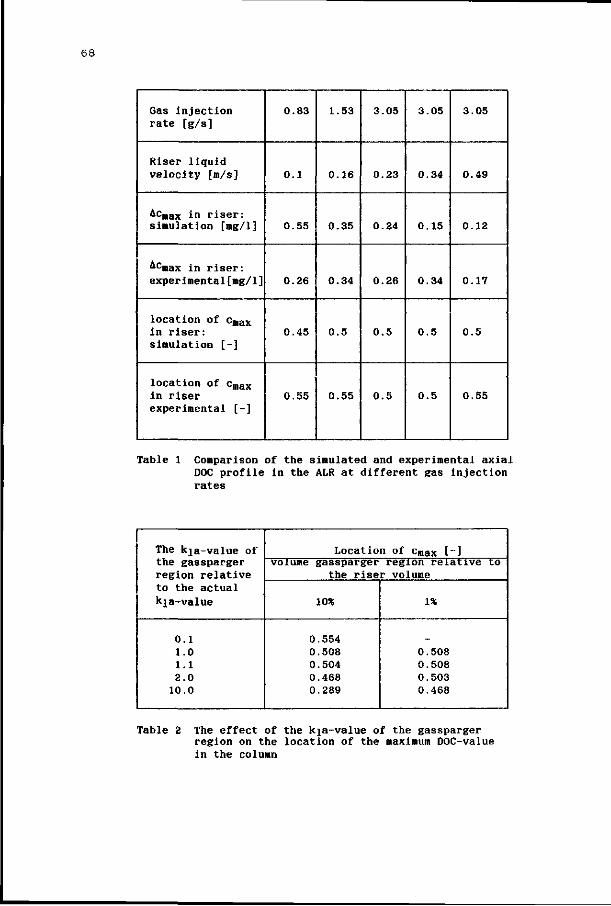
68
Gas injection rate [g/s]
Riser liquid velocity [m/s]
Acmax in riser: simulation [mg/1]
^cmax in riser: experimental[mg/1]
location of cmax in riser: simulation [-]
location of cmax in riser experimental [-]
0.83
0.1
0.55
0.26
0.45
0.55
1.53
0.16
0.35
0.34
0.5
0.55
3.05
0.23
0.24
0.26
0.5
0.5
3.05
0.34
0.15
0.34
0.5
0.5
3.05
0.49
0.12
0.17
0.5
0.55
Table 1 Comparison of the simulated and experimental axial DOC profile in the ALR at different gas injection rates
The kla-value of the gassparger region relative to the actual kja-value
0.1 1.0 1.1 2.0
10.0
Location of c m a x [-] volume gassparger region relative to
the riser volume
10%
0.554 0.508 0.504 0.468 0.289
1%
0.508 0.508 0.503 0.468
Table 2 The effect of the k^a-value of the gassparger region on the location of the maximum DOC-value in the column
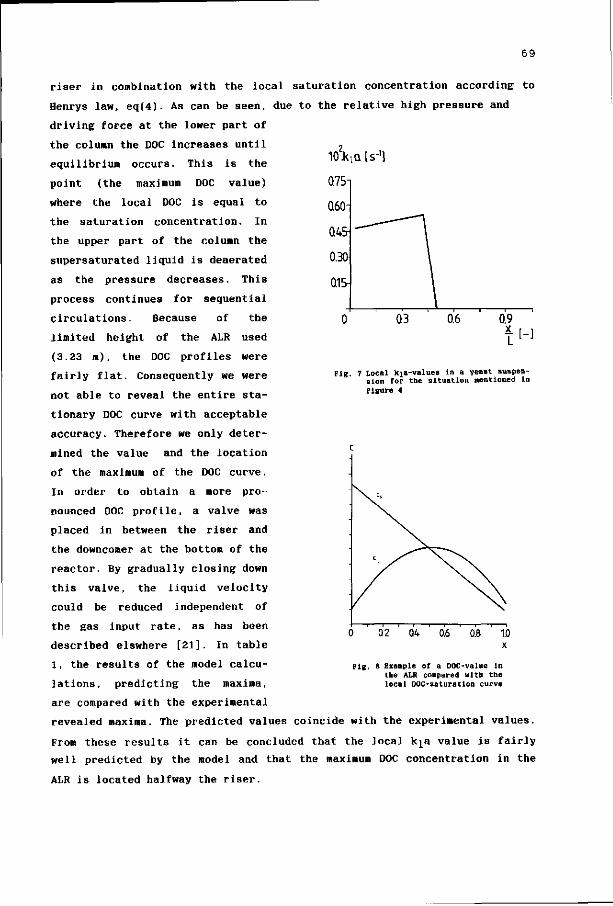
69
1 0 . M I S " 1 ]
0.75-]
0.60
0.45-
0.30
0.15-
0.3 0.6 0.9 x. L
Fig. 7 Local k^a-values in a yeast suspension for the situation mentioned in Pigure 4
riser in combination with the local saturation concentration according to
Henrys law, eq(4). As can be seen, due to the relative high pressure and
driving force at the lower part of
the column the DOC increases until 9
equilibrium occurs. This is the
point (the maximum DOC value)
where the local DOC is equal to
the saturation concentration. In
the upper part of the column the
supersaturated liquid is deaerated
as the pressure decreases. This
process continues for sequential
circulations. Because of the
limited height of the ALR used
(3.23 m ) , the DOC profiles were
fairly flat. Consequently we were
not able to reveal the entire sta
tionary DOC curve with acceptable
accuracy. Therefore we only deter
mined the value and the location
of the maximum of the DOC curve.
In order to obtain a more pro
nounced DOC profile, a valve was
placed in between the riser and
the downcomer at the bottom of the
reactor. By gradually closing down
this valve, the liquid velocity
could be reduced independent of
the gas input rate, as has been
described elswhere [21]. In table
1, the results of the model calcu
lations, predicting the maxima,
are compared with the experimental
revealed maxima. The predicted values coincide with the experimental values.
From these results it can be concluded that the local kja value is fairly
well predicted by the model and that the maximum DOC concentration in the
ALR is located halfway the riser.
Fie. 8 Exaaple of a DOC-value in the ALR compared with the local DOC-saturatlon curve
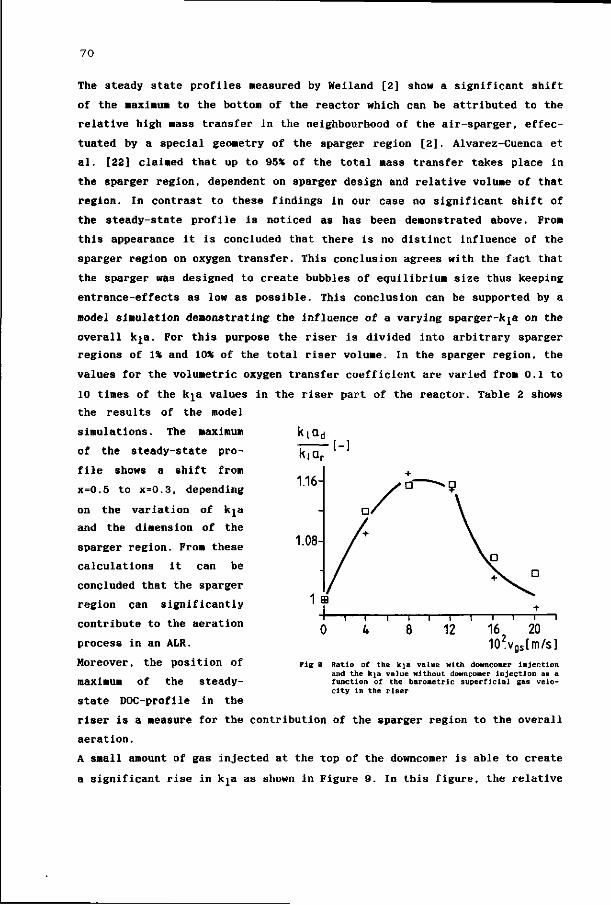
70
The steady state profiles measured by WeHand [2] show a significant shift
of the maximum to the bottom of the reactor which can be attributed to the
relative high mass transfer in the neighbourhood of the air-sparger, effec
tuated by a special geometry of the sparger region [2]. Alvarez-Cuenca et
al. [22] claimed that up to 95% of the total mass transfer takes place in
the sparger region, dependent on sparger design and relative volume of that
region. In contrast to these findings in our case no significant shift of
the steady-state profile is noticed as has been demonstrated above. From
this appearance it is concluded that there is no distinct influence of the
sparger region on oxygen transfer. This conclusion agrees with the fact that
the sparger was designed to create bubbles of equilibrium size thus keeping
entrance-effects as low as possible. This conclusion can be supported by a
model simulation demonstrating the influence of a varying sparger-k^a on the
overall kja. For this purpose the riser is divided into arbitrary sparger
regions of 1% and 10* of the total riser volume. In the sparger region, the
values for the volumetric oxygen transfer coefficient are varied from 0.1 to
10 times of the k^a values in the riser part of the reactor. Table 2 shows
the results of the model
simulations. The maximum k[Q(j
of the steady-state pro
file shows a shift from
x=0.5 to x=0.3, depending
on the variation of k^a
and the dimension of the
sparger region. From these
calculations it can be
concluded that the sparger
region can significantly
contribute to the aeration
process in an ALR.
Moreover, the position of
maximum of the steady-
state DOC-profile in the
riser is a measure for the contribution of the sparger region to the overall
aeration.
A small amount of gas injected at the top of the downcomer is able to create
a significant rise in kja as shown in Figure 9. In this figure, the relative
10.vgs[m/s] Fig 9 Ratio of the kja value with downcomer injection
and the kja value without downcomer injection as a function of the barometric superficial gas velocity in the riser
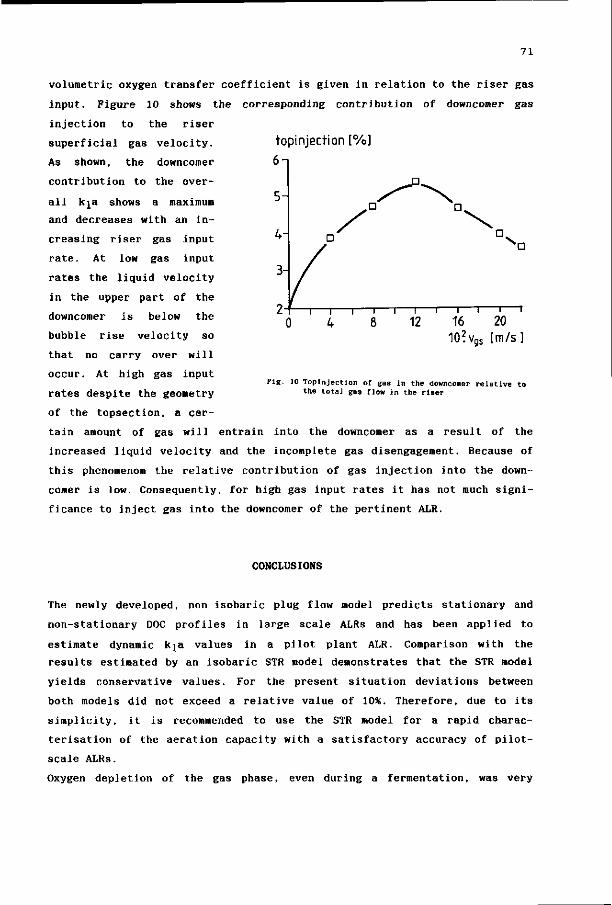
71
volumetric oxygen transfer coefficient is given in relation to the riser gas
input. Figure 10 shows the corresponding contribution of downcomer gas
injection to the riser
superficial gas velocity. topinjection [%]
As shown, the downcomer 6-
contribution to the over
all kja shows a maximum
and decreases with an in
creasing riser gas input
rate. At low gas input
rates the liquid velocity
in the upper part of the
downcomer is below the
bubble rise velocity so
that no carry over will
occur. At high gas input
rates despite the geometry
of the topsection, a cer
tain amount of gas will entrain into the downcomer as a result of the
increased liquid velocity and the incomplete gas disengagement. Because of
this phenomenom the relative contribution of gas injection into the down-
corner is low. Consequently, for high gas input rates it has not much signi
ficance to inject gas into the downcomer of the pertinent ALR.
10?vgs [m/s
Fig. 10 Topinjection of gas in the downcomer relative to the total gas flow in the riser
CONCLUSIONS
The newly developed, non-isobaric plug flow model predicts stationary and
non-stationary DOC profiles in large scale ALRs and has been applied to
estimate dynamic kja values in a pilot plant ALR. Comparison with the
results estimated by an isobaric STR model demonstrates that the STR model
yields conservative values. For the present situation deviations between
both models did not exceed a relative value of 10%. Therefore, due to its
simplicity, it is recommended to use the STR model for a rapid charac
terisation of the aeration capacity with a satisfactory accuracy of pilot-
scale ALRs.
Oxygen depletion of the gas phase, even during a fermentation, was very
72
little and did not surpass 1 volume-* of oxygen, which was fairly well pre
dicted by the plug flow model. For this reason an ALR is a very suitable
reactor for aerobic processes showing a high oxygen demand.
If necessary, the aeration capacity of the ALR can be enhanced by injection
of a small amount of gas at the entrance of the downcomer. Injection of 5*
of the total riser gas flow enhances the overall kja value up to 16*.
It is possible to incorporate the gas sparger contribution to the overall
oxygen transfer process into the plug flow model. However, as shown by model
calculations, in the present ALR the aeration capacity of the gas sparger
did not differ significantly from the main aeration process due to its spe
cial geometry.
ACKNOWLEDGEMENTS
The authors wish to thank prof. dr. K. van ' t Riet and prof. K.Ch.A.M.
Luyben for their helpfull discussions during the preparation of the
manuscript.
REFERENCES
[1] R.A. Bello, C.W. Robinson and M. Moo-Young. Gas hold-up and overall volumetric oxygen transfer coefficient in airlift contactors. Biotechnol. & Bioeng. 27, (1985) 369-381.
[2] P. Weiland. Untersuchung eines Airliftreaktors mit au0erem Umlauf im Hinblick auf seine Anwendung als Bioreaktor, Thesis, University of Dortmund, Dortmund, 1978.
[3] R.T. Hatch. Experimental and theoretical studies of oxygen transfer in the airlift fermenter, Thesis, Massachusetts Institute of Technology, Cambridge, MA, 1973.
[4] C.H. Lin, B.S. Fang, C.S. Wu, H.Y.Fang, T.F. Kuo and C.Y. Hu. Oxygen transfer and mixing in a tower cycling fermentor. Biotechnol. & Bioeng. 18 (1976) 1557-1572.
[5] J.C. Merchuk and Y. Stein. A distributed parameter model for an airlift fermentor. Biotechnol. & Bioeng. 22 (1980) 1189-1211.
[6] C.S. Ho, L.E. Erickson and L.T. Fan. Modeling and simulation of oxygen transfer in airlift fermentors. Biotechnol. and Bioeng. 19 (1977) 1503-1522.
[7] P. Verlaan J. Tramper, K. van ' t Riet and K.Ch.A.M. Luyben. A Hydrodynamic model for an airlift-loop bioreactor with external loop. Chem. Eng. Journal. 33 (1986) B43-B53 (Chapter two of this thesis) .
[8] P. Verlaan, A.M.M. van Eijs, J. Tramper, K. van ' t Riet and K.Ch.A.M. Luyben. Estimation of axial dispersion in individual sections of an airlift-loop reactor, submitted for publication (Chapter three of this thesis).
[9] R.G.J.M. van der Lans. Hydrodynamics of a bubble column loop reactor. Thesis, Delft- University of Technology, Delft, 1985.
[10] A.V. Quirk and R.W.H. Plank. The effect of carbondioxide on the production of an extracellular nuclease of staphylococcus aureus. Biotechnol. & Bioeng. 25 (1983) 1083-1093.
73
[11] J. van de Donk. Water aeration with plunging jets. Thesis, Delft University of Technology, Delft, 1981.
[12] G. Ruchti, I.J. Dunn and J.R. Bourne. Comparison of dynamic oxygen electrode methods for the measurements of kia. Biotechnol. & Bioeng. 23 (1981) 277-290.
[13] R. Higbie. The rate of absorption of a pure gas into a still liquid during short periods of exposure. Trans. Am. Inst. Chem. Eng. 31 (1935) 365-389.
[14] M.M.C.G. Warmoeskerken. Gas-liquid dispersing characteristics of turbine agitators. Thesis, Delft University of Technology, Delft, 1986.
[15] L.C. Brown and C.R.J. Baillod. Modeling and interpreting oxygen transfer data. Proc. ASCE. (1982).
[16] Subroutine DVERK (Runge-Kutta method, initial value problem.) IMSL library edition 9.2, Houston, 1984.
[17] K. van ' t Riet. Turbine agitator hydrodynamics and dispersion performance. Thesis, Delft University of Technology, Delft, 1975.
[18] V. Linek, P. Benes and F. Hovorka. The role of interphase nitrogen transport in the dynamic measurements of the overall volumetric mass transfer coefficient in air-sparged systems. Biotechnol. & Bioeng. 23 (1980) 301-319.
[19] 0PTPAC3. Non-lineair optimalisation package NDV-DSA/SCA/TK/77:054/ap. N.V. Philips Gloeilampen fabrieken, Eindhoven, The Netherlands, 1977.
[20] J. Robinson and J.H. Cooper. Method of determining oxygen concentrations in biological media, suitable for calibration of the oxygen electrode. Anal. Biochem. 33 (1970) 390-399.
[21] P. Verlaan, J.-C. Vos and K. van' t Riet. From bubble column to airlift-loop reactor. Hydrodynamics of the transition flow regime. Submitted (Chapter five of this thesis).
[22] M. Alvarez-Cuenca, C.G.J. Baker and M.A. Bergougnou. Oxygen mass transfer in bubble columns. Chem. Eng. Sci. 35 (1980) 1121-1127.
NOMENCLATURE
A (interfacial) area [raa]
a volumetric interfacial area [m~^J
c concentration [kg/m3]
d diameter [m]
g gravitational constant [m/s2]
He Henry constant [pa]
K Michaelis Menten constant [kg/m3]
k mass transfer coefficient [m/s]
kja volumetric mass transfer coefficient [s~ ' kja mean volumetric mass transfer
coefficient concerning the column length
kja overall, mean volumetric mass
transfer coefficient of the ALR [s-1]
L length [m]
M molar mass [kg/mol]
p pressure [Pa]
74
R
r
STR
T
t
V
v„ V
X
y
gas constant
respiration coefficient
ideally stirred tank reactor
temperature
time
volume
Michaelis Henten constant
velocity
coordinate
mole fraction
i denoting a specific component
1 liquid
s saturation, superficial
[J/(mol
[kg/(m3
[K]
[«]
[m3]
[kg/(m3
[ra/s]
[m]
[-]
K)]
s)]
.»)]
Greek symbols
o gas hold up [-]
o' approximated gas hold up [-]
(J>v volume flow [m3/s]
p density [kg/m3]
Subscripts
b bubble
g gas
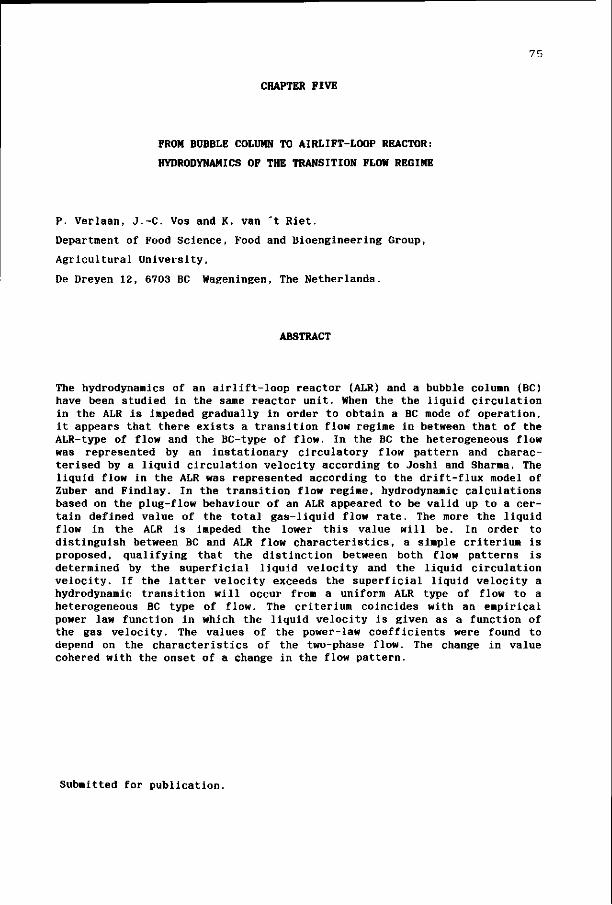
75
CHAPTER FIVE
FROM BUBBLE COLUMN TO AIRLIFT-LOOP REACTOR:
HYDRODYNAMICS OF THE TRANSITION FLOW REGIME
P. Verlaan, J.-C. Vos and K. van 't Riet.
Department of Food Science, Food and Bioengineering Group,
Agricultural University,
De Dreyen 12, 6703 BC Wageningen, The Netherlands.
ABSTRACT
The hydrodynamics of an airlift-loop reactor (ALR) and a bubble column (BC) have been studied in the same reactor unit. When the the liquid circulation in the ALR is impeded gradually in order to obtain a BC mode of operation, it appears that there exists a transition flow regime in between that of the ALR-type of flow and the BC-type of flow. In the BC the heterogeneous flow was represented by an instationary circulatory flow pattern and characterised by a liquid circulation velocity according to Joshi and Sharma. The liquid flow in the ALR was represented according to the drift-flux model of Zuber and Findlay. In the transition flow regime, hydrodynamic calculations based on the plug-flow behaviour of an ALR appeared to be valid up to a certain defined value of the total gas-liquid flow rate. The more the liquid flow in the ALR is impeded the lower this value will be. In order to distinguish between BC and ALR flow characteristics, a simple criterium is proposed, qualifying that the distinction between both flow patterns is determined by the superficial liquid velocity and the liquid circulation velocity. If the latter velocity exceeds the superficial liquid velocity a hydrodynamic transition will occur from a uniform ALR type of flow to a heterogeneous BC type of flow. The criterium coincides with an empirical power law function in which the liquid velocity is given as a function of the gas velocity. The values of the power-law coefficients were found to depend on the characteristics of the two-phase flow. The change in value cohered with the onset of a change in the flow pattern.
Submitted for publication.
76
INTRODUCTION
Various types of bioreactors are presently used in biotechnological pro
cesses of which the airlift-loop reactor (ALR) is a recent development. The
ALR concept has been evolved from that of the bubble column and was first
described by Le Francois et al. [1]. The special feature of the ALR is the
circulation of the liquid through a downcomer which connects the top and the
bottom of the main bubbling section (the riser). Due to the high circulation
flow rate, efficient mixing is combined with a controlled liquid flow in the
absence of mechanical agitators [2]. Moreover, an ALR satisfies a high oxy
gen demand even at large ALR constructions (50 -• 100 m) [3]. For this
reasons, an ALR seems an attractive alternative for aerobic processes.
An ALR has a plug flow for both the liquid and the gas phase with the liquid
phase circulating through the reactor. If the liquid flow is hampered (e.g.
by gas redispersion plates, a small downcomer diameter, monitoring devices
etc.) the upflow region can loose its typical plug flow characteristics.
Gradually, a transition from plug flow to a BC type of flow will occur when
the liquid flow decreases. The intermediate region between an unhampered
ALR-flow and an established BC-flow is what we call the transition flow
regime.
A major problem in designing and modelling the hydrodynamic characteristics
of an ALR is the exact characterization of the flow regime in the column.
This problem has been recognized earlier in the literature, though until
yet, only a few results have been reported on this topic. Merchuk and Stein
[4], for instance, investigated gas hold-ups and liquid velocities as a
function of the hydrodynamic resistance in an ALR by partially closing the
downcomer. They found the liquid velocity to be a simple power law function
of the gas flow rate. The coefficients of the power-law function did depend
on the geometry of the ALR and the two-phase flow regime in the riser column
and therefore on the resistance in the ALR. However, on the one hand the
authors concluded that a change of the exponent in the above-mentioned
correlation gives an objective method to recognize the onset of change in
the flow pattern. On the other hand they concluded that, in evaluating their
results according to the Zuber and Findlay drift-flux model [5], fairly flat
velocity and gas hold-up radial profiles exist all along the column, inde
pendent of reactor operation under bubble column or ALR conditions. Merchuk
[6] investigated gas hold-up and liquid circulation in an ALR with a rec-
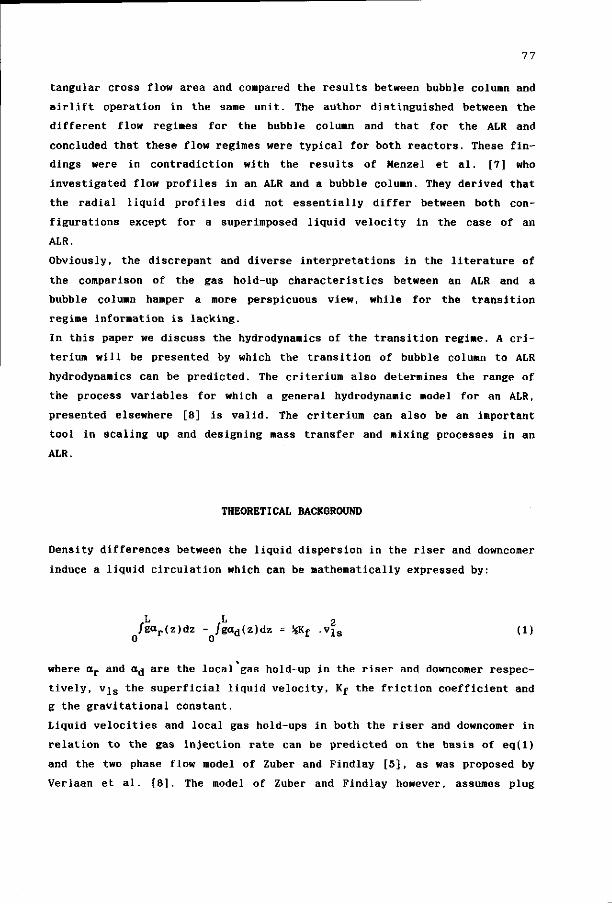
77
tangular cross flow area and compared the results between bubble column and
airlift operation in the same unit. The author distinguished between the
different flow regimes for the bubble column and that for the ALR and
concluded that these flow regimes were typical for both reactors. These fin
dings were in contradiction with the results of Menzel et al. [7] who
investigated flow profiles in an ALR and a bubble column. They derived that
the radial liquid profiles did not essentially differ between both con
figurations except for a superimposed liquid velocity in the case of an
ALR.
Obviously, the discrepant and diverse interpretations in the literature of
the comparison of the gas hold-up characteristics between an ALR and a
bubble column hamper a more perspicuous view, while for the transition
regime information is lacking.
In this paper we discuss the hydrodynamics of the transition regime. A cri-
terium will be presented by which the transition of bubble column to ALR
hydrodynamics can be predicted. The criterium also determines the range of
the process variables for which a general hydrodynamic model for an ALR,
presented elsewhere [8] is valid. The criterium can also be an important
tool in scaling up and designing mass transfer and mixing processes in an
ALR.
THEORETICAL BACKGROUND
Density differences between the liquid dispersion in the riser and downcomer
induce a liquid circulation which can be mathematically expressed by:
/gar(z)dz - /gad(z)dz = %Kf ,vls (1) 0 0
where o r and a d are the local gas hold-up in the riser and downcomer respec
tively, v j s the superficial liquid velocity, Kj the friction coefficient and
g the gravitational constant.
Liquid velocities and local gas hold-ups in both the riser and downcomer in
relation to the gas injection rate can be predicted on the basis of eq(l)
and the two phase flow model of Zuber and Findlay [5], as was proposed by
Verlaan et al. [8]. The model of Zuber and Findlay however, assumes plug
78
flow in the liquid phase, taking into account a non-uniform flow and hold-up
distribution across the duct. This means that this model is restricted only
to an ALR with a high circulation rate because in that regime the plug flow
characteristics are reached. From the Zuber and Findlay model the following
equation is obtained:
vg = C. {vgs + v l s } + vb>00 (2)
where C is a distribution parameter for non-uniform, radial flow and vb „
is the rise velocity of a single bubble in an infinite medium. The flatter
the flow profiles, the closer C approaches unity. When v„ is plotted as a
function of the total flow, vg s+vl s, the values of C and vb „, can be
obtained and the flow is characterized. If the flow regime changes, there
will be a non-linear relationship between the gasvelocity and the total
flow, indicating that C and vb „, will depend on the value of the total gas-
liquid flow rate.
In the case of a bubble column, the Zuber and Findlay model is not valid. In
such a column, the heterogeneous two-phase flow induces instationary cir
culation cells which cannot be represented by a single distribution para
meter. Moreover, radial hold-up and liquid velocity profiles are strongly
dependent of the gas input rate [9.1°]• Joshi and Sharma [10], introduced a
model which predicts the circulation velocity, v c j , of the liquid in the
circulation cells. They derived an expression for the liquid circulation
velocity at high superficial liquid velocities which can be represented by:
vc l- 1.18{gDa(vs - v b > 0 0 ) | 0 - 3 3 (3)
where vs is the slip velocity between the gas and the liquid phase and D is
the diameter of the column.
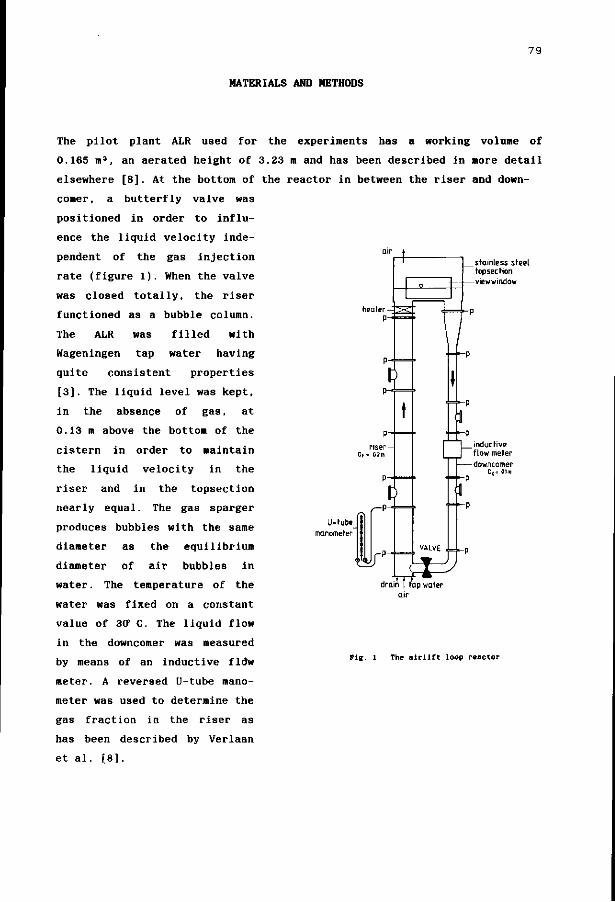
79
MATERIALS AND METHODS
heater -P-
^
P-
riser-
P^
U-tube manometer
- P -
stainless steel topsection
-viewwindow
ft
The pilot plant ALR used for the experiments has a working volume of
0.165 m3, an aerated height of 3.23 m and has been described in more detail
elsewhere [8]. At the bottom of the reactor in between the riser and down-
comer, a butterfly valve was
positioned in order to influ
ence the liquid velocity inde
pendent of the gas injection
rate (figure 1). When the valve
was closed totally, the riser
functioned as a bubble column.
The ALR was filled with
Wageningen tap water having
quite consistent properties
[3]. The liquid level was kept,
in the absence of gas, at
0.13 m above the bottom of the
cistern in order to maintain
the liquid velocity in the
riser and in the topsection
nearly equal. The gas sparger
produces bubbles with the same
diameter as the equilibrium
diameter of air bubbles in
water. The temperature of the
water was fixed on a constant
value of 3CP C. The liquid flow
in the downcomer was measured
by means of an inductive fldw
meter. A reversed U-tube mano
meter was used to determine the
gas fraction in the riser as
has been described by Verlaan
et al. [8].
_ inductive flow meter
-downcomer D d : 01m
lin I tap drain | tap water air
Pig. 1 The a i r l i f t loop reactor
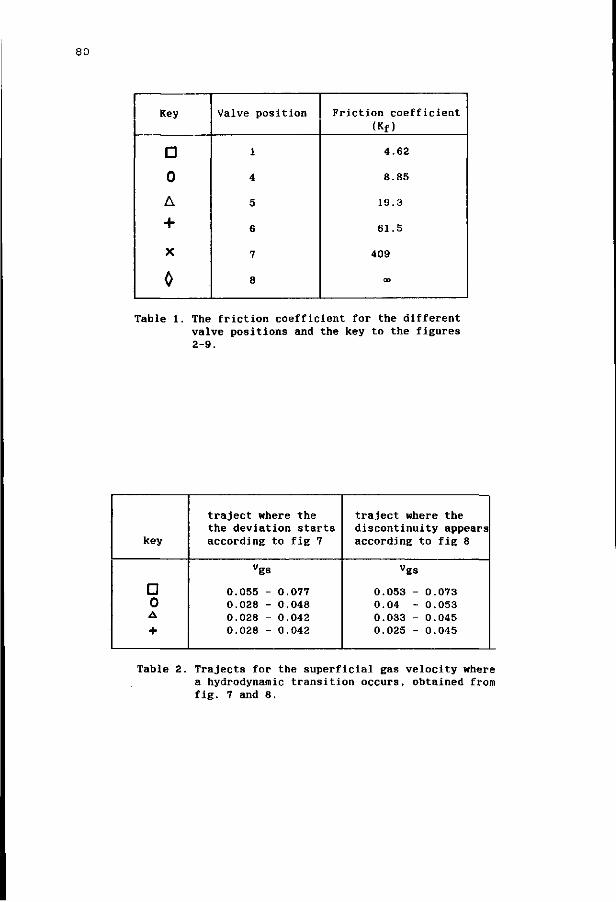
80
Key
D 0 A
+ X
0
Valve position
1
4
5
6
7
8
Friction coefficient (Kf)
4.62
8.85
19.3
61.5
409
00
Table 1. The friction coefficient for the different valve positions and the key to the figures 2-9.
key
traject where the the deviation starts according to fig 7
traject where the discontinuity appears according to fig 8
• 0 A
"gs
055 - 0.077 028 -028 -028 -
0.048 0.042 0.042
"gs
0 0 0 0
053 04 033 -025
- 0 - 0 - 0 - 0
073 053 045 045
Table 2. Trajects for the superficial gas velocity where a hydrodynamic transition occurs, obtained from fig. 7 and 8.

RESULTS AND DISCUSSION
Liquid velocity and hold-up
Figure 2 shows the liquid velocity as a function of the normalized super
ficial gas velocity in the riser. The normalized value is the value at
visdlm/s] 1.6-.
16 102Vas[m/s] *gs
Pig. 2 Superficial liquid velocity in the downcomer as a function of the superficial gas velocity with the valve position as a parameter. (Key given in table 1)
100 kPa and 0 °C. In this figure, the position of the butterfly valve is a
parameter. As shown, the position of the butterfly valve determines the
liquid circulation and therefore the liquid velocity in the downcomer and
riser. As a result, the residence time of the gas phase in the riser
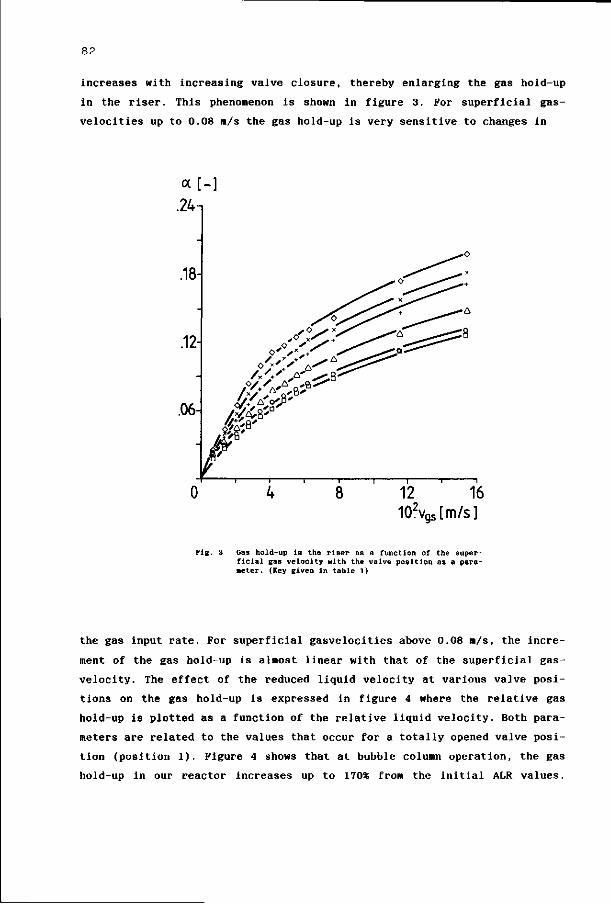
82
increases with increasing valve closure, thereby enlarging the gas hold-up
in the riser. This phenomenon is shown in figure 3. For superficial gas-
velocities up to 0.08 m/s the gas hold-up is very sensitive to changes in
.24-,
.18
.12-
.06-
I MP
12 102v,
16 •gslm/s]
Fig. 3 Gas hold-up in the riser as a function of the superficial gas velocity with the valve position as a parameter. (Key given in table 1)
the gas input rate. For superficial gasvelocities above 0.08 m/s, the incre
ment of the gas hold-up is almost linear with that of the superficial gas-
velocity. The effect of the reduced liquid velocity at various valve posi
tions on the gas hold-up is expressed in figure 4 where the relative gas
hold-up is plotted as a function of the relative liquid velocity. Both para
meters are related to the values that occur for a totally opened valve posi
tion (position 1). Figure 4 shows that at bubble column operation, the gas
hold-up in our reactor increases up to 170* from the initial ALR values.
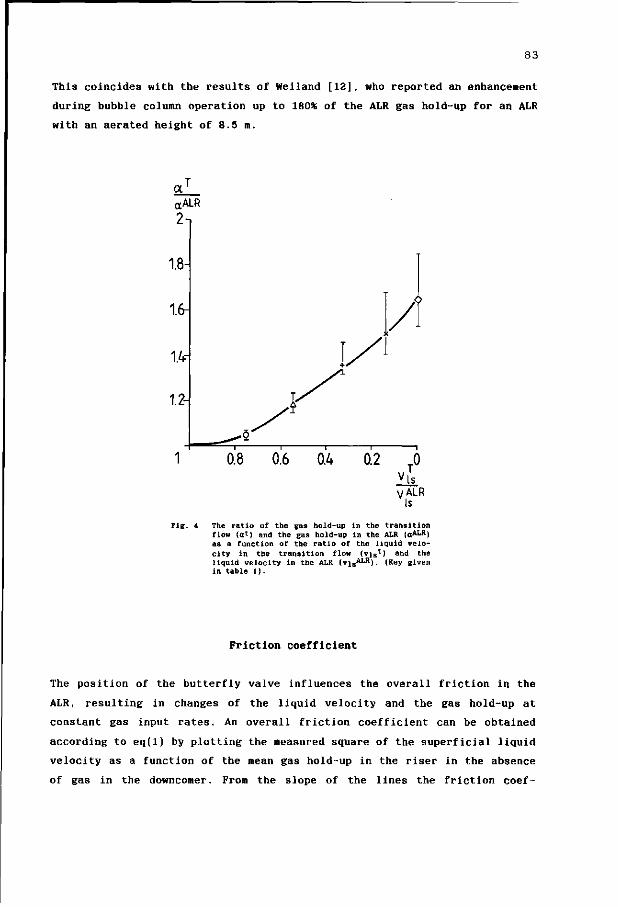
83
This coincides with the results of Wei land [12], who reported an enhancement
during bubble column operation up to 180% of the ALR gas hold-up for an ALR
with an aerated height of 8.5 m.
The ratio of the gas hold-up in the transition flow (at) and the gas hold-up in the ALR (oALR) as a function of the ratio of the liquid velocity in the transition flow (vis1) and the liquid velocity in the ALR (vis
A L R). (Key given in table 1).
Friction coefficient
The position of the butterfly valve influences the overall friction in the
ALR, resulting in changes of the liquid velocity and the gas hold-up at
constant gas input rates. An overall friction coefficient can be obtained
according to eq(l) by plotting the measured square of the superficial liquid
velocity as a function of the mean gas hold-up in the riser in the absence
of gas in the downcomer. From the slope of the lines the friction coef-
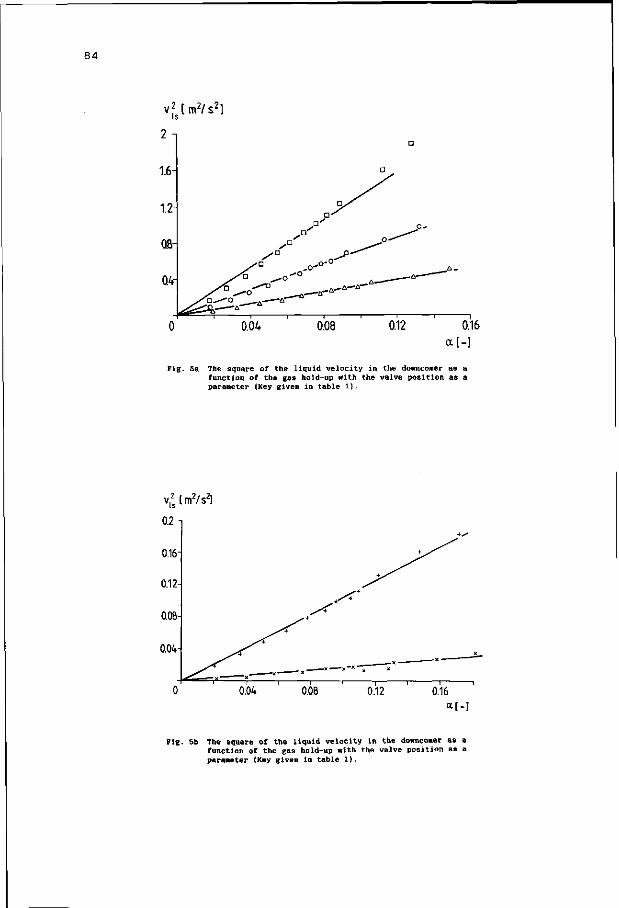
84
Fig. 5a The square of the liquid velocity in the downcomer as a function of the gas hold-up with the valve position as a parameter (Key given in table 1).
<*[-]
Pig. 5b The square of the liquid velocity in the downcomer as a function of the gas hold-up with the valve position as a parameter (Key given in table 1).
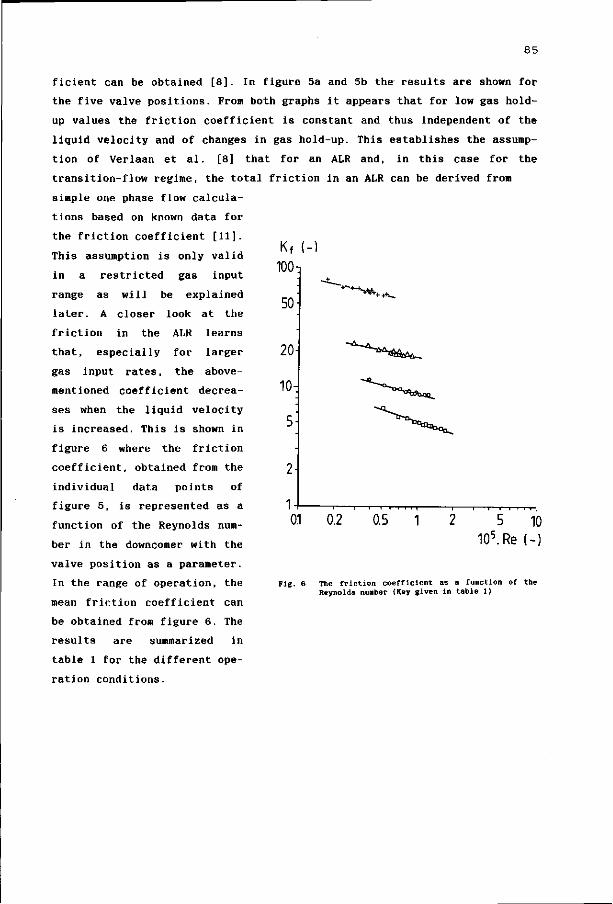
85
• * * * • + * - .
ficient can be obtained [8]. In figure 5a and 5b the results are shown for
the five valve positions. From both graphs it appears that for low gas hold
up values the friction coefficient is constant and thus independent of the
liquid velocity and of changes in gas hold-up. This establishes the assump
tion of Verlaan et al. [8] that for an ALR and, in this case for the
transition-flow regime, the total friction in an ALR can be derived from
simple one-phase flow calcula
tions based on known data for
the friction coefficient [11].
This assumption is only valid
in a restricted gas input
range as will be explained
later. A closer look at the
friction in the ALR learns
that, especially for larger
gas input rates, the above-
mentioned coefficient decrea
ses when the liquid velocity
is increased. This is shown in
figure 6 where the friction
coefficient, obtained from the
individual data points of
figure 5, is represented as a
function of the Reynolds num
ber in the downcomer with the
valve position as a parameter.
In the range of operation, the
mean friction coefficient can
be obtained from figure 6. The
results are summarized in
table 1 for the different ope
ration conditions.
Kf
10(h
50
20
10,
5:
2-
1 0.1 0.2 0.5 2 5 10
105.Re (-)
Pig. 6 The friction coefficient as a function of the Reynolds number (Key given in table 1)
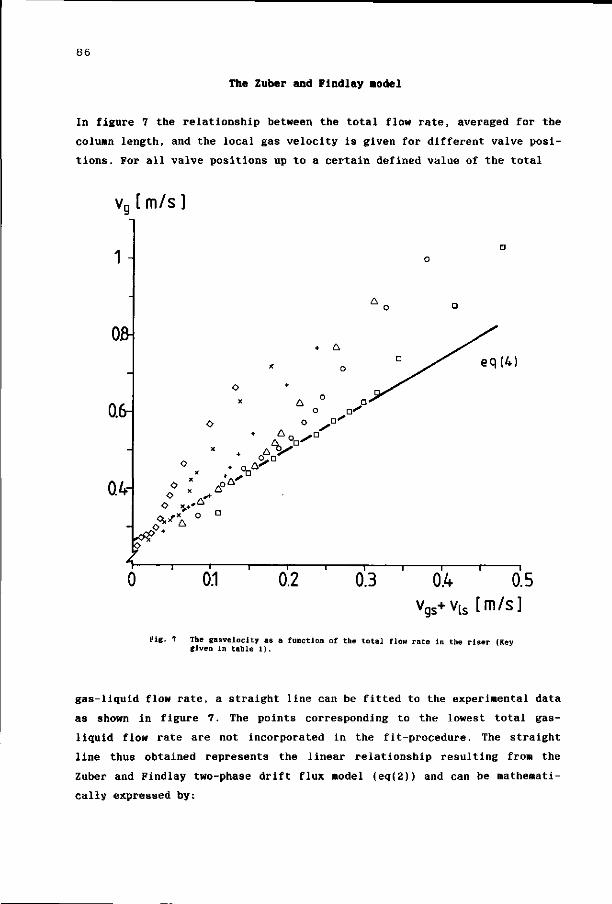
86
The Zuber and Findlay «odel
In figure 7 the relationship between the total flow rate, averaged for the
column length, and the local gas velocity is given for different valve posi
tions. For all valve positions up to a certain defined value of the total
vg [m / s ]
1-
0.8-
0.6-
0.4-
+ A
o n'
O o
o v
• oj-
.A'
I o
- I 1 1 1 1 1 —
0.1 0.2 0.3
eq(M
— i r
0.4 0.5 vqs+vts [m/s]
Fig. 7 The gasvelocity as a function of the total flow rate in the riser (Key given in table 1).
gas-liquid flow rate, a straight line can be fitted to the experimental data
as shown in figure 7. The points corresponding to the lowest total gas-
liquid flow rate are not incorporated in the fit-procedure. The straight
line thus obtained represents the linear relationship resulting from the
Zuber and Findlay two-phase drift flux model (eq(2)) and can be mathemati
cally expressed by:
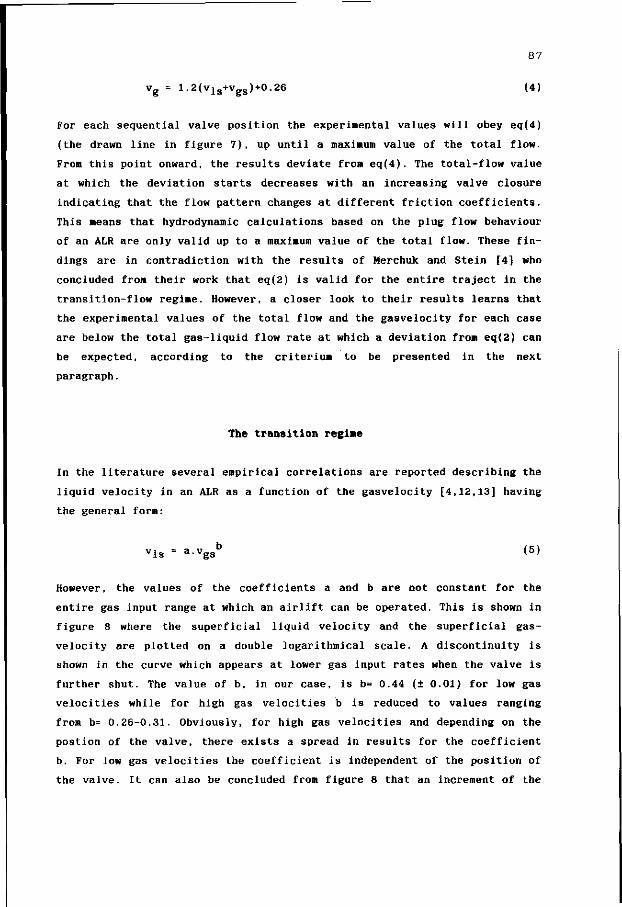
87
v g = 1.2(vls+vgs)+0.26 (4)
For each sequential valve position the experimental values will obey eq(4)
(the drawn line in figure 7 ) , up until a maximum value of the total flow.
From this point onward, the results deviate from eq(4). The total-flow value
at which the deviation starts decreases with an increasing valve closure
indicating that the flow pattern changes at different friction coefficients.
This means that hydrodynamic calculations based on the plug flow behaviour
of an ALR are only valid up to a maximum value of the total flow. These fin
dings are in contradiction with the results of Merchuk and Stein [4] who
concluded from their work that eq(2) is valid for the entire traject in the
transition-flow regime. However, a closer look to their results learns that
the experimental values of the total flow and the gasvelocity for each case
are below the total gas-liquid flow rate at which a deviation from eq(2) can
be expected, according to the criterium to be presented in the next
paragraph.
The transition regime
In the literature several empirical correlations are reported describing the
liquid velocity in an ALR as a function of the gasvelocity [4,12,13] having
the general form:
vls = a - v g s b ( 5 )
However, the values of the coefficients a and b are not constant for the
entire gas input range at which an airlift can be operated. This is shown in
figure 8 where the superficial liquid velocity and the superficial gas
velocity are plotted on a double logarithmical scale. A discontinuity is
shown in the curve which appears at lower gas input rates when the valve is
further shut. The value of b, in our case, is b= 0.44 (+ 0.01) for low gas
velocities while for high gas velocities b is reduced to values ranging
from b= 0.26-0.31. Obviously, for high gas velocities and depending on the
postion of the valve, there exists a spread in results for the coefficient
b. For low gas velocities the coefficient is independent of the position of
the valve. It can also be concluded from figure 8 that an increment of the

88
10-8:
5
3
0.1-
1i 0.8-
0.5-
0.3^
n.o--°'D 0 - o -
n ^ ° -0-°'° A - ^ - ^ o ' ° A-A-a-"
' V ° A-** - 0 ^ A " - ^ * - " " * " , A ^ f i . . . - * - * ' *
—i—i—i—rr -
3 5 I 10 — i — I — I i r p-i-i
30 50 80100 102vg s [m/s]
Fie- 8 The superficial downcoaer liquid velocity as a function of the superficial gas velocity (Key given in table 1).
friction diminishes the value of a. Merchuk and Stein [4] also noticed these
phenomena and attributed
these effects to the Vls[m/s]
transfer of bubble flow
to turbulent bubble flow
in the column. Onken and
Weiland [12] and van der
Lans [13] were able to
describe their results
for an ALR with one
single value for the
exponent.
The position of the
discontinuity for the
individual lines in fi
gure 8 coincides with
the start of the devia
tion from the Zuber and
Findlay relation (eq(2))
in figure 7, as is shown in table 2. Apparently, a change in flow pattern is
responsible for this deviation. The background of this change of flow pat
tern can be explained when the typical hydrodynamic flow behaviour of a
bubble column is considered according to Joshi and Sharma [10] (eqn(3)).
From their model it is derived that there exists a heterogeneous circulation
flow pattern inside the bubble column when the slip velocity, vs, is greater
than the rise velocity of a single bubble in an infinite medium, vb x. When
the slip velocity, vs, is calculated, the circulating velocity can be
obtained from the model of Joshi and Sharma. By applying eqn(3) for the pre
sent reactor a circulation velocity can be obtained thereby suggesting the
appearance of circulation cells. This would imply a heterogeneous flow pat
tern though the actual flow pattern can be very accurately predicted by the
plug-flow model of Zuber and Findlay. Obviously, the relative high liquid
flow rates in the upflow region of the ALR suppresses the existence of the
circulation cells. In figure 9, the ratio of the superficial liquid velocity
in the riser and the calculated liquid circulation velocity from eqn (3) is
given as a function of the superficial gas velocity for ALR operation and
two intermediate valve positions. From this figure it can be seen that each
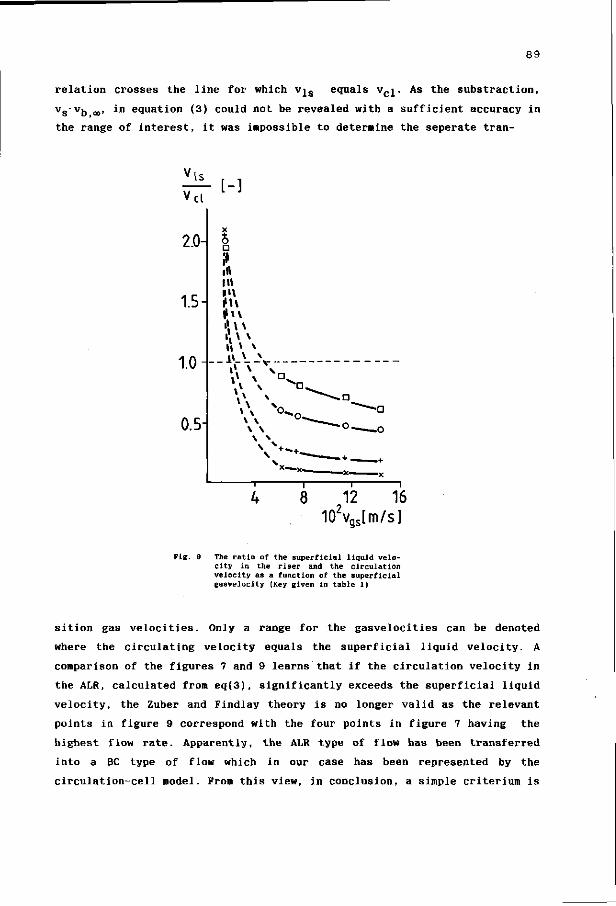
89
relation crosses the line for which v^s equals v c j . As the substraction,
Vg-vjj 00, in equation (3) could not be revealed with a sufficient accuracy in
the range of interest, it was impossible to determine the seperate tran-
v l s
Vcl
2.0-
1.5-
1.0
0.5-
[-1
X
S D a in i» \ M\ *»\ .\\v i \ \ \
A \ \ it \ v
4 T "
8 12 16 102vgs[m/s]
Fig. 9 The ratio of the superficial liquid velocity in the riser and the circulation velocity as a function of the superficial gasvelocity (Key given In table 1)
sition gas velocities. Only a range for the gasvelocities can be denoted
where the circulating velocity equals the superficial liquid velocity. A
comparison of the figures 7 and 9 learns that if the circulation velocity in
the ALR, calculated from eq(3), significantly exceeds the superficial liquid
velocity, the Zuber and Findlay theory is no longer valid as the relevant
points in figure 9 correspond with the four points in figure 7 having the
highest flow rate. Apparently, the ALR type of flow has been transferred
into a BC type of flow which in our case has been represented by the
circulation-cell model. From this view, in conclusion, a simple criterium is
90
postulated leading to a discrimination between both types of flow in the
transition regime. The criterium states that the change between an ALR-type
of flow and a BC-type of flow can be expected when:
v l s s v c l (6)
If eqn [6] holds for an ALR the flow in such a reactor can be very well
modelled by the two phase flow drift flux model of Zuber and Findlay. This
conclusion also indicates that the hydrodynamic model of Verlaan et al. [8]
only gives an accurate description of liquid velocities and gas hold-ups
until a hydrodynamic transition occurs, according to eqn(6). If the super
ficial liquid velocity obviously exceeds the liquid circulation velocity,
the airlift is operated as a bubble column and the above-mentioned hydrody
namic model will calculate progressive values for the gas hold-up and the
liquid velocity as the gas velocity is underestimated by the Zuber and
Findlay model.
CONCLUSION
The gas hold-up in an ALR is, in contrast to a BC, determined by the liquid
velocity. When the friction in an ALR is enhanced, the liquid velocity will
be reduced thereby enlarging the gas hold-up. The maximum value will be
obtained when the ALR is operated as a BC. For the latter operation mode the
gas hold-up in our reactor reaches values of 170% of the initial ALR value.
The liquid velocity was found to be a simple power-law function of the gas
flow rate for both reactor configurations; the coefficients depending on the
flow characteristics of the reactor configuration. The liquid flow in a BC
is characterized by the liquid circulation velocity according to the
circulation-cell model of Joshi and Sharma. In the ALR the flow was repre
sented according to the drift-flux model of Zuber and Findlay. In the tran
sition flow regime between both reactor configurations the hydrodynamic
calculations based on the plug-flow behaviour of an ALR are only valid up to
a maximum value of the total gas-liquid flow rate. For greater values, the
ALR type of flow will change into a BC type of flow. A simple criterium
qualifies the distinction between both flow patterns, determined by the
superficial liquid velocity and the liquid circulation velocity.
91
REFERENCES
[I] M.L. Lefrangois, C.G. Mariller and J.V. Mejane. Effectionnements aux procedes de cultures Forgiques et de fermentations industrielles. Brevet d'Invention, France, no. 1 102 200 (1955).
[2] P. Verlaan, A.M.M. van Eijs, J. Tramper, K. van ' t Riet and K. Ch. A. M. Luyben. Estimation of axial dispersion in individual sections of an airlift-loop reactor. Submitted for publication. (Chapter three of this thesis) .
[3] P. Verlaan, M.A.F. Hermans, J. Tramper, K. van ' t Riet and K.Ch.A.M. Luyben. Isobaric and non-isobaric modelling of dynamic gas-liquid oxygen transfer in an airlift-loop bioreactor. Submitted for publication. (Chapter four of this thesis).
[4] J.C. Merchuk and Y. Stein. Local hold up and liquid velocity in airlift reactors. AIChEJ., 27 (1981) 377-388.
[5] N. Zuber and J.A. Findlay. Average volumetric concentration in two-phase flow systems. J. Heat Transfer, November (1965) 453-468.
[6] J.C. Merchuk. Gas hold-up and liquid velocity in a two dimensional air-lift reactor. Chem. Eng. Sci., 41 (1986) 11-16.
[7] T. Menzel, H.J. Kantorek, K. Franz, R. Buchholz and U. Onken. Zur Stromungsstruktur in Airlift-Schlaufenreaktoren. Chem. Ing. Techn., 57 (1985) 139-141.
[8] P. Verlaan, J. Tramper, K. van ' t Riet and K.Ch.A.M. Luyben. A hydro-dynamic model for an airlift-loop bioreactor with external loop. Chem. Eng. J., 33 (1986) B43 (Chapter two of this thesis).
[9] J.B. Joshi and Y.T. Shah. Hydrodynamic and mixing models for bubble column reactors. Chem. Eng. Commun., 11 (1981) 165-199.
[10] J.B. Joshi and M.M. Sharma. A circulation cell model for bubble columns. Trans.I.Chem.E., 57 (1979) 244-251.
[II] G.B. Wallis, One dimensional two phase flow, McGraw-Hill, New York, 1969.
[12] U. Onken and P. Weiland. Hydrodynamics and mass transfer in an airlift loop fermentor. Eur. J. Appl. Microbiol. Biotechnol., 10 (1980) 31-40.
[13] R.G.J.M. van der Lans, Hydrodynamics of a bubble column loop reactor, Thesis, Delft University of Technology, Delft, 1985.
NOMENCLATURE
a
u
C
D
g
Kf
L
Re
vb,oo
gas hold-up
viscosity
flow parameter
diameter
gravitational constant
friction coefficient
length
Reynolds number:
Re= v.D/v
velocity
rise velocity of a single
bubble in an infinite medium
coordinate
[-]
[mVs]
[-]
[m]
[m/s2]
[-]
[•]
[-]
[m/s]
[m/s]
[•]
92
Subscripts
cl according to the liquid circulation
d downcomer
g gas
1 liquid
r riser
s superficial, slip
93
CHAPTER SIX
FROM BUBBLE COLUMN TO AIRLIFT-LOOP REACTOR:
AXIAL DISPERSION AND OXYGEN TRANSFER
P. Verlaan, J.-C. Vos and K. van 't Riet
Department of Food Science, Food and Bioengineering Group,
Agricultural University,
De Dreyen 12, 6703 BC Wageningen, The Netherlands.
ABSTRACT
Axial dispersion and oxygen transfer were investigated in a bubble column
with a circulation loop. A butterfly valve, situated at the bottom of the
loop enabled us to study the above-mentioned physical characteristics in the
transition regime between typical airlift-loop-reactor (ALR) flow and
bubble-column (BC) flow. The Bodenstein number was found to decrease when
the liquid velocity was reduced, implicating a less established plug flow
character. The number of circulations required to achieve complete mixing in
the reactor was diminished if the liquid circulation was hampered and
appeared to be proportional to the Bodenstein number. The volumetric oxygen
transfer coefficient was estimated by an ideally-stirred-tank reactor (STR)
model and a plug-flow model. The STR model yielded reliable results for the
whole range of operation while the plug-flow model only appeared to be
appropriate for the ALR operation mode. The kja values obtained, were
included in a generalized correlation for the transition flow regime and
were found to increase gradually when the circulation velocity was reduced.
Submitted for publication.
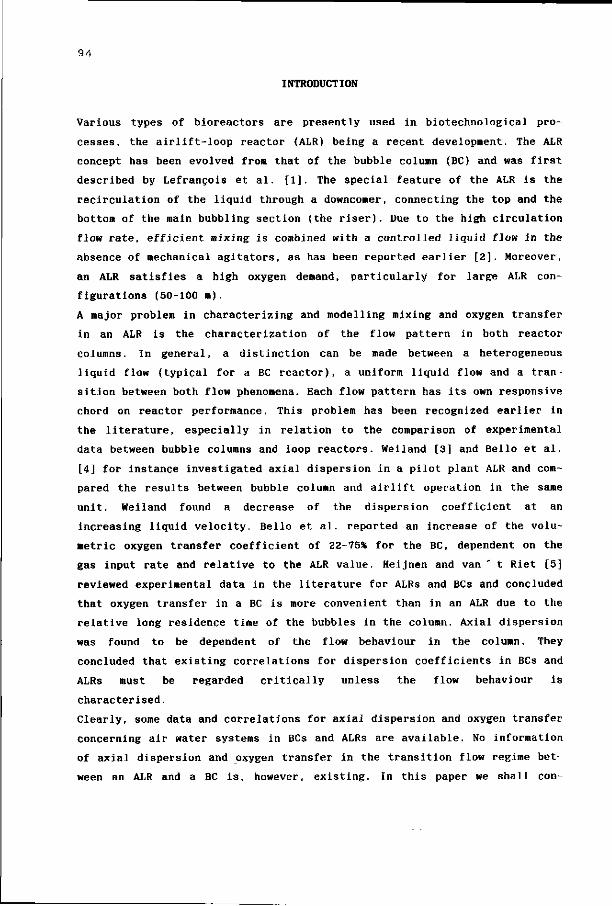
94
INTRODUCTION
Various types of bioreactors are presently used in biotechnological pro
cesses, the airlift-loop reactor (ALR) being a recent development. The ALR
concept has been evolved from that of the bubble column (BC) and was first
described by Lefrancois et al. [1]. The special feature of the ALR is the
recirculation of the liquid through a downcomer, connecting the top and the
bottom of the main bubbling section (the riser). Due to the high circulation
flow rate, efficient mixing is combined with a controlled liquid flow in the
absence of mechanical agitators, as has been reported earlier [2]. Moreover,
an ALR satisfies a high oxygen demand, particularly for large ALR con
figurations (50-100 m ) .
A major problem in characterizing and modelling mixing and oxygen transfer
in an ALR is the characterization of the flow pattern in both reactor
columns. In general, a distinction can be made between a heterogeneous
liquid flow (typical for a BC reactor), a uniform liquid flow and a tran
sition between both flow phenomena. Each flow pattern has its own responsive
chord on reactor performance. This problem has been recognized earlier in
the literature, especially in relation to the comparison of experimental
data between bubble columns and loop reactors. Weiland [3] and Bello et al.
[4] for instance investigated axial dispersion in a pilot plant ALR and com
pared the results between bubble column and airlift operation in the same
unit. Weiland found a decrease of the dispersion coefficient at an
increasing liquid velocity. Bello et al. reported an increase of the volu
metric oxygen transfer coefficient of 22-75* for the BC, dependent on the
gas input rate and relative to the ALR value. Heijnen and van ' t Riet [5]
reviewed experimental data in the literature for ALRs and BCs and concluded
that oxygen transfer in a BC is more convenient than in an ALR due to the
relative long residence time of the bubbles in the column. Axial dispersion
was found to be dependent of the flow behaviour in the column. They
concluded that existing correlations for dispersion coefficients in BCs and
ALRs must be regarded critically unless the flow behaviour is
characterised.
Clearly, some data and correlations for axial dispersion and oxygen transfer
concerning air water systems in BCs and ALRs are available. No information
of axial dispersion and oxygen transfer in the transition flow regime bet
ween an ALR and a BC is, however, existing. In this paper we shall con-
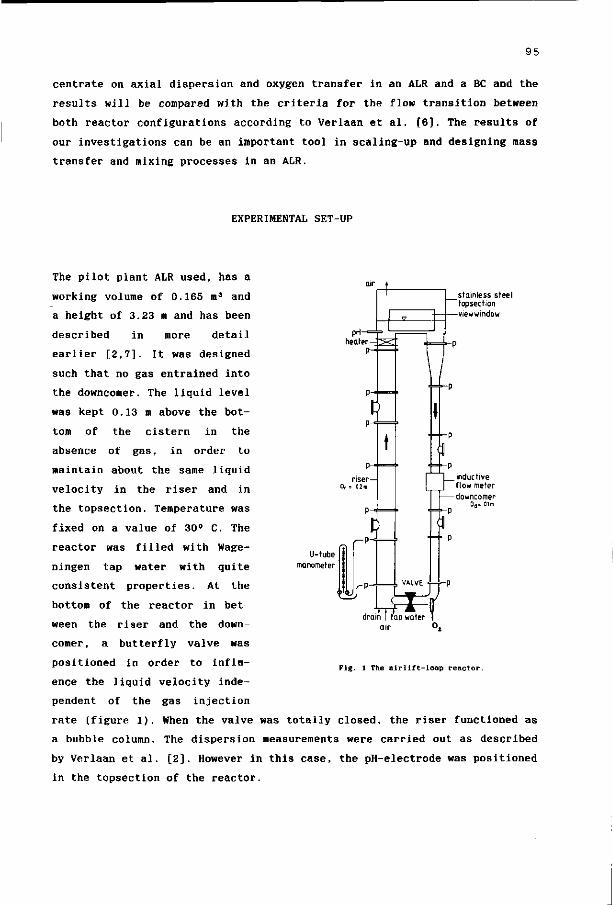
95
centrate on axial dispersion and oxygen transfer in an ALR and a BC and the
results will be compared with the criteria for the flow transition between
both reactor configurations according to Verlaan et al. [6]. The results of
our investigations can be an important tool in scaling-up and designing mass
transfer and mixing processes in an ALR.
EXPERIMENTAL SET-UP
inductive flow meter downcomer
0j= 01m
The pilot plant ALR used, has a
working volume of 0.165 m3 and
a height of 3.23 m and has been
described in more detail
earlier [2,7]. It was designed
such that no gas entrained into
the downcomer. The liquid level
was kept 0.13 m above the bot
tom of the cistern in the
absence of gas, in order to
maintain about the same liquid
velocity in the riser and in
the topsection. Temperature was
fixed on a value of 30° C. The
reactor was filled with Wage-
ningen tap water with quite
consistent properties. At the
bottom of the reactor in bet
ween the riser and the down-
corner, a butterfly valve was
positioned in order to infln-
ence the liquid velocity inde
pendent of the gas injection
rate (figure 1). When the valve was totally closed, the riser functioned as
a bubble column. The dispersion measurements were carried out as described
by Verlaan et al. [2]. However in this case, the pH-electrode was positioned
in the topsection of the reactor.
Fig. 1 The airlift-loop reactor.
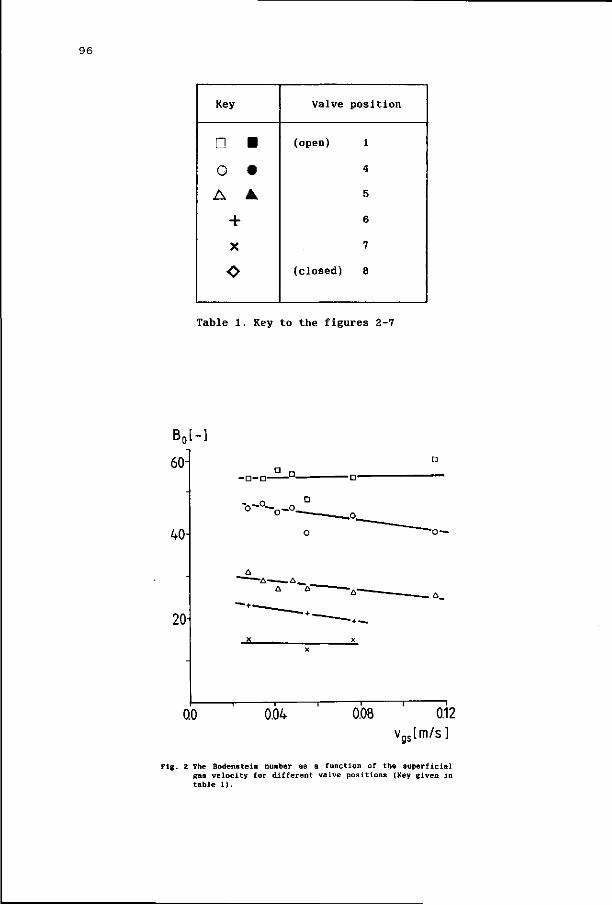
96
Key
• • o • A •
+ X
O
Valve position
(open) 1
4
5
6
7
(closed) 8
Table 1. Key to the figures 2-7
B 0 H
60-
40
20-
0.0 0.04 0.08 0.12
Vgslm/s]
Pig. 2 The Bodenstein number as a function of the superficial gas velocity for different valve positions (Key given in table 1).
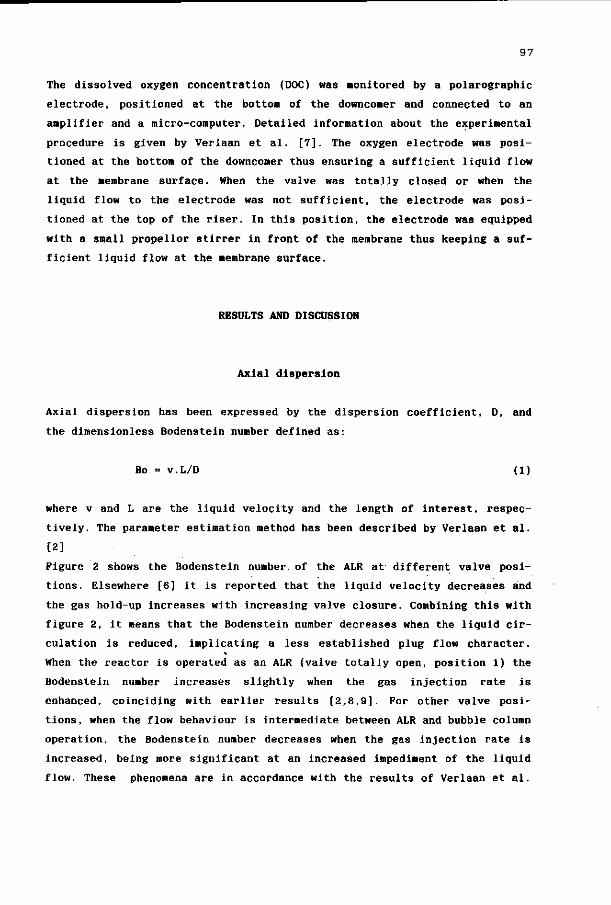
97
The dissolved oxygen concentration (DOC) was monitored by a polarographic
electrode, positioned at the bottom of the downcomer and connected to an
amplifier and a micro-computer. Detailed information about the experimental
procedure is given by Verlaan et al. [7]. The oxygen electrode was posi
tioned at the bottom of the downcomer thus ensuring a sufficient liquid flow
at the membrane surface. When the valve was totally closed or when the
liquid flow to the electrode was not sufficient, the electrode was posi
tioned at the top of the riser. In this position, the electrode was equipped
with a small propellor stirrer in front of the membrane thus keeping a suf
ficient liquid flow at the membrane surface.
RESULTS AND DISCUSSION
Axial dispersion
Axial dispersion has been expressed by the dispersion coefficient, D, and
the dimensionless Bodenstein number defined as:
Bo = v.L/D (1)
where v and L are the liquid velocity and the length of interest, respec
tively. The parameter estimation method has been described by Verlaan et al.
[2]
Figure 2 shows the Bodenstein number, of the ALR at different valve posi
tions. Elsewhere [6] it is reported that the liquid velocity decreases and
the gas hold-up increases with increasing valve closure. Combining this with
figure 2, it means that the Bodenstein number decreases when the liquid cir
culation is reduced, implicating a less established plug flow character.
When the reactor is operated as an ALR (valve totally open, position 1) the
Bodenstein number increases slightly when the gas injection rate is
enhanced, coinciding with earlier results [2,8,9]. For other valve posi
tions, when the flow behaviour is intermediate between ALR and bubble column
operation, the Bodenstein number decreases when the gas injection rate is
increased, being more significant at an increased impediment of the liquid
flow. These phenomena are in accordance with the results of Verlaan et al.
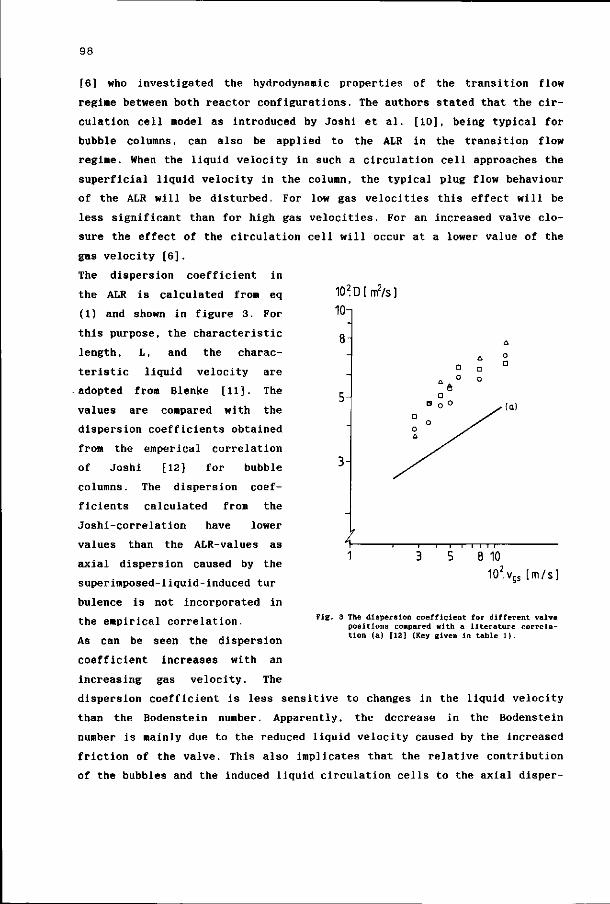
98
102D[m2/s]
10-
8H
[6] who investigated the hydrodynamic properties of the transition flow
regime between both reactor configurations. The authors stated that the cir
culation cell model as introduced by Joshi et al. [10], being typical for
bubble columns, can also be applied to the ALR in the transition flow
regime. When the liquid velocity in such a circulation cell approaches the
superficial liquid velocity in the column, the typical plug flow behaviour
of the ALR will be disturbed. For low gas velocities this effect will be
less significant than for high gas velocities. For an increased valve clo
sure the effect of the circulation cell will occur at a lower value of the
gas velocity [6].
The dispersion coefficient in
the ALR is calculated from eq
(1) and shown in figure 3. For
this purpose, the characteristic
length, L, and the charac
teristic liquid velocity are
adopted from Blenke [11]. The
values are compared with the
dispersion coefficients obtained
from the emperical correlation
of Joshi [12] for bubble
columns. The dispersion coef
ficients calculated from the
Joshi-correlation have lower
values than the ALR-values as
axial dispersion caused by the
superimposed-liquid-induced tur
bulence is not incorporated in
the empirical correlation.
As can be seen the dispersion
coefficient increases with an
increasing gas velocity. The
dispersion coefficient is less sensitive to changes in the liquid velocity
than the Bodenstein number. Apparently, the decrease in the Bodenstein
number is mainly due to the reduced liquid velocity caused by the increased
friction of the valve. This also implicates that the relative contribution
of the bubbles and the induced liquid circulation cells to the axial disper-
3-
I — i — i — i i i i —
5 8 10
102v( gs [m/s]
PiB- 3 The dispersion coefficient for different valve positions compared with a literature correlation (a) [12] (Key given in table 1).
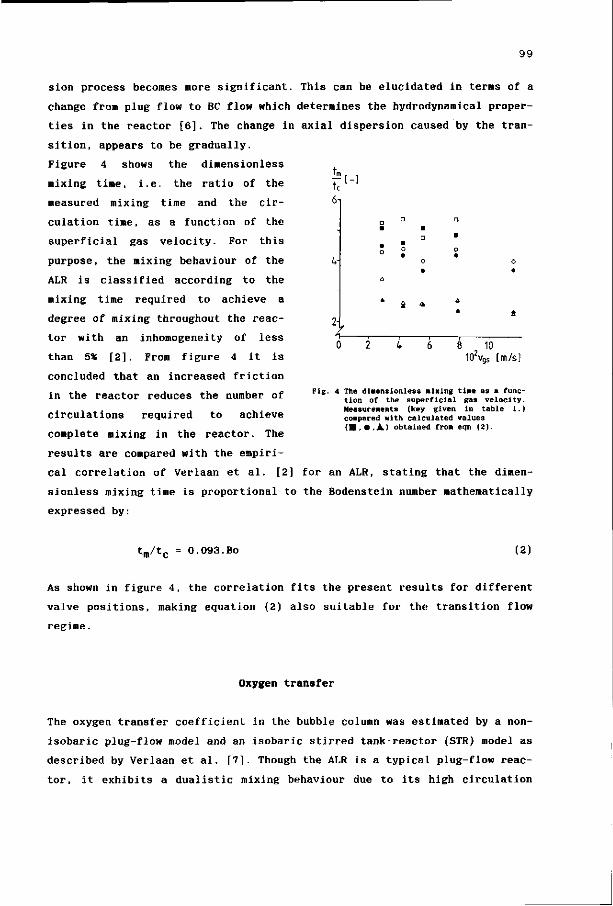
99
sion process becomes more significant. This can be elucidated in terms of a
change from plug flow to BC flow which determines the hydrodynamical proper
ties in the reactor [6]. The change in axial dispersion caused by the tran
sition, appears to be gradually.
4-
Figure 4 shows the dimensionless
mixing time, i.e. the ratio of the
measured mixing time and the cir
culation time, as a function of the
superficial gas velocity. For this
purpose, the mixing behaviour of the
ALR is classified according to the
mixing time required to achieve a
degree of mixing throughout the reac
tor with an inhomogeneity of less
than 5% [2]. From figure 4 it is
concluded that an increased friction
in the reactor reduces the number of
circulations required to achieve
complete mixing in the reactor. The
results are compared with the empiri
cal correlation of Verlaan et al. [2] for an ALR, stating that the dimen
sionless mixing time is proportional to the Bodenstein number mathematically
expressed by:
t-i 10 102v9s [m/s]
Fig. 4 The dimensionless nixing tiae as a function of the superficial gas velocity. MeasureRents (key given in table 1.) compared with calculated values (•,«,A) obtained from eqn (2).
tm/tc = 0.093.Bo (2)
As shown in figure 4, the correlation fits the present results for different
valve positions, making equation (2) also suitable for the transition flow
regime.
Oxygen transfer
The oxygen transfer coefficient in the bubble column was estimated by a non-
isobaric plug-flow model and an isobaric stirred-tank-reactor (STR) model as
described by Verlaan et al. [7]. Though the ALR is a typical plug-flow reac
tor, it exhibits a dualistic mixing behaviour due to its high circulation
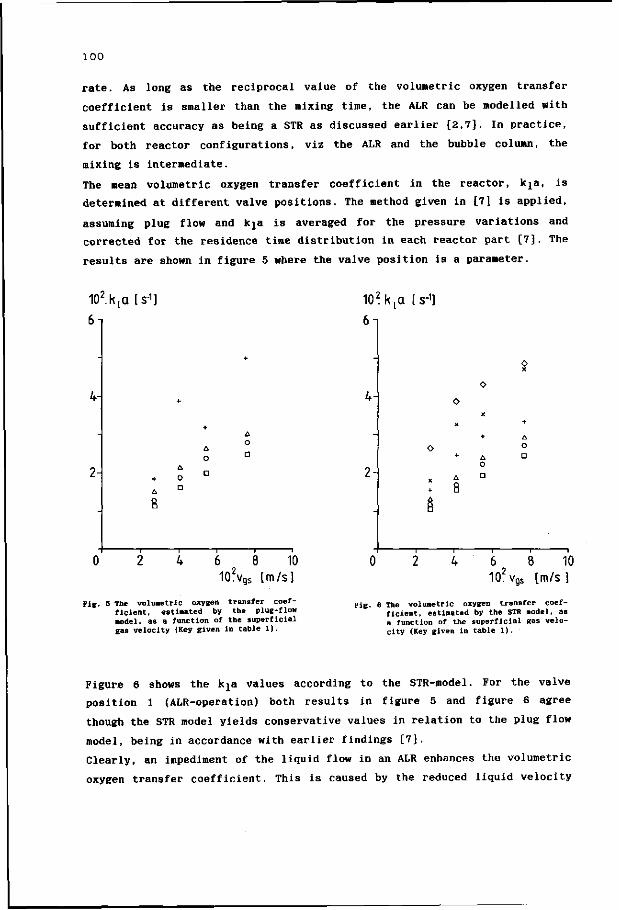
100
rate. As long as the reciprocal value of the volumetric oxygen transfer
coefficient is smaller than the mixing time, the ALR can be modelled with
sufficient accuracy as being a STR as discussed earlier [2,7]. In practice,
for both reactor configurations, viz the ALR and the bubble column, the
mixing is intermediate.
The mean volumetric oxygen transfer coefficient in the reactor, kja, is
determined at different valve positions. The method given in [7] is applied,
assuming plug flow and kja is averaged for the pressure variations and
corrected for the residence time distribution in each reactor part [7]. The
results are shown in figure 5 where the valve position is a parameter.
102.k,a [s-1] 102k,a [s-1]
2-
102v, 10
gs [m/s]
Fig. 5 The volumetric oxygen transfer coefficient, estimated by the plug-flow •odel. as a function of the superficial gas velocity (Key given In table 1).
4-
102v, gs
J 10 [m/s ]
Fig. 6 The volumetric oxygen transfer coefficient, estimated by the STR model, as a function of the superficial gas velocity (Key given in table 1).
Figure 6 shows the k1a values according to the STR-model. For the valve
position 1 (ALR-operation) both results in figure 5 and figure 6 agree
though the STR model yields conservative values in relation to the plug flow
model, being in accordance with earlier findings [7].
Clearly, an impediment of the liquid flow in an ALR enhances the volumetric
oxygen transfer coefficient. This is caused by the reduced liquid velocity
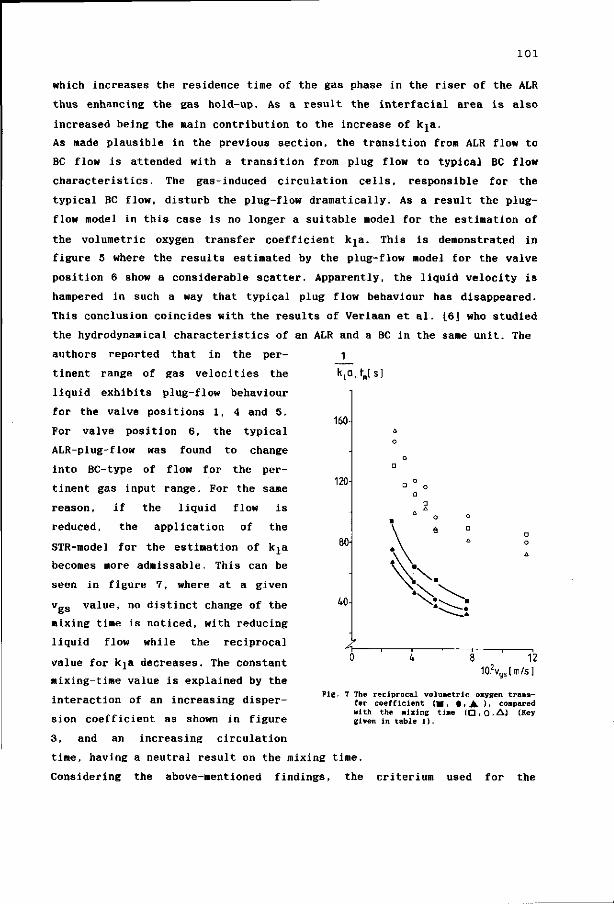
101
which increases the residence time of the gas phase in the riser of the ALR
thus enhancing the gas hold-up. As a result the interfacial area is also
increased being the main contribution to the increase of kja.
As made plausible in the previous section, the transition from ALR flow to
BC flow is attended with a transition from plug flow to typical BC flow
characteristics. The gas-induced circulation cells, responsible for the
typical BC flow, disturb the plug-flow dramatically. As a result the plug-
flow model in this case is no longer a suitable model for the estimation of
the volumetric oxygen transfer coefficient kja. This is demonstrated in
figure 5 where the results estimated by the plug-flow model for the valve
position 6 show a considerable scatter. Apparently, the liquid velocity is
hampered in such a way that typical plug flow behaviour has disappeared.
This conclusion coincides with the results of Verlaan et al. [6] who studied
the hydrodynamical characteristics of an ALR and a BC in the same unit. The
1
160
authors reported that in the per
tinent range of gas velocities the
liquid exhibits plug-flow behaviour
for the valve positions 1, 4 and 5.
For valve position 6, the typical
ALR-plug-flow was found to change
into BC-type of flow for the per
tinent gas input range. For the same
reason, if the liquid flow is
reduced, the application of the
STR-model for the estimation of kja
becomes more admissable. This can be
seen in figure 7, where at a given
v_s value, no distinct change of the
mixing time is noticed, with reducing
liquid flow while the reciprocal
value for kja decreases. The constant
mixing-time value is explained by the
interaction of an increasing disper
sion coefficient as shown in figure
3, and an increasing circulation
time, having a neutral result on the mixing time.
Considering the above-mentioned findings, the criterium used for the
120
80
40
4-12
10Xs[m/s] >gs
Fie. 7 The reciprocal volumetric oxygen transfer coefficient (M , •, A )• compared with the nixing ti»e ( D . O . A J (Key given in table 1).
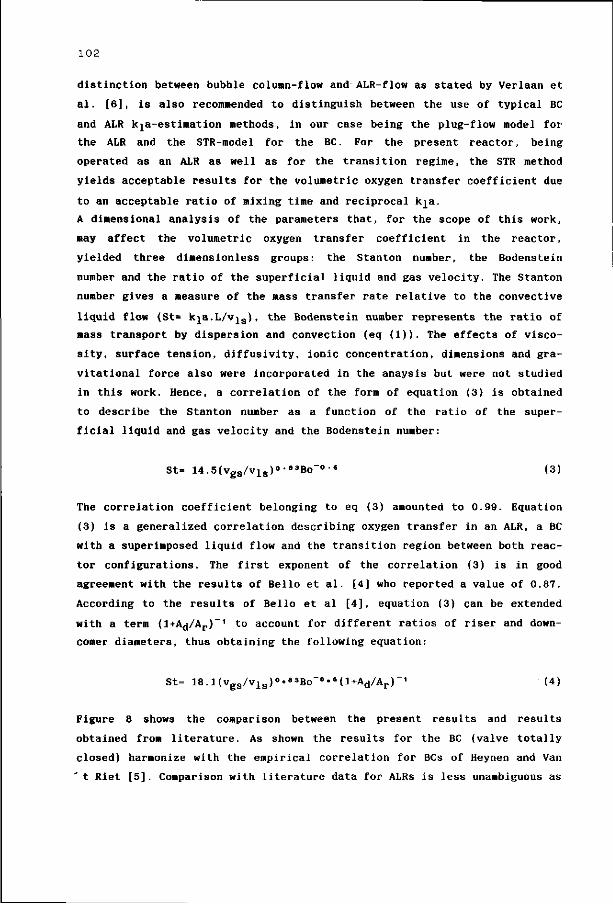
102
distinction between bubble column-flow and ALR-flow as stated by Verlaan et
al. [6], is also recommended to distinguish between the use of typical BC
and ALR kja-estimation methods, in our case being the plug-flow model for
the ALR and the STR-model for the BC. For the present reactor, being
operated as an ALR as well as for the transition regime, the STR method
yields acceptable results for the volumetric oxygen transfer coefficient due
to an acceptable ratio of mixing time and reciprocal k^a.
A dimensional analysis of the parameters that, for the scope of this work,
•ay affect the volumetric oxygen transfer coefficient in the reactor,
yielded three dimensionless groups: the Stanton number, the Bodenstein
number and the ratio of the superficial liquid and gas velocity. The Stanton
number gives a measure of the mass transfer rate relative to the convective
liquid flow (St= kja.L/vjs), the Bodenstein number represents the ratio of
mass transport by dispersion and convection (eq (1)). The effects of visco
sity, surface tension, diffusivity, ionic concentration, dimensions and gra
vitational force also were incorporated in the anaysis but were not studied
in this work. Hence, a correlation of the form of equation (3) is obtained
to describe the Stanton number as a function of the ratio of the super
ficial liquid and gas velocity and the Bodenstein number:
St= 14.5(VgS/vls)°-83Bo"0-« (3)
The correlation coefficient belonging to eq (3) amounted to 0.99. Equation
(3) is a generalized correlation describing oxygen transfer in an ALR, a BC
with a superimposed liquid flow and the transition region between both reac
tor configurations. The first exponent of the correlation (3) is in good
agreement with the results of Bello et al. [4] who reported a value of 0.87.
According to the results of Bello et al [4], equation (3) can be extended
with a term (1+A^/Ar)_1 to account for different ratios of riser and down-
comer diameters, thus obtaining the following equation:
St= 18.1(vg s/vl s)0•e 3Bo"0•6(l+Ad/A^)", (4)
Figure 8 shows the comparison between the present results and results
obtained from literature. As shown the results for the BC (valve totally
closed) harmonize with the empirical correlation for BCs of Heynen and Van
t Riet [5]. Comparison with literature data for ALRs is less unambiguous as
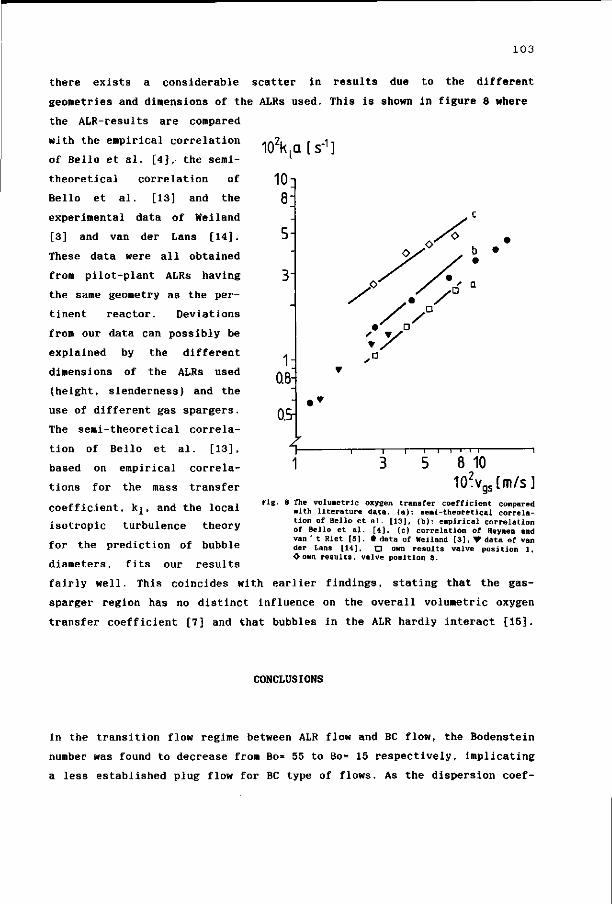
103
there exists a considerable scatter in results due to the different
geometries and dimensions of the ALRs used. This is shown in figure 8 where
the ALR-results are compared
>2, 10zktQ [s-1]
10i 8
/ / L
1-0.8:
OS
/
with the empirical correlation
of Bello et al. [4], the semi-
theoretical correlation of
Bello et al. [13] and the
experimental data of Weiland
[3] and van der Lans [14].
These data were all obtained
from pilot-plant ALRs having
the same geometry as the per
tinent reactor. Deviations
from our data can possibly be
explained by the different
dimensions of the ALRs used
(height, slenderness) and the
use of different gas spargers.
The semi-theoretical correla
tion of Bello et al. [13],
based on empirical correla
tions for the mass transfer
coefficient, kj, and the local
isotropic turbulence theory
for the prediction of bubble
diameters, fits our results
fairly well. This coincides with earlier findings, stating that the gas-
sparger region has no distinct influence on the overall volumetric oxygen
transfer coefficient [7] and that bubbles in the ALR hardly interact [15].
1 3 — i — i — i i i i 1
5 8 10 102vgs[m/s]
Fig. 8 The volumetric oxygen transfer coefficient compared with literature data, (a): seai-theoretical correlation of Bello et al. [13], (b): eapirical correlation of Bello et al. [4], (c) correlation of Heynen and van ' t Met [5]. • data of Weiland [ 3 ] , • data of van der Lans [14], o own results valve position 1, ^ own results, valve position 8.
CONCLUSIONS
In the transition flow regime between ALR flow and BC flow, the Bodenstein
number was found to decrease from Bo= 55 to Bo= 15 respectively, implicating
a less established plug flow for BC type of flows. As the dispersion coef-
104
ficient remained constant for the entire range of operation, the decrease of
the Bodenstein number is mainly attributed to the decreased convective
transport as a result of the reduced liquid velocity. The number of cir
culations required to achieve complete mixing was diminished if the liquid
circulation was hampered and appeared to be proportional to the Bodenstein
number.
The volumetric oxygen transfer coefficient was estimated by an STR-model and
a plug-flow model. The STR model yielded reliable results for the entire
range of operation while the plug-flow model only appeared to be appropiate
for the ALR operation mode. The kja-values obtained, were found to increase
from 0.01-0.025 s"1 for ALR operation to 0.026-0.05 s"1 for BC operation,
the actual value depending on the gas injection rate. A generalized correla
tion is given for kja. In this correlation k^a is proportional to the 0.83
power of the ratio of the superficial liquid and gas velocity and propor
tional to the -0.6 power of the Bodenstein number.
REFERENCES
[I] M.L. Lefrangois, C.G. Mariller and J.V. Mejane. Effectionnements aux procedes de cultures forgiques et de fermentations industrielles. Brevet d'Invention, France, no. 1 102 200 (1955).
[2] P. Verlaan, J. Tramper, K. van ' t Riet and K.Ch.A.M. Luyben. Estimation of axial dispersion in individual sections of an airlift-loop reactor. Submitted (Chapter three of this thesis).
[3] P. Weiland, 1978, Untersuchung eines Airliftreaktors mit Au|3erem Umlauf im Hinblick auf seine Anwendung als Bioreaktor, Thesis, University of Dortmund, Dortmund GDR.
[4] R.A. Bello, C.W. Robinson and M. Moo-Young. Gas Holdup and Overall Volumetric Oxygen Transfer Coefficient in Airlift Contactors. Biotechnol. Bioeng., 27, (1985) pp 369-381.
[5] J.J. Heijnen, and K. van' t Riet, 1982, Mass transfer, mixing and heat transfer phenomena in low viscous bubble column reactors. Proc. 4 t n
Europ. Conf. on Mixing, Noordwijkerhout, The Netherlands. [6] P. Verlaan, J.-C. Vos and K. van ' t Riet. From bubble column to
airlift-loop reactor. Hydrodynamics of the transition-flow regime. Submitted (Chapter five of this thesis).
[7] P. Verlaan, M.A.F. Hermans, J. Tramper, K. van ' t Riet and K.Ch.A.M. Luyben. Isobaric and non-isobaric modelling of dynamic gas-liquid oxygen transfer in an airlift-loop bioreactor. Submitted (Chapter four of this thesis).
[8] P. Verlaan, J. Tramper, K. van ' t Riet and K.Ch.A.M. Luyben. Hydrodynamics and axial dispersion in an airlift-loop bioreactor with two and three phase flow. Proc. Int. Conf. on Bioreactor Fluid Dynamics (BHRA) Cambridge, England, 15-17 april, 1986.
[9] P. Verlaan and J. Tramper. Influence of nearly floating particles xjn the behaviour of a pilot plant airlift-loop bioreactor. Proc. 4 t n
Europ. Congress on Biotechnology, 1987, vol. 1, pp 101-104 (O.N. Neijssel, R.R. van der Meer, K.Ch.A.M. Luyben eds.) Elsevier Science Publishers B.V., Amsterdam.
[10] J.B. Joshi and M.M. Sharma. A circulation cell model for bubble columns. Trans. Inst. Chem. Engrs, 57, 1979, pp 244-251.
[II] H. Blenke, 1979, Loop reactors, Adv. Biochem. Eng. 13, 121-214. [12] J.B. Joshi. Axial mixing in multiphase contactors - a unified correla
tion. Trans. I. Chem. Eng. 58 (1983) 155-165. [13] R.A. Bello, C.W. Robinson and M. Moo-Young. Prediction of the volu
metric mass transfer coefficient in pneumatic contactors. Chem. Eng.
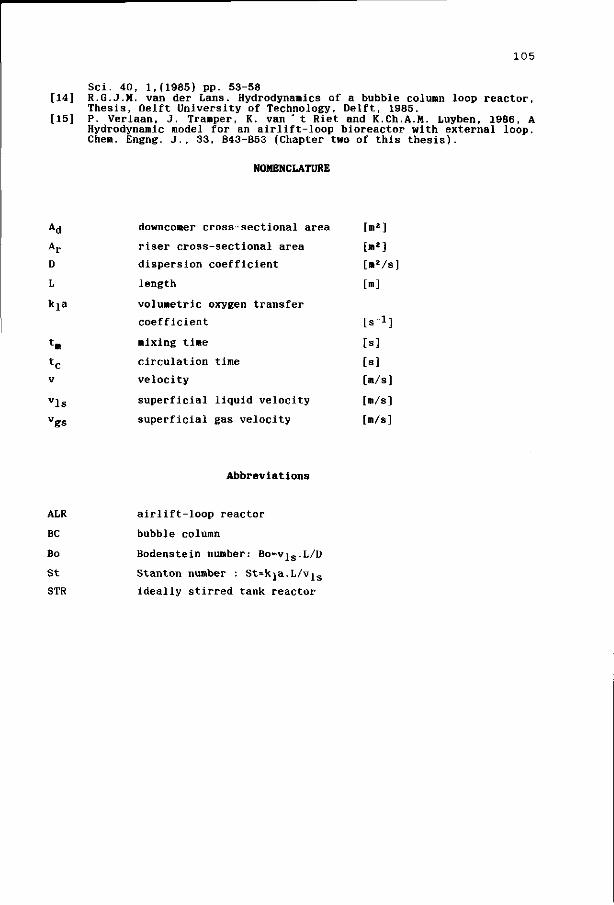
105
Sci. 40, 1,(1985) pp. 53-58 [14] R.G.J.M. van der Lans. Hydrodynamics of a bubble column loop reactor,
Thesis, Delft University of Technology, Delft, 1985. [15] P. Verlaan, J. Tramper, K. van ' t Riet and K.Ch.A.M. Luyben, 1986, A
Hydrodynamic model for an airlift-loop bioreactor with external loop. Chem. Engng. J., 33, B43-B53 (Chapter two of this thesis).
NOMENCLATURE
A,j downcomer cross-sectional area [m2]
Ar riser cross-sectional area [m2]
D dispersion coefficient [ma/s]
L length [m]
kja volumetric oxygen transfer
coefficient [s_1]
tm mixing time [s]
tc circulation time [s]
v velocity [m/s]
v j s superficial liquid velocity [m/s]
v g s superficial gas velocity [m/s]
Abbreviations
ALR airlift-loop reactor
BC bubble column
Bo Bodenstein number: Bo^vjg.L/D
St Stanton number : St=kja.L/v^s
STR ideally stirred tank reactor
107
CHAPTER SEVEN
HYDRODYNAMICS, AXIAL DISPERSION AND GAS-LIQUID OXYGEN TRANSFER
IN AN AIRLIFT-LOOP BIOREACTOR WITH THREE-PHASE FLOW
P. Verlaan and J. Tramper,
Department of Food Science, Food and Bioengineering Group,
Agricultural University,
De Dreijen 12, 6703 BC Wageningen, the Netherlands.
ABSTRACT
Hydrodynamics, axial dispersion and oxygen transfer in a pilot plant
airlift-loop bioreactor (0.165 m3) with a three-phase flow have been studied
in order to investigate the influence on the physical properties of an
airlift-loop reactor (ALR). The third phase consisted of polystyrene or
calcium alginate beads both with a density of p= 1050 kg/m3 and diameters
ranging from 2.4 to 2.7 mm, being good representatives for immobilized
biocatalysts. It was found that the overall reactor performance is strongly
influenced by the presence of the solid phase. The maximum bead loading at
which the ALR could be operated was 40 volume-procent. At this loading the
liquid velocity declined to 60* of the initial two-phase value independent
of the gas injection rate while the gas hold-up decreased from 80% to 20% of
the two-phase value depending on the gas injection rate. The essential
mixing parameter, the Bodenstein number, tended to a 40% higher value at
this loading indicating a better established plug flow. The influence of the
solid phase on the volumetric oxygen transfer coefficient kja was investi
gated to a maximum bead loading of 20 volume procent. In this case, the kja-
value decreased with 40% compared to the two-phase value.
Published in: Proc. Int. Conf. on Bioreactors and Biotransformations, 9-12
november 1987, Auchterarder, U.K. Elseviers Science Publishers B.V.,
Amsterdam.
108
INTRODUCTION
An airlift-loop reactor is a so called second generation type of bioreactor
in which efficient oxygen transfer and mixing is combined with a controlled
liquid flow while the shear rate can be very low. These properties make the
ALR a suitable reactor for shear sensitive organisms requiring a controlled
dissolved oxygen concentration. An example of such an application is the
production of secondary metabolites by plant cells [1]. In many cases immo
bilized biocatalysts or micro-organisms growing in aggregates are used in
biotechnological production processes. This means that the biophase in the
reactor is concentrated in or on beads with diameters up to several millime
ters. Also in this case an ALR seems a suitable reactor having excellent
suspension characteristics due to the high liquid velocity.
Little research has been reported yet on the influence of relatively large
(2-3 mm) particles with a neutral buoyancy, like gel-entrapped biocatalysts,
on bioreactor performance. Recently, Frijlink [2] published results on the
influence of calcium alginate beads (p= 1050 kg/m3, d= 2.2 mm) on oxygen
transfer in a stirred-tank reactor. The author found that the volumetric
oxygen transfer coefficient decreased proportional with the bead loading.
For a bead loading of 37 vol-procent the decrease amounted to 553.-59%,
depending on the gas-flow rate. Metz [3] reported results on the influence
of yeast pellets on oxygen transfer in a bubble column. A pellet loading of
20% diminished the kja-value with 20-30 a;.
For ALRs no such data is available. Therefore the aim of this article is to
give a concise overview of the physical ALR properties and the interaction
with relative large solid particles in order to provide essential infor
mation for three phase ALR design. Results are reported on the physical
influence of neutral buoyant polystyrene or calcium alginate beads with
diameters ranging from 2.4 to 2.7 mm, on ALR performance at pilot plant
scale.

MATERIALS AND METHODS
1 0 9
stainless steel topsection viewwindow
The experiments have been carried out in
a pilot plant ALR with external loop as
shown in figure 1. The ALR has a reactor
volume of 0.165 m3 and an aerated height
of 3.23 m. The upflow and downflow sec
tions, also called riser and downcomer,
were constructed of borosilicate glass
pipe sections with diameters of 0.2 m
and 0.1 m, respectively. The gas
sparger, situated at the bottom of the
riser, produces bubbles with the same
diameter as the equilibrium diameter of
air bubbles in tap water. The topsection
of the ALR was designed such that
complete deaeration occurs during opera
tion and no gas entrains into the down-
comer. The ALR was filled with
Wageningen tap water and its temperature
was maintained on a constant value of
30° C. More details about the ALR and
measuring methods of the hydrodynamic
parameters are given elsewhere [4].
The mixing performance of the ALR was
characterized by estimating the axial
dispersion number on the basis of pulse
respons measurements using acid and base
as tracers. Detection of these tracers by pH-electrodes was not disturbed by
the presence of air bubbles or solid beads. A mathematical description and
detailed information about the experimental method have been published
earlier [5,6].
The typical ALR mixing characteristics allowed us to treat the modelling of
oxygen transfer in two different ways. On the one hand the ALR behaves like
a loop reactor with relative high circulation rates and a short mixing time.
From this point of view the reactor can be modelled as an ideally stirred
drain I tap water air
Fig. 1 The a i r l i f t - loop reactor
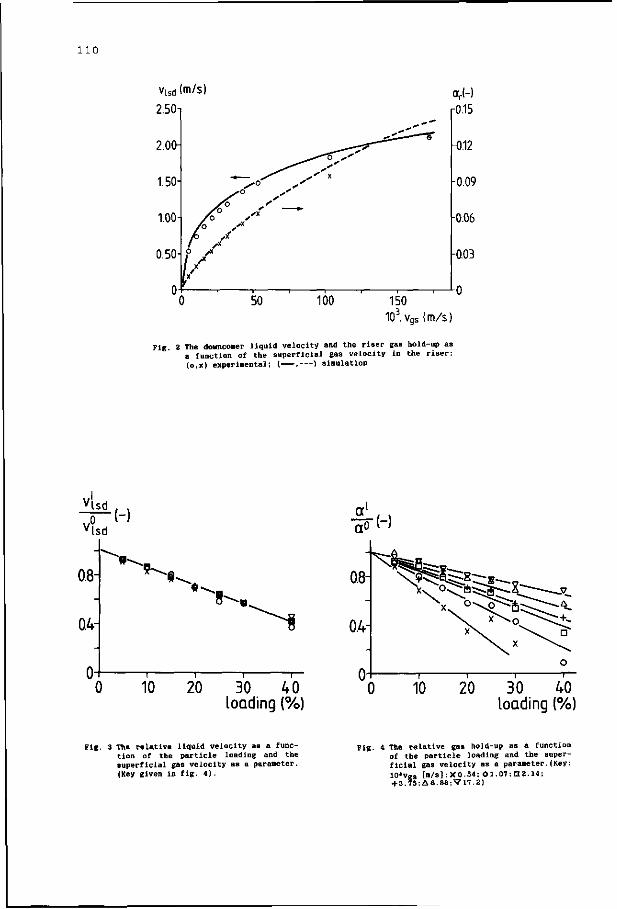
1 1 0
vlsd (m/s)
2.50T
10Jvqs(m/s)
Fig. 2 The donnco»er liquid velocity and the riser gas hold-up as a function of the superficial gas velocity in the riser: (o,x) experi»ental; ( , ) sinulation
v L d ( ]
0.8-
0.4-
* ^ .
10 20 30 40 loading (%)
30 40 loading (%)
Fig. 3 The relative liquid velocity as a function of the particle loading and the superficial gas velocity as a parameter. (Key given in fig. 4).
4 The relative gas hold-up as a function of the particle loading and the superficial gas velocity as a parameter.(Key: 10*vgs [m/s]:X0.54; O 1.07; 112.14; + 3.75;A6.88;V17.2)
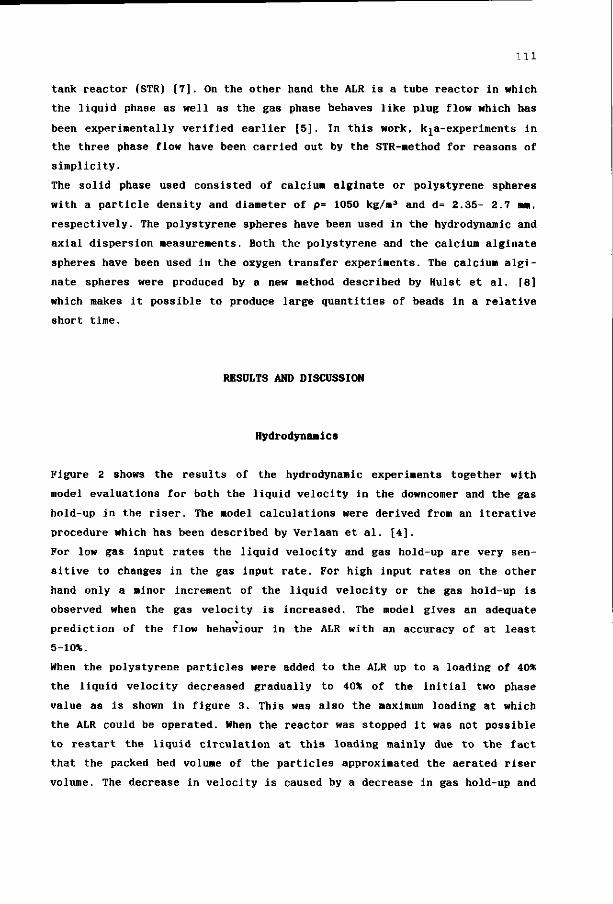
Ill
tank reactor (STR) [7]. On the other hand the ALR is a tube reactor in which
the liquid phase as well as the gas phase behaves like plug flow which has
been experimentally verified earlier [5]. In this work, kja-experiments in
the three phase flow have been carried out by the STR-method for reasons of
simplicity.
The solid phase used consisted of calcium alginate or polystyrene spheres
with a particle density and diameter of p= 1050 kg/m3 and d= 2.35- 2.7 mm,
respectively. The polystyrene spheres have been used in the hydrodynamic and
axial dispersion measurements. Both the polystyrene and the calcium alginate
spheres have been used in the oxygen transfer experiments. The calcium algi
nate spheres were produced by a new method described by Hulst et al. [8]
which makes it possible to produce large quantities of beads in a relative
short time.
RESULTS AND DISCUSSION
Hydrodynamics
Figure 2 shows the results of the hydrodynamic experiments together with
model evaluations for both the liquid velocity in the downcomer and the gas
hold-up in the riser. The model calculations were derived from an iterative
procedure which has been described by Verlaan et al. [4].
For low gas input rates the liquid velocity and gas hold-up are very sen
sitive to changes in the gas input rate. For high input rates on the other
hand only a minor increment of the liquid velocity or the gas hold-up is
observed when the gas velocity is increased. The model gives an adequate
prediction of the flow behaviour in the ALR with an accuracy of at least
5-10%.
When the polystyrene particles were added to the ALR up to a loading of 40*
the liquid velocity decreased gradually to 40* of the initial two phase
value as is shown in figure 3. This was also the maximum loading at which
the ALR could be operated. When the reactor was stopped it was not possible
to restart the liquid circulation at this loading mainly due to the fact
that the packed bed volume of the particles approximated the aerated riser
volume. The decrease in velocity is caused by a decrease in gas hold-up and
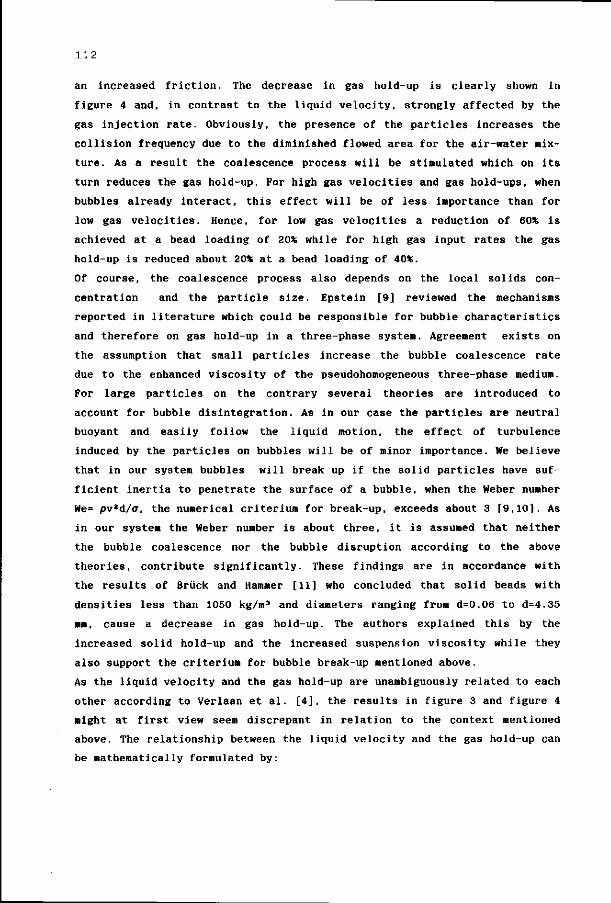
112
an increased friction. The decrease in gas hold-up is clearly shown in
figure 4 and, in contrast to the liquid velocity, strongly affected by the
gas injection rate. Obviously, the presence of the particles increases the
collision frequency due to the diminished flowed area for the air-water mix
ture. As a result the coalescence process will be stimulated which on its
turn reduces the gas hold-up. For high gas velocities and gas hold-ups, when
bubbles already interact, this effect will be of less importance than for
low gas velocities. Hence, for low gas velocities a reduction of 60* is
achieved at a bead loading of 20% while for high gas input rates the gas
hold-up is reduced about 20% at a bead loading of 40%.
Of course, the coalescence process also depends on the local solids con
centration and the particle size. Epstein [9] reviewed the mechanisms
reported in literature which could be responsible for bubble characteristics
and therefore on gas hold-up in a three-phase system. Agreement exists on
the assumption that small particles increase the bubble coalescence rate
due to the enhanced viscosity of the pseudohomogeneous three-phase medium.
For large particles on the contrary several theories are introduced to
account for bubble disintegration. As in our case the particles are neutral
buoyant and easily follow the liquid motion, the effect of turbulence
induced by the particles on bubbles will be of minor importance. We believe
that in our system bubbles will break up if the solid particles have suf
ficient inertia to penetrate the surface of a bubble, when the Weber number
We= pv2d/a, the numerical criterium for break-up, exceeds about 3 [9,10]. As
in our system the Weber number is about three, it is assumed that neither
the bubble coalescence nor the bubble disruption according to the above
theories, contribute significantly. These findings are in accordance with
the results of Briick and Hammer [11] who concluded that solid beads with
densities less than 1050 kg/m3 and diameters ranging from d=0.06 to d=4.35
mm, cause a decrease in gas hold-up. The authors explained this by the
increased solid hold-up and the increased suspension viscosity while they
also support the criterium for bubble break-up mentioned above.
As the liquid velocity and the gas hold-up are unambiguously related to each
other according to Verlaan et al. [4], the results in figure 3 and figure 4
might at first view seem discrepant in relation to the context mentioned
above. The relationship between the liquid velocity and the gas hold-up can
be mathematically formulated by:
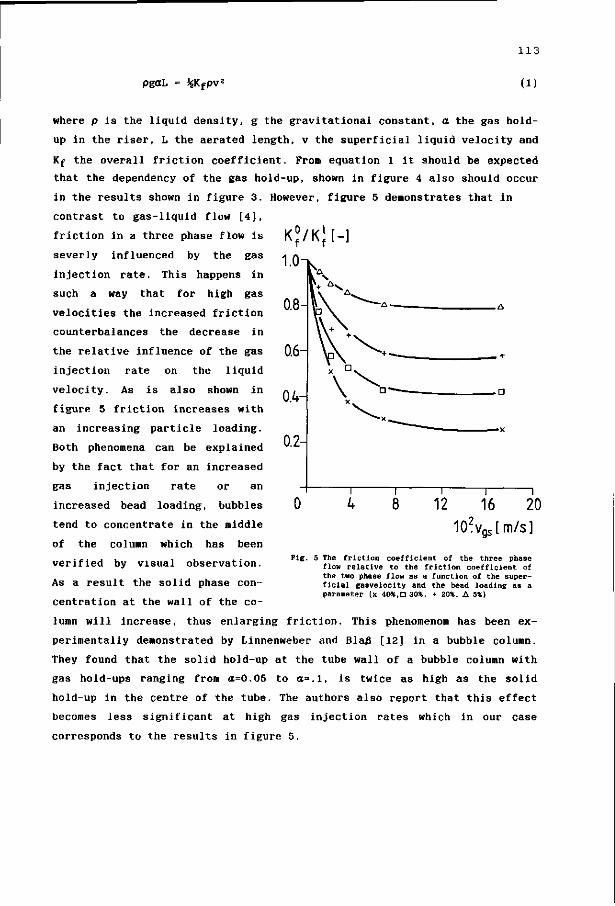
pgaL = %Kfpv2
113
(1)
where p is the liquid density, g the gravitational constant, o the gas hold
up in the riser, L the aerated length, v the superficial liquid velocity and
Kf the overall friction coefficient. From equation 1 it should be expected
that the dependency of the gas hold-up, shown in figure 4 also should occur
in the results shown in figure 3. However, figure 5 demonstrates that in
contrast to gas-liquid flow [4],
friction in a three phase flow is K f / K * [-]
severly influenced by the gas * A
injection rate. This happens in
such a way that for high gas
velocities the increased friction
counterbalances the decrease in
the relative influence of the gas
injection rate on the liquid
velocity. As is also shown in
figure 5 friction increases with
an increasing particle loading.
Both phenomena can be explained
by the fact that for an increased
gas injection rate or an
increased bead loading, bubbles
tend to concentrate in the middle
of the column which has been
verified by visual observation.
As a result the solid phase con
centration at the wall of the co-
102vas[m/s] »gs
Fig. 5 The friction coefficient of the three phase flow relative to the friction coefficient of the two phase flow as a function of the superficial gasvelocity and the bead loading as a parameter (x 40*.• 30X, + 20*. A 5X)
lumn will increase, thus enlarging friction. This phenomenon has been ex
perimentally demonstrated by Linnenweber and Bla/3 [12] in a bubble column.
They found that the solid hold-up at the tube wall of a bubble column with
gas hold-ups ranging from <z=0.05 to a=.l, is twice as high as the solid
hold-up in the centre of the tube. The authors also report that this effect
becomes less significant at high gas injection rates which in our case
corresponds to the results in figure 5.
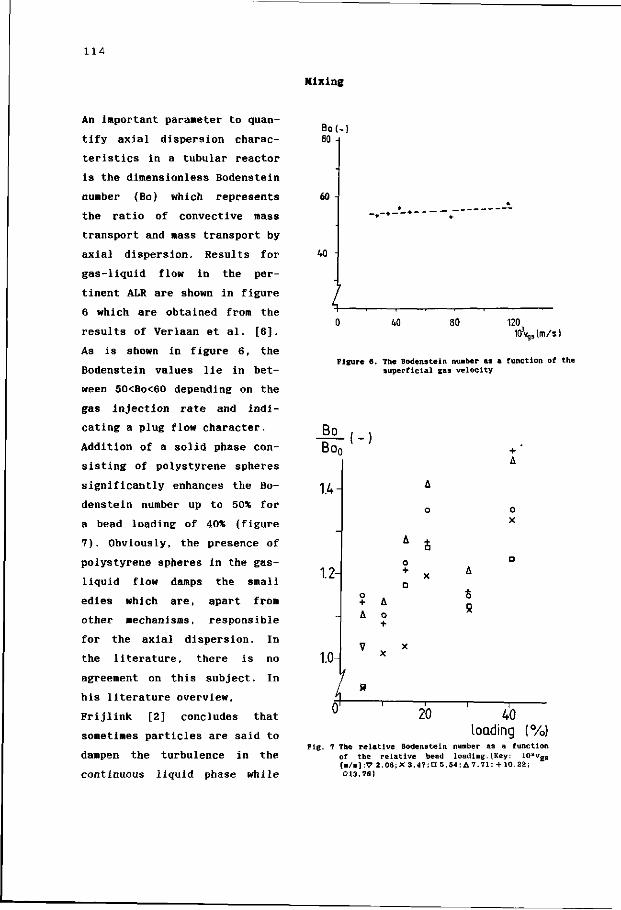
114
Mixing
An important parameter to quan
tify axial dispersion charac
teristics in a tubular reactor
is the dimensionless Bodenstein
number (Bo) which represents
the ratio of convective mass
transport and mass transport by
axial dispersion. Results for
gas-liquid flow in the per
tinent ALR are shown in figure
6 which are obtained from the
results of Verlaan et al. [6].
As is shown in figure 6, the
Bodenstein values lie in bet
ween 50<Bo<60 depending on the
gas injection rate and indi
cating a plug flow character.
Addition of a solid phase con
sisting of polystyrene spheres
significantly enhances the Bo
denstein number up to 50* for
a bead loading of 40* (figure
7). Obviously, the presence of
polystyrene spheres in the gas-
liquid flow damps the small
edies which are, apart from
other mechanisms, responsible
for the axial dispersion. In
the literature, there is no
agreement on this subject. In
his literature overview,
Frijlink [2] concludes that
sometimes particles are said to
dampen the turbulence in the
continuous liquid phase while
Bo( 80
60
40
( W 80 120
lO'vgslm/s)
Figure 6. The Bodenstein number as a function of the superficial gas velocity
Bo Bo0
1.4-
1.2-
1.0-
o
* 8
u 20 40 loading (%)
Fig. 7 The relative Bodenstein number as a function of the relative bead loading. (Key: 102vgs
[m/s]:V 2.06;X 3.47;n 5.54; A 7.71;+10.22; 013.76)
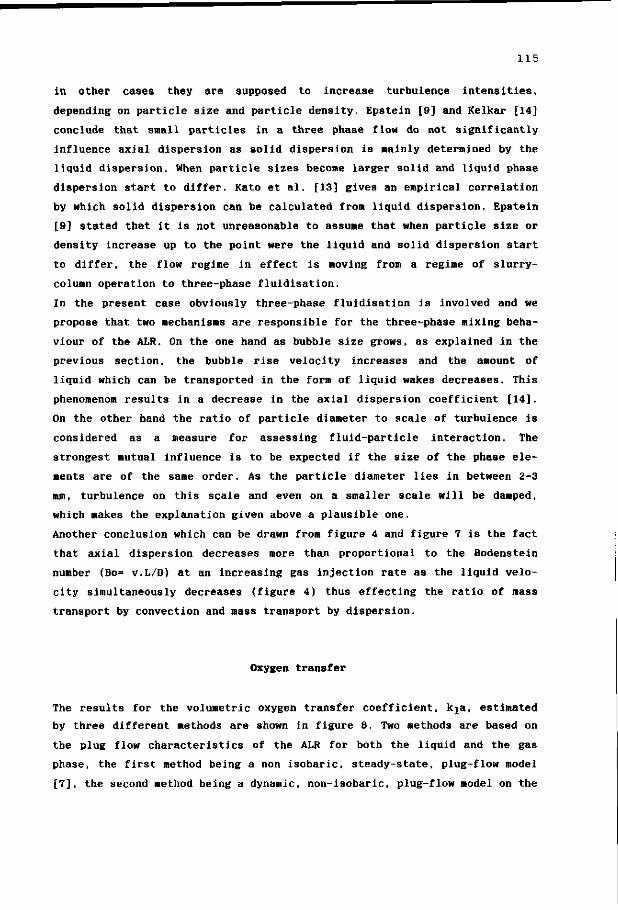
115
in other cases they are supposed to increase turbulence intensities,
depending on particle size and particle density. Epstein [9] and Kelkar [14]
conclude that small particles in a three phase flow do not significantly
influence axial dispersion as solid dispersion is mainly determined by the
liquid dispersion. When particle sizes become larger solid and liquid phase
dispersion start to differ. Kato et al. [13] gives an empirical correlation
by which solid dispersion can be calculated from liquid dispersion. Epstein
[9] stated that it is not unreasonable to assume that when particle size or
density increase up to the point were the liquid and solid dispersion start
to differ, the flow regime in effect is moving from a regime of slurry-
column operation to three-phase fluidisation.
In the present case obviously three-phase fluidisation is involved and we
propose that two mechanisms are responsible for the three-phase mixing beha
viour of the ALR. On the one hand as bubble size grows, as explained in the
previous section, the bubble rise velocity increases and the amount of
liquid which can be transported in the form of liquid wakes decreases. This
phenomenon) results in a decrease in the axial dispersion coefficient [14].
On the other hand the ratio of particle diameter to scale of turbulence is
considered as a measure for assessing fluid-particle interaction. The
strongest mutual influence is to be expected if the size of the phase ele
ments are of the same order. As the particle diameter lies in between 2-3
mm, turbulence on this scale and even on a smaller scale will be damped,
which makes the explanation given above a plausible one.
Another conclusion which can be drawn from figure 4 and figure 7 is the fact
that axial dispersion decreases more than proportional to the Bodenstein
number (Bo= v.L/D) at an increasing gas injection rate as the liquid velo
city simultaneously decreases (figure 4) thus effecting the ratio of mass
transport by convection and mass transport by dispersion.
Oxygen transfer
The results for the volumetric oxygen transfer coefficient, kja, estimated
by three different methods are shown in figure 8. Two methods are based on
the plug flow characteristics of the ALR for both the liquid and the gas
phase, the first method being a non isobaric, steady-state, plug-flow model
[7], the second method being a dynamic, non-isobaric, plug-flow model on the
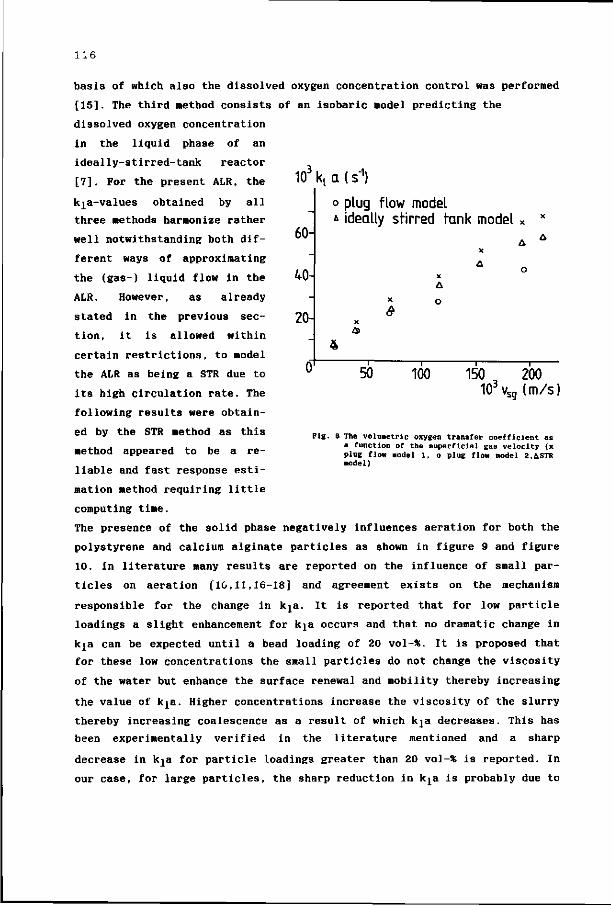
116
basis of which also the dissolved oxygen concentration control was performed
[15]. The third method consists of an isobaric model predicting the
dissolved oxygen concentration
103 kt a (s"1)
60H
40
2<H
o plug flow model * ideally stirred tank model
& o
4
50 100 150 200 103vSQ(m/s)
•sg
in the liquid phase of an
ideally-stirred-tank reactor
[7]. For the present ALR, the
kja-values obtained by all
three methods harmonize rather
well notwithstanding both dif
ferent ways of approximating
the (gas-) liquid flow in the
ALR. However, as already
stated in the previous sec
tion, it is allowed within
certain restrictions, to model
the ALR as being a STR due to
its high circulation rate. The
following results were obtain
ed by the STR method as this
method appeared to be a re
liable and fast response esti
mation method requiring little
computing time.
The presence of the solid phase negatively influences aeration for both the
polystyrene and calcium alginate particles as shown in figure 9 and figure
10. In literature many results are reported on the influence of small par
ticles on aeration [10,11,16-18] and agreement exists on the mechanism
responsible for the change in kja. It is reported that for low particle
loadings a slight enhancement for kja occurs and that no dramatic change in
kja can be expected until a bead loading of 20 vol-%. It is proposed that
for these low concentrations the small particles do not change the viscosity
of the water but enhance the surface renewal and mobility thereby increasing
the value of kja. Higher concentrations increase the viscosity of the slurry
thereby increasing coalescence as a result of which kja decreases. This has
been experimentally verified in the literature mentioned and a sharp
decrease in kja for particle loadings greater than 20 vol-* is reported. In
our case, for large particles, the sharp reduction in kja is probably due to
Fig. 8 The volunetrlc oxygen transfer coefficient as a function of the superficial gas veioclty (x plug flow model 1, o plug flow model 2.&STR model)
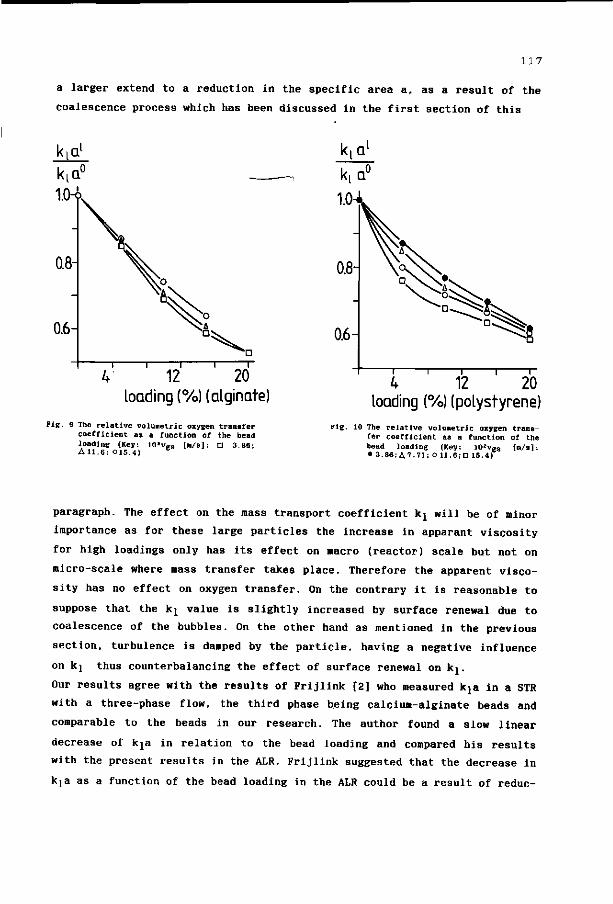
117
a larger extend to a reduction in the specific area a, as a result of the
coalescence process which has been discussed in the first section of this
4 12 20 loading (%) (alginate)
Fig. 9 The relative volumetric oxygen transfer coefficient as a function of the bead loading (Key: 10'vES [m/s]: n 3.86; All.6: 015.4)
loading (%) (polystyrene)
fig. 10 The relative volimetric oxygen transfer coefficient as a function of the bead loading (Key: 10*vgs [m/s]: •3.86;A7.71;OU.6;nl6.4)
paragraph. The effect on the mass transport coefficient lq will be of minor
importance as for these large particles the increase in apparant viscosity
for high loadings only has its effect on macro (reactor) scale but not on
micro-scale where mass transfer takes place. Therefore the apparent visco
sity has no effect on oxygen transfer. On the contrary it is reasonable to
suppose that the kj value is slightly increased by surface renewal due to
coalescence of the bubbles. On the other hand as mentioned in the previous
section, turbulence is damped by the particle, having a negative influence
on kj thus counterbalancing the effect of surface renewal on kj.
Our results agree with the results of Frijlink [2] who measured kja in a STR
with a three-phase flow, the third phase being calcium-alginate beads and
comparable to the beads in our research. The author found a slow linear
decrease of kja in relation to the bead loading and compared his results
with the present results in the ALR. Frijlink suggested that the decrease in
kja as a function of the bead loading in the ALR could be a result of reduc-
118
tion of turbulence intensity resulting in larger stable bubbles, the effect
being much stronger in a system with low energy input such as the ALR than
in a system with high energy input such as the STR. However this explanation
is in contrast to our discussion in the hydrodynamics and mixing section. In
the latter section it was suggested that small eddies were damped by the
particles while the larger eddies determine particle motion due to the
negligible difference in density with water, as suggested in the first sec
tion. As the bubbles are larger in diameter than the particles are, the
larger eddies which are not damped by the particles are responsible for
bubble break up. As these eddies are hardly influenced by the particles no
effect on bubble break up will occur. In fact the mechanism responsible for
the reduction in the interfacial area, a, in an ALR is, apart from the
mechanism in a STR as mentioned by Frijlink, also responsible for the
decrease in the interfacial area in a STR. As the slenderness of the ALR is
much larger than that of a STR the flowed area for the air-water mixture
will be less in a STR than in an ALR, resulting in less coalescence and
therefore less decrease of the interfacial area.
The reduction for alginate beads, shown in figure 9, being perfectly wetted
is slightly more significant than for polystyrene beads, being poorly
wetted. These findings are in accordance with the results of Kelkar and Shah
[14] who reported that solids wettability was found to enhance the
coalescence tendencies in the liquid phase thereby, in our case, reducing
oxygen transfer.
CONCLUSION
The liquid velocity and the gas hold-up of a gas-liquid flow in an ALR can
be easily modelled with a sufficient accuracy. Neutral buoyant particles
with a diameter of 2-3 mm reduce the liquid velocity and the gas hold-up in
an ALR significantly. The decrease in liquid velocity is caused by the
decrease in gas hold-up and an increased friction. The gas hold-up is
reduced mainly because the presence of the particles increases the collision
frequency thereby increasing coalescence due to the diminished flowed area
for the air-water mixture. In comparison to a gas-liquid flow axial disper
sion is reduced in the three phase flow as the presence of the particles
119
damps the small edles which are, apart from other mechanisms, responsible
for the axial dispersion. Moreover, the increased coalescence also contribu
tes to a decrease in axial dispersion. The presence of the particles negati
vely influences aeration due to a reduction in the gas-liquid interfacial
area as a result of the coalescence process. The effect of the increase in
apparent viscosity in the ALR was not supposed to contribute to the decrease
in the aeration process.
REFERENCES
[I] A.C. Hulst, P. Verlaan, H. Breteler and D.H. Ketel. Thiophene production by Tagetes patula in a pilot plant airlift-loop reactor. Proc. 4 t n Europ. Congress on Biotechnology, 1987, vol 2, pp 401-404, (O.M. Neijssel, R.R. van der Meer, K.Ch.A.M. Luyben eds.) Elsevier Science Publishers B.V., Amsterdam.
[2] J.J. Frijlink. Physical aspects of gassed suspension reactors. Thesis, University of Technology, Delft, 1987.
[3] B. Metz. From pulp to pellet, Thesis, University of Technology, Delft. 1976.
[4] P. Verlaan, J. Tramper, K. van ' t Riet and K.Ch.A.M. Luyben. A hydro-dynamic model for an airlift-loop bioreactor with external loop. Chem. Eng. J. 33 (1986) B43-B53 (Chapter two of this thesis).
[5] P. Verlaan, J. Tramper, K. van ' t Riet and K.Ch.A.M. Luyben. Estimation of axial dispersion in individual sections of an airlift-loop reactor. Submitted (Chapter three of this thesis).
[6] P. Verlaan, J. Tramper, K. van ' t Riet and K.Ch.A.M. Luyben. Hydrodynamics and axial dispersion in an airlift-loop bioreactor with two and three phase flow. Proc. Int. Conf. on Bioreactor Fluid Dynamics (BHRA) Cambridge, England, 15-17 april, 1986.
[7] P. Verlaan and J. Tramper. Influence of nearly floating particles x>n the behaviour of a pilot plant airlift-loop bioreactor. Proc. 4 t n
Europ. Congress on Biotechnology, 1987, vol. 1, pp 101-104 (O.N. Neijssel, R.R. van der Meer, K.Ch.A.M. Luyben eds.) Elsevier Science Publishers B.V., Amsterdam.
[8] A.C. Hulst, J. Tramper, K. van ' t Riet and J.M.M. Westerbeek. A new technique for the production of immobilized biocatalysts in large quantities. Biotechnol. Bioeng. 27, pp 870-876 (1985).
[9] N. Epstein. Three phase fluidisation: some knowledge gaps. Canadian J. of Chem. Eng. 59, 1981, pp 649-657.
[10] W.-D. Deckwer and A. Schumpe. Transporterscheinungen in Dreiphasen-Reaktoren mit fluidisiertem Feststoff. Chem.-Ing.-Techn. 55, 1983, pp 591-600. -
[II] F.J. Briick and H. Hammer. Intensivierung des Stoffaustausches in Blasensaulen-Reaktoren durch suspendierten Feststoffen. Chem.-Ing.-Techn. 58, 1986, pp 60-61.
[12] K.-W. Linnenweber and E. Bla/8. Messung ortlicher Gas- und Feststoffgehalte in Blasensaulen mit in der Fliissigkeit suspendiertem Feststoff. Chem.-Ing.- Techn 54, (1982) pp 682-683.
[13] Y. Kato, A. Nishiwaki, T. Fukuda and S. Tanaka. Chem. Eng. Japan, 5, 1972, p 112.
[14] B.G. Kelkar, Y.T. Shah and N.L. Carr. Hydrodynamics and axial mixing in a three-phase bubble column. Effects on slurry properties. Ind. Eng. Chem. Process. Des. Dev. 29, 1984. pp. 308-313.
[15] A.K.M. Krolikowski, M.H. Zwietering, D.P. van den Akker and P. Verlaan. Control of the dissolved oxygen concentration (DOC) in an airlift-loop bioreactor. Proc. 4 t n Europ. Congress on Biotechnology, 1987, vol. 3 pp. 149-152 (O.M. Neijssel, R.R. van der Meer, K.Ch.A.M. Luyben eds.) Elsevier Science Publishers, Amsterdam.
[16] M. Miyachi, A.Iguchi, S. Uchida and K. Koide. Effect of solid particles in liquid-phase on liquid-side mass transfer coefficient.
120
Canadian J. Chem. Eng. 59, 1981, pp 640-641. [17] R.S. Albal, Y.T. Shah, A. Schumpe and N.L. Carr. Mass transfer In
multiphase agitated contactors. Chem. Eng. J. 27, 1983, pp 61-80. [18] G.E.H. Joosten, J.G.M. Schilder and J.J. Jansen. The influence of
suspended material on the gas-liquid mass transfer in stirred gas-liquid contactors. Chem. Eng. Sci. 32, 1977, pp 563-566.
NOMENCLATURE
a
a
D
d
P
g
k
kja
Kf
L
V
interfacial area
gas hold-up
dispersion coefficient
diameter
density
gravitational constant
mass transfer coefficient
volumetric mass transfer
coefficient
friction coefficient
length
velocity
[•»*]
[-]
[mVs]
[m]
[kg/m*]
[m/s*]
[m/s]
[s-1]
[-]
[-]
[m/s]
Subscripts
1
s
d
g
liquid
superficial
downcomer
gas
Superscripts
0 concerning the two-phase system
1 concerning the three-phase
system with a bead loading 1
121
CHAPTER EIGHT
SUMMARY
An airlift-loop reactor is a bioreactor for aerobic biotechnological pro
cesses. The special feature of the ALR is the recirculation of the liquid
through a downcomer connecting the top and the bottom of the main bubbling
section. Due to the high circulation-flow rate, efficient mixing and oxygen
transfer is combined with a controlled liquid flow in the absence of mecha
nical agitators.
Liquid velocities and gas hold-ups in an external-loop airlift reactor (ALR)
on different scales were modelled on the basis of a simple pressure balance.
The model is adapted for non-isobaric conditions and takes into account non
uniform flow profiles and gas hold-up distributions across the duct. The
friction coefficient together with the reactor dimensions are input parame
ters. It has been shown that the friction coefficient can be obtained from
simple one-phase flow calculations based on known data of the seperate reac
tor parts. The model predicts liquid velocities and local gas hold-ups in an
ALR to within 10* and can be applied easily to an internal loop reactor.
Mixing in the individual sections of the ALR is determined by a newly deve
loped parameter estimation procedure which has proven to be reliable for the
estimation of axial dispersion coefficients in the individual sections of
the ALR. From the results it can be concluded, that in an ALR the liquid
flow behaves like plug-flow with superimposed dispersion except for the top-
section for which it is not reasonable to assume plug-flow. The mixing
results simplified the modelling of oxygen transfer in the ALR as it
appeared not to be necessary to incorporate the dispersion contribution into
the oxygen model.
The non-isobaric plug-flow model, presented in this thesis, predicts dynamic
and stationary dissolved oxygen concentration (DOC) profiles in large-scale
ALRs and has been applied also to estimate the volumetric oxygen transfer
coefficient, kja, in the pertinent ALR. Comparison with the results on the
basis of a simple isobaric stirred-tank-reactor model demonstrates, that
such a model yields conservative values though for the present situation the
underestimation did not exceed a value of 10% relative to the plug-flow
122
model. Therefore, due to its simplicity, it is recommended to use the
stirred tank model for a rapid characterization of the overall aeration
capacity of laboratory scale and pilot-scale ALRs. Oxygen depletion of the
gas phase, even during a fermentation, appeared to be very limited and was
fairly well predicted by the plug-flow model. For this reason an ALR is a
very suitable reactor for aerobic processes having a high oxygen demand. If
necessary, the aeration capacity of the ALR can be enhanced by injection of
a small amount of gas at the entrance of the downflow region. This phenome
non! is also accurately predicted by the plug-flow model. In the present ALR
the aeration capacity of the air-sparger region did not significantly differ
from the main aeration process in the upflow region due to its special
geometry.
The intermediate flow region between the ALR and the bubble-column (BC) flow
regime was investigated by gradually closing a butterfly valve at the bottom
of the downcomer. When the valve is further shut and thus the friction is
enhanced, the liquid velocity will be reduced thereby enlarging the gas
hold-up. The maximum value for the gas hold-up is obtained when the ALR is
operated as a BC. In the transition flow regime between ALR and BC flow, the
liquid velocity was found to be a simple power law function of the gas flow
rate. The coefficients of the power law depend on the flow characteristics
in the reactor. In the transition flow regime the hydrodynamic calculations
based on the plug-flow behaviour of an ALR are only valid up to a certain
defined value of the total gas-liquid flow rate. For greater values, the ALR
type of flow will change into a BC type of flow. A simple criterium quali
fies the distinction between both flow patterns, determined by the super
ficial liquid velocity and the liquid circulation velocity.
The transition of ALR to BC flow coincides with the decrease of the
Bodenstein number which also indicates a less established plug flow. As the
dispersion coefficient at a constant gas-flow rate, remained constant for as
well the ALR, the BC and the transition flow, the decreased Bodenstein
number in the BC-type of flow is mainly attributed to the decreased convec-
tive transport as the liquid circulation is impeded. The number of cir
culations required to achieve complete mixing diminshes when the liquid cir
culation is impeded and appeared to be proportional to the Bodenstein
number.
In the transition flow regime, the volumetric oxygen transfer coefficient
was estimated by both the stirred-tank model and the plug-flow model. The
123
stirred-tank model yielded reliable results for the entire range of opera
tion while the plug-flow model only appeared to be appropiate for the ALR
operation mode. The volumetric oxygen transfer coefficient was found to
increase for the BC operation mode and appeared to be a power law function
of the ratio of the superficial liquid and gas velocity and the Bodenstein
number.
Addition of immobilized biocatalysts to the ALR, in our case simulated by
neutral buoyant particles with diameters ranging from 2.4-2.7 mm, signifi
cantly reduces the liquid velocity and the gas hold-up in an ALR. The
decrease in liquid velocity is attributed to the decrease in gas hold-up and
an increased friction in the ALR. The gas hold-up is reduced mainly because
the presence of the particles increases the collision frequency of the air
bubbles thereby increasing coalescence due to the diminished flowed area
available for the air-water mixture. In comparison to a gas-liquid flow,
axial dispersion in the three-phase flow is reduced as the presence of the
particles damps the small eddies which are, apart from other mechanisms,
responsible for the axial dispersion. Moreover, the increased coalescence
also contributes to a decrease in axial dispersion. The presence of the par
ticles negatively influences aeration due to a reduction in the gas-liquid
interfacial area as a result of the increased coalescence. The effect of the
increase in apparent viscosity in the ALR was not supposed to contribute to
the decrease in the aeration process.
125
SAMENVATTING
Een airlift-loop reactor (ALR) is een bioreactor die zeer geschikt is voor
aerobe biotechnologische productieprocessen. Het speciale kenmerk van de ALR
is de recirculatie van de vloeistoffase door een daalbuis (downcomer) die
onder en boven met het belangrijkste reactordeel, de stijgbuis (riser), ver-
bonden is. Op deze manier ontstaat een sterke circulatiestroming in de reac
tor die een efficiente menging en zuurstofoverdracht combineert met een
gecontroleerde stroming zonder dat daarbij mechanische roerders aan te pas
komen.
Vloeistofsnelheden en gas hold-ups in een airlift-loop reactor met een
externe loop op zowel laboratorium als pilot-plant schaal, zijn gemodelleerd
op basis van een eenvoudige drukbalans. Het model houdt rekening met de niet
isobare condities en de niet-uniforme, radiale vloeistof en gas hold-up pro-
fielen. De afmetingen van de reactor en de frictie coefficient zijn invoer
grootheden van het model. Er is aangetoond dat de frictie coefficient
verkregen kan worden uit eenvoudige een-fase frictie berekeningen, toegepast
op de verschillende reactor onderdelen en daarna gesommeerd over de reactor.
Het hydrodynamische model voorspelt de gas hold-up en de vloeistofsnelheid
met een afwijking van hoogstens 10% en is ook toepasbaar op een ALR met een
interne loop.
De menging in de verschillende reactor onderdelen is gekarakteriseerd met
behulp van een nieuw ontwikkelde parameterschattingsprocedure die
betrouwbare resultaten oplevert voor het schatten van de axiale dispersie
coefficient in de verschillende reactor delen. Uit de resultaten kan
geconcludeerd worden dat in een ALR de vloeistofstroming zich inderdaad
gedraagt als een propstroming met axiale dispersie behalve in de topsectie
waar het niet aannemelijk is om het stromingsgedrag als een propstroming
voor te stellen. Uit de verkregen meng-resultaten blijkt dat voor het
modelleren van de zuurstofoverdracht in de ALR het niet nodig is om de
dispersiebijdragen in het model op te nemen.
Het in dit proefschrift beschreven niet-isobare propstroom model voorspelt
stationaire en niet-stationaire opgeloste-zuurstof concentratie profielen in
grootschalige airlift-loop reactoren en is gebruikt om de volumetrische
zuurstofoverdrachtscoefficient, kja in de ALR te schatten. Vergelijking met
resultaten, verkregen op basis van een simpel, isobaar, geroerde-tank reac-
126
tormodel toont aan dat zo' n model te lage waarden oplevert ofschoon voor de
bedoelde situatie deze afwijking niet meer dan 10* bedraagt. Door zijn een-
voud wordt dlt model dan ook aanbevolen voor een snelle karakterlsering van
de overall beluchtingscapaclteit van zowel een laboratorium-schaal als van
een pilot-plant ALR.
De zuurstofultputtlng van de gasfase In de ALR bleek zeer gering te zijn,
zelfs gedurende een fermentatie en werd goed beschreven door het propstroom-
model. Hierdoor is een ALR een zeer geschikte reactor voor aerobe processen
met een hoge zuurstofbelasting. Indien noodzakelijk, kan de zuustofo-
verdrachtscapaciteit van de ALR vergroot worden door continu een kleine
hoeveelheid gas bovenin de downcomer te injecteren. Dit verschijnsel wordt
eveneens goed beschreven door het propstroom model. Voor de onderhavige ALR
bleek de zuurstofoverdrachtscapaciteit in de buurt van de gasverdeler niet
significant af te wijken van die in de rest van de riser, hetgeen
toegeschreven kan worden aan de speciale geometrie van de gasverdeler.
De overgang tussen de typische ALR vloeistofstroming en de bellenkolom (BC)
vloeistofstroming is onderzocht door middel van een vlinderklep onderin de
downcomer van de ALR, die geleidelijk gesloten of geopend kon worden. Bij
een grotere afsluitstand neemt de frictie toe als gevolg waarvan de
vloeistofsnelheid af- en de gas hold-up toeneemt. De maximum waarde voor de
gas hold-up wordt verkregen als de ALR wordt bedreven als een bellenkolom.
In het overgangsregime blijkt de vloeistofstroming een simpele exponentiele
functie van het gasdebiet te zijn. De coefficienten in deze exponentiele
functie zijn afhankelijk van het stromingspatroon in de reactor. In het
overgangsgebied blijk het eerder genoemde hydrodynamische model alleen
geldig te zijn tot een bepaald maximum van het totale gas-vloeistof debiet.
Voor grotere waarden verandert de typische ALR stroming in een bellenkolom-
achtige stroming. Een eenvoudig criterium geeft aan wanneer de overgang
tussen beide stromingspatronen plaatsvindt hetgeen bepaald wordt door de
superficiele vloeistofsnelheid en de vloeistof circulatie snelheid. Het cri
terium strookt met de afname van het Bodenstein getal in het overgangsre
gime. Dit laatste verschijnsel wijst tevens op de minder ontwikkelde
propstroming van een BC-achtig stromingspatroon. Aangezien de disper-
siecoefficient voor zowel de ALR als de BC situatie constant blijft bij een
constant gasdebiet, betekent dit dat de genoemde afname van het Bodenstein
getal hoofdzakelijk toegeschreven moet worden aan de verminderde convectieve
bijdrage wanneer de vloeistof circulatie in toenemende mate wordt belemmerd.
127
Het aantal omlopen benodigd voor een totale menging in de ALR neemt af naar-
mate de vloeistofcirculatie steeds meer wordt belenmerd een blijkt evenredig
te zijn met het Bodenstein getal. In de overgangssituatie is de volu-
metrische zuurstofoverdrachtscoefficient geschat door zowel het geroerde-
tank-reactor model als door het propstroommodel. Het geroerde-tank model
geeft betrouwbare resultaten voor het gehele operationele gebied terwijl het
propstroom model alleen toepasbaar blijkt voor de ALR. De volumetrische
zuurstofoverdrachtscoeffient neemt toe van de ALR naar de BC situatie en
blijkt een exponentiele functie te zijn van de verhouding van de super-
ficiele gassnelheid en de vloeistofsnelheid en het Bodenstein kental.
Toevoeging van een geimmobiliseerde biofase, in ons geval gesimuleerd door
deeltjes met een diameter varierend van 2.4-2.7 mm en een dichtheid ongeveer
gelijk aan die van water, aan de ALR reduceerde de vloeistofsnelheid en de
gas hold-up aanzienlijk. De afname van de vloeistofsnelheid kan toegeschre-
ven worden aan de afname van de gas hold-up en een toename van de frictie in
de ALR. De afname van de gas hold-up is hoofdzakelijk een gevolg van de aan-
wezigheid van de deeltjes die een positief effect heeft op de bot-
singsfrequentie van de luchtbellen en daarbij een toenemende coalescentie
veroorzaakt door de afname van het beschikbare doorstromings oppervlak voor
het water-lucht mengsel. In vergelijking met de gas-vloeistofstroming neemt
de axiale dispersie in de drie-fasen stroming af aangezien de aanwezigheid
van de deeltjes de kleine turbulenties dempt, die, naast andere mechanismen,
verantwoordelijk zijn voor de axiale dispersie. Bovendien draagt een toename
van de coalescentie 66k bij tot een afname van de axiale dispersie. De aan
wezigheid van de deeltjes heeft een negatieve invloed op de beluchting als
gevolg van de afname van het gas-vloeistof uitwisselingsoppervlak als gevolg
van de toename van de coalescentie. Het effect van de toename van de schijn-
bare viscositeit in de reactor is verondersteld niet bij te dragen tot een
afname van de beluchtingscapaciteit.
129
CURRICULUM VITAE
De auteur van dit proefschrift is op 30 december 1955 geboren te Willemstad,
Curacao. In Vlissingen doorliep hij van 1968 tot 1974 het atheneum-B.
Aansluitend hierop werd gestart met de studie Technische Natuurkunde aan de
(toen nog) Technische Hogeschool Delft. Na de 3-jarige kandidaatsfase werd
het doctoraalonderzoek verricht bij de vakgroep Fysische Technologie van de
genoemde studierichting. De twee hoofdonderwerpen betroffen onderzoek aan
waterstraalbeluchters en aan een deep-shaft reactor. Gedurende de doc-
toraalfase is de auteur enkele jaren in deeltijd werkzaam geweest als leraar
in de natuurkunde aan een middelbare school en aan een HBO-opleiding, boven-
dien werd een eerste-graads lesbevoegdheid in de natuurkunde en mechanica
behaald.
In 1983 rondde de auteur zijn studie af en werd hij aangesteld als
wetenschappelijk assistent aan de sectie Proceskunde van de vakgroep
Levensraiddelentechnologie van de (toen nog) Landbouwhogeschool Wageningen.
Het onderwerp van onderzoek is beschreven in dit proefschrift en werd
afgerond in 1986.
Vanaf 1 april 1986 is de auteur werkzaam als universitair docent aan de sec-
tie Proceskunde van de Landbouwuniversiteit Wageningen.