MILIEUSTATISTIEKEN ENVIRONMENT STATISTICS · MILIEUSTATISTIEKEN ENVIRONMENT STATISTICS Suriname in...
96
Suriname in Cijfers no 286- 2012 / 04 Algemeen Bureau voor de Statistiek ism Conservation International Suriname Oktober 2012 Prijs per exemplaar SRD 35,= MILIEUSTATISTIEKEN ENVIRONMENT STATISTICS
Transcript of MILIEUSTATISTIEKEN ENVIRONMENT STATISTICS · MILIEUSTATISTIEKEN ENVIRONMENT STATISTICS Suriname in...
Suriname in Cijfers no 286- 2012 / 04
Algemeen Bureau voor de Statistiek
ism
Conservation International Suriname
Oktober 2012
Prijs per exemplaar SRD 35,=
MILIEUSTATISTIEKEN
ENVIRONMENT STATISTICS
MILIEUSTATISTIEKEN
ENVIRONMENT STATISTICS
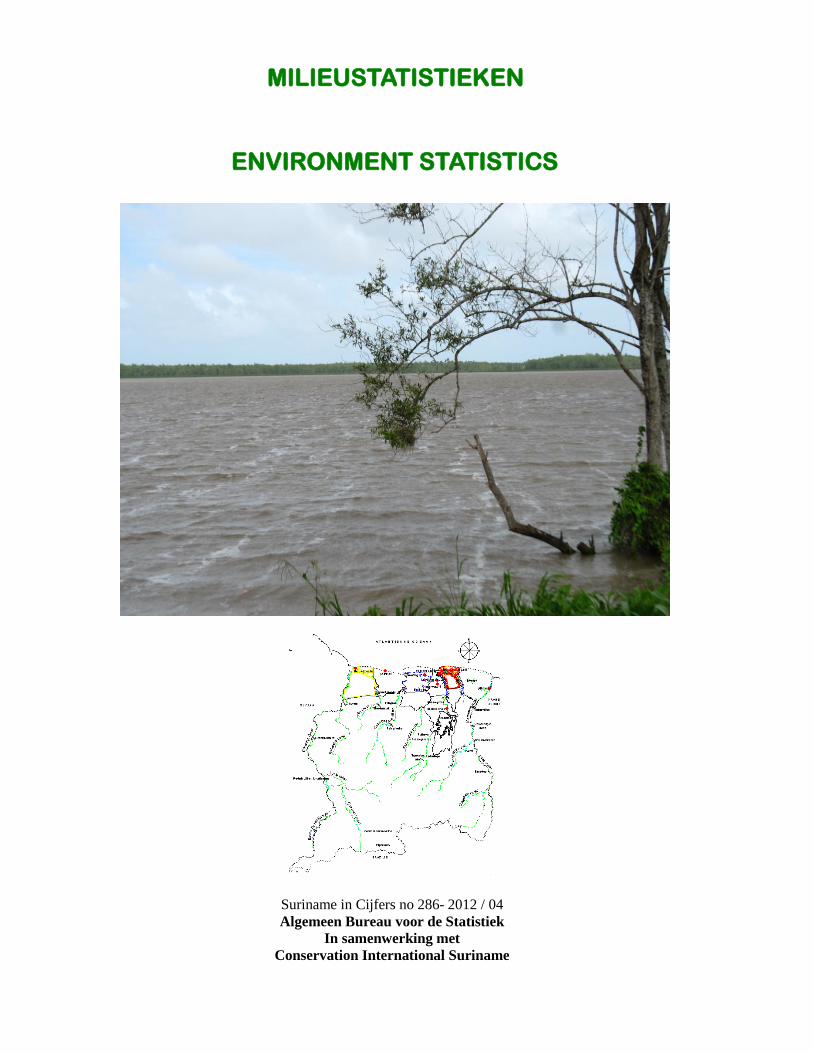
Suriname in Cijfers no 286- 2012 / 04
Algemeen Bureau voor de Statistiek
In samenwerking met
Conservation International Suriname
Milieustatistieken Environmental Statistics
i
Dankzegging / Vote of Thanks Aan de totstandkoming van deze milieupublicatie hebben velen hun bijdrage geleverd en we maken van deze gelegenheid gebruik alle dataverschaffers afzonderlijk te bedanken: / A lot of persons and organizations contributed to this publication on environment statistics and we take this opportunity to thank everyone that furnished data separately:
1. Algemeen Bureau voor de Statistiek / General Bureau of Statistics Censuskantoor / Census Office Afdeling Bevolkingsstatistieken / Population Statistics Section Afdeling Verkeer- en Vervoersstatistieken / Traffic and Transport Statistics Afdeling Handelsstatistieken / Trade Statistics Section 2. Conservation International Suriname 3. Bureau voor Openbare Gezondheidszorg / Bureau for Public Health 4. Centrale Bank van Suriname / Central Bank of Suriname 5. Dienst Lands Bosbeheer / Forest Service of Suriname Afdeling Natuurbeheer/ Division Nature Conservation 6. NV Energie Bedrijven Suriname / Suriname Energy Company 7. Maritieme Autoriteit Suriname / Maritime Authority Suriname 8. Ministerie van Financiën / Ministry of Finance Afdeling Invoerrechten en Accijnzen/, Dept. of Import Duties and Excises 9. Ministerie van Landbouw, Veeteelt en Visserij / Ministry of Agriculture, Animal Husbandry and Fisheries 10. Mninisterie van Natuurlijke Hulpbronnen / Ministry of Natural Resources Dienst Watervoorziening / Water Supply Service Geologische Mijnbouwkundige Dienst / Geological Mining Services 11. Ministerie van Openbare Werken / Ministry of Public Works Meteorologische Dienst / Meteorology Service 12. NIMOS / Office of Environmental Monitoring & Enforcement 13. Stichting Bosexploitatie en Bostoezicht / Institute for Forest Management and Control 14. Centrum voor Landbouwkundig Onderzoek in Suriname (CELOS) / Centre for Agricultural Survey in Suriname 15. Stichting Toerisme Suriname / Suriname Tourism Foundation 16. Surinaamse Visserij Dienst / Suriname Fisheries Services 17. Surinaamse Waterleiding Maatschappij Suriname / Suriname Water Company 18. Bauxiet Instituut voor Suriname / Bauxite Institute Suriname
Milieustatistieken Environmental Statistics
ii
Symbolen
Symbols
. = gegevens ontbreken * = voorlopige cijfers - = nul # = gereviseerde cijfers 0 = minder dan de helft van de gebruikte
eenheid blanco = kan op logische gronden niet voorkomen
. = data not available * = provisional figures - = nil # = revised figures 0 = less than half of the unit used blank = cannot appear due to logical constraints
Milieustatistieken Environmental Statistics
iii
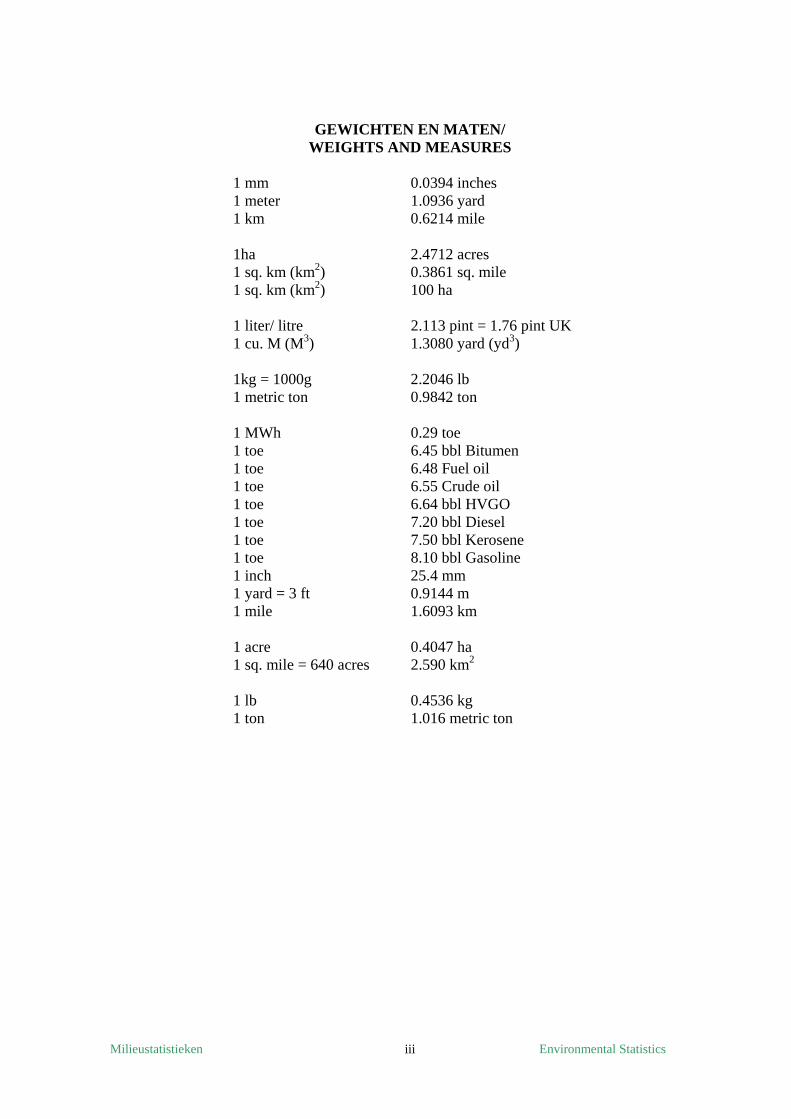
GEWICHTEN EN MATEN/ WEIGHTS AND MEASURES
1 mm 0.0394 inches 1 meter 1.0936 yard 1 km 0.6214 mile 1ha 2.4712 acres 1 sq. km (km2) 0.3861 sq. mile 1 sq. km (km2) 100 ha 1 liter/ litre 2.113 pint = 1.76 pint UK 1 cu. M (M3) 1.3080 yard (yd3) 1kg = 1000g 2.2046 lb 1 metric ton 0.9842 ton 1 MWh 0.29 toe 1 toe 6.45 bbl Bitumen 1 toe 6.48 Fuel oil 1 toe 6.55 Crude oil 1 toe 6.64 bbl HVGO 1 toe 7.20 bbl Diesel 1 toe 7.50 bbl Kerosene 1 toe 8.10 bbl Gasoline 1 inch 25.4 mm 1 yard = 3 ft 0.9144 m 1 mile 1.6093 km 1 acre 0.4047 ha 1 sq. mile = 640 acres 2.590 km2 1 lb 0.4536 kg 1 ton 1.016 metric ton
Milieustatistieken Environmental Statistics
iv
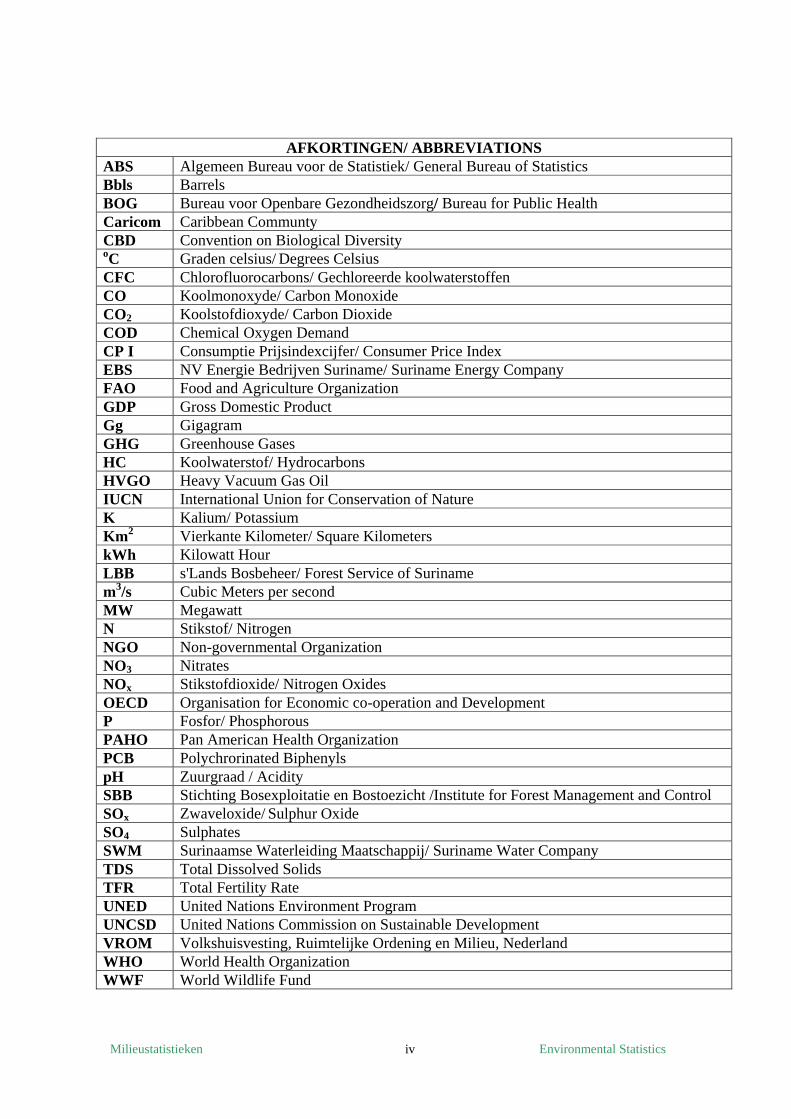
AFKORTINGEN/ ABBREVIATIONS
ABS Algemeen Bureau voor de Statistiek/ General Bureau of Statistics
Bbls Barrels BOG Bureau voor Openbare Gezondheidszorg/ Bureau for Public Health Caricom Caribbean Communty CBD Convention on Biological Diversity oC Graden celsius/ Degrees Celsius CFC Chlorofluorocarbons/ Gechloreerde koolwaterstoffenCO Koolmonoxyde/ Carbon Monoxide CO2 Koolstofdioxyde/ Carbon Dioxide COD Chemical Oxygen Demand CP I Consumptie Prijsindexcijfer/ Consumer Price Index EBS NV Energie Bedrijven Suriname/ Suriname Energy Company FAO Food and Agriculture Organization GDP Gross Domestic Product Gg Gigagram GHG Greenhouse Gases HC Koolwaterstof/ Hydrocarbons HVGO Heavy Vacuum Gas Oil IUCN International Union for Conservation of Nature K Kalium/ Potassium Km2 Vierkante Kilometer/ Square Kilometers kWh Kilowatt Hour LBB s'Lands Bosbeheer/ Forest Service of Suriname m3/s Cubic Meters per second MW Megawatt N Stikstof/ Nitrogen NGO Non-governmental Organization NO3 Nitrates NOx Stikstofdioxide/ Nitrogen Oxides OECD Organisation for Economic co-operation and Development P Fosfor/ Phosphorous PAHO Pan American Health Organization PCB Polychrorinated Biphenyls pH Zuurgraad / Acidity SBB Stichting Bosexploitatie en Bostoezicht /Institute for Forest Management and Control SOx Zwaveloxide/ Sulphur Oxide SO4 Sulphates SWM Surinaamse Waterleiding Maatschappij/ Suriname Water Company TDS Total Dissolved Solids TFR Total Fertility Rate UNED United Nations Environment Program UNCSD United Nations Commission on Sustainable Development VROM Volkshuisvesting, Ruimtelijke Ordening en Milieu, Nederland WHO World Health Organization WWF World Wildlife Fund
Milieustatistieken Environmental Statistics
v
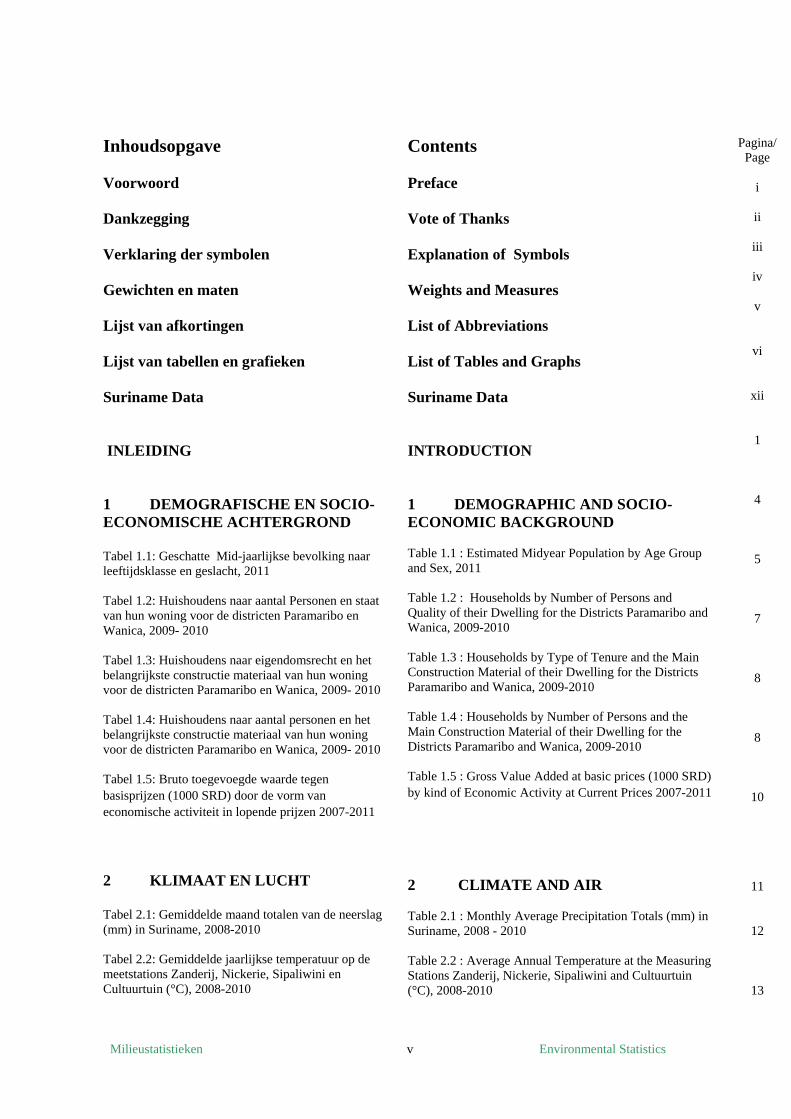
Inhoudsopgave Voorwoord Dankzegging Verklaring der symbolen Gewichten en maten Lijst van afkortingen Lijst van tabellen en grafieken Suriname Data INLEIDING 1 DEMOGRAFISCHE EN SOCIO- ECONOMISCHE ACHTERGROND Tabel 1.1: Geschatte Mid-jaarlijkse bevolking naar leeftijdsklasse en geslacht, 2011 Tabel 1.2: Huishoudens naar aantal Personen en staat van hun woning voor de districten Paramaribo en Wanica, 2009- 2010 Tabel 1.3: Huishoudens naar eigendomsrecht en het belangrijkste constructie materiaal van hun woning voor de districten Paramaribo en Wanica, 2009- 2010 Tabel 1.4: Huishoudens naar aantal personen en het belangrijkste constructie materiaal van hun woning voor de districten Paramaribo en Wanica, 2009- 2010 Tabel 1.5: Bruto toegevoegde waarde tegen basisprijzen (1000 SRD) door de vorm van economische activiteit in lopende prijzen 2007-2011 2 KLIMAAT EN LUCHT
Tabel 2.1: Gemiddelde maand totalen van de neerslag (mm) in Suriname, 2008-2010 Tabel 2.2: Gemiddelde jaarlijkse temperatuur op de meetstations Zanderij, Nickerie, Sipaliwini en Cultuurtuin (°C), 2008-2010
Contents Preface Vote of Thanks Explanation of Symbols Weights and Measures List of Abbreviations List of Tables and Graphs Suriname Data INTRODUCTION 1 DEMOGRAPHIC AND SOCIO- ECONOMIC BACKGROUND
Table 1.1 : Estimated Midyear Population by Age Group and Sex, 2011 Table 1.2 : Households by Number of Persons and Quality of their Dwelling for the Districts Paramaribo and Wanica, 2009-2010 Table 1.3 : Households by Type of Tenure and the Main Construction Material of their Dwelling for the Districts Paramaribo and Wanica, 2009-2010 Table 1.4 : Households by Number of Persons and the Main Construction Material of their Dwelling for the Districts Paramaribo and Wanica, 2009-2010 Table 1.5 : Gross Value Added at basic prices (1000 SRD) by kind of Economic Activity at Current Prices 2007-2011
2 CLIMATE AND AIR Table 2.1 : Monthly Average Precipitation Totals (mm) in Suriname, 2008 - 2010 Table 2.2 : Average Annual Temperature at the Measuring Stations Zanderij, Nickerie, Sipaliwini and Cultuurtuin (°C), 2008-2010
Pagina/ Page
i
ii
iii
iv v
vi
xii
1 4 5 7 8
8
10
11
12
13
Milieustatistieken Environmental Statistics
vi
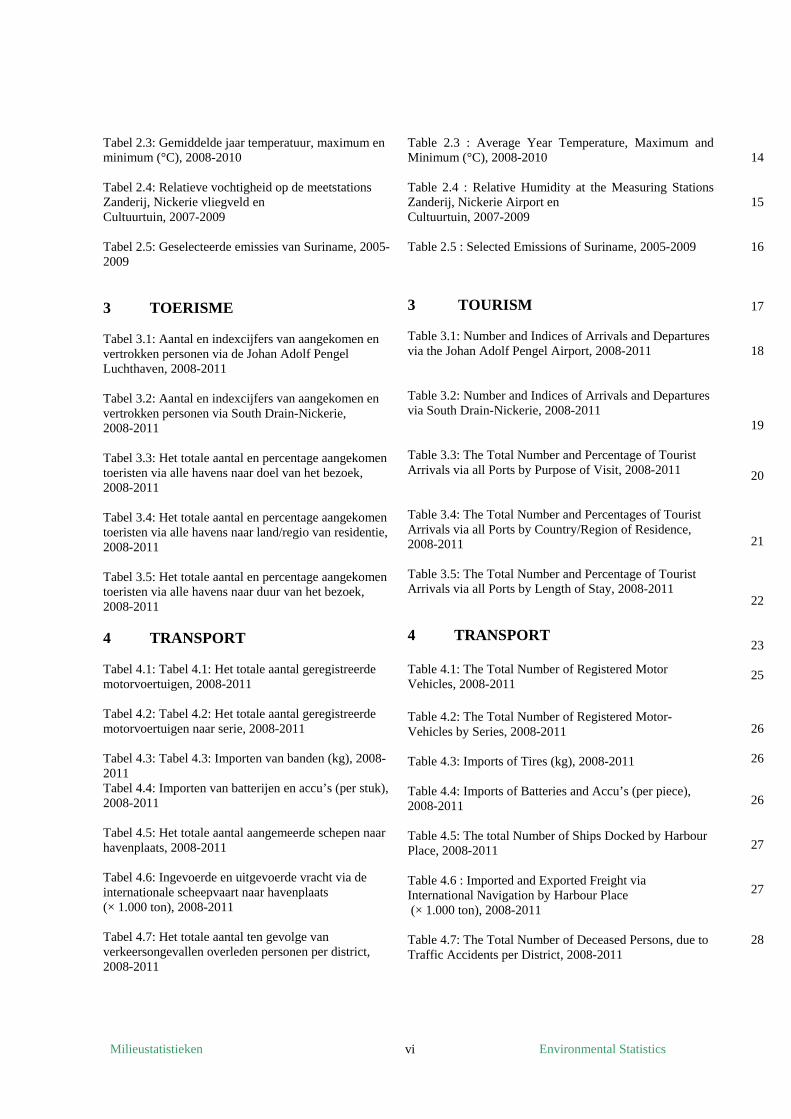
Tabel 2.3: Gemiddelde jaar temperatuur, maximum en minimum (°C), 2008-2010 Tabel 2.4: Relatieve vochtigheid op de meetstations Zanderij, Nickerie vliegveld en Cultuurtuin, 2007-2009 Tabel 2.5: Geselecteerde emissies van Suriname, 2005-2009 3 TOERISME Tabel 3.1: Aantal en indexcijfers van aangekomen en vertrokken personen via de Johan Adolf Pengel Luchthaven, 2008-2011 Tabel 3.2: Aantal en indexcijfers van aangekomen en vertrokken personen via South Drain-Nickerie, 2008-2011 Tabel 3.3: Het totale aantal en percentage aangekomen toeristen via alle havens naar doel van het bezoek, 2008-2011 Tabel 3.4: Het totale aantal en percentage aangekomen toeristen via alle havens naar land/regio van residentie, 2008-2011 Tabel 3.5: Het totale aantal en percentage aangekomen toeristen via alle havens naar duur van het bezoek, 2008-2011 4 TRANSPORT Tabel 4.1: Tabel 4.1: Het totale aantal geregistreerde motorvoertuigen, 2008-2011 Tabel 4.2: Tabel 4.2: Het totale aantal geregistreerde motorvoertuigen naar serie, 2008-2011 Tabel 4.3: Tabel 4.3: Importen van banden (kg), 2008-2011 Tabel 4.4: Importen van batterijen en accu’s (per stuk), 2008-2011 Tabel 4.5: Het totale aantal aangemeerde schepen naar havenplaats, 2008-2011
Tabel 4.6: Ingevoerde en uitgevoerde vracht via de internationale scheepvaart naar havenplaats (× 1.000 ton), 2008-2011 Tabel 4.7: Het totale aantal ten gevolge van verkeersongevallen overleden personen per district, 2008-2011
Table 2.3 : Average Year Temperature, Maximum and Minimum (°C), 2008-2010 Table 2.4 : Relative Humidity at the Measuring Stations Zanderij, Nickerie Airport en Cultuurtuin, 2007-2009 Table 2.5 : Selected Emissions of Suriname, 2005-2009 3 TOURISM
Table 3.1: Number and Indices of Arrivals and Departures via the Johan Adolf Pengel Airport, 2008-2011 Table 3.2: Number and Indices of Arrivals and Departures via South Drain-Nickerie, 2008-2011 Table 3.3: The Total Number and Percentage of Tourist Arrivals via all Ports by Purpose of Visit, 2008-2011 Table 3.4: The Total Number and Percentages of Tourist Arrivals via all Ports by Country/Region of Residence, 2008-2011 Table 3.5: The Total Number and Percentage of Tourist Arrivals via all Ports by Length of Stay, 2008-2011 4 TRANSPORT Table 4.1: The Total Number of Registered Motor Vehicles, 2008-2011 Table 4.2: The Total Number of Registered Motor-Vehicles by Series, 2008-2011 Table 4.3: Imports of Tires (kg), 2008-2011 Table 4.4: Imports of Batteries and Accu’s (per piece), 2008-2011
Table 4.5: The total Number of Ships Docked by Harbour Place, 2008-2011 Table 4.6 : Imported and Exported Freight via International Navigation by Harbour Place (× 1.000 ton), 2008-2011 Table 4.7: The Total Number of Deceased Persons, due to Traffic Accidents per District, 2008-2011
14
15
16
17
18
19
20
21
22
23
25
26
26
26
27
27
28
Milieustatistieken Environmental Statistics
vii
5 MILIEU, GEZONDHEID EN
AFVAL
Tabel 5.1: Malaria gevallen in Suriname, 2008-2010 Tabel 5.2: Suspecte gevallen van dengue naar geslacht, 2008-2010
Tabel 5.3: Suspecte gevallen van leptospirosis naar geslacht, 2008-2010 Tabel 5.4: Milieuklachten per jaar naar soort klacht en district, 2008-2011 Tabel 5.5: Aantal milieu adviezen m.b.t. uitgegeven vergunningen naar districtscommissaris en Ministerie, 2008-2011 Tabel 5.6: Hoeveelheid gestort afval in m3, 2008- 2011 Tabel 5.7: Aantal vrachtwagens in gebruik bij de vuilophaal, de status en de capaciteit per categorie, 2008-2011 Tabel 5.8: Overzicht van scrap productie (ton), 2008-2011 6 ZOETWATER Tabel 6.1.1: Water consumptie SWM verzorgingsgebied (in m3), 2008-2011 Tabel 6.1.2: Water consumptie SWM verzorgingsgebied (Nickerie en Marowijne) (in m3), 2009-2011 Tabel 6.2: Water productie geëxploiteerd door SWM (m3), 2008-2011 Tabel 6.3: Water kwaliteitstest naar E-coli op het waterleidingnet in Ziekenhuizen, 2008-2010 7 ENERGIE EN MINERALEN Tabel 7.1: Totale elektriciteit en kookgas productie, 2008-2011 Tabel 7.2: Huishoudens naar aantal personen en percentage van geselecteerde voorzieningen in Paramaribo en Wanica, 2009-2010 Tabel 7.3: Aantal huishoudens naar soort brandstof gebruik voor koken, Paramaribo en Wanica, 2009-2010 Tabel 7.4: Totale elektriciteit aansluitingen en geïnstalleerde vermogen, 2008 – 2011 Tabel 7.5: De Productie van aardolie, natuur gas en elektriciteitsopwekking door Staatsolie Suriname, 2008-2011
5 ENVIRONMENTAL HEALTH AND
WASTE Table 5.1: Malaria cases in Suriname, 2008-2010 Table 5.2: Suspected Cases of Dengue by Sex, 2008-2010 Table 5.3: Suspected Cases Leptospirosis of by Sex, 2008-2010 Table 5.4: Environmental Complaints per year by Type of Complaint and District, 2008-2011 Table 5.5: Number of Environmental Advices with Regard to Licenses Issued by Districts Commissioner and Ministry, 2008-2011 Table 5.6: Amount of Waste Disposed in m3, 2008-2011 Table 5.7: Number of Lorries Used for Waste Collection, the Status and the Capacity per Category, 2008-2011 Table 5.8: Overview of given Scrap production (ton), 2008-2011 6 FRESH WATER Table 6.1.1: Water consumption SWM Service Area (in m3), 2008-2011 Table 6.1.2: Water consumption SWM Service Area (Nickerie and Marowijne), (in m3), 2009-2011 Table 6.2: Water Production Operated by SWM (m3), 2008-2011 Table 6.3: Water quality testing on E-coli at the Water Distribution Network in Hospitals, 2008- 2010 7 ENERGY AND MINERALS
Table 7.1: Total Electricity and Cooking gas production, 2008-2011 Table 7.2: Households by Number and Percentage of Persons and Selected Utilities in Paramaribo and Wanica, 2009-2010 Table 7.3: Number of households by kind of Fuel Used for Cooking, Paramaribo and Wanica, 2009-2010 Table 7.4: Total Electricity Connection via EBS and the Installed Capacity, 2008-2011 Table 7.5: The Production of Crude Oil, Natural Gas and Electricity Generation by State Oil Company Suriname, 2008-2011
29
30
30
31
32
33
34
34
35
36
38
38
39
41
42
43
44
45
45
46
Milieustatistieken Environmental Statistics
viii
Tabel 7.6: Geselecteerde energie data van Suriname naar sector, 2007-2010 Tabel 7.7: Maandelijkse goudexport in gram, 2008-2011 Tabel 7.8: Productie- en exportcijfers van de bauxiet sector, 2008 – 2011 (x 1000mt) Tabel 7.9: Soort uitgegeven goudmijnrechten en andere mineralen, 2009-2011 ( in ha.) Tabel 7.10: De geregistreerde productie van bouwmaterialen, 2009-2011 Tabel 7.11: Soort concessie (in ha.) naar district en materiaal, 2009-2011 Tabel 7.12: De opwekking van energie door de mijnbouw sector (Kwh), 2008-2011 Tabel 7.13: De distributie van energie geproduceerd door de mijnbouw sector (Kwh), 2008-2011 Tabel 7.14: Energie consumptie van de goudsector, 2006-2009 Tabel 7.15 : Emissies van de bauxiet sector, 2008-2011 Tabel 7.16: Uitstoot van broeikasgassen door de goud sector, 2006-2009 Tabel 7.17: Duurzame performance indicatoren van Rosebel Gold Mines N.V, 2006-2009 Tabel 7.18: Data voor duurzame ontwikkeling, Rosebel Gold Mines N.V, 2006-2009 Tabel 7.19: Totaal land verstoring door Iam Gold, 2007-2009
8 BOSBOUW Tabel 8.1: Totale rondhout productie* per district (in m3), 2008-2011 Tabel 8.2: Rondhoutproductie*) naar belangrijkste soort in m3, 2008-2011 Tabel 8.3: Overzicht van houtexporten naar assortiment in m3, 2008-2011 Tabel 8.4: Exporten van geselecteerde Planten en vruchten in US dollars, 2008-2011 Tabel 8.5: Het aantal geregistreerde houtzagerijen per district, 2008-2010 Tabel 8.6: Uitgemijnde gebieden (in ha), 2008-2011 Tabel 8.7: Gerehabiliteerde gebieden (in ha), 2008-2011
Table 7.6: Selected Energy data of Suriname by Sector, 2007-2010 Table 7.7: Monthly Gold Export in Gram, 2008-2011 Table 7.8: Production and Export Figures of the Bauxite Sector, 2008 – 2011 (x 1000mt) Table 7.9: Type of Gold Mining Rights and other Minerals, 2009-2011 (in ha.) Table 7.10: The Registered Production of Building Materials, 2009-2011 Table 7.11: Kind of Concession (in ha.) by District and material, 2009-2011 Table 7.12: The Generation of Energy by the Mining sector (Kwh), 2008-2011 Table 7.13: The Distribution of Energy Produced by the Mining Sector (Kwh), 2008-2011 Table7.14: Energy Consumption of the Gold Sector, 2006-2009 Table 7.15: Emissions of the Bauxite Sector, 2008-2011 Table 7.16: Greenhouse Gas Emissions by the Gold Sector, 2006-2009 Table 7.17: Sustainable Performance Indicators of Rosebel Gold Mines N.V, 2006-2009 Table 7.18: Data for Sustainable Development, Rosebel Gold Mines N.V. , 2006-2009 Table 7.19: Total Land Disturbance by Iam Gold, 2007-2009
8 FORESTY Table 8.1: Total log production* by district (in m3), 2008-2011 Table 8.2: Log Production*) by Major Species in m3, 2008-2011 Table 8.3: Overview of Timber Export by Assortment in m3, 2008-2011 Table 8.4: Exports of Selected Plants and Fruits in US Dollars, 2008-2011 Table 8.5: The Number of Registered Saw Mills per District, 2008-2010 Table 8.6: Mined- out Areas (in ha), 2008-2011 Table 8.7: Rehabilitated Area’s (in ha), 2008-2011
47
49
50
51
51
52
53
53
54
54
55
55
56
56
57
59
59
60
60
61
61
61
Milieustatistieken Environmental Statistics
ix
9 HULPBRONNEN VAN HET KUSTGEBIED
Tabel 9.1: Visvangsten naar soort visserij, 2008-2011 (in metrieke ton) Tabel 9.2: Aantal boten naar soort visserij, 2008-2011 Tabel 9.3: Gemiddelde aantal zeedagen naar soort visserij 2011 Tabel 9.4: Aantal vergunninghouders naar boot type, 2008-2011
10 LANDGEBRUIK EN LANDBOUW Tabel 10.1: Beplant areaal en landgebruik, 2008-2010 (in ha.) Tabel 10.2: Grasland voor veestapel, 2008-2011 (in ha.) Tabel 10.3: Vee- en pluimvee data naar district, 2008-2010 Tabel 10.4: Kunstmest importen, 2008- 2011 (in kg) Table 10.5: Importen van pesticiden, 2008-2011 (in kg) 11 BIODIVERSITEIT Tabel 11.1: Beschermende oppervlakte als % van de totale land oppervlak, 2010 Tabel 11.2: Het aantal bezoekers naar geselecteerde beschermde gebieden, 2008-2011 Tabel 11.3: Exporten van wilde dieren in US dollars, 2008-2010 Grafieken Grafiek 1: Geschatte mid-jaarlijkse bevolking naar leeftijdsklasse en geslacht, 2011 Grafiek 2: Aantal huishoudens in en de staat van hun woning %, 2010 Grafiek 3: Gemiddelde maand totalen van de neerslag (mm) in Suriname, 2007-2010 Grafiek 4: Gemiddelde temperatuur, maximum en minimum (°C), 2010 Grafiek 5: Jaarlijkse aantal aangekomen en vertrokken personen via de Johan Adolf Pengel Luchthaven en de haven van Nieuw Nickerie, 2008-2011 Grafiek 6: Percentage aangekomen toeristen via alle havens naar doel van het bezoek, 2008-2011
9 COASTAL AND MARINE RESOURCES
Table 9.1: Fish Catches by Type of Fishery, 2008-2011 (in metric ton) Table 9.2: Number of Boats by Type of Fishery, 2008-2011 Table 9.3: Average number of Days at Sea by Type of Fishery 2011 Table 9.4: Number of License Holders by Boat Type, 2008-2011 10 LAND USE AND AGRICULTURE Table 10.1: Planted Area and Land Use, 2008-2010 (in ha.) Table 10.2: Grass Land for Cattle Stocks, 2008-2011 (in ha.) Table10.3: Cattle and Poultry data by District, 2008-2010 Table 10.4: Fertilizer Imports, 2008-2011 (in kg) Table 10.5: Imports of Pesticides, 2008 - 2011 (in kg) 11 BIODIVERSITY Table 11.1: Protected Area as a % of the Total Land Area, 2010 Table 11.2: The number of visitors to selected Protected Areas, 2008-2011 Table 11.3: Exports of Wild Animals in US Dollars, 2008-2010
Graphs Graph 1: Estimated Midyear Population by Age Group and Sex, 2011 Graph 2: Number of Households in and the Quality of their Dwelling %, 2010 Graph 3: Monthly Average Precipitation Totals (mm) in Suriname, 2007-2010 Graph 4: Average Temperature, Maximum and Minimum (°C), 2010 Graph 5: Annual Number of Arrivals and Departures via the Johan Adolf Pengel Airport and Nieuw Nickerie Harbour, 2008-2011 Graph 6: Percentage of Tourist Arrivals via all Ports by Purpose of Visit, 2008-2011
63
64
66
66
67
69
70
71
72
73
73
74
76
76
77 6 7
13
14
19
20
Milieustatistieken Environmental Statistics
x
Grafiek 7: Percentage aangekomen toeristen via alle havens naar land/regio van residentie, 2008-2011 Grafiek 8: Percentage aangekomen toeristen via alle havens naar duur van het bezoek, 2008-2011 Grafiek 9: Aantal geregistreerde motorvoertuigen op de openbare weg, 2010 en 2011 Grafiek 10: Water productie geëxploiteerd door SWM (in kubieke meter), 2008-2011 Grafiek 11: Totale elektriciteit en kookgas productie, 2008-2011 Grafiek 12: Totale elektriciteit aansluitingen en geïnstalleerde vermogen, 2008 – 2011 Grafiek 13: Energie intensiteit- totale primaire energie consumptie per US Dollar of GDP, 2003-2009 Grafiek 14: Productie- en exportcijfers van de bauxiet sector, 2008– 2011 (x 1000mt) Grafiek 15: De opwekking van energie door de mijnbouw sector (xKwh), 2008-2011 Grafiek 16: Overzicht van houtexporten naar assortiment in m3, 2008-2011 Grafiek 17: Visvangsten naar soort visserij, 2008-2011 (in metrieke ton)
Grafiek 18: Beplant areaal en grasland, 2008-2010 BIJLAGEN literatuurverwijzingen Bijlage 1: Lijst van participanten aan de milieu workshop, 18 april 2012 Bijlage 2: Lijst van inleiders en onderwerpen Bijlage 3: Lijst van werkgroepen en onderwerpen
Graph 7: Percentages of Tourist Arrivals via all Ports by Country/Region of Residence, 2008-2011 Graph 8: Percentage of Tourist Arrivals via all Ports by Length of Stay, 2008-2011 Graph 9: Number of Registered Motor-Vehicles on the Public Roads, 2010 and 2011 Graph 10: Water Production Operated by SWM (in cubic meters), 2008-2011 Graph 11: Total Electricity and Cooking gas production, 2008-2011 Graph 12: Total Electricity Connection via EBS and the Installed Capacity, 2008 – 2011
Graph 13: Energy Intensity-Total Primary Energy Consumption per US Dollar of GDP, 2003-2009 Graph 14: Production and Export Figures of the Bauxite Sector, 2008 – 2011 (x 1000mt) Graph 15: The Generation of Energy by the Mining sector (xKwh), 2008-2011 Graph 16: Overview of Timber Export by Assortment in m3, 2008-2011 Graph 17: Fish Catches by Type of Fishery, 2008-2011 (in metric ton)
Graph 18: Planted Area and Grass Land, 2008-2010
APPENDIX References Annex 1: List of participants to the Environmental Statistics Workshop, 18 April 2012 Annex 2: List of speakers and subjects Annex 3: List of Working Groups and Subjects
22
22
25
39
44
46
48
50
53
60
65
71
Milieustatistieken Environmental Statistics
xi
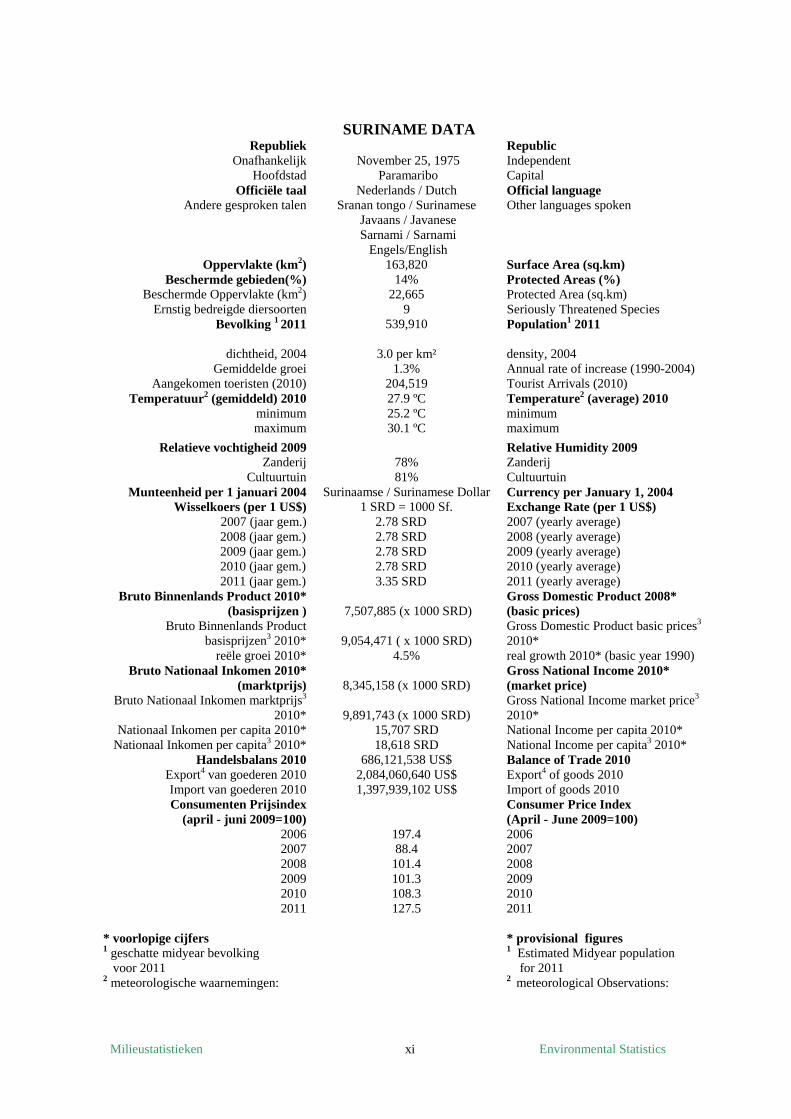
SURINAME DATA Republiek Republic
Onafhankelijk November 25, 1975 Independent Hoofdstad Paramaribo Capital
Officiële taal Nederlands / Dutch Official language Andere gesproken talen Sranan tongo / Surinamese Other languages spoken
Javaans / Javanese Sarnami / Sarnami Engels/English
Oppervlakte (km2) 163,820 Surface Area (sq.km) Beschermde gebieden(%) 14% Protected Areas (%)
Beschermde Oppervlakte (km2) 22,665 Protected Area (sq.km) Ernstig bedreigde diersoorten 9 Seriously Threatened Species
Bevolking 1 2011 539,910 Population1 2011
dichtheid, 2004 3.0 per km² density, 2004 Gemiddelde groei 1.3% Annual rate of increase (1990-2004)
Aangekomen toeristen (2010) 204,519 Tourist Arrivals (2010) Temperatuur2 (gemiddeld) 2010 27.9 ºC Temperature2 (average) 2010
minimum 25.2 ºC minimum maximum 30.1 ºC maximum
Relatieve vochtigheid 2009 Relative Humidity 2009 Zanderij 78% Zanderij
Cultuurtuin 81% Cultuurtuin Munteenheid per 1 januari 2004 Surinaamse / Surinamese Dollar Currency per January 1, 2004
Wisselkoers (per 1 US$) 1 SRD = 1000 Sf. Exchange Rate (per 1 US$) 2007 (jaar gem.) 2.78 SRD 2007 (yearly average)
2008 (jaar gem.) 2.78 SRD 2008 (yearly average) 2009 (jaar gem.) 2.78 SRD 2009 (yearly average) 2010 (jaar gem.) 2.78 SRD 2010 (yearly average) 2011 (jaar gem.) 3.35 SRD 2011 (yearly average)
Bruto Binnenlands Product 2010* (basisprijzen ) 7,507,885 (x 1000 SRD)
Gross Domestic Product 2008* (basic prices)
Bruto Binnenlands Product basisprijzen3 2010* 9,054,471 ( x 1000 SRD)
Gross Domestic Product basic prices3 2010*
reële groei 2010* 4.5% real growth 2010* (basic year 1990) Bruto Nationaal Inkomen 2010*
(marktprijs) 8,345,158 (x 1000 SRD) Gross National Income 2010* (market price)
Bruto Nationaal Inkomen marktprijs3 2010* 9,891,743 (x 1000 SRD)
Gross National Income market price3 2010*
Nationaal Inkomen per capita 2010* 15,707 SRD National Income per capita 2010* Nationaal Inkomen per capita3 2010* 18,618 SRD National Income per capita3 2010*
Handelsbalans 2010 686,121,538 US$ Balance of Trade 2010 Export4 van goederen 2010 2,084,060,640 US$ Export4 of goods 2010 Import van goederen 2010 1,397,939,102 US$ Import of goods 2010 Consumenten Prijsindex
(april - juni 2009=100) Consumer Price Index (April - June 2009=100)
2006 197.4 20062007 88.4 2007 2008 101.4 2008 2009 101.3 2009 2010 108.3 2010 2011 127.5 2011
* voorlopige cijfers * provisional figures 1 geschatte midyear bevolking voor 2011
1 Estimated Midyear population for 2011
2 meteorologische waarnemingen: 2 meteorological Observations:
Milieustatistieken Environmental Statistics
xii
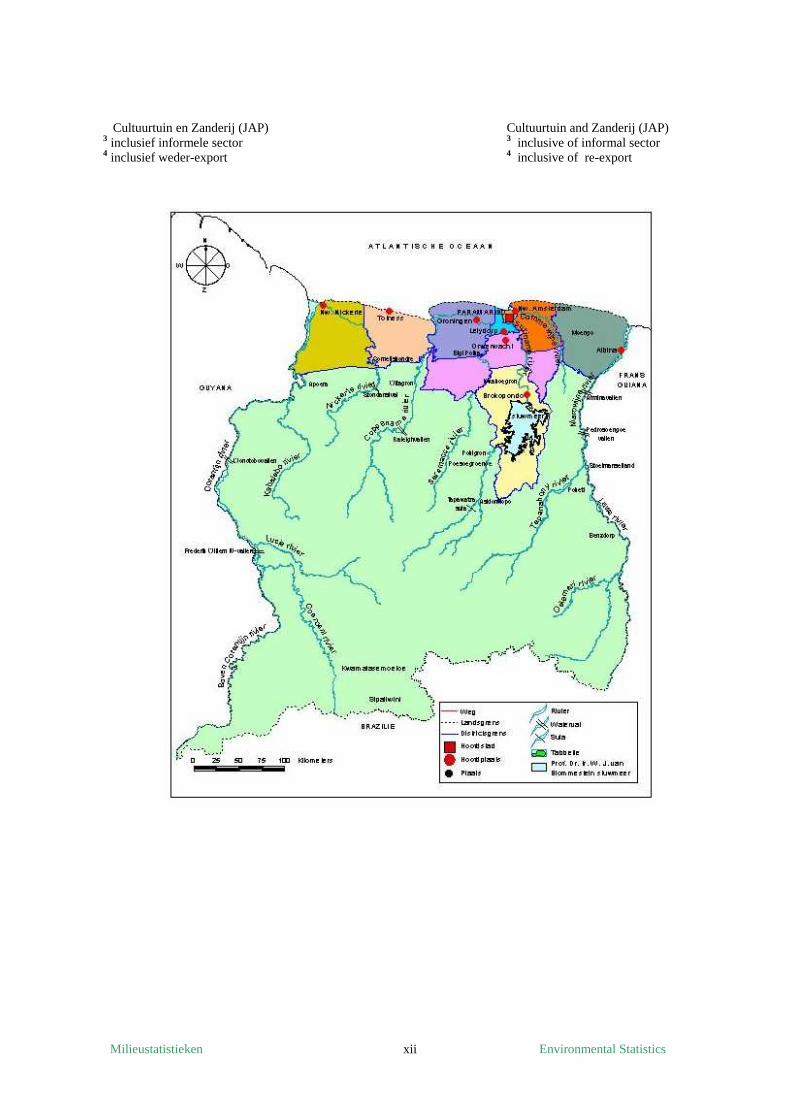
Cultuurtuin en Zanderij (JAP) Cultuurtuin and Zanderij (JAP) 3 inclusief informele sector 3 inclusive of informal sector 4 inclusief weder-export 4 inclusive of re-export
Milieustatistieken Environmental Statistics
1
INTRODUCTIE
1. Algemeen Milieustatistieken zijn belangrijk voor het verschaffen van een solide basis voor de besluitvorming, om vooruitgang te moni-toren en om publieke bewustwording m.b.t. het milieu te bevorderen. Ze hebben ook als doel te voorzien in een synthetische weergave van data, welke afkomstig is van verschillende onderwerpsgebieden en bronnen. Het is thans wereldwijd een gegeven dat de staat van het milieu van fundamenteel belang is voor het voort-bestaan van de mens. Het milieu is op hetzelfde moment onderworpen aan veranderingen, die ontstaan als gevolg van de wijze waarop menselijke activiteiten en natuurlijke gebeurtenissen van invloed zijn hierop. Milieustatistieken en indicatoren voorzien daarom in dergelijke informatie en versterken hierdoor het besluitvormings-proces dat moet waarborgen dat de huidige behoeften bevredigd worden zonder een beroep te doen op het recht van de toekomstige generatie om in hun eigen behoefte te voorzien. 2. Inhoud Elk hoofdstuk begint met een korte introductie, waarbij de milieu vraagstukken van de specifieke sector worden besproken. De informatie van elke hoofdstuk is georganiseerd (in losse delen) op basis van het “Pressure – State – Response” raamwerk; de vraagstukken in elke hoofdstuk beschrijven de druk, de invloed op het milieu en de respons. Voor de dataverzameling zijn CARICOM en UNSD richtlijnen gebruikt. Er is contact gemaakt met de relevante ministeries en instanties - waarvan verondersteld wordt dat zij bepaalde milieu sectoren bestrijken - om de benodigde data op te vragen. In vele gevallen moest er een brief verstuurd worden. Met de vergaarde informatie zijn we in staat geweest om de eerste
INTRODUCTION
1. General Environmental statistics are important to provide a sound basis for decision making, to monitor progress and to support public awareness with respect to the environment. They also aim to provide synthetic presentation of data from various subject areas and sources. It is now globally accepted that the state of the environment is of fundamental importance to human survival. At the same time, the environment is subject to changes as a result of the way that human activities and natural events impact on it. Therefore, environment statistics provide such information and enhances the policy making process that ensure that the present needs are met without compromising the ability of future generations to meet their needs. 2. Contents Each chapter begins with a brief introduction in which the environmental issues of the specific sector are explained. The information of each chapter is organized (loosely) according to the Pressure – State – Response framework; the issues in each chapter describe the pressure, the impact on the environment and the response. CARICOM and UNSD guidelines are used to collect the data. Contact was made with the relevant ministries and institutions - which are supposed to cover certain environmental areas - requesting the data that was needed. A letter had to be sent in many of the cases. With the collected information we were able to produce the first draft publication.
Milieustatistieken Environmental Statistics
2
conceptpublicatie te produceren. Dit concept is zoals gewoonlijk gepresenteerd op een milieu workshop, die door het ABS in samenwerking met CIS is georganiseerd op 18 april 2012 in hotel Torarica, Paramaribo, Suriname. Hoewel mondiale en Surinaamse milieu aangelegenheden met elkaar verbonden zijn, worden er geen mondiale vraagstukken in deze publicatie besproken. Echter kan in één of twee gevallen een commentaar of een cijfer ter vergelijking worden gegeven.
Opgemerkt zal worden dat niet alle vraagstukken ondersteund worden door relevante data. De reden is dat we niet alle gevraagde data hebben ontvangen of dat we niet in staat waren zulke data te achterhalen. Een aantal data gaps bestaan er nog en werk is in voorbereiding om enkele van deze gaps in de naaste toekomst tot het verleden te doen behoren. Wij staan open voor opbouwende kritiek en teneinde ook continuïteit hieraan te kunnen geven, hopen we dat deze publicatie gekoesterd zal worden. De beschikbare data hebben betrekking op de recentste jaren. Voor tijdreeksen hebben we geprobeerd om over de jaren 2008 t/m 2010 de data te presenteren en waar beschikbaar ook data over 2011. Voor de voorgaande jaren zie de eerste vier publicaties, namelijk “ Geselecteerde Milieustatistieken, november 2002”, “Milieustatistieken, mei 2006”, “Milieustatistieken, december 2008” en “Milieustatistieken, september 2010”. Het kan gebeuren dat de data, welke reeds gepubliceerd is in de eerste, tweede, derde en vierde publicatie niet is inbegrepen vanwege het feit dat het onveranderd is gebleven in de afgelopen jaren. Echter is het niet altijd mogelijk geweest om te voorzien in data voor hetzelfde jaar in alle tabellen van samenhangend belang.
This draft is as usual presented at an environment workshop organized on the 18th of April 2012 in close collaboration with CIS in Hotel Torarica, Paramaribo, Suriname. While global environmental concerns and Suriname concerns are interrelated, no attempts are made in this publication to cover global issues. However, in one or two cases, a comment or a figure for comparison may be given.
It will be observed that not all the issues are supported by relevant data. The reason is usually that we have not received all the data requested or been able to locate any such data. A number of data gaps still exist and work is in progress to fill some of the gaps in the near future. We are open for constructive criticism and to be able to give continuity we hope that this publication will be cherished.
The available data refer to the latest available years. For time series, we have tried to give data for the years 2008 up to 2010 and where available also for 2011. For previous years see the first four publications, namely “Selected Environmental Statistics, November 2002”, “Environmental Statistics, May 2006” “Environmental Statistics, December 2008” and “Environmental Statistics, September 2010”. It may happen that data which were already published in the first, second, third and fourth publication are not incorporated because of the fact that they did not change in the past years. However, it has not always been possible to provide data for the same year in all the tables of related interest.
Milieustatistieken Environmental Statistics
3
Tabellen en grafieken worden opeenvolgend genummerd, zodat elk nummer maar een keer voorkomt. Additionele data vindt u soms ook in de tekst. De data beslaat de belangrijkste sectoren die van invloed kunnen zijn op het milieu in Suriname, namelijk: Demografische en Socio-economische achtergrond, Klimaat en Lucht, Toerisme, Transport, Milieu en Gezondheid en Afval, Zoetwater, Energie en Mineralen, Bosbouw, Hulpbronnen van het kustgebied, Landgebruik en Landbouw en Biodiversiteit.
Tables and graphs are numbered consecutively, so that every number only appears once. Additional data are also sometimes found in the text. The data cover the main sectors that can have an impact on the environment in Suriname, namely: Demographic and Socio-economic Background, Climate and Air, Tourism, Transport, Environmental Health and Waste, Fresh Water, Energy and Minerals, Forestry, Coastal and Marine Resources, Land Use and Agriculture, and Biodiversity.
Milieustatistieken Environmental Statistics
4
DEMOGRAFISCHE EN SOCIO- ECONOMISCHE ACHTERGROND/ DEMOGRAPHIC AND SOCIO- ECONOMIC BACKGROUND
Bevolking / Population
Woonverblijven/ Dwellings
Huishoudens/ Households
Bruto Binnenlands Product/ Gross Domestic Product
Milieustatistieken Environmental Statistics
5
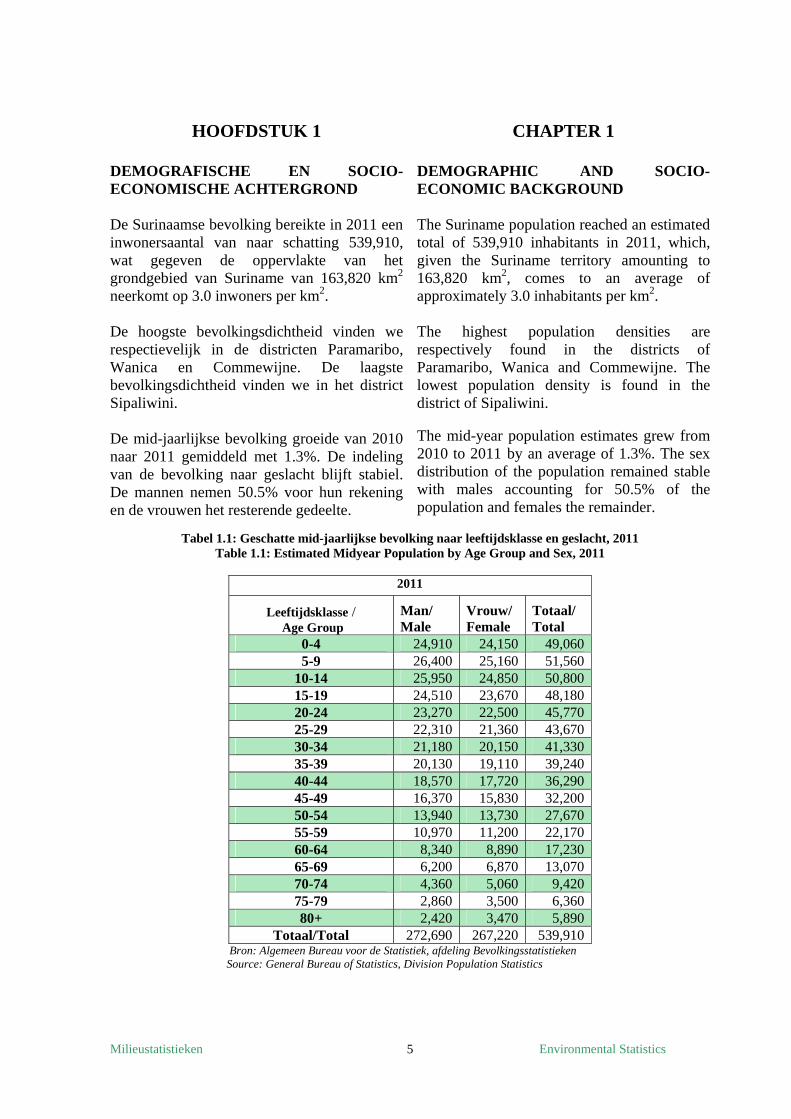
HOOFDSTUK 1 DEMOGRAFISCHE EN SOCIO- ECONOMISCHE ACHTERGROND De Surinaamse bevolking bereikte in 2011 een inwonersaantal van naar schatting 539,910, wat gegeven de oppervlakte van het grondgebied van Suriname van 163,820 km2 neerkomt op 3.0 inwoners per km2. De hoogste bevolkingsdichtheid vinden we respectievelijk in de districten Paramaribo, Wanica en Commewijne. De laagste bevolkingsdichtheid vinden we in het district Sipaliwini. De mid-jaarlijkse bevolking groeide van 2010 naar 2011 gemiddeld met 1.3%. De indeling van de bevolking naar geslacht blijft stabiel. De mannen nemen 50.5% voor hun rekening en de vrouwen het resterende gedeelte.
CHAPTER 1 DEMOGRAPHIC AND SOCIO- ECONOMIC BACKGROUND The Suriname population reached an estimated total of 539,910 inhabitants in 2011, which, given the Suriname territory amounting to 163,820 km2, comes to an average of approximately 3.0 inhabitants per km2. The highest population densities are respectively found in the districts of Paramaribo, Wanica and Commewijne. The lowest population density is found in the district of Sipaliwini.
The mid-year population estimates grew from 2010 to 2011 by an average of 1.3%. The sex distribution of the population remained stable with males accounting for 50.5% of the population and females the remainder.
Tabel 1.1: Geschatte mid-jaarlijkse bevolking naar leeftijdsklasse en geslacht, 2011 Table 1.1: Estimated Midyear Population by Age Group and Sex, 2011
2011
Leeftijdsklasse / Age Group
Man/ Male
Vrouw/ Female
Totaal/ Total
0-4 24,910 24,150 49,060 5-9 26,400 25,160 51,560
10-14 25,950 24,850 50,800 15-19 24,510 23,670 48,180 20-24 23,270 22,500 45,770 25-29 22,310 21,360 43,670 30-34 21,180 20,150 41,330 35-39 20,130 19,110 39,240 40-44 18,570 17,720 36,290 45-49 16,370 15,830 32,200 50-54 13,940 13,730 27,670 55-59 10,970 11,200 22,170 60-64 8,340 8,890 17,230 65-69 6,200 6,870 13,070 70-74 4,360 5,060 9,420 75-79 2,860 3,500 6,360 80+ 2,420 3,470 5,890
Totaal/Total 272,690 267,220 539,910 Bron: Algemeen Bureau voor de Statistiek, afdeling Bevolkingsstatistieken
Source: General Bureau of Statistics, Division Population Statistics
Milieustatistieken Environmental Statistics
6
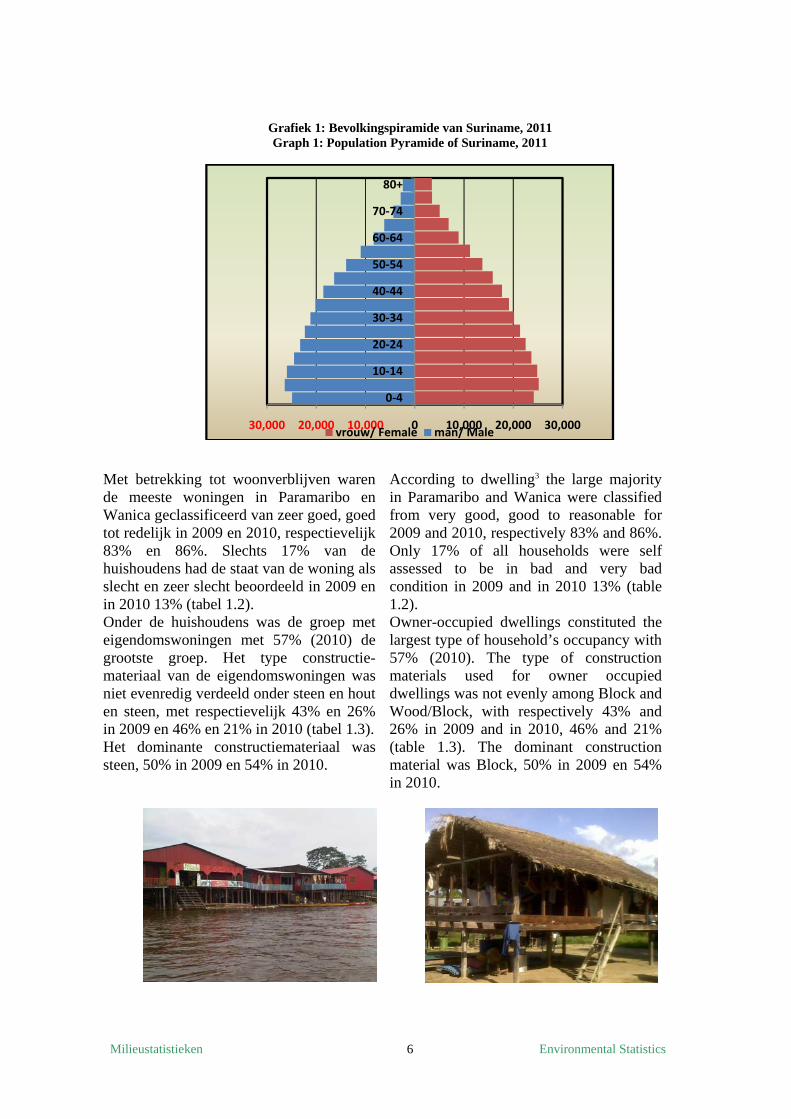
Grafiek 1: Bevolkingspiramide van Suriname, 2011 Graph 1: Population Pyramide of Suriname, 2011
Met betrekking tot woonverblijven waren de meeste woningen in Paramaribo en Wanica geclassificeerd van zeer goed, goed tot redelijk in 2009 en 2010, respectievelijk 83% en 86%. Slechts 17% van de huishoudens had de staat van de woning als slecht en zeer slecht beoordeeld in 2009 en in 2010 13% (tabel 1.2). Onder de huishoudens was de groep met eigendomswoningen met 57% (2010) de grootste groep. Het type constructie-materiaal van de eigendomswoningen was niet evenredig verdeeld onder steen en hout en steen, met respectievelijk 43% en 26% in 2009 en 46% en 21% in 2010 (tabel 1.3). Het dominante constructiemateriaal was steen, 50% in 2009 en 54% in 2010.
According to dwelling3 the large majority in Paramaribo and Wanica were classified from very good, good to reasonable for 2009 and 2010, respectively 83% and 86%. Only 17% of all households were self assessed to be in bad and very bad condition in 2009 and in 2010 13% (table 1.2). Owner-occupied dwellings constituted the largest type of household’s occupancy with 57% (2010). The type of construction materials used for owner occupied dwellings was not evenly among Block and Wood/Block, with respectively 43% and 26% in 2009 and in 2010, 46% and 21% (table 1.3). The dominant construction material was Block, 50% in 2009 en 54% in 2010.
30,000 20,000 10,000 0 10,000 20,000 30,000
0‐4
10‐14
20‐24
30‐34
40‐44
50‐54
60‐64
70‐74
80+
vrouw/ Female man/ Male
Milieustatistieken Environmental Statistics
7
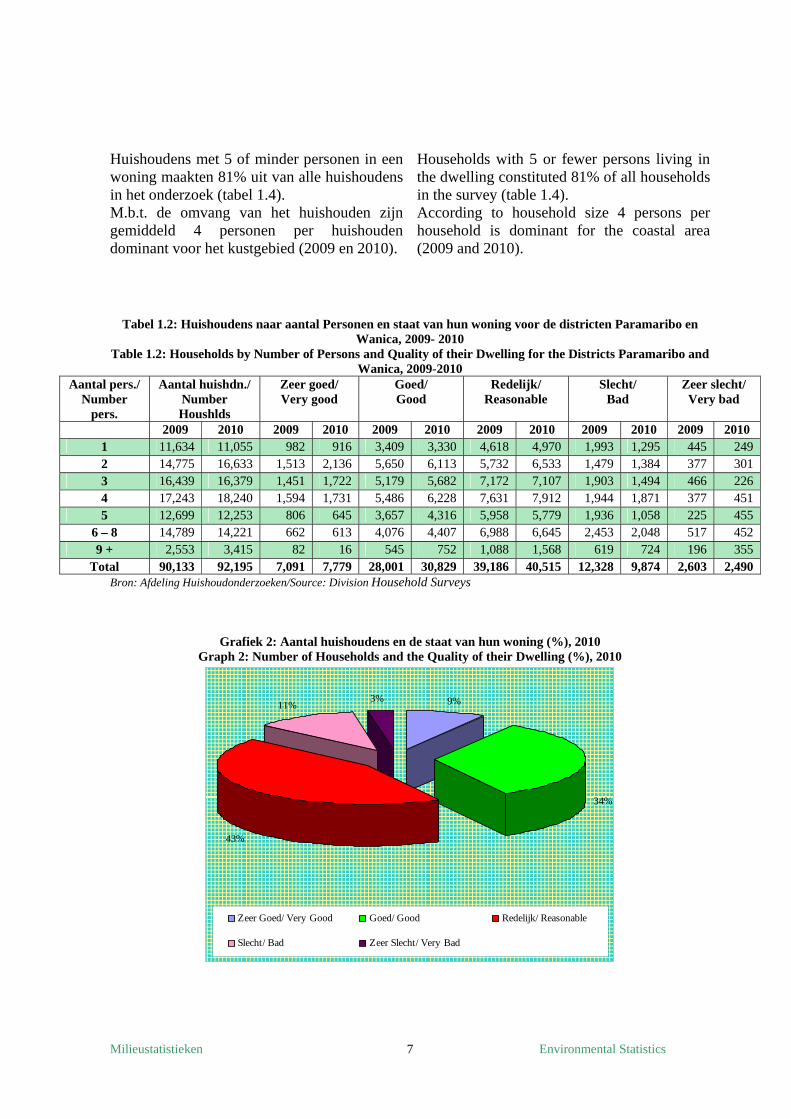
Huishoudens met 5 of minder personen in een woning maakten 81% uit van alle huishoudens in het onderzoek (tabel 1.4). M.b.t. de omvang van het huishouden zijn gemiddeld 4 personen per huishouden dominant voor het kustgebied (2009 en 2010).
Households with 5 or fewer persons living in the dwelling constituted 81% of all households in the survey (table 1.4). According to household size 4 persons per household is dominant for the coastal area (2009 and 2010).
Tabel 1.2: Huishoudens naar aantal Personen en staat van hun woning voor de districten Paramaribo en Wanica, 2009- 2010
Table 1.2: Households by Number of Persons and Quality of their Dwelling for the Districts Paramaribo and Wanica, 2009-2010
Aantal pers./ Number
pers.
Aantal huishdn./ Number Houshlds
Zeer goed/ Very good
Goed/ Good
Redelijk/ Reasonable
Slecht/ Bad
Zeer slecht/ Very bad
2009 2010 2009 2010 2009 2010 2009 2010 2009 2010 2009 2010 1 11,634 11,055 982 916 3,409 3,330 4,618 4,970 1,993 1,295 445 249 2 14,775 16,633 1,513 2,136 5,650 6,113 5,732 6,533 1,479 1,384 377 301 3 16,439 16,379 1,451 1,722 5,179 5,682 7,172 7,107 1,903 1,494 466 226 4 17,243 18,240 1,594 1,731 5,486 6,228 7,631 7,912 1,944 1,871 377 451 5 12,699 12,253 806 645 3,657 4,316 5,958 5,779 1,936 1,058 225 455
6 – 8 14,789 14,221 662 613 4,076 4,407 6,988 6,645 2,453 2,048 517 452 9 + 2,553 3,415 82 16 545 752 1,088 1,568 619 724 196 355
Total 90,133 92,195 7,091 7,779 28,001 30,829 39,186 40,515 12,328 9,874 2,603 2,490 Bron: Afdeling Huishoudonderzoeken/Source: Division Household Surveys
Grafiek 2: Aantal huishoudens en de staat van hun woning (%), 2010 Graph 2: Number of Households and the Quality of their Dwelling (%), 2010
9%
34%
43%
11%3%
Zeer Goed/ Very Good Goed/ Good Redelijk/ Reasonable
Slecht/ Bad Zeer Slecht/ Very Bad
Milieustatistieken Environmental Statistics
8
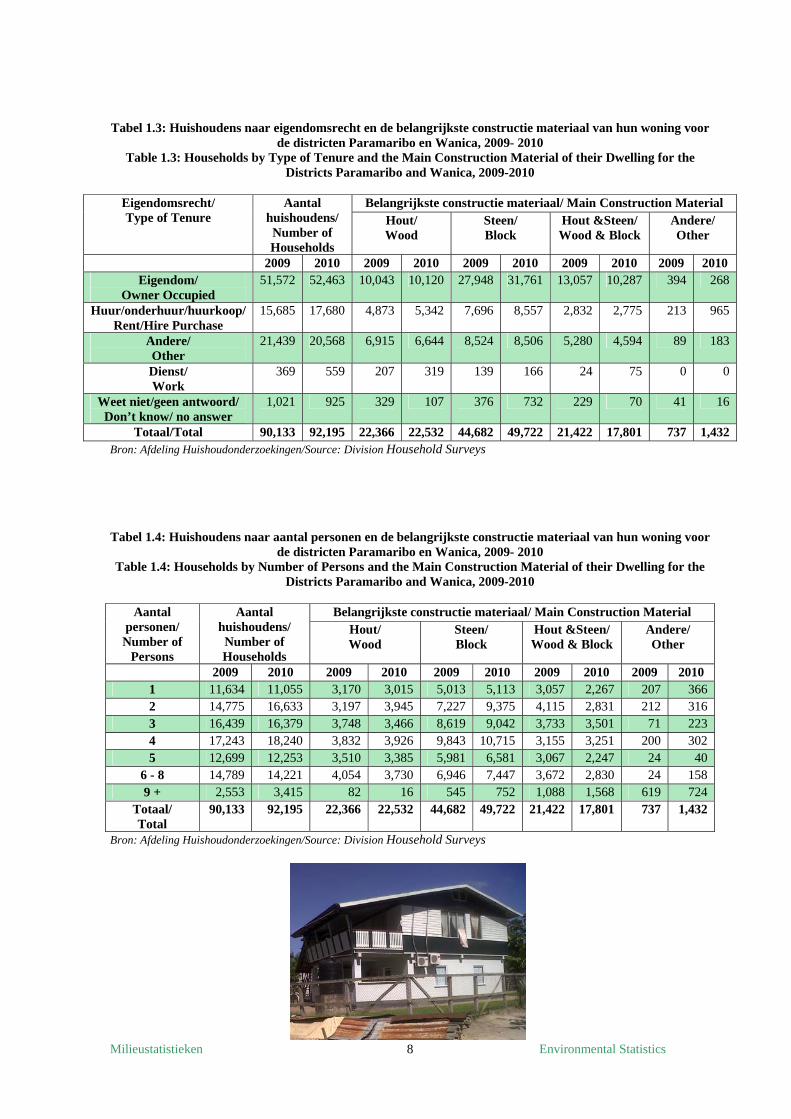
Tabel 1.3: Huishoudens naar eigendomsrecht en de belangrijkste constructie materiaal van hun woning voor de districten Paramaribo en Wanica, 2009- 2010
Table 1.3: Households by Type of Tenure and the Main Construction Material of their Dwelling for the Districts Paramaribo and Wanica, 2009-2010
Eigendomsrecht/ Type of Tenure
Aantal huishoudens/ Number of Households
Belangrijkste constructie materiaal/ Main Construction Material Hout/ Wood
Steen/ Block
Hout &Steen/ Wood & Block
Andere/ Other
2009 2010 2009 2010 2009 2010 2009 2010 2009 2010 Eigendom/
Owner Occupied 51,572 52,463 10,043 10,120 27,948 31,761 13,057 10,287 394 268
Huur/onderhuur/huurkoop/ Rent/Hire Purchase
15,685 17,680 4,873 5,342 7,696 8,557 2,832 2,775 213 965
Andere/ Other
21,439 20,568 6,915 6,644 8,524 8,506 5,280 4,594 89 183
Dienst/ Work
369 559 207 319 139 166 24 75 0 0
Weet niet/geen antwoord/ Don’t know/ no answer
1,021 925 329 107 376 732 229 70 41 16
Totaal/Total 90,133 92,195 22,366 22,532 44,682 49,722 21,422 17,801 737 1,432 Bron: Afdeling Huishoudonderzoekingen/Source: Division Household Surveys
Tabel 1.4: Huishoudens naar aantal personen en de belangrijkste constructie materiaal van hun woning voor
de districten Paramaribo en Wanica, 2009- 2010 Table 1.4: Households by Number of Persons and the Main Construction Material of their Dwelling for the
Districts Paramaribo and Wanica, 2009-2010
Aantal personen/ Number of
Persons
Aantal huishoudens/ Number of Households
Belangrijkste constructie materiaal/ Main Construction Material Hout/ Wood
Steen/ Block
Hout &Steen/ Wood & Block
Andere/ Other
2009 2010 2009 2010 2009 2010 2009 2010 2009 2010 1 11,634 11,055 3,170 3,015 5,013 5,113 3,057 2,267 207 366 2 14,775 16,633 3,197 3,945 7,227 9,375 4,115 2,831 212 316 3 16,439 16,379 3,748 3,466 8,619 9,042 3,733 3,501 71 223 4 17,243 18,240 3,832 3,926 9,843 10,715 3,155 3,251 200 302 5 12,699 12,253 3,510 3,385 5,981 6,581 3,067 2,247 24 40
6 - 8 14,789 14,221 4,054 3,730 6,946 7,447 3,672 2,830 24 158 9 + 2,553 3,415 82 16 545 752 1,088 1,568 619 724
Totaal/ Total
90,133 92,195 22,366 22,532 44,682 49,722 21,422 17,801 737 1,432
Bron: Afdeling Huishoudonderzoekingen/Source: Division Household Surveys
Milieustatistieken Environmental Statistics
9
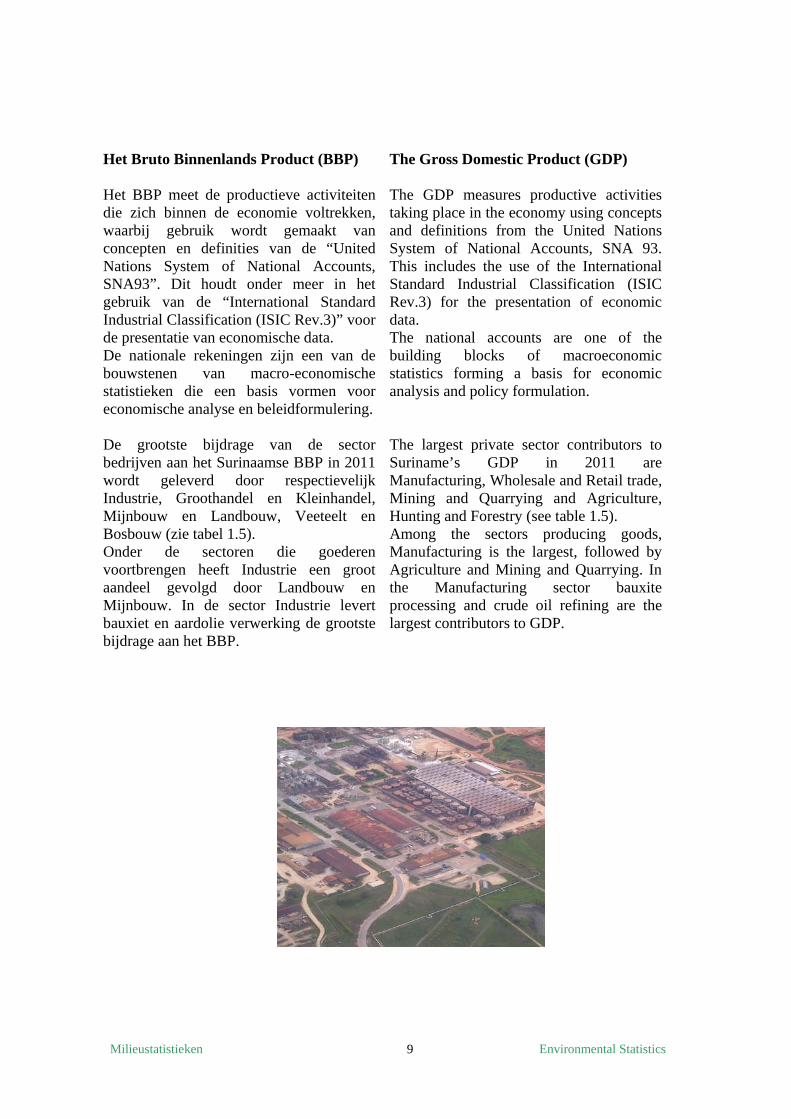
Het Bruto Binnenlands Product (BBP) Het BBP meet de productieve activiteiten die zich binnen de economie voltrekken, waarbij gebruik wordt gemaakt van concepten en definities van de “United Nations System of National Accounts, SNA93”. Dit houdt onder meer in het gebruik van de “International Standard Industrial Classification (ISIC Rev.3)” voor de presentatie van economische data. De nationale rekeningen zijn een van de bouwstenen van macro-economische statistieken die een basis vormen voor economische analyse en beleidformulering. De grootste bijdrage van de sector bedrijven aan het Surinaamse BBP in 2011 wordt geleverd door respectievelijk Industrie, Groothandel en Kleinhandel, Mijnbouw en Landbouw, Veeteelt en Bosbouw (zie tabel 1.5). Onder de sectoren die goederen voortbrengen heeft Industrie een groot aandeel gevolgd door Landbouw en Mijnbouw. In de sector Industrie levert bauxiet en aardolie verwerking de grootste bijdrage aan het BBP.
The Gross Domestic Product (GDP) The GDP measures productive activities taking place in the economy using concepts and definitions from the United Nations System of National Accounts, SNA 93. This includes the use of the International Standard Industrial Classification (ISIC Rev.3) for the presentation of economic data. The national accounts are one of the building blocks of macroeconomic statistics forming a basis for economic analysis and policy formulation. The largest private sector contributors to Suriname’s GDP in 2011 are Manufacturing, Wholesale and Retail trade, Mining and Quarrying and Agriculture, Hunting and Forestry (see table 1.5). Among the sectors producing goods, Manufacturing is the largest, followed by Agriculture and Mining and Quarrying. In the Manufacturing sector bauxite processing and crude oil refining are the largest contributors to GDP.
Milieustatistieken Environmental Statistics
10
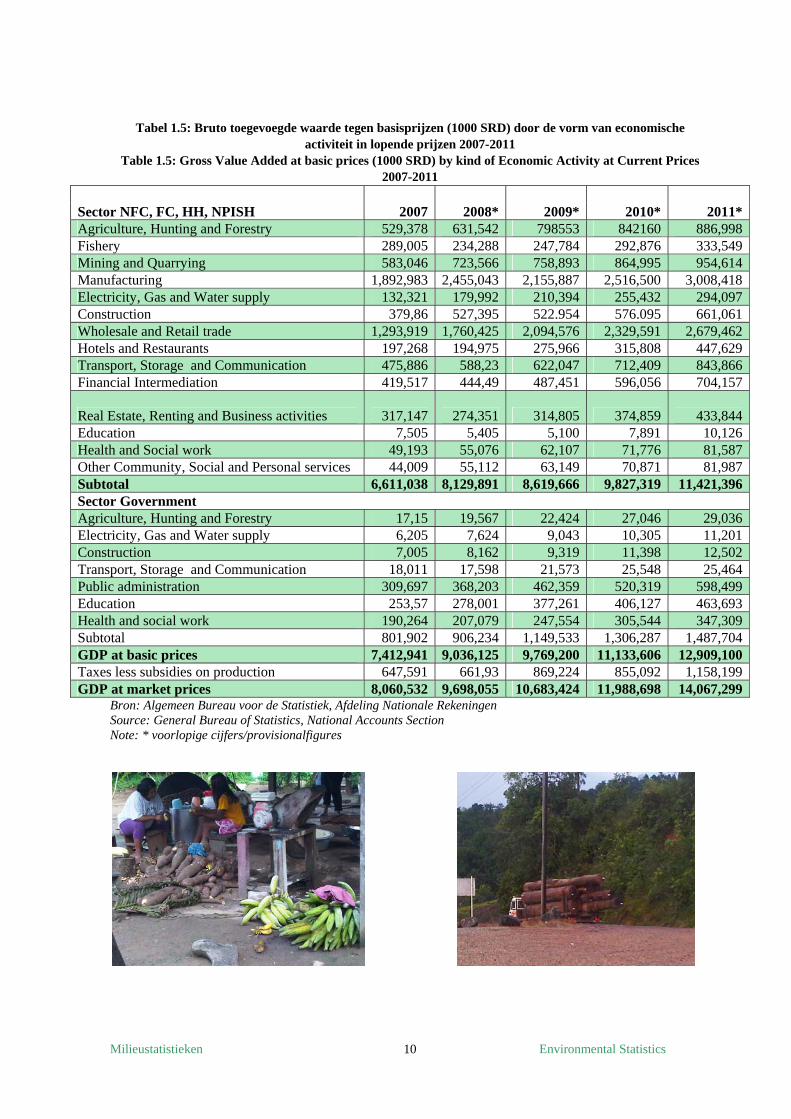
Tabel 1.5: Bruto toegevoegde waarde tegen basisprijzen (1000 SRD) door de vorm van economische activiteit in lopende prijzen 2007-2011
Table 1.5: Gross Value Added at basic prices (1000 SRD) by kind of Economic Activity at Current Prices 2007-2011
Sector NFC, FC, HH, NPISH 2007 2008* 2009* 2010*
2011*Agriculture, Hunting and Forestry 529,378 631,542 798553 842160 886,998Fishery 289,005 234,288 247,784 292,876 333,549Mining and Quarrying 583,046 723,566 758,893 864,995 954,614Manufacturing 1,892,983 2,455,043 2,155,887 2,516,500 3,008,418Electricity, Gas and Water supply 132,321 179,992 210,394 255,432 294,097Construction 379,86 527,395 522.954 576.095 661,061Wholesale and Retail trade 1,293,919 1,760,425 2,094,576 2,329,591 2,679,462Hotels and Restaurants 197,268 194,975 275,966 315,808 447,629Transport, Storage and Communication 475,886 588,23 622,047 712,409 843,866Financial Intermediation 419,517 444,49 487,451 596,056 704,157
Real Estate, Renting and Business activities 317,147 274,351 314,805 374,859
433,844Education 7,505 5,405 5,100 7,891 10,126Health and Social work 49,193 55,076 62,107 71,776 81,587Other Community, Social and Personal services 44,009 55,112 63,149 70,871 81,987Subtotal 6,611,038 8,129,891 8,619,666 9,827,319 11,421,396Sector Government Agriculture, Hunting and Forestry 17,15 19,567 22,424 27,046 29,036Electricity, Gas and Water supply 6,205 7,624 9,043 10,305 11,201Construction 7,005 8,162 9,319 11,398 12,502Transport, Storage and Communication 18,011 17,598 21,573 25,548 25,464Public administration 309,697 368,203 462,359 520,319 598,499Education 253,57 278,001 377,261 406,127 463,693Health and social work 190,264 207,079 247,554 305,544 347,309Subtotal 801,902 906,234 1,149,533 1,306,287 1,487,704GDP at basic prices 7,412,941 9,036,125 9,769,200 11,133,606 12,909,100Taxes less subsidies on production 647,591 661,93 869,224 855,092 1,158,199GDP at market prices 8,060,532 9,698,055 10,683,424 11,988,698 14,067,299
Bron: Algemeen Bureau voor de Statistiek, Afdeling Nationale Rekeningen Source: General Bureau of Statistics, National Accounts Section Note: * voorlopige cijfers/provisionalfigures
Milieustatistieken Environmental Statistics
11
KLIMAAT EN LUCHT / CLIMATE AND AIR
Neerslag/ Precipitation
Temperatuur/
Temperature
Vochtigheid/ Humidity
Windsnelheid/
Wind force
Milieustatistieken Environmental Statistics
12
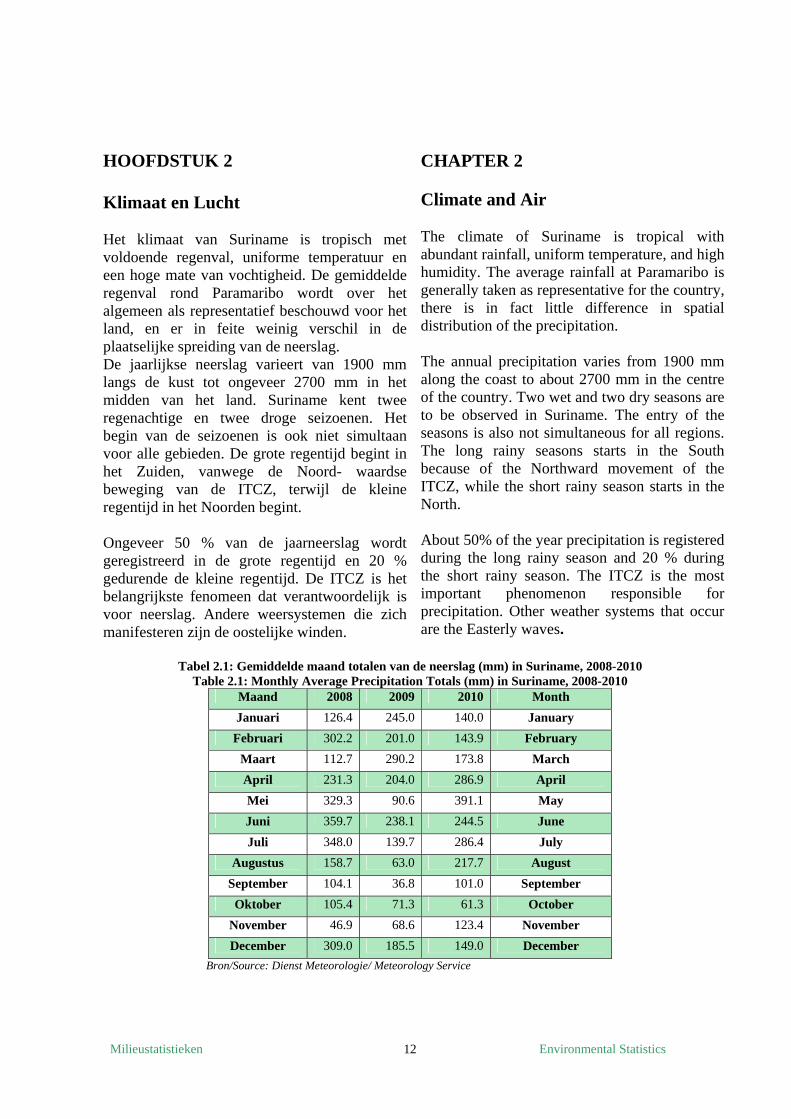
HOOFDSTUK 2 Klimaat en Lucht Het klimaat van Suriname is tropisch met voldoende regenval, uniforme temperatuur en een hoge mate van vochtigheid. De gemiddelde regenval rond Paramaribo wordt over het algemeen als representatief beschouwd voor het land, en er in feite weinig verschil in de plaatselijke spreiding van de neerslag. De jaarlijkse neerslag varieert van 1900 mm langs de kust tot ongeveer 2700 mm in het midden van het land. Suriname kent twee regenachtige en twee droge seizoenen. Het begin van de seizoenen is ook niet simultaan voor alle gebieden. De grote regentijd begint in het Zuiden, vanwege de Noord- waardse beweging van de ITCZ, terwijl de kleine regentijd in het Noorden begint. Ongeveer 50 % van de jaarneerslag wordt geregistreerd in de grote regentijd en 20 % gedurende de kleine regentijd. De ITCZ is het belangrijkste fenomeen dat verantwoordelijk is voor neerslag. Andere weersystemen die zich manifesteren zijn de oostelijke winden.
CHAPTER 2 Climate and Air The climate of Suriname is tropical with abundant rainfall, uniform temperature, and high humidity. The average rainfall at Paramaribo is generally taken as representative for the country, there is in fact little difference in spatial distribution of the precipitation. The annual precipitation varies from 1900 mm along the coast to about 2700 mm in the centre of the country. Two wet and two dry seasons are to be observed in Suriname. The entry of the seasons is also not simultaneous for all regions. The long rainy seasons starts in the South because of the Northward movement of the ITCZ, while the short rainy season starts in the North. About 50% of the year precipitation is registered during the long rainy season and 20 % during the short rainy season. The ITCZ is the most important phenomenon responsible for precipitation. Other weather systems that occur are the Easterly waves.
Tabel 2.1: Gemiddelde maand totalen van de neerslag (mm) in Suriname, 2008-2010 Table 2.1: Monthly Average Precipitation Totals (mm) in Suriname, 2008-2010
Bron/Source: Dienst Meteorologie/ Meteorology Service
Maand 2008 2009 2010 Month
Januari 126.4 245.0 140.0 January
Februari 302.2 201.0 143.9 February
Maart 112.7 290.2 173.8 March
April 231.3 204.0 286.9 April
Mei 329.3 90.6 391.1 May
Juni 359.7 238.1 244.5 June
Juli 348.0 139.7 286.4 July
Augustus 158.7 63.0 217.7 August
September 104.1 36.8 101.0 September
Oktober 105.4 71.3 61.3 October
November 46.9 68.6 123.4 November
December 309.0 185.5 149.0 December
Milieustatistieken Environmental Statistics
13
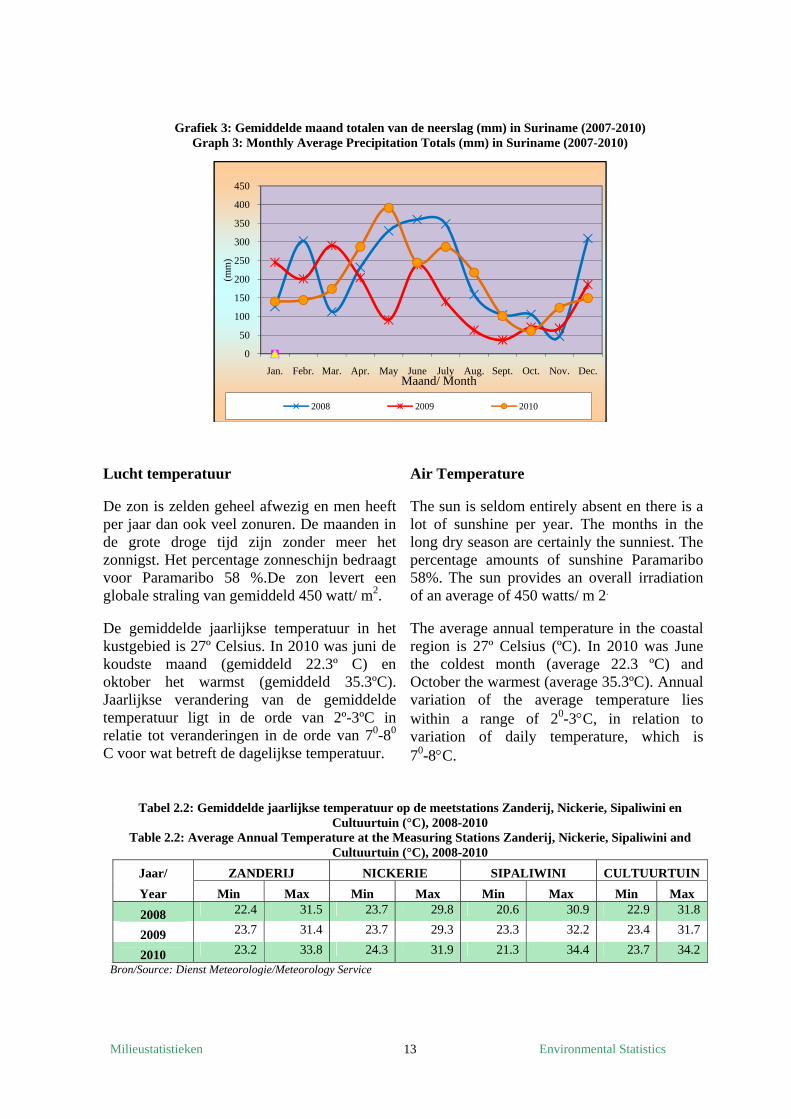
Grafiek 3: Gemiddelde maand totalen van de neerslag (mm) in Suriname (2007-2010) Graph 3: Monthly Average Precipitation Totals (mm) in Suriname (2007-2010)
Lucht temperatuur De zon is zelden geheel afwezig en men heeft per jaar dan ook veel zonuren. De maanden in de grote droge tijd zijn zonder meer het zonnigst. Het percentage zonneschijn bedraagt voor Paramaribo 58 %.De zon levert een globale straling van gemiddeld 450 watt/ m2. De gemiddelde jaarlijkse temperatuur in het kustgebied is 27º Celsius. In 2010 was juni de koudste maand (gemiddeld 22.3º C) en oktober het warmst (gemiddeld 35.3ºC). Jaarlijkse verandering van de gemiddelde temperatuur ligt in de orde van 2º-3ºC in relatie tot veranderingen in de orde van 70-80 C voor wat betreft de dagelijkse temperatuur.
Air Temperature The sun is seldom entirely absent en there is a lot of sunshine per year. The months in the long dry season are certainly the sunniest. The percentage amounts of sunshine Paramaribo 58%. The sun provides an overall irradiation of an average of 450 watts/ m 2. The average annual temperature in the coastal region is 27º Celsius (ºC). In 2010 was June the coldest month (average 22.3 ºC) and October the warmest (average 35.3ºC). Annual variation of the average temperature lies within a range of 20-3C, in relation to variation of daily temperature, which is 70-8C.
Tabel 2.2: Gemiddelde jaarlijkse temperatuur op de meetstations Zanderij, Nickerie, Sipaliwini en
Cultuurtuin (°C), 2008-2010 Table 2.2: Average Annual Temperature at the Measuring Stations Zanderij, Nickerie, Sipaliwini and
Cultuurtuin (°C), 2008-2010
Jaar/ ZANDERIJ NICKERIE SIPALIWINI CULTUURTUIN
Year Min Max Min Max Min Max Min Max
2008 22.4 31.5 23.7 29.8 20.6 30.9 22.9 31.8
2009 23.7 31.4 23.7 29.3 23.3 32.2 23.4 31.7
2010 23.2 33.8 24.3 31.9 21.3 34.4 23.7 34.2
Bron/Source: Dienst Meteorologie/Meteorology Service
0
50
100
150
200
250
300
350
400
450
Jan. Febr. Mar. Apr. May June July Aug. Sept. Oct. Nov. Dec.
(mm
)
Maand/ Month
2008 2009 2010
Milieustatistieken Environmental Statistics
14
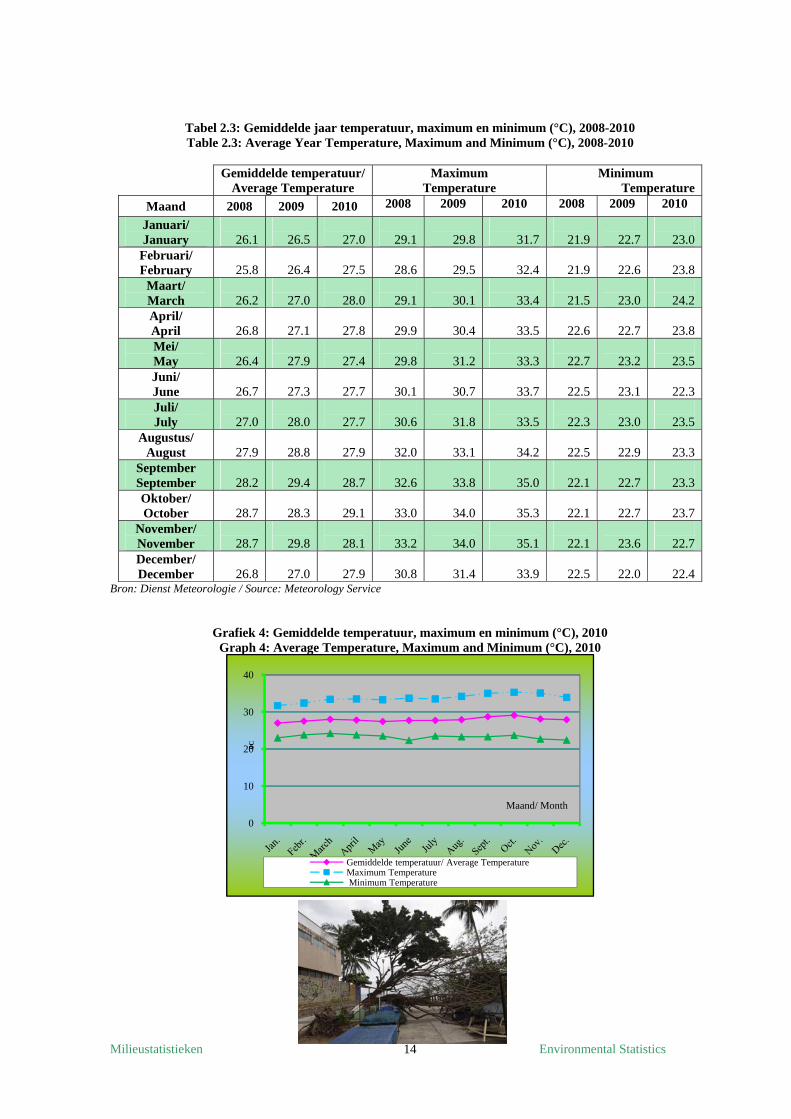
Tabel 2.3: Gemiddelde jaar temperatuur, maximum en minimum (°C), 2008-2010 Table 2.3: Average Year Temperature, Maximum and Minimum (°C), 2008-2010
Gemiddelde temperatuur/
Average Temperature Maximum
Temperature Minimum
Temperature
Maand 2008 2009 2010 2008 2009 2010 2008 2009 2010
Januari/ January
26.1
26.5
27.0
29.1
29.8
31.7
21.9
22.7
23.0
Februari/ February
25.8
26.4
27.5
28.6
29.5
32.4
21.9
22.6
23.8
Maart/ March
26.2
27.0
28.0
29.1
30.1
33.4
21.5
23.0
24.2
April/ April
26.8
27.1
27.8
29.9
30.4
33.5
22.6
22.7
23.8
Mei/ May
26.4
27.9
27.4
29.8
31.2
33.3
22.7
23.2
23.5
Juni/ June
26.7
27.3
27.7
30.1
30.7
33.7
22.5
23.1
22.3
Juli/ July
27.0
28.0
27.7
30.6
31.8
33.5
22.3
23.0
23.5
Augustus/ August
27.9
28.8
27.9
32.0
33.1
34.2
22.5
22.9
23.3
September September
28.2
29.4
28.7
32.6
33.8
35.0
22.1
22.7
23.3
Oktober/ October
28.7
28.3
29.1
33.0
34.0
35.3
22.1
22.7
23.7
November/ November
28.7
29.8
28.1
33.2
34.0
35.1
22.1
23.6
22.7
December/ December
26.8
27.0
27.9
30.8
31.4
33.9
22.5
22.0
22.4
Bron: Dienst Meteorologie / Source: Meteorology Service
Grafiek 4: Gemiddelde temperatuur, maximum en minimum (°C), 2010 Graph 4: Average Temperature, Maximum and Minimum (°C), 2010
0
10
20
30
40
0C
Maand/ Month
Gemiddelde temperatuur/ Average Temperature Maximum Temperature Minimum Temperature
Milieustatistieken Environmental Statistics
15
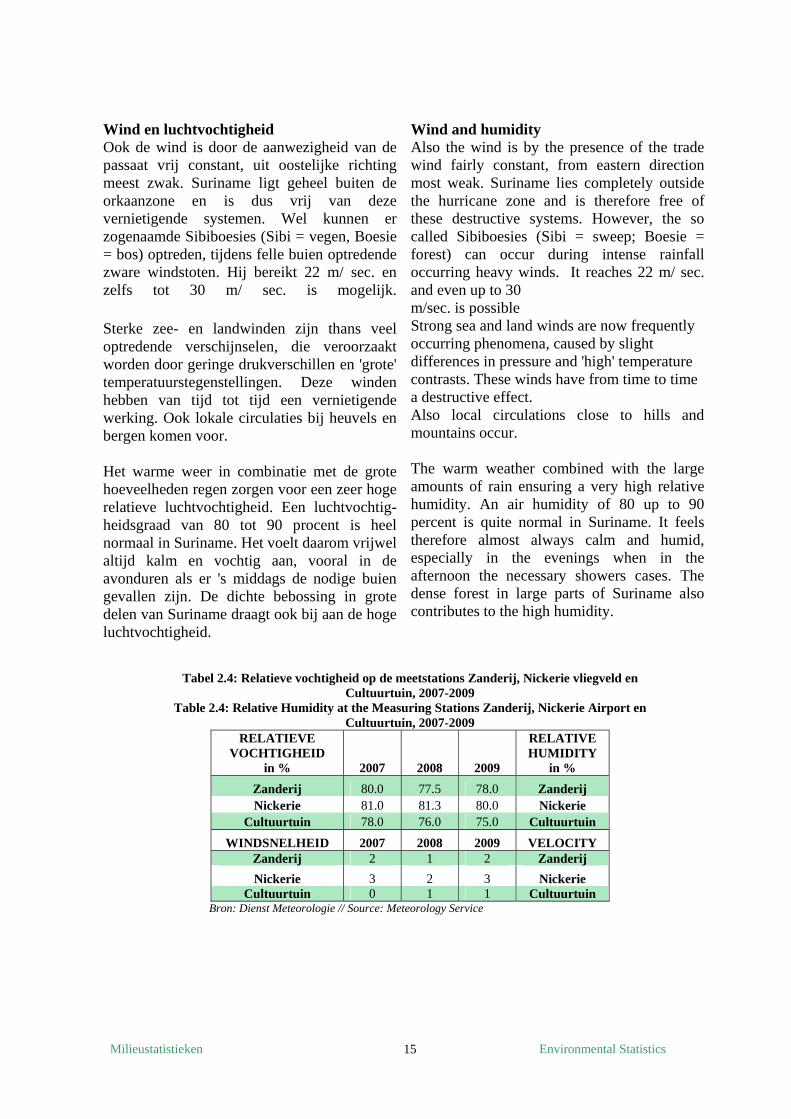
Wind en luchtvochtigheid Ook de wind is door de aanwezigheid van de passaat vrij constant, uit oostelijke richting meest zwak. Suriname ligt geheel buiten de orkaanzone en is dus vrij van deze vernietigende systemen. Wel kunnen er zogenaamde Sibiboesies (Sibi = vegen, Boesie = bos) optreden, tijdens felle buien optredende zware windstoten. Hij bereikt 22 m/ sec. en zelfs tot 30 m/ sec. is mogelijk. Sterke zee- en landwinden zijn thans veel optredende verschijnselen, die veroorzaakt worden door geringe drukverschillen en 'grote' temperatuurstegenstellingen. Deze winden hebben van tijd tot tijd een vernietigende werking. Ook lokale circulaties bij heuvels en bergen komen voor. Het warme weer in combinatie met de grote hoeveelheden regen zorgen voor een zeer hoge relatieve luchtvochtigheid. Een luchtvochtig-heidsgraad van 80 tot 90 procent is heel normaal in Suriname. Het voelt daarom vrijwel altijd kalm en vochtig aan, vooral in de avonduren als er 's middags de nodige buien gevallen zijn. De dichte bebossing in grote delen van Suriname draagt ook bij aan de hoge luchtvochtigheid.
Wind and humidity Also the wind is by the presence of the trade wind fairly constant, from eastern direction most weak. Suriname lies completely outside the hurricane zone and is therefore free of these destructive systems. However, the so called Sibiboesies (Sibi = sweep; Boesie = forest) can occur during intense rainfall occurring heavy winds. It reaches 22 m/ sec. and even up to 30 m/sec. is possible Strong sea and land winds are now frequently occurring phenomena, caused by slight differences in pressure and 'high' temperature contrasts. These winds have from time to time a destructive effect. Also local circulations close to hills and mountains occur. The warm weather combined with the large amounts of rain ensuring a very high relative humidity. An air humidity of 80 up to 90 percent is quite normal in Suriname. It feels therefore almost always calm and humid, especially in the evenings when in the afternoon the necessary showers cases. The dense forest in large parts of Suriname also contributes to the high humidity.
Tabel 2.4: Relatieve vochtigheid op de meetstations Zanderij, Nickerie vliegveld en Cultuurtuin, 2007-2009
Table 2.4: Relative Humidity at the Measuring Stations Zanderij, Nickerie Airport en Cultuurtuin, 2007-2009
RELATIEVE VOCHTIGHEID
in % 2007 2008 2009
RELATIVE HUMIDITY
in %
Zanderij 80.0 77.5 78.0 Zanderij Nickerie 81.0 81.3 80.0 Nickerie
Cultuurtuin 78.0 76.0 75.0 Cultuurtuin
WINDSNELHEID 2007 2008 2009 VELOCITY Zanderij 2 1 2 Zanderij
Nickerie 3 2 3 Nickerie Cultuurtuin 0 1 1 Cultuurtuin
Bron: Dienst Meteorologie // Source: Meteorology Service
Milieustatistieken Environmental Statistics
16
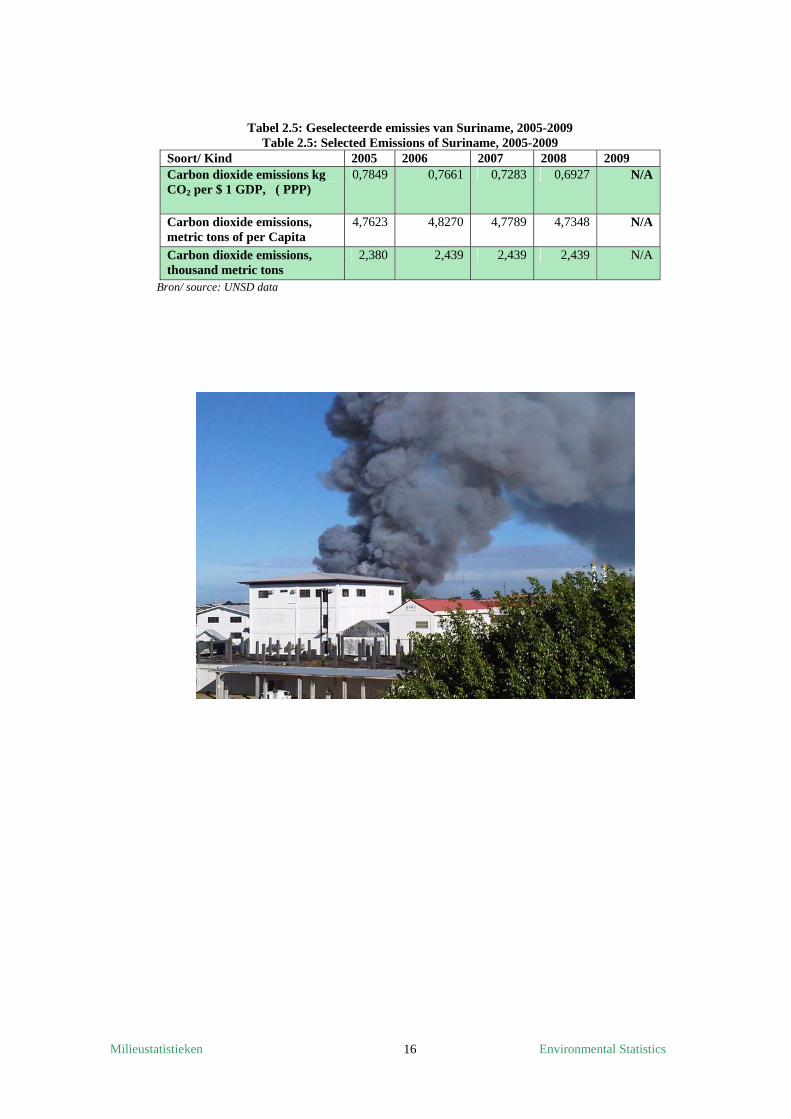
Tabel 2.5: Geselecteerde emissies van Suriname, 2005-2009 Table 2.5: Selected Emissions of Suriname, 2005-2009
Soort/ Kind 2005 2006 2007 2008 2009 Carbon dioxide emissions kg CO2 per $ 1 GDP, ( PPP)
0,7849 0,7661 0,7283 0,6927 N/A
Carbon dioxide emissions, metric tons of per Capita
4,7623 4,8270 4,7789 4,7348 N/A
Carbon dioxide emissions, thousand metric tons
2,380 2,439 2,439 2,439 N/A
Bron/ source: UNSD data
Milieustatistieken Environmental Statistics
17
TOERISME/
TOURISM
Aangekomen personen/ Arrivals
Doel van het bezoek/ Purpose of Visit
Markt/ Market
Doel van het bezoek/ Purpose of Visit
Verblijfplaats/ Place of Stay
Milieustatistieken Environmental Statistics
18
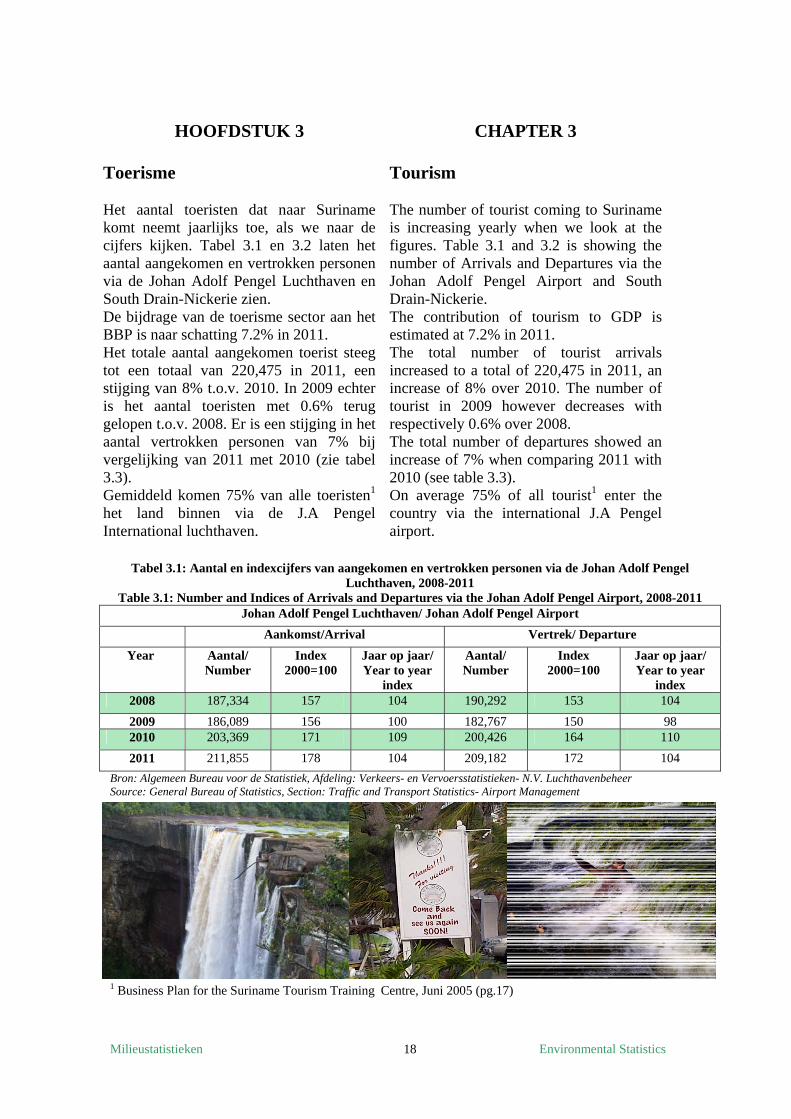
HOOFDSTUK 3 Toerisme Het aantal toeristen dat naar Suriname komt neemt jaarlijks toe, als we naar de cijfers kijken. Tabel 3.1 en 3.2 laten het aantal aangekomen en vertrokken personen via de Johan Adolf Pengel Luchthaven en South Drain-Nickerie zien. De bijdrage van de toerisme sector aan het BBP is naar schatting 7.2% in 2011. Het totale aantal aangekomen toerist steeg tot een totaal van 220,475 in 2011, een stijging van 8% t.o.v. 2010. In 2009 echter is het aantal toeristen met 0.6% terug gelopen t.o.v. 2008. Er is een stijging in het aantal vertrokken personen van 7% bij vergelijking van 2011 met 2010 (zie tabel 3.3). Gemiddeld komen 75% van alle toeristen1 het land binnen via de J.A Pengel International luchthaven.
CHAPTER 3 Tourism The number of tourist coming to Suriname is increasing yearly when we look at the figures. Table 3.1 and 3.2 is showing the number of Arrivals and Departures via the Johan Adolf Pengel Airport and South Drain-Nickerie. The contribution of tourism to GDP is estimated at 7.2% in 2011. The total number of tourist arrivals increased to a total of 220,475 in 2011, an increase of 8% over 2010. The number of tourist in 2009 however decreases with respectively 0.6% over 2008. The total number of departures showed an increase of 7% when comparing 2011 with 2010 (see table 3.3). On average 75% of all tourist1 enter the country via the international J.A Pengel airport.
Tabel 3.1: Aantal en indexcijfers van aangekomen en vertrokken personen via de Johan Adolf Pengel Luchthaven, 2008-2011
Table 3.1: Number and Indices of Arrivals and Departures via the Johan Adolf Pengel Airport, 2008-2011 Johan Adolf Pengel Luchthaven/ Johan Adolf Pengel Airport
Aankomst/Arrival Vertrek/ Departure
Year Aantal/ Number
Index 2000=100
Jaar op jaar/ Year to year
index
Aantal/ Number
Index 2000=100
Jaar op jaar/ Year to year
index 2008 187,334 157 104 190,292 153 104
2009 186,089 156 100 182,767 150 98 2010 203,369 171 109 200,426 164 110
2011 211,855 178 104 209,182 172 104
Bron: Algemeen Bureau voor de Statistiek, Afdeling: Verkeers- en Vervoersstatistieken- N.V. Luchthavenbeheer Source: General Bureau of Statistics, Section: Traffic and Transport Statistics- Airport Management
1 Business Plan for the Suriname Tourism Training Centre, Juni 2005 (pg.17)
Milieustatistieken Environmental Statistics
19
Tabel 3.2: Aantal en indexcijfers van aangekomen en vertrokken personen via South Drain-Nickerie, 2008-2011
Table 3.2: Number and Indices of Arrivals and Departures via South Drain-Nickerie, 2008-2011
South Drain-Nickerie
Aankomst/Arrival Vertrek/ Departure
Year Aantal/ Number
Index 2000=100
Jaar op jaar/ Year to year
index
Aantal/ Number
Index 2000=100
Jaar op jaar/ Year to year
index 2008 27,063 145 111 25,532 165 110
2009 30,966 166 114 29,940 193 117 2010 42,299 227 137 39,583 255 132
2011 49,104 264 116 46,942 303 119
Bron: Algemeen Bureau voor de Statistiek, Afdeling: Verkeers- en Vervoersstatistieken- Canawaima Ferry service Inc. Source: General Bureau of Statistics, Section: Traffic and Transport Statistics- Canawaima Ferry service Inc.
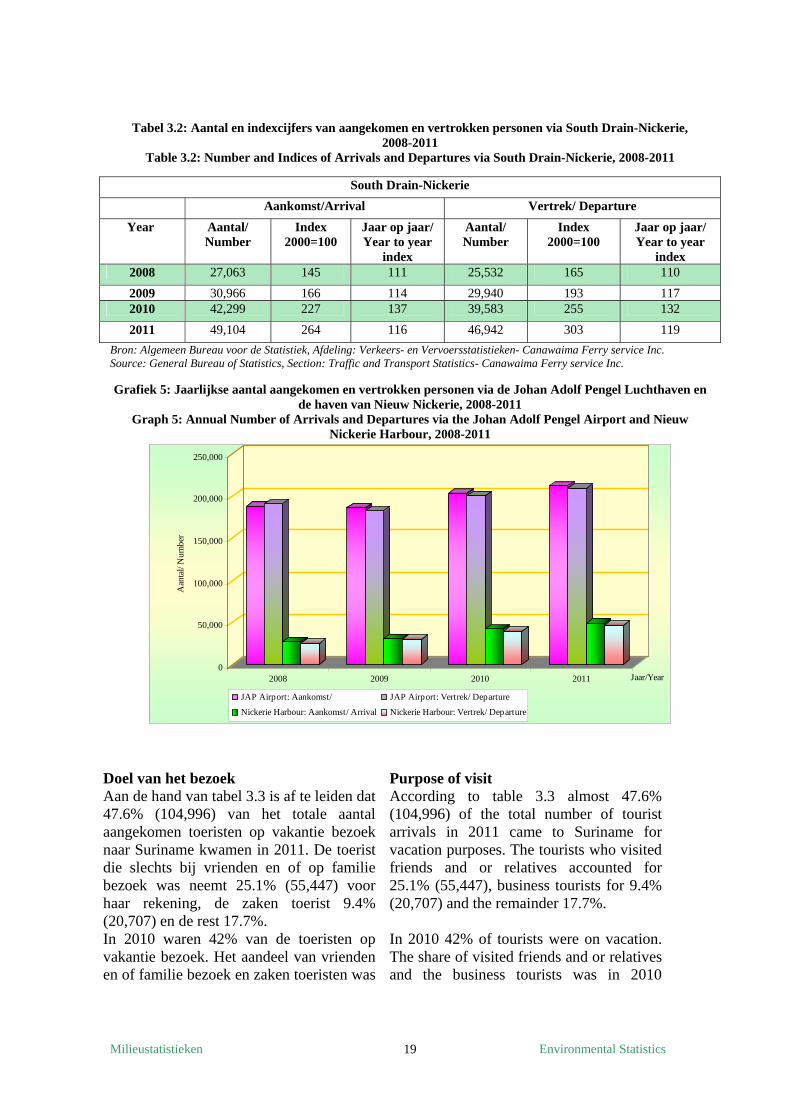
Grafiek 5: Jaarlijkse aantal aangekomen en vertrokken personen via de Johan Adolf Pengel Luchthaven en de haven van Nieuw Nickerie, 2008-2011
Graph 5: Annual Number of Arrivals and Departures via the Johan Adolf Pengel Airport and Nieuw Nickerie Harbour, 2008-2011
Doel van het bezoek Aan de hand van tabel 3.3 is af te leiden dat 47.6% (104,996) van het totale aantal aangekomen toeristen op vakantie bezoek naar Suriname kwamen in 2011. De toerist die slechts bij vrienden en of op familie bezoek was neemt 25.1% (55,447) voor haar rekening, de zaken toerist 9.4% (20,707) en de rest 17.7%. In 2010 waren 42% van de toeristen op vakantie bezoek. Het aandeel van vrienden en of familie bezoek en zaken toeristen was
Purpose of visit According to table 3.3 almost 47.6% (104,996) of the total number of tourist arrivals in 2011 came to Suriname for vacation purposes. The tourists who visited friends and or relatives accounted for 25.1% (55,447), business tourists for 9.4% (20,707) and the remainder 17.7%. In 2010 42% of tourists were on vacation. The share of visited friends and or relatives and the business tourists was in 2010
0
50,000
100,000
150,000
200,000
250,000
Aan
tal/
Num
ber
2008 2009 2010 2011 Jaar/Year
JAP Airport: Aankomst/ JAP Airport: Vertrek/ Departure
Nickerie Harbour: Aankomst/ Arrival Nickerie Harbour: Vertrek/ Departure
Milieustatistieken Environmental Statistics
20
in 2010 respectievelijk 34.7% en 8.5%. Normaliter bezoeken ongeveer een derde van het totaal aan vakantie toeristen Suriname gedurende het derde kwartaal van het jaar (juli, augustus en september) met de piek in augustus.
respectively 34.7% and 8.5%. Normally one-third of the vacation pleasure tourists is visiting Suriname during the third quarter of the year (July, August and September) with August as the peak month.
Tabel 3.3: Het totale aantal en percentage aangekomen toeristen via alle havens naar doel van het bezoek,
2008-2011 Table 3.3: The Total Number and Percentage of Tourist Arrivals via all Ports by Purpose of Visit, 2008-2011
Doel/Purpose 2008 2009 2010 2011
Aantal/ Number
% Aantal/ Number
% Aantal/ Number
% Aantal/ Number
%
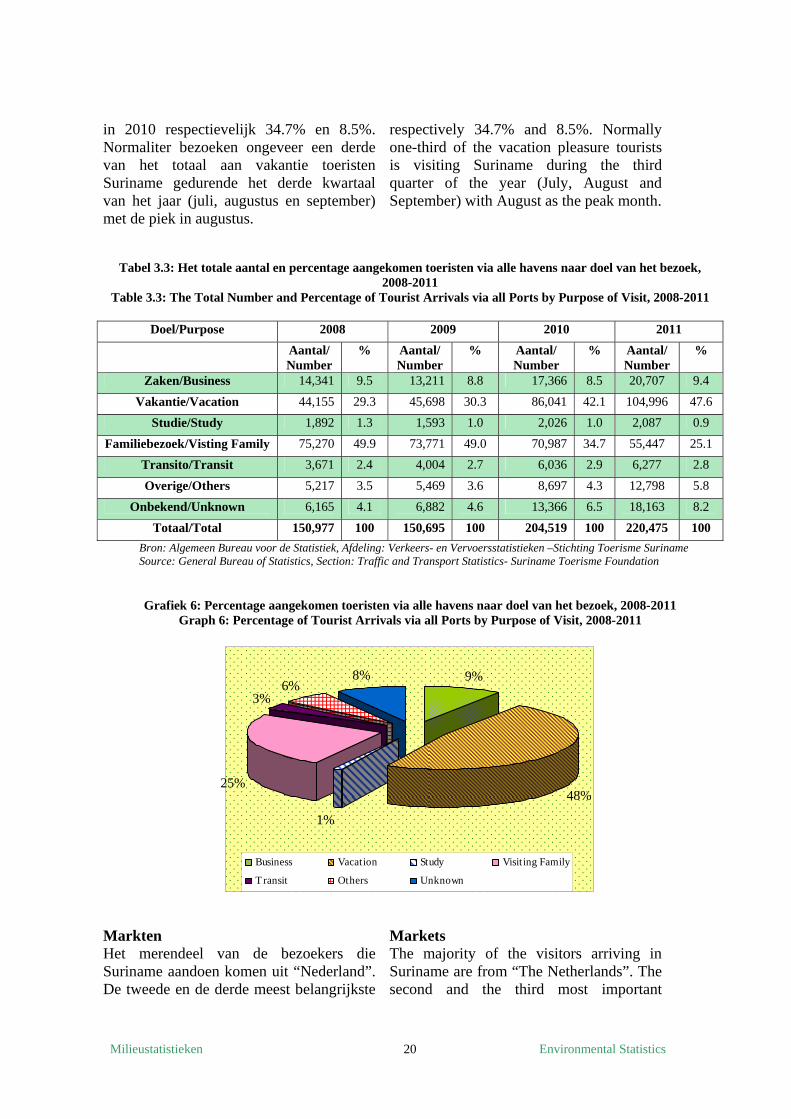
Zaken/Business 14,341 9.5 13,211 8.8 17,366 8.5 20,707 9.4
Vakantie/Vacation 44,155 29.3 45,698 30.3 86,041 42.1 104,996 47.6
Studie/Study 1,892 1.3 1,593 1.0 2,026 1.0 2,087 0.9
Familiebezoek/Visting Family 75,270 49.9 73,771 49.0 70,987 34.7 55,447 25.1
Transito/Transit 3,671 2.4 4,004 2.7 6,036 2.9 6,277 2.8
Overige/Others 5,217 3.5 5,469 3.6 8,697 4.3 12,798 5.8
Onbekend/Unknown 6,165 4.1 6,882 4.6 13,366 6.5 18,163 8.2
Totaal/Total 150,977 100 150,695 100 204,519 100 220,475 100
Bron: Algemeen Bureau voor de Statistiek, Afdeling: Verkeers- en Vervoersstatistieken –Stichting Toerisme Suriname Source: General Bureau of Statistics, Section: Traffic and Transport Statistics- Suriname Toerisme Foundation
Grafiek 6: Percentage aangekomen toeristen via alle havens naar doel van het bezoek, 2008-2011 Graph 6: Percentage of Tourist Arrivals via all Ports by Purpose of Visit, 2008-2011
Markten Het merendeel van de bezoekers die Suriname aandoen komen uit “Nederland”. De tweede en de derde meest belangrijkste
Markets The majority of the visitors arriving in Suriname are from “The Netherlands”. The second and the third most important
9%
48%
1%
25%
3%6%
8%
Business Vacation Study Visit ing Family
Transit Others Unknown
Milieustatistieken Environmental Statistics
21
markten zijn die van Guyana en Frans Guyana. Vergelijken we het 2011 bezoekersaantal uit “Nederland” met dat van 2010 dan merken we een daling van 4%. En vergelijken we het 2009 bezoekersaantal uit “Nederland” met die van 2008 dan merken we een daling van 8 %. Accommodatie “Hotel” is over het algemeen het meest voorkomende type accommodatie in Suriname waar toeristen verblijven gevolgd door “Other (privé huizen, vrienden en familie)”. Het aantal toerisme gerelateerde diensten stijgt in kwantiteit en capaciteit.
markets are Guyana and French Guyana. When comparing the 2011 visitors from “The Netherlands” with those in 2010 a decrease of 4% is showed. And when compare the 2009 visitors from “The Netherlands” with those in 2008 an decrease of 8% is showed. Accommodation “Hotel” is overall the most dominant type of accommodation used in Suriname followed by “Others (private houses relatives and families)”. The number of tourism related services is increasing in quantity and capacity.
Tabel 3.4: Het totale aantal en percentage aangekomen toeristen via alle havens naar land/regio van residentie, 2008-2011
Table 3.4: The Total Number and Percentages of Tourist Arrivals via all Ports by Country/Region of Residence, 2008-2011
Land/ Regio van Residentie/
Country/ Region of Residence 2008 2009 2010 2011
Aantal/ Number
% Aantal/ Number
% Aantal/ Number
% Aantal/ Number
%
Nederland/ The Netherlands 88,380 58.6 81,117 53.9 101,578 49.7 98,054 44.5 Overige Europa/ Rest of Europe 6,919 4.6 6,666 4.4 8,631 4.2 1,477 0.7
Brazilie /Brazil 7,488 5.0 7,840 5.2 11,158 5.4 14,427 6.5 Guyana /Guyana 13,445 8.9 18,753 12.4 30,446 14.9 33,010 15.0
Frans Guyana/ French Guyana 14,062 9.3 14,638 9.7 23,887 11.7 30,210 13.7 Ov. Zd –Am./ Rest of South America 891 0.6 766 0.5 948 0.5 560 0.3
Caraibisch gebied/ Caribbean 8,845 5.9 10,497 7.0 13,417 6.6 9,370 4.2 Amerika/America 4,973 3.3 4,964 3.3 6,600 3.2 7,754 3.5
Rest van de wereld/Rest of the World 5,191 3.5 4,347 2.9 6,554 3.2 22,875 10.4 Onbekend /Unknown 517 0.3 1,040 0.7 1,300 0.6 2,738 1.2
Totaal/Total 150,711 100 150,628 100 204,519 100 220,475 100 Bron: Algemeen Bureau voor de Statistiek, Afdeling: Verkeers- en Vervoersstatistieken –Stichting Toerisme Suriname Source: General Bureau of Statistics, Section: Traffic and Transport Statistics- Suriname Toerisme Foundation
Milieustatistieken Environmental Statistics
22
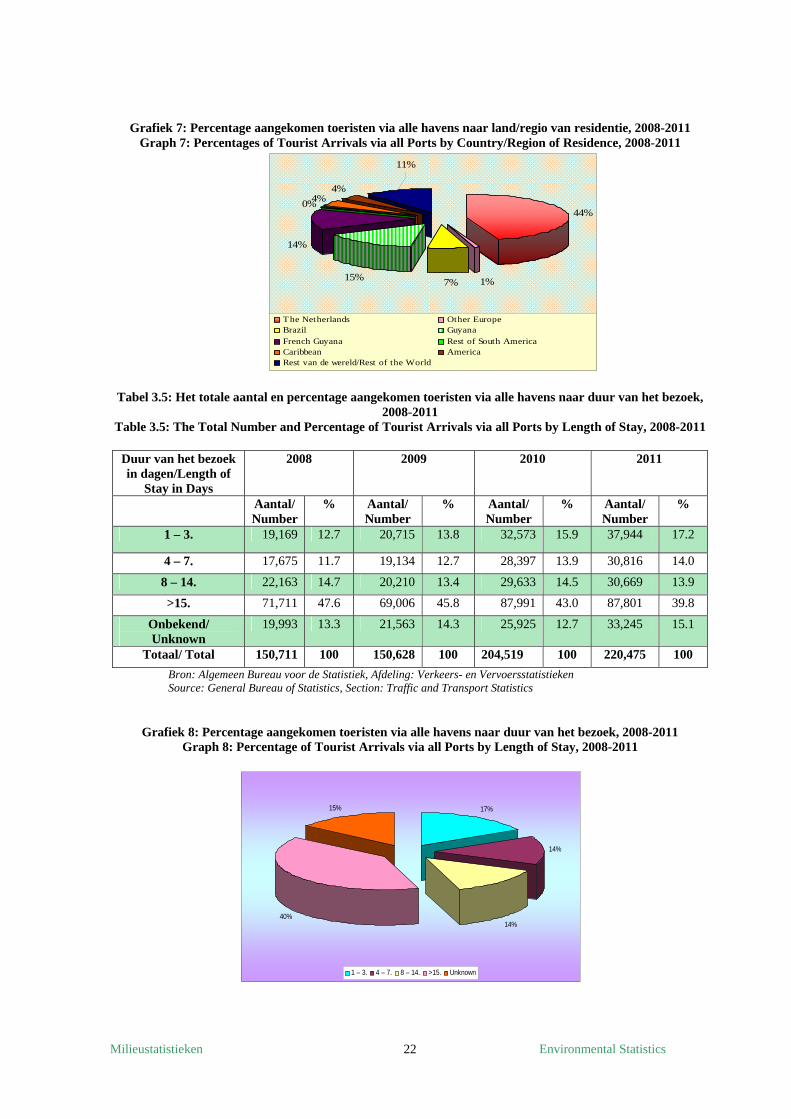
Grafiek 7: Percentage aangekomen toeristen via alle havens naar land/regio van residentie, 2008-2011 Graph 7: Percentages of Tourist Arrivals via all Ports by Country/Region of Residence, 2008-2011
Tabel 3.5: Het totale aantal en percentage aangekomen toeristen via alle havens naar duur van het bezoek, 2008-2011
Table 3.5: The Total Number and Percentage of Tourist Arrivals via all Ports by Length of Stay, 2008-2011
Duur van het bezoek in dagen/Length of
Stay in Days
2008 2009 2010 2011
Aantal/ Number
% Aantal/ Number
% Aantal/ Number
% Aantal/ Number
%
1 – 3. 19,169 12.7 20,715 13.8 32,573 15.9 37,944 17.2
4 – 7. 17,675 11.7 19,134 12.7 28,397 13.9 30,816 14.0
8 – 14. 22,163 14.7 20,210 13.4 29,633 14.5 30,669 13.9
>15. 71,711 47.6 69,006 45.8 87,991 43.0 87,801 39.8
Onbekend/ Unknown
19,993 13.3 21,563 14.3 25,925 12.7 33,245 15.1
Totaal/ Total 150,711 100 150,628 100 204,519 100 220,475 100
Bron: Algemeen Bureau voor de Statistiek, Afdeling: Verkeers- en Vervoersstatistieken Source: General Bureau of Statistics, Section: Traffic and Transport Statistics
Grafiek 8: Percentage aangekomen toeristen via alle havens naar duur van het bezoek, 2008-2011 Graph 8: Percentage of Tourist Arrivals via all Ports by Length of Stay, 2008-2011
44%
1%7%15%
14%
0%4%4%
11%
The Netherlands Other EuropeBrazil GuyanaFrench Guyana Rest of South AmericaCaribbean AmericaRest van de wereld/Rest of the World
17%
14%
14%40%
15%
1 – 3. 4 – 7. 8 – 14. >15. Unknown
Milieustatistieken Environmental Statistics
23
TRANSPORT/ TRANSPORT
Geregistreerde motorvoertuigen/ Registered Motor Vehicles
Aangemeerde schepen naar haven/
Ships Docked by Harbour
Importen van banden, batterijen en accu’s/ Imports of Batteries and Accu’s
Milieustatistieken Environmental Statistics
24
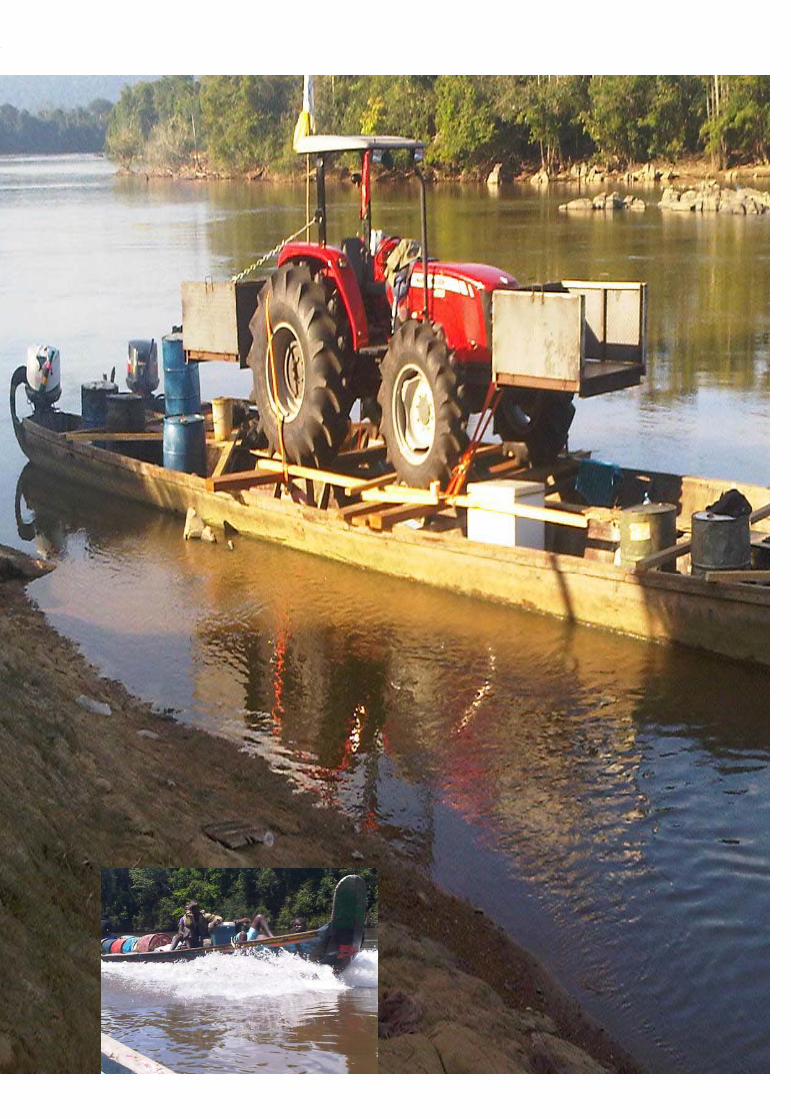
HOOFDSTUK 4
Transport Transport is het verplaatsen van personen of goederen. Dit kan met bijvoorbeeld de auto, boot, fiets, trein, per vliegtuig, enzovoorts. Bij vervoer gaat het om tastbare dingen (bijvoorbeeld goederen- vervoer), vloeistoffen (bijvoorbeeld olie-transport), gassen ( b.v. aardgas), dieren (bijvoorbeeld veetransport) of mensen (personenvervoer), maar ook om niet direct tastbare zaken zoals energie (bijvoorbeeld elektriciteitstransport of warmtetransport) of informatie (bijvoorbeeld datatransport). Om te transporteren wordt gebruikgemaakt van vervoermiddelen. Elk type vervoer kent haar eigen specifieke vervoermiddel met als resultaat een of meer specifieke effecten op het milieu. Sedert 2008 is er een constante groei te zien in het totale aantal geregistreerde motor voertuigen op de openbare weg. Ongeveer 61% van alle geregistreerde motor voertuigen in 2010 waren personen auto’s, 21% bromfietsen en vrachtauto’s 15%. Gebruikte banden zijn een geschikte habitat voor knaagdieren en ander ongedierte. Ze houden water en worden uitstekende broedplaatsen voor muggen die ziektes dragen. Onjuist opgeslagen banden vormen een brandgevaar. Bij verbranding, stoten ze vervuilende luchtrook en kunnen olie en roet ontsnappen en contamineren zowel oppervlakte -en grondwater. Bijna alle accu's bevatten stoffen die het milieu vervuilen. Bijzonder problematisch zijn accu's die zware metalen kwik, cadmium of lood bevatten. De importen van banden, batterijen en accu’s worden in de tabellen 4.3 en 4.4 gepresenteerd.
CHAPTER 4
Transport Transport is the movement of people or goods. This can be for example by car, boat, bicycle, train, plane, and etc.Transport has to do with tangible things (e.g. goods), liquids (e.g. oil transport), gases (e.g. natural gas), animals (e.g. animal transport) or people (passengers), but also not directly tangible items such as energy (e.g. electricity transmission or heat transport) or information (e.g.) data transfer). To transport use is made of means of transport. Each type of carriage has its own specific means of transport resulting in one or more specific effect on the environment. Since 2008, there has been a constant growth in the total number of registered motor vehicles on public roads. Approximately 61% of all registered motor vehicles in 2011 were passenger cars, 21% mopeds and 15% lorries. Used tires are convenient habitats for rodents and other vermin. They hold water and become excellent breeding grounds for mosquitoes that carry diseases. Improperly stored tires present a fire hazard. When burned, They emit air polluting smoke and oils and soot can run off and contaminate both surface and ground water.
Nearly all batteries contain substances that pollute the environment. Particularly problematic are batteries that contain heavy metals mercury, cadmium or lead.
The imports of tires, batteries and accu’s are presented in the tables 4.3 and 4.4.
Milieustatistieken Environmental Statistics
25
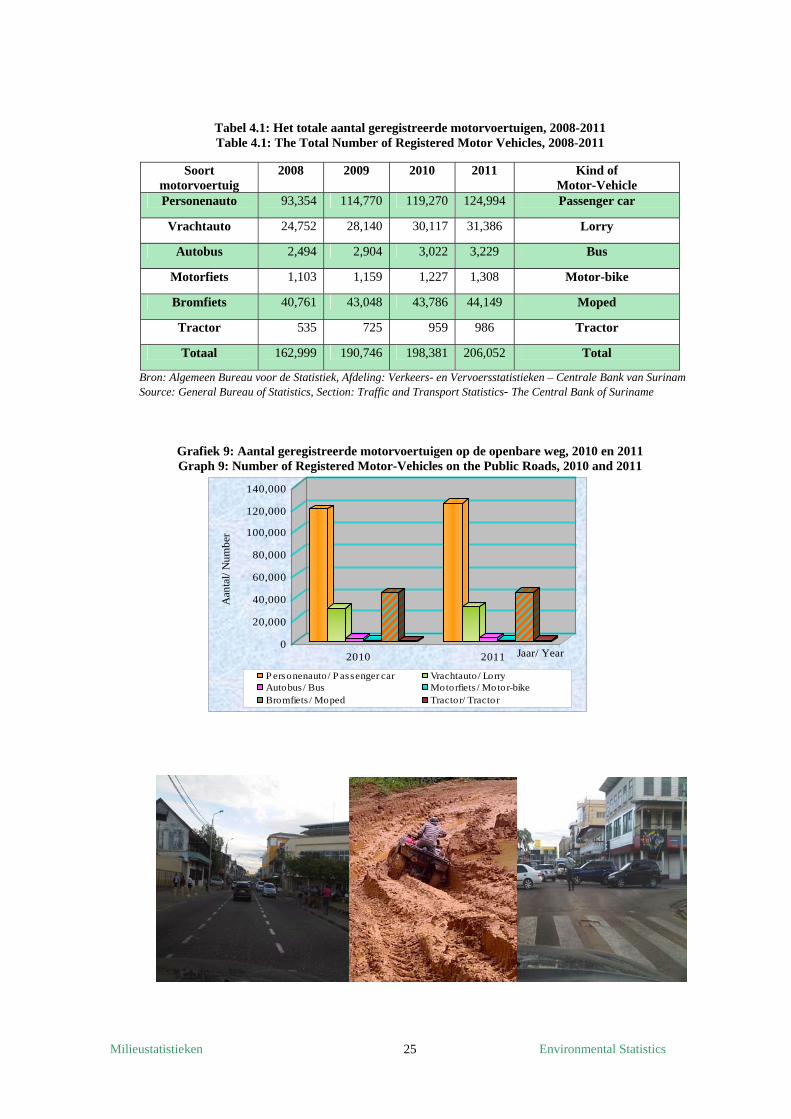
Tabel 4.1: Het totale aantal geregistreerde motorvoertuigen, 2008-2011 Table 4.1: The Total Number of Registered Motor Vehicles, 2008-2011
Bron: Algemeen Bureau voor de Statistiek, Afdeling: Verkeers- en Vervoersstatistieken – Centrale Bank van Surinam Source: General Bureau of Statistics, Section: Traffic and Transport Statistics- The Central Bank of Suriname
Grafiek 9: Aantal geregistreerde motorvoertuigen op de openbare weg, 2010 en 2011 Graph 9: Number of Registered Motor-Vehicles on the Public Roads, 2010 and 2011
0
20,000
40,000
60,000
80,000
100,000
120,000
140,000
Aan
tal/
Num
ber
2010 2011 Jaar/ Year
P ersonenauto/ P assenger car Vrachtauto/ LorryAutobus/ Bus Motorfiets / Motor-bike Bromfiets / Moped Tractor/ Tractor
Soort motorvoertuig
2008 2009 2010 2011 Kind of Motor-Vehicle
Personenauto 93,354 114,770 119,270 124,994 Passenger car
Vrachtauto 24,752 28,140 30,117 31,386 Lorry
Autobus 2,494 2,904 3,022 3,229 Bus
Motorfiets 1,103 1,159 1,227 1,308 Motor-bike
Bromfiets 40,761 43,048 43,786 44,149 Moped
Tractor 535 725 959 986 Tractor
Totaal 162,999 190,746 198,381 206,052 Total
Milieustatistieken Environmental Statistics
26
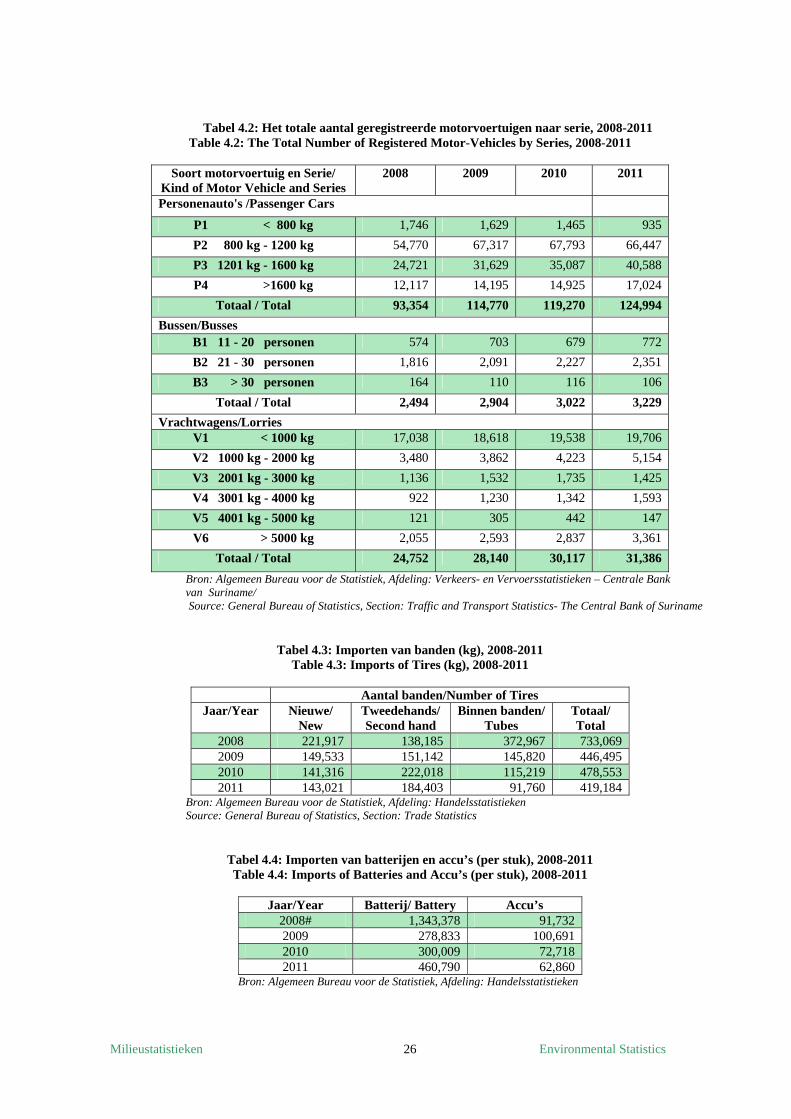
Tabel 4.2: Het totale aantal geregistreerde motorvoertuigen naar serie, 2008-2011 Table 4.2: The Total Number of Registered Motor-Vehicles by Series, 2008-2011
Soort motorvoertuig en Serie/
Kind of Motor Vehicle and Series 2008 2009 2010 2011
Personenauto's /Passenger Cars
P1 < 800 kg 1,746 1,629 1,465 935
P2 800 kg - 1200 kg 54,770 67,317 67,793 66,447
P3 1201 kg - 1600 kg 24,721 31,629 35,087 40,588
P4 >1600 kg 12,117 14,195 14,925 17,024
Totaal / Total 93,354 114,770 119,270 124,994
Bussen/Busses B1 11 - 20 personen 574 703 679 772
B2 21 - 30 personen 1,816 2,091 2,227 2,351
B3 > 30 personen 164 110 116 106
Totaal / Total 2,494 2,904 3,022 3,229
Vrachtwagens/Lorries V1 < 1000 kg 17,038 18,618 19,538 19,706
V2 1000 kg - 2000 kg 3,480 3,862 4,223 5,154
V3 2001 kg - 3000 kg 1,136 1,532 1,735 1,425
V4 3001 kg - 4000 kg 922 1,230 1,342 1,593
V5 4001 kg - 5000 kg 121 305 442 147
V6 > 5000 kg 2,055 2,593 2,837 3,361
Totaal / Total 24,752 28,140 30,117 31,386
Bron: Algemeen Bureau voor de Statistiek, Afdeling: Verkeers- en Vervoersstatistieken – Centrale Bank van Suriname/ Source: General Bureau of Statistics, Section: Traffic and Transport Statistics- The Central Bank of Suriname
Tabel 4.3: Importen van banden (kg), 2008-2011 Table 4.3: Imports of Tires (kg), 2008-2011
Aantal banden/Number of Tires Jaar/Year Nieuwe/
New Tweedehands/ Second hand
Binnen banden/ Tubes
Totaal/ Total
2008 221,917 138,185 372,967 733,069 2009 149,533 151,142 145,820 446,495 2010 141,316 222,018 115,219 478,553 2011 143,021 184,403 91,760 419,184
Bron: Algemeen Bureau voor de Statistiek, Afdeling: Handelsstatistieken Source: General Bureau of Statistics, Section: Trade Statistics
Tabel 4.4: Importen van batterijen en accu’s (per stuk), 2008-2011 Table 4.4: Imports of Batteries and Accu’s (per stuk), 2008-2011
Jaar/Year Batterij/ Battery Accu’s
2008# 1,343,378 91,732 2009 278,833 100,691 2010 300,009 72,718 2011 460,790 62,860
Bron: Algemeen Bureau voor de Statistiek, Afdeling: Handelsstatistieken
Milieustatistieken Environmental Statistics
27
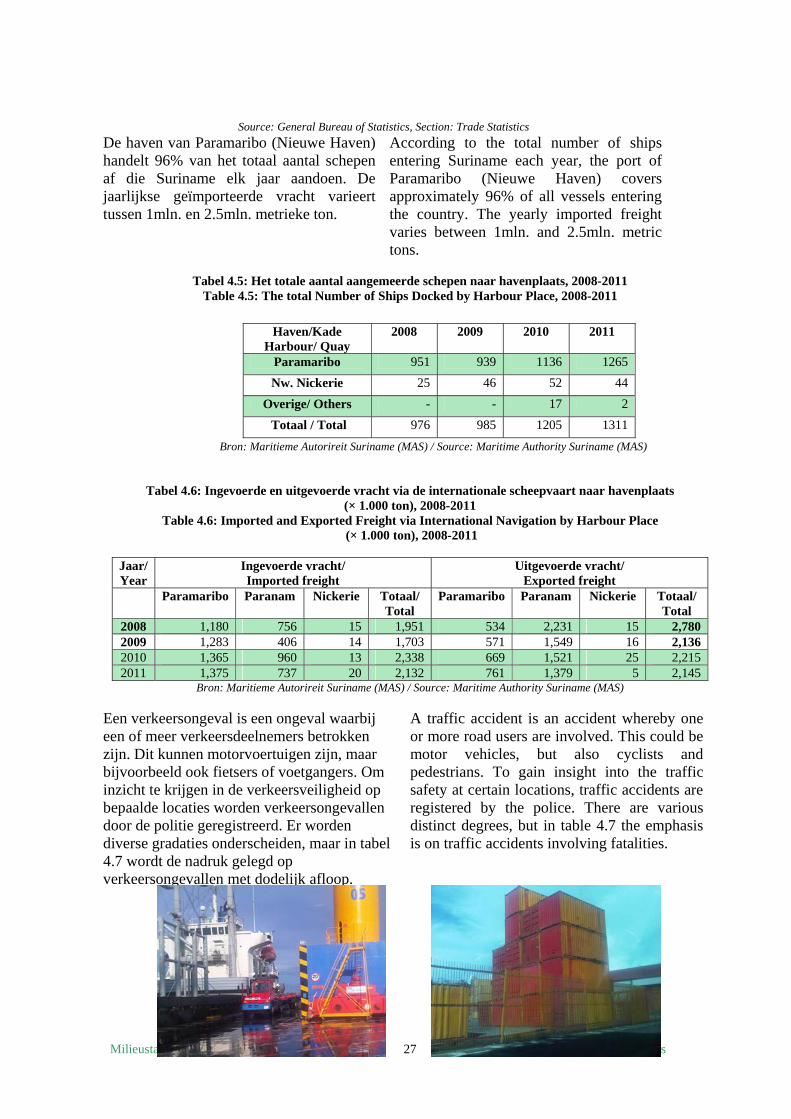
Source: General Bureau of Statistics, Section: Trade Statistics De haven van Paramaribo (Nieuwe Haven) handelt 96% van het totaal aantal schepen af die Suriname elk jaar aandoen. De jaarlijkse geïmporteerde vracht varieert tussen 1mln. en 2.5mln. metrieke ton.
According to the total number of ships entering Suriname each year, the port of Paramaribo (Nieuwe Haven) covers approximately 96% of all vessels entering the country. The yearly imported freight varies between 1mln. and 2.5mln. metric tons.
Tabel 4.5: Het totale aantal aangemeerde schepen naar havenplaats, 2008-2011
Table 4.5: The total Number of Ships Docked by Harbour Place, 2008-2011
Bron: Maritieme Autorireit Suriname (MAS) / Source: Maritime Authority Suriname (MAS)
Tabel 4.6: Ingevoerde en uitgevoerde vracht via de internationale scheepvaart naar havenplaats (× 1.000 ton), 2008-2011
Table 4.6: Imported and Exported Freight via International Navigation by Harbour Place (× 1.000 ton), 2008-2011
Jaar/ Year
Ingevoerde vracht/ Imported freight
Uitgevoerde vracht/ Exported freight
Paramaribo Paranam Nickerie Totaal/ Total
Paramaribo Paranam Nickerie Totaal/ Total
2008 1,180 756 15 1,951 534 2,231 15 2,780 2009 1,283 406 14 1,703 571 1,549 16 2,136 2010 1,365 960 13 2,338 669 1,521 25 2,215 2011 1,375 737 20 2,132 761 1,379 5 2,145
Bron: Maritieme Autorireit Suriname (MAS) / Source: Maritime Authority Suriname (MAS)
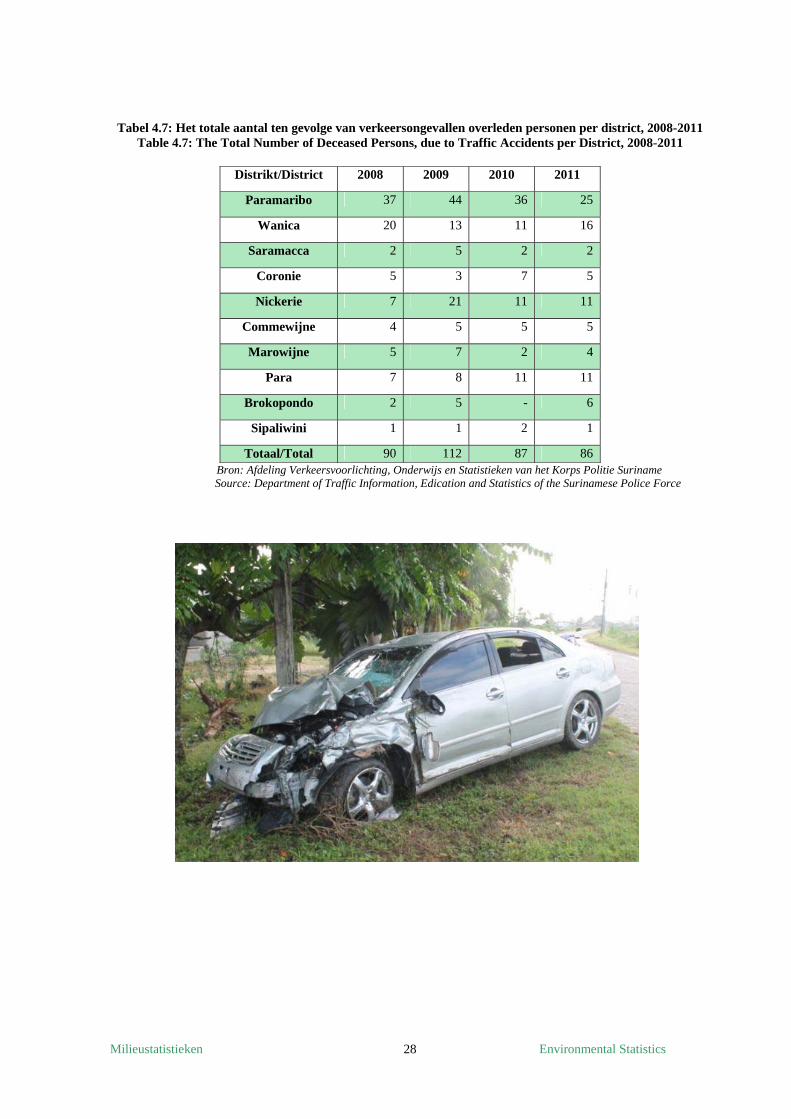
Een verkeersongeval is een ongeval waarbij een of meer verkeersdeelnemers betrokken zijn. Dit kunnen motorvoertuigen zijn, maar bijvoorbeeld ook fietsers of voetgangers. Om inzicht te krijgen in de verkeersveiligheid op bepaalde locaties worden verkeersongevallen door de politie geregistreerd. Er worden diverse gradaties onderscheiden, maar in tabel 4.7 wordt de nadruk gelegd op verkeersongevallen met dodelijk afloop.
A traffic accident is an accident whereby one or more road users are involved. This could be motor vehicles, but also cyclists and pedestrians. To gain insight into the traffic safety at certain locations, traffic accidents are registered by the police. There are various distinct degrees, but in table 4.7 the emphasis is on traffic accidents involving fatalities.
Haven/Kade Harbour/ Quay
2008 2009 2010 2011
Paramaribo 951 939 1136 1265
Nw. Nickerie 25 46 52 44
Overige/ Others - - 17 2
Totaal / Total 976 985 1205 1311
Milieustatistieken Environmental Statistics
28
Tabel 4.7: Het totale aantal ten gevolge van verkeersongevallen overleden personen per district, 2008-2011 Table 4.7: The Total Number of Deceased Persons, due to Traffic Accidents per District, 2008-2011
Distrikt/District 2008 2009 2010 2011
Paramaribo 37 44 36 25
Wanica 20 13 11 16
Saramacca 2 5 2 2
Coronie 5 3 7 5
Nickerie 7 21 11 11
Commewijne 4 5 5 5
Marowijne 5 7 2 4
Para 7 8 11 11
Brokopondo 2 5 - 6
Sipaliwini 1 1 2 1
Totaal/Total 90 112 87 86 Bron: Afdeling Verkeersvoorlichting, Onderwijs en Statistieken van het Korps Politie Suriname
Source: Department of Traffic Information, Edication and Statistics of the Surinamese Police Force
Milieustatistieken Environmental Statistics
29
MILIEU GEZONDHEID EN AFVAL/ ENVIRONMENTAL HEALTH AND WASTE
Milieu gerelateerde ziekten/ Environmentally related Diseases
Milieuklachten/ Environmental Complaints
Milieuadviezen/ Environmental advices
Vuilophaal/ Waste Collection
Milieustatistieken Environmental Statistics
30
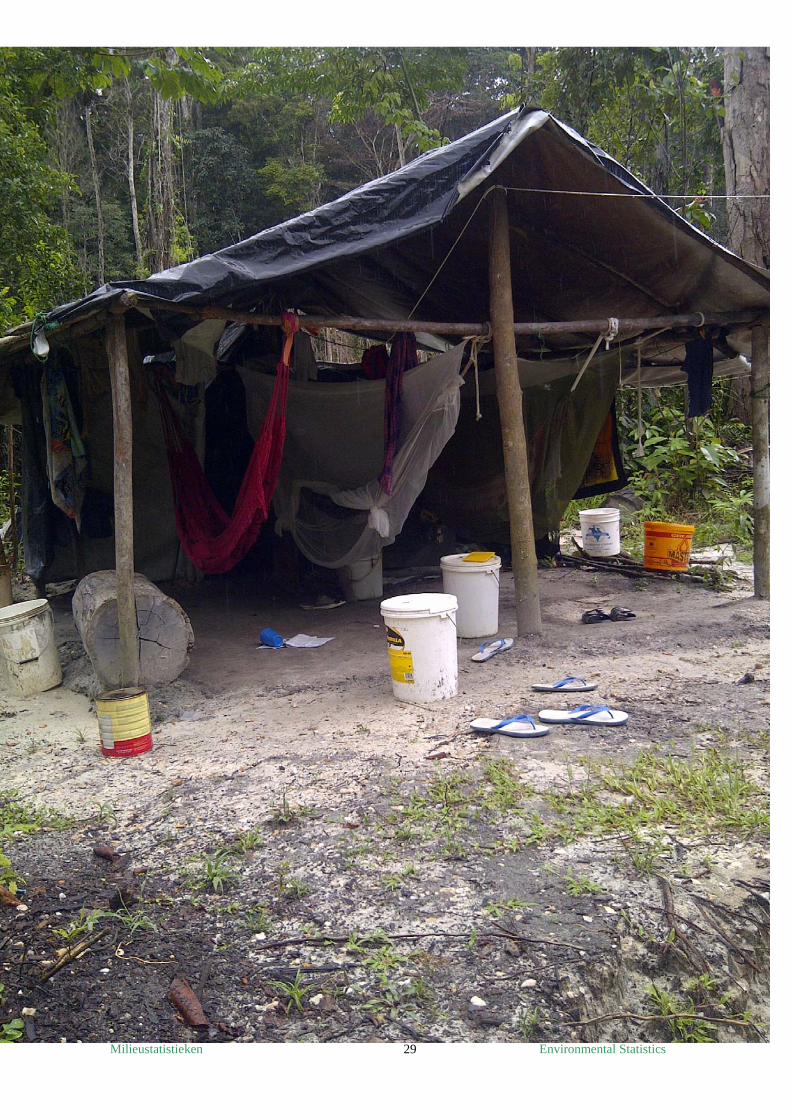
HOOFDSTUK 5 Milieu gezondheid en afval Er bestaat een sterk verband tussen aantasting van het milieu en de volksgezondheid. De ziekte gevallen nemen toe als aantasting van het milieu verslechtert. Ziekten en kwalen die verband houden met het milieu variëren van allergieën en astma tot kanker en Malaria. De meest significante milieu gerelateerde ziekten in Suriname zijn malaria, dengue koorts en Leptospirosis. Malaria voorkomens zijn met meer dan 90% gereduceerd en sinds 2006 is de ziekte in Suriname bijna volledig onder controle, in de dorpsgemeenschappen. Alleen de grensstreek met Frans Guyana en mobiele gemeenschappen van met name goudmijnwerkers in het binnenland zijn nog kwetsbaar voor malaria.
CHAPTER 5
Environmental Health and Waste There is a strong link between environmental degradation and human health. The incidence of diseases increases as environmental degradation worsens. Diseases and ailments related to the environment vary from allergies and asthma to cancer and malaria. The most significant environment-related diseases in Suriname are malaria, dengue fever and Leptospirose. There is a decrease of more than 90% in malaria cases and this disease is since 2006 almost completely under control in Suriname, in the village communities. Only at the border with French Guyana and mobile communities, especially gold miners in the interior are vulnerable to malaria.
Tabel 5.1: Malaria gevallen in Suriname, 2008-2010 Table 5.1: Malaria cases in Suriname, 2008-2010
Jaar/ Year Man/ Male Vrouw/ Female Totaal/ Total
2008 - - 2,134 2009 1,012 486 1,498 2010 333 183 544
Bron: Bureau voor Openbare Gezondheidszorg/ Source: Bureau for Public Health
Tabel 5.2: Suspecte gevallen van dengue naar geslacht, 2008-2010 Table 5.2: Suspected Cases of Dengue by Sex, 2008-2010
Jaar/ Year Man/ Male Vrouw/ Female Totaal/ Total
2008 233 185 418 2009 488 392 880 2010 298 218 516
Bron: Bureau voor Openbare Gezondheidszorg/ Source: Bureau for Public Health
Milieustatistieken Environmental Statistics
31
Tabel 5.3: Suspecte gevallen van leptospirosis naar geslacht, 2008-2010 Table 5.3: Suspected Cases Leptospirosis of by Sex, 2008-2010
Jaar/ Year Man/ Male Vrouw/ Female Totaal/ Total
2008 100 60 160 2009 78 32 110 2010 94 50 144
Bron: Bureau voor Openbare Gezondheidszorg / Source: Bureau for Public Health
Paramaribo is dominant voor de meeste milieuklachten gevolgd door de districten Wanica en Commewijne (zie tabel 5.4). Geluidsoverlast is de milieuklacht die het meest voorkomt in 2011, terwijl overlast van stank en rook de meest voorkomende klacht was in 2010 en 2009. Het aantal milieuadviezen dat door NIMOS is gegeven aan enkele districtscommissarissen en ministeries met betrekking tot verleende vergunningen is te zien in tabel 5.5. Er is elk jaar een toename aan verstrekte vergunningen te merken.
Paramaribo is dominant for most of the environmental complaints followed by the districts Wanica and Commewijne. (see table 5.4). Noise pollution is the environmental complaint that occurs most frequently in 2011, while nuisance of stench and smoke the most common complaint was in 2010 and 2009. The number of environmental advices given by NIMOS to some of the district commissioners and Ministries with regard to issued licenses can be seen in table 5.5. There is each year an increase to notice in the licenses that are issued.
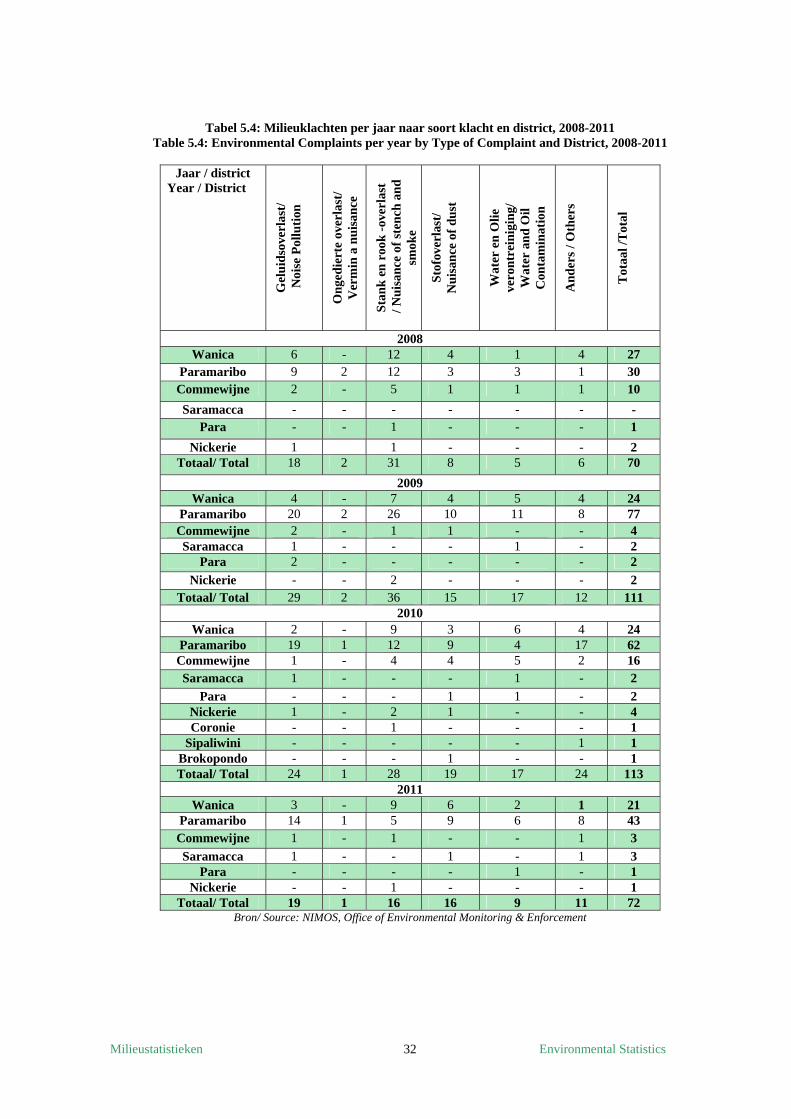
Milieustatistieken Environmental Statistics
32
Tabel 5.4: Milieuklachten per jaar naar soort klacht en district, 2008-2011 Table 5.4: Environmental Complaints per year by Type of Complaint and District, 2008-2011
Jaar / district
Year / District
Gel
uid
sove
rlas
t/
Noi
se P
ollu
tion
On
ged
iert
e ov
erla
st/
Ver
min
a n
uis
ance
Sta
nk
en
roo
k -
over
last
/
Nu
isan
ce o
f st
ench
an
d
smok
e
Sto
fove
rlas
t/
Nu
isan
ce o
f du
st
Wat
er e
n O
lie
vero
ntr
ein
igin
g/
Wat
er a
nd
Oil
C
onta
min
atio
n
And
ers
/ Oth
ers
Tot
aal /
Tot
al
2008 Wanica 6 - 12 4 1 4 27
Paramaribo 9 2 12 3 3 1 30 Commewijne 2 - 5 1 1 1 10
Saramacca - - - - - - - Para - - 1 - - - 1
Nickerie 1 1 - - - 2 Totaal/ Total 18 2 31 8 5 6 70
2009 Wanica 4 - 7 4 5 4 24
Paramaribo 20 2 26 10 11 8 77 Commewijne 2 - 1 1 - - 4 Saramacca 1 - - - 1 - 2
Para 2 - - - - - 2
Nickerie - - 2 - - - 2 Totaal/ Total 29 2 36 15 17 12 111
2010 Wanica 2 - 9 3 6 4 24
Paramaribo 19 1 12 9 4 17 62 Commewijne 1 - 4 4 5 2 16 Saramacca 1 - - - 1 - 2
Para - - - 1 1 - 2 Nickerie 1 - 2 1 - - 4 Coronie - - 1 - - - 1
Sipaliwini - - - - - 1 1 Brokopondo - - - 1 - - 1 Totaal/ Total 24 1 28 19 17 24 113
2011 Wanica 3 - 9 6 2 1 21
Paramaribo 14 1 5 9 6 8 43 Commewijne 1 - 1 - - 1 3
Saramacca 1 - - 1 - 1 3 Para - - - - 1 - 1
Nickerie - - 1 - - - 1 Totaal/ Total 19 1 16 16 9 11 72
Bron/ Source: NIMOS, Office of Environmental Monitoring & Enforcement
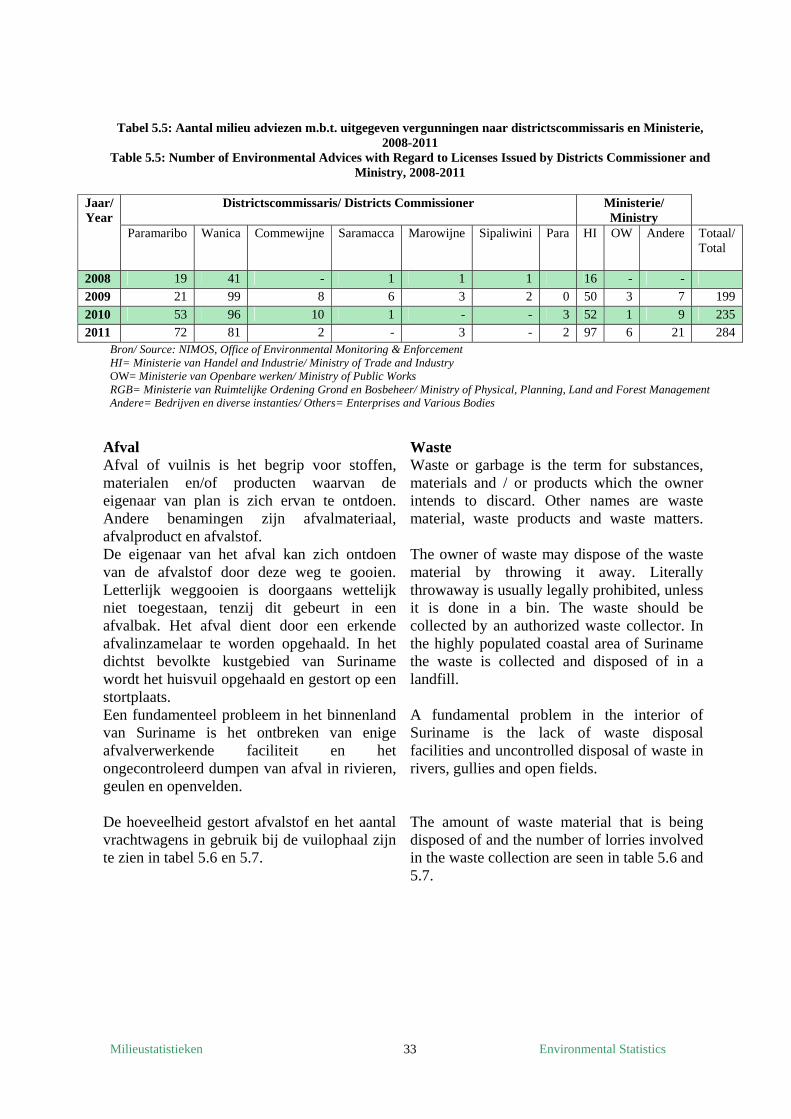
Milieustatistieken Environmental Statistics
33
Tabel 5.5: Aantal milieu adviezen m.b.t. uitgegeven vergunningen naar districtscommissaris en Ministerie, 2008-2011
Table 5.5: Number of Environmental Advices with Regard to Licenses Issued by Districts Commissioner and Ministry, 2008-2011
Jaar/ Year
Districtscommissaris/ Districts Commissioner Ministerie/ Ministry
Paramaribo Wanica Commewijne Saramacca Marowijne Sipaliwini Para HI OW Andere
Totaal/ Total
2008 19 41 - 1 1 1 16 - -
2009 21 99 8 6 3 2 0 50 3 7 199
2010 53 96 10 1 - - 3 52 1 9 235
2011 72 81 2 - 3 - 2 97 6 21 284 Bron/ Source: NIMOS, Office of Environmental Monitoring & Enforcement HI= Ministerie van Handel and Industrie/ Ministry of Trade and Industry OW= Ministerie van Openbare werken/ Ministry of Public Works RGB= Ministerie van Ruimtelijke Ordening Grond en Bosbeheer/ Ministry of Physical, Planning, Land and Forest Management Andere= Bedrijven en diverse instanties/ Others= Enterprises and Various Bodies
Afval Afval of vuilnis is het begrip voor stoffen, materialen en/of producten waarvan de eigenaar van plan is zich ervan te ontdoen. Andere benamingen zijn afvalmateriaal, afvalproduct en afvalstof. De eigenaar van het afval kan zich ontdoen van de afvalstof door deze weg te gooien. Letterlijk weggooien is doorgaans wettelijk niet toegestaan, tenzij dit gebeurt in een afvalbak. Het afval dient door een erkende afvalinzamelaar te worden opgehaald. In het dichtst bevolkte kustgebied van Suriname wordt het huisvuil opgehaald en gestort op een stortplaats. Een fundamenteel probleem in het binnenland van Suriname is het ontbreken van enige afvalverwerkende faciliteit en het ongecontroleerd dumpen van afval in rivieren, geulen en openvelden. De hoeveelheid gestort afvalstof en het aantal vrachtwagens in gebruik bij de vuilophaal zijn te zien in tabel 5.6 en 5.7.
Waste Waste or garbage is the term for substances, materials and / or products which the owner intends to discard. Other names are waste material, waste products and waste matters. The owner of waste may dispose of the waste material by throwing it away. Literally throwaway is usually legally prohibited, unless it is done in a bin. The waste should be collected by an authorized waste collector. In the highly populated coastal area of Suriname the waste is collected and disposed of in a landfill. A fundamental problem in the interior of Suriname is the lack of waste disposal facilities and uncontrolled disposal of waste in rivers, gullies and open fields. The amount of waste material that is being disposed of and the number of lorries involved in the waste collection are seen in table 5.6 and 5.7.
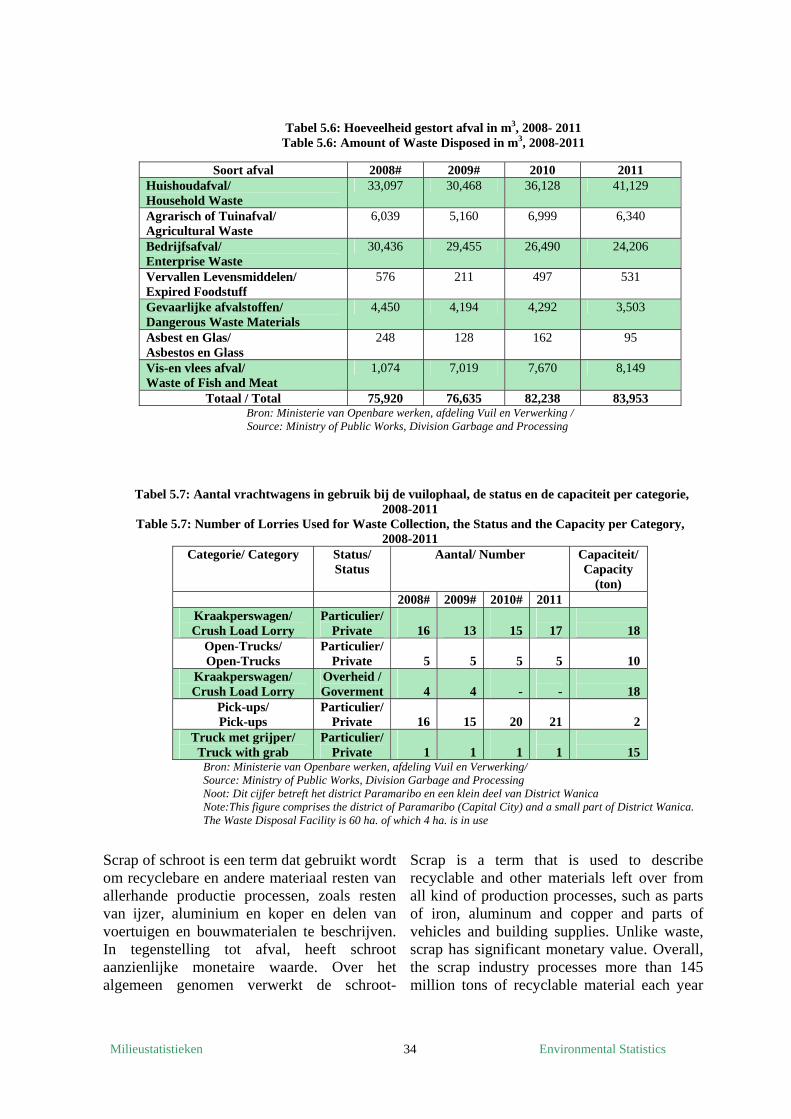
Milieustatistieken Environmental Statistics
34
Tabel 5.6: Hoeveelheid gestort afval in m3, 2008- 2011 Table 5.6: Amount of Waste Disposed in m3, 2008-2011
Soort afval 2008# 2009# 2010 2011 Huishoudafval/ Household Waste
33,097 30,468 36,128 41,129
Agrarisch of Tuinafval/ Agricultural Waste
6,039 5,160 6,999 6,340
Bedrijfsafval/ Enterprise Waste
30,436 29,455 26,490 24,206
Vervallen Levensmiddelen/ Expired Foodstuff
576 211 497 531
Gevaarlijke afvalstoffen/ Dangerous Waste Materials
4,450 4,194 4,292 3,503
Asbest en Glas/ Asbestos en Glass
248 128 162 95
Vis-en vlees afval/ Waste of Fish and Meat
1,074 7,019 7,670 8,149
Totaal / Total 75,920 76,635 82,238 83,953 Bron: Ministerie van Openbare werken, afdeling Vuil en Verwerking /
Source: Ministry of Public Works, Division Garbage and Processing
Tabel 5.7: Aantal vrachtwagens in gebruik bij de vuilophaal, de status en de capaciteit per categorie, 2008-2011
Table 5.7: Number of Lorries Used for Waste Collection, the Status and the Capacity per Category, 2008-2011
Categorie/ Category Status/ Status
Aantal/ Number Capaciteit/ Capacity
(ton) 2008# 2009# 2010# 2011
Kraakperswagen/ Crush Load Lorry
Particulier/Private 16 13 15
17
18
Open-Trucks/ Open-Trucks
Particulier/Private 5 5 5
5
10
Kraakperswagen/ Crush Load Lorry
Overheid / Goverment 4 4 -
-
18
Pick-ups/ Pick-ups
Particulier/Private 16 15 20
21
2
Truck met grijper/ Truck with grab
Particulier/Private 1 1 1
1
15
Bron: Ministerie van Openbare werken, afdeling Vuil en Verwerking/ Source: Ministry of Public Works, Division Garbage and Processing Noot: Dit cijfer betreft het district Paramaribo en een klein deel van District Wanica Note:This figure comprises the district of Paramaribo (Capital City) and a small part of District Wanica. The Waste Disposal Facility is 60 ha. of which 4 ha. is in use
Scrap of schroot is een term dat gebruikt wordt om recyclebare en andere materiaal resten van allerhande productie processen, zoals resten van ijzer, aluminium en koper en delen van voertuigen en bouwmaterialen te beschrijven. In tegenstelling tot afval, heeft schroot aanzienlijke monetaire waarde. Over het algemeen genomen verwerkt de schroot-
Scrap is a term that is used to describe recyclable and other materials left over from all kind of production processes, such as parts of iron, aluminum and copper and parts of vehicles and building supplies. Unlike waste, scrap has significant monetary value. Overall, the scrap industry processes more than 145 million tons of recyclable material each year
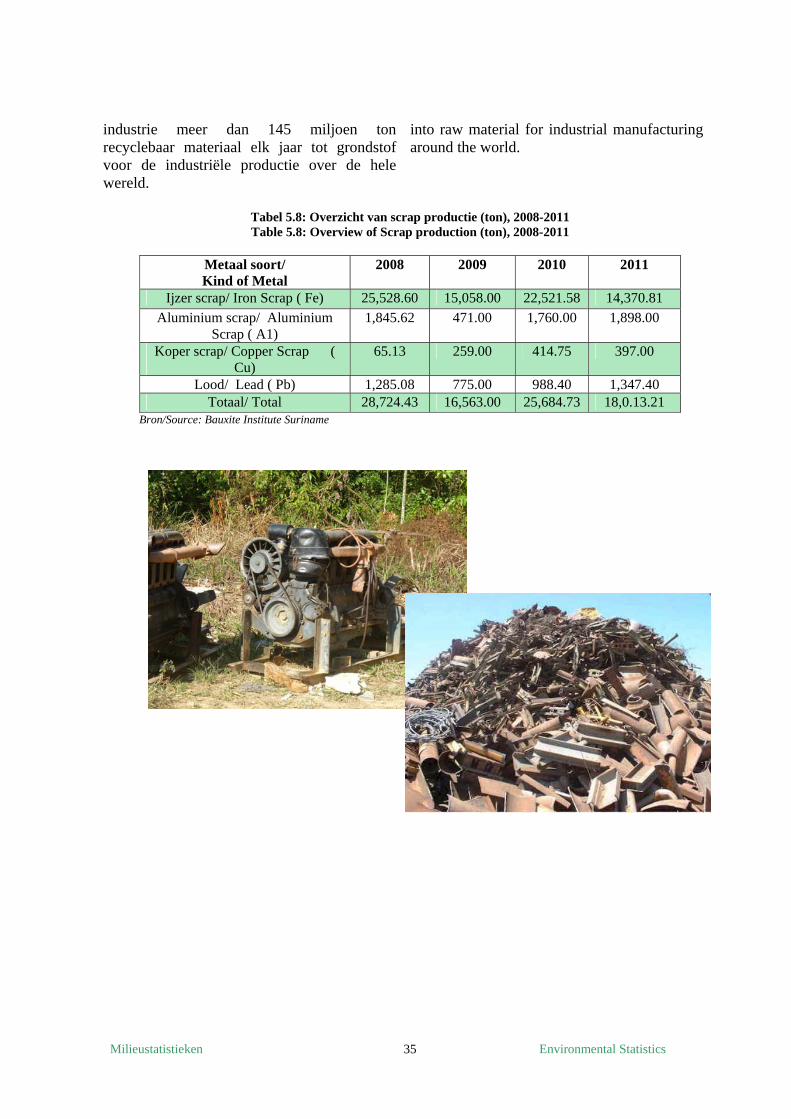
Milieustatistieken Environmental Statistics
35
industrie meer dan 145 miljoen ton recyclebaar materiaal elk jaar tot grondstof voor de industriële productie over de hele wereld.
into raw material for industrial manufacturing around the world.
Tabel 5.8: Overzicht van scrap productie (ton), 2008-2011 Table 5.8: Overview of Scrap production (ton), 2008-2011
Metaal soort/ Kind of Metal
2008 2009 2010 2011
Ijzer scrap/ Iron Scrap ( Fe) 25,528.60 15,058.00 22,521.58 14,370.81
Aluminium scrap/ Aluminium Scrap ( A1)
1,845.62 471.00 1,760.00 1,898.00
Koper scrap/ Copper Scrap ( Cu)
65.13 259.00 414.75 397.00
Lood/ Lead ( Pb) 1,285.08 775.00 988.40 1,347.40 Totaal/ Total 28,724.43 16,563.00 25,684.73 18,0.13.21
Bron/Source: Bauxite Institute Suriname
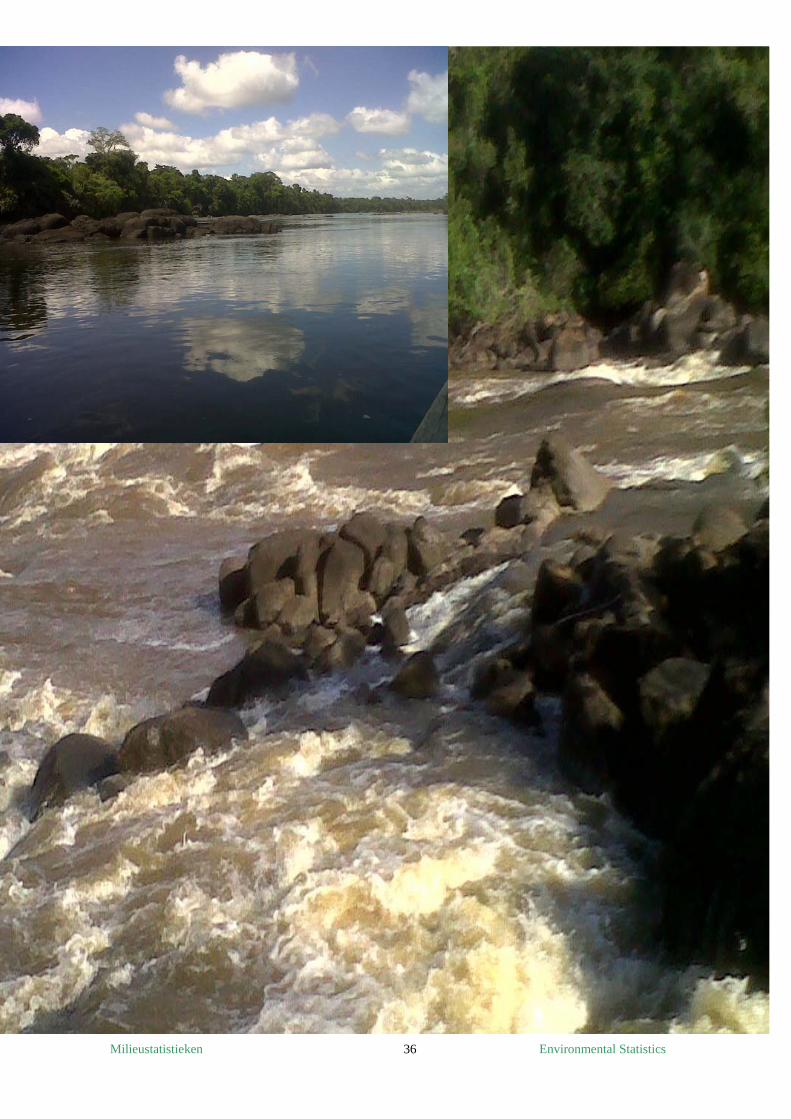
Milieustatistieken Environmental Statistics
36
ZOETWATER/
FRESH WATER
Water consumptie/ Water consumption
Water productie/ Water Production
Water kwaliteitstest/ Water quality testing
Milieustatistieken Environmental Statistics 37
HOOFDSTUK 6
Zoetwater Suriname is rijk aan zoetwater hulpbronnen, wat wordt beschouwd als zeer waardevolle hulpbron. Deze hulbronnen worden echter ernstig bedreigd door menselijke activiteiten. Indien de waterbronnen niet onmiddellijk worden behouden en beschermd, zullen deze binnenkort onbruikbaar worden. Over het algemeen is de kwaliteit van het water goed, maar volgens een evaluatierapport2 over zoetwater-hulpbronnen in Suriname is de kwaliteit van het oppervlaktewater in zowel stedelijke als plattelandsgebieden onder ernstige druk door mijn- en industriële activiteiten, slechte afval verwerking en sanitaire voorzieningen.
Het SWM laboratorium en de Milieu Controle Dienst van het BOG doen dagelijkse waterkwaliteittesten bij de verschillende distributie punten. Ongeveer 91% van de bevolking in urbane gebieden is aangesloten op het openbare waterleidingnet.
Van tabel 6.1.1 kan worden afgeleid dat water consumptie gedomineerd wordt door “Huisaansluitingen” met ongeveer 70% van de totale consumptie in 2011 wat neer komt op een stijging van 6% t.o.v. 2010.
Tabel 6.2 geeft de water productie door SWM weer. De water consumptie en productie van het district Wanica en delen van district Para zijn in het cijfer van Paramaribo inbegrepen. We hebben de aangevraagde recente data over de water productie niet ontvangen van de Dienst Watervoorziening van het Ministerie van Natuurlijke Hulpbronnen.
CHAPTER 6
Fresh Water Suriname is rich in freshwater resources, what is considered as very valuable resource. These resources, however, are seriously threatened by human activities. If the water resources are not immediately preserved and protected, they will soon become unusable. In general, the water quality is good, but according to an evaluation report2 on freshwater resources in Suriname the quality of surface water in both urban and rural areas is under severe pressure by mining and industrial activities, poor waste processing and sanitation provision.
The SWM laboratory and the Environmental Control Division of the BOG carry out daily water quality testing at the various distribution points. About 91% of the people in urban areas are connected to the public water supply.
From table 6.1.1 it can be seen that water consumption is dominated by “House Connections” with approximately 70% of the total consumption in 2010, which equal a increase of 6% when compare to 2009. Table 6.2 shows the water production by the SWM. The water consumption and production of the district Wanica and parts of Para are included in the Paramaribo figure. We did not receive the requested recent data about the water production of the Water Supply Service of the Ministry of Natural resources.
2 Suriname´s zoetwaterbronnen veranderen in vuile onbruikbare bronnen Rachael van der Kooye, Suriname
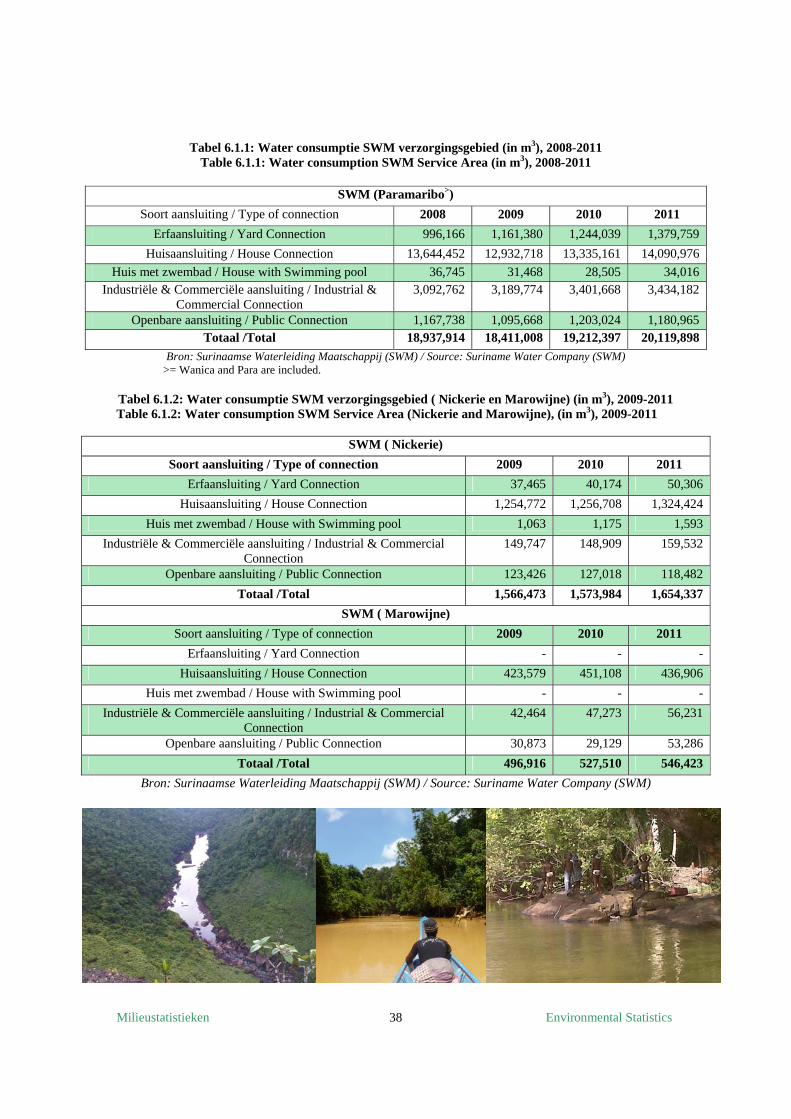
Milieustatistieken Environmental Statistics 38
Tabel 6.1.1: Water consumptie SWM verzorgingsgebied (in m3), 2008-2011 Table 6.1.1: Water consumption SWM Service Area (in m3), 2008-2011
SWM (Paramaribo>)
Soort aansluiting / Type of connection 2008 2009 2010 2011
Erfaansluiting / Yard Connection 996,166 1,161,380 1,244,039 1,379,759
Huisaansluiting / House Connection 13,644,452 12,932,718 13,335,161 14,090,976
Huis met zwembad / House with Swimming pool 36,745 31,468 28,505 34,016 Industriële & Commerciële aansluiting / Industrial &
Commercial Connection 3,092,762 3,189,774 3,401,668 3,434,182
Openbare aansluiting / Public Connection 1,167,738 1,095,668 1,203,024 1,180,965 Totaal /Total 18,937,914 18,411,008 19,212,397 20,119,898
Bron: Surinaamse Waterleiding Maatschappij (SWM) / Source: Suriname Water Company (SWM) >= Wanica and Para are included. Tabel 6.1.2: Water consumptie SWM verzorgingsgebied ( Nickerie en Marowijne) (in m3), 2009-2011 Table 6.1.2: Water consumption SWM Service Area (Nickerie and Marowijne), (in m3), 2009-2011
SWM ( Nickerie)
Soort aansluiting / Type of connection 2009 2010 2011
Erfaansluiting / Yard Connection 37,465 40,174 50,306
Huisaansluiting / House Connection 1,254,772 1,256,708 1,324,424
Huis met zwembad / House with Swimming pool 1,063 1,175 1,593
Industriële & Commerciële aansluiting / Industrial & Commercial Connection
149,747 148,909 159,532
Openbare aansluiting / Public Connection 123,426 127,018 118,482
Totaal /Total 1,566,473 1,573,984 1,654,337
SWM ( Marowijne)
Soort aansluiting / Type of connection 2009 2010 2011
Erfaansluiting / Yard Connection - - -
Huisaansluiting / House Connection 423,579 451,108 436,906
Huis met zwembad / House with Swimming pool - - -
Industriële & Commerciële aansluiting / Industrial & Commercial Connection
42,464 47,273 56,231
Openbare aansluiting / Public Connection 30,873 29,129 53,286
Totaal /Total 496,916 527,510 546,423
Bron: Surinaamse Waterleiding Maatschappij (SWM) / Source: Suriname Water Company (SWM)
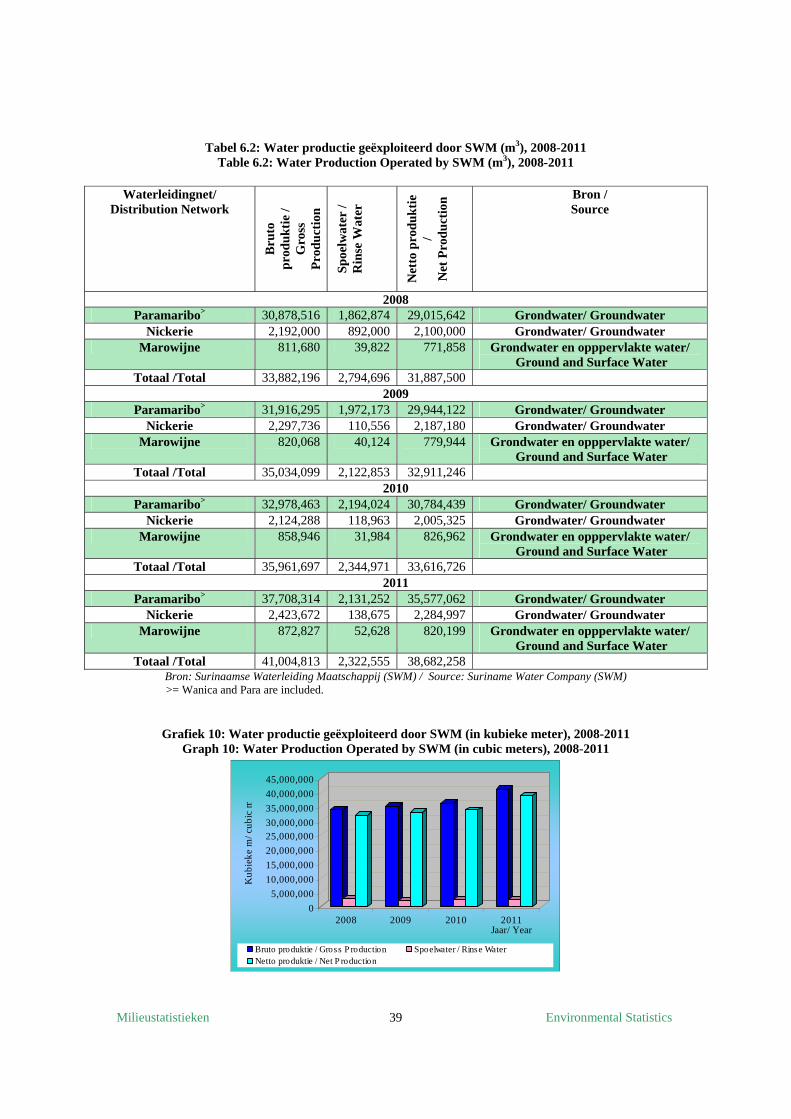
Milieustatistieken Environmental Statistics 39
Tabel 6.2: Water productie geëxploiteerd door SWM (m3), 2008-2011 Table 6.2: Water Production Operated by SWM (m3), 2008-2011
Waterleidingnet/
Distribution Network
Bru
to
pro
du
kti
e /
Gro
ss
Pro
du
ctio
n
Sp
oelw
ater
/ R
inse
Wat
er
Net
to p
rod
uk
tie
/ N
et P
rod
uct
ion
Bron / Source
2008 Paramaribo> 30,878,516 1,862,874 29,015,642 Grondwater/ Groundwater
Nickerie 2,192,000 892,000 2,100,000 Grondwater/ Groundwater Marowijne 811,680 39,822 771,858 Grondwater en opppervlakte water/
Ground and Surface Water Totaal /Total 33,882,196 2,794,696 31,887,500
2009 Paramaribo> 31,916,295 1,972,173 29,944,122 Grondwater/ Groundwater
Nickerie 2,297,736 110,556 2,187,180 Grondwater/ Groundwater Marowijne 820,068 40,124 779,944 Grondwater en opppervlakte water/
Ground and Surface Water Totaal /Total 35,034,099 2,122,853 32,911,246
2010 Paramaribo> 32,978,463 2,194,024 30,784,439 Grondwater/ Groundwater
Nickerie 2,124,288 118,963 2,005,325 Grondwater/ Groundwater Marowijne 858,946 31,984 826,962 Grondwater en opppervlakte water/
Ground and Surface Water Totaal /Total 35,961,697 2,344,971 33,616,726
2011 Paramaribo> 37,708,314 2,131,252 35,577,062 Grondwater/ Groundwater
Nickerie 2,423,672 138,675 2,284,997 Grondwater/ Groundwater Marowijne 872,827 52,628 820,199 Grondwater en opppervlakte water/
Ground and Surface Water Totaal /Total 41,004,813 2,322,555 38,682,258
Bron: Surinaamse Waterleiding Maatschappij (SWM) / Source: Suriname Water Company (SWM) >= Wanica and Para are included.
Grafiek 10: Water productie geëxploiteerd door SWM (in kubieke meter), 2008-2011 Graph 10: Water Production Operated by SWM (in cubic meters), 2008-2011
0
5,000,000
10,000,000
15,000,000
20,000,000
25,000,00030,000,000
35,000,000
40,000,000
45,000,000
Kub
ieke
m/ c
ubic
m
2008 2009 2010 2011Jaar/ Year
Bruto produktie / Gross P roduction Spoelwater / Rinse WaterNetto produktie / Net P roduction
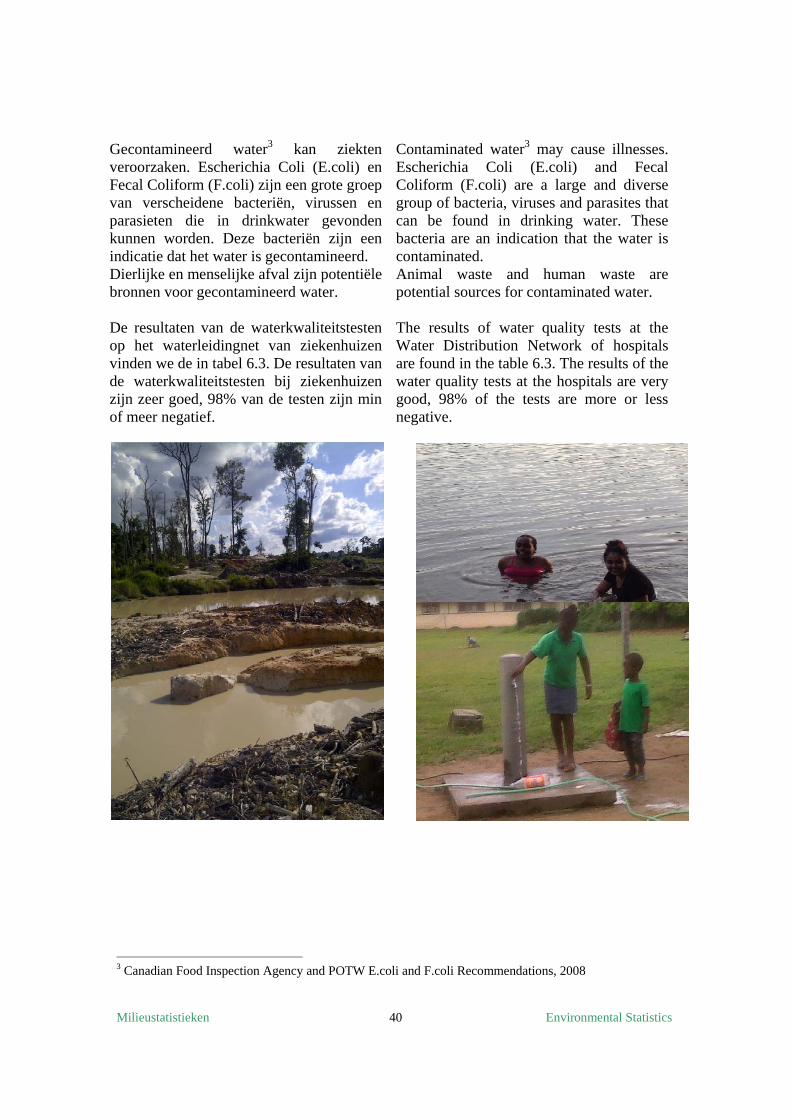
Milieustatistieken Environmental Statistics 40
Gecontamineerd water3 kan ziekten veroorzaken. Escherichia Coli (E.coli) en Fecal Coliform (F.coli) zijn een grote groep van verscheidene bacteriën, virussen en parasieten die in drinkwater gevonden kunnen worden. Deze bacteriën zijn een indicatie dat het water is gecontamineerd. Dierlijke en menselijke afval zijn potentiële bronnen voor gecontamineerd water. De resultaten van de waterkwaliteitstesten op het waterleidingnet van ziekenhuizen vinden we de in tabel 6.3. De resultaten van de waterkwaliteitstesten bij ziekenhuizen zijn zeer goed, 98% van de testen zijn min of meer negatief.
Contaminated water3 may cause illnesses. Escherichia Coli (E.coli) and Fecal Coliform (F.coli) are a large and diverse group of bacteria, viruses and parasites that can be found in drinking water. These bacteria are an indication that the water is contaminated. Animal waste and human waste are potential sources for contaminated water. The results of water quality tests at the Water Distribution Network of hospitals are found in the table 6.3. The results of the water quality tests at the hospitals are very good, 98% of the tests are more or less negative.
3 Canadian Food Inspection Agency and POTW E.coli and F.coli Recommendations, 2008
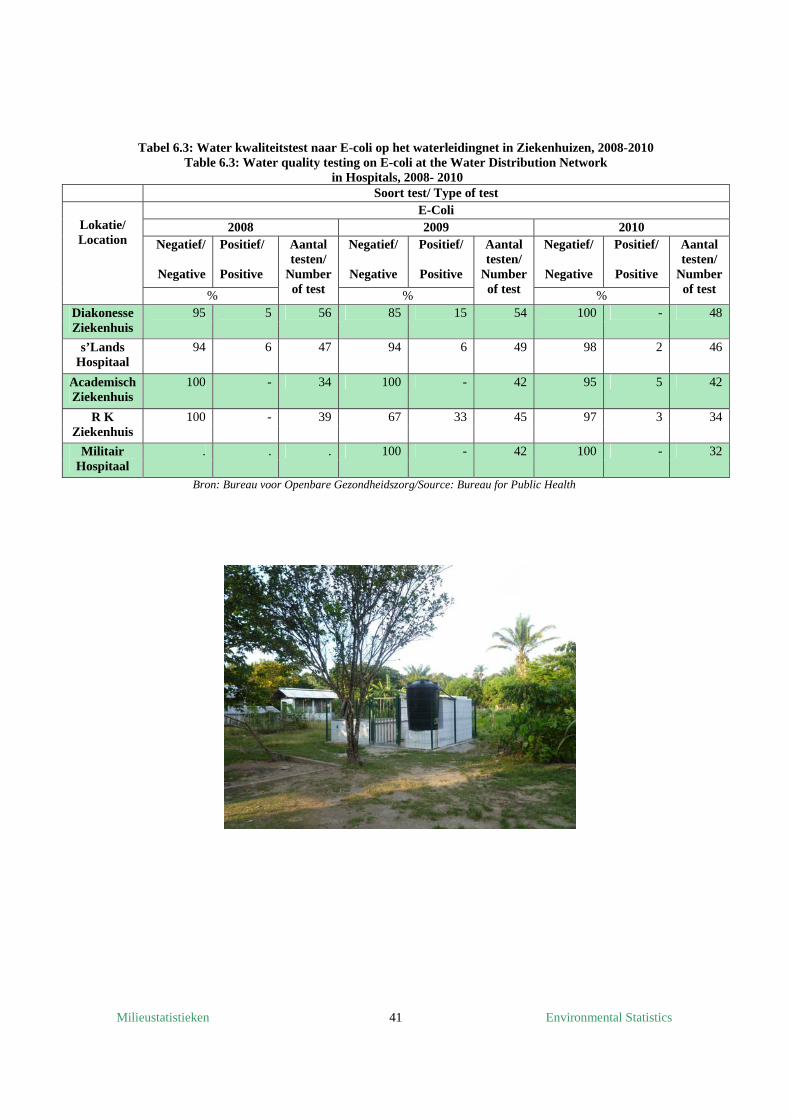
Milieustatistieken Environmental Statistics 41
Tabel 6.3: Water kwaliteitstest naar E-coli op het waterleidingnet in Ziekenhuizen, 2008-2010 Table 6.3: Water quality testing on E-coli at the Water Distribution Network
in Hospitals, 2008- 2010 Soort test/ Type of test
Lokatie/ Location
E-Coli 2008 2009 2010
Negatief/
Negative
Positief/
Positive
Aantal testen/
Number of test
Negatief/
Negative
Positief/
Positive
Aantal testen/
Number of test
Negatief/
Negative
Positief/
Positive
Aantal testen/
Number of test % % %
Diakonesse Ziekenhuis
95 5 56 85 15 54 100 - 48
s’Lands Hospitaal
94 6 47 94 6 49 98 2 46
Academisch Ziekenhuis
100 - 34 100 - 42 95 5 42
R K Ziekenhuis
100 - 39 67 33 45 97 3 34
Militair Hospitaal
. . . 100 - 42 100 - 32
Bron: Bureau voor Openbare Gezondheidszorg/Source: Bureau for Public Health
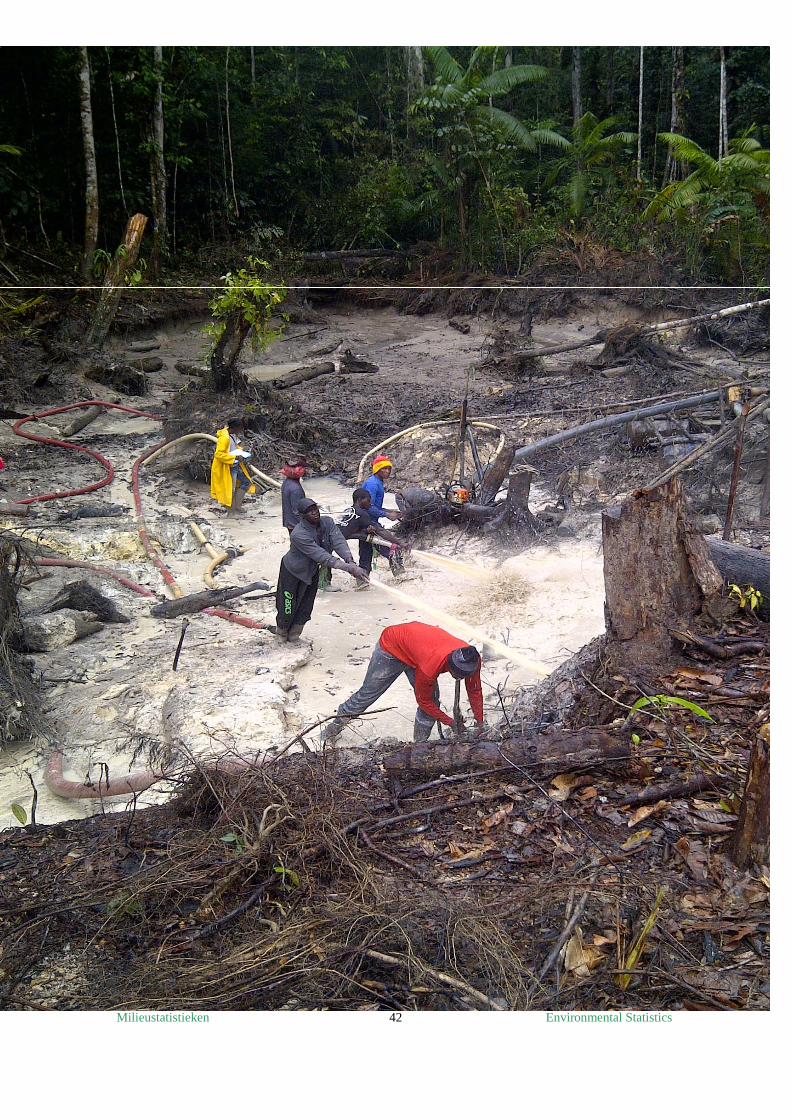
Milieustatistieken Environmental Statistics 42
ENERGIE EN MINERALEN/
ENERGY AND MINERALS
Energie / Energy
Bauxiet mijnbouw/ Bauxite mining
Goud/ Gold
Aardolie/ Crude oil
Concessiehouders/ Concession holders
Bouwmaterialen/ Building materials
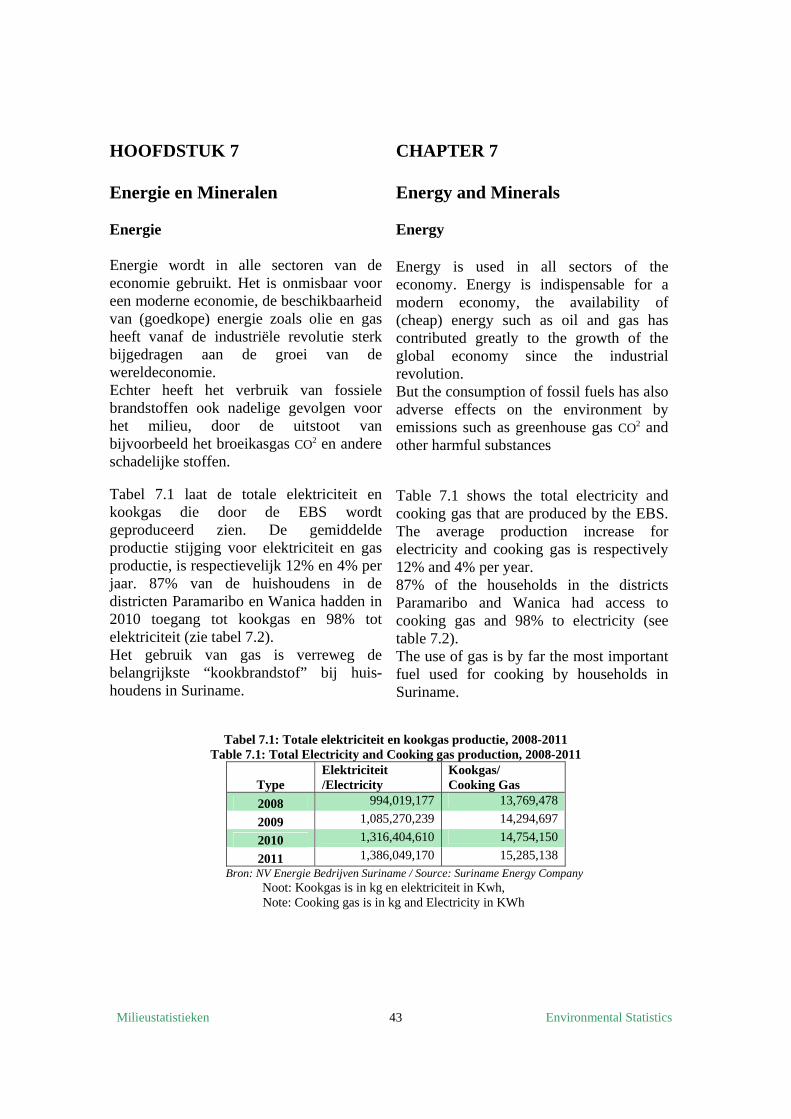
Milieustatistieken Environmental Statistics 43
HOOFDSTUK 7 Energie en Mineralen Energie Energie wordt in alle sectoren van de economie gebruikt. Het is onmisbaar voor een moderne economie, de beschikbaarheid van (goedkope) energie zoals olie en gas heeft vanaf de industriële revolutie sterk bijgedragen aan de groei van de wereldeconomie. Echter heeft het verbruik van fossiele brandstoffen ook nadelige gevolgen voor het milieu, door de uitstoot van bijvoorbeeld het broeikasgas CO2 en andere schadelijke stoffen. Tabel 7.1 laat de totale elektriciteit en kookgas die door de EBS wordt geproduceerd zien. De gemiddelde productie stijging voor elektriciteit en gas productie, is respectievelijk 12% en 4% per jaar. 87% van de huishoudens in de districten Paramaribo en Wanica hadden in 2010 toegang tot kookgas en 98% tot elektriciteit (zie tabel 7.2). Het gebruik van gas is verreweg de belangrijkste “kookbrandstof” bij huis- houdens in Suriname.
CHAPTER 7 Energy and Minerals Energy
Energy is used in all sectors of the economy. Energy is indispensable for a modern economy, the availability of (cheap) energy such as oil and gas has contributed greatly to the growth of the global economy since the industrial revolution. But the consumption of fossil fuels has also adverse effects on the environment by emissions such as greenhouse gas CO2 and other harmful substances Table 7.1 shows the total electricity and cooking gas that are produced by the EBS. The average production increase for electricity and cooking gas is respectively 12% and 4% per year. 87% of the households in the districts Paramaribo and Wanica had access to cooking gas and 98% to electricity (see table 7.2). The use of gas is by far the most important fuel used for cooking by households in Suriname.
Tabel 7.1: Totale elektriciteit en kookgas productie, 2008-2011 Table 7.1: Total Electricity and Cooking gas production, 2008-2011
Type Elektriciteit /Electricity
Kookgas/ Cooking Gas
2008 994,019,177 13,769,478
2009 1,085,270,239 14,294,697
2010 1,316,404,610 14,754,150
2011 1,386,049,170 15,285,138 Bron: NV Energie Bedrijven Suriname / Source: Suriname Energy Company Noot: Kookgas is in kg en elektriciteit in Kwh, Note: Cooking gas is in kg and Electricity in KWh
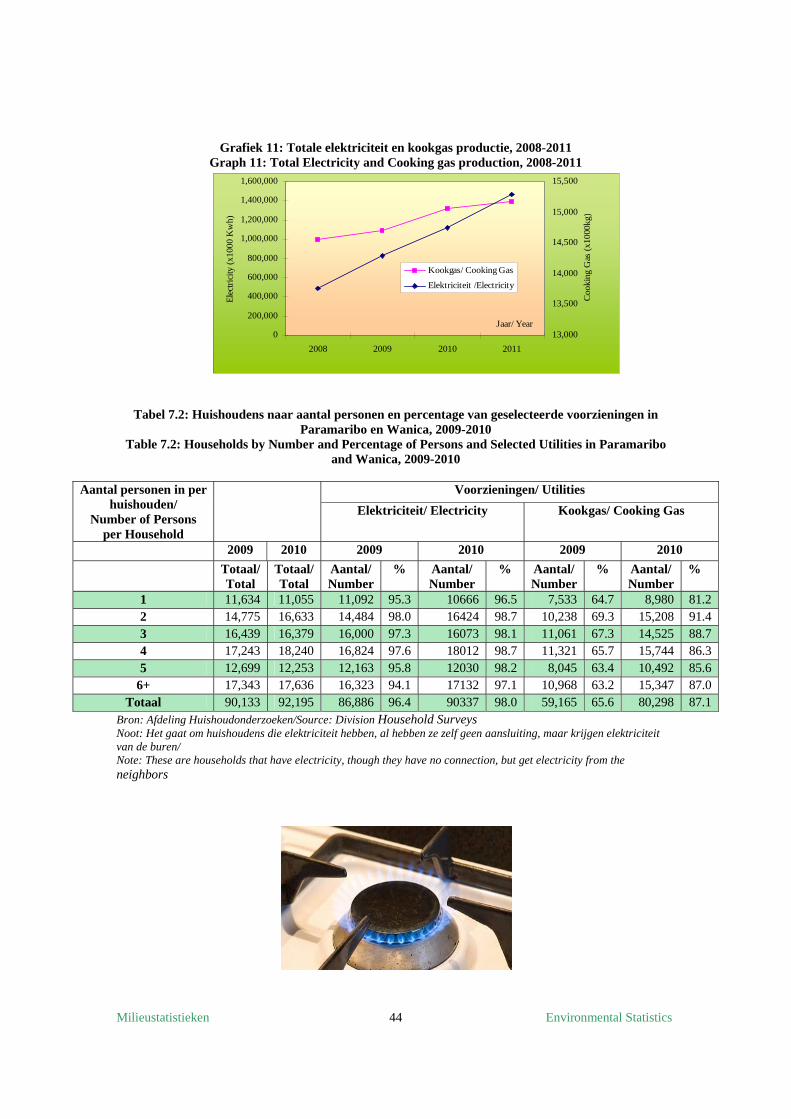
Milieustatistieken Environmental Statistics 44
Grafiek 11: Totale elektriciteit en kookgas productie, 2008-2011 Graph 11: Total Electricity and Cooking gas production, 2008-2011
Tabel 7.2: Huishoudens naar aantal personen en percentage van geselecteerde voorzieningen in Paramaribo en Wanica, 2009-2010
Table 7.2: Households by Number and Percentage of Persons and Selected Utilities in Paramaribo and Wanica, 2009-2010
Aantal personen in per
huishouden/ Number of Persons
per Household
Voorzieningen/ Utilities
Elektriciteit/ Electricity Kookgas/ Cooking Gas
2009 2010 2009 2010 2009 2010
Totaal/ Total
Totaal/ Total
Aantal/ Number
% Aantal/ Number
% Aantal/ Number
% Aantal/ Number
%
1 11,634 11,055 11,092 95.3 10666 96.5 7,533 64.7 8,980 81.2 2 14,775 16,633 14,484 98.0 16424 98.7 10,238 69.3 15,208 91.4 3 16,439 16,379 16,000 97.3 16073 98.1 11,061 67.3 14,525 88.7 4 17,243 18,240 16,824 97.6 18012 98.7 11,321 65.7 15,744 86.3 5 12,699 12,253 12,163 95.8 12030 98.2 8,045 63.4 10,492 85.6
6+ 17,343 17,636 16,323 94.1 17132 97.1 10,968 63.2 15,347 87.0 Totaal 90,133 92,195 86,886 96.4 90337 98.0 59,165 65.6 80,298 87.1
Bron: Afdeling Huishoudonderzoeken/Source: Division Household Surveys Noot: Het gaat om huishoudens die elektriciteit hebben, al hebben ze zelf geen aansluiting, maar krijgen elektriciteit van de buren/ Note: These are households that have electricity, though they have no connection, but get electricity from the neighbors
0
200,000
400,000
600,000
800,000
1,000,000
1,200,000
1,400,000
1,600,000
2008 2009 2010 2011
Jaar/ Year
Ele
ctri
city
(x1
000
Kw
h)
13,000
13,500
14,000
14,500
15,000
15,500
Coo
king
Gas
(x1
000k
g)
Kookgas/ Cooking Gas
Elektriciteit /Electricity
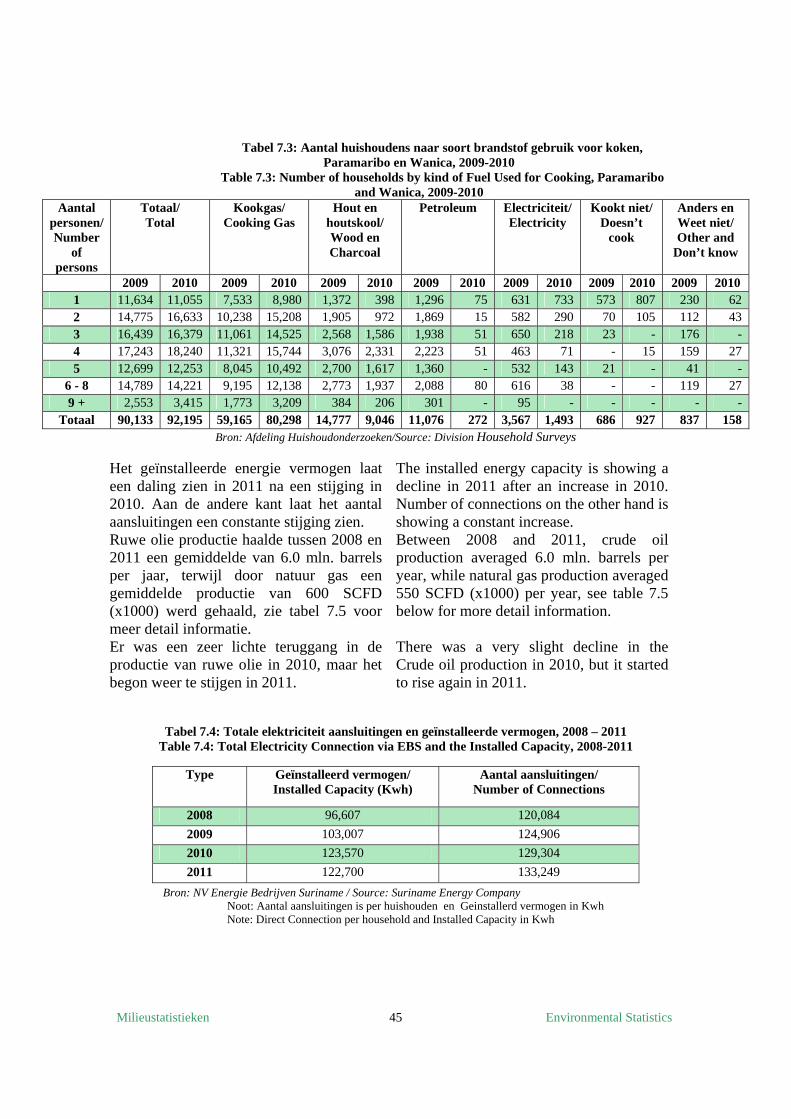
Milieustatistieken Environmental Statistics 45
Tabel 7.3: Aantal huishoudens naar soort brandstof gebruik voor koken, Paramaribo en Wanica, 2009-2010
Table 7.3: Number of households by kind of Fuel Used for Cooking, Paramaribo and Wanica, 2009-2010
Aantal personen/ Number
of persons
Totaal/ Total
Kookgas/ Cooking Gas
Hout en houtskool/ Wood en Charcoal
Petroleum Electriciteit/ Electricity
Kookt niet/ Doesn’t
cook
Anders en Weet niet/ Other and
Don’t know
2009 2010 2009 2010 2009 2010 2009 2010 2009 2010 2009 2010 2009 2010 1 11,634 11,055 7,533 8,980 1,372 398 1,296 75 631 733 573 807 230 62 2 14,775 16,633 10,238 15,208 1,905 972 1,869 15 582 290 70 105 112 43 3 16,439 16,379 11,061 14,525 2,568 1,586 1,938 51 650 218 23 - 176 - 4 17,243 18,240 11,321 15,744 3,076 2,331 2,223 51 463 71 - 15 159 27 5 12,699 12,253 8,045 10,492 2,700 1,617 1,360 - 532 143 21 - 41 -
6 - 8 14,789 14,221 9,195 12,138 2,773 1,937 2,088 80 616 38 - - 119 27 9 + 2,553 3,415 1,773 3,209 384 206 301 - 95 - - - - -
Totaal 90,133 92,195 59,165 80,298 14,777 9,046 11,076 272 3,567 1,493 686 927 837 158 Bron: Afdeling Huishoudonderzoeken/Source: Division Household Surveys
Het geïnstalleerde energie vermogen laat een daling zien in 2011 na een stijging in 2010. Aan de andere kant laat het aantal aansluitingen een constante stijging zien. Ruwe olie productie haalde tussen 2008 en 2011 een gemiddelde van 6.0 mln. barrels per jaar, terwijl door natuur gas een gemiddelde productie van 600 SCFD (x1000) werd gehaald, zie tabel 7.5 voor meer detail informatie. Er was een zeer lichte teruggang in de productie van ruwe olie in 2010, maar het begon weer te stijgen in 2011.
The installed energy capacity is showing a decline in 2011 after an increase in 2010. Number of connections on the other hand is showing a constant increase. Between 2008 and 2011, crude oil production averaged 6.0 mln. barrels per year, while natural gas production averaged 550 SCFD (x1000) per year, see table 7.5 below for more detail information. There was a very slight decline in the Crude oil production in 2010, but it started to rise again in 2011.
Tabel 7.4: Totale elektriciteit aansluitingen en geïnstalleerde vermogen, 2008 – 2011
Table 7.4: Total Electricity Connection via EBS and the Installed Capacity, 2008-2011
Bron: NV Energie Bedrijven Suriname / Source: Suriname Energy Company Noot: Aantal aansluitingen is per huishouden en Geinstallerd vermogen in Kwh Note: Direct Connection per household and Installed Capacity in Kwh
Type Geïnstalleerd vermogen/ Installed Capacity (Kwh)
Aantal aansluitingen/ Number of Connections
2008 96,607 120,084
2009 103,007 124,906
2010 123,570 129,304
2011 122,700 133,249
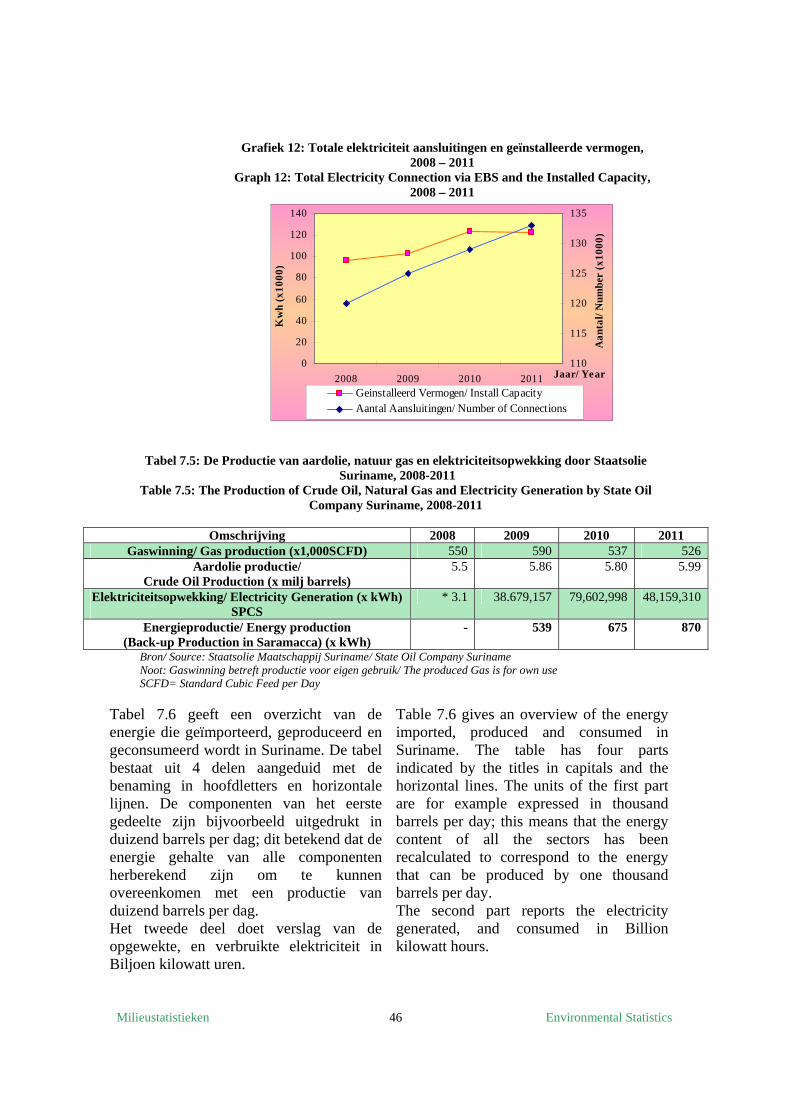
Milieustatistieken Environmental Statistics 46
Grafiek 12: Totale elektriciteit aansluitingen en geïnstalleerde vermogen, 2008 – 2011
Graph 12: Total Electricity Connection via EBS and the Installed Capacity, 2008 – 2011
Tabel 7.5: De Productie van aardolie, natuur gas en elektriciteitsopwekking door Staatsolie Suriname, 2008-2011
Table 7.5: The Production of Crude Oil, Natural Gas and Electricity Generation by State Oil Company Suriname, 2008-2011
Omschrijving 2008 2009 2010 2011
Gaswinning/ Gas production (x1,000SCFD) 550 590 537 526 Aardolie productie/
Crude Oil Production (x milj barrels) 5.5 5.86 5.80 5.99
Elektriciteitsopwekking/ Electricity Generation (x kWh) SPCS
* 3.1 38.679,157 79,602,998 48,159,310
Energieproductie/ Energy production (Back-up Production in Saramacca) (x kWh)
- 539 675 870
Bron/ Source: Staatsolie Maatschappij Suriname/ State Oil Company Suriname Noot: Gaswinning betreft productie voor eigen gebruik/ The produced Gas is for own use SCFD= Standard Cubic Feed per Day
Tabel 7.6 geeft een overzicht van de energie die geïmporteerd, geproduceerd en geconsumeerd wordt in Suriname. De tabel bestaat uit 4 delen aangeduid met de benaming in hoofdletters en horizontale lijnen. De componenten van het eerste gedeelte zijn bijvoorbeeld uitgedrukt in duizend barrels per dag; dit betekend dat de energie gehalte van alle componenten herberekend zijn om te kunnen overeenkomen met een productie van duizend barrels per dag. Het tweede deel doet verslag van de opgewekte, en verbruikte elektriciteit in Biljoen kilowatt uren.
Table 7.6 gives an overview of the energy imported, produced and consumed in Suriname. The table has four parts indicated by the titles in capitals and the horizontal lines. The units of the first part are for example expressed in thousand barrels per day; this means that the energy content of all the sectors has been recalculated to correspond to the energy that can be produced by one thousand barrels per day. The second part reports the electricity generated, and consumed in Billion kilowatt hours.
0
20
40
60
80
100
120
140
2008 2009 2010 2011 Jaar/ Year
Kw
h (x
1000
)
110
115
120
125
130
135
Aan
tal/
Num
ber
(x10
00)
Geinstalleerd Vermogen/ Install CapacityAantal Aansluitingen/ Number of Connections
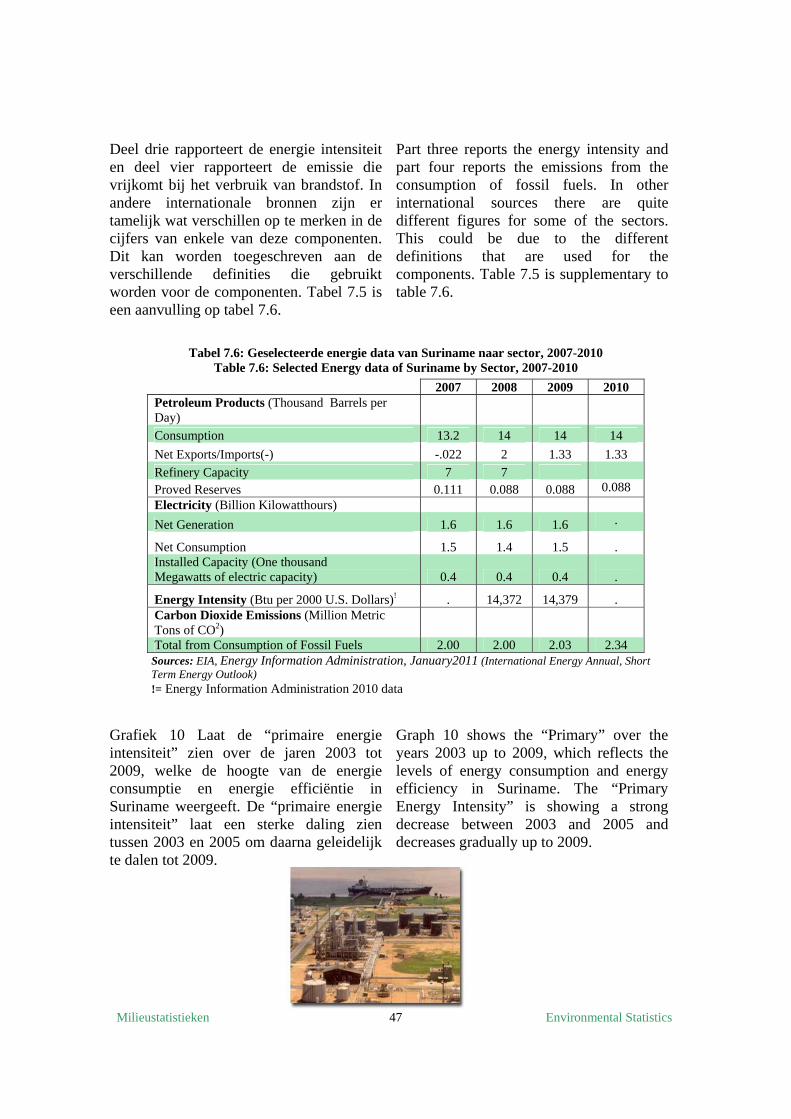
Milieustatistieken Environmental Statistics 47
Deel drie rapporteert de energie intensiteit en deel vier rapporteert de emissie die vrijkomt bij het verbruik van brandstof. In andere internationale bronnen zijn er tamelijk wat verschillen op te merken in de cijfers van enkele van deze componenten. Dit kan worden toegeschreven aan de verschillende definities die gebruikt worden voor de componenten. Tabel 7.5 is een aanvulling op tabel 7.6.
Part three reports the energy intensity and part four reports the emissions from the consumption of fossil fuels. In other international sources there are quite different figures for some of the sectors. This could be due to the different definitions that are used for the components. Table 7.5 is supplementary to table 7.6.
Tabel 7.6: Geselecteerde energie data van Suriname naar sector, 2007-2010
Table 7.6: Selected Energy data of Suriname by Sector, 2007-2010
Sources: EIA, Energy Information Administration, January2011 (International Energy Annual, Short Term Energy Outlook)
!= Energy Information Administration 2010 data
Grafiek 10 Laat de “primaire energie intensiteit” zien over de jaren 2003 tot 2009, welke de hoogte van de energie consumptie en energie efficiëntie in Suriname weergeeft. De “primaire energie intensiteit” laat een sterke daling zien tussen 2003 en 2005 om daarna geleidelijk te dalen tot 2009.
Graph 10 shows the “Primary” over the years 2003 up to 2009, which reflects the levels of energy consumption and energy efficiency in Suriname. The “Primary Energy Intensity” is showing a strong decrease between 2003 and 2005 and decreases gradually up to 2009.
2007 2008 2009 2010 Petroleum Products (Thousand Barrels per Day)
Consumption 13.2 14 14 14
Net Exports/Imports(-) -.022 2 1.33 1.33
Refinery Capacity 7 7
Proved Reserves 0.111 0.088 0.088 0.088 Electricity (Billion Kilowatthours)
Net Generation 1.6 1.6 1.6 .
Net Consumption 1.5 1.4 1.5 . Installed Capacity (One thousand Megawatts of electric capacity) 0.4 0.4 0.4
.
Energy Intensity (Btu per 2000 U.S. Dollars)! . 14,372 14,379 . Carbon Dioxide Emissions (Million Metric Tons of CO2)
Total from Consumption of Fossil Fuels 2.00 2.00 2.03 2.34
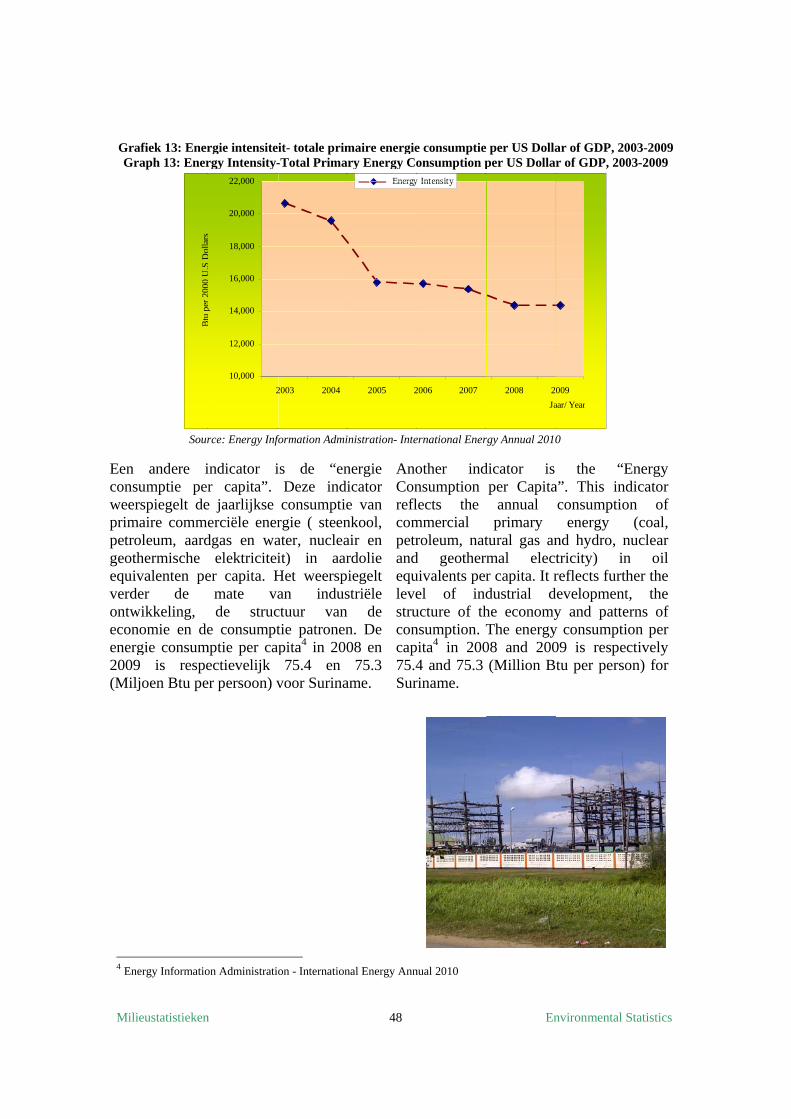
Mili
GraGr
Een consuweerprimpetrogeothequivverdeontweconenerg2009(Milj
4 Ene
eustatistieken
afiek 13: Eneraph 13: Ener
Sour
andere iumptie perrspiegelt deaire comme
oleum, aardhermische valenten peer de
wikkeling, omie en degie consum9 is respejoen Btu pe
ergy Informatio
Btu
per
200
0 U
.S D
olla
rs
n
rgie intensitergy Intensity-
rce: Energy Inf
indicator ir capita”.
e jaarlijkse erciële enerdgas en wa
elektriciteier capita. H
mate vade struc
e consumptmptie per cap
ectievelijk r persoon) v
on Administratio
10,000
12,000
14,000
16,000
18,000
20,000
22,000
2
p
it- totale prim-Total Prima
formation Admi
is de “enDeze indiconsumptie
rgie ( steenater, nucleait) in aarHet weerspan indusctuur van tie patronenpita4 in 20075.4 en
voor Surina
on - Internation
2003 2004
48
maire energiery Energy Co
inistration- Inte
nergie icator e van nkool, air en rdolie iegelt striële
de n. De 08 en
75.3 ame.
AnoConreflcompetrandequlevestruconcap75.4Sur
nal Energy Ann
2005 2
Energy
e consumptie onsumption p
ernational Energ
other indnsumption ects the
mmercial roleum, nat
d geothermuivalents perel of inducture of thnsumption. Tita4 in 2004 and 75.3riname.
nual 2010
2006 2007
y Intensity
En
per US Dollaper US Dollar
rgy Annual 2010
dicator is per Capita
annual primary
tural gas anmal electr capita. It rdustrial dhe economyThe energy08 and 200(Million Bt
2008 20
Ja
nvironmental
ar of GDP, 20r of GDP, 200
0
the “Ea”. This indconsumptio
energy nd hydro, ntricity) inreflects furthevelopmenty and patte
y consumpti09 is respetu per perso
009
aar/ Year
Statistics
003-2009 03-2009
Energy dicator on of
(coal, nuclear n oil her the t, the erns of ion per ctively on) for
Milieustatistieken Environmental Statistics 49
Mineralen De goudcijfers zijn afkomstig van de Centrale Bank van Suriname en deze beperken zich tot de kleinschalige goudwinning en wel slechts het deel dat voor export wordt aangeboden (zie tabel 7.7).
Minerals The gold figures are from the Central Bank of Suriname and are restricted to the small scale gold mining, namely the part that is offered for export (see table 7.7).
Tabel 7.7: Maandelijkse goudexport in gram, 2008-2011 Table 7.7: Monthly Gold Export in Gram, 2008-2011
Maand/ Month Goudexport/ Gold Export 2008 2009 2010 2011
Januari/ January 1,234,508.70 1,297,804.10 1,226,866.60 1,203,861.60 Februari/ February 1,323,021.30 1,264,386.50 1,299,372.60 1,394,207.00
Maart/ March 1,221,627.60 1,486,956.60 1,668,664.60 1,725,118.40 April/ April 1,233,100.10 1,273,659.50 1,544,837.20 1,761,038.80 Mei/ May 1,541,091.20 1,405,654.20 1,346,923.30 1,568,209.10 Juni/ June 1,398,552.30 1,388,098.50 1,556,879.00 1,544,742.60 Juli/ July 1,576,544.00 1,235,271.20 1,407,419.10 1,730,990.50
Augustus/ August 1,159,874.10 1,180,840.20 1,560,963.50 1,546,916.40 September/ September 1,490,411.30 1,535,863.70 1,487,092.10 1,697,108.10
Oktober/ October 1,273,786.20 1,398,370.80 1,560,613.10 1,493,609.10 November/ November 1,280,793.90 1,412,345.90 1,634,671.60 1,739,891.50 December/ December 1,732,418.00 1,617,360.70 1,812,376.90 1,785,958.00
Totaal/ Total 16,465,728.70 16,496,611.90 18,106,679.60 19,191,651.10 Bron: Centrale Bank van Suriname/ Source: Central Bank of Suriname
De meest gebruikte methode om te komen tot fijn afgewerkt goud heeft een kwik basis. Ruw gesproken, voor elke bewerkte kilogram goud, zal dezelfde hoeveelheid kwik worden gebruikt. Bauxiet winning en verwerking gaat gepaard met de volgende invloeden, met name: verlies van boslandschap en habitat, emissies, kwikdamp, aluinaarde stof, bauxiet residuen en oppervlakte- en grondwater vervuiling. De productie- en exportcijfers van bauxiet zijn te zien in tabel 7.8, terwijl in de tabellen 7.9, 7.10 en 7.11 data te zien zijn met betrekking tot goudmijnrechten, bouwmaterialen productie en soort concessie naar district en materiaal.
The most common method used to recover fine-grained gold is mercury based. Roughly speaking, for each kilogram of gold recovered, the same amount of mercury is used. Bauxite mining and processing goes together with the following impacts, namely: loss of forest land and habitat, emissions, mercury vapor, alumina dust, bauxite residue and surface and ground water pollution. The production and export figures of bauxite are found in table 7.8, while in the tables 7.9, 7.10 and 7.11 data are found with regard to gold mining rights, the production of building materials and kind of concession by district and material.
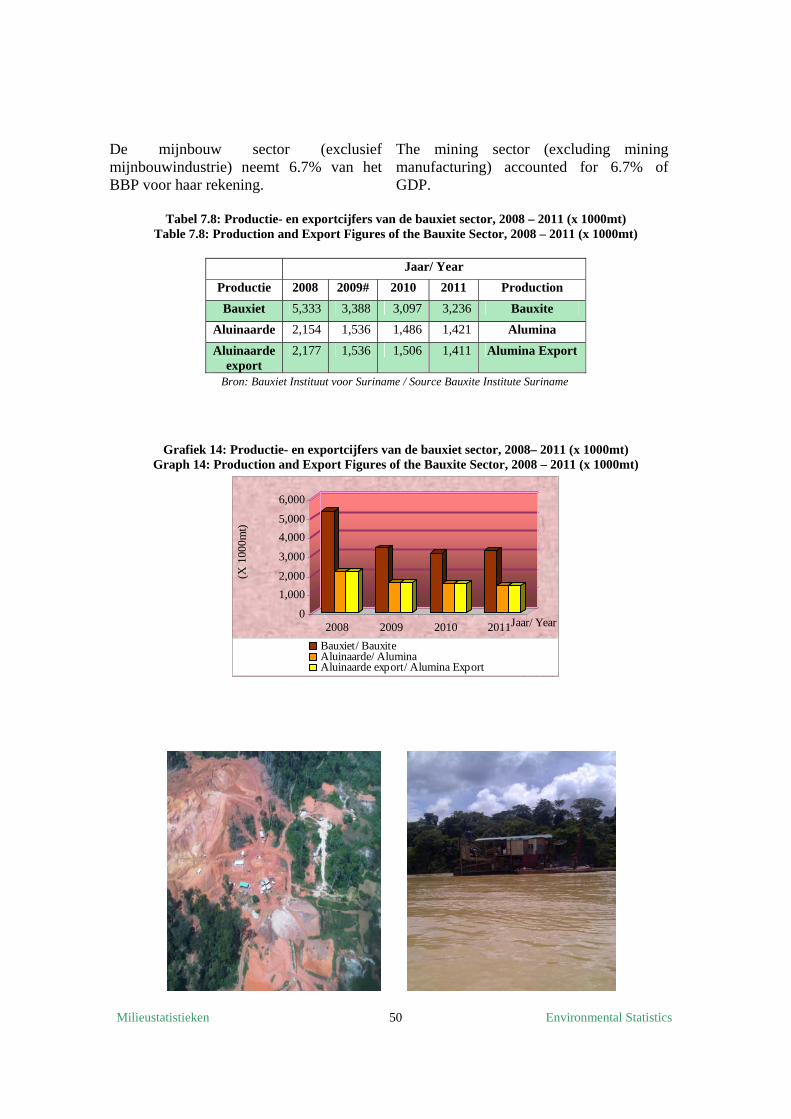
Milieustatistieken Environmental Statistics 50
De mijnbouw sector (exclusief mijnbouwindustrie) neemt 6.7% van het BBP voor haar rekening.
The mining sector (excluding mining manufacturing) accounted for 6.7% of GDP.
Tabel 7.8: Productie- en exportcijfers van de bauxiet sector, 2008 – 2011 (x 1000mt) Table 7.8: Production and Export Figures of the Bauxite Sector, 2008 – 2011 (x 1000mt)
Bron: Bauxiet Instituut voor Suriname / Source Bauxite Institute Suriname
Grafiek 14: Productie- en exportcijfers van de bauxiet sector, 2008– 2011 (x 1000mt) Graph 14: Production and Export Figures of the Bauxite Sector, 2008 – 2011 (x 1000mt)
0
1,000
2,000
3,000
4,000
5,000
6,000
(X 1
000m
t)
2008 2009 2010 2011Jaar/ Year
Bauxiet/ BauxiteAluinaarde/ Alumina Aluinaarde export/ Alumina Export
Jaar/ Year
Productie 2008 2009# 2010 2011 Production
Bauxiet 5,333 3,388 3,097 3,236 Bauxite
Aluinaarde 2,154 1,536 1,486 1,421 Alumina
Aluinaarde export
2,177 1,536 1,506 1,411 Alumina Export
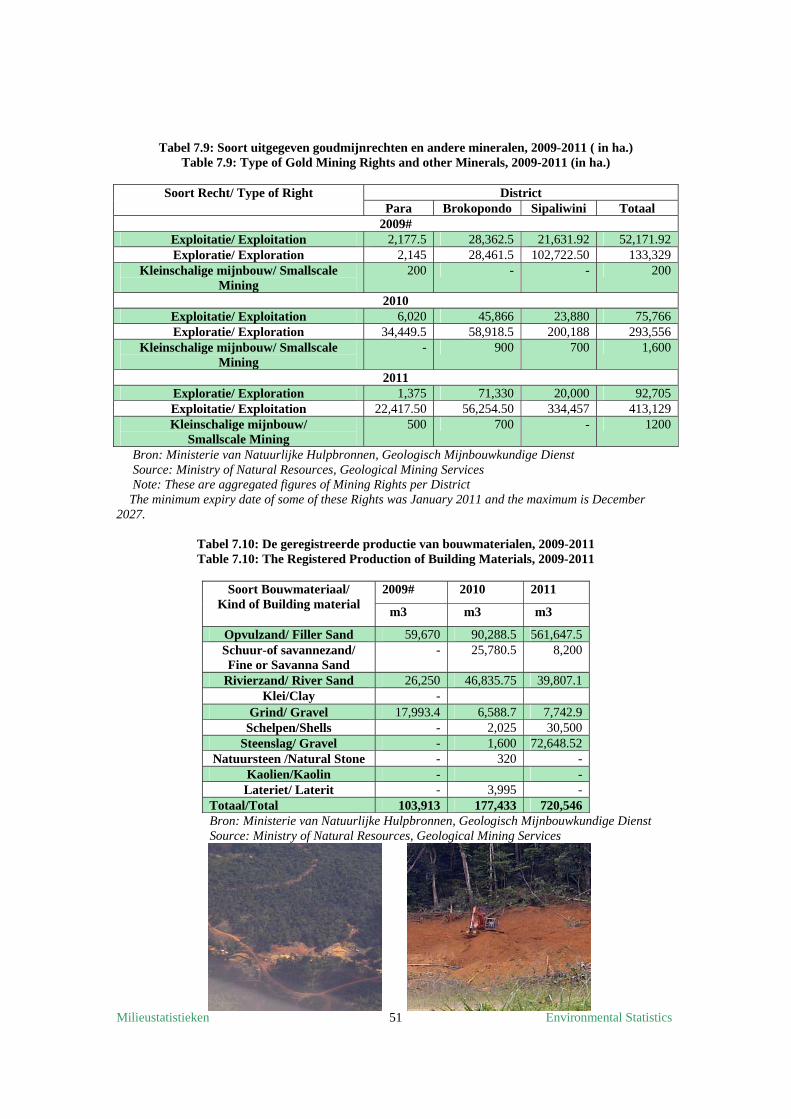
Milieustatistieken Environmental Statistics 51
Tabel 7.9: Soort uitgegeven goudmijnrechten en andere mineralen, 2009-2011 ( in ha.) Table 7.9: Type of Gold Mining Rights and other Minerals, 2009-2011 (in ha.)
Soort Recht/ Type of Right District
Para Brokopondo Sipaliwini Totaal 2009#
Exploitatie/ Exploitation 2,177.5 28,362.5 21,631.92 52,171.92 Exploratie/ Exploration 2,145 28,461.5 102,722.50 133,329
Kleinschalige mijnbouw/ Smallscale Mining
200 - - 200
2010 Exploitatie/ Exploitation 6,020 45,866 23,880 75,766 Exploratie/ Exploration 34,449.5 58,918.5 200,188 293,556
Kleinschalige mijnbouw/ Smallscale Mining
- 900 700 1,600
2011 Exploratie/ Exploration 1,375 71,330 20,000 92,705 Exploitatie/ Exploitation 22,417.50 56,254.50 334,457 413,129 Kleinschalige mijnbouw/
Smallscale Mining 500 700 - 1200
Bron: Ministerie van Natuurlijke Hulpbronnen, Geologisch Mijnbouwkundige Dienst Source: Ministry of Natural Resources, Geological Mining Services Note: These are aggregated figures of Mining Rights per District The minimum expiry date of some of these Rights was January 2011 and the maximum is December 2027.
Tabel 7.10: De geregistreerde productie van bouwmaterialen, 2009-2011 Table 7.10: The Registered Production of Building Materials, 2009-2011
Soort Bouwmateriaal/
Kind of Building material 2009# 2010 2011
m3 m3 m3
Opvulzand/ Filler Sand 59,670 90,288.5 561,647.5 Schuur-of savannezand/ Fine or Savanna Sand
- 25,780.5 8,200
Rivierzand/ River Sand 26,250 46,835.75 39,807.1 Klei/Clay -
Grind/ Gravel 17,993.4 6,588.7 7,742.9 Schelpen/Shells - 2,025 30,500
Steenslag/ Gravel - 1,600 72,648.52 Natuursteen /Natural Stone - 320 -
Kaolien/Kaolin - - Lateriet/ Laterit - 3,995 -
Totaal/Total 103,913 177,433 720,546 Bron: Ministerie van Natuurlijke Hulpbronnen, Geologisch Mijnbouwkundige Dienst Source: Ministry of Natural Resources, Geological Mining Services
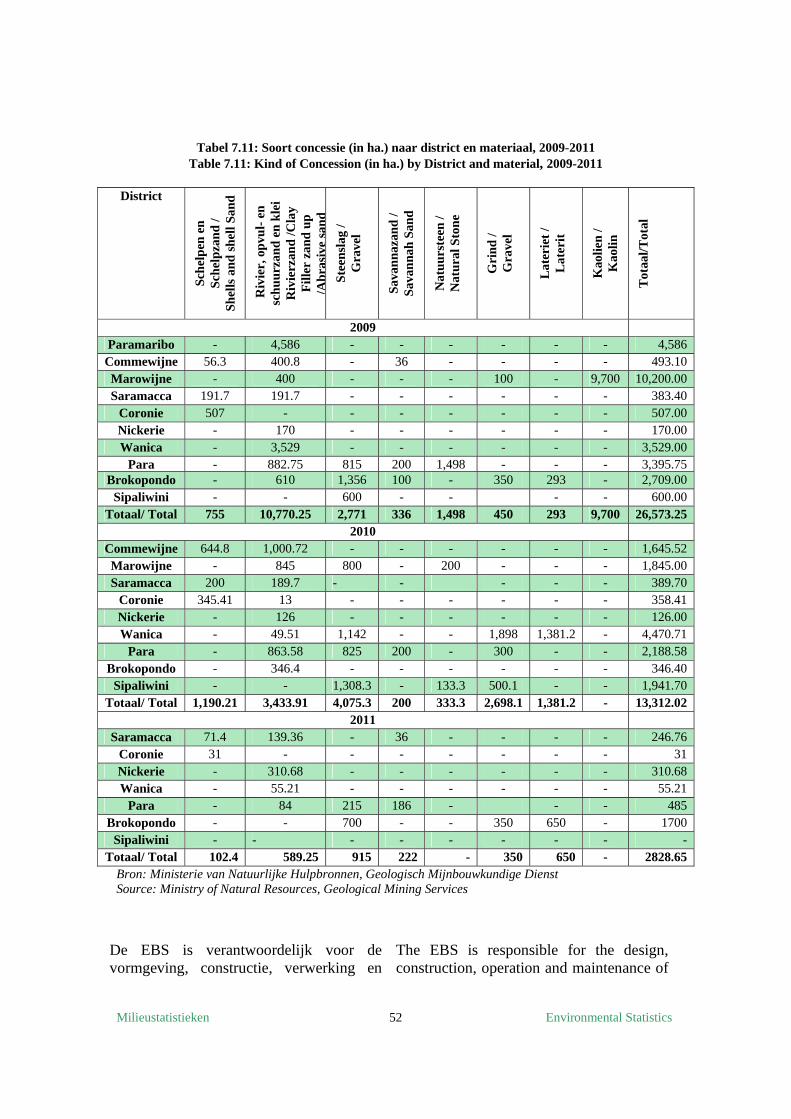
Milieustatistieken Environmental Statistics 52
Tabel 7.11: Soort concessie (in ha.) naar district en materiaal, 2009-2011 Table 7.11: Kind of Concession (in ha.) by District and material, 2009-2011
District
Sch
elp
en e
n S
chel
pza
nd
/ S
hel
ls a
nd
sh
ell S
and
Riv
ier,
op
vul-
en
sc
hu
urz
and
en
kle
i R
ivie
rzan
d /C
lay
Fil
ler
zan
d u
p
/Ab
rasi
vesa
nd
Ste
ensl
ag /
Gra
vel
Sav
ann
azan
d /
Sav
ann
ah S
and
Nat
uu
rste
en /
Nat
ura
l Sto
ne
Gri
nd /
Gra
vel
Lat
erie
t /
Lat
erit
Kao
lien
/ K
aolin
Tot
aal/T
otal
2009 Paramaribo - 4,586 - - - - - - 4,586
Commewijne 56.3 400.8 - 36 - - - - 493.10 Marowijne - 400 - - - 100 - 9,700 10,200.00 Saramacca 191.7 191.7 - - - - - - 383.40
Coronie 507 - - - - - - - 507.00 Nickerie - 170 - - - - - - 170.00 Wanica - 3,529 - - - - - - 3,529.00
Para - 882.75 815 200 1,498 - - - 3,395.75 Brokopondo - 610 1,356 100 - 350 293 - 2,709.00
Sipaliwini - - 600 - - - - 600.00 Totaal/ Total 755 10,770.25 2,771 336 1,498 450 293 9,700 26,573.25
2010 Commewijne 644.8 1,000.72 - - - - - - 1,645.52 Marowijne - 845 800 - 200 - - - 1,845.00 Saramacca 200 189.7 - - - - - 389.70
Coronie 345.41 13 - - - - - - 358.41 Nickerie - 126 - - - - - - 126.00 Wanica - 49.51 1,142 - - 1,898 1,381.2 - 4,470.71
Para - 863.58 825 200 - 300 - - 2,188.58 Brokopondo - 346.4 - - - - - - 346.40
Sipaliwini - - 1,308.3 - 133.3 500.1 - - 1,941.70 Totaal/ Total 1,190.21 3,433.91 4,075.3 200 333.3 2,698.1 1,381.2 - 13,312.02
2011 Saramacca 71.4 139.36 - 36 - - - - 246.76
Coronie 31 - - - - - - - 31 Nickerie - 310.68 - - - - - - 310.68 Wanica - 55.21 - - - - - - 55.21
Para - 84 215 186 - - - 485 Brokopondo - - 700 - - 350 650 - 1700
Sipaliwini - - - - - - - - - Totaal/ Total 102.4 589.25 915 222 - 350 650 - 2828.65
Bron: Ministerie van Natuurlijke Hulpbronnen, Geologisch Mijnbouwkundige Dienst Source: Ministry of Natural Resources, Geological Mining Services
De EBS is verantwoordelijk voor de vormgeving, constructie, verwerking en
The EBS is responsible for the design, construction, operation and maintenance of
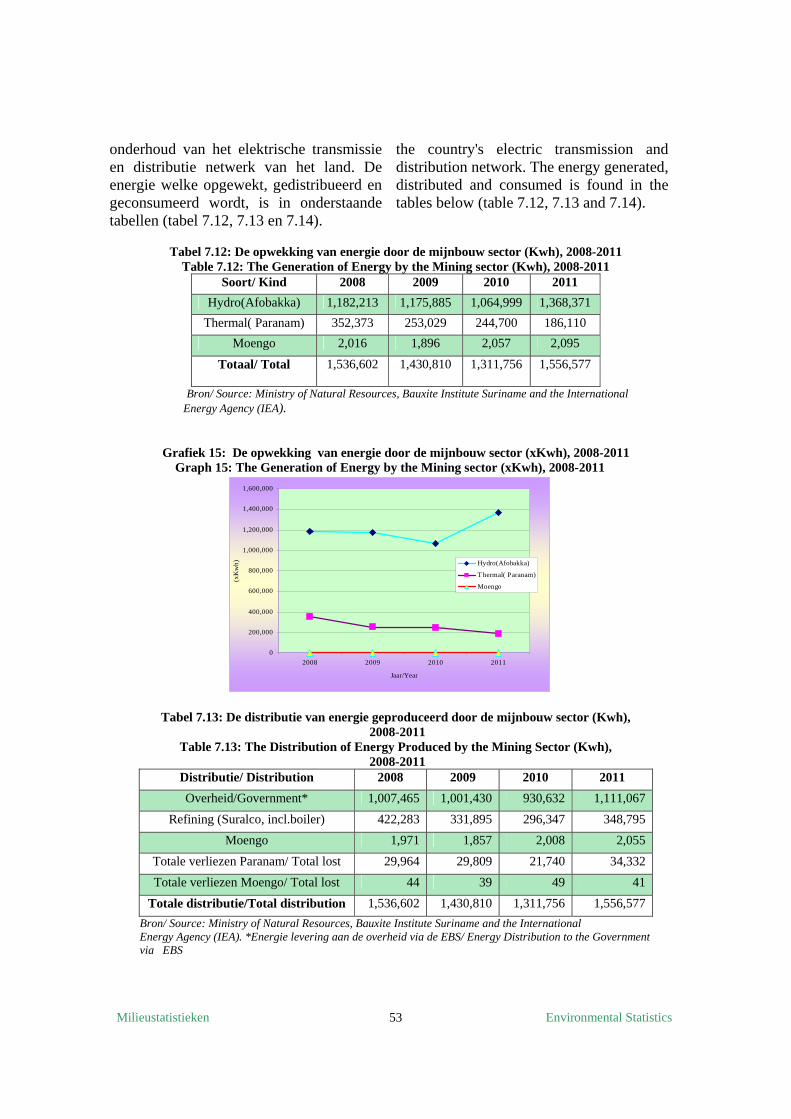
Milieustatistieken Environmental Statistics 53
onderhoud van het elektrische transmissie en distributie netwerk van het land. De energie welke opgewekt, gedistribueerd en geconsumeerd wordt, is in onderstaande tabellen (tabel 7.12, 7.13 en 7.14).
the country's electric transmission and distribution network. The energy generated, distributed and consumed is found in the tables below (table 7.12, 7.13 and 7.14).
Tabel 7.12: De opwekking van energie door de mijnbouw sector (Kwh), 2008-2011 Table 7.12: The Generation of Energy by the Mining sector (Kwh), 2008-2011
Soort/ Kind 2008 2009 2010 2011
Hydro(Afobakka) 1,182,213 1,175,885 1,064,999 1,368,371
Thermal( Paranam) 352,373 253,029 244,700 186,110
Moengo 2,016 1,896 2,057 2,095
Totaal/ Total 1,536,602
1,430,810
1,311,756
1,556,577
Bron/ Source: Ministry of Natural Resources, Bauxite Institute Suriname and the International Energy Agency (IEA).
Grafiek 15: De opwekking van energie door de mijnbouw sector (xKwh), 2008-2011
Graph 15: The Generation of Energy by the Mining sector (xKwh), 2008-2011
Tabel 7.13: De distributie van energie geproduceerd door de mijnbouw sector (Kwh), 2008-2011
Table 7.13: The Distribution of Energy Produced by the Mining Sector (Kwh), 2008-2011
Distributie/ Distribution 2008 2009 2010 2011
Overheid/Government* 1,007,465 1,001,430 930,632 1,111,067
Refining (Suralco, incl.boiler) 422,283 331,895 296,347 348,795
Moengo 1,971 1,857 2,008 2,055
Totale verliezen Paranam/ Total lost 29,964 29,809 21,740 34,332
Totale verliezen Moengo/ Total lost 44 39 49 41
Totale distributie/Total distribution 1,536,602 1,430,810 1,311,756 1,556,577
Bron/ Source: Ministry of Natural Resources, Bauxite Institute Suriname and the International Energy Agency (IEA). *Energie levering aan de overheid via de EBS/ Energy Distribution to the Government via EBS
0
200,000
400,000
600,000
800,000
1,000,000
1,200,000
1,400,000
1,600,000
2008 2009 2010 2011
Jaar/Year
(xK
wh) Hydro(Afobakka)
Thermal( Paranam)
Moengo
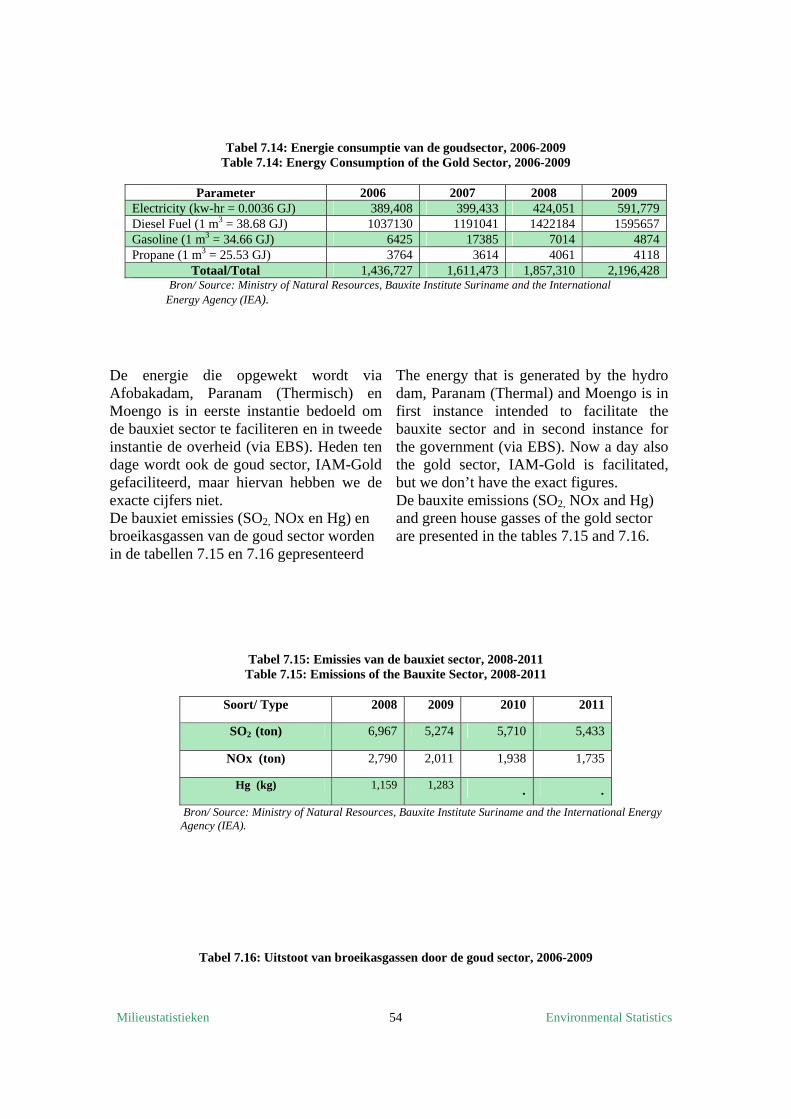
Milieustatistieken Environmental Statistics 54
Tabel 7.14: Energie consumptie van de goudsector, 2006-2009 Table 7.14: Energy Consumption of the Gold Sector, 2006-2009
Parameter 2006 2007 2008 2009
Electricity (kw-hr = 0.0036 GJ) 389,408 399,433 424,051 591,779 Diesel Fuel (1 m3 = 38.68 GJ) 1037130 1191041 1422184 1595657 Gasoline (1 m3 = 34.66 GJ) 6425 17385 7014 4874 Propane (1 m3 = 25.53 GJ) 3764 3614 4061 4118
Totaal/Total 1,436,727 1,611,473 1,857,310 2,196,428 Bron/ Source: Ministry of Natural Resources, Bauxite Institute Suriname and the International
Energy Agency (IEA).
De energie die opgewekt wordt via Afobakadam, Paranam (Thermisch) en Moengo is in eerste instantie bedoeld om de bauxiet sector te faciliteren en in tweede instantie de overheid (via EBS). Heden ten dage wordt ook de goud sector, IAM-Gold gefaciliteerd, maar hiervan hebben we de exacte cijfers niet. De bauxiet emissies (SO2, NOx en Hg) en broeikasgassen van de goud sector worden in de tabellen 7.15 en 7.16 gepresenteerd
The energy that is generated by the hydro dam, Paranam (Thermal) and Moengo is in first instance intended to facilitate the bauxite sector and in second instance for the government (via EBS). Now a day also the gold sector, IAM-Gold is facilitated, but we don’t have the exact figures. De bauxite emissions (SO2, NOx and Hg) and green house gasses of the gold sector are presented in the tables 7.15 and 7.16.
Tabel 7.15: Emissies van de bauxiet sector, 2008-2011 Table 7.15: Emissions of the Bauxite Sector, 2008-2011
Soort/ Type 2008 2009 2010 2011
SO2 (ton) 6,967 5,274 5,710 5,433
NOx (ton) 2,790 2,011 1,938 1,735
Hg (kg) 1,159 1,283 . . Bron/ Source: Ministry of Natural Resources, Bauxite Institute Suriname and the International Energy Agency (IEA).
Tabel 7.16: Uitstoot van broeikasgassen door de goud sector, 2006-2009
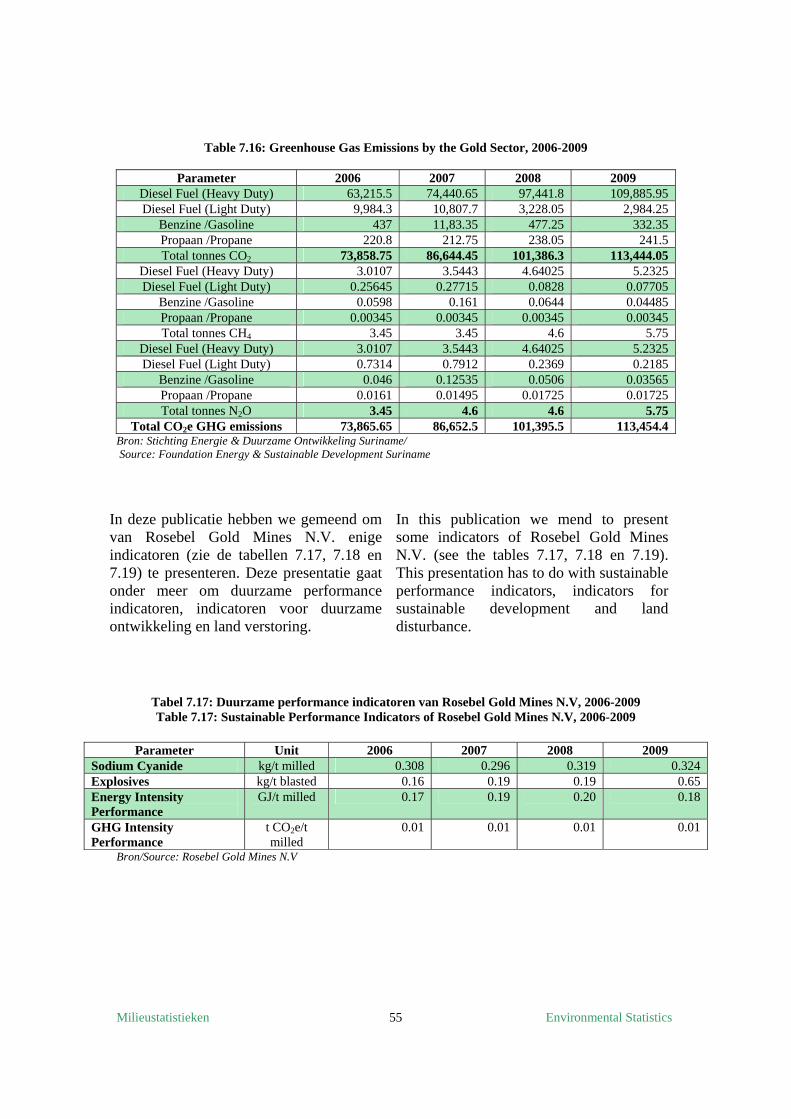
Milieustatistieken Environmental Statistics 55
Table 7.16: Greenhouse Gas Emissions by the Gold Sector, 2006-2009
Parameter 2006 2007 2008 2009 Diesel Fuel (Heavy Duty) 63,215.5 74,440.65 97,441.8 109,885.95Diesel Fuel (Light Duty) 9,984.3 10,807.7 3,228.05 2,984.25
Benzine /Gasoline 437 11,83.35 477.25 332.35Propaan /Propane 220.8 212.75 238.05 241.5 Total tonnes CO2 73,858.75 86,644.45 101,386.3 113,444.05
Diesel Fuel (Heavy Duty) 3.0107 3.5443 4.64025 5.2325 Diesel Fuel (Light Duty) 0.25645 0.27715 0.0828 0.07705
Benzine /Gasoline 0.0598 0.161 0.0644 0.04485 Propaan /Propane 0.00345 0.00345 0.00345 0.00345 Total tonnes CH4 3.45 3.45 4.6 5.75
Diesel Fuel (Heavy Duty) 3.0107 3.5443 4.64025 5.2325 Diesel Fuel (Light Duty) 0.7314 0.7912 0.2369 0.2185
Benzine /Gasoline 0.046 0.12535 0.0506 0.03565 Propaan /Propane 0.0161 0.01495 0.01725 0.01725 Total tonnes N2O 3.45 4.6 4.6 5.75
Total CO2e GHG emissions 73,865.65 86,652.5 101,395.5 113,454.4 Bron: Stichting Energie & Duurzame Ontwikkeling Suriname/ Source: Foundation Energy & Sustainable Development Suriname
In deze publicatie hebben we gemeend om van Rosebel Gold Mines N.V. enige indicatoren (zie de tabellen 7.17, 7.18 en 7.19) te presenteren. Deze presentatie gaat onder meer om duurzame performance indicatoren, indicatoren voor duurzame ontwikkeling en land verstoring.
In this publication we mend to present some indicators of Rosebel Gold Mines N.V. (see the tables 7.17, 7.18 en 7.19). This presentation has to do with sustainable performance indicators, indicators for sustainable development and land disturbance.
Tabel 7.17: Duurzame performance indicatoren van Rosebel Gold Mines N.V, 2006-2009 Table 7.17: Sustainable Performance Indicators of Rosebel Gold Mines N.V, 2006-2009
Parameter Unit 2006 2007 2008 2009
Sodium Cyanide kg/t milled 0.308 0.296 0.319 0.324 Explosives kg/t blasted 0.16 0.19 0.19 0.65 Energy Intensity Performance
GJ/t milled 0.17 0.19 0.20 0.18
GHG Intensity Performance
t CO2e/t milled
0.01 0.01 0.01 0.01
Bron/Source: Rosebel Gold Mines N.V
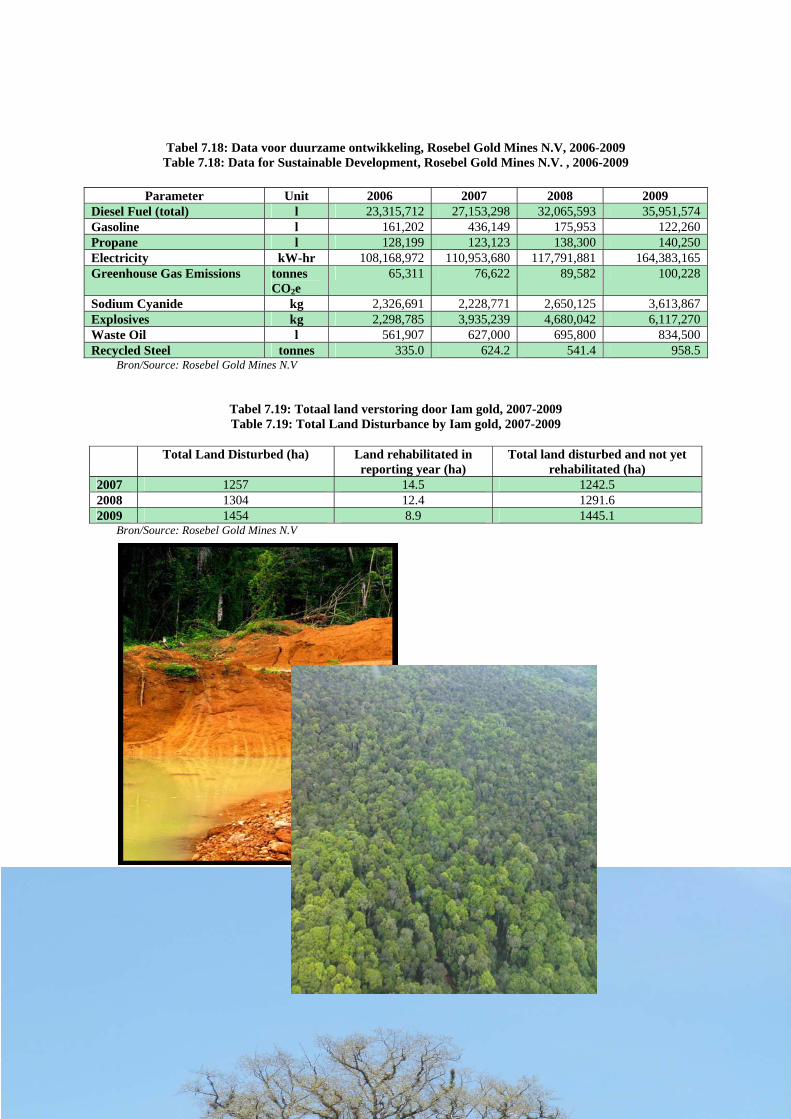
Milieustatistieken Environmental Statistics 56
Tabel 7.18: Data voor duurzame ontwikkeling, Rosebel Gold Mines N.V, 2006-2009 Table 7.18: Data for Sustainable Development, Rosebel Gold Mines N.V. , 2006-2009
Parameter Unit 2006 2007 2008 2009
Diesel Fuel (total) l 23,315,712 27,153,298 32,065,593 35,951,574 Gasoline l 161,202 436,149 175,953 122,260 Propane l 128,199 123,123 138,300 140,250 Electricity kW-hr 108,168,972 110,953,680 117,791,881 164,383,165 Greenhouse Gas Emissions tonnes
CO2e 65,311 76,622 89,582 100,228
Sodium Cyanide kg 2,326,691 2,228,771 2,650,125 3,613,867 Explosives kg 2,298,785 3,935,239 4,680,042 6,117,270 Waste Oil l 561,907 627,000 695,800 834,500 Recycled Steel tonnes 335.0 624.2 541.4 958.5
Bron/Source: Rosebel Gold Mines N.V
Tabel 7.19: Totaal land verstoring door Iam gold, 2007-2009 Table 7.19: Total Land Disturbance by Iam gold, 2007-2009
Total Land Disturbed (ha) Land rehabilitated in
reporting year (ha) Total land disturbed and not yet
rehabilitated (ha) 2007 1257 14.5 1242.5 2008 1304 12.4 1291.6 2009 1454 8.9 1445.1
Bron/Source: Rosebel Gold Mines N.V
Milieustatistieken Environmental Statistics 57
BOSBOUW/
FORESTRY
Bostypen/ Forest types
Rondhout productie/ Log production
Hout export/ Timber Export
Bosbijproducten/ Forest Product
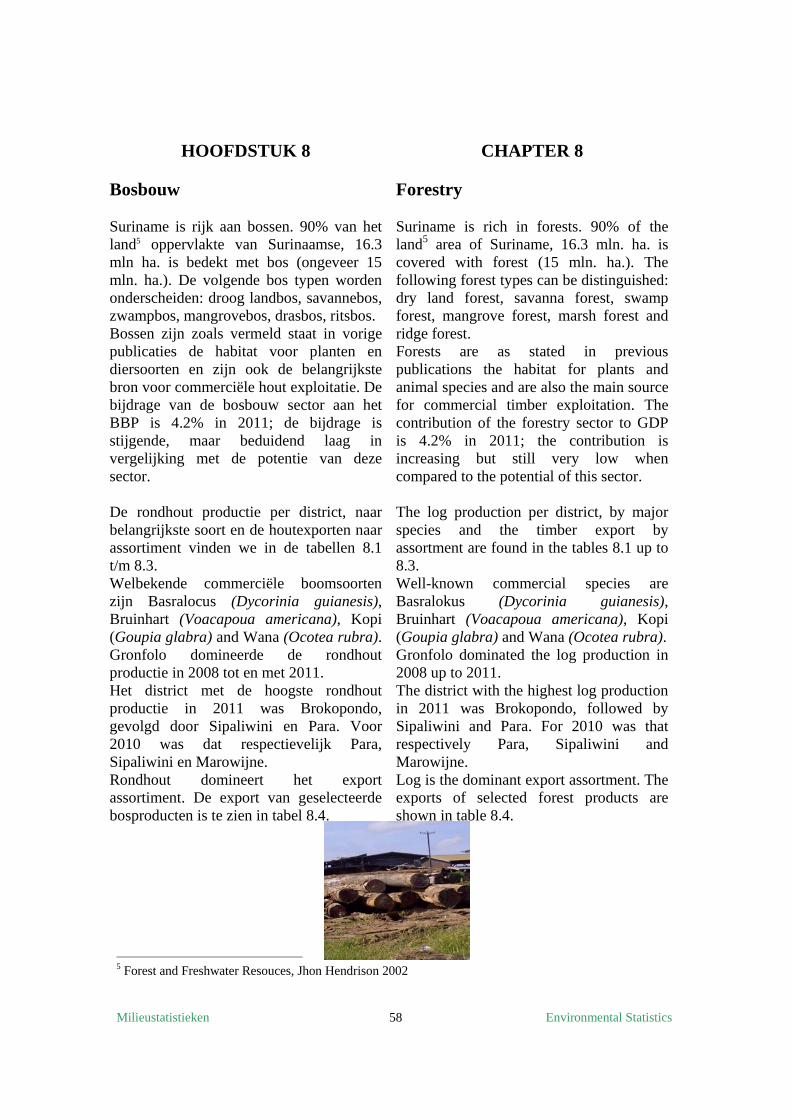
Milieustatistieken Environmental Statistics 58
HOOFDSTUK 8 Bosbouw Suriname is rijk aan bossen. 90% van het land5 oppervlakte van Surinaamse, 16.3 mln ha. is bedekt met bos (ongeveer 15 mln. ha.). De volgende bos typen worden onderscheiden: droog landbos, savannebos, zwampbos, mangrovebos, drasbos, ritsbos. Bossen zijn zoals vermeld staat in vorige publicaties de habitat voor planten en diersoorten en zijn ook de belangrijkste bron voor commerciële hout exploitatie. De bijdrage van de bosbouw sector aan het BBP is 4.2% in 2011; de bijdrage is stijgende, maar beduidend laag in vergelijking met de potentie van deze sector. De rondhout productie per district, naar belangrijkste soort en de houtexporten naar assortiment vinden we in de tabellen 8.1 t/m 8.3. Welbekende commerciële boomsoorten zijn Basralocus (Dycorinia guianesis), Bruinhart (Voacapoua americana), Kopi (Goupia glabra) and Wana (Ocotea rubra). Gronfolo domineerde de rondhout productie in 2008 tot en met 2011. Het district met de hoogste rondhout productie in 2011 was Brokopondo, gevolgd door Sipaliwini en Para. Voor 2010 was dat respectievelijk Para, Sipaliwini en Marowijne. Rondhout domineert het export assortiment. De export van geselecteerde bosproducten is te zien in tabel 8.4.
CHAPTER 8 Forestry Suriname is rich in forests. 90% of the land5 area of Suriname, 16.3 mln. ha. is covered with forest (15 mln. ha.). The following forest types can be distinguished: dry land forest, savanna forest, swamp forest, mangrove forest, marsh forest and ridge forest. Forests are as stated in previous publications the habitat for plants and animal species and are also the main source for commercial timber exploitation. The contribution of the forestry sector to GDP is 4.2% in 2011; the contribution is increasing but still very low when compared to the potential of this sector. The log production per district, by major species and the timber export by assortment are found in the tables 8.1 up to 8.3. Well-known commercial species are Basralokus (Dycorinia guianesis), Bruinhart (Voacapoua americana), Kopi (Goupia glabra) and Wana (Ocotea rubra). Gronfolo dominated the log production in 2008 up to 2011. The district with the highest log production in 2011 was Brokopondo, followed by Sipaliwini and Para. For 2010 was that respectively Para, Sipaliwini and Marowijne. Log is the dominant export assortment. The exports of selected forest products are shown in table 8.4.
5 Forest and Freshwater Resouces, Jhon Hendrison 2002
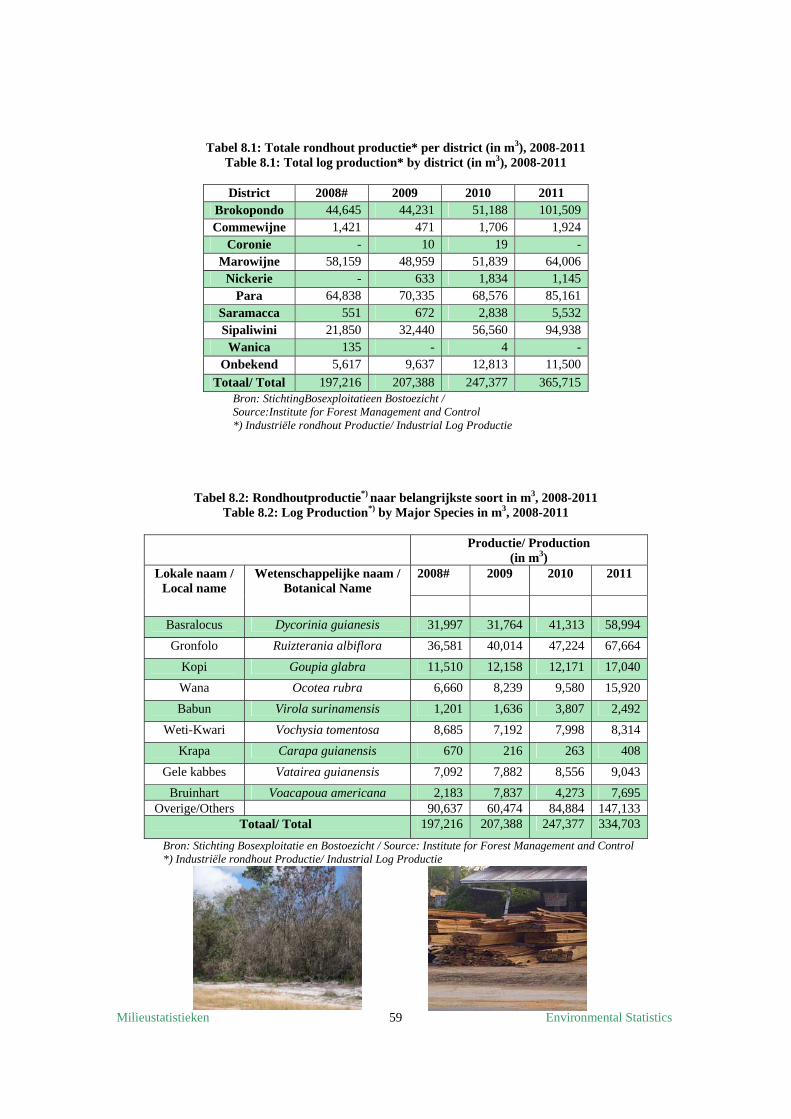
Milieustatistieken Environmental Statistics 59
Tabel 8.1: Totale rondhout productie* per district (in m3), 2008-2011 Table 8.1: Total log production* by district (in m3), 2008-2011
District 2008# 2009 2010 2011
Brokopondo 44,645 44,231 51,188 101,509 Commewijne 1,421 471 1,706 1,924
Coronie - 10 19 - Marowijne 58,159 48,959 51,839 64,006
Nickerie - 633 1,834 1,145 Para 64,838 70,335 68,576 85,161
Saramacca 551 672 2,838 5,532 Sipaliwini 21,850 32,440 56,560 94,938 Wanica 135 - 4 -
Onbekend 5,617 9,637 12,813 11,500
Totaal/ Total 197,216 207,388 247,377 365,715 Bron: StichtingBosexploitatieen Bostoezicht / Source:Institute for Forest Management and Control
*) Industriële rondhout Productie/ Industrial Log Productie
Tabel 8.2: Rondhoutproductie*) naar belangrijkste soort in m3, 2008-2011 Table 8.2: Log Production*) by Major Species in m3, 2008-2011
Productie/ Production
(in m3) Lokale naam /
Local name Wetenschappelijke naam /
Botanical Name 2008#
2009
2010 2011
Basralocus Dycorinia guianesis 31,997 31,764 41,313 58,994
Gronfolo Ruizterania albiflora 36,581 40,014 47,224 67,664
Kopi Goupia glabra 11,510 12,158 12,171 17,040
Wana Ocotea rubra 6,660 8,239 9,580 15,920
Babun Virola surinamensis 1,201 1,636 3,807 2,492
Weti-Kwari Vochysia tomentosa 8,685 7,192 7,998 8,314
Krapa Carapa guianensis 670 216 263 408
Gele kabbes Vatairea guianensis 7,092 7,882 8,556 9,043
Bruinhart Voacapoua americana 2,183 7,837 4,273 7,695 Overige/Others 90,637 60,474 84,884 147,133
Totaal/ Total 197,216 207,388 247,377 334,703
Bron: Stichting Bosexploitatie en Bostoezicht / Source: Institute for Forest Management and Control *) Industriële rondhout Productie/ Industrial Log Productie
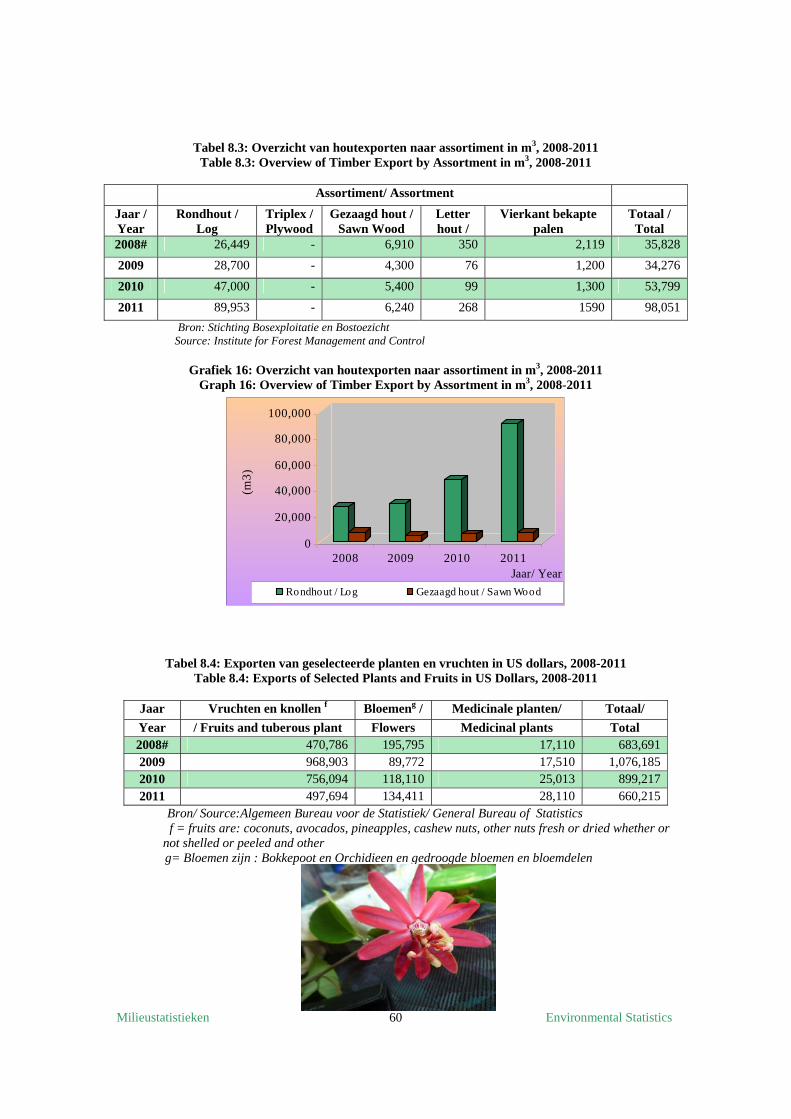
Milieustatistieken Environmental Statistics 60
Tabel 8.3: Overzicht van houtexporten naar assortiment in m3, 2008-2011 Table 8.3: Overview of Timber Export by Assortment in m3, 2008-2011
Assortiment/ Assortment
Jaar / Year
Rondhout / Log
Triplex / Plywood
Gezaagd hout / Sawn Wood
Letter hout /
Vierkant bekapte palen
Totaal / Total
2008# 26,449 - 6,910 350 2,119 35,828
2009 28,700 - 4,300 76 1,200 34,276
2010 47,000 - 5,400 99 1,300 53,799
2011 89,953 - 6,240 268 1590 98,051
Bron: Stichting Bosexploitatie en Bostoezicht Source: Institute for Forest Management and Control
Grafiek 16: Overzicht van houtexporten naar assortiment in m3, 2008-2011
Graph 16: Overview of Timber Export by Assortment in m3, 2008-2011
Tabel 8.4: Exporten van geselecteerde planten en vruchten in US dollars, 2008-2011 Table 8.4: Exports of Selected Plants and Fruits in US Dollars, 2008-2011
Jaar Vruchten en knollen f Bloemeng / Medicinale planten/ Totaal/
Year / Fruits and tuberous plant Flowers Medicinal plants Total 2008# 470,786 195,795 17,110 683,691 2009 968,903 89,772 17,510 1,076,185 2010 756,094 118,110 25,013 899,217 2011 497,694 134,411 28,110 660,215
Bron/ Source:Algemeen Bureau voor de Statistiek/ General Bureau of Statistics f = fruits are: coconuts, avocados, pineapples, cashew nuts, other nuts fresh or dried whether or not shelled or peeled and other
g= Bloemen zijn : Bokkepoot en Orchidieen en gedroogde bloemen en bloemdelen
0
20,000
40,000
60,000
80,000
100,000
(m3)
2008 2009 2010 2011Jaar/ Year
Rondhout / Log Gezaagd hout / Sawn Wood
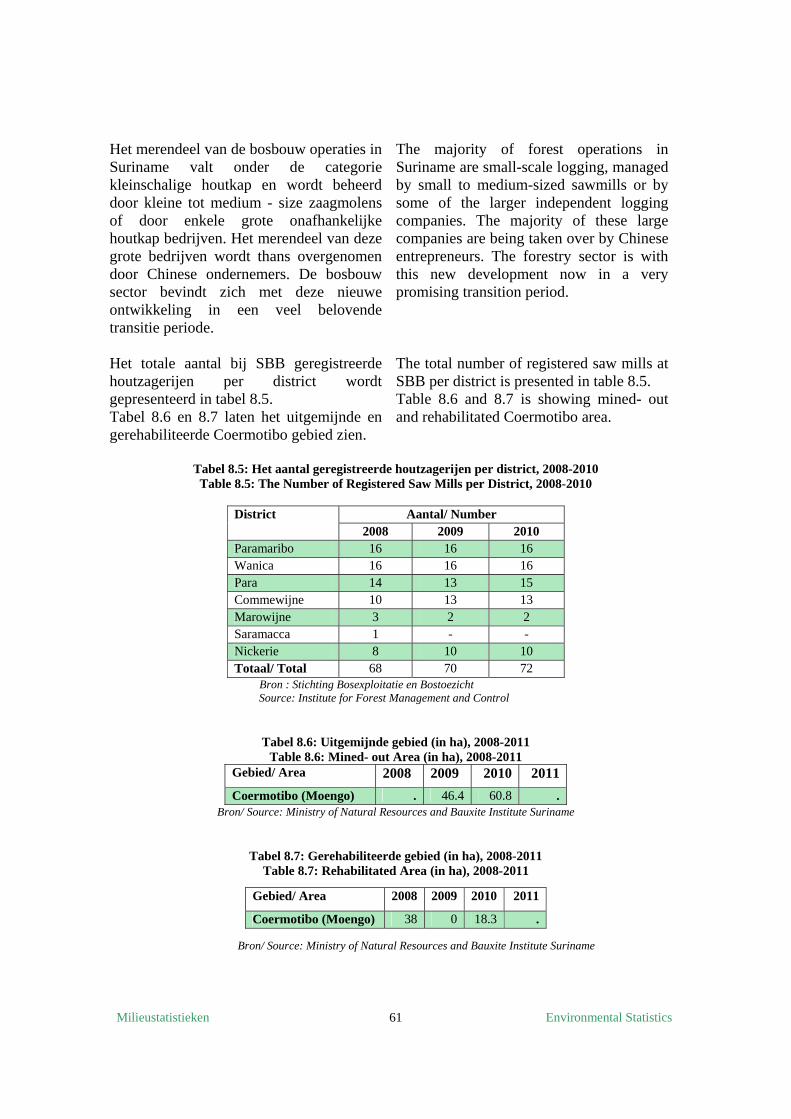
Milieustatistieken Environmental Statistics 61
Het merendeel van de bosbouw operaties in Suriname valt onder de categorie kleinschalige houtkap en wordt beheerd door kleine tot medium - size zaagmolens of door enkele grote onafhankelijke houtkap bedrijven. Het merendeel van deze grote bedrijven wordt thans overgenomen door Chinese ondernemers. De bosbouw sector bevindt zich met deze nieuwe ontwikkeling in een veel belovende transitie periode. Het totale aantal bij SBB geregistreerde houtzagerijen per district wordt gepresenteerd in tabel 8.5. Tabel 8.6 en 8.7 laten het uitgemijnde en gerehabiliteerde Coermotibo gebied zien.
The majority of forest operations in Suriname are small-scale logging, managed by small to medium-sized sawmills or by some of the larger independent logging companies. The majority of these large companies are being taken over by Chinese entrepreneurs. The forestry sector is with this new development now in a very promising transition period. The total number of registered saw mills at SBB per district is presented in table 8.5. Table 8.6 and 8.7 is showing mined- out and rehabilitated Coermotibo area.
Tabel 8.5: Het aantal geregistreerde houtzagerijen per district, 2008-2010 Table 8.5: The Number of Registered Saw Mills per District, 2008-2010
District Aantal/ Number
2008 2009 2010 Paramaribo 16 16 16 Wanica 16 16 16 Para 14 13 15 Commewijne 10 13 13 Marowijne 3 2 2 Saramacca 1 - - Nickerie 8 10 10 Totaal/ Total 68 70 72
Bron : Stichting Bosexploitatie en Bostoezicht Source: Institute for Forest Management and Control
Tabel 8.6: Uitgemijnde gebied (in ha), 2008-2011 Table 8.6: Mined- out Area (in ha), 2008-2011
Gebied/ Area 2008 2009 2010 2011
Coermotibo (Moengo) . 46.4 60.8 . Bron/ Source: Ministry of Natural Resources and Bauxite Institute Suriname
Tabel 8.7: Gerehabiliteerde gebied (in ha), 2008-2011 Table 8.7: Rehabilitated Area (in ha), 2008-2011
Bron/ Source: Ministry of Natural Resources and Bauxite Institute Suriname
Gebied/ Area 2008 2009 2010 2011
Coermotibo (Moengo) 38 0 18.3 .
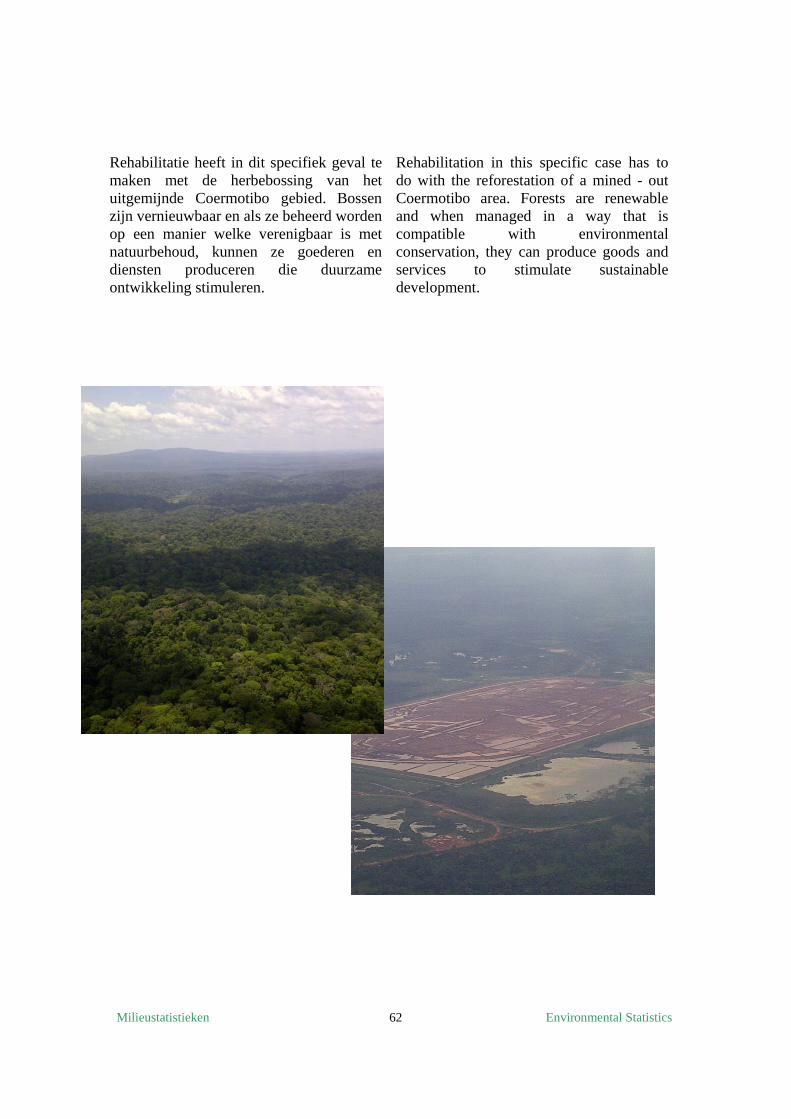
Milieustatistieken Environmental Statistics 62
Rehabilitatie heeft in dit specifiek geval te maken met de herbebossing van het uitgemijnde Coermotibo gebied. Bossen zijn vernieuwbaar en als ze beheerd worden op een manier welke verenigbaar is met natuurbehoud, kunnen ze goederen en diensten produceren die duurzame ontwikkeling stimuleren.
Rehabilitation in this specific case has to do with the reforestation of a mined - out Coermotibo area. Forests are renewable and when managed in a way that is compatible with environmental conservation, they can produce goods and services to stimulate sustainable development.
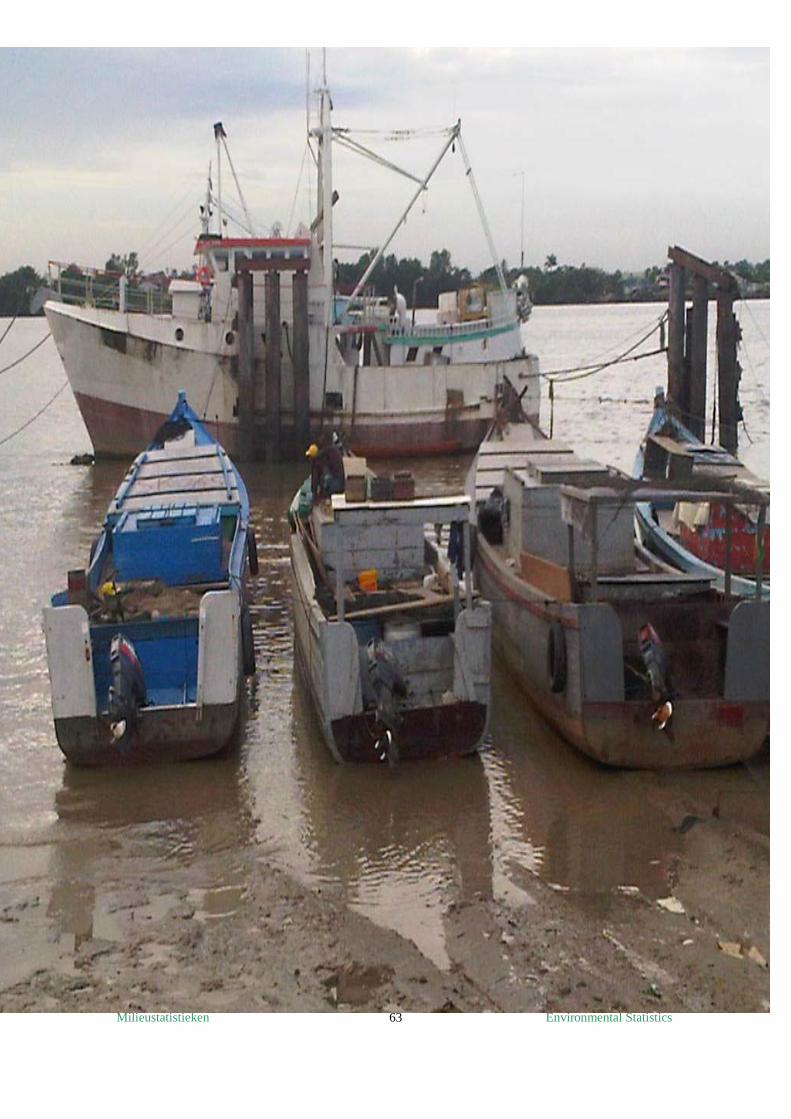
Milieustatistieken Environmental Statistics 63
HULPBRONNEN VAN HET KUSTGEBIED/ COASTAL AND MARINE RESOURCES
Visvangsten/ Fish Catches
Soort visserij/ Kind of Fishery
Zeedagen/ Days at Sea
Vergunninghouders/License Holders
Aquacultuur/ Aquaculture
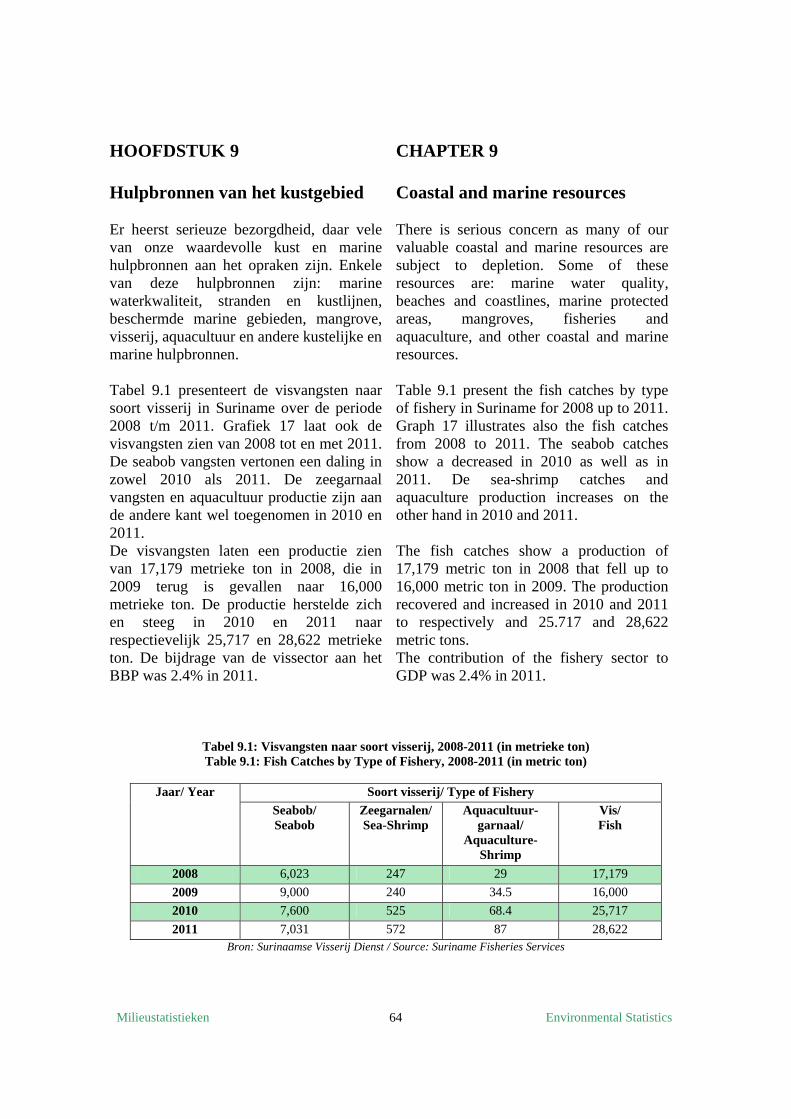
Milieustatistieken Environmental Statistics 64
HOOFDSTUK 9 Hulpbronnen van het kustgebied
Er heerst serieuze bezorgdheid, daar vele van onze waardevolle kust en marine hulpbronnen aan het opraken zijn. Enkele van deze hulpbronnen zijn: marine waterkwaliteit, stranden en kustlijnen, beschermde marine gebieden, mangrove, visserij, aquacultuur en andere kustelijke en marine hulpbronnen. Tabel 9.1 presenteert de visvangsten naar soort visserij in Suriname over de periode 2008 t/m 2011. Grafiek 17 laat ook de visvangsten zien van 2008 tot en met 2011. De seabob vangsten vertonen een daling in zowel 2010 als 2011. De zeegarnaal vangsten en aquacultuur productie zijn aan de andere kant wel toegenomen in 2010 en 2011. De visvangsten laten een productie zien van 17,179 metrieke ton in 2008, die in 2009 terug is gevallen naar 16,000 metrieke ton. De productie herstelde zich en steeg in 2010 en 2011 naar respectievelijk 25,717 en 28,622 metrieke ton. De bijdrage van de vissector aan het BBP was 2.4% in 2011.
CHAPTER 9 Coastal and marine resources There is serious concern as many of our valuable coastal and marine resources are subject to depletion. Some of these resources are: marine water quality, beaches and coastlines, marine protected areas, mangroves, fisheries and aquaculture, and other coastal and marine resources. Table 9.1 present the fish catches by type of fishery in Suriname for 2008 up to 2011. Graph 17 illustrates also the fish catches from 2008 to 2011. The seabob catches show a decreased in 2010 as well as in 2011. De sea-shrimp catches and aquaculture production increases on the other hand in 2010 and 2011. The fish catches show a production of 17,179 metric ton in 2008 that fell up to 16,000 metric ton in 2009. The production recovered and increased in 2010 and 2011 to respectively and 25.717 and 28,622 metric tons. The contribution of the fishery sector to GDP was 2.4% in 2011.
Tabel 9.1: Visvangsten naar soort visserij, 2008-2011 (in metrieke ton) Table 9.1: Fish Catches by Type of Fishery, 2008-2011 (in metric ton)
Jaar/ Year
Soort visserij/ Type of Fishery
Seabob/ Seabob
Zeegarnalen/ Sea-Shrimp
Aquacultuur- garnaal/
Aquaculture-Shrimp
Vis/ Fish
2008 6,023 247 29 17,179
2009 9,000 240 34.5 16,000
2010 7,600 525 68.4 25,717
2011 7,031 572 87 28,622 Bron: Surinaamse Visserij Dienst / Source: Suriname Fisheries Services
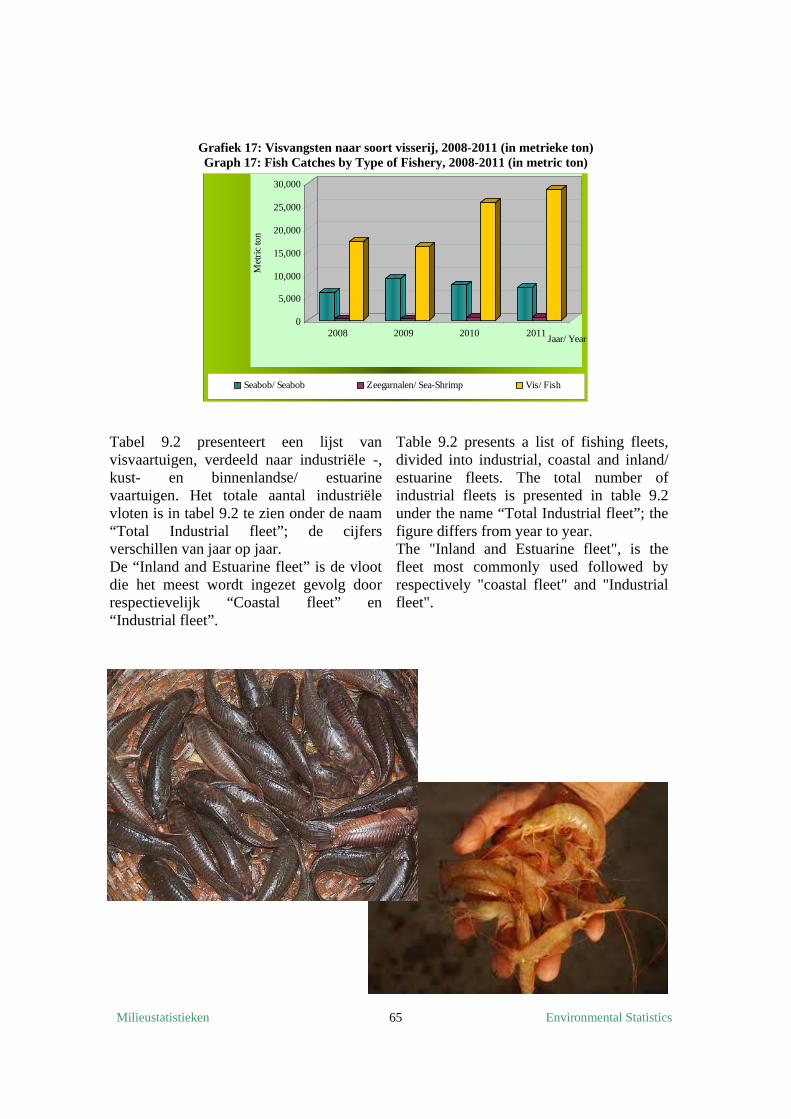
Milieustatistieken Environmental Statistics 65
Grafiek 17: Visvangsten naar soort visserij, 2008-2011 (in metrieke ton) Graph 17: Fish Catches by Type of Fishery, 2008-2011 (in metric ton)
Tabel 9.2 presenteert een lijst van visvaartuigen, verdeeld naar industriële -, kust- en binnenlandse/ estuarine vaartuigen. Het totale aantal industriële vloten is in tabel 9.2 te zien onder de naam “Total Industrial fleet”; de cijfers verschillen van jaar op jaar. De “Inland and Estuarine fleet” is de vloot die het meest wordt ingezet gevolg door respectievelijk “Coastal fleet” en “Industrial fleet”.
Table 9.2 presents a list of fishing fleets, divided into industrial, coastal and inland/ estuarine fleets. The total number of industrial fleets is presented in table 9.2 under the name “Total Industrial fleet”; the figure differs from year to year. The "Inland and Estuarine fleet", is the fleet most commonly used followed by respectively "coastal fleet" and "Industrial fleet".
0
5,000
10,000
15,000
20,000
25,000
30,000
Met
ric
ton
2008 2009 2010 2011Jaar/ Year
Seabob/ Seabob Zeegarnalen/ Sea-Shrimp Vis/ Fish
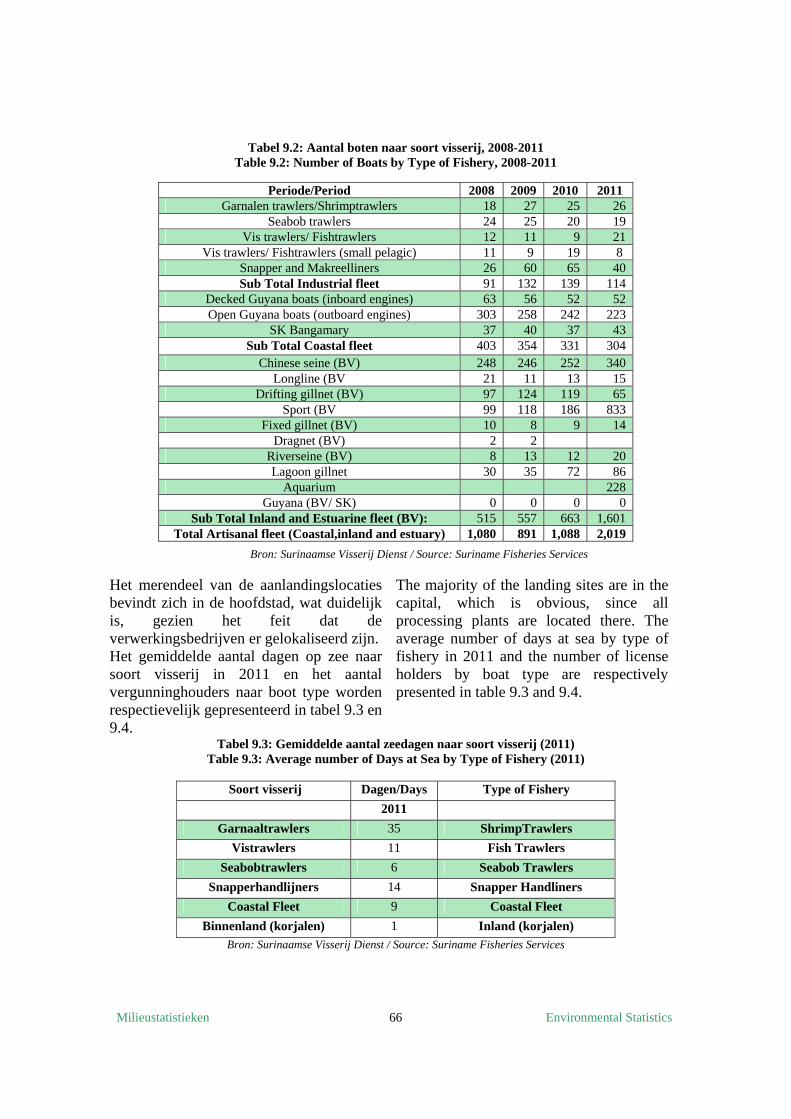
Milieustatistieken Environmental Statistics 66
Tabel 9.2: Aantal boten naar soort visserij, 2008-2011 Table 9.2: Number of Boats by Type of Fishery, 2008-2011
Bron: Surinaamse Visserij Dienst / Source: Suriname Fisheries Services
Het merendeel van de aanlandingslocaties bevindt zich in de hoofdstad, wat duidelijk is, gezien het feit dat de verwerkingsbedrijven er gelokaliseerd zijn. Het gemiddelde aantal dagen op zee naar soort visserij in 2011 en het aantal vergunninghouders naar boot type worden respectievelijk gepresenteerd in tabel 9.3 en 9.4.
The majority of the landing sites are in the capital, which is obvious, since all processing plants are located there. The average number of days at sea by type of fishery in 2011 and the number of license holders by boat type are respectively presented in table 9.3 and 9.4.
Tabel 9.3: Gemiddelde aantal zeedagen naar soort visserij (2011) Table 9.3: Average number of Days at Sea by Type of Fishery (2011)
Soort visserij Dagen/Days Type of Fishery
2011
Garnaaltrawlers 35 ShrimpTrawlers
Vistrawlers 11 Fish Trawlers
Seabobtrawlers 6 Seabob Trawlers
Snapperhandlijners 14 Snapper Handliners
Coastal Fleet 9 Coastal Fleet
Binnenland (korjalen) 1 Inland (korjalen)
Bron: Surinaamse Visserij Dienst / Source: Suriname Fisheries Services
Periode/Period 2008 2009 2010 2011 Garnalen trawlers/Shrimptrawlers 18 27 25 26
Seabob trawlers 24 25 20 19 Vis trawlers/ Fishtrawlers 12 11 9 21
Vis trawlers/ Fishtrawlers (small pelagic) 11 9 19 8 Snapper and Makreelliners 26 60 65 40 Sub Total Industrial fleet 91 132 139 114
Decked Guyana boats (inboard engines) 63 56 52 52 Open Guyana boats (outboard engines) 303 258 242 223
SK Bangamary 37 40 37 43 Sub Total Coastal fleet 403 354 331 304
Chinese seine (BV) 248 246 252 340 Longline (BV 21 11 13 15
Drifting gillnet (BV) 97 124 119 65 Sport (BV 99 118 186 833
Fixed gillnet (BV) 10 8 9 14 Dragnet (BV) 2 2
Riverseine (BV) 8 13 12 20 Lagoon gillnet 30 35 72 86
Aquarium 228 Guyana (BV/ SK) 0 0 0 0
Sub Total Inland and Estuarine fleet (BV): 515 557 663 1,601 Total Artisanal fleet (Coastal,inland and estuary) 1,080 891 1,088 2,019
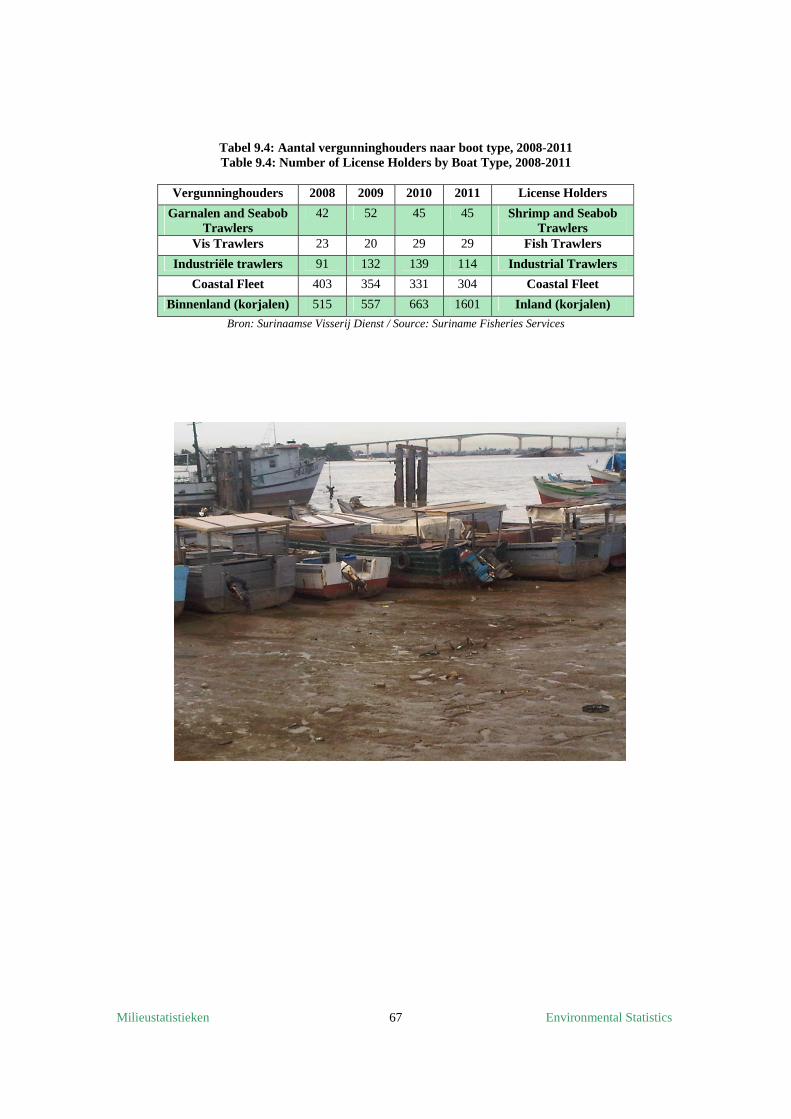
Milieustatistieken Environmental Statistics 67
Tabel 9.4: Aantal vergunninghouders naar boot type, 2008-2011 Table 9.4: Number of License Holders by Boat Type, 2008-2011
Vergunninghouders 2008 2009 2010 2011 License Holders
Garnalen and Seabob Trawlers
42 52 45 45 Shrimp and Seabob Trawlers
Vis Trawlers 23 20 29 29 Fish Trawlers
Industriële trawlers 91 132 139 114 Industrial Trawlers
Coastal Fleet 403 354 331 304 Coastal Fleet
Binnenland (korjalen) 515 557 663 1601 Inland (korjalen)
Bron: Surinaamse Visserij Dienst / Source: Suriname Fisheries Services
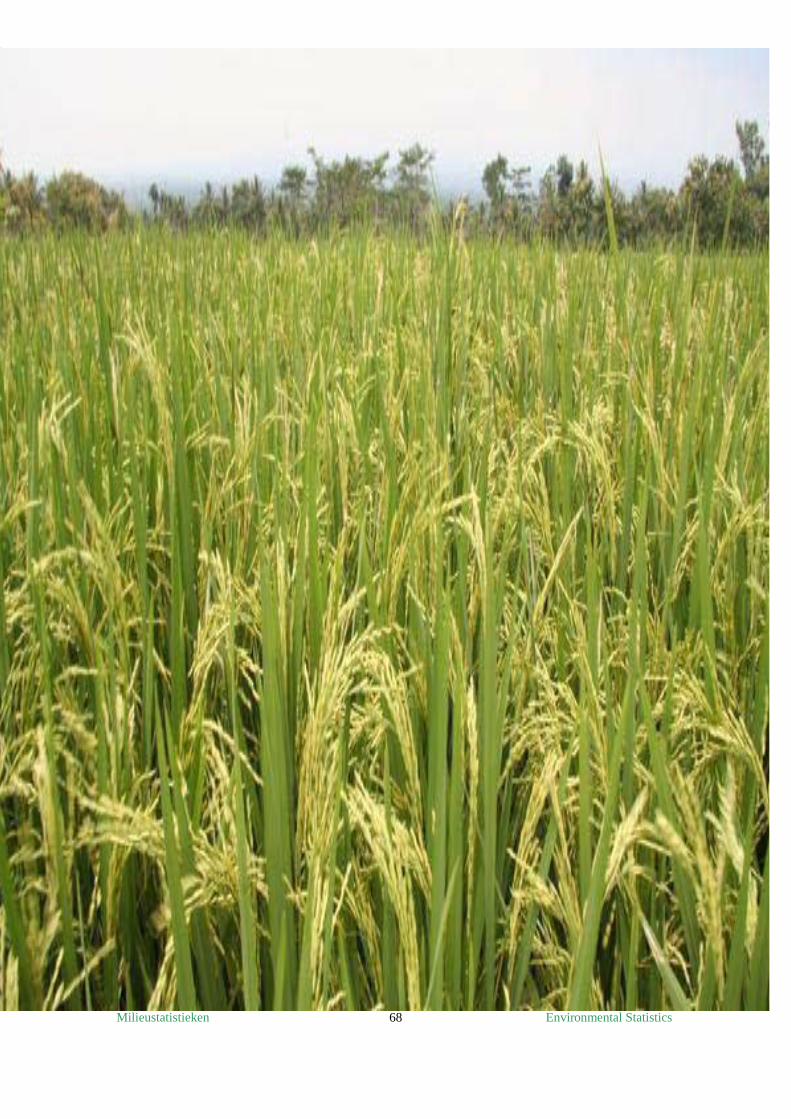
Milieustatistieken Environmental Statistics 68
LANDGEBRUIK EN LANDBOUW/
LAND USE AND AGRICULTURE
Landgebruik/ Land Use
Vee- en pluimvee/ Cattle and Poultry
Kunstmest importen/ Fertilizer Imports
Pesticiden importen/ Pesticides Imports
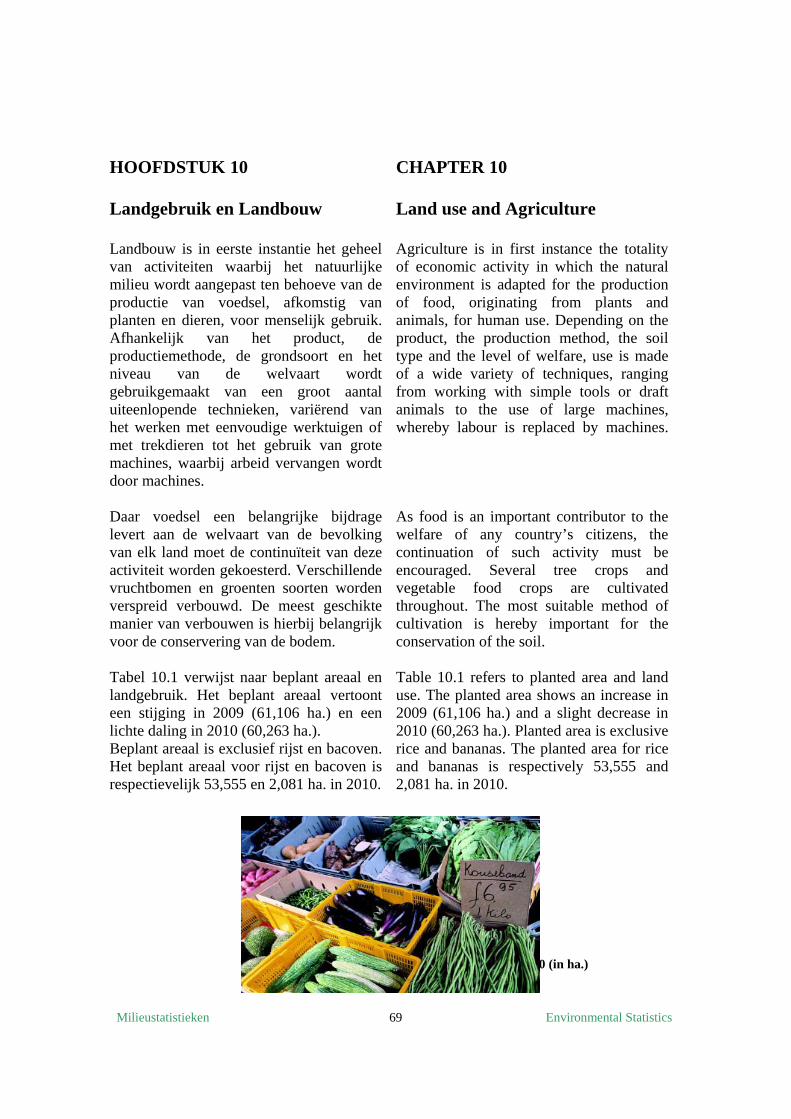
Milieustatistieken Environmental Statistics 69
HOOFDSTUK 10 Landgebruik en Landbouw Landbouw is in eerste instantie het geheel van activiteiten waarbij het natuurlijke milieu wordt aangepast ten behoeve van de productie van voedsel, afkomstig van planten en dieren, voor menselijk gebruik. Afhankelijk van het product, de productiemethode, de grondsoort en het niveau van de welvaart wordt gebruikgemaakt van een groot aantal uiteenlopende technieken, variërend van het werken met eenvoudige werktuigen of met trekdieren tot het gebruik van grote machines, waarbij arbeid vervangen wordt door machines. Daar voedsel een belangrijke bijdrage levert aan de welvaart van de bevolking van elk land moet de continuïteit van deze activiteit worden gekoesterd. Verschillende vruchtbomen en groenten soorten worden verspreid verbouwd. De meest geschikte manier van verbouwen is hierbij belangrijk voor de conservering van de bodem. Tabel 10.1 verwijst naar beplant areaal en landgebruik. Het beplant areaal vertoont een stijging in 2009 (61,106 ha.) en een lichte daling in 2010 (60,263 ha.). Beplant areaal is exclusief rijst en bacoven. Het beplant areaal voor rijst en bacoven is respectievelijk 53,555 en 2,081 ha. in 2010.
CHAPTER 10 Land use and Agriculture Agriculture is in first instance the totality of economic activity in which the natural environment is adapted for the production of food, originating from plants and animals, for human use. Depending on the product, the production method, the soil type and the level of welfare, use is made of a wide variety of techniques, ranging from working with simple tools or draft animals to the use of large machines, whereby labour is replaced by machines. As food is an important contributor to the welfare of any country’s citizens, the continuation of such activity must be encouraged. Several tree crops and vegetable food crops are cultivated throughout. The most suitable method of cultivation is hereby important for the conservation of the soil. Table 10.1 refers to planted area and land use. The planted area shows an increase in 2009 (61,106 ha.) and a slight decrease in 2010 (60,263 ha.). Planted area is exclusive rice and bananas. The planted area for rice and bananas is respectively 53,555 and 2,081 ha. in 2010.
Tabel 10.1: Beplant areaal en landgebruik, 2008-2010 (in ha.)
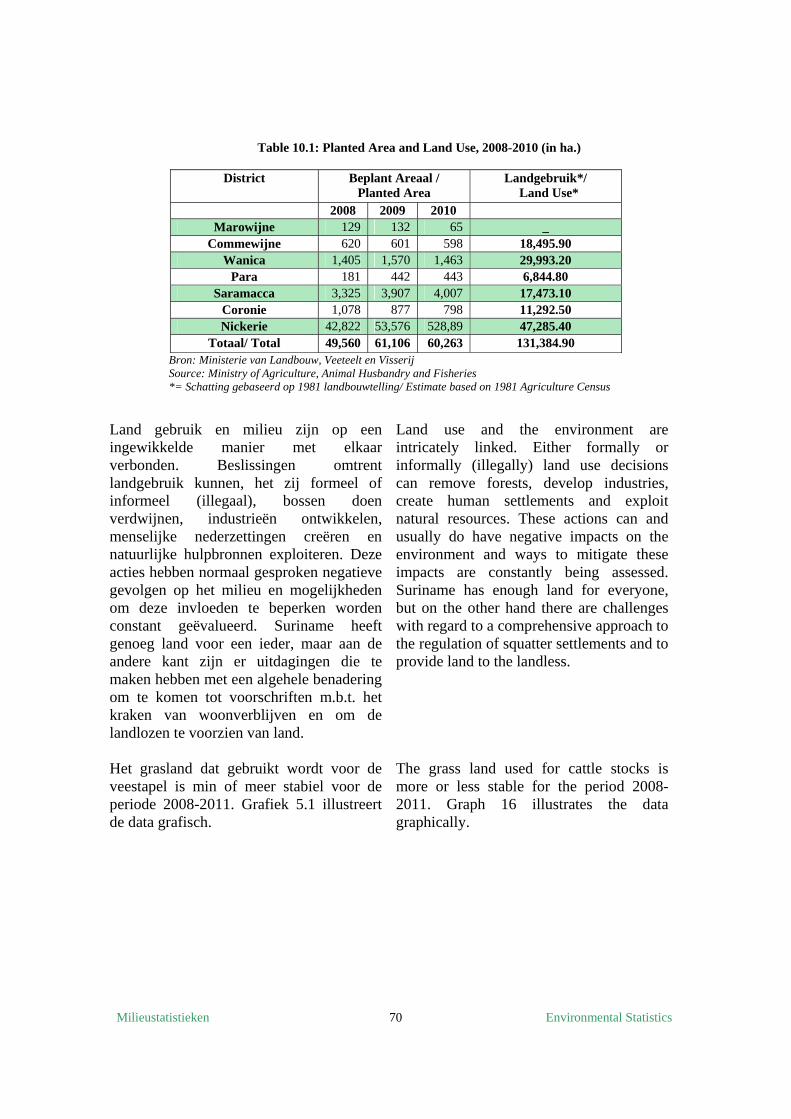
Milieustatistieken Environmental Statistics 70
Table 10.1: Planted Area and Land Use, 2008-2010 (in ha.)
District Beplant Areaal / Planted Area
Landgebruik*/ Land Use*
2008 2009 2010 Marowijne 129 132 65 _
Commewijne 620 601 598 18,495.90 Wanica 1,405 1,570 1,463 29,993.20
Para 181 442 443 6,844.80 Saramacca 3,325 3,907 4,007 17,473.10
Coronie 1,078 877 798 11,292.50 Nickerie 42,822 53,576 528,89 47,285.40
Totaal/ Total 49,560 61,106 60,263 131,384.90 Bron: Ministerie van Landbouw, Veeteelt en Visserij Source: Ministry of Agriculture, Animal Husbandry and Fisheries *= Schatting gebaseerd op 1981 landbouwtelling/ Estimate based on 1981 Agriculture Census
Land gebruik en milieu zijn op een ingewikkelde manier met elkaar verbonden. Beslissingen omtrent landgebruik kunnen, het zij formeel of informeel (illegaal), bossen doen verdwijnen, industrieën ontwikkelen, menselijke nederzettingen creëren en natuurlijke hulpbronnen exploiteren. Deze acties hebben normaal gesproken negatieve gevolgen op het milieu en mogelijkheden om deze invloeden te beperken worden constant geëvalueerd. Suriname heeft genoeg land voor een ieder, maar aan de andere kant zijn er uitdagingen die te maken hebben met een algehele benadering om te komen tot voorschriften m.b.t. het kraken van woonverblijven en om de landlozen te voorzien van land. Het grasland dat gebruikt wordt voor de veestapel is min of meer stabiel voor de periode 2008-2011. Grafiek 5.1 illustreert de data grafisch.
Land use and the environment are intricately linked. Either formally or informally (illegally) land use decisions can remove forests, develop industries, create human settlements and exploit natural resources. These actions can and usually do have negative impacts on the environment and ways to mitigate these impacts are constantly being assessed. Suriname has enough land for everyone, but on the other hand there are challenges with regard to a comprehensive approach to the regulation of squatter settlements and to provide land to the landless. The grass land used for cattle stocks is more or less stable for the period 2008-2011. Graph 16 illustrates the data graphically.
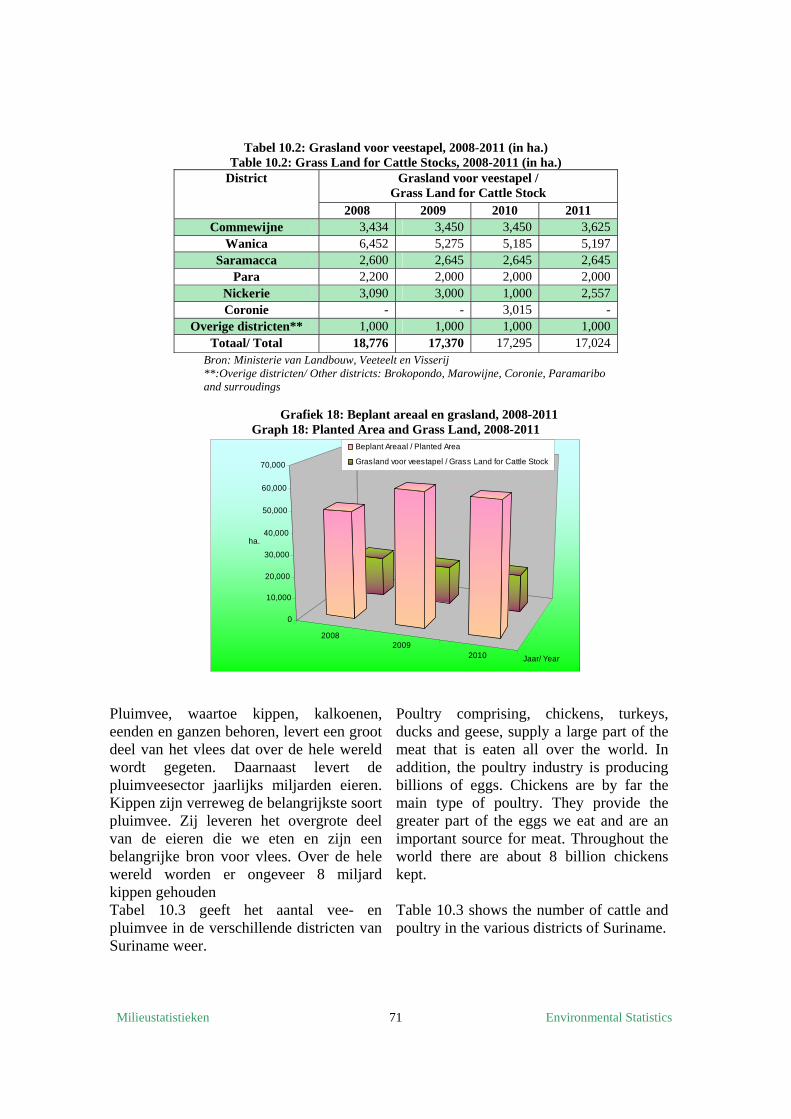
Milieustatistieken Environmental Statistics 71
Tabel 10.2: Grasland voor veestapel, 2008-2011 (in ha.) Table 10.2: Grass Land for Cattle Stocks, 2008-2011 (in ha.)
District Grasland voor veestapel / Grass Land for Cattle Stock
2008 2009 2010 2011 Commewijne 3,434 3,450 3,450 3,625
Wanica 6,452 5,275 5,185 5,197 Saramacca 2,600 2,645 2,645 2,645
Para 2,200 2,000 2,000 2,000 Nickerie 3,090 3,000 1,000 2,557 Coronie - - 3,015 -
Overige districten** 1,000 1,000 1,000 1,000 Totaal/ Total 18,776 17,370 17,295 17,024
Bron: Ministerie van Landbouw, Veeteelt en Visserij **:Overige districten/ Other districts: Brokopondo, Marowijne, Coronie, Paramaribo and surroudings
Grafiek 18: Beplant areaal en grasland, 2008-2011 Graph 18: Planted Area and Grass Land, 2008-2011
Pluimvee, waartoe kippen, kalkoenen, eenden en ganzen behoren, levert een groot deel van het vlees dat over de hele wereld wordt gegeten. Daarnaast levert de pluimveesector jaarlijks miljarden eieren. Kippen zijn verreweg de belangrijkste soort pluimvee. Zij leveren het overgrote deel van de eieren die we eten en zijn een belangrijke bron voor vlees. Over de hele wereld worden er ongeveer 8 miljard kippen gehouden Tabel 10.3 geeft het aantal vee- en pluimvee in de verschillende districten van Suriname weer.
Poultry comprising, chickens, turkeys, ducks and geese, supply a large part of the meat that is eaten all over the world. In addition, the poultry industry is producing billions of eggs. Chickens are by far the main type of poultry. They provide the greater part of the eggs we eat and are an important source for meat. Throughout the world there are about 8 billion chickens kept. Table 10.3 shows the number of cattle and poultry in the various districts of Suriname.
20082009
2010
0
10,000
20,000
30,000
40,000
50,000
60,000
70,000
ha.
Jaar/ Year
Beplant Areaal / Planted Area
Grasland voor veestapel / Grass Land for Cattle Stock
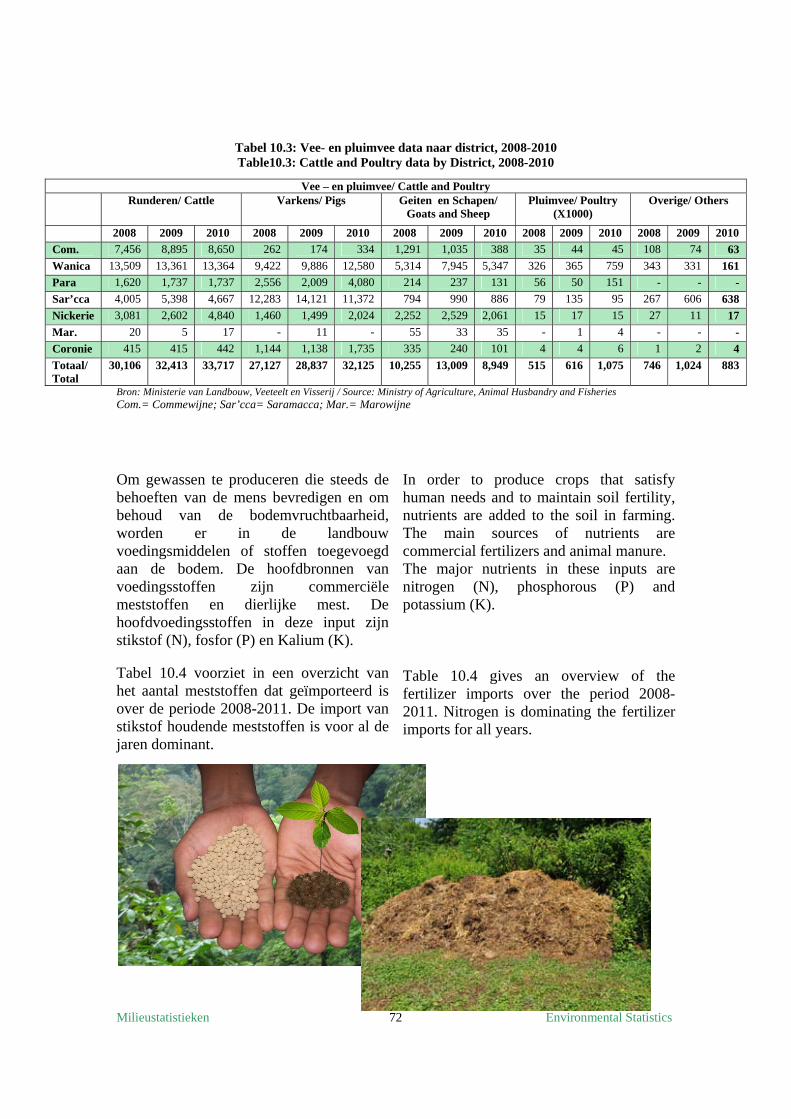
Milieustatistieken Environmental Statistics 72
Tabel 10.3: Vee- en pluimvee data naar district, 2008-2010 Table10.3: Cattle and Poultry data by District, 2008-2010
Bron: Ministerie van Landbouw, Veeteelt en Visserij / Source: Ministry of Agriculture, Animal Husbandry and Fisheries Com.= Commewijne; Sar’cca= Saramacca; Mar.= Marowijne
Vee – en pluimvee/ Cattle and Poultry Runderen/ Cattle
Varkens/ Pigs Geiten en Schapen/
Goats and Sheep Pluimvee/ Poultry
(X1000) Overige/ Others
2008 2009 2010 2008 2009 2010 2008 2009 2010 2008 2009 2010 2008 2009 2010
Com. 7,456 8,895 8,650 262 174 334 1,291 1,035 388 35 44 45 108 74 63
Wanica 13,509 13,361 13,364 9,422 9,886 12,580 5,314 7,945 5,347 326 365 759 343 331 161
Para 1,620 1,737 1,737 2,556 2,009 4,080 214 237 131 56 50 151 - - -
Sar’cca 4,005 5,398 4,667 12,283 14,121 11,372 794 990 886 79 135 95 267 606 638
Nickerie 3,081 2,602 4,840 1,460 1,499 2,024 2,252 2,529 2,061 15 17 15 27 11 17
Mar. 20 5 17 - 11 - 55 33 35 - 1 4 - - -
Coronie 415 415 442 1,144 1,138 1,735 335 240 101 4 4 6 1 2 4
Totaal/ Total
30,106 32,413 33,717 27,127 28,837 32,125 10,255 13,009 8,949 515 616 1,075 746 1,024 883
Om gewassen te produceren die steeds de behoeften van de mens bevredigen en om behoud van de bodemvruchtbaarheid, worden er in de landbouw voedingsmiddelen of stoffen toegevoegd aan de bodem. De hoofdbronnen van voedingsstoffen zijn commerciële meststoffen en dierlijke mest. De hoofdvoedingsstoffen in deze input zijn stikstof (N), fosfor (P) en Kalium (K). Tabel 10.4 voorziet in een overzicht van het aantal meststoffen dat geïmporteerd is over de periode 2008-2011. De import van stikstof houdende meststoffen is voor al de jaren dominant.
In order to produce crops that satisfy human needs and to maintain soil fertility, nutrients are added to the soil in farming. The main sources of nutrients are commercial fertilizers and animal manure. The major nutrients in these inputs are nitrogen (N), phosphorous (P) and potassium (K). Table 10.4 gives an overview of the fertilizer imports over the period 2008-2011. Nitrogen is dominating the fertilizer imports for all years.
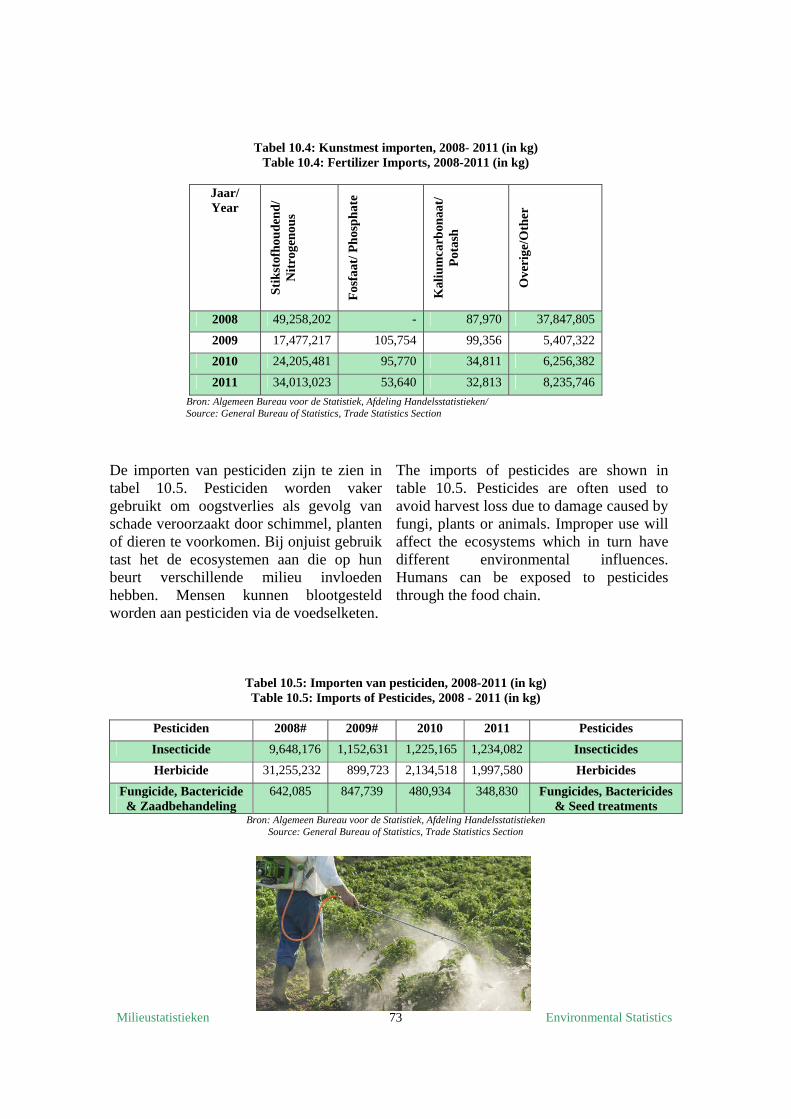
Milieustatistieken Environmental Statistics 73
Tabel 10.4: Kunstmest importen, 2008- 2011 (in kg) Table 10.4: Fertilizer Imports, 2008-2011 (in kg)
Jaar/ Year
Sti
kst
ofh
oud
end
/ N
itro
gen
ous
Fos
faat
/ Ph
osp
hat
e
Kal
ium
carb
onaa
t/
Pot
ash
Ove
rige
/Oth
er
2008 49,258,202 - 87,970 37,847,805
2009 17,477,217 105,754 99,356 5,407,322
2010 24,205,481 95,770 34,811 6,256,382
2011 34,013,023 53,640 32,813 8,235,746
Bron: Algemeen Bureau voor de Statistiek, Afdeling Handelsstatistieken/ Source: General Bureau of Statistics, Trade Statistics Section
De importen van pesticiden zijn te zien in tabel 10.5. Pesticiden worden vaker gebruikt om oogstverlies als gevolg van schade veroorzaakt door schimmel, planten of dieren te voorkomen. Bij onjuist gebruik tast het de ecosystemen aan die op hun beurt verschillende milieu invloeden hebben. Mensen kunnen blootgesteld worden aan pesticiden via de voedselketen.
The imports of pesticides are shown in table 10.5. Pesticides are often used to avoid harvest loss due to damage caused by fungi, plants or animals. Improper use will affect the ecosystems which in turn have different environmental influences. Humans can be exposed to pesticides through the food chain.
Tabel 10.5: Importen van pesticiden, 2008-2011 (in kg) Table 10.5: Imports of Pesticides, 2008 - 2011 (in kg)
Pesticiden 2008# 2009# 2010 2011 Pesticides
Insecticide 9,648,176 1,152,631 1,225,165 1,234,082 Insecticides
Herbicide 31,255,232 899,723 2,134,518 1,997,580 Herbicides
Fungicide, Bactericide & Zaadbehandeling
642,085 847,739 480,934 348,830 Fungicides, Bactericides & Seed treatments
Bron: Algemeen Bureau voor de Statistiek, Afdeling Handelsstatistieken Source: General Bureau of Statistics, Trade Statistics Section
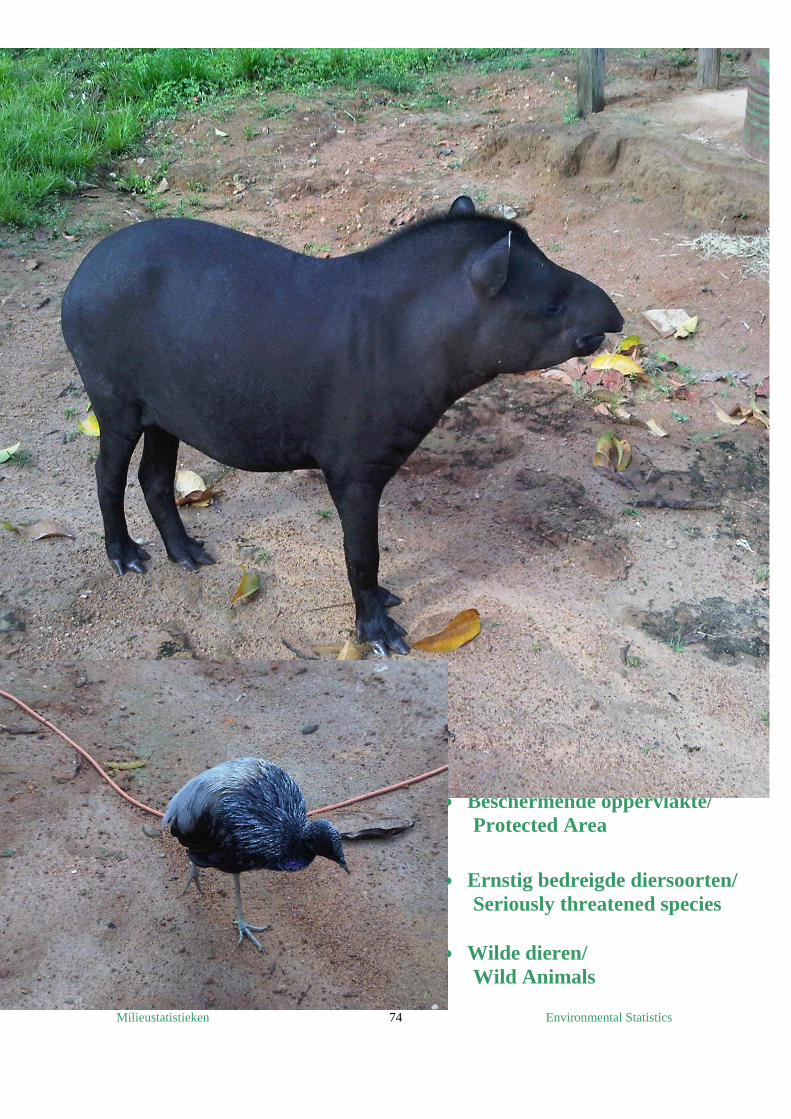
Milieustatistieken Environmental Statistics 74
BIODIVERSITEIT/
BIODIVERSITY
Beschermende oppervlakte/ Protected Area
Ernstig bedreigde diersoorten/ Seriously threatened species
Wilde dieren/ Wild Animals
Milieustatistieken Environmental Statistics 75
HOOFDSTUK 11
Biodiversiteit
Het geheel van al het leven en alle biologische systemen op aarde wordt aangeduid met de term biodiversiteit. Het varieert van microscopisch DNA tot de verschillende hogere levensvormen of ecosystemen. Tot nog toe heeft de mens op aarde 4 miljoen levensvormen ontdekt en beschreven. Alhoewel het in eerste instantie een ecologisch begrip is, heeft biodiversiteit ook een ethische betekenis: Als eigenlijk niets waardevoller is dan het leven, is de waarde van al het leven praktisch onschatbaar. In die optiek is de hoge biodiversiteit, meer nog dan de levenloze grondstoffen, de grootste rijkdom van de aarde. Verlies aan biodiversiteit is dus een waardevermindering en simpelweg onwenselijk. Toch is afname van biodiversiteit al realiteit. Door menselijk handelen, zoals ontbossing, mijnbouw en landbouw, is biodiversiteit aan het afnemen. Helaas wordt verwacht dat deze afname zich ook in de toekomst zal voortzetten. De kans is dan groot dat meer levensvormen (in de natuur) zullen uitsterven. Een beschermd gebied is een gebied dat op zij gezet is voor behoud en bescherming van uiterst belangrijke natuurlijke en culturele karakteristieken, voor de regelgeving betreffende wetenschappelijk, educatief en recreatief gebruik. Tabel 11.1 geeft een overzicht van de beschermende oppervlakte als % van de totale land oppervlakte. Het jaarlijkse aantal bezoekers naar geselecteerde beschermde gebieden varieert tussen 10,000 en 27,000 bezoekers per jaar (zie tabel 11.2).
CHAPTER 11
Biodiversity
The whole of all life and all biological systems on earth is designated by the term biodiversity. It ranges from microscopic DNA to the different higher life forms or ecosystems. So far, man has discovered and described 4 million life forms on earth. Although initially an ecological concept, biodiversity has an ethical sense: If nothing is more valuable than life, the value of all life is practically priceless. The high biodiversity is in this perspective, even more than the lifeless raw materials, the greatest wealth of the earth. Biodiversity loss is a depreciation and simply undesirable.
Nevertheless, loss of biodiversity is already a reality. Biodiversity is declining due to human activities such as deforestation, mining and agriculture. Unfortunately, it is expected that this decrease will continue in the future. The probability is high that more life forms (in nature) will die out.
A protected area is an area set aside for the preservation and protection of highly important natural and cultural features, for the regulation of the scientific, educational and recreational use. Table 11.1 gives an overview of the protected area as a % of total area of the country. The yearly number of visitors to selected protected areas varies between 10,000 and 27,000 visitors per year (see table 11.2).
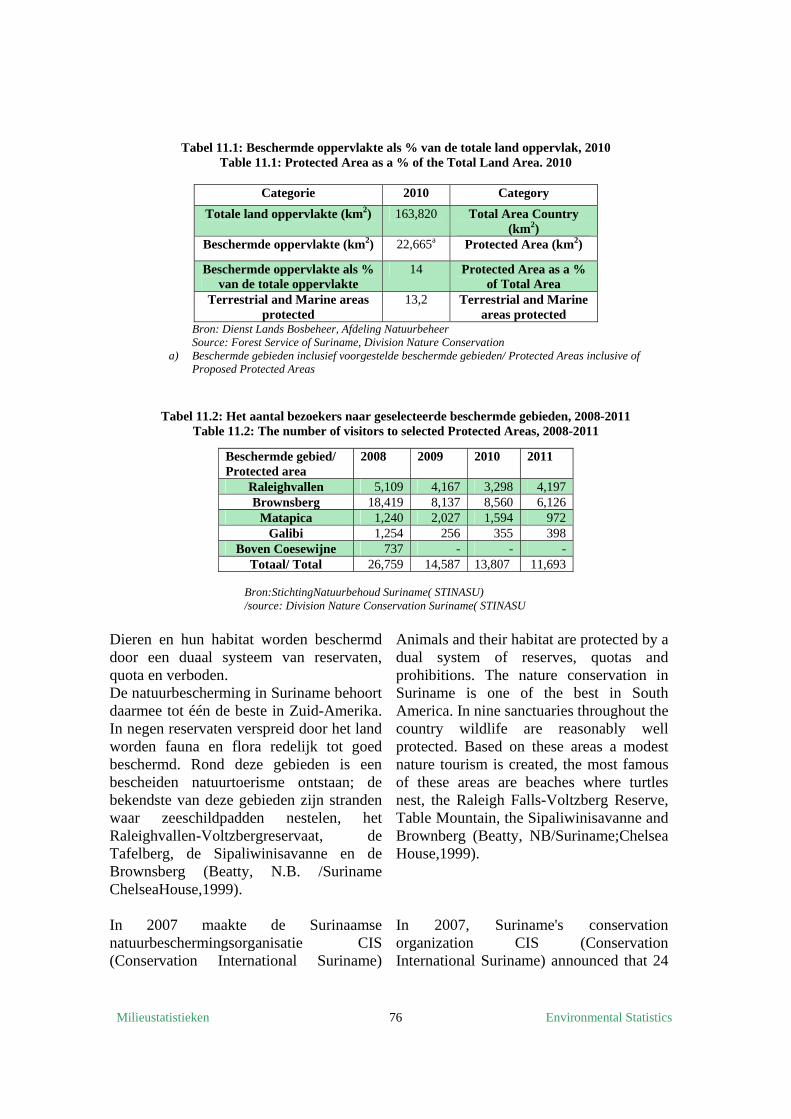
Milieustatistieken Environmental Statistics 76
Tabel 11.1: Beschermde oppervlakte als % van de totale land oppervlak, 2010 Table 11.1: Protected Area as a % of the Total Land Area. 2010
Categorie 2010 Category
Totale land oppervlakte (km2) 163,820 Total Area Country (km2)
Beschermde oppervlakte (km2) 22,665a Protected Area (km2)
Beschermde oppervlakte als % van de totale oppervlakte
14 Protected Area as a % of Total Area
Terrestrial and Marine areas protected
13,2 Terrestrial and Marine areas protected
Bron: Dienst Lands Bosbeheer, Afdeling Natuurbeheer Source: Forest Service of Suriname, Division Nature Conservation
a) Beschermde gebieden inclusief voorgestelde beschermde gebieden/ Protected Areas inclusive of Proposed Protected Areas
Tabel 11.2: Het aantal bezoekers naar geselecteerde beschermde gebieden, 2008-2011 Table 11.2: The number of visitors to selected Protected Areas, 2008-2011
Bron:StichtingNatuurbehoud Suriname( STINASU) /source: Division Nature Conservation Suriname( STINASU
Dieren en hun habitat worden beschermd door een duaal systeem van reservaten, quota en verboden. De natuurbescherming in Suriname behoort daarmee tot één de beste in Zuid-Amerika. In negen reservaten verspreid door het land worden fauna en flora redelijk tot goed beschermd. Rond deze gebieden is een bescheiden natuurtoerisme ontstaan; de bekendste van deze gebieden zijn stranden waar zeeschildpadden nestelen, het Raleighvallen-Voltzbergreservaat, de Tafelberg, de Sipaliwinisavanne en de Brownsberg (Beatty, N.B. /Suriname ChelseaHouse,1999). In 2007 maakte de Surinaamse natuurbeschermingsorganisatie CIS (Conservation International Suriname)
Animals and their habitat are protected by a dual system of reserves, quotas and prohibitions. The nature conservation in Suriname is one of the best in South America. In nine sanctuaries throughout the country wildlife are reasonably well protected. Based on these areas a modest nature tourism is created, the most famous of these areas are beaches where turtles nest, the Raleigh Falls-Voltzberg Reserve, Table Mountain, the Sipaliwinisavanne and Brownberg (Beatty, NB/Suriname;Chelsea House,1999). In 2007, Suriname's conservation organization CIS (Conservation International Suriname) announced that 24
Beschermde gebied/ Protected area
2008 2009 2010 2011
Raleighvallen 5,109 4,167 3,298 4,197 Brownsberg 18,419 8,137 8,560 6,126
Matapica 1,240 2,027 1,594 972 Galibi 1,254 256 355 398
Boven Coesewijne 737 - - - Totaal/ Total 26,759 14,587 13,807 11,693
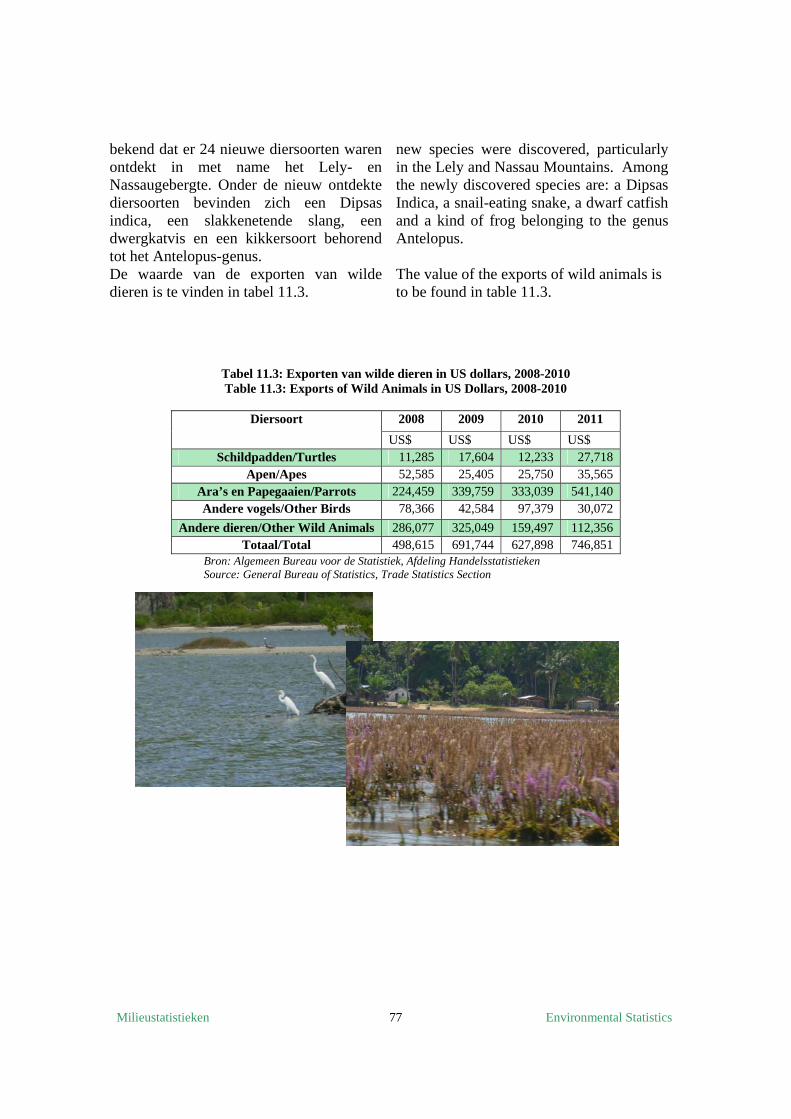
Milieustatistieken Environmental Statistics 77
bekend dat er 24 nieuwe diersoorten waren ontdekt in met name het Lely- en Nassaugebergte. Onder de nieuw ontdekte diersoorten bevinden zich een Dipsas indica, een slakkenetende slang, een dwergkatvis en een kikkersoort behorend tot het Antelopus-genus. De waarde van de exporten van wilde dieren is te vinden in tabel 11.3.
new species were discovered, particularly in the Lely and Nassau Mountains. Among the newly discovered species are: a Dipsas Indica, a snail-eating snake, a dwarf catfish and a kind of frog belonging to the genus Antelopus. The value of the exports of wild animals is to be found in table 11.3.
Tabel 11.3: Exporten van wilde dieren in US dollars, 2008-2010 Table 11.3: Exports of Wild Animals in US Dollars, 2008-2010
Diersoort 2008 2009 2010 2011
US$ US$ US$ US$ Schildpadden/Turtles 11,285 17,604 12,233 27,718
Apen/Apes 52,585 25,405 25,750 35,565 Ara’s en Papegaaien/Parrots 224,459 339,759 333,039 541,140 Andere vogels/Other Birds 78,366 42,584 97,379 30,072
Andere dieren/Other Wild Animals 286,077 325,049 159,497 112,356 Totaal/Total 498,615 691,744 627,898 746,851
Bron: Algemeen Bureau voor de Statistiek, Afdeling Handelsstatistieken Source: General Bureau of Statistics, Trade Statistics Section
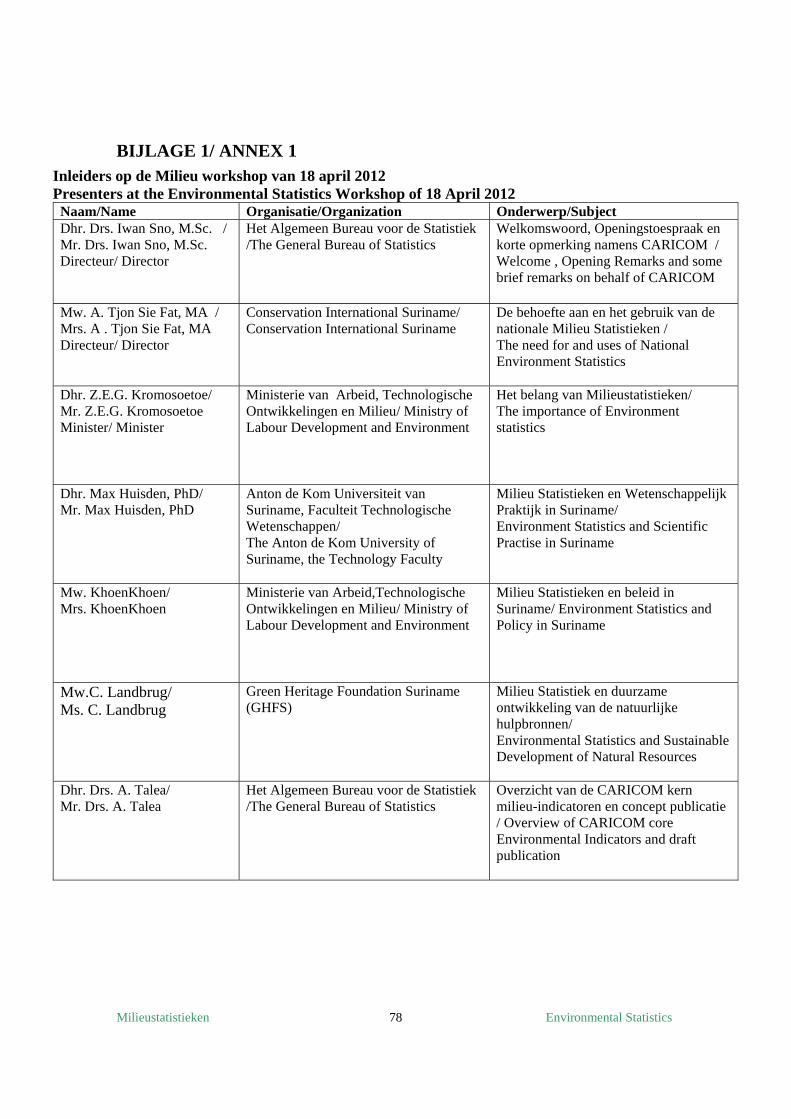
Milieustatistieken Environmental Statistics 78
BIJLAGE 1/ ANNEX 1 Inleiders op de Milieu workshop van 18 april 2012 Presenters at the Environmental Statistics Workshop of 18 April 2012
Naam/Name Organisatie/Organization Onderwerp/Subject Dhr. Drs. Iwan Sno, M.Sc. / Mr. Drs. Iwan Sno, M.Sc. Directeur/ Director
Het Algemeen Bureau voor de Statistiek /The General Bureau of Statistics
Welkomswoord, Openingstoespraak en korte opmerking namens CARICOM / Welcome , Opening Remarks and some brief remarks on behalf of CARICOM
Mw. A. Tjon Sie Fat, MA / Mrs. A . Tjon Sie Fat, MA Directeur/ Director
Conservation International Suriname/ Conservation International Suriname
De behoefte aan en het gebruik van de nationale Milieu Statistieken / The need for and uses of National Environment Statistics
Dhr. Z.E.G. Kromosoetoe/ Mr. Z.E.G. Kromosoetoe Minister/ Minister
Ministerie van Arbeid, Technologische Ontwikkelingen en Milieu/ Ministry of Labour Development and Environment
Het belang van Milieustatistieken/ The importance of Environment statistics
Dhr. Max Huisden, PhD/ Mr. Max Huisden, PhD
Anton de Kom Universiteit van Suriname, Faculteit Technologische Wetenschappen/ The Anton de Kom University of Suriname, the Technology Faculty
Milieu Statistieken en Wetenschappelijk Praktijk in Suriname/ Environment Statistics and Scientific Practise in Suriname
Mw. KhoenKhoen/ Mrs. KhoenKhoen
Ministerie van Arbeid,Technologische Ontwikkelingen en Milieu/ Ministry of Labour Development and Environment
Milieu Statistieken en beleid in Suriname/ Environment Statistics and Policy in Suriname
Mw.C. Landbrug/ Ms. C. Landbrug
Green Heritage Foundation Suriname (GHFS)
Milieu Statistiek en duurzame ontwikkeling van de natuurlijke hulpbronnen/ Environmental Statistics and Sustainable Development of Natural Resources
Dhr. Drs. A. Talea/ Mr. Drs. A. Talea
Het Algemeen Bureau voor de Statistiek /The General Bureau of Statistics
Overzicht van de CARICOM kern milieu-indicatoren en concept publicatie / Overview of CARICOM core Environmental Indicators and draft publication
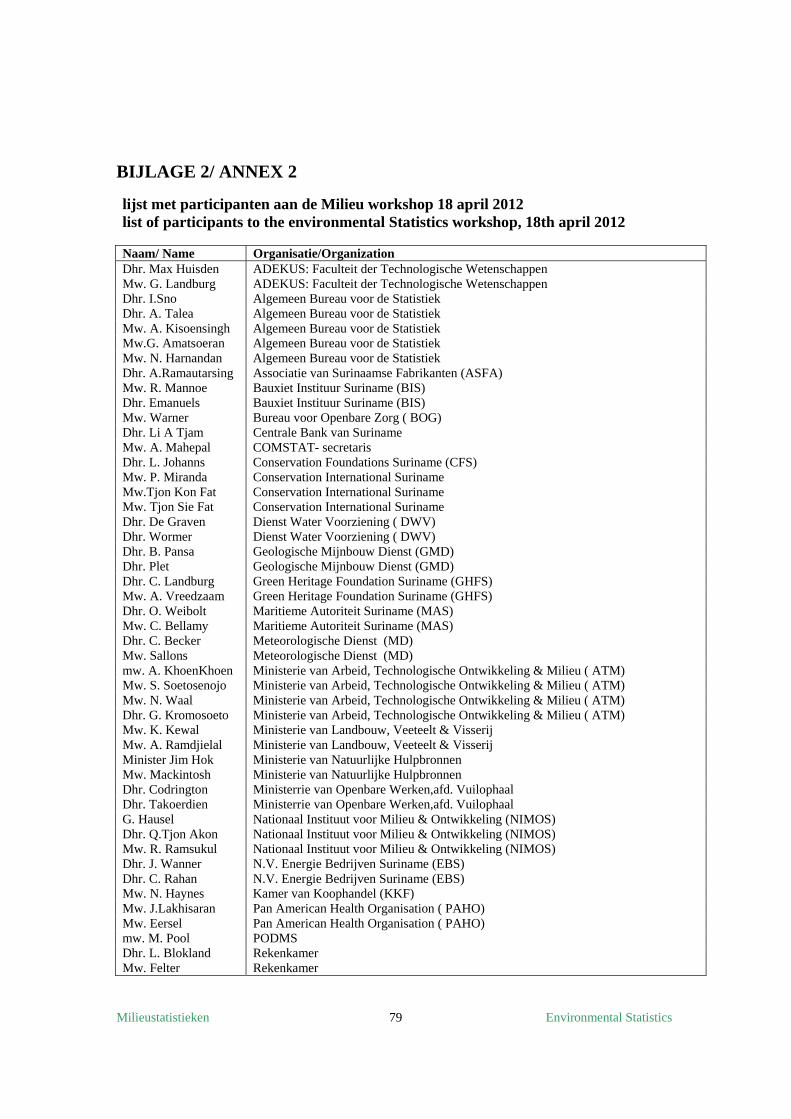
Milieustatistieken Environmental Statistics 79
BIJLAGE 2/ ANNEX 2
lijst met participanten aan de Milieu workshop 18 april 2012 list of participants to the environmental Statistics workshop, 18th april 2012
Naam/ Name Organisatie/Organization Dhr. Max Huisden ADEKUS: Faculteit der Technologische Wetenschappen Mw. G. Landburg ADEKUS: Faculteit der Technologische WetenschappenDhr. I.Sno Algemeen Bureau voor de Statistiek Dhr. A. Talea Algemeen Bureau voor de Statistiek Mw. A. Kisoensingh Algemeen Bureau voor de Statistiek Mw.G. Amatsoeran Algemeen Bureau voor de Statistiek Mw. N. Harnandan Algemeen Bureau voor de Statistiek Dhr. A.Ramautarsing Associatie van Surinaamse Fabrikanten (ASFA) Mw. R. Mannoe Bauxiet Instituur Suriname (BIS) Dhr. Emanuels Bauxiet Instituur Suriname (BIS) Mw. Warner Bureau voor Openbare Zorg ( BOG) Dhr. Li A Tjam Centrale Bank van Suriname Mw. A. Mahepal COMSTAT- secretaris Dhr. L. Johanns Conservation Foundations Suriname (CFS) Mw. P. Miranda Conservation International Suriname Mw.Tjon Kon Fat Conservation International Suriname Mw. Tjon Sie Fat Conservation International Suriname Dhr. De Graven Dienst Water Voorziening ( DWV) Dhr. Wormer Dienst Water Voorziening ( DWV) Dhr. B. Pansa Geologische Mijnbouw Dienst (GMD) Dhr. Plet Geologische Mijnbouw Dienst (GMD) Dhr. C. Landburg Green Heritage Foundation Suriname (GHFS) Mw. A. Vreedzaam Green Heritage Foundation Suriname (GHFS) Dhr. O. Weibolt Maritieme Autoriteit Suriname (MAS) Mw. C. Bellamy Maritieme Autoriteit Suriname (MAS) Dhr. C. Becker Meteorologische Dienst (MD) Mw. Sallons Meteorologische Dienst (MD) mw. A. KhoenKhoen Ministerie van Arbeid, Technologische Ontwikkeling & Milieu ( ATM) Mw. S. Soetosenojo Ministerie van Arbeid, Technologische Ontwikkeling & Milieu ( ATM) Mw. N. Waal Ministerie van Arbeid, Technologische Ontwikkeling & Milieu ( ATM) Dhr. G. Kromosoeto Ministerie van Arbeid, Technologische Ontwikkeling & Milieu ( ATM) Mw. K. Kewal Ministerie van Landbouw, Veeteelt & Visserij Mw. A. Ramdjielal Ministerie van Landbouw, Veeteelt & Visserij Minister Jim Hok Ministerie van Natuurlijke Hulpbronnen Mw. Mackintosh Ministerie van Natuurlijke Hulpbronnen Dhr. Codrington Ministerrie van Openbare Werken,afd. Vuilophaal Dhr. Takoerdien Ministerrie van Openbare Werken,afd. Vuilophaal G. Hausel Nationaal Instituut voor Milieu & Ontwikkeling (NIMOS) Dhr. Q.Tjon Akon Nationaal Instituut voor Milieu & Ontwikkeling (NIMOS)Mw. R. Ramsukul Nationaal Instituut voor Milieu & Ontwikkeling (NIMOS) Dhr. J. Wanner N.V. Energie Bedrijven Suriname (EBS) Dhr. C. Rahan N.V. Energie Bedrijven Suriname (EBS) Mw. N. Haynes Kamer van Koophandel (KKF) Mw. J.Lakhisaran Pan American Health Organisation ( PAHO) Mw. Eersel Pan American Health Organisation ( PAHO) mw. M. Pool PODMS Dhr. L. Blokland Rekenkamer Mw. Felter Rekenkamer
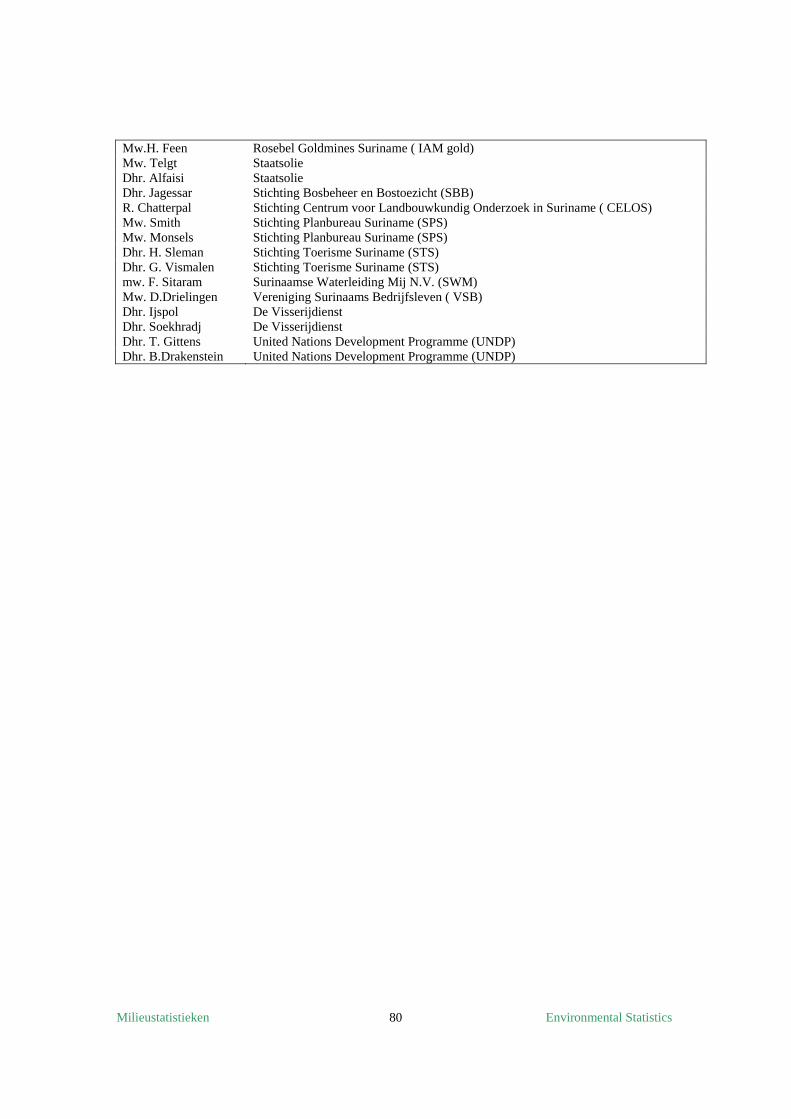
Milieustatistieken Environmental Statistics 80
Mw.H. Feen Rosebel Goldmines Suriname ( IAM gold) Mw. Telgt Staatsolie Dhr. Alfaisi Staatsolie Dhr. Jagessar Stichting Bosbeheer en Bostoezicht (SBB) R. Chatterpal Stichting Centrum voor Landbouwkundig Onderzoek in Suriname ( CELOS) Mw. Smith Stichting Planbureau Suriname (SPS) Mw. Monsels Stichting Planbureau Suriname (SPS) Dhr. H. Sleman Stichting Toerisme Suriname (STS) Dhr. G. Vismalen Stichting Toerisme Suriname (STS) mw. F. Sitaram Surinaamse Waterleiding Mij N.V. (SWM) Mw. D.Drielingen Vereniging Surinaams Bedrijfsleven ( VSB) Dhr. Ijspol De Visserijdienst Dhr. Soekhradj De Visserijdienst Dhr. T. Gittens United Nations Development Programme (UNDP) Dhr. B.Drakenstein United Nations Development Programme (UNDP)
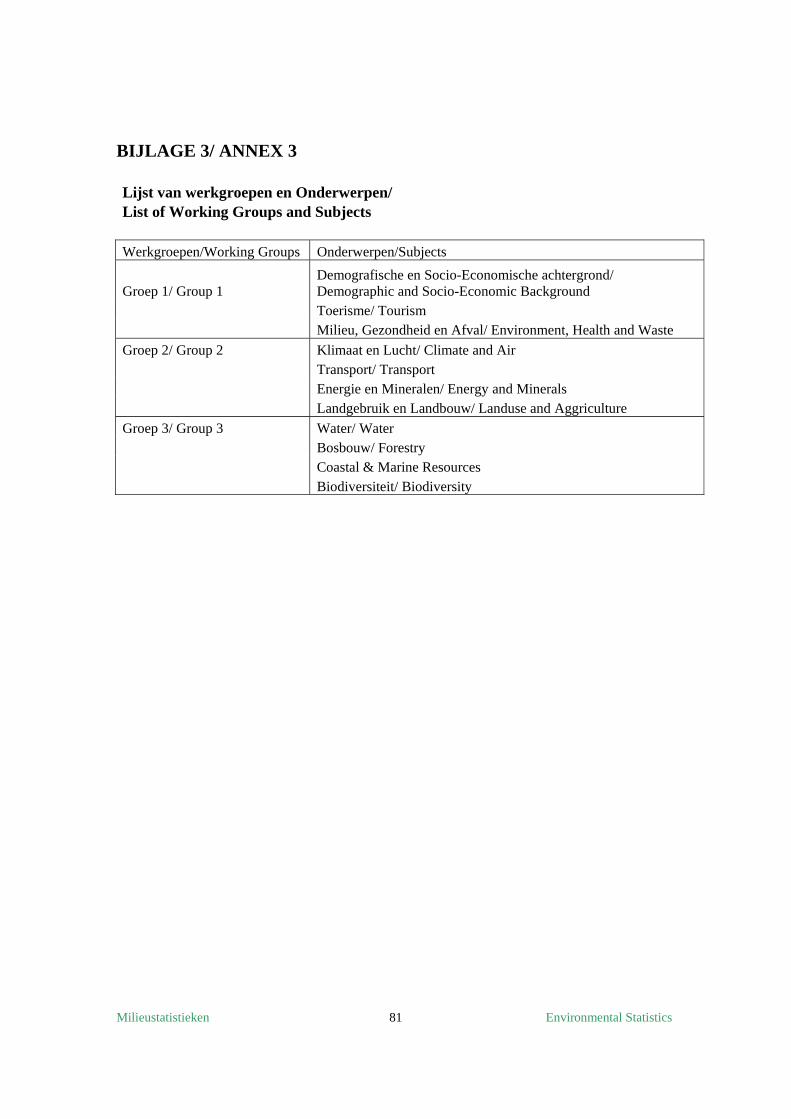
Milieustatistieken Environmental Statistics 81
BIJLAGE 3/ ANNEX 3 Lijst van werkgroepen en Onderwerpen/ List of Working Groups and Subjects
Werkgroepen/Working Groups Onderwerpen/Subjects
Groep 1/ Group 1 Demografische en Socio-Economische achtergrond/ Demographic and Socio-Economic Background
Toerisme/ Tourism Milieu, Gezondheid en Afval/ Environment, Health and Waste
Groep 2/ Group 2 Klimaat en Lucht/ Climate and Air Transport/ Transport Energie en Mineralen/ Energy and Minerals Landgebruik en Landbouw/ Landuse and Aggriculture
Groep 3/ Group 3 Water/ Water Bosbouw/ Forestry Coastal & Marine Resources Biodiversiteit/ Biodiversity