Microencapsulation for controlled release of liquid ... · Microencapsulation for controlled...
154
Microencapsulation for controlled release of liquid crosslinker : towards low temperature curing powder coatings Citation for published version (APA): Senatore, D. (2008). Microencapsulation for controlled release of liquid crosslinker : towards low temperature curing powder coatings. Eindhoven: Technische Universiteit Eindhoven. https://doi.org/10.6100/IR634193 DOI: 10.6100/IR634193 Document status and date: Published: 01/01/2008 Document Version: Publisher’s PDF, also known as Version of Record (includes final page, issue and volume numbers) Please check the document version of this publication: • A submitted manuscript is the version of the article upon submission and before peer-review. There can be important differences between the submitted version and the official published version of record. People interested in the research are advised to contact the author for the final version of the publication, or visit the DOI to the publisher's website. • The final author version and the galley proof are versions of the publication after peer review. • The final published version features the final layout of the paper including the volume, issue and page numbers. Link to publication General rights Copyright and moral rights for the publications made accessible in the public portal are retained by the authors and/or other copyright owners and it is a condition of accessing publications that users recognise and abide by the legal requirements associated with these rights. • Users may download and print one copy of any publication from the public portal for the purpose of private study or research. • You may not further distribute the material or use it for any profit-making activity or commercial gain • You may freely distribute the URL identifying the publication in the public portal. If the publication is distributed under the terms of Article 25fa of the Dutch Copyright Act, indicated by the “Taverne” license above, please follow below link for the End User Agreement: www.tue.nl/taverne Take down policy If you believe that this document breaches copyright please contact us at: [email protected] providing details and we will investigate your claim. Download date: 14. May. 2020
Transcript of Microencapsulation for controlled release of liquid ... · Microencapsulation for controlled...
Microencapsulation for controlled release of liquid crosslinker :towards low temperature curing powder coatingsCitation for published version (APA):Senatore, D. (2008). Microencapsulation for controlled release of liquid crosslinker : towards low temperaturecuring powder coatings. Eindhoven: Technische Universiteit Eindhoven. https://doi.org/10.6100/IR634193
DOI:10.6100/IR634193
Document status and date:Published: 01/01/2008
Document Version:Publisher’s PDF, also known as Version of Record (includes final page, issue and volume numbers)
Please check the document version of this publication:
• A submitted manuscript is the version of the article upon submission and before peer-review. There can beimportant differences between the submitted version and the official published version of record. Peopleinterested in the research are advised to contact the author for the final version of the publication, or visit theDOI to the publisher's website.• The final author version and the galley proof are versions of the publication after peer review.• The final published version features the final layout of the paper including the volume, issue and pagenumbers.Link to publication
General rightsCopyright and moral rights for the publications made accessible in the public portal are retained by the authors and/or other copyright ownersand it is a condition of accessing publications that users recognise and abide by the legal requirements associated with these rights.
• Users may download and print one copy of any publication from the public portal for the purpose of private study or research. • You may not further distribute the material or use it for any profit-making activity or commercial gain • You may freely distribute the URL identifying the publication in the public portal.
If the publication is distributed under the terms of Article 25fa of the Dutch Copyright Act, indicated by the “Taverne” license above, pleasefollow below link for the End User Agreement:www.tue.nl/taverne
Take down policyIf you believe that this document breaches copyright please contact us at:[email protected] details and we will investigate your claim.
Download date: 14. May. 2020
Microencapsulation for controlled
release of liquid crosslinker: towards low temperature curing powder coatings
PROEFSCHRIFT ter verkrijging van de graad van doctor aan de Technische Universiteit Eindhoven, op gezag van de Rector Magnificus, prof.dr.ir. C.J. van Duijn, voor een commissie aangewezen door het College voor Promoties in het openbaar te verdedigen op maandag 21 april 2008 om 16.00 uur
door Daniela Senatore
geboren te Cava de’ Tirreni, Italië
II
Dit proefschrift is goedgekeurd door de promotoren: prof.dr. R.A.T.M. van Benthem en prof.dr. G. de With Copromotor: dr. J. Laven Micro-encapsulation for controlled release of liquid cross-linker: towards low temperature curing powder coatings by Daniela Senatore Technische Universiteit Eindhoven, 2008 A catalogue record is available from the Eindhoven University of Technology Library Proefschrift, ISBN: 978-90-386-1247-8 The research described in this thesis forms part of the research programme of the Dutch Polymer Institute (DPI, P.O. Box, 5600 AX, Eindhoven), Coating Technology Area, DPI project #422. Cover designed by Daniela Senatore and Petr Sereda: “smiling” spray dried particle Printed by Printpartners Ipskamp, Eschede, The Netherlands, 2008 An electronic copy of this thesis is available at the site of the Library of Eindhoven, University of Technology, http://w3.tue.nl/en/services/library/digilib/publications_from_tue/dissertations/

III
A Domenico

IV
V
TABLE OF CONTENT
1. GENERAL INTRODUCTION 1
1.1. Micro-Encapsulation 1
1.1.1. Spray drying 2
1.2. Coatings and encapsulation 5
1.3. Aim and outline of the thesis 6
2. MICROENCAPSULATION OF THE LIQUID CROSSLINKER: DESIGN OF EXPERIMENT 9
2.1. Introduction 10
2.2. Experimental 11
2.3. Result and discussion 19
2.3.1. Characterization of ELO dispersions 19
2.3.2. Spray-dried powder: statistical analysis and interpretation 20
2.3.3. Morphology of the spray-dried particles 29
2.4. Conclusions 33
3. MISCIBILITY AND SPECIFIC INTERACTIONS IN BLENDS OF POLY(N-VINYL-2-
PYRROLIDONE) AND ACID FUNCTIONAL POLYESTER RESINS 37
3.1. Introduction 38
3.2. Experimental 39
3.3. Result and discussion 42
3.3.1. DSC analysis 42
3.3.2. FTIR analysis 49
3.3.3. CPMAS NMR analysis 55
3.4. Conclusions 58
4. MICROENCAPSULATED CROSSLINKER FOR POWDER COATING: TOWARDS LOW
TEMPERATURE CURING 63
4.1. Introduction 64
4.2. Experimental 65
4.3. Result and discussion 68
4.3.1. Characterization of the spray dried particles 68
4.3.2. DSC and DMTR of the coating powders 72
4.4. Conclusions 87
5. THE EFFECT OF PVP ON THE POWDER COATING PERFORMANCE 93
5.1. Introduction 94
5.2. Experimental 94
5.3. Result and discussion 97
5.3.1. Coating powder: effect of the PVP on the curing kinetics 97
5.3.2. Cured powder coatings: effect of the PVP on the coating performance 112
5.4. Conclusions 115
VI
6. EPILOGUE 117
6.1 Aim of the project 118
6.2 Encapsulation of the cross-linker 118
6.2.1 Mini-emulsion polymerization and spray drying as alternative route of encapsulation 119
6.3 Characterization of the microparticles 120
6.4 Preparation of the powder coating formulation and curing 121
SUMMARY 125
ACKNOWLEDGMENTS 129
CURRICULUM VITAE 133
PUBLICATIONS 135
1 Introduction
1
1.1 Microencapsulation
Sputnik 1 was the first artificial satellite sent to outer space1. Its exterior was a spherical shell
with a diameter of about 60 cm that had many functions among which two were very important:
it protected its interior from the hostile outside and prevented its interior (e.g. gas) from escaping.
Mankind has over the years built an enormous variety of walls for all kind of reasons, but
avoiding escape (e.g. prisons) and entrance (e.g. town walls) appear to be the most prominent
ones.
Mother Nature taught this principle to mankind via many examples of shell-like isolators,
which vary from the birds’ eggs and the coconuts on a macroscale to vesicle membranes in
biological cells on a nanoscale. Both types have been developed to protect or to provide
particular reaction spaces2.
The enveloping of a liquid, solid or gas within another material to form particles is called
encapsulation. Depending on the method and the materials used, the size and shape of the
particles can vary. Often the term “capsules” is used when the encapsulated substance (the core,
the active agent, the filling, the internal phase, the nucleus or the payload) is surrounded by a
membrane of material (the encapsulant, the carrier, the coating, the membrane, the shell or the
wall), while the term “sphere” or just “particle” is used when the core is dispersed or dissolved in
the carrier substance. Particles or capsules which have sizes between 1-5000 µm are called
microparticles or microcapules; below 1 µm, they are usually defined as nanocapsules or
nanoparticles and above 5000 µm the particles are called macro-capsules or just coated particles.
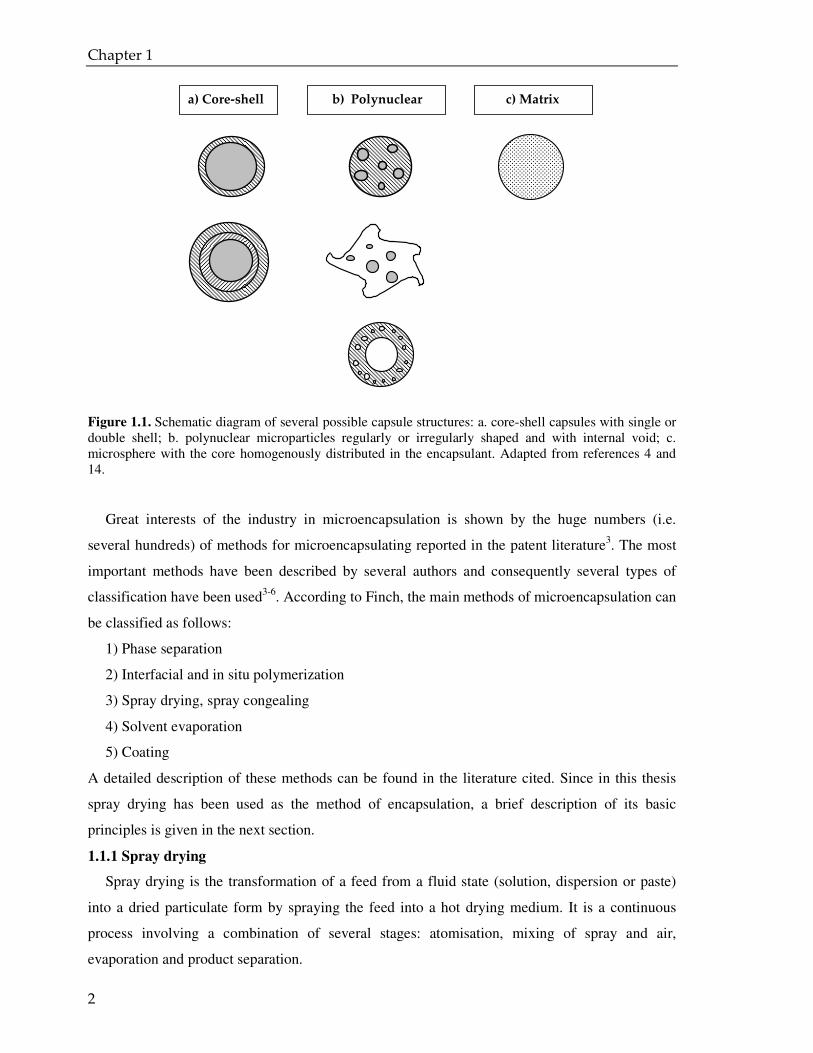
Microcapsules are usually spherical, but they can also have an irregular shape. Figure 1.1
illustrates the difference between microparticles as well as some of their typical geometries.
Substances may be microencapsulated with the intention that the core material will be
confined within the capsule walls for a specific period of time. Alternatively, core materials may
be encapsulated so that the core material will be released either gradually through the capsule
walls, known as controlled release or diffusion, or when external conditions trigger the capsule
walls to rupture, melt, or dissolve.
Chapter 1
2
Figure 1.1. Schematic diagram of several possible capsule structures: a. core-shell capsules with single or double shell; b. polynuclear microparticles regularly or irregularly shaped and with internal void; c. microsphere with the core homogenously distributed in the encapsulant. Adapted from references 4 and 14.
Great interests of the industry in microencapsulation is shown by the huge numbers (i.e.
several hundreds) of methods for microencapsulating reported in the patent literature3. The most
important methods have been described by several authors and consequently several types of
classification have been used3-6. According to Finch, the main methods of microencapsulation can
be classified as follows:
1) Phase separation
2) Interfacial and in situ polymerization
3) Spray drying, spray congealing
4) Solvent evaporation
5) Coating
A detailed description of these methods can be found in the literature cited. Since in this thesis
spray drying has been used as the method of encapsulation, a brief description of its basic
principles is given in the next section.
1.1.1 Spray drying
Spray drying is the transformation of a feed from a fluid state (solution, dispersion or paste)
into a dried particulate form by spraying the feed into a hot drying medium. It is a continuous
process involving a combination of several stages: atomisation, mixing of spray and air,
evaporation and product separation.
a) Core-shell b) Polynuclear c) Matrix
Introduction
3
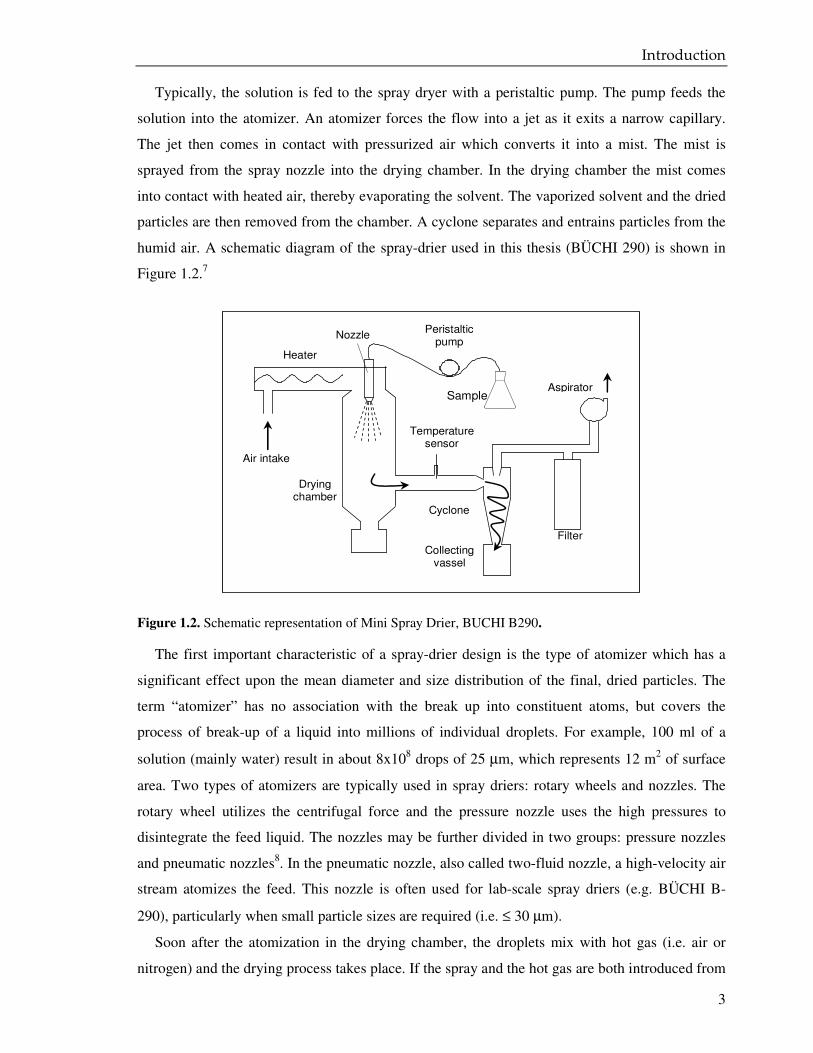
Typically, the solution is fed to the spray dryer with a peristaltic pump. The pump feeds the
solution into the atomizer. An atomizer forces the flow into a jet as it exits a narrow capillary.
The jet then comes in contact with pressurized air which converts it into a mist. The mist is
sprayed from the spray nozzle into the drying chamber. In the drying chamber the mist comes
into contact with heated air, thereby evaporating the solvent. The vaporized solvent and the dried
particles are then removed from the chamber. A cyclone separates and entrains particles from the
humid air. A schematic diagram of the spray-drier used in this thesis (BÜCHI 290) is shown in
Figure 1.2.7
Figure 1.2. Schematic representation of Mini Spray Drier, BUCHI B290.
The first important characteristic of a spray-drier design is the type of atomizer which has a
significant effect upon the mean diameter and size distribution of the final, dried particles. The
term “atomizer” has no association with the break up into constituent atoms, but covers the
process of break-up of a liquid into millions of individual droplets. For example, 100 ml of a
solution (mainly water) result in about 8x10⁸ drops of 25 µm, which represents 12 m2 of surface
area. Two types of atomizers are typically used in spray driers: rotary wheels and nozzles. The
rotary wheel utilizes the centrifugal force and the pressure nozzle uses the high pressures to
disintegrate the feed liquid. The nozzles may be further divided in two groups: pressure nozzles
and pneumatic nozzles8. In the pneumatic nozzle, also called two-fluid nozzle, a high-velocity air
stream atomizes the feed. This nozzle is often used for lab-scale spray driers (e.g. BÜCHI B-
290), particularly when small particle sizes are required (i.e. ≤ 30 µm).
Soon after the atomization in the drying chamber, the droplets mix with hot gas (i.e. air or
nitrogen) and the drying process takes place. If the spray and the hot gas are both introduced from
Air intake
Heater
Nozzle Peristaltic
pump
Temperature sensor
Drying chamber
Cyclone
Filter
Aspirator Sample
Collecting vassel
Chapter 1
4
the top of the chamber and travel in the same direction through the dryer, the drying take place
within co-current. Vice versa, if the spray and the air are introduced, the first from the top and the
second from the bottom, the drying proceeds in a counter-current flow. Co-current flow is often
used to spray heat-sensitive materials, while the counter-current flow is used when a powder
within a certain characteristic is needed (e.g. high bulk density powder)9. A mixture of co- and
counter-current flow is also possible.
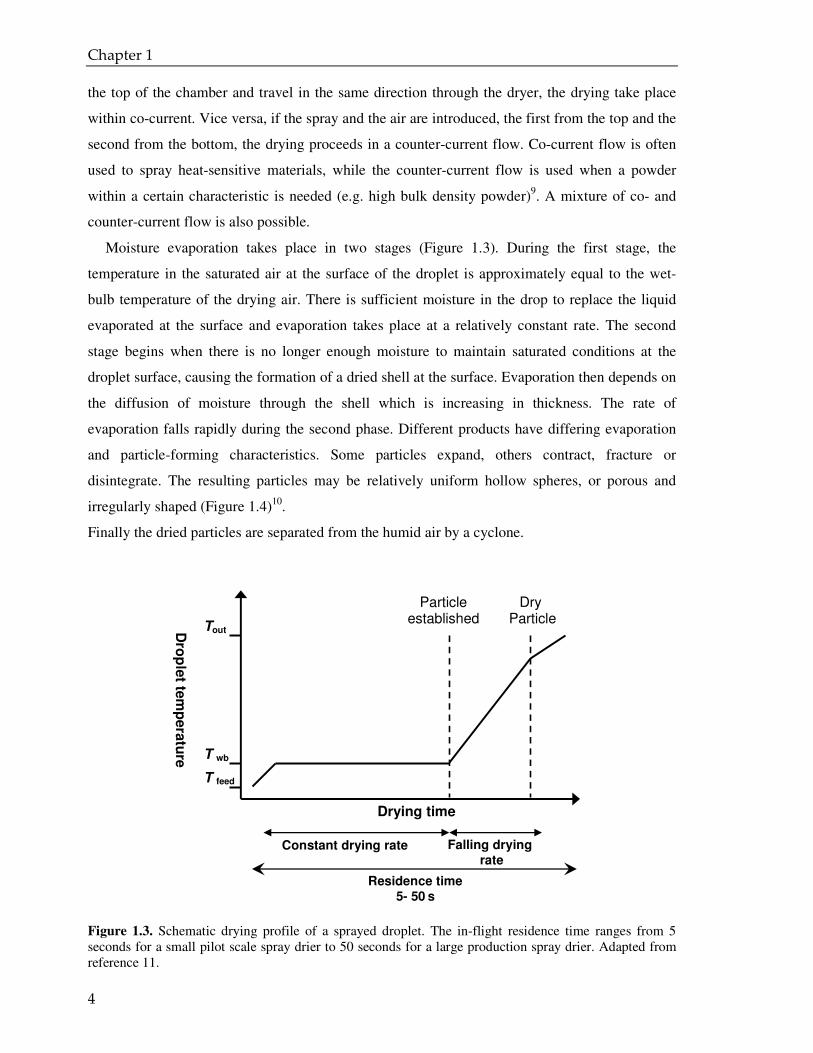
Moisture evaporation takes place in two stages (Figure 1.3). During the first stage, the
temperature in the saturated air at the surface of the droplet is approximately equal to the wet-
bulb temperature of the drying air. There is sufficient moisture in the drop to replace the liquid
evaporated at the surface and evaporation takes place at a relatively constant rate. The second
stage begins when there is no longer enough moisture to maintain saturated conditions at the
droplet surface, causing the formation of a dried shell at the surface. Evaporation then depends on
the diffusion of moisture through the shell which is increasing in thickness. The rate of
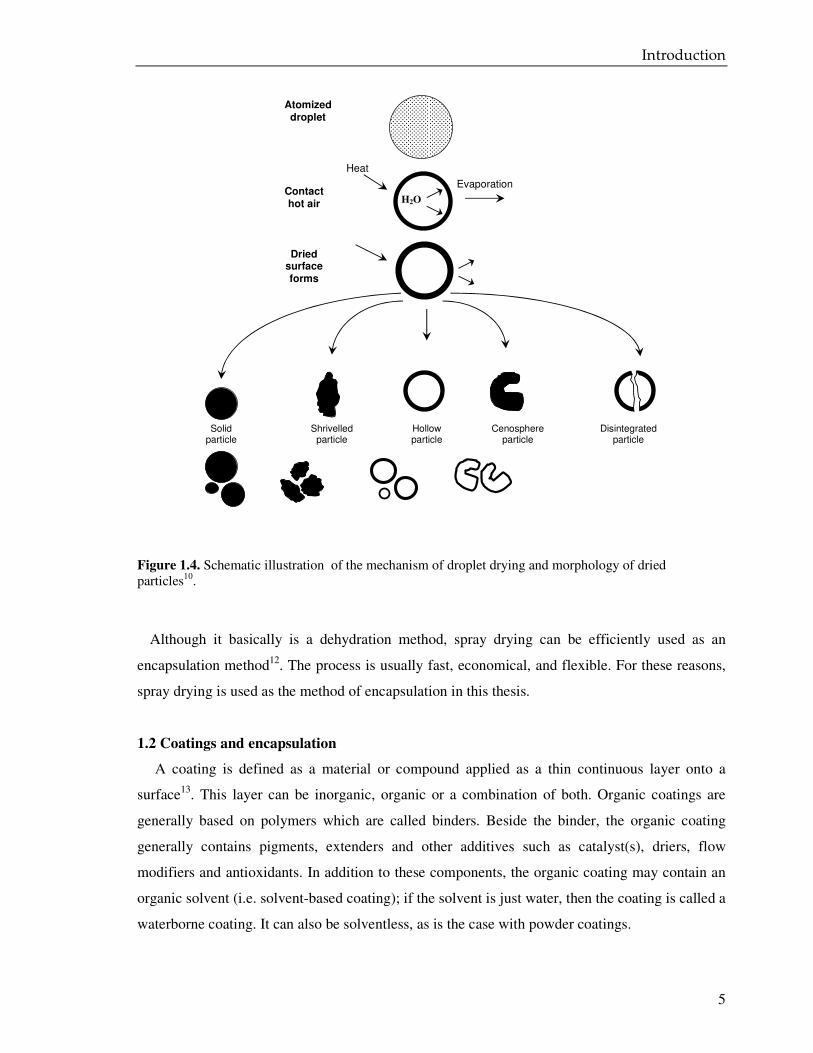
evaporation falls rapidly during the second phase. Different products have differing evaporation
and particle-forming characteristics. Some particles expand, others contract, fracture or
disintegrate. The resulting particles may be relatively uniform hollow spheres, or porous and
irregularly shaped (Figure 1.4)10.
Finally the dried particles are separated from the humid air by a cyclone.
Figure 1.3. Schematic drying profile of a sprayed droplet. The in-flight residence time ranges from 5 seconds for a small pilot scale spray drier to 50 seconds for a large production spray drier. Adapted from reference 11.
D
rop
let te
mp
era
ture
T feed
T wb
Tout
Drying time
Constant drying rate Falling drying rate
Residence time 5- 50
s
Particle established
Dry Particle
Introduction
5
Figure 1.4. Schematic illustration of the mechanism of droplet drying and morphology of dried particles10.
Although it basically is a dehydration method, spray drying can be efficiently used as an
encapsulation method12. The process is usually fast, economical, and flexible. For these reasons,
spray drying is used as the method of encapsulation in this thesis.
1.2 Coatings and encapsulation
A coating is defined as a material or compound applied as a thin continuous layer onto a
surface13. This layer can be inorganic, organic or a combination of both. Organic coatings are
generally based on polymers which are called binders. Beside the binder, the organic coating
generally contains pigments, extenders and other additives such as catalyst(s), driers, flow
modifiers and antioxidants. In addition to these components, the organic coating may contain an
organic solvent (i.e. solvent-based coating); if the solvent is just water, then the coating is called a
waterborne coating. It can also be solventless, as is the case with powder coatings.
H2O
Heat
Evaporation
Atomized droplet
Contact hot air
Dried surface forms
Solid particle
s
Shrivelled particle
Hollow particle
Cenosphere particle
Disintegrated particle
Chapter 1
6
Coatings are mainly used in everyday life to protect an object from atmospheric moisture, UV-
light etc, and also to establish decoration (paints, lacquers); in most cases, it is a combination of
both. Nowadays, coating research is focused on designing coatings which, beside the classical
properties of protection and decoration, possess an additional “functionality”, as with self-
cleaning, self-healing, anti-fouling, soft-feel, anti-bacterial and anti–corrosion coatings. These
and other applications that already involve or could involve the use of microencapsulation to
create functional coatings are described by Gosh14, along with the description of some of the most
important methods for microencapsulation. This technique has already been proven as a
successful technology in many technological fields, i.e. paper production15, foods16,
pharmaceuticals17, graphic art18, agrochemicals19, cosmetics20 and adhesives21. On the other hand,
Gosh reports “microencapsulation has not been yet explored in the field of functional coatings
where the possibilities of obtaining functional surfaces using microcapsules are almost
unlimited”.
In this thesis, microencapsulation is not used in the design and optimization of a functional
coating, but it will be shown that microencapsualtion is potentially an interesting way to improve
the physical and chemical stability of a low temperature powder coating (“proof of principle”).
1.3 Aim and outline of the thesis
Since 1990, in view of the European regulation concerning the reduction of the VOC22
(Volatile Organic Compound) emission into the air, powder coatings, which are completely
solvent free, have become a very attractive alternative to solvent-based coatings. A powder
coating is obtained by melt mixing the formulation ingredients (i.e., resin, cross-linker, pigments
and several additives), typically at 90 °C - 110 ºC, by means of an extruder. After extrusion, the
melt is cooled to ambient temperature, ground and sieved. After that, the powder is ready to be
applied by spraying electrostatically on the object to be coated. The process is completed, when
the applied powder melts and cures by heating the object to a temperature usually between 150 ºC
and 200 ºC23.
The current trend in powder coatings is to use formulations which cure at 100 °C - 140 ºC24.
Beside the cost savings due to energy reduction, a low temperature powder coating can be used
on heat-sensitive substrates like MDF (medium density fiber), wood and plastic. In order to
enable low temperature curing, a sufficiently high reaction rate at such a temperature is required.
However, as the kinetics of curing of a thermosetting powder coating usually follows a classical
Arrhenius equation, a higher curing rate at lower temperature also implies a less chemically
stable system during melt extrusion and upon storage.
Introduction
7
Moreover, in the need to find an environmentally friendly and less toxic alternative cross-
linker to the widely used triglycidyl isocyanurate (TGIC), the use of liquid cross-linkers has been
explored25. To their disadvantage, liquid crosslinkers can act as plasticizers and lower the glass
transition temperature (Tg) of the resin, compromising the physical stability of powder coatings
upon storage.
In this thesis, we attempt to control the chemical and physical stability of a powder coating
formulation, without compromising the ability of the coating to become homogeneously cross-
linked, by encapsulating a liquid cross-linker in a polymeric matrix. The powder coating system
is based on an acid functional polyester (APE) and an aliphatic oxirane, epoxidized linseed oil
(ELO).
Chapter 2 describes the encapsulation of the ELO in poly(N-vinyl-pyrrolidone) (PVP) by
spray drying. Although this process is rather fast, low-cost and generally environmentally
friendly, in reality many parameters can affect the result of the encapsulation. As the optimal
conditions for such a process in our case were far from clear, a design of experiments (DoE)
approach was used to study and to optimize the encapsulation process by spray drying in terms
of total amount of ELO in the powder (payload) and amount of ELO enclosed in the PVP
(encapsulation efficiency).
Chapter 3 reports the miscibility of the acid functional polyesters as used e.g. in powder
coatings with the PVP. The miscibility and the intermolecular interactions of their blends are
studied using Differential Scanning Calorimetry (DSC), Attenuated Reflectance Fourier
Transform Infrared (ATR-FTIR) and Cross-Polarization Magic Angle Spinning (CPMAS) 13C
NMR spectroscopy.
Chapter 4 illustrates the preparation of a spray dried powder for encapsulating the ELO
according to the optimum conditions found in Chapter 2. The spray dried powder (SDP) was
used as cross-linker of an acid functional polyester in a powder coating (PC) formulation. This
PC formulation was compared with two other formulations based on the same APE, but
containing free ELO. The curing process of the PC formulations was studied by differential
scanning calorimeter (DSC) analysis and Dynamic Mechanical Rheological Testing (DMRT or
DMA).
Chapter 5 describes the influence of the addition of PVP on the kinetics of curing and the
performance of powder coating. The effect of the PVP on the kinetics is studied by isothermal
and non-isothermal DSC. The effect of the PVP as a water absorbing additive is studied by means
of DSC, mechanical and optical tests.
Chapter 1
8
1.4 References
(1) http://en.wikipedia.org/wiki/Sputnik_1, accessed on 1-1-2008.
(2) Sliwka, A. W. Angewandte Chemie-International Edition in English, 1975, 14, 8, 539-550.
(3) Finch C.A.;Bodmeier R. Microencapsulation, Wiley-VHC Verlag CmbH & Co., 2002.
(4) Thies C. Microencapsulation, John Wile & Sons, Inc., New York, 2005.
(5) Luzzi, L. A. Journal of Pharmaceutical Sciences, 1970, 59, 10.
(6) Gutcho, M. Capsule technology and microencapsulation, Park Ridge, N.J., 1972.
(7) Buchi Labortechnik, Training papers spray-drying, http://www.buchi.com/Spray-Drying.69.0.html,
accessed on 1-1-0008.
(8) Cedik, P.; Filkova, I. Drying Technology, 1985, 3, 1, 101-118.
(9) Oakley, D. E. Chemical Engineering Progress, 1997, 93, 10, 48-54.
(10) Masters, K. Spray Drying Handbook, 5th, Longman Scientific & Technical, Harlow Essex, England, 1991.
(11) Elversson J. Spray-Dried Powders for Inhalation - Particle Formation and Formulation Concepts, Appsala Universitet, 2005.
(12) Re, M. I. Drying Technology, 1998, 16, 6, 1195-1236.
(13) Wicks, Z. W.; Jones, F. N.; Pappas, S. P. Organic Coatings: Science and Technology, Wiley-Interscience, Chichester, 1992.
(14) Ghosh, S. K. Functional coatings by polymer microencapsulation, Wiley-VCH, Weinheim, 2006.
(15) Blythe, D. Microspheres, Microcapsules and Liposomes, Citus Books, London, 1999.
(16) Shahidi, F.; Han, X. Q. Critical Reviews in Food Science and Nutrition, 1993, 33, 6, 501-547.
(17) Thies, C. Crc Critical Reviews in Biomedical Engineering, 1982, 8, 4, 335-383.
(18) Comiskey, B.; Albert, J. D.; Yoshizawa, H.; Jacobson, J. Nature, 1998, 394, 6690, 253-255.
(19) Tsuji K. Microspheres, Microcapsules & Liposomes, Citus Books, London, 1999.
(20) Miyazawa, K.; Yajima, I.; Kaneda, I.; Yanaki, T. Journal of Cosmetic Science, 2000, 51, 4, 239-252.
(21) Pernot J.M. Microsphere, Microcapsules and Liposomes, Citus Books, London, 2007.
(22) Official Journal of the European Communities, 1999, L85/1.
(23) Misev, T. A. Powder coatings: chemistry and technology, John Wiley and Sons, Inc., New York, 1991.
(24) Misev, T. A.; van der Linde, R. Progress in Organic Coatings, 1998, 34, 1-4, 160-168.
(25) Overeem, A.; Buisman, G. J. H.; Derksen, J. T. P.; Cuperus, F. P.; Molhoek, L.; Grisnich, W.; Goemans, C. Industrial Crops and Products, 1999, 10, 3, 157-165.


2 Microencapsulation of the liquid
cross-linker: Design of Experiment
9
Experimental factorial design was chosen to investigate the effects of seven parameters on the encapsualation of the epoxidized linseed oil in poly(N-vinyl-pyrrolidone) by spray drying. Three factors concerning both the dispersion feed (total concentration of additive and core to encapsulant ratio) and the spray-drying processes (spray flow of the spray-drier) were chosen. A 23 factorial Design of Experiment was carried out. The aim of the design of experiment was to understand and to optimize the encapsulation process in terms of total amount of epoxidized linseed oil in the powder (payload) and the amount of epoxidized linseed oil enclosed in the polyvinylpyrrolidone (encapsulation efficiency).
Chapter 2
10
2.1 Introduction
Microencapsulation is defined as the process of enveloping one substance (a solid, liquid and
gas) within another material, to form particles, which range from less than one micron to several
hundred microns in size. The substance that is encapsulated is usually called the core material,
the active ingredient or agent, filling, nucleus, or internal phase. The material encapsulating the
core is referred to as the coating, membrane, shell, or wall material.
Microparticles may be spherically shaped, with a continuous wall surrounding the core while
others are asymmetrically and variably shaped, with a quantity of smaller droplets of core
material embedded throughout the encapsulating material1. Mother Nature offers many examples
of encapsulation varying from macroscale (e.g. from the birds’ eggs) to nanoscale (e.g. the
vesicles)2. Microencapsulation may be achieved by numerous techniques3 and has been applied in
different fields, e.g. paper4, food5, pharmaceutical6, graphic art7, agrochemical8, cosmetic9,
adhesive10 and coating industry11. Substances may be microencapsulated with the intention that
the core material will be confined within the capsule walls for a specific period of time.
Alternatively, core materials may be encapsulated so that the core material will be released either
gradually through the capsule walls, known as controlled release or diffusion, or when external
conditions trigger the capsule walls to rupture, melt, or dissolve.
This chapter reports on the preparation of micro-encapsulated droplets of a liquid cross-linker,
epoxidized linseed oil (ELO), for powder coating applications. Spray drying was employed in
this study for microencapsulating. This technique simply consists of preparing a dispersion of the
liquid to be encapsulated (the “core”) in an aqueous solution of a polymer (the “encapsulant”).
The emulsion is atomized into a spray of fine droplets (atomization) in a chamber, where it meets
a flow of hot air. The water of the emulsion droplets rapidly evaporates forming dried particles,
which are separated by means of a cyclone and collected in a detachable vessel12 .
Originally, spray-drying was widely used as a dehydration method, especially for drying heat-
sensitive foods and pharmaceuticals. Nowadays, this technique is also used as a method to entrap
an active material within a protective matrix. Indeed, spray-drying is a rather fast, low-cost and
generally environmentally friendly process. Although this process of encapsulation, as above
described, appears very straightforward, in reality many parameters can affect the result. Many
papers report the factors influencing the encapsulation of volatile or heat-sensitive compounds by
spray-drying13-19. An extensive review of all the factors which effect microencapsulation via
spray-drying of volatile compounds was reported by Re20. This author described how the
properties of the compounds (molecular weight, vapour pressure, concentration in the emulsion),
the properties of the capsule wall material (type, molecular weight), the properties of the
Microencapsulation of the liquid cross-linker: Design of Experiment
11
emulsion (solid content, oil droplets size distribution, stability) and the drying process conditions
(atomized droplet size, inlet temperature, drying air velocity, drier feed rate) influence the
retention of the core and the encapsulation efficiency.
In the present study, we disperse the liquid ELO in an aqueous solution of poly(N-vinyl-2-
pyrrolidone) (PVP) to obtain a fine emulsion, which was successively sprayed by means of a lab
scale spray-drier. As the optimal conditions for such a process in our case were far from clear, we
had to investigate the effect of the various process and formulation variables on the total amount
of ELO in the spray dried powder (payload) and on the efficiency of the encapsulation (amount of
ELO inside the particles to total amount of ELO). To do so, we used a design of experiments
(DoE) approach. In this chapter we describe how we chose the most relevant parameters. Then,
we will show the results of the performed DoE using the selected parameters in terms of payload
and encapsulation efficiency. Finally, we reveal the results of the characterization of the
morphology of spray dried powders (SDP) via Scanning Electron Microscopy (SEM) and static
Light Scattering (LS).
2.2 Experimental
Materials Poly(N-vinyl-2-pyrrolidone) (PVP) was obtained from Aldrich and has a molecular
weight of about 10000 g/mol. The epoxidized linseed oil was a kind gift of DSM Resins, B.V.
(Zwolle) and has weight per equivalent (weight in g of sample containing one equivalent of
epoxy group) of 167.5. The compounds 4-(1,1,3,3-tetramethylbutyl)phenyl-polyethylene glycol
(Triton TX100, Aldrich) and sorbitol mono-oleate (Span 80, Aldrich) were used as surfactant.
Deionized water was obtained with a Milli-Q water purifying system. Anhydrous ethyl ether (EE)
(purity ≥ 99.8 %), petroleum ether (PE) and n-heptane (purity ≥ 99.8 %) were purchased from
Aldrich and were used as supplied.
Emulsification and spray-drying The emulsions of ELO in aqueous solution of PVP were
prepared by first dissolving the TX100 in water to obtain a 2 wt % solution. Then, PVP was
added to the surfactant solution, which was magnetically stirred overnight until all the PVP had
been dissolved and the solution appeared transparent. The ELO was added to the PVP aqueous
solution and emulsified at 11300 rpm for 90 seconds with a rotor-stator homogenizer
(Ultraturrax, T25, IKA-Labortechnik). Finally, to further reduce the size of the oil droplets, the
coarse emulsion was homogenized using an ultrasonic processor (Sonic Vibracell VC750, 720 W,
20 kHz) equipped with a 13 mm tip high intensity horn. The sound horn was immersed at a
constant depth and placed centrally in the emulsion. Emulsions were prepared at an amplitude of
80 %, which results in a power output between 70-80 W. The applied time of the ultrasonic
Chapter 2
12
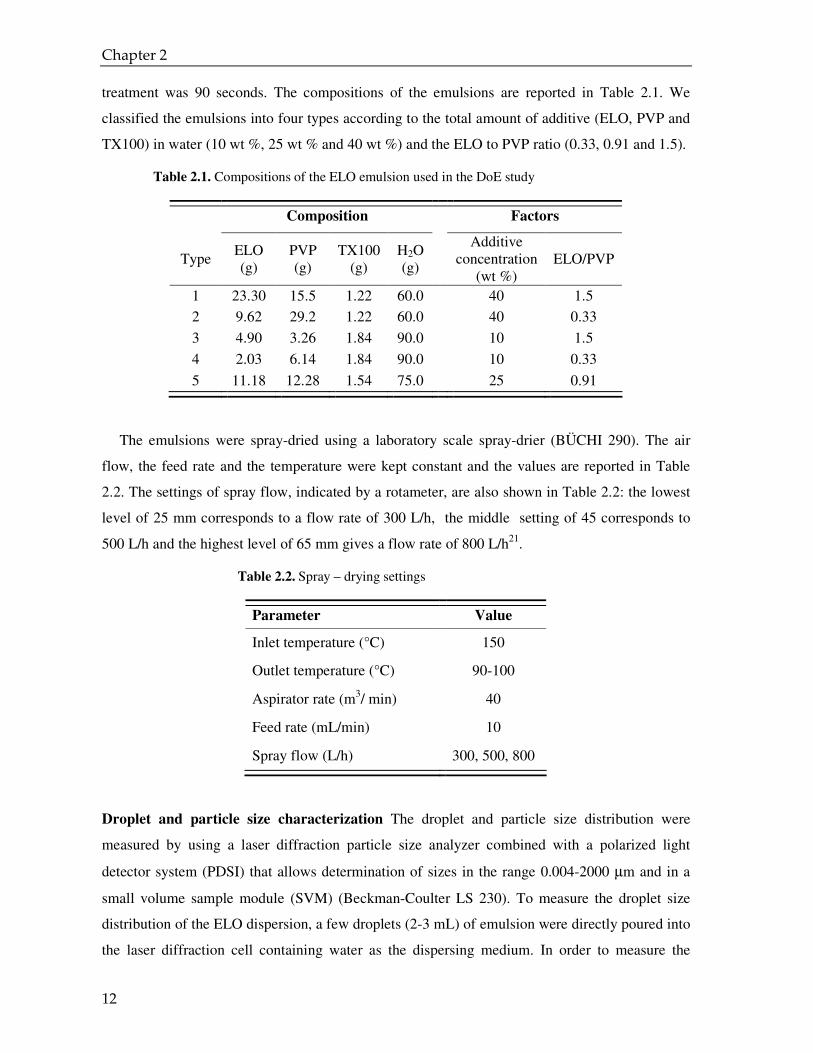
treatment was 90 seconds. The compositions of the emulsions are reported in Table 2.1. We
classified the emulsions into four types according to the total amount of additive (ELO, PVP and
TX100) in water (10 wt %, 25 wt % and 40 wt %) and the ELO to PVP ratio (0.33, 0.91 and 1.5).
Table 2.1. Compositions of the ELO emulsion used in the DoE study
Composition Factors
Type ELO (g)
PVP (g)
TX100 (g)
H2O (g)
Additive
concentration (wt %)
ELO/PVP
1 23.30 15.5 1.22 60.0 40 1.5
2 9.62 29.2 1.22 60.0 40 0.33
3 4.90 3.26 1.84 90.0 10 1.5
4 2.03 6.14 1.84 90.0 10 0.33
5 11.18 12.28 1.54 75.0 25 0.91
The emulsions were spray-dried using a laboratory scale spray-drier (BÜCHI 290). The air
flow, the feed rate and the temperature were kept constant and the values are reported in Table
2.2. The settings of spray flow, indicated by a rotameter, are also shown in Table 2.2: the lowest
level of 25 mm corresponds to a flow rate of 300 L/h, the middle setting of 45 corresponds to
500 L/h and the highest level of 65 mm gives a flow rate of 800 L/h21.
Table 2.2. Spray – drying settings
Parameter Value
Inlet temperature (°C) 150
Outlet temperature (°C) 90-100
Aspirator rate (m3/ min) 40
Feed rate (mL/min) 10
Spray flow (L/h) 300, 500, 800
Droplet and particle size characterization The droplet and particle size distribution were
measured by using a laser diffraction particle size analyzer combined with a polarized light
detector system (PDSI) that allows determination of sizes in the range 0.004-2000 µm and in a
small volume sample module (SVM) (Beckman-Coulter LS 230). To measure the droplet size
distribution of the ELO dispersion, a few droplets (2-3 mL) of emulsion were directly poured into
the laser diffraction cell containing water as the dispersing medium. In order to measure the
Microencapsulation of the liquid cross-linker: Design of Experiment
13
particle size distribution of the spray-dried powder (SDP), 0.5 mg was dispersed in 5 mL of a 2
wt % solution of Span 80 in n-heptane. The dispersion was stirred for 1 minute with an
ultrasound processor equipped with a micro-tip horn. A few drops of this dispersion were added
to the diffraction cell which used n-heptane as a dispersant medium. The ELO droplet size
distribution in the powder after spray-drying was measured from the reconstituted emulsion.
About 0.2 mg of powder were added to 1.8 mL water and gently stirred with a magnetic stirrer
for 30 minutes. Successively, the droplet size distribution was measured as mentioned above.
Characterization of the spray-dried particles The total amount of ELO per weight of SDP was
defined as the payload (wt %) and was measured by DSC. It is known that for an immiscible
mixture of two compounds the fraction of the component can be quantified according to the
following formula: x = ∆ (mixture)/∆ (pure)p pC C , where ∆ (mixture)pC is the change in the
specific heat capacity at glass transition temperature g ( )T for the component in the mixture and
(pure)pC∆ is the change in specific heat capacity at gT of the pure component22.
The DSC measurements were performed with a Perkin-Elmer Pyris 1 calorimeter, calibrated with
indium and lead standards. The samples were placed in aluminium pans of 10 µL volume (PE
volatile pans) and sealed. The sample weights varied between 5 and 10 mg. The samples were
first cooled down from 30 °C to -110 °C at 20 °C/min, then heated up to 40 °C at 20 °C/min and
cooled down again to -30 °C at 30 °C/min to eliminate an exothermic peak of crystallization,
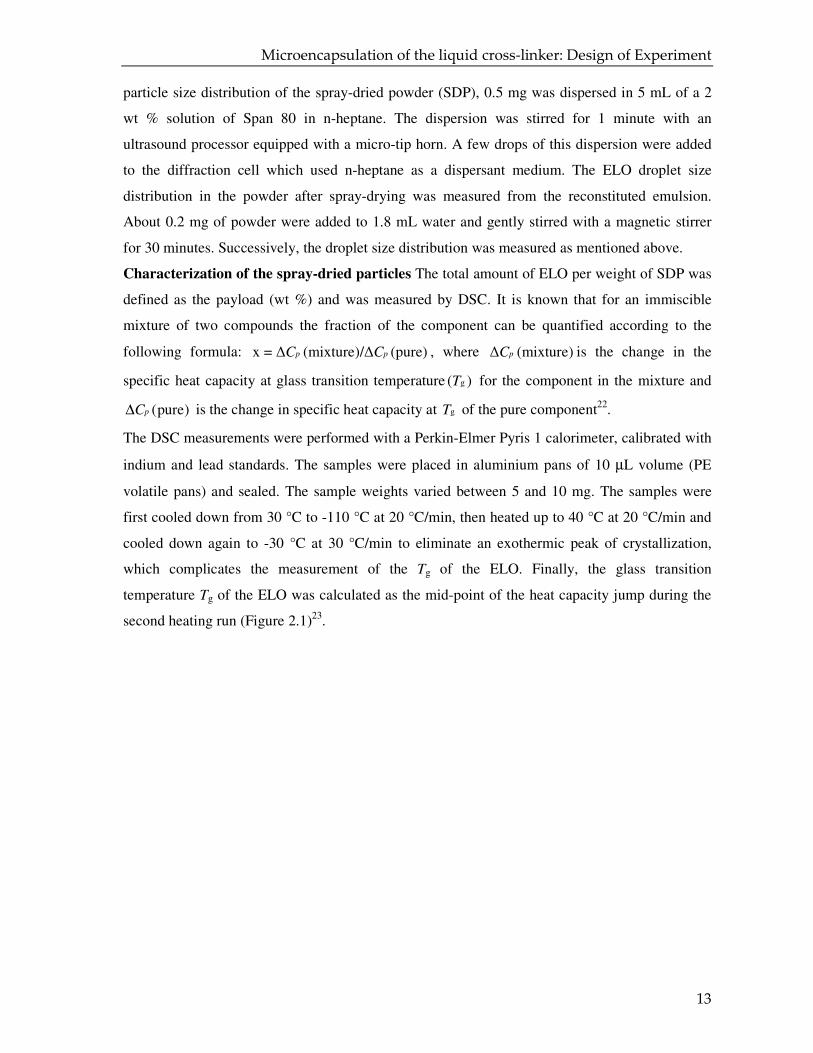
which complicates the measurement of the Tg of the ELO. Finally, the glass transition
temperature Tg of the ELO was calculated as the mid-point of the heat capacity jump during the
second heating run (Figure 2.1)23.
Chapter 2
14
Figure 2.1. Heating curve of the DSC thermogram of pure ELO ( heating rate 20 °C/min); the arrow marks the glass transition temperature (Tg ) of ELO and the * labels indicate endothermic peaks probably due to the melting of crystals of low molecular weight impurities (e.g. free fatty acid of Linseed oil24).
The “free” ELO or non-encapsulated ELO was measured by washing 0.500 g (w1) of SDP
with 20 mL of a mixture of ethyl ether and petroleum ether (1:1.5). The powder was placed into a
glass bottle of 30 mL volume together with a magnetic bar. 20 mL of solvent mixture were added
and the suspension was gently stirred. Then, the suspension was filtered on a paper filter and
washed three times with 10 mL of solvent mixture. The solution was transferred into an
aluminum pan of 70 mL, previously weighed (w2) and placed into a vacuum oven at 60 °C
overnight. The amount of extracted ELO (free ELO) was calculated as follows:
3 2 1extracted ELO = 100( - / )×w w w , where w3 is the weight of the aluminum pan after drying.
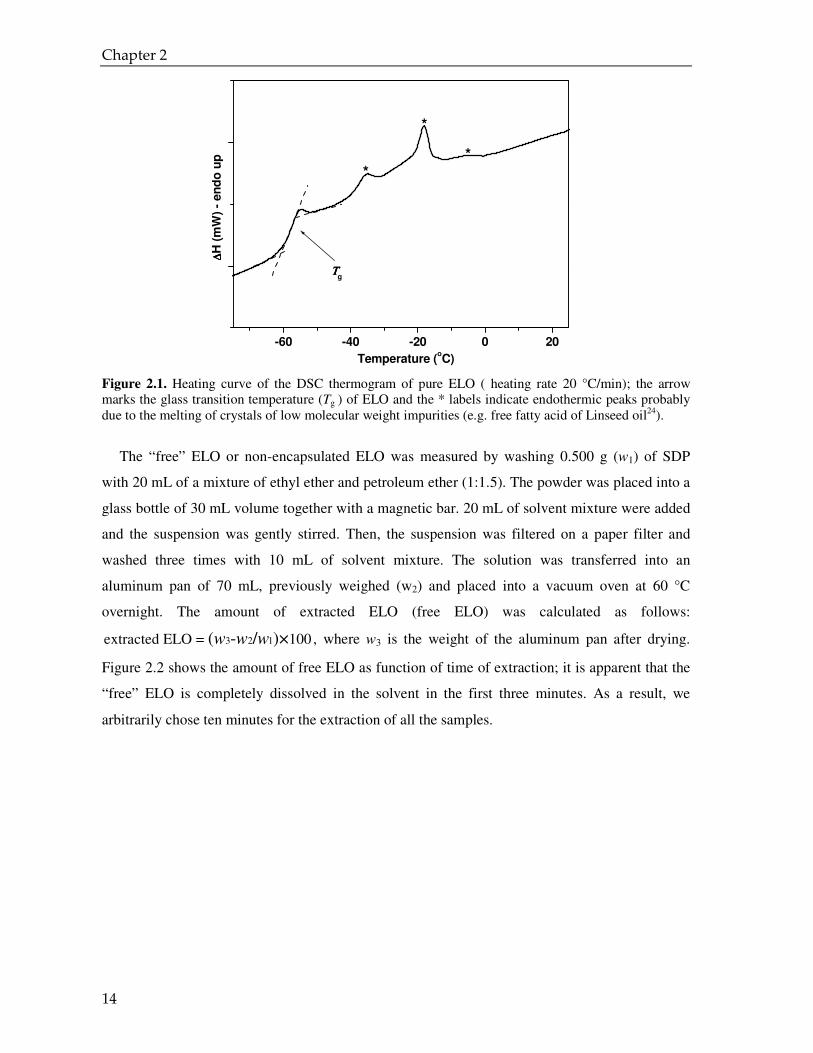
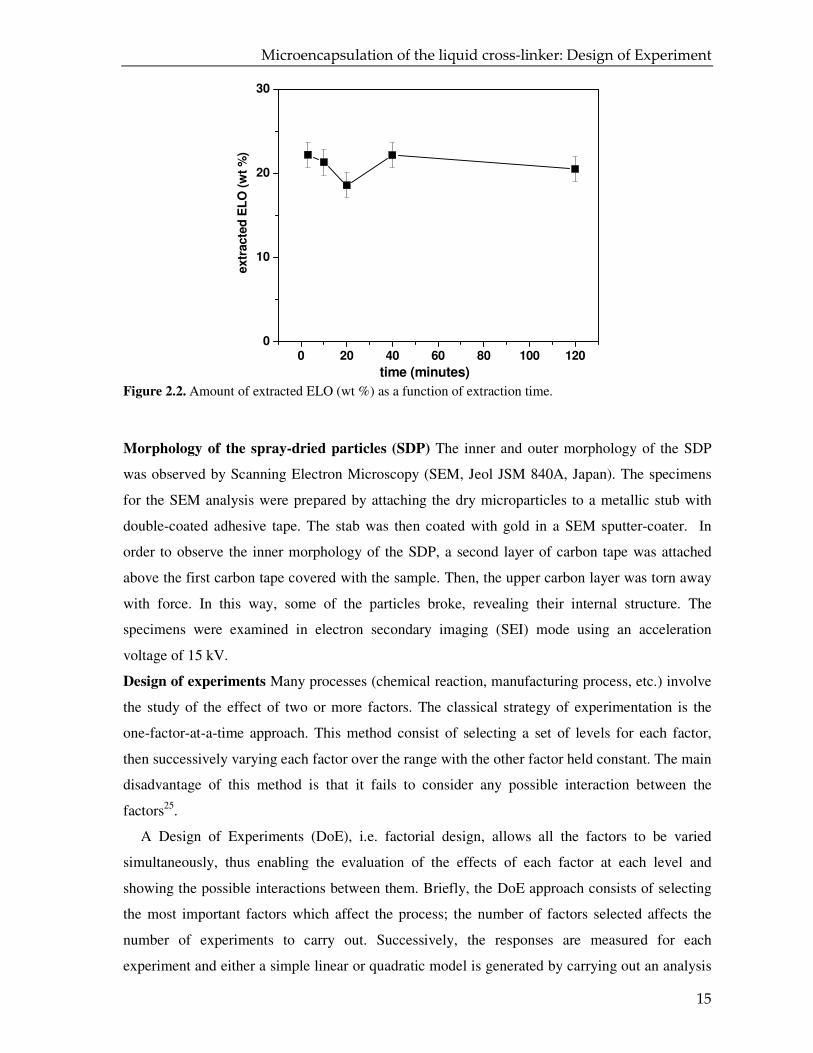
Figure 2.2 shows the amount of free ELO as function of time of extraction; it is apparent that the
“free” ELO is completely dissolved in the solvent in the first three minutes. As a result, we
arbitrarily chose ten minutes for the extraction of all the samples.
-60 -40 -20 0 20
*
*
*
ΤΤΤΤg
∆∆ ∆∆H
(m
W)
- en
do
up
Temperature (oC)
Microencapsulation of the liquid cross-linker: Design of Experiment
15
Figure 2.2. Amount of extracted ELO (wt %) as a function of extraction time.
Morphology of the spray-dried particles (SDP) The inner and outer morphology of the SDP
was observed by Scanning Electron Microscopy (SEM, Jeol JSM 840A, Japan). The specimens
for the SEM analysis were prepared by attaching the dry microparticles to a metallic stub with
double-coated adhesive tape. The stab was then coated with gold in a SEM sputter-coater. In
order to observe the inner morphology of the SDP, a second layer of carbon tape was attached
above the first carbon tape covered with the sample. Then, the upper carbon layer was torn away
with force. In this way, some of the particles broke, revealing their internal structure. The
specimens were examined in electron secondary imaging (SEI) mode using an acceleration
voltage of 15 kV.
Design of experiments Many processes (chemical reaction, manufacturing process, etc.) involve
the study of the effect of two or more factors. The classical strategy of experimentation is the
one-factor-at-a-time approach. This method consist of selecting a set of levels for each factor,
then successively varying each factor over the range with the other factor held constant. The main
disadvantage of this method is that it fails to consider any possible interaction between the
factors25.
A Design of Experiments (DoE), i.e. factorial design, allows all the factors to be varied
simultaneously, thus enabling the evaluation of the effects of each factor at each level and
showing the possible interactions between them. Briefly, the DoE approach consists of selecting
the most important factors which affect the process; the number of factors selected affects the
number of experiments to carry out. Successively, the responses are measured for each
experiment and either a simple linear or quadratic model is generated by carrying out an analysis
0 20 40 60 80 100 1200
10
20
30
extr
acte
d E
LO
(w
t %
)
time (minutes)
Chapter 2
16
of variance (ANOVA) of the responses identifying the statistically significant terms. The
responses obtained from the reduced equation, i.e. an equation containing only the statistically
significant factors and their interactions, are used to draw the response surface plots. These plots
allow visualization of the optimum conditions of the process. Finally, a replica of the optimum
settings can be carried out to verify the predicted model.
In our system, we have 4 process variables (the inlet temperature, the liquid feed rate, the
drying air flow rate and spray flow) and 2 formulation variables (the total concentration of
additives in the aqueous dispersion and the ratio core/encapsulant).
Among these 6 factors we selected the spray flow (SF), the concentration and the ratio
ELO/PVP as the major inputs which can affect the payload and the encapsulation efficiency. This
choice is based on the assumption that the bigger the size of the dried particles and the smaller the
size of the emulsion droplets of the ELO, the greater amount of material is entrapped in the
matrix of polymer26-27. These results strongly depend upon the materials and instrument settings.
Therefore, among the four process variables (spray flow, feed rate, aspirator rate and inlet
temperature) we selected only the spray-flow, because it is the major variable affecting the size of
spray-dried particles of a water-based dispersion (Table 2.3 )21. It might be argued that the feed
rate was not included in design of the experiment despite the fact that is reported to influence the
spray-dried particle sizes. This choice was primarily due to the fact that the feed rate appears to
have a weaker influence on the particle sizes compared to the spray flow and the solid
concentration. This assumption is confirmed by the study conducted by Mosen et al., which
reported that the ratio spray flow/feed rate influences the particle sizes28.
Microencapsulation of the liquid cross-linker: Design of Experiment
17
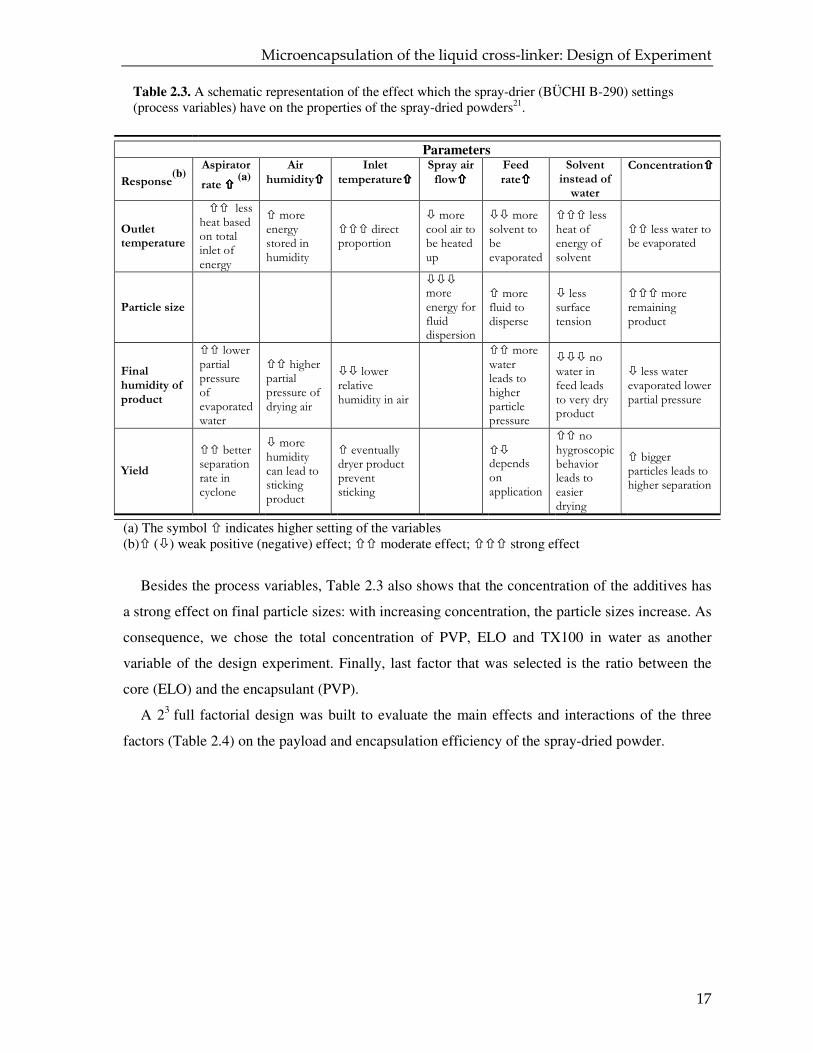
Table 2.3. A schematic representation of the effect which the spray-drier (BÜCHI B-290) settings (process variables) have on the properties of the spray-dried powders21.
(a) The symbol � indicates higher setting of the variables (b)� (�) weak positive (negative) effect; �� moderate effect; ��� strong effect
Besides the process variables, Table 2.3 also shows that the concentration of the additives has
a strong effect on final particle sizes: with increasing concentration, the particle sizes increase. As
consequence, we chose the total concentration of PVP, ELO and TX100 in water as another
variable of the design experiment. Finally, last factor that was selected is the ratio between the
core (ELO) and the encapsulant (PVP).
A 23 full factorial design was built to evaluate the main effects and interactions of the three
factors (Table 2.4) on the payload and encapsulation efficiency of the spray-dried powder.
Parameters
Response(b)
Aspirator
rate ���� (a)
Air
humidity����
Inlet
temperature����
Spray air
flow����
Feed
rate����
Solvent
instead of
water
Concentration����
Outlet temperature
�� less heat based on total inlet of energy
� more energy stored in humidity
��� direct proportion
� more cool air to be heated up
�� more solvent to be evaporated
��� less heat of energy of solvent
�� less water to be evaporated
Particle size
��� more energy for fluid dispersion
� more fluid to disperse
� less surface tension
��� more remaining product
Final
humidity of
product
�� lower partial pressure of evaporated water
�� higher partial pressure of drying air
�� lower relative humidity in air
�� more water leads to higher particle pressure
��� no water in feed leads to very dry product
� less water evaporated lower partial pressure
Yield
�� better separation rate in cyclone
� more humidity can lead to sticking product
� eventually dryer product prevent sticking
�� depends on application
�� no hygroscopic behavior leads to easier drying
� bigger particles leads to higher separation
Chapter 2
18
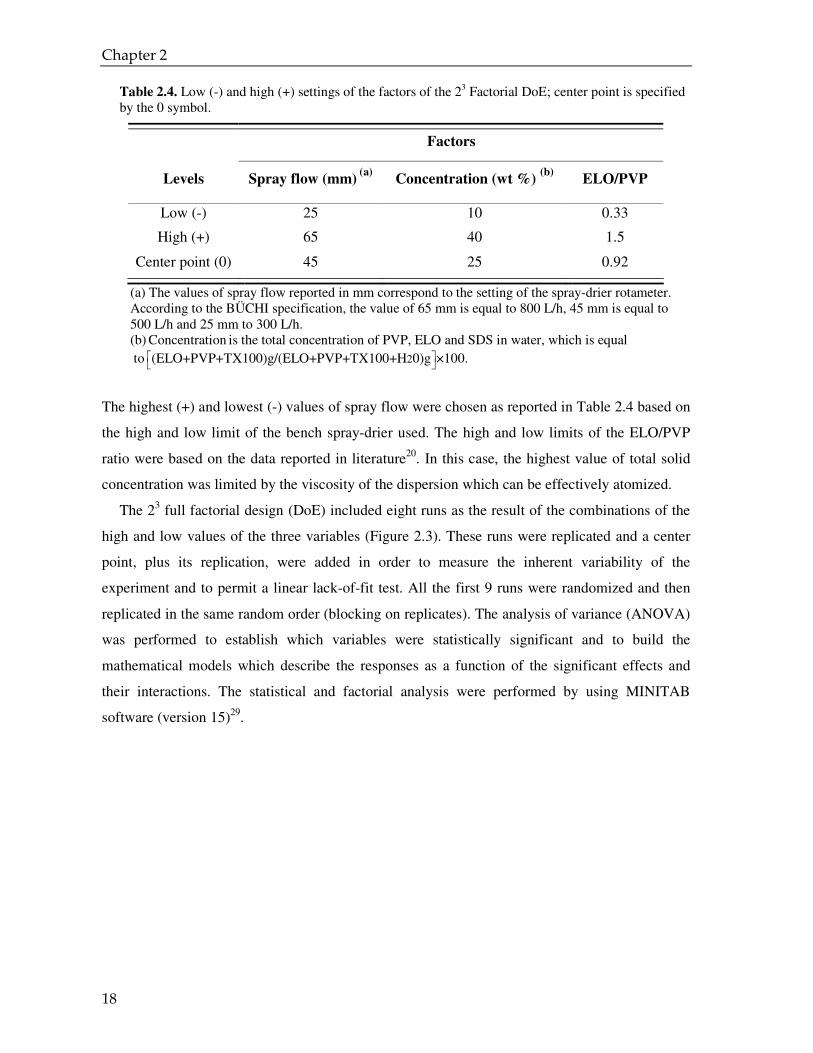
Table 2.4. Low (-) and high (+) settings of the factors of the 23 Factorial DoE; center point is specified by the 0 symbol.
Factors
Levels Spray flow (mm) (a)
Concentration (wt %) (b)
ELO/PVP
Low (-) 25 10 0.33
High (+) 65 40 1.5
Center point (0) 45 25 0.92
(a) The values of spray flow reported in mm correspond to the setting of the spray-drier rotameter. According to the BÜCHI specification, the value of 65 mm is equal to 800 L/h, 45 mm is equal to 500 L/h and 25 mm to 300 L/h. (b) Concentration is the total concentration of PVP, ELO and SDS in water, which is equal
to 2(ELO+PVP+TX100)g/(ELO+PVP+TX100+H 0)g ×100.
The highest (+) and lowest (-) values of spray flow were chosen as reported in Table 2.4 based on
the high and low limit of the bench spray-drier used. The high and low limits of the ELO/PVP
ratio were based on the data reported in literature20. In this case, the highest value of total solid
concentration was limited by the viscosity of the dispersion which can be effectively atomized.
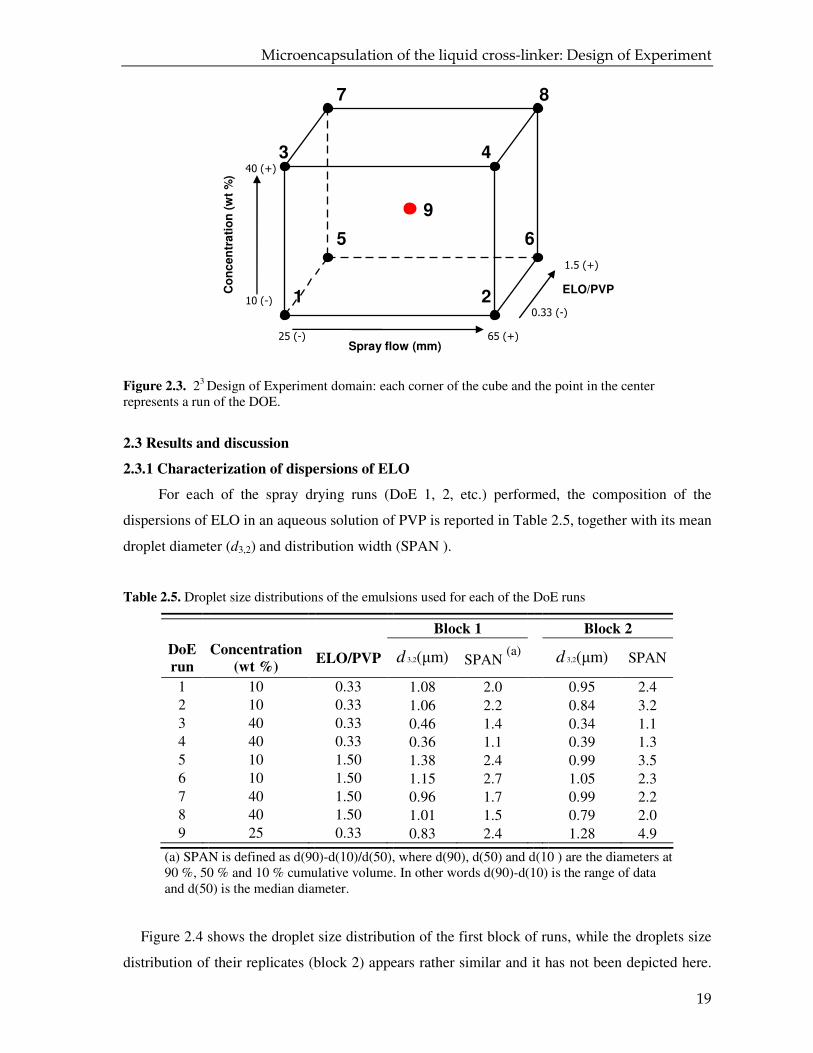
The 23 full factorial design (DoE) included eight runs as the result of the combinations of the
high and low values of the three variables (Figure 2.3). These runs were replicated and a center
point, plus its replication, were added in order to measure the inherent variability of the
experiment and to permit a linear lack-of-fit test. All the first 9 runs were randomized and then
replicated in the same random order (blocking on replicates). The analysis of variance (ANOVA)
was performed to establish which variables were statistically significant and to build the
mathematical models which describe the responses as a function of the significant effects and
their interactions. The statistical and factorial analysis were performed by using MINITAB
software (version 15)29.
Microencapsulation of the liquid cross-linker: Design of Experiment
19
Figure 2.3. 23 Design of Experiment domain: each corner of the cube and the point in the center represents a run of the DOE.
2.3 Results and discussion
2.3.1 Characterization of dispersions of ELO
For each of the spray drying runs (DoE 1, 2, etc.) performed, the composition of the
dispersions of ELO in an aqueous solution of PVP is reported in Table 2.5, together with its mean
droplet diameter (d3,2) and distribution width (SPAN ).
Table 2.5. Droplet size distributions of the emulsions used for each of the DoE runs
Block 1 Block 2
DoE
run
Concentration
(wt %) ELO/PVP 3,2(µm)d SPAN
(a) 3,2(µm)d SPAN
1 10 0.33 1.08 2.0 0.95 2.4 2 10 0.33 1.06 2.2 0.84 3.2 3 40 0.33 0.46 1.4 0.34 1.1 4 40 0.33 0.36 1.1 0.39 1.3 5 10 1.50 1.38 2.4 0.99 3.5 6 10 1.50 1.15 2.7 1.05 2.3 7 40 1.50 0.96 1.7 0.99 2.2 8 40 1.50 1.01 1.5 0.79 2.0 9 25 0.33 0.83 2.4 1.28 4.9
(a) SPAN is defined as d(90)-d(10)/d(50), where d(90), d(50) and d(10 ) are the diameters at 90 %, 50 % and 10 % cumulative volume. In other words d(90)-d(10) is the range of data and d(50) is the median diameter.
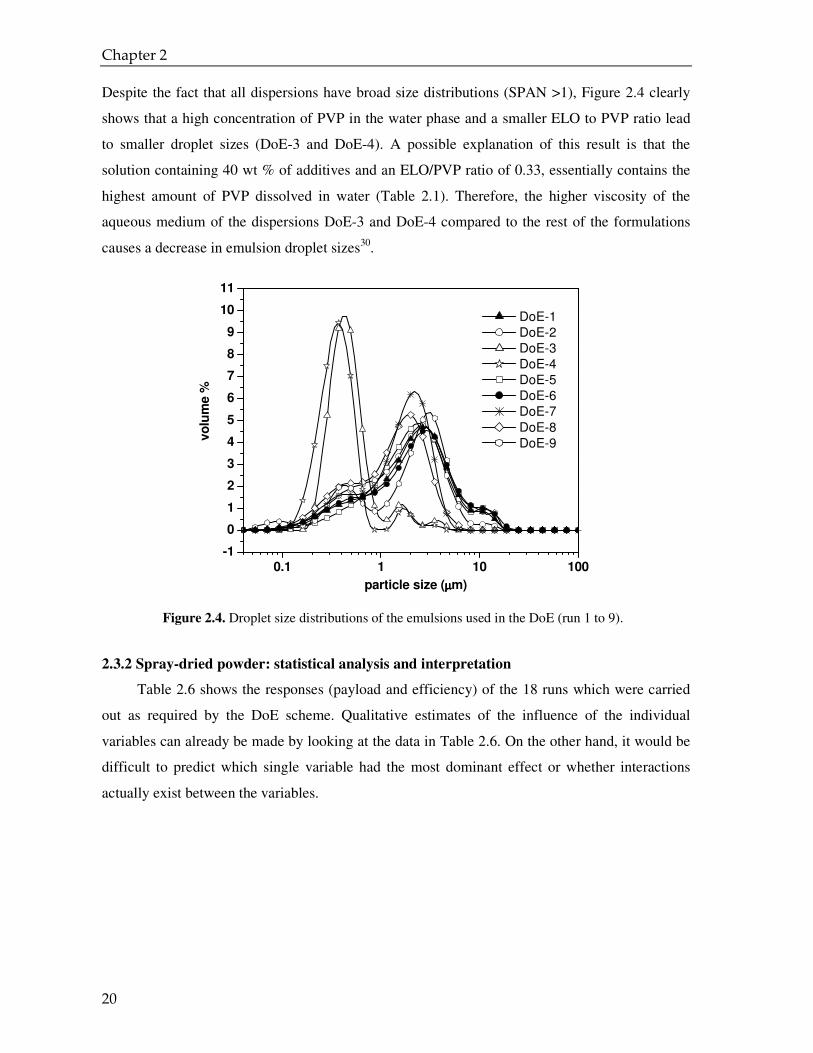
Figure 2.4 shows the droplet size distribution of the first block of runs, while the droplets size
distribution of their replicates (block 2) appears rather similar and it has not been depicted here.
1.5 (+)
0.33 (-)
40 (+)
10 (-)
65 (+)25 (-)
ELO/PVP
Spray flow (mm)
Co
nc
en
tra
tio
n (
wt
%)
1 2
3 4
5 6
7 8
9
Chapter 2
20
Despite the fact that all dispersions have broad size distributions (SPAN >1), Figure 2.4 clearly
shows that a high concentration of PVP in the water phase and a smaller ELO to PVP ratio lead
to smaller droplet sizes (DoE-3 and DoE-4). A possible explanation of this result is that the
solution containing 40 wt % of additives and an ELO/PVP ratio of 0.33, essentially contains the
highest amount of PVP dissolved in water (Table 2.1). Therefore, the higher viscosity of the
aqueous medium of the dispersions DoE-3 and DoE-4 compared to the rest of the formulations
causes a decrease in emulsion droplet sizes30.
Figure 2.4. Droplet size distributions of the emulsions used in the DoE (run 1 to 9).
2.3.2 Spray-dried powder: statistical analysis and interpretation
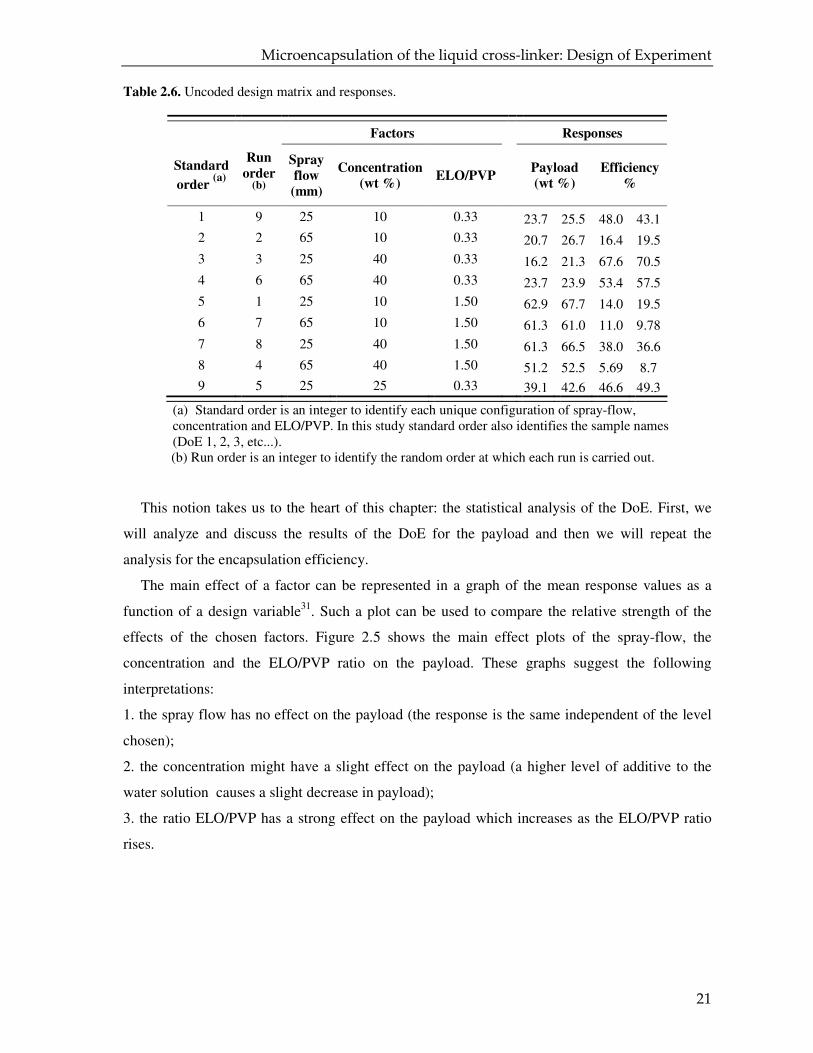
Table 2.6 shows the responses (payload and efficiency) of the 18 runs which were carried
out as required by the DoE scheme. Qualitative estimates of the influence of the individual
variables can already be made by looking at the data in Table 2.6. On the other hand, it would be
difficult to predict which single variable had the most dominant effect or whether interactions
actually exist between the variables.
0.1 1 10 100-1
0
1
2
3
4
5
6
7
8
9
10
11
DoE-1
DoE-2
DoE-3
DoE-4
DoE-5
DoE-6
DoE-7
DoE-8
DoE-9
vo
lum
e %
particle size (µµµµm)
Microencapsulation of the liquid cross-linker: Design of Experiment
21
Table 2.6. Uncoded design matrix and responses.
Factors Responses
Standard
order (a)
Run
order (b)
Spray
flow
(mm)
Concentration
(wt %) ELO/PVP
Payload
(wt %)
Efficiency
%
1 9 25 10 0.33 23.7 25.5 48.0 43.1
2 2 65 10 0.33 20.7 26.7 16.4 19.5
3 3 25 40 0.33 16.2 21.3 67.6 70.5
4 6 65 40 0.33 23.7 23.9 53.4 57.5
5 1 25 10 1.50 62.9 67.7 14.0 19.5
6 7 65 10 1.50 61.3 61.0 11.0 9.78
7 8 25 40 1.50 61.3 66.5 38.0 36.6
8 4 65 40 1.50 51.2 52.5 5.69 8.7 9 5 25 25 0.33 39.1 42.6 46.6 49.3
(a) Standard order is an integer to identify each unique configuration of spray-flow, concentration and ELO/PVP. In this study standard order also identifies the sample names (DoE 1, 2, 3, etc...).
(b) Run order is an integer to identify the random order at which each run is carried out.
This notion takes us to the heart of this chapter: the statistical analysis of the DoE. First, we
will analyze and discuss the results of the DoE for the payload and then we will repeat the
analysis for the encapsulation efficiency.
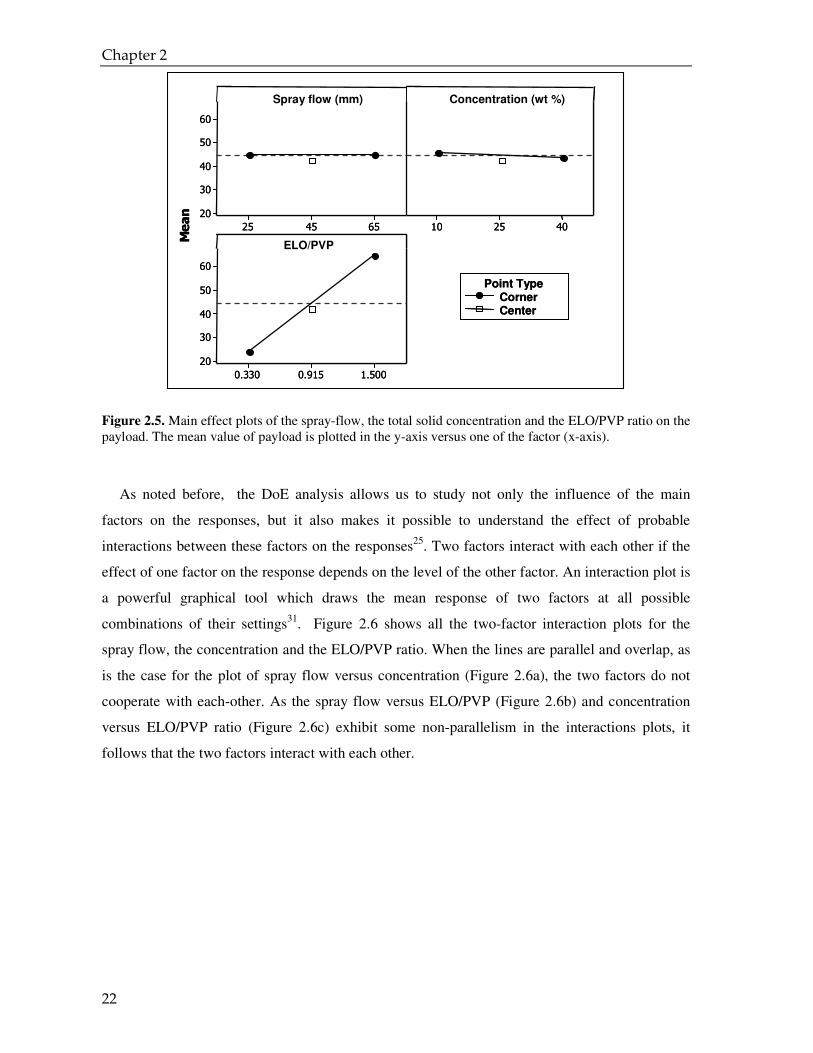
The main effect of a factor can be represented in a graph of the mean response values as a
function of a design variable31. Such a plot can be used to compare the relative strength of the
effects of the chosen factors. Figure 2.5 shows the main effect plots of the spray-flow, the
concentration and the ELO/PVP ratio on the payload. These graphs suggest the following
interpretations:
1. the spray flow has no effect on the payload (the response is the same independent of the level
chosen);
2. the concentration might have a slight effect on the payload (a higher level of additive to the
water solution causes a slight decrease in payload);
3. the ratio ELO/PVP has a strong effect on the payload which increases as the ELO/PVP ratio
rises.
Chapter 2
22
Figure 2.5. Main effect plots of the spray-flow, the total solid concentration and the ELO/PVP ratio on the payload. The mean value of payload is plotted in the y-axis versus one of the factor (x-axis).
As noted before, the DoE analysis allows us to study not only the influence of the main
factors on the responses, but it also makes it possible to understand the effect of probable
interactions between these factors on the responses25. Two factors interact with each other if the
effect of one factor on the response depends on the level of the other factor. An interaction plot is
a powerful graphical tool which draws the mean response of two factors at all possible
combinations of their settings31. Figure 2.6 shows all the two-factor interaction plots for the
spray flow, the concentration and the ELO/PVP ratio. When the lines are parallel and overlap, as
is the case for the plot of spray flow versus concentration (Figure 2.6a), the two factors do not
cooperate with each-other. As the spray flow versus ELO/PVP (Figure 2.6b) and concentration
versus ELO/PVP ratio (Figure 2.6c) exhibit some non-parallelism in the interactions plots, it
follows that the two factors interact with each other.
654525
60
50
40
30
20
402510
1.5000.9150.330
60
50
40
30
20
Spray flow (mm)
Mean
Concentration (wt %)
ELO/PVP
CornerCenter
Point Type
654525
60
50
40
30
20
402510
1.5000.9150.330
60
50
40
30
20
Spray flow (mm)
Mean
Concentration (wt %)
ELO/PVP
CornerCenter
Point Type
Microencapsulation of the liquid cross-linker: Design of Experiment
23
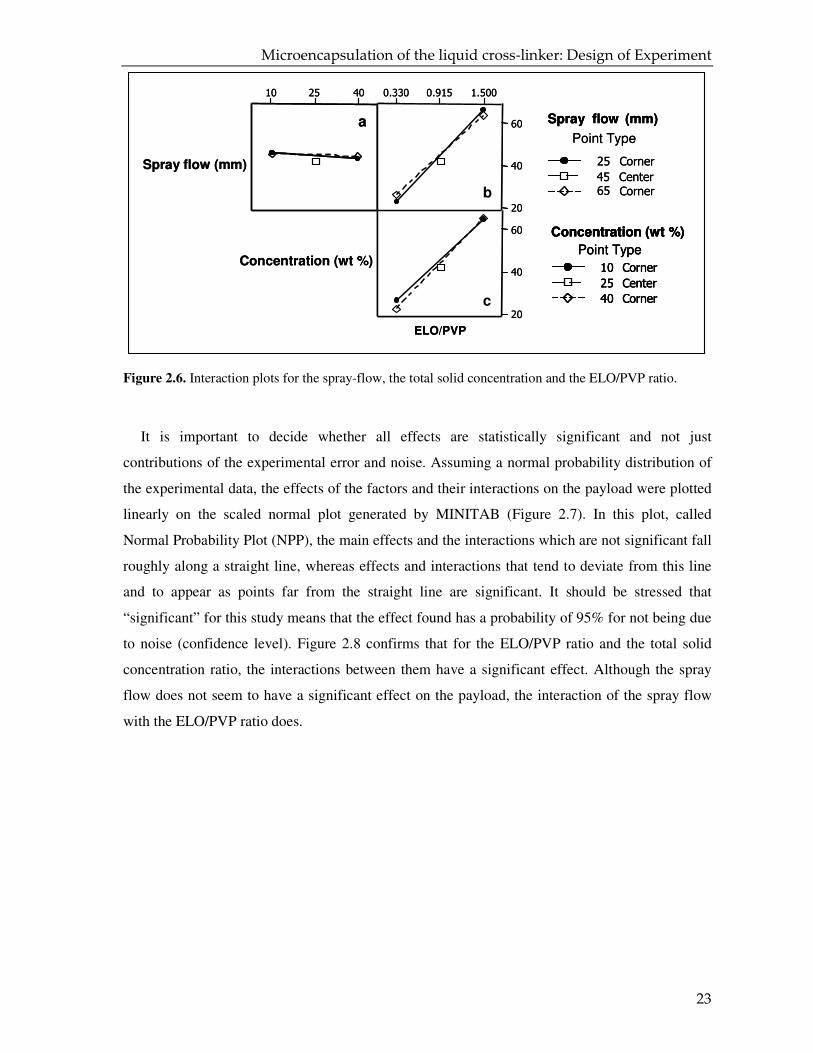
Figure 2.6. Interaction plots for the spray-flow, the total solid concentration and the ELO/PVP ratio.
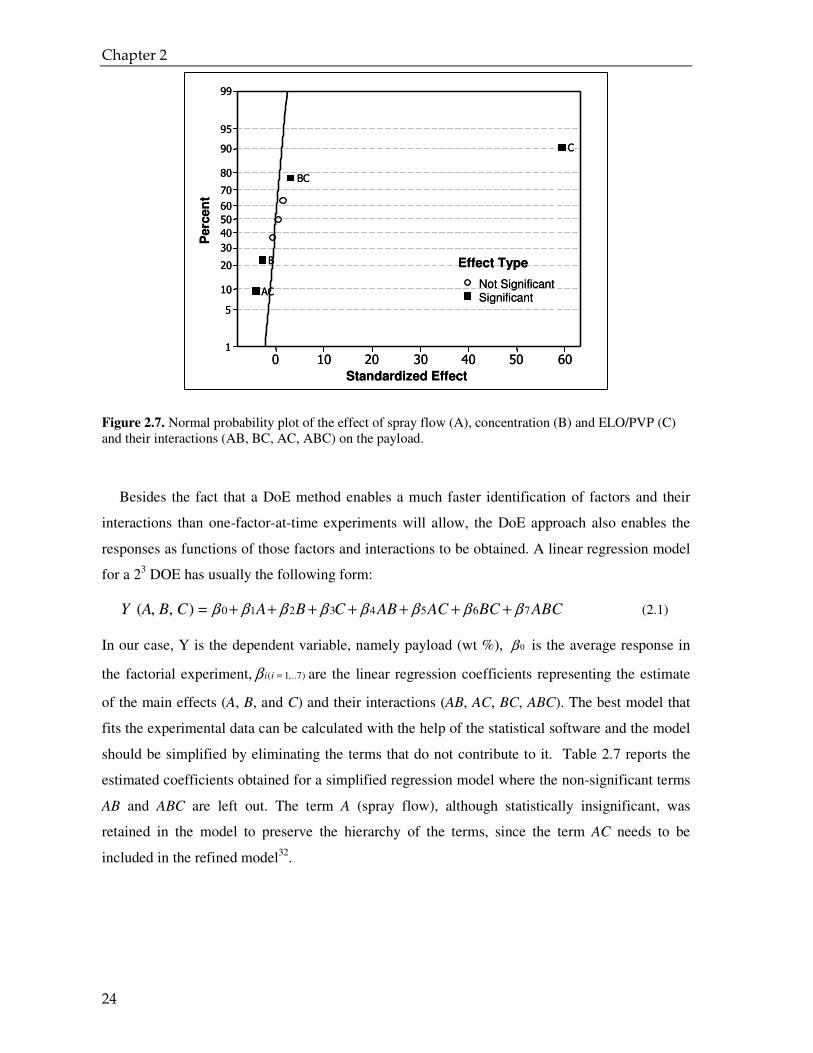
It is important to decide whether all effects are statistically significant and not just
contributions of the experimental error and noise. Assuming a normal probability distribution of
the experimental data, the effects of the factors and their interactions on the payload were plotted
linearly on the scaled normal plot generated by MINITAB (Figure 2.7). In this plot, called
Normal Probability Plot (NPP), the main effects and the interactions which are not significant fall
roughly along a straight line, whereas effects and interactions that tend to deviate from this line
and to appear as points far from the straight line are significant. It should be stressed that
“significant” for this study means that the effect found has a probability of 95% for not being due
to noise (confidence level). Figure 2.8 confirms that for the ELO/PVP ratio and the total solid
concentration ratio, the interactions between them have a significant effect. Although the spray
flow does not seem to have a significant effect on the payload, the interaction of the spray flow
with the ELO/PVP ratio does.
402510 1.5000.9150.330
60
40
20
60
40
20
Spray flow (mm)
Concentration (wt %)
ELO/PVP
25 Corner
45 Center65 Corner
(mm)flowSpray
Point Type
10 Corner
25 Center
40 Corner
(wt %)Concentration
Point Type
a
b
c
402510 1.5000.9150.330
60
40
20
60
40
20
Spray flow (mm)
Concentration (wt %)
ELO/PVP
25 Corner
45 Center65 Corner
(mm)flowSpray (mm)flowSpray
Point Type
10 Corner
25 Center
40 Corner
(wt %)Concentration
Point Type
10 Corner
25 Center
40 Corner
(wt %)Concentration (wt %)Concentration
Point Type
a
b
c
Chapter 2
24
Figure 2.7. Normal probability plot of the effect of spray flow (A), concentration (B) and ELO/PVP (C) and their interactions (AB, BC, AC, ABC) on the payload.
Besides the fact that a DoE method enables a much faster identification of factors and their
interactions than one-factor-at-time experiments will allow, the DoE approach also enables the
responses as functions of those factors and interactions to be obtained. A linear regression model
for a 23 DOE has usually the following form:
0 1 2 3 4 5 6 7 ( , , ) = Y A B C A B C AB AC BC ABCβ β β β β β β β+ + + + + + + (2.1)
In our case, Y is the dependent variable, namely payload (wt %), 0β is the average response in
the factorial experiment, ( 1,..7)i iβ = are the linear regression coefficients representing the estimate
of the main effects (A, B, and C) and their interactions (AB, AC, BC, ABC). The best model that
fits the experimental data can be calculated with the help of the statistical software and the model
should be simplified by eliminating the terms that do not contribute to it. Table 2.7 reports the
estimated coefficients obtained for a simplified regression model where the non-significant terms
AB and ABC are left out. The term A (spray flow), although statistically insignificant, was
retained in the model to preserve the hierarchy of the terms, since the term AC needs to be
included in the refined model32.
6050403020100
99
95
90
80
70
60
50
40
30
20
10
5
1
Standardized Effect
Perc
en
t
Not SignificantSignificant
Effect Type
BC
AC
C
B
6050403020100
99
95
90
80
70
60
50
40
30
20
10
5
1
Standardized Effect
Perc
en
t
Not SignificantSignificant
Effect Type
BC
AC
C
B
Microencapsulation of the liquid cross-linker: Design of Experiment
25
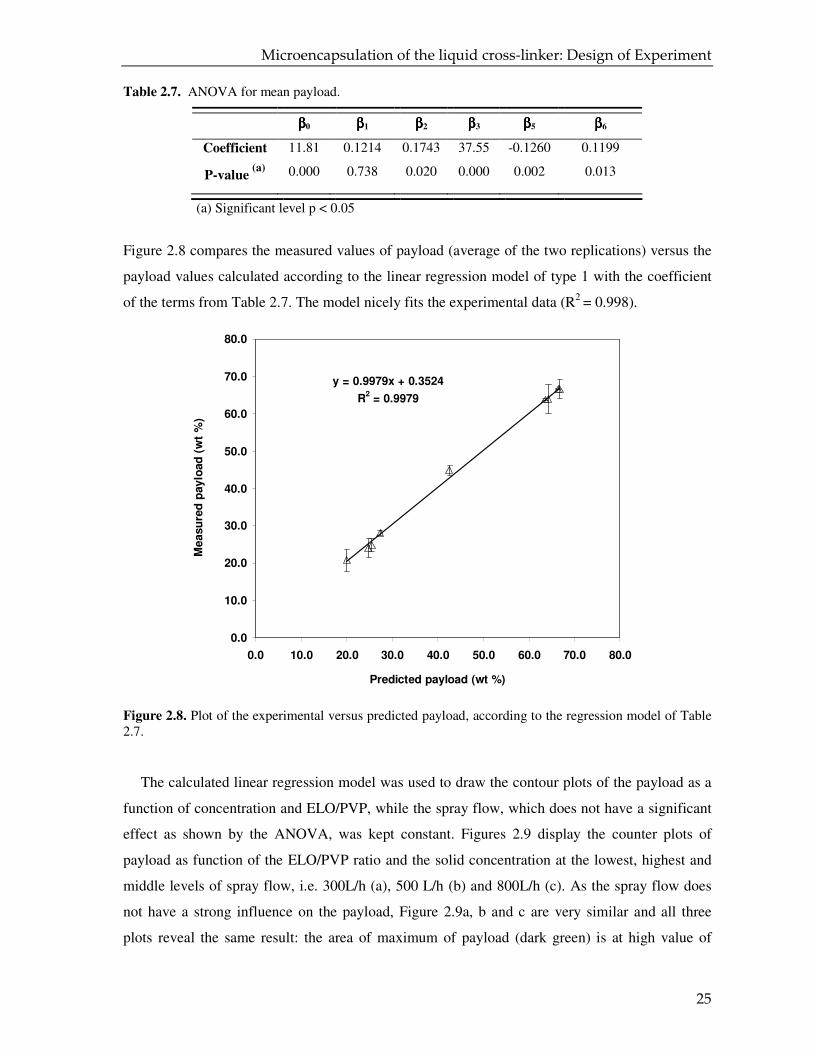
Table 2.7. ANOVA for mean payload.
ββββ0 ββββ1 ββββ2 ββββ3 ββββ5 ββββ6
Coefficient 11.81 0.1214 0.1743 37.55 -0.1260 0.1199
P-value (a)
0.000 0.738 0.020 0.000 0.002 0.013
(a) Significant level p < 0.05
Figure 2.8 compares the measured values of payload (average of the two replications) versus the
payload values calculated according to the linear regression model of type 1 with the coefficient
of the terms from Table 2.7. The model nicely fits the experimental data (R2 = 0.998).
Figure 2.8. Plot of the experimental versus predicted payload, according to the regression model of Table 2.7.
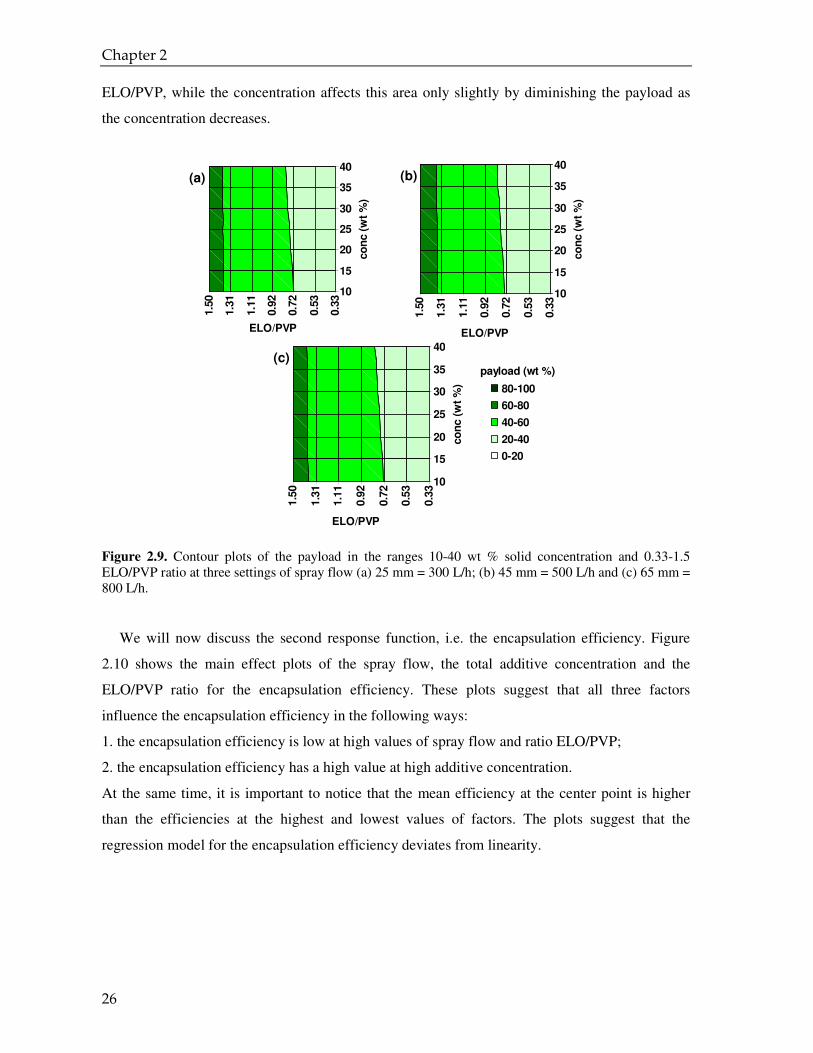
The calculated linear regression model was used to draw the contour plots of the payload as a
function of concentration and ELO/PVP, while the spray flow, which does not have a significant
effect as shown by the ANOVA, was kept constant. Figures 2.9 display the counter plots of
payload as function of the ELO/PVP ratio and the solid concentration at the lowest, highest and
middle levels of spray flow, i.e. 300L/h (a), 500 L/h (b) and 800L/h (c). As the spray flow does
not have a strong influence on the payload, Figure 2.9a, b and c are very similar and all three
plots reveal the same result: the area of maximum of payload (dark green) is at high value of
y = 0.9979x + 0.3524
R2 = 0.9979
0.0
10.0
20.0
30.0
40.0
50.0
60.0
70.0
80.0
0.0 10.0 20.0 30.0 40.0 50.0 60.0 70.0 80.0
Predicted payload (wt %)
Measu
red
paylo
ad
(w
t %
)
Chapter 2
26
ELO/PVP, while the concentration affects this area only slightly by diminishing the payload as
the concentration decreases.
Figure 2.9. Contour plots of the payload in the ranges 10-40 wt % solid concentration and 0.33-1.5 ELO/PVP ratio at three settings of spray flow (a) 25 mm = 300 L/h; (b) 45 mm = 500 L/h and (c) 65 mm = 800 L/h.
We will now discuss the second response function, i.e. the encapsulation efficiency. Figure
2.10 shows the main effect plots of the spray flow, the total additive concentration and the
ELO/PVP ratio for the encapsulation efficiency. These plots suggest that all three factors
influence the encapsulation efficiency in the following ways:
1. the encapsulation efficiency is low at high values of spray flow and ratio ELO/PVP;
2. the encapsulation efficiency has a high value at high additive concentration.
At the same time, it is important to notice that the mean efficiency at the center point is higher
than the efficiencies at the highest and lowest values of factors. The plots suggest that the
regression model for the encapsulation efficiency deviates from linearity.
0.3
3
0.5
3
0.7
2
0.9
2
1.1
1
1.3
1
1.5
0
10
15
20
25
30
35
40
ELO/PVP
co
nc (
wt
%)
(a)
0.3
3
0.5
3
0.7
2
0.9
2
1.1
1
1.3
1
1.5
0
10
15
20
25
30
35
40
ELO/PVP
co
nc (
wt
%)
(b)
0.3
3
0.5
3
0.7
2
0.9
2
1.1
1
1.3
1
1.5
0
10
15
20
25
30
35
40
payload (wt %)
ELO/PVP
co
nc (
wt
%)
(c)
80-100
60-80
40-60
20-40
0-20
Microencapsulation of the liquid cross-linker: Design of Experiment
27
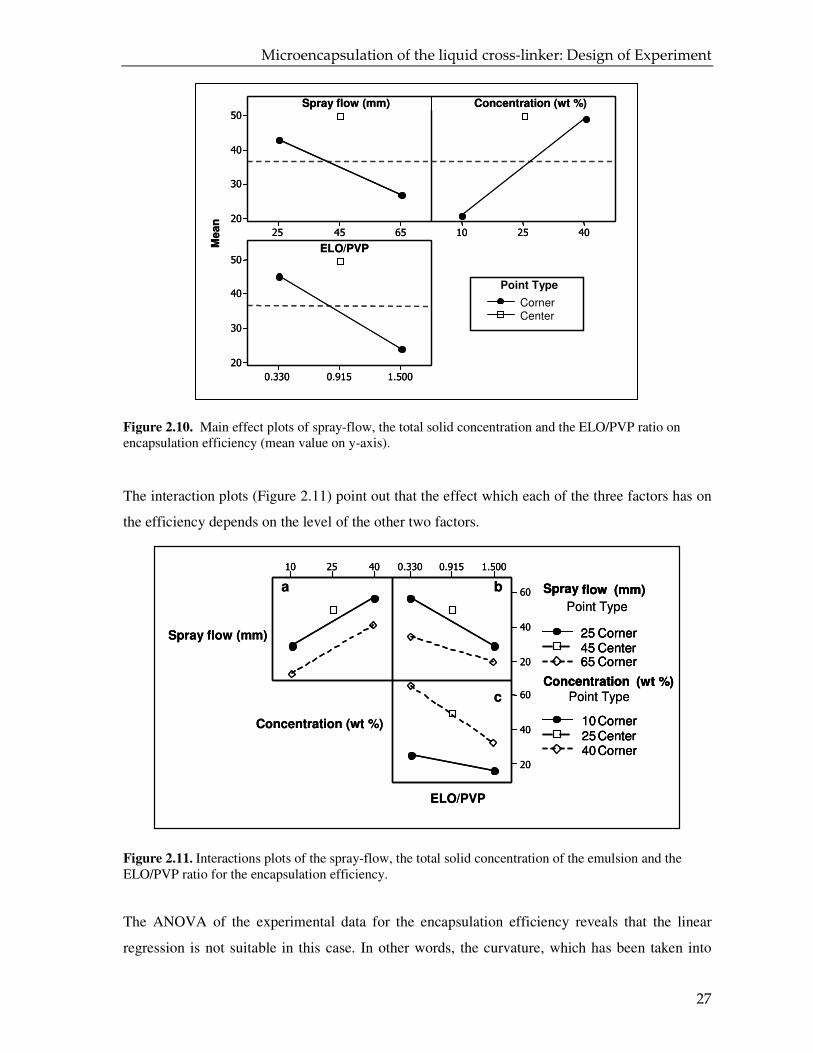
Figure 2.10. Main effect plots of spray-flow, the total solid concentration and the ELO/PVP ratio on encapsulation efficiency (mean value on y-axis).
The interaction plots (Figure 2.11) point out that the effect which each of the three factors has on
the efficiency depends on the level of the other two factors.
Figure 2.11. Interactions plots of the spray-flow, the total solid concentration of the emulsion and the ELO/PVP ratio for the encapsulation efficiency.
The ANOVA of the experimental data for the encapsulation efficiency reveals that the linear
regression is not suitable in this case. In other words, the curvature, which has been taken into
654525
50
40
30
20
402510
1.5000.9150.330
50
40
30
20
Spray flow (mm)
Me
an
Concentration (wt %)
ELO/PVP
CornerCenter
Point Type
654525
50
40
30
20
402510
1.5000.9150.330
50
40
30
20
Spray flow (mm)
Me
an
Concentration (wt %)
ELO/PVP
CornerCenter
Point Type
402510 1.5000.9150.330
60
40
20
60
40
20
Spray flow (mm)
Concentration (wt %)
ELO/PVP
25 Corner45 Center65 Corner
(mm)flowSpray
Point Type
10Corner25Center40Corner
(wt %)Concentration
Point Type
a b
c
402510 1.5000.9150.330
60
40
20
60
40
20
Spray flow (mm)
Concentration (wt %)
ELO/PVP
25 Corner45 Center65 Corner
25 Corner45 Center65 Corner
(mm)flowSpray (mm)flowSpray
Point Type
10Corner25Center40Corner
10Corner25Center40Corner
(wt %)Concentration (wt %)Concentration
Point Type
a b
c
Chapter 2
28
account by including the center point in the DoE, is statistically relevant (p-value of curvature <
0.05).
In this case, only a response-surface design or a design for a quadratic model would allow
fitting a model which accurately resolves the curvature32.
A 2k factorial design which includes a center point, as used in this study, can only be used to fit
the experimental data with an equation containing a simple generic quadratic term of the type:
20 1 2 3 4 5 6 7 * * ( , , ) = Y A B C A B C AB AC BC ABC xβ β β β β β β β β+ + + + + + + + (2.2)
where the quadratic term * is used to indicate the ambiguity of the source of the quadratic effect.
In this case, the term 2* *xβ cannot be precisely decomposed in the terms:
28 9 10* *x AA BB CCβ β β β= + +
Keeping in mind that a 2 3 plus a center point is not a real surface-response design, we decided to
fit this design with a quadratic model which qualitatively predicts the efficiency as a function of
the spray flow, concentration and ELO/PVP ratio. In Figure 2.12 the efficiency values are
reported as calculated by the generic quadratic equation 2.2, where the coefficient values were
calculated by the ANOVA of the 23 DOE runs plus center point for the efficiency of
encapsulation.
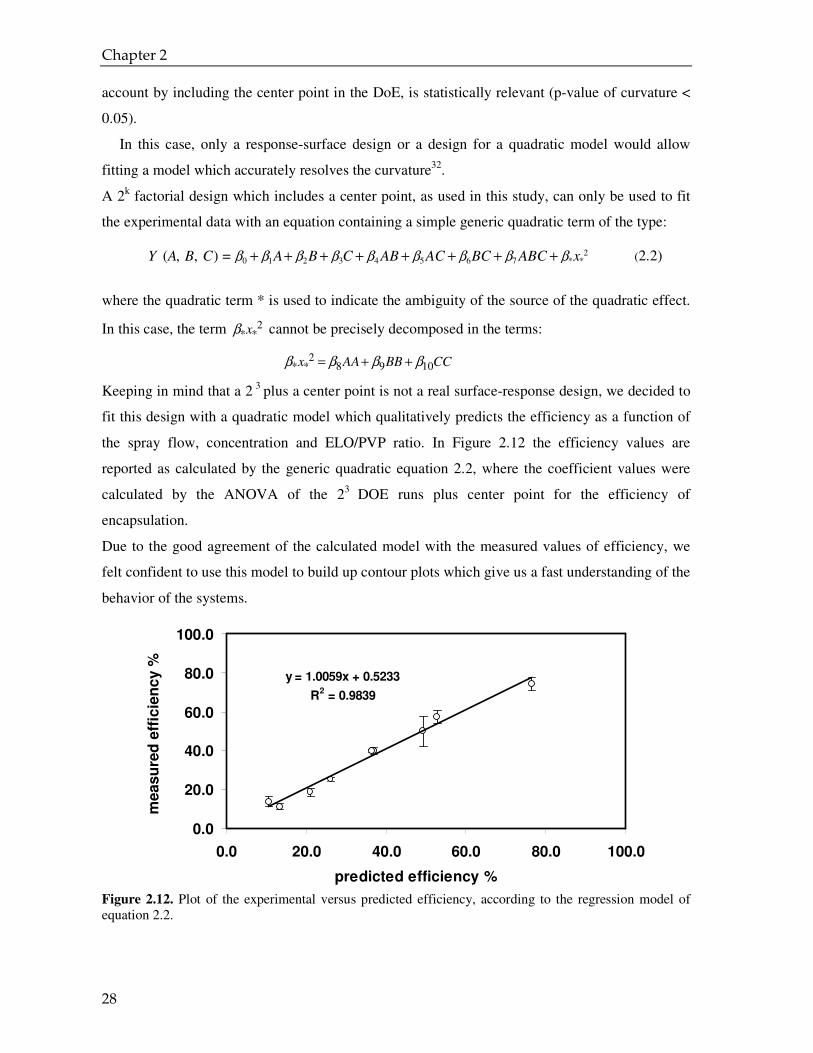
Due to the good agreement of the calculated model with the measured values of efficiency, we
felt confident to use this model to build up contour plots which give us a fast understanding of the
behavior of the systems.
Figure 2.12. Plot of the experimental versus predicted efficiency, according to the regression model of equation 2.2.
y = 1.0059x + 0.5233
R2 = 0.9839
0.0
20.0
40.0
60.0
80.0
100.0
0.0 20.0 40.0 60.0 80.0 100.0
predicted efficiency %
measu
red
eff
icie
ncy %
Microencapsulation of the liquid cross-linker: Design of Experiment
29
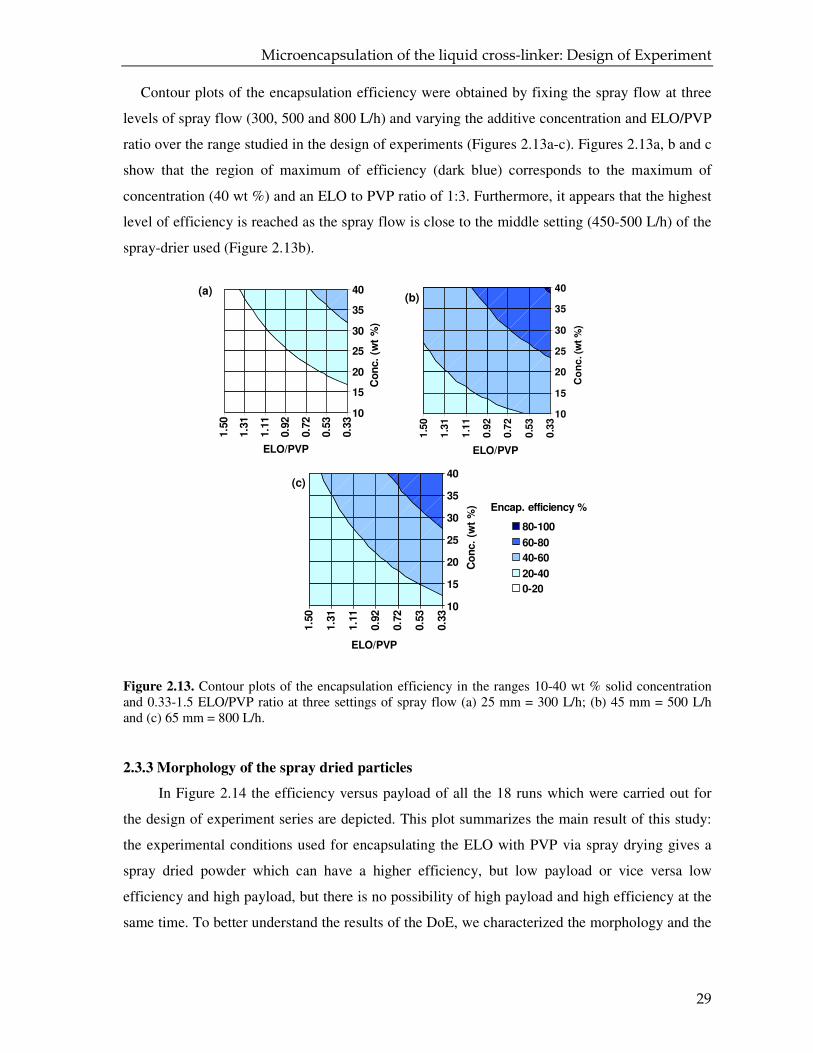
Contour plots of the encapsulation efficiency were obtained by fixing the spray flow at three
levels of spray flow (300, 500 and 800 L/h) and varying the additive concentration and ELO/PVP
ratio over the range studied in the design of experiments (Figures 2.13a-c). Figures 2.13a, b and c
show that the region of maximum of efficiency (dark blue) corresponds to the maximum of
concentration (40 wt %) and an ELO to PVP ratio of 1:3. Furthermore, it appears that the highest
level of efficiency is reached as the spray flow is close to the middle setting (450-500 L/h) of the
spray-drier used (Figure 2.13b).
Figure 2.13. Contour plots of the encapsulation efficiency in the ranges 10-40 wt % solid concentration and 0.33-1.5 ELO/PVP ratio at three settings of spray flow (a) 25 mm = 300 L/h; (b) 45 mm = 500 L/h and (c) 65 mm = 800 L/h.
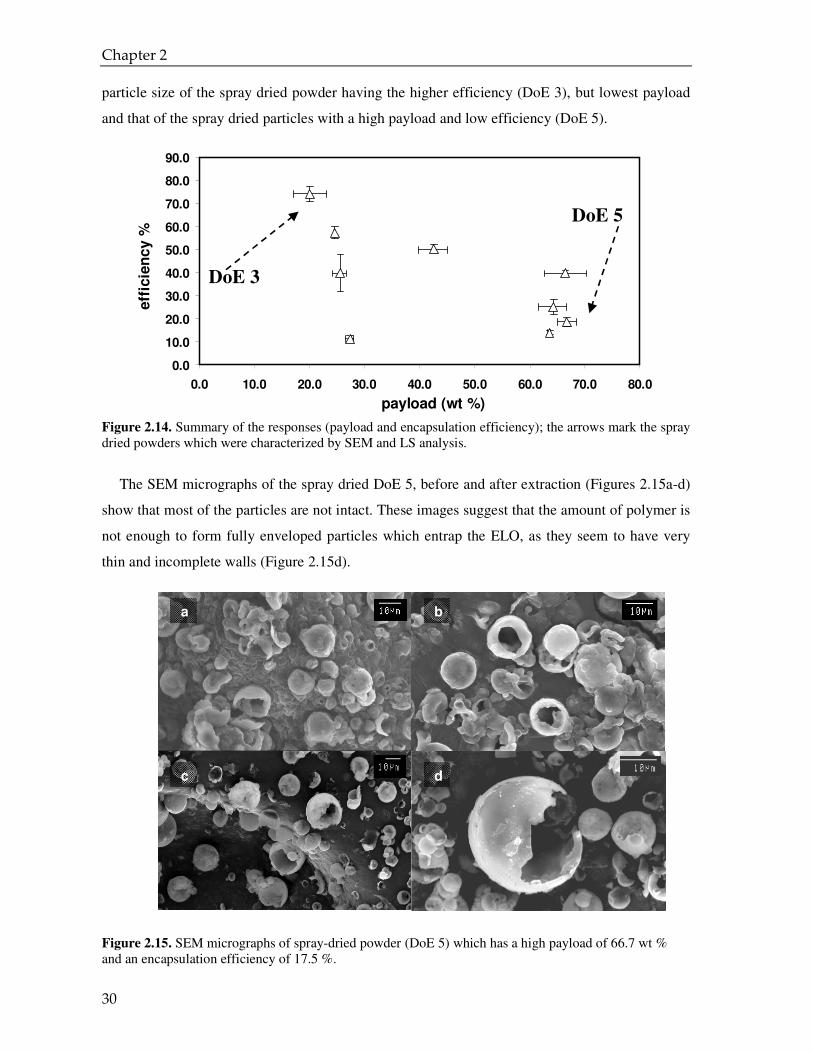
2.3.3 Morphology of the spray dried particles
In Figure 2.14 the efficiency versus payload of all the 18 runs which were carried out for
the design of experiment series are depicted. This plot summarizes the main result of this study:
the experimental conditions used for encapsulating the ELO with PVP via spray drying gives a
spray dried powder which can have a higher efficiency, but low payload or vice versa low
efficiency and high payload, but there is no possibility of high payload and high efficiency at the
same time. To better understand the results of the DoE, we characterized the morphology and the
0.3
3
0.5
3
0.7
2
0.9
2
1.1
1
1.3
1
1.5
0
10
15
20
25
30
35
40
ELO/PVP
Co
nc.
(wt
%)
(a)
0.3
3
0.5
3
0.7
2
0.9
2
1.1
1
1.3
1
1.5
010
15
20
25
30
35
40
ELO/PVP
Co
nc
. (w
t %
)
(b)
0.3
3
0.5
3
0.7
2
0.9
2
1.1
1
1.3
1
1.5
0
10
15
20
25
30
35
40
Encap. efficiency %
ELO/PVP
Co
nc.
(wt
%)
(c)
80-100
60-80
40-60
20-40
0-20
Chapter 2
30
particle size of the spray dried powder having the higher efficiency (DoE 3), but lowest payload
and that of the spray dried particles with a high payload and low efficiency (DoE 5).
Figure 2.14. Summary of the responses (payload and encapsulation efficiency); the arrows mark the spray dried powders which were characterized by SEM and LS analysis.
The SEM micrographs of the spray dried DoE 5, before and after extraction (Figures 2.15a-d)
show that most of the particles are not intact. These images suggest that the amount of polymer is
not enough to form fully enveloped particles which entrap the ELO, as they seem to have very
thin and incomplete walls (Figure 2.15d).
Figure 2.15. SEM micrographs of spray-dried powder (DoE 5) which has a high payload of 66.7 wt % and an encapsulation efficiency of 17.5 %.
0.0
10.0
20.0
30.0
40.0
50.0
60.0
70.0
80.0
90.0
0.0 10.0 20.0 30.0 40.0 50.0 60.0 70.0 80.0
payload (wt %)
eff
icie
ncy %
DoE 3
DoE 5
a b
c d
Microencapsulation of the liquid cross-linker: Design of Experiment
31
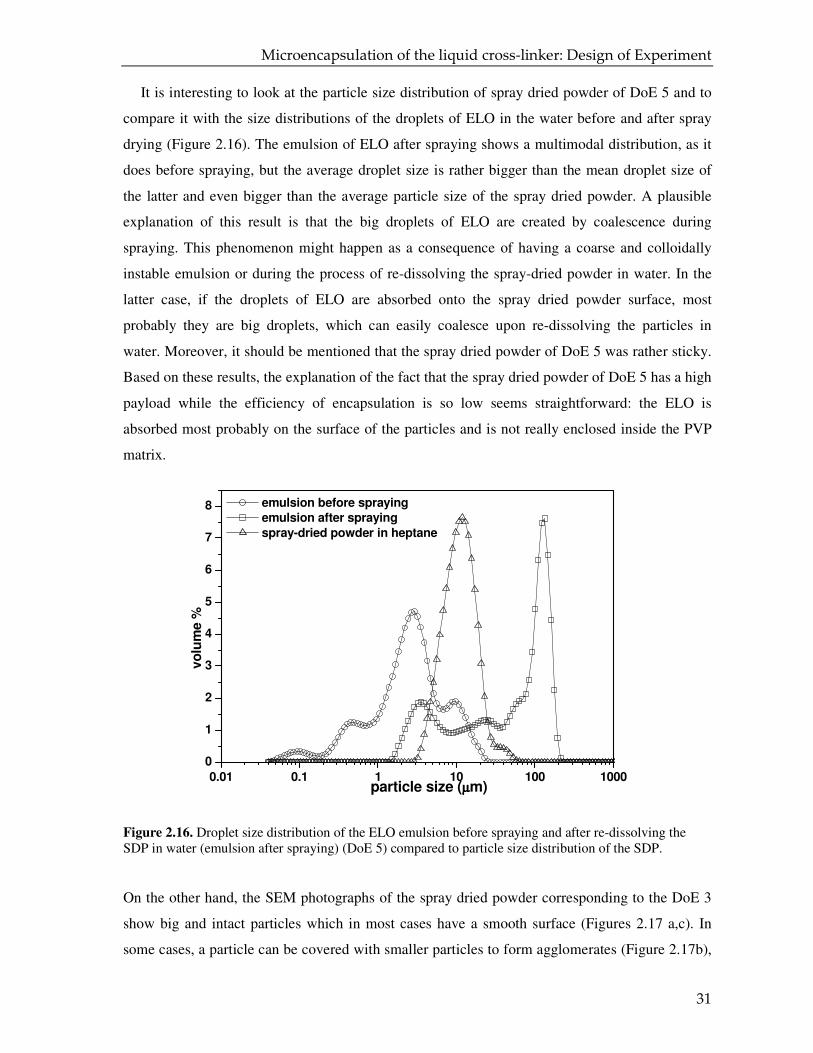
It is interesting to look at the particle size distribution of spray dried powder of DoE 5 and to
compare it with the size distributions of the droplets of ELO in the water before and after spray
drying (Figure 2.16). The emulsion of ELO after spraying shows a multimodal distribution, as it
does before spraying, but the average droplet size is rather bigger than the mean droplet size of
the latter and even bigger than the average particle size of the spray dried powder. A plausible
explanation of this result is that the big droplets of ELO are created by coalescence during
spraying. This phenomenon might happen as a consequence of having a coarse and colloidally
instable emulsion or during the process of re-dissolving the spray-dried powder in water. In the
latter case, if the droplets of ELO are absorbed onto the spray dried powder surface, most
probably they are big droplets, which can easily coalesce upon re-dissolving the particles in
water. Moreover, it should be mentioned that the spray dried powder of DoE 5 was rather sticky.
Based on these results, the explanation of the fact that the spray dried powder of DoE 5 has a high
payload while the efficiency of encapsulation is so low seems straightforward: the ELO is
absorbed most probably on the surface of the particles and is not really enclosed inside the PVP
matrix.
Figure 2.16. Droplet size distribution of the ELO emulsion before spraying and after re-dissolving the SDP in water (emulsion after spraying) (DoE 5) compared to particle size distribution of the SDP.
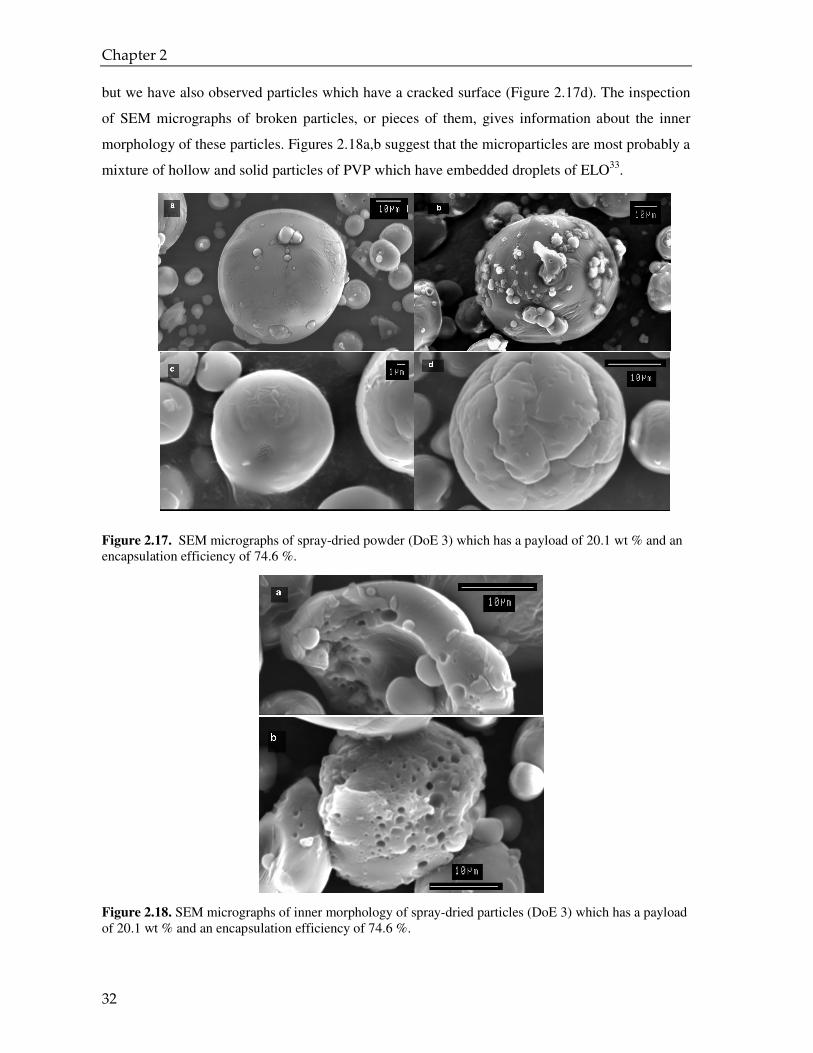
On the other hand, the SEM photographs of the spray dried powder corresponding to the DoE 3
show big and intact particles which in most cases have a smooth surface (Figures 2.17 a,c). In
some cases, a particle can be covered with smaller particles to form agglomerates (Figure 2.17b),
0.01 0.1 1 10 100 1000
0
1
2
3
4
5
6
7
8 emulsion before spraying
emulsion after spraying
spray-dried powder in heptane
vo
lum
e %
particle size (µµµµm)
Chapter 2
32
but we have also observed particles which have a cracked surface (Figure 2.17d). The inspection
of SEM micrographs of broken particles, or pieces of them, gives information about the inner
morphology of these particles. Figures 2.18a,b suggest that the microparticles are most probably a
mixture of hollow and solid particles of PVP which have embedded droplets of ELO33.
Figure 2.17. SEM micrographs of spray-dried powder (DoE 3) which has a payload of 20.1 wt % and an encapsulation efficiency of 74.6 %.
Figure 2.18. SEM micrographs of inner morphology of spray-dried particles (DoE 3) which has a payload of 20.1 wt % and an encapsulation efficiency of 74.6 %.
Microencapsulation of the liquid cross-linker: Design of Experiment
33
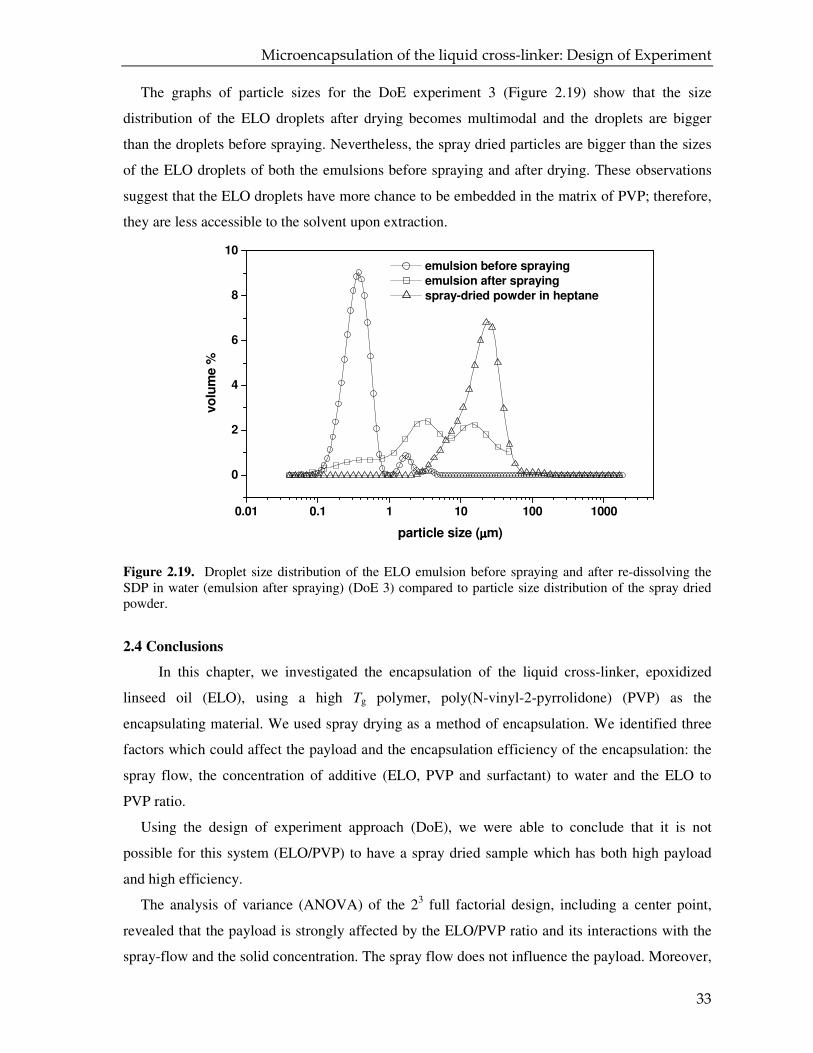
The graphs of particle sizes for the DoE experiment 3 (Figure 2.19) show that the size
distribution of the ELO droplets after drying becomes multimodal and the droplets are bigger
than the droplets before spraying. Nevertheless, the spray dried particles are bigger than the sizes
of the ELO droplets of both the emulsions before spraying and after drying. These observations
suggest that the ELO droplets have more chance to be embedded in the matrix of PVP; therefore,
they are less accessible to the solvent upon extraction.
Figure 2.19. Droplet size distribution of the ELO emulsion before spraying and after re-dissolving the SDP in water (emulsion after spraying) (DoE 3) compared to particle size distribution of the spray dried powder.
2.4 Conclusions
In this chapter, we investigated the encapsulation of the liquid cross-linker, epoxidized
linseed oil (ELO), using a high Tg polymer, poly(N-vinyl-2-pyrrolidone) (PVP) as the
encapsulating material. We used spray drying as a method of encapsulation. We identified three
factors which could affect the payload and the encapsulation efficiency of the encapsulation: the
spray flow, the concentration of additive (ELO, PVP and surfactant) to water and the ELO to
PVP ratio.
Using the design of experiment approach (DoE), we were able to conclude that it is not
possible for this system (ELO/PVP) to have a spray dried sample which has both high payload
and high efficiency.
The analysis of variance (ANOVA) of the 23 full factorial design, including a center point,
revealed that the payload is strongly affected by the ELO/PVP ratio and its interactions with the
spray-flow and the solid concentration. The spray flow does not influence the payload. Moreover,
0.01 0.1 1 10 100 1000
0
2
4
6
8
10
emulsion before spraying
emulsion after spraying
spray-dried powder in heptane
vo
lum
e %
particle size (µµµµm)
Chapter 2
34
the construction of a mathematical model of the payload as a function of these factors enabled to
locate the maximum area of payload around the highest value of ELO/PVP and lower value of
concentration. The ANOVA of the design of experiments for the encapsulation efficiency
suggested that all three factors and their interactions influence the efficiency. The statistical
significance (p < 0.05) of the curvature for the linear regression of the encapsulation efficiency
reveals that a linear mathematical model is not suitable to describe the efficiency as a function of
the spray flow, concentration and ELO/PVP ratio. However, the presence of a center point in the
23 factorial designs allowed us to fit the data for the efficiency with an approximate quadratic
model. The contour plots of the efficiency versus the concentration and ELO/PVP ratio at
different levels of spray flow showed that the maximum area of efficiency is located at the
maximum of the concentration, minimum of ELO/PVP ratio and medium value of spray flow.
Finally, the analysis of the morphology of the spray dried powders (SDP) via Scanning
Electron Microscopy (SEM) demonstrated that the SDP with the highest payload and lowest
efficiency (DoE 5), comprises hollow and incomplete particles. On the other hand, the powder
with high efficiency and low payload (DoE 3) consists of microparticles which are intact and
have thick smooth shell. The analysis of the droplet size distribution of the emulsion reconstituted
by dissolving a certain amount of spray dried powder in water, suggested that during the spraying
the droplets of ELO collapse and form bigger droplets compared to the droplet size before
spraying. These observations confirm our preliminary hypothesis which guided us also to the
choice of the factors: given a system (core/shell/surfactant), the bigger the spray dried particle
sizes and the smaller the ELO droplet sizes are, the better is the efficiency of encapsulation.
Based on these results, as we will show in Chapter 4, we were able to successfully encapsulate
the liquid cross-linker in a matrix of PVP. We obtained a free flow powder which has a payload
of ~ 20 wt % and high efficiency of encapsulation of ~ 90 %.
Microencapsulation of the liquid cross-linker: Design of Experiment
35
2.5 References
(1) Thies, C. Microencapsulation, John Wile & Sons, Inc., New York, 2005.
(2) Sliwka, W. Angewandte Chemie-International Edition in English, 1975, 14, 8, 539-550.
(3) Finch, C. A.; Bodmeier, R. Microencapsulation, Wiley-VHC Verlag CmbH & Co., 2002.
(4) Blythe, D. in Microspheres, Microcapsules and Liposomes, Arshady, R., 1999, 391.
(5) Shahidi, F.; Han, X. Q. Critical Reviews in Food Science and Nutrition, 1993, 33, 6, 501-547.
(6) Thies, C. Crc Critical Reviews in Biomedical Engineering, 1982, 8, 4, 335-383.
(7) Comiskey, B.; Albert, J. D.; Yoshizawa, H.; Jacobson, J. Nature, 1998, 394, 6690, 253-255.
(8) Tsuji, K. in Microspheres, Microcapsules & Liposomes, Arshady, R., 1999, 349.
(9) Miyazawa, K.; Yajima, I.; Kaneda, I.; Yanaki, T. Journal of Cosmetic Science, 2000, 51, 4, 239-252.
(10) Pernot, J. M. in Microsphere, Microcapsules and Liposomes, Arshady, R., 2007, 441.
(11) Ghosh, S. K. Functional coatings by polymer microencapsulation, Wiley-VCH, Weinheim, 2006.
(12) Masters, K. Spray Drying Handbook, 5th, Longman Scientific & Technical, Harlow Essex, England, 1991.
(13) Re, M. I.; Liu, Y. J. Drying '96-Proceedings of the 10th International Drying Symposium, 1996, A, 541-549.
(14) Hecht, J. P.; King, C. J. Industrial & Engineering Chemistry Research,2000, 39, 6, 1756-1765.
(15) Mongenot, N.; Charrier, S.; Chalier, P. Journal of Agricultural and Food Chemistry, 2000, 48, 3, 861-867.
(16) Wan, L. S. C.; Heng, P. W. S.; Chia, C. G. H. Drug Development and Industrial Pharmacy, 1992, 18, 9, 997-1011.
(17) Vanichtanunkul, D.; Vayumhasuwan, P.; Nimmannit, U. Journal of Microencapsulation, 1998, 15, 6, 753-759.
(18) Rosenberg, M.; Kopelman, I. J.; Talmon, Y. Journal of Agricultural and Food Chemistry, 1990, 38, 5, 1288-1294.
(19) Maa, Y. F.; Nguyen, P. A.; Sit, K.; Hsu, C. C. Biotechnology and Bioengineering, 1998, 60, 3, 301-309.
(20) Re, M. I. Drying Technology, 1998, 16, 6, 1195-1236.
(21) Buchi Labortechnik, Training papers spray-drying, http://www.buchi.com/Spray-Drying.69.0.html,
accessed on 1-1-0008.
(22) Bair, H. E.; Boyle, D. J.; Kelleher, P. G. Polymer Engineering and Science, 1980, 20, 15, 995-1001.
(23) Hohne, G.; Hemminger, W.; Flammersheim, H. J. Differential Scanning Calorimetry: a guide for
practitioners, Springer, 1996.
Chapter 2
36
(24) Twan, A. R. H. in Paint technology manuals, Chapman and Hall, 1969, 113.
(25) Montgomery, D. C. Design and analysis of experiments, Wiley, New York, 1984.
(26) Soottintawat, A.; Yoshii, H.; Furuta, T.; Ohkawara, M.; Linko, P. Journal of Food Science, 2003, 68, 7, 2256-2262.
(27) Soottintawat, A.; Takayama, K.; Okamura, K.; Muranaka, D.; Yoshii, H.; Furuta, T.; Ohkawara, M.; Linko, P. Innovative Food Science & Emerging Technologies, 2005, 6, 2, 163-170.
(28) Mosen, K.; Backstrom, K.; Thalberg, K.; Schaefer, T.; Kristensen, H. G.; Axelsson, A. Pharmaceutical Development and Technology, 2004, 9, 4, 409-417.
(29) Statistical software, Minitab 15, http://www.minitab.com/, accessed on 1-1-2008.
(30) Behrend, O.; Ax, K.; Schubert, H. Ultrasonics Sonochemistry, 2000, 7, 2, 77-85.
(31) Anthony, J. Design of Experiments for Engineers and Scientists, Butterworth-Heinemann,
Amsterdam, 2003.
(32) Mathews, P. Design of experiments with minitab, American Society for Quality, Quality Press, Milwaukee, 2004.
(33) Rosenberg, M.; Kopelman, I. J.; Talmon, Y. Journal of Food Science, 1985, 50, 1, 139-144.


3 Miscibility and specific interactions in
blends of poly(N-vinyl-2-
pyrrolidone) and acid functional
polyester resins
37
Miscibility and intermolecular interactions of novel blends of poly(N-vinyl-2-pyrrolidone) (PVP) and acid functional polyester resins (APE) were studied using Differential Scanning Calorimetry (DSC), Attenuated Reflectance Fourier Transform Infrared (ATR-FTIR) and Cross-Polarization Magic Angle Spinning (CPMAS) 13C NMR spectroscopy. DSC reveals a single Tg for all blends of PVP and APEs resins studied, except in one case. In fact, this behavior depends on the molecular weight of PVP and the number of acid end-groups of the polyesters. A higher number of acid groups of the APEs as well as a higher molecular weight of the PVPs promote the miscibility of the two polymers. The ATR-FTIR spectra show mixing induced displacements of the stretch vibrations of both PVP and APE carbonyl groups to higher frequencies. This blue shift indicates dipole-dipole interactions between the carbonyl groups of PVP and the carbonyl groups of APEs. Moreover, FTIR spectra of blends of PVP with the APE resins contain a broad peak at about 1630 cm-1, which appears as a shoulder of the carbonyl stretch vibration of PVP. This band is ascribed to H-bonding between the carbonyls of PVP and the hydrogen atoms of the end groups of the APE resins. Analysis of the temperature-variable FTIR spectra of blends of PVP and a polyester resin of neopentyl glycol and isophthalic acid (PNI), used as a model of the APE resin, confirms the existence of such interactions. When increasing the PNI content, the PVP and PNI carbonyl resonances in CPMAS 13C NMR spectra of PVP-PNI blends shift in the up-field direction. The fact that the two blend components affect each other’s 13C NMR shifts confirms that the two polymers are close together in the blend. Proton spin-lattice relaxation of the PVP, PNI and their blends also indicates that PVP mixes with the APE resins at the sub-micron scale as consistent with the single glass-transition observed with DSC.
Chapter 3
38
3.1 Introduction
The need for a new polymer materials with controlled and tailored properties has driven the
interest of industry and academia towards polymer blends, i.e. physical mixtures of two different
homopolymers or copolymers. Blending two polymers provides new materials with a wide range
of properties, depending on the type of constituents and their composition, without chemical
synthesis of a new polymer. A large number of polymer blends have been studied in the
literature1. In general, a miscible blend is the exception rather than the rule. This is due to the
unfavorable enthalpy of mixing and the small entropy of mixing. However, if specific
interactions such as dipole-dipole interactions, hydrogen bonding, charge transfer and acid-base
interactions between the two constituents occur, then miscibility is observed2.
Poly(vinylpyrrolidone) (PVP) is a water soluble polymer, which is miscible with numerous
polymers. The miscibility of PVP with hydroxyl-containing polymers like polyvinylalchol3-7,
poly(4-vinyl phenol)8, poly(hydroxyether-bisphenol A)9-10 and natural polymers11-12 has been
clearly attributed to hydrogen bonds between the carbonyl groups of the PVP (a H-acceptor) and
the hydroxyl groups (a H-donor) of the other polymers. However, PVP has also been proved to be
miscible with halogen-containing polymers like polyvinylchloride (PVC)13-15, poly(chloromethyl
methacrylate), poly(2-chloroethyl methacrylate)16, poly(3-chloropropyl methacrylate), poly(2-
bromoethyl methacrylate) and poly(2-iodomethacrylate)17. For these blends, the miscibility is
attributed to two kinds of intermolecular interactions: 1. dipole-dipole interactions between the
carbonyl groups of the PVP and the carbon-halogen groups of the halogenated polymer; 2. H-
bonding between the carbonyl groups of the PVP and the α-hydrogens of the halogenated
polymers (e.g. PVC). Fourier Transform Infra-Red (FTIR) study has shown that the stretch
vibration of the PVP carbonyl groups shifts to higher frequency (blue shift). This shift has been
ascribed to dipole-dipole interactions14. Moreover, Raman and solids NMR studies of the
PVP/PVC blends confirmed the existence of dipole-dipole interactions, but no clear proof of
hydrogen bonding was found15.
Blends of PVP with DL-polylactide18 have also been investigated. In this case hydrogen
bonding interactions are not possible due the absence of H-donor groups. Nevertheless, the
stretch vibration of the PVP carbonyl shows a shift to higher frequency. It was concluded that this
shift cannot be ascribed to electric dipole-dipole interactions between the carbonyl groups of the
PVP and those of the polyester, because the stretch vibration of the latter is independent of the
PVP content.
In this chapter we describe, for the first time, blends of PVP with acid functional polyesters
(APE) as used e.g. in powder coatings. Polyesters for such applications are typically low
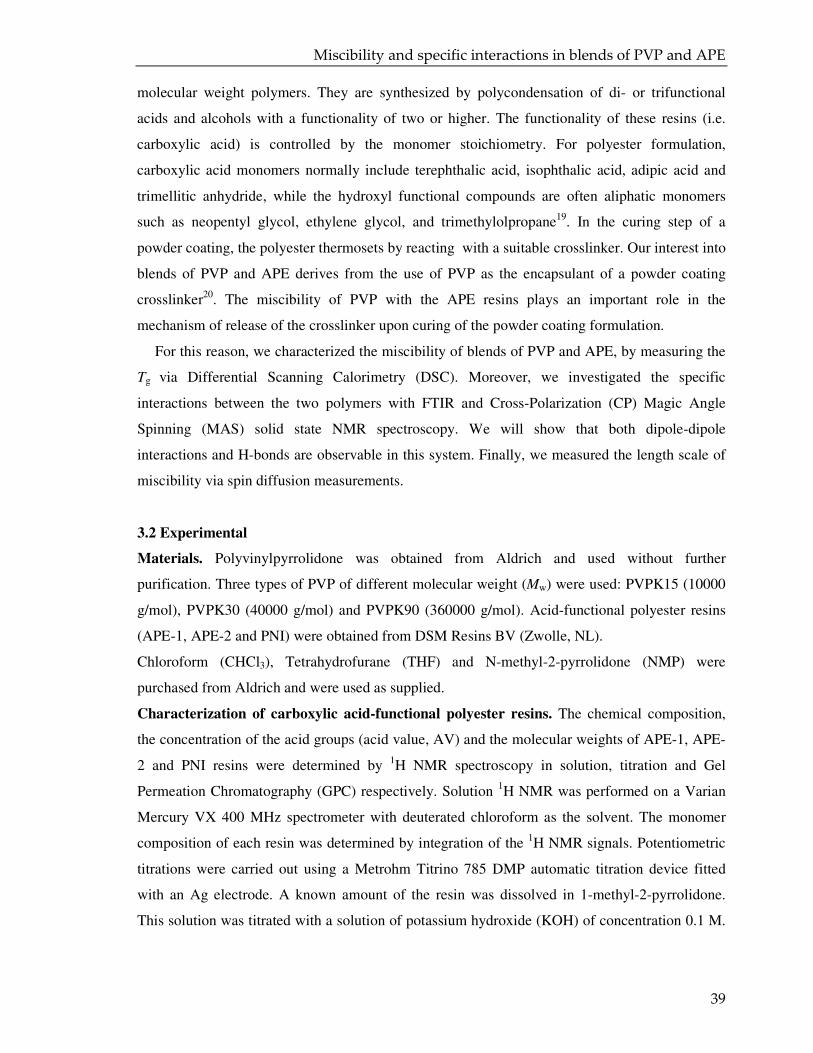
Miscibility and specific interactions in blends of PVP and APE
39
molecular weight polymers. They are synthesized by polycondensation of di- or trifunctional
acids and alcohols with a functionality of two or higher. The functionality of these resins (i.e.
carboxylic acid) is controlled by the monomer stoichiometry. For polyester formulation,
carboxylic acid monomers normally include terephthalic acid, isophthalic acid, adipic acid and
trimellitic anhydride, while the hydroxyl functional compounds are often aliphatic monomers
such as neopentyl glycol, ethylene glycol, and trimethylolpropane19. In the curing step of a
powder coating, the polyester thermosets by reacting with a suitable crosslinker. Our interest into
blends of PVP and APE derives from the use of PVP as the encapsulant of a powder coating
crosslinker20. The miscibility of PVP with the APE resins plays an important role in the
mechanism of release of the crosslinker upon curing of the powder coating formulation.
For this reason, we characterized the miscibility of blends of PVP and APE, by measuring the
Tg via Differential Scanning Calorimetry (DSC). Moreover, we investigated the specific
interactions between the two polymers with FTIR and Cross-Polarization (CP) Magic Angle
Spinning (MAS) solid state NMR spectroscopy. We will show that both dipole-dipole
interactions and H-bonds are observable in this system. Finally, we measured the length scale of
miscibility via spin diffusion measurements.
3.2 Experimental
Materials. Polyvinylpyrrolidone was obtained from Aldrich and used without further
purification. Three types of PVP of different molecular weight (Mw) were used: PVPK15 (10000
g/mol), PVPK30 (40000 g/mol) and PVPK90 (360000 g/mol). Acid-functional polyester resins
(APE-1, APE-2 and PNI) were obtained from DSM Resins BV (Zwolle, NL).
Chloroform (CHCl3), Tetrahydrofurane (THF) and N-methyl-2-pyrrolidone (NMP) were
purchased from Aldrich and were used as supplied.
Characterization of carboxylic acid-functional polyester resins. The chemical composition,
the concentration of the acid groups (acid value, AV) and the molecular weights of APE-1, APE-
2 and PNI resins were determined by 1H NMR spectroscopy in solution, titration and Gel
Permeation Chromatography (GPC) respectively. Solution 1H NMR was performed on a Varian
Mercury VX 400 MHz spectrometer with deuterated chloroform as the solvent. The monomer
composition of each resin was determined by integration of the 1H NMR signals. Potentiometric
titrations were carried out using a Metrohm Titrino 785 DMP automatic titration device fitted
with an Ag electrode. A known amount of the resin was dissolved in 1-methyl-2-pyrrolidone.
This solution was titrated with a solution of potassium hydroxide (KOH) of concentration 0.1 M.
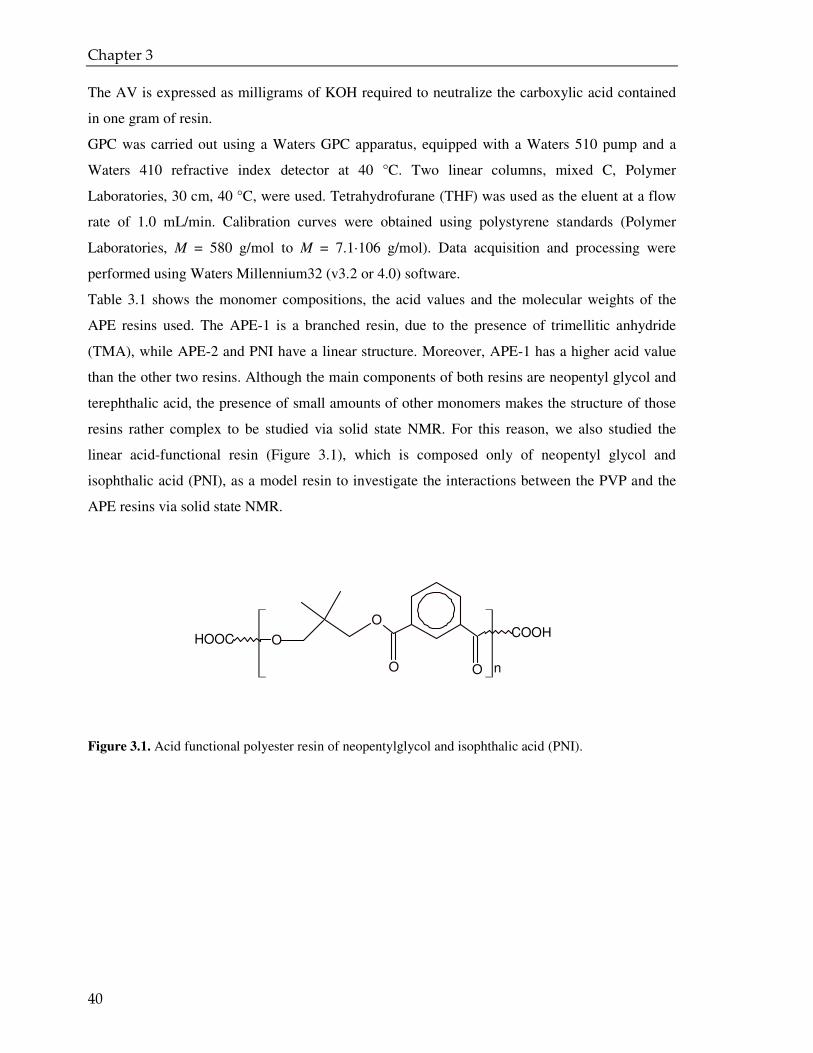
Chapter 3
40
The AV is expressed as milligrams of KOH required to neutralize the carboxylic acid contained
in one gram of resin.
GPC was carried out using a Waters GPC apparatus, equipped with a Waters 510 pump and a
Waters 410 refractive index detector at 40 °C. Two linear columns, mixed C, Polymer
Laboratories, 30 cm, 40 °C, were used. Tetrahydrofurane (THF) was used as the eluent at a flow
rate of 1.0 mL/min. Calibration curves were obtained using polystyrene standards (Polymer
Laboratories, M = 580 g/mol to M = 7.1·106 g/mol). Data acquisition and processing were
performed using Waters Millennium32 (v3.2 or 4.0) software.
Table 3.1 shows the monomer compositions, the acid values and the molecular weights of the
APE resins used. The APE-1 is a branched resin, due to the presence of trimellitic anhydride
(TMA), while APE-2 and PNI have a linear structure. Moreover, APE-1 has a higher acid value
than the other two resins. Although the main components of both resins are neopentyl glycol and
terephthalic acid, the presence of small amounts of other monomers makes the structure of those
resins rather complex to be studied via solid state NMR. For this reason, we also studied the
linear acid-functional resin (Figure 3.1), which is composed only of neopentyl glycol and
isophthalic acid (PNI), as a model resin to investigate the interactions between the PVP and the
APE resins via solid state NMR.
Figure 3.1. Acid functional polyester resin of neopentylglycol and isophthalic acid (PNI).
O O
O
O
n
COOHHOOC
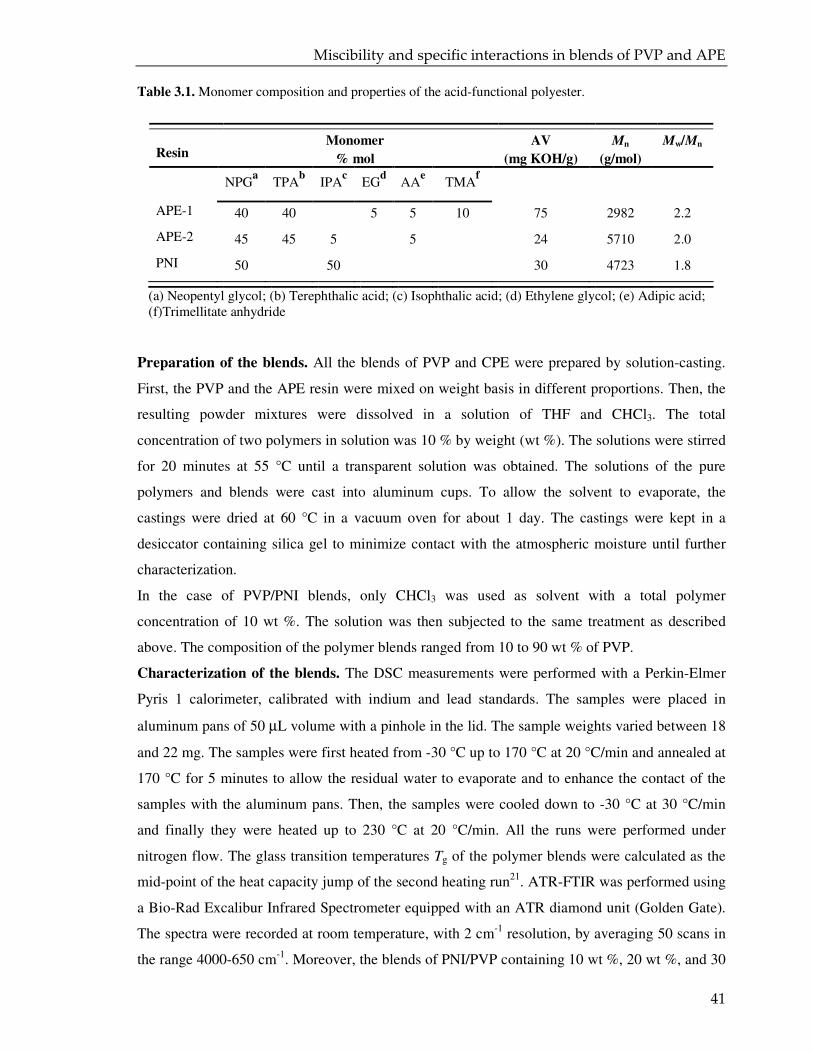
Miscibility and specific interactions in blends of PVP and APE
41
Table 3.1. Monomer composition and properties of the acid-functional polyester.
Resin Monomer
% mol
AV
(mg KOH/g)
Mn
(g/mol)
Mw/Mn
NPGa TPA
b IPA
c EG
d AA
e TMA
f
APE-1 40 40 5 5 10 75 2982 2.2
APE-2 45 45 5 5 24 5710 2.0
PNI 50 50 30 4723 1.8
(a) Neopentyl glycol; (b) Terephthalic acid; (c) Isophthalic acid; (d) Ethylene glycol; (e) Adipic acid; (f)Trimellitate anhydride
Preparation of the blends. All the blends of PVP and CPE were prepared by solution-casting.
First, the PVP and the APE resin were mixed on weight basis in different proportions. Then, the
resulting powder mixtures were dissolved in a solution of THF and CHCl3. The total
concentration of two polymers in solution was 10 % by weight (wt %). The solutions were stirred
for 20 minutes at 55 °C until a transparent solution was obtained. The solutions of the pure
polymers and blends were cast into aluminum cups. To allow the solvent to evaporate, the
castings were dried at 60 °C in a vacuum oven for about 1 day. The castings were kept in a
desiccator containing silica gel to minimize contact with the atmospheric moisture until further
characterization.
In the case of PVP/PNI blends, only CHCl3 was used as solvent with a total polymer
concentration of 10 wt %. The solution was then subjected to the same treatment as described
above. The composition of the polymer blends ranged from 10 to 90 wt % of PVP.
Characterization of the blends. The DSC measurements were performed with a Perkin-Elmer
Pyris 1 calorimeter, calibrated with indium and lead standards. The samples were placed in
aluminum pans of 50 µL volume with a pinhole in the lid. The sample weights varied between 18
and 22 mg. The samples were first heated from -30 °C up to 170 °C at 20 °C/min and annealed at
170 °C for 5 minutes to allow the residual water to evaporate and to enhance the contact of the
samples with the aluminum pans. Then, the samples were cooled down to -30 °C at 30 °C/min
and finally they were heated up to 230 °C at 20 °C/min. All the runs were performed under
nitrogen flow. The glass transition temperatures Tg of the polymer blends were calculated as the
mid-point of the heat capacity jump of the second heating run21. ATR-FTIR was performed using
a Bio-Rad Excalibur Infrared Spectrometer equipped with an ATR diamond unit (Golden Gate).
The spectra were recorded at room temperature, with 2 cm-1 resolution, by averaging 50 scans in
the range 4000-650 cm-1. Moreover, the blends of PNI/PVP containing 10 wt %, 20 wt %, and 30
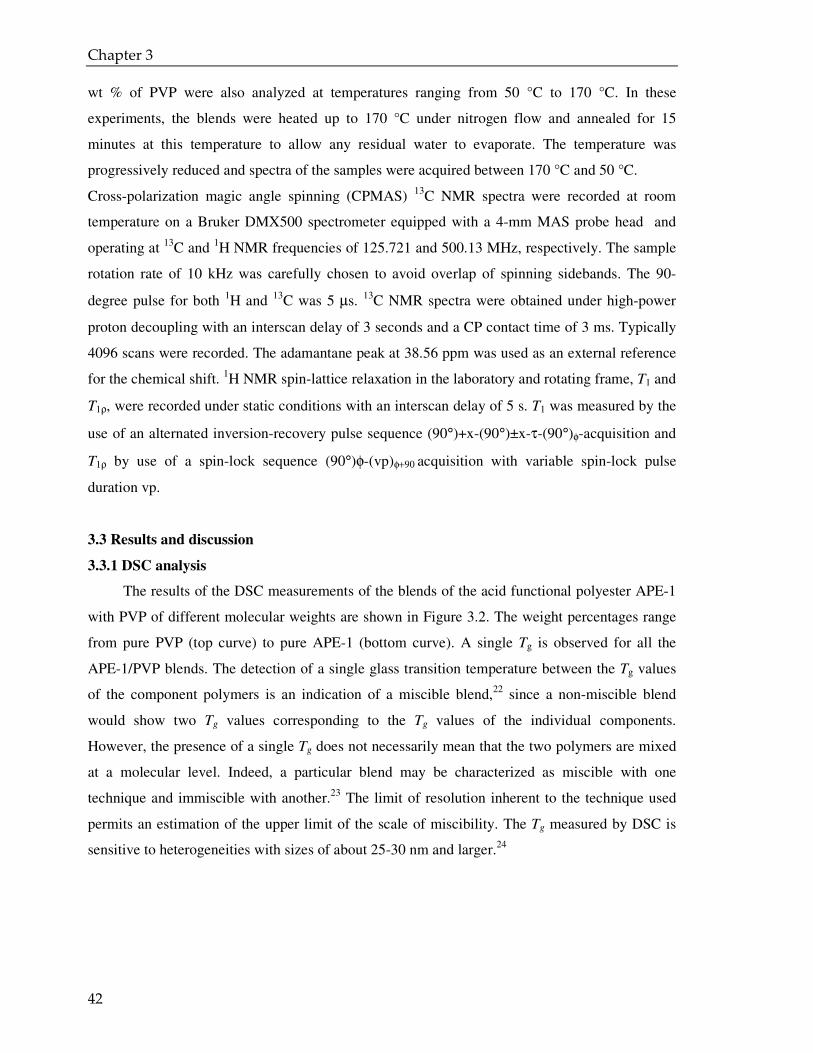
Chapter 3
42
wt % of PVP were also analyzed at temperatures ranging from 50 °C to 170 °C. In these
experiments, the blends were heated up to 170 °C under nitrogen flow and annealed for 15
minutes at this temperature to allow any residual water to evaporate. The temperature was
progressively reduced and spectra of the samples were acquired between 170 °C and 50 °C.
Cross-polarization magic angle spinning (CPMAS) 13C NMR spectra were recorded at room
temperature on a Bruker DMX500 spectrometer equipped with a 4-mm MAS probe head and
operating at 13C and 1H NMR frequencies of 125.721 and 500.13 MHz, respectively. The sample
rotation rate of 10 kHz was carefully chosen to avoid overlap of spinning sidebands. The 90-
degree pulse for both 1H and 13C was 5 µs. 13C NMR spectra were obtained under high-power
proton decoupling with an interscan delay of 3 seconds and a CP contact time of 3 ms. Typically
4096 scans were recorded. The adamantane peak at 38.56 ppm was used as an external reference
for the chemical shift. 1H NMR spin-lattice relaxation in the laboratory and rotating frame, T1 and
T1ρ, were recorded under static conditions with an interscan delay of 5 s. T1 was measured by the
use of an alternated inversion-recovery pulse sequence (90°)+x-(90°)±x-τ-(90°)φ-acquisition and
T1ρ by use of a spin-lock sequence (90°)φ-(vp)φ+90 acquisition with variable spin-lock pulse
duration vp.
3.3 Results and discussion
3.3.1 DSC analysis
The results of the DSC measurements of the blends of the acid functional polyester APE-1
with PVP of different molecular weights are shown in Figure 3.2. The weight percentages range
from pure PVP (top curve) to pure APE-1 (bottom curve). A single Tg is observed for all the
APE-1/PVP blends. The detection of a single glass transition temperature between the Tg values
of the component polymers is an indication of a miscible blend,22 since a non-miscible blend
would show two Tg values corresponding to the Tg values of the individual components.
However, the presence of a single Tg does not necessarily mean that the two polymers are mixed
at a molecular level. Indeed, a particular blend may be characterized as miscible with one
technique and immiscible with another.23 The limit of resolution inherent to the technique used
permits an estimation of the upper limit of the scale of miscibility. The Tg measured by DSC is
sensitive to heterogeneities with sizes of about 25-30 nm and larger.24

Miscibility and specific interactions in blends of PVP and APE
43
Figure 3.2. DSC thermograms of APE-1 blended with PVPK15 (a), PVPK30 (b) and PVPK90 (c); the number associated to each curve refers to the weight percentage of PVP.
Several attempts to relate the Tg of a miscible blend to its composition have been reported in
literature25. Two of the most well known equations are the Fox equation26,
1 2
1 2
1 +
g g g
w w
T T T= (3.1)
and the Gordon-Taylor27 equation,
1 1 2 2
1 2
( )
( )g g
g
w T kw TT
w kw
+=
+ (3.2)
50 75 100 125 150 175
a
0
10
20
30
40
50
60
8090
100
PVP (wt %)en
do
Temperature ( 0C )
50 75 100 125 150 175 200
b
PVP (wt %)
0
10
20
30
40
60
100
80
en
do
Temperature ( 0C )
50 75 100 125 150 175 200
c
0
10
20
30
40
60
80
100
PVP (wt %)
en
do
Temperature ( 0C )
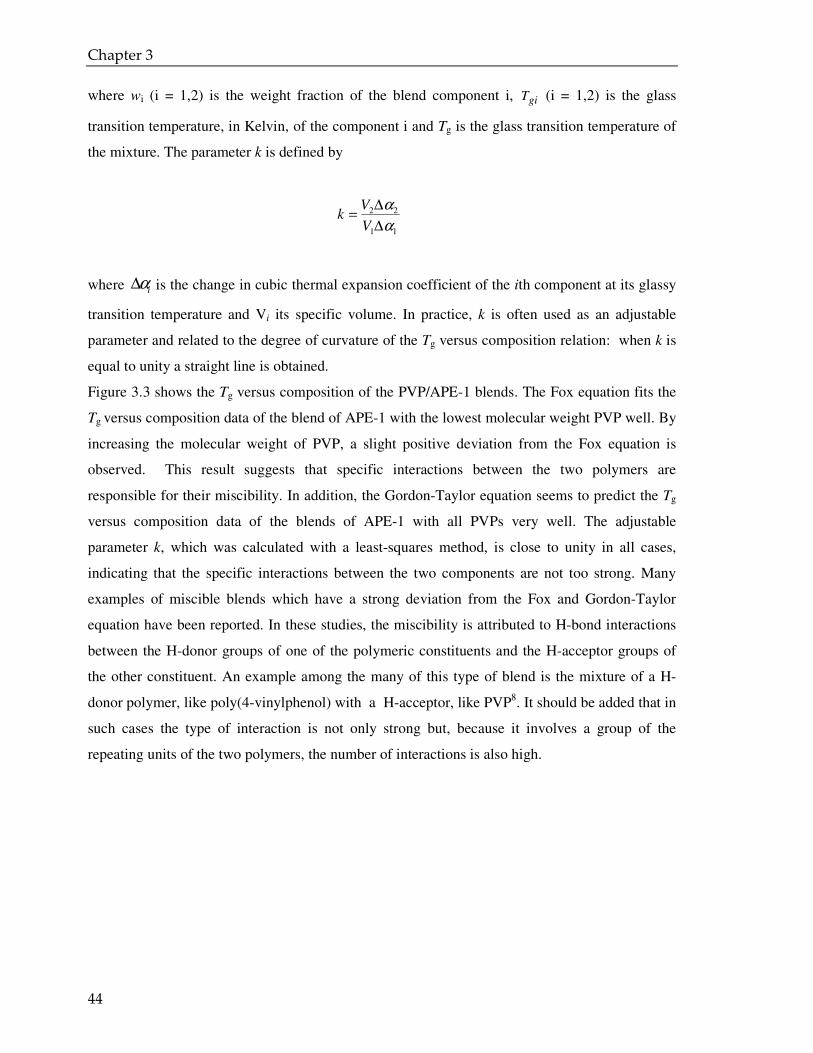
Chapter 3
44
where wi (i = 1,2) is the weight fraction of the blend component i, giT (i = 1,2) is the glass
transition temperature, in Kelvin, of the component i and Tg is the glass transition temperature of
the mixture. The parameter k is defined by
2 2
1 1
Vk
V
α
α
∆=
∆
where iα∆ is the change in cubic thermal expansion coefficient of the ith component at its glassy
transition temperature and Vi its specific volume. In practice, k is often used as an adjustable
parameter and related to the degree of curvature of the Tg versus composition relation: when k is
equal to unity a straight line is obtained.
Figure 3.3 shows the Tg versus composition of the PVP/APE-1 blends. The Fox equation fits the
Tg versus composition data of the blend of APE-1 with the lowest molecular weight PVP well. By
increasing the molecular weight of PVP, a slight positive deviation from the Fox equation is
observed. This result suggests that specific interactions between the two polymers are
responsible for their miscibility. In addition, the Gordon-Taylor equation seems to predict the Tg
versus composition data of the blends of APE-1 with all PVPs very well. The adjustable
parameter k, which was calculated with a least-squares method, is close to unity in all cases,
indicating that the specific interactions between the two components are not too strong. Many
examples of miscible blends which have a strong deviation from the Fox and Gordon-Taylor
equation have been reported. In these studies, the miscibility is attributed to H-bond interactions
between the H-donor groups of one of the polymeric constituents and the H-acceptor groups of
the other constituent. An example among the many of this type of blend is the mixture of a H-
donor polymer, like poly(4-vinylphenol) with a H-acceptor, like PVP8. It should be added that in
such cases the type of interaction is not only strong but, because it involves a group of the
repeating units of the two polymers, the number of interactions is also high.
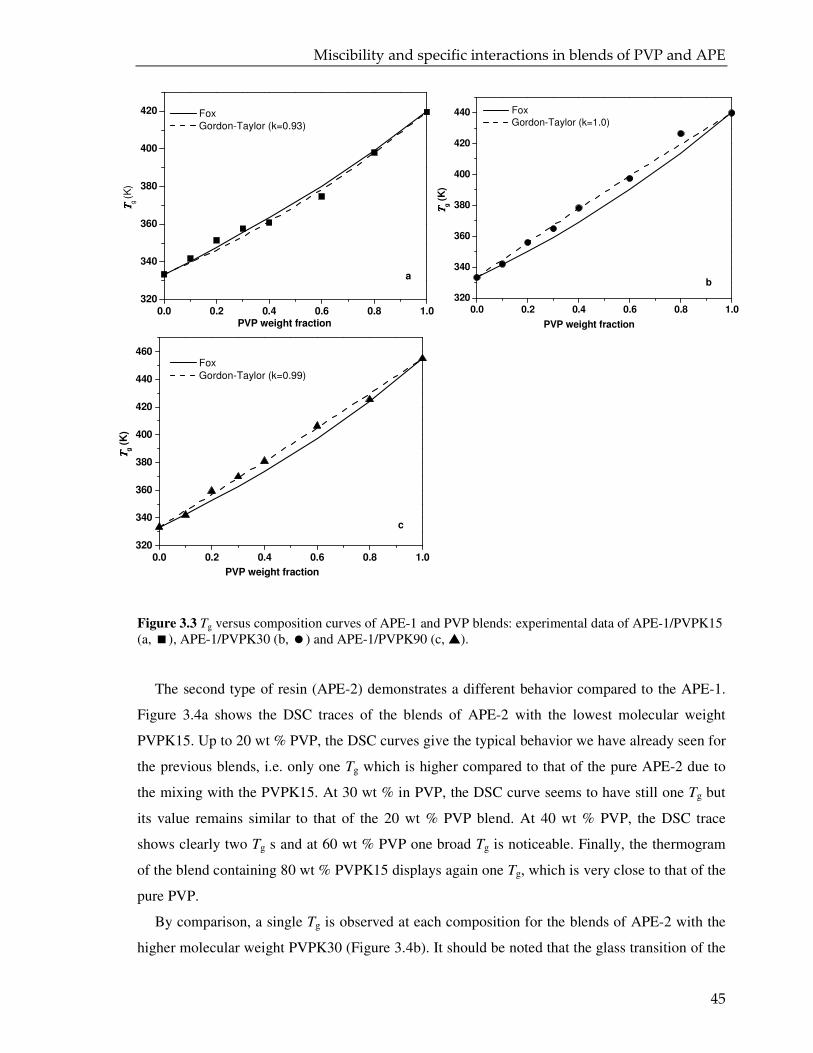
Miscibility and specific interactions in blends of PVP and APE
45
Figure 3.3 Tg versus composition curves of APE-1 and PVP blends: experimental data of APE-1/PVPK15 (a, �), APE-1/PVPK30 (b, �) and APE-1/PVPK90 (c, s).
The second type of resin (APE-2) demonstrates a different behavior compared to the APE-1.
Figure 3.4a shows the DSC traces of the blends of APE-2 with the lowest molecular weight
PVPK15. Up to 20 wt % PVP, the DSC curves give the typical behavior we have already seen for
the previous blends, i.e. only one Tg which is higher compared to that of the pure APE-2 due to
the mixing with the PVPK15. At 30 wt % in PVP, the DSC curve seems to have still one Tg but
its value remains similar to that of the 20 wt % PVP blend. At 40 wt % PVP, the DSC trace
shows clearly two Tg s and at 60 wt % PVP one broad Tg is noticeable. Finally, the thermogram
of the blend containing 80 wt % PVPK15 displays again one Tg, which is very close to that of the
pure PVP.
By comparison, a single Tg is observed at each composition for the blends of APE-2 with the
higher molecular weight PVPK30 (Figure 3.4b). It should be noted that the glass transition of the
0.0 0.2 0.4 0.6 0.8 1.0320
340
360
380
400
420
440
460
c
Fox
Gordon-Taylor (k=0.99)
ΤΤ ΤΤg (
K)
PVP weight fraction
0.0 0.2 0.4 0.6 0.8 1.0320
340
360
380
400
420
440
b
Fox
Gordon-Taylor (k=1.0)
ΤΤ ΤΤg (
K)
PVP weight fraction
0.0 0.2 0.4 0.6 0.8 1.0320
340
360
380
400
420
a
Fox
Gordon-Taylor (k=0.93)ΤΤ ΤΤ
g (K
)
PVP weight fraction
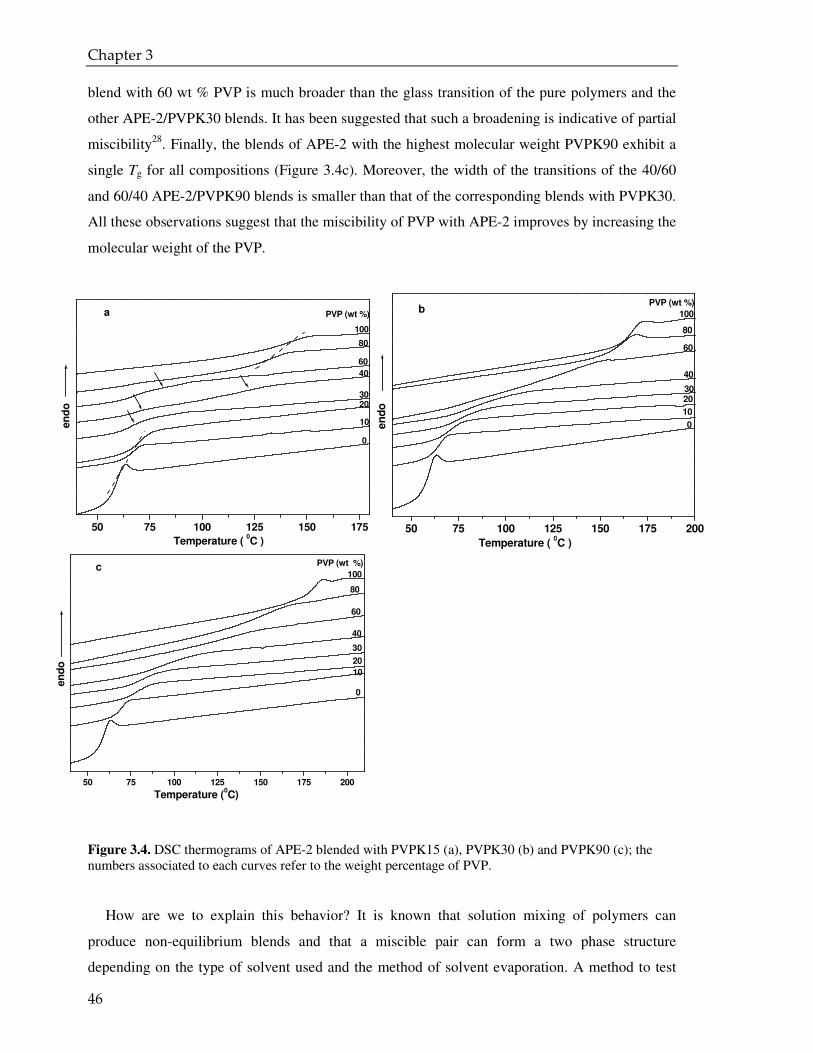
Chapter 3
46
blend with 60 wt % PVP is much broader than the glass transition of the pure polymers and the
other APE-2/PVPK30 blends. It has been suggested that such a broadening is indicative of partial
miscibility28. Finally, the blends of APE-2 with the highest molecular weight PVPK90 exhibit a
single Tg for all compositions (Figure 3.4c). Moreover, the width of the transitions of the 40/60
and 60/40 APE-2/PVPK90 blends is smaller than that of the corresponding blends with PVPK30.
All these observations suggest that the miscibility of PVP with APE-2 improves by increasing the
molecular weight of the PVP.
Figure 3.4. DSC thermograms of APE-2 blended with PVPK15 (a), PVPK30 (b) and PVPK90 (c); the numbers associated to each curves refer to the weight percentage of PVP.
How are we to explain this behavior? It is known that solution mixing of polymers can
produce non-equilibrium blends and that a miscible pair can form a two phase structure
depending on the type of solvent used and the method of solvent evaporation. A method to test
50 75 100 125 150 175
a
0
10
2030
40
60
80
100
PVP (wt %)
en
do
Temperature ( 0C )
50 75 100 125 150 175 200
b
0
10
2030
40
60
80
100
PVP (wt %)
en
do
Temperature ( 0C )
50 75 100 125 150 175 200
c
0
10
20
30
40
60
80
100
PVP (wt %)
en
do
Temperature (0C)
Miscibility and specific interactions in blends of PVP and APE
47
whether this is a possible cause of the apparent immiscibility of the blends of APE-2 with
PVPK15 and PVPK30 is to use a different solvent or to anneal the blends at a temperature higher
than the Tg of the pure PVP. The annealing can also be done by applying a heating and cooling
cycle in the DSC furnace. If the immiscibility of a blend is the result of a non-equilibrium
situation, then, after annealing, the DSC trace of that sample should show only one Tg 29. Figure
3.5 shows DSC curves of the 40 wt % PVP, both after annealing the sample in the way described
above and when using N-methyl-2-pyrrolidone as a different casting solvent. The DSC curves
still exhibit two distinctive Tgs. Therefore, we can conclude that the immiscibility shown by the
blend of APE-2 with the lowest molecular weight PVP in the composition range of 30 to 60 wt %
PVP is not caused by kinetics. In the next section the type of interactions in the blends will be
investigated in order to explain the (im)miscibility of blends with APE-2.
Figure 3.5. DSC curves of the blends of APE-2 with 40 wt % PVPK15: cast from N-methyl-2-pyrrolidone (solid line); after annealing in DSC furnace (dashed line).
Figure 3.6 shows the Tg versus composition of blends of APE-2 with PVPK30 and PVPK90.
The Tg versus composition curve of the APE-2/PVPK15 blends, which shows two distinct Tgs,
has not been plotted. The Tg data of the blends containing 60 wt % and 80 wt % PVPK30 deviate
from both the Fox and Gordon-Taylor equations. This positive deviation can be due to strong
specific interactions between the two constituents. By contrast, the Tg versus composition plot of
the APE-2/PVPK90 blends shows a good fit to both the Fox and Gordon-Taylor equations.
-50 0 50 100 150
casted from NMP
annealed in DSC
en
do
Temperature (oC)

Chapter 3
48
Figure 3.6. Tg versus composition curves of miscible blends of APE-2 and PVP blends: experimental data of APE-2/PVPK30 (�) and APE-2/PVPK90 (s).
In Figure 3.7a the DSC traces are plotted and in Figure 3.7b the Tg versus composition graph is
given for the blends of the resin PNI with the PVP of intermediate molecular weight, PVPK30.
Similarly to the blend of APE-1 with PVP, the DSC data show only one Tg for each composition
and the experimental data are perfectly represented by both the Fox and the Gordon-Taylor
equations.
Figure 3.7. (a) DSC thermograms of PNI and PVPK30 blends; the numbers associated to each curve refer to the weight percentage of PVP; (b) Tg versus composition curve of PNI/PVPK30 blends.
0.0 0.2 0.4 0.6 0.8 1.0320
340
360
380
400
420
440
460
b
Fox
Gordon-Taylor (k=0.923)
ΤΤ ΤΤg (
K)
PVP weight fraction
0.0 0.2 0.4 0.6 0.8 1.0320
340
360
380
400
420
440
460
a
Fox
Gordon-Taylor (k=1)
ΤΤ ΤΤg (
K)
PVP weight fraction
50 75 100 125 150 175 200
a
0
10
20
30
40
60
80
100
PVP (wt %)
en
do
Temperature ( 0C )
0.0 0.2 0.4 0.6 0.8 1.0320
340
360
380
400
420
440
460
b
Fox
Gordon-Taylor (k=0.923)
ΤΤ ΤΤg (
K)
PVP weight fraction
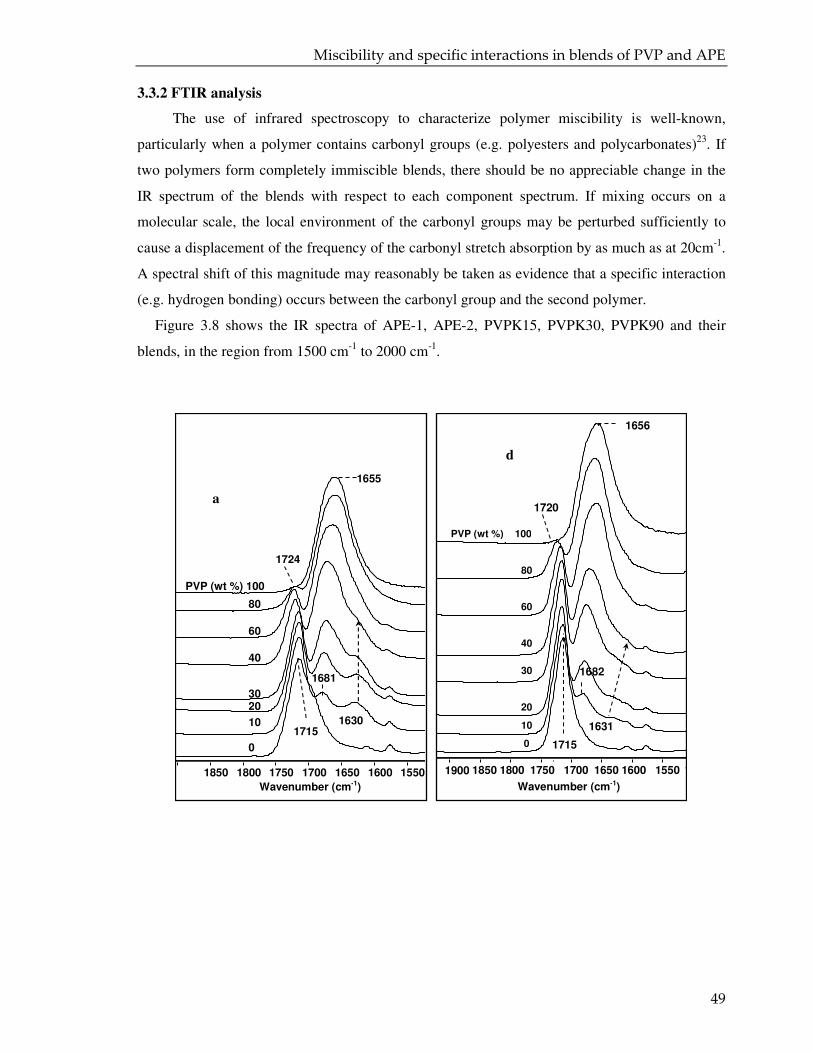
Miscibility and specific interactions in blends of PVP and APE
49
3.3.2 FTIR analysis
The use of infrared spectroscopy to characterize polymer miscibility is well-known,
particularly when a polymer contains carbonyl groups (e.g. polyesters and polycarbonates)23. If
two polymers form completely immiscible blends, there should be no appreciable change in the
IR spectrum of the blends with respect to each component spectrum. If mixing occurs on a
molecular scale, the local environment of the carbonyl groups may be perturbed sufficiently to
cause a displacement of the frequency of the carbonyl stretch absorption by as much as at 20cm-1.
A spectral shift of this magnitude may reasonably be taken as evidence that a specific interaction
(e.g. hydrogen bonding) occurs between the carbonyl group and the second polymer.
Figure 3.8 shows the IR spectra of APE-1, APE-2, PVPK15, PVPK30, PVPK90 and their
blends, in the region from 1500 cm-1 to 2000 cm-1.
PVP (wt %) 100
1720
d
80
1656
1900 1850 1800 1750 1700 1650 1600
Wavenumber (cm-1)
1715
1631
60
40
30
20
10
0
1550 15
1682
PVP (wt %) 100
80
60
1724
1850 1800 1750 1700 1650 1600 1550
Wavenumber (cm-1)
1655
40
30
10
0
20
1715
1681
1630
a
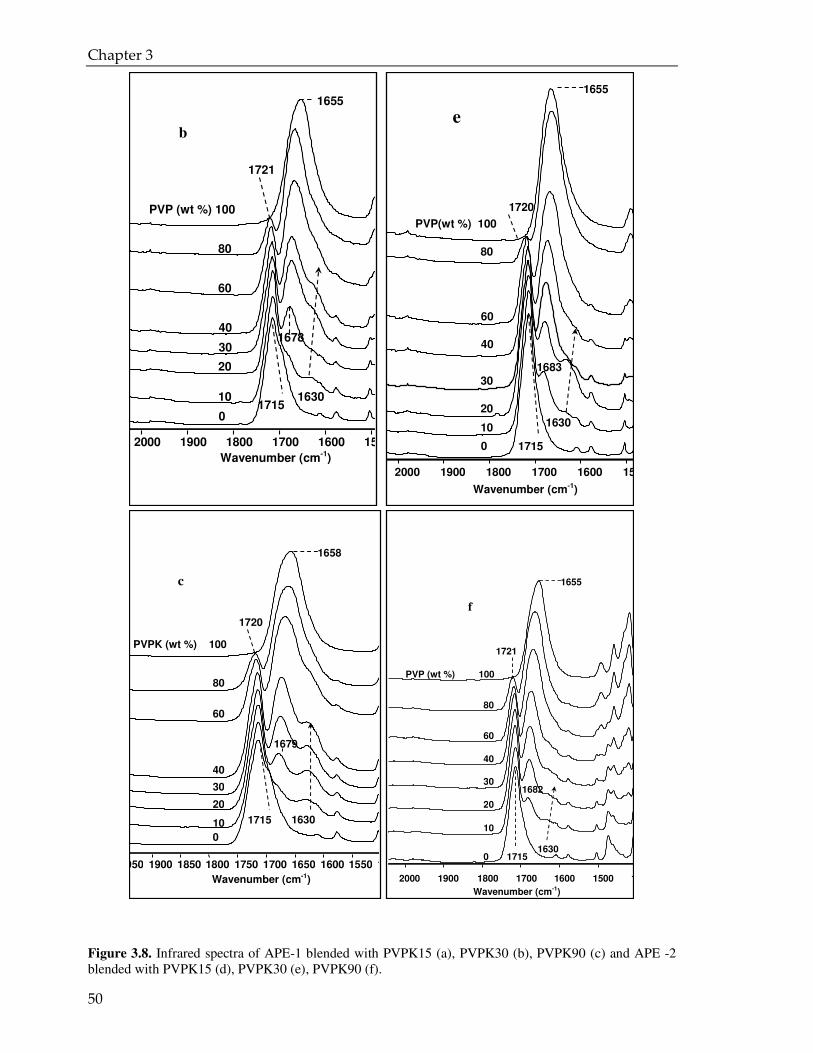
Chapter 3
50
Figure 3.8. Infrared spectra of APE-1 blended with PVPK15 (a), PVPK30 (b), PVPK90 (c) and APE -2 blended with PVPK15 (d), PVPK30 (e), PVPK90 (f).
2000 1900 1800 1700 1600 1500
Wavenumber (cm-1)
60
80
40
30
10
0
20
1715
1678
1630
PVP (wt %) 100
1721
1655
b
Wavenumber (cm-1)
2000 1900 1800 1700 1600 1500
10
0
20
1715
1630
1655
e
1720
80
PVP(wt %) 100
60
40
30
1683
1950 1900 1850 1800 1750 1700 1650 1600 1550 1500
Wavenumber (cm-1)
40
20
10
0
30
1715 1630
1658
PVPK (wt %) 100
80
60
1720
c
1679
Wavenumber (cm-1)
2000 1900 1800 1700 1600 1500 1400
60
40
20
10
0 1715 1630
1682 30
1655
1721
PVP (wt %) 100
80
f
Miscibility and specific interactions in blends of PVP and APE
51
The spectra of the pure PVPs show a band at about 1656 cm-1 which is assigned to the C=O
stretching vibrations of the amide group. The fact that this band is significantly broadened could
be indicative of strong intermolecular and intramolecular interactions between the amide groups
of the PVP30. Upon adding the carboxyl acid functional polyesters, this band shifts to higher
frequencies by about 25 cm-1 (blue shift). The blue shift cannot be attributed to the formation of
hydrogen bonds as this would decrease the stretching vibration of the carbonyl, giving a shift to
lower frequency (red shift). A blue shift of the carbonyl of the amide group of the PVP was
previously observed in blends of PVP with polyvinylchloride15 (PVC) and DL-polylactide18
(PLC). For the PVP/PVC blend, it was suggested that dipole-dipole interaction between the
amide C=O of the PVP and the C-Cl bond of the PVC was the major reason for the observed
shift. However, the authors concluded that the presence of hydrogen bonds between the carbonyls
of the PVP and the α-hydrogens of the PVC, was to weak to be visible.
For the PVP/PLC blends, these authors attributed the blue shift of the PVP carbonyl to the
elimination of strong intermolecular and intramolecular interactions in PVP, upon mixing with
PLC. They concluded that dipole-dipole interactions between the C=O of the PVP and the C=O
of the PLC were not present as the wavenumber of the latter group did not show any shift upon
blending with PVP. In contrast, we observed that the carbonyl stretching band at 1715 cm-1 of the
pure polyester resins shifts to higher frequencies upon increasing the amount of PVP from 10 to
90 wt %. This blue shift (~ 5 cm-1) is much smaller than the blue shift of the carbonyl of the pure
PVP (~ 25 cm-1). It appears that in the pure PVP as well as in the pure resin, dipole-dipole
interactions between the carbonyls of PVP macromolecules and between the carbonyls of the
resin macromolecules exist. Upon blending the two polymers together, part of these specific
interactions are broken, but new interactions appear between the carbonyls of PVP chain and the
polyester resin chain. These new interactions are also dipole-dipole interactions and, therefore,
will have a strength similar to the corresponding interactions in the pure polymer. This
interpretation is in agreement with the Tg versus composition behavior. Indeed, the good fitting of
the experimental data with the Fox and Gordon-Taylor (k = 1) equations shows that the
interactions which are formed between the PVPs and the APEs are of similar strength to the
interactions existing between macromolecules of the pure polymers.
The IR spectra of all the blends show a new band at about 1630 cm-1, as a shoulder to the normal
C=O band of pure PVP. This band is very broad and becomes clearly visible at the lowest content
of PVP. Moreover, the intensity of this shoulder is approximately constant between 40 wt % and
10 wt % PVP.
Chapter 3
52
A possible explanation for the appearance of this shoulder is the formation of H-bonds
between the carbonyls of the PVP and the acid end-groups of the carboxylic acid functional
polyesters. As noted before, the occurrence of H-bonding between the carbonyl of the PVP and a
hydrogen donor group (i.e. OH or COOH) causes a shift of the carbonyl stretching band to lower
frequencies. In blends of PVP with polymers which have a repeating unit containing a hydrogen
donor like OH (e.g. polyvinylphenol, PVPh), Moskala et al. found a clear shoulder on top of the
amide carbonyl band due to the presence of both “free” and H-bonded carbonyls8. They showed
that the intensity of the stretching band of the H-bonded carbonyl increases with increasing
amount of PVPh.
In our case, the broad band at 1630 cm-1 has a low intensity which remains constant by
increasing the amount of APE from 10 wt % to 40 wt %. This result can be explained if we
consider that the acid groups of the APE resins, which can interact via H-bonding with the
carbonyls of the PVP, are end-groups. If we calculate the number of acid groups of the resin and
the number of carbonyl groups of PVP of a blend containing 10 wt % of the latter, it becomes
clear that the number of proton acceptor groups is about 100 times higher than the number of
proton donor groups. Consequently, only a small amount of carbonyl groups of PVP can form H-
bonds with the acid end-groups of the APE. It is clear that the number of acid end-groups is
already saturated at the lowest content of PVP. Therefore, the intensity of the H-bonded carbonyl
stretching is very low and does not rise upon increasing the amount of PVP. This broad band at
1630 cm-1 can no longer be discerned from the main carbonyl band in the mixture with the
highest content of PVP (80 wt %).
In order to confirm that the broad band at 1630 cm-1 is due to the stretching of the PVP
carbonyl groups which are H-bonded to the acid end-groups of the resins, we measured the IR
spectra of the blend of PNI and PVPK30 over a range of temperature. It is known that the number
of hydrogen bonds decrease with increasing temperature, due to prevailing entropic
contributions31. For example, He et al32 reported that the fraction of carbonyl groups associated
through H-bonding, in blends of poly(e-caprolactone) (PLC) and 4,4'-thiophenol (TDP),
decreases on increasing the temperature. On the basis of IR spectra of the blends between 26 °C
and 160 °C, these authors clearly showed that the stretching of the carbonyl of PLC, which is H-
bonded, decreases in intensity and shifts to higher frequencies with an increase in temperature.
Figure 3.9 shows the IR spectra in the region 1600-1800 cm-1 of pure PNI and its blends with
10 wt %, 20 wt % and 30 wt % of PVPK30. The spectra were recorded at different temperatures.
For each composition, spectra are shown at 50 °C, 70 °C, 90 °C, 110 °C, 130 °C, 150 °C and 170
°C. For all the blends containing PVP, the intensity of the broad band at about 1630 cm-1
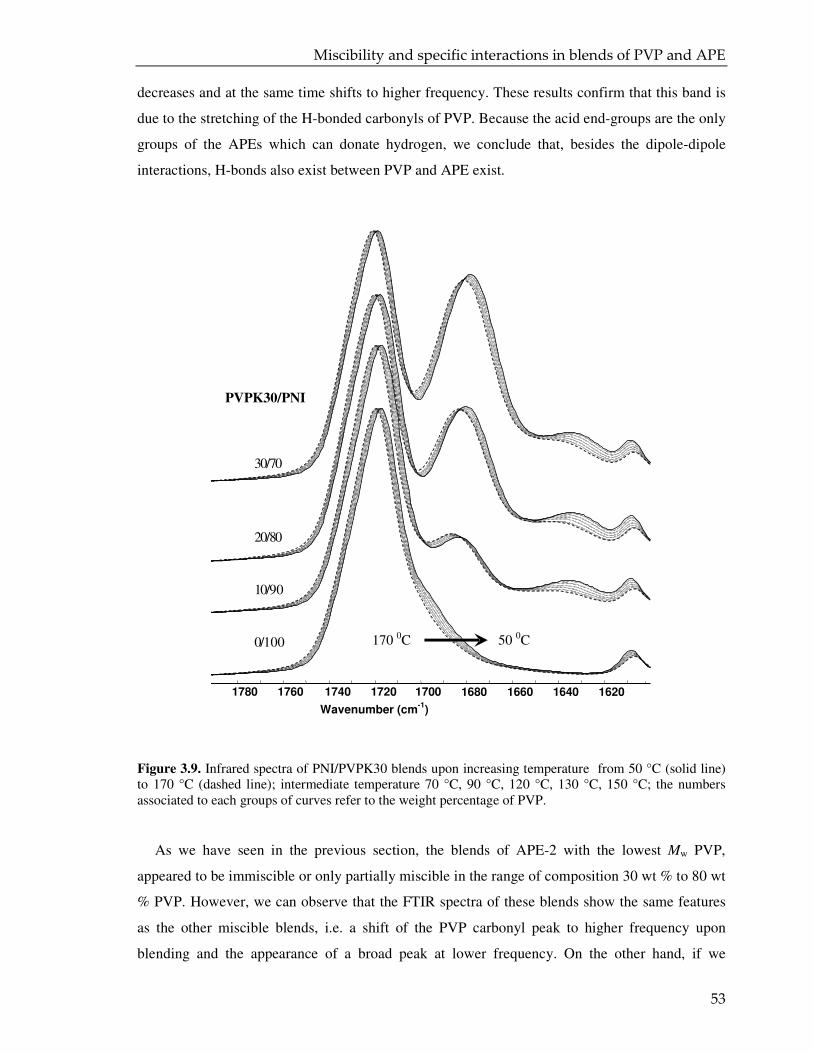
Miscibility and specific interactions in blends of PVP and APE
53
decreases and at the same time shifts to higher frequency. These results confirm that this band is
due to the stretching of the H-bonded carbonyls of PVP. Because the acid end-groups are the only
groups of the APEs which can donate hydrogen, we conclude that, besides the dipole-dipole
interactions, H-bonds also exist between PVP and APE exist.
Figure 3.9. Infrared spectra of PNI/PVPK30 blends upon increasing temperature from 50 °C (solid line) to 170 °C (dashed line); intermediate temperature 70 °C, 90 °C, 120 °C, 130 °C, 150 °C; the numbers associated to each groups of curves refer to the weight percentage of PVP.
As we have seen in the previous section, the blends of APE-2 with the lowest Mw PVP,
appeared to be immiscible or only partially miscible in the range of composition 30 wt % to 80 wt
% PVP. However, we can observe that the FTIR spectra of these blends show the same features
as the other miscible blends, i.e. a shift of the PVP carbonyl peak to higher frequency upon
blending and the appearance of a broad peak at lower frequency. On the other hand, if we
1780
1760 1740 1720 1700
1680 1660
1640 1620
170 0 C 50 0 C
PVPK30/PNI
0 /100
1 0 /90
2 0 /8 0
3 0 /7 0
Wavenumber (cm-1
)
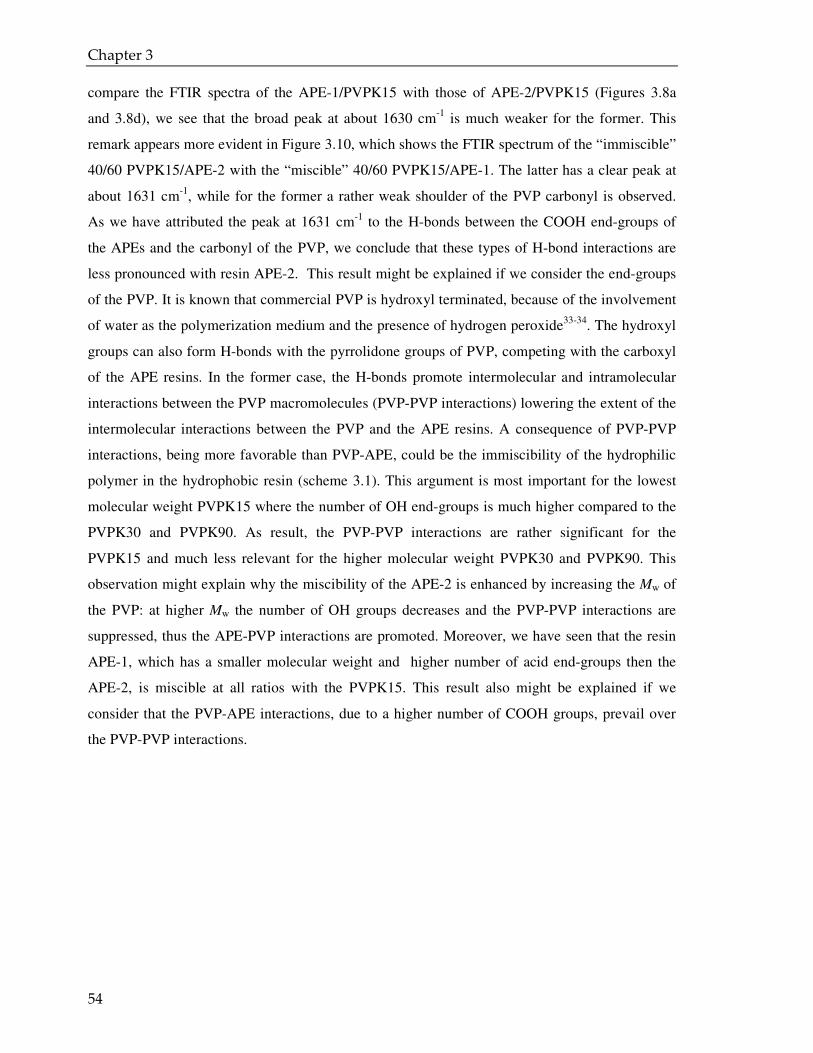
Chapter 3
54
compare the FTIR spectra of the APE-1/PVPK15 with those of APE-2/PVPK15 (Figures 3.8a
and 3.8d), we see that the broad peak at about 1630 cm-1 is much weaker for the former. This
remark appears more evident in Figure 3.10, which shows the FTIR spectrum of the “immiscible”
40/60 PVPK15/APE-2 with the “miscible” 40/60 PVPK15/APE-1. The latter has a clear peak at
about 1631 cm-1, while for the former a rather weak shoulder of the PVP carbonyl is observed.
As we have attributed the peak at 1631 cm-1 to the H-bonds between the COOH end-groups of
the APEs and the carbonyl of the PVP, we conclude that these types of H-bond interactions are
less pronounced with resin APE-2. This result might be explained if we consider the end-groups
of the PVP. It is known that commercial PVP is hydroxyl terminated, because of the involvement
of water as the polymerization medium and the presence of hydrogen peroxide33-34. The hydroxyl
groups can also form H-bonds with the pyrrolidone groups of PVP, competing with the carboxyl
of the APE resins. In the former case, the H-bonds promote intermolecular and intramolecular
interactions between the PVP macromolecules (PVP-PVP interactions) lowering the extent of the
intermolecular interactions between the PVP and the APE resins. A consequence of PVP-PVP
interactions, being more favorable than PVP-APE, could be the immiscibility of the hydrophilic
polymer in the hydrophobic resin (scheme 3.1). This argument is most important for the lowest
molecular weight PVPK15 where the number of OH end-groups is much higher compared to the
PVPK30 and PVPK90. As result, the PVP-PVP interactions are rather significant for the
PVPK15 and much less relevant for the higher molecular weight PVPK30 and PVPK90. This
observation might explain why the miscibility of the APE-2 is enhanced by increasing the Mw of
the PVP: at higher Mw the number of OH groups decreases and the PVP-PVP interactions are
suppressed, thus the APE-PVP interactions are promoted. Moreover, we have seen that the resin
APE-1, which has a smaller molecular weight and higher number of acid end-groups then the
APE-2, is miscible at all ratios with the PVPK15. This result also might be explained if we
consider that the PVP-APE interactions, due to a higher number of COOH groups, prevail over
the PVP-PVP interactions.
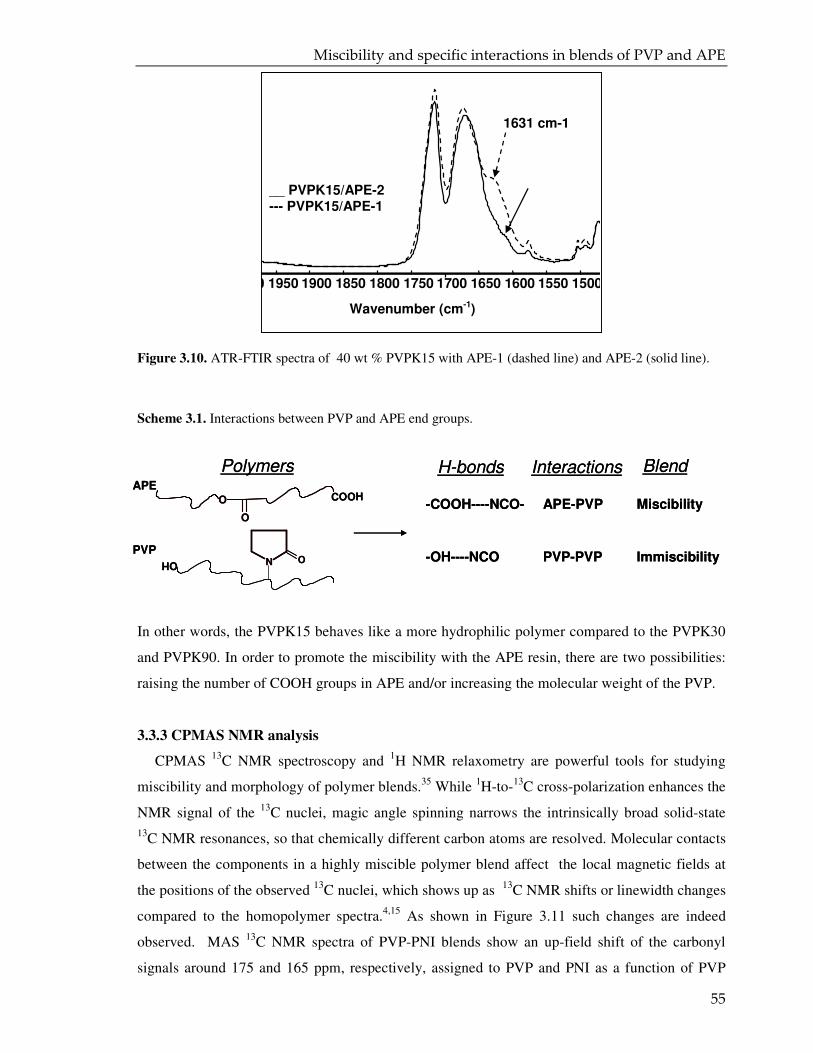
Miscibility and specific interactions in blends of PVP and APE
55
Figure 3.10. ATR-FTIR spectra of 40 wt % PVPK15 with APE-1 (dashed line) and APE-2 (solid line).
Scheme 3.1. Interactions between PVP and APE end groups.
In other words, the PVPK15 behaves like a more hydrophilic polymer compared to the PVPK30
and PVPK90. In order to promote the miscibility with the APE resin, there are two possibilities:
raising the number of COOH groups in APE and/or increasing the molecular weight of the PVP.
3.3.3 CPMAS NMR analysis
CPMAS 13C NMR spectroscopy and 1H NMR relaxometry are powerful tools for studying
miscibility and morphology of polymer blends.35 While 1H-to-13C cross-polarization enhances the
NMR signal of the 13C nuclei, magic angle spinning narrows the intrinsically broad solid-state 13C NMR resonances, so that chemically different carbon atoms are resolved. Molecular contacts
between the components in a highly miscible polymer blend affect the local magnetic fields at
the positions of the observed 13C nuclei, which shows up as 13C NMR shifts or linewidth changes
compared to the homopolymer spectra.4,15 As shown in Figure 3.11 such changes are indeed
observed. MAS 13C NMR spectra of PVP-PNI blends show an up-field shift of the carbonyl
signals around 175 and 165 ppm, respectively, assigned to PVP and PNI as a function of PVP
Wavenumber (cm-1)
2000 1950 1900 1850 1800 1750 1700 1650 1600 1550 1500
__ PVPK15/APE-2 --- PVPK15/APE-1
1631 cm-1
-COOH----NCO-
-OH----NCO
Polymers H-bonds Blend
Miscibility
Immiscibility
COOH
N OOH
O
O
APE
PVP
Interactions
APE-PVP
PVP-PVP
-COOH----NCO-
-OH----NCO
Polymers H-bonds Blend
Miscibility
Immiscibility
COOH
N OOH
O
O
APE
PVP
Interactions
APE-PVP
PVP-PVP
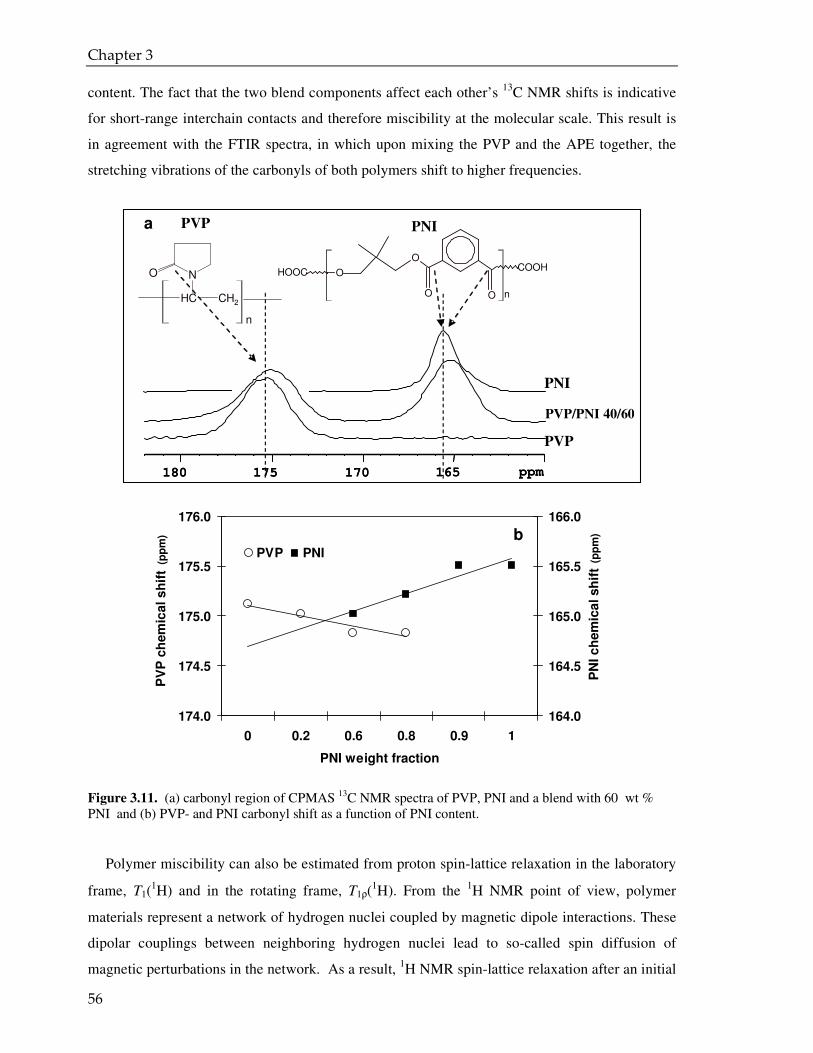
Chapter 3
56
content. The fact that the two blend components affect each other’s 13C NMR shifts is indicative
for short-range interchain contacts and therefore miscibility at the molecular scale. This result is
in agreement with the FTIR spectra, in which upon mixing the PVP and the APE together, the
stretching vibrations of the carbonyls of both polymers shift to higher frequencies.
Figure 3.11. (a) carbonyl region of CPMAS 13C NMR spectra of PVP, PNI and a blend with 60 wt % PNI and (b) PVP- and PNI carbonyl shift as a function of PNI content.
Polymer miscibility can also be estimated from proton spin-lattice relaxation in the laboratory
frame, T1(1H) and in the rotating frame, T1ρ(
1H). From the 1H NMR point of view, polymer
materials represent a network of hydrogen nuclei coupled by magnetic dipole interactions. These
dipolar couplings between neighboring hydrogen nuclei lead to so-called spin diffusion of
magnetic perturbations in the network. As a result, 1H NMR spin-lattice relaxation after an initial
165 170 175 180 ppm 165 170 175 180 ppm
O O
O O
n
COOH HOOC
PVP
PVP/PNI 40/60
PNI
PVP PNI
N
HC CH 2
O
n
a
174.0
174.5
175.0
175.5
176.0
0 0.2 0.6 0.8 0.9 1
PNI weight fraction
PV
P c
hem
ical s
hif
t (p
pm
)
164.0
164.5
165.0
165.5
166.0
PN
I c
hem
ica
l sh
ift
(pp
m)
PVP PNI
b
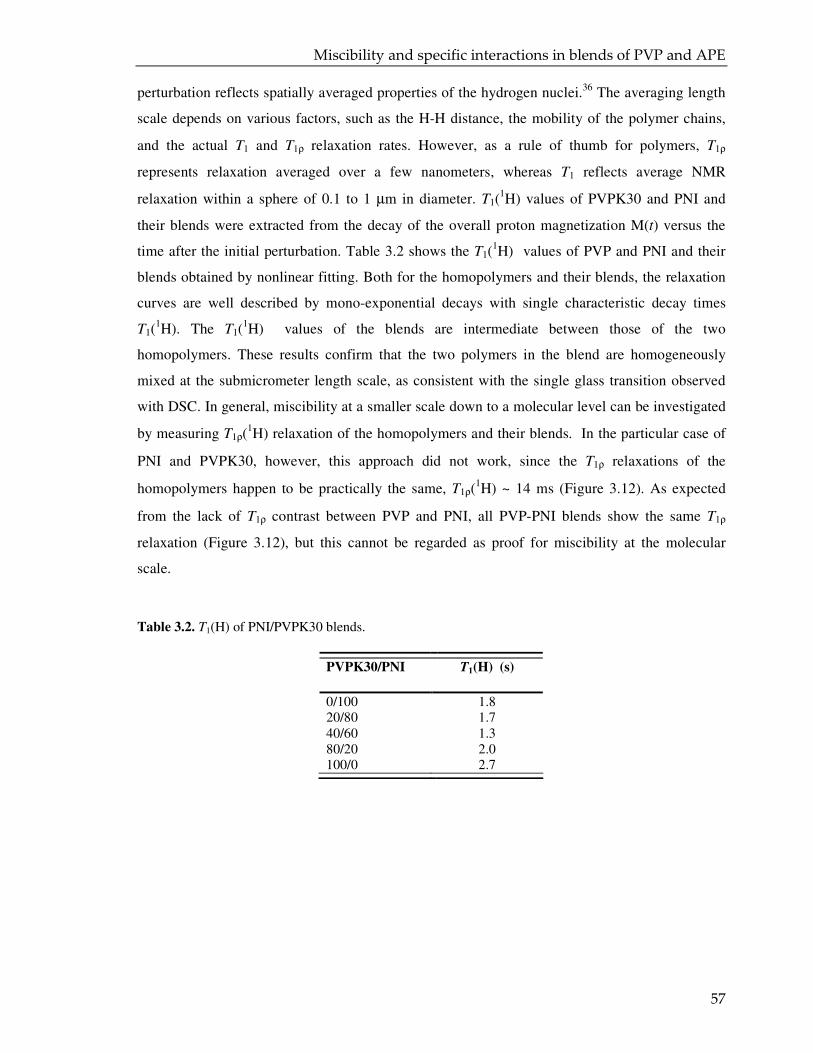
Miscibility and specific interactions in blends of PVP and APE
57
perturbation reflects spatially averaged properties of the hydrogen nuclei.36 The averaging length
scale depends on various factors, such as the H-H distance, the mobility of the polymer chains,
and the actual T1 and T1ρ relaxation rates. However, as a rule of thumb for polymers, T1ρ
represents relaxation averaged over a few nanometers, whereas T1 reflects average NMR
relaxation within a sphere of 0.1 to 1 µm in diameter. T1(1H) values of PVPK30 and PNI and
their blends were extracted from the decay of the overall proton magnetization M(t) versus the
time after the initial perturbation. Table 3.2 shows the T1(1H) values of PVP and PNI and their
blends obtained by nonlinear fitting. Both for the homopolymers and their blends, the relaxation
curves are well described by mono-exponential decays with single characteristic decay times
T1(1H). The T1(
1H) values of the blends are intermediate between those of the two
homopolymers. These results confirm that the two polymers in the blend are homogeneously
mixed at the submicrometer length scale, as consistent with the single glass transition observed
with DSC. In general, miscibility at a smaller scale down to a molecular level can be investigated
by measuring T1ρ(1H) relaxation of the homopolymers and their blends. In the particular case of
PNI and PVPK30, however, this approach did not work, since the T1ρ relaxations of the
homopolymers happen to be practically the same, T1ρ(1H) ~ 14 ms (Figure 3.12). As expected
from the lack of T1ρ contrast between PVP and PNI, all PVP-PNI blends show the same T1ρ
relaxation (Figure 3.12), but this cannot be regarded as proof for miscibility at the molecular
scale.
Table 3.2. T1(H) of PNI/PVPK30 blends.
PVPK30/PNI T1(H) (s)
0/100 1.8 20/80 1.7 40/60 1.3 80/20 2.0 100/0 2.7
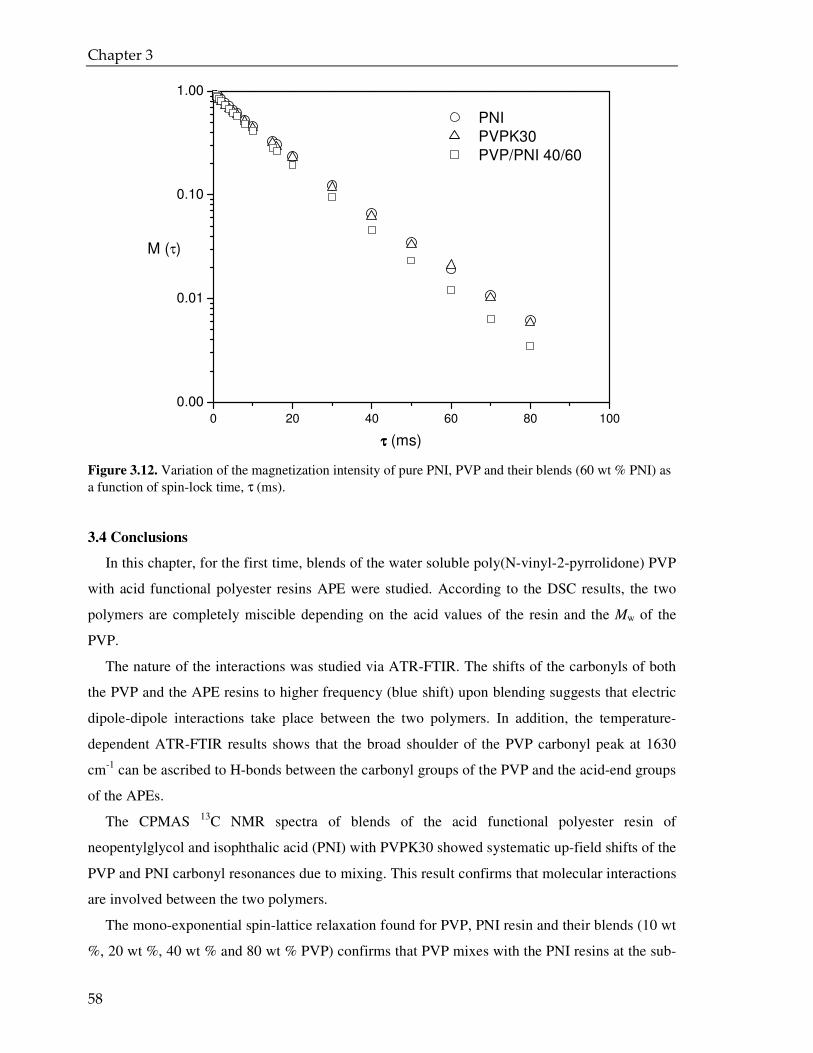
Chapter 3
58
Figure 3.12. Variation of the magnetization intensity of pure PNI, PVP and their blends (60 wt % PNI) as a function of spin-lock time, τ (ms).
3.4 Conclusions
In this chapter, for the first time, blends of the water soluble poly(N-vinyl-2-pyrrolidone) PVP
with acid functional polyester resins APE were studied. According to the DSC results, the two
polymers are completely miscible depending on the acid values of the resin and the Mw of the
PVP.
The nature of the interactions was studied via ATR-FTIR. The shifts of the carbonyls of both
the PVP and the APE resins to higher frequency (blue shift) upon blending suggests that electric
dipole-dipole interactions take place between the two polymers. In addition, the temperature-
dependent ATR-FTIR results shows that the broad shoulder of the PVP carbonyl peak at 1630
cm-1 can be ascribed to H-bonds between the carbonyl groups of the PVP and the acid-end groups
of the APEs.
The CPMAS 13C NMR spectra of blends of the acid functional polyester resin of
neopentylglycol and isophthalic acid (PNI) with PVPK30 showed systematic up-field shifts of the
PVP and PNI carbonyl resonances due to mixing. This result confirms that molecular interactions
are involved between the two polymers.
The mono-exponential spin-lattice relaxation found for PVP, PNI resin and their blends (10 wt
%, 20 wt %, 40 wt % and 80 wt % PVP) confirms that PVP mixes with the PNI resins at the sub-
0 20 40 60 80 100
0.00
0.01
0.10
1.00
PNI
PVPK30
PVP/PNI 40/60
M (τ)
ττττ (ms)
Miscibility and specific interactions in blends of PVP and APE
59
micron scale as consistent with the single glass-transition observed with DSC. Due to the
coincidental lack of T1ρ-relaxation contrast between the homopolymers PVP and PNI, it was
impossible to obtain information about the miscibility at the nanometer length scale from proton
T1ρ relaxometry.
Chapter 3
60
3.5 References (1) Olabisi O.;Robeson L.M. Polymer-Polymer Miscibility, Academic Press, New York, 1979.
(2) Coleman, M. M.; Serman, C. J.; Bhagwagar, D. E.; Painter, P. C. Polymer 1990, 31, 7, 1187-1203.
(3) Nishio, Y.; Haratani, T.; Takahashi, T. Journal of Polymer Science Part B-Polymer Physics 1990, 28, 3, 355-376.
(4) Zhang, X. Q.; Takegoshi, K.; Hikichi, K. Polymer 1992, 33, 4, 712-717.
(5) Ping, Z. H.; Nguyen, Q. T.; Neel, J. Makromolekulare Chemie-Macromolecular Chemistry and
Physics 1990, 191, 1, 185-198.
(6) Feng, H. Q.; Feng, Z. L.; Shen, L. F. Polymer 1993, 34, 12, 2516-2519.
(7) Cassu, S. N.; Felisberti, M. I. Polymer 1997, 38, 15, 3907-3911.
(8) Moskala, E. J.; Varnell, D. F.; Coleman, M. M. Polymer 1985, 26, 2, 228-234.
(9) Eguiazabal, J. I.; Iruin, J. J.; Cortazar, M.; Guzman, G. M. Makromolekulare Chemie-Macromolecular
Chemistry and Physics 1984, 185, 8, 1761-1766.
(10) Deilarduya, A. M.; Iruin, J. J.; Fernandezberridi, M. J. Macromolecules 1995, 28, 10, 3707-3712.
(11) Masson, J. F.; Manley, R. S. Macromolecules 1991, 24, 25, 6670-6679.
(12) Sionkowska, A. European Polymer Journal 2003, 39, 11, 2135-2140.
(13) Guo, Q. P. Makromolekulare Chemie-Rapid Communications 1990, 11, 6, 279-283.
(14) Dong, J.; Fredericks, P. M.; George, G. A. Polymer Degradation and Stability 1997, 58, 1-2, 159-169.
(15) Zheng, S. X.; Guo, Q. P.; Mi, Y. L. Journal of Polymer Science Part B-Polymer Physics 1999, 37, 17, 2412-2419.
(16) Neo, M. K.; Goh, S. H. Polymer Communications 1991, 32, 7, 200-201.
(17) Low, S. M.; Goh, S. H.; Lee, S. Y.; Neo, M. K. Polymer Bulletin 1994, 32, 2, 187-192.
(18) Zhang, G. B.; Zhang, J. M.; Zhou, X. S.; Shen, D. Y. Journal of Applied Polymer Science 2003, 88, 4, 973-979.
(19) Misev T.A. Powder Coatings: Chemistry and Technology, Wiley, New York, 1991.
(20) Senatore D.; ten Cate A.T.; Laven J.; van Benthem R.A.T.M.; de With G. Abstracts of Papers of the
American Chemical Society 2007, 97, 912-913.
(21) Höhne G., H. W. F. H. J. Differential Scanning Calorimetry: a guide for practitioners, Springer, 1996.
(22) Koleske, J. V. Polymer Blends, Academic, New York, 1978.
(23) Garton, A. Infrared spectroscopy of polymer blends, composites and surfaces, Carl Hanser Verlag, Munich, 1992.
Miscibility and specific interactions in blends of PVP and APE
61
(24) Kaplan, D. S. Journal of Applied Polymer Science 1976, 20, 10, 2615-2629.
(25) Hale A.; Bair H.E. in Thermal characterization of polymeric materials, 2nd, Turi E., 1997, 745.
(26) Fox T.G. Bull.Amer.Phys.Soc. 1956, 1, 2, 123.
(27) Gordon, M.; Taylor, J. S. Journal of Applied Chemistry 1952, 2, 9, 493-500.
(28) Macknight W.J.; Karasz F.E.; Fried J.R. Polymer blends, Newman Ed., Acad.press, New York, 1978.
(29) Kyu, T.; Ko, C. C.; Lim, D. S.; Smith, S. D.; Noda, I. Journal of Polymer Science Part B-Polymer
Physics 1993, 31, 11, 1641-1648.
(30) Rothschi, W. G. Journal of the American Chemical Society 1972, 94, 25, 8676.
(31) He, Y.; Zhu, B.; Inoue, Y. Progress in Polymer Science 2004, 29, 10, 1021-1051.
(32) He, Y.; Asakawa, N.; Inoue, Y. Macromolecular Chemistry and Physics 2001, 202, 7, 1035-1043.
(33) Washio, I.; Xiong, Y. J.; Yin, Y. D.; Xia, Y. N. Advanced Materials 2006, 18, 13, 1745.
(34) Raith, K.; Kuhn, A. V.; Rosche, F.; Wolf, R.; Neubert, R. H. H. Pharmaceutical Research 2002, 19, 4, 556-560.
(35) McBrierty, V. J.; Douglass, D. C. Macromolecular Reviews Part D-Journal of Polymer Science 1981,
16, 295-366.
(36) Schimdt-Rohr K.;Spiess H.W. Multidimensional solid-state NMR and polymers, Academic Press, London, 1994.

Chapter 3
62


4 Microencapsulated cross-linker for
powder coatings: towards low
temperature curing
63
A liquid cross-linker for powder coatings, epoxidized linseed oil, was encapsulated in poly(N-vinyl)pyrrolidone (PVP) microparticles by means of
spray-drying. These microparticles had an average particle size of about 16 µm and the cross-linker was embedded in the polymer matrix as droplets of size
below 0.5 µm. The amount of encapsulated cross-linker was ~ 20 wt %, while the encapsulation efficiency was about 85%. The spray dried powder was used as a cross-linker of an acid functional polyester in a powder coating formulation. The latter was compared with two other formulations based on the same acid functional polyester, but containing free cross-linker. One of these formulations contains the same amount of PVP (i.e. as an additive) as the coating formulation with the encapsulated ELO. The curing process of the powder coating formulations was studied by differential scanning calorimeter analysis and dynamic mechanical rheological testing. The advantages of the encapsulated cross-linker concept were demonstrated in both storage and curing.
Chapter 4
64
4.1 Introduction
More and more severe environmental regulations have provided an impetus for developing
alternatives for solvent-borne paints. Among these, powder coatings are known to be
environmentally friendly because they are 100% solvent free and their volatile organic emissions
are virtually zero. Powder coating formulations essentially contain a resin, a cross-linker,
pigments and several additives. These ingredients are melted, typically at 90-110 °C, and
homogeneously mixed by means of an extruder. After extrusion, the melt is cooled at ambient
temperature, ground and sieved. After this, the powder coating is ready to be applied by spraying
electrostatically onto the object to be coated. The process is completed when the applied powder
melts and cures. This is done by heating the object to a temperature usually between 150 °C and
200 °C1.
The current trend in powder coatings is to use formulations which cure at temperatures lower
than 140 °C. Such powder coatings can be used on heat-sensitive substrates like wood, plastic
and MDF (medium density fiber board)2. In order to enable low temperature curing, a sufficiently
high reaction rate at a temperature lower than 140 °C is required. However, as the kinetics of
curing of a thermosetting powder coating follows a classical Arrhenius behavior, a higher curing
rate at lower temperature also implies a less chemically stable system during melt extrusion and
upon storage.
Apart from chemical reactivity, also physical storage stability is an important aspect of the
powder coatings. Powder coatings are based on both thermoplastic and thermosetting resins. The
thermosetting polyester resins are based on carboxyl or hydroxyl functional polyesters3. A widely
used system which offers good exterior durability is based on acid-functional polyester (APE)
and triglycidyl isocyanurate (TGIC). Unfortunately, the TGIC has been shown to be highly toxic
and carcinogenic. Given the need to find an environmentally friendly and less toxic alternative
cross-linker, the use of aliphatic oxirane compounds have been explored4. These compounds are
obtained by epoxidizing vegetable oils, e.g. olive and linseed oils. The epoxidized linseed oil
(ELO) and the other aliphatic oxirane are liquid compounds, which can act as plasticizers and
lower the glass transition temperature (Tg) of the resin. The plasticizing effect might compromise
the physical (and, hence, possible also chemical stability) of the powder coatings upon storage.
In this study, we attempt to prove that the microencapsulation of a reactive component of the
powder coating formulation (i.e. the cross-linker) can improve the chemical and physical stability
of the powder. At same time, upon release of the cross-linker the cure reaction can proceed at the
desired temperature.
Microencapsulated cross-linker for powder coatings: towards low temperature curing
65
In chapter 2, we illustrated the microencapsulation of the ELO, by means of spray-drying and
showed that the microencapsulation converts the liquid ELO into a solid. Microencapsulation is a
process in which liquid droplets, particles or gas bubbles are enclosed in a continuous film of
polymer (the encapsulant). Spray drying is one of the most commonly used encapsulation
techniques because it can be environmentally friendly, straightforward and relatively
inexpensive5-6. We used poly(N-vinyl-2-pyrrolidone) (PVP) as encapsulant because it is a water
soluble polymer with good film forming and emulsifying properties. In addition, PVP has a Tg
which varies from 54 °C to 175 °C depending on molecular weight and the amount of absorbed
water7. The Tg of the encapsulant is a key factor of this study: it should be high enough to
guarantee good protection upon storage and melt extrusion, but low enough to allow the release
of the cross-linker upon curing.
In the present chapter, we describe the preparation of the microparticles containing the ELO,
using the optimum conditions as found in chapter 2. We characterize the microparticles in terms
of the amount of encapsulated ELO, their particle size and morphology. Finally, we show the
envisaged benefits of the use of the encapsulated ELO in a powder coating formulation by
dynamic mechanical rheological testing and differential scanning calorimetry.
4.2 Experimental
Materials. Epoxidized linseed oil used in the present study has a weight per equivalent (weight in
g of sample containing one mol of epoxy group) of 167.5 and was provided by DSM Resins BV,
Zwolle. Poly (N-vinyl-2-pyrrolidone) (Povidone K30) with Mw of about 40000 g/mol and sodium
dodecyl sulphate (SDS) were obtained from Aldrich. Carboxyl-functionalized polyester (APE),
with an acid number of 24 mg (KOH)/g (resin), alkali-metal catalyst (Uranox P7121, polyester
based masterbatch with 20% active ingredient), degassing agent (benzoin), flow agent (Resiflow
PV5) and anti-oxidants (a mixture of a hindered amine and a phenolic antioxidant) were also
obtained from DSM Resins BV.
Preparation of the encapsulated cross-linker. In this chapter, we report the microencapsulation
of the ELO via spray drying using the optimized conditions resulting from the design of
experiment method described in chapter 2. The carrier solution containing PVP was prepared by
dissolving 60 g of PVP in 120 g distilled water containing 1 wt % of SDS. Once the polymer was
dissolved, 20 g of ELO was added to the solution and the dispersion was stirred, by means of a
magnetic bar for about 2 hours. The total amount of additives (PVP, ELO and SDS) to water was
40 wt % and the ELO to PVP ratio was 1:3. After that, the pre-emulsion was homogenized using
a sonicator (Sonic VCX, 750 W, 29 Hz) equipped with a 13 mm tip high intensity horn. The
Chapter 4
66
ultrasound horn was immersed at a depth of about 1 cm and placed centrally in 200 g pre-
emulsion in a 5 cm diameter glass bottle. Emulsions were prepared at a power amplitude of the
sonicator of 80 %, which results in a input in the emulsion between 70-80 W. the time of
sonification was 90 seconds.
Then, the fine emulsion was spray-dried using a BÜCHI B290 mini spray-drier. Operational
conditions of the spray-drying were: air inlet temperature of 150 °C, air outlet temperature of 100
°C, feed rate of 10 mL/min, air flow of 40 m3/min and spray-flow of 500 L/h.
Characterization of the spray-dried powder. The ELO droplet size distribution and spray-dried
particle size distribution were measured using a Light Scattering Analyzer (LS Coulter LS230).
This instrument is able to measure a wide particle size range (0.4 µm up to 2000 µm) when
equipped with the Small Volume Module (SVM), as it combines a classical laser light diffraction
with a polarization intensity diffraction scattering cell. To measure the droplet size distribution of
the ELO emulsion a few droplets (2-3 mL) of emulsion were directly poured into the module
containing water as the dispersing medium. In order to measure the particle size distribution, 0.5
mg of spray-dried powder (SDP) was dispersed in 5 mL of 2 wt % solution of Span 80 in n-
heptane. The dispersion was stirred for 1 minute with an ultrasound processor equipped with a
micro-tip horn. A few drops of this dispersion were added into the module which used n-heptane
as the dispersant. In addition, 0.2 g of spray-dried powder was dissolved in 1.8 ml of water by
gently stirring with a magnetic bar. Droplet size distribution of the resulting emulsion
(reconstituted emulsion) was measured also by LS.
The internal and external structures of the spray-dried particles (SDP) were studied via Scanning
Electron Microscopy (SEM Jeol JSM840A). For the study of the outer structures of the
microparticles, the particles were attached to a specimen holder by a double carbon coated tape
and then sputtered with a layer of gold. For studying the inner structure, at first, a double-coated
carbon tape was fixed on the sample holder and covered with a certain amount of microparticles.
Thereafter, a second carbon coated tape was added on the top of the sample. Subsequently, the
upper tape was pulled off fiercely in order to induce a mechanical fracture of some of the
microparticles.
The total amount of ELO (payload), defined as percentage of mass of ELO on total mass of
powder, was evaluated via Differential Scanning Calorimeter (DSC, PE Pyris1). The instrument
was calibrated with indium and lead standards. Samples were placed in 10 µL Al pans and
hermetically sealed to minimize the effect of the water loss and possible PVP decomposition on
the measurement of the ELO and PVP Tgs. Sample weight varied between 5 and 10 mg. Samples
Microencapsulated cross-linker for powder coatings: towards low temperature curing
67
were first cooled down from 30 °C to -110 °C at 20 °C/min, then heated up to -40 °C at 20
°C/min and cooled down again to -110 ºC at 30 °C/min to eliminate an endothermic peak of
crystallization, which complicate the measurement of the Tg of ELO (see Figure 1, chapter 2).
Finally, the sample was heated again up to 100 °C at 20 °C/min and the Tg temperature was
measured as mid-point of the heat capacity transition. The DSC thermogram of the pure ELO
shows a Tg at about -56 °C. Considering that the ELO and the PVP are immiscible, we can
calculate the amount of ELO in the SDP (payload) as8 :
Payload (weight % of ELO in SDP) = ( (SDP)/ (pure)) 100Cp Cp∆ ∆ ×
where the (SDP)Cp∆ is the change in specific heat capacity at Tg for the ELO in the SDP and
(pure)Cp∆ is the change in specific heat capacity at Tg for the pure ELO.
The amount of surface ELO (free ELO) was evaluated by washing 0.5 g of spray-dried powder
( )1w with 20 ml of a diethyl ether/petroleum ether mixture (1:3). This solvent mixture is able to
dissolve the free ELO, but not the PVP polymer and therein encapsulated ELO. The dispersion
was gently stirred for 10 minutes, and then filtered on a paper filter and washed three times with
10 mL of ether solution. The solution was collected in a 70 mL aluminum pan, dried in vacuum
oven at 60 ºC, and weighed ( )2w . Then, the solvent was evaporated in a vacuum oven at 60 ºC for
12 hours. The amount of extracted ELO was calculated as follow:
( )3 2 1Extracted ELO (Free ELO) = / 100w w w− ×
where 3w is the weight of the aluminum pan plus the extracted ELO.
The efficiency of encapsulation was defined as
( )Payload-Free ELO /Payload 100
×
Preparation of the coating powders. Powder coating (PC) formulations were prepared
according to the procedure described by Misev1. All the components of PC formulations were
pre-mixed in a coffee-grinder, and then extruded with a 16 mm twin-extruder (Prism TSE
system) at a temperature of 100 °C and a speed of 100 rpm. Upon exiting the extruder die, the
melt was cooled to room temperature, ground and sieved through a 90 µm sieve.
Characterization of coating powders. Differential Scanning Calorimetry (DSC) (Perkin-Elmer,
Pyris 1) was used to evaluate the storage stability of the powder coating formulations. For each
sample, 20-25 mg of powder was placed in a stainless steel pan and hermetically sealed. These
pans can withstand an internal pressure of 24 atm, thus preventing any evaporation of water or
other volatile compound during the measurement. The pans were stored in an oven at 40 °C for
Chapter 4
68
an overall period of 31 days. After a period of seven days, the samples of the three different
formulations were measured by DSC. Samples were scanned from -30 °C up to 300 °C at 10
°C/min. For an accurate determination of the Tg the samples were first scanned from -30 °C to 90
°C at 10 °C/min, cooled down to -30 °C and finally heated up to 290-300 °C at 10 °C/min.
The variation of the storage (G’) and loss (G”) moduli versus time (time sweep) were measured
isothermally at 90 °C and 140 °C with a Physica, UDS200 rheometer equipped with a plate-plate
geometry and high temperature cell. The isothermal measurements were carried out using plates
with a diameter of 2.5 cm at 1 Hz frequency and 1% strain. The measurement of the complex
viscosity versus the cross-linking reactions was carried out in dynamic mode with a stress-
controlled rheometer (AR-1000N, TA Instruments). Solid opaque discs of ca. 500 µm, obtained
by compression molding (400 bar, 5 minutes), were placed between two aluminium plates of 2
cm diameter. The samples were heated to 90 °C at a heating rate of ca. 60 °C/min, left at 90 °C
for 1 min, thereafter the measurements were started. The complex viscosities were measured at a
constant frequency of 1 Hz (6.28 rad·sec-1) and a strain of 1 % from 90 °C to 250 °C at heating
rate of 2 °C/min (temperature sweep).
4.3 Results and discussions
4.3.1 Characterization of the spray dried particles
The LS analysis shows that the spray dried powder (SDP) has a wide particle size distribution
with an average diameter of 16 µm (Figure 4.1). This Figure also presents the droplet size
distributions of the ELO emulsion before spraying and after it is recovered, by dissolving the
SDP in water. The droplet size distributions of the two ELO/water emulsions are very similar and
have an average droplet size of 0.1 µm. These results indicate that during spray drying, the ELO
droplet size distribution has not been changed.
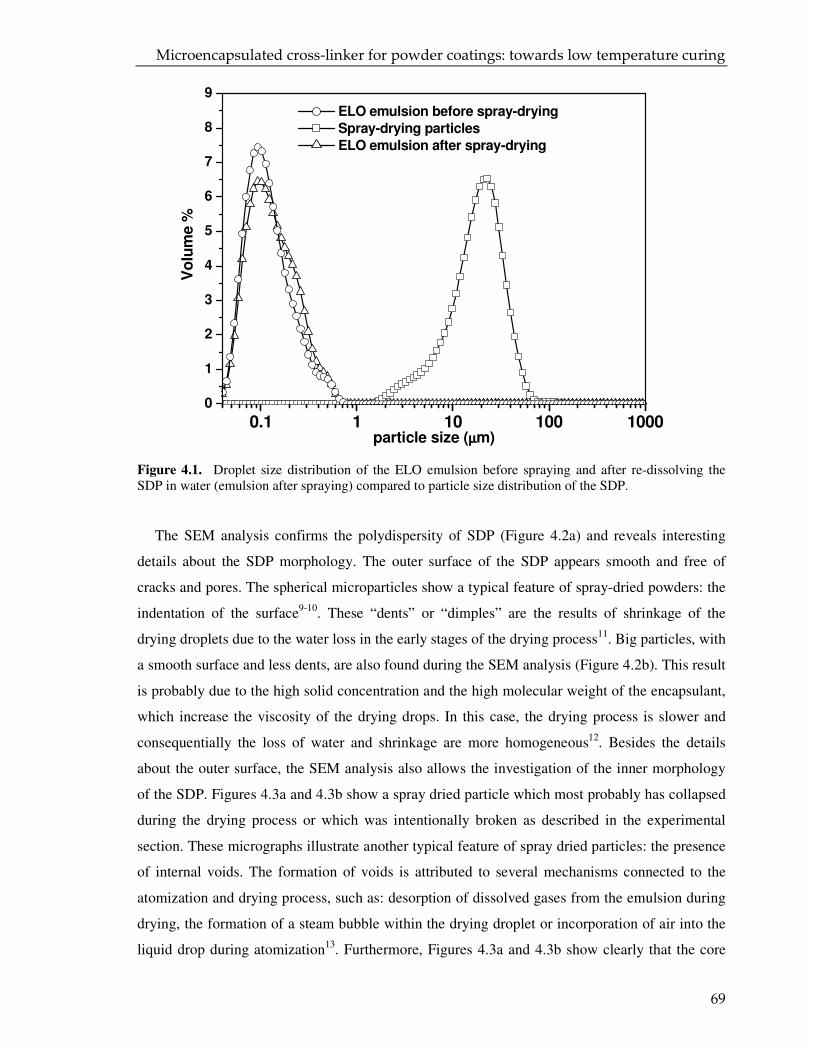
Microencapsulated cross-linker for powder coatings: towards low temperature curing
69
Figure 4.1. Droplet size distribution of the ELO emulsion before spraying and after re-dissolving the SDP in water (emulsion after spraying) compared to particle size distribution of the SDP.
The SEM analysis confirms the polydispersity of SDP (Figure 4.2a) and reveals interesting
details about the SDP morphology. The outer surface of the SDP appears smooth and free of
cracks and pores. The spherical microparticles show a typical feature of spray-dried powders: the
indentation of the surface9-10. These “dents” or “dimples” are the results of shrinkage of the
drying droplets due to the water loss in the early stages of the drying process11. Big particles, with
a smooth surface and less dents, are also found during the SEM analysis (Figure 4.2b). This result
is probably due to the high solid concentration and the high molecular weight of the encapsulant,
which increase the viscosity of the drying drops. In this case, the drying process is slower and
consequentially the loss of water and shrinkage are more homogeneous12. Besides the details
about the outer surface, the SEM analysis also allows the investigation of the inner morphology
of the SDP. Figures 4.3a and 4.3b show a spray dried particle which most probably has collapsed
during the drying process or which was intentionally broken as described in the experimental
section. These micrographs illustrate another typical feature of spray dried particles: the presence
of internal voids. The formation of voids is attributed to several mechanisms connected to the
atomization and drying process, such as: desorption of dissolved gases from the emulsion during
drying, the formation of a steam bubble within the drying droplet or incorporation of air into the
liquid drop during atomization13. Furthermore, Figures 4.3a and 4.3b show clearly that the core
0.1 1 10 100 10000
1
2
3
4
5
6
7
8
9
ELO emulsion before spray-drying
Spray-drying particles
ELO emulsion after spray-drying
Vo
lum
e %
particle size (µµµµm)
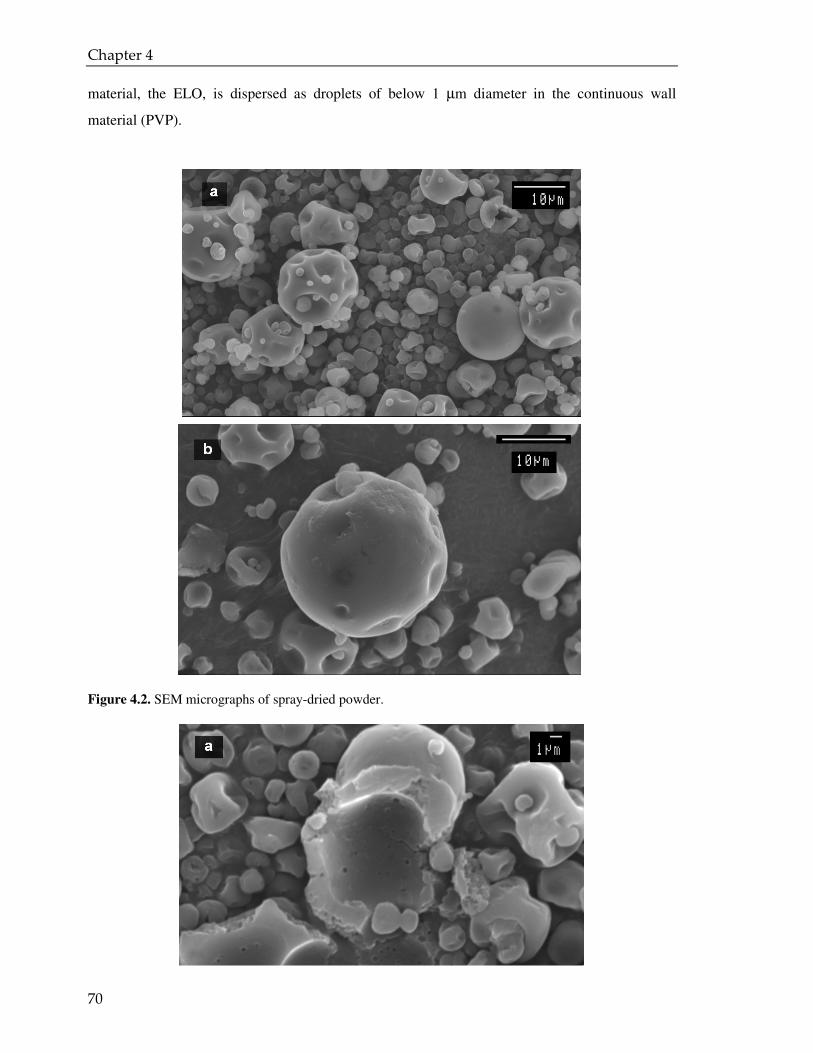
Chapter 4
70
material, the ELO, is dispersed as droplets of below 1 µm diameter in the continuous wall
material (PVP).
Figure 4.2. SEM micrographs of spray-dried powder.
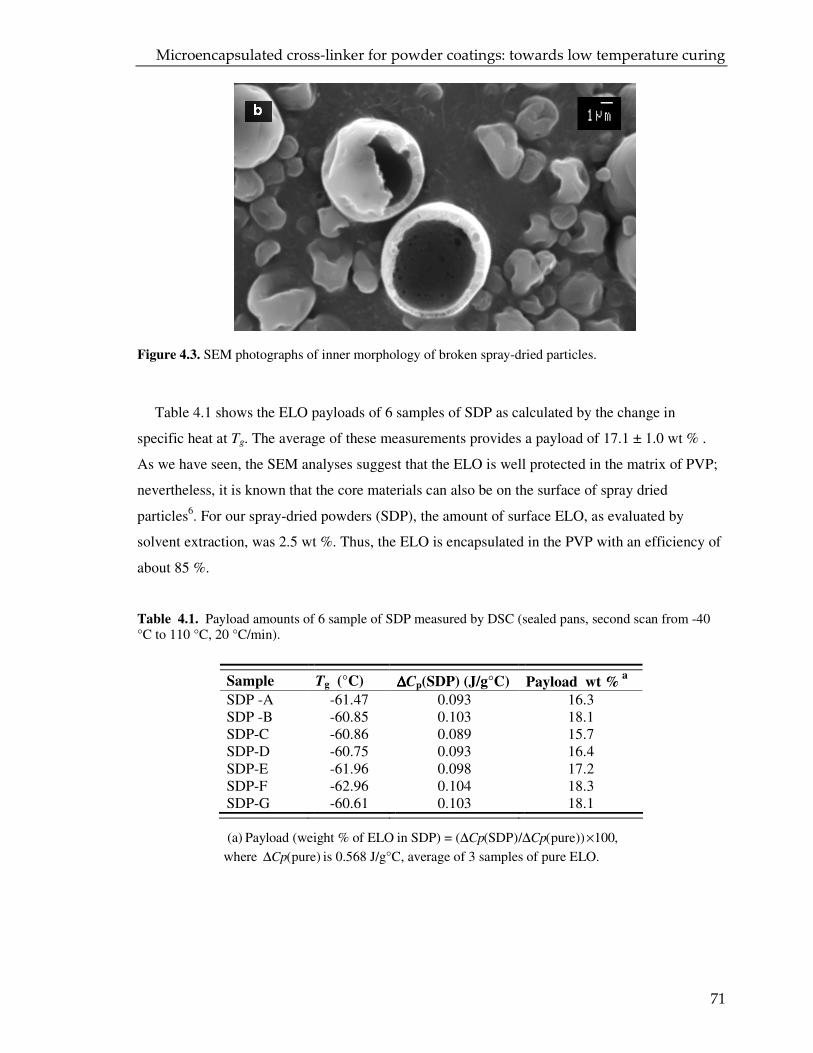
Microencapsulated cross-linker for powder coatings: towards low temperature curing
71
Figure 4.3. SEM photographs of inner morphology of broken spray-dried particles.
Table 4.1 shows the ELO payloads of 6 samples of SDP as calculated by the change in
specific heat at Tg. The average of these measurements provides a payload of 17.1 ± 1.0 wt % .
As we have seen, the SEM analyses suggest that the ELO is well protected in the matrix of PVP;
nevertheless, it is known that the core materials can also be on the surface of spray dried
particles6. For our spray-dried powders (SDP), the amount of surface ELO, as evaluated by
solvent extraction, was 2.5 wt %. Thus, the ELO is encapsulated in the PVP with an efficiency of
about 85 %.
Table 4.1. Payload amounts of 6 sample of SDP measured by DSC (sealed pans, second scan from -40 °C to 110 °C, 20 °C/min).
(a) Payload (weight % of ELO in SDP) = ( (SDP)/ (pure)) 100,Cp Cp∆ ∆ ×
where (pure)Cp∆ is 0.568 J/g°C, average of 3 samples of pure ELO.
Sample Tg (°C) ∆∆∆∆Cp(SDP) (J/g°C) Payload wt % a
SDP -A -61.47 0.093 16.3 SDP -B -60.85 0.103 18.1 SDP-C -60.86 0.089 15.7 SDP-D -60.75 0.093 16.4 SDP-E -61.96 0.098 17.2 SDP-F -62.96 0.104 18.3 SDP-G -60.61 0.103 18.1
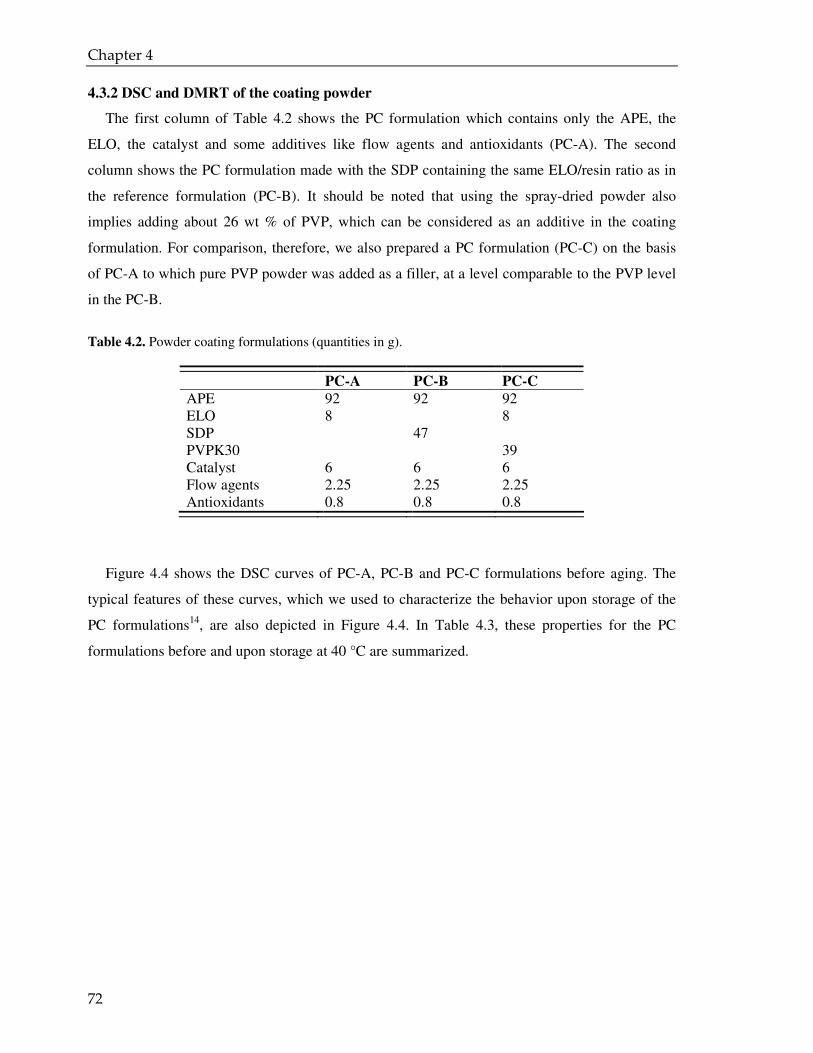
Chapter 4
72
4.3.2 DSC and DMRT of the coating powder
The first column of Table 4.2 shows the PC formulation which contains only the APE, the
ELO, the catalyst and some additives like flow agents and antioxidants (PC-A). The second
column shows the PC formulation made with the SDP containing the same ELO/resin ratio as in
the reference formulation (PC-B). It should be noted that using the spray-dried powder also
implies adding about 26 wt % of PVP, which can be considered as an additive in the coating
formulation. For comparison, therefore, we also prepared a PC formulation (PC-C) on the basis
of PC-A to which pure PVP powder was added as a filler, at a level comparable to the PVP level
in the PC-B.
Table 4.2. Powder coating formulations (quantities in g).
Figure 4.4 shows the DSC curves of PC-A, PC-B and PC-C formulations before aging. The
typical features of these curves, which we used to characterize the behavior upon storage of the
PC formulations14, are also depicted in Figure 4.4. In Table 4.3, these properties for the PC
formulations before and upon storage at 40 °C are summarized.
PC-A PC-B PC-C
APE 92 92 92 ELO 8 8 SDP 47 PVPK30 39 Catalyst 6 6 6 Flow agents 2.25 2.25 2.25 Antioxidants 0.8 0.8 0.8
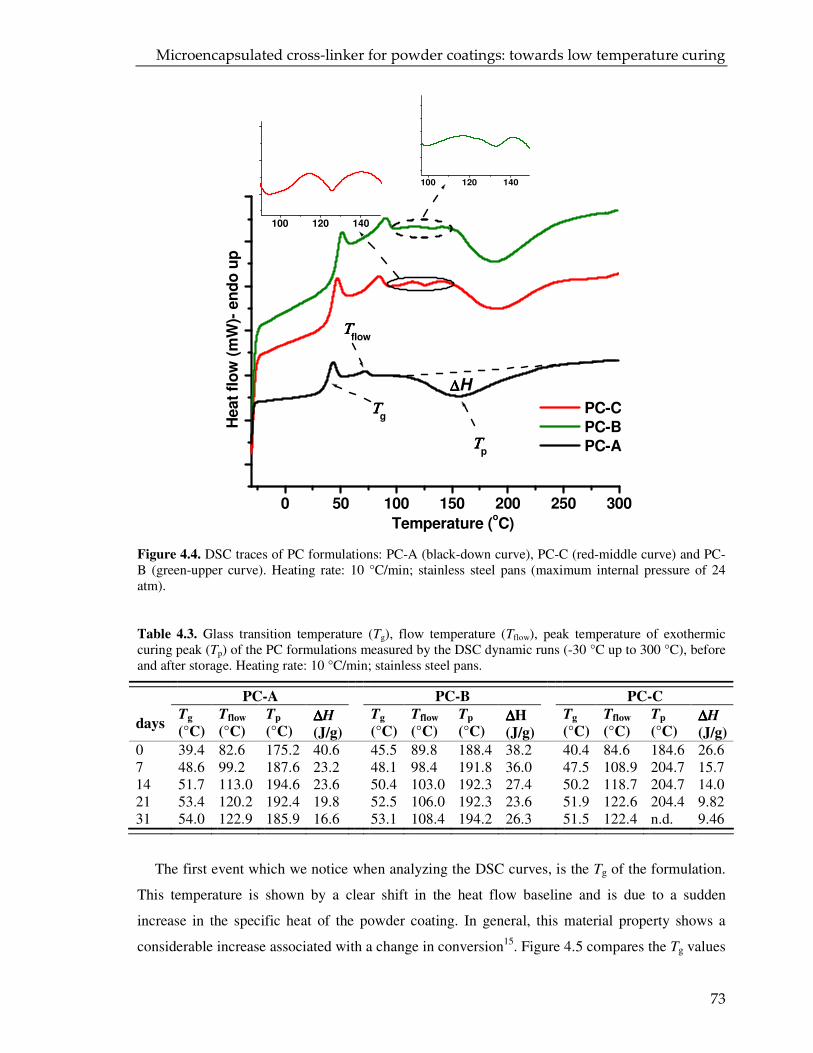
Microencapsulated cross-linker for powder coatings: towards low temperature curing
73
Figure 4.4. DSC traces of PC formulations: PC-A (black-down curve), PC-C (red-middle curve) and PC-B (green-upper curve). Heating rate: 10 °C/min; stainless steel pans (maximum internal pressure of 24 atm).
Table 4.3. Glass transition temperature (Tg), flow temperature (Tflow), peak temperature of exothermic curing peak (Tp) of the PC formulations measured by the DSC dynamic runs (-30 °C up to 300 °C), before and after storage. Heating rate: 10 °C/min; stainless steel pans.
PC-A PC-B PC-C
days Tg
(°C)
Tflow
(°C)
Tp
(°C) ∆∆∆∆H
(J/g)
Tg
(°C)
Tflow
(°C)
Tp
(°C) ∆∆∆∆H
(J/g)
Tg
(°C)
Tflow
(°C)
Tp
(°C) ∆∆∆∆H
(J/g)
0 39.4 82.6 175.2 40.6 45.5 89.8 188.4 38.2 40.4 84.6 184.6 26.6 7 48.6 99.2 187.6 23.2 48.1 98.4 191.8 36.0 47.5 108.9 204.7 15.7 14 51.7 113.0 194.6 23.6 50.4 103.0 192.3 27.4 50.2 118.7 204.7 14.0 21 53.4 120.2 192.4 19.8 52.5 106.0 192.3 23.6 51.9 122.6 204.4 9.82 31 54.0 122.9 185.9 16.6 53.1 108.4 194.2 26.3 51.5 122.4 n.d. 9.46
The first event which we notice when analyzing the DSC curves, is the Tg of the formulation.
This temperature is shown by a clear shift in the heat flow baseline and is due to a sudden
increase in the specific heat of the powder coating. In general, this material property shows a
considerable increase associated with a change in conversion15. Figure 4.5 compares the Tg values
0 50 100 150 200 250 300
PC-C
PC-B
PC-AΤΤΤΤp
∆∆∆∆H
ΤΤΤΤflow
ΤΤΤΤg
Heat
flo
w (
mW
)- e
nd
o u
p
Temperature (oC)
100 120 140
100 120 140
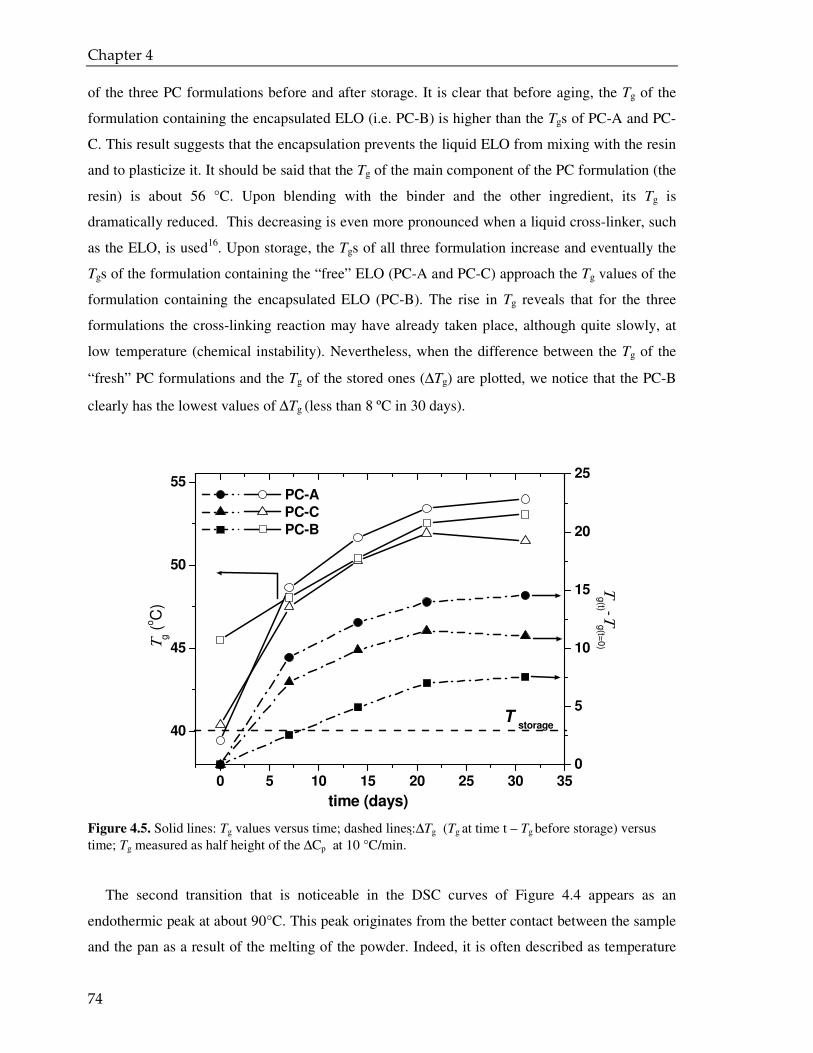
Chapter 4
74
of the three PC formulations before and after storage. It is clear that before aging, the Tg of the
formulation containing the encapsulated ELO (i.e. PC-B) is higher than the Tgs of PC-A and PC-
C. This result suggests that the encapsulation prevents the liquid ELO from mixing with the resin
and to plasticize it. It should be said that the Tg of the main component of the PC formulation (the
resin) is about 56 °C. Upon blending with the binder and the other ingredient, its Tg is
dramatically reduced. This decreasing is even more pronounced when a liquid cross-linker, such
as the ELO, is used16. Upon storage, the Tgs of all three formulation increase and eventually the
Tgs of the formulation containing the “free” ELO (PC-A and PC-C) approach the Tg values of the
formulation containing the encapsulated ELO (PC-B). The rise in Tg reveals that for the three
formulations the cross-linking reaction may have already taken place, although quite slowly, at
low temperature (chemical instability). Nevertheless, when the difference between the Tg of the
“fresh” PC formulations and the Tg of the stored ones (∆Tg) are plotted, we notice that the PC-B
clearly has the lowest values of ∆Tg (less than 8 ºC in 30 days).
Figure 4.5. Solid lines: Tg values versus time; dashed lines: ∆Tg (Tg at time t – Tg before storage) versus time; Tg measured as half height of the ∆Cp at 10 °C/min.
The second transition that is noticeable in the DSC curves of Figure 4.4 appears as an
endothermic peak at about 90°C. This peak originates from the better contact between the sample
and the pan as a result of the melting of the powder. Indeed, it is often described as temperature
0 5 10 15 20 25 30 35
40
45
50
55
0
5
10
15
20
25
T storage
PC-A
PC-C
PC-B
time (days)
Τg (
oC
)
Τg(t) -Τ
g(t=
0)
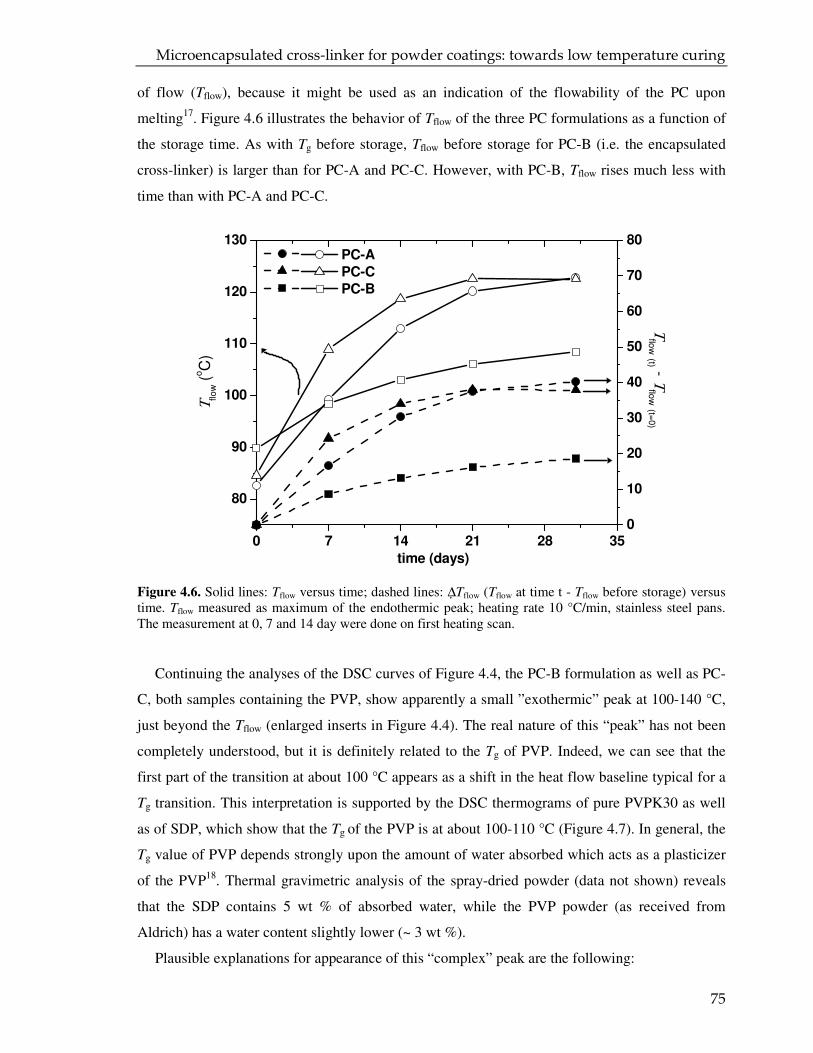
Microencapsulated cross-linker for powder coatings: towards low temperature curing
75
of flow (Tflow), because it might be used as an indication of the flowability of the PC upon
melting17. Figure 4.6 illustrates the behavior of Tflow of the three PC formulations as a function of
the storage time. As with Tg before storage, Tflow before storage for PC-B (i.e. the encapsulated
cross-linker) is larger than for PC-A and PC-C. However, with PC-B, Tflow rises much less with
time than with PC-A and PC-C.
Figure 4.6. Solid lines: Tflow versus time; dashed lines: ∆Tflow (Tflow at time t - Tflow before storage) versus time. Tflow measured as maximum of the endothermic peak; heating rate 10 °C/min, stainless steel pans. The measurement at 0, 7 and 14 day were done on first heating scan.
Continuing the analyses of the DSC curves of Figure 4.4, the PC-B formulation as well as PC-
C, both samples containing the PVP, show apparently a small ”exothermic” peak at 100-140 °C,
just beyond the Tflow (enlarged inserts in Figure 4.4). The real nature of this “peak” has not been
completely understood, but it is definitely related to the Tg of PVP. Indeed, we can see that the
first part of the transition at about 100 °C appears as a shift in the heat flow baseline typical for a
Tg transition. This interpretation is supported by the DSC thermograms of pure PVPK30 as well
as of SDP, which show that the Tg of the PVP is at about 100-110 °C (Figure 4.7). In general, the
Tg value of PVP depends strongly upon the amount of water absorbed which acts as a plasticizer
of the PVP18. Thermal gravimetric analysis of the spray-dried powder (data not shown) reveals
that the SDP contains 5 wt % of absorbed water, while the PVP powder (as received from
Aldrich) has a water content slightly lower (~ 3 wt %).
Plausible explanations for appearance of this “complex” peak are the following:
0 7 14 21 28 35
80
90
100
110
120
130
0
10
20
30
40
50
60
70
80 PC-A
PC-C
PC-B
time (days)
Τflo
w (
oC
)
Τflo
w (t) - Τflo
w (t=0)

Chapter 4
76
1. The transition might be due to sample movement of some kind. This could happen, for
example, when the PVP “melts” and flows. The transition for this type of event occurs because
the rate of heat transfer changes between the sample and the pan due to the change in surface area
of contact during melting and flowing of the PVP.
2. The transition is caused by the heat of mixing or swelling of the PVP with the resin, which is
soon covered by the exothermic peak due to the curing reaction. In chapter 3, it was shown that
the PVP is thermodynamically miscible with the polyester resin APE. We studied the miscibility
of blends of these two polymers obtained by solvent casting. In the case of the PC formulations,
the PVP is mixed with the APE by melt extrusion process at about 100 °C. The residence time of
the PVP in the extruder is very short (few seconds) and at this temperature most probably the
PVP is not able to intimately mix with the resin, although thermodynamically the process is
favorable. It might be that a certain amount of PVP does dissolve into the resin (lower molecular
weight fraction), but most of the PVP is not intimately mixed. This behavior would explain why
we do not see a strong effect on the Tg of the resin and in addition we can see the appearance of a
“complex” transition in the DSC curves at 100-140 °C. However, we are not aware of other
possible transitions that could cause this “exothermic peak”.
Figure 4.7. DSC thermograms of the PVPK30 (~3 wt % absorbed water, TGA) and PVP in the spray dried powder (~5 wt % absorbed water). Heating rate of 20 °C/min, stainless steel pans.
40 60 80 100 120 140 160
SDP
PVPK30
110 oC
105 oC
Heat
flo
w (
mW
) -
en
do
up
Temperature (oC)
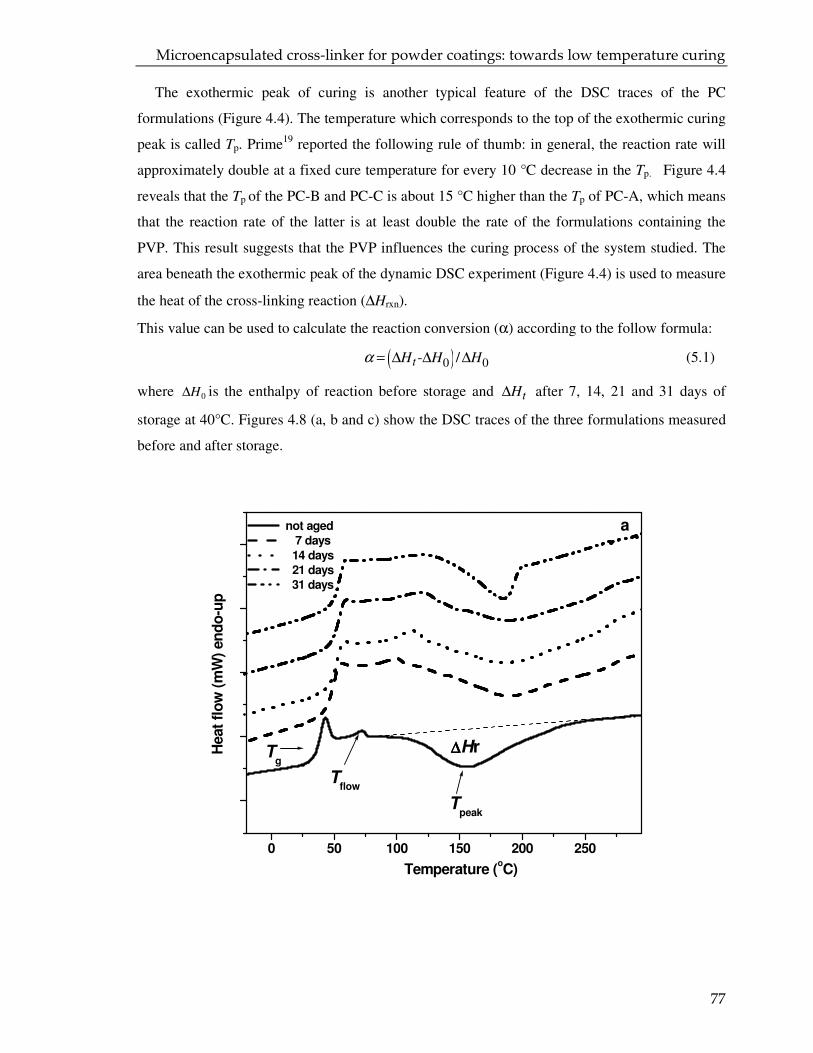
Microencapsulated cross-linker for powder coatings: towards low temperature curing
77
The exothermic peak of curing is another typical feature of the DSC traces of the PC
formulations (Figure 4.4). The temperature which corresponds to the top of the exothermic curing
peak is called Tp. Prime19 reported the following rule of thumb: in general, the reaction rate will
approximately double at a fixed cure temperature for every 10 °C decrease in the Tp. Figure 4.4
reveals that the Tp of the PC-B and PC-C is about 15 °C higher than the Tp of PC-A, which means
that the reaction rate of the latter is at least double the rate of the formulations containing the
PVP. This result suggests that the PVP influences the curing process of the system studied. The
area beneath the exothermic peak of the dynamic DSC experiment (Figure 4.4) is used to measure
the heat of the cross-linking reaction (∆Hrxn).
This value can be used to calculate the reaction conversion (α) according to the follow formula:
( )0 0- /tH H Hα = ∆ ∆ ∆ (5.1)
where 0H∆ is the enthalpy of reaction before storage and tH∆ after 7, 14, 21 and 31 days of
storage at 40°C. Figures 4.8 (a, b and c) show the DSC traces of the three formulations measured
before and after storage.
0 50 100 150 200 250
a not aged
7 days
14 days
21 days
31 days
∆∆∆∆Hr
Tpeak
Tflow
Tg
Heat
flo
w (
mW
) en
do
-up
Temperature (oC)
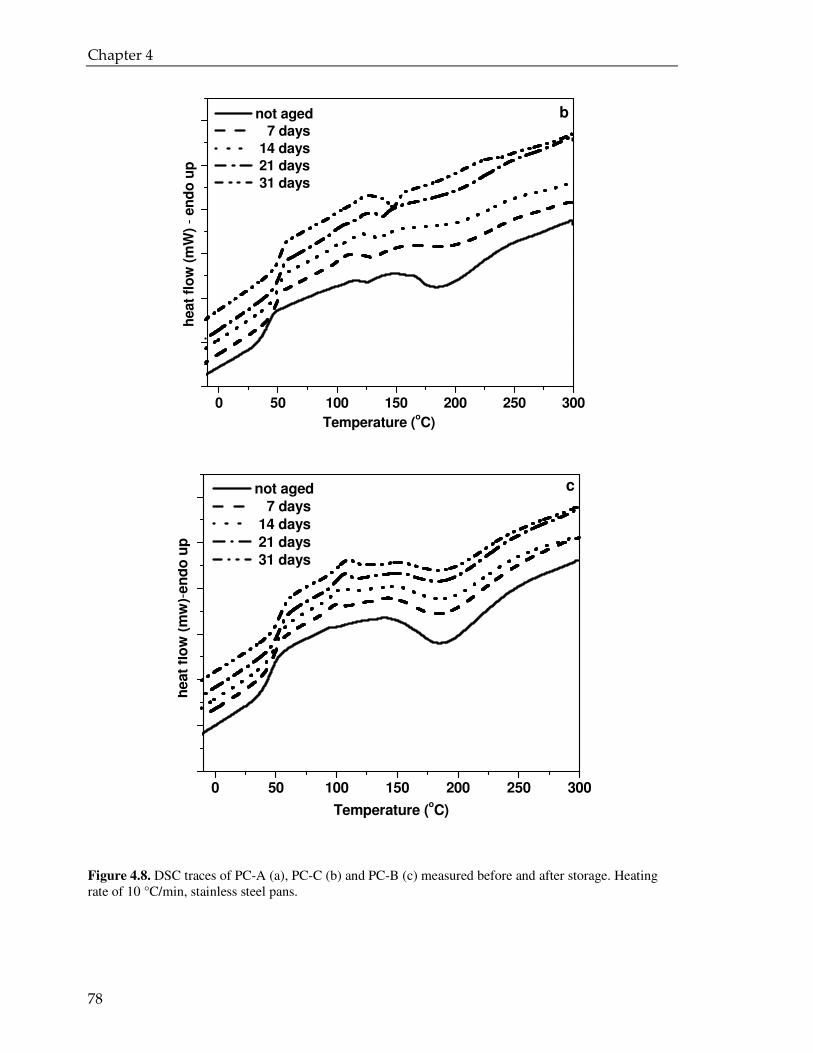
Chapter 4
78
Figure 4.8. DSC traces of PC-A (a), PC-C (b) and PC-B (c) measured before and after storage. Heating rate of 10 °C/min, stainless steel pans.
0 50 100 150 200 250 300
b not aged
7 days
14 days
21 days
31 days
heat
flo
w (
mW
) -
en
do
up
Temperature (oC)
0 50 100 150 200 250 300
c not aged
7 days
14 days
21 days
31 days
heat
flo
w (
mw
)-en
do
up
Temperature (oC)
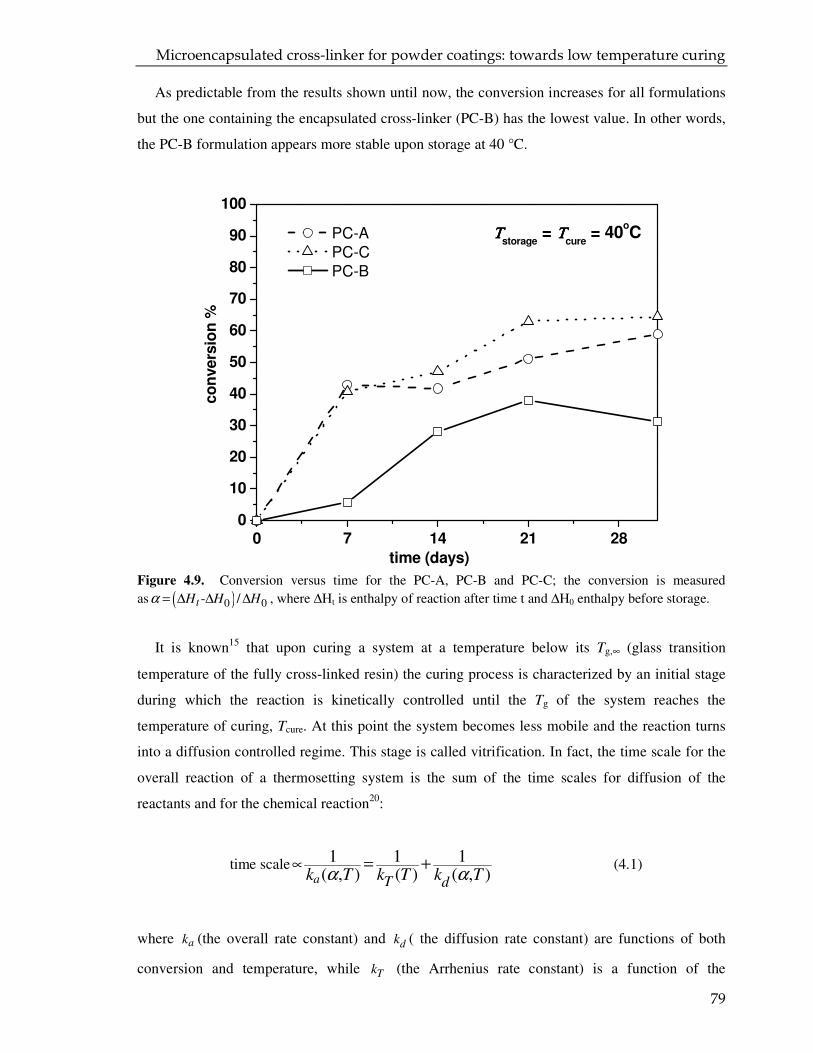
Microencapsulated cross-linker for powder coatings: towards low temperature curing
79
As predictable from the results shown until now, the conversion increases for all formulations
but the one containing the encapsulated cross-linker (PC-B) has the lowest value. In other words,
the PC-B formulation appears more stable upon storage at 40 °C.
Figure 4.9. Conversion versus time for the PC-A, PC-B and PC-C; the conversion is measured
as ( )0 0- /tH H Hα = ∆ ∆ ∆ , where ∆Ht is enthalpy of reaction after time t and ∆H0 enthalpy before storage.
It is known15 that upon curing a system at a temperature below its Tg,∞ (glass transition
temperature of the fully cross-linked resin) the curing process is characterized by an initial stage
during which the reaction is kinetically controlled until the Tg of the system reaches the
temperature of curing, Tcure. At this point the system becomes less mobile and the reaction turns
into a diffusion controlled regime. This stage is called vitrification. In fact, the time scale for the
overall reaction of a thermosetting system is the sum of the time scales for diffusion of the
reactants and for the chemical reaction20:
time scale 1 1 1( , ) ( ) ( , )a T d
k T k T k Tα α∝ = + (4.1)
where ak (the overall rate constant) and dk ( the diffusion rate constant) are functions of both
conversion and temperature, while Tk (the Arrhenius rate constant) is a function of the
0 7 14 21 280
10
20
30
40
50
60
70
80
90
100
ΤΤΤΤstorage
= ΤΤΤΤcure
= 40oC PC-A
PC-C
PC-B
co
nvers
ion
%
time (days)
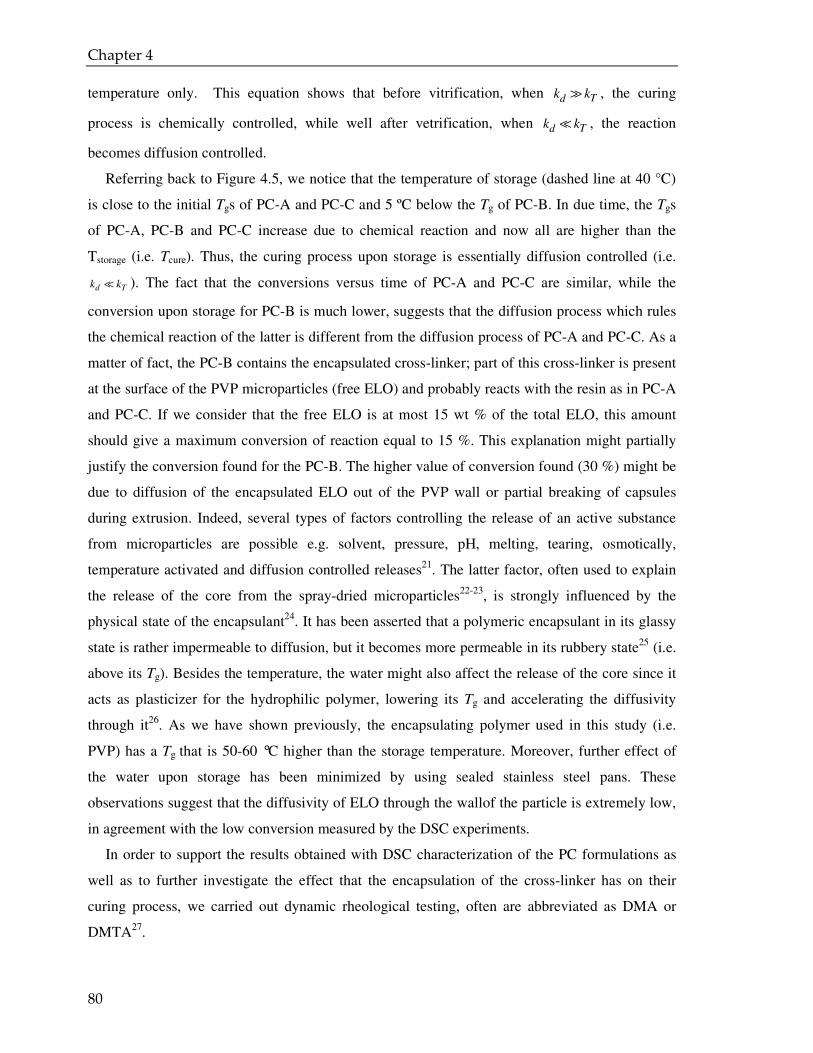
Chapter 4
80
temperature only. This equation shows that before vitrification, when Tdk k� , the curing
process is chemically controlled, while well after vetrification, when Tdk k� , the reaction
becomes diffusion controlled.
Referring back to Figure 4.5, we notice that the temperature of storage (dashed line at 40 °C)
is close to the initial Tgs of PC-A and PC-C and 5 ºC below the Tg of PC-B. In due time, the Tgs
of PC-A, PC-B and PC-C increase due to chemical reaction and now all are higher than the
Tstorage (i.e. Tcure). Thus, the curing process upon storage is essentially diffusion controlled (i.e.
d Tk k� ). The fact that the conversions versus time of PC-A and PC-C are similar, while the
conversion upon storage for PC-B is much lower, suggests that the diffusion process which rules
the chemical reaction of the latter is different from the diffusion process of PC-A and PC-C. As a
matter of fact, the PC-B contains the encapsulated cross-linker; part of this cross-linker is present
at the surface of the PVP microparticles (free ELO) and probably reacts with the resin as in PC-A
and PC-C. If we consider that the free ELO is at most 15 wt % of the total ELO, this amount
should give a maximum conversion of reaction equal to 15 %. This explanation might partially
justify the conversion found for the PC-B. The higher value of conversion found (30 %) might be
due to diffusion of the encapsulated ELO out of the PVP wall or partial breaking of capsules
during extrusion. Indeed, several types of factors controlling the release of an active substance
from microparticles are possible e.g. solvent, pressure, pH, melting, tearing, osmotically,
temperature activated and diffusion controlled releases21. The latter factor, often used to explain
the release of the core from the spray-dried microparticles22-23, is strongly influenced by the
physical state of the encapsulant24. It has been asserted that a polymeric encapsulant in its glassy
state is rather impermeable to diffusion, but it becomes more permeable in its rubbery state25 (i.e.
above its Tg). Besides the temperature, the water might also affect the release of the core since it
acts as plasticizer for the hydrophilic polymer, lowering its Tg and accelerating the diffusivity
through it26. As we have shown previously, the encapsulating polymer used in this study (i.e.
PVP) has a Tg that is 50-60 °C higher than the storage temperature. Moreover, further effect of
the water upon storage has been minimized by using sealed stainless steel pans. These
observations suggest that the diffusivity of ELO through the wallof the particle is extremely low,
in agreement with the low conversion measured by the DSC experiments.
In order to support the results obtained with DSC characterization of the PC formulations as
well as to further investigate the effect that the encapsulation of the cross-linker has on their
curing process, we carried out dynamic rheological testing, often are abbreviated as DMA or
DMTA27.
Microencapsulated cross-linker for powder coatings: towards low temperature curing
81
Figure 4.10 shows typical curves of the complex viscosity (η*) versus dynamic curing
temperature for PC-A. The phase shift as a function of temperature is also depicted in Figure
4.10. The measurements were performed in triplicate. Good correspondence of the curves proves
the reproducibility of the method. The measurements started at 90 °C, after one minute of
equilibration; the complex viscosity decreases due to the melting of the powder (melt), while the
phase shift is close to 90° which indicates an almost fully liquid character of the sample. The
initial rise of the phase angle from about 78° to a plateau at 88° might be the consequence of two
causes: 1. a slight unbalance in temperature between upper and lower plate of the rheometer in
dynamic mode; 2. the melting of the powder, which at the beginning of the measurement is not
completed yet and only after few minutes the materials behaves as a purely viscous material28. As
the temperature continues to increase, the powder coating flows until the complex viscosity
begins to rise again due to the start of the cross-linking. The competition between these two
phenomena (i.e. the flow and the cross-linking) produces a minimum in the complex viscosity
curve (η*min). This value and the temperature range at which the viscosity reaches the minimum
(flow window) affect the flow and the extent of leveling of the coating17. At the same time, when
the curing process starts, the phase shift drops steeply towards a value of approximately zero,
showing the typical behavior of an elastic material. The final value of the complex viscosity
depends of the cross-link network density since in the rubbery region * '/Gη ω∝ and
0 '( 0)eG RT Gν ω= = → , where G’ is the storage modulus of the cross-linked network, R is the gas
constant, T is the temperature in Kelvin at the beginning of the rubbery region and νe is the cross-
link density29. For the PC formulations of this study, a relatively low G’ (~ 4·105 Pa) is found,
either due to the low conversion of curing for the experimental conditions used or due to the low
cross-link network density of an acid polyester resin cross-linker with epoxidized natural oil 4 or
due to both.
Chapter 4
82
Figure 4.10. Complex viscosity (black lines) and phase shift (grey curves) versus temperature of PC-A measured three times; AR-1000N, TA Instruments, heating rate 2 °C/min, 1 Hz, 1% strain.
However, the main goal of this study is not to measure the final engineering properties of a cross-
linked coating but to prove that the encapsulated ELO affects the viscosity-temperature behavior
of the powder coating, as we are going to show next.
Figure 4.11 displays values for the complex viscosity and phase shift versus temperature of
PC-A, PC-B and PC-C. Starting soon after the time of equilibration at 90 °C we observe the
following features:
1. The initial viscosity of the formulations containing PVP (i.e. PC-B and PC-C) have higher
viscosities compared to PC-A. This result is also confirmed by the lower δ values which may
reflect the higher stiffness of the formulations PC-B and PC-C. This behavior is a consequence of
the high amount of PVP, which, at temperatures below its Tg, might act just as an inorganic filler.
For instance, it is known that pigment particles, e.g. TiO2, used in powder coatings based on
carboxyl-functional resins, can interact leading to higher viscosity30. Besides this, soon after the
equilibration (at 90 °C) the δ of the formulation containing the encapsulated ELO (PC-B) is even
lower than PC-C and increases more sharply than the PC-A and PC-C. This result demonstrates
that the formulation containing the encapsulated ELO has a higher Tflow in agreement with the
80 100 120 140 160 180 200 220
103
104
105
ΤΤΤΤonset x-linkingflow window
flow
elastic behaviour
cross-linking
melting
η∗η∗η∗η∗ min
viscous behaviourvis
co
sit
y (
ηη ηη*)
Pas
Temperature (0C)
0
20
40
60
80
100
p
hase a
ng
le (
δδ δδ)
Microencapsulated cross-linker for powder coatings: towards low temperature curing
83
DSC results. Note that the encapsulation of ELO makes the plasticizing effect of ELO in PC-B
less than in PC-A and PC-C, thus affecting the rheological properties.
2. Above 100 °C, the viscosity curves of the PC-B and PC-C show a deflection (arrows) which
probably displays the glass transition Tg of the PVP as also shown by the DSC curves (Figure
4.4). This deflection is followed by a sudden minimum in the phase shift. This can be understood
by considering the rheological response of a purely viscous liquid in which spherical polymeric
particles are dispersed. On heating, we suppose that the dispersing liquid gradually diminishes in
viscosity; the solid polymer particles melt and eventually arrive at a very-low, purely viscous
state. The effect of the well-dispersed solid filler particles is to increase the viscosity of the
dispersion, in the case of low volume fractions φ according to Einstein’s viscosity law31
ln / 2.5d dη φ = , while keeping the system purely viscous. Once the particles melt, their
resistance diminishes down to ln / 1d dη φ = (in case the flow is not strong enough to deform the
spheres) but preserve their purely viscous character. At intermediate temperatures, the particles
will exhibit viscoelasticity thus conveying some “memory” to the rheology of the dispersion,
noticeable as some elastic contribution. This is what can be recognized as a minimum in the
phase angle in Figure 4.11. It should be noted that the temperature corresponding to this
“minimum” in δ is rather close to the temperature at which the “apparent” minimum in the DSC
trace (Figure 4.4) was found for PC-B and PC-C.
3. By increasing the temperature, the coating powders are melted and easily flow until the
curing reaction begins. PC-A and PC-C exhibit approximately the same ηmin while the PC-B
formulation has a lower ηmin but shifted to higher temperature. The behavior of the formulation
PC-B is probably the consequence of the encapsulation of the cross-linker: the starting of the
curing is delayed by the encapsulation, but as soon as the temperature is above the Tg of the PVP,
the cross-linker is released and mixes with the resin whereafter the viscosity begins to rise.
4. Finally, we observe that the large drop in δ (i.e. the formation of the infinite network of
cross-links) of the PC-B and PC-C formulations are shifted to much higher temperature when
compared to PC-A. These results confirm what we found via the DSC experiments: the PVP
reduces the curing rate of the APE/ELO binder.
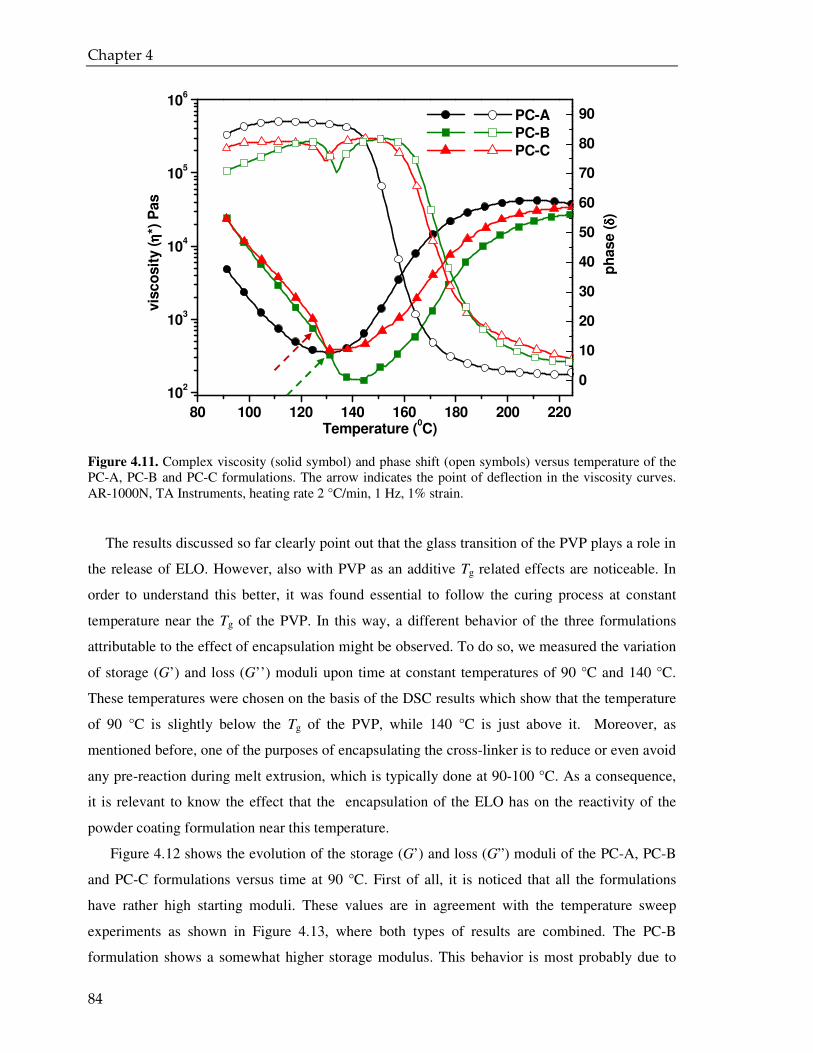
Chapter 4
84
Figure 4.11. Complex viscosity (solid symbol) and phase shift (open symbols) versus temperature of the PC-A, PC-B and PC-C formulations. The arrow indicates the point of deflection in the viscosity curves. AR-1000N, TA Instruments, heating rate 2 °C/min, 1 Hz, 1% strain.
The results discussed so far clearly point out that the glass transition of the PVP plays a role in
the release of ELO. However, also with PVP as an additive Tg related effects are noticeable. In
order to understand this better, it was found essential to follow the curing process at constant
temperature near the Tg of the PVP. In this way, a different behavior of the three formulations
attributable to the effect of encapsulation might be observed. To do so, we measured the variation
of storage (G’) and loss (G’’) moduli upon time at constant temperatures of 90 °C and 140 °C.
These temperatures were chosen on the basis of the DSC results which show that the temperature
of 90 °C is slightly below the Tg of the PVP, while 140 °C is just above it. Moreover, as
mentioned before, one of the purposes of encapsulating the cross-linker is to reduce or even avoid
any pre-reaction during melt extrusion, which is typically done at 90-100 °C. As a consequence,
it is relevant to know the effect that the encapsulation of the ELO has on the reactivity of the
powder coating formulation near this temperature.
Figure 4.12 shows the evolution of the storage (G’) and loss (G”) moduli of the PC-A, PC-B
and PC-C formulations versus time at 90 °C. First of all, it is noticed that all the formulations
have rather high starting moduli. These values are in agreement with the temperature sweep
experiments as shown in Figure 4.13, where both types of results are combined. The PC-B
formulation shows a somewhat higher storage modulus. This behavior is most probably due to
80 100 120 140 160 180 200 220
102
103
104
105
106
0
10
20
30
40
50
60
70
80
90
PC-A
PC-B
PC-C
ph
ase (
δδ δδ)
vis
co
sit
y (
ηη ηη*)
Pas
Temperature (0C)
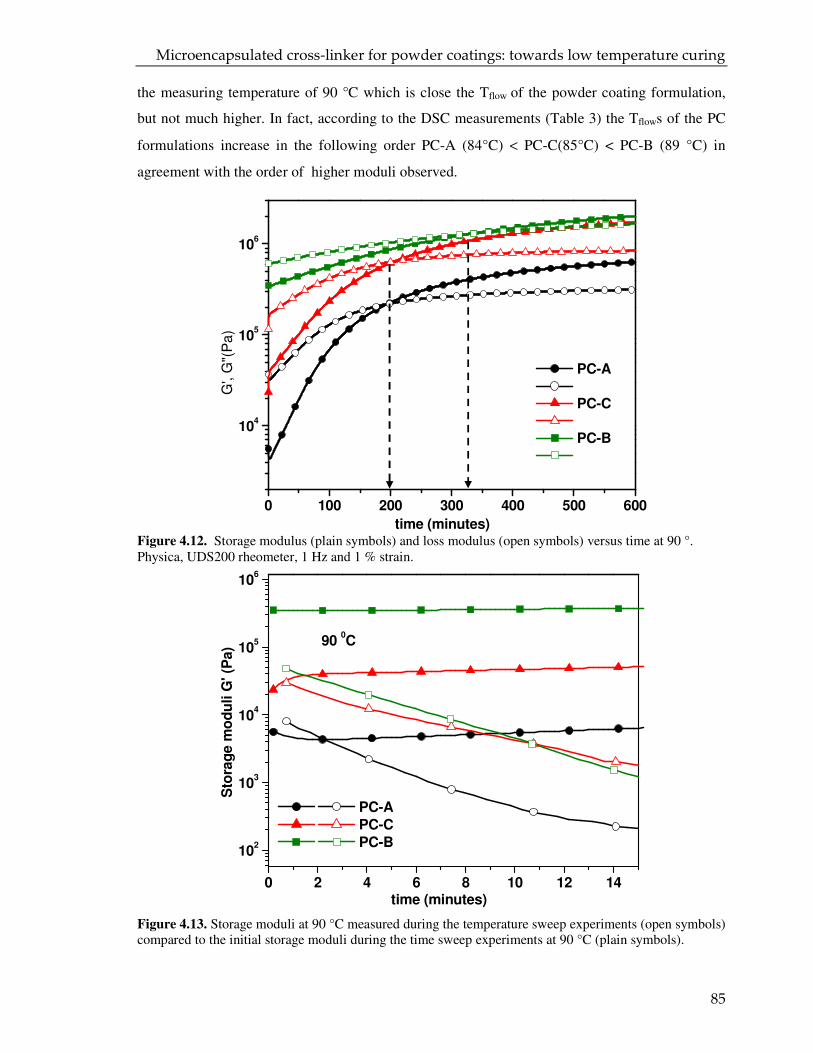
Microencapsulated cross-linker for powder coatings: towards low temperature curing
85
the measuring temperature of 90 °C which is close the Tflow of the powder coating formulation,
but not much higher. In fact, according to the DSC measurements (Table 3) the Tflows of the PC
formulations increase in the following order PC-A (84°C) < PC-C(85°C) < PC-B (89 °C) in
agreement with the order of higher moduli observed.
Figure 4.12. Storage modulus (plain symbols) and loss modulus (open symbols) versus time at 90 °. Physica, UDS200 rheometer, 1 Hz and 1 % strain.
Figure 4.13. Storage moduli at 90 °C measured during the temperature sweep experiments (open symbols) compared to the initial storage moduli during the time sweep experiments at 90 °C (plain symbols).
0 100 200 300 400 500 600
104
105
106
PC-A
PC-C
PC-B
G',
G"(
Pa
)
time (minutes)
0 2 4 6 8 10 12 14
102
103
104
105
106
90 0C
PC-A
PC-C
PC-B
Sto
rag
e m
od
uli G
' (P
a)
time (minutes)
Chapter 4
86
When imposing oscillatory shear on a sample over a range of frequencies, a sample with both
viscous and elastic aspects will have d log '/ d log 2 and d log "/ d log 1G Gω ω= = beyond some
limiting largest relaxation time 1~tL L
ω− , i.e. at the low end of the spectrum of angular
frequencies ω . We will follow the hypothesis of Winter and coworkers32 that the transition of a
system from liquid to space-filling network is characterized by a power-law behavior for both G’
and G” at the low ω end. Applying the Kronig-Kramers relationship, this leads to
' "/ tan( / 2) nG G n Gπ ω= = with 0 1n< < and0
Lω ω< � . Those authors found that n is equal 1
(i.e. a frequency independent phase angle of 45°) for stochiometric networks in accordance with
n=1 found for networks by other authors. However, for non-stochiometric networks (deficient in
crosslinkers) they found somewhat lower values for n, with correspondingly a somewhat lower
phase angle. In practice there is a limitation in the lowest experimentally attainable value of ω .
Thus, practically one has to define such a system to be at its gel point when a power law behavior
can be noticed at the low end of the investigated frequency range.
In our case, we want to compare the curing of powder formulations that are in principle close
to stochiometric conditions, but which do or do not contain PVP. This polymer has two effects on
the rheological behavior. When it has been dissolved we can consider, in approximation, the
rheological response of the system to be the sum of two contributions: that of the curing powder
coating and that of a polymeric solution. The latter will keep its viscous-elastic character while
the former will exhibit the response as discussed by Winter et al. This makes the criterion that the
gel point is marked by power-law behavior less accurate. At the gel point some “liquid-like”
curvature in the double log plots of modulus versus frequency can be still expected, especially at
large polymer concentrations. Additionally, when PVP is used as an encapsulant, the
stochiometry is not guaranteed any more, especially at an earlier stage of curing. According to
Winter’s findings, this may lead to a somewhat smaller value of n at the gel point. The conclusion
will be that in our systems the gel point can not be derived unambiguously from these double log
plots. We will, as a practical rule, characterize the progress of gelation by the point where the
phase angle attains the value of 450 (cross-over, G’ = G”), but we must be aware of the
limitations of this measurument for network formation.
Referring back to Figure 4.12, if we assume that the G’- G” cross-over point roughly
specifies the curing rate, we can conclude that at 90 °C the PC-A and PC-C formulations have a
similar curing rate whereas PC-B cures at a much slower rate. This result agrees with the fact that
the PC-B contains the encapsulated ELO. At a curing temperature of 90 °C, which is just slightly
below the Tg of the encapsulant, i.e. PVP, the microparticles are probably still intact and the
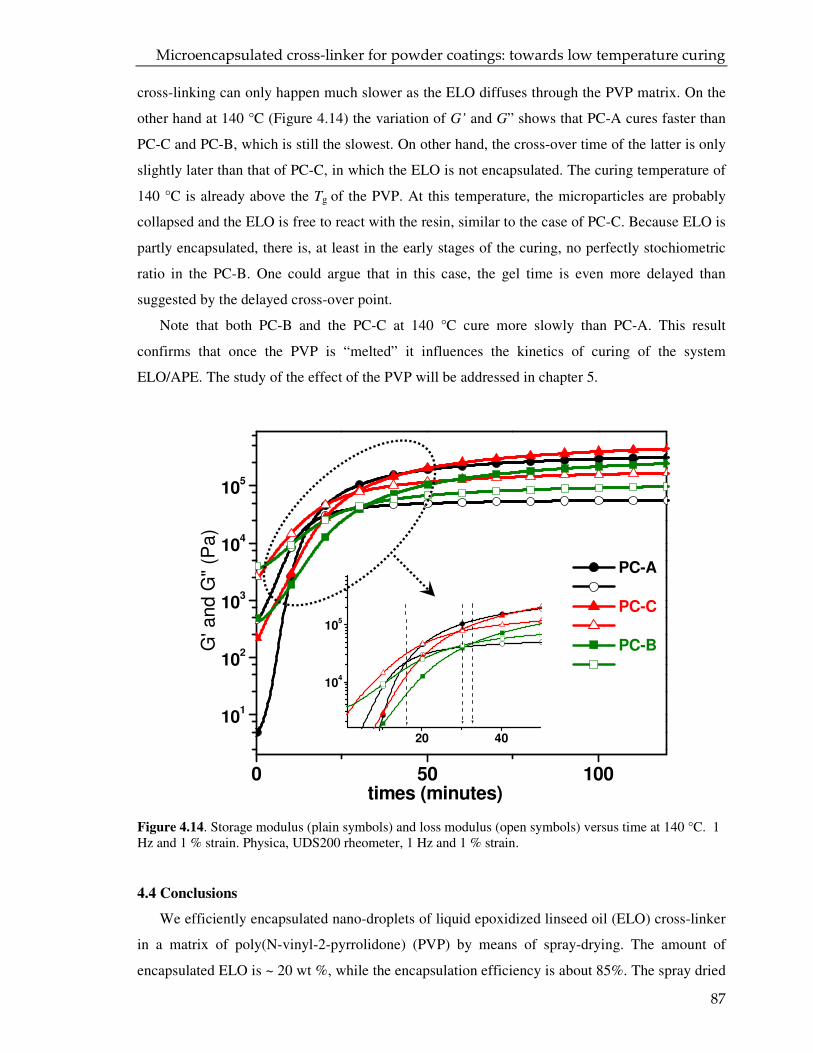
Microencapsulated cross-linker for powder coatings: towards low temperature curing
87
cross-linking can only happen much slower as the ELO diffuses through the PVP matrix. On the
other hand at 140 °C (Figure 4.14) the variation of G’ and G” shows that PC-A cures faster than
PC-C and PC-B, which is still the slowest. On other hand, the cross-over time of the latter is only
slightly later than that of PC-C, in which the ELO is not encapsulated. The curing temperature of
140 °C is already above the Tg of the PVP. At this temperature, the microparticles are probably
collapsed and the ELO is free to react with the resin, similar to the case of PC-C. Because ELO is
partly encapsulated, there is, at least in the early stages of the curing, no perfectly stochiometric
ratio in the PC-B. One could argue that in this case, the gel time is even more delayed than
suggested by the delayed cross-over point.
Note that both PC-B and the PC-C at 140 °C cure more slowly than PC-A. This result
confirms that once the PVP is “melted” it influences the kinetics of curing of the system
ELO/APE. The study of the effect of the PVP will be addressed in chapter 5.
Figure 4.14. Storage modulus (plain symbols) and loss modulus (open symbols) versus time at 140 °C. 1 Hz and 1 % strain. Physica, UDS200 rheometer, 1 Hz and 1 % strain.
4.4 Conclusions
We efficiently encapsulated nano-droplets of liquid epoxidized linseed oil (ELO) cross-linker
in a matrix of poly(N-vinyl-2-pyrrolidone) (PVP) by means of spray-drying. The amount of
encapsulated ELO is ~ 20 wt %, while the encapsulation efficiency is about 85%. The spray dried
0 50 100
101
102
103
104
105
G' a
nd
G"
(Pa)
times (minutes)
PC-A
PC-C
PC-B
20 40
104
105
Chapter 4
88
powder (SDP) was used as a cross-linker for the acid functional polyester (APE) in a powder
coating formulation (PC-B). This PC formulation was compared with two other formulations
based on the same APE, but containing free ELO: PC-A and PC-C. The latter differs from PC-A
since it contains the same amount of PVP (i.e. as an additive) as PC-B.
By differential scanning calorimeter (DSC) analysis and dynamic rheological testing of the PC-A,
PC-B and PC-C we conclude that:
1. The fact that PC-B has the highest Tg of the three formulations investigated shows that the
ELO is well protected in the polymer matrix and is not plasticizing the resin as in PC-A and PC-
C.
2. The PC-B has the highest Tflow compared to PC-A and PC-C. This result confirms that most
of the ELO is not free to plasticize the resin and suggests that the PC-B melts and flows at
slightly higher temperature than PC-A and PC-C.
3. Upon storage at a temperature of 40 °C the PC-B is the most stable of the three
formulations. Indeed, the Tg increases little upon storage, while a stronger rise is measured for the
PC-A and PC-C. The same behavior was found for the Tflow: PC-B has the highest value before
aging, but, upon storage, the Tflow of the PC-A and PC-C increase more than the Tflow of PC-B.
The measurement of the reaction enthalpy (H), calculated by the exothermic peak of the DSC
traces, confirms that the conversion of the PC-A and PC-C formulations is much higher then PC-
B. Since the temperature of storage is quite close to the Tg of the PC-formulation, we conclude
that after some time (increasing of Tg above the Tstorage) the reaction is diffusion controlled. The
fact that the conversion of PC-B is non-negligible on storage may be due to the free ELO. In
addition, the encapsulated ELO might also slowly diffuse to some extent through the glassy
matrix of PVP.
4. The measurement of the complex viscosities of the PC formulations at increasing
temperature (temperature sweep) reveals that the PVP increases the complex viscosity of the
formulations in agreement with what is shown by some inorganic filler (i.e. TiO2). Moreover, the
appearance of a deflection in the complex viscosity curves of the formulation containing the PVP
(i.e. PC-B and PC-C at ~ 110-120 °C) is most probably related to the Tg of the PVP (ca. 100-110
°C ). This deflection is followed by a sudden drop in the phase shift, in the same temperature
range where an apparently exothermic peak is found by DSC analysis. It is relevant that the PC-B
formulation has the lowest minimum in viscosity, shifted at higher temperature. This result shows
that the encapsulation of the ELO provides a delay of the starting of the curing reaction, which
seems to be triggered by the glass transition of the PVP. Finally, well above the Tg of the PVP,
we can observe a radical drop in the phase shift, which is an indication of the chemical network
Microencapsulated cross-linker for powder coatings: towards low temperature curing
89
formation. The fact that the formulations containing the PVP show the drop at much higher
temperatures than the PC-A, suggests that the PVP influences the kinetics of curing of the
system. This finding is also in agreement with the DSC curves that showed that PC-B and PC-C
have a Tpeak at least 15 °C higher , indicating a two times lower reaction rate for PC-B and PC-C
compared to PC-A.
5. The measurements of the storage and loss moduli at 90 °C (below the Tg of the PVP) show a
time lag in the curing reaction (cross-over point of G’ and G’ = approximate gel time). This time
lag is much less relevant at the temperature of 140 °C, which is already above the Tg of the PVP.
In addition, at 140 °C the formulations containing the PVP have the same “gel time”, which is
somewhat higher than the cross-over point of PC-A formulation. This result confirms that the
PVP, once it is “melted”, slows down the reaction of the epoxy with the acid.
Chapter 4
90
4.5 References
(1) Misev, T. A. Powder coatings : chemistry and technology, John Wiley and Sons, Inc., New York, 1991. (2) Misev, T. A.; van der Linde, R. Progress in Organic Coatings 1998, 34, 1-4, 160-168. (3) Richert D.S. in Kirk-Othmer Encyclopedia of Chemical Science and Technology, 2001, 35. (4) Witte, F. M.; Goemans, C. D.; van der Linde, R.; Stanssens, D. A. Progress in Organic Coatings
1997, 32, 1-4, 241-251. (5) Thies C. in Kirk-Othmer Encyclopedia of Chemical Science and Technology, 2001, 438. (6) Re, M. I. Drying Technology 1998, 16, 6, 1195-1236. (7) Poly(N-vinyl-2-pyrrolidone), http://www.polymersdatabase.com/, accessed on 2007. (8) Bair, H. E.; Boyle, D. J.; Kelleher, P. G. Polymer Engineering and Science 1980, 20, 15, 995-1001. (9) Buma, T. J.; Henstra, S. Netherlands Milk and Dairy Journal-Nederlands-Nederlands Melk en Zuiveltijdschrift 1971, 25, 1, 75-&. (10) Rosenberg, M.; Kopelman, I. J.; Talmony, Y. Journal of Food Science 1985, 50, 1, 139-144. (11) Greenwald, C. G.; King, C. J. Journal of Food Process Engineering 1981, 4, 171-187. (12) Rosenberg, M.; Talmony, Y.; Kopelman, I. J. Food Microstructure 1988, 7, 1, 15-23. (13) Verhey, J. G. P. Netherlands Milk and Dairy Journal 1972, 26, 3-4, 186-202. (14) Gherlone, L.; Rossini, T.; Stula, V. Progress in Organic Coatings 1998, 34, 1-4, 57-63. (15) Wisanrakkit, G.; Gillham, J. K. Journal of Applied Polymer Science 1990, 41, 11-12, 2885-2929. (16) Overeem, A.; Buisman, G. J. H.; Derksen, J. T. P.; Cuperus, F. P.; Molhoek, L.; Grisnich, W.; Goemans, C. Industrial Crops and Products 1999, 10, 3, 157-165. (17) De Lange P.G. Powder coatings: chemistry and technology, 2nd , William Andrew Publishing; 2004. (18) Buera, M. D.; Levi, G.; Karel, M. Biotechnology Progress 1992, 8, 2, 144-148. (19) Prime R.B. in Thermal characterizaton of polymeric materials, 2nd, Turi E., 1997, 1379. (20) Dusek, K.; Havlicek, I. Progress in Organic Coatings 1993, 22, 1-4, 145-159. (21) Reineccius, G. A. Controlled-release techniques in the food-industry, 1995. (22) Soottitantawat, A.; Yoshii, H.; Furuta, T.; Ohgawara, M.; Forssell, P.; Partanen, R.; Poutanen, K.; Linko, P. Journal of Agricultural and Food Chemistry 2004, 52, 5, 1269-1276. (23) Soottintawat, A.; Takayama, K.; Okamura, K.; Muranaka, D.; Yoshii, H.; Furuta, T.; Ohkawara, M.; Linko, P. Innovative Food Science & Emerging Technologies 2005, 6, 2, 163-170.
Microencapsulated cross-linker for powder coatings: towards low temperature curing
91
(24) Whorton, C. Encapsulation and controlled release of food ingredients, Acs symposium series, 1995,
134-142. (25) Vrentas, J. S.; Duda, J. L. Journal of Applied Polymer Science 1978, 22, 8, 2325-2339. (26) Levi, G.; Karel, M. Journal of Food Engineering 1995, 24, 1, 1-13. (27) Franck A..J. DMA to improve powder coatings, http://www.tainstruments.com, 2004.
(28) Osterhold, M.; Niggemann, F. Progress in Organic Coatings 1998, 33, 1, 55-60. (29) Flory, P. J. Chemical Reviews 1946, 39, 1, 137-197. (30) Osterhold, M. Progress in Organic Coatings 2000, 40, 1-4, 131-137. (31) Macosko, C. Rheology: principles, measuraments and applications, Weinheim, VCH, 1994. (32) Chambon, F.; Winter, H. H. Journal of Rheology 1987, 31, 8, 683-697.

Chapter 4
92


5 The effect of poly(N-vinyl-2-
pyrrolidone)on the powder coating
performance
93
The addition of the encapsulated cross-linker, epoxidized linseed oil, to a powder coating formulation containing acid functional polyester requires the addition of a certain amount of a water soluble thermoplastic polymer such as poly(N-vinyl-2-pyrrolidone) (PVP). In this chapter the influence of the encapsulation as well as of the addition of the PVP on the kinetics of curing is investigated by isothermal and non-isothermal differentical scanning calorimetry. The effect of the PVP as a water absorbing additive is studied by means of differential scanning calorimetry, mechanical and optical tests.
Chapter 5
94
5.1 Introduction
In the previous chapter, it was found that the addition of poly(N-vinyl-2-pyrrolidone) (PVP),
both as an additive and an encapsulant to the powder coating formulation, decreases the rate of
the curing reaction. Usually, a thermosetting formulation, like a powder coating, contains a resin
and a cross-linker (the binder) and one or more additives (e.g. catalyst, pigments, fillers,
antioxidants, plasticizers, flow agents, thermoplastics, etc.). The pigment, one of the most
important components of paints, is mainly used for aesthetic and protective reason1. Pigments can
be organic or inorganic. Depending on their functions, they are divided in: color pigments (e.g.
titanium oxide, zinc oxide, carbon black, iron oxides, chromium oxides, azo compounds),
extenders (e.g. calcium carbonate, kaolins, talcs, mica, silica, wallostonite and barite) and
functional pigments (e.g. anti-corrosive)2. These pigments and, in general, fillers may be inert as
well as reactive towards the binders, influencing the curing process of the coating or
thermosetting formulation. A general review of the influence of fillers (e.g. pigments) on the
kinetics of curing of thermosetting formulation was made by Prime3.
The effect of the microencapsulation of curing agents on the curing kinetics of epoxy resins
has been studied by Bank et al4. In their paper, these authors show that encapsulation improves
the handling of the cross-linker during the preparation of the formulation by improving the pot-
life of the formulation, but also that no significant effects of the encapsulation are noticeable on
the kinetics of curing as indicated by Differential Scanning Calorimeter (DSC).
The purpose of this chapter is to evaluate both the effect of the encapsulation and the influence
of PVP as an additive for powder coating (PC) formulations. The curing of the PC formulations
with and without PVP was investigated by isothermal and non-isothermal DSC.
Additionally, the PC formulations were applied on aluminum plates and cured. The effect of the
PVP on some mechanical and optical properties of the cured coatings was studied by solvent and
impact resistance tests, optical microscopy and Fourier Transform Infrared microscopy in
Attenuated Total Reflectance mode (micro ATR-FTIR). Finally the influence of PVP on the
water sensitivity of the PC formulation is evaluated by measuring the change in the Tgs of those
formulations upon absorption of water and visual inspection of the coatings after a severe test
with boiling water.
5.2 Experimental section
Materials Epoxidized linseed oil (ELO) used in the present study has a weight per equivalent
(weight in g of a sample containing one mol of epoxy groups) of 167.5 and was provided by
DSM Resins BV, Zwolle. Poly (N-vinyl-2-pyrrolidone) (PVPK30) with Mw of about 40000 g/mol
and sodium dodecyl sulphate (SDS) were obtained from Aldrich. Carboxyl-functionalized
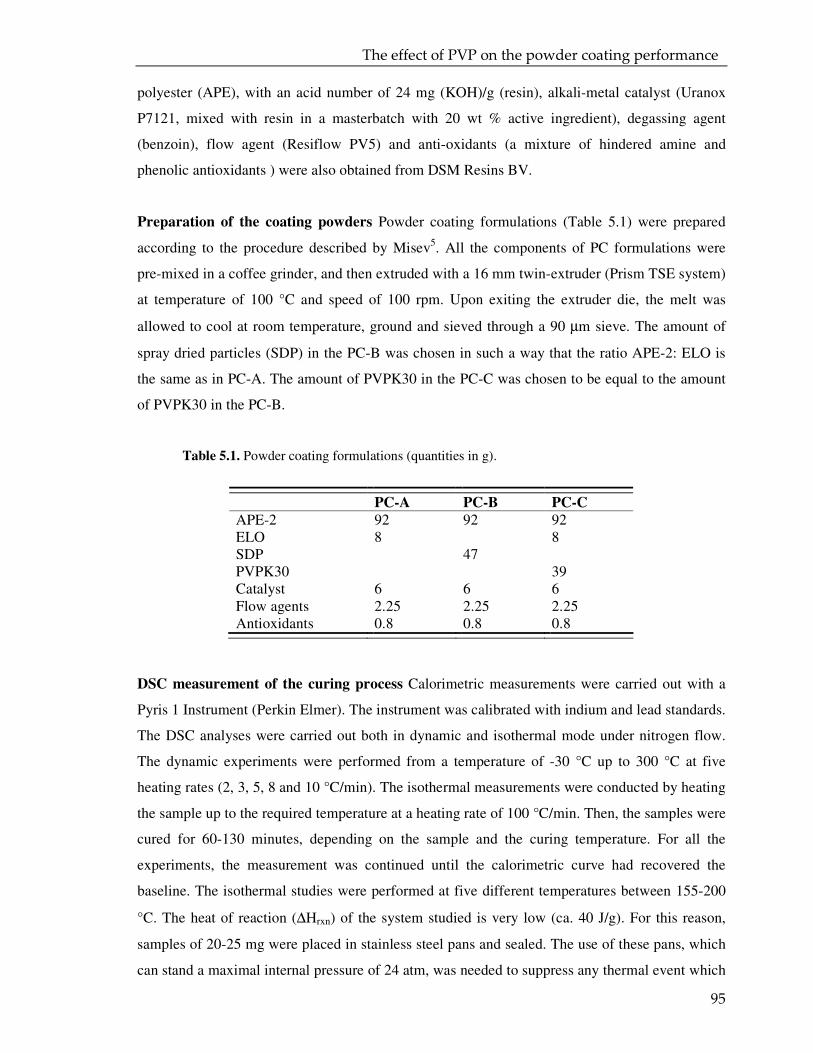
The effect of PVP on the powder coating performance
95
polyester (APE), with an acid number of 24 mg (KOH)/g (resin), alkali-metal catalyst (Uranox
P7121, mixed with resin in a masterbatch with 20 wt % active ingredient), degassing agent
(benzoin), flow agent (Resiflow PV5) and anti-oxidants (a mixture of hindered amine and
phenolic antioxidants ) were also obtained from DSM Resins BV.
Preparation of the coating powders Powder coating formulations (Table 5.1) were prepared
according to the procedure described by Misev5. All the components of PC formulations were
pre-mixed in a coffee grinder, and then extruded with a 16 mm twin-extruder (Prism TSE system)
at temperature of 100 °C and speed of 100 rpm. Upon exiting the extruder die, the melt was
allowed to cool at room temperature, ground and sieved through a 90 µm sieve. The amount of
spray dried particles (SDP) in the PC-B was chosen in such a way that the ratio APE-2: ELO is
the same as in PC-A. The amount of PVPK30 in the PC-C was chosen to be equal to the amount
of PVPK30 in the PC-B.
Table 5.1. Powder coating formulations (quantities in g).
DSC measurement of the curing process Calorimetric measurements were carried out with a
Pyris 1 Instrument (Perkin Elmer). The instrument was calibrated with indium and lead standards.
The DSC analyses were carried out both in dynamic and isothermal mode under nitrogen flow.
The dynamic experiments were performed from a temperature of -30 °C up to 300 °C at five
heating rates (2, 3, 5, 8 and 10 °C/min). The isothermal measurements were conducted by heating
the sample up to the required temperature at a heating rate of 100 °C/min. Then, the samples were
cured for 60-130 minutes, depending on the sample and the curing temperature. For all the
experiments, the measurement was continued until the calorimetric curve had recovered the
baseline. The isothermal studies were performed at five different temperatures between 155-200
°C. The heat of reaction (∆Hrxn) of the system studied is very low (ca. 40 J/g). For this reason,
samples of 20-25 mg were placed in stainless steel pans and sealed. The use of these pans, which
can stand a maximal internal pressure of 24 atm, was needed to suppress any thermal event which
PC-A PC-B PC-C
APE-2 92 92 92 ELO 8 8 SDP 47 PVPK30 39 Catalyst 6 6 6 Flow agents 2.25 2.25 2.25 Antioxidants 0.8 0.8 0.8
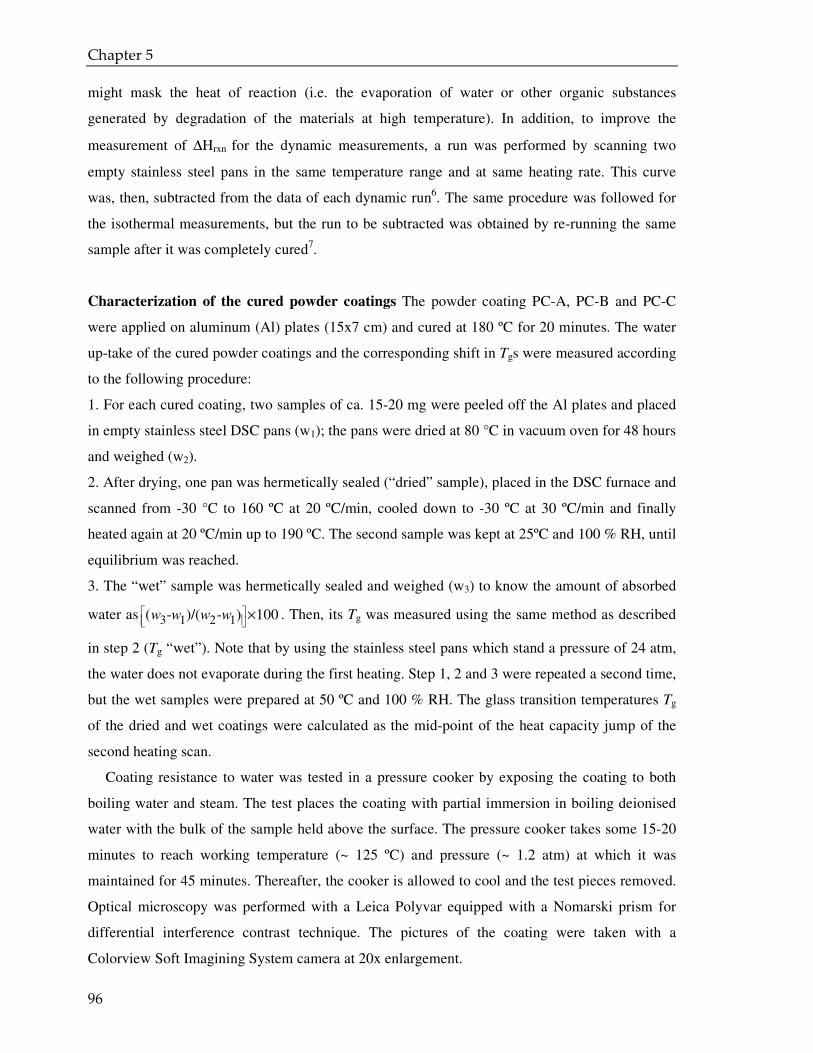
Chapter 5
96
might mask the heat of reaction (i.e. the evaporation of water or other organic substances
generated by degradation of the materials at high temperature). In addition, to improve the
measurement of ∆Hrxn for the dynamic measurements, a run was performed by scanning two
empty stainless steel pans in the same temperature range and at same heating rate. This curve
was, then, subtracted from the data of each dynamic run6. The same procedure was followed for
the isothermal measurements, but the run to be subtracted was obtained by re-running the same
sample after it was completely cured7.
Characterization of the cured powder coatings The powder coating PC-A, PC-B and PC-C
were applied on aluminum (Al) plates (15x7 cm) and cured at 180 ºC for 20 minutes. The water
up-take of the cured powder coatings and the corresponding shift in Tgs were measured according
to the following procedure:
1. For each cured coating, two samples of ca. 15-20 mg were peeled off the Al plates and placed
in empty stainless steel DSC pans (w1); the pans were dried at 80 °C in vacuum oven for 48 hours
and weighed (w2).
2. After drying, one pan was hermetically sealed (“dried” sample), placed in the DSC furnace and
scanned from -30 °C to 160 ºC at 20 ºC/min, cooled down to -30 ºC at 30 ºC/min and finally
heated again at 20 ºC/min up to 190 ºC. The second sample was kept at 25ºC and 100 % RH, until
equilibrium was reached.
3. The “wet” sample was hermetically sealed and weighed (w3) to know the amount of absorbed
water as 3 1 2 1( - )/( - ) 100w w w w
× . Then, its Tg was measured using the same method as described
in step 2 (Tg “wet”). Note that by using the stainless steel pans which stand a pressure of 24 atm,
the water does not evaporate during the first heating. Step 1, 2 and 3 were repeated a second time,
but the wet samples were prepared at 50 ºC and 100 % RH. The glass transition temperatures Tg
of the dried and wet coatings were calculated as the mid-point of the heat capacity jump of the
second heating scan.
Coating resistance to water was tested in a pressure cooker by exposing the coating to both
boiling water and steam. The test places the coating with partial immersion in boiling deionised
water with the bulk of the sample held above the surface. The pressure cooker takes some 15-20
minutes to reach working temperature (~ 125 ºC) and pressure (~ 1.2 atm) at which it was
maintained for 45 minutes. Thereafter, the cooker is allowed to cool and the test pieces removed.
Optical microscopy was performed with a Leica Polyvar equipped with a Nomarski prism for
differential interference contrast technique. The pictures of the coating were taken with a
Colorview Soft Imagining System camera at 20x enlargement.
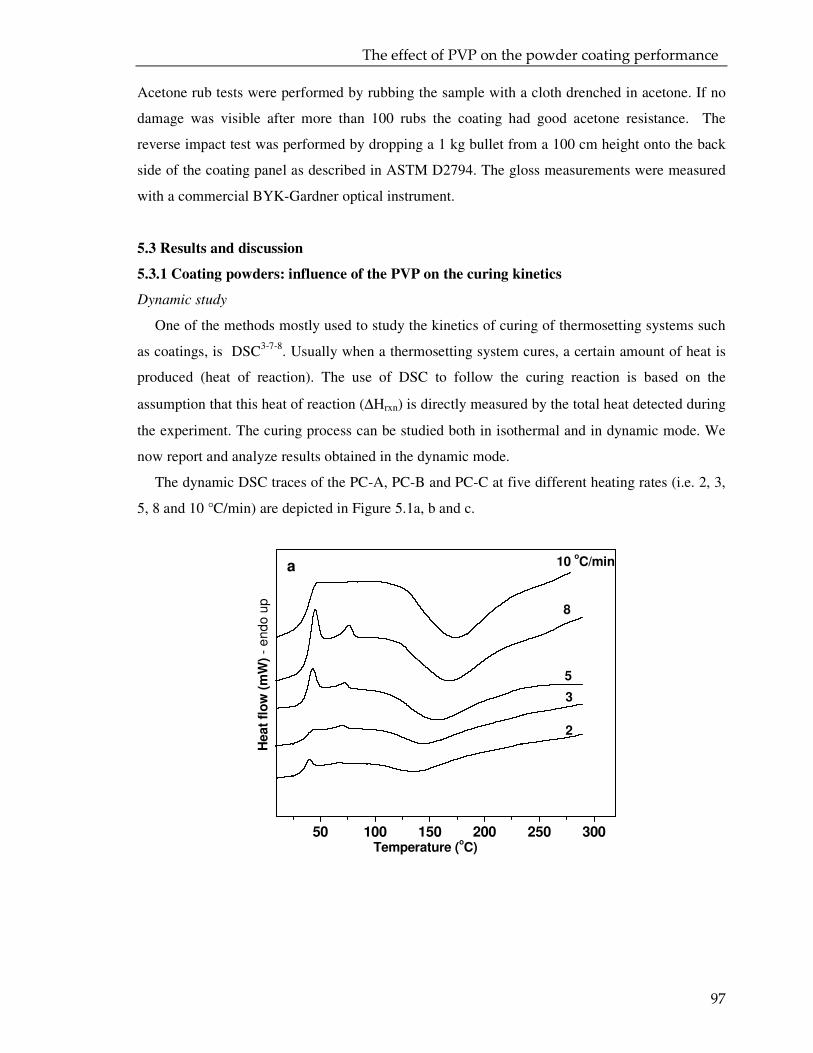
The effect of PVP on the powder coating performance
97
Acetone rub tests were performed by rubbing the sample with a cloth drenched in acetone. If no
damage was visible after more than 100 rubs the coating had good acetone resistance. The
reverse impact test was performed by dropping a 1 kg bullet from a 100 cm height onto the back
side of the coating panel as described in ASTM D2794. The gloss measurements were measured
with a commercial BYK-Gardner optical instrument.
5.3 Results and discussion
5.3.1 Coating powders: influence of the PVP on the curing kinetics
Dynamic study
One of the methods mostly used to study the kinetics of curing of thermosetting systems such
as coatings, is DSC3-7-8. Usually when a thermosetting system cures, a certain amount of heat is
produced (heat of reaction). The use of DSC to follow the curing reaction is based on the
assumption that this heat of reaction (∆Hrxn) is directly measured by the total heat detected during
the experiment. The curing process can be studied both in isothermal and in dynamic mode. We
now report and analyze results obtained in the dynamic mode.
The dynamic DSC traces of the PC-A, PC-B and PC-C at five different heating rates (i.e. 2, 3,
5, 8 and 10 °C/min) are depicted in Figure 5.1a, b and c.
50 100 150 200 250 300
a
8
5
3
10 oC/min
2
Heat
flo
w (
mW
) -
en
do
up
Temperature (oC)
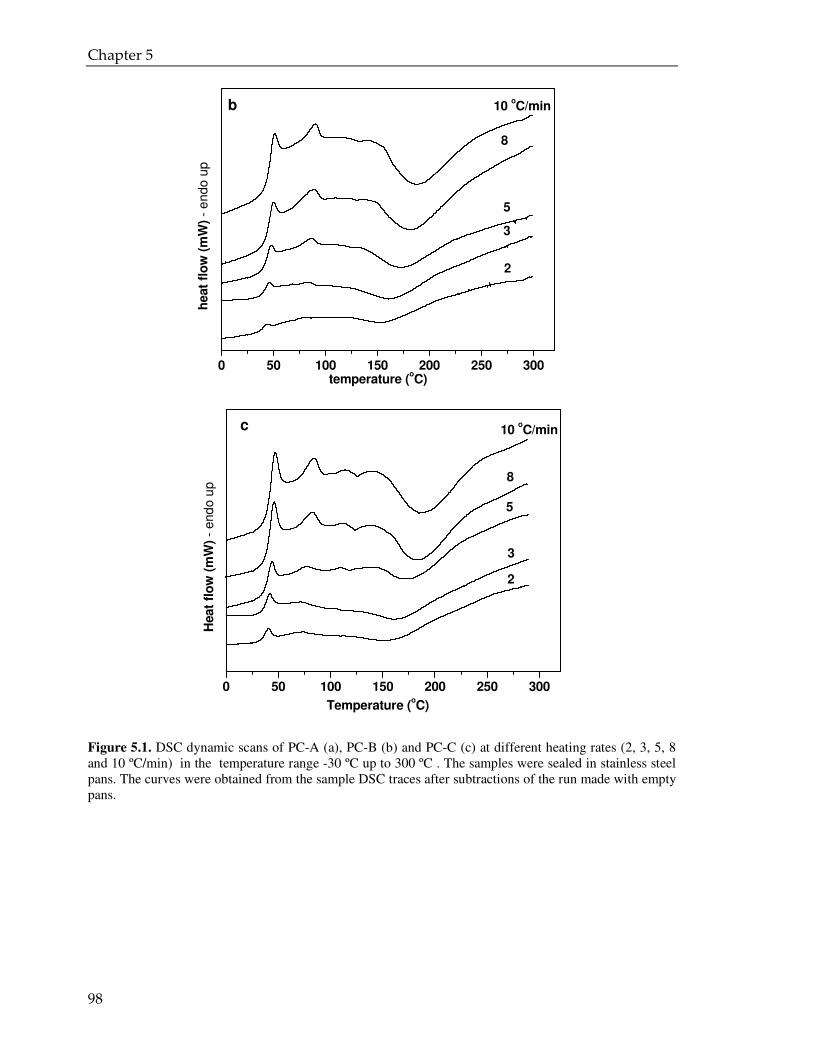
Chapter 5
98
Figure 5.1. DSC dynamic scans of PC-A (a), PC-B (b) and PC-C (c) at different heating rates (2, 3, 5, 8 and 10 ºC/min) in the temperature range -30 ºC up to 300 ºC . The samples were sealed in stainless steel pans. The curves were obtained from the sample DSC traces after subtractions of the run made with empty pans.
0 50 100 150 200 250 300
b
10 oC/min
8
5
3
2
heat
flo
w (
mW
) -
en
do
up
temperature (oC)
0 50 100 150 200 250 300
c
8
5
3
10 oC/min
2
Heat
flo
w (
mW
) -
end
o u
p
Temperature (oC)
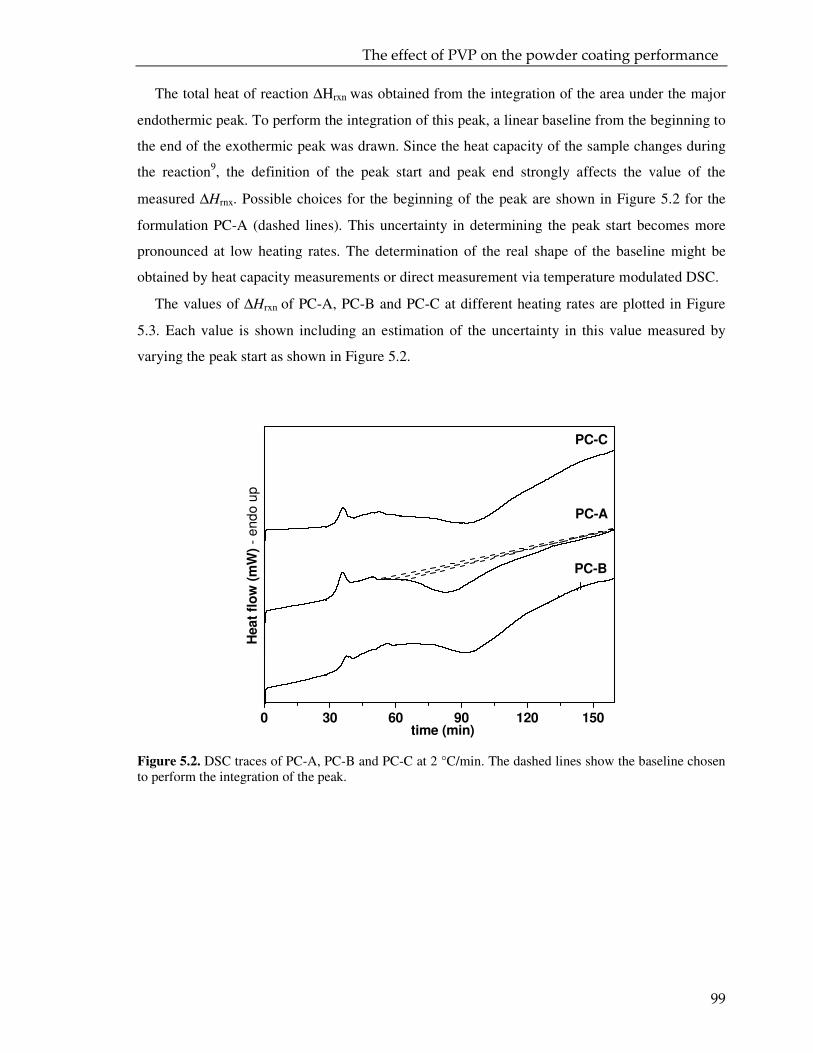
The effect of PVP on the powder coating performance
99
The total heat of reaction ∆Hrxn was obtained from the integration of the area under the major
endothermic peak. To perform the integration of this peak, a linear baseline from the beginning to
the end of the exothermic peak was drawn. Since the heat capacity of the sample changes during
the reaction9, the definition of the peak start and peak end strongly affects the value of the
measured ∆Hrnx. Possible choices for the beginning of the peak are shown in Figure 5.2 for the
formulation PC-A (dashed lines). This uncertainty in determining the peak start becomes more
pronounced at low heating rates. The determination of the real shape of the baseline might be
obtained by heat capacity measurements or direct measurement via temperature modulated DSC.
The values of ∆Hrxn of PC-A, PC-B and PC-C at different heating rates are plotted in Figure
5.3. Each value is shown including an estimation of the uncertainty in this value measured by
varying the peak start as shown in Figure 5.2.
Figure 5.2. DSC traces of PC-A, PC-B and PC-C at 2 °C/min. The dashed lines show the baseline chosen to perform the integration of the peak.
0 30 60 90 120 150
PC-B
PC-C
PC-A
Heat
flo
w (
mW
) -
end
o u
p
time (min)
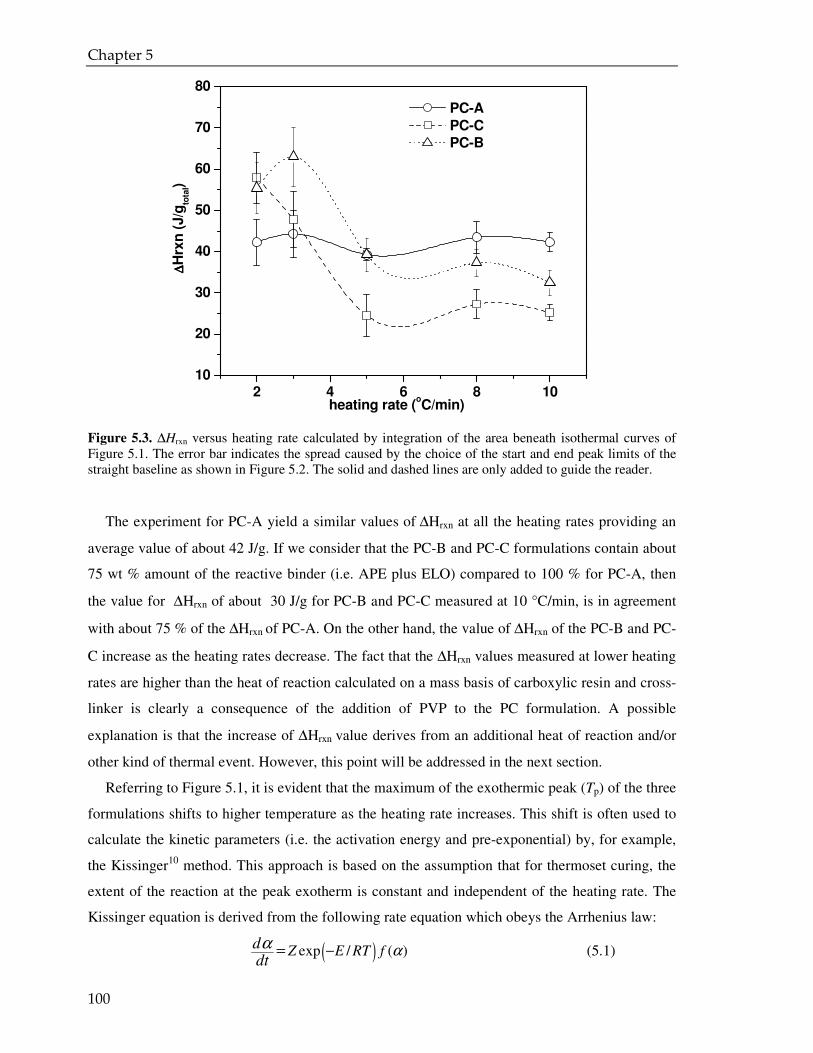
Chapter 5
100
Figure 5.3. ∆Hrxn versus heating rate calculated by integration of the area beneath isothermal curves of Figure 5.1. The error bar indicates the spread caused by the choice of the start and end peak limits of the straight baseline as shown in Figure 5.2. The solid and dashed lines are only added to guide the reader.
The experiment for PC-A yield a similar values of ∆Hrxn at all the heating rates providing an
average value of about 42 J/g. If we consider that the PC-B and PC-C formulations contain about
75 wt % amount of the reactive binder (i.e. APE plus ELO) compared to 100 % for PC-A, then
the value for ∆Hrxn of about 30 J/g for PC-B and PC-C measured at 10 °C/min, is in agreement
with about 75 % of the ∆Hrxn of PC-A. On the other hand, the value of ∆Hrxn of the PC-B and PC-
C increase as the heating rates decrease. The fact that the ∆Hrxn values measured at lower heating
rates are higher than the heat of reaction calculated on a mass basis of carboxylic resin and cross-
linker is clearly a consequence of the addition of PVP to the PC formulation. A possible
explanation is that the increase of ∆Hrxn value derives from an additional heat of reaction and/or
other kind of thermal event. However, this point will be addressed in the next section.
Referring to Figure 5.1, it is evident that the maximum of the exothermic peak (Tp) of the three
formulations shifts to higher temperature as the heating rate increases. This shift is often used to
calculate the kinetic parameters (i.e. the activation energy and pre-exponential) by, for example,
the Kissinger10 method. This approach is based on the assumption that for thermoset curing, the
extent of the reaction at the peak exotherm is constant and independent of the heating rate. The
Kissinger equation is derived from the following rate equation which obeys the Arrhenius law:
( )exp / ( )Z E RT fddt
αα −= (5.1)
2 4 6 8 1010
20
30
40
50
60
70
80
PC-A
PC-C
PC-B
∆∆ ∆∆H
rxn
(J/g
tota
l)
heating rate (oC/min)
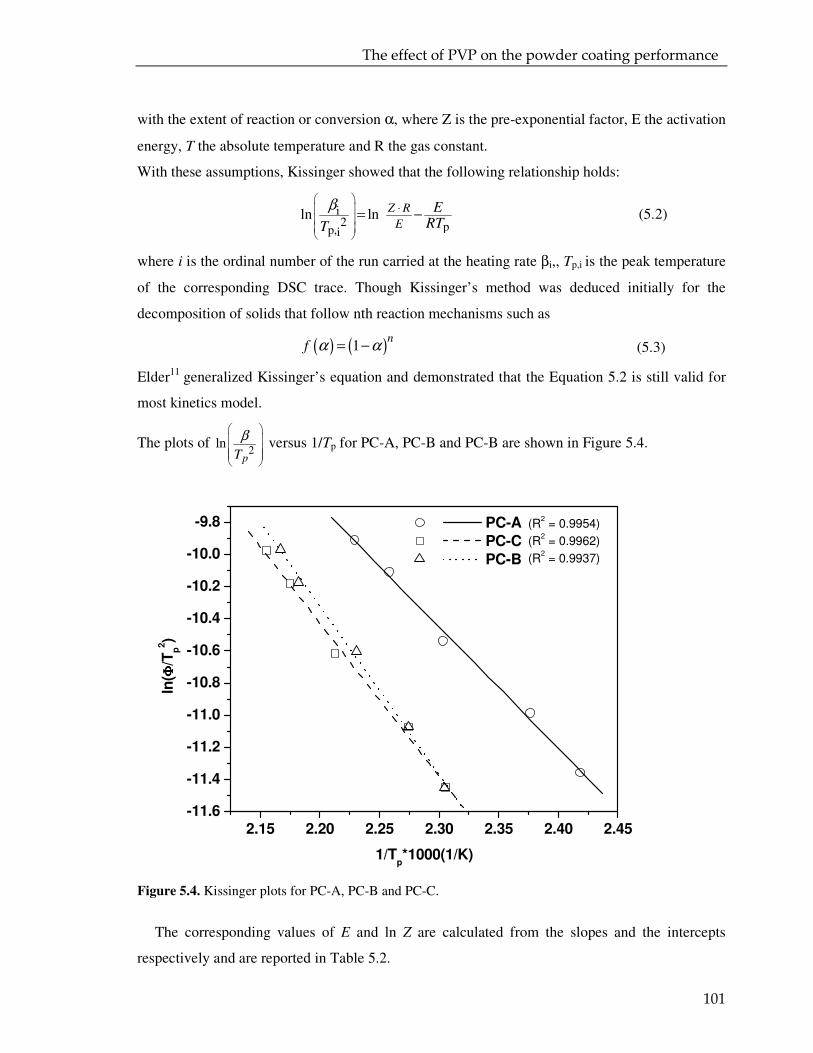
The effect of PVP on the powder coating performance
101
with the extent of reaction or conversion α, where Z is the pre-exponential factor, E the activation
energy, T the absolute temperature and R the gas constant.
With these assumptions, Kissinger showed that the following relationship holds:
i2 pp,i
ln ln Z R
E
ERTT
β
⋅= − (5.2)
where i is the ordinal number of the run carried at the heating rate βi,, Tp,i is the peak temperature
of the corresponding DSC trace. Though Kissinger’s method was deduced initially for the
decomposition of solids that follow nth reaction mechanisms such as
( ) ( )1n
f α α= − (5.3)
Elder11 generalized Kissinger’s equation and demonstrated that the Equation 5.2 is still valid for
most kinetics model.
The plots of 2
lnpT
β
versus 1/Tp for PC-A, PC-B and PC-B are shown in Figure 5.4.
Figure 5.4. Kissinger plots for PC-A, PC-B and PC-C.
The corresponding values of E and ln Z are calculated from the slopes and the intercepts
respectively and are reported in Table 5.2.
2.15 2.20 2.25 2.30 2.35 2.40 2.45-11.6
-11.4
-11.2
-11.0
-10.8
-10.6
-10.4
-10.2
-10.0
-9.8 (R2 = 0.9954)
(R2 = 0.9962)
(R2 = 0.9937)
PC-A
PC-C
PC-B
ln( ΦΦ ΦΦ
/Tp
2)
1/Tp*1000(1/K)
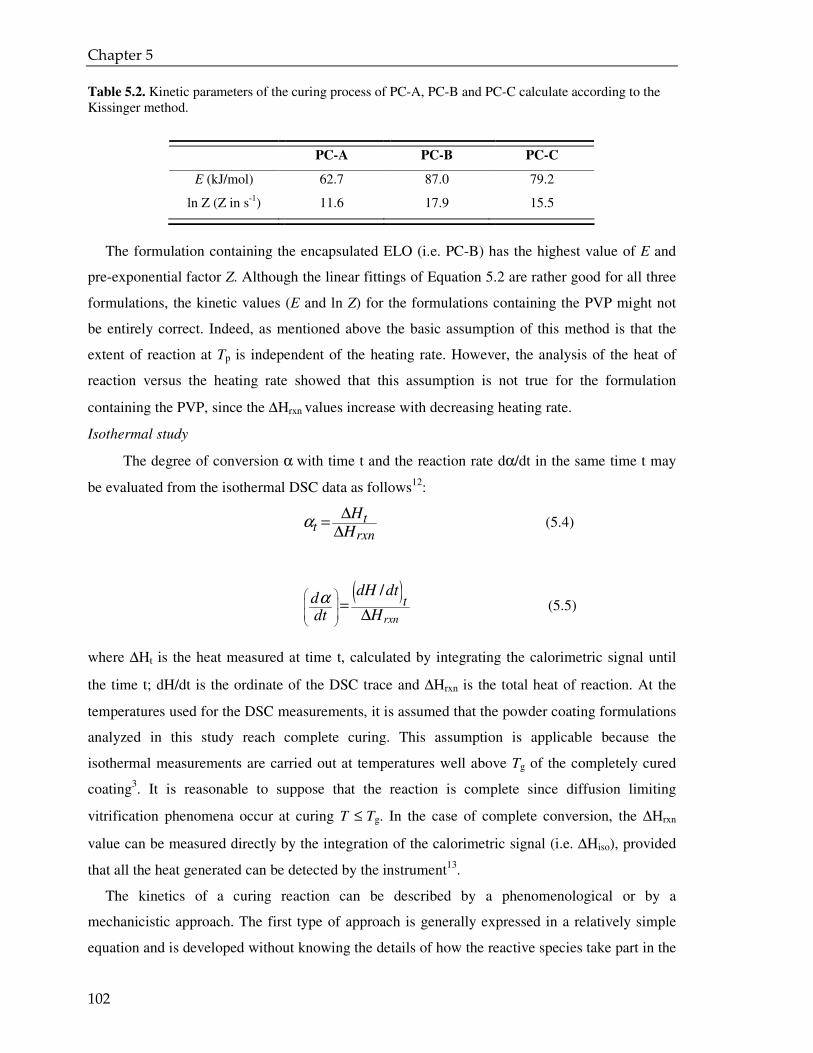
Chapter 5
102
Table 5.2. Kinetic parameters of the curing process of PC-A, PC-B and PC-C calculate according to the Kissinger method.
PC-A PC-B PC-C
E (kJ/mol) 62.7 87.0 79.2
ln Z (Z in s-1) 11.6 17.9 15.5
The formulation containing the encapsulated ELO (i.e. PC-B) has the highest value of E and
pre-exponential factor Z. Although the linear fittings of Equation 5.2 are rather good for all three
formulations, the kinetic values (E and ln Z) for the formulations containing the PVP might not
be entirely correct. Indeed, as mentioned above the basic assumption of this method is that the
extent of reaction at Tp is independent of the heating rate. However, the analysis of the heat of
reaction versus the heating rate showed that this assumption is not true for the formulation
containing the PVP, since the ∆Hrxn values increase with decreasing heating rate.
Isothermal study
The degree of conversion α with time t and the reaction rate dα/dt in the same time t may
be evaluated from the isothermal DSC data as follows12:
tt
rxn
H
Hα
∆=
∆ (5.4)
( )/
rxn
tdH dt
dHdt
α
=∆
(5.5)
where ∆Ht is the heat measured at time t, calculated by integrating the calorimetric signal until
the time t; dH/dt is the ordinate of the DSC trace and ∆Hrxn is the total heat of reaction. At the
temperatures used for the DSC measurements, it is assumed that the powder coating formulations
analyzed in this study reach complete curing. This assumption is applicable because the
isothermal measurements are carried out at temperatures well above Tg of the completely cured
coating3. It is reasonable to suppose that the reaction is complete since diffusion limiting
vitrification phenomena occur at curing T ≤ Tg. In the case of complete conversion, the ∆Hrxn
value can be measured directly by the integration of the calorimetric signal (i.e. ∆Hiso), provided
that all the heat generated can be detected by the instrument13.
The kinetics of a curing reaction can be described by a phenomenological or by a
mechanicistic approach. The first type of approach is generally expressed in a relatively simple
equation and is developed without knowing the details of how the reactive species take part in the
The effect of PVP on the powder coating performance
103
reaction and information of the exact composition of the system is not required. Due to the
complexity of the reactions and the fact that in most commercial applications the exact
composition is not known, the phenomenological approach is often preferred14. In this case, the
reaction rate is expressed by the general equation
( ) ( )d k T fdtα α= (5.6)
with f(α) a function of the degree of conversion α, where k(T) is the rate constant which is
assumed to be only temperature dependent. If k(T) is supposed to follow the Arrhenius behavior,
then equation 5.6 coincides with equation 5.1.
According to the phenomenological approach, the curing reaction can be assimilated to a single
reaction process and the function f(α) can be expressed by a simple equation which is only a
function of the degree of conversion. In this study we used a n-order model to fit the experimental
reaction rate as a function of time. According to this model the isothermal rate equation can be
written as:
( )( )exp / 1a
nZ E RT
ddtα α−= − (5.7)
The Perkin Elmer kinetic software calculates n, Z and Ea based on the general differential
method reported by Flynn15-16. Briefly, according to this approach, first the isothermal cure in the
DSC is recorded at several temperatures and the experimental α and dα/dt are determined at each
temperature; afterwards, these values are adjusted to the following equation by a multilinear
regression analysis:
ln ln ln(1 )d k ndtα α
= + − (5.8)
If the plot of ln ddtα as a function of ( )ln 1 α− is linear, the slope gives the order of the reaction
and the intercept at 0α = provides ln k. The same experimental values of dα/dt and α can be
analyzed by fitting data from each temperature at the same value of α (isoconversional method).
According to the following equation:
( ) a 1ln ln iii
EdZ f
R Tdtα α
= − (5.9)
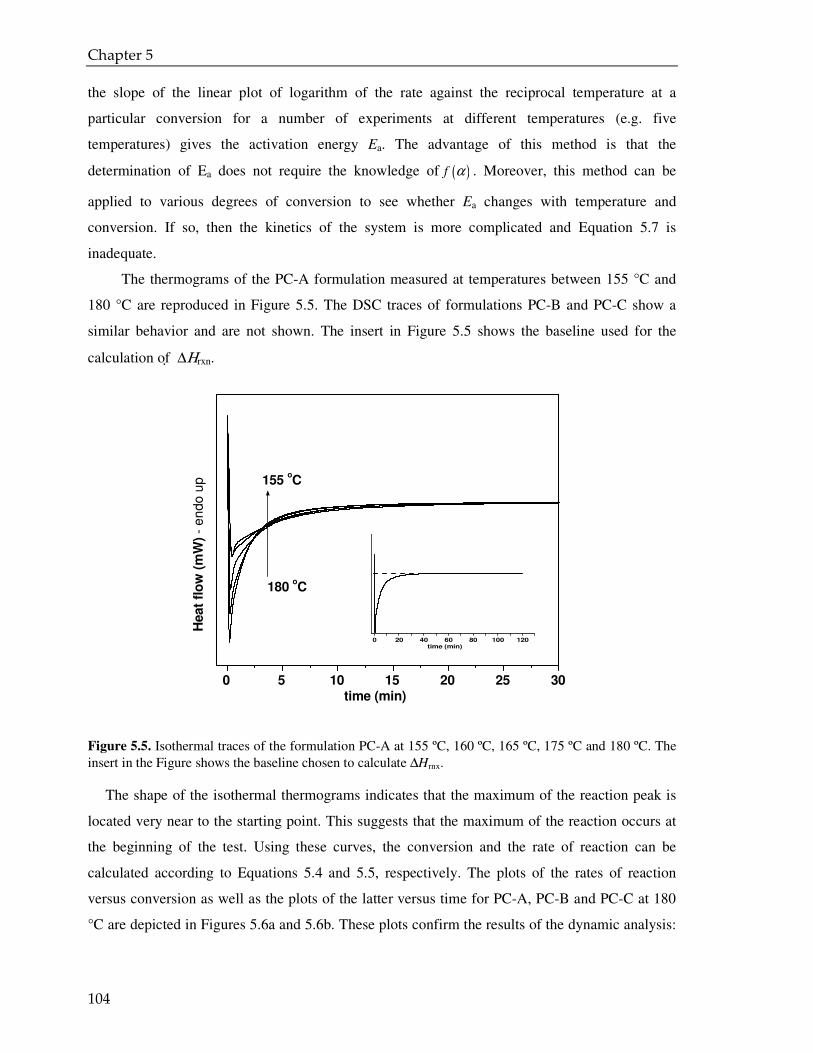
Chapter 5
104
the slope of the linear plot of logarithm of the rate against the reciprocal temperature at a
particular conversion for a number of experiments at different temperatures (e.g. five
temperatures) gives the activation energy Ea. The advantage of this method is that the
determination of Ea does not require the knowledge of ( )f α . Moreover, this method can be
applied to various degrees of conversion to see whether Ea changes with temperature and
conversion. If so, then the kinetics of the system is more complicated and Equation 5.7 is
inadequate.
The thermograms of the PC-A formulation measured at temperatures between 155 °C and
180 °C are reproduced in Figure 5.5. The DSC traces of formulations PC-B and PC-C show a
similar behavior and are not shown. The insert in Figure 5.5 shows the baseline used for the
calculation of ∆Ηrxn.
Figure 5.5. Isothermal traces of the formulation PC-A at 155 ºC, 160 ºC, 165 ºC, 175 ºC and 180 ºC. The insert in the Figure shows the baseline chosen to calculate ∆Hrnx.
The shape of the isothermal thermograms indicates that the maximum of the reaction peak is
located very near to the starting point. This suggests that the maximum of the reaction occurs at
the beginning of the test. Using these curves, the conversion and the rate of reaction can be
calculated according to Equations 5.4 and 5.5, respectively. The plots of the rates of reaction
versus conversion as well as the plots of the latter versus time for PC-A, PC-B and PC-C at 180
°C are depicted in Figures 5.6a and 5.6b. These plots confirm the results of the dynamic analysis:
0 5 10 15 20 25 30
0 20 40 60 80 100 120
time (min)
180 oC
155 oC
Heat
flo
w (
mW
) -
en
do
up
time (min)
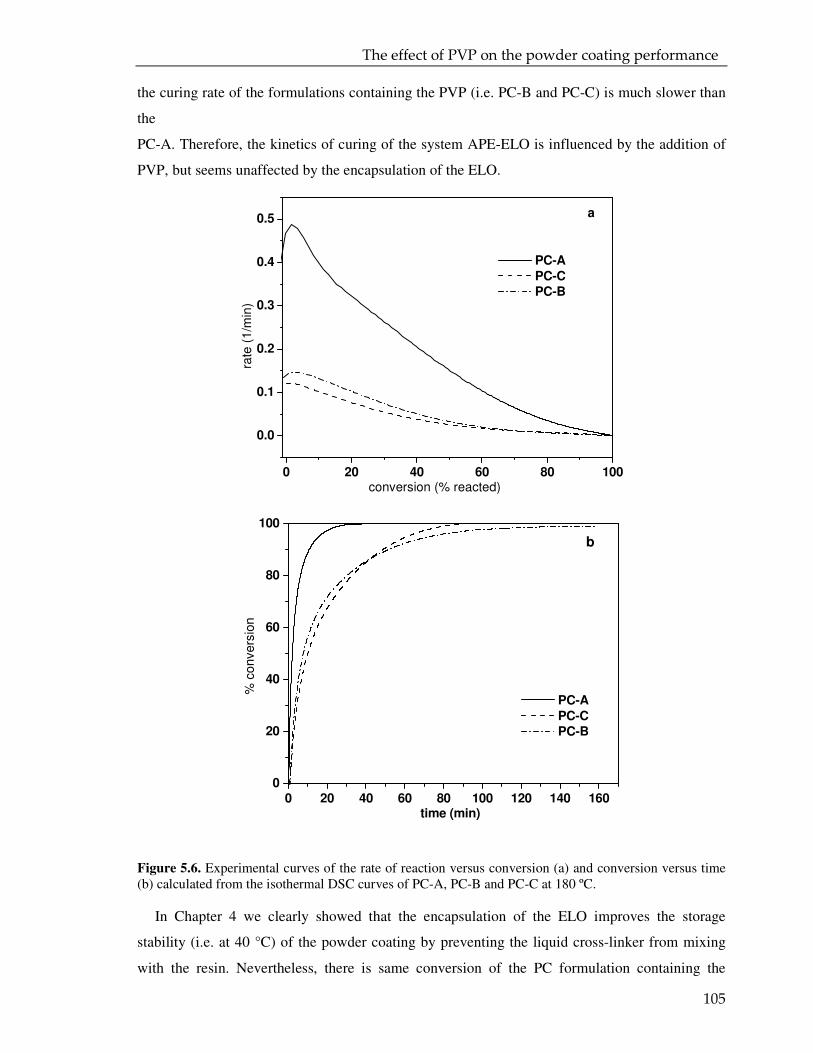
The effect of PVP on the powder coating performance
105
the curing rate of the formulations containing the PVP (i.e. PC-B and PC-C) is much slower than
the
PC-A. Therefore, the kinetics of curing of the system APE-ELO is influenced by the addition of
PVP, but seems unaffected by the encapsulation of the ELO.
Figure 5.6. Experimental curves of the rate of reaction versus conversion (a) and conversion versus time (b) calculated from the isothermal DSC curves of PC-A, PC-B and PC-C at 180 ºC.
In Chapter 4 we clearly showed that the encapsulation of the ELO improves the storage
stability (i.e. at 40 °C) of the powder coating by preventing the liquid cross-linker from mixing
with the resin. Nevertheless, there is same conversion of the PC formulation containing the
0 20 40 60 80 100
0.0
0.1
0.2
0.3
0.4
0.5 a
PC-A
PC-C
PC-B
rate
(1
/min
)
conversion (% reacted)
0 20 40 60 80 100 120 140 160
0
20
40
60
80
100
b
PC-A
PC-C
PC-B
% c
onvers
ion
time (min)
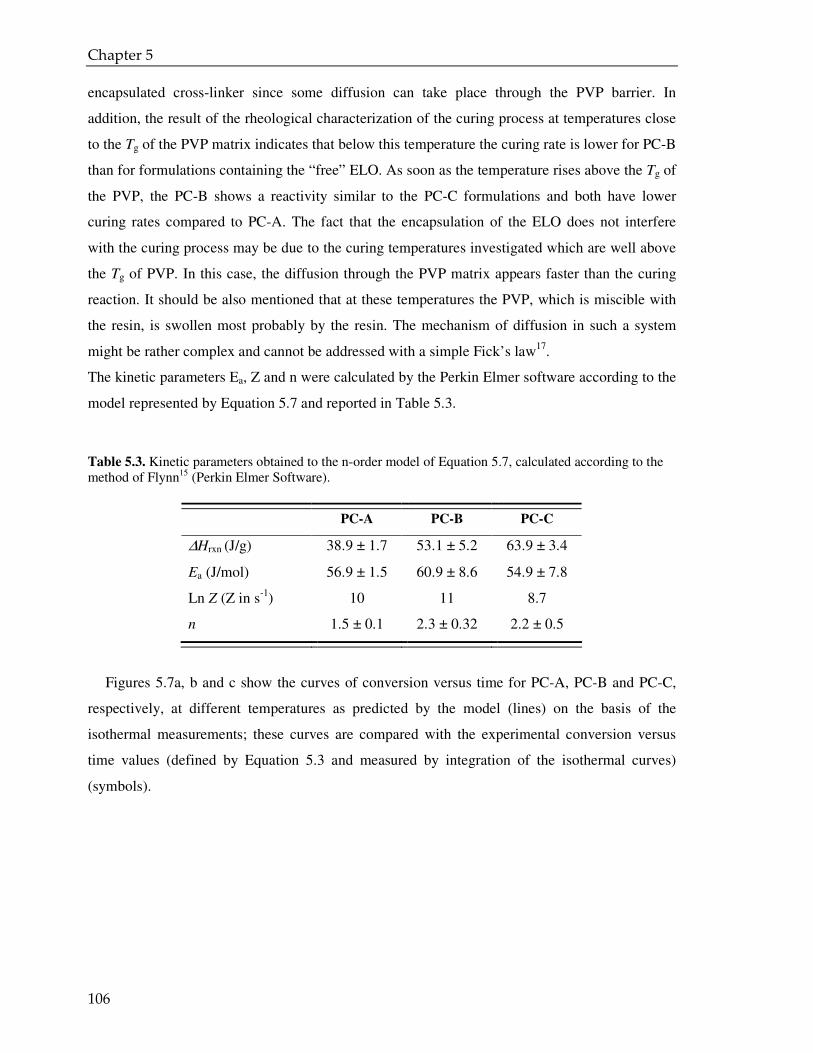
Chapter 5
106
encapsulated cross-linker since some diffusion can take place through the PVP barrier. In
addition, the result of the rheological characterization of the curing process at temperatures close
to the Tg of the PVP matrix indicates that below this temperature the curing rate is lower for PC-B
than for formulations containing the “free” ELO. As soon as the temperature rises above the Tg of
the PVP, the PC-B shows a reactivity similar to the PC-C formulations and both have lower
curing rates compared to PC-A. The fact that the encapsulation of the ELO does not interfere
with the curing process may be due to the curing temperatures investigated which are well above
the Tg of PVP. In this case, the diffusion through the PVP matrix appears faster than the curing
reaction. It should be also mentioned that at these temperatures the PVP, which is miscible with
the resin, is swollen most probably by the resin. The mechanism of diffusion in such a system
might be rather complex and cannot be addressed with a simple Fick’s law17.
The kinetic parameters Ea, Z and n were calculated by the Perkin Elmer software according to the
model represented by Equation 5.7 and reported in Table 5.3.
Table 5.3. Kinetic parameters obtained to the n-order model of Equation 5.7, calculated according to the method of Flynn15 (Perkin Elmer Software).
Figures 5.7a, b and c show the curves of conversion versus time for PC-A, PC-B and PC-C,
respectively, at different temperatures as predicted by the model (lines) on the basis of the
isothermal measurements; these curves are compared with the experimental conversion versus
time values (defined by Equation 5.3 and measured by integration of the isothermal curves)
(symbols).
PC-A PC-B PC-C
∆Hrxn (J/g) 38.9 ± 1.7 53.1 ± 5.2 63.9 ± 3.4
Ea (J/mol) 56.9 ± 1.5 60.9 ± 8.6 54.9 ± 7.8
Ln Z (Z in s-1) 10 11 8.7
n 1.5 ± 0.1 2.3 ± 0.32 2.2 ± 0.5
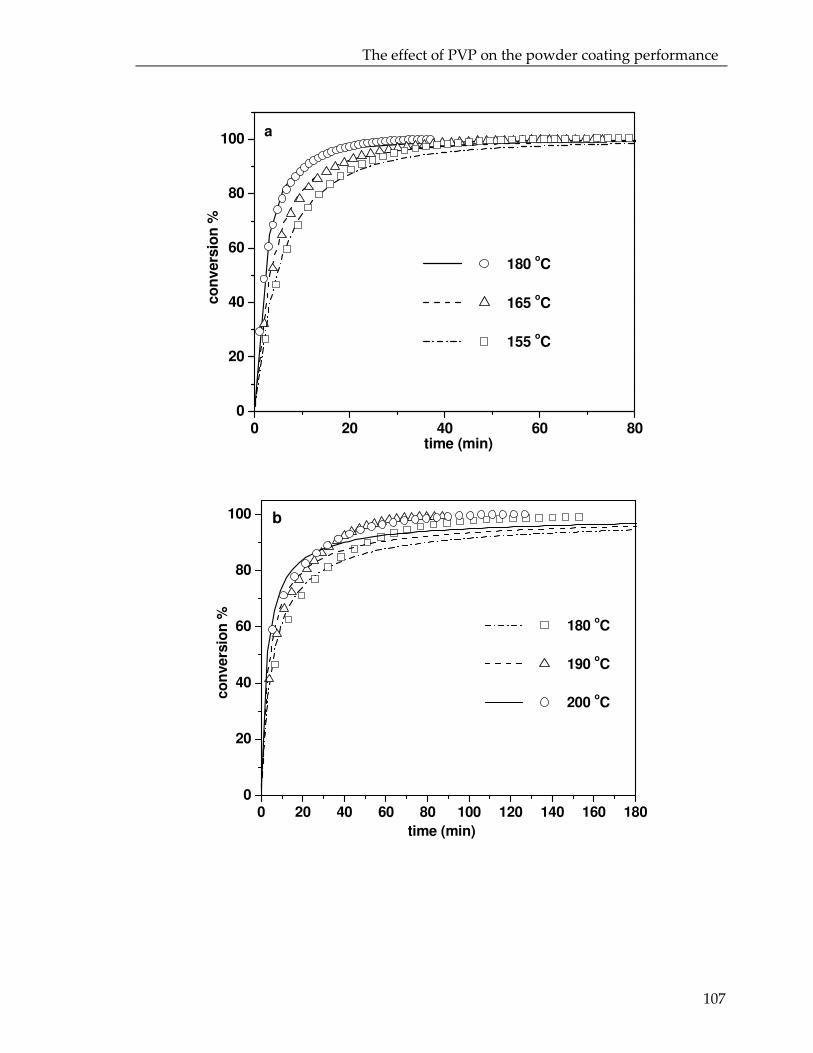
The effect of PVP on the powder coating performance
107
0 20 40 60 80 100 120 140 160 1800
20
40
60
80
100 b
180 oC
190 oC
200 oC
co
nvers
ion
%
time (min)
0 20 40 60 800
20
40
60
80
100
180 oC
165 oC
155 oC
a
co
nvers
ion
%
time (min)
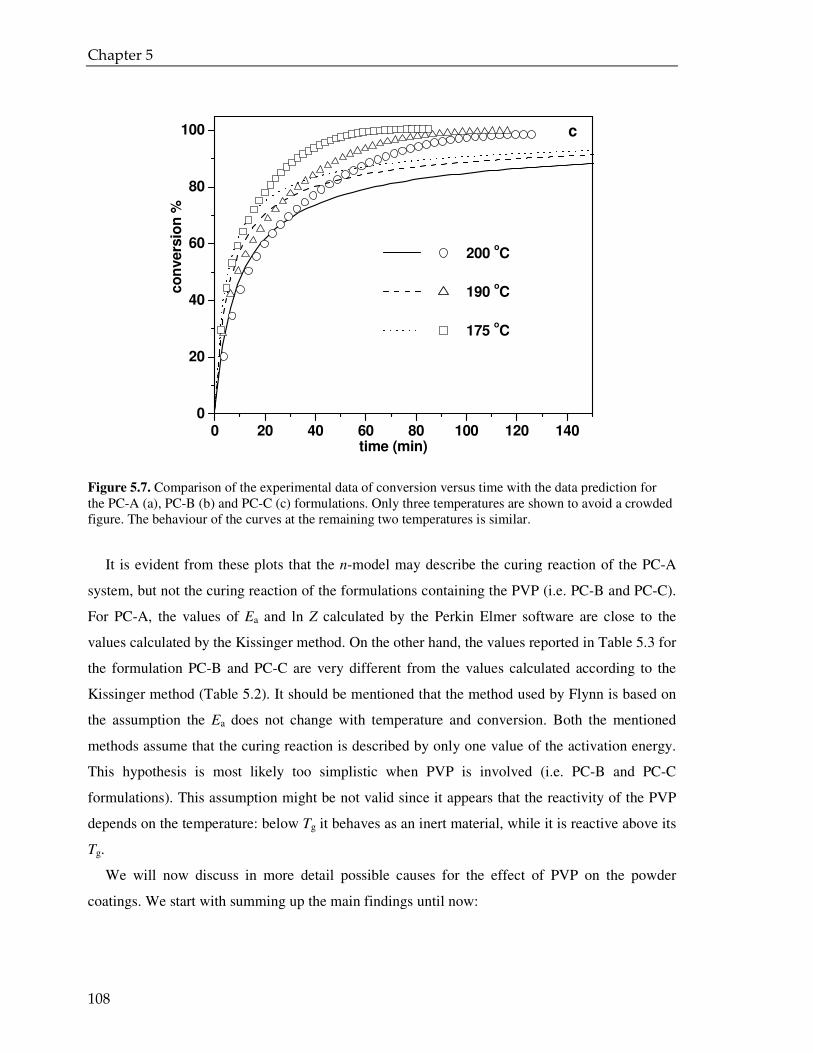
Chapter 5
108
Figure 5.7. Comparison of the experimental data of conversion versus time with the data prediction for the PC-A (a), PC-B (b) and PC-C (c) formulations. Only three temperatures are shown to avoid a crowded figure. The behaviour of the curves at the remaining two temperatures is similar.
It is evident from these plots that the n-model may describe the curing reaction of the PC-A
system, but not the curing reaction of the formulations containing the PVP (i.e. PC-B and PC-C).
For PC-A, the values of Ea and ln Z calculated by the Perkin Elmer software are close to the
values calculated by the Kissinger method. On the other hand, the values reported in Table 5.3 for
the formulation PC-B and PC-C are very different from the values calculated according to the
Kissinger method (Table 5.2). It should be mentioned that the method used by Flynn is based on
the assumption the Ea does not change with temperature and conversion. Both the mentioned
methods assume that the curing reaction is described by only one value of the activation energy.
This hypothesis is most likely too simplistic when PVP is involved (i.e. PC-B and PC-C
formulations). This assumption might be not valid since it appears that the reactivity of the PVP
depends on the temperature: below Tg it behaves as an inert material, while it is reactive above its
Tg.
We will now discuss in more detail possible causes for the effect of PVP on the powder
coatings. We start with summing up the main findings until now:
0 20 40 60 80 100 120 1400
20
40
60
80
100
200 oC
190 oC
175 oC
c
co
nvers
ion
%
time (min)
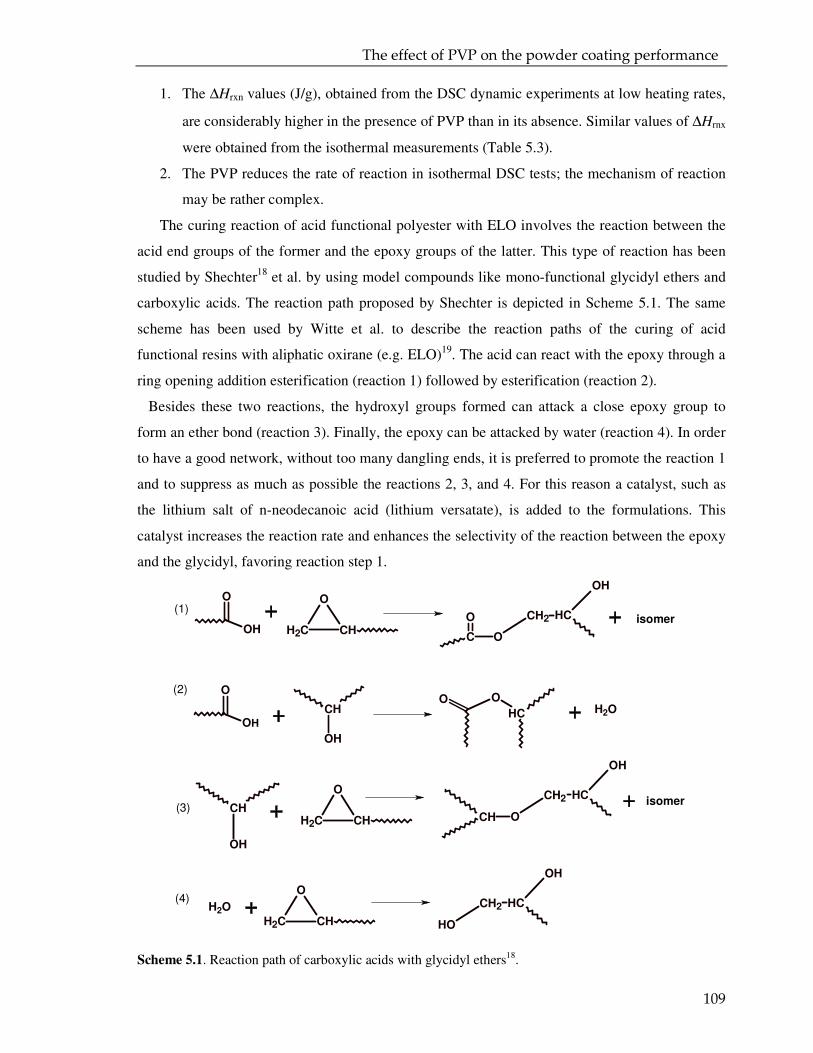
The effect of PVP on the powder coating performance
109
1. The ∆Hrxn values (J/g), obtained from the DSC dynamic experiments at low heating rates,
are considerably higher in the presence of PVP than in its absence. Similar values of ∆Hrnx
were obtained from the isothermal measurements (Table 5.3).
2. The PVP reduces the rate of reaction in isothermal DSC tests; the mechanism of reaction
may be rather complex.
The curing reaction of acid functional polyester with ELO involves the reaction between the
acid end groups of the former and the epoxy groups of the latter. This type of reaction has been
studied by Shechter18 et al. by using model compounds like mono-functional glycidyl ethers and
carboxylic acids. The reaction path proposed by Shechter is depicted in Scheme 5.1. The same
scheme has been used by Witte et al. to describe the reaction paths of the curing of acid
functional resins with aliphatic oxirane (e.g. ELO)19. The acid can react with the epoxy through a
ring opening addition esterification (reaction 1) followed by esterification (reaction 2).
Besides these two reactions, the hydroxyl groups formed can attack a close epoxy group to
form an ether bond (reaction 3). Finally, the epoxy can be attacked by water (reaction 4). In order
to have a good network, without too many dangling ends, it is preferred to promote the reaction 1
and to suppress as much as possible the reactions 2, 3, and 4. For this reason a catalyst, such as
the lithium salt of n-neodecanoic acid (lithium versatate), is added to the formulations. This
catalyst increases the reaction rate and enhances the selectivity of the reaction between the epoxy
and the glycidyl, favoring reaction step 1.
Scheme 5.1. Reaction path of carboxylic acids with glycidyl ethers18.
O
CH2 CH
O
OH
O
CH2 CHC
O
O
CH2 CH
OH
isomer (1)
O
OH
CH
OH
O O
CH OH2
(2)
CH
OH
isomer
OH2
O
CH2 CH OH
CH2 CH
OH
(3)
(4)
CH O
CH2 CH
OH
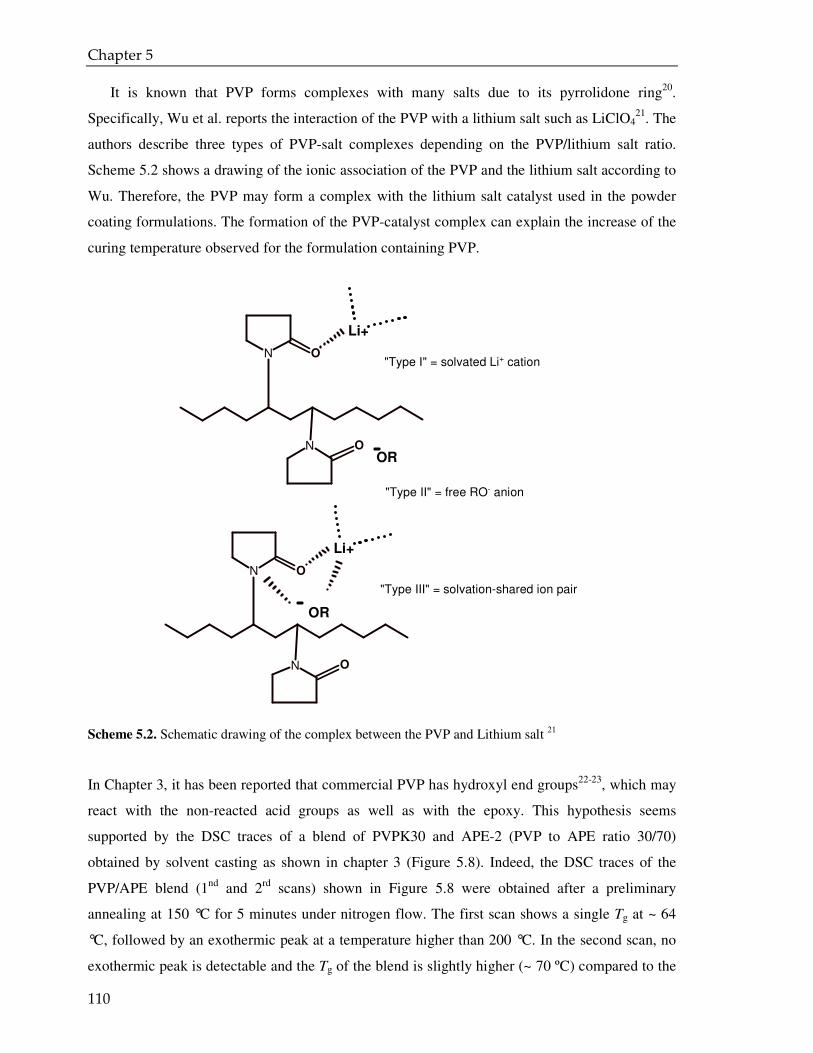
Chapter 5
110
It is known that PVP forms complexes with many salts due to its pyrrolidone ring20.
Specifically, Wu et al. reports the interaction of the PVP with a lithium salt such as LiClO421. The
authors describe three types of PVP-salt complexes depending on the PVP/lithium salt ratio.
Scheme 5.2 shows a drawing of the ionic association of the PVP and the lithium salt according to
Wu. Therefore, the PVP may form a complex with the lithium salt catalyst used in the powder
coating formulations. The formation of the PVP-catalyst complex can explain the increase of the
curing temperature observed for the formulation containing PVP.
Scheme 5.2. Schematic drawing of the complex between the PVP and Lithium salt 21
In Chapter 3, it has been reported that commercial PVP has hydroxyl end groups22-23, which may
react with the non-reacted acid groups as well as with the epoxy. This hypothesis seems
supported by the DSC traces of a blend of PVPK30 and APE-2 (PVP to APE ratio 30/70)
obtained by solvent casting as shown in chapter 3 (Figure 5.8). Indeed, the DSC traces of the
PVP/APE blend (1nd and 2rd scans) shown in Figure 5.8 were obtained after a preliminary
annealing at 150 °C for 5 minutes under nitrogen flow. The first scan shows a single Tg at ~ 64
°C, followed by an exothermic peak at a temperature higher than 200 °C. In the second scan, no
exothermic peak is detectable and the Tg of the blend is slightly higher (~ 70 ºC) compared to the
N
N
O
O
Li+
OR
N
N
O
O
Li+
OR
"Type I" = solvated Li+ cation
"Type II" = free RO- anion
"Type III" = solvation-shared ion pair
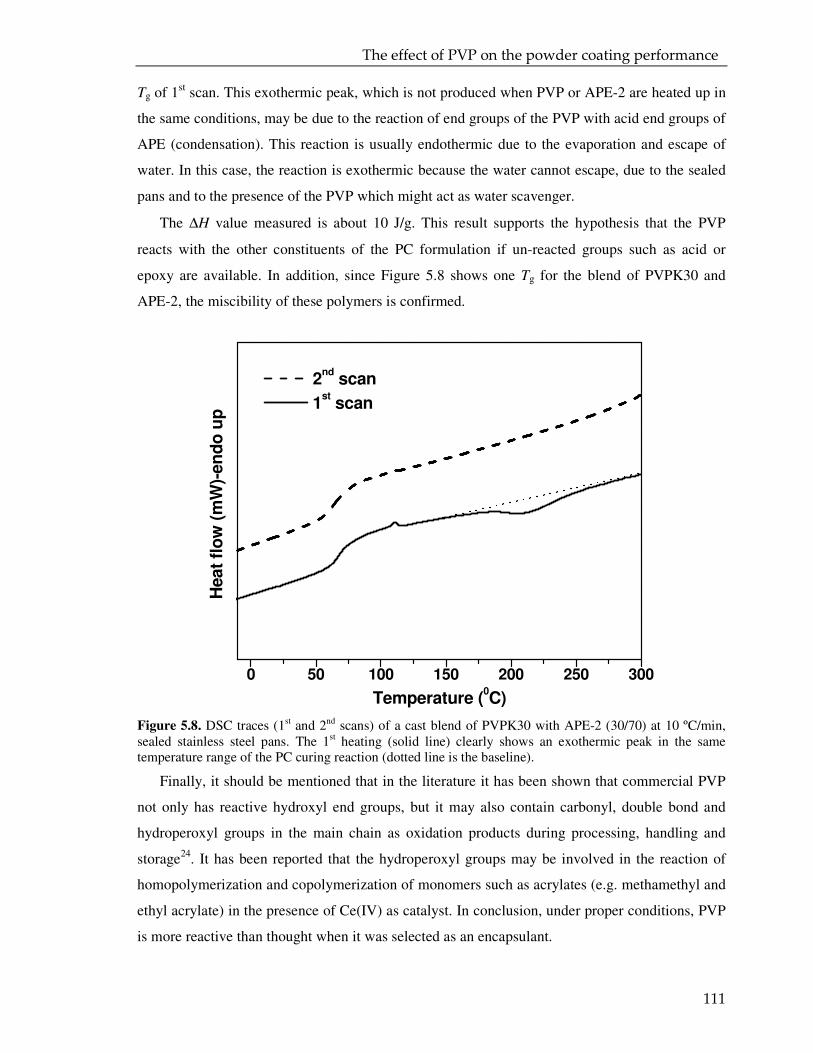
The effect of PVP on the powder coating performance
111
Tg of 1st scan. This exothermic peak, which is not produced when PVP or APE-2 are heated up in
the same conditions, may be due to the reaction of end groups of the PVP with acid end groups of
APE (condensation). This reaction is usually endothermic due to the evaporation and escape of
water. In this case, the reaction is exothermic because the water cannot escape, due to the sealed
pans and to the presence of the PVP which might act as water scavenger.
The ∆H value measured is about 10 J/g. This result supports the hypothesis that the PVP
reacts with the other constituents of the PC formulation if un-reacted groups such as acid or
epoxy are available. In addition, since Figure 5.8 shows one Tg for the blend of PVPK30 and
APE-2, the miscibility of these polymers is confirmed.
Figure 5.8. DSC traces (1st and 2nd scans) of a cast blend of PVPK30 with APE-2 (30/70) at 10 ºC/min, sealed stainless steel pans. The 1st heating (solid line) clearly shows an exothermic peak in the same temperature range of the PC curing reaction (dotted line is the baseline).
Finally, it should be mentioned that in the literature it has been shown that commercial PVP
not only has reactive hydroxyl end groups, but it may also contain carbonyl, double bond and
hydroperoxyl groups in the main chain as oxidation products during processing, handling and
storage24. It has been reported that the hydroperoxyl groups may be involved in the reaction of
homopolymerization and copolymerization of monomers such as acrylates (e.g. methamethyl and
ethyl acrylate) in the presence of Ce(IV) as catalyst. In conclusion, under proper conditions, PVP
is more reactive than thought when it was selected as an encapsulant.
0 50 100 150 200 250 300
2nd
scan
1st scan
Heat
flo
w (
mW
)-en
do
up
Temperature (0C)
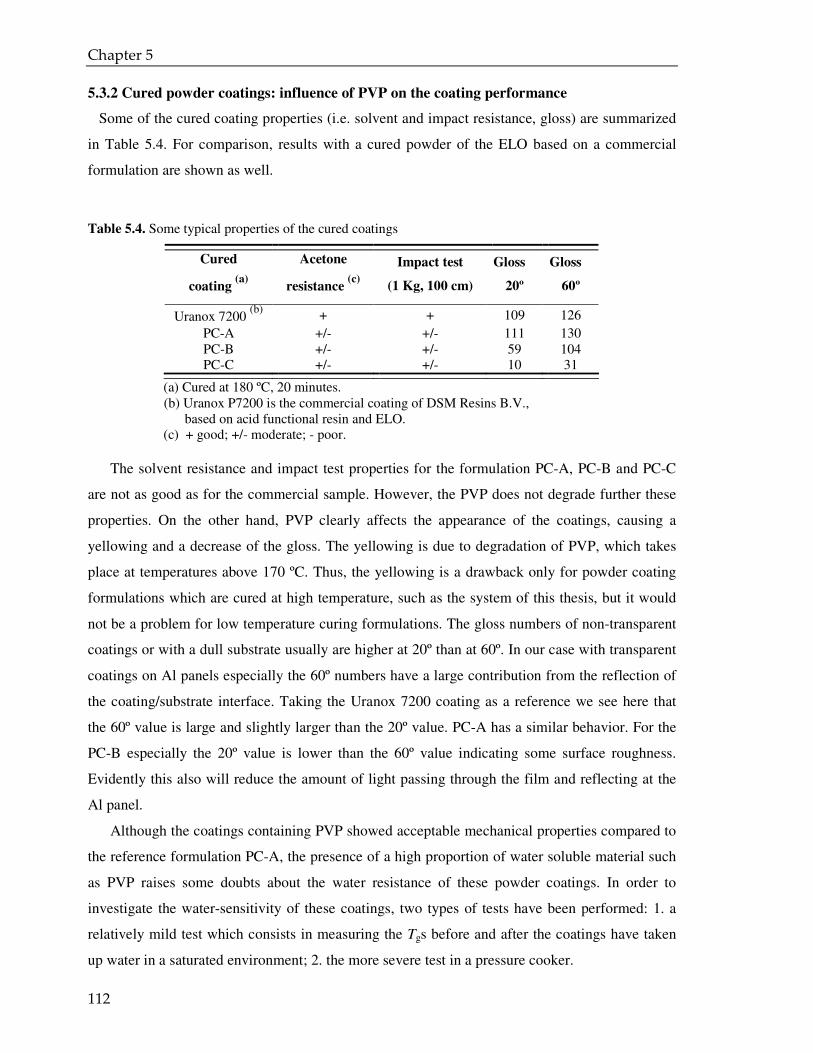
Chapter 5
112
5.3.2 Cured powder coatings: influence of PVP on the coating performance
Some of the cured coating properties (i.e. solvent and impact resistance, gloss) are summarized
in Table 5.4. For comparison, results with a cured powder of the ELO based on a commercial
formulation are shown as well.
Table 5.4. Some typical properties of the cured coatings
Cured
coating (a)
Acetone
resistance (c)
Impact test
(1 Kg, 100 cm)
Gloss
20º
Gloss
60º
Uranox 7200 (b)
+ + 109 126 PC-A +/- +/- 111 130 PC-B +/- +/- 59 104 PC-C +/- +/- 10 31
(a) Cured at 180 ºC, 20 minutes. (b) Uranox P7200 is the commercial coating of DSM Resins B.V.,
based on acid functional resin and ELO. (c) + good; +/- moderate; - poor.
The solvent resistance and impact test properties for the formulation PC-A, PC-B and PC-C
are not as good as for the commercial sample. However, the PVP does not degrade further these
properties. On the other hand, PVP clearly affects the appearance of the coatings, causing a
yellowing and a decrease of the gloss. The yellowing is due to degradation of PVP, which takes
place at temperatures above 170 ºC. Thus, the yellowing is a drawback only for powder coating
formulations which are cured at high temperature, such as the system of this thesis, but it would
not be a problem for low temperature curing formulations. The gloss numbers of non-transparent
coatings or with a dull substrate usually are higher at 20º than at 60º. In our case with transparent
coatings on Al panels especially the 60º numbers have a large contribution from the reflection of
the coating/substrate interface. Taking the Uranox 7200 coating as a reference we see here that
the 60º value is large and slightly larger than the 20º value. PC-A has a similar behavior. For the
PC-B especially the 20º value is lower than the 60º value indicating some surface roughness.
Evidently this also will reduce the amount of light passing through the film and reflecting at the
Al panel.
Although the coatings containing PVP showed acceptable mechanical properties compared to
the reference formulation PC-A, the presence of a high proportion of water soluble material such
as PVP raises some doubts about the water resistance of these powder coatings. In order to
investigate the water-sensitivity of these coatings, two types of tests have been performed: 1. a
relatively mild test which consists in measuring the Tgs before and after the coatings have taken
up water in a saturated environment; 2. the more severe test in a pressure cooker.
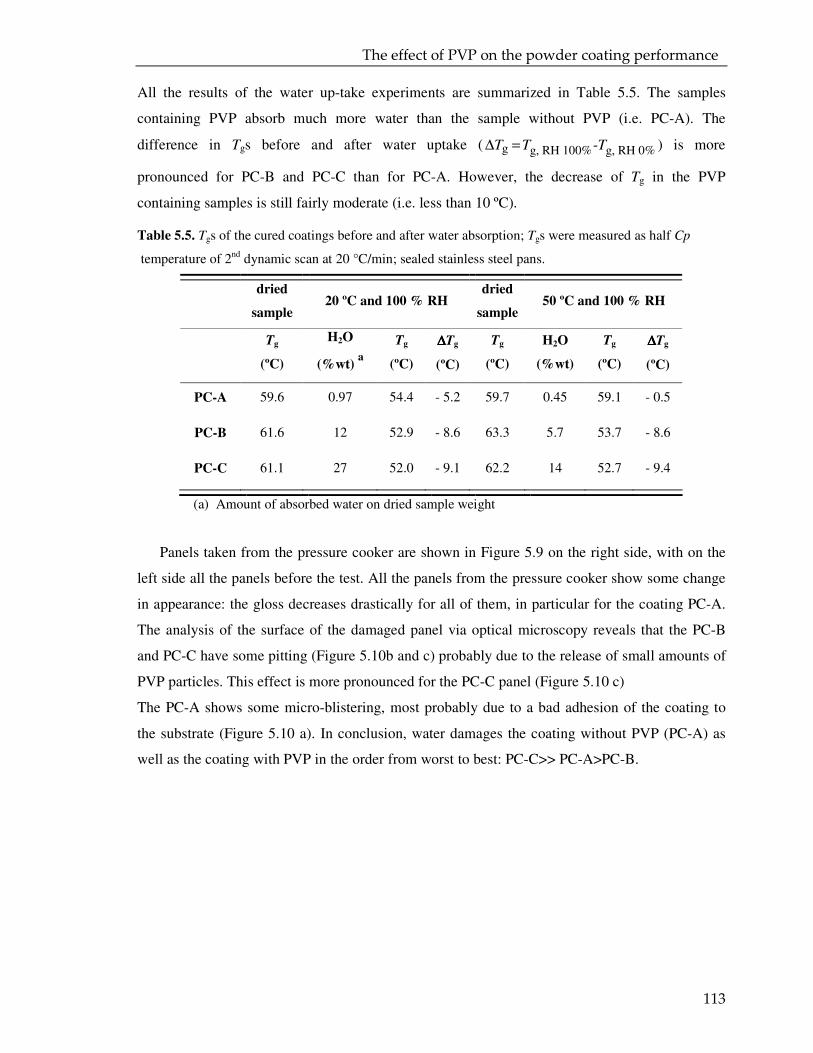
The effect of PVP on the powder coating performance
113
All the results of the water up-take experiments are summarized in Table 5.5. The samples
containing PVP absorb much more water than the sample without PVP (i.e. PC-A). The
difference in Tgs before and after water uptake ( g g, RH 100% g, RH 0%-T T T∆ = ) is more
pronounced for PC-B and PC-C than for PC-A. However, the decrease of Tg in the PVP
containing samples is still fairly moderate (i.e. less than 10 ºC).
Table 5.5. Tgs of the cured coatings before and after water absorption; Tgs were measured as half Cp
temperature of 2nd dynamic scan at 20 °C/min; sealed stainless steel pans.
dried
sample 20 ºC and 100 % RH
dried
sample 50 ºC and 100 % RH
Tg
(ºC)
H2O
(%wt) a
Tg
(ºC)
∆∆∆∆Tg
(ºC)
Tg
(ºC)
H2O
(%wt)
Tg
(ºC)
∆∆∆∆Tg
(ºC)
PC-A 59.6 0.97 54.4 - 5.2 59.7 0.45 59.1 - 0.5
PC-B 61.6 12 52.9 - 8.6 63.3 5.7 53.7 - 8.6
PC-C 61.1 27 52.0 - 9.1 62.2 14 52.7 - 9.4
(a) Amount of absorbed water on dried sample weight
Panels taken from the pressure cooker are shown in Figure 5.9 on the right side, with on the
left side all the panels before the test. All the panels from the pressure cooker show some change
in appearance: the gloss decreases drastically for all of them, in particular for the coating PC-A.
The analysis of the surface of the damaged panel via optical microscopy reveals that the PC-B
and PC-C have some pitting (Figure 5.10b and c) probably due to the release of small amounts of
PVP particles. This effect is more pronounced for the PC-C panel (Figure 5.10 c)
The PC-A shows some micro-blistering, most probably due to a bad adhesion of the coating to
the substrate (Figure 5.10 a). In conclusion, water damages the coating without PVP (PC-A) as
well as the coating with PVP in the order from worst to best: PC-C>> PC-A>PC-B.
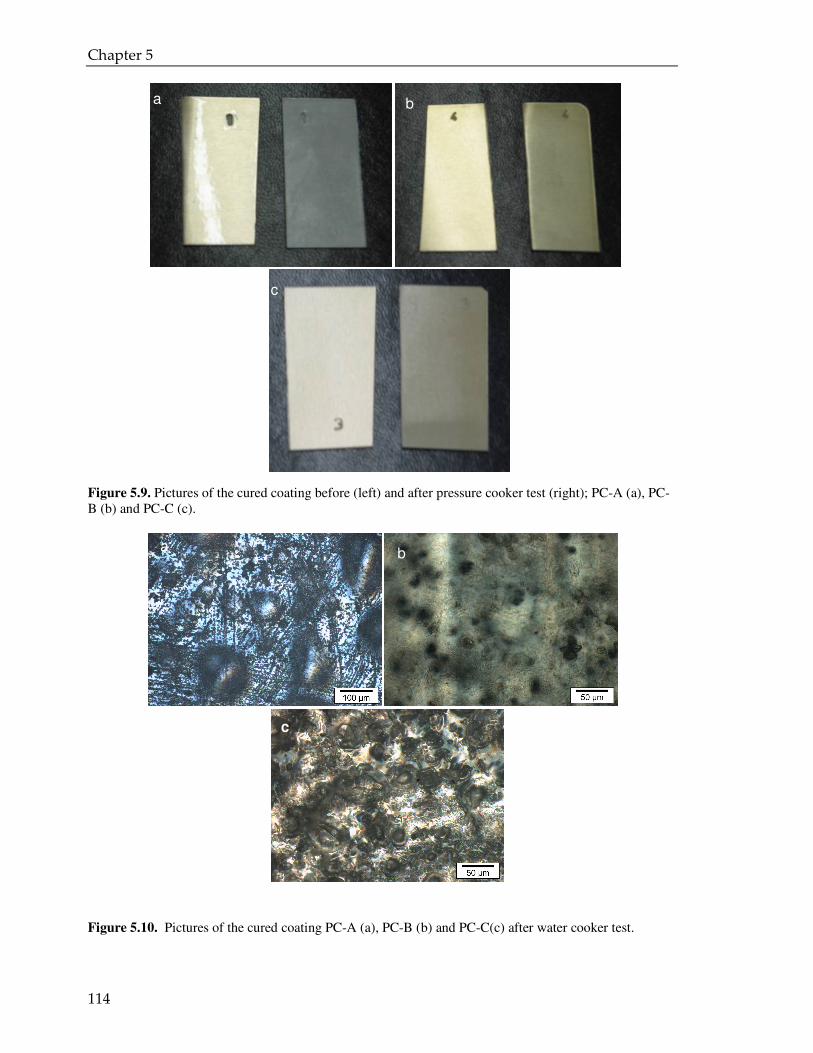
Chapter 5
114
Figure 5.9. Pictures of the cured coating before (left) and after pressure cooker test (right); PC-A (a), PC-B (b) and PC-C (c).
Figure 5.10. Pictures of the cured coating PC-A (a), PC-B (b) and PC-C(c) after water cooker test.
a b
c
a b
c
The effect of PVP on the powder coating performance
115
5.4 Conclusions
The effect of PVP in a PC formulation has been investigated with respect to the curing kinetics
and the final coating properties.
PVP reduces the curing rate and increases the heat of reaction. A plausible explanation might
be that the PVP forms an ionic complex with the lithium salt based catalyst. The formation of
such a complex would hinder the catalyst from taking part in the main curing reaction.
In addition, at the high temperatures used for the curing process (Tcure » Tg, PVP), PVP
becomes a “reactive” additive. The increase in reaction heat might be due to side reactions
involving PVP. However, based on the available experimental data, a complete explanation of
how PVP influences the curing process of the PC formulation cannot be given unambiguously.
The thermal, mechanical and optical surface analyses of the coating show that the addition of
~25 wt % PVP, as an encapsulant, to the PC formulation is only slightly detrimental to it.
Chapter 5
116
5.5 References
(1) Solomon, D. H.;Hawthorne D.G. Chemistry of pigments and fillers, Wiley Interscience, Chichester, 1983. (2) Patton, T. C. Pigment Handbook, John Wiley & Sons, New York, 1973. (3) Prime R.B. Thermal characterization of polymeric materials, 2nd, Academic Press, New York, 1997. (4) Bank, M.; Bayless, R.; Botham, R.; Shank, P. Modern Plastics, 1973, 50, 11, 84-86. (5) Misev, T. A. Powder coatings: chemistry and technology, John Wiley and Sons, Inc., New York,
1991. (6) Perkin Elmer, Pyris Kinetics Software Guide, www.perkinelmer.com, accessed on 2002. (7) Barton, J. M. Thermochimica Acta, 1983, 71, 3, 337-344. (8) Richardson, M. J. Pure and Applied Chemistry, 1992, 64, 11, 1789-1800. (9) Hemminger, W. F.; Sarge, S. M. Journal of Thermal Analysis, 1991, 37, 7, 1455-1477. (10) Kissinger, H. E. Analytical Chemistry, 1957, 29, 11, 1702-1706. (11) Elder, J. P. Journal of Thermal Analysis, 1985, 30, 3, 657-669. (12) Salla, J. M.; Ramis, X. Journal of Applied Polymer Science, 1994, 51, 3, 453-462. (13) Salla, J. M.; Ramis, X. Polymer Engineering and Science, 1996, 36, 6, 835-851. (14) Yousefi, A.; Lafleur, P. G.; Gauvin, R. Polymer Composites, 1997, 18, 2, 157-168. (15) Flynn, J. H. Journal of Thermal Analysis, 1991, 37, 2, 293-305. (16) Flynn, J. H. Journal of Thermal Analysis, 1988, 34, 1, 367-381. (17) Wesselingh, J. A. Journal of Controlled Release, 1993, 24, 1-3, 47-60. (18) Shechter, L.; Wynstra, J. Industrial and Engineering Chemistry, 1956, 48, 1, 86-93. (19) Witte, F. M.; Goemans, C. D.; van der Linde, R.; Stanssens, D. A. Progress in Organic Coatings,
1997, 32, 1-4, 241-251. (20) Blecher, L.; Lorenz, D. H.; Lowd, H. L.; Wood, A. S.; Wyman, D. P. Handbook of water-soluble
gums and resins, McGraw-Hill, New York, 1980.
(21) Wu, H. D.; Wu, I. D.; Chang, F. C. Polymer, 2001, 42, 2, 555-562. (22) Washio, I.; Xiong, Y. J.; Yin, Y. D.; Xia, Y. N. Advanced Materials, 2006, 18, 13, 1745. (23) Raith, K.; Kuhn, A. V.; Rosche, F.; Wolf, R.; Neubert, R. H. H. Pharmaceutical Research, 2002, 19,
4, 556-560.
(24) Staszewska, D. U. Angewandte Makromolekulare Chemie, 1983, 118, 1-17.


6 Epilogue
117
In this chapter, the aim of the thesis is described and also the approach followed to achieve the goals. The main results are set out and some recommendations for the improvement for future research are given.
Chapter 6
118
6.1 Aim of the project
The aim of this thesis was to investigate the potential of encapsulating a liquid crosslinker in a
polymer matrix to improve the chemical and physical stability of a powder coating formulation.
The aim was not to apply this technology to low temperature curing powders but rather to
investigate the applicability of the idea to liquid crosslinkers. In future, its application to
formulations able to cure at low temperature (<140 °C) may indeed be a very interesting one.
Encapsulation and controlled release in such a case may be a way to solve the intrinsic chemical
and physical instability of a low temperature powder coating formulation.
6.2 Encapsulation of the cross-linker
The benefit of encapsulating a crosslinker can be expected when the crosslinker is a liquid at
storage temperature because the encapsulation will prevent the crosslinker’s lowering of the glass
transition temperature of the powder coating formulation. This will improve the stability at
storage temperature, both physically (free-flowing, non-sticky powder) and chemically
(suppressed premature cross linking). At the same time, encapsulating a liquid is much more
challenging than encapsulating a solid. For these reasons a crosslinker of the liquid type was
chosen. Epoxidized linseed oil (ELO) was chosen as liquid crosslinker. It is a liquid, yellowish oil
that is used to cure acid functional polyesters, generally, at temperatures higher than 180 °C.
In Chapter 2 it was shown that the liquid crosslinker can indeed be encapsulated in a matrix of
in poly(N-vinyl-pyrrolidone) (PVP), a water soluble polymer. The method of encapsulation was
spray drying.
Why spry drying as the encapsulation method? Why a hydrophilic encapsulant?
In literature, several methods of encapsulation are described, but the choice of the spray drying
was dictated by the following preferences:
1. to use a method which does not involve organic solvent; hence, to use an environmentally
friendly method such as the powder coating is.
2. to use a method which is fast, straightforward, simple and easy to scale up; thus to have a
method which could be easily applied by industry.
On other hand, the biggest limitation of spray drying is the low amount of active materials on
total amount of powder (payload). The value generally reported in literature is not higher then 30
wt %. The payload can be increased but generally will require the use of organic solvent.
Consequently, the choice of spray drying would not have been an environmentally friendly
technique anymore. In addition, it would be more expansive for an industry to handle a large
amount of organic solvent.
Epilogue
119
In Chapter 2 it was shown how to optimize the dispersion of liquid ELO in an aqueous
solution of PVP to obtain a fine emulsion, which could be successfully sprayed by means of a lab
scale spray-drier (BÜCHI B290). We used PVP as encapsulant because it is a water soluble
polymer as required by the encapsulation method, and because it has good emulsifying and film
forming properties. A suitable water-soluble encapsulant has also to be non-miscible with the
crosslinker and, more important, non-reactive towards it. Last, but not least, the Tg of the
encapsulant was a key factor of this study: it had to be high enough to guarantee good protection
upon storage and melt extrusion, but low enough to allow the release of the cross-linker upon
curing. The selected PVP is both immiscible and inert towards the ELO. In addition, it has a Tg
which varies from 54 °C to 175 °C depending on molecular weight and the amount of absorbed
water.
6.2.1 Mini-emulsion polymerization and spray drying as alternative route of encapsulation
As an alternative route to microenpsulation via spray-drying, mini-emulsion polymerization
experiments were carried out (nanoencapsulation)1-3.
The ELO was mixed with the monomer (methylmethacrylate or styrene) and an oil-soluble
initiator (AIBN). The ratio of ELO to monomer varied from 1:4 up to 2:1. This oil phase was then
added to an aqueous sodium dodecyl sulphate solution (SDS, 1% w/w). The mixture was mixed
by means of high ultrasonic stirring (Sonic Sonifier) in order to get an oil in water emulsion with
oil droplet sizes between 50-500 nm (mini-emulsion). Finally, the emulsion was heated up to 70
ºC and the radical polymerization of MMA or styrene started. If the polymerization occurs in the
oil droplets (mini-reactors), followed by phase separation of the polymer, the formation of
nanoparticles with a specific morphology (i.e. core-shell, hemisphere, individual particle) is
obtained. The conversion of the monomer was very high (i.e. > 95%).The latex particles had an
average particle size of about 100 nm and a narrow particle size distribution. The characterization
of the morphology of the nanoparticles via transmission electron microscopy was complicated by
the fact that the polymer shell and the active material had similar refractive indices, which did not
allow distinguishing between the two. The use of a staining agent for the polymer solved the
problem. As the latex produced contained about 80 wt % water, it has to be dried in order to be
used in a powder coating formulation. As directly evaporating water led to a non-redispersible
lump of material, spray drying could be used in this case as a simple de-hydratation method.
The combination of the mini-emulsion polymerization and spray drying might be a good
alternative to PVP involved spray drying technique mentioned, since it is still environmentally
Chapter 6
120
friendly and the payload may easily be higher than 30 wt %. Unfortunately, this route could not
be further investigated since lack of time forced us to set other priorities.
6.3 Characterization of the microparticles
Although spray drying as an encapsulation process appears very straightforward, in reality
many parameters can affect the result. In Chapter 2, we identified three main factors which affect
the payload and the encapsulation efficiency: the spray flow (i.e. the air flow in the spray nozzle),
the concentration of ELO and PVP in water and the ELO to PVP weight ratio. Using a design of
experiment approach (DoE), we were able to conclude that it is not possible for this system
(ELO/PVP) to have a spray dried sample which has both a high payload and a high efficiency.
The analysis of the morphology of the spray dried powders (SDP) via Scanning Electron
Microscopy (SEM) demonstrated that the SDP, with the highest payload and lowest efficiency
(i.e. DoE 5), comprised hollow and incomplete particles. On the other hand, the powder with the
high efficiency and low payload (i.e. DoE 3) consisted of microparticles which were intact and
had thick smooth shells. The analysis of the ELO droplet size distribution of the emulsion
reconstituted by dissolving spray dried powder in water suggested that, during the spraying, the
droplets of ELO collapse and form bigger droplets compared to the droplet size before spraying.
These observations confirmed our preliminary hypothesis which guided us also to the choice of
the main factors: at fixed concentrations of core, shell and surfactant in the initial emulsion,
higher efficiencies of encapsulation are found for larger sizes of the spray dried particle sizes and
for smaller initial ELO droplets.
Based on the results of Chapter 2, a free flowing powder (spray dried powder, SDP) of 20 wt
% payload and of 90 % encapsulation efficiency was prepared. The LS analysis showed that this
spray dried powder had a wide particle size distribution with an average diameter of 16 µm. The
SEM analysis confirmed the polydispersity of SDP and revealed interesting details about the SDP
morphology. The outer surface of the SDP appeared smooth and free of cracks and pores. The
spherical microparticles showed a typical feature of spray-dried powders: the indentation of the
surface. Big particles, with a smooth surface and less dents, were also found during the SEM
analysis. The SEM analysis of the inner morphology of the SDP illustrated another typically
feature of a spray dried particle: the presence of a void surrounded by a thick wall. Finally, the
SEM analysis showed clearly that the ELO was dispersed as droplets of below 1 µm in the thick
wall apparently composed of PVP.
Epilogue
121
6.4 Preparation of the powder coating formulation and curing
The SDP was used as cross-linker of acid functional polyester (APE) in a powder coating
formulation (PC-B). All the components of the coating powder formulations were pre-mixed in a
coffee grinder and then extruded with a 16 mm twin-extruder (Prism) at 100 °C and 100 rpm.
Upon exiting the extruder die, the melt was cooled at room temperature. The PC formulation
containing the encapsulated cross-linker was compared with two other formulations based on the
same APE, but containing free ELO: PC-A and PC-C. The former can be seen as the reference
mixture and contains no PVP. Into the latter, PVP powder was added to the same amount as the
amount of PVP encapsulant used in PC-B. Indeed, a complicating factor in this study was the use
of microparticles which contained about 20 wt % of active material and 80 % wt of PVP. Based
on the total composition of the coating formulation, the addition of the spray dried particles
implied the addition of a certain amount of PVP (about 26 wt %).
As it appeared to be the first time that a hydrophilic thermoplastic polymer was mixed with
acid functional polyester (APE) and the other ingredients of a typical PC formulation, also the
miscibility of the ingredients involved, especially that of the polymers, had to investigated. In
Chapter 3, the characterization of blends of PVP and APE by Differential Scanning Calorimetry
(DSC), Attenuated Reflectance Fourier Transform Infrared (ATR-FTIR) and Cross-Polarization
Magic Angle Spinning (CPMAS) 13C NMR spectroscopy revealed that the two polymers are
completely miscible depending on the acid value of the resin and on the Mw of the PVP. The
nature of the interactions was studied via the ATR-FTIR technique. The shifts of the carbonyl
peaks of both the PVP and the APE resins to a higher frequency (blue shift) upon blending
suggested that electric dipole-dipole interactions take place between the two polymers. Besides,
the temperature-dependent ATR-FTIR results showed that the broad shoulder of the PVP
carbonyl peak at 1630 cm-1 can be ascribed to H-bonds between the carbonyl groups of the PVP
and the acid-end groups of the APEs.
The fact that PVP is miscible with the polyester it is an advantage: once the encapsulated
crosslinker is mixed into the powder coating formulation, the inactive part of the microparticles,
is not detrimental by phase separation effects in the powder coating formulation. Indeed, as
reported in Chapter 5, the thermal, mechanical and optical surface analyses of cured coatings
show that the addition of ~25 wt % PVP, as an encapsulant, to the PC formulation is only slightly
detrimental. Moreover, as a consequence of increasing the temperature above the glass transition
temperature of the resin and the PVP, up to the cure temperature, the two components tend to
mix. Possibly the low molecular weight resin does swell the PVP while the ELO, being almost
Chapter 6
122
immiscible with PVP, diffuses through the PVP matrix to outside the SDP. Thus, the crosslinker
is released, mixed with the polyester and the crosslinking reaction can proceed.
Upon storage at a temperature of 40 °C, the PC-B is the most stable of the three formulations.
Definitely, its Tg increases only a little upon storage, while a stronger rise is measured for both
PC-A and PC-C. A similar trend was found for the temperature at which the powder coating
powder melts (i.e. Tflow): prior to storage at 400 C, PC-B has the highest value but, after storage,
the Tflow of the PC-A and PC-C increased more than the Tflow of PC-B. The measurement of the
reaction enthalpy (∆H), as calculated from the exothermic peak of the DSC trace, confirmed that
the progress of conversion during storage was much more pronounced for the PC-A and PC-C
formulations than for PC-B. Since the temperature of storage was quite close to the Tg of the PC-
formulations, we conclude that after some time the reaction kinetics converted from reaction
controlled to diffusion controlled due to the increase of Tg to beyond Tstorage. The fact that the
conversion of PC-B was still significant on storage may be due to the available free ELO; part of
the cross-linker is present at the surface of the PVP microparticles (free ELO) and probably reacts
with the resin as it does in PC-A and PC-C. If we consider that the free ELO is maximum 15 wt
% of the total ELO, this amount should give a maximum conversion of reaction equal to 15 %.
This explanation might partially justify the conversion found for the PC-B. The higher value of
conversion found (30 %) may be due to diffusion of some of the encapsulated ELO through the
PVP wall or due to some breaking of capsules during extrusion. It would be interesting to look at
microcapsules embedded in the coating powder soon after the extrusion and verify that no-
breaking had happened.
However, the rather high amount of PVP involved is a complicating factor: although we
wanted to study the effect of the encapsulation on the curing process of the powder coating
formulation, the presence as such of PVP in the formulation could have an effect of the kinetics
of curing.
The curing process of the powder coating formulations was also studied by dynamic
mechanical rheological testing. The measurement of the complex viscosities of the PC
formulations at increasing temperature (temperature sweep) showed that the encapsulation of the
ELO provides a delay of the starting of the curing reaction, which appeared to be triggered by the
glass transition of the PVP. On increasing the temperature, the coating powders are melted and
easily flow until the curing reaction begins. PC-A and PC-C exhibited approximately the same
viscosity minimum (ηmin) while the PC-B formulation had a lower ηmin but shifted to a higher
temperature. The behavior of the formulation PC-B is probably the consequence of the
encapsulation of the cross-linker: the starting of the curing is delayed by the encapsulation, but as
Epilogue
123
soon as the temperature is above the Tg of the PVP, the cross-linker is released and mixes with
the resin whereafter the viscosity begins to rise.
It is known that the time and the temperature range at which the viscosity reaches the
minimum (flow window) affect the flow and the extent of leveling of the coating. Since the
formulation containing the encapsulated ELO had a lower ηmin shifted at higher temperature, we
may suppose that the flow of the PC-B formulation during the curing cycle is better in
comparison to to that of PC-A and PC-C. An useful indicator of the total degree of flow would be
the “inclined plane flow” test: a pellet of coating powder, prepared by means of pressing powder
in a mould press, is placed horizontal to the glass plate that has been preheated to the test
temperature. The glass plate stands in an oven on a metal plate which is capable of being
maintained in both horizontal and inclined positions by means of a lever without opening the
oven door. When the pellet is slightly molten in a flat position for a certain time, the plate is tilted
to 65° and kept in this position for 15 minutes. The amount of flow is measured as the length of
the trace that is made by the molten powder4. It would be interesting to carry out the inclined
plane flow test for the fresh and stored powder coating formulations as an additional test to
confirm that the encapsulation increases the extent of flow on cure of the either or not pre-stored
powder coating.
Chapter 6
124
6.5 References
(1) Tiarks, F.; Landfester, K.; Antonietti, M. Langmuir 2001, 17, 908-918.
(2) van Zyl, A. J. P.; Sanderson, R. D.; de Wet-Roos, D.; Klumperman, B. Macromolecules 2003, 36, 8621-8629.
(3) Chen, W. P.; Zhu, M. F.; Song, S.; Sun, B.; Chen, Y. M.; Adler, H. J. P. Macromolecular Materials
and Engineering 2005, 290, 669-674.
(4) De Lange P.G. Powder coatings: chemistry and technology, 2nd edition, William Andrew Publishing; 2004.


SUMMARY
125
Many objects used in everyday life like refrigerators, air conditioning cabinets, dish-
washers, automobiles or motorbikes are made of metal parts which are powder coated. A powder
coating formulation is essentially a dry paint composed of a resin, a cross-linker, pigments and
several additives. These ingredients are melted, usually at 90 °C - 110 ºC, and homogeneously
mixed by means of an extruder. After extrusion, the melt is cooled at ambient temperature,
ground and sieved. After that, the powder coating typical is applied electrostatically on the object
to be coated. The process is completed when the applied powder melts and cures by heating the
object to a temperature usually between 150 ºC and 200 ºC. No organic solvents are needed and
this is why powder coatings are environmentally safer than many other paint systems.
The current trend in powder coatings is to use formulations which cure at 100 °C - 140 ºC.
Curing at low temperature not only saves energy, but it is especially useful with substrates that
are heat-sensitive like MDF (medium density fiber), wood and plastic. In order to enable low
temperature curing, a sufficiently high reaction rate at such temperature is required. However, as
the kinetics of curing of a thermosetting powder coating normally follow a classical Arrhenius
equation, a higher curing rate at lower cure temperature also implies a chemically less stable
system during melt extrusion and upon storage. Moreover, in the need to find a crosslinker that is
environmentally friendlier and less toxic than the widely used triglycidyl isocyanurate (TGIC),
the use of other, including liquid, cross-linkers has been explored. To their disadvantage, liquid
crosslinkers can act as plasticizers and lower the glass transition temperature (Tg) of the resin,
compromising its physical stability upon storage.
The aim of this thesis was to investigate the potential of the encapsulation of a liquid
crosslinker in a polymer matrix to control the chemical and physical stability of a powder coating
formulation.
We studied the encapsulation of a liquid cross-linker, epoxidized linseed oil (ELO), using a
high Tg polymer, poly(N-vinyl-2-pyrrolidone) (PVP), as encapsulating material. Spray drying
was used as the method of encapsulation, because it is a rather fast, low-cost and environmentally
friendly process. Three main factors which could affect the payload and the encapsulation
efficiency of the spray dried particles were identified: the spray flow, the concentration of
additives (ELO, PVP and surfactant) to water and the ELO to PVP ratio in the water-based spray
feed. Using a design of experiment approach (DoE), we concluded that it is not possible for this
system (ELO/PVP) to have a spray dried sample which has both a high payload (total amount of
epoxidized linseed oil in the powder) and high encapsulation efficiency (amount of epoxidized
linseed oil enclosed in the polyvinylpyrrolidone). The analysis of the morphology of the spray
dried powders (SDP) via Scanning Electron Microscopy (SEM) demonstrated that the SDP with
Summary
126
the highest payload and lowest efficiency (DoE 5) comprised mainly hollow and incomplete
particles. On the other hand, the powder with high efficiency and low payload (DoE 3) consisted
of microparticles which were intact and had thick walls.
Based on these results, we were able to optimize the encapsulation of the liquid cross-linker
in a matrix of PVP. A free flowing powder (SDP) which had a payload of ~ 20 wt % and high
efficiency of encapsulation of ~ 85 % was prepared. The SDP was used as cross-linker of acid
functional polyester (APE) in a powder coating formulation (PC-B). This PC formulation was
compared with two other formulations based on the same APE, but containing free ELO: PC-A
and PC-C. PC-A can be seen as the reference mixture and contains no PVP. In the PC-C, PVP
powder was added to the same amount as the amount of PVP encapsulant used in PC-B.
The differential scanning calorimeter (DSC) analysis of the three powder coating
formulations after storage at 40 °C showed that the PC-B is the most stable of the three
formulations. Indeed, its Tg increases little upon storage, while PC-A and PC-C showed a
stronger rise. The magnitude of the reaction enthalpy (∆H), as calculated from the exothermic
peak of a DSC trace, confirmed that the conversions in the PC-A and PC-C formulations were
much higher then PC-B.
The curing process of the powder coating formulations was studied by dynamic mechanical
rheological testing. The measurement of the complex viscosities of the PC formulations at
increasing temperature (temperature sweep) showed that the encapsulation of the ELO provides a
delay of the starting of the curing reaction, which appeared to be triggered by the glass transition
of the PVP. The evolution of the storage (G’) and loss (G”) moduli at 90 °C (below the Tg of the
PVP) indicates a time lag in the curing reaction (cross-over point of G’ and G’ = approximate gel
time) of PC-B. This time lag is much less pronounced at the temperature of 140 °C, which is
already above the Tg of the PVP. In addition, the formulations containing the PVP (PC-B and PC-
C) had the same “gel time” at 140 °C, which was somewhat higher than the cross-over point of
PC-A formulation. This result shows that the PVP, once it has been “melted”, slows down the
reaction of the epoxy with the acid.
The effect of PVP in a PC formulation was more extensively investigated with respect to
the curing kinetics and the final coating properties.
The PVP reduces the curing rate and increases the heat of reaction. A plausible explanation
is that the PVP forms an ionic complex with the lithium salt based catalyst. The formation of such
a complex would hinder the catalyst from taking place in the main curing reaction. In addition,
when using relatively high cure temperatures (Tcure » Tg,PVP), the PVP becomes a “reactive”
additive. The increase in reaction heat may be due to side reactions involving the PVP. Thermal,
Microencapsulation for controlled released of liquid crosslinker
127
mechanical and optical surface analyses of the cured coating showed that the addition of ~25 wt
% PVP, as an encapsulant, to a PC formulation is only slightly detrimental to it.
In addition, blends of PVP with APE resins were studied. According to the DSC results, the
two polymers are completely miscible depending on the acid values of the resin and the Mw of the
PVP. The nature of the interactions was studied via ATR-FTIR technique. The shifts of the
carbonyls of both the PVPs and the APE resins to a higher frequency (blue shift) upon blending
suggest that electric dipole-dipole interactions take place between the two polymers. In addition,
temperature-dependent ATR-FTIR results show that the broad shoulder of the PVP carbonyl peak
at 1630 cm-1 can be ascribed to H-bonds between the carbonyl groups of the PVP and the acid-
end groups of the APEs. The CPMAS 13C NMR spectra of blends of the acid functional polyester
resin of neopentylglycol and isophthalic acid (model resin) with the PVP of Mw as the one used
in the PC-formulation showed systematic up-field shift of the PVP and resin carbonyl resonances.
This result confirms that specific molecular interactions are involved between the two polymers.

Acknowledgments
129
I did not believe this moment would come! If I am writing these lines, it means those four
years of experiments, joy, frustration and etc. are over. Strange coincidence: even Leonard Cohen
sings “Alleluia, alleluia” from my radio!
This moment would not have been possible without the help of other people.
First of all, I would like to thank prof. Bert de With, prof. Rolf van Benthem and dr. Jos Laven
for their guidance. Bert and Rolf, besides the scientific discussions during the “biweekly
coaching meeting”, I will always remember the positive attitude and the encouragement received
especially during the last year of the PhD. Your words have been a source of inspiration and
optimism which helped to overcome the moment of hesitation and pessimism.
Jos, thanks a lot for all the efforts you have made to improve the quality of this manuscript. I also
want to thank you in advance for your help for the articles which are going to come. Hartelijk
bedankt!
I would like to thank the members of my committee prof. Mats Johansson (KTH, Sweden),
prof. Erik Nies (University of Leuven) and prof. Arend J. Schouten (University of Groningen) for
having read my thesis and having found the time to attend my defense.
My gratitude goes also to prof. Marshall Ming for being always available, if I asked, although I
was not one of his PhD students. Dear Marshall, I wish you all the best for your carrier and your
own life in the States.
I am very glad I have met dr. Alexander Kodentsov. Sascha, thanks a lot for the SEM
instructions and for all the help I received from you: whenever I needed something you had
always a solution.
The Dutch Polymer Institute (DPI) is also thanked for the financial support (project #422). I
would like to thank dr. John van Haare for the organization of the meetings, his support, his
suggestions and his enthusiasm. I also thank Sean Alexander (DSM), Shila de Vries (DPI) and
Jaap Renkema (DPI) for the support received during the preparation and submission of the patent.
I would like to thank all the industrial contact peoples whom I have met for their suggestions,
support and enthusiasm. Particularly, I have to thank Leendert Molhoek (DSM Resins)for the
materials and the possibility he gave me to prepare the powder coating formulations at DSM
Resins in Zwolle. All my gratitude goes also to Gert Dijkstra, John Rietberg and Adri Geeve for
the help received during the two days spent in Zwolle. I also thank Paul Binda for the kind
invitation to present my work at DSM Resins.
My greatly gratitude goes also to dr. Alistair Raid from Akzo Nobel Coatings (UK) for the
suggestions and the water testing of the coatings.
Acknowledgments
130
During these years of research, I experienced how important is to find a person who is willing
to help you to solve your analytical problems. To this respect, I would like to thank dr. Tessa ten
Cate (TNO) for her collaboration and help with the rheological measurements, the
encouragement and her smiles. Grazie mille, Tessa! I would like to express my gratidute also to
dr. Domenico La Camera for his help relating the design of experiments. Greatly
acknowledgment to dr. Pieter Magusin and Brahim Mezari for their help with the solid NMR
studies. My acknowledgment goes to prof. Günter Höhne who first helped me four years ago with
the DSC measuraments. Then, I have to thank Mr. Phil Robinson form Ruston Service who
taught me to understand the instrument which became my favorite one! At end of my thesis, I
received a great help regarding the kinetic studies from dr. Thanos Dimopoulos (TU/e) and prof.
Emanuel Salmeron Sanchez (University of Valencia). Thanos, thanks for the help received
especially because in those days you had to defend your thesis too. Dear Manuel, without your
scientific and indefatigably support, your optimism and encouragement I would never complete
chapter 5. Muchas grazias!
I would like to thank those people who have helped me with those experiments which are not
reported in this thesis; nevertheless they have taught me something. My thanks go to Eric van
Dungen (University of Stellenbosch, South Africa). Eric, I really enjoyed the one month and half
spent with you working on the mini-emulsion polymerization. Good luck with your thesis!
In four year many people came and went away, some of these people I have to thank for the
collaboration, the scientific support or simply the nice time spent in the lab or at coffee room. I
would like to thank dr. Alex Zdrakov for his always positive attitude to the problems (i.e.
challenges). Alex, thanks for having broadened my view with your physicist point of view.
I would like to thank some of the former PhDs and post-docs of the SMG group. Thanks to
Nollaig, Okan, Fabrizio, Willem Jan, Dennis, Amir, Dirk Jan, Olavio, Sdrjan, Wim, Zhili, Di and
Talal. I am very glad to still have the possibility to work with some of you. Big thanks to those
people who have recently finished their PhD and have left the TU/e to spread all over Europe.
First of all, I thank Tamara, my ex-officemate. In 2004, we started together and again we started a
new job on the same day in 2008. I hope we will keep always in contact. Lot of thanks to Nadia
for her chocolate, delicious cakes and the support. Good luck in England. Thanks to Bart for the
help you gave with the polyester characterization. I wish you all the best for your carrier in
Switzerland.
In the SMG group, I still have to thank many other people. I thank all SMG people, but some
of them I have known a bit better.
Acknowledgments
131
Imanda, you were always of great help, the best secretary: grazie mille, “cara Imanda”. My
thanks go to Gerard too for the movies and the pictures. Huub, I hope you forgive me if I have
never been able to pronounce your name how it should be, since the double “u” is not my favorite
sound. Nevertheless, I would like to thank you very much for all the help. Marco, my gratitude
for the quick help always received when I needed. Niek, thanks for the first SEM instructions you
gave me four years ago. Thanks also for the TEM measurements which unfortunately have not
been showed in this thesis. Thankful regards also to Anneke Delsing. Mark, my favorite student!
All my gratitude for the work you have done and which resulted in a complete chapter and a
paper.
Thanks to my other officemate, Svetlana for her patience and understanding. A big hug to
Francesca, Catarina (gratidão), Przemek, Baris (cucciolo), Wilfred, Marcel, Kangboo, Ming,
Adolphe, Wouter, Emilie and Beryl. Thanks a lot to all of you for the help, the coffee break, the
good and bad moments, the discussions at lunch time and etc.
Outside TU/e, I would like to express all my gratitude to my friends Elena, Jad, Soubra,
Carlos, Ester, Isabelle, Marwa and Haider for the support, the understanding and the nice time we
have had together. I hope we will have a lot of nice moments to share for all our life long.
A thankful appreciation to dr. Ann Terry for checking that this manuscript did not have too
much English mistakes. Dear Ann, I really appreciate the time you spent to read my thesis despite
your busy life.
I would like also to thank all those Italian friends who, although the distance and the “busy
life”, have been in contact with me for these four years. Alcuni di voi sono stati gia’ in Olanda,
noi siamo qui quando volete.
All my gratitude goes also to my mother-in-law who has been of great help at beginning of
the writing: cara mamma Maria Rosaria, grazie mille per l’aiuto che ci hai dato durante questi
anni. Un grazie anche a Serena. Of course, I have to thank my italian family. Cara mamma,
papa’, Felicita, Mimmo, Peppe, Ivana, Marta, Lina, Arianna, Vincenzo, Chiara e Silvietta: un
abbraccio virtuale per ringraziarvi del supporto e della comprensione avuta nonostante la
lontananza.
Finally, the warmest gratitude goes to my husband, Domenico: thanks for the support, your
love and understanding. I dedicate this thesis with all my love to you.

CURRICULUM VITAE
133
Daniela Senatore was born in Cava de’ Tirreni, Salerno (Italy) on the 10th of November
1973. In March 1999, she obtained her M.Sc. in Chemistry at University of Salerno on the
topic of synthesis of ethylene-styrene and ethylene-(p-substituted-styrene) copolymers
by Ziegler-Natta homogeneous catalysis. From May 1999 to May 2000, she worked at
Italian National Research Council, Institute for Macromolecular Studies in Milan (Italy),
with a grant on the subject of blending and characterizations of elastomers for tyre
application. In June 2000, she was employed at Pirelly Tyres R&D, Material Innovation
group (Milan) to develop new compound formulations for tyres made with innovative
materials. In May 2002, she moved to Pirelli Labs where she worked on the physical and
chemical characterization of materials as support to R&D departments of Pirelli Tyres,
Pirelli Cables and Pirelli Labs. In November 2003, she moved to Netherlands and in
January 2004 she stared her PhD in the group of Materials and Interface Chemistry of
the Chemical Engineer Department, at Eindhoven University of Technology. Within this
group, she worked under the supervision of dr. Joshua Laven, prof. dr. Rolf A.T.M. van
Benthem and prof. dr. Bert de With. The most important results of her PhD research are
described in this thesis. From the 1st of March 2008, she is employed at the DSM
Neoresins in Waalwijk, The Netherlands.

Publications
135
D. Senatore, R.A.T.M. van Benthem, J. Laven and G. de With, Powder coatings composition, International Application No. PCT/EP2008/000764, January 2008. D. Senatore, A.T. ten Cate, J. Laven, R.A.T.M. van Benthem and G. de With, Controlled Release
of Micro-Encapsulated Cross-Linker in Powder Coatings, Polymeric Materials: Science &
Engineering, 2007, 97, 913. D.Senatore, M.J.A. Berix, J. Laven, R.T.A.M. van Benthem, G. de With, B. Mezari, P.M.M. Magusin, Miscibility and specific interactions of poly(N-vinyl-methyl)pyrrolidone and acid
functional polyesters, accepted for publication in Macromolecules (February 2008). D. Senatore, T.A. ten Cate, J. Laven, R.T.A.M. van Benthem, G. de With Physical and chemical
stabilization of powder coating by encapsulation of the cross-linker, submitted to Polymer.
D. Senatore, J. Laven, R.A.T.M. van Benthem and G. de With, Microencapsulation for
controlled realease of crosslinker: towards low temperature powder coatings, in preparation.
*J. Laven, D. Senatore, W. K. Wijting, G.de With, The partitioning of octyl phenol ethoxylate
surfactant between water and sunflower oil, submitted to Journal of Colloidal and Interface
Science.
*A.N. Zdravkov, D. Senatore, J. Laven, R. A.T.M. van Benthem and G.de With, Effect of
Surfactant Inter-Phase Diffusion on Drop Size Distribution during Emulsification, to be submitted.
* These publications did not result from the research described in this thesis