mCerebrum: A Mobile Sensing Software Platform for ...santosh/Papers/mCerebrum-SenSys-2017.pdf ·...
14
mCerebrum: A Mobile Sensing Soſtware Platform for Development and Validation of Digital Biomarkers and Interventions Syed Monowar Hossain, Timothy Hnat, Nazir Saleheen, Nusrat Jahan Nasrin University of Memphis {smhssain,twhnat,nsleheen, nnasrin}@memphis.edu Joseph Noor, Bo-Jhang Ho, Tyson Condie, Mani Srivastava University of California, Los Angeles {jnoor,bojhang,tcondie,mbs}@ucla. edu Santosh Kumar University of Memphis [email protected] ABSTRACT The development and validation studies of new multisensory biomark- ers and sensor-triggered interventions requires collecting raw sen- sor data with associated labels in the natural field environment. Unlike platforms for traditional mHealth apps, a software platform for such studies needs to not only support high-rate data ingestion, but also share raw high-rate sensor data with researchers, while supporting high-rate sense-analyze-act functionality in real-time. We present mCerebrum, a realization of such a platform, which supports high-rate data collections from multiple sensors with real- time assessment of data quality. A scalable storage architecture (with near optimal performance) ensures quick response despite rapidly growing data volume. Micro-batching and efficient sharing of data among multiple source and sink apps allows reuse of com- putations to enable real-time computation of multiple biomarkers without saturating the CPU or memory. Finally, it has a reconfig- urable scheduler which manages all prompts to participants that is burden- and context-aware. With a modular design currently span- ning 23+ apps, mCerebrum provides a comprehensive ecosystem of system services and utility apps. The design of mCerebrum has evolved during its concurrent use in scientific field studies at ten sites spanning 106,806 person days. Evaluations show that com- pared with other platforms, mCerebrum’s architecture and design choices support 1.5 times higher data rates and 4.3 times higher storage throughput, while causing 8.4 times lower CPU usage. CCS CONCEPTS • Human-centered computing → Ubiquitous and mobile com- puting; Ubiquitous and mobile computing systems and tools; • Com- puter systems organization → Embedded and cyber-physical systems; KEYWORDS mHealth, mobile sensor big data, software architecture Permission to make digital or hard copies of all or part of this work for personal or classroom use is granted without fee provided that copies are not made or distributed for profit or commercial advantage and that copies bear this notice and the full citation on the first page. Copyrights for components of this work owned by others than ACM must be honored. Abstracting with credit is permitted. To copy otherwise, or republish, to post on servers or to redistribute to lists, requires prior specific permission and/or a fee. Request permissions from [email protected]. SenSys ’17, November 6–8, 2017, Delft, Netherlands © 2017 Association for Computing Machinery. ACM ISBN 978-1-4503-5459-2/17/11. . . $15.00 https://doi.org/10.1145/3131672.3131694 ACM Reference format: Syed Monowar Hossain, Timothy Hnat, Nazir Saleheen, Nusrat Jahan Nas- rin, Joseph Noor, Bo-Jhang Ho, Tyson Condie, Mani Srivastava, and Santosh Kumar. 2017. mCerebrum: A Mobile Sensing Software Platform for Develop- ment and Validation of Digital Biomarkers and Interventions. In Proceedings of SenSys ’17, Delft, Netherlands, November 6–8, 2017, 14 pages. https://doi.org/10.1145/3131672.3131694 1 INTRODUCTION Smartphones with embedded and wirelessly connected sensors have revolutionized health and wellness management via numerous apps. These technologies are also fueling the next generation of health research and are leading to novel interventions to improve health and wellness [14]. But, their future momentum critically depends on our ability to discover and validate new biomarkers for assessing health, wellness, daily behaviors, and contextual factors. 1.1 System Requirements Development and validation of any new mHealth biomarker re- quires conducting research studies in lab and field settings to collect raw sensor data with appropriate labels (e.g., self-reports). Raw sen- sor data are of increasing interest as it significantly expands the useful life of the information collected. Similar to biomedical stud- ies that often archive biospecimens in biobanks so they can be reprocessed to take advantage of future improvements in assays and support biomedical discoveries not possible at the time of data collection, raw sensor data can be used to obtain new biomarkers that were not available at the time of data collection. For example, if the activity trackers stored raw sensor data from accelerometers and gyroscopes (100+ HZ instead of few samples of activity counts per day), the same sensor data can also be used to track eating, drinking, brushing, smoking, etc. from hand gesture signatures, in addition to activity counts. Doing so, however, re- quires a mobile phone software platform that can be used to collect both high-rate raw sensor data and associated labels in field. A general-purpose software platform that can enable such data collection needs several attributes. First, it must support concurrent connections to a wide variety of high-rate wearable sensors with an ability to plug-in new sensors. Second, it must ingest the large volume of rapidly arriving data for which native support does not yet exist in the smartphone hardware or operating system without falling behind and losing data. Third, it needs to support reliable
Transcript of mCerebrum: A Mobile Sensing Software Platform for ...santosh/Papers/mCerebrum-SenSys-2017.pdf ·...
mCerebrum: A Mobile Sensing Software Platform forDevelopment and Validation of Digital Biomarkers and
InterventionsSyed Monowar Hossain,
Timothy Hnat, Nazir Saleheen,Nusrat Jahan NasrinUniversity of Memphis
{smhssain,twhnat,nsleheen,nnasrin}@memphis.edu
Joseph Noor, Bo-Jhang Ho,Tyson Condie, Mani SrivastavaUniversity of California, Los Angeles{jnoor,bojhang,tcondie,mbs}@ucla.
edu
Santosh KumarUniversity of Memphis
ABSTRACTThe development and validation studies of newmultisensory biomark-ers and sensor-triggered interventions requires collecting raw sen-sor data with associated labels in the natural field environment.Unlike platforms for traditional mHealth apps, a software platformfor such studies needs to not only support high-rate data ingestion,but also share raw high-rate sensor data with researchers, whilesupporting high-rate sense-analyze-act functionality in real-time.We present mCerebrum, a realization of such a platform, whichsupports high-rate data collections from multiple sensors with real-time assessment of data quality. A scalable storage architecture(with near optimal performance) ensures quick response despiterapidly growing data volume. Micro-batching and efficient sharingof data among multiple source and sink apps allows reuse of com-putations to enable real-time computation of multiple biomarkerswithout saturating the CPU or memory. Finally, it has a reconfig-urable scheduler which manages all prompts to participants that isburden- and context-aware. With a modular design currently span-ning 23+ apps, mCerebrum provides a comprehensive ecosystemof system services and utility apps. The design of mCerebrum hasevolved during its concurrent use in scientific field studies at tensites spanning 106,806 person days. Evaluations show that com-pared with other platforms, mCerebrum’s architecture and designchoices support 1.5 times higher data rates and 4.3 times higherstorage throughput, while causing 8.4 times lower CPU usage.
CCS CONCEPTS•Human-centered computing→Ubiquitous andmobile com-puting; Ubiquitous and mobile computing systems and tools; • Com-puter systems organization → Embedded and cyber-physicalsystems;
KEYWORDSmHealth, mobile sensor big data, software architecture
Permission to make digital or hard copies of all or part of this work for personal orclassroom use is granted without fee provided that copies are not made or distributedfor profit or commercial advantage and that copies bear this notice and the full citationon the first page. Copyrights for components of this work owned by others than ACMmust be honored. Abstracting with credit is permitted. To copy otherwise, or republish,to post on servers or to redistribute to lists, requires prior specific permission and/or afee. Request permissions from [email protected] ’17, November 6–8, 2017, Delft, Netherlands© 2017 Association for Computing Machinery.ACM ISBN 978-1-4503-5459-2/17/11. . . $15.00https://doi.org/10.1145/3131672.3131694
ACM Reference format:Syed Monowar Hossain, Timothy Hnat, Nazir Saleheen, Nusrat Jahan Nas-rin, Joseph Noor, Bo-Jhang Ho, Tyson Condie, Mani Srivastava, and SantoshKumar. 2017. mCerebrum: A Mobile Sensing Software Platform for Develop-ment and Validation of Digital Biomarkers and Interventions. In Proceedingsof SenSys ’17, Delft, Netherlands, November 6–8, 2017, 14 pages.https://doi.org/10.1145/3131672.3131694
1 INTRODUCTIONSmartphoneswith embedded andwirelessly connected sensors haverevolutionized health and wellness management via numerous apps.These technologies are also fueling the next generation of healthresearch and are leading to novel interventions to improve healthand wellness [14]. But, their future momentum critically dependson our ability to discover and validate new biomarkers for assessinghealth, wellness, daily behaviors, and contextual factors.
1.1 System RequirementsDevelopment and validation of any new mHealth biomarker re-quires conducting research studies in lab and field settings to collectraw sensor data with appropriate labels (e.g., self-reports). Raw sen-sor data are of increasing interest as it significantly expands theuseful life of the information collected. Similar to biomedical stud-ies that often archive biospecimens in biobanks so they can bereprocessed to take advantage of future improvements in assaysand support biomedical discoveries not possible at the time of datacollection, raw sensor data can be used to obtain new biomarkersthat were not available at the time of data collection.
For example, if the activity trackers stored raw sensor data fromaccelerometers and gyroscopes (100+ HZ instead of few samples ofactivity counts per day), the same sensor data can also be used totrack eating, drinking, brushing, smoking, etc. from hand gesturesignatures, in addition to activity counts. Doing so, however, re-quires a mobile phone software platform that can be used to collectboth high-rate raw sensor data and associated labels in field.
A general-purpose software platform that can enable such datacollection needs several attributes. First, it must support concurrentconnections to a wide variety of high-rate wearable sensors withan ability to plug-in new sensors. Second, it must ingest the largevolume of rapidly arriving data for which native support does notyet exist in the smartphone hardware or operating system withoutfalling behind and losing data. Third, it needs to support reliable
SenSys ’17, November 6–8, 2017, Delft, Netherlands S. Hossain et al.
storage of quickly growing volume of sensor data, whose archivalis critical to the development and validation of new biomarkers.
Fourth, it is desirable to quickly analyze incoming data tomonitorsignal quality so any errors in sensor attachment or placement canbe fixed quickly to maximize data yield. Fifth, it needs to support thesense-analyze-act pipeline for high-rate streaming sensor data. Thisis necessary to prompt self-reports (for collection of labels) as wellas confirm/refute prompts for validation of new biomarkers in thefield. Sense-analyze-act support is also needed to aid developmentand evaluation of sensor-triggered interventions.
Sixth, it needs seamless sharing of streaming data from mul-tiple sensors to enable computation of multi-sensor biomarkers(e.g., stress, smoking, eating). Seventh, the platform needs to begeneral-purpose and extensible to support a wide variety of sensors,biomarkers, and study designs. Eighth, it needs to be architecturallyscalable so that it can support concurrent computation of a largenumber of biomarkers (each of which requires complex processing)without saturating the computational capacity or battery life of themobile phone. Finally, it needs to carefully control interruptions tostudy participants from various sources (e.g., self-report, ecologi-cal momentary assessment (EMA) and interventions (EMI), fixingsensor attachments) limiting user burden and cognitive overloadwhile satisfying the numerous study requirements.
1.2 Our ContributionsIn this paper we presentmCerebrum, an open-source, generalizable,and reusable platform that meets the above requirements (see Sec-tion 1.1), in particular, high-rate data ingestion, real-time biomarkercomputation, and burden-aware prompting. The design of mCere-brum has evolved from its use in ten research studies with uniquestudy requirements and diverse health targets (see Table 1).
To accomplish efficient ingestion and real-time processing ofhigh-rate sensor data (70+ million samples/day) for multi-sensorbiomarkers, mCerebrum uses an efficient data exchange architec-ture (called DataKit). To ease the burden of frequent and complexcomputation for biomarkers, the architecture natively supportscomputation reuse and microbatching.
To ensure extensibility to new sensors and generalizability todiverse study goals, mCerebrum uses a common data format that isflexible for current and future data types, yet efficient for commu-nication. To reduce latency and overhead associated with storingrapidly growing sensor data (up to 2GB/day), mCerebrum usesa new scalable storage architecture called Pebbles. Burden-awarescheduling of user prompts is achieved through a bipartite graphdesign with gradual escalation to ensure meeting study goals, whileusing adaptive feedback for managing user burden.
Evaluations show that when inserting 1k samples at a time,mCerebrum ingests 9.65k samples/s, which is 1.5 times higherthan AWARE [7] (and 7 times higher for 1 sample insertions). Forhigh-rate storage, mCerebrum achieves 92% of optimal throughput,which is 4.3 times higher than AWARE [7]. Via microbatching ofdata ingestion and enabling efficient reuse of computation, mCere-brum achieves significantly lower CPU utilization (8.4 times lowerthan AWARE [7]), which is necessary to enable real-time computa-tion of multi-sensor biomarkers from high-rate sensor data.
2 RELATEDWORKWe compare mCerebrum with some existing software platformsfor conducting mHealth research studies with sensor data. Table 1summarizes the comparison on key desired attributes.
The first set of platforms related to mCerebrum are variouscommercial systems, which broadly fall into two categories. Amongthese are the data collection systems that have been created byvendors of wearables such as Fitbit, Withings, Polar, and Garmin.Typically, they provide mobile apps to let users visualize the dataand back-end cloud services for storage, web-based access, andRESTful API based distribution to other applications and services.Besides being limited to supporting only vendor-specific devices,most of these systems are designed to collect low-rate biomarkerscomputed on the device (e.g. step count) instead of high-rate rawsensor data and limit access by third-party applications to be onlyvia web service APIs. In rare cases, the raw high-rate sensor data isexposed via an SDK to third-party smartphone apps, such as withMicrosoft Band, but then nothing else is usually provided.
The second category of commercial systems are software plat-forms from the major ecosystem players (Apple, Google, and Mi-crosoft) that are device and application vendor agnostic, and providesupport for a richer suite of services. Of these, the most well-knownare Apple’s HealthKit and ResearchKit services [13, 25] where theformer provides a smartphone based storage engine optimized forcollection and querying of a broad spectrum of health-related sen-sor data, and the latter provides organizers of research studies,that make use of such data, support for study management func-tions such as subject recruitment. However, unlike mCerebrum,the HealthKit targets low-rate data and has no native support forother critical functions such as data quality assessment, biomarkercomputation, privacy management, and context-triggered user datacollection, notifications, and interventions.
Capabilities similar to HealthKit and ResearchKit are provided inthe Android world respectively by a combination of Google Fit [8](a cloud-based data collection and distribution service that is tightlyknit with Android) and various systems that have either portedResearchKit to Android or seek to provide similar study manage-ment functions. These too target low-rate sensor data collectionwith no integrated support for data quality assessment, biomarkercomputation, privacy management, and context-triggered user datacollection, notifications, and interventions. Microsoft’s HealthVaultis a similar product in this space and shares the same limitations.
Also relevant to mCerebrum are various research systems thathave sought to provide software frameworks for sensor data collec-tion in social, participatory, and mobile health sensing, such as Con-textPhone [20], Jigsaw [16], Funf [1], UbiqLog [24], Ohmage [32],AWARE [7], Lifestreams [12], and many others. While some ofthese systems such as Jigsaw, Funf, and AWARE have targeted high-rate sensors, most of them are optimized for low-rate collectionor for local storage. Almost all lack other key functions of dataquality assessment, biomarker computation, privacy management,context-triggered user data collection, notifications, and interven-tions. Moreover, these systems, for the most part, remain limited tosmall-scale academic usage. By contrast, mCerebrum is not onlycapable of high performance data collection and provides a far morecomprehensive set of functions and sensor support, but has also
mCerebrum: A Mobile Sensing Software Platform SenSys ’17, November 6–8, 2017, Delft, Netherlands
Framework Sensor-support High Scalable Data Computation Data Sense-Analyze BurdenThroughput Storage Quality Sharing Sharing -Act Support Aware
GoogleFit Internal, Bluetooth ✓ ✓ ✓HealthKit Internal, Bluetooth ✓ ✓ ✓
OpenDataKit Bluetooth, USB ✓AWARE Internal ✓ ✓ ✓
mCerebrum Internal, Bluetooth,Bluetooth-LE, ANT+ ✓ ✓ ✓ ✓ ✓ ✓ ✓
Table 1: Comparison of different extensible mHealth frameworks that support external sensors
proven its robustness and scalability in mission-critical settings viaits adoption in multiple large studies by independent researchers.
OpenDataKit (ODK) [4] is one of the earliest platforms to supporthigh-rate sensor data collection from Bluetooth and USB-basedwearable sensors. New driver services can be added dynamicallyas plugins to acquire data from external devices as binary streams.ODK encodes the stream as meaningful representations beforefinally making it available to one target application through theframework. ODK does not allow top level applications to exchangedata among themselves through the framework, limiting supportfor real-time computation of biomarkers.
AWARE [7] is a framework that supports data collection fromphone sensors (e.g. accelerometer, gyroscope), phone activities (e.g.calendar, call, message), and self-report (e.g. questionnaires, voice,data labeling). AWARE supports plug-ins of external sensors; how-ever, plug-ins are responsible for managing their own data storageand sharing. This limits the scalability of storage for high-ratesensor data, overall throughput, and CPU utlization.
In addition to software platforms that support data collectionfrom sensors, some platforms are optimized for collection of self-reports. First, Commcare [2] is a commercial software tool thatallows creation, editing, and deployment of mobile applications forresearch studies without a software developer. It supports complexlogic that can guide a participant to ask the right questions andprovide appropriate advice. This platform should be capable ofcollecting low-rate biomarker data, similar to the other platforms;however, we are uncertain due to its proprietary nature.
Second, Paco [6] is an open-source platform developed by Google.It operates at meaningful moments to log data and/or prompt usersto act (e.g., view information or answer research questions). This isused for daily experience research, to study participant attitudesand behaviors over time, in the context of their daily lives (e.g., foruser-centered design of products or services); however, it is limitedin many of the other capabilities that mCerebrum provides suchas sensor data collection and customizable biomarker triggeredprompting that is burden- and context-aware.
Specific mechanisms in mCerebrum benefit from prior worksaddressing problems such as energy-optimized data collection viasmarter sampling and sensor duty-cycling [3], coping with highrate sensors [16], energy-optimized context inference via providinginference computation as a shared service and making use of spe-cialized processor cores in mobile system-on-chips [15, 31], privacymanagement for sensory data on mobile platforms [5], sensor dataquality assessment, data storage management on mobile platforms,and power, latency, and robustness considerations in partitioning ofcomputation across wearables, phones, and the cloud [23]. We note
SmartphoneHigh Data Rate Sensors
Chestband
Smart Watches
UWB RF Sensor
Low Data Rate Sensors
Oral-B Toothbrush
iCO SmokerlyzerOmron BP/
Weight Smartphone Sensors
GPS, Accel, Gyro
Wireless Radios: Bluetooth, ANT+
Data Quality
Privacy Controller
Secure Local Data Storage
Secure Cloud Data Storage
Encryption-based Privacy Filter
Machine Learning Models
BiomarkersStress
SmokingEating
Lung CongestionHeart Motion
LocationActivityDriving
Drug use
…
38+ million
1500
6
70+ million samples/day
Biomarker-triggered User Engagement
Self Report
Intervention
Performance-based Tests
Data Recipients
10+ million13 million
4
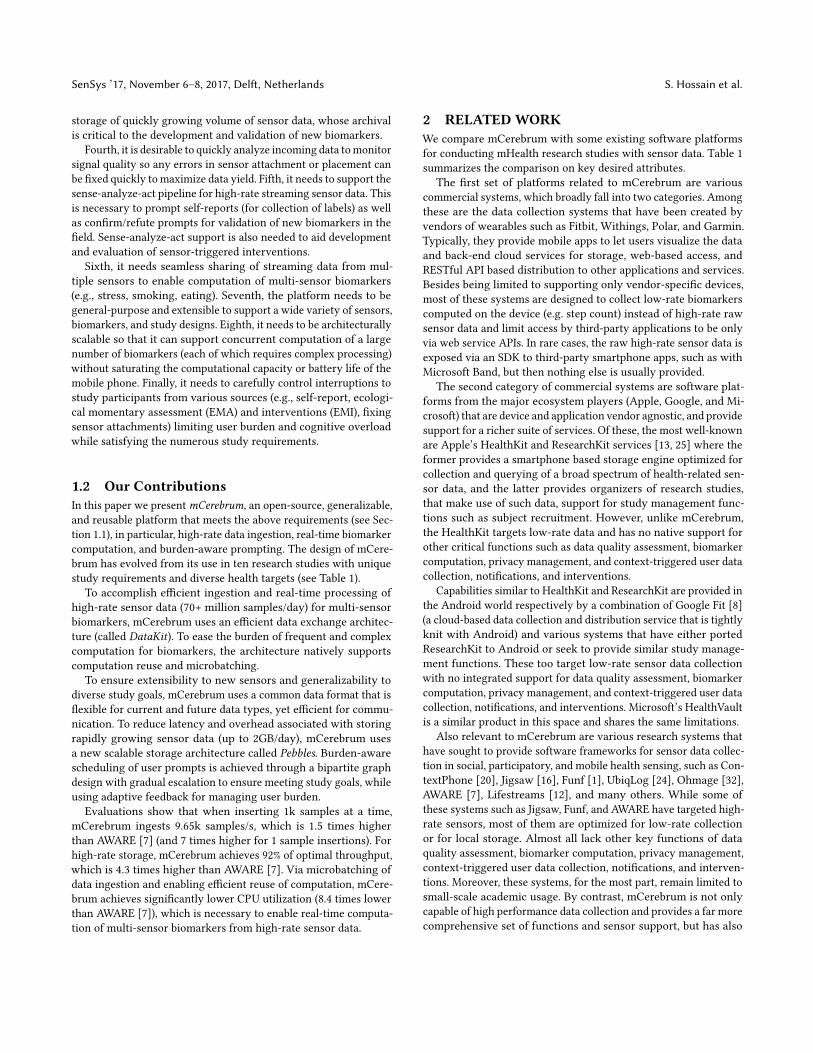
Figure 1: mCerebrum overview illustrating key componentssuch as ingestion of high-frequency sensor data, real-timedata quality assessment and biomarker computation.
that while many of these problems are solvable in an application-specific vertical system operating under carefully managed con-ditions, they become much harder in mCerebrum which seeks tobe extensible and support a range of sensing devices and workrobustly across diverse scenarios and users.
In summary, the higher performance achieved in mCerebrumas compared to other sensor data collection platforms is a resultof multiple architectural choices such as efficient inter-applicationcommunication, a new scalable storage architecture, and central-ized storage. The novelty and utility of our framework extendsbeyond architectural efficiencies as mCerebrum provides nativesupport for high-rate data collection, real-time biomarker computa-tion, sensor-triggered intervention, burden-aware user prompting,privacy controls, among several others. The development of thesecapabilities is not simply a matter of code changes but also iterativerefinements based on extensive user feedback from real-life studies.These together make our system suitable for data collection in thenatural field environment in health studies involving developmentand validation of new biomarkers.
3 OVERVIEW OF MCEREBRUMWe describe the overall architecture in Section 3.1, which includescomponent-level and communication design, real-life deploymentsin Section 3.2, and key features of mCerebrum in Section 3.3.
mCerebrum is designed to operate both as an independent, stand-alone platform and as part of a larger system [10]. The work pre-sented here focuses on the mobile phone components. The cloudcompanion of mCerebrum warrants its own independent article.

SenSys ’17, November 6–8, 2017, Delft, Netherlands S. Hossain et al.
Application DescriptionDataKit Handles routing, privacy, and storage
DataKitAPI API library for apps to use DataKitPlotter Real-time data visualizer
Privacy Controller Allows the participant to suspend datacollection and EMA prompting
Utilities Common helper functionsPhone Integrates the smartphone sensors
Chestband Data collection from ANT+ sensor suiteWrist BLE wrist-worn motion capture deviceiCO Carbon Monoxide sensor support
Smartwatch Bluetooth 4 connected watchUWB RF BLE chest sensor for measuring heart
function and lung fluidBlood Pressure BLE-connected blood pressure cuff
Weight BLE-connected weight scaleSmart Toothbrush BLE-connected smart toothbrushStream Processor Provides real-time computation of
biomarkers (e.g. stress, smoking, etc.)Mood Surfing A custom built stress reduction app
Thought Shakeup A custom built stress reduction appMedication Medication adherence compliance app
and reminder systemSelf Report Customizable self-report prompts
EMA Customizable EMA delivery applicationStudy Main study interface; provides applica-
tion management for all other appsEMA/EMI Scheduler Customizable scheduler for delivering
user prompts based on biomarkersAdherence Reminder A scheduler for episodic data collectionNotification Manager Gatekeeper for all user prompts
Table 2: Overview of mCerebrum apps and libraries
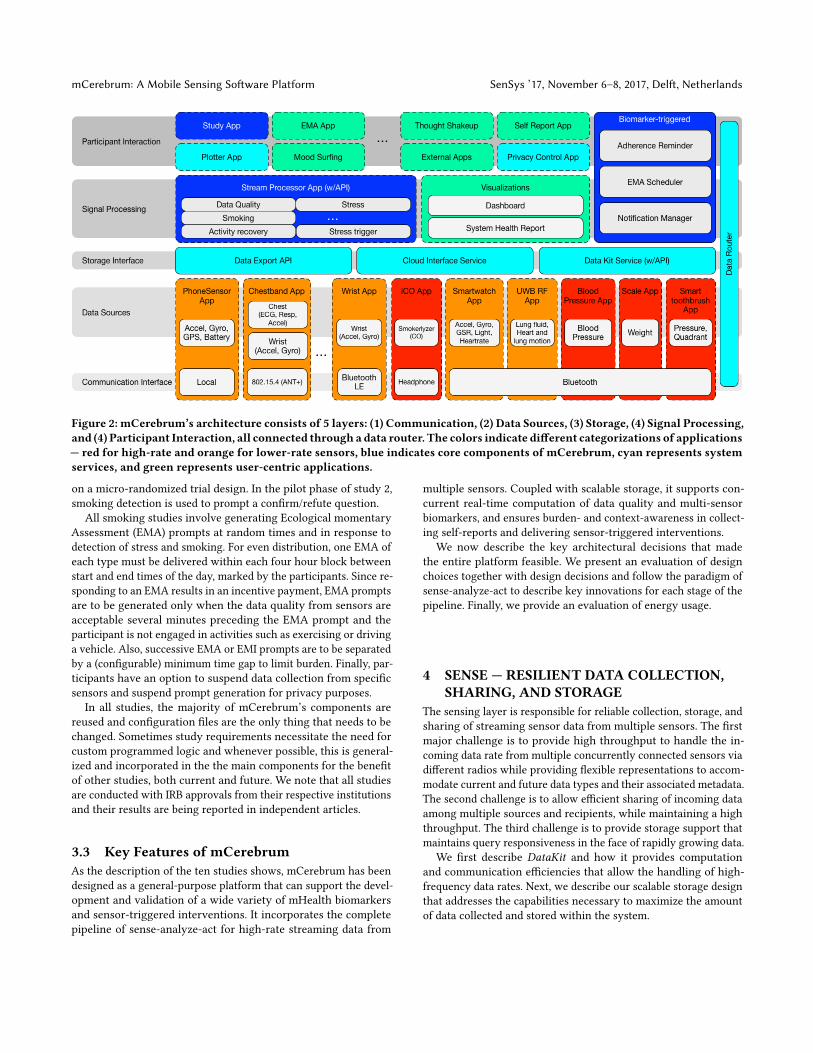
3.1 ArchitectureTo achieve our goal of high-rate streaming data collection, logging,real-time processing, and intervention, we built a flexible, layeredarchitecture as illustrated in Figure 1. The architecture is composedof five layers: (1) communication interfaces, which include sup-port for both smartphone sensors and wearable sensors, (2) datasources that provide an interface between devices and the restof the mCerebrum platform, (3) storage and routing interface,which provides persistent data storage and routing of intermediateresults among the various components and is subject to the rulesof a privacy controller, (4) a signal processing layer provides thenecessary support for long-running applications to receive andprocess data from elsewhere in the system, and (5) the participantinterface layer that implements all interactions with the partici-pants. Together, they represent 23 different applications across ourcurrently supported studies (see Figure 2 and Table 2).
The mCerebrum platform and all associated applications arepublicly available on GitHub (github.com/MD2Korg/) under theBSD 2-Clause license.
ID Study Users Person-Days
Samples(Billions)
1 Smoking & Eating 225 3,150 1362 Smoking 300 4,200 1823 Smoking 300 4,200 1824 Smoking & fMRI 90 1,260 555 Smoking & Stress 24 336 156 Heart Failure 225 6,750 2247 Oral Health 162 29,160 9688 Cocaine Use 25 350 189 Behavior Change 100 1400 5810 Job Performance 800 56,000 2,891
Total 2,251 106,806 4,729Table 3: mCerebrum powered studies span 10 sites – North-western, Rice, Utah, Vermont, Moffitt, Ohio State, UCLA,Johns Hopkins, Dartmouth, and Minnesota.
3.2 Real-Life DeploymentsThe design of mCerebrum has emerged from half a decade of expe-rience in supporting half a dozen completed field studies at indepen-dent sites. The current design of mCerebrum is in various stages ofdeployment in ten research studies at different sites throughout theUnited States by independent research teams; however, they cur-rently receive technical support from the mCerebrum team. Thesestudies collectively span a total of 2,251 unique participants and106,806 person-days (2.5 million hours) of high-frequency sensordata. We estimate the net data generated, processed, stored, andtransmitted will be over 100TB and about 4.7 trillion data pointsbased on our current data abstraction. Table 3 provides a break-down of these studies. We briefly describe each study to show thediversity in studies adequately served by mCerebrum.
The goal of smoking studies (1-5) are to find sensor-based mark-ers that predict smoking lapse. Participants who want to quit smok-ing wear sensors for four days prior to quitting and 10 days afterquitting. The goal of heart failure study (6) is to find sensor-basedmarkers that predict hospital readmission. The study tracks activity,eating, medication adherence, lung fluid change, blood pressure,and weight for 30 days in recently discharged heart failure patients.The goal of oral health study (7) is to find sensor-based markersthat predict changes in plaque level. Participants wear sensors forsix months to track brushing and flossing behavior. The goal ofcocaine study (8) is to develop and validate a sensor-based detectorof cocaine use to detect timing of cocaine use in nation-wide clinicaltrials network. Active cocaine users wear sensors for two weeksin field. The goal of behavior change study (9) is to study effectsof stress interventions for subsequent refinements in smoking andobese participants during 14 days of sensor wearing. The goal ofjob performance study (10) is to discover sensor-based indicatorsof job performance from ten weeks of sensor wearing.
All studies involve continuous data collection from two wristsensors and smartphone sensors. The smoking studies, cocainestudy, behavior change study, and the job performance study alsoinvolves continuous data collection from a chest band. All smokingstudies involve computation of stress and smoking events on thephone which are used to launch stress intervention (study 1) based
mCerebrum: A Mobile Sensing Software Platform SenSys ’17, November 6–8, 2017, Delft, Netherlands
Figure 2: mCerebrum’s architecture consists of 5 layers: (1) Communication, (2) Data Sources, (3) Storage, (4) Signal Processing,and (4) Participant Interaction, all connected through a data router. The colors indicate different categorizations of applications— red for high-rate and orange for lower-rate sensors, blue indicates core components of mCerebrum, cyan represents systemservices, and green represents user-centric applications.
on a micro-randomized trial design. In the pilot phase of study 2,smoking detection is used to prompt a confirm/refute question.
All smoking studies involve generating Ecological momentaryAssessment (EMA) prompts at random times and in response todetection of stress and smoking. For even distribution, one EMA ofeach type must be delivered within each four hour block betweenstart and end times of the day, marked by the participants. Since re-sponding to an EMA results in an incentive payment, EMA promptsare to be generated only when the data quality from sensors areacceptable several minutes preceding the EMA prompt and theparticipant is not engaged in activities such as exercising or drivinga vehicle. Also, successive EMA or EMI prompts are to be separatedby a (configurable) minimum time gap to limit burden. Finally, par-ticipants have an option to suspend data collection from specificsensors and suspend prompt generation for privacy purposes.
In all studies, the majority of mCerebrum’s components arereused and configuration files are the only thing that needs to bechanged. Sometimes study requirements necessitate the need forcustom programmed logic and whenever possible, this is general-ized and incorporated in the the main components for the benefitof other studies, both current and future. We note that all studiesare conducted with IRB approvals from their respective institutionsand their results are being reported in independent articles.
3.3 Key Features of mCerebrumAs the description of the ten studies shows, mCerebrum has beendesigned as a general-purpose platform that can support the devel-opment and validation of a wide variety of mHealth biomarkersand sensor-triggered interventions. It incorporates the completepipeline of sense-analyze-act for high-rate streaming data from
multiple sensors. Coupled with scalable storage, it supports con-current real-time computation of data quality and multi-sensorbiomarkers, and ensures burden- and context-awareness in collect-ing self-reports and delivering sensor-triggered interventions.
We now describe the key architectural decisions that madethe entire platform feasible. We present an evaluation of designchoices together with design decisions and follow the paradigm ofsense-analyze-act to describe key innovations for each stage of thepipeline. Finally, we provide an evaluation of energy usage.
4 SENSE — RESILIENT DATA COLLECTION,SHARING, AND STORAGE
The sensing layer is responsible for reliable collection, storage, andsharing of streaming sensor data from multiple sensors. The firstmajor challenge is to provide high throughput to handle the in-coming data rate from multiple concurrently connected sensors viadifferent radios while providing flexible representations to accom-modate current and future data types and their associated metadata.The second challenge is to allow efficient sharing of incoming dataamong multiple sources and recipients, while maintaining a highthroughput. The third challenge is to provide storage support thatmaintains query responsiveness in the face of rapidly growing data.
We first describe DataKit and how it provides computationand communication efficiencies that allow the handling of high-frequency data rates. Next, we describe our scalable storage designthat addresses the capabilities necessary to maximize the amountof data collected and stored within the system.
SenSys ’17, November 6–8, 2017, Delft, Netherlands S. Hossain et al.
4.1 DataKit: Efficient Collection & Sharing ofHigh-rate Sensor Data
mCerebrum’s DataKit is designed to collect high-rate sensor datafrommultiple concurrent sources and allow efficient many-to-manysharing of data between data source and sink apps. Because datasources will grow in diversity of data types and likewise recipientsmay accept different formats of data from double values to complexJSON encoded Ecological Momentary Assessments (EMAs), DataKitprovides a flexible structure to handle data representations andtransport within the system. Additionally, by providing a fast andefficient communication mechanism, computation can be reusedby transmitting intermediate results through DataKit for otherprocesses to utilize instead of requiring each application to computevalues as needed.
DataKit is implemented as a data router instead of utilizing acommon database for storage due to two key limitations. First,SQLite, the de facto standard for Android, is unable to efficientlyscale (Section 4.2) to the data rates mCerebrum required. Second,having a central controller allows for better control over securityand privacy of data streams, restricting specific data items that arepersisted and stored through dedicated APIs.
4.1.1 Data Representation. mCerebrum’s data model is built ontwo abstractions: (1) a data point, which is the tuple consisting of atimestamp and value and (2) a data stream, a uniquely identifiablecollection of data points. A data point value can be composed ofany of the following: boolean, integer, long, double, string, JSON,and all array variants. By constraining most data to primitive types,we allow for efficient serialization and communication while allow-ing for complex data types through JSON encoding. mCerebrumutilizes a hybrid encoding scheme that supports two kinds of dat.First, high-frequency sensor data (java primitives) is byte encodedto reduce encoding and decoding time. The Android IPC is highlyoptimized to minimize copying and is based on pointer and permis-sion manipulation. Hence, compression techniques are unlikely toyield significant benefits. Second, a flexible type based on stringencoded JSON objects is used to represent all other types of data,thus providing nearly unlimited flexibility for complex objects.
4.1.2 Flexible and efficient communication. mCerebrum pro-vides a simple, yet flexible and efficient communication mechanismthrough DataKit and DataKitAPI. The API implements functionalitycommon to many publish-subscribe mechanisms with additionalsupport for sending query commands through the interface. It al-lows an application to connect and disconnect from DataKit andprovides a subscribe and unsubscribe mechanism. In order to searchfor data streams, it provides a find method that allows for partialmatching of the data stream based on included metadata. Subscribeutilizes a callbackmechanismwhich allows DataKit to directly routeappropriate data through function callbacks. Applications can queryby the last N samples and by time-range to retrieve informationfrom DataKit. In order to create a data stream and its associatedmetadata, registration and unregistration methods are provided. Fi-nally, an insert method is provided to send data to DataKit. Thesebasic building blocks allow for a variety of applications to be con-structed and their simplicity keeps internal complexity down toensure efficient data processing and routing.
1 10 100 10000
2
4
6
8
10
Buffer Size
Freq
uen
cy (
kH
z)
mCerebrum
AWARE
HealthKit
Google Fit
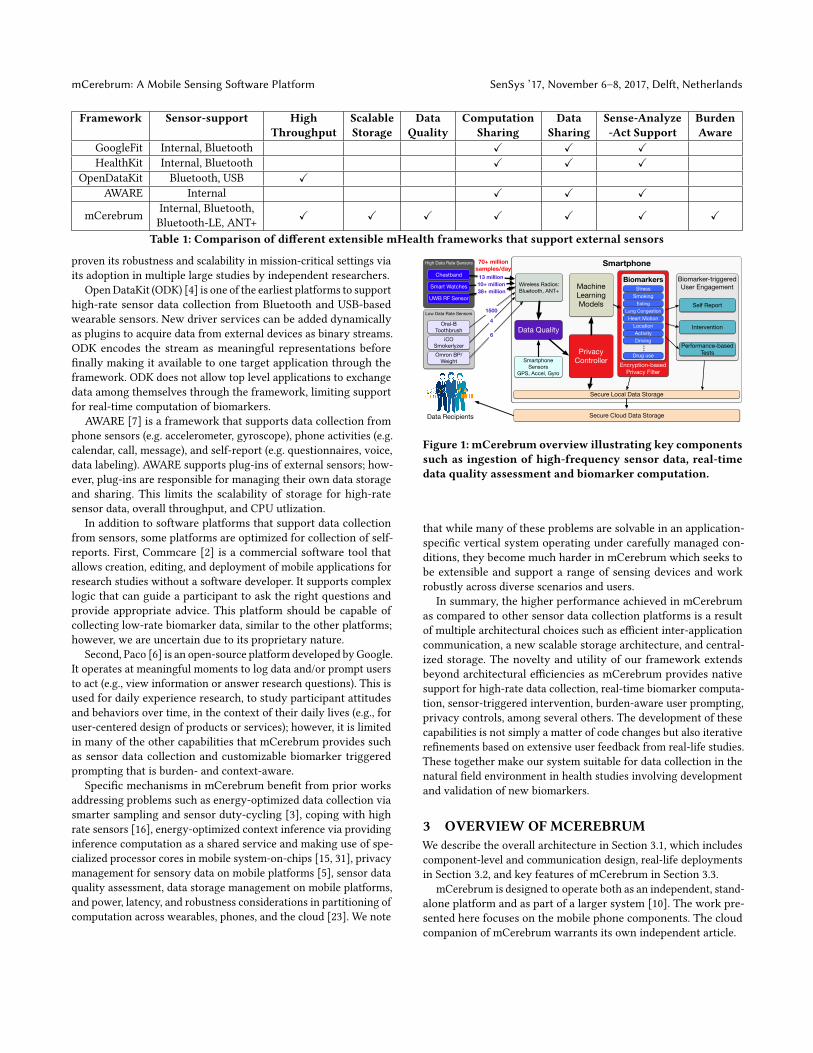
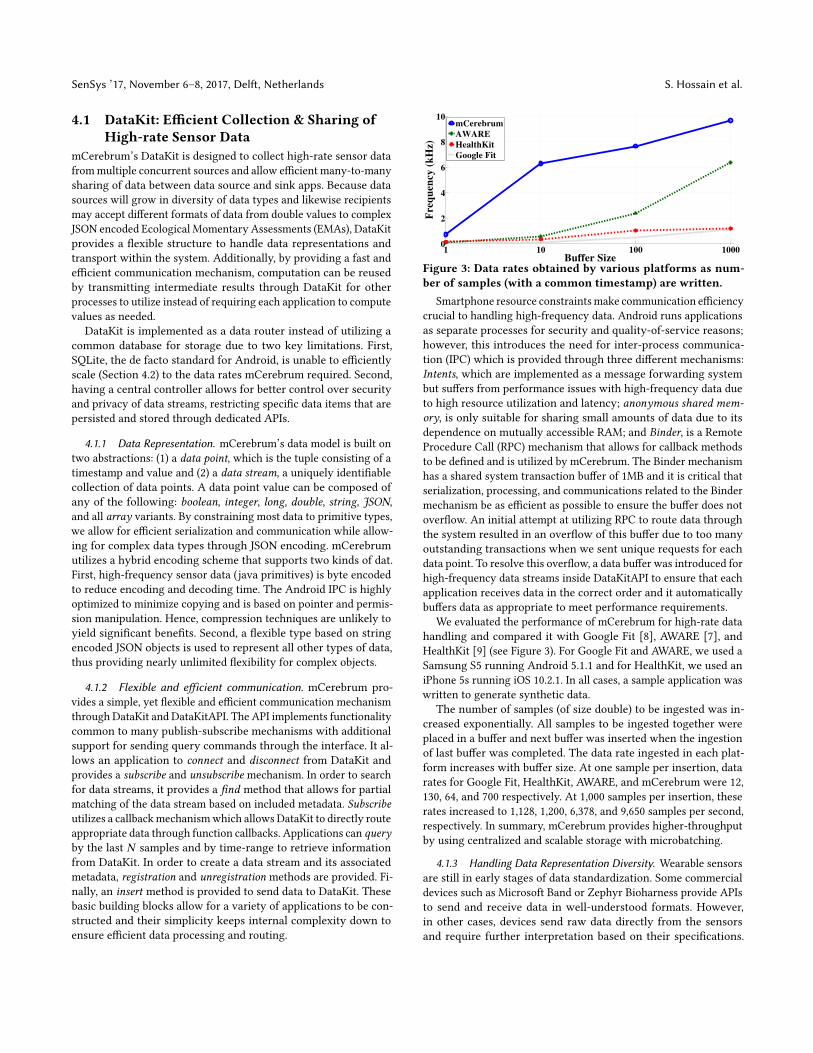
Figure 3: Data rates obtained by various platforms as num-ber of samples (with a common timestamp) are written.
Smartphone resource constraintsmake communication efficiencycrucial to handling high-frequency data. Android runs applicationsas separate processes for security and quality-of-service reasons;however, this introduces the need for inter-process communica-tion (IPC) which is provided through three different mechanisms:Intents, which are implemented as a message forwarding systembut suffers from performance issues with high-frequency data dueto high resource utilization and latency; anonymous shared mem-ory, is only suitable for sharing small amounts of data due to itsdependence on mutually accessible RAM; and Binder, is a RemoteProcedure Call (RPC) mechanism that allows for callback methodsto be defined and is utilized by mCerebrum. The Binder mechanismhas a shared system transaction buffer of 1MB and it is critical thatserialization, processing, and communications related to the Bindermechanism be as efficient as possible to ensure the buffer does notoverflow. An initial attempt at utilizing RPC to route data throughthe system resulted in an overflow of this buffer due to too manyoutstanding transactions when we sent unique requests for eachdata point. To resolve this overflow, a data buffer was introduced forhigh-frequency data streams inside DataKitAPI to ensure that eachapplication receives data in the correct order and it automaticallybuffers data as appropriate to meet performance requirements.
We evaluated the performance of mCerebrum for high-rate datahandling and compared it with Google Fit [8], AWARE [7], andHealthKit [9] (see Figure 3). For Google Fit and AWARE, we used aSamsung S5 running Android 5.1.1 and for HealthKit, we used aniPhone 5s running iOS 10.2.1. In all cases, a sample application waswritten to generate synthetic data.
The number of samples (of size double) to be ingested was in-creased exponentially. All samples to be ingested together wereplaced in a buffer and next buffer was inserted when the ingestionof last buffer was completed. The data rate ingested in each plat-form increases with buffer size. At one sample per insertion, datarates for Google Fit, HealthKit, AWARE, and mCerebrum were 12,130, 64, and 700 respectively. At 1,000 samples per insertion, theserates increased to 1,128, 1,200, 6,378, and 9,650 samples per second,respectively. In summary, mCerebrum provides higher-throughputby using centralized and scalable storage with microbatching.
4.1.3 Handling Data Representation Diversity. Wearable sensorsare still in early stages of data standardization. Some commercialdevices such as Microsoft Band or Zephyr Bioharness provide APIsto send and receive data in well-understood formats. However,in other cases, devices send raw data directly from the sensorsand require further interpretation based on their specifications.
mCerebrum: A Mobile Sensing Software Platform SenSys ’17, November 6–8, 2017, Delft, Netherlands
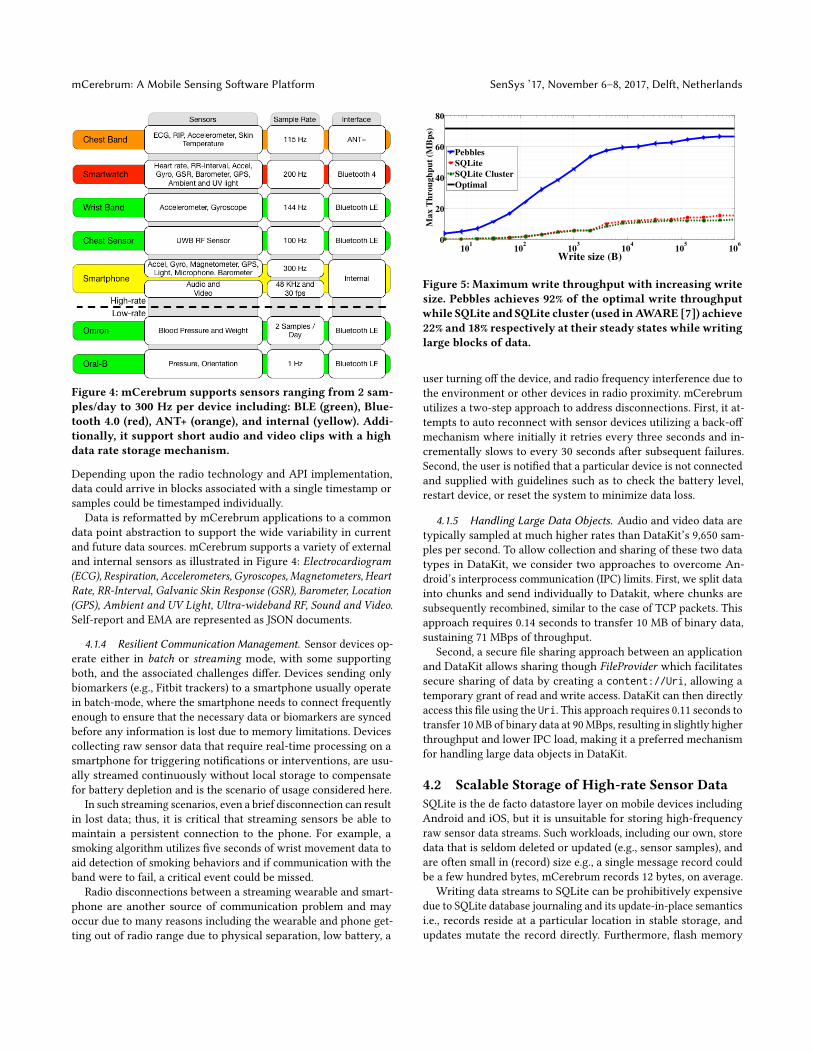
Figure 4: mCerebrum supports sensors ranging from 2 sam-ples/day to 300 Hz per device including: BLE (green), Blue-tooth 4.0 (red), ANT+ (orange), and internal (yellow). Addi-tionally, it support short audio and video clips with a highdata rate storage mechanism.
Depending upon the radio technology and API implementation,data could arrive in blocks associated with a single timestamp orsamples could be timestamped individually.
Data is reformatted by mCerebrum applications to a commondata point abstraction to support the wide variability in currentand future data sources. mCerebrum supports a variety of externaland internal sensors as illustrated in Figure 4: Electrocardiogram(ECG), Respiration, Accelerometers, Gyroscopes, Magnetometers, HeartRate, RR-Interval, Galvanic Skin Response (GSR), Barometer, Location(GPS), Ambient and UV Light, Ultra-wideband RF, Sound and Video.Self-report and EMA are represented as JSON documents.
4.1.4 Resilient Communication Management. Sensor devices op-erate either in batch or streaming mode, with some supportingboth, and the associated challenges differ. Devices sending onlybiomarkers (e.g., Fitbit trackers) to a smartphone usually operatein batch-mode, where the smartphone needs to connect frequentlyenough to ensure that the necessary data or biomarkers are syncedbefore any information is lost due to memory limitations. Devicescollecting raw sensor data that require real-time processing on asmartphone for triggering notifications or interventions, are usu-ally streamed continuously without local storage to compensatefor battery depletion and is the scenario of usage considered here.
In such streaming scenarios, even a brief disconnection can resultin lost data; thus, it is critical that streaming sensors be able tomaintain a persistent connection to the phone. For example, asmoking algorithm utilizes five seconds of wrist movement data toaid detection of smoking behaviors and if communication with theband were to fail, a critical event could be missed.
Radio disconnections between a streaming wearable and smart-phone are another source of communication problem and mayoccur due to many reasons including the wearable and phone get-ting out of radio range due to physical separation, low battery, a
101
102
103
104
105
106
0
20
40
60
80
Write size (B)
Max
Th
ro
ug
hp
ut
(MB
ps)
Pebbles
SQLite
SQLite Cluster
Optimal
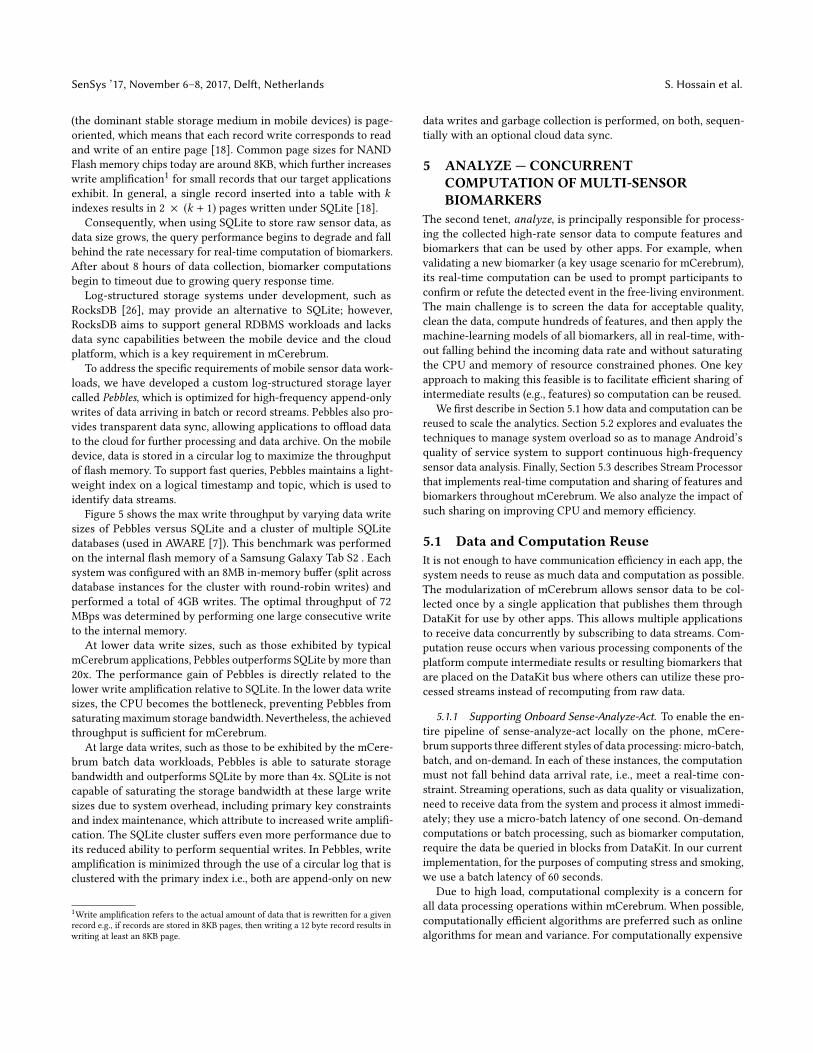
Figure 5: Maximum write throughput with increasing writesize. Pebbles achieves 92% of the optimal write throughputwhile SQLite and SQLite cluster (used inAWARE [7]) achieve22% and 18% respectively at their steady states while writinglarge blocks of data.
user turning off the device, and radio frequency interference due tothe environment or other devices in radio proximity. mCerebrumutilizes a two-step approach to address disconnections. First, it at-tempts to auto reconnect with sensor devices utilizing a back-offmechanism where initially it retries every three seconds and in-crementally slows to every 30 seconds after subsequent failures.Second, the user is notified that a particular device is not connectedand supplied with guidelines such as to check the battery level,restart device, or reset the system to minimize data loss.
4.1.5 Handling Large Data Objects. Audio and video data aretypically sampled at much higher rates than DataKit’s 9,650 sam-ples per second. To allow collection and sharing of these two datatypes in DataKit, we consider two approaches to overcome An-droid’s interprocess communication (IPC) limits. First, we split datainto chunks and send individually to Datakit, where chunks aresubsequently recombined, similar to the case of TCP packets. Thisapproach requires 0.14 seconds to transfer 10 MB of binary data,sustaining 71 MBps of throughput.
Second, a secure file sharing approach between an applicationand DataKit allows sharing though FileProvider which facilitatessecure sharing of data by creating a content://Uri, allowing atemporary grant of read and write access. DataKit can then directlyaccess this file using the Uri. This approach requires 0.11 seconds totransfer 10MB of binary data at 90MBps, resulting in slightly higherthroughput and lower IPC load, making it a preferred mechanismfor handling large data objects in DataKit.
4.2 Scalable Storage of High-rate Sensor DataSQLite is the de facto datastore layer on mobile devices includingAndroid and iOS, but it is unsuitable for storing high-frequencyraw sensor data streams. Such workloads, including our own, storedata that is seldom deleted or updated (e.g., sensor samples), andare often small in (record) size e.g., a single message record couldbe a few hundred bytes, mCerebrum records 12 bytes, on average.
Writing data streams to SQLite can be prohibitively expensivedue to SQLite database journaling and its update-in-place semanticsi.e., records reside at a particular location in stable storage, andupdates mutate the record directly. Furthermore, flash memory
SenSys ’17, November 6–8, 2017, Delft, Netherlands S. Hossain et al.
(the dominant stable storage medium in mobile devices) is page-oriented, which means that each record write corresponds to readand write of an entire page [18]. Common page sizes for NANDFlash memory chips today are around 8KB, which further increaseswrite amplification1 for small records that our target applicationsexhibit. In general, a single record inserted into a table with kindexes results in 2 × (k + 1) pages written under SQLite [18].
Consequently, when using SQLite to store raw sensor data, asdata size grows, the query performance begins to degrade and fallbehind the rate necessary for real-time computation of biomarkers.After about 8 hours of data collection, biomarker computationsbegin to timeout due to growing query response time.
Log-structured storage systems under development, such asRocksDB [26], may provide an alternative to SQLite; however,RocksDB aims to support general RDBMS workloads and lacksdata sync capabilities between the mobile device and the cloudplatform, which is a key requirement in mCerebrum.
To address the specific requirements of mobile sensor data work-loads, we have developed a custom log-structured storage layercalled Pebbles, which is optimized for high-frequency append-onlywrites of data arriving in batch or record streams. Pebbles also pro-vides transparent data sync, allowing applications to offload datato the cloud for further processing and data archive. On the mobiledevice, data is stored in a circular log to maximize the throughputof flash memory. To support fast queries, Pebbles maintains a light-weight index on a logical timestamp and topic, which is used toidentify data streams.
Figure 5 shows the max write throughput by varying data writesizes of Pebbles versus SQLite and a cluster of multiple SQLitedatabases (used in AWARE [7]). This benchmark was performedon the internal flash memory of a Samsung Galaxy Tab S2 . Eachsystem was configured with an 8MB in-memory buffer (split acrossdatabase instances for the cluster with round-robin writes) andperformed a total of 4GB writes. The optimal throughput of 72MBps was determined by performing one large consecutive writeto the internal memory.
At lower data write sizes, such as those exhibited by typicalmCerebrum applications, Pebbles outperforms SQLite by more than20x. The performance gain of Pebbles is directly related to thelower write amplification relative to SQLite. In the lower data writesizes, the CPU becomes the bottleneck, preventing Pebbles fromsaturating maximum storage bandwidth. Nevertheless, the achievedthroughput is sufficient for mCerebrum.
At large data writes, such as those to be exhibited by the mCere-brum batch data workloads, Pebbles is able to saturate storagebandwidth and outperforms SQLite by more than 4x. SQLite is notcapable of saturating the storage bandwidth at these large writesizes due to system overhead, including primary key constraintsand index maintenance, which attribute to increased write amplifi-cation. The SQLite cluster suffers even more performance due toits reduced ability to perform sequential writes. In Pebbles, writeamplification is minimized through the use of a circular log that isclustered with the primary index i.e., both are append-only on new
1Write amplification refers to the actual amount of data that is rewritten for a givenrecord e.g., if records are stored in 8KB pages, then writing a 12 byte record results inwriting at least an 8KB page.
data writes and garbage collection is performed, on both, sequen-tially with an optional cloud data sync.
5 ANALYZE — CONCURRENTCOMPUTATION OF MULTI-SENSORBIOMARKERS
The second tenet, analyze, is principally responsible for process-ing the collected high-rate sensor data to compute features andbiomarkers that can be used by other apps. For example, whenvalidating a new biomarker (a key usage scenario for mCerebrum),its real-time computation can be used to prompt participants toconfirm or refute the detected event in the free-living environment.The main challenge is to screen the data for acceptable quality,clean the data, compute hundreds of features, and then apply themachine-learning models of all biomarkers, all in real-time, with-out falling behind the incoming data rate and without saturatingthe CPU and memory of resource constrained phones. One keyapproach to making this feasible is to facilitate efficient sharing ofintermediate results (e.g., features) so computation can be reused.
We first describe in Section 5.1 how data and computation can bereused to scale the analytics. Section 5.2 explores and evaluates thetechniques to manage system overload so as to manage Android’squality of service system to support continuous high-frequencysensor data analysis. Finally, Section 5.3 describes Stream Processorthat implements real-time computation and sharing of features andbiomarkers throughout mCerebrum. We also analyze the impact ofsuch sharing on improving CPU and memory efficiency.
5.1 Data and Computation ReuseIt is not enough to have communication efficiency in each app, thesystem needs to reuse as much data and computation as possible.The modularization of mCerebrum allows sensor data to be col-lected once by a single application that publishes them throughDataKit for use by other apps. This allows multiple applicationsto receive data concurrently by subscribing to data streams. Com-putation reuse occurs when various processing components of theplatform compute intermediate results or resulting biomarkers thatare placed on the DataKit bus where others can utilize these pro-cessed streams instead of recomputing from raw data.
5.1.1 Supporting Onboard Sense-Analyze-Act. To enable the en-tire pipeline of sense-analyze-act locally on the phone, mCere-brum supports three different styles of data processing: micro-batch,batch, and on-demand. In each of these instances, the computationmust not fall behind data arrival rate, i.e., meet a real-time con-straint. Streaming operations, such as data quality or visualization,need to receive data from the system and process it almost immedi-ately; they use a micro-batch latency of one second. On-demandcomputations or batch processing, such as biomarker computation,require the data be queried in blocks from DataKit. In our currentimplementation, for the purposes of computing stress and smoking,we use a batch latency of 60 seconds.
Due to high load, computational complexity is a concern forall data processing operations within mCerebrum. When possible,computationally efficient algorithms are preferred such as onlinealgorithms for mean and variance. For computationally expensive
mCerebrum: A Mobile Sensing Software Platform SenSys ’17, November 6–8, 2017, Delft, Netherlands
operations such as computing percentiles, online approximationsare used. In the case of convolution, the amount of data to beprocessed is limited to control CPU load.
5.2 Handling System OverloadAndroid is based on the Linux kernel and applications are runas self-contained processes. This allows Android to manage theQuality-of-Service (QoS) it provides to the user; however, this QoSis designed for regular consumer use and not configurable for long-running background applications such as the ones we utilize toprovide a continuously running pipeline of sense-analyze-act. An-droid selectively kills, and subsequently removes from memory,applications as the system begins to run out of resources.
To determine which processes should be killed when low onmemory, Android places each process into an importance hierar-chy based on the components running in them and the state ofthose components. The process types are (in order of importance):foreground, visible, service, and cached. Due to the QoS constraintsfrom the OS, we find that our applications are the typical onesremoved due to their service process state and worse, the OS sendsa SIGNAL_KILL command instead of a signal that can be trappedby our applications for a graceful shutdown. This forces our appli-cations to have a second watchdog application that can restart anapplication if the OS decided to remove it.
mCerebrum adopts three separate mechanisms to combat theoverload introduced and subsequent semi-random application clos-ing. First, the core service in critical applications is declared asa foreground process, which is a way to request that the OS notremove this application from a running state. This is especiallycritical for applications that interact with the participant through auser interface or a scheduling algorithm. Second, the mCerebrumkernel acts like a watchdog system for the rest of the applicationservices. It periodically checks (every 30 seconds) to ensure thatthe list of services it expects to be running are operational. In theevent that a service is not functional, it utilizes an exponentialback-off mechanism to quickly restart a service and in the event ofcontinued failure, it will slow attempts to restart processes. Finally,every service must maintain a persistent copy of internal state onthe internal phone memory and be able to resume when restarted.In addition, we adopt several optimizations (described below) tolimit system overload and avoid application removal by the OS.
5.2.1 Micro-batching to Control Communication Load. Sharingand processing data as they arrive in real-time increases both thesystem and communication load due to the maximum bandwidthand maximum buffer size limits for Inter-Process Communication(IPC) that are used to share data and intermediate results amongthe data sources and requesting applications.
Our initial implementation serialized measurements from sen-sors into individual messages before sending them through DataKit;however, once the data rate exceeded 700 hertz (on a Samsung S4),the system queues overflowed and the system began losing data. Weadopt a micro-batching design where data is shared for computationin small batches that introduces a small latency, but significantlyreduces system overload.
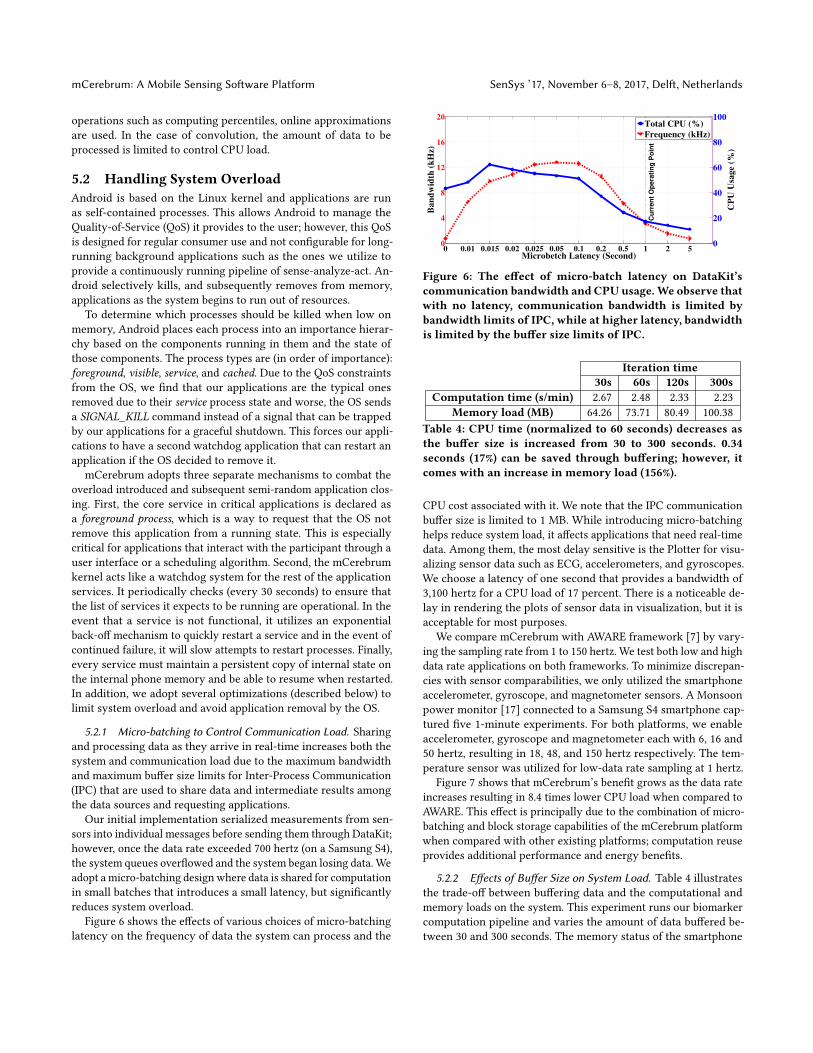
Figure 6 shows the effects of various choices of micro-batchinglatency on the frequency of data the system can process and the
0 0.01 0.015 0.02 0.025 0.05 0.1 0.2 0.5 1 2 50
4
8
12
16
20
Cu
rren
t O
pera
tin
g P
oin
t
Ba
nd
wid
th (
kH
z)
Microbetch Latency (Second)
0
20
40
60
80
100
CP
U U
sag
e (
%)
Total CPU (%)
Frequency (kHz)
Figure 6: The effect of micro-batch latency on DataKit’scommunication bandwidth and CPU usage.We observe thatwith no latency, communication bandwidth is limited bybandwidth limits of IPC, while at higher latency, bandwidthis limited by the buffer size limits of IPC.
Iteration time30s 60s 120s 300s
Computation time (s/min) 2.67 2.48 2.33 2.23Memory load (MB) 64.26 73.71 80.49 100.38
Table 4: CPU time (normalized to 60 seconds) decreases asthe buffer size is increased from 30 to 300 seconds. 0.34seconds (17%) can be saved through buffering; however, itcomes with an increase in memory load (156%).
CPU cost associated with it. We note that the IPC communicationbuffer size is limited to 1 MB. While introducing micro-batchinghelps reduce system load, it affects applications that need real-timedata. Among them, the most delay sensitive is the Plotter for visu-alizing sensor data such as ECG, accelerometers, and gyroscopes.We choose a latency of one second that provides a bandwidth of3,100 hertz for a CPU load of 17 percent. There is a noticeable de-lay in rendering the plots of sensor data in visualization, but it isacceptable for most purposes.
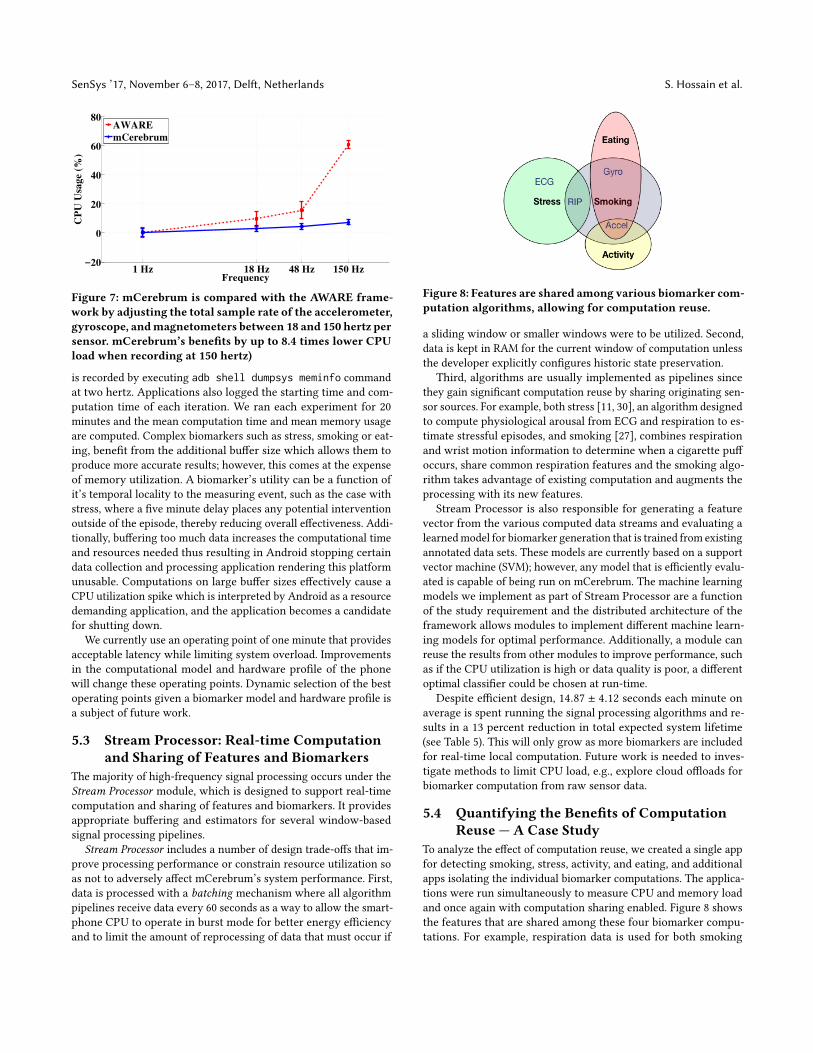
We compare mCerebrum with AWARE framework [7] by vary-ing the sampling rate from 1 to 150 hertz. We test both low and highdata rate applications on both frameworks. To minimize discrepan-cies with sensor comparabilities, we only utilized the smartphoneaccelerometer, gyroscope, and magnetometer sensors. A Monsoonpower monitor [17] connected to a Samsung S4 smartphone cap-tured five 1-minute experiments. For both platforms, we enableaccelerometer, gyroscope and magnetometer each with 6, 16 and50 hertz, resulting in 18, 48, and 150 hertz respectively. The tem-perature sensor was utilized for low-data rate sampling at 1 hertz.
Figure 7 shows that mCerebrum’s benefit grows as the data rateincreases resulting in 8.4 times lower CPU load when compared toAWARE. This effect is principally due to the combination of micro-batching and block storage capabilities of the mCerebrum platformwhen compared with other existing platforms; computation reuseprovides additional performance and energy benefits.
5.2.2 Effects of Buffer Size on System Load. Table 4 illustratesthe trade-off between buffering data and the computational andmemory loads on the system. This experiment runs our biomarkercomputation pipeline and varies the amount of data buffered be-tween 30 and 300 seconds. The memory status of the smartphone
SenSys ’17, November 6–8, 2017, Delft, Netherlands S. Hossain et al.
1 Hz 18 Hz 48 Hz 150 Hz−20
0
20
40
60
80
Frequency
CP
U U
sag
e (
%)
AWARE
mCerebrum
Figure 7: mCerebrum is compared with the AWARE frame-work by adjusting the total sample rate of the accelerometer,gyroscope, andmagnetometers between 18 and 150 hertz persensor. mCerebrum’s benefits by up to 8.4 times lower CPUload when recording at 150 hertz)
is recorded by executing adb shell dumpsys meminfo commandat two hertz. Applications also logged the starting time and com-putation time of each iteration. We ran each experiment for 20minutes and the mean computation time and mean memory usageare computed. Complex biomarkers such as stress, smoking or eat-ing, benefit from the additional buffer size which allows them toproduce more accurate results; however, this comes at the expenseof memory utilization. A biomarker’s utility can be a function ofit’s temporal locality to the measuring event, such as the case withstress, where a five minute delay places any potential interventionoutside of the episode, thereby reducing overall effectiveness. Addi-tionally, buffering too much data increases the computational timeand resources needed thus resulting in Android stopping certaindata collection and processing application rendering this platformunusable. Computations on large buffer sizes effectively cause aCPU utilization spike which is interpreted by Android as a resourcedemanding application, and the application becomes a candidatefor shutting down.
We currently use an operating point of one minute that providesacceptable latency while limiting system overload. Improvementsin the computational model and hardware profile of the phonewill change these operating points. Dynamic selection of the bestoperating points given a biomarker model and hardware profile isa subject of future work.
5.3 Stream Processor: Real-time Computationand Sharing of Features and Biomarkers
The majority of high-frequency signal processing occurs under theStream Processor module, which is designed to support real-timecomputation and sharing of features and biomarkers. It providesappropriate buffering and estimators for several window-basedsignal processing pipelines.
Stream Processor includes a number of design trade-offs that im-prove processing performance or constrain resource utilization soas not to adversely affect mCerebrum’s system performance. First,data is processed with a batching mechanism where all algorithmpipelines receive data every 60 seconds as a way to allow the smart-phone CPU to operate in burst mode for better energy efficiencyand to limit the amount of reprocessing of data that must occur if
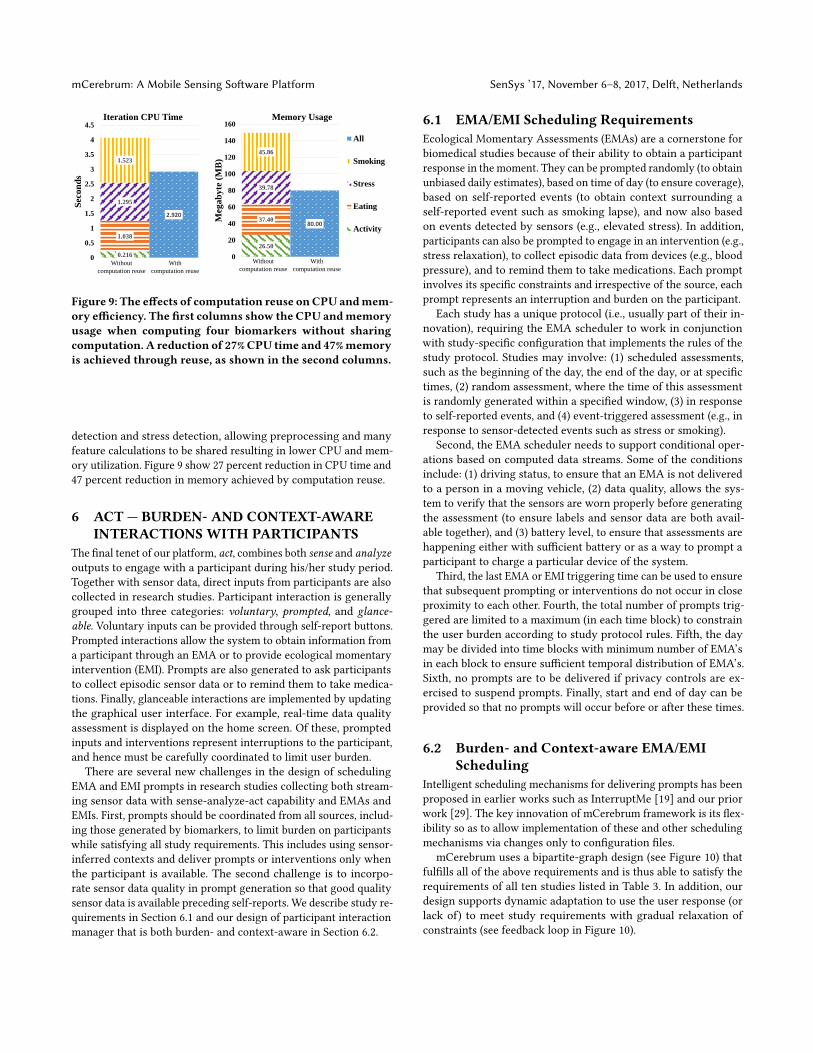
Figure 8: Features are shared among various biomarker com-putation algorithms, allowing for computation reuse.
a sliding window or smaller windows were to be utilized. Second,data is kept in RAM for the current window of computation unlessthe developer explicitly configures historic state preservation.
Third, algorithms are usually implemented as pipelines sincethey gain significant computation reuse by sharing originating sen-sor sources. For example, both stress [11, 30], an algorithm designedto compute physiological arousal from ECG and respiration to es-timate stressful episodes, and smoking [27], combines respirationand wrist motion information to determine when a cigarette puffoccurs, share common respiration features and the smoking algo-rithm takes advantage of existing computation and augments theprocessing with its new features.
Stream Processor is also responsible for generating a featurevector from the various computed data streams and evaluating alearnedmodel for biomarker generation that is trained from existingannotated data sets. These models are currently based on a supportvector machine (SVM); however, any model that is efficiently evalu-ated is capable of being run on mCerebrum. The machine learningmodels we implement as part of Stream Processor are a functionof the study requirement and the distributed architecture of theframework allows modules to implement different machine learn-ing models for optimal performance. Additionally, a module canreuse the results from other modules to improve performance, suchas if the CPU utilization is high or data quality is poor, a differentoptimal classifier could be chosen at run-time.
Despite efficient design, 14.87 ± 4.12 seconds each minute onaverage is spent running the signal processing algorithms and re-sults in a 13 percent reduction in total expected system lifetime(see Table 5). This will only grow as more biomarkers are includedfor real-time local computation. Future work is needed to inves-tigate methods to limit CPU load, e.g., explore cloud offloads forbiomarker computation from raw sensor data.
5.4 Quantifying the Benefits of ComputationReuse — A Case Study
To analyze the effect of computation reuse, we created a single appfor detecting smoking, stress, activity, and eating, and additionalapps isolating the individual biomarker computations. The applica-tions were run simultaneously to measure CPU and memory loadand once again with computation sharing enabled. Figure 8 showsthe features that are shared among these four biomarker compu-tations. For example, respiration data is used for both smoking
mCerebrum: A Mobile Sensing Software Platform SenSys ’17, November 6–8, 2017, Delft, Netherlands
26.50
37.40
39.78
45.86
80.00
0
20
40
60
80
100
120
140
160
Meg
ab
yte
(M
B)
Memory Usage
All
Smoking
Stress
Eating
Activity
0.216
1.038
1.295
1.523
2.920
0
0.5
1
1.5
2
2.5
3
3.5
4
4.5
Sec
on
ds
Iteration CPU Time
With
computation reuse
Without
computation reuseWith
computation reuse
Without
computation reuse
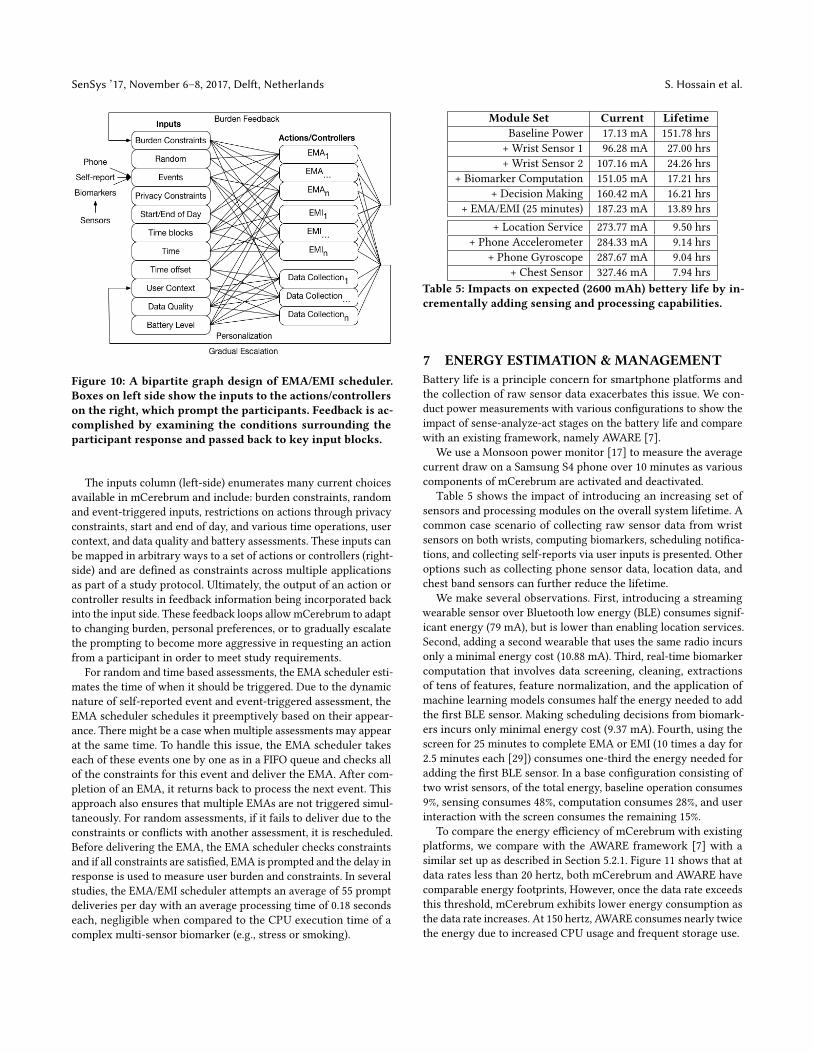
Figure 9: The effects of computation reuse onCPU andmem-ory efficiency. The first columns show the CPU andmemoryusage when computing four biomarkers without sharingcomputation. A reduction of 27%CPU time and 47%memoryis achieved through reuse, as shown in the second columns.
detection and stress detection, allowing preprocessing and manyfeature calculations to be shared resulting in lower CPU and mem-ory utilization. Figure 9 show 27 percent reduction in CPU time and47 percent reduction in memory achieved by computation reuse.
6 ACT — BURDEN- AND CONTEXT-AWAREINTERACTIONS WITH PARTICIPANTS
The final tenet of our platform, act, combines both sense and analyzeoutputs to engage with a participant during his/her study period.Together with sensor data, direct inputs from participants are alsocollected in research studies. Participant interaction is generallygrouped into three categories: voluntary, prompted, and glance-able. Voluntary inputs can be provided through self-report buttons.Prompted interactions allow the system to obtain information froma participant through an EMA or to provide ecological momentaryintervention (EMI). Prompts are also generated to ask participantsto collect episodic sensor data or to remind them to take medica-tions. Finally, glanceable interactions are implemented by updatingthe graphical user interface. For example, real-time data qualityassessment is displayed on the home screen. Of these, promptedinputs and interventions represent interruptions to the participant,and hence must be carefully coordinated to limit user burden.
There are several new challenges in the design of schedulingEMA and EMI prompts in research studies collecting both stream-ing sensor data with sense-analyze-act capability and EMAs andEMIs. First, prompts should be coordinated from all sources, includ-ing those generated by biomarkers, to limit burden on participantswhile satisfying all study requirements. This includes using sensor-inferred contexts and deliver prompts or interventions only whenthe participant is available. The second challenge is to incorpo-rate sensor data quality in prompt generation so that good qualitysensor data is available preceding self-reports. We describe study re-quirements in Section 6.1 and our design of participant interactionmanager that is both burden- and context-aware in Section 6.2.
6.1 EMA/EMI Scheduling RequirementsEcological Momentary Assessments (EMAs) are a cornerstone forbiomedical studies because of their ability to obtain a participantresponse in the moment. They can be prompted randomly (to obtainunbiased daily estimates), based on time of day (to ensure coverage),based on self-reported events (to obtain context surrounding aself-reported event such as smoking lapse), and now also basedon events detected by sensors (e.g., elevated stress). In addition,participants can also be prompted to engage in an intervention (e.g.,stress relaxation), to collect episodic data from devices (e.g., bloodpressure), and to remind them to take medications. Each promptinvolves its specific constraints and irrespective of the source, eachprompt represents an interruption and burden on the participant.
Each study has a unique protocol (i.e., usually part of their in-novation), requiring the EMA scheduler to work in conjunctionwith study-specific configuration that implements the rules of thestudy protocol. Studies may involve: (1) scheduled assessments,such as the beginning of the day, the end of the day, or at specifictimes, (2) random assessment, where the time of this assessmentis randomly generated within a specified window, (3) in responseto self-reported events, and (4) event-triggered assessment (e.g., inresponse to sensor-detected events such as stress or smoking).
Second, the EMA scheduler needs to support conditional oper-ations based on computed data streams. Some of the conditionsinclude: (1) driving status, to ensure that an EMA is not deliveredto a person in a moving vehicle, (2) data quality, allows the sys-tem to verify that the sensors are worn properly before generatingthe assessment (to ensure labels and sensor data are both avail-able together), and (3) battery level, to ensure that assessments arehappening either with sufficient battery or as a way to prompt aparticipant to charge a particular device of the system.
Third, the last EMA or EMI triggering time can be used to ensurethat subsequent prompting or interventions do not occur in closeproximity to each other. Fourth, the total number of prompts trig-gered are limited to a maximum (in each time block) to constrainthe user burden according to study protocol rules. Fifth, the daymay be divided into time blocks with minimum number of EMA’sin each block to ensure sufficient temporal distribution of EMA’s.Sixth, no prompts are to be delivered if privacy controls are ex-ercised to suspend prompts. Finally, start and end of day can beprovided so that no prompts will occur before or after these times.
6.2 Burden- and Context-aware EMA/EMIScheduling
Intelligent scheduling mechanisms for delivering prompts has beenproposed in earlier works such as InterruptMe [19] and our priorwork [29]. The key innovation of mCerebrum framework is its flex-ibility so as to allow implementation of these and other schedulingmechanisms via changes only to configuration files.
mCerebrum uses a bipartite-graph design (see Figure 10) thatfulfills all of the above requirements and is thus able to satisfy therequirements of all ten studies listed in Table 3. In addition, ourdesign supports dynamic adaptation to use the user response (orlack of) to meet study requirements with gradual relaxation ofconstraints (see feedback loop in Figure 10).
SenSys ’17, November 6–8, 2017, Delft, Netherlands S. Hossain et al.
Figure 10: A bipartite graph design of EMA/EMI scheduler.Boxes on left side show the inputs to the actions/controllerson the right, which prompt the participants. Feedback is ac-complished by examining the conditions surrounding theparticipant response and passed back to key input blocks.
The inputs column (left-side) enumerates many current choicesavailable in mCerebrum and include: burden constraints, randomand event-triggered inputs, restrictions on actions through privacyconstraints, start and end of day, and various time operations, usercontext, and data quality and battery assessments. These inputs canbe mapped in arbitrary ways to a set of actions or controllers (right-side) and are defined as constraints across multiple applicationsas part of a study protocol. Ultimately, the output of an action orcontroller results in feedback information being incorporated backinto the input side. These feedback loops allowmCerebrum to adaptto changing burden, personal preferences, or to gradually escalatethe prompting to become more aggressive in requesting an actionfrom a participant in order to meet study requirements.
For random and time based assessments, the EMA scheduler esti-mates the time of when it should be triggered. Due to the dynamicnature of self-reported event and event-triggered assessment, theEMA scheduler schedules it preemptively based on their appear-ance. There might be a case when multiple assessments may appearat the same time. To handle this issue, the EMA scheduler takeseach of these events one by one as in a FIFO queue and checks allof the constraints for this event and deliver the EMA. After com-pletion of an EMA, it returns back to process the next event. Thisapproach also ensures that multiple EMAs are not triggered simul-taneously. For random assessments, if it fails to deliver due to theconstraints or conflicts with another assessment, it is rescheduled.Before delivering the EMA, the EMA scheduler checks constraintsand if all constraints are satisfied, EMA is prompted and the delay inresponse is used to measure user burden and constraints. In severalstudies, the EMA/EMI scheduler attempts an average of 55 promptdeliveries per day with an average processing time of 0.18 secondseach, negligible when compared to the CPU execution time of acomplex multi-sensor biomarker (e.g., stress or smoking).
Module Set Current LifetimeBaseline Power 17.13 mA 151.78 hrs
+ Wrist Sensor 1 96.28 mA 27.00 hrs+ Wrist Sensor 2 107.16 mA 24.26 hrs
+ Biomarker Computation 151.05 mA 17.21 hrs+ Decision Making 160.42 mA 16.21 hrs
+ EMA/EMI (25 minutes) 187.23 mA 13.89 hrs+ Location Service 273.77 mA 9.50 hrs
+ Phone Accelerometer 284.33 mA 9.14 hrs+ Phone Gyroscope 287.67 mA 9.04 hrs
+ Chest Sensor 327.46 mA 7.94 hrsTable 5: Impacts on expected (2600 mAh) bettery life by in-crementally adding sensing and processing capabilities.
7 ENERGY ESTIMATION & MANAGEMENTBattery life is a principle concern for smartphone platforms andthe collection of raw sensor data exacerbates this issue. We con-duct power measurements with various configurations to show theimpact of sense-analyze-act stages on the battery life and comparewith an existing framework, namely AWARE [7].
We use a Monsoon power monitor [17] to measure the averagecurrent draw on a Samsung S4 phone over 10 minutes as variouscomponents of mCerebrum are activated and deactivated.
Table 5 shows the impact of introducing an increasing set ofsensors and processing modules on the overall system lifetime. Acommon case scenario of collecting raw sensor data from wristsensors on both wrists, computing biomarkers, scheduling notifica-tions, and collecting self-reports via user inputs is presented. Otheroptions such as collecting phone sensor data, location data, andchest band sensors can further reduce the lifetime.
We make several observations. First, introducing a streamingwearable sensor over Bluetooth low energy (BLE) consumes signif-icant energy (79 mA), but is lower than enabling location services.Second, adding a second wearable that uses the same radio incursonly a minimal energy cost (10.88 mA). Third, real-time biomarkercomputation that involves data screening, cleaning, extractionsof tens of features, feature normalization, and the application ofmachine learning models consumes half the energy needed to addthe first BLE sensor. Making scheduling decisions from biomark-ers incurs only minimal energy cost (9.37 mA). Fourth, using thescreen for 25 minutes to complete EMA or EMI (10 times a day for2.5 minutes each [29]) consumes one-third the energy needed foradding the first BLE sensor. In a base configuration consisting oftwo wrist sensors, of the total energy, baseline operation consumes9%, sensing consumes 48%, computation consumes 28%, and userinteraction with the screen consumes the remaining 15%.
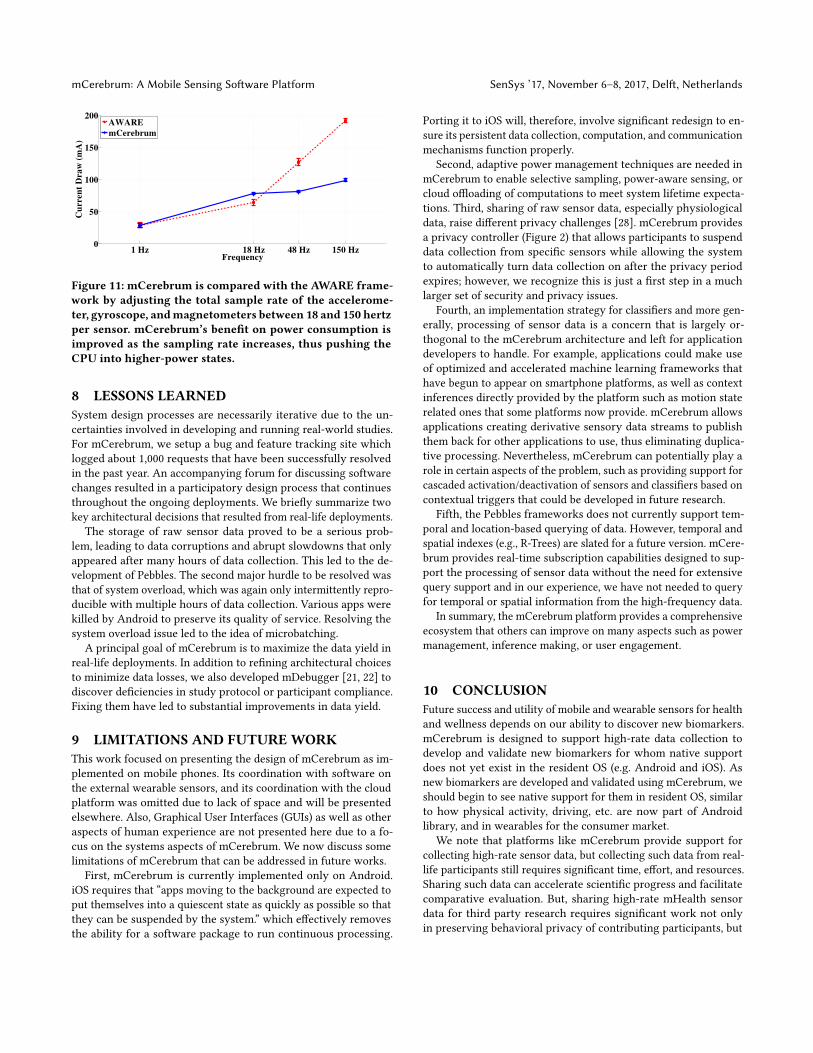
To compare the energy efficiency of mCerebrum with existingplatforms, we compare with the AWARE framework [7] with asimilar set up as described in Section 5.2.1. Figure 11 shows that atdata rates less than 20 hertz, both mCerebrum and AWARE havecomparable energy footprints, However, once the data rate exceedsthis threshold, mCerebrum exhibits lower energy consumption asthe data rate increases. At 150 hertz, AWARE consumes nearly twicethe energy due to increased CPU usage and frequent storage use.
mCerebrum: A Mobile Sensing Software Platform SenSys ’17, November 6–8, 2017, Delft, Netherlands
1 Hz 18 Hz 48 Hz 150 Hz0
50
100
150
200
Frequency
Cu
rren
t D
raw
(m
A)
AWARE
mCerebrum
Figure 11: mCerebrum is compared with the AWARE frame-work by adjusting the total sample rate of the accelerome-ter, gyroscope, andmagnetometers between 18 and 150 hertzper sensor. mCerebrum’s benefit on power consumption isimproved as the sampling rate increases, thus pushing theCPU into higher-power states.
8 LESSONS LEARNEDSystem design processes are necessarily iterative due to the un-certainties involved in developing and running real-world studies.For mCerebrum, we setup a bug and feature tracking site whichlogged about 1,000 requests that have been successfully resolvedin the past year. An accompanying forum for discussing softwarechanges resulted in a participatory design process that continuesthroughout the ongoing deployments. We briefly summarize twokey architectural decisions that resulted from real-life deployments.
The storage of raw sensor data proved to be a serious prob-lem, leading to data corruptions and abrupt slowdowns that onlyappeared after many hours of data collection. This led to the de-velopment of Pebbles. The second major hurdle to be resolved wasthat of system overload, which was again only intermittently repro-ducible with multiple hours of data collection. Various apps werekilled by Android to preserve its quality of service. Resolving thesystem overload issue led to the idea of microbatching.
A principal goal of mCerebrum is to maximize the data yield inreal-life deployments. In addition to refining architectural choicesto minimize data losses, we also developed mDebugger [21, 22] todiscover deficiencies in study protocol or participant compliance.Fixing them have led to substantial improvements in data yield.
9 LIMITATIONS AND FUTUREWORKThis work focused on presenting the design of mCerebrum as im-plemented on mobile phones. Its coordination with software onthe external wearable sensors, and its coordination with the cloudplatform was omitted due to lack of space and will be presentedelsewhere. Also, Graphical User Interfaces (GUIs) as well as otheraspects of human experience are not presented here due to a fo-cus on the systems aspects of mCerebrum. We now discuss somelimitations of mCerebrum that can be addressed in future works.
First, mCerebrum is currently implemented only on Android.iOS requires that “apps moving to the background are expected toput themselves into a quiescent state as quickly as possible so thatthey can be suspended by the system.” which effectively removesthe ability for a software package to run continuous processing.
Porting it to iOS will, therefore, involve significant redesign to en-sure its persistent data collection, computation, and communicationmechanisms function properly.
Second, adaptive power management techniques are needed inmCerebrum to enable selective sampling, power-aware sensing, orcloud offloading of computations to meet system lifetime expecta-tions. Third, sharing of raw sensor data, especially physiologicaldata, raise different privacy challenges [28]. mCerebrum providesa privacy controller (Figure 2) that allows participants to suspenddata collection from specific sensors while allowing the systemto automatically turn data collection on after the privacy periodexpires; however, we recognize this is just a first step in a muchlarger set of security and privacy issues.
Fourth, an implementation strategy for classifiers and more gen-erally, processing of sensor data is a concern that is largely or-thogonal to the mCerebrum architecture and left for applicationdevelopers to handle. For example, applications could make useof optimized and accelerated machine learning frameworks thathave begun to appear on smartphone platforms, as well as contextinferences directly provided by the platform such as motion staterelated ones that some platforms now provide. mCerebrum allowsapplications creating derivative sensory data streams to publishthem back for other applications to use, thus eliminating duplica-tive processing. Nevertheless, mCerebrum can potentially play arole in certain aspects of the problem, such as providing support forcascaded activation/deactivation of sensors and classifiers based oncontextual triggers that could be developed in future research.
Fifth, the Pebbles frameworks does not currently support tem-poral and location-based querying of data. However, temporal andspatial indexes (e.g., R-Trees) are slated for a future version. mCere-brum provides real-time subscription capabilities designed to sup-port the processing of sensor data without the need for extensivequery support and in our experience, we have not needed to queryfor temporal or spatial information from the high-frequency data.
In summary, the mCerebrum platform provides a comprehensiveecosystem that others can improve on many aspects such as powermanagement, inference making, or user engagement.
10 CONCLUSIONFuture success and utility of mobile and wearable sensors for healthand wellness depends on our ability to discover new biomarkers.mCerebrum is designed to support high-rate data collection todevelop and validate new biomarkers for whom native supportdoes not yet exist in the resident OS (e.g. Android and iOS). Asnew biomarkers are developed and validated using mCerebrum, weshould begin to see native support for them in resident OS, similarto how physical activity, driving, etc. are now part of Androidlibrary, and in wearables for the consumer market.
We note that platforms like mCerebrum provide support forcollecting high-rate sensor data, but collecting such data from real-life participants still requires significant time, effort, and resources.Sharing such data can accelerate scientific progress and facilitatecomparative evaluation. But, sharing high-rate mHealth sensordata for third party research requires significant work not onlyin preserving behavioral privacy of contributing participants, but
SenSys ’17, November 6–8, 2017, Delft, Netherlands S. Hossain et al.
also requires extensive works in efficient and meaningful annota-tions of the data, together with provenance of each stage of theprocessing pipeline that converts sensor data into biomarkers. De-veloping a complementary provenance cyberinfrastructure systemfor automatic generation and processing of metadata for high-ratemHealth sensor data can amplify the scientific utility of platformslike mCerebrum.
ACKNOWLEDGMENTSThe authors thank our shepherd and the anonymous reviewers fortheir insightful feedback and suggestions. We would also like tothank the many individuals that have helped to develop, test, anddeploy this platform at sites around the world.
The authors acknowledge support by the National Science Foun-dation under award numbers ACI-1640813, CNS-1212901, IIS-1231754and IIS-1636916, and by the National Institutes of Health undergrants R01CA190329, R01MD010362, R01DE025244, UG1DA040309,and U54EB020404 (by NIBIB) through funds provided by the trans-NIH Big Data-to-Knowledge (BD2K) initiative.
REFERENCES[1] Nadav Aharony, Wei Pan, Cory Ip, Inas Khayal, and Alex Pentland. 2011. Social
fMRI: Investigating and shaping social mechanisms in the real world. Pervasiveand Mobile Computing 7, 6 (2011), 643–659.
[2] Commcare App. 2017. Online at https://www.commcarehq.org/. visited April(2017).
[3] Ari Y Benbasat and Joseph A Paradiso. 2007. A framework for the automatedgeneration of power-efficient classifiers for embedded sensor nodes. In Proceed-ings of the 5th international conference on Embedded networked sensor systems.ACM, 219–232.
[4] Waylon Brunette, Rita Sodt, Rohit Chaudhri, Mayank Goel, Michael Falcone,Jaylen Van Orden, and Gaetano Borriello. 2012. Open data kit sensors: a sensorintegration framework for android at the application-level. In Proceedings of the10th international conference on Mobile systems, applications, and services. ACM,351–364.
[5] Supriyo Chakraborty, Chenguang Shen, Kasturi Rangan Raghavan, YasserShoukry, Matt Millar, and Mani Srivastava. 2014. ipShield: a framework forenforcing context-aware privacy. In 11th USENIX Symposium on Networked Sys-tems Design and Implementation (NSDI 14). 143–156.
[6] Paco The Personal Analytics Companion. 2017. Online athttps://www.pacoapp.com/. visited April (2017).
[7] Denzil Ferreira, Vassilis Kostakos, and Anind K Dey. 2015. AWARE: mobilecontext instrumentation framework. Frontiers in ICT 2 (2015), 6.
[8] Google’s FIT. 2017. Online at https://www.google.com/fit/. visited April (2017).[9] Apple’s HealthKit. 2017. Online at https://developer.apple.com/healthkit/. visited
April (2017).[10] Timothy Hnat, Syed Hossain, Nasir Ali, Simona Carini, Tyson Condie, Ida Sim,
Mani Srivastava, and Santosh Kumar. 2017. mCerebrum and Cerebral Cortex: AReal-time Collection, Analytic, and Intervention Platform for High-frequencyMobile Sensor Data. In Proceedings of the 2017 American Medical InformaticsAssociation (AMIA) Annual Symposium.
[11] Karen Hovsepian, Mustafa al’Absi, Emre Ertin, Thomas Kamarck, Motohiro Naka-jima, and Santosh Kumar. 2015. cStress: towards a gold standard for continuousstress assessment in the mobile environment. In Proceedings of the 2015 ACMInternational Joint Conference on Pervasive and Ubiquitous Computing. ACM,493–504.
[12] Cheng-Kang Hsieh, Hongsuda Tangmunarunkit, Faisal Alquaddoomi, John Jenk-ins, Jinha Kang, Cameron Ketcham, Brent Longstaff, Joshua Selsky, Betta Dawson,Dallas Swendeman, et al. 2013. Lifestreams: A modular sense-making toolsetfor identifying important patterns from everyday life. In Proceedings of the 11thACM Conference on Embedded Networked Sensor Systems. ACM, 5.
[13] Jennifer Jardine, Jonathan Fisher, and Benjamin Carrick. 2015. Apple’s Re-searchKit: smart data collection for the smartphone era? Journal of the RoyalSociety of Medicine 108, 8 (2015), 294–296.
[14] Santosh Kumar, Wendy Nilsen, Misha Pavel, and Mani Srivastava. 2013. Mobilehealth: Revolutionizing healthcare through transdisciplinary research. Computer46, 1 (2013), 28–35.
[15] Felix Xiaozhu Lin, Zhen Wang, Robert LiKamWa, and Lin Zhong. 2012. Reflex:using low-power processors in smartphones without knowing them. ACM
SIGARCH Computer Architecture News 40, 1 (2012), 13–24.[16] Hong Lu, Jun Yang, Zhigang Liu, Nicholas D Lane, Tanzeem Choudhury, and An-
drew T Campbell. 2010. The Jigsaw continuous sensing engine for mobile phoneapplications. In Proceedings of the 8th ACM conference on embedded networkedsensor systems. ACM, 71–84.
[17] monitor 2017. Monsoon Power Monitor. (2017). Retrieved August 14, 2017 fromhttp://www.msoon.com/LabEquipment
[18] Gihwan Oh, Sangchul Kim, Sang-Won Lee, and Bongki Moon. 2015. SQLiteOptimization with Phase Change Memory for Mobile Applications. Proc. VLDBEndow. 8, 12 (Aug. 2015), 1454–1465. https://doi.org/10.14778/2824032.2824044
[19] Veljko Pejovic and Mirco Musolesi. 2014. InterruptMe: Designing IntelligentPrompting Mechanisms for Pervasive Applications. In Proceedings of the 2014ACM International Joint Conference on Pervasive and Ubiquitous Computing (Ubi-Comp ’14). ACM, New York, NY, USA, 897–908. https://doi.org/10.1145/2632048.2632062
[20] Mika Raento, Antti Oulasvirta, Renaud Petit, and Hannu Toivonen. 2005. Con-textPhone: A prototyping platform for context-aware mobile applications. IEEEpervasive computing 4, 2 (2005), 51–59.
[21] Md. Mahbubur Rahman, Nasir Ali, Rummana Bari, Nazir Saleheen, Mustafaal’Absi, Emre Ertin, Ashley Kennedy, Kenzie L. Preston, and Santosh Kumar. 2017.mDebugger: Assessing and Diagnosing the Fidelity and Yield of Mobile SensorData. In Mobile Health - Sensors, Analytic Methods, and Applications. Springer,Cham, Switzerland, 121–143. https://doi.org/10.1007/978-3-319-51394-2_7
[22] Md. Mahbubur Rahman, Rummana Bari, Amin Ahsan Ali, Moushumi Sharmin,Andrew Raij, Karen Hovsepian, Syed Monowar Hossain, Emre Ertin, AshleyKennedy, David H. Epstein, Kenzie L. Preston, Michelle Jobes, J. Gayle Beck,Satish Kedia, Kenneth D. Ward, Mustafa al’Absi, and Santosh Kumar. 2014. AreWe There Yet?: Feasibility of Continuous Stress Assessment via Wireless Phys-iological Sensors. In Proceedings of the 5th ACM Conference on Bioinformatics,Computational Biology, and Health Informatics (BCB ’14). ACM, New York, NY,USA, 479–488. https://doi.org/10.1145/2649387.2649433
[23] Reza Rawassizadeh, Martin Tomitsch, Manouchehr Nourizadeh, Elaheh Momeni,Aaron Peery, Liudmila Ulanova, and Michael Pazzani. 2015. Energy-EfficientIntegration of Continuous Context Sensing and Prediction into Smartwatches.Sensors 15, 9 (2015), 22616–22645.
[24] Reza Rawassizadeh, Martin Tomitsch, Katarzyna Wac, and A Min Tjoa. 2013.UbiqLog: a generic mobile phone-based life-log framework. Personal and ubiqui-tous computing 17, 4 (2013), 621–637.
[25] rocksdb 2017. Apple’s ResearchKit. (2017). Retrieved August 14, 2017 fromhttp://www.researchkit.org/
[26] rocksdb 2017. RocksDB. (2017). Retrieved August 14, 2017 from http://rocksdb.org/
[27] Nazir Saleheen, Amin Ahsan Ali, Syed Monowar Hossain, Hillol Sarker, SoujanyaChatterjee, Benjamin Marlin, Emre Ertin, Mustafa al’Absi, and Santosh Kumar.2015. puffMarker: A Multi-sensor Approach for Pinpointing the Timing of FirstLapse in Smoking Cessation. In Proceedings of the 2015 ACM International JointConference on Pervasive and Ubiquitous Computing (UbiComp ’15). ACM, NewYork, NY, USA, 999–1010. https://doi.org/10.1145/2750858.2806897
[28] Nazir Saleheen, Supriyo Chakraborty, Nasir Ali, Md Mahbubur Rahman,Syed Monowar Hossain, Rummana Bari, Eugene Buder, Mani Srivastava, andSantosh Kumar. 2016. mSieve: Differential Behavioral Privacy in Time Series ofMobile Sensor Data. In Proceedings of the 2016 ACM International Joint Conferenceon Pervasive and Ubiquitous Computing (UbiComp ’16). ACM, New York, NY, USA,706–717. https://doi.org/10.1145/2971648.2971753
[29] Hillol Sarker, Moushumi Sharmin, Amin Ahsan Ali, Md. Mahbubur Rahman,Rummana Bari, Syed Monowar Hossain, and Santosh Kumar. 2014. Assessingthe Availability of Users to Engage in Just-in-time Intervention in the NaturalEnvironment. In Proceedings of the 2014 ACM International Joint Conference onPervasive and Ubiquitous Computing (UbiComp ’14). ACM, New York, NY, USA,909–920. https://doi.org/10.1145/2632048.2636082
[30] Hillol Sarker, Matthew Tyburski, Md Mahbubur Rahman, Karen Hovsepian,Moushumi Sharmin, David H. Epstein, Kenzie L. Preston, C. Debra Furr-Holden,Adam Milam, Inbal Nahum-Shani, Mustafa al’Absi, and Santosh Kumar. 2016.Finding Significant Stress Episodes in a Discontinuous Time Series of RapidlyVarying Mobile Sensor Data. In Proceedings of the 2016 CHI Conference on HumanFactors in Computing Systems (CHI ’16). ACM, New York, NY, USA, 4489–4501.https://doi.org/10.1145/2858036.2858218
[31] Chenguang Shen, Supriyo Chakraborty, Kasturi Rangan Raghavan, Haksoo Choi,and Mani B. Srivastava. 2013. Exploiting Processor Heterogeneity for EnergyEfficient Context Inference on Mobile Phones. In Proceedings of the Workshop onPower-Aware Computing and Systems (HotPower ’13). ACM, New York, NY, USA,Article 9, 5 pages. https://doi.org/10.1145/2525526.2525856
[32] H Tangmunarunkit, CK Hsieh, B Longstaff, S Nolen, J Jenkins, C Ketcham, JSelsky, F Alquaddoomi, D George, J Kang, et al. 2015. Ohmage: A general andextensible end-to-end participatory sensing platform. ACM Transactions onIntelligent Systems and Technology (TIST) 6, 3 (2015), 38.