Manu Mam Term Paper
39
Havells India Ltd. INTRODUCTION Mr. Qimat Rai Gupta is the Founder Chairman and Managing Director of Havells India Ltd.´ His leadership and vision led him to create QRG Enterprises as one of the players in the power distribution equipment industry as well as make its mark on the global space. His belief in team work, implementation of the decisions, communication and transparency through ethical values, business integrity and technological expertise have made the QRG group and especially Havells India Ltd the largest player low voltage power distribution equipment industry in India and a name to reckon within the global market. The company¶s phenomenal success over the years has been due to Mr. Qimat Rai Gupta¶s mantra, ³Growth through quality, innovation and market consolidation". His focus on research and development has enabled Havells develop products for consumers that offer great value. His constant emphasis on promoting energy conservation and environmental preservation coupled with his philanthropic service to the economically weaker section of the society is his way of giving back in return to the society that has helped this organization realize its true potential. Havells India Ltd is a billion-dollar-plus Indian electrical equipment company with products ranging from industrial & domestic circuit protection switchgear, cables & wires, motors, fans, power capacitors, compact fluorescent lamps (CFL), and luminaries for domestic, commercial & industrial applications, modular switches covering household, commercial and industrial electrical needs. The company is listed on the Bombay Stock Exchange. Havells owns global brands like Crabtree, Sylvania, Concord, Luminance, and Linolite & SLI Lighting. Havells has 91 branches / representative offices and over 8000 professionals in over 50 countries. Its seven manufacturing plants in India are located at
-
Upload
subodh-kumar -
Category
Documents
-
view
217 -
download
0
Transcript of Manu Mam Term Paper
8/7/2019 Manu Mam Term Paper
http://slidepdf.com/reader/full/manu-mam-term-paper 1/39
Havells India Ltd.
INTRODUCTION
Mr. Qimat Rai Gupta is the Founder Chairman and Managing
Director of Havells India Ltd.´ His leadership and vision led him tocreate QRG Enterprises as one of the players in the power distribution
equipment industry as well as make its mark on the global space.
His belief in team work, implementation of the decisions,
communication and transparency through ethical values, business
integrity and technological expertise have made the QRG group and
especially Havells India Ltd the largest player low voltage power
distribution equipment industry in India and a name to reckon within
the global market. The company¶s phenomenal success over the yearshas been due to Mr. Qimat Rai Gupta¶s mantra, ³Growth through
quality, innovation and market consolidation". His focus on research
and development has enabled Havells develop products for consumers
that offer great value. His constant emphasis on promoting energy
conservation and environmental preservation coupled with his
philanthropic service to the economically weaker section of the
society is his way of giving back in return to the society that has
helped this organization realize its true potential.
Havells India Ltd is a billion-dollar-plus Indian electrical equipment
company with products ranging from industrial & domestic circuit
protection switchgear, cables & wires, motors, fans, power capacitors,
compact fluorescent lamps (CFL), and luminaries for domestic,
commercial & industrial applications, modular switches covering
household, commercial and industrial electrical needs. The companyis listed on the Bombay Stock Exchange.
Havells owns global brands like Crabtree, Sylvania, Concord,
Luminance, and Linolite & SLI Lighting. Havells has 91 branches /
representative offices and over 8000 professionals in over 50
countries. Its seven manufacturing plants in India are located at
8/7/2019 Manu Mam Term Paper
http://slidepdf.com/reader/full/manu-mam-term-paper 2/39
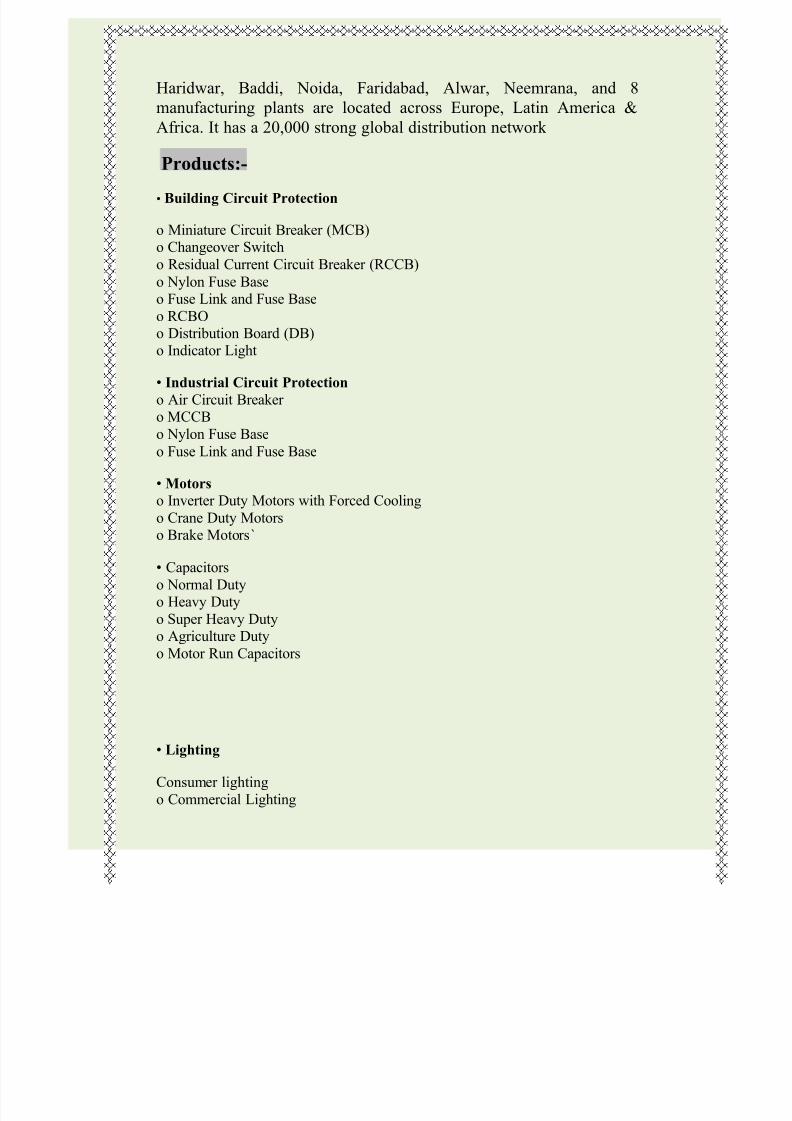
Haridwar, Baddi, Noida, Faridabad, Alwar, Neemrana, and 8
manufacturing plants are located across Europe, Latin America &
Africa. It has a 20,000 strong global distribution network
Products:-� Building Circuit Protection
o Miniature Circuit Breaker (MCB)o Changeover Switch
o Residual Current Circuit Breaker (RCCB)
o Nylon Fuse Baseo Fuse Link and Fuse Base
o RCBOo Distribution Board (DB)
o Indicator Light
� Industrial Circuit Protection
o Air Circuit Breaker o MCCB
o Nylon Fuse Base
o Fuse Link and Fuse Base
� Motors o Inverter Duty Motors with Forced Cooling
o Crane Duty Motorso Brake Motors`
� Capacitors
o Normal Dutyo Heavy Duty
o Super Heavy Dutyo Agriculture Duty
o Motor Run Capacitors
� Lighting
Consumer lighting
o Commercial Lighting
8/7/2019 Manu Mam Term Paper
http://slidepdf.com/reader/full/manu-mam-term-paper 3/39
o down Lighter
o Area Lightingo Road Lighting
o Specialty Lamps
� CFL
� Fans
Corporate:-
The QRG Group defines corporate governance strategically, which
encompasses not only what Havells does as a company with their
profits, but also how they make them. Company addresses how thecompany manages its economic, social, and environmental impacts,
as well as its relationships in all key spheres of influence: the
workplace, the marketplace, the supply chain, the community, and the
public policy realm. Their eco responsibility initiative also focuses on
how they run their business, and includes efforts to develop an
alternative-energy strategy, and thus reduce the environmental
impact of their operations.
Corporate Social Responsibility
Havells contributes to socially responsible activities, like providing
mid-day meal in government schools in Alwar district, covering
15000 students per day. Besides this the company has acquired land
for constructing a larger kitchen with all the modern facilities to serve
freshly cooked food to 50000 students in the area. Havells runs a
mobile Medical Van, equipped with a trained doctor and necessary
medicines in the rural areas of Delhi & NCR for the very poor and
needy villagers. They have also set up free medical check-up camps.In the past, the company has also contributed to the society during
various national calamities like the Bihar Flood, Tsunami and Kargil
National Relief Fund etc.
8/7/2019 Manu Mam Term Paper
http://slidepdf.com/reader/full/manu-mam-term-paper 4/39
Retail initiatives
The company has been promoting its brand through sponsorship of
cricket events like Champions Trophy, Champions League, IPL
Season 2, IPL Season1, and T20 World Cup. The company has also
taken the initiative to reach directly to the consumers through
"Havells Galaxy" ± a one stop shop for all electrical and lighting
needs. This is yet another initiative by Havells targeted at end-users,
architects and Consultants, to showcase Havells products. The
products they offer combine the attributes of elegance, technological
advancement and convenience all in one.
HavellsWorld
Havells announced the opening of its first display & learning centres
µHavells World¶ in the country on 29th March, 2010, New Delhi.
Havells has also opened its first Havells World in Mumbai. Havells
World is targeted at the retailer community, involved in retailing the
Havells electrical and lighting products. The Company aims to
accelerate its growth with this initiative and plans to open 10 such
stores in the country. It will serve as the reference location for all the
retailers to get a comprehensive overview of the entire range of theHavells µproducts.
Giving the consumers, a much wider choice in electrical consumer
products, the Havells World will offer an end to end solution to all
electrical needs from the time electricity enters home to the light
output. Havells World brings to its consumer a wide range in stylish
and high quality low voltage electrical equipments including; Cables,
Wires, Fans, CFLs, LED Lightings, Lighting Fixtures, Crabtree
switches, Motors and Domestic & Industrial Switchgears etc.

8/7/2019 Manu Mam Term Paper
http://slidepdf.com/reader/full/manu-mam-term-paper 5/39
REFRENCES
1. http://en.wikipedia.org/wiki/Havells
2. Wikipedia articles with possible conflicts of interest from June
2010 | Articles needing additional references from July 2010
8/7/2019 Manu Mam Term Paper
http://slidepdf.com/reader/full/manu-mam-term-paper 6/39
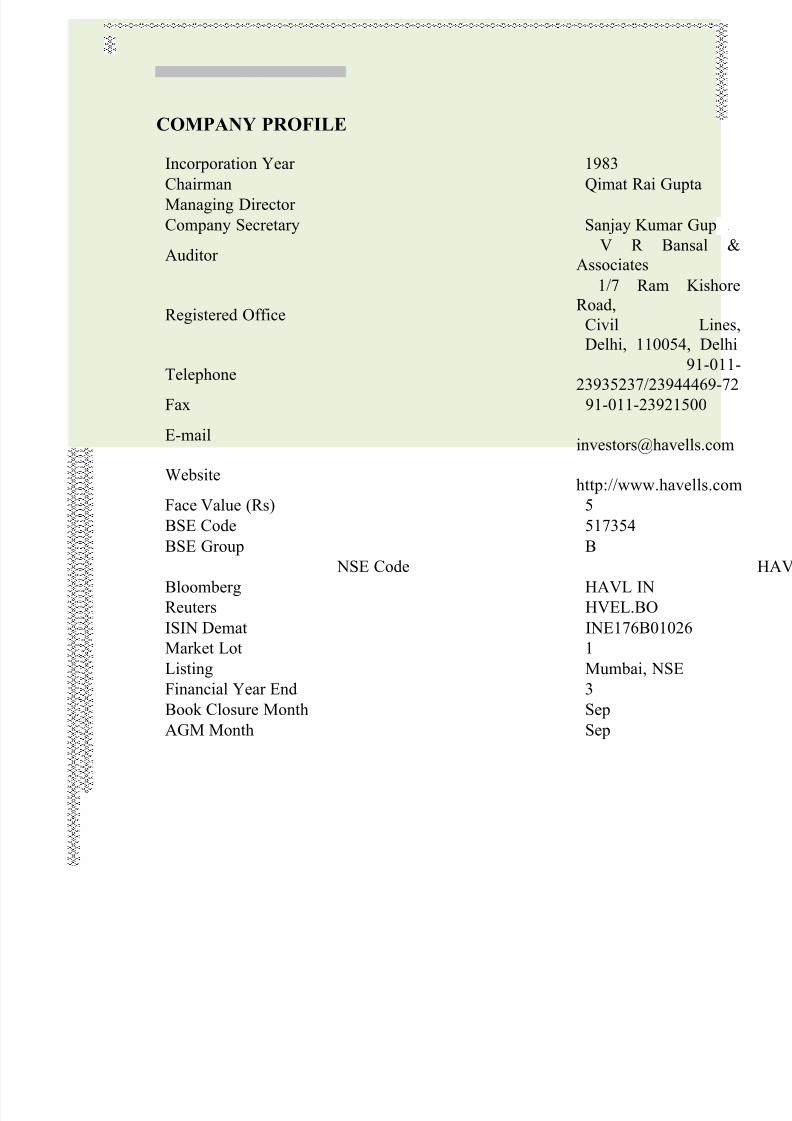
COMPANY PROFILE
Incorporation Year 1983
Chairman Qimat Rai Gupta
Managing Director
Company Secretary Sanjay Kumar Gu
Auditor V R Bansa
Associates
Registered Office
1/7 Ram Ki
Road,
Civil L
Delhi, 110054, D
Telephone91
23935237/239444
Fax 91-011-23921500
E-mailinvestors@havells
Websitehttp://www.havell
Face Value (Rs) 5
BSE Code 517354BSE Group B
NSE Code
Bloomberg HAVL IN
Reuters HVEL.BO
ISIN Demat INE176B01026
Market Lot 1
Listing Mumbai, NSE
Financial Year End 3Book Closure Month Sep
AGM Month Sep
8/7/2019 Manu Mam Term Paper
http://slidepdf.com/reader/full/manu-mam-term-paper 7/39
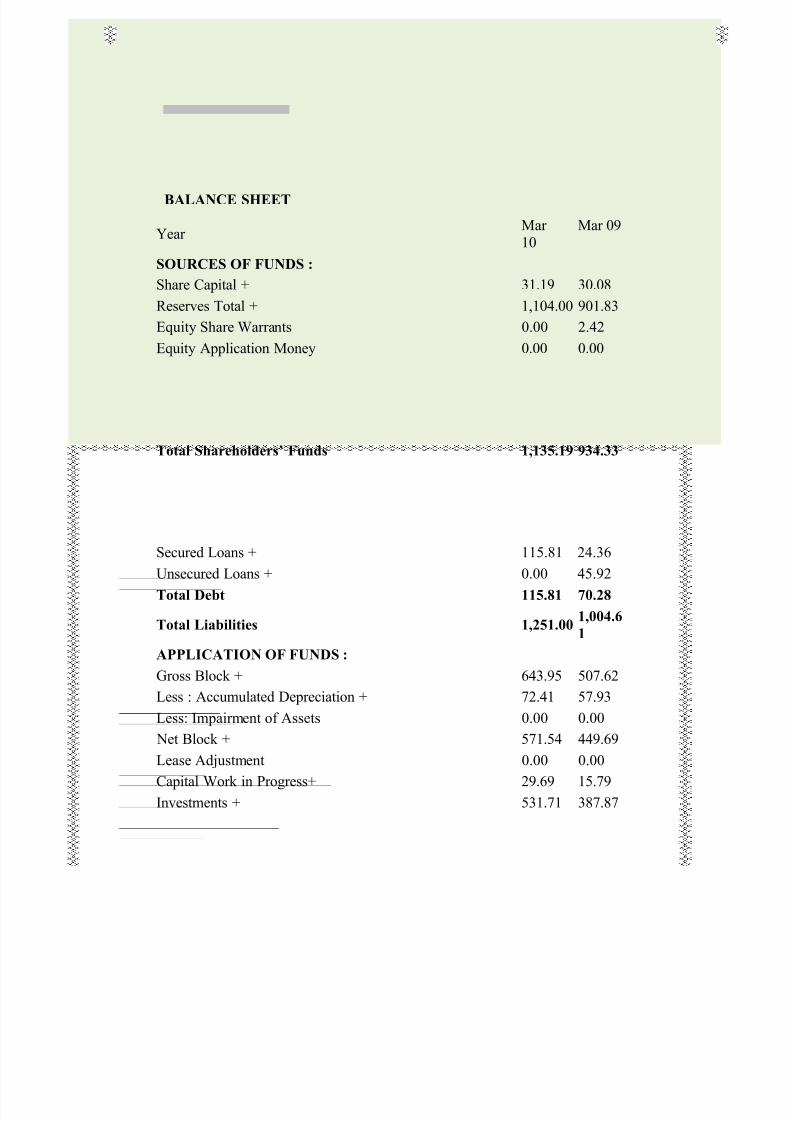
BALANCE SHEET
Year Mar 10
Mar 09
SOURCES OF FUNDS :
Share Capital +
31.19 30.08
Reserves Total +
1,104.00 901.83
Equity Share Warrants 0.00 2.42
Equity Application Money 0.00 0.00
Total Shareholders¶ Funds 1,135.19 934.33
Secured Loans +
115.81 24.36
Unsecured Loans +
0.00 45.92
Total Debt 115.81 70.28
Total Liabilities 1,251.00 1,004.6
1
APPLICATION OF FUNDS :
Gross Block + 643.95 507.62
Less : Accumulated Depreciation + 72.41 57.93
Less: Impairment of Assets 0.00 0.00
Net Block + 571.54 449.69
Lease Adjustment 0.00 0.00
Capital Work in Progress+ 29.69 15.79
Investments + 531.71 387.87
8/7/2019 Manu Mam Term Paper
http://slidepdf.com/reader/full/manu-mam-term-paper 8/39
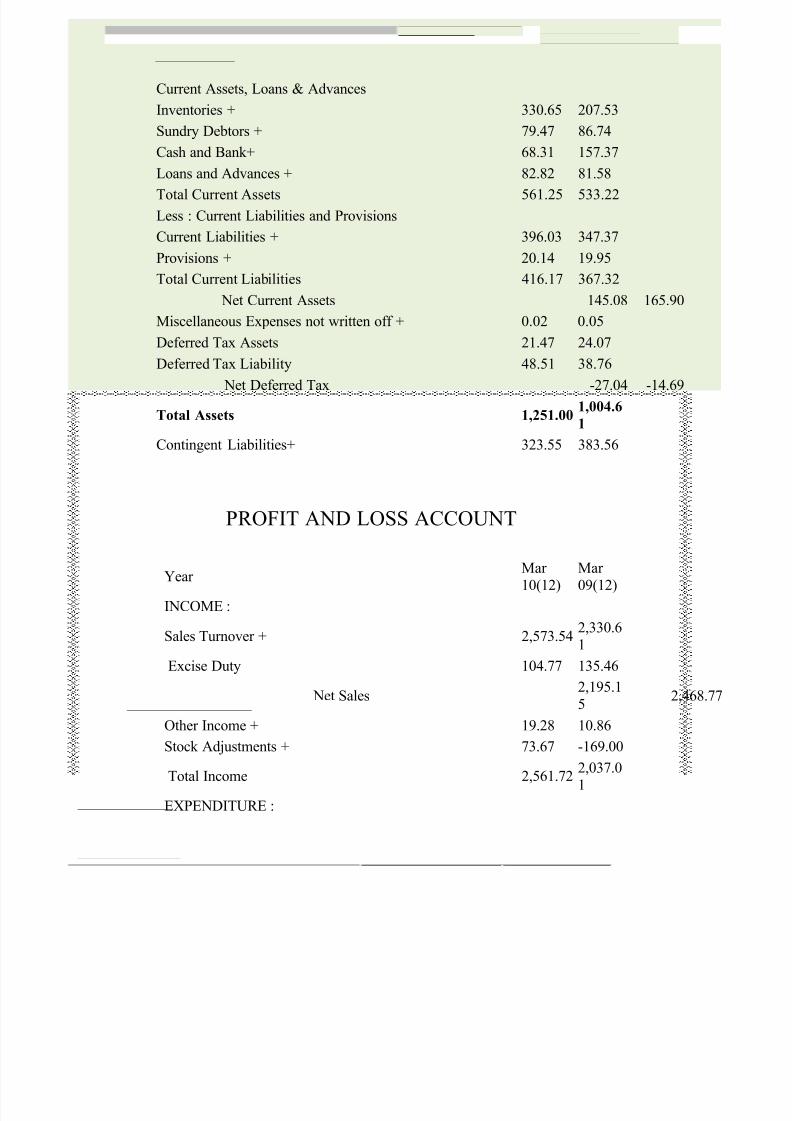
Current Assets, Loans & Advances
Inventories + 330.65 207.53
Sundry Debtors +
79.47 86.74
Cash and Bank+ 68.31 157.37
Loans and Advances + 82.82 81.58Total Current Assets 561.25 533.22
Less : Current Liabilities and Provisions
Current Liabilities + 396.03 347.37
Provisions + 20.14 19.95
Total Current Liabilities 416.17 367.32
Net Current Assets 145.08 165.90
Miscellaneous Expenses not written off +
0.02 0.05
Deferred Tax Assets 21.47 24.07Deferred Tax Liability 48.51 38.76
Net Deferred Tax -27.04 -14.69
Total Assets 1,251.00 1,004.6
1
Contingent Liabilities+ 323.55 383.56
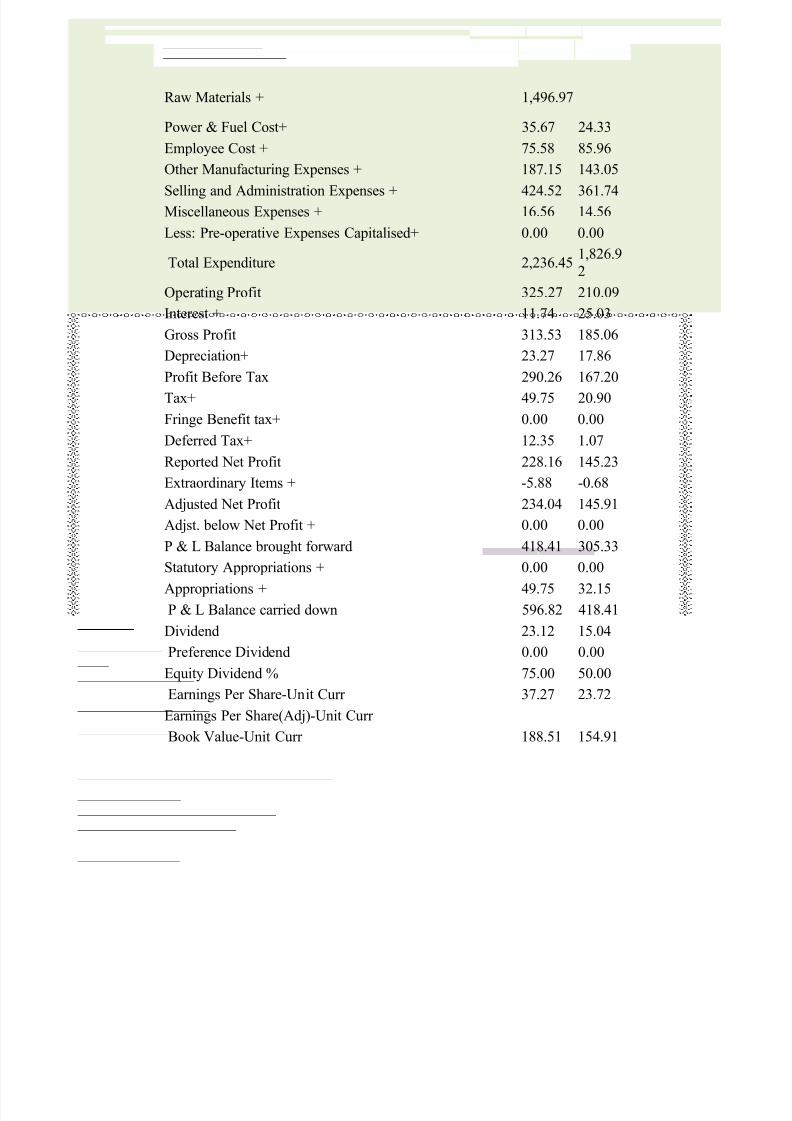
PROFIT AND LOSS ACCOUNT
Year Mar 10(12)
Mar 09(12)
INCOME :
Sales Turnover + 2,573.542,330.61
Excise Duty 104.77 135.46
Net Sales 2,4682,195.15
Other Income + 19.28 10.86
Stock Adjustments + 73.67 -169.00
Total Income 2,561.722,037.01
EXPENDITURE :
8/7/2019 Manu Mam Term Paper
http://slidepdf.com/reader/full/manu-mam-term-paper 9/39
Raw Materials + 1,496.97
Power & Fuel Cost+ 35.67 24.33
Employee Cost + 75.58 85.96
Other Manufacturing Expenses + 187.15 143.05Selling and Administration Expenses + 424.52 361.74
Miscellaneous Expenses + 16.56 14.56
Less: Pre-operative Expenses Capitalised+ 0.00 0.00
Total Expenditure 2,236.451,826.9
2
Operating Profit 325.27 210.09
Interest + 11.74 25.03
Gross Profit 313.53 185.06
Depreciation+ 23.27 17.86
Profit Before Tax 290.26 167.20
Tax+ 49.75 20.90
Fringe Benefit tax+ 0.00 0.00
Deferred Tax+ 12.35 1.07
Reported Net Profit 228.16 145.23
Extraordinary Items + -5.88 -0.68
Adjusted Net Profit 234.04 145.91
Adjst. below Net Profit + 0.00 0.00
P & L Balance brought forward 418.41 305.33
Statutory Appropriations + 0.00 0.00
Appropriations + 49.75 32.15
P & L Balance carried down 596.82 418.41
Dividend 23.12 15.04
Preference Dividend 0.00 0.00
Equity Dividend % 75.00 50.00
Earnings Per Share-Unit Curr 37.27 23.72Earnings Per Share(Adj)-Unit Curr
Book Value-Unit Curr 188.51 154.91
8/7/2019 Manu Mam Term Paper
http://slidepdf.com/reader/full/manu-mam-term-paper 10/39
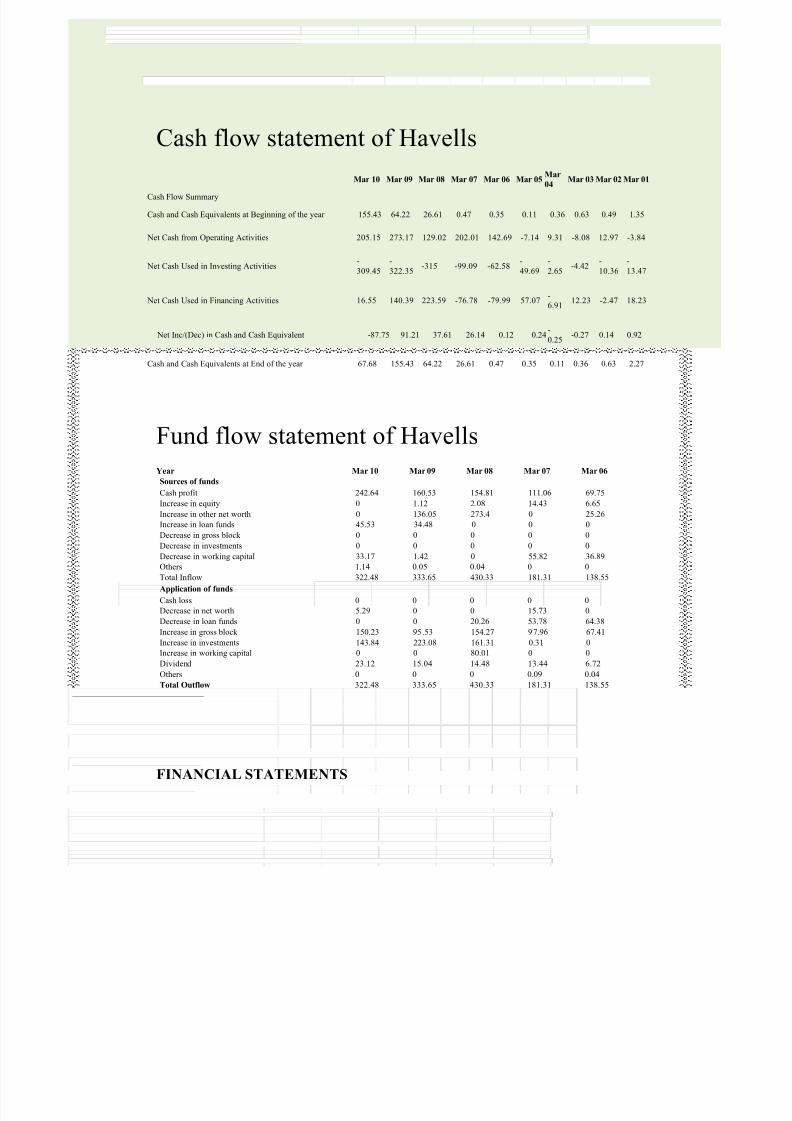
Cash flow statement of Havells
Mar 10 Mar 09 Mar 08 Mar 07 Mar 06 Mar 05 Mar04
Mar 03 Mar 02 Mar 01
Cash Flow Summary
Cash and Cash Equivalents at Beginning of the year 155.43 64.22 26.61 0.47 0.35 0.11 0.36 0.63 0.49 1.35
Net Cash from Operating Activities 205.15 273.17 129.02 202.01 142.69 -7.14 9.31 -8.08 12.97 -3.84
Net Cash Used in Investing Activities-
309.45
-
322.35-315 -99.09 -62.58
-
49.69
-
2.65-4.42
-
10.36
-
13.47
Net Cash Used in Financing Activities 16.55 140.39 223.59 -76.78 -79.99 57.07-
6.9112.23 -2.47 18.23
Net Inc/(Dec) in Cash and Cash Equivalent -87.75 91.21 37.61 26.14 0.12 0.24-
0.25-0.27 0.14 0.92
Cash and Cash Equivalents at End of the year 67.68 155.43 64.22 26.61 0.47 0.35 0.11 0.36 0.63 2.27
Fund flow statement of Havells
Year Mar 10 Mar 09 Mar 08 Mar 07 Mar 06
Sources of funds
Cash profit 242.64 160.53 154.81 111.06 69.75
Increase in equity 0 1.12 2.08 14.43 6.65
Increase in other net worth 0 136.05 273.4 0 25.26
Increase in loan funds 45.53 34.48 0 0 0
Decrease in gross block 0 0 0 0 0
Decrease in investments 0 0 0 0 0
Decrease in working capital 33.17 1.42 0 55.82 36.89
Others 1.14 0.05 0.04 0 0
Total Inflow 322.48 333.65 430.33 181.31 138.55
Application of funds
Cash loss 0 0 0 0 0
Decrease in net worth 5.29 0 0 15.73 0
Decrease in loan funds 0 0 20.26 53.78 64.38
Increase in gross block 150.23 95.53 154.27 97.96 67.41
Increase in investments 143.84 223.08 161.31 0.31 0
Increase in working capital 0 0 80.01 0 0
Dividend 23.12 15.04 14.48 13.44 6.72
Others 0 0 0 0.09 0.04
Total Outflow 322.48 333.65 430.33 181.31 138.55
FINANCIAL STATEMENTS

8/7/2019 Manu Mam Term Paper
http://slidepdf.com/reader/full/manu-mam-term-paper 11/39
Financial statement may refer to any statement or document which discloses
financial information relating to business concern but technically financial
statement includes income statement or profit & loss account and balance sheet.
Financial statements
Income statement or trading & p/l account
Position statement or balance sheet
Statement of retained earning
Statement of changes in financial position
Tools and techniques of analysis and interpretation:-
1. Comparative financial statement or analysis ,
2. Common ±size statement or analysis
3. Trend analysis
4. Ratio analysis
5. Fund flow statement
6. Cash flow statement
7. Cost Analysis
Comparative financial statement or analysis: -
It is an important horizontal Technique in which financial data of two or more
period (year) are presented in a comparative from.
a) A comparative income statement show the comparison of various items
of cost ,expenses and final the result in form of net profit and net loss.
Percent change =absolute change /figure of the previous year *100
b) A comparative balance sheet reveals the position of assets and liabilities
on two or more different data along with changes in these items.
8/7/2019 Manu Mam Term Paper
http://slidepdf.com/reader/full/manu-mam-term-paper 12/39
Common ±size statement or analysis:-
Common size financial statement facilities both of analysis i.e.; horizontal as
well as vertical. This statement indicates the relationship of various items in
terms of percentage with some common or basis items .it expressed the net sale
in term of percentage.
Trend analysis:-
This analysis is an important tool of horizontal financial analysis .under this
method ratio are calculated for selected items of the financial statement takingthe figure of the base year as 100 and for this purpose the following formula
may be used
Trend ratio =current year amount /base year amount *100
Ratio analysis:-
Ratio analysis is also an important method of analysis of financial statement .it
is adopted to establish meaningful mathematical relation between two items or
two group of items show in financial statement.
Fund flow statement:-
Financial statement can also be analyzed by preparing fund flow statement and
in that case it is known as fund flow analysis .This statement is prepared in
order to reveal the source from which funds are obtained the uses to which they
are being put. Here fund stand for working capital.
Cash flow statement:-
8/7/2019 Manu Mam Term Paper
http://slidepdf.com/reader/full/manu-mam-term-paper 13/39
This technique is very useful in the management of cash and analysis of short
term liquidity .under this method a statement is prepared to show the inflow and
outflow of cash related to various activities in the concern during a specific
period.
OBJECTIVE OF ANALYSIS AND INTERPRETATION:-
To determine and examine the current earning capacity and to estimate
future prospects.
To estimate overall as well as segment wise performance efficiency and
managerial ability in a business concern
To determine long term as well as segment wise performance efficiency
and managerial ability in a business concern.
To forecast the future result and prepare the budgets
To make inter-firm comparison on the basis of operational efficiency
and financial positive of various firms engaged in the same industry
To identify financial weaknesses of the firm and to suggest rem edial
measures.
To determine the growth prospects of different division as well of thefirm as a whole.
8/7/2019 Manu Mam Term Paper
http://slidepdf.com/reader/full/manu-mam-term-paper 14/39
RESEARCH METHOLOGY:-
STUDY: -
This Research is based on analysis and interpretation of financial statement, to
know the financial position of the company, identify financial weakness of thefirm and to suggest remedial.
DATA COLLECTION:-
Primary data
Secondary data
Primary data:-
Primary data are those which are collated a fresh and for the first time & thus
happen to be original in character. Primary data is obtained by the study
specially designed to fulfil the data needs to problem hand. Such data are
original in characters generated by the way of conducting survey
Secondary data:-
Secondary data are those which have already been collected by someone else
and which have already been passed through the statistical process. Secondary
data consists of not only published records and reports but also unpublished
records.
We are using secondary data in our research.
8/7/2019 Manu Mam Term Paper
http://slidepdf.com/reader/full/manu-mam-term-paper 15/39
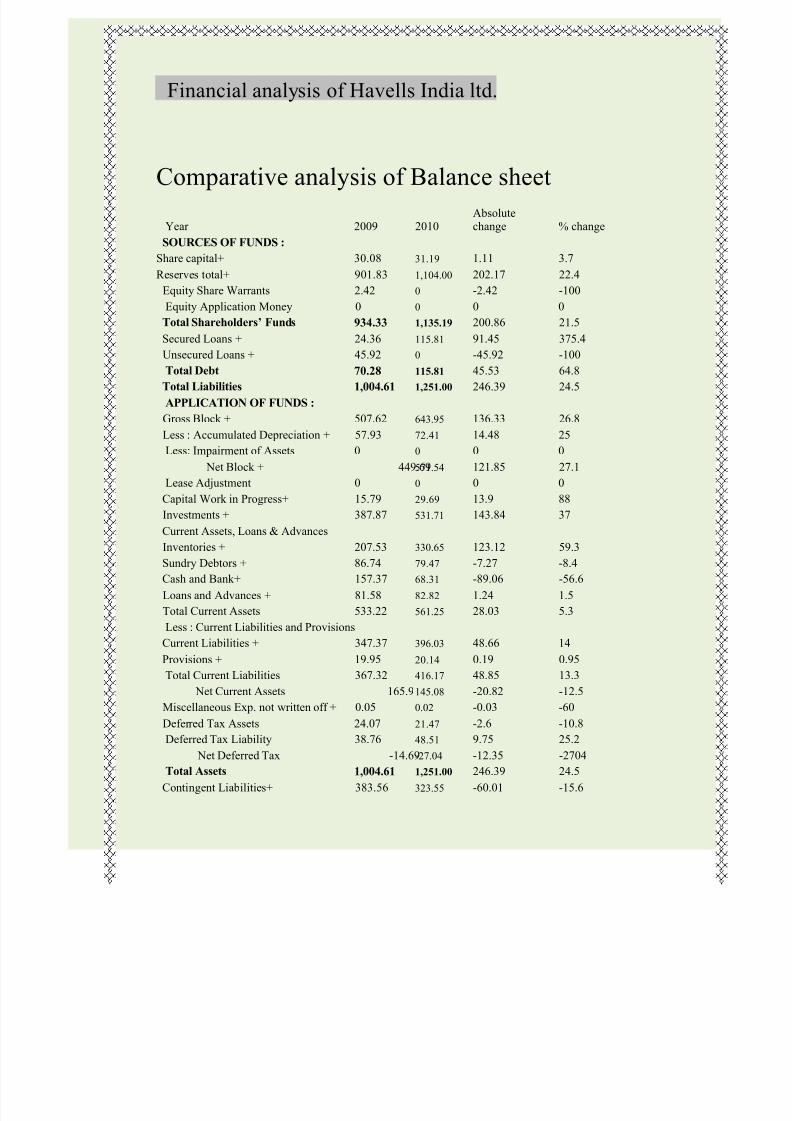
Financial analysis of Havells India ltd.
Comparative analysis of Balance sheet
Year 2009 2010Absolutechange % change
SOURCES OF FUNDS :
Share capital+
30.08 31.19 1.11 3.7
Reserves total+ 901.83 1,104.00 202.17 22.4
Equity Share Warrants 2.42 0 -2.42 -100
Equity Application Money 0 0 0 0
Total Shareholders¶ Funds 934.33 1,135.19 200.86 21.5
Secured Loans + 24.36 115.81 91.45 375.4
Unsecured Loans + 45.92 0 -45.92 -100
Total Debt 70.28 115.81 45.53 64.8
Total Liabilities 1,004.61 1,251.00 246.39 24.5
APPLICATION OF FUNDS :
Gross Block + 507.62 643.95 136.33 26.8
Less : Accumulated Depreciation + 57.93 72.41 14.48 25
Less: Impairment of Assets 0 0 0 0
Net Block + 449.69571.54 121.85 27.1
Lease Adjustment 0 0 0 0
Capital Work in Progress+ 15.79 29.69 13.9 88
Investments + 387.87 531.71 143.84 37Current Assets, Loans & Advances
Inventories + 207.53 330.65 123.12 59.3
Sundry Debtors + 86.74 79.47 -7.27 -8.4
Cash and Bank+ 157.37 68.31 -89.06 -56.6
Loans and Advances + 81.58 82.82 1.24 1.5
Total Current Assets 533.22 561.25 28.03 5.3
Less : Current Liabilities and Provisions
Current Liabilities + 347.37 396.03 48.66 14
Provisions + 19.95 20.14 0.19 0.95
Total Current Liabilities 367.32 416.17 48.85 13.3
Net Current Assets 165.9145.08 -20.82 -12.5Miscellaneous Exp. not written off + 0.05 0.02 -0.03 -60
Deferred Tax Assets 24.07 21.47 -2.6 -10.8
Deferred Tax Liability 38.76 48.51 9.75 25.2
Net Deferred Tax -14.69-27.04 -12.35 -2704
Total Assets 1,004.61 1,251.00 246.39 24.5
Contingent Liabilities+ 383.56 323.55 -60.01 -15.6
8/7/2019 Manu Mam Term Paper
http://slidepdf.com/reader/full/manu-mam-term-paper 16/39
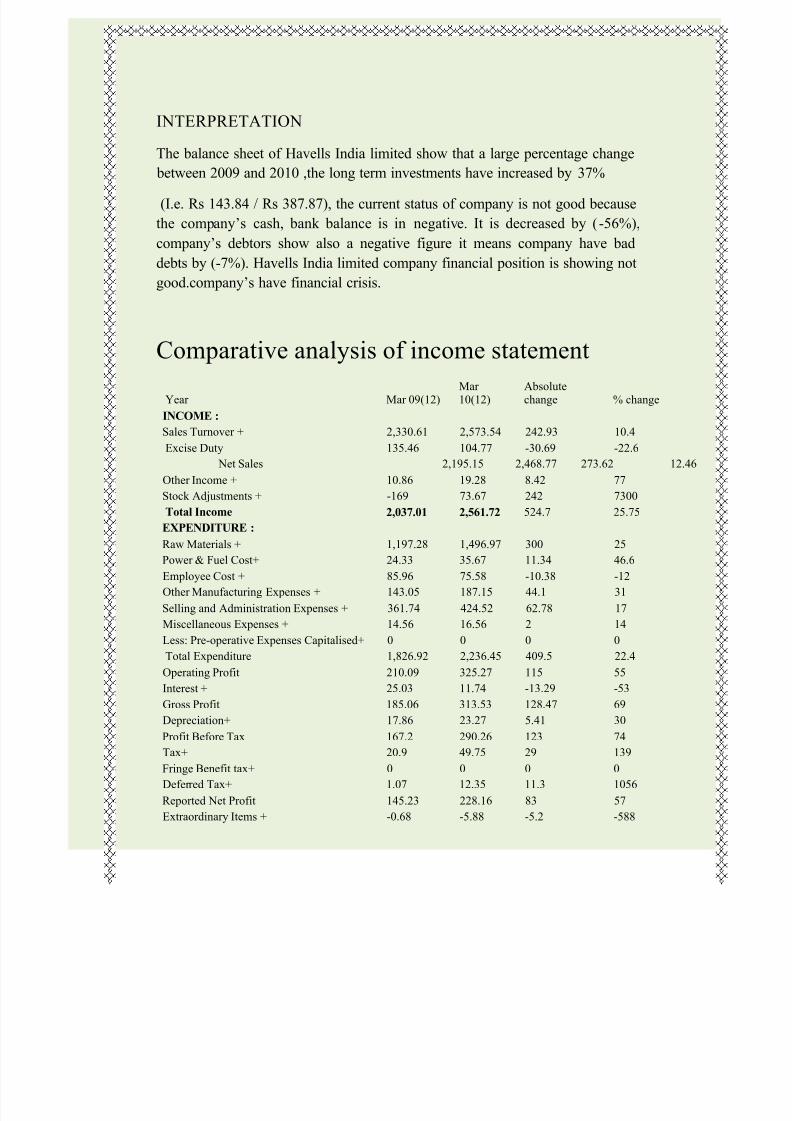
INTERPRETATION
The balance sheet of Havells India limited show that a large percentage change
between 2009 and 2010 ,the long term investments have increased by 37%
(I.e. Rs 143.84 / Rs 387.87), the current status of company is not good because
the company¶s cash, bank balance is in negative. It is decreased by (-56%),
company¶s debtors show also a negative figure it means company have bad
debts by (-7%). Havells India limited company financial position is showing not
good.company¶s have financial crisis.
Comparative analysis of income statement
Year Mar 09(12)Mar 10(12)
Absolutechange % change
INCOME :
Sales Turnover + 2,330.61 2,573.54 242.93 10.4
Excise Duty 135.46 104.77 -30.69 -22.6
Net Sales 2,195.15 2,468.77 273.62 12.46
Other Income + 10.86 19.28 8.42 77
Stock Adjustments + -169 73.67 242 7300
Total Income 2,037.01 2,561.72 524.7 25.75
EXPENDITURE :
Raw Materials + 1,197.28 1,496.97 300 25
Power & Fuel Cost+ 24.33 35.67 11.34 46.6
Employee Cost + 85.96 75.58 -10.38 -12
Other Manufacturing Expenses + 143.05 187.15 44.1 31
Selling and Administration Expenses + 361.74 424.52 62.78 17
Miscellaneous Expenses + 14.56 16.56 2 14
Less: Pre-operative Expenses Capitalised+ 0 0 0 0
Total Expenditure 1,826.92 2,236.45 409.5 22.4
Operating Profit 210.09 325.27 115 55
Interest + 25.03 11.74 -13.29 -53
Gross Profit 185.06 313.53 128.47 69
Depreciation+ 17.86 23.27 5.41 30
Profit Before Tax 167.2 290.26 123 74
Tax+ 20.9 49.75 29 139
Fringe Benefit tax+ 0 0 0 0
Deferred Tax+ 1.07 12.35 11.3 1056
Reported Net Profit 145.23 228.16 83 57
Extraordinary Items + -0.68 -5.88 -5.2 -588
8/7/2019 Manu Mam Term Paper
http://slidepdf.com/reader/full/manu-mam-term-paper 17/39
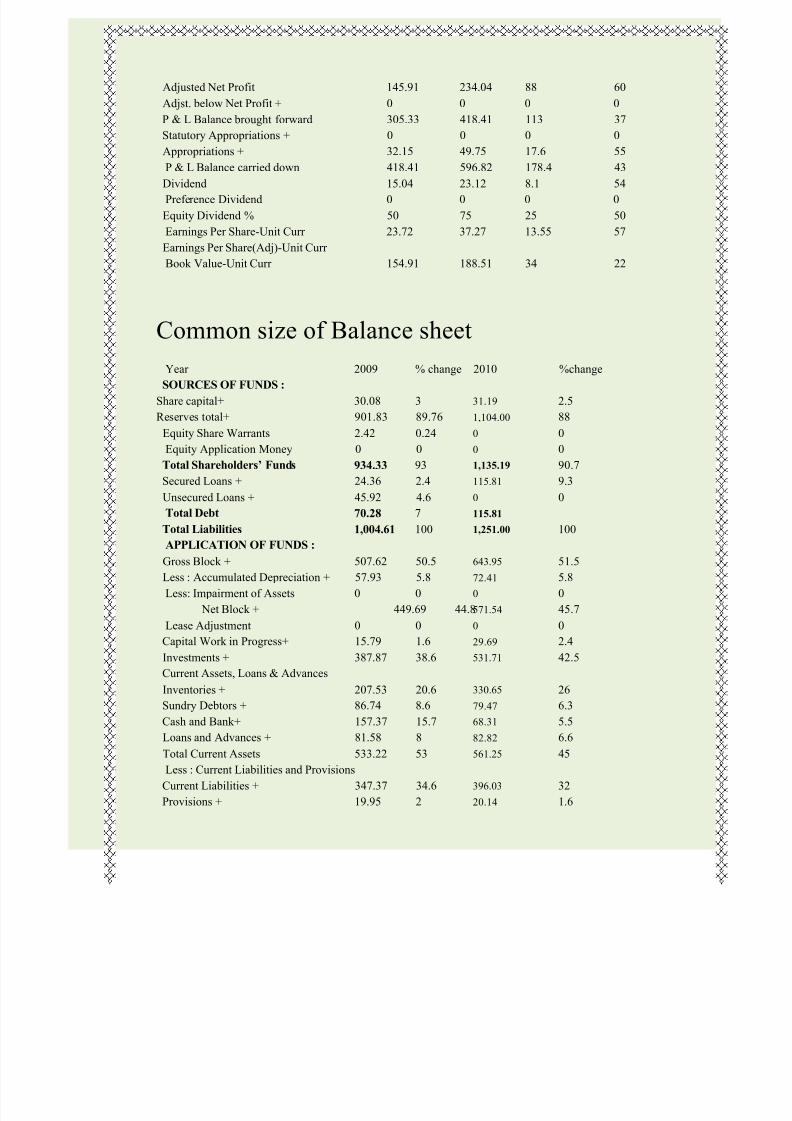
Adjusted Net Profit 145.91 234.04 88 60
Adjst. below Net Profit + 0 0 0 0
P & L Balance brought forward 305.33 418.41 113 37
Statutory Appropriations + 0 0 0 0
Appropriations + 32.15 49.75 17.6 55
P & L Balance carried down 418.41 596.82 178.4 43Dividend 15.04 23.12 8.1 54
Preference Dividend 0 0 0 0
Equity Dividend % 50 75 25 50
Earnings Per Share-Unit Curr 23.72 37.27 13.55 57
Earnings Per Share(Adj)-Unit Curr
Book Value-Unit Curr 154.91 188.51 34 22
Common size of Balance sheet
Year 2009 % change 2010 %change
SOURCES OF FUNDS :
Share capital+
30.08 3 31.19 2.5
Reserves total+ 901.83 89.76 1,104.00 88
Equity Share Warrants 2.42 0.24 0 0
Equity Application Money 0 0 0 0
Total Shareholders¶ Funds 934.33 93 1,135.19 90.7
Secured Loans + 24.36 2.4 115.81 9.3
Unsecured Loans + 45.92 4.6 0 0
Total Debt 70.28 7 115.81
Total Liabilities 1,004.61 100 1,251.00 100
APPLICATION OF FUNDS :
Gross Block + 507.62 50.5 643.95 51.5
Less : Accumulated Depreciation + 57.93 5.8 72.41 5.8
Less: Impairment of Assets 0 0 0 0
Net Block + 449.69 44.8571.54 45.7
Lease Adjustment 0 0 0 0
Capital Work in Progress+ 15.79 1.6 29.69 2.4
Investments + 387.87 38.6 531.71 42.5
Current Assets, Loans & Advances
Inventories + 207.53 20.6 330.65 26Sundry Debtors + 86.74 8.6 79.47 6.3
Cash and Bank+ 157.37 15.7 68.31 5.5
Loans and Advances + 81.58 8 82.82 6.6
Total Current Assets 533.22 53 561.25 45
Less : Current Liabilities and Provisions
Current Liabilities + 347.37 34.6 396.03 32
Provisions + 19.95 2 20.14 1.6
8/7/2019 Manu Mam Term Paper
http://slidepdf.com/reader/full/manu-mam-term-paper 18/39
Total Current Liabilities 367.32 36.6 416.17 33
Net Current Assets 165.9 16.5 145.08 12
Miscellaneous Exp. not written off + 0.05 0.005 0.02 0.002
Deferred Tax Assets 24.07 2.4 21.47 1.7
Deferred Tax Liability 38.76 4 48.51 3.8
Net Deferred Tax -14.69 -1.5 -27.04 -2.16Total Assets 1,004.61 100 1,251.00 100
Contingent Liabilities+ 383.56 38.18 323.55 26
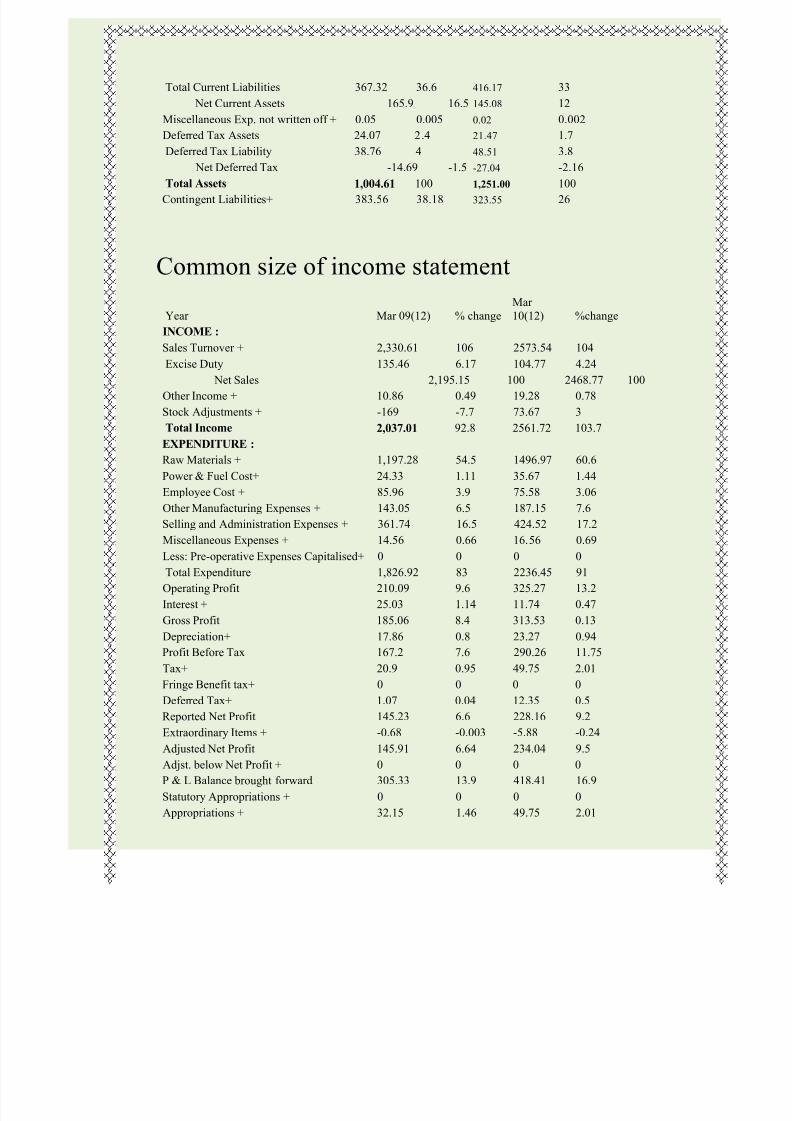
Common size of income statement
Year Mar 09(12) % change
Mar
10(12) %change
INCOME :
Sales Turnover + 2,330.61 106 2573.54 104Excise Duty 135.46 6.17 104.77 4.24
Net Sales 2,195.15 100 2468.77 100
Other Income + 10.86 0.49 19.28 0.78
Stock Adjustments + -169 -7.7 73.67 3
Total Income 2,037.01 92.8 2561.72 103.7
EXPENDITURE :
Raw Materials + 1,197.28 54.5 1496.97 60.6
Power & Fuel Cost+ 24.33 1.11 35.67 1.44
Employee Cost + 85.96 3.9 75.58 3.06
Other Manufacturing Expenses + 143.05 6.5 187.15 7.6
Selling and Administration Expenses + 361.74 16.5 424.52 17.2
Miscellaneous Expenses + 14.56 0.66 16.56 0.69
Less: Pre-operative Expenses Capitalised+ 0 0 0 0
Total Expenditure 1,826.92 83 2236.45 91
Operating Profit 210.09 9.6 325.27 13.2
Interest + 25.03 1.14 11.74 0.47
Gross Profit 185.06 8.4 313.53 0.13
Depreciation+ 17.86 0.8 23.27 0.94
Profit Before Tax 167.2 7.6 290.26 11.75
Tax+ 20.9 0.95 49.75 2.01
Fringe Benefit tax+ 0 0 0 0
Deferred Tax+ 1.07 0.04 12.35 0.5
Reported Net Profit 145.23 6.6 228.16 9.2
Extraordinary Items + -0.68 -0.003 -5.88 -0.24
Adjusted Net Profit 145.91 6.64 234.04 9.5
Adjst. below Net Profit + 0 0 0 0
P & L Balance brought forward 305.33 13.9 418.41 16.9
Statutory Appropriations + 0 0 0 0
Appropriations + 32.15 1.46 49.75 2.01
8/7/2019 Manu Mam Term Paper
http://slidepdf.com/reader/full/manu-mam-term-paper 19/39
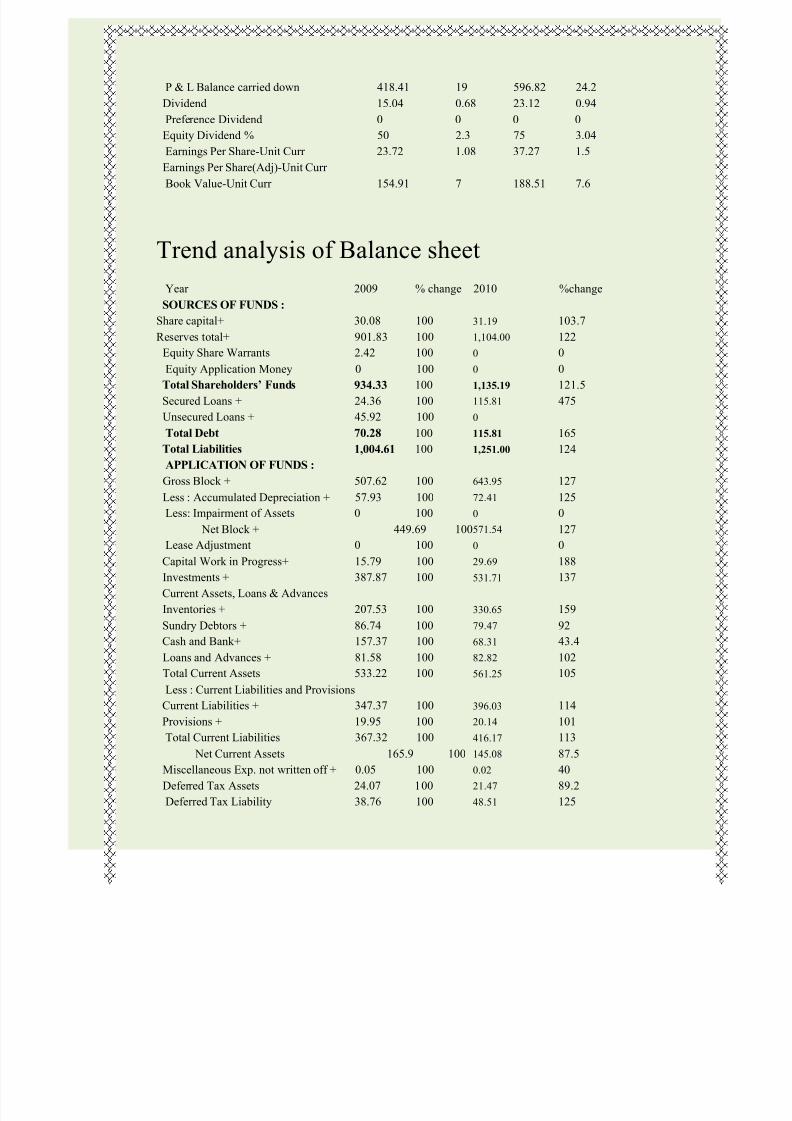
P & L Balance carried down 418.41 19 596.82 24.2
Dividend 15.04 0.68 23.12 0.94
Preference Dividend 0 0 0 0
Equity Dividend % 50 2.3 75 3.04
Earnings Per Share-Unit Curr 23.72 1.08 37.27 1.5
Earnings Per Share(Adj)-Unit Curr Book Value-Unit Curr 154.91 7 188.51 7.6
Trend analysis of Balance sheet
Year 2009 % change 2010 %change
SOURCES OF FUNDS :
Share capital+
30.08 100 31.19 103.7
Reserves total+ 901.83 100 1,104.00 122
Equity Share Warrants 2.42 100 0 0
Equity Application Money 0 100 0 0
Total Shareholders¶ Funds 934.33 100 1,135.19 121.5
Secured Loans + 24.36 100 115.81 475
Unsecured Loans + 45.92 100 0
Total Debt 70.28 100 115.81 165
Total Liabilities 1,004.61 100 1,251.00 124
APPLICATION OF FUNDS :
Gross Block + 507.62 100 643.95 127
Less : Accumulated Depreciation + 57.93 100 72.41 125
Less: Impairment of Assets 0 100 0 0
Net Block + 449.69 100571.54 127
Lease Adjustment 0 100 0 0
Capital Work in Progress+ 15.79 100 29.69 188
Investments + 387.87 100 531.71 137
Current Assets, Loans & Advances
Inventories + 207.53 100 330.65 159
Sundry Debtors + 86.74 100 79.47 92
Cash and Bank+ 157.37 100 68.31 43.4
Loans and Advances + 81.58 100 82.82 102
Total Current Assets 533.22 100 561.25 105
Less : Current Liabilities and ProvisionsCurrent Liabilities + 347.37 100 396.03 114
Provisions + 19.95 100 20.14 101
Total Current Liabilities 367.32 100 416.17 113
Net Current Assets 165.9 100 145.08 87.5
Miscellaneous Exp. not written off + 0.05 100 0.02 40
Deferred Tax Assets 24.07 100 21.47 89.2
Deferred Tax Liability 38.76 100 48.51 125
8/7/2019 Manu Mam Term Paper
http://slidepdf.com/reader/full/manu-mam-term-paper 20/39
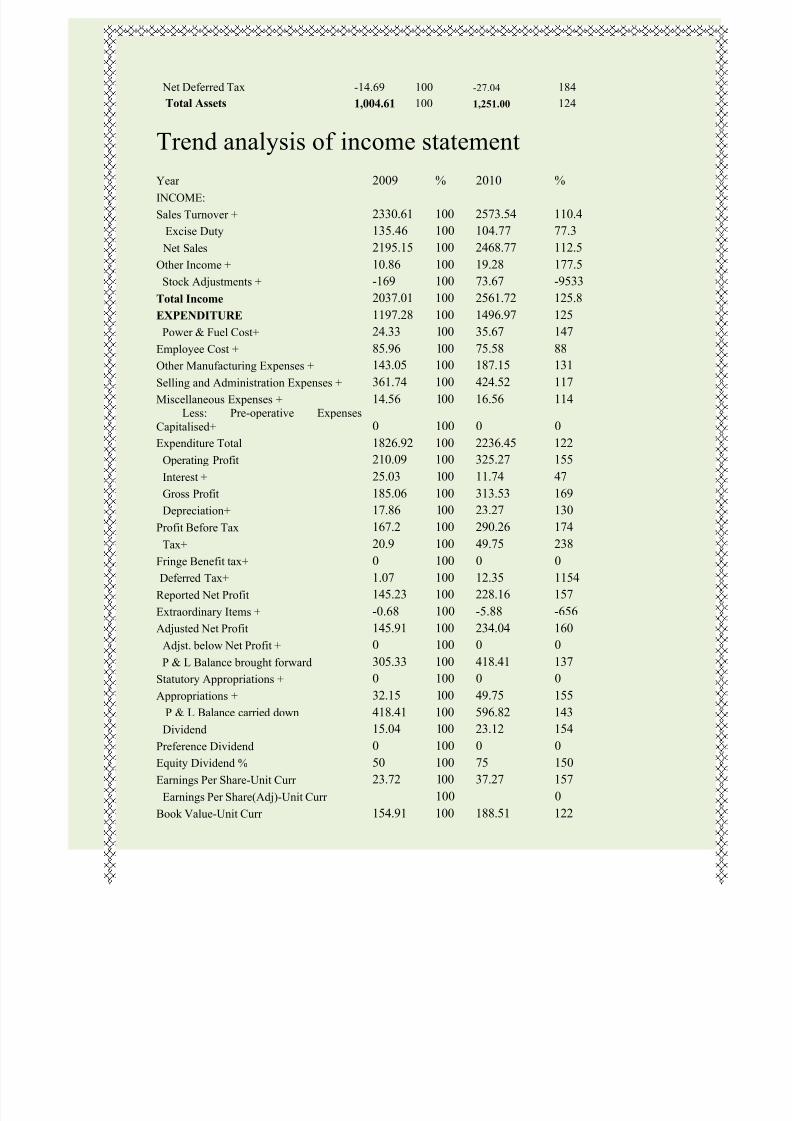
Net Deferred Tax -14.69 100 -27.04 184
Total Assets 1,004.61 100 1,251.00 124
Trend analysis of income statement
Year 2009 % 2010 %
INCOME:
Sales Turnover +
2330.61 100 2573.54 110.4
Excise Duty 135.46 100 104.77 77.3
Net Sales 2195.15 100 2468.77 112.5
Other Income + 10.86 100 19.28 177.5
Stock Adjustments + -169 100 73.67 -9533
Total Income 2037.01 100 2561.72 125.8
EXPENDITURE 1197.28 100 1496.97 125
Power & Fuel Cost+ 24.33 100 35.67 147
Employee Cost + 85.96 100 75.58 88Other Manufacturing Expenses + 143.05 100 187.15 131
Selling and Administration Expenses + 361.74 100 424.52 117
Miscellaneous Expenses + 14.56 100 16.56 114Less: Pre-operative Expenses
Capitalised+ 0 100 0 0
Expenditure Total 1826.92 100 2236.45 122
Operating Profit 210.09 100 325.27 155
Interest + 25.03 100 11.74 47
Gross Profit 185.06 100 313.53 169
Depreciation+ 17.86 100 23.27 130
Profit Before Tax 167.2 100 290.26 174
Tax+ 20.9 100 49.75 238
Fringe Benefit tax+ 0 100 0 0
Deferred Tax+
1.07 100 12.35 1154
Reported Net Profit 145.23 100 228.16 157
Extraordinary Items + -0.68 100 -5.88 -656
Adjusted Net Profit 145.91 100 234.04 160
Adjst. below Net Profit +
0 100 0 0
P & L Balance brought forward 305.33 100 418.41 137
Statutory Appropriations + 0 100 0 0
Appropriations + 32.15 100 49.75 155P & L Balance carried down 418.41 100 596.82 143
Dividend 15.04 100 23.12 154
Preference Dividend 0 100 0 0
Equity Dividend % 50 100 75 150
Earnings Per Share-Unit Curr 23.72 100 37.27 157
Earnings Per Share(Adj)-Unit Curr 100 0
Book Value-Unit Curr 154.91 100 188.51 122
8/7/2019 Manu Mam Term Paper
http://slidepdf.com/reader/full/manu-mam-term-paper 21/39
Ratio Analysis:-
Ratio Analysis can be defined as the study and interpretation of relationships
between various financial variables, by investor or lenders. It is a quantitative
investment technique used for comparing a company¶s financial performance to
the market in general. A change in these ratios helps to bring about a change in the
way a company works. It helps to identify areas where the management needs
change.
Types of Ratios calculated:-
A number of ratios are calculated by companies for evaluating their short and long
term performance and also to know liquidity and profitability. Some of the mostcommonly used ratios are:
1. Liquidity ratios:
It can be defined as a ratio that indicates what proportion of a company¶s assets
can be readily converted into cash in the short term. Some of the liquidity ratios
are:
y Current ratio:-
The current ratio is calculated from balance sheet data as current assets/current
liabilities.The thumb of rule of current ratio 2:1. It means that firm can pay its
current liabilities from its current assets two times over.
Formula:
Current ratio= current Assets/current liabilities
y Quick ratio:-
Some current assets can be converted into cash more easily than others. Su ch
assets are classified as quick assets. Quick assets include cash, debtors, marketablesecurities and other assets which can be converted quickly into cash. Its thumb of
rule 1:1, the company can meet all its current liabilities at a short notice. The ac id
test ratio is better indicator of liquidity.
Formula:
Quick ratio= quick assets/current liabilities
8/7/2019 Manu Mam Term Paper
http://slidepdf.com/reader/full/manu-mam-term-paper 22/39
y Absolute liquid ratio:-
Absolute liquidity is represented by cash and near cash items. It is a ratio of
absolute liquid assets to current liabilities. In the computation of this ratio only theabsolute liquid assets are compared with the liquid liabilities. The absolute liquid
assets are cash, bank and marketable securities. It is to be observed that
receivables (debtors/accounts receivables and bills receivables) are eliminated
from the list of liquid assets in order to obtain absolute4 liquid assets since there
may be some doubt in their liquidity.
Formula:
Absolute liquid ratio=Absolute liquid assets/current
Liabilities
2. Profitability ratios:
It can be defined as a ratio that explains the profitability of a company during a
specific period of time. It explains how profitable a company is. These ratios can
be compared during different financial years to see the overall performance of a
company. Some of the profitability ratios are:
y Gross Profit ratio:-
The basic components for the calculation of gross profit ratio are gross profit and
net sales. Net sales mean that sale minus sales returns. Gross profit would be the
difference between net sales and cost of goods sold. Cost of goods sold in the case
of a trading concern would be equal to opening stock plus purchases , minus
closing stock plus all direct expenses relating to purchases. In the case of
manufacturing concern, it would be equal to the sum of the cost of raw materials,
wages, direct expenses and all manufacturing expenses. In other words, generally
the expenses charged to profit and loss account or operating expenses are excluded
from the calculation of cost of goods sold.
Formula:
Gross profit ratio=gross profit/Net sales*100
8/7/2019 Manu Mam Term Paper
http://slidepdf.com/reader/full/manu-mam-term-paper 23/39
y Net profit ratio:-
This ratio is used by investors, creditors, and lenders to judge the profit earnings
capacity of the organisation. It indicates the overall profitability of the
organisation after meeting all expenses, charges, depreciation, etc.
Formula:
Net profit ratio= Net profit /Net sales*100
y Operating ratio:
Operating ratio indicates the relationship between operating expenses and sales.
This ratio indicates operating efficiency of the organisation and is important to the
management in evaluating its own efficiency.
Formula:
Operating ratio=Operating costs/Net sales*100
y Return on Investment(ROI):-
This ratio measure the percentage returns to the company on the funds it had
employed and is a good indication of the profitability of the organisation. It is also
a useful overall measure of the ability of the management.
Formula:
Return on investment= net profit/shareholder¶sFunds*100
y Return on Equity(ROE):-
Return on equity is the single measure that summarises the financial health of a
company. Number of pennies earned during the year on each dollar. As a very
rough rule of thumb, return on equity consistently above 15% is a sign of good
health of the company; ROE consistently below 15% is sign of trouble.
Formula:
Return on equity= (Net profit-preference dividend)/equityShareholders*100
y Earnings Per Share:-
Earnings per share (EPS) are such a fundamental number that we usually forget
that is a financial ratio. The necessary adjustments for dilutive securities. It net
income attribute to each share of common stock.
8/7/2019 Manu Mam Term Paper
http://slidepdf.com/reader/full/manu-mam-term-paper 24/39
Formula:
Earnings per share= (Net profit-preference dividend)
/no. of equity share outstanding
3. Some other ratios are:
y Inventory turnover ratio:-
Stock turnover ratio and inventory turnover ratio are the same. This ratio is a
relationship between the cost of goods sold during a particular period of time andthe cost of average inventory during a particular period. It is expressed in number
of times. Stock turnover ratio / Inventory turnover ratio indicates the number of time the stock has been turned over during the period and evaluates the efficiencywith which a firm is able to manage its inventory. This ratio indicates whether
investment in stock is within proper limit or not.
Formula:
Inventory turnover ratio=COGS/Average stock
Inventory conversion ratio=365/ITR
y Debtor¶s turnover ratio:-
Debtor¶s turnover ratio or accounts receivable turnover ratio indicates the
velocity of debt collection of a firm. In simple words it indicates the number of times average debtors (receivable) are turned over during a year.
Formula:
Debtor¶s turnover ratio=Net credit sales/Average debtors
Debtor¶s collection period=365/DTR
8/7/2019 Manu Mam Term Paper
http://slidepdf.com/reader/full/manu-mam-term-paper 25/39
y Creditors turnover ratio:
This ratio is similar to the debtor turnover ratio. It compares creditors with thetotal credit purchases.
Formula:
Creditors turnover ratio=Net credit purchase/Average creditor
Average payment period=365/CTR
y Solvency ratio:
Debt-to-Equity ratio indicates the relationship between the external equities or
outsiders funds and the internal equities or shareholders funds.
Formula:Debt to equity ratio= total debt /equity
y interest coverage ratio:
Interest coverage ratio is also known as debt service ratio or debt service
coverage ratio.
Formula:
Interest coverage ratio=Earnings before interest tax/ interest
Charges
8/7/2019 Manu Mam Term Paper
http://slidepdf.com/reader/full/manu-mam-term-paper 26/39
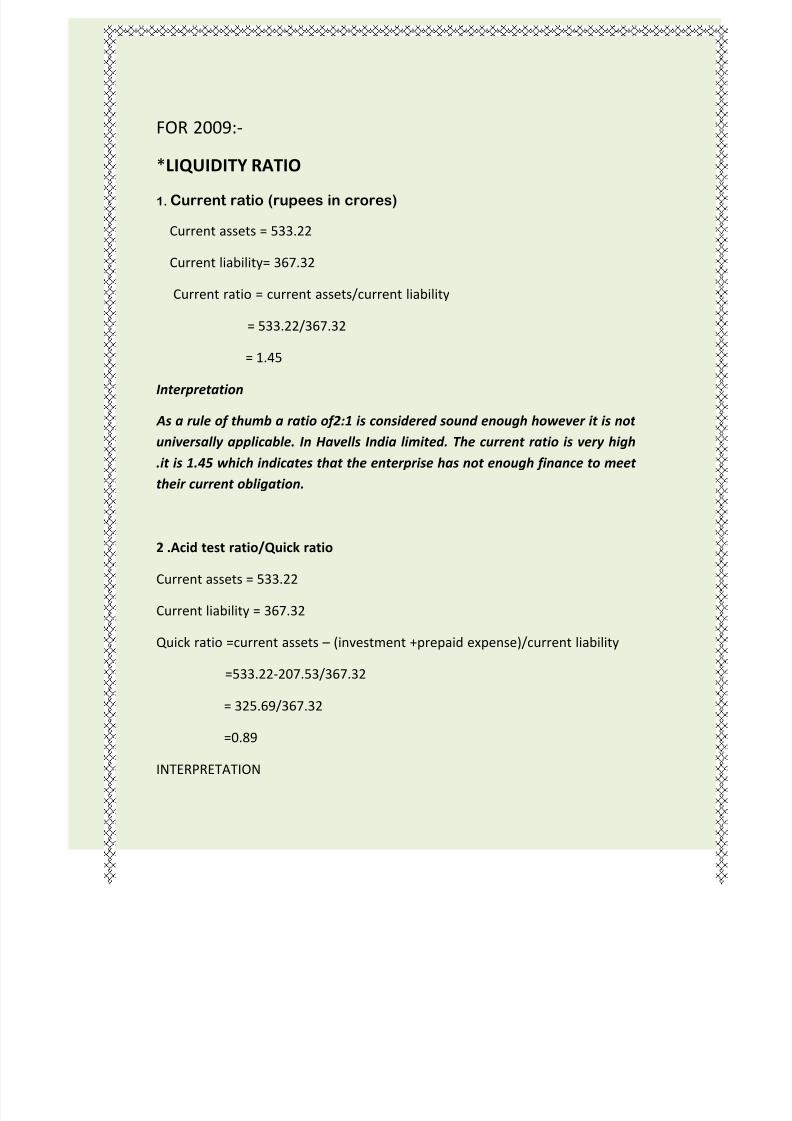
FOR 2009:-
*LIQUIDITY RATIO1. Current ratio (rupees in crores)
Current assets = 533.22
Current liability= 367.32
Current ratio = current assets/current liability
= 533.22/367.32
= 1.45
Interpretation
As a rule of thumb a ratio of2:1 is considered sound enough however it is not
universally applicable. In Havells India limited. The current ratio is very high
.it is 1.45 which indicates that the enterprise has not enough finance to meet
their current obligation.
2 .Acid test ratio/Quick ratio
Current assets = 533.22
Current liability = 367.32
Quick ratio =current assets (investment +prepaid expense)/current liability
=533.22-207.53/367.32
= 325.69/367.32
=0.89
INTERPRETATION
8/7/2019 Manu Mam Term Paper
http://slidepdf.com/reader/full/manu-mam-term-paper 27/39
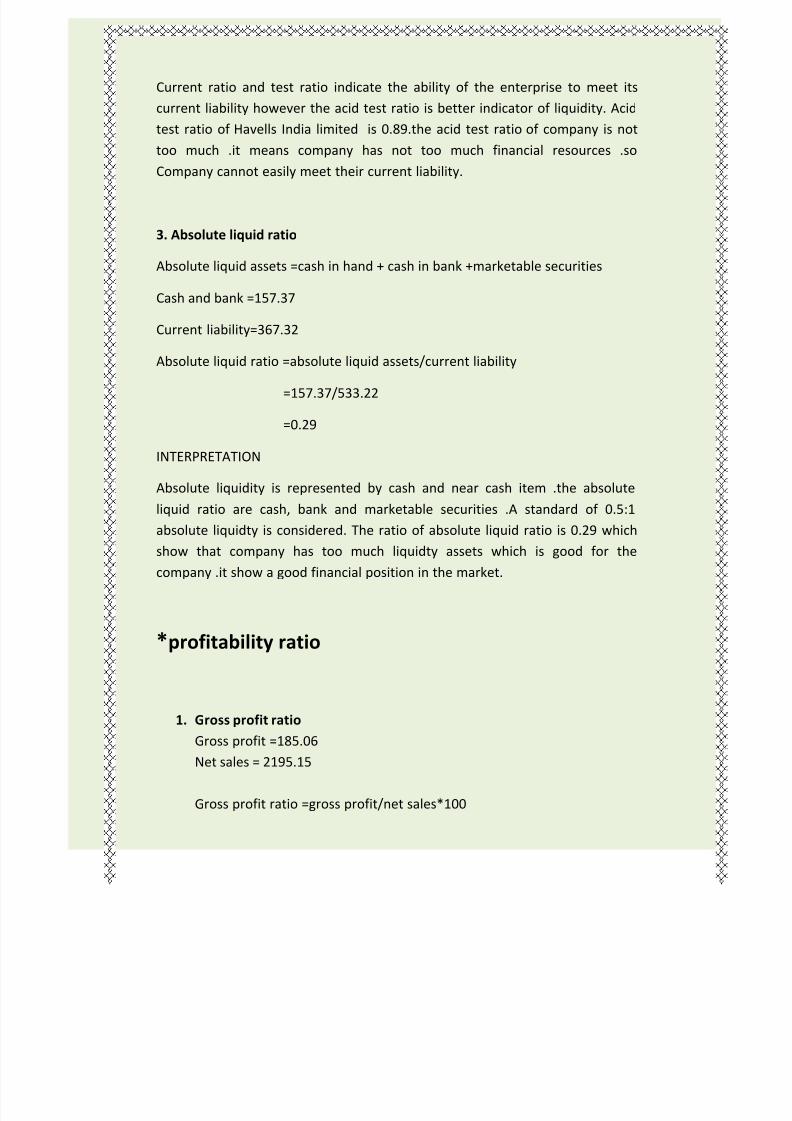
Current ratio and test ratio indicate the ability of the enterprise to meet its
current liability however the acid test ratio is better indicator of liquidity. Acid
test ratio of Havells India limited is 0.89.the acid test ratio of company is not
too much .it means company has not too much financial resources .so
Company cannot easily meet their current liability.
3. Absolute liquid ratio
Absolute liquid assets =cash in hand + cash in bank +marketable securities
Cash and bank =157.37
Current liability=367.32
Absolute liquid ratio =absolute liquid assets/current liability
=157.37/533.22
=0.29
INTERPRETATION
Absolute liquidity is represented by cash and near cash item .the absolute
liquid ratio are cash, bank and marketable securities .A standard of 0.5:1
absolute liquidty is considered. The ratio of absolute liquid ratio is 0.29 which
show that company has too much liquidty assets which is good for the
company .it show a good financial position in the market.
*profitability ratio
1. Gross profit ratio
Gross profit =185.06
Net sales = 2195.15
Gross profit ratio =gross profit/net sales*100
8/7/2019 Manu Mam Term Paper
http://slidepdf.com/reader/full/manu-mam-term-paper 28/39
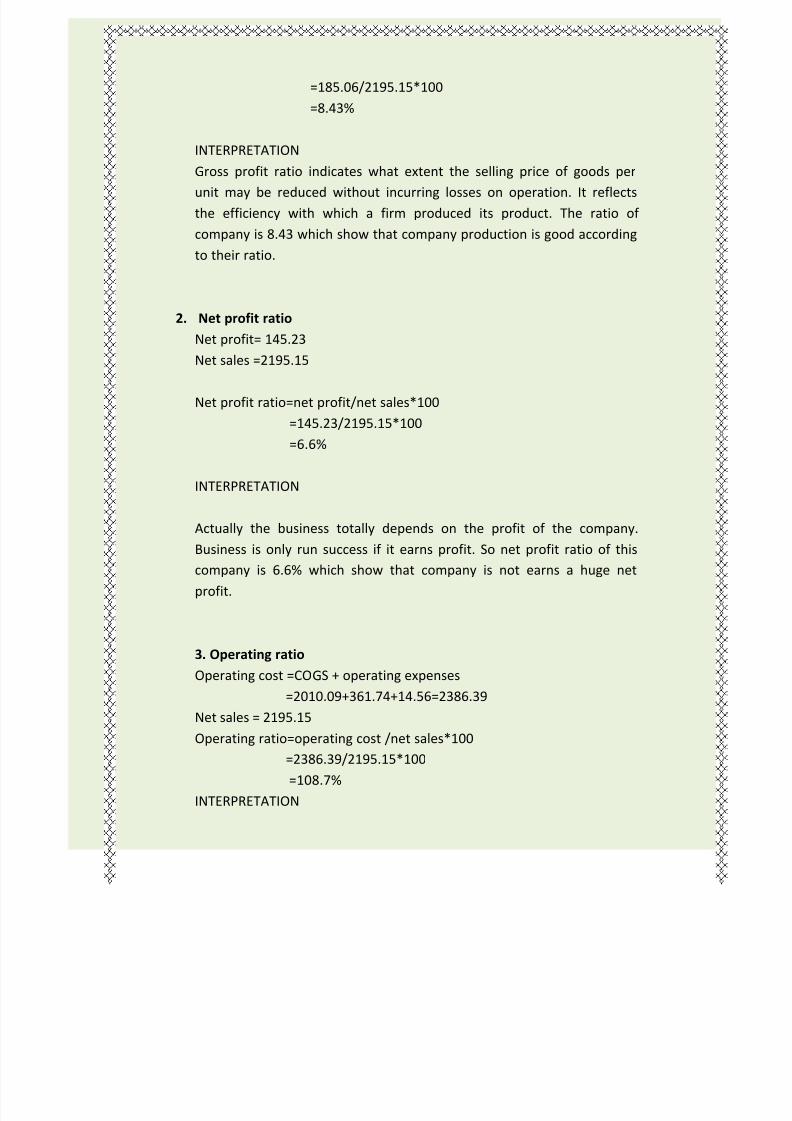
=185.06/2195.15*100
=8.43%
INTERPRETATION
Gross profit ratio indicates what extent the selling price of goods perunit may be reduced without incurring losses on operation. It reflects
the efficiency with which a firm produced its product. The ratio of
company is 8.43 which show that company production is good according
to their ratio.
2. Net profit ratio
Net profit= 145.23
Net sales =2195.15
Net profit ratio=net profit/net sales*100
=145.23/2195.15*100
=6.6%
INTERPRETATION
Actually the business totally depends on the profit of the company.
Business is only run success if it earns profit. So net profit ratio of this
company is 6.6% which show that company is not earns a huge net
profit.
3. Operating ratio
Operating cost =COGS + operating expenses
=2010.09+361.74+14.56=2386.39
Net sales = 2195.15
Operating ratio=operating cost /net sales*100
=2386.39/2195.15*100
=108.7%
INTERPRETATION
8/7/2019 Manu Mam Term Paper
http://slidepdf.com/reader/full/manu-mam-term-paper 29/39
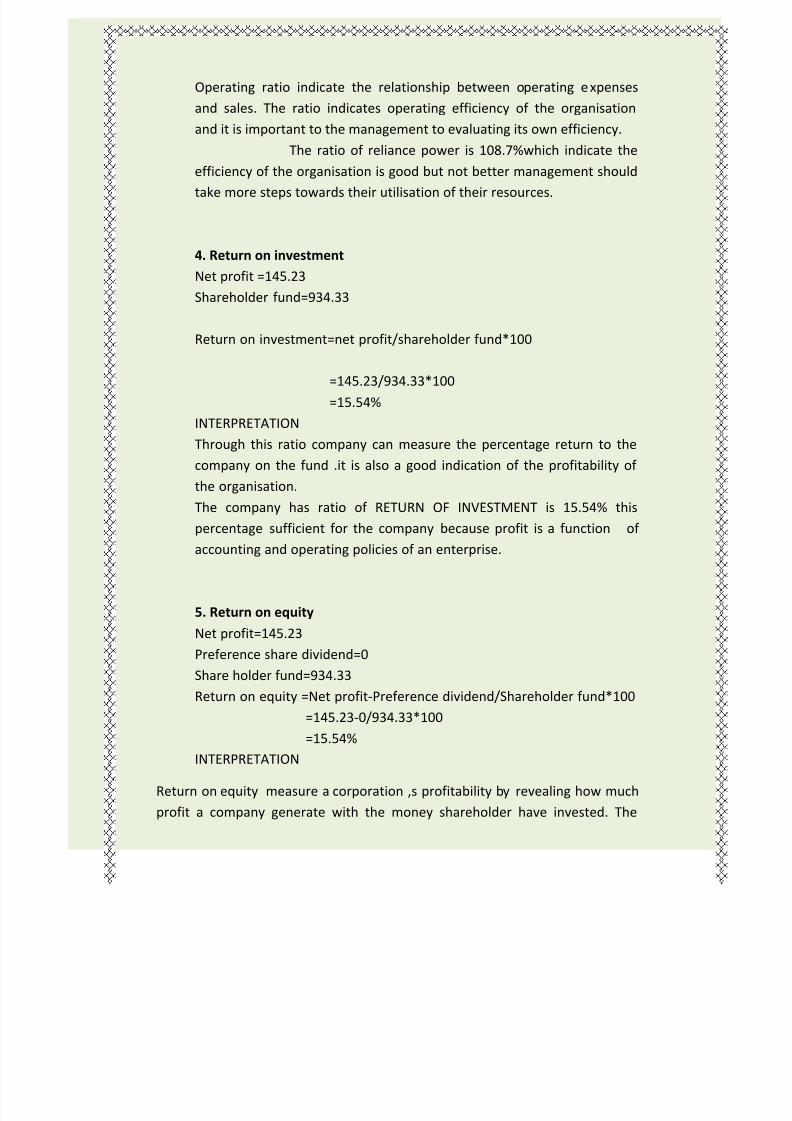
Operating ratio indicate the relationship between operating e xpenses
and sales. The ratio indicates operating efficiency of the organisation
and it is important to the management to evaluating its own efficiency.
The ratio of reliance power is 108.7%which indicate the
efficiency of the organisation is good but not better management shouldtake more steps towards their utilisation of their resources.
4. Return on investment
Net profit =145.23
Shareholder fund=934.33
Return on investment=net profit/shareholder fund*100
=145.23/934.33*100
=15.54%
INTERPRETATION
Through this ratio company can measure the percentage return to the
company on the fund .it is also a good indication of the profitability of
the organisation.
The company has ratio of RETURN OF INVESTMENT is 15.54% this
percentage sufficient for the company because profit is a function of
accounting and operating policies of an enterprise.
5. Return on equity
Net profit=145.23
Preference share dividend=0
Share holder fund=934.33
Return on equity =Net profit-Preference dividend/Shareholder fund*100
=145.23-0/934.33*100
=15.54%
INTERPRETATION
Return on equity measure a corporation ,s profitability by revealing how much
profit a company generate with the money shareholder have invested. The
8/7/2019 Manu Mam Term Paper
http://slidepdf.com/reader/full/manu-mam-term-paper 30/39
ratio of ROE is15.54% indicating good performance in generating profit from
that amount which is invested by the shareholder.
6. Earnings per share =Net profit-preference dividend/No. Of equity
share outstanding
*Activity /turnover ratio
1. Inventory turnover ratio
COG
S=net sales-gross profit
=2195.15-185.06
=2010.09
Average stock= 207.53
Inventory turnover ratio=COGS/average stock
= 2010.09/ 207.53 =10
INTERPRETATION
Inventory turnover ratio indicate that how many times a company, s inventory
is sold and replaced over a period. A high ratio implies either strong sales or
effective buying. But company ITR is 10 which show that company has good
turnover implies good sales.
2. Debtors turnover ratio=net credit annual sales/average
debtors
Net credit sales= 2195.15
Average debtor= 86.74
8/7/2019 Manu Mam Term Paper
http://slidepdf.com/reader/full/manu-mam-term-paper 31/39
Debtor turnover ratio=2195.15/86.74
=25.31
3. Creditors turnover ratio =net credit purchase/average creditor
Average payment period=365/CTR
NOTE there is no any credit purchase by the company so we could not find.
*solvency ratio
1. Debt to equity ratio
Debt=70.28
Equity= 30.08
Debt to equity ratio= total debt/equity
=70.28/30.08
=2.3
INTERPRETATION
Through this ratio company find out financial power of the
company. A high debt to equity ratio generally means that a company has been
aggressive in financial its growth with debt. If company debt may increase
more than it may lead to bankruptcy.
Company debt to equity ratio is not much which indicates that company
took debt according to their need.
8/7/2019 Manu Mam Term Paper
http://slidepdf.com/reader/full/manu-mam-term-paper 32/39
*coverage ratio
1. Inertest coverage ratio
EBIT=167.20
Interest charges= 25.03
Interest coverage ratio=earnings before interest tax/interest charges
=167.20/25.03
=6.7
INTERPRETATION
Interest coverage ratio determines that how easily a company can pay interest
on outstanding debt. The lower the ratio, the company is burden by debt
expense. But the Havells India limited has interest coverage ratio is 6.7. Which
show that company has not much debt or if company has any debt it can easily
met by the company.
CALCULATION FOR 2010
*LIQUIDITY RATIO
1. Current ratio (rupees in crores)
Current assets = 561.25
Current liability= 416.17
Current ratio = current assets/current liability
8/7/2019 Manu Mam Term Paper
http://slidepdf.com/reader/full/manu-mam-term-paper 33/39
= 561.25 / 416.17
= 1.35
Interpretation
Generally as a rule of thumb a ratio of2:1 is considered sound enough
however it is not universally applicable. In Havells India limited. The current
ratio is very low .it is 1.35 which indicates that the enterprise has not more
finance than it need .the ratio show that company has not much finance.
Thus, a high current ratio means the enterprise has more finance so they can
use efficiently. But company has low current ratio.
2 .Acid test ratio/Quick ratio
Current assets = 561.25
Current liability = 416.17
Quick ratio =current assets (investment +prepaid expense)/current liability
=561.25-330.65/416.17
= 231/416.17
= 0.56
INTERPRETATION
Current ratio and test ratio indicate the ability of the enterprise to meet its
current liability however the acid test ratio is better indicator of liquidity. Acid
test ratio of havells India limited is 0.56.the acid test ratio of company is not
too much. It means company has not too much finance available.
2. Absolute liquid ratio
Cash and bank = 68.31
Current liability= 416.17
8/7/2019 Manu Mam Term Paper
http://slidepdf.com/reader/full/manu-mam-term-paper 34/39
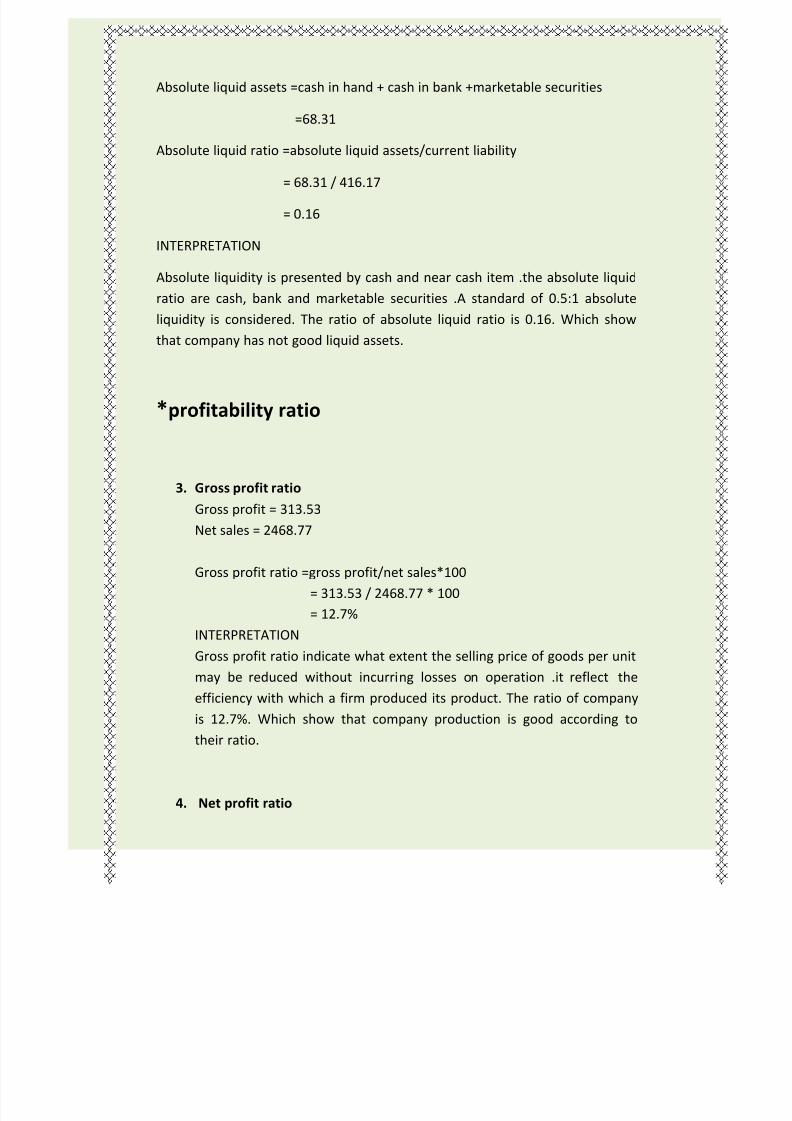
Absolute liquid assets =cash in hand + cash in bank +marketable securities
=68.31
Absolute liquid ratio =absolute liquid assets/current liability
= 68.31 / 416.17
= 0.16
INTERPRETATION
Absolute liquidity is presented by cash and near cash item .the absolute liquid
ratio are cash, bank and marketable securities .A standard of 0.5:1 absolute
liquidity is considered. The ratio of absolute liquid ratio is 0.16. Which show
that company has not good liquid assets.
*profitability ratio
3. Gross profit ratio
Gross profit = 313.53
Net sales = 2468.77
Gross profit ratio =gross profit/net sales*100
= 313.53 / 2468.77 * 100
= 12.7%
INTERPRETATION
Gross profit ratio indicate what extent the selling price of goods per unit
may be reduced without incurring losses on operation .it reflect the
efficiency with which a firm produced its product. The ratio of company
is 12.7%. Which show that company production is good according to
their ratio.
4. Net profit ratio
8/7/2019 Manu Mam Term Paper
http://slidepdf.com/reader/full/manu-mam-term-paper 35/39
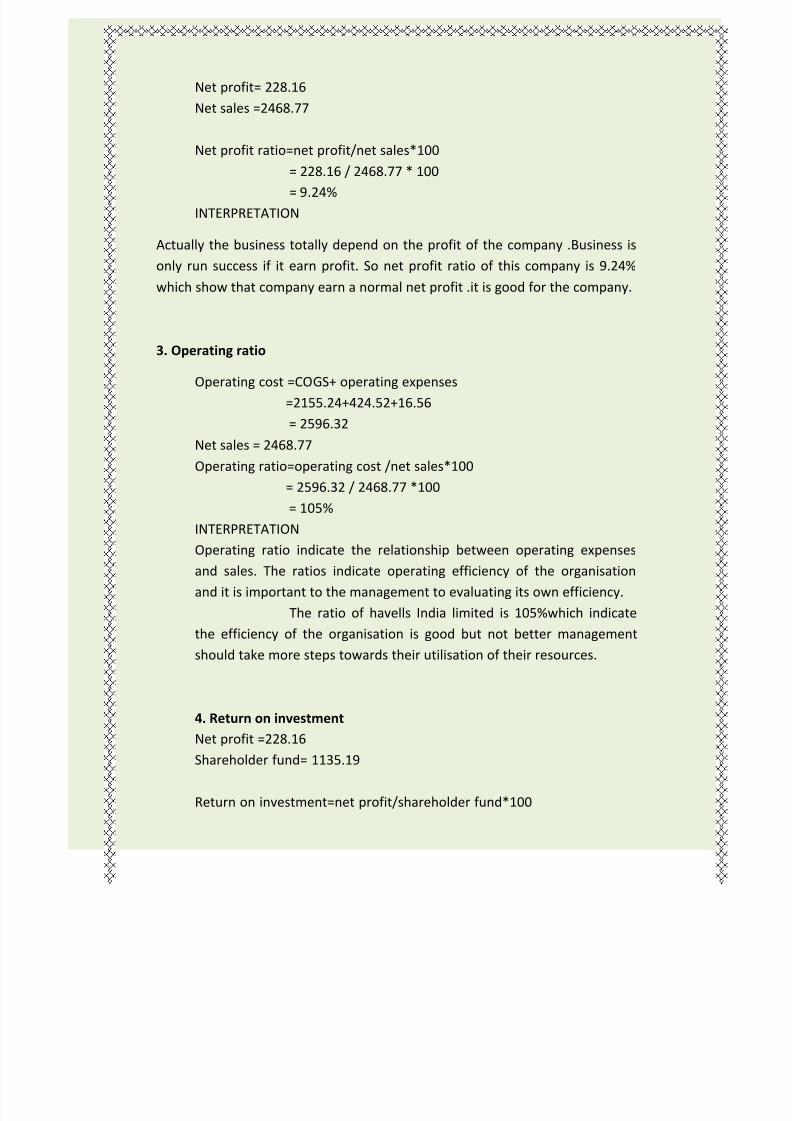
Net profit= 228.16
Net sales =2468.77
Net profit ratio=net profit/net sales*100
= 228.16 / 2468.77 * 100= 9.24%
INTERPRETATION
Actually the business totally depend on the profit of the company .Business is
only run success if it earn profit. So net profit ratio of this company is 9.24%
which show that company earn a normal net profit .it is good for the company.
3. Operating ratio
Operating cost =COGS+ operating expenses
=2155.24+424.52+16.56
= 2596.32
Net sales = 2468.77
Operating ratio=operating cost /net sales*100
= 2596.32 / 2468.77 *100
= 105%
INTERPRETATION
Operating ratio indicate the relationship between operating expenses
and sales. The ratios indicate operating efficiency of the organisation
and it is important to the management to evaluating its own efficiency.
The ratio of havells India limited is 105%which indicate
the efficiency of the organisation is good but not better management
should take more steps towards their utilisation of their resources.
4. Return on investment
Net profit =228.16
Shareholder fund= 1135.19
Return on investment=net profit/shareholder fund*100
8/7/2019 Manu Mam Term Paper
http://slidepdf.com/reader/full/manu-mam-term-paper 36/39
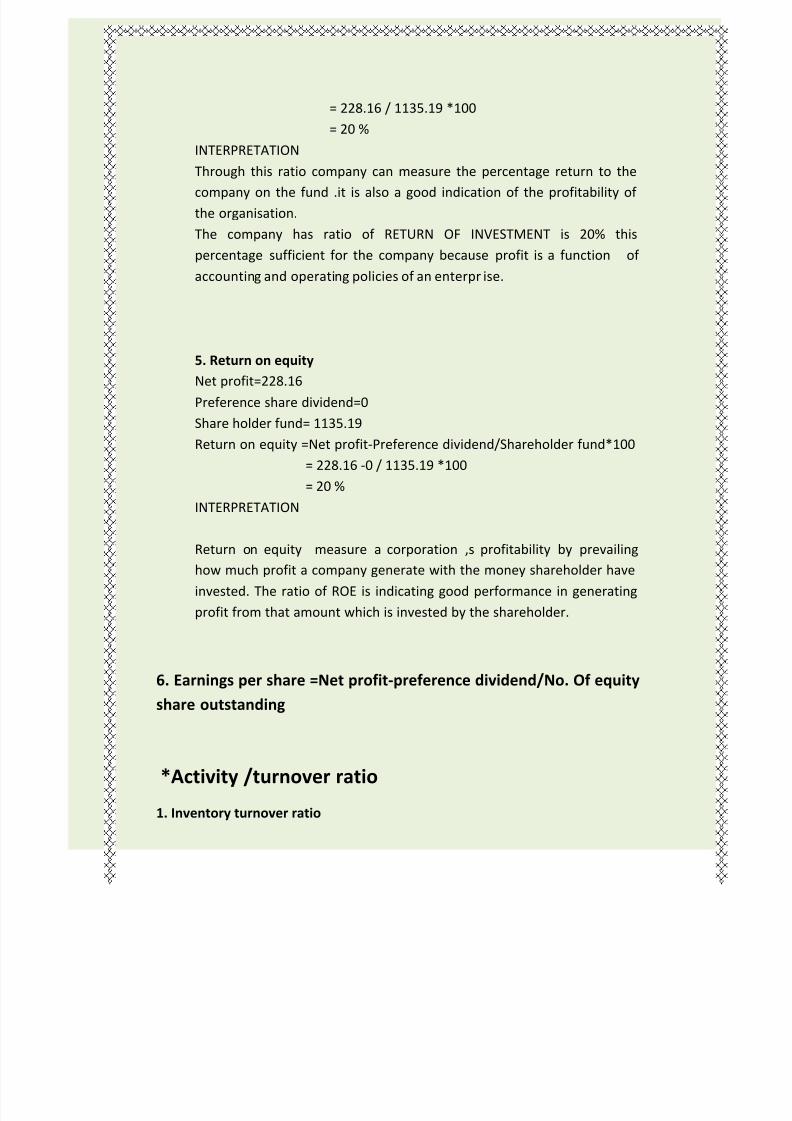
= 228.16 / 1135.19 *100
= 20 %
INTERPRETATION
Through this ratio company can measure the percentage return to thecompany on the fund .it is also a good indication of the profitability of
the organisation.
The company has ratio of RETURN OF INVESTMENT is 20% this
percentage sufficient for the company because profit is a function of
accounting and operating policies of an enterpr ise.
5. Return on equity
Net profit=228.16
Preference share dividend=0
Share holder fund= 1135.19
Return on equity =Net profit-Preference dividend/Shareholder fund*100
= 228.16 -0 / 1135.19 *100
= 20 %
INTERPRETATION
Return on equity measure a corporation ,s profitability by prevailing
how much profit a company generate with the money shareholder have
invested. The ratio of ROE is indicating good performance in generating
profit from that amount which is invested by the shareholder.
6. Earnings per share =Net profit-preference dividend/No. Of equity
share outstanding
*Activity /turnover ratio
1. Inventory turnover ratio
8/7/2019 Manu Mam Term Paper
http://slidepdf.com/reader/full/manu-mam-term-paper 37/39
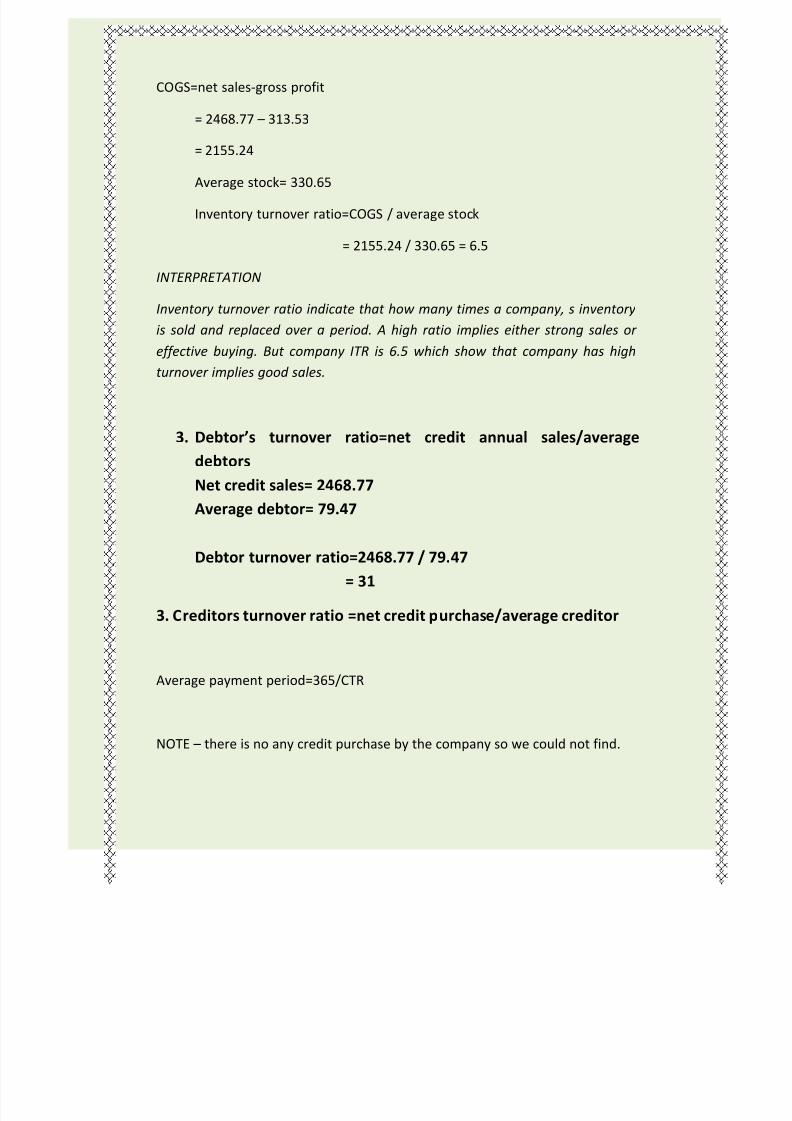
COGS=net sales-gross profit
= 2468.77 313.53
= 2155.24
Average stock= 330.65
Inventory turnover ratio=COGS / average stock
= 2155.24 / 330.65 = 6.5
INTERPRETATION
Inventory turnover ratio indicate that how many times a company, s inventory
is sold and replaced over a period. A high ratio implies either strong sales or
effective buying. But company ITR is 6.5 which show that company has high
turnover implies good sales.
3. Debtors turnover ratio=net credit annual sales/average
debtors
Net credit sales= 2468.77
Average debtor= 79.47
Debtor turnover ratio=2468.77 / 79.47
= 31
3. Creditors turnover ratio =net credit purchase/average creditor
Average payment period=365/CTR
NOTE there is no any credit purchase by the company so we could not find.
8/7/2019 Manu Mam Term Paper
http://slidepdf.com/reader/full/manu-mam-term-paper 38/39
*solvency ratio
1. Debt to equity ratio
Debt= 115.81
Equity= 31.19
Debt to equity ratio= total debt/equity
= 115.81 / 31.19
= 3.7
INTERPRETATION
Through this ratio company find out financial power of the company. A high
debt to equity ratio generally means that a company has been aggressive in
financial its growth with debt. If company debt may increase more than it may
lead to bankruptcy.
Company debt to equity ratio is not much which indicates that company
took debt according to their need.
*coverage ratio
3. Inertest coverage ratio
EBIT= 290.26
Interest charges= 11.74
Interest coverage ratio=earnings before interest tax/interest charges=290.26 / 11.74
= 24.7
INTERPRETATION

8/7/2019 Manu Mam Term Paper
http://slidepdf.com/reader/full/manu-mam-term-paper 39/39
Interest coverage ratio determine that how easily a company can pay interest
on outstanding debt .the lower the ratio ,the company is burden by debt
expense. But the reliance power company has interest coverage ratio is 24.7
which show that company has no any debt or if company has any debt it can
easily meet by the company.