Lg ir deck_11.15.16
26
Company Overview November 2016
-
Upload
leaf-group -
Category
Investor Relations
-
view
31 -
download
0
Transcript of Lg ir deck_11.15.16
Company Overview
November 2016
2
Disclaimers
This document and any related oral presentation does not constitute an offer or invitation to subscribe for, purchase or otherwise acquire any debt or equity securities of Leaf Group Ltd. (“Leaf Group” or the “Company”) and nothing contained herein or in the related oral presentation shall form the basis of any contract or commitment.
The distribution of this document and any related oral presentation in certain jurisdictions may be restricted by law and persons into whose possession this document or any related oral presentation comes should inform themselves about, and observe, any such restriction. Any failure to comply with these restrictions may constitute a violation of the laws of any such other jurisdiction.
The information contained herein does not constitute investment, legal, accounting, regulatory, taxation or other advice and the information does not take into account your investment objectives or legal, accounting, regulatory, taxation or financial situation or particular needs. You are solely responsible for forming your own opinions and conclusions on such matters and the market and for making your own independent assessment of the information. You are solely responsible for seeking independent professional advice in relation to the information and any action taken on the basis of the information.
This presentation contains certain forward-looking statements. All statements other than statements of historical facts contained in this presentation, including statements regarding the Company’s future results of operations and financial position, business strategy, plans and objectives for future operations, are forward-looking statements. You should not rely upon forward-looking statements as guarantees of future performance. The Company has based these forward-looking statements largely on its current expectations and projections about future events and financial trends that it believes may affect its financial condition, results of operations, business strategy, short-term and long-term business operations and objectives, and financial needs. These forward-looking statements are subject to a number of risks, uncertainties and assumptions that may cause actual results to differ materially from those contained in any forward-looking statements, including those described under the heading “Risk Factors” in the Company’s periodic reports filed from time to time with the Securities and Exchange Commission (the “SEC”), which are incorporated herein by reference. Moreover, the Company operates in a very competitive and rapidly changing environment and new risks emerge from time to time. In light of these risks, uncertainties and assumptions, the forward-looking statements included in this presentation may not occur and actual results could differ materially and adversely from those anticipated or implied in the forward-looking statements. Except as required by law, the Company undertakes no obligation to update any forward-looking statements for any reason after the date of this presentation to conform these statements to actual results or to changes in the Company’s expectations.
The Company is publicly traded on the New York Stock Exchange under the ticker symbol “LFGR” and is a registrant under the rules and regulations promulgated by the SEC. Before evaluating whether you should consider an investment in the Company’s securities, you should read all of the disclosures set forth in the Company’s annual, quarterly and periodic reports filed with the SEC, including the disclosures under the headings “Risk Factors” and “Management’s Discussion and Analysis of Financial Condition and Results of Operations.” The Company’s SEC filings can be found at www.sec.gov and ir.leafgroup.com.
3
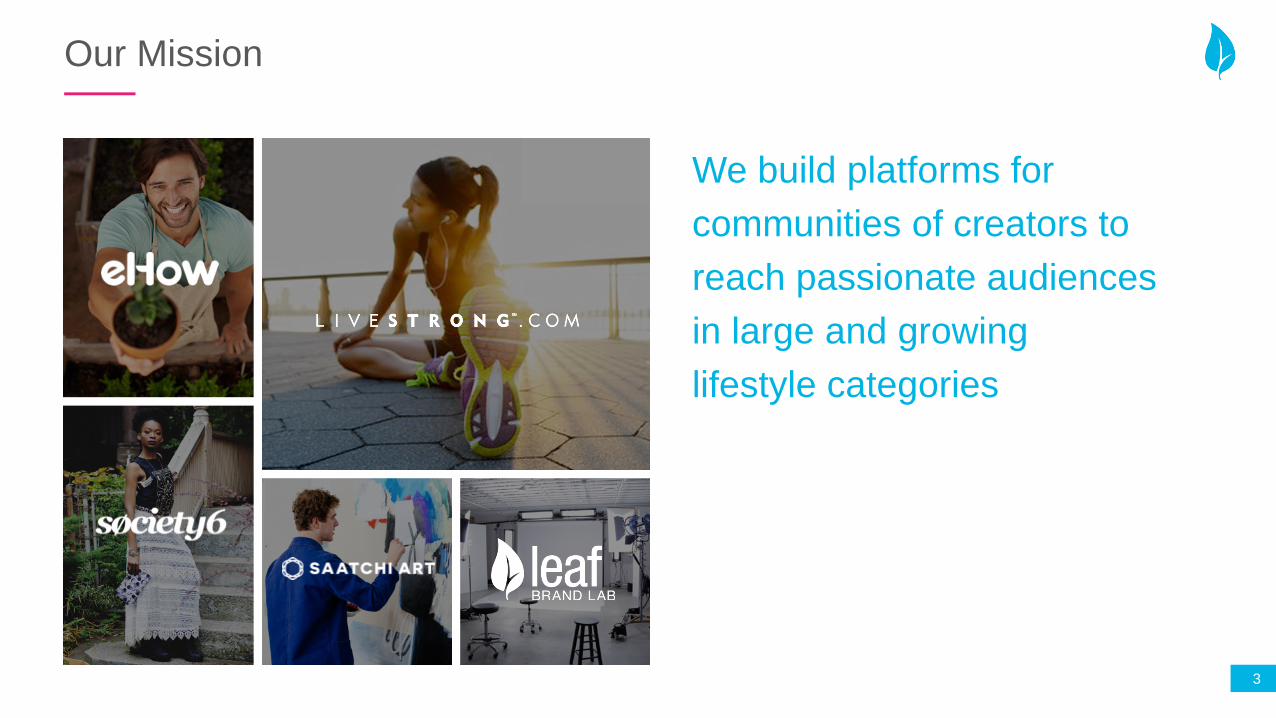
Our Mission
We build platforms for communities of creators to reach passionate audiences in large and growing lifestyle categories
4
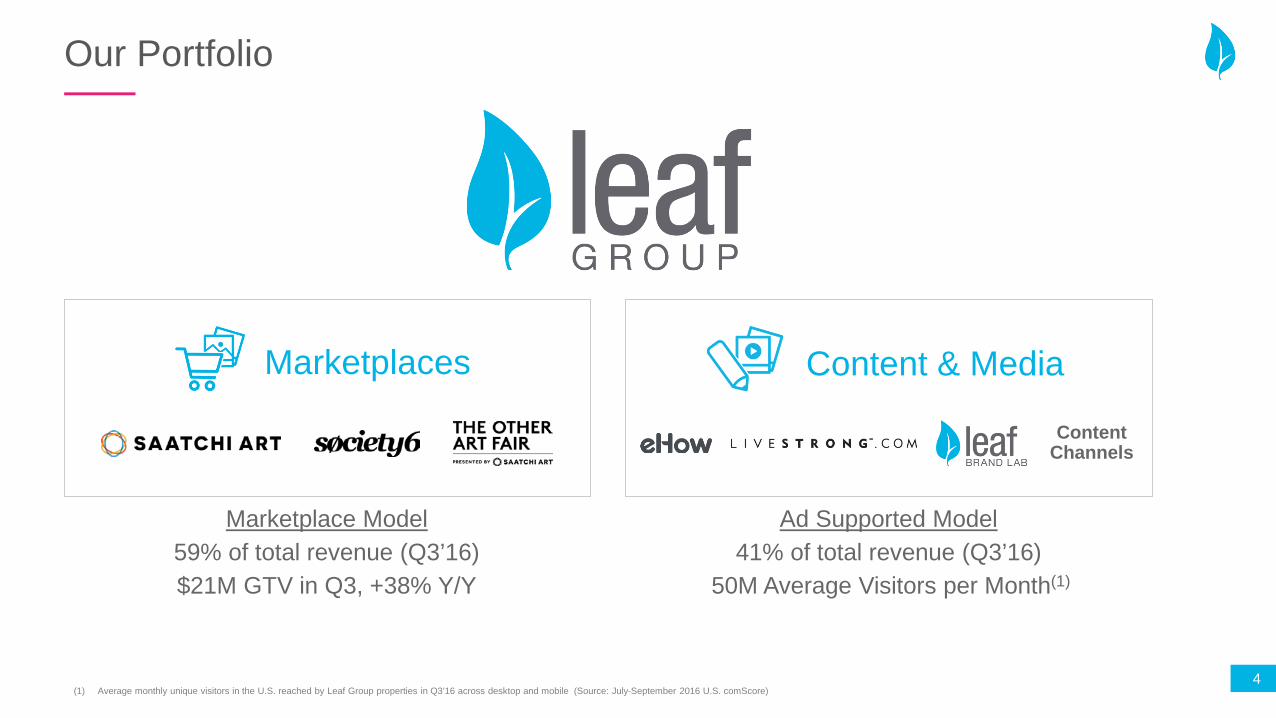
Our Portfolio
Marketplace Model 59% of total revenue (Q3’16) $21M GTV in Q3, +38% Y/Y
Ad Supported Model 41% of total revenue (Q3’16)
50M Average Visitors per Month(1)
(1) Average monthly unique visitors in the U.S. reached by Leaf Group properties in Q3’16 across desktop and mobile (Source: July-September 2016 U.S. comScore)
Marketplaces Content & Media
Content Channels
5
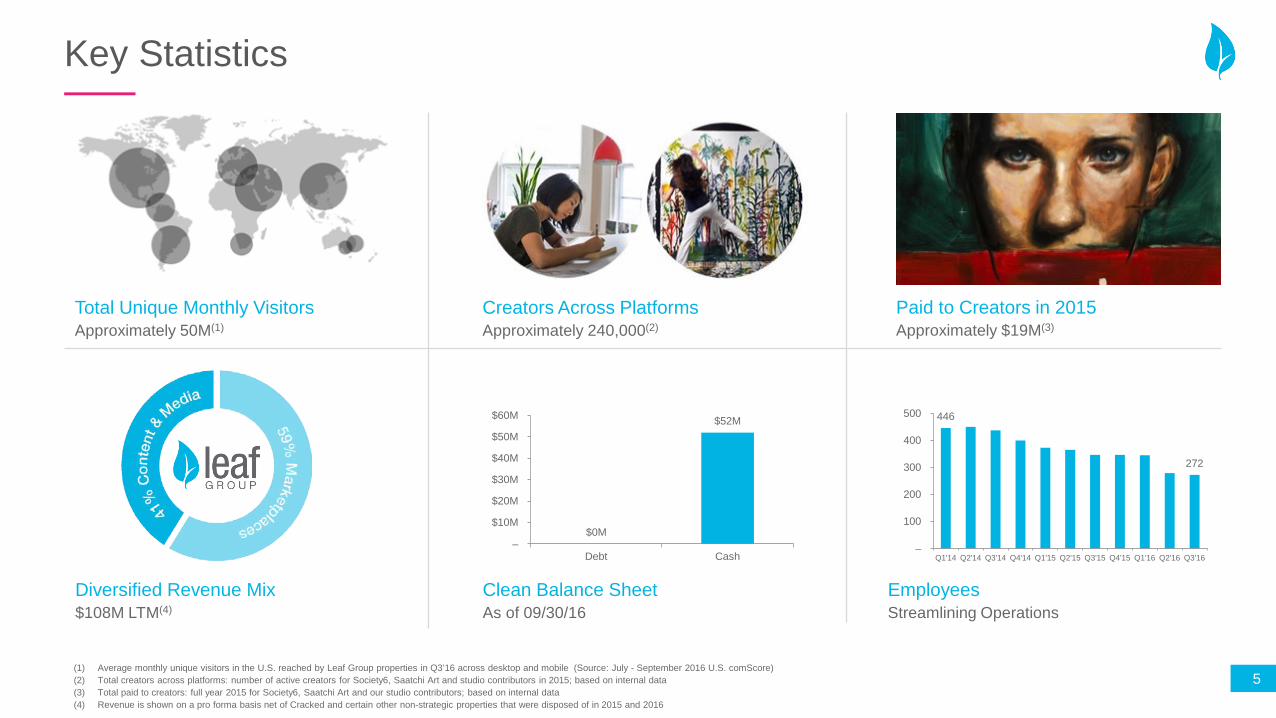
Key Statistics
Approximately 50M(1) Total Unique Monthly Visitors
Approximately $19M(3) Paid to Creators in 2015
Approximately 240,000(2) Creators Across Platforms
$108M LTM(4) Diversified Revenue Mix Clean Balance Sheet Employees
(1) Average monthly unique visitors in the U.S. reached by Leaf Group properties in Q3’16 across desktop and mobile (Source: July - September 2016 U.S. comScore) (2) Total creators across platforms: number of active creators for Society6, Saatchi Art and studio contributors in 2015; based on internal data (3) Total paid to creators: full year 2015 for Society6, Saatchi Art and our studio contributors; based on internal data (4) Revenue is shown on a pro forma basis net of Cracked and certain other non-strategic properties that were disposed of in 2015 and 2016
$0M
$52M
–
$10M
$20M
$30M
$40M
$50M
$60M
Debt Cash
446
272
–
100
200
300
400
500
Q1'14 Q2'14 Q3'14 Q4'14 Q1'15 Q2'15 Q3'15 Q4'15 Q1'16 Q2'16 Q3'16
As of 09/30/16
Streamlining Operations
6
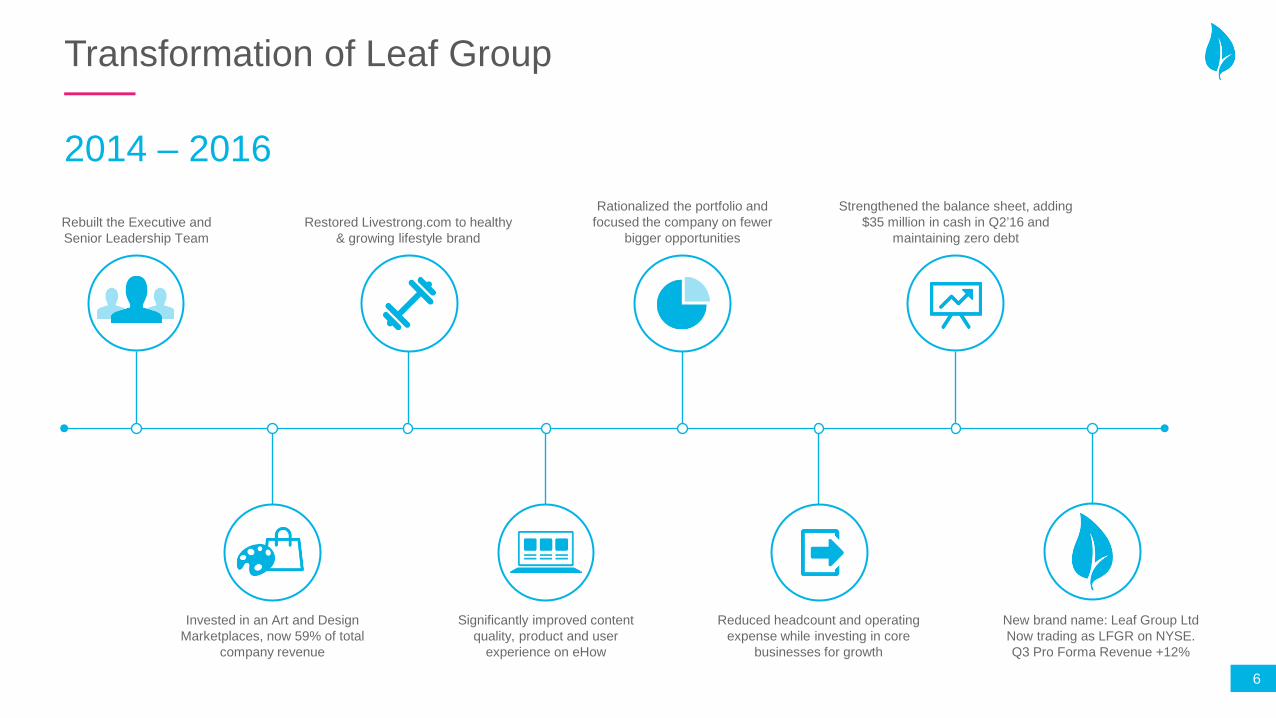
Transformation of Leaf Group
2014 – 2016
Rebuilt the Executive and Senior Leadership Team
Invested in an Art and Design Marketplaces, now 59% of total
company revenue
Restored Livestrong.com to healthy & growing lifestyle brand
Rationalized the portfolio and focused the company on fewer
bigger opportunities
Strengthened the balance sheet, adding $35 million in cash in Q2’16 and
maintaining zero debt
Significantly improved content quality, product and user
experience on eHow
Reduced headcount and operating expense while investing in core
businesses for growth
New brand name: Leaf Group Ltd Now trading as LFGR on NYSE. Q3 Pro Forma Revenue +12%
7
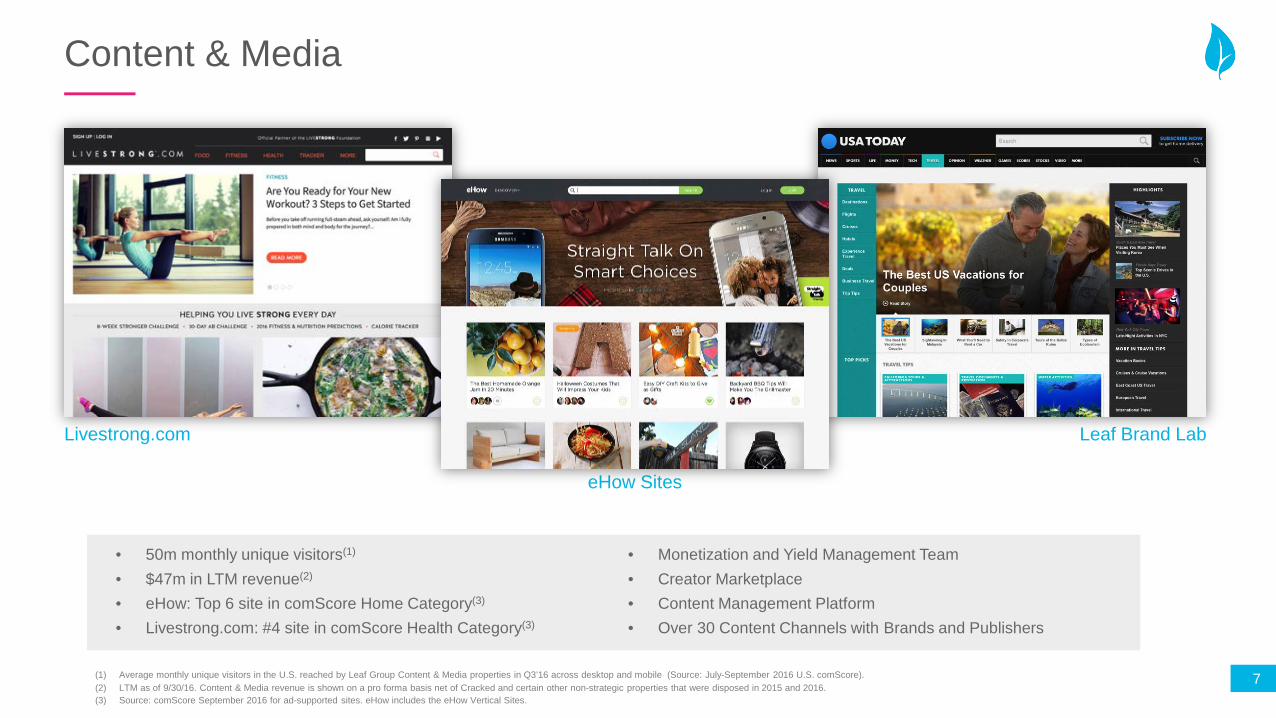
Content & Media
(1) Average monthly unique visitors in the U.S. reached by Leaf Group Content & Media properties in Q3’16 across desktop and mobile (Source: July-September 2016 U.S. comScore). (2) LTM as of 9/30/16. Content & Media revenue is shown on a pro forma basis net of Cracked and certain other non-strategic properties that were disposed in 2015 and 2016. (3) Source: comScore September 2016 for ad-supported sites. eHow includes the eHow Vertical Sites.
Leaf Brand Lab Livestrong.com
eHow Sites
• 50m monthly unique visitors(1)
• $47m in LTM revenue(2) • eHow: Top 6 site in comScore Home Category(3)
• Livestrong.com: #4 site in comScore Health Category(3)
• Monetization and Yield Management Team • Creator Marketplace • Content Management Platform • Over 30 Content Channels with Brands and Publishers
8
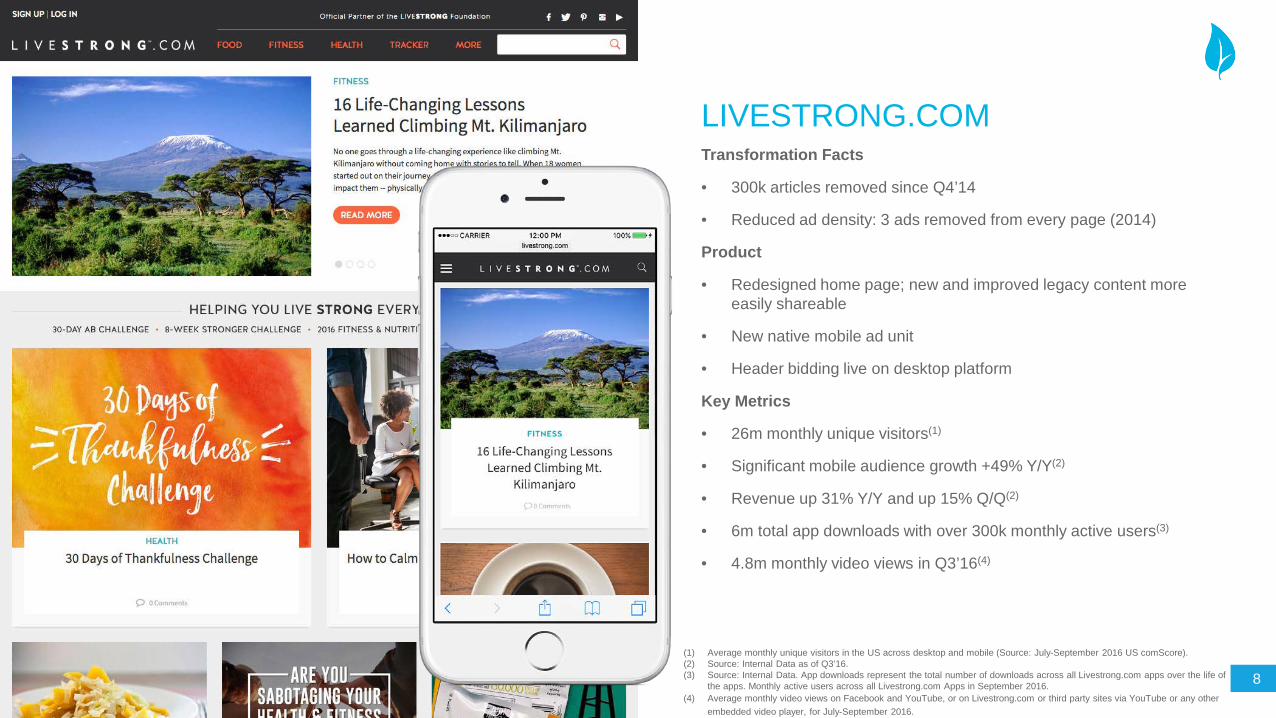
LIVESTRONG.COM Transformation Facts
• 300k articles removed since Q4’14
• Reduced ad density: 3 ads removed from every page (2014)
Product
• Redesigned home page; new and improved legacy content more easily shareable
• New native mobile ad unit
• Header bidding live on desktop platform
Key Metrics
• 26m monthly unique visitors(1)
• Significant mobile audience growth +49% Y/Y(2)
• Revenue up 31% Y/Y and up 15% Q/Q(2)
• 6m total app downloads with over 300k monthly active users(3)
• 4.8m monthly video views in Q3’16(4)
(1) Average monthly unique visitors in the US across desktop and mobile (Source: July-September 2016 US comScore). (2) Source: Internal Data as of Q3’16. (3) Source: Internal Data. App downloads represent the total number of downloads across all Livestrong.com apps over the life of
the apps. Monthly active users across all Livestrong.com Apps in September 2016. (4) Average monthly video views on Facebook and YouTube, or on Livestrong.com or third party sites via YouTube or any other
embedded video player, for July-September 2016.
9
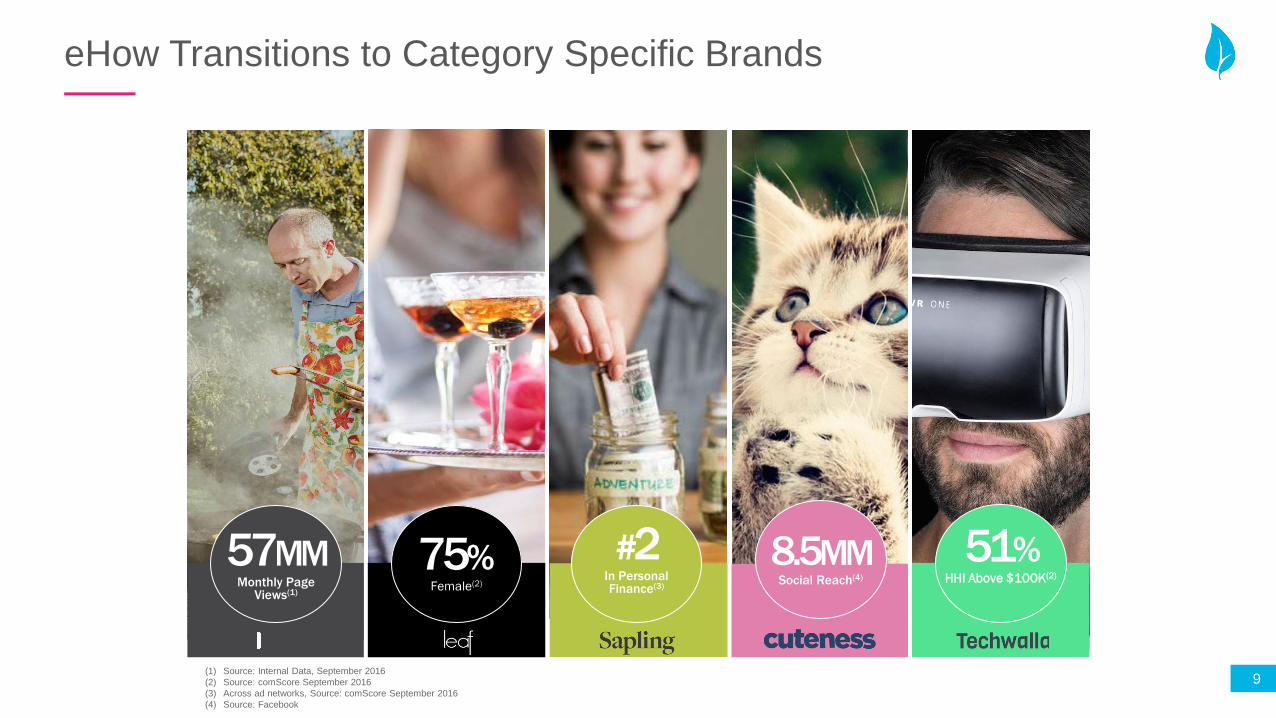
eHow Transitions to Category Specific Brands
75% Female(2)
#2 In Personal Finance(3)
57MM Monthly Page
Views(1)
8.5MM Social Reach(4)
51% HHI Above $100K(2)
(1) Source: Internal Data, September 2016 (2) Source: comScore September 2016 (3) Across ad networks, Source: comScore September 2016 (4) Source: Facebook
10
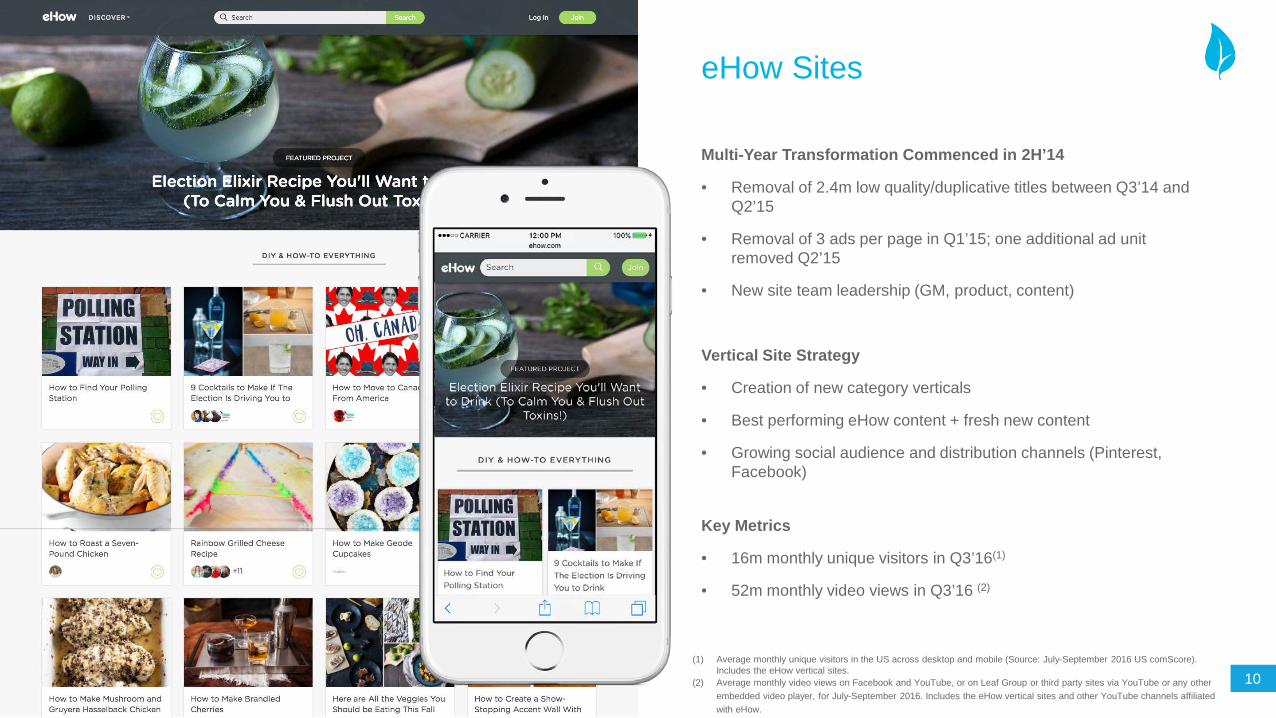
eHow Sites
(1) Average monthly unique visitors in the US across desktop and mobile (Source: July-September 2016 US comScore). Includes the eHow vertical sites.
(2) Average monthly video views on Facebook and YouTube, or on Leaf Group or third party sites via YouTube or any other embedded video player, for July-September 2016. Includes the eHow vertical sites and other YouTube channels affiliated with eHow.
Multi-Year Transformation Commenced in 2H’14
• Removal of 2.4m low quality/duplicative titles between Q3’14 and Q2’15
• Removal of 3 ads per page in Q1’15; one additional ad unit removed Q2’15
• New site team leadership (GM, product, content)
Vertical Site Strategy
• Creation of new category verticals
• Best performing eHow content + fresh new content
• Growing social audience and distribution channels (Pinterest, Facebook)
Key Metrics
• 16m monthly unique visitors in Q3’16(1)
• 52m monthly video views in Q3’16 (2)
11
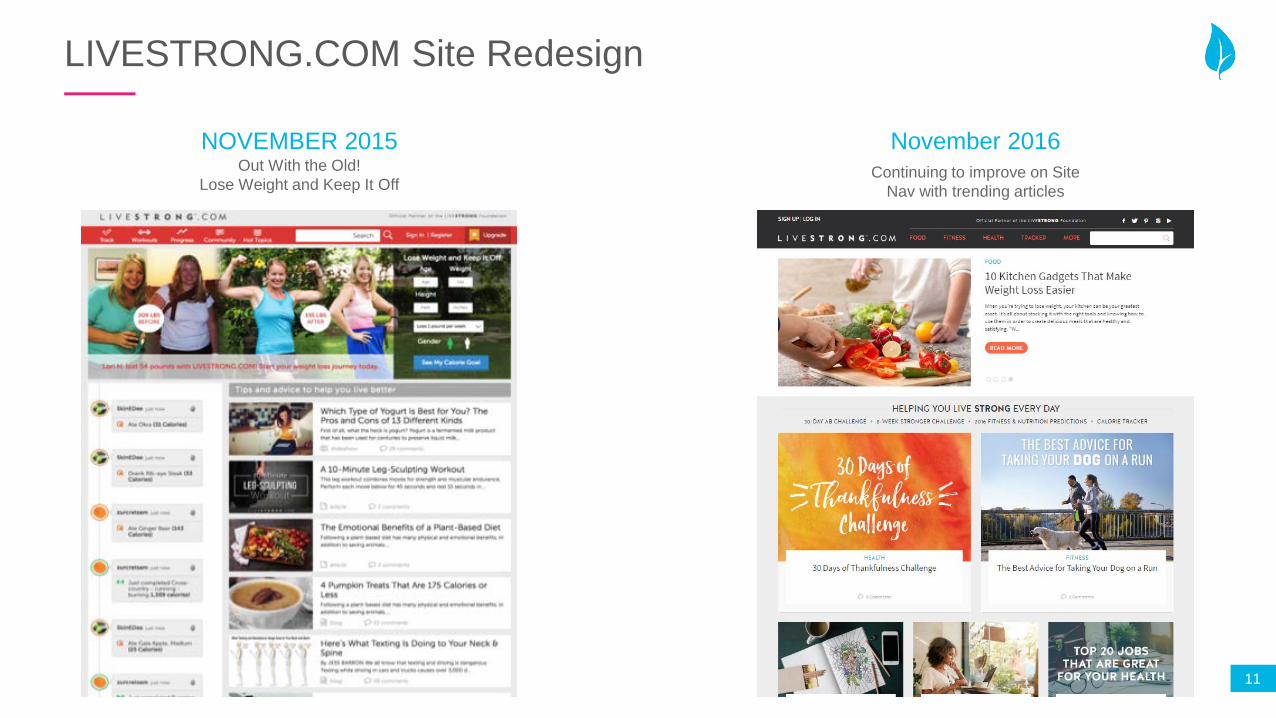
LIVESTRONG.COM Site Redesign
November 2016 Continuing to improve on Site
Nav with trending articles
NOVEMBER 2015 Out With the Old!
Lose Weight and Keep It Off
12
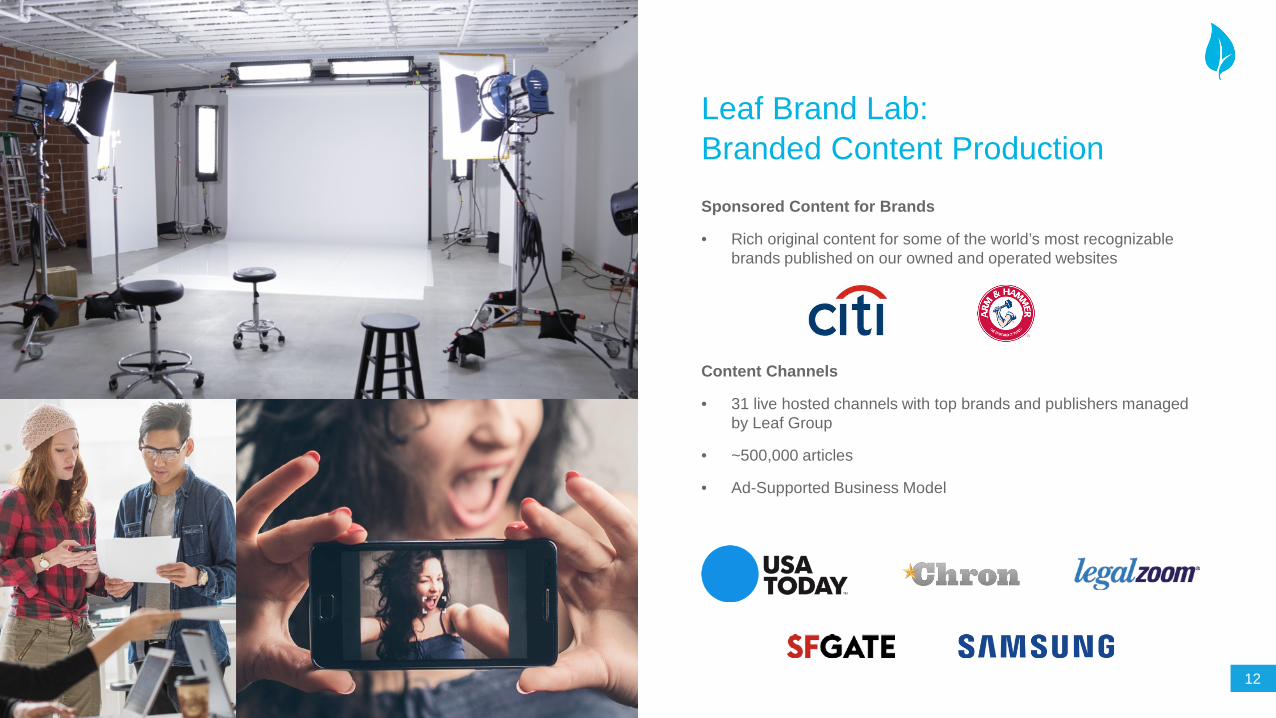
Leaf Brand Lab: Branded Content Production Sponsored Content for Brands
• Rich original content for some of the world’s most recognizable brands published on our owned and operated websites
Content Channels
• 31 live hosted channels with top brands and publishers managed by Leaf Group
• ~500,000 articles
• Ad-Supported Business Model
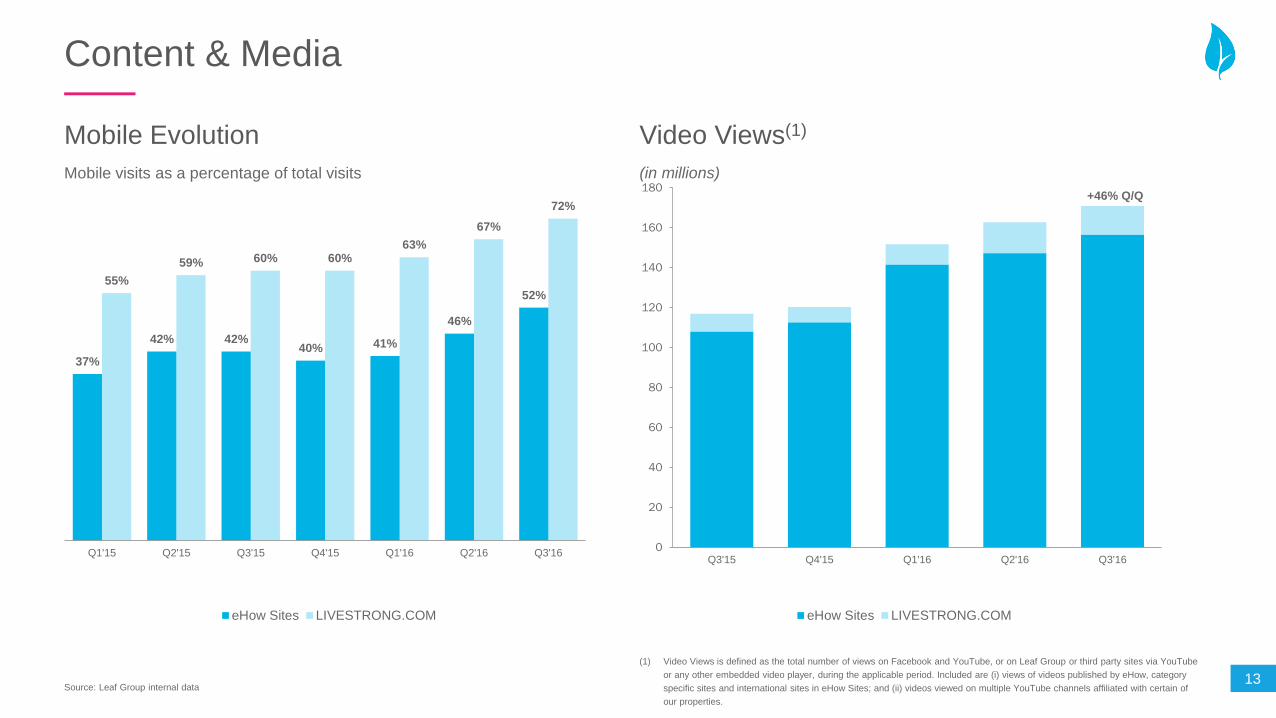
Mobile Evolution Video Views(1)
Source: Leaf Group internal data
Mobile visits as a percentage of total visits (in millions)
0
20
40
60
80
100
120
140
160
180
Q3'15 Q4'15 Q1'16 Q2'16 Q3'16
eHow Sites LIVESTRONG.COM
+46% Q/Q
(1) Video Views is defined as the total number of views on Facebook and YouTube, or on Leaf Group or third party sites via YouTube or any other embedded video player, during the applicable period. Included are (i) views of videos published by eHow, category specific sites and international sites in eHow Sites; and (ii) videos viewed on multiple YouTube channels affiliated with certain of our properties.
37%
42% 42% 40% 41%
46%
52% 55%
59% 60% 60% 63%
67% 72%
Q1'15 Q2'15 Q3'15 Q4'15 Q1'16 Q2'16 Q3'16
eHow Sites LIVESTRONG.COM
13
Content & Media
14
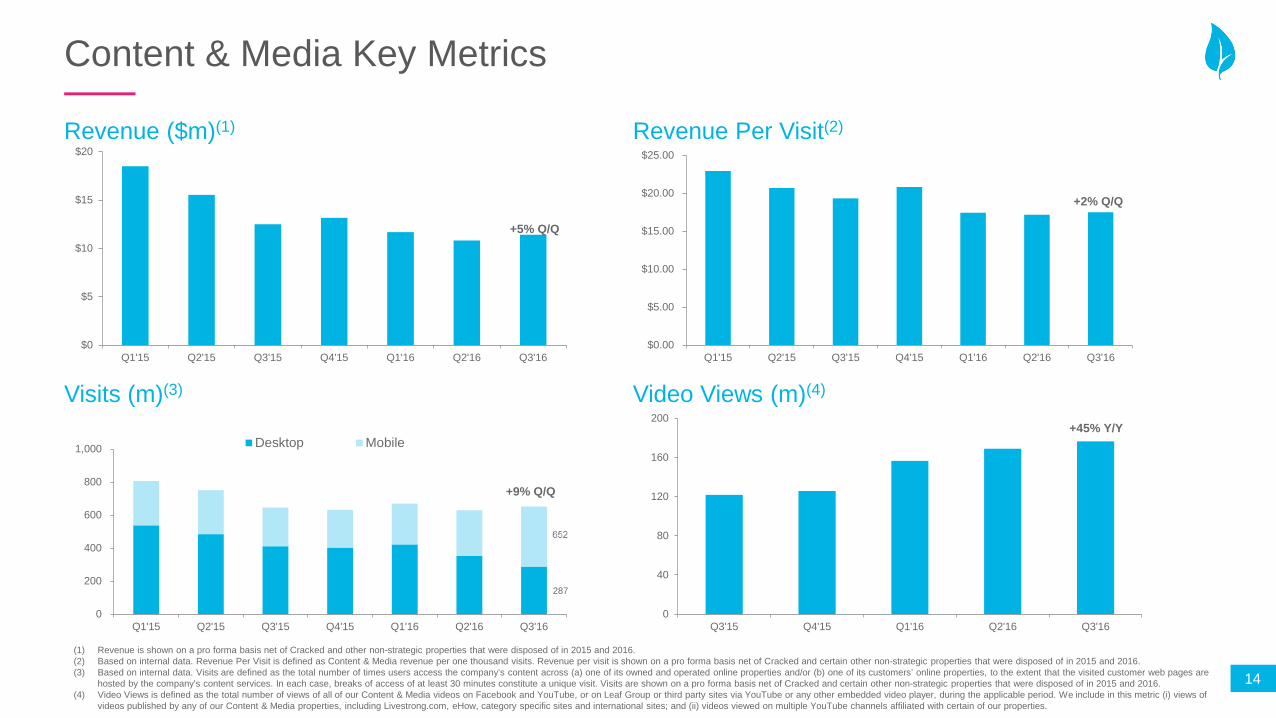
Content & Media Key Metrics
$0.00
$5.00
$10.00
$15.00
$20.00
$25.00
Q1'15 Q2'15 Q3'15 Q4'15 Q1'16 Q2'16 Q3'16
+2% Q/Q
0
40
80
120
160
200
Q3'15 Q4'15 Q1'16 Q2'16 Q3'16
+45% Y/Y
Revenue Per Visit(2)
Video Views (m)(4)
Revenue ($m)(1)
Visits (m)(3)
$0
$5
$10
$15
$20
Q1'15 Q2'15 Q3'15 Q4'15 Q1'16 Q2'16 Q3'16
+5% Q/Q
(1) Revenue is shown on a pro forma basis net of Cracked and other non-strategic properties that were disposed of in 2015 and 2016. (2) Based on internal data. Revenue Per Visit is defined as Content & Media revenue per one thousand visits. Revenue per visit is shown on a pro forma basis net of Cracked and certain other non-strategic properties that were disposed of in 2015 and 2016. (3) Based on internal data. Visits are defined as the total number of times users access the company’s content across (a) one of its owned and operated online properties and/or (b) one of its customers’ online properties, to the extent that the visited customer web pages are
hosted by the company’s content services. In each case, breaks of access of at least 30 minutes constitute a unique visit. Visits are shown on a pro forma basis net of Cracked and certain other non-strategic properties that were disposed of in 2015 and 2016. (4) Video Views is defined as the total number of views of all of our Content & Media videos on Facebook and YouTube, or on Leaf Group or third party sites via YouTube or any other embedded video player, during the applicable period. We include in this metric (i) views of
videos published by any of our Content & Media properties, including Livestrong.com, eHow, category specific sites and international sites; and (ii) videos viewed on multiple YouTube channels affiliated with certain of our properties.
287
0
200
400
600
800
1,000
Q1'15 Q2'15 Q3'15 Q4'15 Q1'16 Q2'16 Q3'16
Desktop Mobile
+9% Q/Q
15
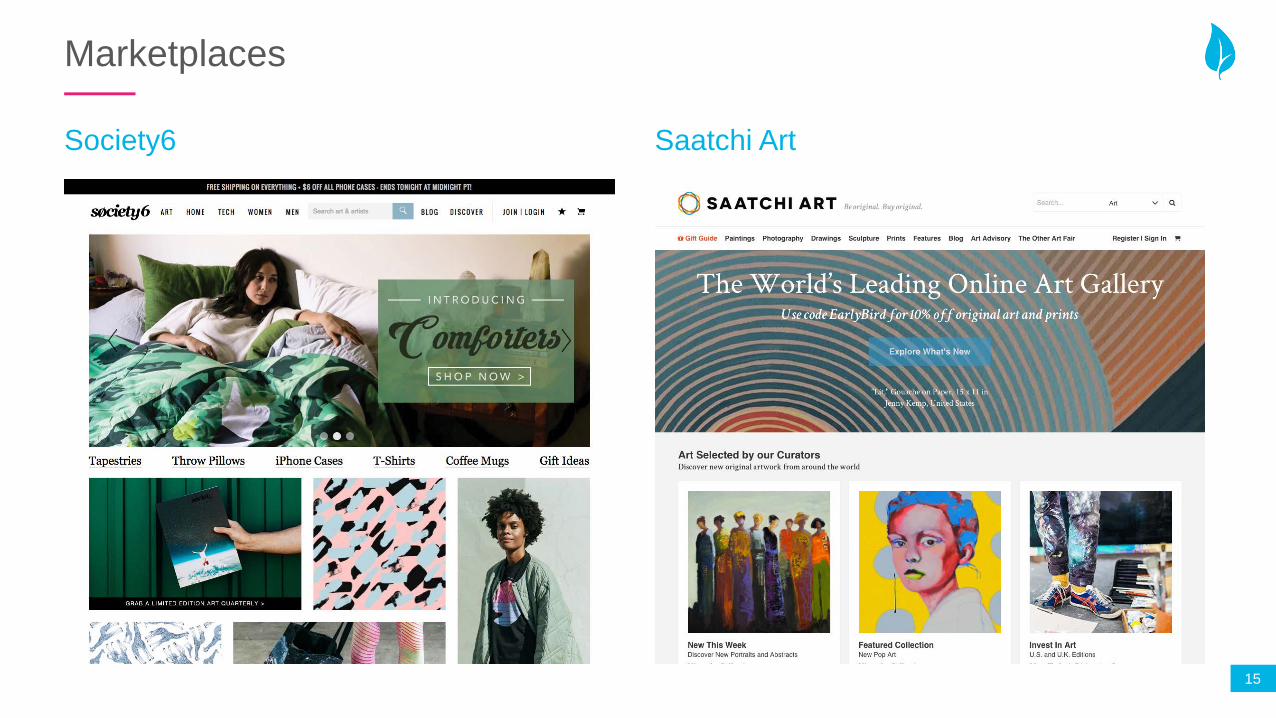
Marketplaces
Society6 Saatchi Art
16
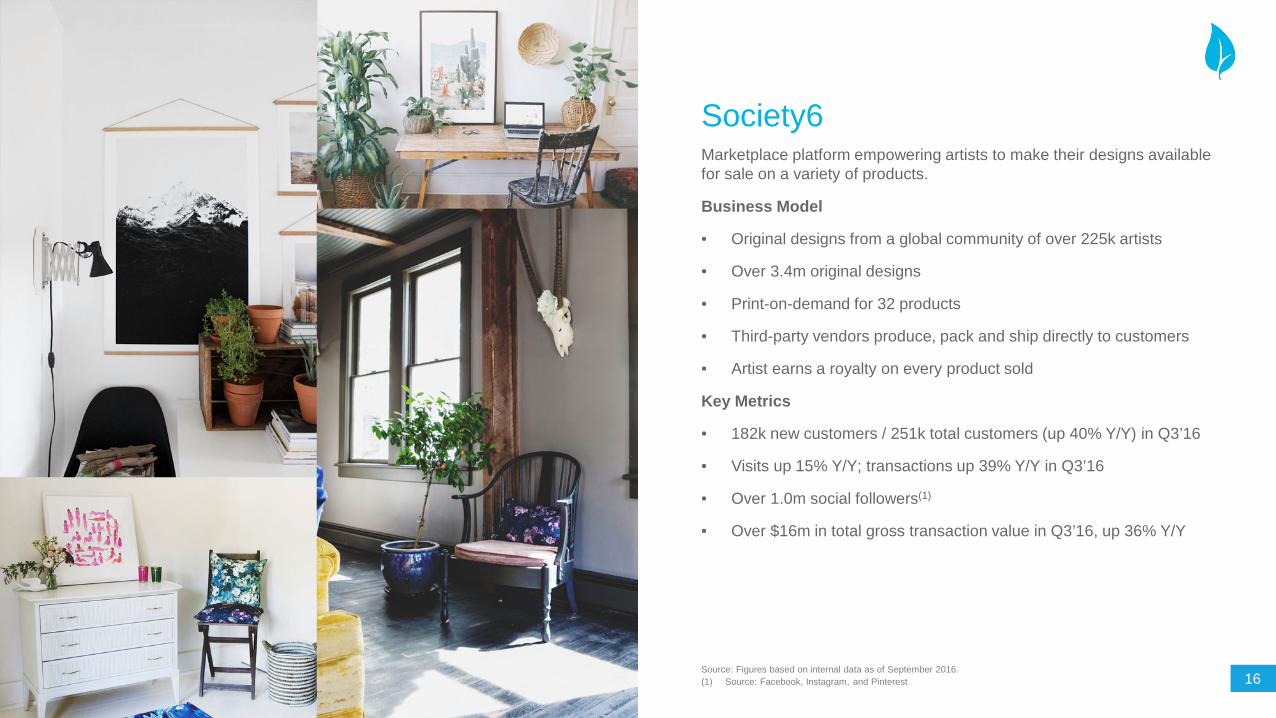
Society6 Marketplace platform empowering artists to make their designs available for sale on a variety of products.
Business Model
• Original designs from a global community of over 225k artists
• Over 3.4m original designs
• Print-on-demand for 32 products
• Third-party vendors produce, pack and ship directly to customers
• Artist earns a royalty on every product sold
Key Metrics
• 182k new customers / 251k total customers (up 40% Y/Y) in Q3’16
• Visits up 15% Y/Y; transactions up 39% Y/Y in Q3’16
• Over 1.0m social followers(1)
• Over $16m in total gross transaction value in Q3’16, up 36% Y/Y
Source: Figures based on internal data as of September 2016. (1) Source: Facebook, Instagram, and Pinterest
17
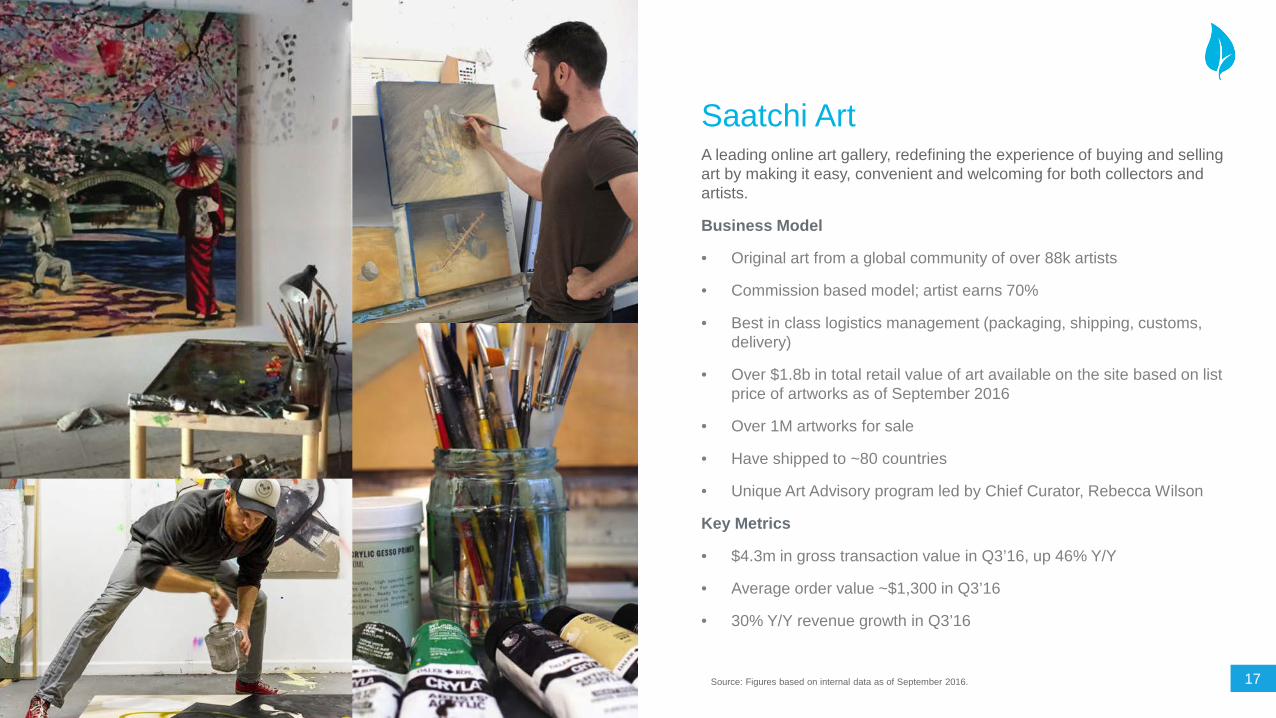
Saatchi Art A leading online art gallery, redefining the experience of buying and selling art by making it easy, convenient and welcoming for both collectors and artists.
Business Model
• Original art from a global community of over 88k artists
• Commission based model; artist earns 70%
• Best in class logistics management (packaging, shipping, customs, delivery)
• Over $1.8b in total retail value of art available on the site based on list price of artworks as of September 2016
• Over 1M artworks for sale
• Have shipped to ~80 countries
• Unique Art Advisory program led by Chief Curator, Rebecca Wilson
Key Metrics
• $4.3m in gross transaction value in Q3’16, up 46% Y/Y
• Average order value ~$1,300 in Q3’16
• 30% Y/Y revenue growth in Q3’16
Source: Figures based on internal data as of September 2016.
18
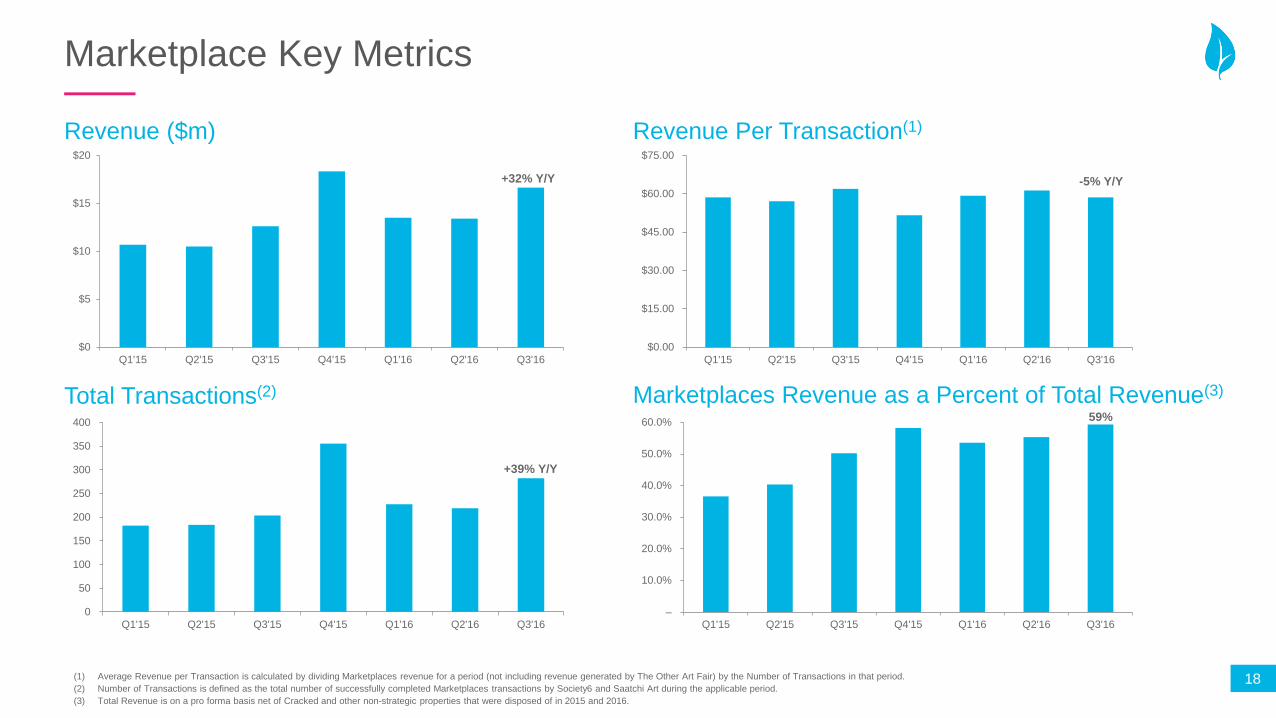
Marketplace Key Metrics
Revenue ($m) Revenue Per Transaction(1)
Total Transactions(2)
$0
$5
$10
$15
$20
Q1'15 Q2'15 Q3'15 Q4'15 Q1'16 Q2'16 Q3'16
+32% Y/Y
0
50
100
150
200
250
300
350
400
Q1'15 Q2'15 Q3'15 Q4'15 Q1'16 Q2'16 Q3'16
+39% Y/Y
$0.00
$15.00
$30.00
$45.00
$60.00
$75.00
Q1'15 Q2'15 Q3'15 Q4'15 Q1'16 Q2'16 Q3'16
-5% Y/Y
Marketplaces Revenue as a Percent of Total Revenue(3) 59%
–
10.0%
20.0%
30.0%
40.0%
50.0%
60.0%
Q1'15 Q2'15 Q3'15 Q4'15 Q1'16 Q2'16 Q3'16
(1) Average Revenue per Transaction is calculated by dividing Marketplaces revenue for a period (not including revenue generated by The Other Art Fair) by the Number of Transactions in that period. (2) Number of Transactions is defined as the total number of successfully completed Marketplaces transactions by Society6 and Saatchi Art during the applicable period. (3) Total Revenue is on a pro forma basis net of Cracked and other non-strategic properties that were disposed of in 2015 and 2016.

Financials
20
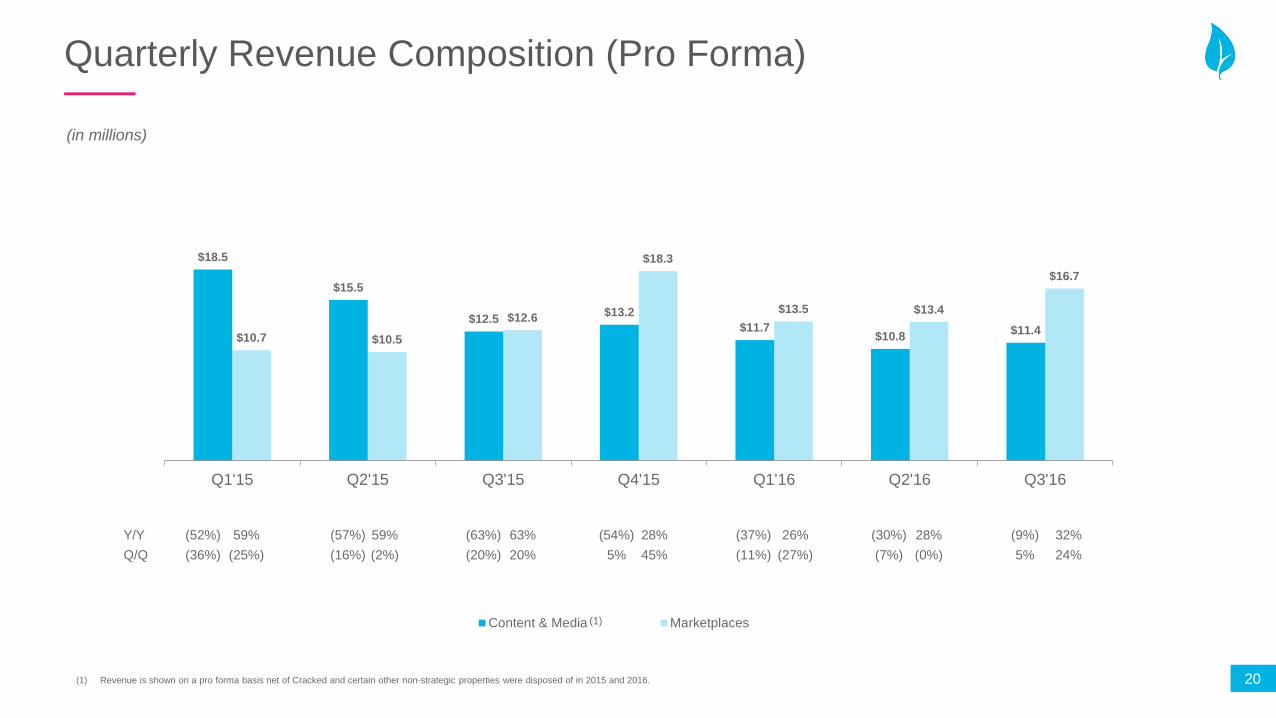
Quarterly Revenue Composition (Pro Forma)
$18.5
$15.5
$12.5 $13.2 $11.7
$10.8 $11.4 $10.7 $10.5
$12.6
$18.3
$13.5 $13.4
$16.7
Q1'15 Q2'15 Q3'15 Q4'15 Q1'16 Q2'16 Q3'16
Content & Media Marketplaces(1)
(in millions)
Y/Y (52%) 59% (57%) 59% (63%) 63% (54%) 28% (37%) 26% (30%) 28% (9%) 32% Q/Q (36%) (25%) (16%) (2%) (20%) 20% 5% 45% (11%) (27%) (7%) (0%) 5% 24%
(1) Revenue is shown on a pro forma basis net of Cracked and certain other non-strategic properties were disposed of in 2015 and 2016.
21
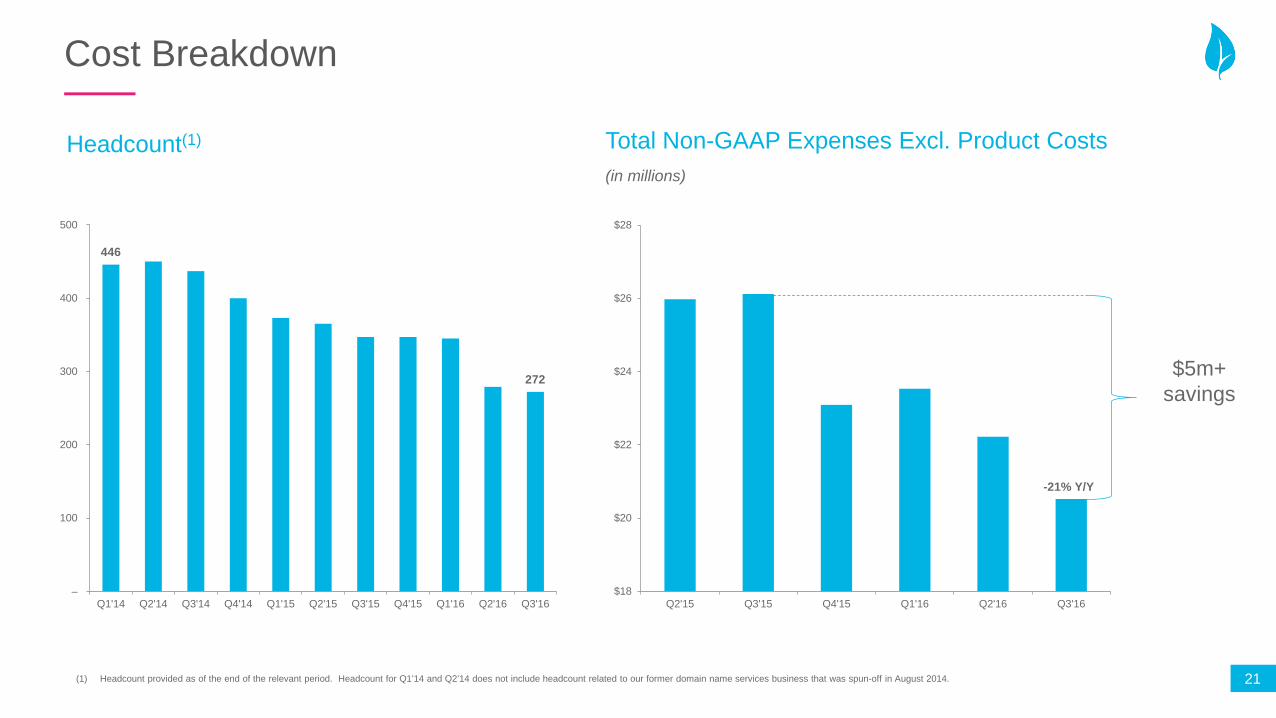
Cost Breakdown
$18
$20
$22
$24
$26
$28
Q2'15 Q3'15 Q4'15 Q1'16 Q2'16 Q3'16
-21% Y/Y
Total Non-GAAP Expenses Excl. Product Costs (in millions)
$5m+ savings
Headcount(1)
446
272
–
100
200
300
400
500
Q1'14 Q2'14 Q3'14 Q4'14 Q1'15 Q2'15 Q3'15 Q4'15 Q1'16 Q2'16 Q3'16
(1) Headcount provided as of the end of the relevant period. Headcount for Q1’14 and Q2’14 does not include headcount related to our former domain name services business that was spun-off in August 2014.
22
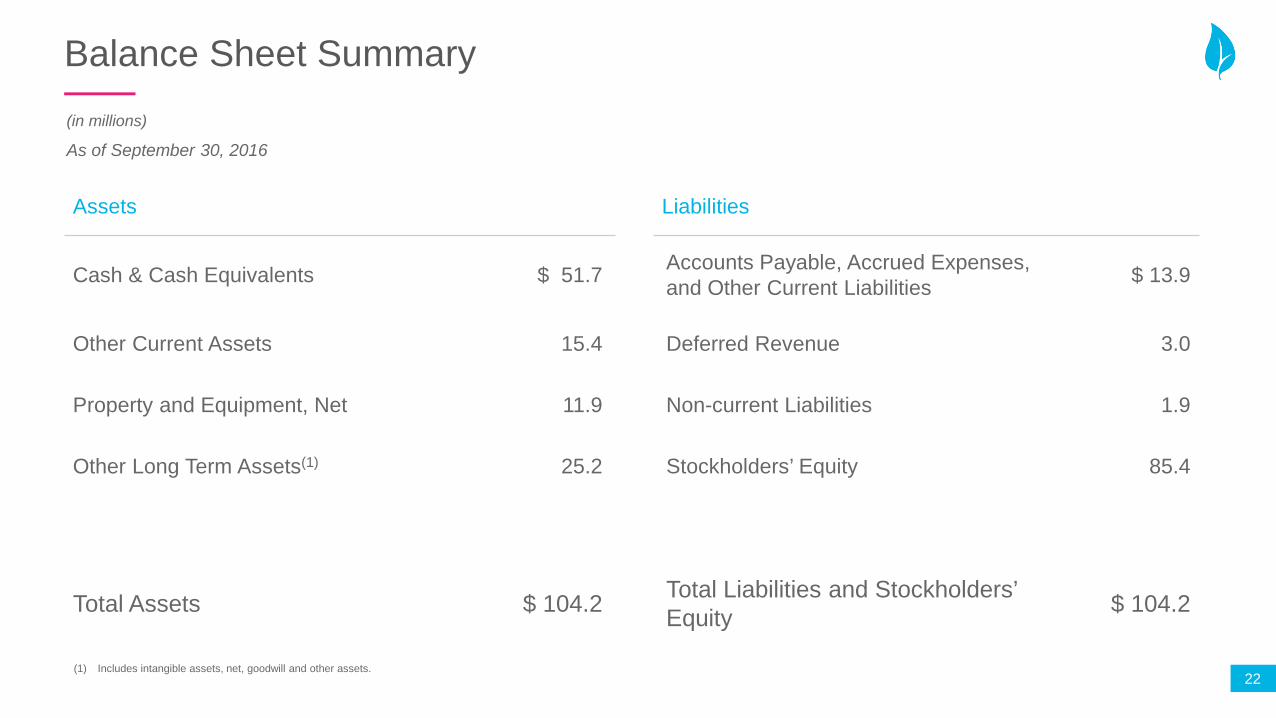
Balance Sheet Summary
Assets Liabilities
Cash & Cash Equivalents $ 51.7 Accounts Payable, Accrued Expenses, and Other Current Liabilities $ 13.9
Other Current Assets 15.4 Deferred Revenue 3.0
Property and Equipment, Net 11.9 Non-current Liabilities 1.9
Other Long Term Assets(1) 25.2 Stockholders’ Equity 85.4
Total Assets $ 104.2 Total Liabilities and Stockholders’ Equity $ 104.2
(in millions)
As of September 30, 2016
(1) Includes intangible assets, net, goodwill and other assets.
23
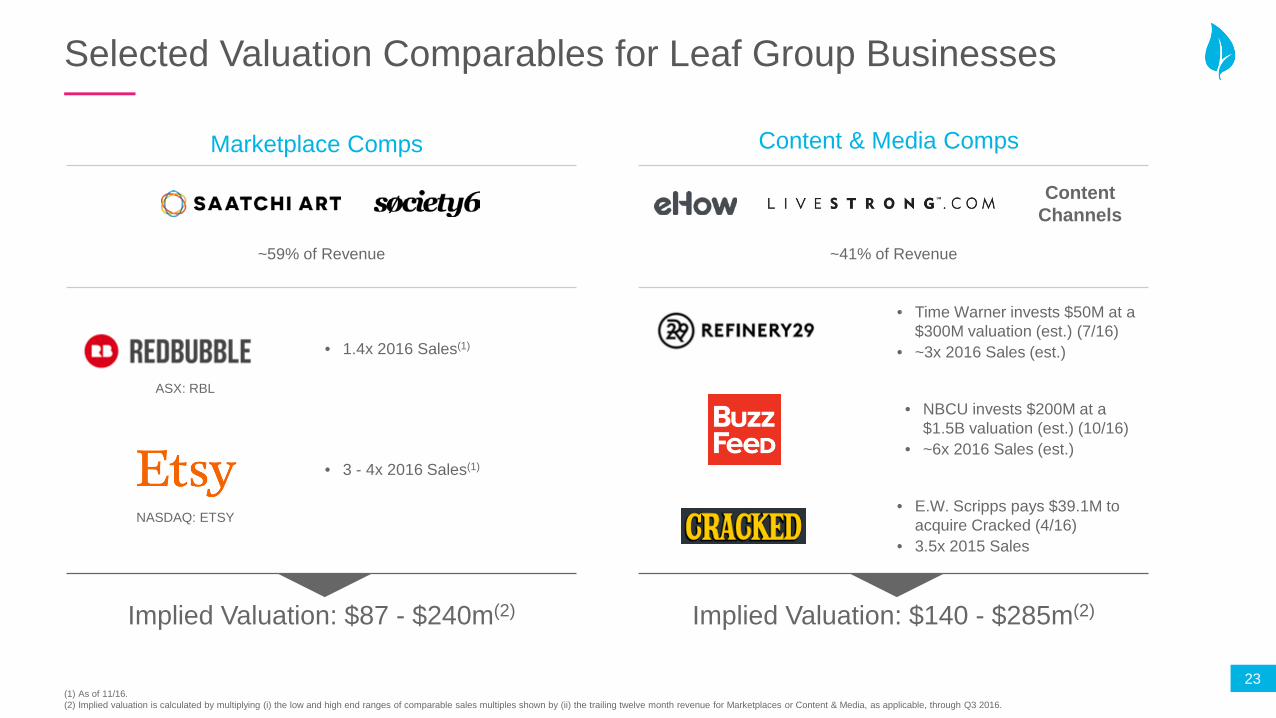
Selected Valuation Comparables for Leaf Group Businesses
Content & Media Comps Marketplace Comps
~59% of Revenue
• 1.4x 2016 Sales(1)
ASX: RBL
NASDAQ: ETSY
• 3 - 4x 2016 Sales(1)
Implied Valuation: $87 - $240m(2)
~41% of Revenue
Implied Valuation: $140 - $285m(2)
Content Channels
• Time Warner invests $50M at a $300M valuation (est.) (7/16)
• ~3x 2016 Sales (est.)
• NBCU invests $200M at a $1.5B valuation (est.) (10/16)
• ~6x 2016 Sales (est.)
• E.W. Scripps pays $39.1M to acquire Cracked (4/16)
• 3.5x 2015 Sales
(1) As of 11/16. (2) Implied valuation is calculated by multiplying (i) the low and high end ranges of comparable sales multiples shown by (ii) the trailing twelve month revenue for Marketplaces or Content & Media, as applicable, through Q3 2016.
24
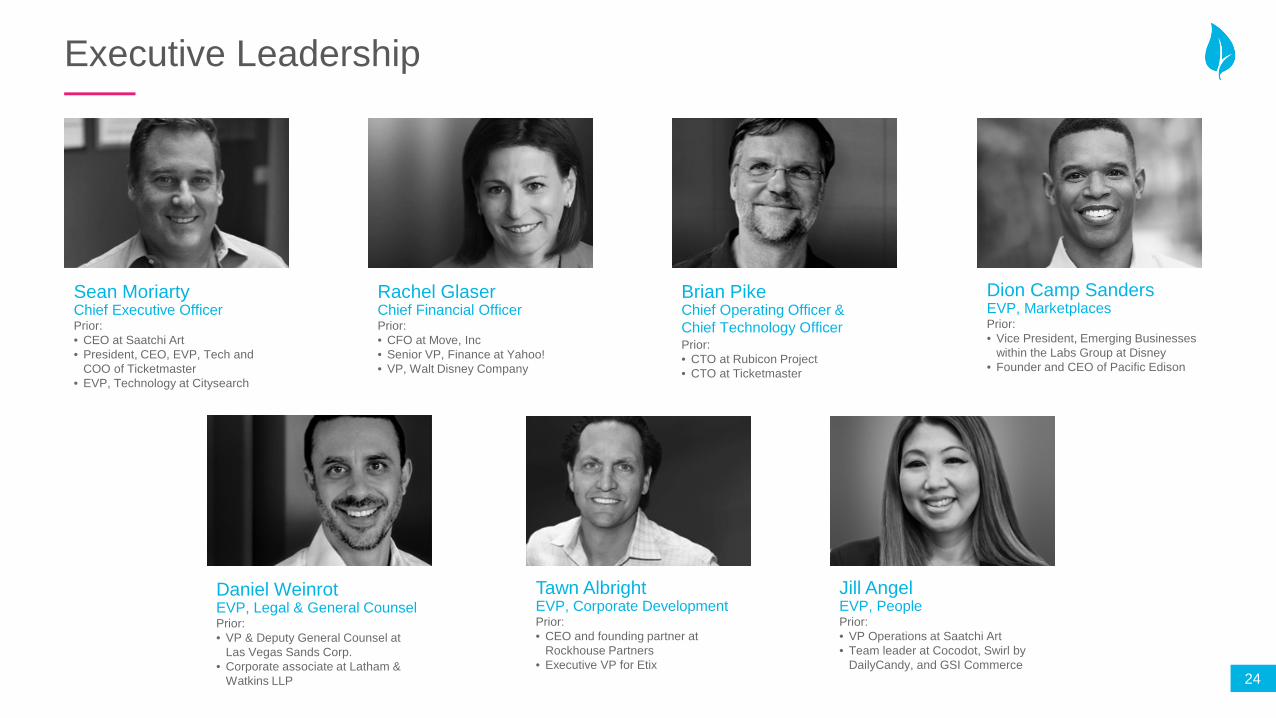
Executive Leadership
Rachel Glaser Chief Financial Officer
Sean Moriarty Chief Executive Officer Prior: • CEO at Saatchi Art • President, CEO, EVP, Tech and
COO of Ticketmaster • EVP, Technology at Citysearch
Brian Pike Chief Operating Officer & Chief Technology Officer
Daniel Weinrot EVP, Legal & General Counsel
Prior: • CFO at Move, Inc • Senior VP, Finance at Yahoo! • VP, Walt Disney Company
Prior: • CTO at Rubicon Project • CTO at Ticketmaster
Prior: • VP & Deputy General Counsel at
Las Vegas Sands Corp. • Corporate associate at Latham &
Watkins LLP
Tawn Albright EVP, Corporate Development Prior: • CEO and founding partner at
Rockhouse Partners • Executive VP for Etix
Jill Angel EVP, People Prior: • VP Operations at Saatchi Art • Team leader at Cocodot, Swirl by
DailyCandy, and GSI Commerce
Dion Camp Sanders EVP, Marketplaces Prior: • Vice President, Emerging Businesses
within the Labs Group at Disney • Founder and CEO of Pacific Edison

25
Investment Thesis
• Strong and experienced management team with significant breadth and depth operating media and marketplace businesses.
• Marketplace business now represents almost 60% of total revenue. Revenue growing ~32% year-over-year, Gross Transaction Value growing 38% year-over-year.
• Transforming Content & Media business with strong well-known brands. Significantly improved products and content. Growing social reach with 6 million combined followers on Facebook and Pinterest(1).
• Reduced operating costs by ~$20 million per year on a run rate basis. Corporate overhead provides significant operating leverage going forward.
• More focused portfolio with sale of Cracked in Q2’16 and divestitures of other non-core properties.
• Sum of the Parts analysis points to significant value dislocation.
• Clean balance sheet with ~$51 million cash and no debt (Q3’16).
(1) Source:, Facebook and Pinterest