Smart Cities Europese beleidsvisie en welke financieringsmogelijkheden?
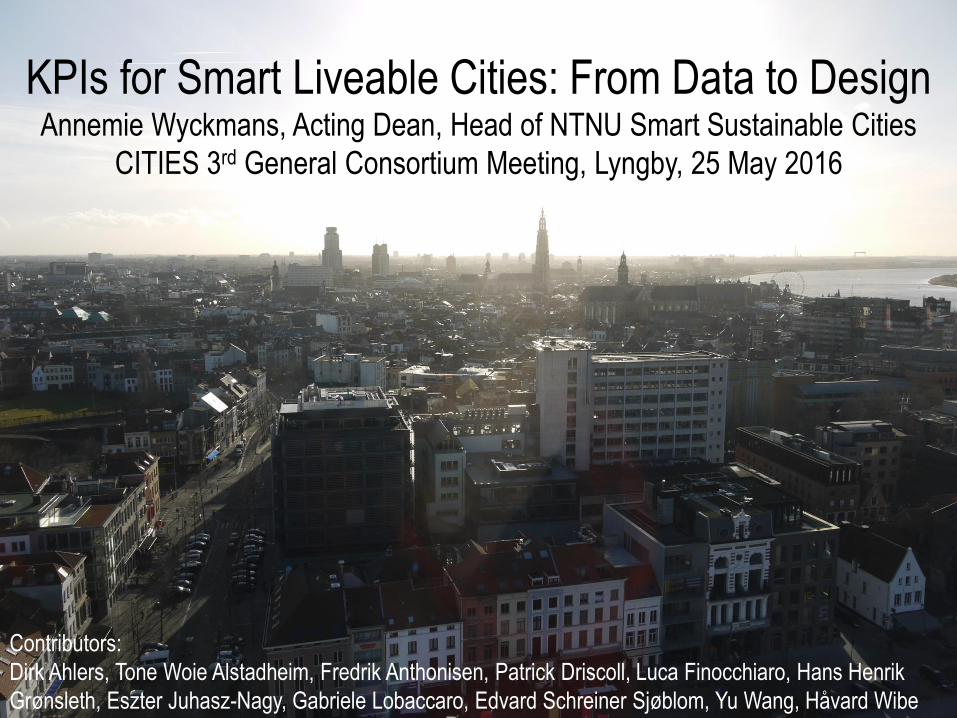
KPIs for Smart Liveable Cities: From Data to DesignAnnemie Wyckmans, Acting Dean, Head of NTNU Smart Sustainable Cities
CITIES 3rd General Consortium Meeting, Lyngby, 25 May 2016
Contributors:
Dirk Ahlers, Tone Woie Alstadheim, Fredrik Anthonisen, Patrick Driscoll, Luca Finocchiaro, Hans Henrik
Grønsleth, Eszter Juhasz-Nagy, Gabriele Lobaccaro, Edvard Schreiner Sjøblom, Yu Wang, Håvard Wibe
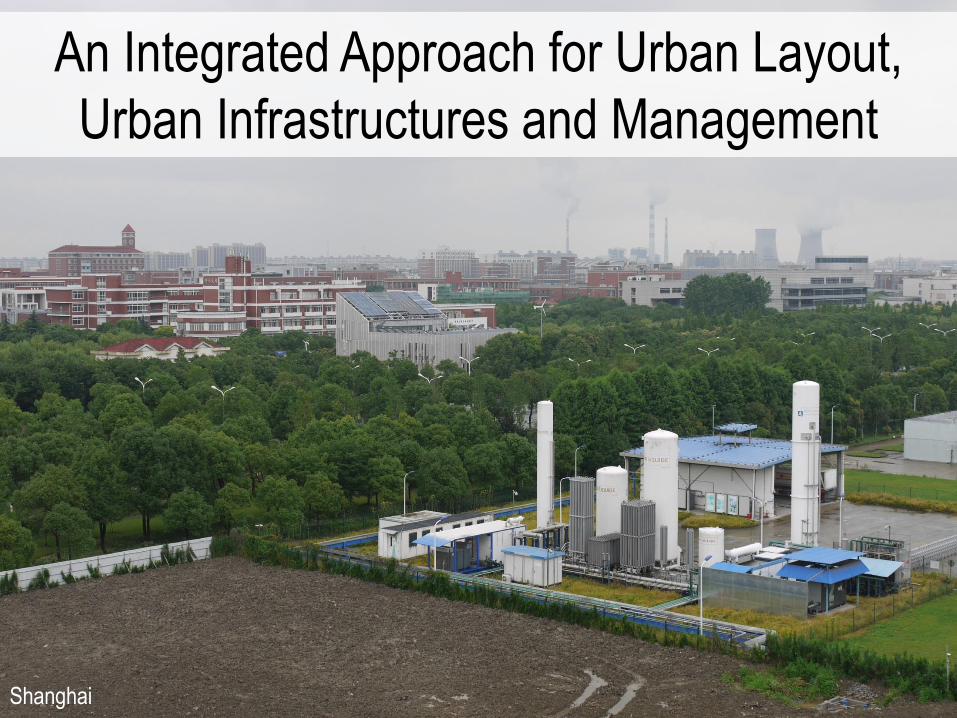
An Integrated Approach for Urban Layout,
Urban Infrastructures and Management
Shanghai
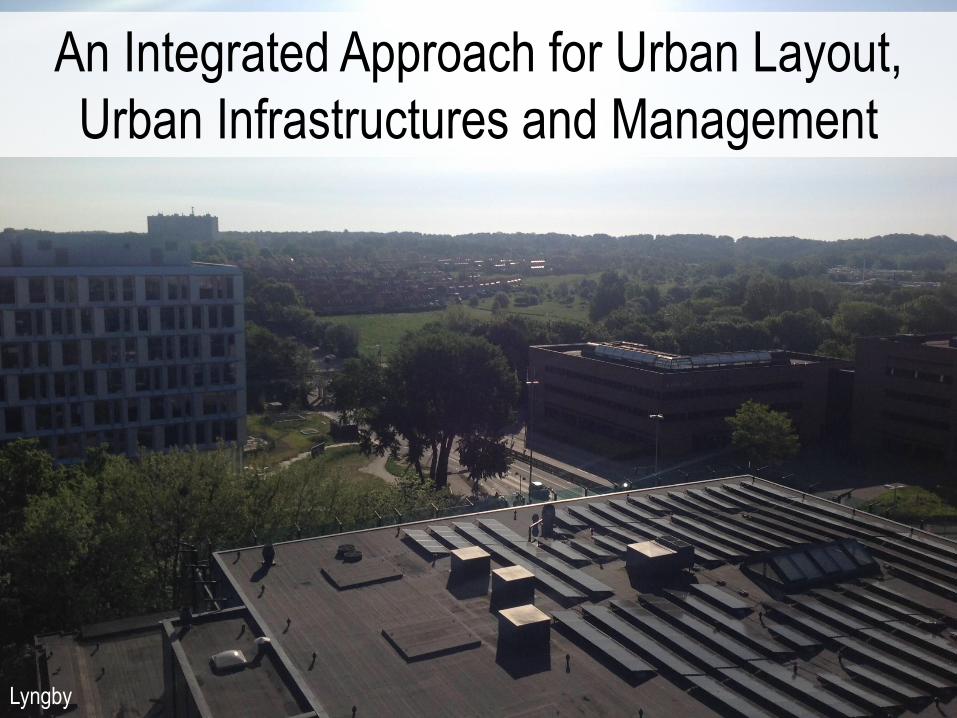
An Integrated Approach for Urban Layout,
Urban Infrastructures and Management
Lyngby
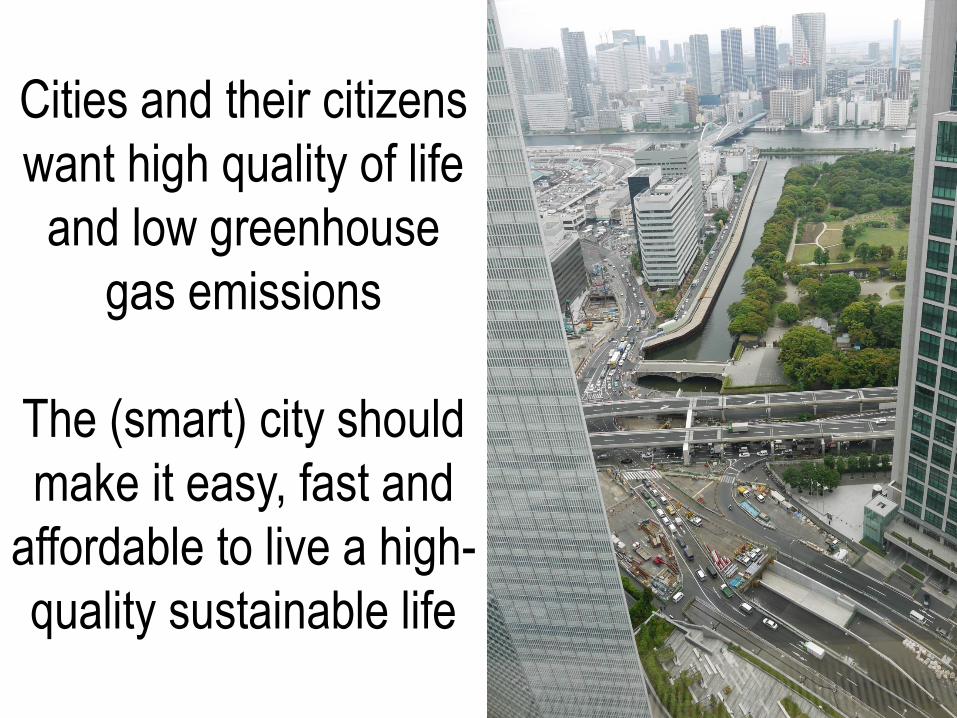
Cities and their citizens
want high quality of life
and low greenhouse
gas emissions
The (smart) city should
make it easy, fast and
affordable to live a high-
quality sustainable life
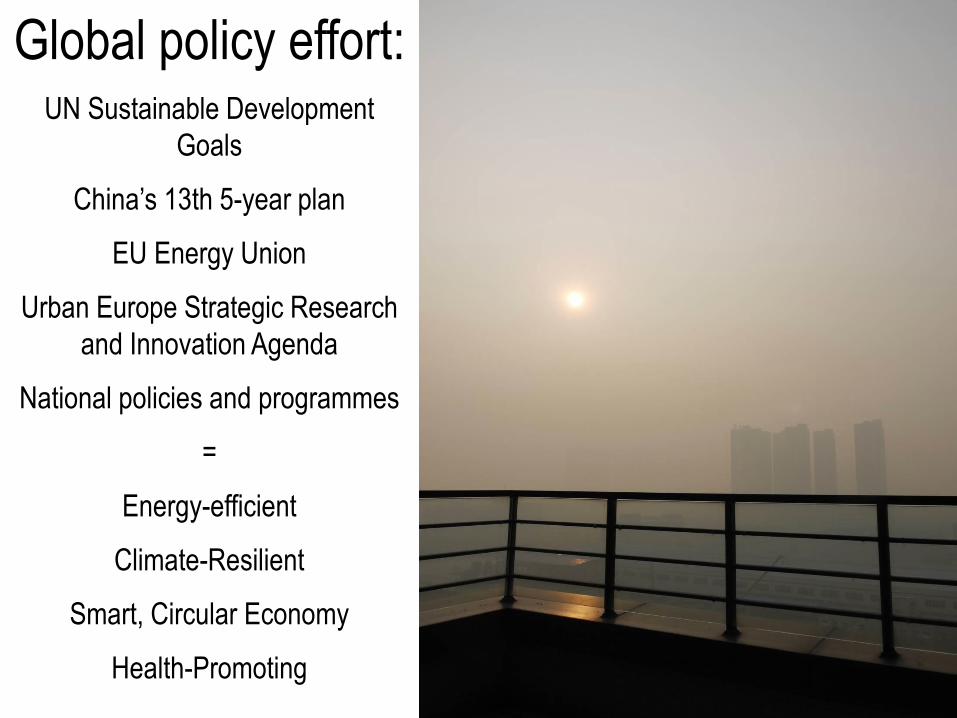
Global policy effort:UN Sustainable Development
Goals
China’s 13th 5-year plan
EU Energy Union
Urban Europe Strategic Research
and Innovation Agenda
National policies and programmes
=
Energy-efficient
Climate-Resilient
Smart, Circular Economy
Health-Promoting
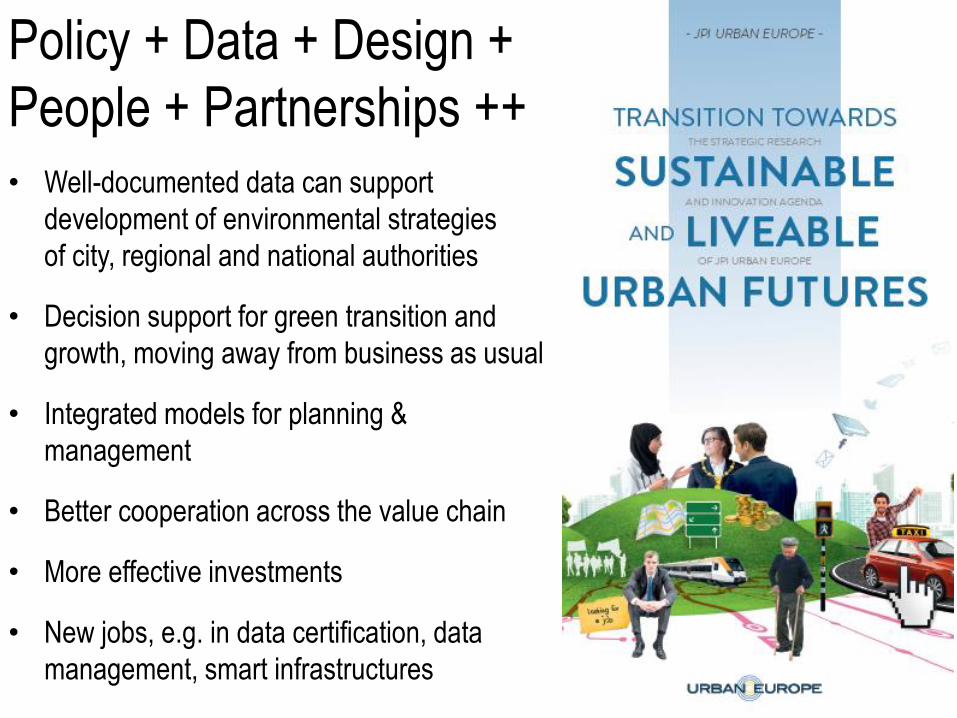
Policy + Data + Design +
People + Partnerships ++
• Well-documented data can support
development of environmental strategies
of city, regional and national authorities
• Decision support for green transition and
growth, moving away from business as usual
• Integrated models for planning &
management
• Better cooperation across the value chain
• More effective investments
• New jobs, e.g. in data certification, data
management, smart infrastructures
Project Example: The Research Centre on
Zero Emission Buildings / Zero Emission
Neighbourhoods in Smart Cities (Application)
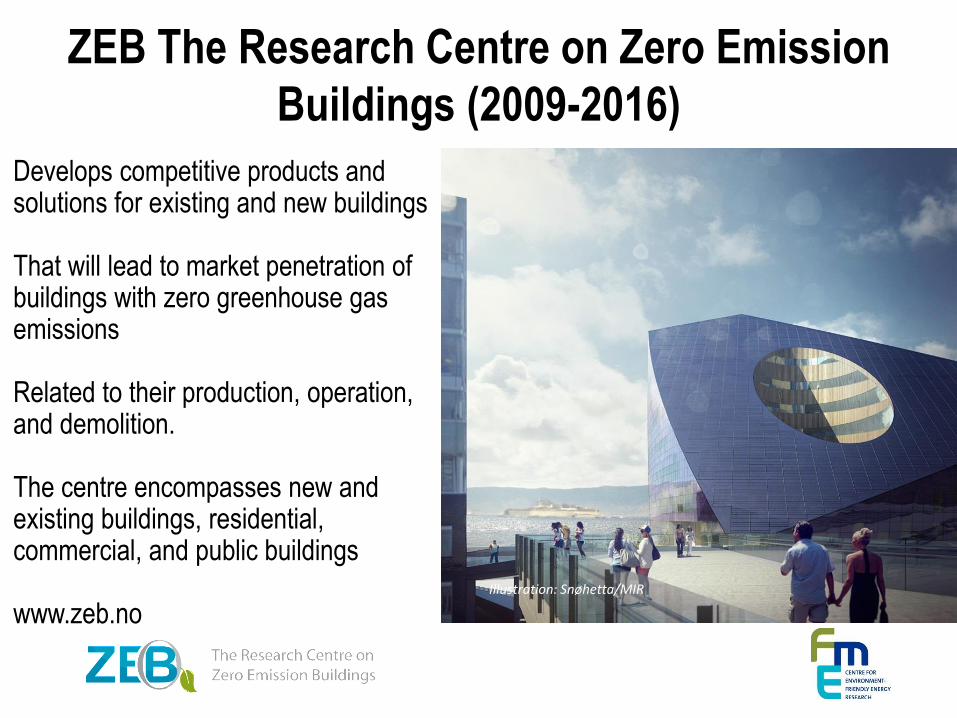
Develops competitive products and solutions for existing and new buildings
That will lead to market penetration of buildings with zero greenhouse gas emissions
Related to their production, operation, and demolition.
The centre encompasses new and existing buildings, residential, commercial, and public buildings
www.zeb.noIllustration: Snøhetta/MIR
ZEB The Research Centre on Zero Emission
Buildings (2009-2016)
ZEB The Research Centre on Zero Emission
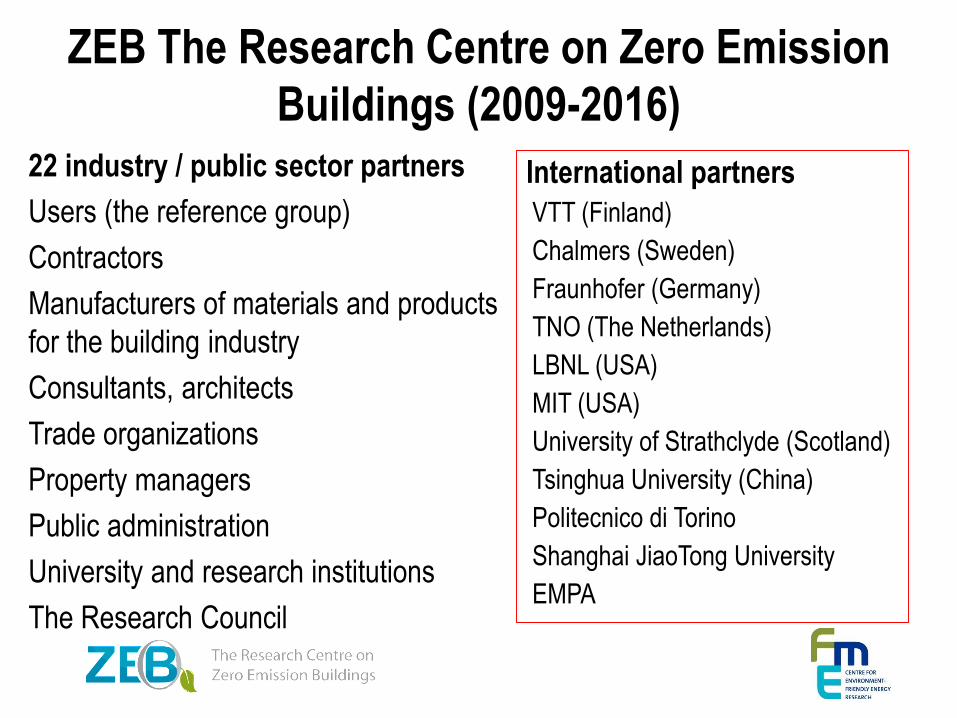
Buildings (2009-2016)22 industry / public sector partners
Users (the reference group)
Contractors
Manufacturers of materials and products
for the building industry
Consultants, architects
Trade organizations
Property managers
Public administration
University and research institutions
The Research Council
International partners
VTT (Finland)
Chalmers (Sweden)
Fraunhofer (Germany)
TNO (The Netherlands)
LBNL (USA)
MIT (USA)
University of Strathclyde (Scotland)
Tsinghua University (China)
Politecnico di Torino
Shanghai JiaoTong University
EMPA
ZEB The Research Centre on Zero Emission
Buildings (2009-2016)
A world where buildings do not contribute with
greenhouse gas emissions
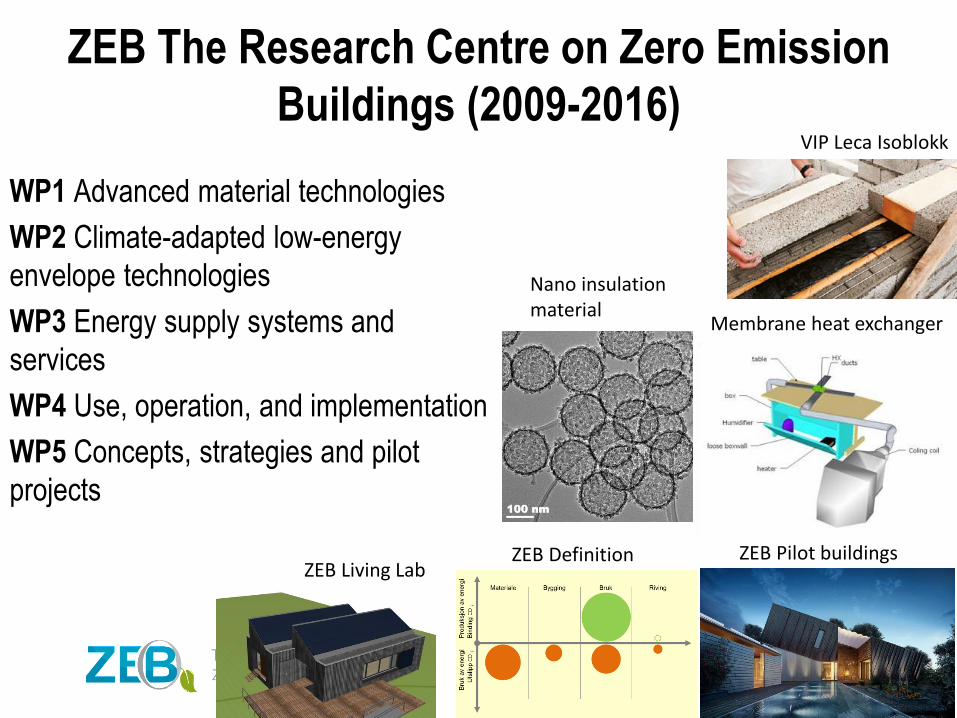
Nano insulation material
VIP Leca Isoblokk
Membrane heat exchanger
ZEB Living LabZEB Definition ZEB Pilot buildings
WP1 Advanced material technologies
WP2 Climate-adapted low-energy
envelope technologies
WP3 Energy supply systems and
services
WP4 Use, operation, and implementation
WP5 Concepts, strategies and pilot
projects
12 ZEN – The Research Centre on Zero Emission Neighbourhoods in Smart Cities
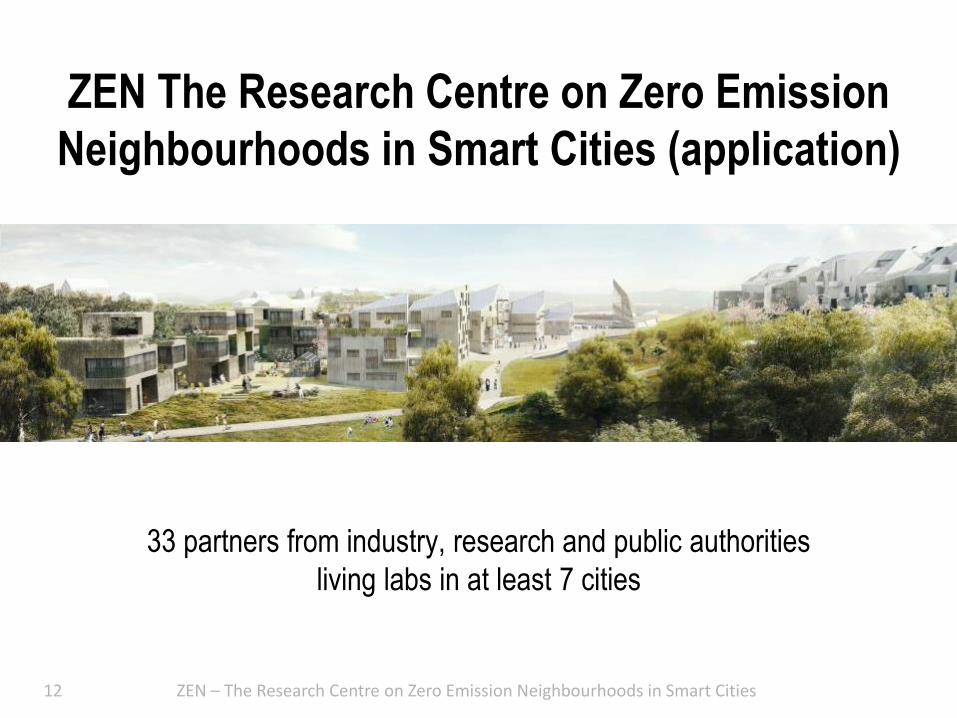
ZEN The Research Centre on Zero Emission
Neighbourhoods in Smart Cities (application)
33 partners from industry, research and public authorities
living labs in at least 7 cities
13 ZEN – The Research Centre on Zero Emission Neighbourhoods in Smart Cities
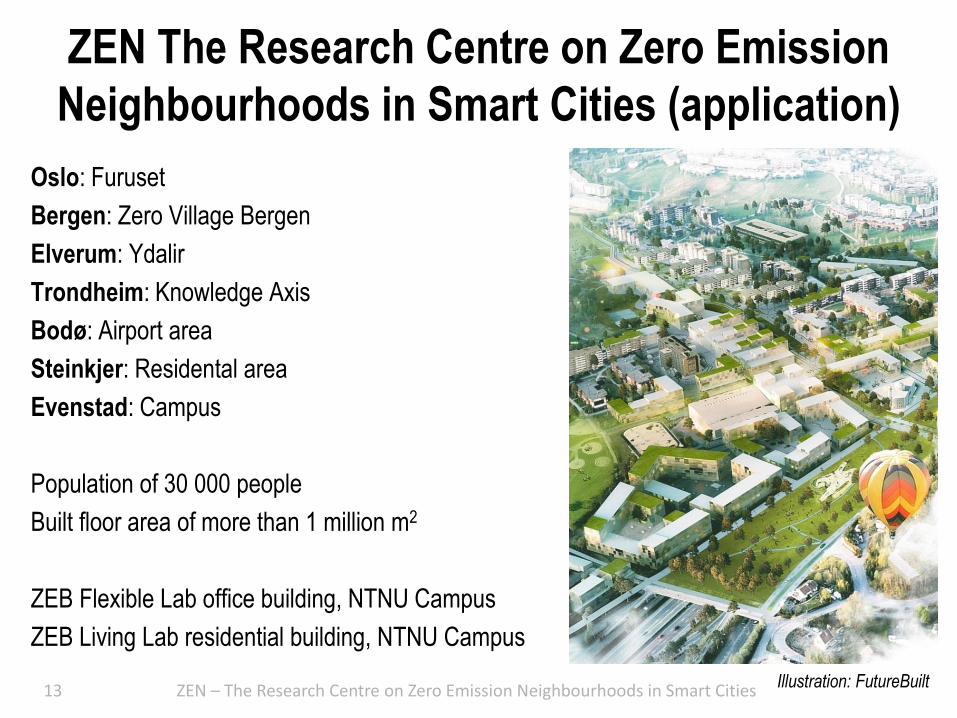
ZEN The Research Centre on Zero Emission
Neighbourhoods in Smart Cities (application)
Oslo: Furuset
Bergen: Zero Village Bergen
Elverum: Ydalir
Trondheim: Knowledge Axis
Bodø: Airport area
Steinkjer: Residental area
Evenstad: Campus
Population of 30 000 people
Built floor area of more than 1 million m2
ZEB Flexible Lab office building, NTNU Campus
ZEB Living Lab residential building, NTNU Campus
Illustration: FutureBuilt
Project Example: Knowledge Axis / Carbon
Track and Trace
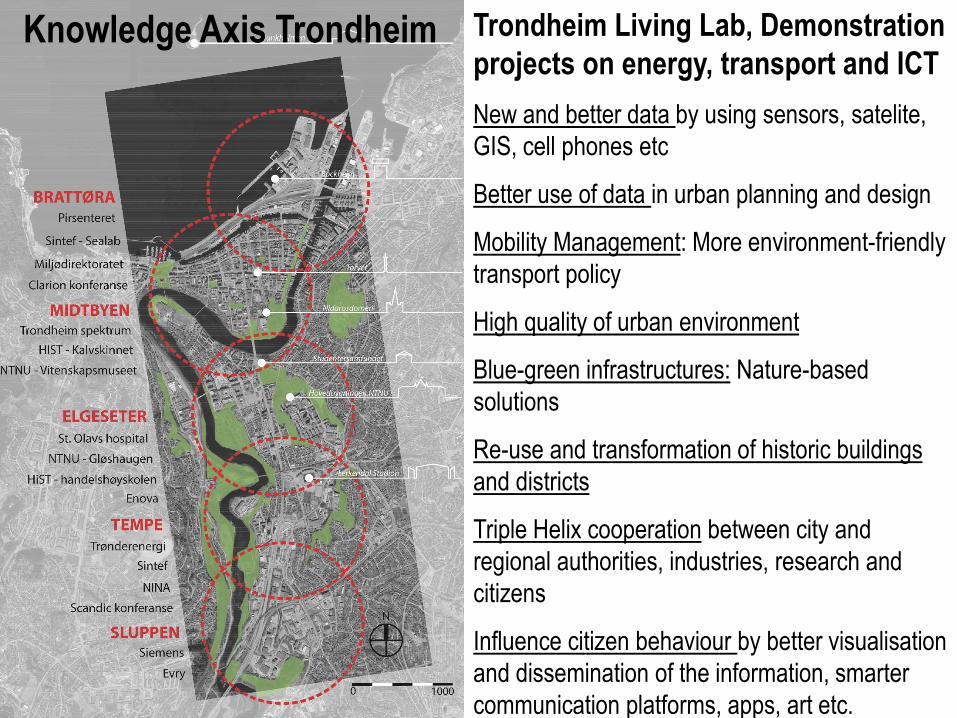
Knowledge Axis Trondheim Trondheim Living Lab, Demonstration
projects on energy, transport and ICT
New and better data by using sensors, satelite,
GIS, cell phones etc
Better use of data in urban planning and design
Mobility Management: More environment-friendly
transport policy
High quality of urban environment
Blue-green infrastructures: Nature-based
solutions
Re-use and transformation of historic buildings
and districts
Triple Helix cooperation between city and
regional authorities, industries, research and
citizens
Influence citizen behaviour by better visualisation
and dissemination of the information, smarter
communication platforms, apps, art etc.
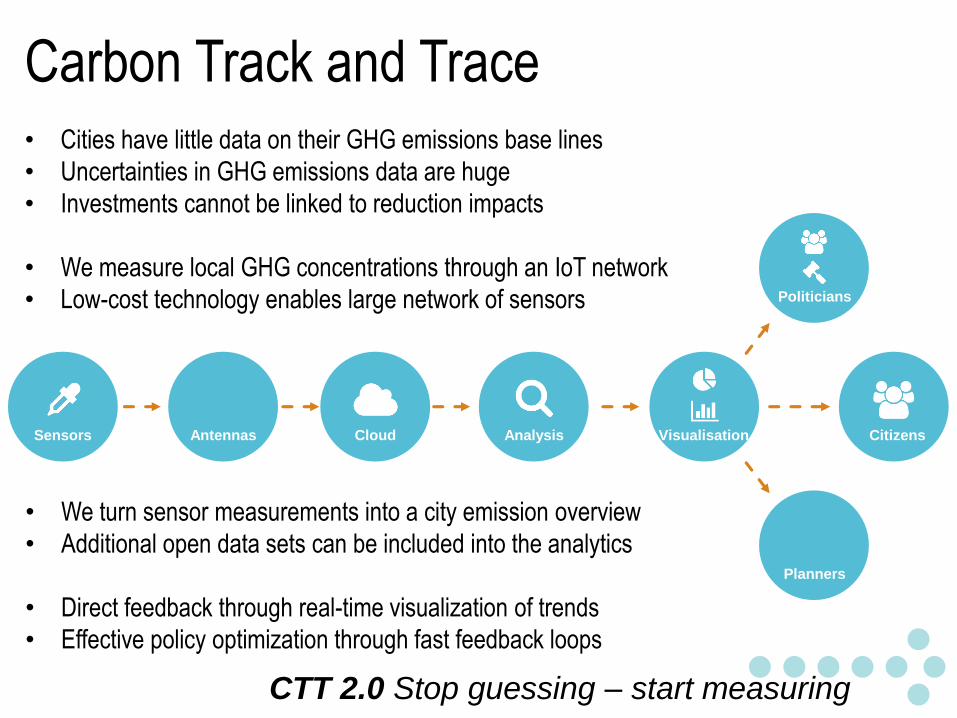
Citizens
Politicians
Planners
VisualisationAnalysisCloudAntennasSensors
Carbon Track and Trace
CTT 2.0 Stop guessing – start measuring
• Cities have little data on their GHG emissions base lines
• Uncertainties in GHG emissions data are huge
• Investments cannot be linked to reduction impacts
• We measure local GHG concentrations through an IoT network
• Low-cost technology enables large network of sensors
• We turn sensor measurements into a city emission overview
• Additional open data sets can be included into the analytics
• Direct feedback through real-time visualization of trends
• Effective policy optimization through fast feedback loops
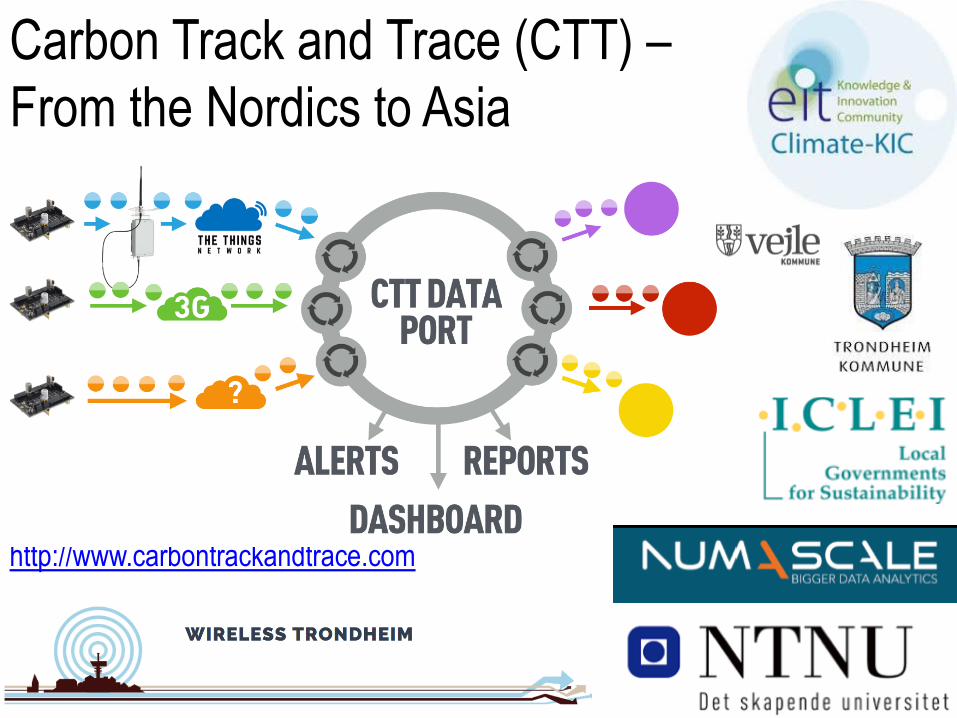
Carbon Track and Trace (CTT) –
From the Nordics to Asia
http://www.carbontrackandtrace.com
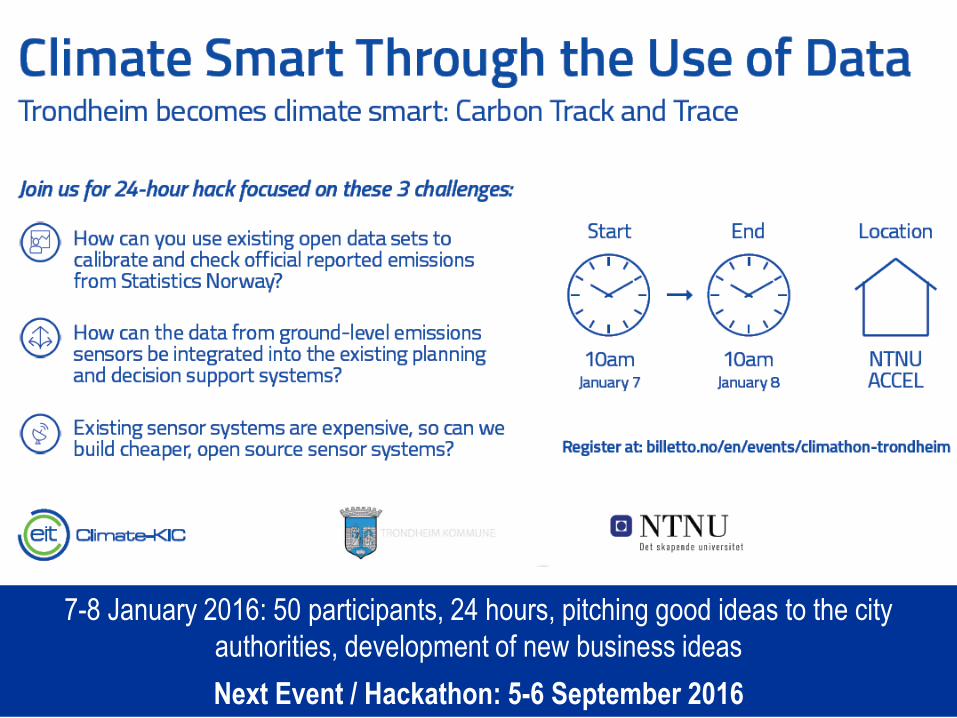
7-8 January 2016: 50 participants, 24 hours, pitching good ideas to the city
authorities, development of new business ideas
Next Event / Hackathon: 5-6 September 2016
Project Example: RAMSES Climate Change
Adaptation, Mitigation and Sustainable
Development of Cities
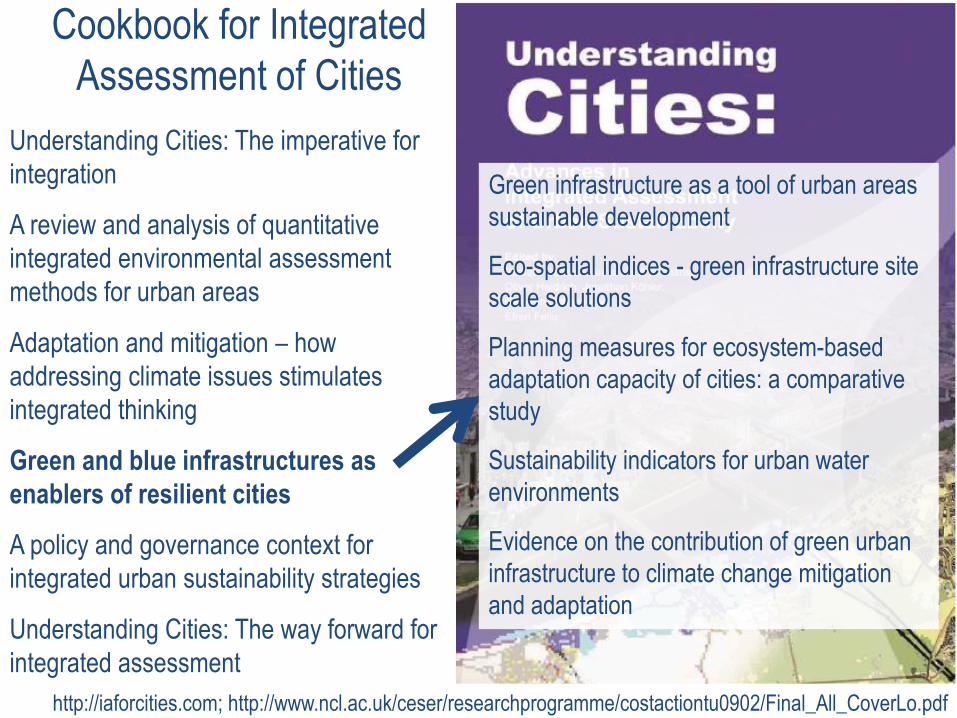
Cookbook for Integrated
Assessment of Cities
http://iaforcities.com; http://www.ncl.ac.uk/ceser/researchprogramme/costactiontu0902/Final_All_CoverLo.pdf
Understanding Cities: The imperative for
integration
A review and analysis of quantitative
integrated environmental assessment
methods for urban areas
Adaptation and mitigation – how
addressing climate issues stimulates
integrated thinking
Green and blue infrastructures as
enablers of resilient cities
A policy and governance context for
integrated urban sustainability strategies
Understanding Cities: The way forward for
integrated assessment
Green infrastructure as a tool of urban areas
sustainable development
Eco-spatial indices - green infrastructure site
scale solutions
Planning measures for ecosystem-based
adaptation capacity of cities: a comparative
study
Sustainability indicators for urban water
environments
Evidence on the contribution of green urban
infrastructure to climate change mitigation
and adaptation
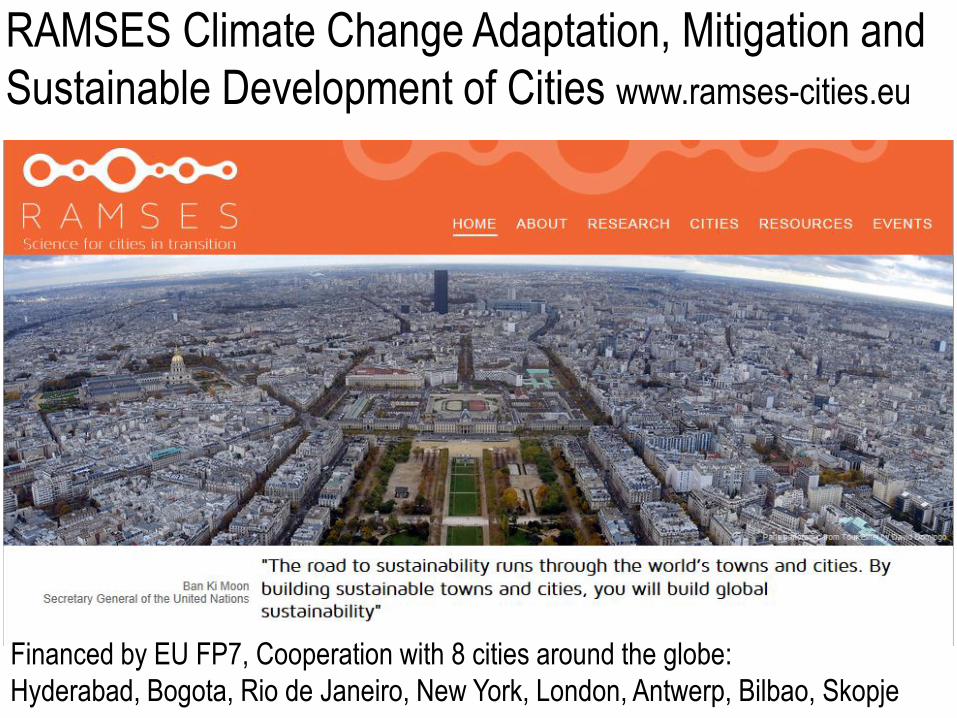
Financed by EU FP7, Cooperation with 8 cities around the globe:
Hyderabad, Bogota, Rio de Janeiro, New York, London, Antwerp, Bilbao, Skopje
RAMSES Climate Change Adaptation, Mitigation and
Sustainable Development of Cities www.ramses-cities.eu
23
Annemie Wyckmans, 24.oktober 2013, Inneklimadagen Oslo
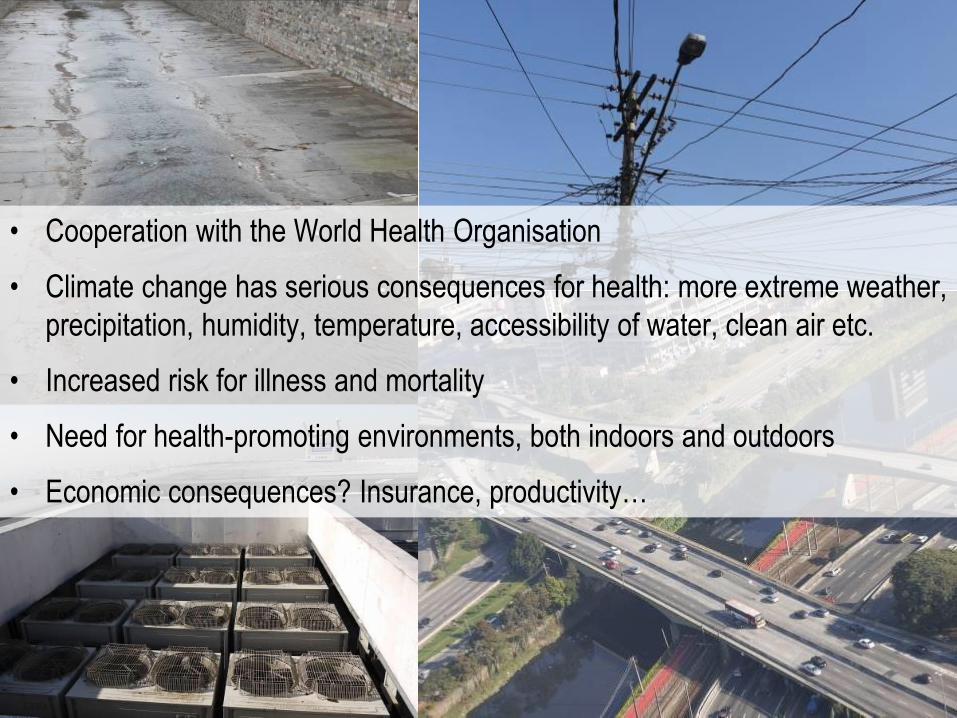
• Cooperation with the World Health Organisation
• Climate change has serious consequences for health: more extreme weather,
precipitation, humidity, temperature, accessibility of water, clean air etc.
• Increased risk for illness and mortality
• Need for health-promoting environments, both indoors and outdoors
• Economic consequences? Insurance, productivity…
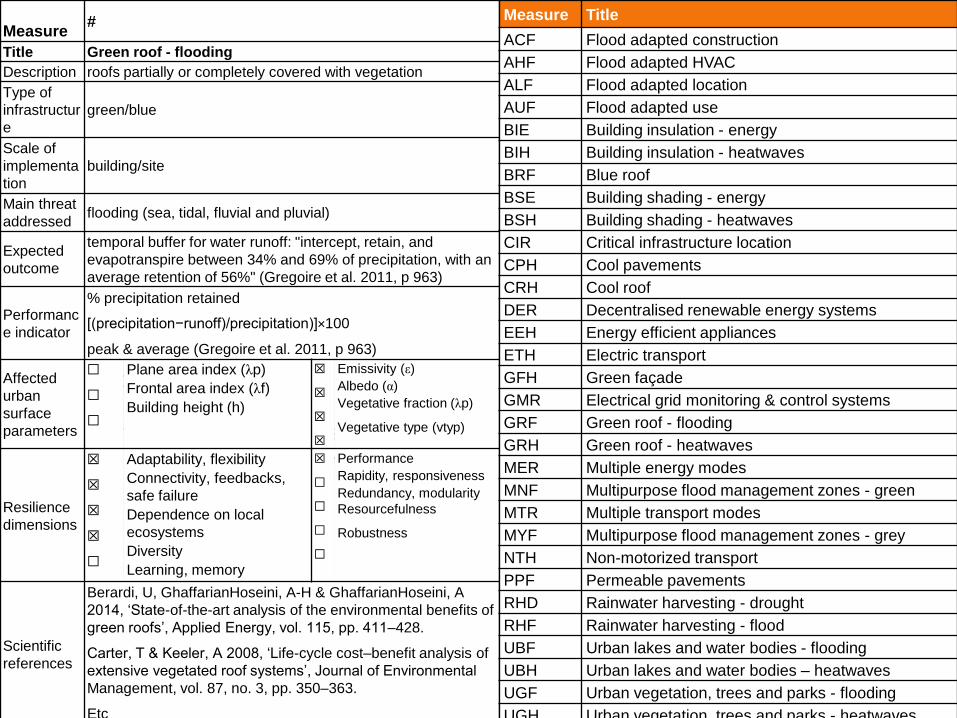
D2.4
Reconciling Adaptation, Mitigation and Sustainable Development for Cities
D2.4 Adaptation measures and
corresponding indicators for
resilient architecture, infrastructure,
and urban environments
Draft for internal review submitted
5 February 2015
Input for selecting measures for
cost assessment, modelling
scenarios and health WP4 / WP5
/ WP6
Measure#
Title Green roof - flooding
Description roofs partially or completely covered with vegetation
Type of
infrastructur
e
green/blue
Scale of
implementa
tion
building/site
Main threat
addressedflooding (sea, tidal, fluvial and pluvial)
Expected
outcome
temporal buffer for water runoff: "intercept, retain, and
evapotranspire between 34% and 69% of precipitation, with an
average retention of 56%" (Gregoire et al. 2011, p 963)
Performanc
e indicator
% precipitation retained
[(precipitation−runoff)/precipitation)]×100
peak & average (Gregoire et al. 2011, p 963)
Affected
urban
surface
parameters
☐
☐
☐
Plane area index (λp)
Frontal area index (λf)
Building height (h)
☒
☒
☒
☒
Emissivity (ε)
Albedo (α)
Vegetative fraction (λp)
Vegetative type (vtyp)
Resilience
dimensions
☒
☒
☒
☒
☐
Adaptability, flexibility
Connectivity, feedbacks,
safe failure
Dependence on local
ecosystems
Diversity
Learning, memory
☒
☐
☐
☐
☐
Performance
Rapidity, responsiveness
Redundancy, modularity
Resourcefulness
Robustness
Scientific
references
Berardi, U, GhaffarianHoseini, A-H & GhaffarianHoseini, A
2014, ‘State-of-the-art analysis of the environmental benefits of
green roofs’, Applied Energy, vol. 115, pp. 411–428.
Carter, T & Keeler, A 2008, ‘Life-cycle cost–benefit analysis of
extensive vegetated roof systems’, Journal of Environmental
Management, vol. 87, no. 3, pp. 350–363.
Etc
Measure Title
ACF Flood adapted construction
AHF Flood adapted HVAC
ALF Flood adapted location
AUF Flood adapted use
BIE Building insulation - energy
BIH Building insulation - heatwaves
BRF Blue roof
BSE Building shading - energy
BSH Building shading - heatwaves
CIR Critical infrastructure location
CPH Cool pavements
CRH Cool roof
DER Decentralised renewable energy systems
EEH Energy efficient appliances
ETH Electric transport
GFH Green façade
GMR Electrical grid monitoring & control systems
GRF Green roof - flooding
GRH Green roof - heatwaves
MER Multiple energy modes
MNF Multipurpose flood management zones - green
MTR Multiple transport modes
MYF Multipurpose flood management zones - grey
NTH Non-motorized transport
PPF Permeable pavements
RHD Rainwater harvesting - drought
RHF Rainwater harvesting - flood
UBF Urban lakes and water bodies - flooding
UBH Urban lakes and water bodies – heatwaves
UGF Urban vegetation, trees and parks - flooding
UGH Urban vegetation, trees and parks - heatwaves
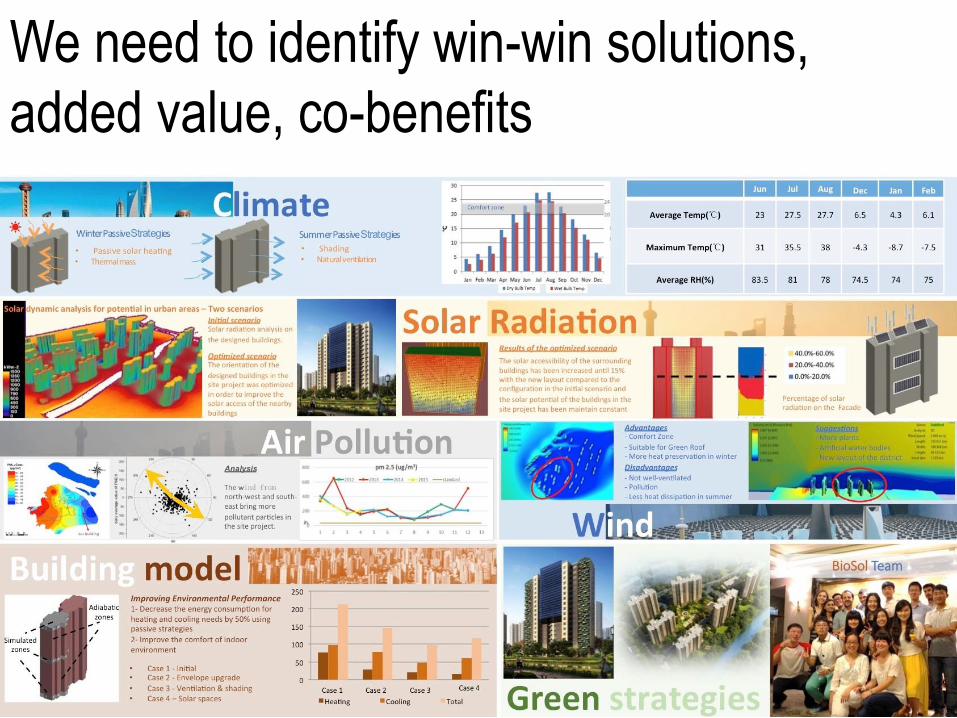
We need to identify win-win solutions,
added value, co-benefits
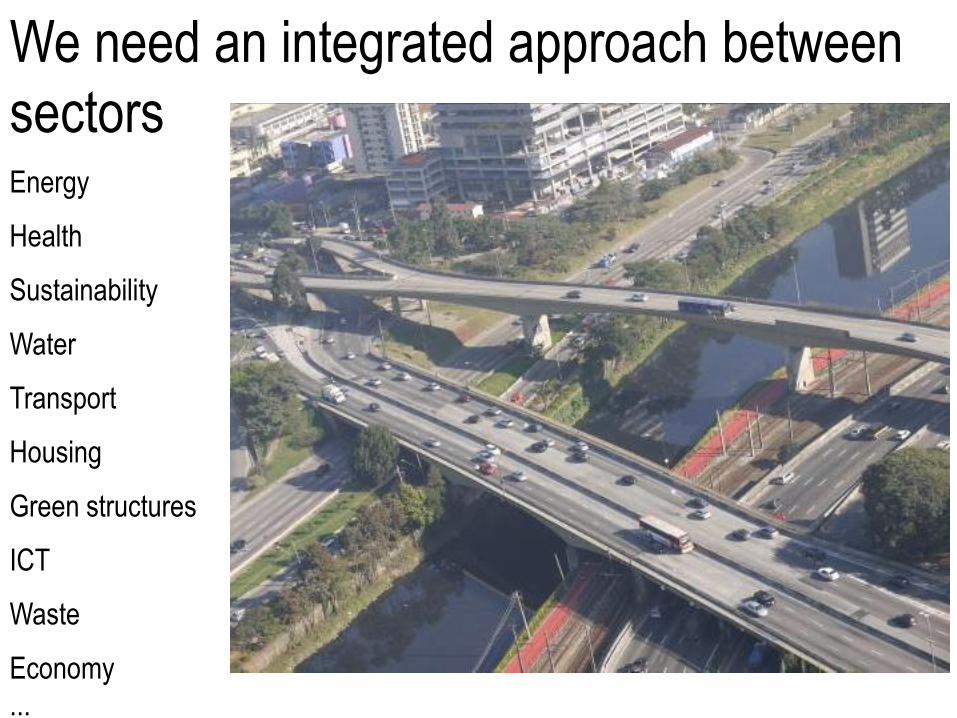
We need an integrated approach between
sectorsEnergy
Health
Sustainability
Water
Transport
Housing
Green structures
ICT
Waste
Economy
...

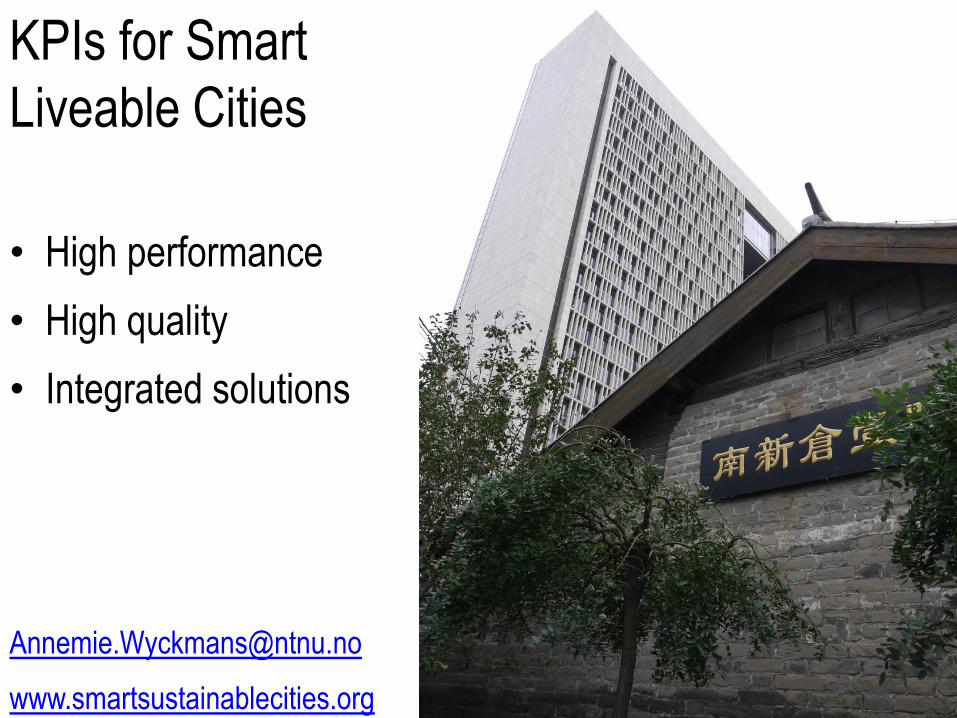
KPIs for Smart
Liveable Cities
• High performance
• High quality
• Integrated solutions
www.smartsustainablecities.org
EERA Conference,
Birmingham, 24-25 November 2016Session on Energy Systems
• System real-time monitoring and data management
• Smart Zero Emission Cities, from Data to Design
• System enhanced flexibility as a key factor to
Renewables integration
• Energy Efficiency in food and drink manufacturing
• Energy Systems: An integrated effort by industry, public
sector and research