
III Workshop on Microwave Reflectometry for Fusion Plasma ...
177
IVIIIIHIIII ES9700322 Centro de Investigaciones Energéticas, Medioambientales y Tecnolôgicas Miner III Workshop on Microwave Reflectometry for Fusion Plasma Diagnostics J. Sanchez E. de la Luna 2 9 - 0 1 Informes Técniçpq Ciemat 838 Noviembrel997
Transcript of III Workshop on Microwave Reflectometry for Fusion Plasma ...
IVIIIIHIIIIES9700322
Centro deInvestigaciones Energéticas,Medioambientalesy Tecnolôgicas
Miner
III Workshop on MicrowaveReflectometry for Fusion PlasmaDiagnostics
J. SanchezE. de la Luna
2 9 - 0 1Informes Técniçpq Ciemat 838
Noviembrel997
Informes Técnicos Ciemat 838Noviembrel997
III Workshop on Micro waveReflectometry for Fusion PlasmaDiagnostics
J. SanchezE. de la Luna
Asociaciôn EURATOM/CIEMAT para Fusion - 45
Departamento de Fusion y Particulas Elementales
Toda correspondencia en relación con este trabajo debe dirigirse al Servicio deInformación y Documentación, Centro de Investigaciones Energéticas, Medioambientales yTecnológicas, Ciudad Universitaria, 28040-MADRID, ESPAÑA.
Las solicitudes de ejemplares deben dirigirse a este mismo Servicio.
Los descriptores se han seleccionado del Thesauro del DOE para describir lasmaterias que contiene este informe con vistas a su recuperación. La catalogación se ha hechoutilizando el documento DOE/TIC-4602 (Rev. 1) Descriptive Cataloguing On-Line, y laclasificación de acuerdo con el documento DOE/TIC.4584-R7 Subject Categories and Scopepublicados por el Office of Scientific and Technical Information del Departamento de Energíade los Estados Unidos.
Se autoriza la reproducción de los resúmenes analíticos que aparecen en estapublicación.
Depósito Legal: M-14226-1995ÑIPO: 238-97-001-5ISSN: 1135-9420
Editorial CIEMAT
CLASIFICACIÔN DOE Y DESCRIPTORES
700320PLASMA DIAGNOSTICS; PLASMA MICROINSTABILITIES; PLASMA DENSITY; ELEC-TRON DENSITY; FLUCTUATIONS; PROCEEDINGS
"Proceedings of the III Workshop on Microwave Reflectometry for Fusion Plasmas"CIEMAT, Madrid (Spain) May 5-7 1997
Organised in collaboration with IAEASanchez, J.; Luna, E. de la179 pp. 143 figs. 145 refs.
Abstract:
Microwave reflectometry is based on the analysis of the properties (phase delay, time delay,amplitude) of a millimeter wave beam which is launched and reflected at the plasma critical layer.Operation with a fixed frequency beam can be used to analyze the electron density fluctuations inthe reflecting region. If several frequencies are launched, information about the density profile canbe obtained.
In these proceedings, a collection of papers is presented on the issues of density fluctuationstudies and profile analysis as well as a special contribution about the development of reflectometryfor the ITER project.
"Ponencias presentadas en el III Workshop on Microwave Reflectometryfor Fusion Plasmas"
CIEMAT, Madrid (Espana) 5-7, Mayo 1997Organizado en colaboraciôn con la IAEA
Sanchez, J.; Luna, E. de la179 pp. 143 figs. 145 refs.
Resumen:
La técnica de Reflectometria de Microondas se basa en el anâlisis de las propiedades(fase, tiempo de retardo y amplitud) de un haz de onda milimétrica que se envia y es reflejado enla capa critica del plasma. Si se opera a frecuencia fija se obtiene informaciôn sobre las fluctua-ciones de densidad electrônica en la zona de reflexion, mientras que si se envian varias frecuen-cias se obtiene informaciôn sobre el perfil de densidad electrônica.
En este informe se présenta una colecciôn de trabajos sobre la medida de fluctuaciones dedensidad y perfiles de densidad. Asimismo se incluye un apartado sobre el desarrollo de la técni-ca para el proyecto ITER.

Participants List:
CanadaG. Conway, University of Saskatchewane-mail : [email protected]
D. Pinsonneault Centre Canadien de Fusion Magnétique,Varennes, Quebece-mail: [email protected]
FranceF. Clairet, Association EURATOM-CEA, Cadarachee-mail: [email protected]
C. Laviron, Association EURATOM-CEA, Cadarachee-mail: [email protected]
G. Leclert, LPMI, Univ. Henri Poincare Nancy Ie-mail [email protected]
P. Moreau, Association EURATOM-CEA, Cadarachee-mail: [email protected]
GermanyM. Hirsch, Max-Planck-Institut fur Plasmaphysik, Garchinge-mail: [email protected]
D. Wagner, Institut fuer Plasmaforschung, Universitaet Stuttgarte-mail: [email protected]
JapanA. Mase, Plasma Research Center, University of Tsukubae-mail: [email protected]
PortugalL. Cupido, Centro de Fusao Nuclear, Instituto Superior Technico, [email protected]
M. E. Manso, Centro de Fusao Nuclear, Instituto Superior Technico, Lisbone-mail: [email protected]
J. Santos, Centro de Fusao Nuclear, Instituto Superior Technico, Lisbone-mail: [email protected]
F. Serra, Centro de Fusao Nuclear, Institulo Superior Technico, Lisbone-mail: [email protected]
A. Silva, Centro de Fusao Nuclear, Instituto Superior Technico, Lisbone-mail: [email protected]
P. Varela, Centro de Fusao Nuclear, Instituto Superior Technico, Lisbone-mail: [email protected]

SpainB. Branas, Asociacion EURATOM-CffiMAT, Madride-mail : lasala @ ciemat.es
T. Estrada, Asociacion EURATOM-CIEMAT, Madride-mail: [email protected]
C. Hidalgo, Asociacion EURATOM-CIEMAT, Madride-mail: [email protected]
E. de la Luna Asociacion EURATOM-CffiMAT, Madride-mail: [email protected]
J. Sanchez, Asociacion EURATOM-CffiMAT, Madride-mail: [email protected]
The NetherlandsA. J. H. Donne, FOM-Instituut voor Plasmafysica, Rijnhuizen, Nieuwegeine-mail: [email protected]
A. Hugenholtz, FOM Instituut voor Plasmafysica, Rijnhuizen, Nieuwegeine-mail: [email protected]
P. de Vries, FOM Instituut voor Plasmafysica, Rijnhuizen, Nieuwegeine-mail:p.d. [email protected]
USAT. L. Rhodes UCLA, General Atomics, San Diegoe-mail: [email protected]
G.Vayakis, ITER-JCT, San Diego Sitee-mail: [email protected]
United KingdomN. Deliyanakis, JET Joint Undertaking, Abingdone-mail: [email protected]
INDEX page num.(only first author given)
Garrard Conway, University of Saskatchewan CanadaReflectometer fluctuation and correlation studies at JET. 1
Atsushi Mase, University of Tsukuba JapanDensity Profile and Fluctuation Measurements on GAMMA10 Using FM Reflectometer. 11
Matthias Hirsch, IPP-Garching GermanyPotential and limitations of reflectometry due to scatteringfrom density fluctuations. 21
Fernando Serra, 1ST Lisboa PortugalA 2-D code for the analysis of microwave reflectometrymeasurements in fusion experiments. 29
Garrard Conway, University of Saskatchewan Canada2D Physical optics simulation of fluctuation reflectometry:correlation and asymmetries. 39
Teresa Estrada, CIEMAT Madrid SpainSimulations of correlation reflectometry with a WKB 2-dim code. 49
Jorge Santos, 1ST Lisboa PortugalData processing techniques for data evaluationfrom broadband reflectometry. 55
Maria E. Manso, 1ST Lisboa PortugalDensity profile and fluctuation measurements withmicrowave reflectometry on ASDEX Upgrade. 65
Philippe Moreau, CEA Cadarache FranceDual frequency O-Mode reflectometer fordensity profile measurements on Tore Supra. 77
Frédéric Clairet, CEA Cadarache FranceReflectometry measurements on the Tore Supra tokamak. 85
Peter de Vries, FOM Rijnhuizen The NetherlandsInvestigation of density profile perturbationsby means of Pulse Radar Reflectometry. 91
Albert Hugenholtz, FOM Rijnhuizen The NetherlandsMulti-channel pulsed radar system for the TEXTOR tokamak. 99
Diane Pinsonneault, CCFM Varennes CanadaAM reflectometer density profile measurements on TdeV. 109
Clément Laviron, CEA Cadarache FranceAutomatic linearisation of swept microwavesources for density profile reflectometry. 119
Antonio Silva, 1ST Lisboa PortugalNew developments of the ASDEX Upgradetokamak microwave reflectometer. 127

Nicholas Deliyanakis, JET Culham UKA novel fast frequency modulation scheme forthe JET multi-channel reflectometer. 133
Joaquin Sanchez, CIEMAT Madrid SpainEffects of turbulence in profile reflectometry. 149
George Vayakis, ITER JCT San Diego USAThe challenge of reflectometry in ITER. 157
3rd Intl. reflectometer workshop for fusion plasmas. Madrid, May 5th - 7th 1997 1
Reflectometer fluctuation and correlation studies on JET
G.D.Conwayf, G.VayakisJ, D.V.BartlettJET Joint Undertaking, Abingdon, Oxon, UK
^Plasma Physics Lab., University of Saskatchewan, Canada.
\ITER-JCT, San Diego, USA.
Abstract. Three X-mode, heterodyne, dual-channel correlation reflectometers (75GHz,poloidal/toroidal : 105GHz, pol/tor : 92-96GHz swept, radial) operating on the JET tokamakare described, together with recent results. A range of fluctuation phenomena (ELMs, coherentMHD modes etc.) are observed, as well as variations in core and edge turbulence during ohmic, Land H-mode plasmas. Radial correlation lengths are generally less than 5mm for turbulence butrise to lcm or more for coherent modes. Toroidal correlation lengths range from 5 to 10cm. Largechanges in toroidal rotation velocities are also observed (few km/s with ICRF, tens of km/s withneutral beam heating). Signal imbalances between channels - particularly in low axis and hightriangularity discharges, are explained in terms of asymmetries in alignment of the antennas.
1. Introduction
A new reflectometer diagnostic has been operating on JET during the last two campaigns princi-pally to measure simultaneously radial and (either) toroidal or poloidal correlation lengths of edge andcore plasma turbulence. The diagnostic is actually three separate dual channel X-mode correlationreflectometers, one operating at a fixed frequency of 75 GHz (predominantly outboard edge and SOL),the second at a fixed frequency of 105 GHz (core or inboard edge), and a third swept frequency systemat 92 to 96 GHz. All three reflectometers share a common waveguide and antenna cluster launchinghorizontally from the low field (outboard) side of the tokamak.
In this paper the reflectometer hardware will be described in detail together with the acquisitionsystem and analysis techniques. The capabilities of the diagnostic will be illustrated with a selection ofresults from different operational conditions and plasma fluctuation effects, including coherent modes,broadband turbulence and ELMs. Finally, it will be shown how a defect in the antenna alignment canbe used to advantage to provide additional information on plasma rotation.
2. Hardware - fixed frequency systems
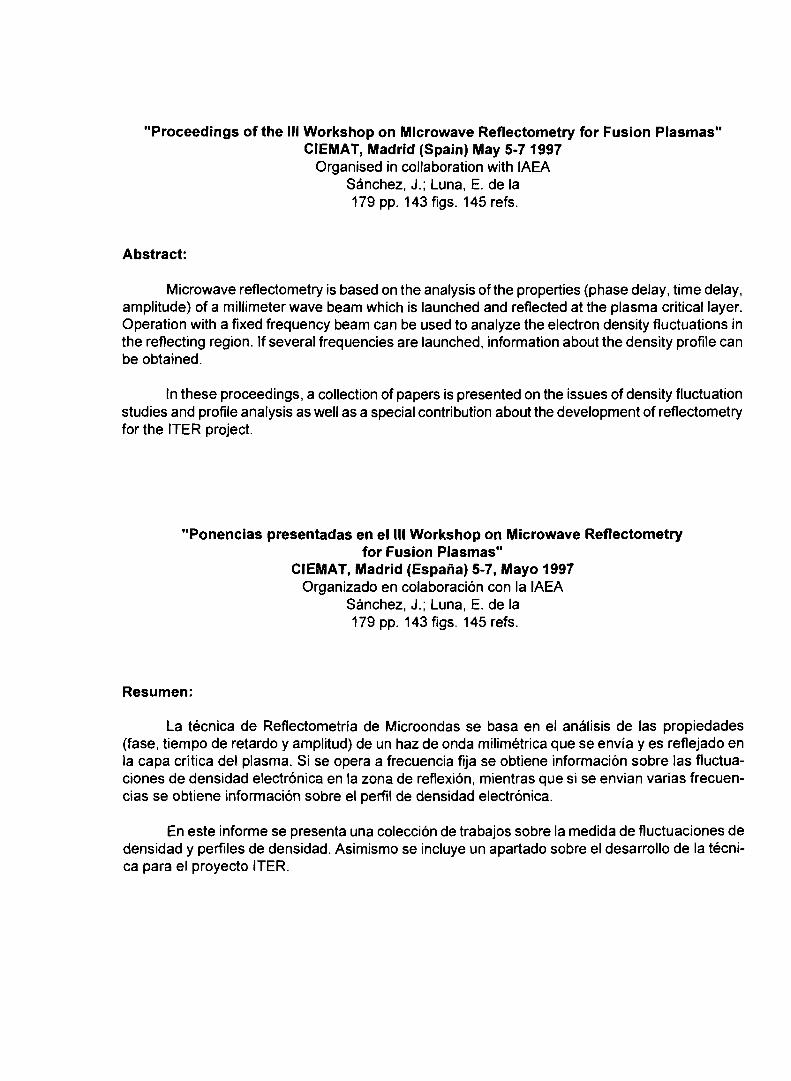
The 75 GHz system (built in-house) and the 105 GHz system (IRE, Ukraine) are identical inoperation and will be described first. Figure 1 shows a schematic of the microwave and electricalcircuit for the 75 GHz system. There are two microwave channels, each with a separate transmitterand receiver horn antennas (see below). The two sources are Varactor tuned Gunn oscillators (about50 mW o/p) locked together with a 10.7 MHz frequency difference by a phase locked loop (PLL). Thetwo received signals undergo two-stage heterodyne down conversion, first to an IF of 10.7 MHz bymixing with a part (3 dB coupler) of the opposing transmitted signal, i.e. each source also acts as thelocal oscillator (LO) for the other channel's receiver. The two oscillator signals are also sampled with10 dB couplers and mixed together to generate the 10.7 MHz reference signal for the PLL and thesecond stage 'incident and quadrature' (IQ) detectors. The mixer output (video) signals are first ACcoupled to +30 dB wide-band amplifiers (to remove the homodyne component) and fed via isolatingtransformers to matched IQ demodulators (Pascal Ltd.) which generate (zero mean) Acos(j> and
- 1 -
3rd Intl. reflectometer workshop for fusion plasmas. Madrid, May 5th - 7th 1997 2
A sin cf> signals for each channel. The IQ detectors and final stage amplifiers have an overall bandwidth
of DC to 1 MHz. Both oscillators are temperature stabilised (and free-running) however the PLL
ensures that any frequency drifts in the channel 1 master oscillator are tracked by the channel 2 slave.
30dBIso. trans.5 - 20 MHz DC-1MHZ
Rx 1
Tx2
Channel 1
Acos((())
Figure 1: Schematic of the 75 GHz toroidal correlation reflectometer. Black lines represent waveguide,
grey lines represent electronic circuitry.
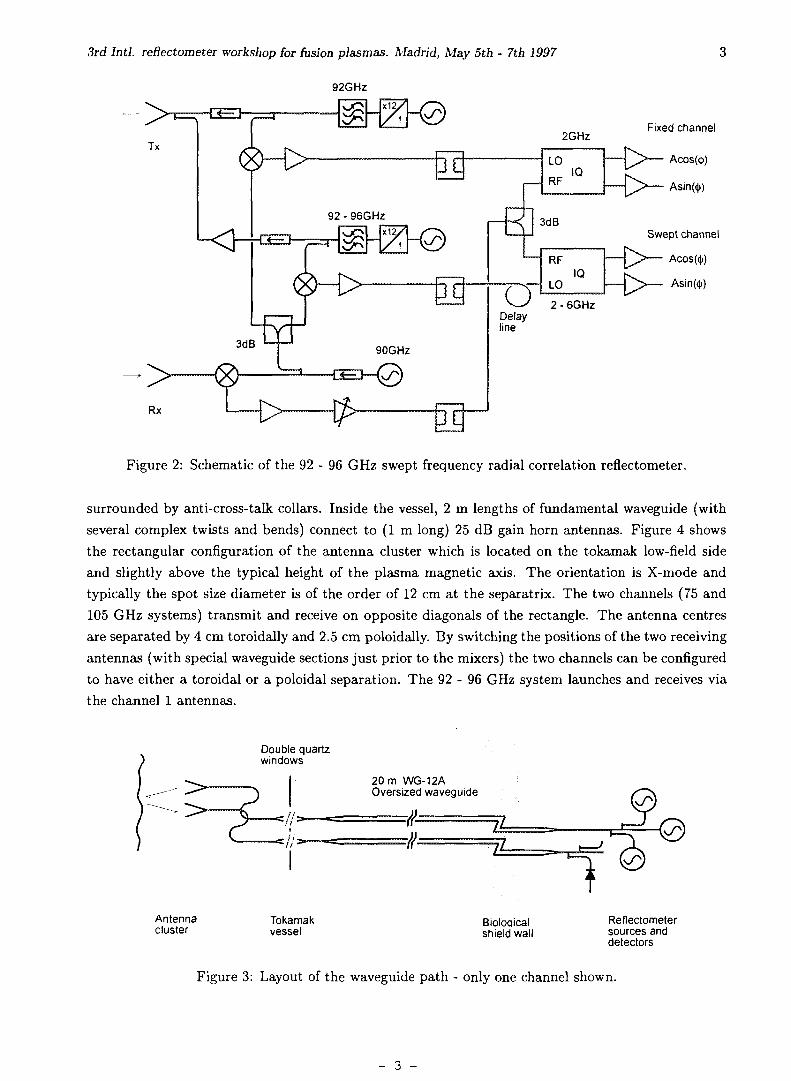
3. Hardware - swept frequency system
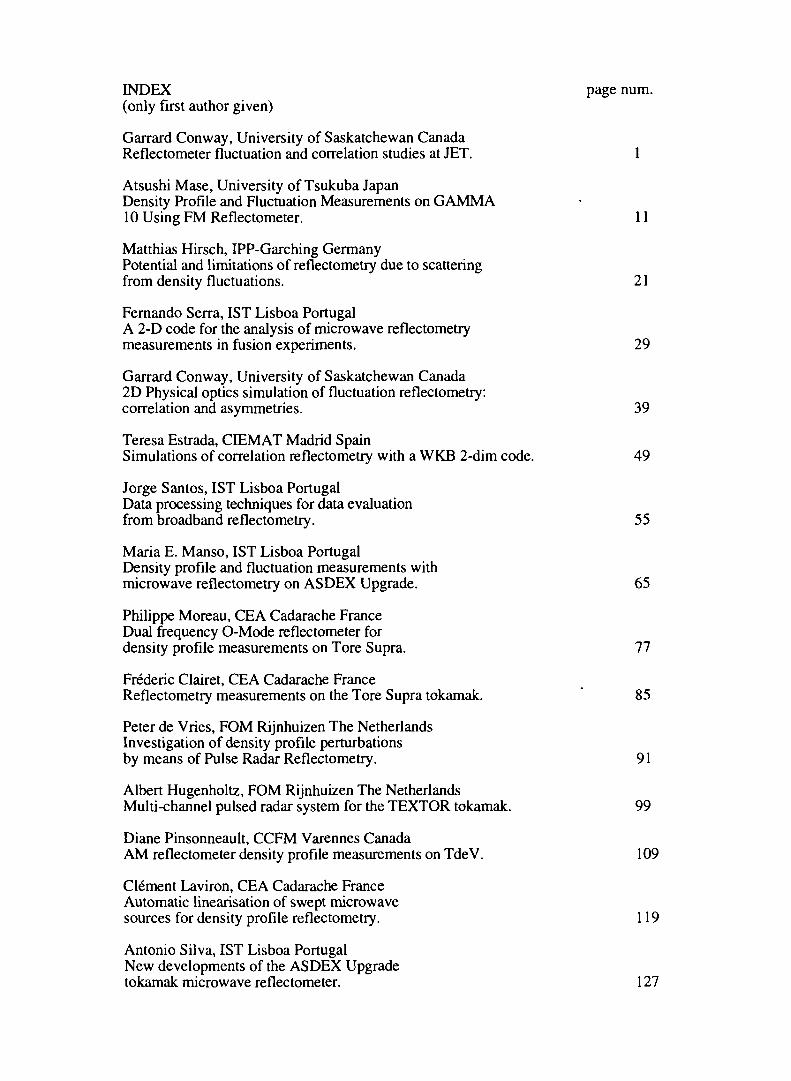
The radial correlation reflectometer (ELVA-1 Ltd. St. Petersburg) is shown schematically in
figure 2. The transmitter section has two oscillators, one fixed at 7.666 GHz and one tunable over
7.666 to 8.000 GHz via a digitally programmable frequency unit. The outputs are frequency multiplied
(x 12), amplified and then combined prior to launching. The receiver section has a single 90 GHz local
oscillator (Impatt) which is heterodyne mixed with the received signal. The mixer output is amplified,
split and then fed to the RF inputs of two IQ detectors. Part of the 90 GHz LO signal is also mixed
with a sample of the 92 GHz and the 92 - 96 GHz launch signals to generate a 2 GHz and a 2 - 6 GHz
reference signal (LO) for each of the IQ detectors. The resulting outputs are again a pair of Acos<f>
and A sin <j> zero mean signals for the 92 GHz fixed channel and the 92 - 96 GHz swept channel.
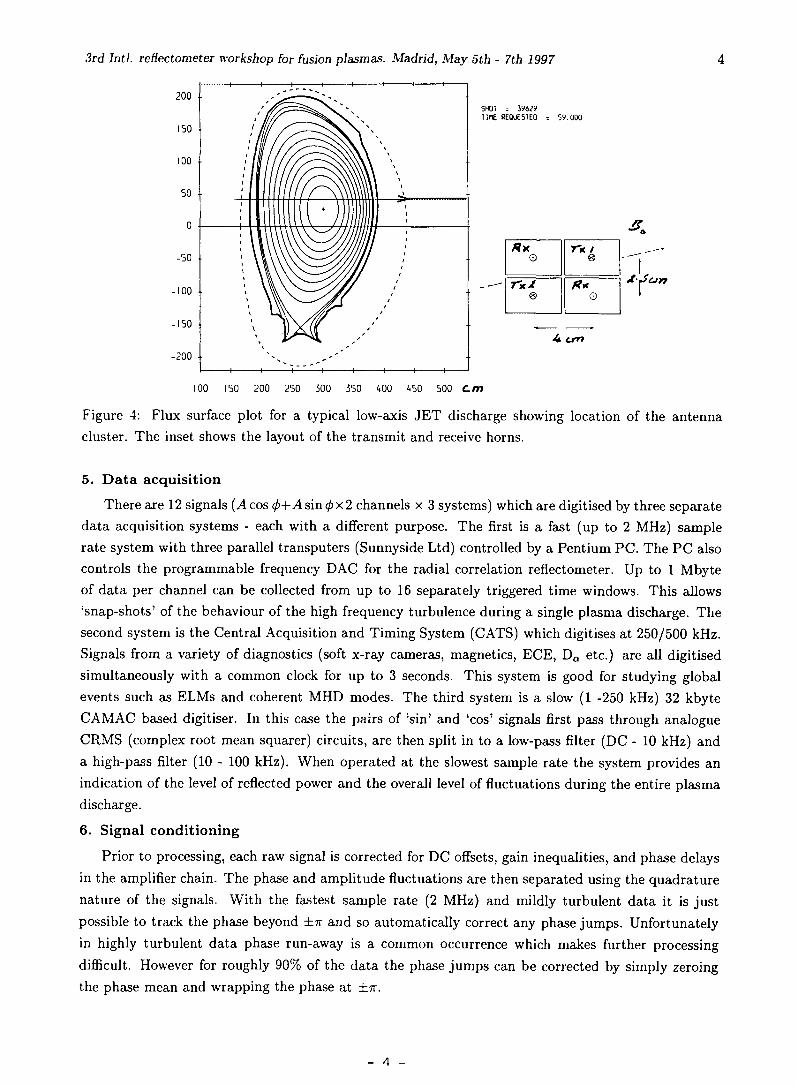
4. Waveguide and antennas
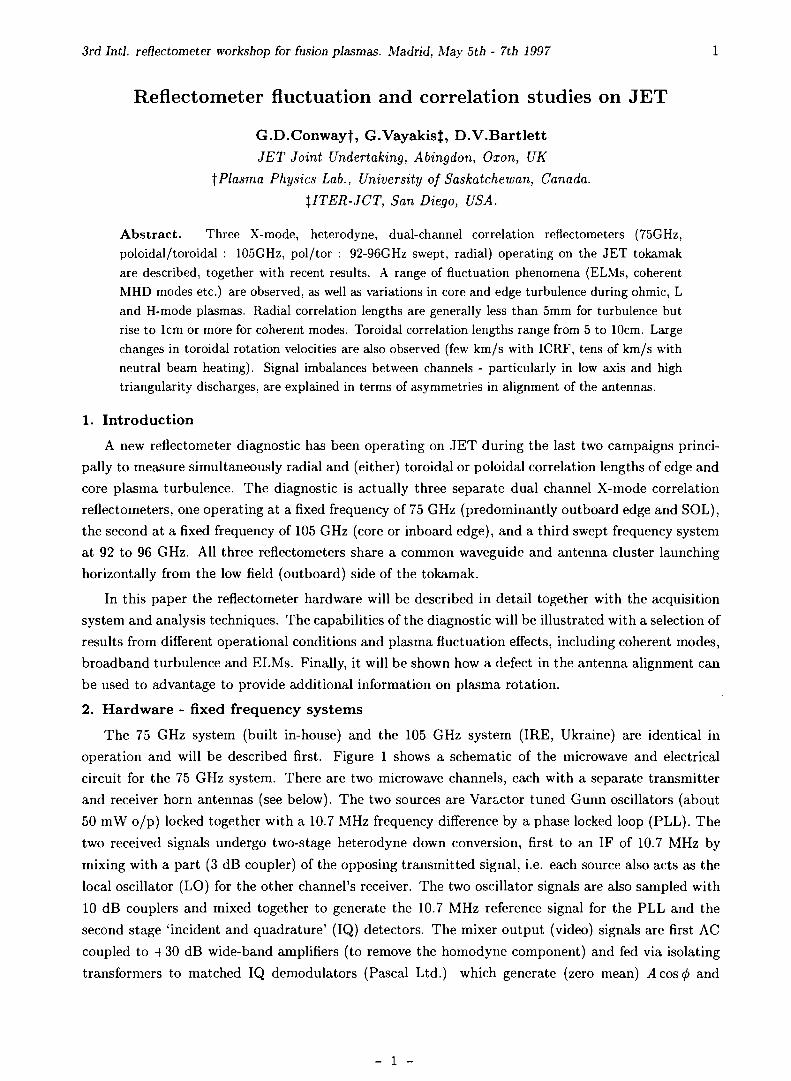
The transmit and receive ports of the three systems are connected through a system of 3 & 5 dB
couplers and tapers onto four oversized WG-12A waveguides. The waveguides are some 20 metres
long and pass from the diagnostic hall through the biological shield wall and a series of E-plane bends
to the mid-plane of the tokamak, figure 3. The oversized section has a typical single pass attenuation
of about 9 dB. Tapers reduce the waveguide back to fundamental WG-27 guide which connects to the
vacuum feedthroughs. These consist of a pair of horns either side of 15° tilted quartz double windows,
- 2 -
3rd Intl. reflectometer workshop for fusion plasmas. Madrid, May 5th - 7th 1997
92GHz
Fixed channel
Acos($)
Swept channel
_^>— Acos(4>)
Rx
Figure 2: Schematic of the 92 - 96 GHz swept frequency radial correlation reflectometer.
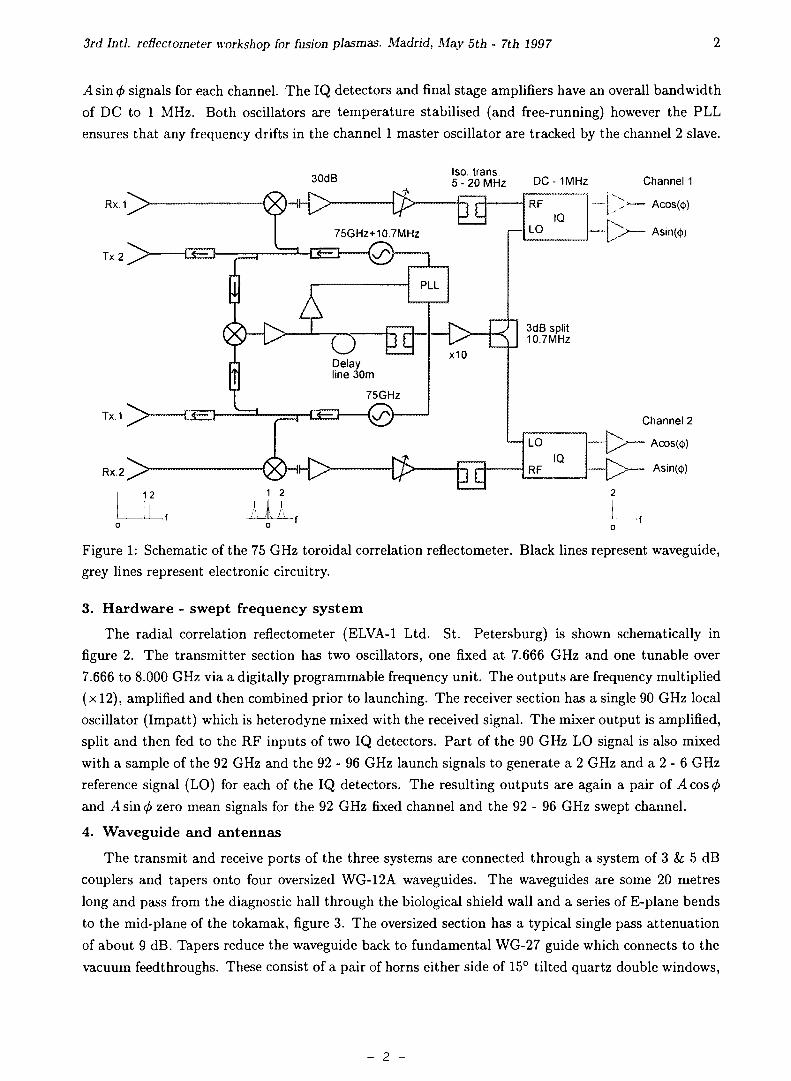
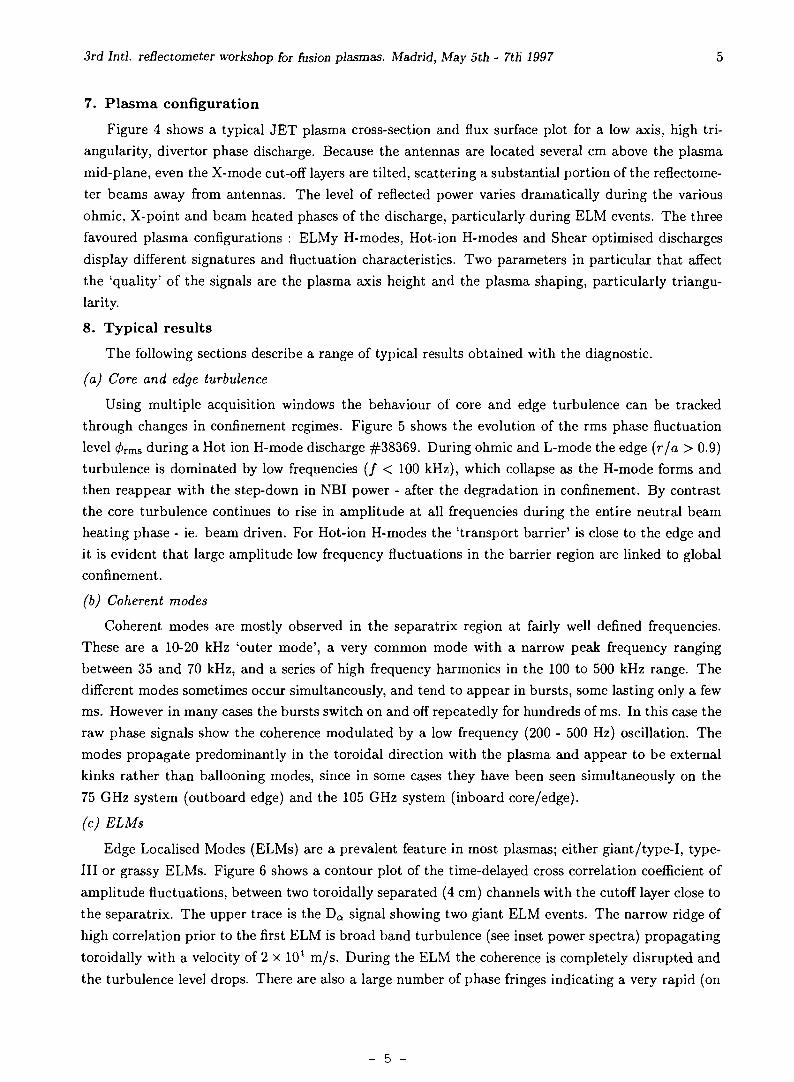
surrounded by anti-cross-talk collars. Inside the vessel, 2 m lengths of fundamental waveguide (withseveral complex twists and bends) connect to (1 m long) 25 dB gain horn antennas. Figure 4 showsthe rectangular configuration of the antenna cluster which is located on the tokamak low-field sideand slightly above the typical height of the plasma magnetic axis. The orientation is X-mode andtypically the spot size diameter is of the order of 12 cm at the separatrix. The two channels (75 and105 GHz systems) transmit and receive on opposite diagonals of the rectangle. The antenna centresare separated by 4 cm toroidally and 2.5 cm poloidally. By switching the positions of the two receivingantennas (with special waveguide sections just prior to the mixers) the two channels can be configuredto have either a toroidal or a poloidal separation. The 92 - 96 GHz system launches and receives viathe channel 1 antennas.
Double quartzwindows
20 m WG-12AOversized waveguide
Antennacluster
Tokamakvessel
Bioloaicalshield wall
Reflectometersources anddetectors
Figure 3: Layout of the waveguide path - only one channel shown.
- 3 -
3rd Intl. reflectometer workshop for fusion plasmas. Madrid, May 5th - 7th 1997
SHOI = 59629l i n t REOUESTEO = 59.000
rtxo S
ft*o
A cm
100 150 200 250 300 350 <<00 450 500 Cm
Figure 4: Flux surface plot for a typical low-axis JET discharge showing location of the antennacluster. The inset shows the layout of the transmit and receive horns.
5. Data acquisition
There are 12 signals (A cos (p+A sin <fr x 2 channels x 3 systems) which are digitised by three separatedata acquisition systems - each with a different purpose. The first is a fast (up to 2 MHz) samplerate system with three parallel transputers (Sunnyside Ltd) controlled by a Pentium PC. The PC alsocontrols the programmable frequency DAC for the radial correlation reflectometer. Up to 1 Mbyteof data per channel can be collected from up to 16 separately triggered time windows. This allows'snap-shots' of the behaviour of the high frequency turbulence during a single plasma discharge. Thesecond system is the Central Acquisition and Timing System (CATS) which digitises at 250/500 kHz.Signals from a variety of diagnostics (soft x-ray cameras, magnetics, ECE, DQ etc.) are all digitisedsimultaneously with a common clock for up to 3 seconds. This system is good for studying globalevents such as ELMs and coherent MHD modes. The third system is a slow (1 -250 kHz) 32 kbyteCAMAC based digitiser. In this case the pairs of 'sin' and 'cos' signals first pass through analogueCRMS (complex root mean squarer) circuits, are then split in to a low-pass filter (DC - 10 kHz) anda high-pass filter (10 - 100 kHz). When operated at the slowest sample rate the system provides anindication of the level of reflected power and the overall level of fluctuations during the entire plasmadischarge.
6. Signal conditioning
Prior to processing, each raw signal is corrected for DC offsets, gain inequalities, and phase delaysin the amplifier chain. The phase and amplitude fluctuations are then separated using the quadraturenature of the signals. With the fastest sample rate (2 MHz) and mildly turbulent data it is justpossible to track the phase beyond ±n and so automatically correct any phase jumps. Unfortunatelyin highly turbulent data phase run-away is a common occurrence which makes further processingdifficult. However for roughly 90% of the data the phase jumps can be corrected by simply zeroingthe phase mean and wrapping the phase at ±ix.
- 4 -
3rd Intl. reflectometer workshop for fusion plasmas. Madrid, May 5th - 7th 1997 5
7. Plasma configuration
Figure 4 shows a typical JET plasma cross-section and flux surface plot for a low axis, high tri-angularity, divertor phase discharge. Because the antennas are located several cm above the plasmamid-plane, even the X-mode cut-off layers are tilted, scattering a substantial portion of the reflectome-ter beams away from antennas. The level of reflected power varies dramatically during the variousohmic. X-point and beam heated phases of the discharge, particularly during ELM events. The threefavoured plasma configurations : ELMy H-modes, Hot-ion H-modes and Shear optimised dischargesdisplay different signatures and fluctuation characteristics. Two parameters in particular that affectthe 'quality' of the signals are the plasma axis height and the plasma shaping, particularly triangu-larity.
8. Typical results
The following sections describe a range of typical results obtained with the diagnostic.
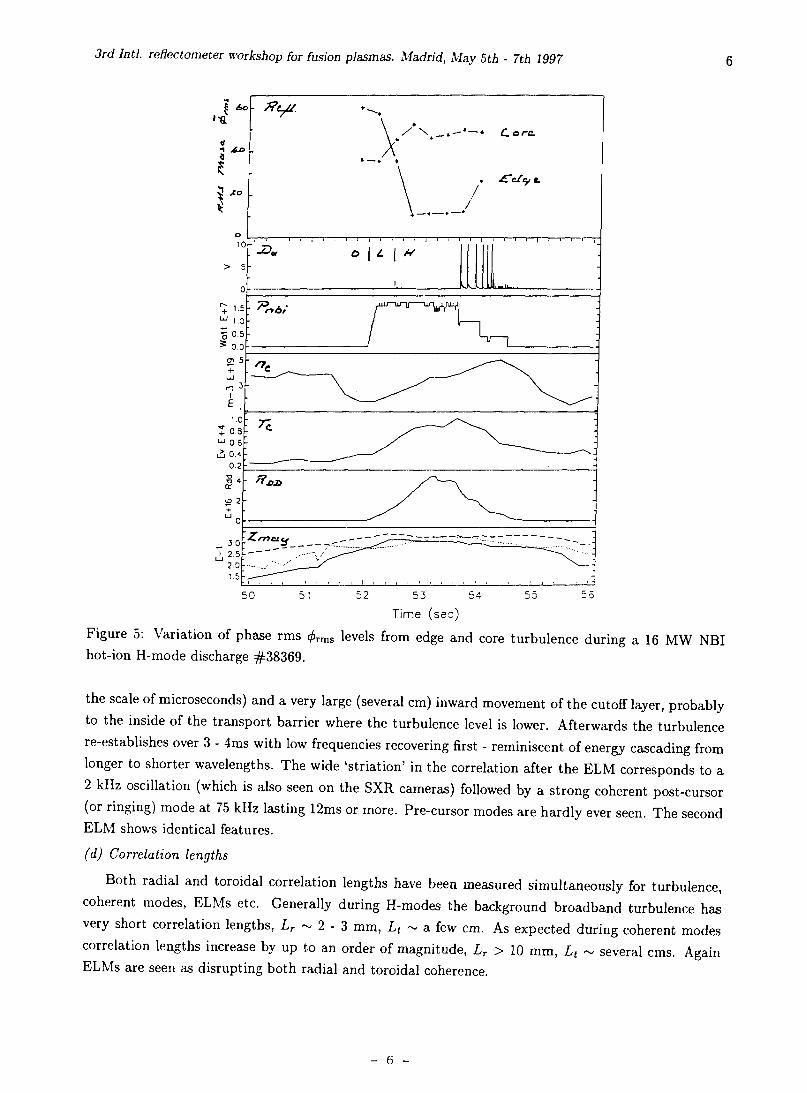
(a) Core and edge turbulence
Using multiple acquisition windows the behaviour of core and edge turbulence can be trackedthrough changes in confinement regimes. Figure 5 shows the evolution of the rms phase fluctuationlevel </>rms during a Hot ion H-mode discharge #38369. During ohmic and L-mode the edge (r/a > 0.9)turbulence is dominated by low frequencies (/ < 100 kHz), which collapse as the H-mode forms andthen reappear with the step-down in NBI power - after the degradation in confinement. By contrastthe core turbulence continues to rise in amplitude at all frequencies during the entire neutral beamheating phase - ie. beam driven. For Hot-ion H-modes the 'transport barrier' is close to the edge andit is evident that large amplitude low frequency fluctuations in the barrier region are linked to globalconfinement.
(b) Coherent modes
Coherent modes are mostly observed in the separatrix region at fairly well defined frequencies.These are a 10-20 kHz 'outer mode', a very common mode with a narrow peak frequency rangingbetween 35 and 70 kHz, and a series of high frequency harmonics in the 100 to 500 kHz range. Thedifferent modes sometimes occur simultaneously, and tend to appear in bursts, some lasting only a fewras. However in many cases the bursts switch on and off repeatedly for hundreds of ms. In this case theraw phase signals show the coherence modulated by a low frequency (200 - 500 Hz) oscillation. Themodes propagate predominantly in the toroidal direction with the plasma and appear to be externalkinks rather than ballooning modes, since in some cases they have been seen simultaneously on the75 GHz system (outboard edge) and the 105 GHz system (inboard core/edge).
(c) ELMs
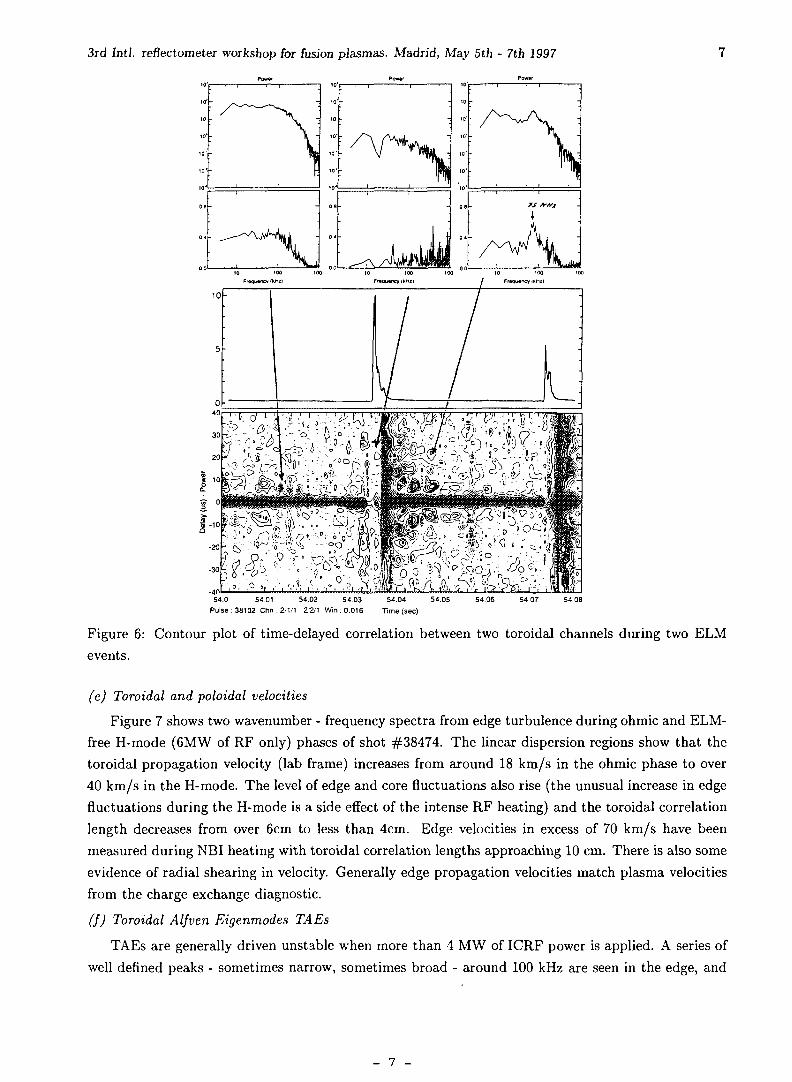
Edge Localised Modes (ELMs) are a prevalent feature in most plasmas; either giant/type-I, type-Ill or grassy ELMs. Figure 6 shows a contour plot of the time-delayed cross correlation coefficient ofamplitude fluctuations, between two toroidally separated (4 cm) channels with the cutoff layer close tothe separatrix. The upper trace is the DQ signal showing two giant ELM events. The narrow ridge ofhigh correlation prior to the first ELM is broad band turbulence (see inset power spectra) propagatingtoroidally with a velocity of 2 x 10⁴ m/s. During the ELM the coherence is completely disrupted andthe turbulence level drops. There are also a large number of phase fringes indicating a very rapid (on
- 5 -
3rd Intl. reflectometer workshop for fusion plasmas. Madrid, May 5th - 7th 1997
/ N _ , - • — * Care
53 AO
5 nn
IE
1.0Ï0.8^ 0.5
0.2
3.0
201.5
-V
Z.mcL^
5 0 51 5552 53 54
Time (sec)
Figure 5: Variation of phase rms <f)rms levels from edge and core turbulence during a 16 MW NBIhot-ion H-mode discharge #38369.
the scale of microseconds) and a very large (several cm) inward movement of the cutoff layer, probably
to the inside of the transport barrier where the turbulence level is lower. Afterwards the turbulence
re-establishes over 3 - 4ms with low frequencies recovering first - reminiscent of energy cascading from
longer to shorter wavelengths. The wide 'striation' in the correlation after the ELM corresponds to a
2 kHz oscillation (which is also seen on the SXR cameras) followed by a strong coherent post-cursor
(or ringing) mode at 75 kHz lasting 12ms or more. Pre-cursor modes are hardly ever seen. The second
ELM shows identical features.
(d) Correlation lengths
Both radial and toroidal correlation lengths have been measured simultaneously for turbulence,
coherent modes, ELMs etc. Generally during H-modes the background broadband turbulence has
very short correlation lengths, Lr ~ 2 - 3 mm, Lt ~ a few cm. As expected during coherent modes
correlation lengths increase by up to an order of magnitude, Lr > 10 mm, Lt ~ several cms. Again
ELMs are seen as disrupting both radial and toroidal coherence.
- 6 -
3rd IntJ. reflectometer workshop for fusion plasmas. Madrid, May 5th - 7th 1997
54.0 54 01 54.02 54.03 54.04 54.05Pulse : 38102 Chn : 2/1/1 .2/2/1 Win: 0.016 Time (sec)
5406 5407
Figure 6: Contour plot of time-delayed correlation between two toroidal channels during two ELMevents.
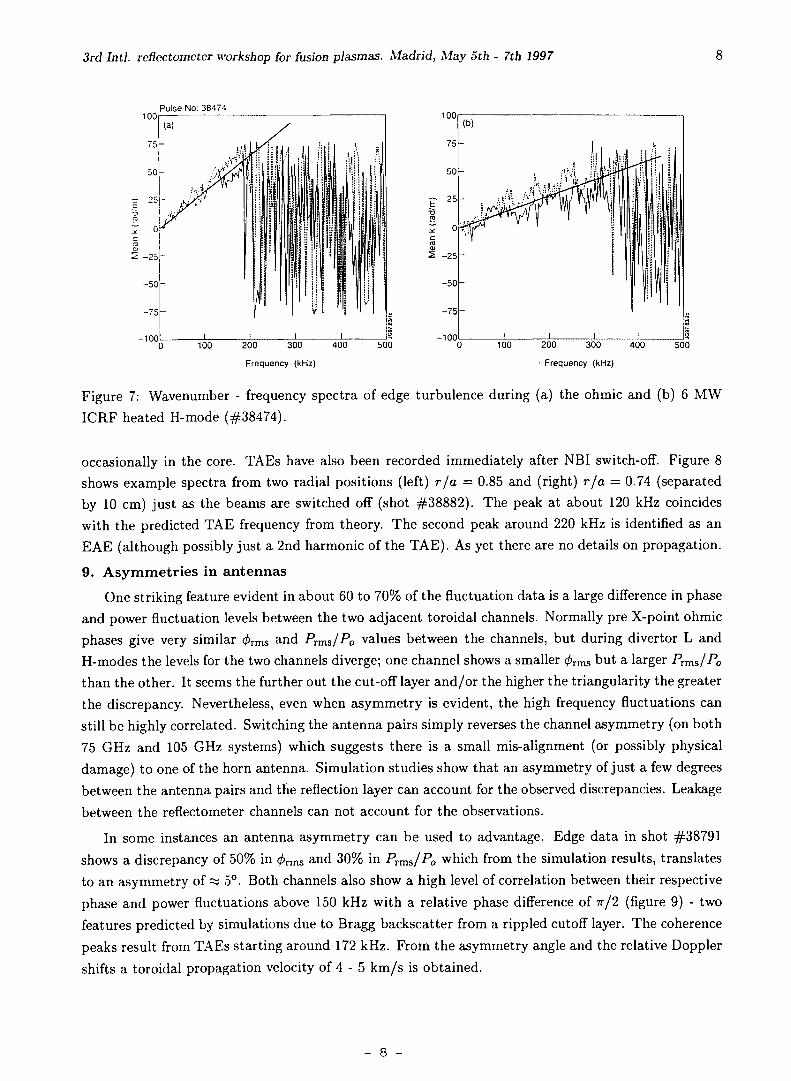
(e) Toroidal and poloidal velocities
Figure 7 shows two wavenumber - frequency spectra from edge turbulence during ohmic and ELM-free H-mode (6MW of RF only) phases of shot #38474. The linear dispersion regions show that thetoroidal propagation velocity (lab frame) increases from around 18 km/s in the ohmic phase to over40 km/s in the H-mode. The level of edge and core fluctuations also rise (the unusual increase in edgefluctuations during the H-mode is a side effect of the intense RF heating) and the toroidal correlationlength decreases from over 6cm to less than 4cm. Edge velocities in excess of 70 km/s have beenmeasured during NBI heating with toroidal correlation lengths approaching 10 cm. There is also someevidence of radial shearing in velocity. Generally edge propagation velocities match plasma velocitiesfrom the charge exchange diagnostic.
(f) Toroidal Alfven Eigenmodes TAEs
TAEs are generally driven unstable when more than 4 MW of ICRF power is applied. A series ofwell defined peaks - sometimes narrow, sometimes broad - around 100 kHz are seen in the edge, and
- 7 -
3rd Intl. reflectometer workshop for fusion plasmas. Madrid, May 5th - 7th 1997
100Pulse No: 38474
100i
-100L200 300 400 500
-100100 200 300 400 500
Frequency (kHz) - Frequency (kHz)
Figure 7: Wavenumber - frequency spectra of edge turbulence during (a) the ohmic and (b) 6 MWICRF heated H-mode (#38474).
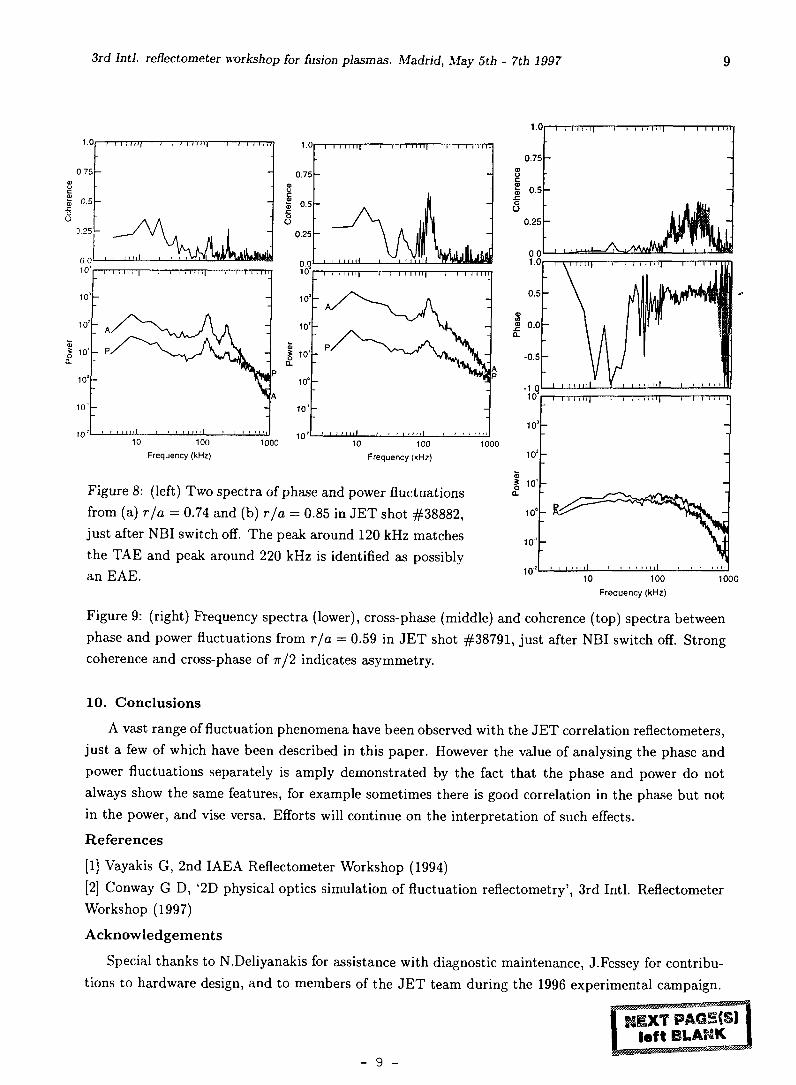
occasionally in the core. TAEs have also been recorded immediately after NBI switch-off. Figure 8shows example spectra from two radial positions (left) r/a = 0.85 and (right) r/a = 0.74 (separatedby 10 cm) just as the beams are switched off (shot #38882). The peak at about 120 kHz coincideswith the predicted TAE frequency from theory. The second peak around 220 kHz is identified as anEAE (although possibly just a 2nd harmonic of the TAE). As yet there are no details on propagation.
9. Asymmetries in antennas
One striking feature evident in about 60 to 70% of the fluctuation data is a large difference in phaseand power fluctuation levels between the two adjacent toroidal channels. Normally pre X-point ohmicphases give very similar (f>ims and Prms/Po values between the channels, but during divertor L andH-modes the levels for the two channels diverge; one channel shows a smaller <prms but a larger PTms/P0
than the other. It seems the further out the cut-off layer and/or the higher the triangularity the greaterthe discrepancy. Nevertheless, even when asymmetry is evident, the high frequency fluctuations canstill be highly correlated. Switching the antenna pairs simply reverses the channel asymmetry (on both75 GHz and 105 GHz systems) which suggests there is a small mis-alignment (or possibly physicaldamage) to one of the horn antenna. Simulation studies show that an asymmetry of just a few degreesbetween the antenna pairs and the reflection layer can account for the observed discrepancies. Leakagebetween the reflectometer channels can not account for the observations.
In some instances an antenna asymmetry can be used to advantage. Edge data in shot #38791shows a discrepancy of 50% in (prms and 30% in Prms/Po which from the simulation results, translatesto an asymmetry of « 5°. Both channels also show a high level of correlation between their respectivephase and power fluctuations above 150 kHz with a relative phase difference of 7r/2 (figure 9) - twofeatures predicted by simulations due to Bragg backscatter from a rippled cutoff layer. The coherencepeaks result from TAEs starting around 172 kHz. From the asymmetry angle and the relative Dopplershifts a toroidal propagation velocity of 4 - 5 km/s is obtained.
- 8 -
3rd Intl. reftectometer workshop for fusion plasmas. Madrid, May 5th - 7th 1997
10 100
Frequency (kHz)
1000 10 100
Frequency (kHz)
1000
Figure 8: (left) Two spectra of phase and power fluctuationsfrom (a) r/a = 0.74 and (b) r/a = 0.85 in JET shot #38882,just after NBI switch off. The peak around 120 kHz matchesthe TAE and peak around 220 kHz is identified as possiblyan EAE. 10 100
Frequency (kHz)
1000
Figure 9: (right) Frequency spectra (lower), cross-phase (middle) and coherence (top) spectra betweenphase and power fluctuations from r/a = 0.59 in JET shot #38791, just after NBI switch off. Strongcoherence and cross-phase of 7r/2 indicates asymmetry.
10. Conclusions
A vast range of fluctuation phenomena have been observed with the JET correlation reflectometers,just a few of which have been described in this paper. However the value of analysing the phase andpower fluctuations separately is amply demonstrated by the fact that the phase and power do notalways show the same features, for example sometimes there is good correlation in the phase but notin the power, and vise versa. Efforts will continue on the interpretation of such effects.References
[1] Vayakis G, 2nd IAEA Reflectometer Workshop (1994)
[2] Conway G D, '2D physical optics simulation of fluctuation reflectometry', 3rd Intl. ReflectometerWorkshop (1997)
Acknowledgements
Special thanks to N.Deliyanakis for assistance with diagnostic maintenance, J.Fessey for contribu-tions to hardware design, and to members of the JET team during the 1996 experimental campaign.
- 9 -
Density Profile and Fluctuation Measurements on GAMMA 10Using FM Reflectometer
A. Mase, T. Tokuzawa, L. G. Bruskin, Y. Kogi, N. Oyama,A. Itakura, T. Tamano, and K. Yatsu
Plasma Research Center, University ofTsukuba,Tsukuba 305, Japan
A broadband FM reflectometer was applied to the GAMMA 10 tandem mirror in orderto measure density profile and fluctuations in the central-cell plasma. The clear fringes areobserved during a plasma shot, when a fast-sweep oscillator is utilized and the resultantintermediate frequencies from the mixer output of the reflectometer are larger than the ioncyclotron range of frequency (ICRF). The density profile measurement is performed forvarious sweep times of the oscillator. The reliability of measurement seems to be improvedwhen the sweep time is faster than 50/is. The integrated value of many reconstructed densityprofiles agrees well with the profile obtained from a scanning interferometer. The severalreconstruction algorithms are used to analyze the fast time-varying data, such as, themaximum-entropy method (MEM) spectral analysis and wavelet analysis.
The reflectometer was also applied to the measurement of fluctuations. The space andtime resolving spectra of ICRF-driven waves as well as low-frequency instabilities aremeasured. The density and magnetic-field fluctuation levels are evaluated from both thereflectometer and cross-polarization scattering (CPS) diagnostic method. The CPS is relatedto the mode-conversion effect consisting of a polarization difference of a scattered wavewith regard to an incident wave by the existence of magnetic fluctuations. It is observed thatthe Bragg resonance condition seems to be satisfied for the CPS similar to conventionalThomson scattering.
I. INTRODUCTION
Reflectometer has been expected to be one of the key diagnostics to measure densityprofiles and density/magnetic-field fluctuations in large fusion devices such as ITER. Itprovides good spatial and temporal resolution, while requiring a single viewing chord andminimal vacuum access in contrast to interferometry and Thomson scattering. One of themost serious problems in density profile measurement using conventional frequency-modulation (FM) reflectometer is caused by the existence of density fluctuations in plasmas,since the multifringe phase changes produced by a reflectometer are easily masked by thosedue to density fluctuations. Several methods have been proposed to avoid this problem suchas amplitude-modulation (AM) reflectometry [ 1 ] or dual-frequency differential reflectometry[2] and pulsed radar reflectometry using moderate short pulse [3] or ultrashort pulse [4] aswell as advanced data processing techniques based on Fourier spectrum analysis [5] and onmaximum entropy method (MEM) [6].
We report here a broadband FM reflectometer system sweeping faster than thecharacteristic time scale of the density fluctuations. The high-frequency fringes due to thechange of the cut-off layer can be distinguished from those due to the density fluctuations,since the fluctuation level with frequency larger than the ion cyclotron range of frequency(ICRF) is usually much smaller than the average density. Two types of data processingtechnique have been applied in order to reconstruct density profiles, that is, zero-cross
- 11 -
counting and MEM. Recently the wavelet transform is also applied for the reconstruction ofthe present FM reflectometer. Unlike the Fourier transform, which suffers from lack oftemporal resolution, the wavelet transform possesses both time and frequency resolvingcapacities.
Diagnostics of plasma fluctuations are very important for transport study inmagnetically-confined plasmas. Various techniques have been employed in order tomeasure the fluctuations, such as probes, electromagnetic wave scattering, reflectometry,and beam probe. In recent years, it has been mentioned that magnetic-field fluctuations aswell as density and potential fluctuations are of importance for plasma transport. However,the direct measurement of internal magnetic field fluctuations remains a major issue inplasma diagnostics. A new application of electromagnetic wave scattering by magneticfluctuations has been proposed recently. This is related to the mode conversion effectconsisting of a polarization difference of a scattered wave from an incident wave calledcross-polarization scattering (CPS) [7,8]. We have applied the CPS measurement to thewaves in the ion cyclotron range of frequency (ICRF) [9]. In this paper, we report theobservation of low frequency waves of less than 200 kHz. In magnetic confinementsystems, the magnetohydrodynamic (MHD) wave and the electromagnetic drift wave can beexcited in this frequency range.
II. DESCRIPTION OF THE EXPERIMENTAL ARRANGEMENTS
A. GAMMA 10 tandem mirror
The present experiment is performed in the hot-ion mode of GAMMA 10 [10]. TheICRF power with frequencies of 9.9 MHz (RF1) and 4.7-8.9 MHz (RF2) is employed tobuildup a plasma and heat ions following gun-produced plasma injection. The frequency of4.7-8.9 MHz corresponds to the ion cyclotron frequency near the midplane of the centralcell, and 9.9 MHz corresponds to that of the anchor cells. Two separate 28 GHz gyrotronsare used in the plug/barrier cells in order to create the confining potentials. Fundamentalelectron cyclotron resonance heating (ECRH) occurs in the plug regions and second-harmonic ECRH occurs in the barrier regions. The central-cell plasma parameters are asfollows: the line density ncl^=4-5xi0^ cm2 with an effective diameter of /r=2O-23 cm, theelectron temperature 7^=60-80 eV, and the averaged ion temperature 7",=5-7 keV. Themagnetic field strength at the midplane of the central cell is fic=0.30-0.57 T, and the mirrorratio is 4.9.
B. FM reflectometer for Density profile measurement
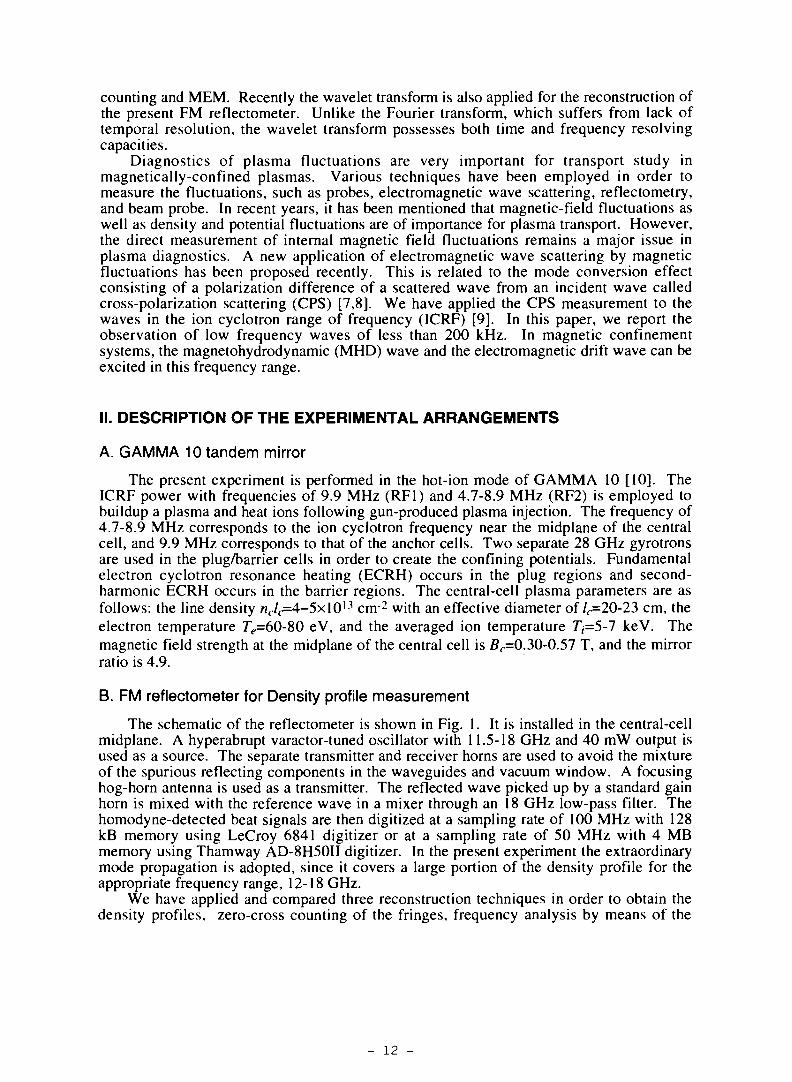
The schematic of the reflectometer is shown in Fig. 1. It is installed in the central-cellmidplane. A hyperabrupt varactor-tuned oscillator with 11.5-18 GHz and 40 mW output isused as a source. The separate transmitter and receiver horns are used to avoid the mixtureof the spurious reflecting components in the waveguides and vacuum window. A focusinghog-horn antenna is used as a transmitter. The reflected wave picked up by a standard gainhorn is mixed with the reference wave in a mixer through an 18 GHz low-pass filter. Thehomodyne-detected beat signals are then digitized at a sampling rate of 100 MHz with 128kB memory using LeCroy 6841 digitizer or at a sampling rate of 50 MHz with 4 MBmemory using Thamway AD-8H5OII digitizer. In the present experiment the extraordinarymode propagation is adopted, since it covers a large portion of the density profile for theappropriate frequency range, 12-18 GHz.
We have applied and compared three reconstruction techniques in order to obtain thedensity profiles, zero-cross counting of the fringes, frequency analysis by means of the
- 12 -
MEM, and wavelet analysis [11,12]. A numerical algorithm to reconstruct the densityprofile is similar to the technique shown in the previous papers [13].
DATA PROCESSING
SYSTEM
11.S-18GHZ
ISOLATOR AMPLIFIER DIRECTIONAL
COUPLER
\ SHIELD BOX I
Fig. 1. A schematic diagram of the FM reflectometer system.
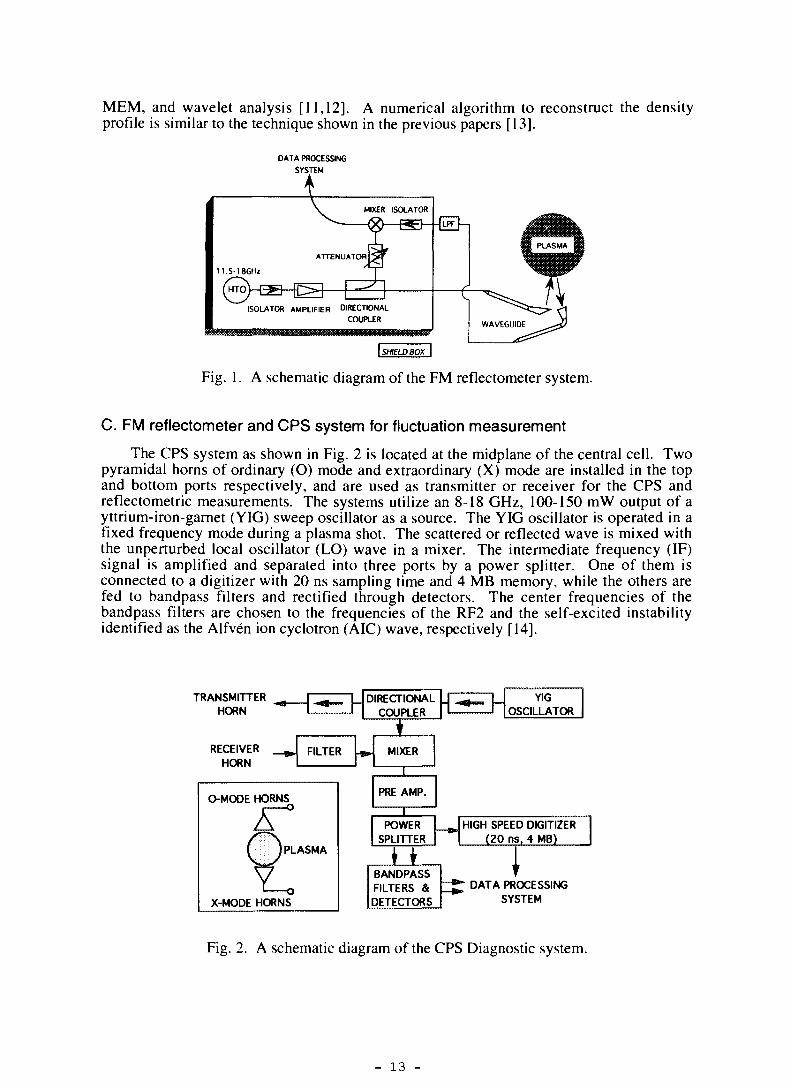
C. FM reflectometer and CPS system for fluctuation measurement
The CPS system as shown in Fig. 2 is located at the midplane of the central cell. Twopyramidal horns of ordinary (O) mode and extraordinary (X) mode are installed in the topand bottom ports respectively, and are used as transmitter or receiver for the CPS andreflectometric measurements. The systems utilize an 8-18 GHz, 100-150 mW output of ayttrium-iron-garnet (YIG) sweep oscillator as a source. The YIG oscillator is operated in afixed frequency mode during a plasma shot. The scattered or reflected wave is mixed withthe unperturbed local oscillator (LO) wave in a mixer. The intermediate frequency (IF)signal is amplified and separated into three ports by a power splitter. One of them isconnected to a digitizer with 20 ns sampling time and 4 MB memory, while the others arefed to bandpass filters and rectified through detectors. The center frequencies of thebandpass filters are chosen to the frequencies of the RF2 and the self-excited instabilityidentified as the Alfvén ion cyclotron (AIC) wave, respectively [14].
TRANSMITTERHORN
RECEIVERHORN
FILTER
O-MOOE HORNS
PLASMA
X-MODE HORNS
DIRECTIONALCOUPLER
YIGOSCILLATOR
MIXER
J±BANDPASSFILTERS &DETECTORS
1
PRE AMP.
I
POWERSPLITTER
—»» HIGH SPEED DIGITIZER(20 ns, 4 MB)
DATA PROCESSINGSYSTEM
Fig. 2. A schematic diagram of the CPS Diagnostic system.
- 13 -
IV. EXPERIMENTAL RESULTS AND DISCUSSION
A. Density profiles
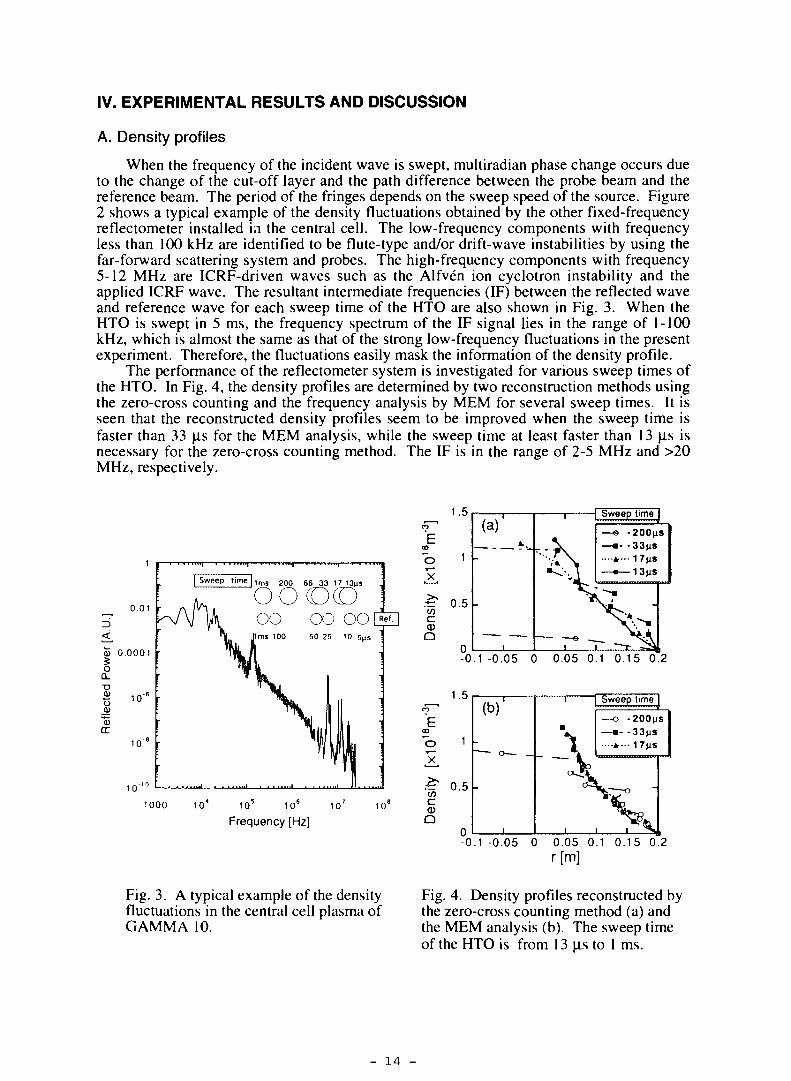
When the frequency of the incident wave is swept, multiradian phase change occurs dueto the change of the cut-off layer and the path difference between the probe beam and thereference beam. The period of the fringes depends on the sweep speed of the source. Figure2 shows a typical example of the density fluctuations obtained by the other fixed-frequencyreflectometer installed in the central cell. The low-frequency components with frequencyless than 100 kHz are identified to be flute-type and/or drift-wave instabilities by using thefar-forward scattering system and probes. The high-frequency components with frequency5-12 MHz are ICRF-driven waves such as the Alfvén ion cyclotron instability and theapplied ICRF wave. The resultant intermediate frequencies (IF) between the reflected waveand reference wave for each sweep time of the HTO are also shown in Fig. 3. When theHTO is swept in 5 ms, the frequency spectrum of the IF signal lies in the range of 1-100kHz, which is almost the same as that of the strong low-frequency fluctuations in the presentexperiment. Therefore, the fluctuations easily mask the information of the density profile.
The performance of the reflectometer system is investigated for various sweep times ofthe HTO. In Fig. 4, the density profiles are determined by two reconstruction methods usingthe zero-cross counting and the frequency analysis by MEM for several sweep times. It isseen that the reconstructed density profiles seem to be improved when the sweep time isfaster than 33 u.s for the MEM analysis, while the sweep time at least faster than 13 fis isnecessary for the zero-cross counting method. The IF is in the range of 2-5 MHz and >20MHz, respectively.
0.01
Sweep t ime| im s 2 0 0 66 33 17 13ns
OOQ(D ]
oo œ oockms 100 50 25 10 5Ms
1000 10* 105 106 107 10°
Frequency [Hz]
ËCO
"ÔT—
X
wcCD
O-0
1.6
1
0.5
n
(a)'*..
-
-
1 Sweep time
—© -200»is
•-*—17| is—•—13ns
1 -0.05 0 0.05 0.1 0.15 0.2
-0.1 -0.05 0 0.05 0.1 0.15 0.2r[m]
Fig. 3. A typical example of the densityfluctuations in the central cell plasma ofGAMMA 10.
Fig. 4. Density profiles reconstructed bythe zero-cross counting method (a) andthe MEM analysis (b). The sweep timeof the HTO is from 13 (is to 1 ms.
- 14 -
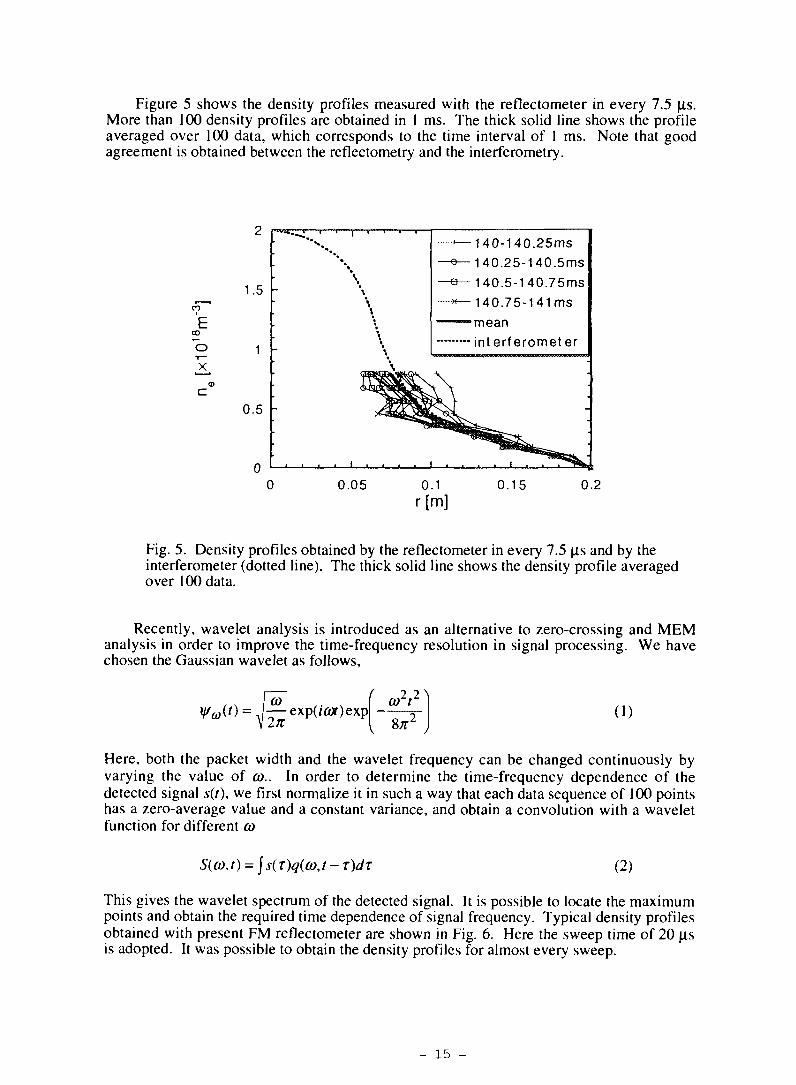
Figure 5 shows the density profiles measured with the reflectometer in every 7.5 |is.More than 100 density profiles are obtained in 1 ms. The thick solid line shows the profileaveraged over 100 data, which corresponds to the time interval of 1 ms. Note that goodagreement is obtained between the reflectometry and the interferometry.
1.5
oo
b
0.5
40-140.25ms40.25-140.5ms
140.5-140.75ms140.75-141ms
interferometer
0.05 0.1r[m]
0.15 0.2
Fig. 5. Density profiles obtained by the reflectometer in every 7.5 u.s and by theinterferometer (dotted line). The thick solid line shows the density profile averagedover 100 data.
Recently, wavelet analysis is introduced as an alternative to zero-crossing and MEManalysis in order to improve the time-frequency resolution in signal processing. We havechosen the Gaussian wavelet as follows,
r* <• , {— exp(i<w)exp2K y
a>2*2'(1)
Here, both the packet width and the wavelet frequency can be changed continuously byvarying the value of a>.. In order to determine the time-frequency dependence of thedetected signal.?(/), we first normalize it in such a way that each data sequence of 100 pointshas a zero-average value and a constant variance, and obtain a convolution with a waveletfunction for different co
,t) = js(T)q(û),t-T)dT (2)
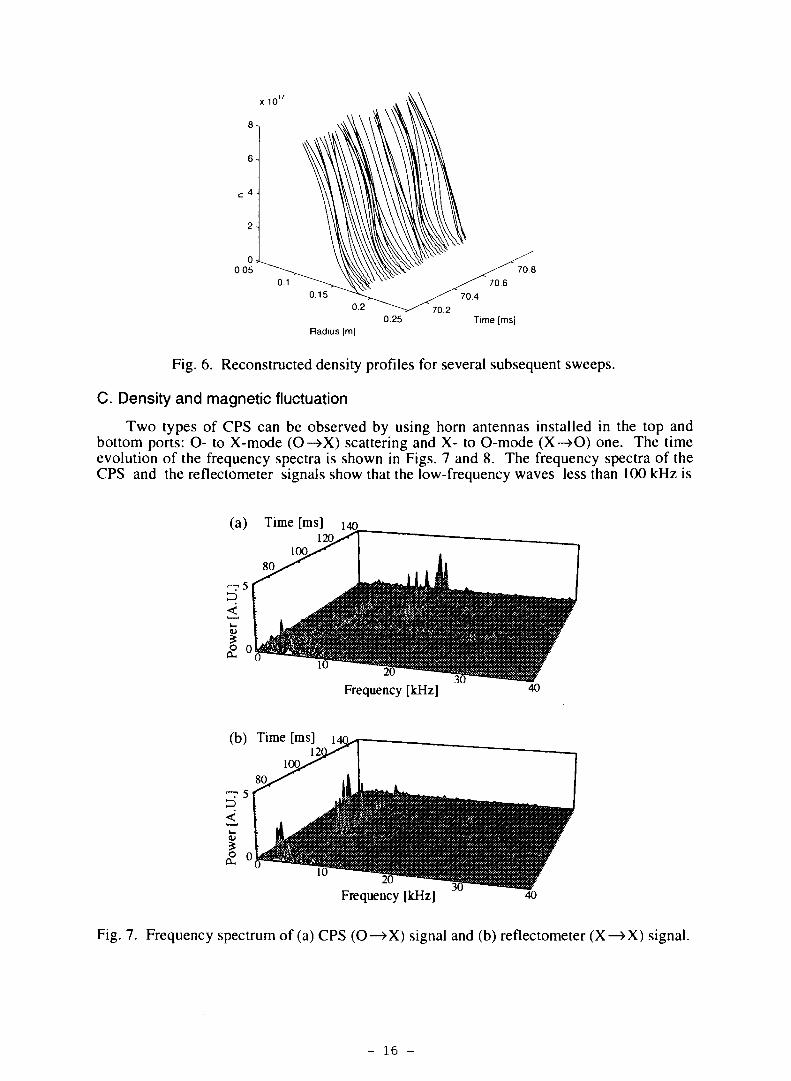
This gives the wavelet spectrum of the detected signal. It is possible to locate the maximumpoints and obtain the required time dependence of signal frequency. Typical density profilesobtained with present FM reflectometer are shown in Fig. 6. Here the sweep time of 20 [isis adopted. It was possible to obtain the density profiles for almost every sweep.
- 15 -
x 10
70870.6
70.40.2
Radius [m]0.25
70.2Time [ms]
Fig. 6. Reconstructed density profiles for several subsequent sweeps.
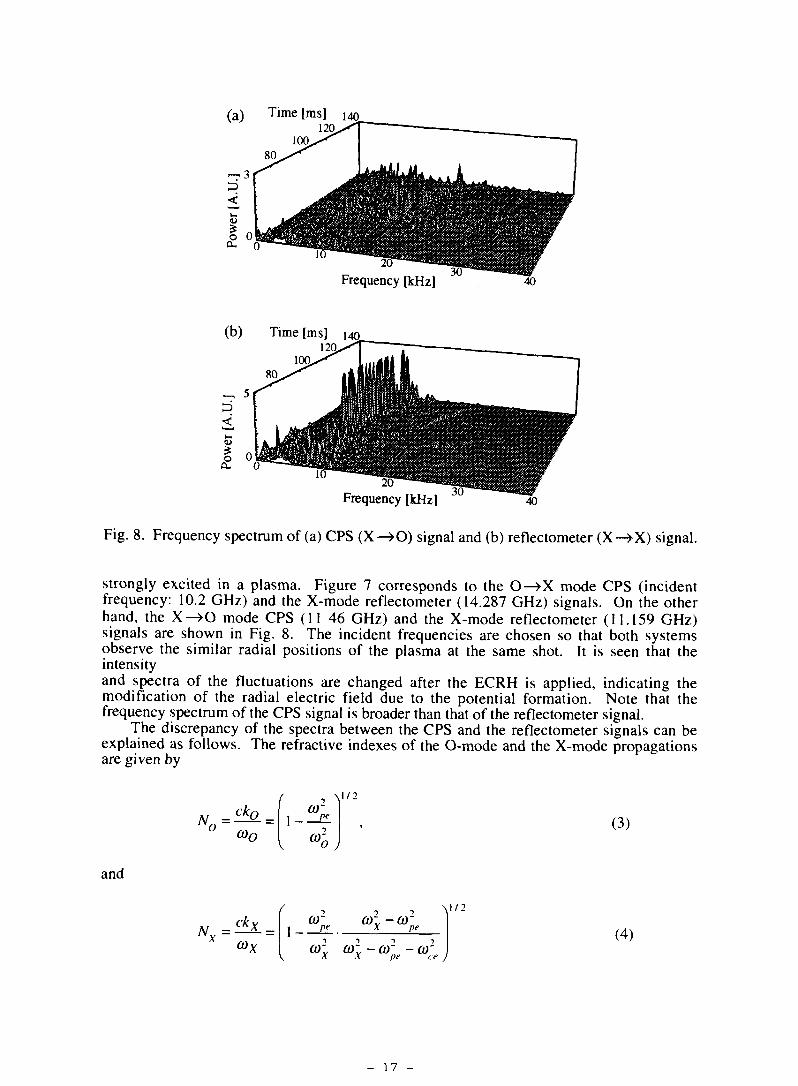
C. Density and magnetic fluctuation
Two types of CPS can be observed by using horn antennas installed in the top andbottom ports: O- to X-mode (O-»X) scattering and X- to 0-mode (X—>O) one. The timeevolution of the frequency spectra is shown in Figs. 7 and 8. The frequency spectra of theCPS and the reflectometer signals show that the low-frequency waves less than 100 kHz is
(a) Time [ms] 14o12a
10Q.80
Frequency [kHz]
(b) Time [ms] 1121
10Q,80.
T 5D
Frequency [kHz]
Fig. 7. Frequency spectrum of (a) CPS (O—>X) signal and (b) reflectometer (X—>X) signal.
- 16 -
(a) Time [ms] 14o
100.80
Frequency [kHz]
(b) Time [ms] 140
100.120_
80
- , 5
Frequency [kHz] 40
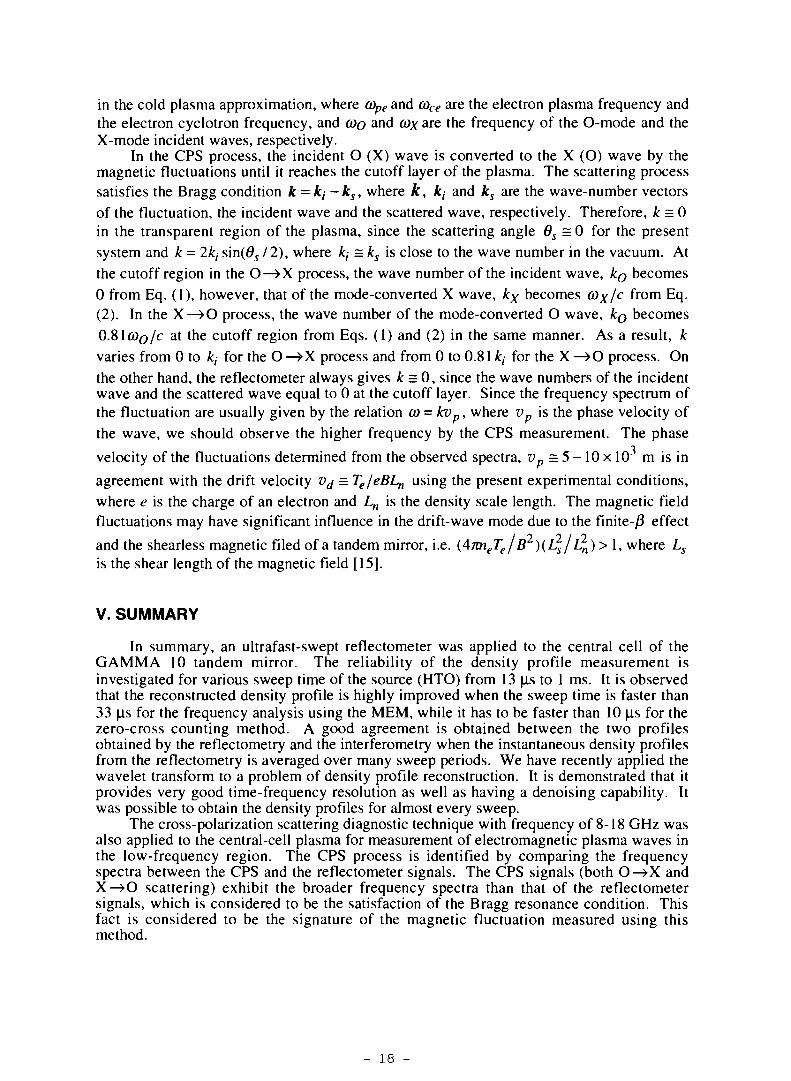
Fig. 8. Frequency spectrum of (a) CPS (X-»O) signal and (b) reflectometer (X-»X) signal.
strongly excited in a plasma. Figure 7 corresponds to the O—»X mode CPS (incidentfrequency: 10.2 GHz) and the X-mode reflectometer (14.287 GHz) signals. On the otherhand, the X—>O mode CPS (11 46 GHz) and the X-mode reflectometer (11.159 GHz)signals are shown in Fig. 8. The incident frequencies are chosen so that both systemsobserve the similar radial positions of the plasma at the same shot. It is seen that theintensityand spectra of the fluctuations are changed after the ECRH is applied, indicating themodification of the radial electric field due to the potential formation. Note that thefrequency spectrum of the CPS signal is broader than that of the reflectometer signal.
The discrepancy of the spectra between the CPS and the reflectometer signals can beexplained as follows. The refractive indexes of the O-mode and the X-mode propagationsare given by
0io
\ l / 2CO'
pe
(Ûo )
(3)
and
., ckvN = —— =
V
\ l / 2
co: (Û'V-(Û~ -0)' ,X pe ce J
(4)
- 17 -
in the cold plasma approximation, where cope and coce are the electron plasma frequency andthe electron cyclotron frequency, and û)o and 0)x are the frequency of the O-mode and theX-mode incident waves, respectively.
In the CPS process, the incident O (X) wave is converted to the X (O) wave by themagnetic fluctuations until it reaches the cutoff layer of the plasma. The scattering processsatisfies the Bragg condition k = kj-ks, where k, kj and ks are the wave-number vectorsof the fluctuation, the incident wave and the scattered wave, respectively. Therefore, k = 0in the transparent region of the plasma, since the scattering angle 6S = 0 for the presentsystem and k = 7kt sin(#j 12), where kt = ks is close to the wave number in the vacuum. Atthe cutoff region in the O—>X process, the wave number of the incident wave, ko becomes0 from Eq. (1), however, that of the mode-converted X wave, kx becomes (Ox/c from Eq.(2). In the X—»O process, the wave number of the mode-converted O wave, ko becomesO.&ICOQ/C at the cutoff region from Eqs. (1) and (2) in the same manner. As a result, kvaries from 0 to /c, for the O —¥X process and from 0 to 0.81 &,- for the X —>O process. On
the other hand, the reflectometer always gives k = 0, since the wave numbers of the incidentwave and the scattered wave equal to 0 at the cutoff layer. Since the frequency spectrum ofthe fluctuation are usually given by the relation a> = kvp, where vp is the phase velocity ofthe wave, we should observe the higher frequency by the CPS measurement. The phasevelocity of the fluctuations determined from the observed spectra, vp = 5 -10 x 10" m is inagreement with the drift velocity v^ = Tg/eBL^ using the present experimental conditions,where e is the charge of an electron and Ln is the density scale length. The magnetic fieldfluctuations may have significant influence in the drift-wave mode due to the finite-/? effect
and the shearless magnetic filed of a tandem mirror, i.e. (AimeTel B ){LsjLn) > 1, where Ls
is the shear length of the magnetic field [15].
V. SUMMARY
In summary, an ultrafast-swept reflectometer was applied to the central cell of theGAMMA 10 tandem mirror. The reliability of the density profile measurement isinvestigated for various sweep time of the source (HTO) from 13 fis to 1 ms. It is observedthat the reconstructed density profile is highly improved when the sweep time is faster than33 JIS for the frequency analysis using the MEM, while it has to be faster than 10 (is for thezero-cross counting method. A good agreement is obtained between the two profilesobtained by the reflectometry and the interferometry when the instantaneous density profilesfrom the reflectometry is averaged over many sweep periods. We have recently applied thewavelet transform to a problem of density profile reconstruction. It is demonstrated that itprovides very good time-frequency resolution as well as having a denoising capability. Itwas possible to obtain the density profiles for almost every sweep.
The cross-polarization scattering diagnostic technique with frequency of 8-18 GHz wasalso applied to the central-cell plasma for measurement of electromagnetic plasma waves inthe low-frequency region. The CPS process is identified by comparing the frequencyspectra between the CPS and the reflectometer signals. The CPS signals (both O—»X andX—»O scattering) exhibit the broader frequency spectra than that of the reflectometersignals, which is considered to be the satisfaction of the Bragg resonance condition. Thisfact is considered to be the signature of the magnetic fluctuation measured using thismethod.
- 18 -
ACKNOWLEDGMENTS
The authors deeply acknowledge the GAMMA 10 group of the University of Tsukubafor their collaboration. This work was supported in part by a Grant-in-Aid for ScientificResearch from the Japanese Ministry of Education, Science, Sports and Culture.
REFERENCES
[1] J. Sanchez, B. Branas, T. Estrada, E. de la Luna and V. Zhuravlev, Rev. Sci. Instrum.63,4654(1992).
[2] G. R. Hanson, J. B. Wilgen, T. S. Bigelow, I. Collazo, A. C. England, M. Murakami,D. A. Ramussen, and J. R. Wilson, Rev. Sci. Instrum. 66, 863 (1995).
[3] S. H. Heijnen, M. de Baar, A. J. H. Donné, M. J. van de Pol, C. A. J. Hugenholtz, andRTP team, Rev. Sci. Instrum. 66,419 (1995).
[4] C. W. Domier, N. C. Luhmann, Jr., A. Chou, W-M. Zhang, A. J. Romanowsky, Rev.Sci. Instrum. 66, 399(1995).
[5] K. W. Kim, E. J. Doyle, W. A. Peebles, A> Ejiri, N. C. Luhmann, Jr., and C. L. Rettig,Rev. Sci. Instrum. 66, 1229 (1995).
[6] M. Nagatsu, T. Hayashi, Y. MAtsushita, and T. Tsukishima, Jpn. J. Appl. Phys. 33,L45 (1994).
[7] X.L.Zou, L.Colas, M.Paume, J.M.Chareau, L.Laurent, P. Devynck, and D.Gresillon,Phys. Rev. Lett. 75, 1090 (1995).
[8] L. G. Bruskin, A. Mase, and T. Tamano, Plasma, Phys. Control. Fusion 37, 255 (1995).[9] A. Mase, L.G.Bruskin, N.Oyama, T.Tokuzawa, H. Inutake, A.Itakura, H.Hojo,
M.Ichimura, and T.Tamano, Rev. Sci. Instrum. 68, 454 (1997).[10] T. Tamano, Phys. Plasmas 2, 2321 (1995).[11] M. Nagatsu, A. Fuse, and A. Mase, Plasma Phys. Control. Fusion 38, 1033 (1996).[12] L. G. Bruskin, A. Mase, T. Tokuzawa, N. Oyama, A. Itakura, and T. Tamano, Jpn. J.
Appl. Phys. 36, L632 ( 1997).[13] E. J. Doyle, T. Lehecka, N. C. Luhmann, Jr., W. A. Peebles, and the DIII-D Group,
Rev. Sci. Instrum. 61, 2896 (1990).[14] A. Mase, M. Ichimura, H. Satake, R. Katsumata, T. Tokuzawa, Y. Ito, H. Hojo,
E. J. Doyle, A. Itakura, M. Inutake, and T. Tamano, Phys. Fluids B 5, 1677 (1993).[15] S. J. Camargo, B. D. Scott, and D. Biskamp, Phys. Plasmas 3, 3912 (1996).
UEX1 PAGE(S)left
- 19 -
Potential and limitations of reflectometrydue to scattering from density fluctuations
M.Hirsch, E. Holzhauer
Max—Planck Institutfur Piasmaphysik, EURATOM Ass., D-85748 Garching, FRG* Institut fur Plasmaforschung, Universitât Stuttgart, D-70569 Stuttgart, FRG
In collaboration with :
B. Kurzan, P. Amadeo ( IPP-Garching)
B. Branas, M. Frances (CIEMAT -Madrid)
T. Grossmann (1ST -Lisboa )
HI Reflectometry Workshop on Fusion Plasma, CIEMAT, Madrid, Spain
May 5 - 7 , 1997
- 21 -

Introduction
Conventional reflectometry uses the phase of the reflected signal to monitor densityfluctuations at the reflecting layer. However, in the presence of density fluctuations (e.g. in theL-mode or during ELMs) the nominal coherent reflection is strongly modified by refraction,diffraction and backscattering resulting from the small-scale turbulence-like density structures.
The reflected signal is determined by two effects [1] :(i) The interferometric term, described by a line-integral, which can be calculated with the
WKB approximation,(ii) The scattering term, which is due to small-scale density structures which must be
calculated from the full-wave solution.
As a consequence the wavefront of the reflected signal can be strongly distorted.
A number of experimental observations cannot be explained satisfactorily by 1-D models:• Fluctuations in reflected signal power of up to 100 %.• Loss of unshifted coherently reflected signal.• Asymmetry of the reflected frequency spectrum (=> phase runaway).• Loss of radial coherence in 2-frequency reflectometer experiments.
In magnetically confined fusion plasma the variation of plasma parameters over the microwavebeam cross-section in the toroidal direction can be neglected and the calculations are carriedout in 2 dimensions. We use two different numerical codes to describe the propagation ofelectromagnetic waves in the plasma:(i) An equivalent electrical network (RLC - network) [2,3],(ii) A time-dependent finite difference method [4].
1-dimensional case:A uni-directional Doppler shift can be produced by a density fluctuation propating radially (i.e.along the line-of-sight), provided the Bragg condition for backscattering is fulfilled locally bythe wavenumber of the fluctuation. This situation can be described by a 1-D model. Even if thefluctuation is nonpropagating (i.e. no Doppler shift) the total phase response of thereflectometer from interferometry and backscattering terms is modified which may lead to anerror in density profile measurements.
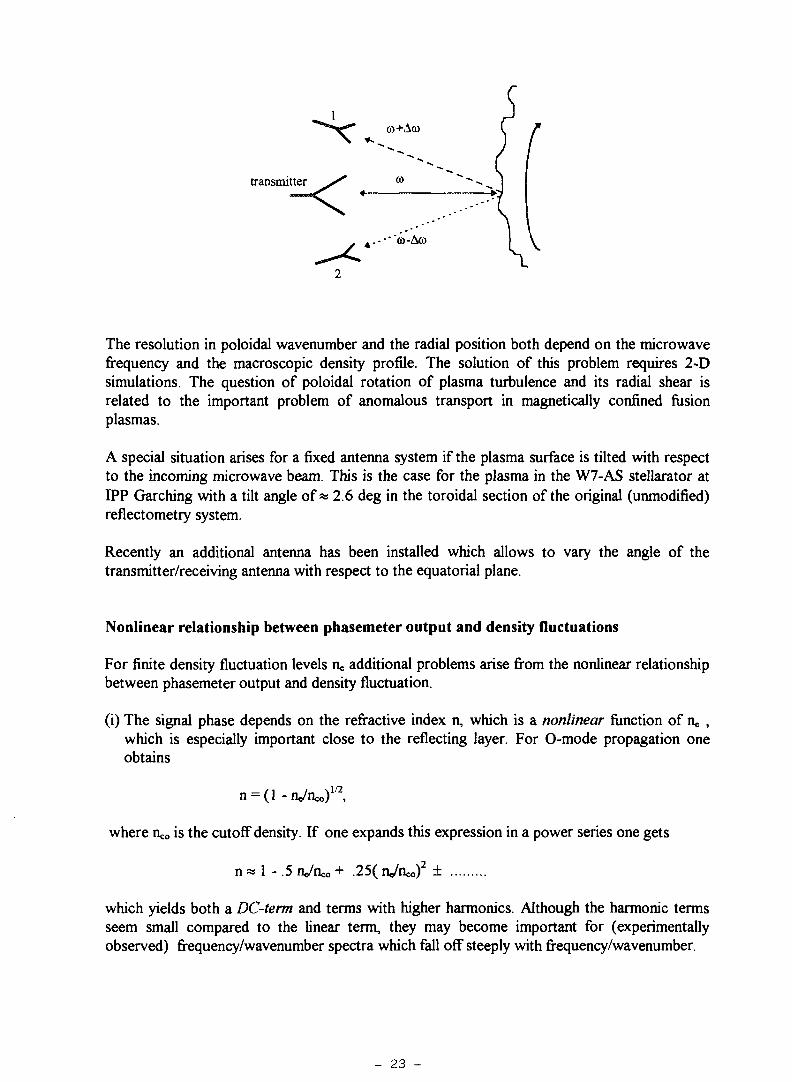
2-dimensional case:In fusion experiments one usually also observes fluctuations which propagate poloidally (i.e.transverse to the line-of-sight). The figure below (taken from [3]) illustrates the origin of zero-order and ± first-order sidebands from a rotating periodic poloidal density fluctuation actinglike a grating in reflection. Receiver antennas at viewing angles differing from perpendicularincidence onto the plasma surface allow to determine the poloidal propagation velocity andpoloidal wavenumber of the density fluctuations. This type of reflectometry can be consideredas a backscattering experiment with the radial resolution of a reflectometry system.
- 22 -
1co+Aco
transmitter
À.--"'a)-Acû I V
2
The resolution in poloidal wavenumber and the radial position both depend on the microwavefrequency and the macroscopic density profile. The solution of this problem requires 2-Dsimulations. The question of poloidal rotation of plasma turbulence and its radial shear isrelated to the important problem of anomalous transport in magnetically confined fusionplasmas.
A special situation arises for a fixed antenna system if the plasma surface is tilted with respectto the incoming microwave beam. This is the case for the plasma in the W7-AS stellarator atIPP Garching with a tilt angle of * 2.6 deg in the toroidal section of the original (unmodified)reflectometry system.
Recently an additional antenna has been installed which allows to vary the angle of thetransmitter/receiving antenna with respect to the equatorial plane.
Nonlinear relationship between phasemeter output and density fluctuations
For finite density fluctuation levels n- additional problems arise from the nonlinear relationshipbetween phasemeter output and density fluctuation.
(i) The signal phase depends on the refractive index n, which is a nonlinear function of n^ ,which is especially important close to the reflecting layer. For O-mode propagation oneobtains
where n^ is the cutoff density. If one expands this expression in a power series one gets
n « 1 - .5 ru/iio + .25(ne/ncof ±
which yields both a DC-term and terms with higher harmonics. Although the harmonic termsseem small compared to the linear term, they may become important for (experimentallyobserved) frequency/wavenumber spectra which fall off steeply with frequency/wavenumber.
- 23 -
(ii) If the signal phase varies sinusoidally in time/space additional sidebands infrequency/wavenumber space appear, which are an intrinsic property of phase-modulatedcarriers. The power in the various harmonics (including the zero order) is given byBessel functions and can be found in standard textbooks on rf-signal processing.
(iii) The output of a reflectometer comes from a phase detector which is a nonlinear devicewith respect to signal amplitude. If density fluctuations with different frequencies arepresent the information about the individual signal components at the receiver input can belost. This can be easily demonstrated for the simple case of two signal components
i and a2sin(©2t), for which the resulting phase $(t) is given by
= arctan [ (ai sin(©it)+ a2 sin(<B2t) ) / (ai cos(©it)+ a2 cos(a2t) ) ].
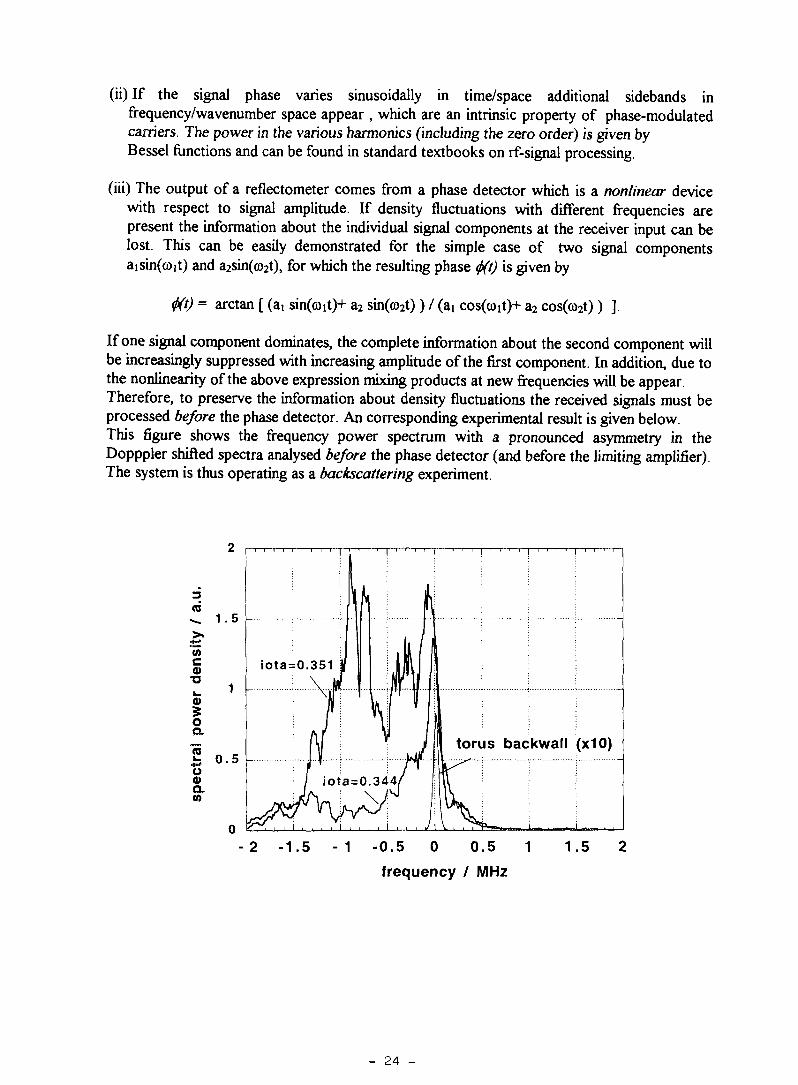
If one signal component dominates, the complete information about the second component willbe increasingly suppressed with increasing amplitude of the first component. In addition, due tothe nonlinearity of the above expression mixing products at new frequencies will be appear.Therefore, to preserve the information about density fluctuations the received signals must beprocessed before the phase detector. An corresponding experimental result is given below.This figure shows the frequency power spectrum with a pronounced asymmetry in theDopppler shifted spectra analysed before the phase detector (and before the limiting amplifier).The system is thus operating as a backscattering experiment.
ra
torus backwall (x10)
- 2 -1.5 - 1 -0.5 0 0.5 1
frequency / MHz
1.5
- 24 -
Analytic modelling of the phase-runaway
If the unshifted zero-order wave (coherent reflection) is not the dominant term at the input ofthe receiver antenna one observes transient destructive interference resulting in minima of thetotal wave amplitude associated with rapid changes of the phase. A simple analytic modelallows to derive the origin of the phase runaway and the characteristic threshold for thefluctuation level needed for the onset of the phase runaway. This analytic model yields theresulting phase <f>(t) due to the
(i) unshifted zero-order signal with frequency a>,(ii) frequency-shifted sidebands with frequency © ±Aco.
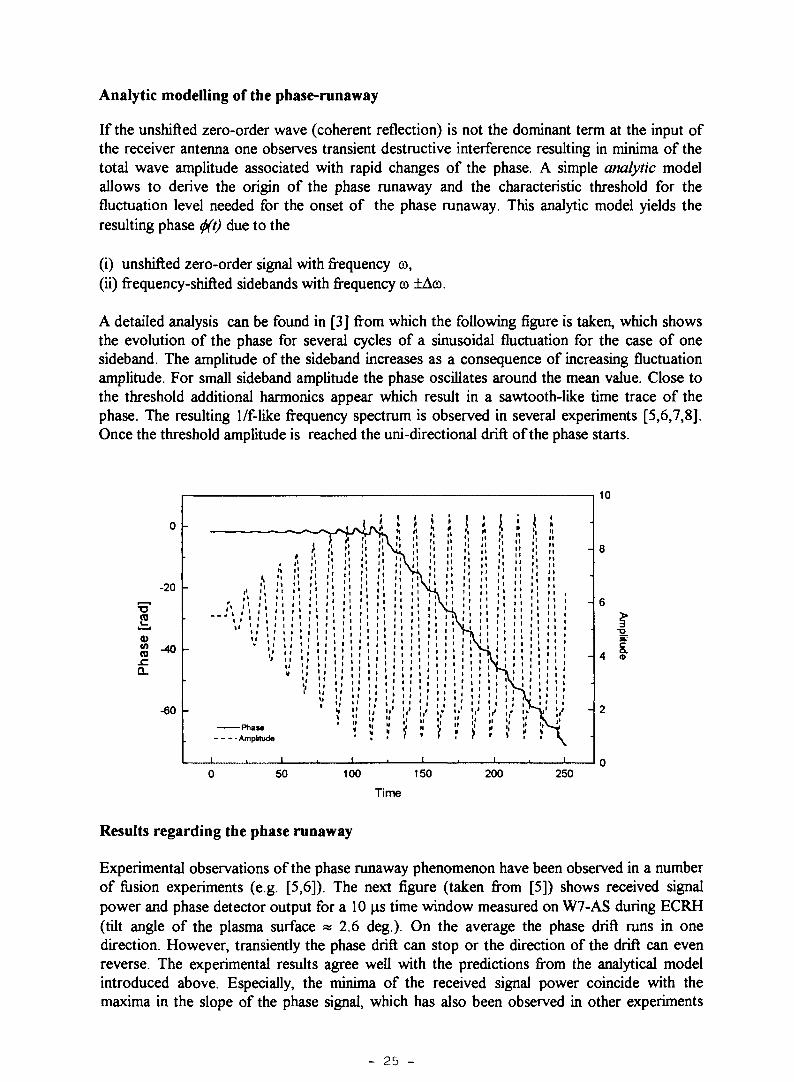
A detailed analysis can be found in [3] from which the following figure is taken, which showsthe evolution of the phase for several cycles of a sinusoidal fluctuation for the case of onesideband. The amplitude of the sideband increases as a consequence of increasing fluctuationamplitude. For small sideband amplitude the phase oscillates around the mean value. Close tothe threshold additional harmonics appear which result in a sawtooth-like time trace of thephase. The resulting 1/f-like frequency spectrum is observed in several experiments [5,6,7,8].Once the threshold amplitude is reached the uni-directional drift of the phase starts.
50 100 200 250
Time
Results regarding the phase runaway
Experimental observations of the phase runaway phenomenon have been observed in a numberof fusion experiments (e.g. [5,6]). The next figure (taken from [5]) shows received signalpower and phase detector output for a 10 u,s time window measured on W7-AS during ECRH(tilt angle of the plasma surface « 2.6 deg). On the average the phase drift runs in onedirection. However, transiently the phase drift can stop or the direction of the drift can evenreverse. The experimental results agree well with the predictions from the analytical modelintroduced above. Especially, the minima of the received signal power coincide with themaxima in the slope of the phase signal, which has also been observed in other experiments
- 25 -
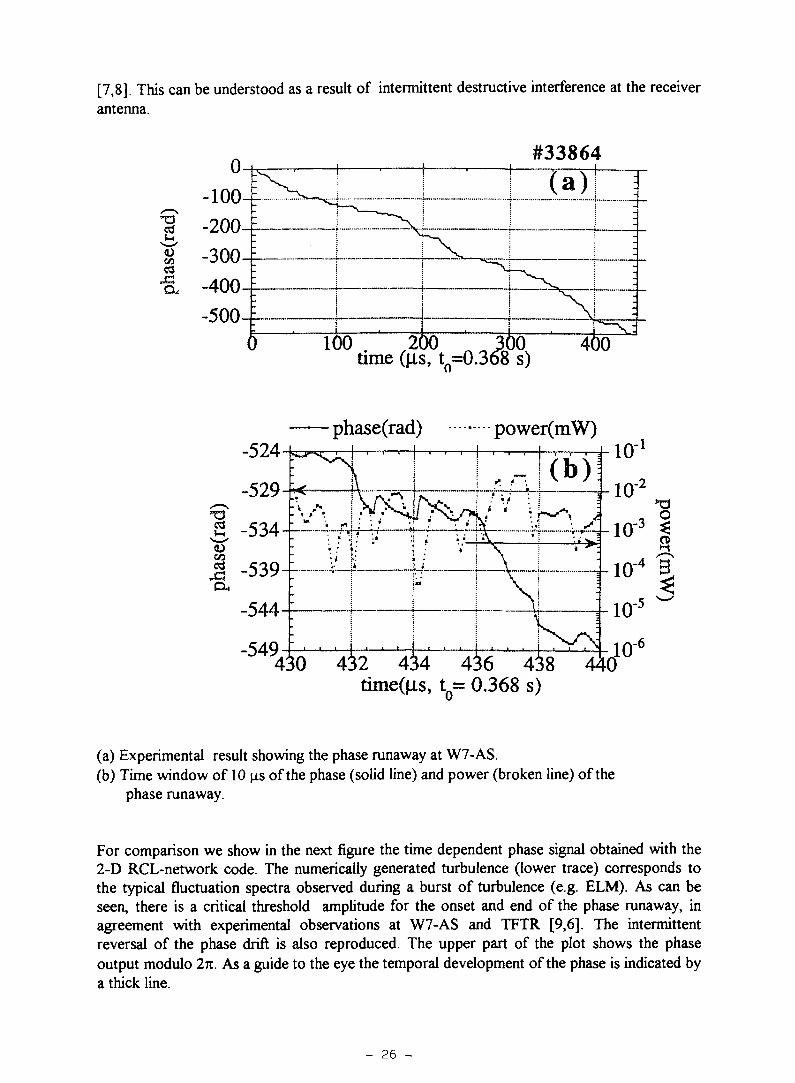
[7,8]. This can be understood as a result of intermittent destructive interference at the receiverantenna.
#33864
time (p.s, to=0.368 s)
phase(rad) power(mW)
S -534-r~-4-T>
"549430 4^2 4^4 4^6 4^8 440*°time(fis, to= 0.368 s)
(a) Experimental result showing the phase runaway at W7-AS.(b) Time window of 10 us of the phase (solid line) and power (broken line) of the
phase runaway.
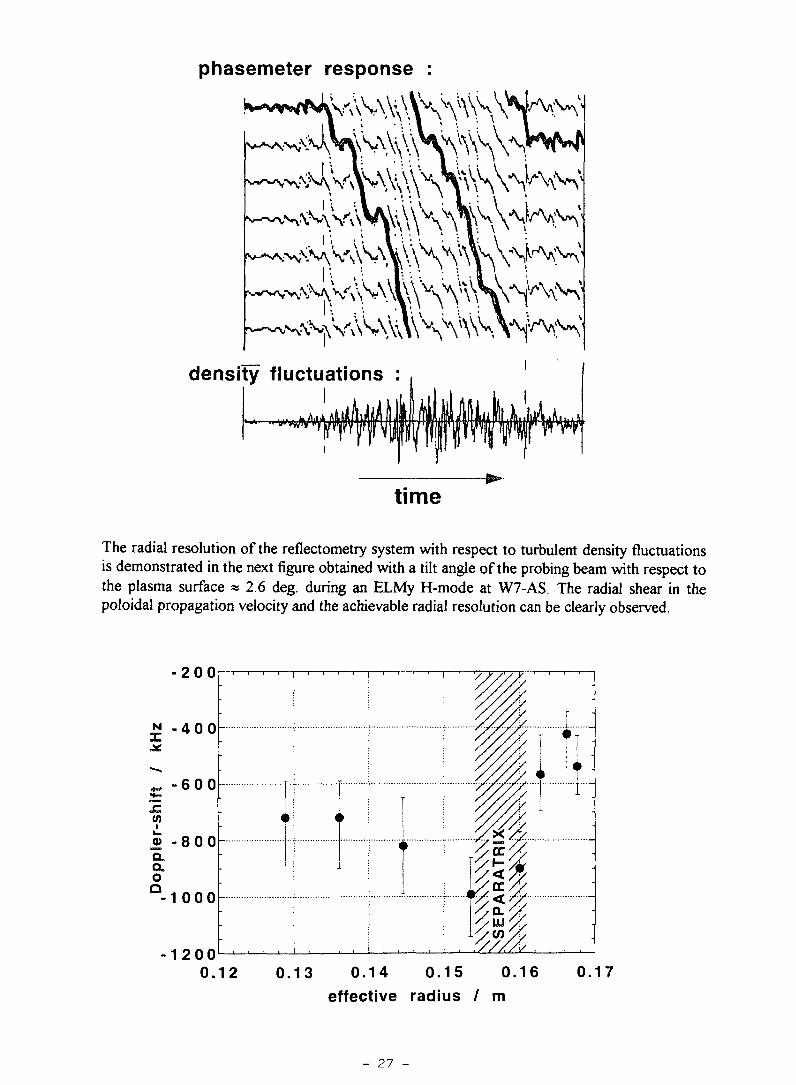
For comparison we show in the next figure the time dependent phase signal obtained with the2-D RCL-network code. The numerically generated turbulence (lower trace) corresponds tothe typical fluctuation spectra observed during a burst of turbulence (e.g. ELM). As can beseen, there is a critical threshold amplitude for the onset and end of the phase runaway, inagreement with experimental observations at W7-AS and TFTR [9,6]. The intermittentreversal of the phase drift is also reproduced. The upper part of the plot shows the phaseoutput modulo 2K. AS a guide to the eye the temporal development of the phase is indicated bya thick line.
- 26 -
phasemeter response :
\
density fluctuations
time
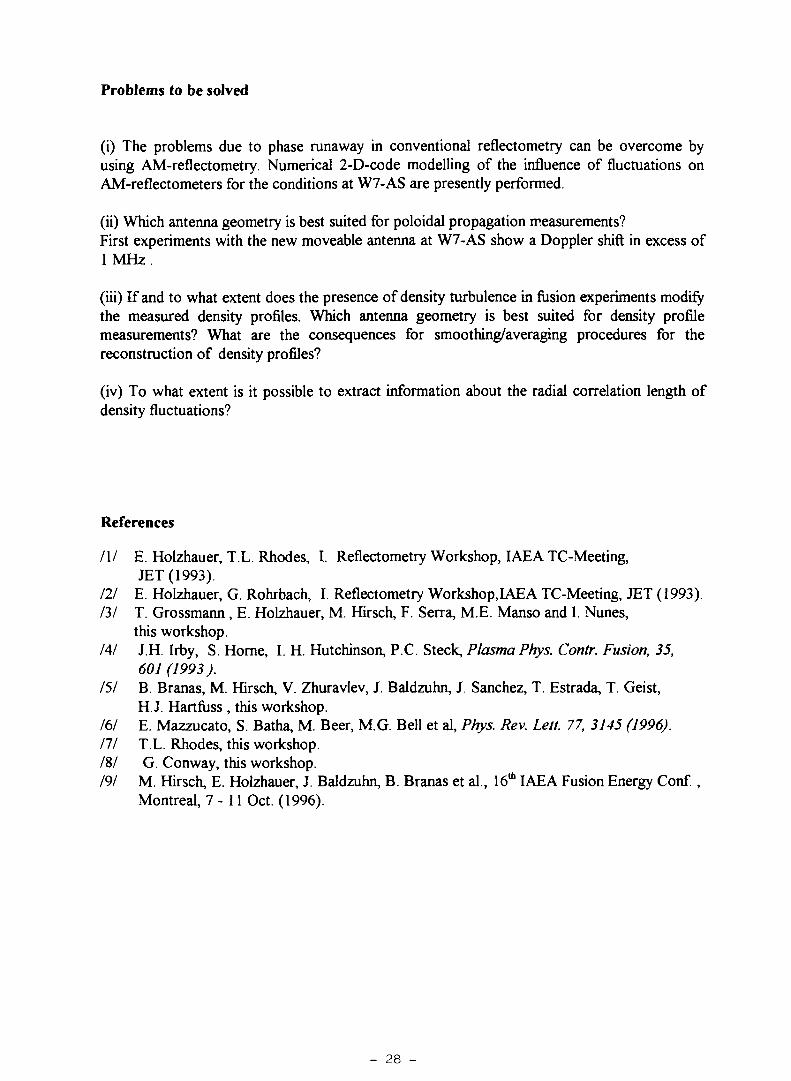
The radial resolution of the reflectometry system with respect to turbulent density fluctuationsis demonstrated in the next figure obtained with a tilt angle of the probing beam with respect tothe plasma surface « 2.6 deg. during an ELMy H-mode at W7-AS. The radial shear in thepoloidal propagation velocity and the achievable radial resolution can be clearly observed.
- 2 0 0
N - 4 0 0
„ - 6 0 0
(A
- 8 0 0aao
Q-1 0 0 0
- 1 2 0 0 i . , ,
r
0 .12 0 .13 0 .14 0 .15 0 .16
effective radius / m
T"
0.17
- 27 -
Problems to be solved
(i) The problems due to phase runaway in conventional reflectometry can be overcome byusing AM-reflectometry. Numerical 2-D-code modelling of the influence of fluctuations onAM-reflectometers for the conditions at W7-AS are presently performed.
(ii) Which antenna geometry is best suited for poloidal propagation measurements?First experiments with the new moveable antenna at W7-AS show a Doppler shift in excess of1 MHz.
(iii) If and to what extent does the presence of density turbulence in fusion experiments modifythe measured density profiles. Which antenna geometry is best suited for density profilemeasurements? What are the consequences for smoothing/averaging procedures for thereconstruction of density profiles?
(iv) To what extent is it possible to extract information about the radial correlation length ofdensity fluctuations?
References
III E. Holzhauer, T.L. Rhodes, I. Reflectometry Workshop, IAEA TC-Meeting,JET (1993).
Ill E. Holzhauer, G. Rohrbach, I. Reflectometry Workshop.IAEA TC-Meeting, JET (1993).131 T. Grossmann , E. Holzhauer, M. Hirsch, F. Serra, M.E. Manso and I. Nunes,
this workshop.141 J.H. Irby, S. Home, I. H. Hutchinson, P.C. Steck, Plasma Phys. Contr. Fusion, 35,
601(1993).151 B. Branas, M. Hirsch, V. Zhuravlev, J. Baldzuhn, J. Sanchez, T. Estrada, T. Geist,
H. J. Hartfiiss , this workshop.161 E. Mazzucato, S. Batha, M. Beer, M.G. Bell et al, Phys. Rev. Lett. 77, 3145 (1996).Ill T.L. Rhodes, this workshop./8/ G. Conway, this workshop.191 M. Hirsch, E. Holzhauer, J. Baldzuhn, B. Branas et al., 16th IAEA Fusion Energy Conf. ,
Montreal, 7 - 11 Oct. (1996).
- 28 -

A 2-D Code for the Analysis of Microwave ReflectometryMeasurements in Fusion Experiments
M.T. Grossmann, E. Holzhauer !, M. Hirsch 2, F. SerrajM. E. Manso and I.Nunes
Associaçâo EURATOM/IST, Centro de Fusâo Nuclear,1096 Lisboa Codex, Portugal
'institutfur Plasmaforschung, Universitât Stuttgart, Germany2Max-Planck-lnstitut fiir Plasmaphysik, EURATOM Association, D-85748 Garching,
GermanyI - Introduction
Density fluctuations affect the group delay of electromagnetic waves probing theplasma and undergoing reflection from a cutoff layer. The purpose of the analysis ofdensity fluctuations in reflectometry experiments is therefore two-fold: to deduce thespatial and spectral characteristics of the fluctuations and to understand their impacton the evaluation of density profiles.Several theoretical studies have been undertaken recently in order to analyse theinfluence of density fluctuations on reflectometry signals. The reduction of the full-wave equation to a first-order Born approximation was treated analytically for the 1-D( Zou et al. 1990, Mazzucato and Nazikian 1991, Bretz 1992, Hutchinson 1992,Afeyan et al., 1995) and 2-D cases (Bruskin et al., 1995). Also several numericalcodes were developed (using finite difference methods), for the direct solution of thewave equation in 2-D, with the Born single- scattering approximation (Fanack et al.1996, Conway et al., 1996) or full - wave multiple scattering (Irby et al., 1993).1-D solutions can provide insight about the interpretation of the measurements,namely in what concerns the localisation of the phase response of a reflectometer toradially propagating fluctuations: either due to the oscillation of the cut-off layer (forfluctuations with kf « ko ) or to Bragg resonant scattering away from the cutoff layer(where kf = 2 k (x), for 2kA < kf< 2ko, kA being the finite wavenumber at the cut-off). The phase response is strongly influenced by the shape of the localisedperturbation: for a damped wavetrain with sharp boundaries (broad spectrum) thephase response is dominant at cut-off for any value of the fluctuating wavenumber(Fanack et al. 1995, Grossmann et al. 1995), in agreement with experiments ( Rhodeset al., 1992). Moreover the scattering process is roughly localised in the cut-off layeras long as the k-spectrum is concentrated below a critical value; this should be thecase of tokamaks where usually the turbulence exhibits a spectrum rapidly decayingabove k = 5 cm"1 (Fanack et al., 1995).However, for a quantitative analysis of fluctuation measurements, 2-D effects (asrefraction, diffraction, interference and beam divergence) have to be included in thescattering models, namely to account for poloidally propagating oscillatory modes: ifkf < 2k0 , the layer behaves as a "corrugated" surface that will scatter the incidentbeam, leading to Doppler-shifted components.Here we present a 2-D numerical code based on spatially distributed RLC networks(Holzhauer and Rohrbach, 1992) to model the full-wave propagation in the densityfluctuating plasma; it is easily adapted to different antennae-plasma configurationsand to both O and X-modes. The code was applied to the study of the influence of
- 29 -
poloidal rotating structures in X-mode reflectometry measurements (with the AMand carrier phase system) on the W7-AS stellarator, taking into account the antennae-plasma geometry of the diagnostic: two poloidally separated antennae(emitter/receiver). The numerical simulations reveal the existence of an anomalousdrift of the phase ("phase runaway") above a given threshold of the perturbation,when a plasma tilting with respect to the symmetry axis of the two antennae is takeninto account.
II - Numerical code
The code is based on spatially distributed RLC networks to model the full-wavepropagation of electromagnetic waves (É = £oexp j(k.r -ox)) in a densityfluctuating plasma. Using the Maxwell equations (where the plasma effects areincluded in the response of the current density J to the wave electric field E), in thecold plasma approximation and for O-mode propagation , one obtains for 1-D
geometry ( k JL Bo ( ky= kz= 0 ), É \\ Bo (E = EZ), with Bo = Boez ):
Ax = jcoAx|ioH (1)
3H,-Ax = (JC
• ) E ,
Ax nee Ax nee
(2)
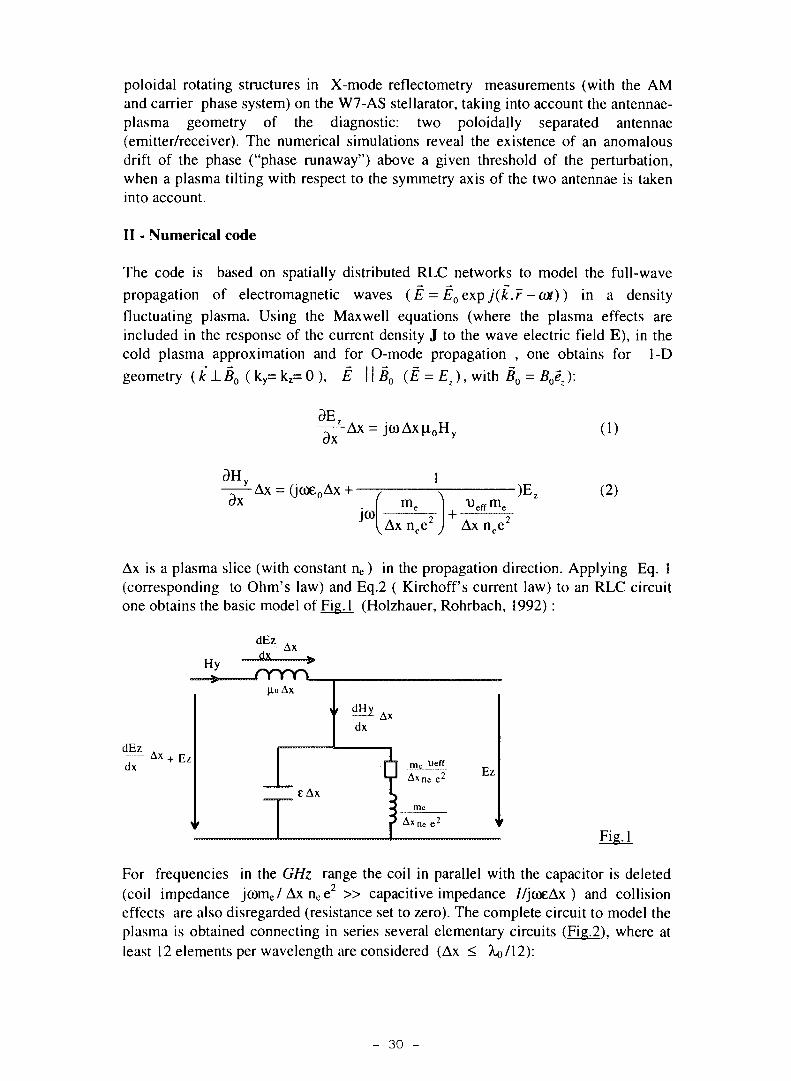
Ax is a plasma slice (with constant ne ) in the propagation direction. Applying Eq. 1(corresponding to Ohm's law) and Eq.2 ( Kirchoff's current law) to an RLC circuitone obtains the basic model of Fig. 1 (Holzhauer, Rohrbach, 1992) :
Hy
dEz
dx
dEzdx
Ax
srrrx,HuAx
dxAx
Ax n c e 2 Ez
e Ax
Fig.l
For frequencies in the GHz range the coil in parallel with the capacitor is deleted(coil impedance jcùme/Axnee
2 » capacitive impedance //jcœAx ) and collisioneffects are also disregarded (resistance set to zero). The complete circuit to model theplasma is obtained connecting in series several elementary circuits (Fig.2), where atleast 12 elements per wavelength are considered (Ax < Ào/12):
- 30 -
T.—» o Fig.
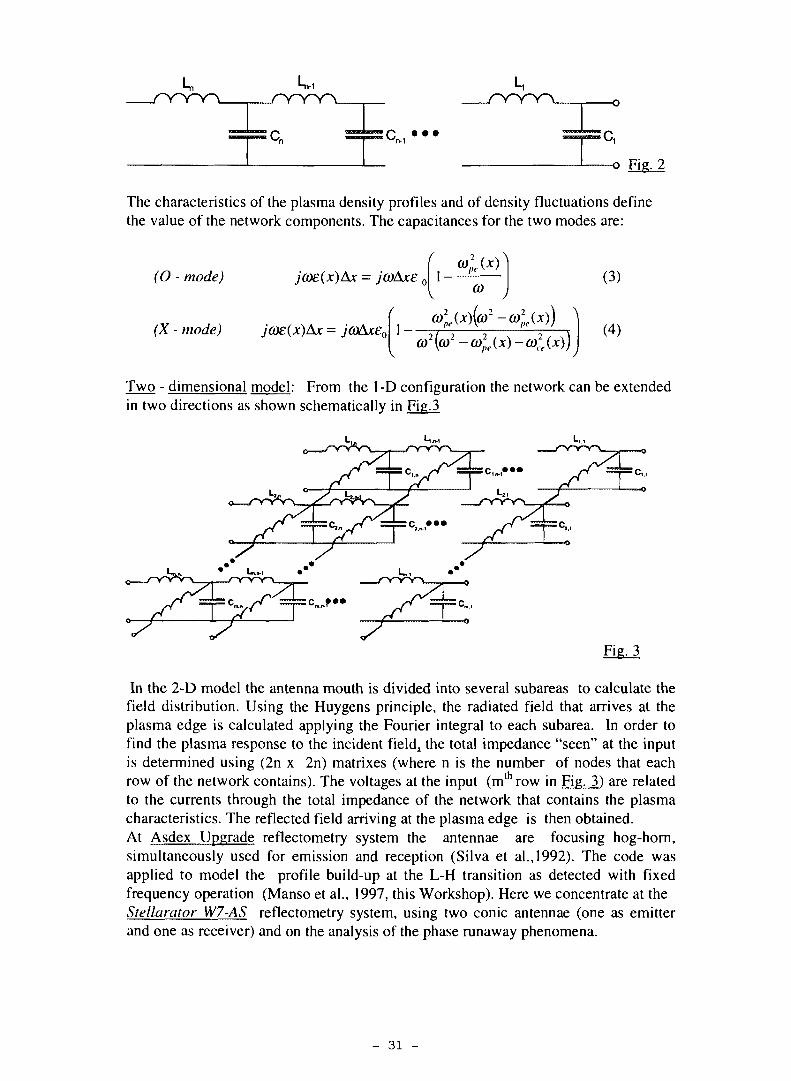
The characteristics of the plasma density profiles and of density fluctuations definethe value of the network components. The capacitances for the two modes are:
(O - mode) jo)£(x)Ax = jcoAxe J 1 -<(*)
(û
(X - mode) jcoe(x)Ax = jœAxeo\ 1 - -
(3)
(4)
Two - dimensional model: From the 1 -D configuration the network can be extendedin two directions as shown schematically in Fig.3
In the 2-D model the antenna mouth is divided into several subareas to calculate thefield distribution. Using the Huygens principle, the radiated field that arrives at theplasma edge is calculated applying the Fourier integral to each subarea. In order tofind the plasma response to the incident fields the total impedance "seen" at the inputis determined using (2n x 2n) matrixes (where n is the number of nodes that eachrow of the network contains). The voltages at the input (mlh row in Fig. 3) are relatedto the currents through the total impedance of the network that contains the plasmacharacteristics. The reflected field arriving at the plasma edge is then obtained.At Asdex Upgrade reflectometry system the antennae are focusing hog-horn,simultaneously used for emission and reception (Silva et al., 1992). The code wasapplied to model the profile build-up at the L-H transition as detected with fixedfrequency operation (Manso et al., 1997, this Workshop). Here we concentrate at theStellarator W7-AS reflectometry system, using two conic antennae (one as emitterand one as receiver) and on the analysis of the phase runaway phenomena.
- 31 -
HI - Phase runaway at the W7-AS reflectometry system
An anomalous drift of the phase, too large to be explained by a realistic radialmovement of the cut-off layer is usually referred as "phase runaway" (d<|)/dt ~ 100 -200 kHz at W7-AS). It has been detected in several reflectometry devices andattributed to the Doppler shift of the probing beam reflected from rotating cut-offlayer disturbances (Sanchez et al., 1992; Bulanin, Korneev, 1994). First directcomparisons of the phase runaway with plasma rotation measurements have beenrecently reported at W7-AS, showing that the drift is inverted as the rotation isreversed (by inverting the magnetic field); using a 2-D WKB code numericalsimulations have shown that for a net drift of the phase to appear it is necessary someasymmetry: in the geometry of the emitting/receiving horns and/or in the turbulentrotating structures (Branas, Hirsch et al., 1997, this workshop). Here we describebriefly a theoretical approach for the occurrence of phase drift due to scattering, andcompare it with numerical simulations using the 2-D RLC code adapted to the two-antenna geometry of the W7-AS reflectometry system.
(i) Theoretical analysis
A microwave of frequency co which has been reflected from a plasma, in generalcontains a signal of the incident frequency and additional components at frequenciesco + AoXt); the frequency shift is A(w = /fc,.v ,, , where v ,, is the poloidal velocity of a
rotating perturbation. The non-shifted signal corresponds to reflection and refractionin the stationary plasma. In contrast the frequency shifted components uu±Aco(t)result from the modulations of the optical properties due to temporal perturbations ofthe plasma (described either as moving structures on the surface of a mirror, or astemporal fluctuations of the refractive index in the propagating path), leading toscattering of the probing waves (Hirsch, Holzhauer et al., 1997, this Workshop). Acombination of Doppler-shifted return signals might lead to a ramping of the phasedetected at a receiver antenna in a different poloidal position with respect to theemitter, as shown with 2-D numerical simulations (Irby et al., 1993).The perturbed received reflectometry signal (with heterodyne detection) ischaracterised by the amplitude A(t) and a time dependent phase shift <|)(t). In thefollowing the reflected signal will be represented by three spectral components S °, S+
and S ' , with frequencies (O, Û)+ACÛ+ and co-Ao). Their interference at the receivingantenna will lead to a signal output:
S" + S+ +S~ = cos(a>r) + a+ cos(cot)cos(Aa>+t) -a+ sin(û)f ) sin( Aco+t)(5)
+ a cos((Ot)cos(A(O t) + a sin(ct)r)sin(Aû> f)
where the phase of S° was set to zero, and the amplitudes ( a + , a ~ ) have beennormalised with respect to the amplitude of the non-shifted signal. Assuming that thesignal at the output of the receiver antenna is S(t) = A (t) cos ( cot + <))(t)), one obtainsfor the measured phase:
a+ sin(A(0+1) - a~ sin(AûW)tan 0(0 = : ; (6)
\ + u cos(Aco t) + a cos(Aco t)
- 32 -
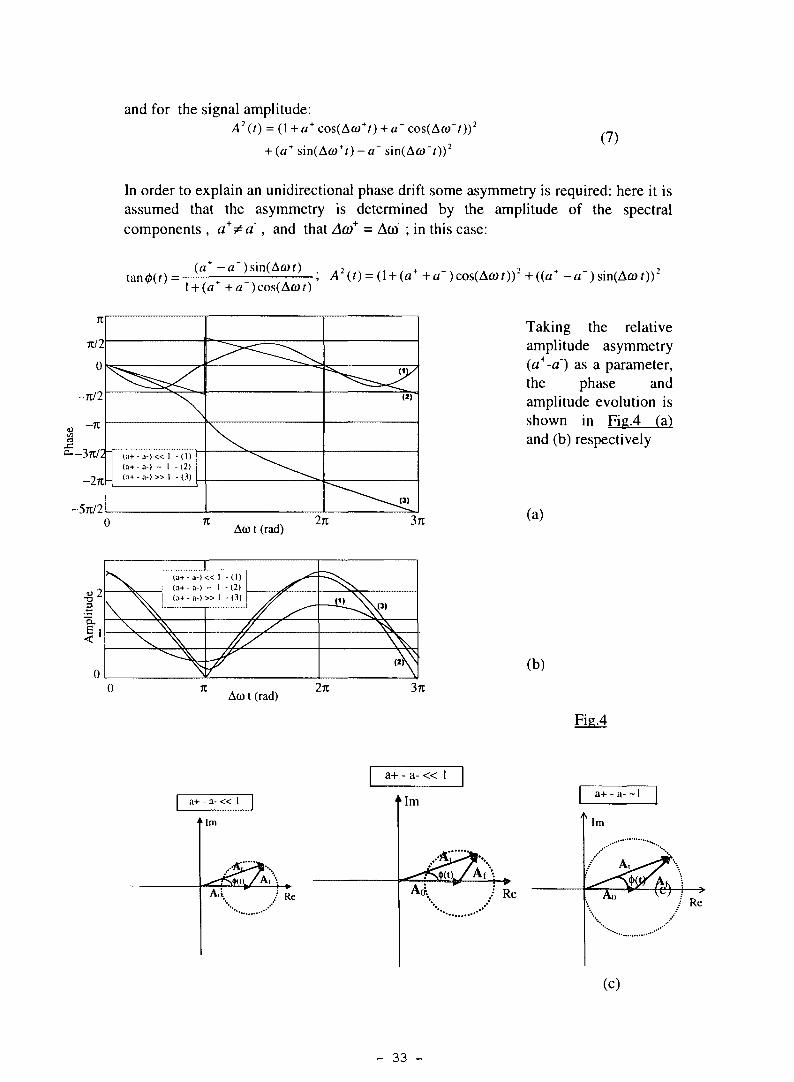
and for the signal amplitude:A2(t) = ( l + a + cos(Aft)+r) + a' cos(A(o't))2
+ (a+ sin(A(O*t)-a~ sin(Au>~0)2(7)
In order to explain an unidirectional phase drift some asymmetry is required: here it isassumed that the asymmetry is determined by the amplitude of the spectralcomponents , a+ïa~, and that Aa>+ = A(Û ; in this case:
tan0(0= ~U ) S i n ( A t " ? )
(a +a )cos(Awf)
AM t (rad)
Aco t (rad)
a+ - a- « 1
Im
Ai *:
2TC
271
Aiii / Re
7:
7C/2
0
-71/2
-27C
Sir/?
( a + - a - ) « 1 - (1)(a+-a-) - 1 - (2 )(a+ - a-) » 1 - (3)
371
litu
de
F i< '
0
N\ \
(a+(a+(a+
- a-) « 1-a-) - 1- a-) » 1
- ( I )-(2)-(3)
\ V
3T:
a+ - a- « 1
Im
Taking the relativeamplitude asymmetry(a+-a) as a parameter,the phase andamplitude evolution isshown in Fig.4 (a)and (b) respectively
(a)
(b)
,: Re
Fig.4
/ Re
(c)
- 33 -
In the diagram of Fig. 4.c, Ao and Af are the complex amplitudes of the non-shiftedand the shifted signals, shown for 3 typical situations. For (a+-a) « 1 , thecontribution of the fluctuation to the total complex amplitude A, is small, and a phasewhich periodically changes around the phase of S° is obtained: (|)(t) = (a+-a~)sin(Aû)t). For (a+- a) ~\ the threshold condition (Af=-Ao) for the occurrence ofDoppler shift in the phase occurs: <j)(t) displays a "step" with a height of 7t;simultaneously fully destructive interference of the signals imply the amplitude dropto zero. If (a+-a') increases slightly above this level a periodic rapid change of thephase (IA((>l=7t) is observed when the amplitude A(t) has its minimum. Above thethreshold the average slope of the phase change is independent of the specific value of(a+-a'). When (a+-a) » 1 , the power of the unshifted signal component can beneglected. The amplitude of the received signal is dominated by the amplitude of theshifted component. The phase changes continuously as <|)(t)= Aœt, that is, the signalobtained at the antenna output is Doppler shifted by Aœ and therefore a continuousdrift of the phase should be detected ("phase runaway").
In a real experiment there are two possible sources for the asymmetry: amisalignment of the antenna with respect to the normal direction onto the plasmasurface; a tilt angle of the plasma column which depends on the operating parametersof the plasma experiment and must be obtained from suitable diagnostic methods
(ii) 2-D simulation and comparison with experimental results
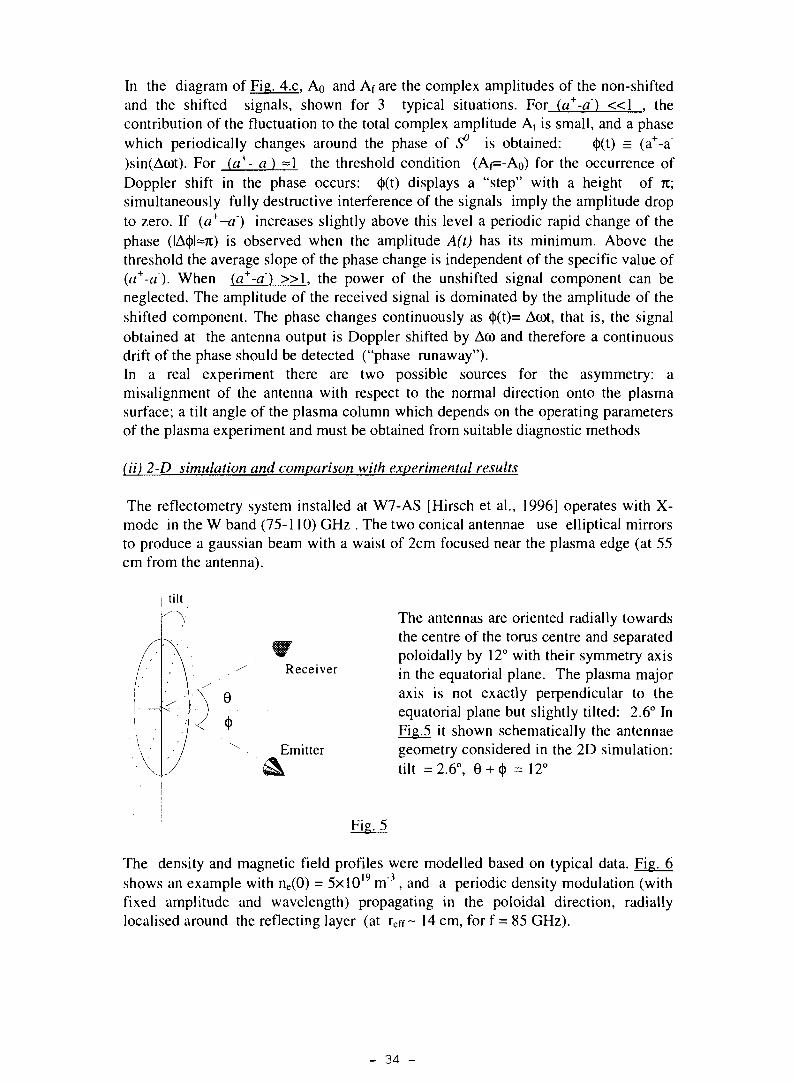
The reflectometry system installed at W7-AS [Hirsch et al., 1996] operates with X-mode in the W band (75-110) GHz . The two conical antennae use elliptical mirrorsto produce a gaussian beam with a waist of 2cm focused near the plasma edge (at 55cm from the antenna).
t i l t
The antennas are oriented radially towardsthe centre of the torus centre and separatedpoloidally by 12° with their symmetry axis
Receiver j n t n e equatorial plane. The plasma majoraxis is not exactly perpendicular to theequatorial plane but slightly tilted: 2.6° InFig.5 it shown schematically the antennae
Emitter geometry considered in the 2D simulation:i tilt =2.6°, 0 + <|> =12°
'
The density and magnetic field profiles were modelled based on typical data. Fig. 6shows an example with ne(0) = 5x l0 l 9 m 3 , and a periodic density modulation (withfixed amplitude and wavelength) propagating in the poloidal direction, radiallylocalised around the reflecting layer (at reff~ 14 cm, for f = 85 GHz).
- 34 -
0.040.03 width [m]
LOI'
Fig.6
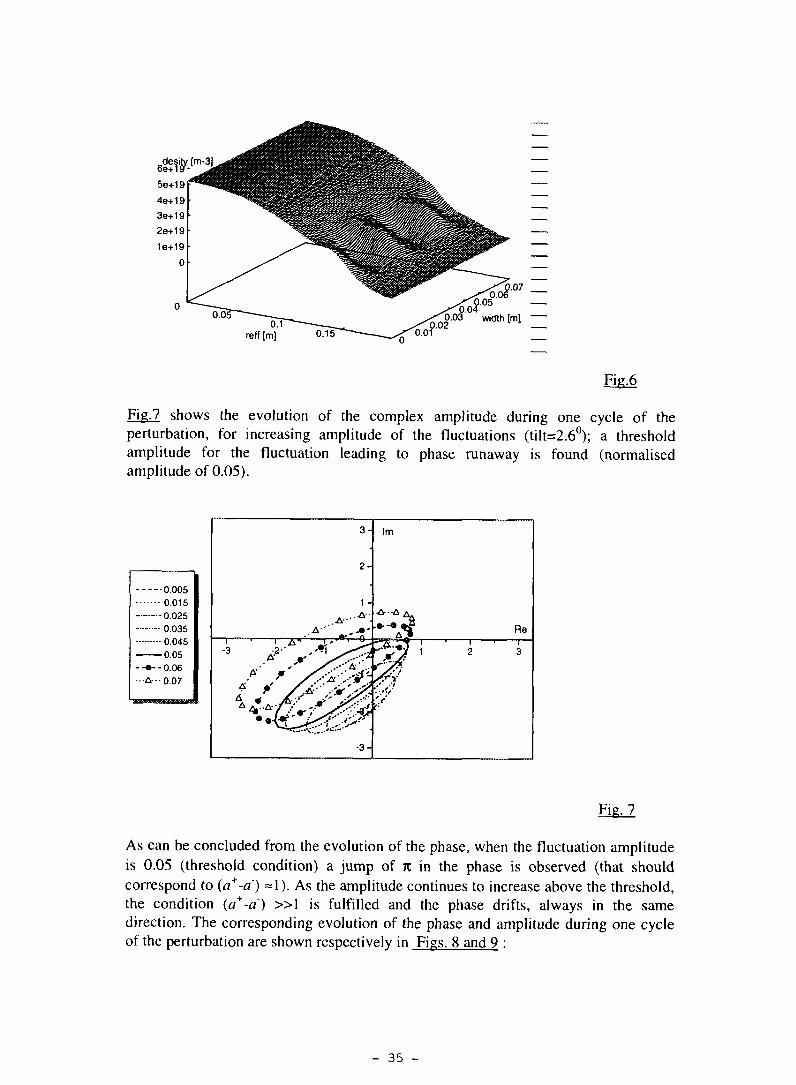
Fig.7 shows the evolution of the complex amplitude during one cycle of theperturbation, for increasing amplitude of the fluctuations (tilt=2.6°); a thresholdamplitude for the fluctuation leading to phase runaway is found (normalisedamplitude of 0.05).
0.0050.0150.0250.0350.0450.05
-0.06-0.07
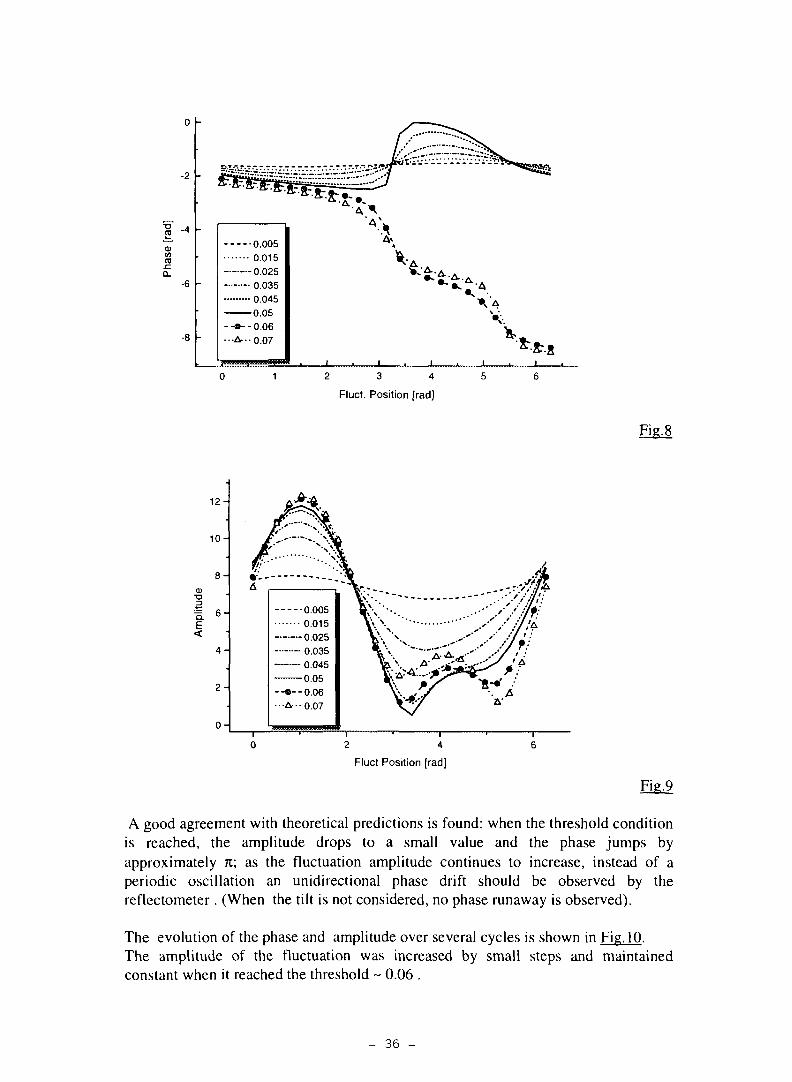
As can be concluded from the evolution of the phase, when the fluctuation amplitudeis 0.05 (threshold condition) a jump of 71 in the phase is observed (that shouldcorrespond to (a+-a") =1). As the amplitude continues to increase above the threshold,the condition (a+-a) » 1 is fulfilled and the phase drifts, always in the samedirection. The corresponding evolution of the phase and amplitude during one cycleof the perturbation are shown respectively in Figs. 8 and 9 :
- 35 -
•a
CDmasc
-2
-4
-8
2 3 4
Fluct. Position [rad]
Fig.8
12-
1 0 -
8 -
CDT3
4 -
2 -
0 -
0.005
0.015
0.025
0.035
0.045
0.05
• - - 0 . 0 6
A- -0 .07
2 4
Fluct Position [rad]
A good agreement with theoretical predictions is found: when the threshold conditionis reached, the amplitude drops to a small value and the phase jumps byapproximately n; as the fluctuation amplitude continues to increase, instead of aperiodic oscillation an unidirectional phase drift should be observed by thereflectometer. (When the tilt is not considered, no phase runaway is observed).
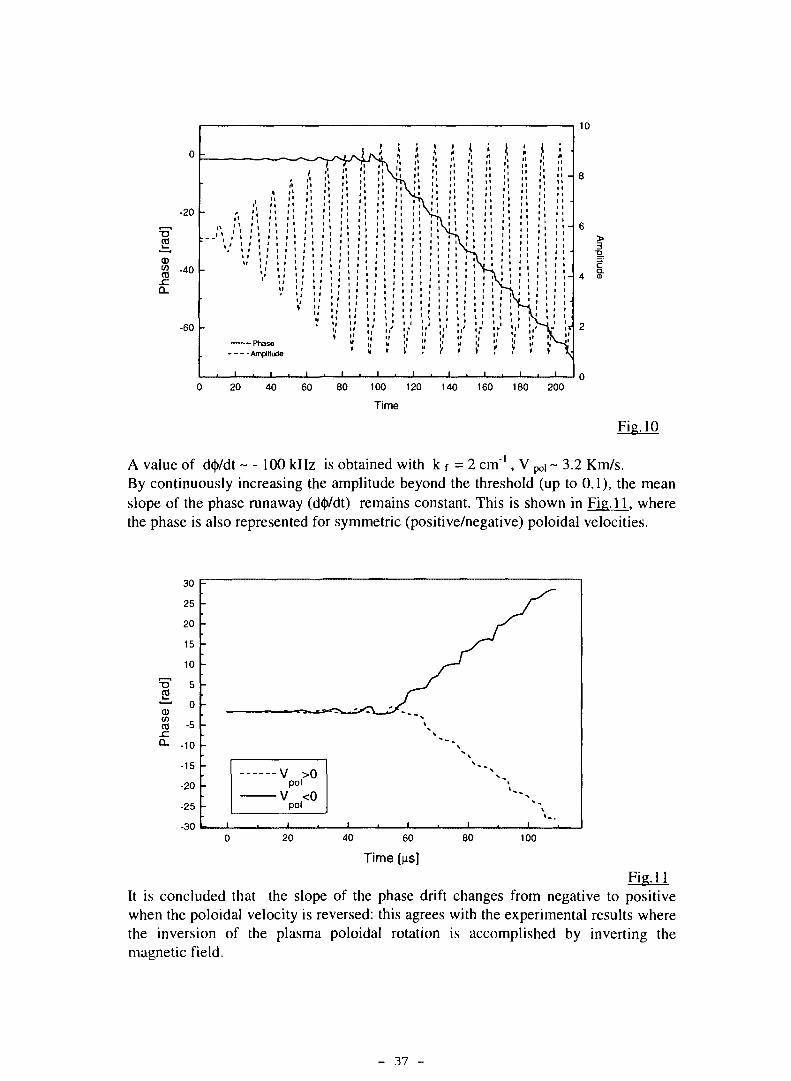
The evolution of the phase and amplitude over several cycles is shown in Fig. 10.The amplitude of the fluctuation was increased by small steps and maintainedconstant when it reached the threshold ~ 0.06 .
- 36 -
s0
0
-20
-40
-60
i
r • ' . 1 1 1
, . ' • ' ' . • ' ''
- ' • ; : ' • • : • ; • :ii ' i
ti
i
; ;
I I* • i
Phase
Amplitude
i . i . i
1111uu
1 11 t
\
f y 7h ;1 • ! ! i \ i» \ ' , «I
1 * ' i '1 1 i i '" i if1' . . H
1 i »i . 1 .
1» >
' ' ' l11 ,
•Vil j: !m
'! " !•';• ? :;
1 l^\1 • \ l'. ; • • •
u 'Tu i,'« t
. i
\ : • :
: •HV;i • i >-
i1 su 'ij Lt 1
± i
ili/••
; .i "
iîv
' _
i '
1 1i
10
- 8
- 6
- 4
>T5
20 40 60 80 100 120
Time
140 160 180 200
A value of d<|)/dt ~ - 100 kHz is obtained with k f = 2 cm"1, V poi ~ 3.2 Km/s.By continuously increasing the amplitude beyond the threshold (up to 0.1), the meanslope of the phase runaway (d()>/dt) remains constant. This is shown in Fig. 11, wherethe phase is also represented for symmetric (positive/negative) poloidal velocities.
(U
Q,
30
25
20
15
10
5
0
-5
-10
-15
-20
-25
-30
-
-
-
Jl
v >opol
V <0pol
1
" ~ \I
\
\
\^
20 40 60 80 100
Time [us]
It is concluded that the slope of the phase drift changes from negative to positivewhen the poloidal velocity is reversed: this agrees with the experimental results wherethe inversion of the plasma poloidal rotation is accomplished by inverting themagnetic field.
- 37 -
200
100
0
#33860 / 33937
-200
• +Bo -B
: O
0.08 0.1 0.12 0.14r(m)
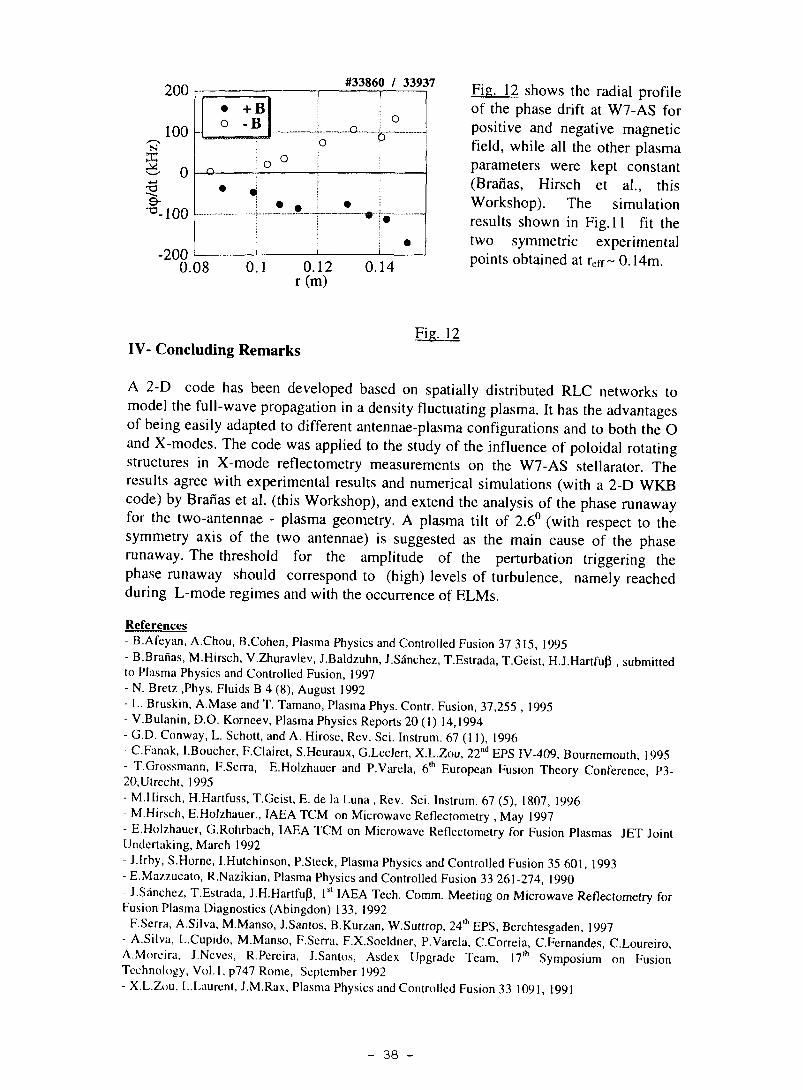
Fig. 12 shows the radial profileof the phase drift at W7-AS forpositive and negative magneticfield, while all the other plasmaparameters were kept constant(Branas, Hirsch et al., thisWorkshop). The simulationresults shown in Fig. 11 fit thetwo symmetric experimentalpoints obtained at reff ~ 0.14m.
IV- Concluding Remarks
A 2-D code has been developed based on spatially distributed RLC networks tomodel the full-wave propagation in a density fluctuating plasma. It has the advantagesof being easily adapted to different antennae-plasma configurations and to both the Oand X-modes. The code was applied to the study of the influence of poloidal rotatingstructures in X-mode reflectometry measurements on the W7-AS stellarator. Theresults agree with experimental results and numerical simulations (with a 2-D WKBcode) by Branas et al. (this Workshop), and extend the analysis of the phase runawayfor the two-antennae - plasma geometry. A plasma tilt of 2.6° (with respect to thesymmetry axis of the two antennae) is suggested as the main cause of the phaserunaway. The threshold for the amplitude of the perturbation triggering thephase runaway should correspond to (high) levels of turbulence, namely reachedduring L-mode regimes and with the occurrence of ELMs.
References- B.Afeyan, A.Chou, B.Cohen, Plasma Physics and Controlled Fusion 37 315, 1995- B.Branas, M.Hirsch, V.Zhuravlev, J.Baldzuhn, J.Sânchez, T.Estrada, T.Geist, H.J.HartfuP , submittedto Plasma Physics and Controlled Fusion, 1997- N. Bretz ,Phys. Fluids B 4 (8), August 1992- L. Bruskin, A.Mase and T. Tamano, Plasma Phys. Contr. Fusion, 37,255 , 1995- V.Bulanin, D.O. Korneev, Plasma Physics Reports 20 (1) 14,1994- G.D. Conway, L. Schott, and A. Hirose, Rev. Sci. Instrum. 67 (11), 1996- C.Fanak, I.Boucher, F.Clairet, S.Heuraux, G.Leclert, X.L.Zou, 22nd EPS IV-409, Bournemouth, 1995
E.Holzhauer and P.Varela, 6lh European Fusion Theory Conference, P3-- T.Grossmann, F.Serra,20,Utrecht, 1995- M.Hirsch, H.Hartfuss, T.Geist, E. de la Luna , Rev. Sci. Instrum. 67 (5), 1807, 1996- M.Hirsch, E.Holzhauer., IAEA TCM on Microwave Reflectometry , May 1997- E.Holzhauer, G.Rohrbach, IAEA TCM on Microwave Reflectometry for Fusion Plasmas JET JointUndertaking, March 1992- J.Irby, S.Horne, I.Hutchinson, P.Steek, Plasma Physics and Controlled Fusion 35 601, 1993- E.Mazzucato, R.Nazikian, Plasma Physics and Controlled Fusion 33 261-274, 1990- J.Sânchez, T.Estrada, J.H.Hartfup1, Is' IAEA Tech. Comm. Meeting on Microwave Reflectometry forFusion Plasma Diagnostics (Abingdon) 133, 1992- F.Serra, A.Silva. M.Manso, J.Santos, B.Kurzan, W.Suttrop, 24lh EPS, Berchtesgaden, 1997- A.Silva, L.Cupido, M.Manso, F.Serra, F.X.Soeldner, P.Varela, C.Correia, C.Fernandes, C.Loureiro,A.Moreira, J.Neves, R.Pcreira, J.Santos, Asdcx Upgrade Team, I7lh Symposium on FusionTechnology, Vol.1, p747 Rome, September 1992- X.L.Zou, L.Laurent, J.M.Rax, Plasma Physics and Controlled Fusion 33 1091, 1991
- 38 -
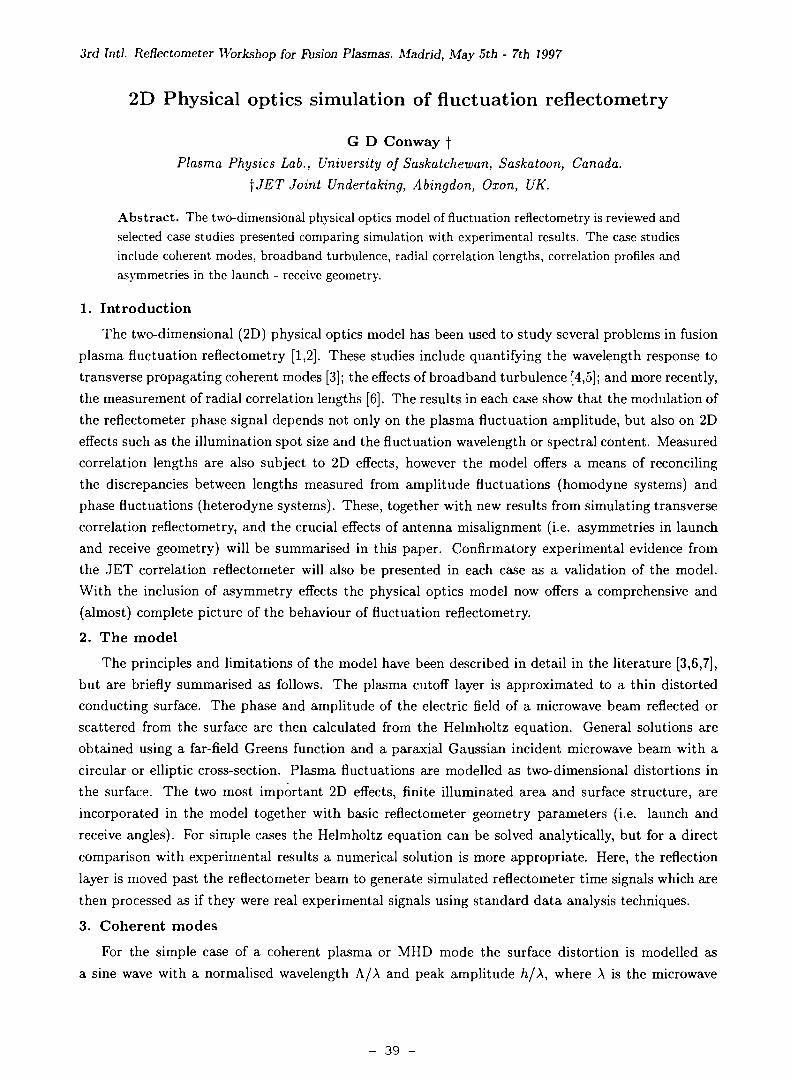
3rd Intl. ReBectometer Workshop for Fusion Plasmas. Madrid, May 5th - 7th 1997
2D Physical optics simulation of fluctuation reflectometry
G D Conway f
Plasma Physics Lab., University of Saskatchewan, Saskatoon, Canada.
\JET Joint Undertaking, Abingdon, Oxon, UK.
Abstract. The two-dimensional physical optics model of fluctuation reflectometry is reviewed andselected case studies presented comparing simulation with experimental results. The case studiesinclude coherent modes, broadband turbulence, radial correlation lengths, correlation profiles andasymmetries in the launch - receive geometry.
1. Introduction
The two-dimensional (2D) physical optics model has been used to study several problems in fusion
plasma fluctuation reflectometry [1,2]. These studies include quantifying the wavelength response to
transverse propagating coherent modes [3]; the effects of broadband turbulence [4,5]; and more recently,
the measurement of radial correlation lengths [6]. The results in each case show that the modulation of
the reflectometer phase signal depends not only on the plasma fluctuation amplitude, but also on 2D
effects such as the illumination spot size and the fluctuation wavelength or spectral content. Measured
correlation lengths are also subject to 2D effects, however the model offers a means of reconciling
the discrepancies between lengths measured from amplitude fluctuations (homodyne systems) and
phase fluctuations (heterodyne systems). These, together with new results from simulating transverse
correlation reflectometry, and the crucial effects of antenna misalignment (i.e. asymmetries in launch
and receive geometry) will be summarised in this paper. Confirmatory experimental evidence from
the JET correlation reflectometer will also be presented in each case as a validation of the model.
With the inclusion of asymmetry effects the physical optics model now offers a comprehensive and
(almost) complete picture of the behaviour of fluctuation reflectometry.
2. The model
The principles and limitations of the model have been described in detail in the literature [3,6,7],
but are briefly summarised as follows. The plasma cutoff layer is approximated to a thin distorted
conducting surface. The phase and amplitude of the electric field of a microwave beam reflected or
scattered from the surface are then calculated from the Helmholtz equation. General solutions are
obtained using a far-field Greens function and a paraxial Gaussian incident microwave beam with a
circular or elliptic cross-section. Plasma fluctuations are modelled as two-dimensional distortions in
the surface. The two most important 2D effects, finite illuminated area and surface structure, are
incorporated in the model together with basic reflectometer geometry parameters (i.e. launch and
receive angles). For simple cases the Helmholtz equation can be solved analytically, but for a direct
comparison with experimental results a numerical solution is more appropriate. Here, the reflection
layer is moved past the reflectometer beam to generate simulated reflectometer time signals which are
then processed as if they were real experimental signals using standard data analysis techniques.
3. Coherent modes
For the simple case of a coherent plasma or MHD mode the surface distortion is modelled as
a sine wave with a normalised wavelength A/A and peak amplitude h/\, where A is the microwave
- 39 -
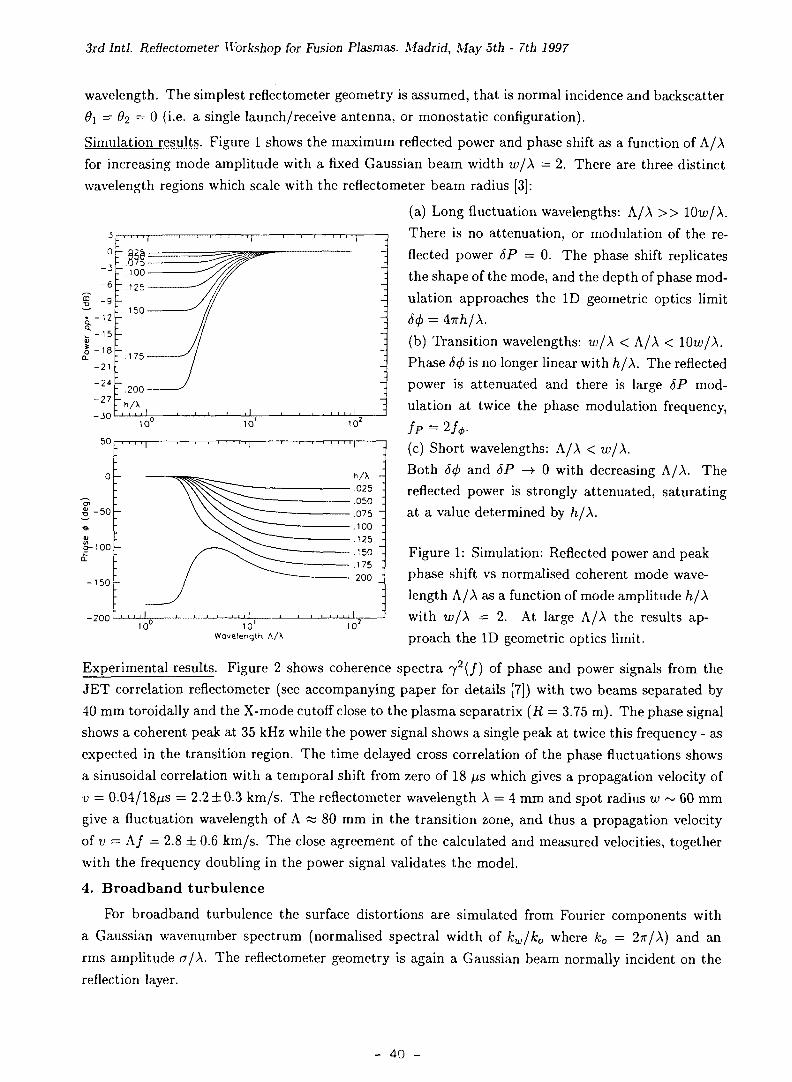
3rd Intl. Reflectometer Workshop for Fusion Plasmas. Madrid, May 5th - 7th 1997
wavelength. The simplest reflectometer geometry is assumed, that is normal incidence and backscatter
#2 = 02 = 0 (i.e. a single launch/receive antenna, or monostatic configuration).
Simulation results. Figure 1 shows the maximum reflected power and phase shift as a function of A/A
for increasing mode amplitude with a fixed Gaussian beam width w/X = 2. There are three distinct
wavelength regions which scale with the reflectometer beam radius [3]:
(a) Long fluctuation wavelengths: A/A > > 10u>/A.
There is no attenuation, or modulation of the re-
flected power ÔP = 0. The phase shift replicates
the shape of the mode, and the depth of phase mod-
ulation approaches the ID geometric optics limit
-20010'
Wavelength A/X1 0 '
6<t> =(b) Transition wavelengths: w/X < A/A < lOw/X.
Phase S(f> is no longer linear with h/X. The reflected
power is attenuated and there is large SP mod-
ulation at twice the phase modulation frequency,
fp = 2/0.
(c) Short wavelengths: A/A < w/X.
Both 5(f> and 5P —> 0 with decreasing A/A. The
reflected power is strongly attenuated, saturating
at a value determined by h/X.
Figure 1: Simulation: Reflected power and peak
phase shift vs normalised coherent mode wave-
length A/A as a function of mode amplitude h/X
with w/X = 2. At large A/A the results ap-
proach the ID geometric optics limit.
Experimental results. Figure 2 shows coherence spectra 7 2 ( / ) of phase and power signals from the
JET correlation reflectometer (see accompanying paper for details [7]) with two beams separated by
40 mm toroidally and the X-mode cutoff close to the plasma separatrix (R = 3.75 m). The phase signal
shows a coherent peak at 35 kHz while the power signal shows a single peak at twice this frequency - as
expected in the transition region. The time delayed cross correlation of the phase fluctuations shows
a sinusoidal correlation with a temporal shift from zero of 18 /us which gives a propagation velocity of
v = 0.04/18^s = 2.2 ±0.3 km/s. The reflectometer wavelength A = 4 mm and spot radius w ~ 60 mm
give a fluctuation wavelength of A « 80 mm in the transition zone, and thus a propagation velocity
of v — A/ = 2.8 ± 0.6 km/s. The close agreement of the calculated and measured velocities, together
with the frequency doubling in the power signal validates the model.
4. Broadband turbulence
For broadband turbulence the surface distortions are simulated from Fourier components with
a Gaussian wavenumber spectrum (normalised spectral width of kwjk0 where k0 = 2TT/A) and an
rms amplitude a/A. The reflectometer geometry is again a Gaussian beam normally incident on the
reflection layer.
- 40 -
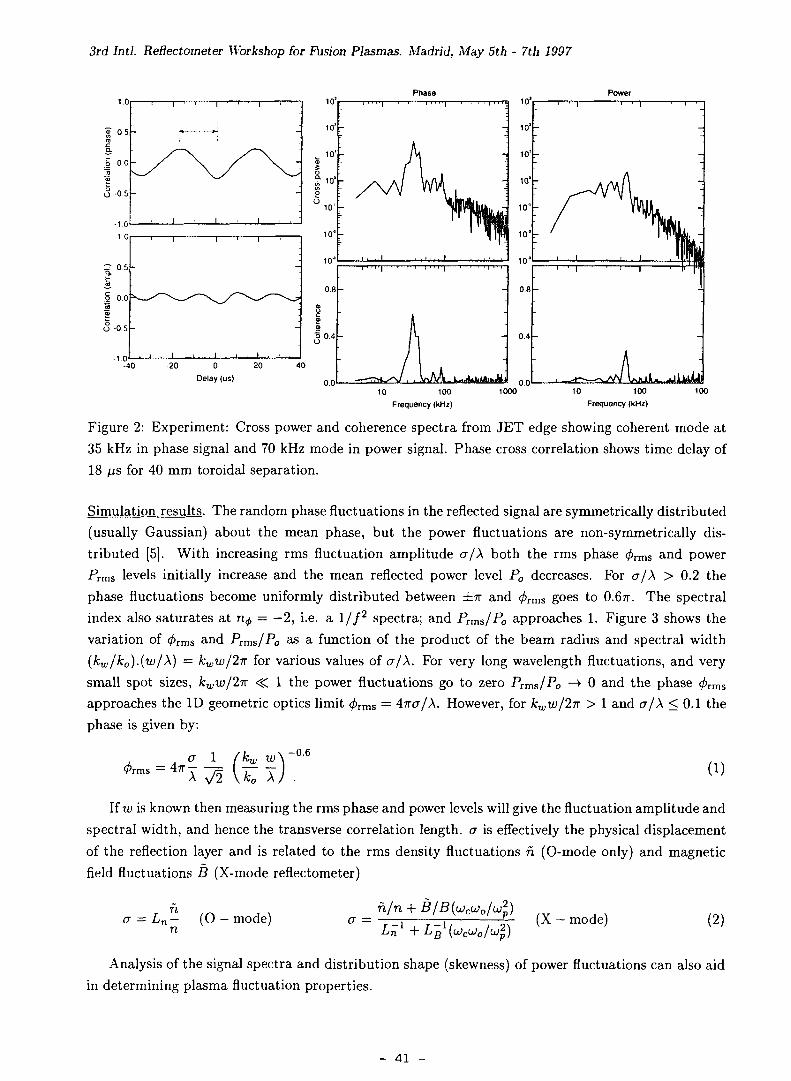
3rd Intl. ReBectometer Workshop for Fusion Plasmas. Madrid, May 5th - 7th 1997
Phase Power
10 100
Frequency (kHz)
10 100
Frequency (kHz)
100
Figure 2: Experiment: Cross power and coherence spectra from JET edge showing coherent mode at
35 kHz in phase signal and 70 kHz mode in power signal. Phase cross correlation shows time delay of
18 /is for 40 mm toroidal separation.
Simulation results. The random phase fluctuations in the reflected signal are symmetrically distributed
(usually Gaussian) about the mean phase, but the power fluctuations are non-symmetrically dis-
tributed [5]. With increasing rms fluctuation amplitude o/\ both the rms phase ^ j and power
Pvms levels initially increase and the mean reflected power level Po decreases. For a/A > 0.2 the
phase fluctuations become uniformly distributed between ±n and ^ r m s goes to 0.6TT. The spectral
index also saturates at n , = —2, i.e. a I / / 2 spectra; and Prms/P0 approaches 1. Figure 3 shows the
variation of <f>Tms and Prms/Po as a function of the product of the beam radius and spectral width
(kw/k0).(w/X) — kww/2n for various values of a/X. For very long wavelength fluctuations, and very
small spot sizes, kww/2TT <$C 1 the power fluctuations go to zero Prms/Po —*• 0 and the phase (j>rms
approaches the ID geometric optics limit <£rms = Aixa/\. However, for kww/2n > 1 and a/\ < 0.1 the
phase is given by:
a 1 fkw47r 71 U ( i )
If w is known then measuring the rms phase and power levels will give the fluctuation amplitude and
spectral width, and hence the transverse correlation length, a is effectively the physical displacement
of the reflection layer and is related to the rms density fluctuations n (0-mode only) and magnetic
field fluctuations B (X-mode reflectometer)
a = Ln— (O — mode)n a =
n/n(X - mode) (2)
Analysis of the signal spectra and distribution shape (skewness) of power fluctuations can also aid
in determining plasma fluctuation properties.
- 41 -
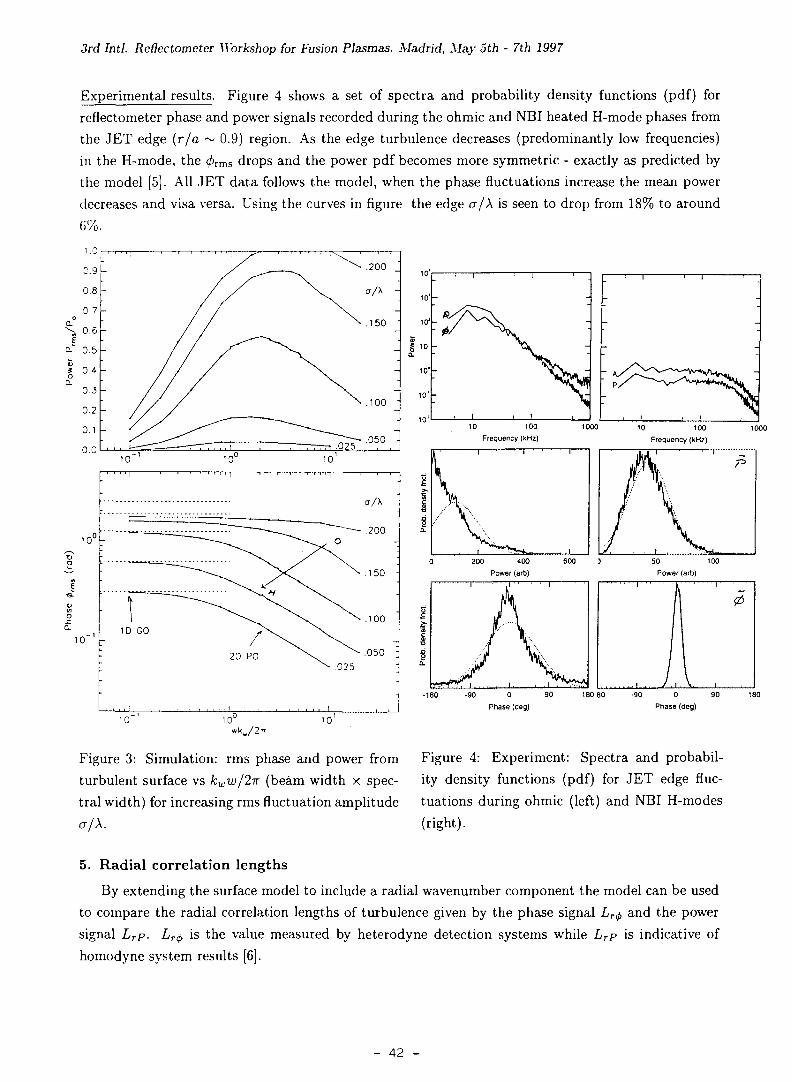
3rd Intl. Reflectometer Workshop for Fusion Plasmas. Madrid, May 5th - 7th 1997
Experimental results. Figure 4 shows a set of spectra and probability density functions (pdf) forreflectometer phase and power signals recorded during the ohmic and NBI heated H-mode phases fromthe JET edge {r/a ~ 0.9) region. As the edge turbulence decreases (predominantly low frequencies)in the H-mode, the < rms drops and the power pdf becomes more symmetric - exactly as predicted bythe model [5]. All JET data follows the model, when the phase fluctuations increase the mean powerdecreases and visa versa. Using the curves in figure the edge a/A is seen to drop from 18% to around
^10 100
Frequency (kHz)
10 -
10 ' -
•
' - ^ • ^ • ^ • • . - — . - _ _ _ _
. _ _ _ ^ \ ^
ID GO / V .
: 20 PO
' ' ' ' ' ' ! ' • '
a/\
^ ^ - — .200
<"\. .» ;
\ \ . 100
\ . ^ - .050 ;
\ .025 ;
: . , , i!
/v200 400 600 3
Power (arb)
50 100
Power (arto)I . 1 . . . . . . . . .
. 1,V.,
1
0
1
10 0
wk./2n
-180 -90 0 90 180 80 -90 0 90 180
Phase (deg) Phase (deg)
10 '
Figure 3: Simulation: rms phase and power from Figure 4: Experiment: Spectra and probabil-turbulent surface vs kww/2n (beam width x spec- ity density functions (pdf) for JET edge fluc-tral width) for increasing rms fluctuation amplitude tuations during ohmic (left) and NBI H-modesa/A. (right).
5. Radial correlation lengths
By extending the surface model to include a radial wavenumber component the model can be usedto compare the radial correlation lengths of turbulence given by the phase signal LT<!> and the powersignal Lrp. Lr$ is the value measured by heterodyne detection systems while LTp is indicative ofhomodyne system results [6].
- 42 -
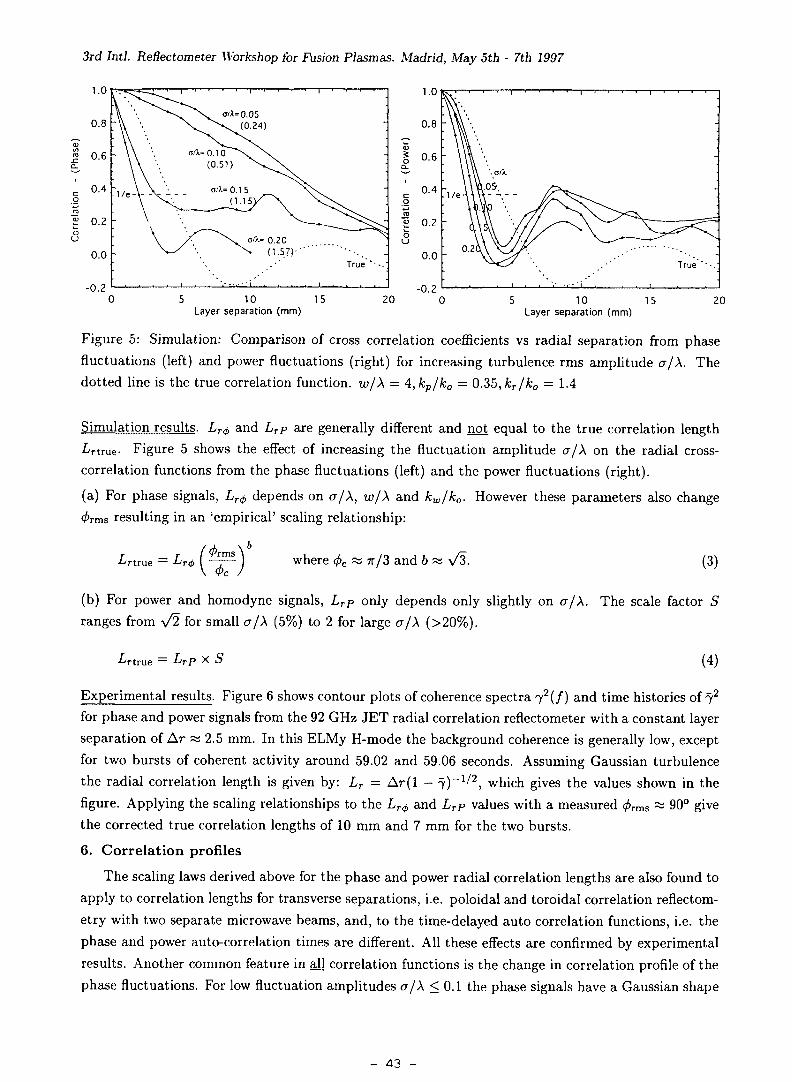
3rd Intl. Reflectometer Workshop for Fusion Plasmas. Madrid, May 5th - 7th 1997
1.0
ou
£ 0.2 -
0.0 -
-0.25 10 15
Layer separation (mm)5 10 15
Layer separation (mm)20
Figure 5: Simulation: Comparison of cross correlation coefficients vs radial separation from phase
fluctuations (left) and power fluctuations (right) for increasing turbulence rms amplitude a/A. The
dotted line is the true correlation function. w/\ = 4,kp/k0 = 0.35, kT/k0 — 1.4
Simulation results. Lr<i) and Lrp are generally different and not equal to the true correlation length
•krtrue- Figure 5 shows the effect of increasing the fluctuation amplitude cr/A on the radial cross-
correlation functions from the phase fluctuations (left) and the power fluctuations (right).
(a) For phase signals, Lr<j, depends on cr/A, w/X and kw/k0. However these parameters also change
<f>Tms resulting in an 'empirical' scaling relationship:
-Ttrue = L.r<t> where <f>c « TT/3 and b « y/3. (3)
(b) For power and homodyne signals, LrP only depends only slightly on a/A. The scale factor S
ranges from \/2 for small cr/A (5%) to 2 for large CT/A (>20%).
Jrtrue = LrPX S (4)
Experimental results. Figure 6 shows contour plots of coherence spectra 72( / ) and time histories of j 2
for phase and power signals from the 92 GHz JET radial correlation reflectometer with a constant layer
separation of Ar as 2.5 mm. In this ELMy H-mode the background coherence is generally low, except
for two bursts of coherent activity around 59.02 and 59.06 seconds. Assuming Gaussian turbulence
the radial correlation length is given by: LT = Ar( l - î ) " 1 / 2 , which gives the values shown in the
figure. Applying the scaling relationships to the LT<t> and Lrp values with a measured <£rms ~ 90° give
the corrected true correlation lengths of 10 mm and 7 mm for the two bursts.
6. Correlat ion profiles
The scaling laws derived above for the phase and power radial correlation lengths are also found to
apply to correlation lengths for transverse separations, i.e. poloidal and toroidal correlation reflectom-
etry with two separate microwave beams, and, to the time-delayed auto correlation functions, i.e. the
phase and power auto-correlation times are different. All these effects are confirmed by experimental
results. Another common feature in all correlation functions is the change in correlation profile of the
phase fluctuations. For low fluctuation amplitudes cr/A < 0.1 the phase signals have a Gaussian shape
- 43 -
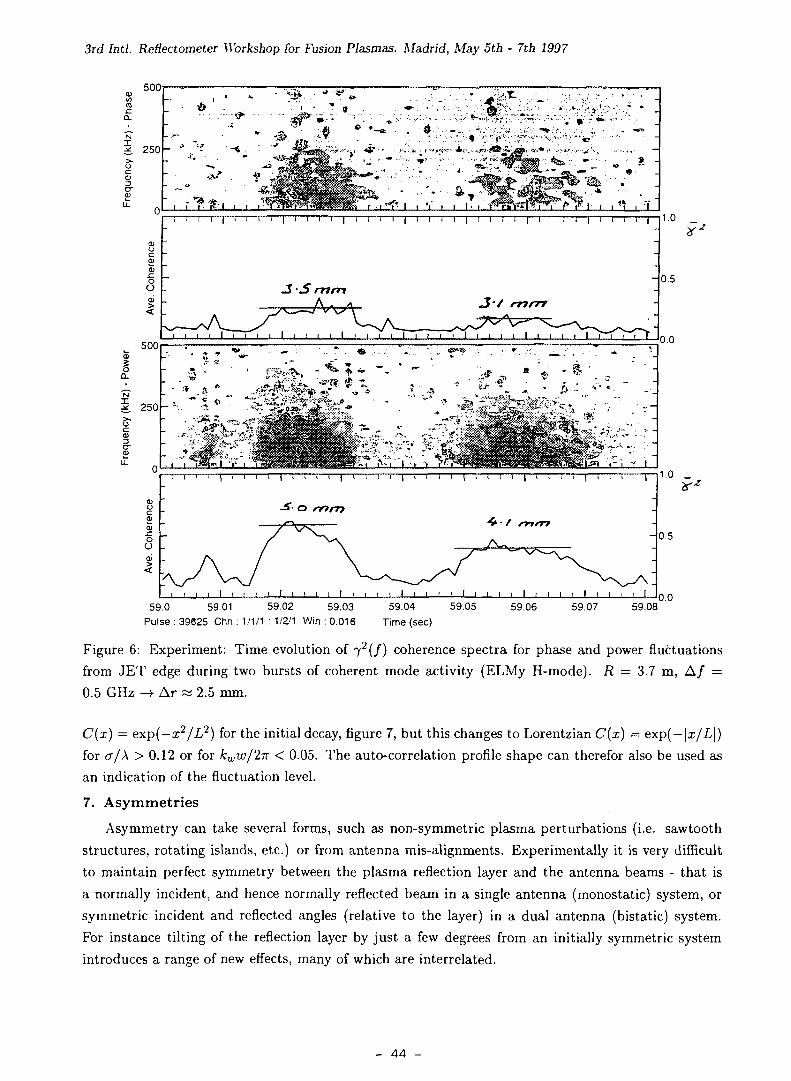
3rd Intl. Refiectometer Workshop for Fusion Plasmas. Madrid, May 5th - 7th 1997
500
1.0
0.5
0.0
1.0 _
0.5
59.0 59.01 59.02 59.03 59.04 59.05 59.06 59.07Pulse : 39625 Chn : 1/1/1 : 1/2/1 Win : 0.016 Time (sec)
59.080.0
Figure 6: Experiment: Time evolution of J2(f) coherence spectra for phase and power fluctuationsfrom JET edge during two bursts of coherent mode activity (ELMy H-mode). R = 3.7 m, A/ =0.5 GHz -*• Ar « 2.5 mm.
C(x) = exp(—x2/L2) for the initial decay, figure 7, but this changes to Lorentzian C(x) = exp( — \x/L\)
for cr/A > 0.12 or for kww/2n < 0.05. The auto-correlation profile shape can therefor also be used as
an indication of the fluctuation level.
7. Asymmetries
Asymmetry can take several forms, such as non-symmetric plasma perturbations (i.e. sawtoothstructures, rotating islands, etc.) or from antenna mis-alignments. Experimentally it is very difficultto maintain perfect symmetry between the plasma reflection layer and the antenna beams - that isa normally incident, and hence normally reflected beam in a single antenna (monostatic) system, orsymmetric incident and reflected angles (relative to the layer) in a dual antenna (bistatic) system.For instance tilting of the reflection layer by just a few degrees from an initially symmetric systemintroduces a range of new effects, many of which are interrelated.
- 44 -
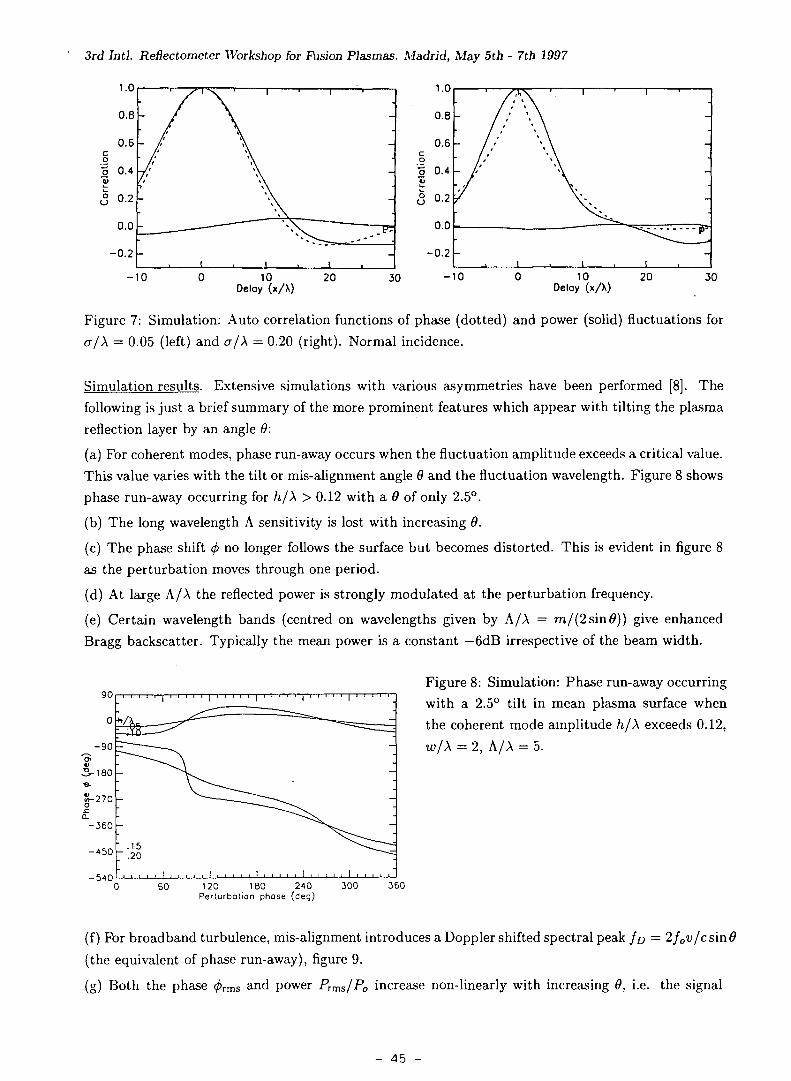
3rd Intl. Reflectometer Workshop for Fusion Plasmas. Madrid, May 5th - 7th 1997
10Delay (x/X)
10Oelay (x/X)
Figure 7: Simulation: Auto correlation functions of phase (dotted) and power (solid) fluctuations for
ujX = 0.05 (left) and CT/A = 0.20 (right). Normal incidence.
Simulation results. Extensive simulations with various asymmetries have been performed [8]. The
following is just a brief summary of the more prominent features which appear with tilting the plasma
reflection layer by an angle 9:
(a) For coherent modes, phase run-away occurs when the fluctuation amplitude exceeds a critical value.
This value varies with the tilt or mis-alignment angle 6 and the fluctuation wavelength. Figure 8 shows
phase run-away occurring for h/X > 0.12 with a 9 of only 2.5°.
(b) The long wavelength A sensitivity is lost with increasing 6.
(c) The phase shift r/> no longer follows the surface but becomes distorted. This is evident in figure 8
as the perturbation moves through one period.
(d) At large A/A the reflected power is strongly modulated at the perturbation frequency.
(e) Certain wavelength bands (centred on wavelengths given by A/A = m/(2sin#)) give enhanced
Bragg backscatter. Typically the mean power is a constant —6dB irrespective of the beam width.
Figure 8: Simulation: Phase run-away occurring
with a 2.5° tilt in mean plasma surface when
the coherent mode amplitude h/X exceeds 0.12,
w/X = 2, A/A = 5.
-450 -
-54060 120 180 240
Perturbotion phase300 360
(f ) For broadband turbulence, mis-alignment introduces a Doppler shifted spectral peak fp = 2fov/c sin 6
(the equivalent of phase run-away), figure 9.
(g) Both the phase ^ r m s and power PTms/P0 increase non-linearly with increasing 9, i.e. the signal
- 45 -
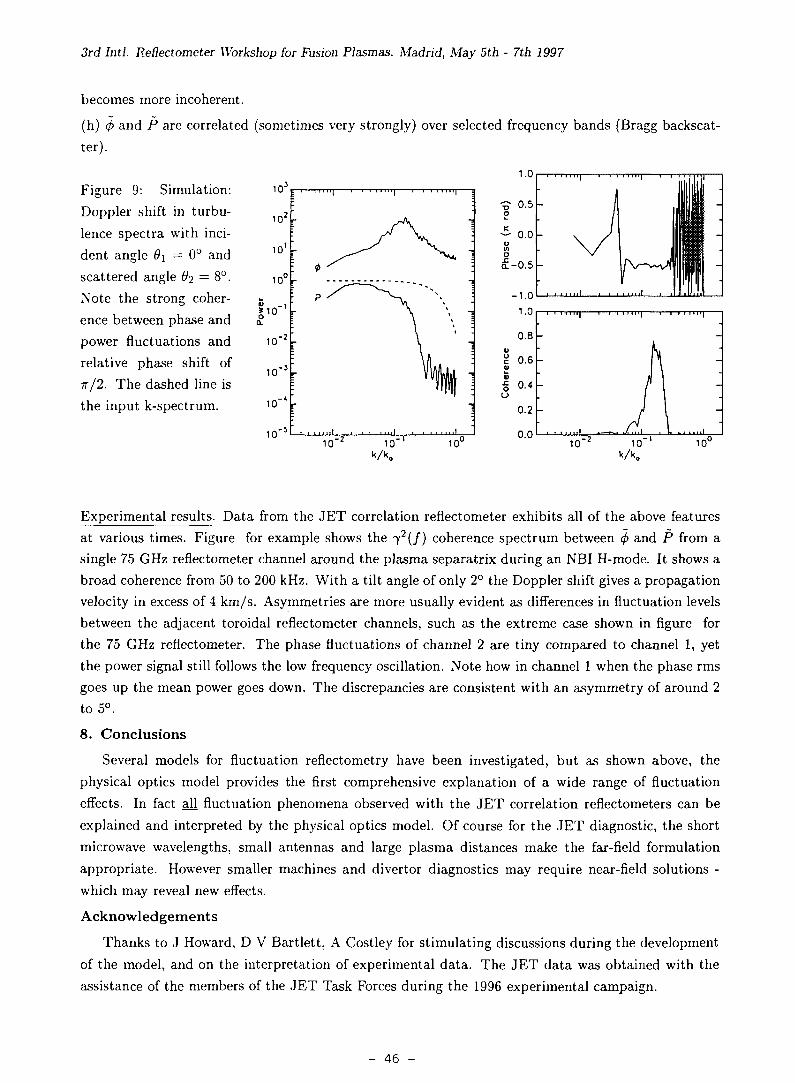
3rd Intl. Reflectometer Wx/rkshop for Fusion Plasmas. Madrid, May 5th - 7th 1997
becomes more incoherent.
(h) <f> and P are correlated (sometimes very strongly) over selected frequency bands (Bragg backscat-ter).
1.0Figure 9: Simulation:Doppler shift in turbu-lence spectra with inci-dent angle 9\ = 0° andscattered angle #2 = 8°.Note the strong coher-ence between phase andpower fluctuations andrelative phase shift ofTT/2. The dashed line isthe input k-spectrum.
1 0 ' 5 ' ' ' " I . • , , , , . , . ! „ I o . o I , , , , . „ ! . . - M i / m l . A > , . .
Experimental results. Data from the JET correlation refiectometer exhibits all of the above featuresat various times. Figure for example shows the 72(/) coherence spectrum between 0 and P from asingle 75 GHz reflectometer channel around the plasma separatrix during an NBI H-mode. It shows abroad coherence from 50 to 200 kHz. With a tilt angle of only 2° the Doppler shift gives a propagationvelocity in excess of 4 km/s. Asymmetries are more usually evident as differences in fluctuation levelsbetween the adjacent toroidal reflectometer channels, such as the extreme case shown in figure forthe 75 GHz reflectometer. The phase fluctuations of channel 2 are tiny compared to channel 1, yetthe power signal still follows the low frequency oscillation. Note how in channel 1 when the phase rmsgoes up the mean power goes down. The discrepancies are consistent with an asymmetry of around 2to 5°.
8. Conclusions
Several models for fluctuation reflectometry have been investigated, but as shown above, thephysical optics model provides the first comprehensive explanation of a wide range of fluctuationeffects. In fact all fluctuation phenomena observed with the JET correlation reflectometers can beexplained and interpreted by the physical optics model. Of course for the JET diagnostic, the shortmicrowave wavelengths, small antennas and large plasma distances make the far-field formulationappropriate. However smaller machines and divertor diagnostics may require near-field solutions -which may reveal new effects.
Acknowledgements
Thanks to J Howard, D V Bartlett, A Costley for stimulating discussions during the developmentof the model, and on the interpretation of experimental data. The JET data was obtained with theassistance of the members of the JET Task Forces during the 1996 experimental campaign.
- 46 -
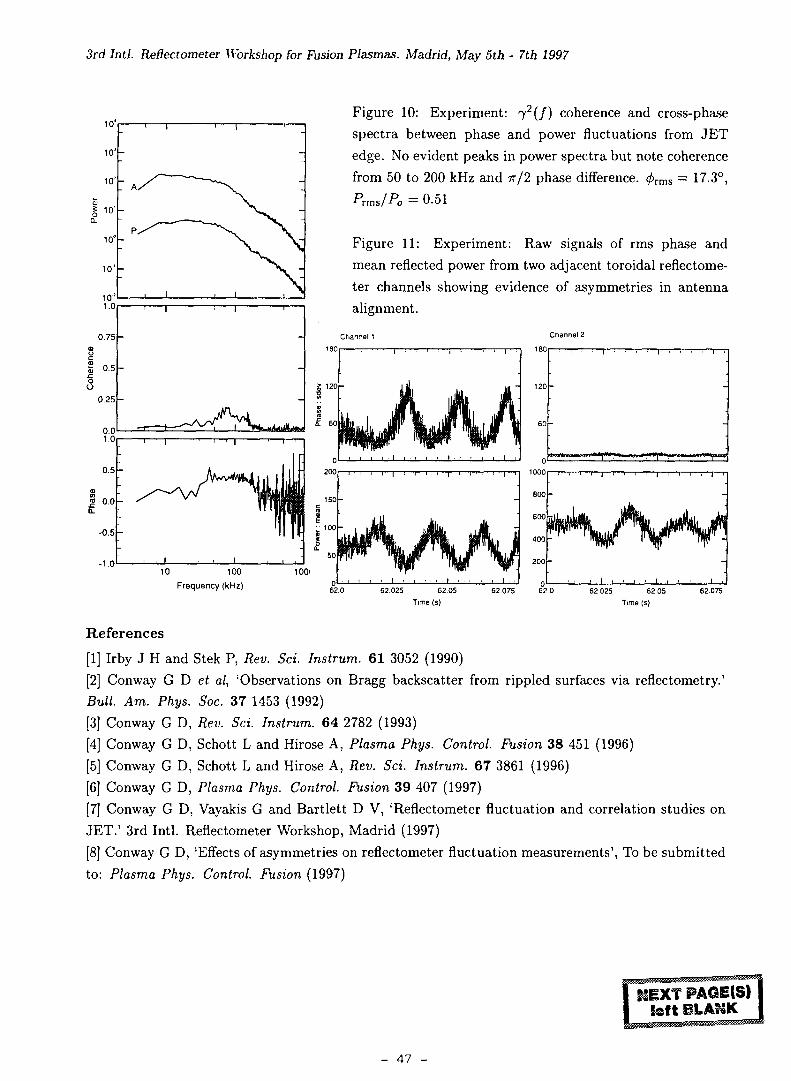
3rd Intl. Reflectometer Workshop for Fusion Plasmas. Madrid, May 5th - 7th 1997
10'
10D
10'
I 1°'0-
10'
10'
10'1.0
0.75
S 0.5
0.25
0.01.0
0.5
« 0.00.
-0.5
-1.0
Figure 10: Experiment: 7 2 ( / ) coherence and cross-phase
spectra between phase and power fluctuations from JET
edge. No evident peaks in power spectra but note coherence
from 50 to 200 kHz and -n/2 phase difference. 0 r m s = 17.3°,
Prms/Po = 0.51
Figure 11: Experiment: Raw signals of rms phase and
mean reflected power from two adjacent toroidal reflectome-
ter channels showing evidence of asymmetries in antenna
alignment.
Channel 2
10 100
Frequency (kHz)62.075
References
[1] Irby J H and Stek P, Rev. Sci. lustrum. 61 3052 (1990)
[2] Conway G D et al, 'Observations on Bragg backscatter from rippled surfaces via reflectometry.'
Bull. Am. Phys. Soc. 37 1453 (1992)
[3] Conway G D, Rev. Sci. lustrum. 64 2782 (1993)
[4] Conway G D, Schott L and Hirose A, Plasma Phys. Control. Fusion 38 451 (1996)
[5] Conway G D, Schott L and Hirose A, Rev. Sci. Instrum. 67 3861 (1996)
[6] Conway G D, Plasma Phys. Control. Fusion 39 407 (1997)
[7] Conway G D, Vayakis G and Bartlett D V, 'Reflectometer fluctuation and correlation studies on
JET.' 3rd Intl. Reflectometer Workshop, Madrid (1997)
[8] Conway G D, 'Effects of asymmetries on reflectometer fluctuation measurements', To be submitted
to: Plasma Phys. Control. Fusion (1997)
- 47 -
Simulations of correlation reflectometry with a WKB 2-dim code
T. Estrada, J. Sanchez, V. Zhuravlev, M. Frances, B. Branas and E. de la Luna
Asociaciôn Euratom-CIEMAT, 28040 Madrid, Spain.
Abstract
A two dimensional code [1] based on the WKB approximation is used to analyze the feasibility
of reflectometry correlation measurements in a turbulent plasma.
Simulation results have been obtained for two fixed frequency beams reflecting simultaneously
on a rotating turbulent structure in a plasma with ITER parameters. The results show that
correlation measurements using the reflectometry signals provides information on radial
correlation lengths of the turbulence only in cases in which the 2-dim effects are weak.
In addition to the use of these studies for turbulence analysis, the correlation measurements can
be used as a robust method for the determination of the signal time delay and therefore of the
density profile in highly turbulent plasmas with parasitic reflections.
Introduction
The knowledge of the turbulence structure is critical for modelling of reflectometry
measurements because of the strong dependence of the results on the parameters of turbulence:
amplitude, dominant wavelengths and correlation lengths. The spatial correlation of the
reflectometry signals may be used to obtain information about these parameters, but there are
still some difficulties in the interpretation of these type of measurements. In this work the
possibilities of correlation reflectometry for turbulence studies are considered.
The reflecting layer for microwave frequencies in fusion plasmas shows a complex corrugated
structure which can lead to destructive interference in the reflectometer beam, inducing intense
amplitude oscillations and random-like phase behaviour. To simulate the plasma turbulence a
combination of a two dimensional unperturbed density distribution with a set of interchanging
hills and depressions has been considered. The hills and depressions amplitude and the
distance between them change randomly within ± 50 % of the average values which define the
amplitude, n/n, and wavelength, X, of the turbulence. The average poloidal and radial
wavelengths are equal. To ensure the applicability of the WKB approximation the ratio between
the average wavelength of the turbulence and the vacuum wavelength of the probing beam is
larger than four.
Simulations are done considering two incident frequencies reflecting simultaneously on a
rotating turbulent structure for different values of n/n and XQ: from weak to strong interference
- 49 -
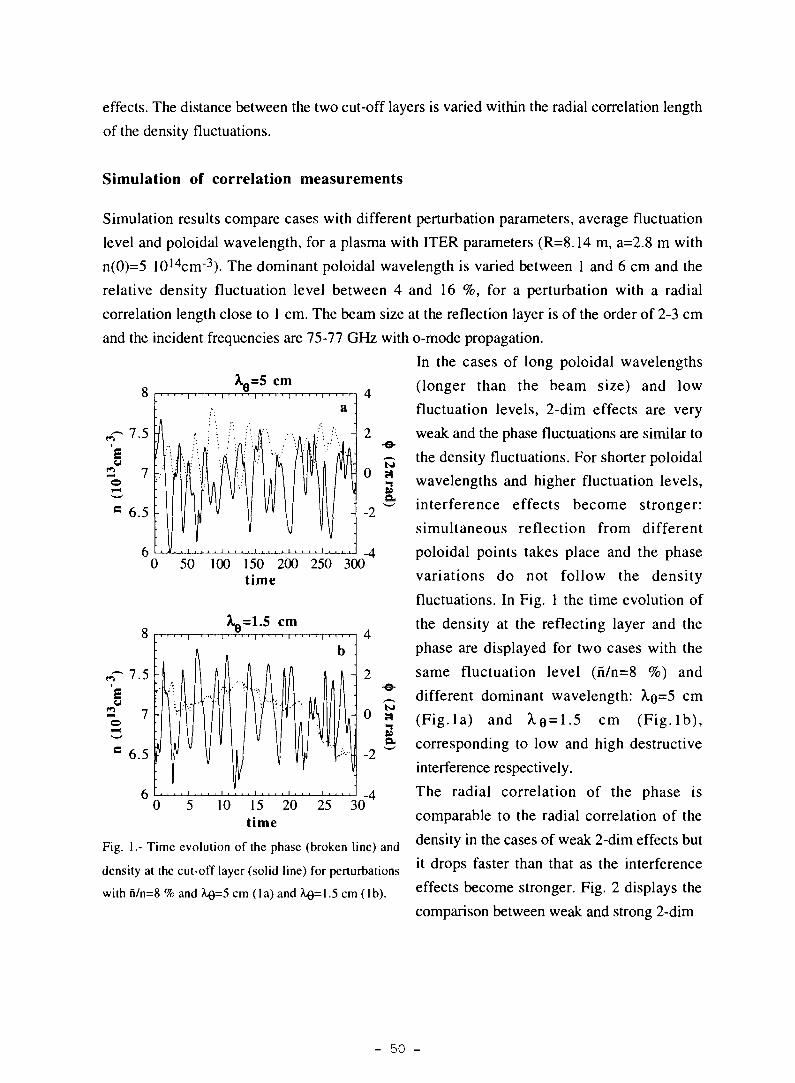
effects. The distance between the two cut-off layers is varied within the radial correlation length
of the density fluctuations.
cm
0
-e-
'S3
-2
Simulation of correlation measurements
Simulation results compare cases with different perturbation parameters, average fluctuation
level and poloidal wavelength, for a plasma with ITER parameters (R=8.14 m, a=2.8 m with
n(0)=5 10l4cm~3). The dominant poloidal wavelength is varied between 1 and 6 cm and the
relative density fluctuation level between 4 and 16 %, for a perturbation with a radial
correlation length close to 1 cm. The beam size at the reflection layer is of the order of 2-3 cm
and the incident frequencies are 75-77 GHz with o-mode propagation.
In the cases of long poloidal wavelengths
(longer than the beam size) and low
fluctuation levels, 2-dim effects are very
weak and the phase fluctuations are similar to
the density fluctuations. For shorter poloidal
wavelengths and higher fluctuation levels,
interference effects become stronger:
simultaneous reflection from different
poloidal points takes place and the phase
variations do not follow the density
fluctuations. In Fig. 1 the time evolution of
the density at the reflecting layer and the
phase are displayed for two cases with the
same fluctuation level (n/n=8 %) and
different dominant wavelength: ^e=5 cm
(Fig.la) and X,Q = 1.5 cm (Fig. lb) ,
corresponding to low and high destructive
interference respectively.
The radial correlation of the phase is
comparable to the radial correlation of the
Fig. 1.- Time evolution of the phase (broken line) and d e n s i t y i n t h e C a S e S ° f W e a k 2 " d i m e f f e C t S b u t
density at the cut-off layer (solid line) for perturbations U d r 0 P S f a S t e r t h a n t h a t a S t h e interference
with fi/n=8 % and Xe=5 cm (la) and A«=l.5 cm (lb). e f f e c t s é co rne stronger. Fig. 2 displays the
comparison between weak and strong 2-dim
I . . . . I • • |
50 100 150 200 250 300time
cm
30
- 50 -
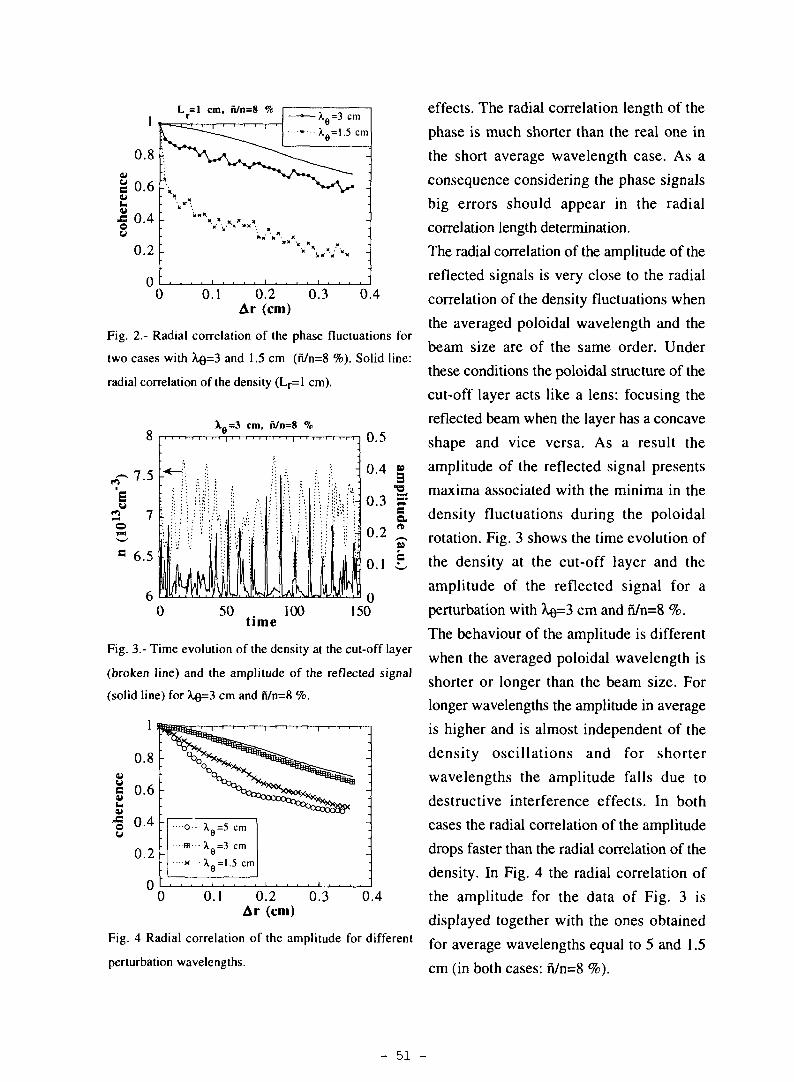
1
0.8
g 0.6£-e 0.4o
0 . 2 ^
0
L =1 cm, n/n-8 %7 — i — ^ i _ _ _ • i • • • • ] •
: ' . ' • • .
—•—^e=3 cm• - • • • • X e =1.5 cm
0.1 0.2 0.3 0.4Ar (cm)
Fig. 2.- Radial correlation of the phase fluctuations for
two cases with XQ-3 and 1.5 cm (n7n=8 %). Solid line:
radial correlation of the density (L|-=l cm).
50 100time
150
Fig. 3.- Time evolution of the density at the cut-off layer
(broken line) and the amplitude of the reflected signal
(solid line) for XQ=3 cm and n7n=8 %.
0 0.1 0.2 0.3 0.4Ar (cm)
Fig. 4 Radial correlation of the amplitude for different
perturbation wavelengths.
effects. The radial correlation length of the
phase is much shorter than the real one in
the short average wavelength case. As a
consequence considering the phase signals
big errors should appear in the radial
correlation length determination.
The radial correlation of the amplitude of the
reflected signals is very close to the radial
correlation of the density fluctuations when
the averaged poloidal wavelength and the
beam size are of the same order. Under
these conditions the poloidal structure of the
cut-off layer acts like a lens: focusing the
reflected beam when the layer has a concave
shape and vice versa. As a result the
amplitude of the reflected signal presents
maxima associated with the minima in the
density fluctuations during the poloidal
rotation. Fig. 3 shows the time evolution of
the density at the cut-off layer and the
amplitude of the reflected signal for a
perturbation with )^e=3 cm and n/n=8 %.
The behaviour of the amplitude is different
when the averaged poloidal wavelength is
shorter or longer than the beam size. For
longer wavelengths the amplitude in average
is higher and is almost independent of the
density oscillations and for shorter
wavelengths the amplitude falls due to
destructive interference effects. In both
cases the radial correlation of the amplitude
drops faster than the radial correlation of the
density. In Fig. 4 the radial correlation of
the amplitude for the data of Fig. 3 is
displayed together with the ones obtained
for average wavelengths equal to 5 and 1.5
cm (in both cases: n/n=8 %).
- 51 -
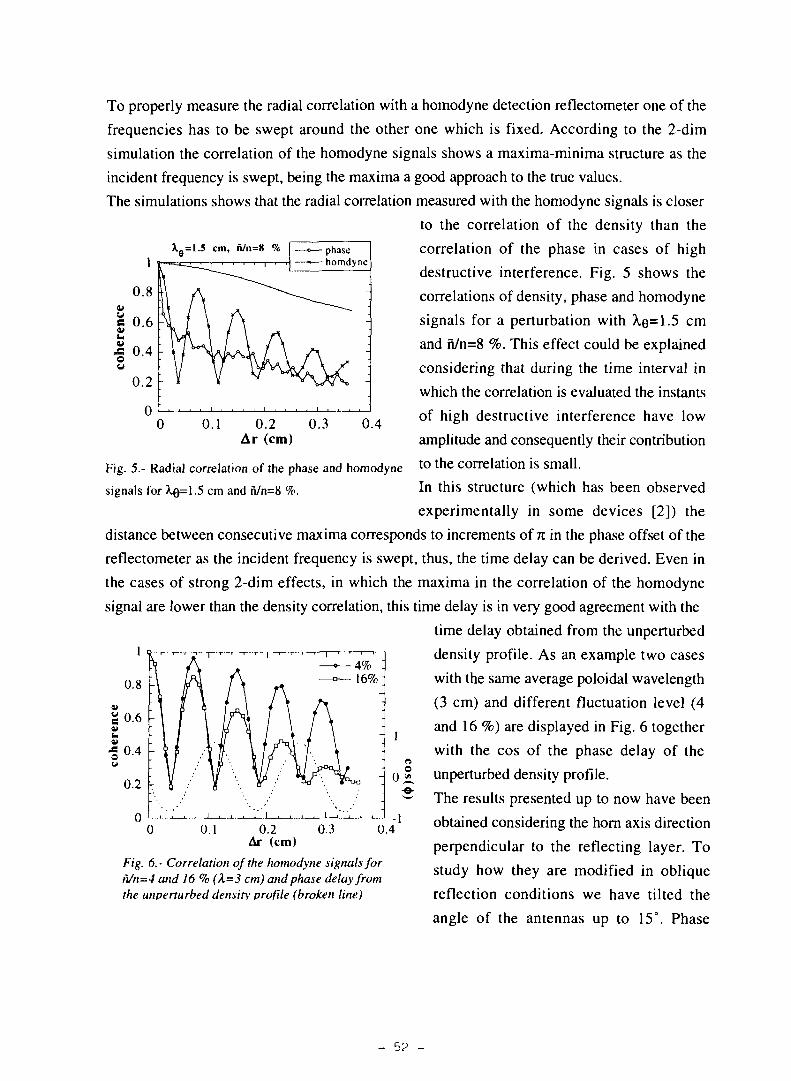
To properly measure the radial correlation with a homodyne detection reflectometer one of the
frequencies has to be swept around the other one which is fixed. According to the 2-dim
simulation the correlation of the homodyne signals shows a maxima-minima structure as the
incident frequency is swept, being the maxima a good approach to the true values.
The simulations shows that the radial correlation measured with the homodyne signals is closer
to the correlation of the density than the
correlation of the phase in cases of high
destructive interference. Fig. 5 shows the
correlations of density, phase and homodyne
signals for a perturbation with À,Q=1.5 cm
and n/n=8 %. This effect could be explained
considering that during the time interval in
which the correlation is evaluated the instants
of high destructive interference have low
amplitude and consequently their contribution
1
0.8
.2 0.4ou
0.2
0
X9 = 1.5 cm, n/n=« %
- \ I ywOrt / \
—»— phase—«— homdyne
0 0.1 0.2Ar (cm)
0.3 0.4
Fig. 5.- Radial correlation of the phase and homodyne
signals for ^Q=1.5 cm and n/n=8 %.
to the correlation is small.
In this structure (which has been observed
experimentally in some devices [2]) the
distance between consecutive maxima corresponds to increments of K in the phase offset of the
reflectometer as the incident frequency is swept, thus, the time delay can be derived. Even in
the cases of strong 2-dim effects, in which the maxima in the correlation of the homodyne
signal are lower than the density correlation, this time delay is in very good agreement with the
time delay obtained from the unperturbed
density profile. As an example two cases
with the same average poloidal wavelength
(3 cm) and different fluctuation level (4
and 16 %) are displayed in Fig. 6 together
with the cos of the phase delay of the
unperturbed density profile.
The results presented up to now have been
obtained considering the horn axis direction
perpendicular to the reflecting layer. To
study how they are modified in oblique
0.1 0.2Ar (cm)
0.3 0.4
Fig. 6.- Correlation of the homodyne signals forfi/n=4 and 16 % (X=3 cm) and phase delay fromthe unperturbed density profile (broken line) reflection conditions we have tilted the
angle of the antennas up to 15°. Phase
- 52 -

1
0.8
I 0.6•g 0.4u
0.2
0
Ar=3 mm, Xo=3 cm, 5n/n=4 %i ' ' ' ' i ' ' ' ' i
runaway appears being proportional to the tilted angle and making senseless the phase
correlation results. Interference effects become stronger, as a consequence, the radial correlation
of the reflectometry (amplitude and homodyne) signals decrease. To illustrate this effect we have
chosen a case in which for perpendicular
reflection the radial correlation of the
reflectometry signals reproduces the radial
correlation of the density: low fluctuation
level (n/n=4 %) and poloidal wavelength
close to the beam size (A,e=3 cm). Fig. 7
shows the correlation of the density,
amplitude and homodyne signal (for two
reflecting layers separated 3 mm in radial
direciton) as a function of the angle of
Fig. 7.- Correlation of the amplitude and homodyne t i l t i nê- T h e d r o P i n t h e correlation as the
signal (for two reflecting layers separated 3 mm) vs. the t i l t e d a n g l e i s increased is more pronounced
tilted angle of the antennas ( e=3 cm, rVn=4%). in the homodyne signal than in the
amplitude. A similar result is obtained with
perpendicular reflection for a fixed poloidal wavelength as the fluctuation level increases.
- density- amplitude- homodyne
-5 0 5 10angle
15 20
Conclusions
The 2-dim WKB code, able to compute interference effects, was used for qualitative
investigation of the perturbations in reflectometry measurements induced by turbulence.
Correlation measurements using the reflectometry phase signal may provide a useful tool to
obtain information on radial correlation lengths of the turbulence only in cases in which the 2-
dim effects are weak. In these cases and for average wavelengths similar to the beam size the
correlation length of the amplitude signal also agrees with the correlation length of the density.
The time delay deduced from the radial correlation of the homodyne signal is in very good
agreement with the time delay obtained from the unperturbed density profile in all the
conditions which have been studied. This kind of measurements can be used to obtain the
density profile in turbulent plasmas with parasitic reflections due to poor access and
complicated waveguides.
References
[1] V. Zhuravlev, J. Sanchez, E. de la Luna. Plasma Phys and Control. Fusion 38 2231 (1996).
[2] J. Sanchez, B. Branas, E. de la Luna and T. Estrada. Rev. Sci. Instrum. 64 (2) 487 (1993).
- 53 -
New Data Processing Techniques for Profile Evaluation
from Broadband FM Reflectometry
J. Santos, M. Manso, F. Nunes, I. Nunes, A. Silva, P. Varela
Associaçào EURATOM/IST, CFN, Institute Superior Técnico - 1096 Lisboa Codex
*MP1 fuer Plasmaphysik, EURATOM Association, D-85748 Gurching, Germany
1. INTRODUCTION
Broadband FM reflectometry is used to obtain the plasma density profile. The profile is evaluated
from the measured beat frequency (/j) of the interference between a reference signal and the signal
reflected from the plasma. Plasma fluctuations cause phase and amplitude perturbations in the
reflected signal making the profile evaluation a difficult problem to solve. Different techniques have
been developed to minimise this problem, namely AM [1], dual differential-phase reflectometry [2]
and pulse radar [3]. In addition, very fast sweeping times (< JO^is) are presently being used to probe
the plasma in time intervals shorter than the typical periods of plasma fluctuations, resulting in a
significant decrease of the "noise" due to temporal fluctuations. In software, several data analysis
methods have been implemented, including either digital filtering [4, 5] or spectral peak tracking
using sliding Fast Fourier Transform algorithms [6] and the Maximum Entropy Method (MEM) [7].
Here we present a method based on the estimation of the power time-frequency distribution (TFD) of
the reflectometry signals, that gives both the main beat frequency due to the average profile and the
local energy scattered by plasma fluctuations.
The method was applied to O-mode broadband reflectometry signals obtained in ASDEX Upgrade.
The reflectometry system probes the plasma in the density range of ne=0.4-6.5x!019 m ' \ with very
fast (W-100lLs) simultaneous operation of several channels, both at the high and low field sides [8].
Here we present results from the high field side (HFS), during the H mode phase of shot #8180,
obtained with four reflectometer channels covering the total frequency range 16-72 GHz.
2. METHOD OF ANALYSIS
2.1 Time-frequency distributions
The standard Fourier analysis allows us to separate a signal into its individual frequency components
and establish the relative intensity of each component. Unfortunately, using the power spectrum, it is
not possible to know when those frequencies occurred. To circumvent such limitations a joint
function of time and frequency, i.e., a distribution is often employed. This mathematically more
sophisticated approach is capable of higher resolution for a given length of data. In fact, no time-
- 55 -
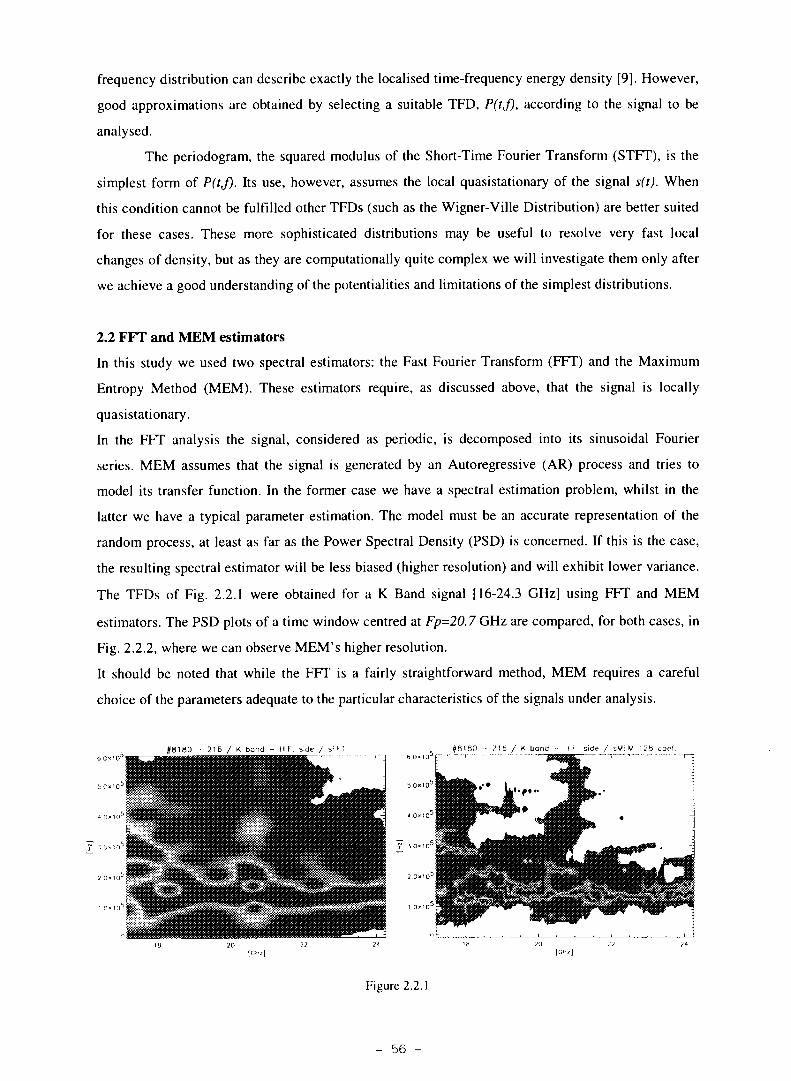
frequency distribution can describe exactly the localised time-frequency energy density [9]. However,
good approximations are obtained by selecting a suitable TFD, P(t,f), according to the signal to be
analysed.
The periodogram, the squared modulus of the Short-Time Fourier Transform (STFT), is the
simplest form of P(t,f). Its use, however, assumes the local quasistationary of the signal s(t). When
this condition cannot be fulfilled other TFDs (such as the Wigner-Ville Distribution) are better suited
for these cases. These more sophisticated distributions may be useful to resolve very fast local
changes of density, but as they are computationally quite complex we will investigate them only after
we achieve a good understanding of the potentialities and limitations of the simplest distributions.
2.2 FFT and MEM estimators
In this study we used two spectral estimators: the Fast Fourier Transform (FFT) and the Maximum
Entropy Method (MEM). These estimators require, as discussed above, that the signal is locally
quasistationary.
In the FFT analysis the signal, considered as periodic, is decomposed into its sinusoidal Fourier
series. MEM assumes that the signal is generated by an Autoregressive (AR) process and tries to
model its transfer function. In the former case we have a spectral estimation problem, whilst in the
latter we have a typical parameter estimation. The model must be an accurate representation of the
random process, at least as far as the Power Spectral Density (PSD) is concerned. If this is the case,
the resulting spectral estimator will be less biased (higher resolution) and will exhibit lower variance.
The TFDs of Fig. 2.2.1 were obtained for a K Band signal [16-24.3 GHz] using FFT and MEM
estimators. The PSD plots of a time window centred at Fp=20.7 GHz are compared, for both cases, in
Fig. 2.2.2, where we can observe MEM's higher resolution.
It should be noted that while the FFT is a fairly straightforward method, MEM requires a careful
choice of the parameters adequate to the particular characteristics of the signals under analysis.
..C1O5
08180 - 216 / K band - HT. side / s : F T #8180 -- 216 / K bond •- H I side / sMLW 128 c o d
Figure 2.2.1
- 56 -
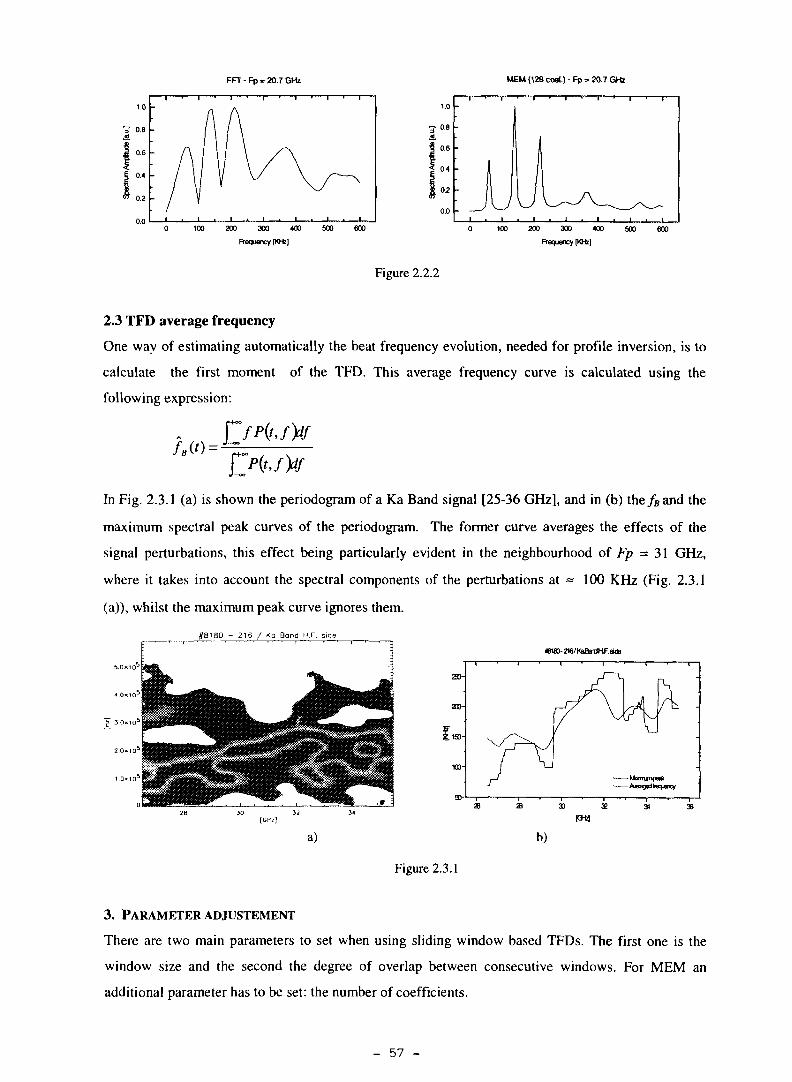
FFT - Fp = 20.7 GHz MEM (128 coel.) - Fp = 20.7 GHz
200 300 400
Frequency [10*)
200 300 400
Frequency [KHz]
Figure 2.2.2
2.3 TFD average frequency
One way of estimating automatically the beat frequency evolution, needed for profile inversion, is to
calculate the first moment of the TFD. This average frequency curve is calculated using the
following expression:
/*(') =
In Fig. 2.3.1 (a) is shown the periodogram of a Ka Band signal [25-36 GHz], and in (b) the/B and the
maximum spectral peak curves of the periodogram. The former curve averages the effects of the
signal perturbations, this effect being particularly evident in the neighbourhood of Fp = 31 GHz,
where it takes into account the spectral components of the perturbations at ~ 100 KHz (Fig. 2.3.1
(a)), whilst the maximum peak curve ignores them.
#8180 - 216 / Ka Bond H.F. side
I.DxlO5
mea- 216/KàartHF. &»
230-
20)-
190-
100-
sn-
-
y—/ KfaonunpeekA«cgsdbeqjeny
30 32
a) b)
Figure 2.3.1
3. PARAMETER ADJUSTEMENT
There are two main parameters to set when using sliding window based TFDs. The first one is the
window size and the second the degree of overlap between consecutive windows. For MEM an
additional parameter has to be set: the number of coefficients.
- 57 -
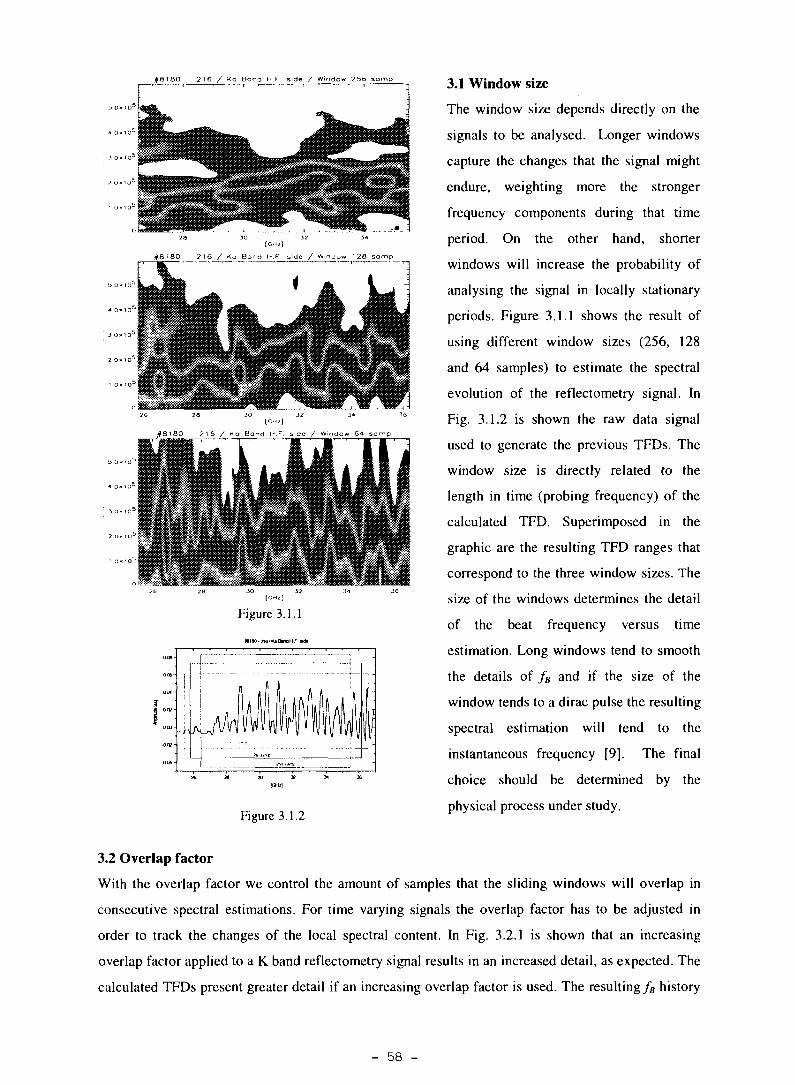
#8180 216 / Ka Band H.F. side / Window 255 samp
# 8 ' 8 0 216 / <a Bond M.F side / Winaow ' 2 8 samp
#8180 216 / Ko Band H.F. sde / Window 64 samp
Figure 3.1.1
X) 3? M »
(GHi]
Figure 3.1.2
3.1 Window size
The window size depends directly on the
signals to be analysed. Longer windows
capture the changes that the signal might
endure, weighting more the stronger
frequency components during that time
period. On the other hand, shorter
windows will increase the probability of
analysing the signal in locally stationary
periods. Figure 3.1.1 shows the result of
using different window sizes (256, 128
and 64 samples) to estimate the spectral
evolution of the reflectometry signal. In
Fig. 3.1.2 is shown the raw data signal
used to generate the previous TFDs. The
window size is directly related to the
length in time (probing frequency) of the
calculated TFD. Superimposed in the
graphic are the resulting TFD ranges that
correspond to the three window sizes. The
size of the windows determines the detail
of the beat frequency versus time
estimation. Long windows tend to smooth
the details of fB and if the size of the
window tends to a dirac pulse the resulting
spectral estimation will tend to the
instantaneous frequency [9]. The final
choice should be determined by the
physical process under study.
3.2 Overlap factor
With the overlap factor we control the amount of samples that the sliding windows will overlap in
consecutive spectral estimations. For time varying signals the overlap factor has to be adjusted in
order to track the changes of the local spectral content. In Fig. 3.2.1 is shown that an increasing
overlap factor applied to a K band reflectometry signal results in an increased detail, as expected. The
calculated TFDs present greater detail if an increasing overlap factor is used. The resulting fB history
- 58 -
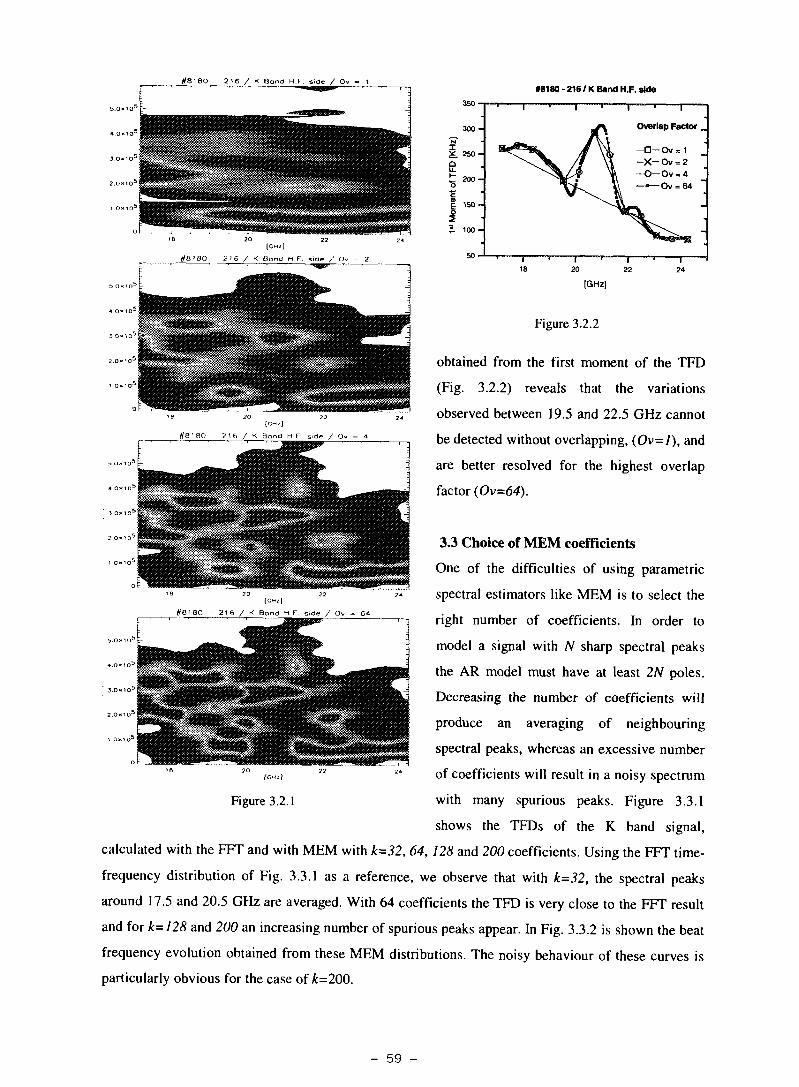
#6180 216 / K Bond H.F. side / Ov = 1#8180 - 216 / K Band H.F. side
360'
#81 80[OH/,
216 / K Band H F. side / Ov = 2
Overlap Factor _
?16 / K Band H.F. side / Ov - 4
18
[GHz]
#8180 216 / K BonO H.F. side / Ov - 61
Figure 3.2.2
obtained from the first moment of the TFD
(Fig. 3.2.2) reveals that the variations
observed between 19.5 and 22.5 GHz cannot
be detected without overlapping, (Ov=7), and
are better resolved for the highest overlap
factor (Ov=64).
3.3 Choice of MEM coefficients
One of the difficulties of using parametric
spectral estimators like MEM is to select the
right number of coefficients. In order to
model a signal with N sharp spectral peaks
the AR model must have at least 2N poles.
Decreasing the number of coefficients will
produce an averaging of neighbouring
spectral peaks, whereas an excessive number
of coefficients will result in a noisy spectrum
with many spurious peaks. Figure 3.3.1
shows the TFDs of the K band signal,
calculated with the FFT and with MEM with k=32, 64, 128 and 200 coefficients. Using the FFT time-
frequency distribution of Fig. 3.3.1 as a reference, we observe that with k=32, the spectral peaks
around 17.5 and 20.5 GHz are averaged. With 64 coefficients the TFD is very close to the FFT result
and for k=128 and 200 an increasing number of spurious peaks appear. In Fig. 3.3.2 is shown the beat
frequency evolution obtained from these MEM distributions. The noisy behaviour of these curves is
particularly obvious for the case of A:=200.
- 59 -
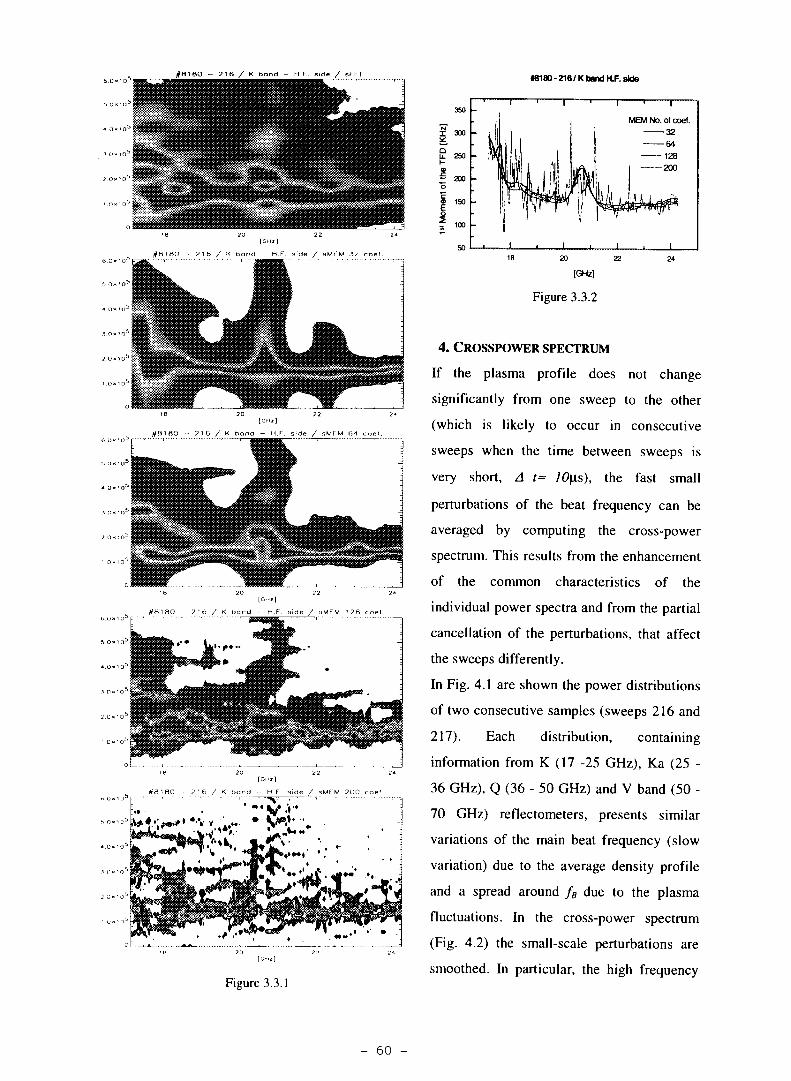
- ?16 / K bond - H.F. siae / sFFT
rfHIBO - 716 / w bond - H.F. side / sNFM 3? cae.t
tt 180 ? ' 6 / K bend - h.F side / sMFW ! ?8 coet
#8180 - 216 / K band H.F. side
350
£ 300
2 250
1 * 0o
| 150
s 100
50
-il
I
I
I
%
l1
1 1
MEM No. of coef.
128200
Figure 3.3.1
[GHz]
Figure 3.3.2
4. CROSSPOWER SPECTRUM
If the plasma profile does not change
significantly from one sweep to the other
(which is likely to occur in consecutive
sweeps when the time between sweeps is
very short, A t~ 10\ls), the fast small
perturbations of the beat frequency can be
averaged by computing the cross-power
spectrum. This results from the enhancement
of the common characteristics of the
individual power spectra and from the partial
cancellation of the perturbations, that affect
the sweeps differently.
In Fig. 4.1 are shown the power distributions
of two consecutive samples (sweeps 216 and
217). Each distribution, containing
information from K (17 -25 GHz), Ka (25 -
36 GHz), Q (36 - 50 GHz) and V band (50 -
70 GHz) reflectometers, presents similar
variations of the main beat frequency (slow
variation) due to the average density profile
and a spread around fB due to the plasma
fluctuations. In the cross-power spectrum
(Fig. 4.2) the small-scale perturbations are
smoothed. In particular, the high frequency
- 60 -
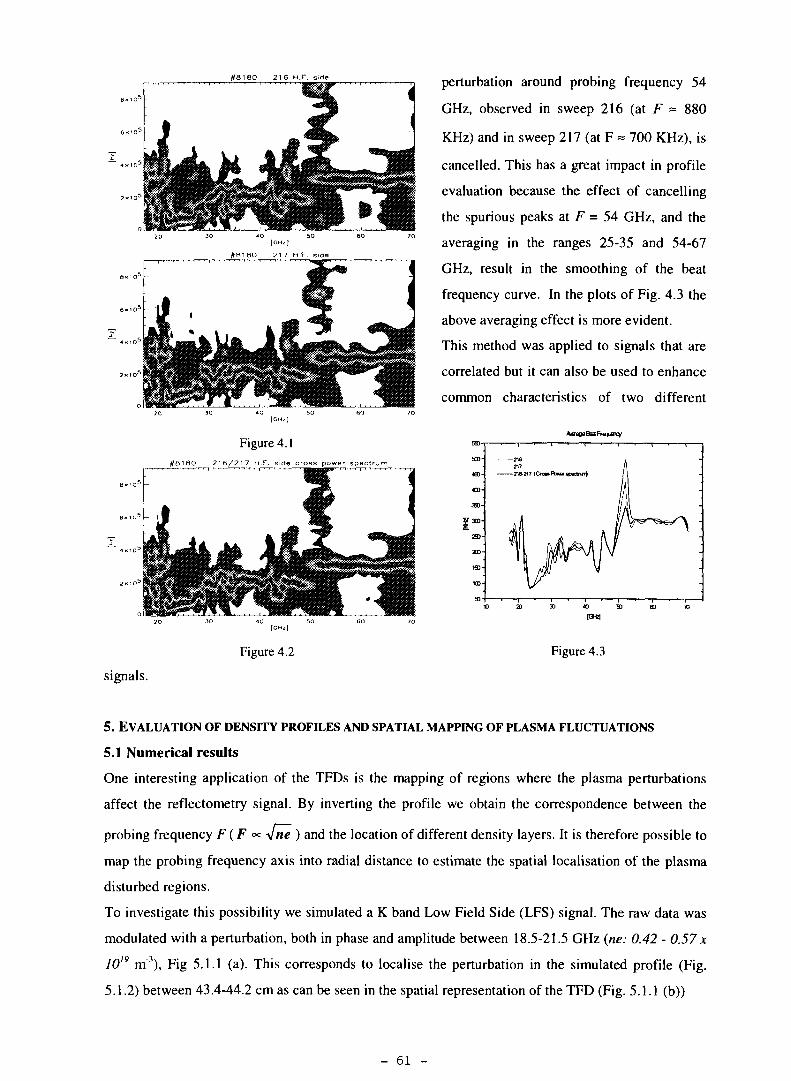
#8180 21 6 H.F. side
?n 30 40 50 60
Figure 4.1#8180 2 1 6 / 2 1 7 H.F. side cross power spectr
Figure 4.2
signals.
perturbation around probing frequency 54
GHz, observed in sweep 216 (at F ~ 880
KHz) and in sweep 217 (at F = 700 KHz), is
cancelled. This has a great impact in profile
evaluation because the effect of cancelling
the spurious peaks at F = 54 GHz, and the
averaging in the ranges 25-35 and 54-67
GHz, result in the smoothing of the beat
frequency curve. In the plots of Fig. 4.3 the
above averaging effect is more evident.
This method was applied to signals that are
correlated but it can also be used to enhance
common characteristics of two different
sm-
480-
400-
36D-
J33J-
25D-
am-
1SD-
100-
50-
217 /
Lii
•
-
•
« 50 BD 10
Figure 4.3
5. EVALUATION OF DENSITY PROFILES AND SPATUL MAPPING OF PLASMA FLUCTUATIONS
5.1 Numerical results
One interesting application of the TFDs is the mapping of regions where the plasma perturbations
affect the reflectometry signal. By inverting the profile we obtain the correspondence between the
probing frequency F ( F « 4ne ) and the location of different density layers. It is therefore possible to
map the probing frequency axis into radial distance to estimate the spatial localisation of the plasma
disturbed regions.
To investigate this possibility we simulated a K band Low Field Side (LFS) signal. The raw data was
modulated with a perturbation, both in phase and amplitude between 18.5-21.5 GHz (ne: 0.42 - 0.57 x
1019 m"3), Fig 5.1.1 (a). This corresponds to localise the perturbation in the simulated profile (Fig.
5.1.2) between 43.4-44.2 cm as can be seen in the spatial representation of the TFD (Fig. 5.1.1 (b))
- 61 -
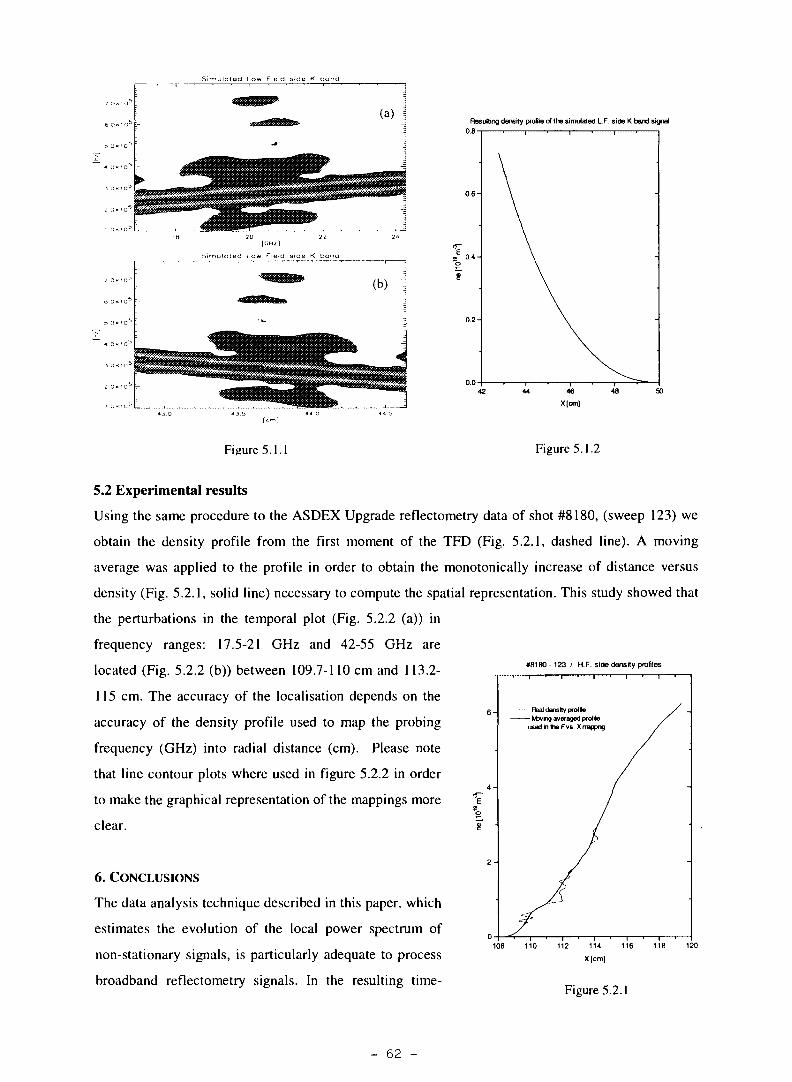
Simulated Low Field side K
Resulting density profile of the simulated LF. side K band signal
0 .8 -
Figure 5.1.1 Figure 5.1.2
#8160-123 / H F side density profiles
— Real density prof le— kbvrig averaged prolie
used in the F vs. X rrappng
5.2 Experimental results
Using the same procedure to the ASDEX Upgrade reflectometry data of shot #8180, (sweep 123) we
obtain the density profile from the first moment of the TFD (Fig. 5.2.1, dashed line). A moving
average was applied to the profile in order to obtain the monotonically increase of distance versus
density (Fig. 5.2.1, solid line) necessary to compute the spatial representation. This study showed that
the perturbations in the temporal plot (Fig. 5.2.2 (a)) in
frequency ranges: 17.5-21 GHz and 42-55 GHz are
located (Fig. 5.2.2 (b)) between 109.7-110 cm and 113.2-
115 cm. The accuracy of the localisation depends on the
accuracy of the density profile used to map the probing
frequency (GHz) into radial distance (cm). Please note
that line contour plots where used in figure 5.2.2 in order
to make the graphical representation of the mappings more
clear.
6. CONCLUSIONS
The data analysis technique described in this paper, which
estimates the evolution of the local power spectrum of
non-stationary signals, is particularly adequate to process
broadband reflectometry signals. In the resulting time-
108 110 112 114 116 118 120
Figure 5.2.1
- 62 -
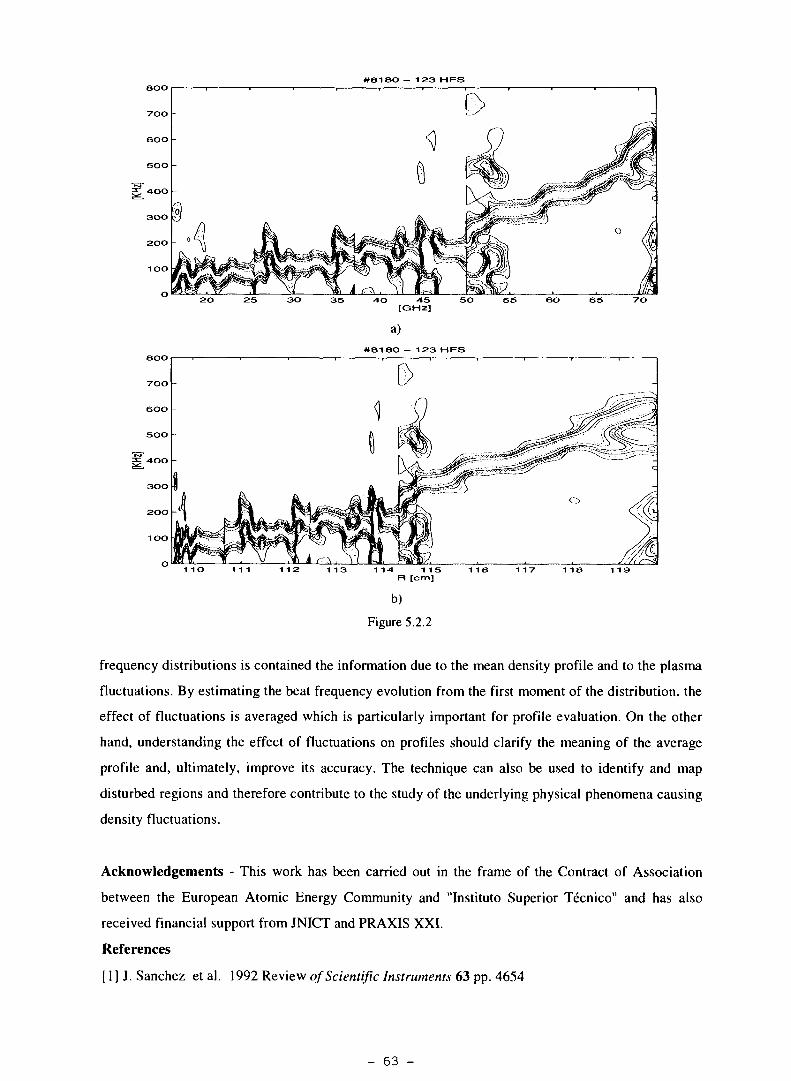
#81 SO - 123 HFS
4O 45[GHz]
a)#81 SO — 123 HFS
11O 111
b)
Figure 5.2.2
frequency distributions is contained the information due to the mean density profile and to the plasma
fluctuations. By estimating the beat frequency evolution from the first moment of the distribution, the
effect of fluctuations is averaged which is particularly important for profile evaluation. On the other
hand, understanding the effect of fluctuations on profiles should clarify the meaning of the average
profile and, ultimately, improve its accuracy. The technique can also be used to identify and map
disturbed regions and therefore contribute to the study of the underlying physical phenomena causing
density fluctuations.
Acknowledgements - This work has been carried out in the frame of the Contract of Association
between the European Atomic Energy Community and "Instituto Superior Técnico" and has also
received financial support from JNICT and PRAXIS XXI.
References
[ I ] J. Sanchez et al. 1992 Review of Scientific Instruments 63 pp. 4654
- 63 -

[2] G. R. Hanson et al. 1992 Review of Scientific Instruments 63 pp. 4658
[3] A. Huggenholtz et al. 1991 Review of Scientific Instruments 62 pp. 1100
[4] K. W. Kim et al. 1995 Review of Scientific Instruments 66 pp. 1229
[5] A. Silva et al. 1995 Proc. 22nd Eur, Conf. Vol. 19C Part IV pp. 413
[6] F. Clairet et al. 1994 Proc. 21st Eur. Conf. Vol. 18B Part III pp.l 172
[7] M. Nagatsu et al. 1996 Plasma Phys. Control Fusion 38 pp. 1033.
[8] A. Silva et al. 1996 Review of Scientific Instruments 67 pp. 4138
[9] B. Porat et al. 1994 Digital Processing of Random Signals, Prentice-Hall, Englewood Cliffs
- 64 -
Density profile and fluctuation measurements with Microwave Reflectometry
on ASDEX UPGRADE
M. Manso, F. Serra, J. Santos, I. Nunes, A.Silva, B. Kurzan*, P.Várela, S.Vergamota,
T.Grossmann, W. Suttrop*
Associagäo EURATOM/IST, CFN, Instituto Superior Técnico - 1096 Lisboa Codex
*MPI fuer Plasmaphysik, EURATOMAssociation, D-85748 Garching, Germany
1. Introduction
The microwave reflectometry system on ASDEX Upgrade uses O-mode at high-field (HFS) and
low-field (LFS) sides, X-mode (low-field) and can operate at broadband ultrafast sweep (> 20 fis)
and at fixed frequency, probing densities up to ~ 6.5x10¹⁹ m'3 [1]. Broadband reflectometry
view the plasma continuously in space at narrow time slots, and fixed frequency in narrow space
slots (density layers) along large time windows. Here we present results obtained during H -
mode discharges in ASDEX Upgrade where broadband and fixed frequency results are used in a
complementary way to analyse profile changes and fluctuations.
2. Broadband swept operation
Plasma fluctuations "print" their signature on the reflectometry signals but for profile
inversion only the average beat frequency fß is extracted and the perturbations due to fluctuations
are regarded (together with the noise from the system) as problems to the profile evaluation. Here
we apply a method based on the estimation of the time-frequency distribution (TFD) of the
energy of the reflectometry signals, that gives both fß and the profile perturbations. The
broadband signals are nonstationary because their spectral characteristics vary along the sweep
and the method uses the concept of instantaneous frequency (fi) that was introduced to describe
the frequency of nonstationary signals at a particular time [2]. The/if is the first moment of the
TFD with respect to the frequency [2]. Several TFD's can be used to estimate the fi, in our
study we used the simplest one which is the periodogram. This can be computed with a sliding
- 65 -
window Short-Time-Fourier Transform (STFT), being applicable as long as the signals are
locally (in each window) quasistationary; the method and its application to broadband
reflectometry is described in [3]. The analysis contributes to the study of the physical phenomena
underlying plasma fluctuations and to the understanding of the effect of fluctuations on the
profile which will improve the accuracy of profile measurement from reflectometry.
2.1 JJH transition
The ASDEX Upgrade plasma was probed with the simultaneous operation of several O-mode
reflectometry channels in the frequency range F: 17-72 GHz, corresponding to densities ne: 0.4 -
6.5 x 10¹⁹ m"3. The measurements were performed at the high field side (HFS) during the ELMy
phase of shot #8180. The interval between consecutive sweeps was 5 ms and the sweeping time
100 |0,s.
The distribution of energy in time and frequency (periodograms) of the reflectometry signals is
shown in Fig. 1 for the L and H phases; signals were obtained at the LFS with three channels
(K, Ka, Q bands) and at the HFS with four channels (K, Ka, Q , V bands). The maps show that
the line where the energy is mainly concentrated, corresponding to the average density profile, is
disturbed due to the density fluctuations; in some regions the main peak is reduced or even
disappears because the energy is scattered by fluctuations, (for example for F > 45 GHz in Fig.
Ib). In other cases sidebands of the main peak arise (for example, Fig. lb at F~ 35 GHz)
indicating that a perturbation with a well defined frequency occurs. The observed patterns reveal
the complexity of the interaction between the incident beam and the fluctuating plasma. Here the
performance of the reflectometry system plays a major role because when the reflected signal is
weak the characteristic of the system (seen for example at very low fe in Fig. la, for F > 38
GHz), may becomes dominant preventing xg measurements in the corresponding frequency
range. For this reason an heterodyne detection system is being implemented that will improve
the S/N in some 30 dB (according to the laboratory tests).
The above periodograms are a useful tool not only for profile evaluation but also to study plasma
fluctuations due to the wide spatial window of probing and high temporal resolution of
broadband reflectometry measurements. After the L/H transition it is observed that fluctuations
- 66 -
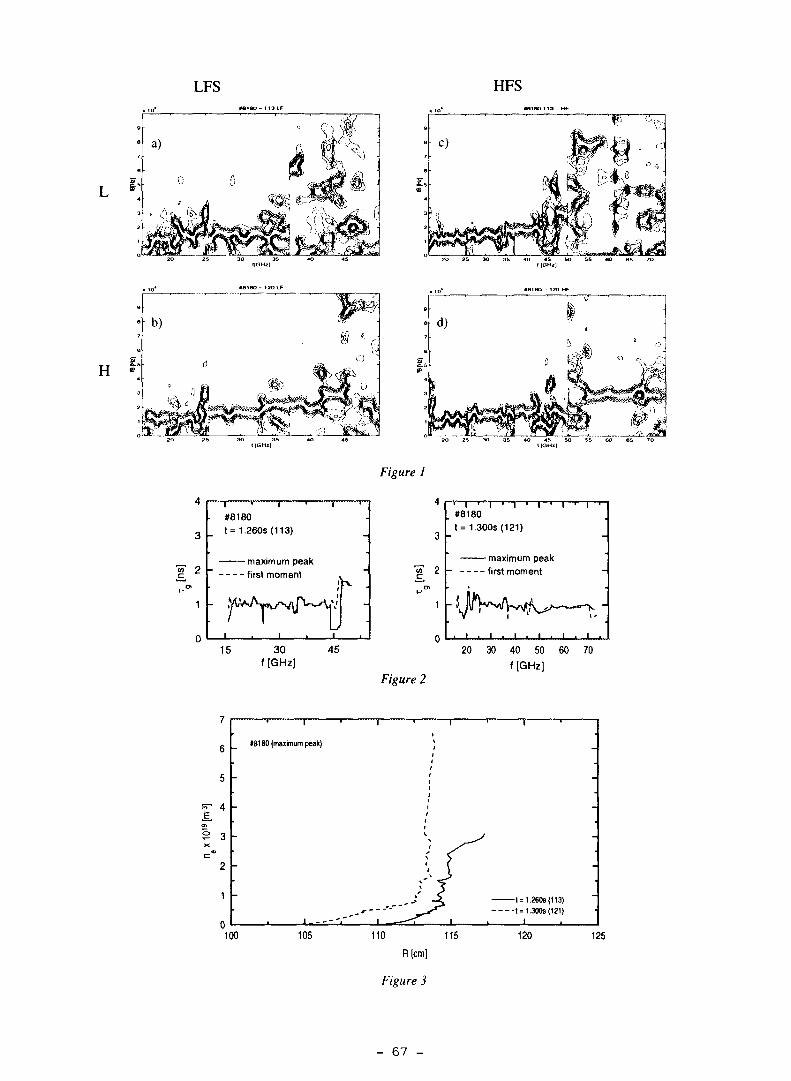
LFS HFSMS1BO - 113 LF
H
#8ISO 113 - HF
26 3O 3S 4O 45
•B1BO - 12OLF
g
8
7
Is(8
3
2
• ID*
d)
!
«81 BO - 120 HF
C |
•J
t
t ° >s$
IO 45 25 3O 3B
Figure 1
#8180t = 1.260s (113)
maximum peakfirst moment
15 30f [GHz]
45
#8180t = 1.300s (121)
maximum peakfirst moment
Figure 2
20 30 40 50 60 70
f [GHz]
5
™ 4
? 3
2
1
#8180 {maximum peak)
100 105
Figure 3
- 1 = 1.260s (113)
-1= 1.300s (121)
120 125
- 67 -
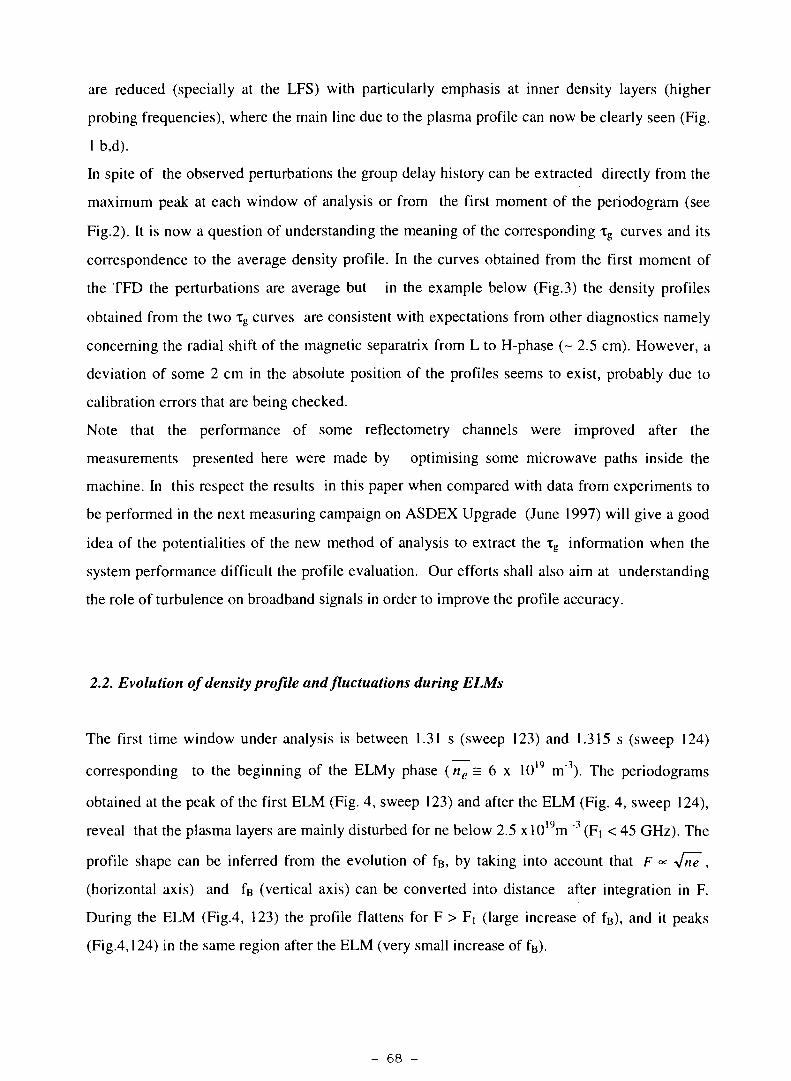
are reduced (specially at the LFS) with particularly emphasis at inner density layers (higher
probing frequencies), where the main line due to the plasma profile can now be clearly seen (Fig.
1 b,d).
In spite of the observed perturbations the group delay history can be extracted directly from the
maximum peak at each window of analysis or from the first moment of the periodogram (see
Fig.2). It is now a question of understanding the meaning of the corresponding xg curves and its
correspondence to the average density profile. In the curves obtained from the first moment of
the TFD the perturbations are average but in the example below (Fig.3) the density profiles
obtained from the two Tg curves are consistent with expectations from other diagnostics namely
concerning the radial shift of the magnetic separatrix from L to H-phase (~ 2.5 cm). However, a
deviation of some 2 cm in the absolute position of the profiles seems to exist, probably due to
calibration errors that are being checked.
Note that the performance of some reflectometry channels were improved after the
measurements presented here were made by optimising some microwave paths inside the
machine. In this respect the results in this paper when compared with data from experiments to
be performed in the next measuring campaign on ASDEX Upgrade (June 1997) will give a good
idea of the potentialities of the new method of analysis to extract the tg information when the
system performance difficult the profile evaluation. Our efforts shall also aim at understanding
the role of turbulence on broadband signals in order to improve the profile accuracy.
2.2. Evolution of density profile and fluctuations during ELMs
The first time window under analysis is between 1.31 s (sweep 123) and 1.315 s (sweep 124)
corresponding to the beginning of the ELMy phase (ne = 6 x 10¹⁹ m 3). The periodograms
obtained at the peak of the first ELM (Fig. 4, sweep 123) and after the ELM (Fig. 4, sweep 124),
reveal that the plasma layers are mainly disturbed for ne below 2.5 xl019m "3 (Fi < 45 GHz). The
profile shape can be inferred from the evolution of fu, by taking into account that F <* yfnë ,
(horizontal axis) and fu (vertical axis) can be converted into distance after integration in F.
During the ELM (Fig.4, 123) the profile flattens for F > Fi (large increase of fB), and it peaks
(Fig.4,124) in the same region after the ELM (very small increase of fB).
- 68 -
#8180- 123/124 HFS
I [GHZ|
Figure 1
The density profiles (Fig.5.a) obtained
directly from the first moment of the
periodograms show that the profile
flattening occur close and inside the
magnetic separatrix, nes s 1.5 x 10¹⁹ m" .
Outside the separatrix the changes in the
profile are very small, the plasma moves
only slightly outward during the ELM. In
Fig. 5b two profiles are shown for a
different window in the ELMy phase, for
19 m"3 19 m"3« 7 = 9 x 10¹⁹ m"3 and nes = 4.1 x 10¹⁹ m"3 ;
t = 1.82 s (sweep 225) is between ELMs and
t = 1.83s (227) is during one ELM (see
Fig.6). The crossing point of the profiles
during an ELM and between ELMs in both
studied cases, Fig. 5 (a,b), occur at a density
close to nes , suggesting therefore that the
separatrix region acts as a kind of "joint" for
profile movements.
7
6
5CO
k 4
o 3xc
1
0
#8180
- t = 1.305s (122)-1= 1.310s (123)
100 105 110 115R [cm]
a)nes=1.5xW'"mJ
120 125
7
6
5cô"1
k 4
oo 3x
#8180 \
- 2711 MS (225)- 7 8 4 MS (227)
100 105 110 115R [cm]
120 125
)nes=4.1 xlO19 m '
Figure 2
1.819 1.82 1.B2S 1.63
Figure 3
- 69 -
3. Fixed frequency operation
With fixed frequency specific plasma density layers are probed at a rate of 1 |Xs (sampling
frequency: 1 MHz). A technique to track the plasma position of fixed density layers is presented
and demonstrated for the density profile build-up during L- to H- transitions.
The temporal evolution of the frequency spectra of the reflected signals (with 300 kHz
maximum imposed by the data acquisition rate) shows an abrupt reduction of the turbulent
fluctuations at the L - H transition. The reduction is observed both at the high and low-field sides
and permits to identify the time of transition (aside from the decrease of the D a signal) with high
temporal resolution. In the spectral content of the reflected signals a clear low-frequency
oscillation ( < 500 Hz) is also observed around the L-H transition, due to the radial displacement
outwards of the reflecting layer as the edge density gradient increases. From the corresponding
phase and amplitude variations the incremental shift of the position of the reflecting layers can be
inferred, with an accuracy (in the millimetre range) defined by the high temporal resolution of the
detected fringes (3|is). Therefore, the profile build-up following the L-H transition can be tracked
revealing the temporal development of the transport barrier.
3.1. Analysis of turbulence during an H-mode discharge
In a homodyne system the detected signal is sensitive to amplitude and phase fluctuations, such
that V(t) = A(t) cos <(>(t), where ((>(t) is the phase difference between the signals from the plasma
and the reference arm. A reflection layer at a fixed equilibrium position leads to a constant phase
angle. Density fluctuations will cause displacements and corrugations of the refractive index
surfaces, leading to amplitude and phase variations that will have impact on the spectral
components of the detected signal.
The temporal evolution of the power spectra is obtained using a FFT sliding technique. Fig. 7
c-e shows the contour plots , corresponding to three probing frequencies: 22.7 GHz (n~0.64xl019
m"3,at the HFS),31.7 GHz (n~1.24xl0l9rn\close to the magnetic separatrix, at the LFS), 45.7
GHz (n ~ 2.58xl019 m"3 , LFS), for # 8595; it is a discharge with unfavourable gradB drift
direction (away from the X-point), where the H-mode is attained through ctr-NBI with high
heating power
- 70 -
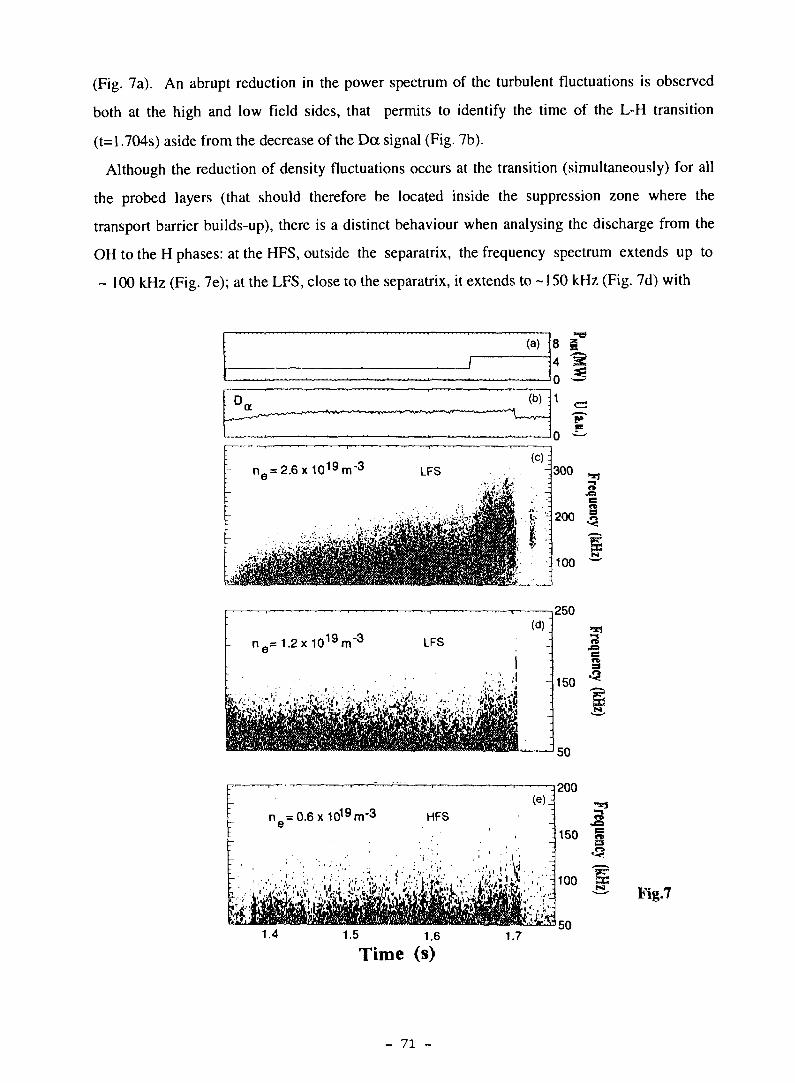
(Fig. 7a). An abrupt reduction in the power spectrum of the turbulent fluctuations is observed
both at the high and low field sides, that permits to identify the time of the L-H transition
(t=l .704s) aside from the decrease of the Da signal (Fig. 7b).
Although the reduction of density fluctuations occurs at the transition (simultaneously) for all
the probed layers (that should therefore be located inside the suppression zone where the
transport barrier builds-up), there is a distinct behaviour when analysing the discharge from the
OH to the H phases: at the HFS, outside the separatrix, the frequency spectrum extends up to
~ 100 kHz (Fig. 7e); at the LFS, close to the separatrix, it extends to -150 kHz (Fig. 7d) with
n_=1.2x10¹⁹m"3 LFS
n e =0.6x 10¹⁹m-3 HFS
15 1.6
Time (s)
250
150
50
--m^mmM
200
150
100
50
Fig.7
- 71 -
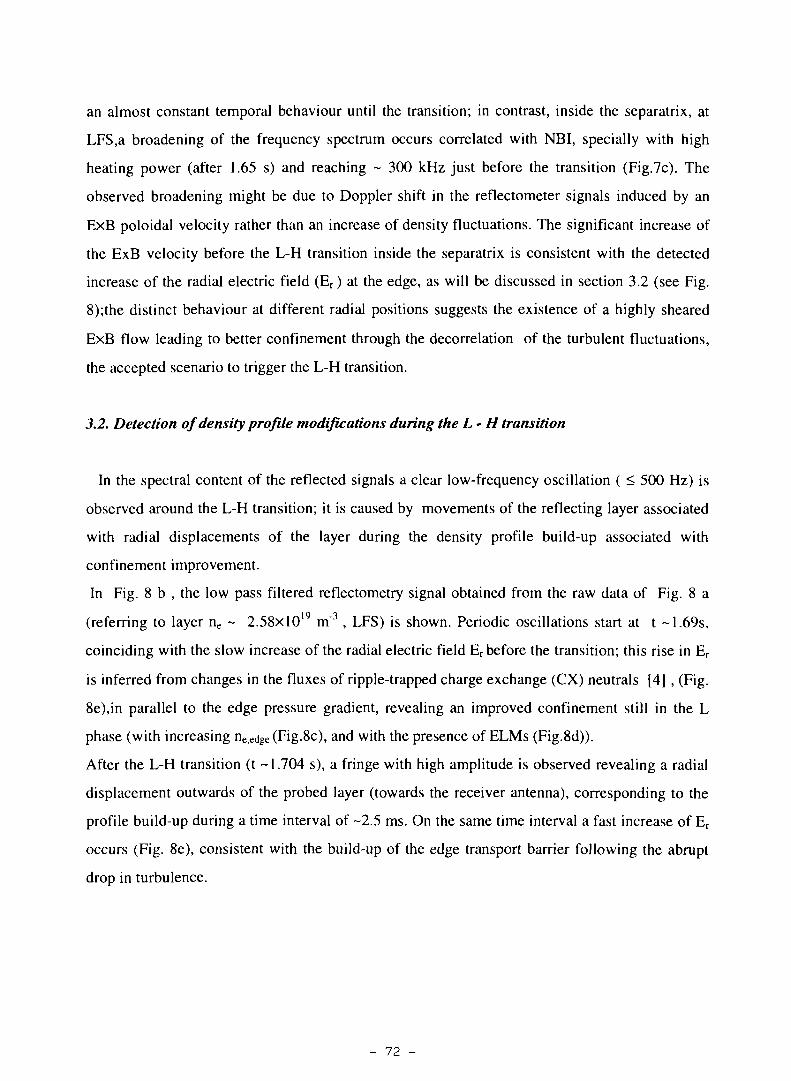
an almost constant temporal behaviour until the transition; in contrast, inside the separatrix, at
LFS,a broadening of the frequency spectrum occurs correlated with NBI, specially with high
heating power (after 1.65 s) and reaching ~ 300 kHz just before the transition (Fig.7c). The
observed broadening might be due to Doppler shift in the reflectometer signals induced by an
ExB poloidal velocity rather than an increase of density fluctuations. The significant increase of
the ExB velocity before the L-H transition inside the separatrix is consistent with the detected
increase of the radial electric field (Er ) at the edge, as will be discussed in section 3.2 (see Fig.
8);the distinct behaviour at different radial positions suggests the existence of a highly sheared
ExB flow leading to better confinement through the decorrelation of the turbulent fluctuations,
the accepted scenario to trigger the L-H transition.
3 . 2 . D e t e c t i o n of density profile modifications during the L - H t r a n s i t i o n
In the spectral content of the reflected signals a clear low-frequency oscillation ( < 500 Hz) is
observed around the L-H transition; it is caused by movements of the reflecting layer associated
with radial displacements of the layer during the density profile build-up associated with
confinement improvement.
In Fig. 8 b , the low pass filtered reflectometry signal obtained from the raw data of Fig. 8 a
(referring to layer ne ~ 2.58xl019 m3 , LFS) is shown. Periodic oscillations start at t ~1.69s,
coinciding with the slow increase of the radial electric field Er before the transition; this rise in Er
is inferred from changes in the fluxes of ripple-trapped charge exchange (CX) neutrals [4] , (Fig.
8e),in parallel to the edge pressure gradient, revealing an improved confinement still in the L
phase (with increasing ne,edge (Fig.8c), and with the presence of ELMs (Fig.8d)).
After the L-H transition (t -1.704 s), a fringe with high amplitude is observed revealing a radial
displacement outwards of the probed layer (towards the receiver antenna), corresponding to the
profile build-up during a time interval of -2.5 ms. On the same time interval a fast increase of Er
occurs (Fig. 8e), consistent with the build-up of the edge transport barrier following the abrupt
drop in turbulence.
- 72 -
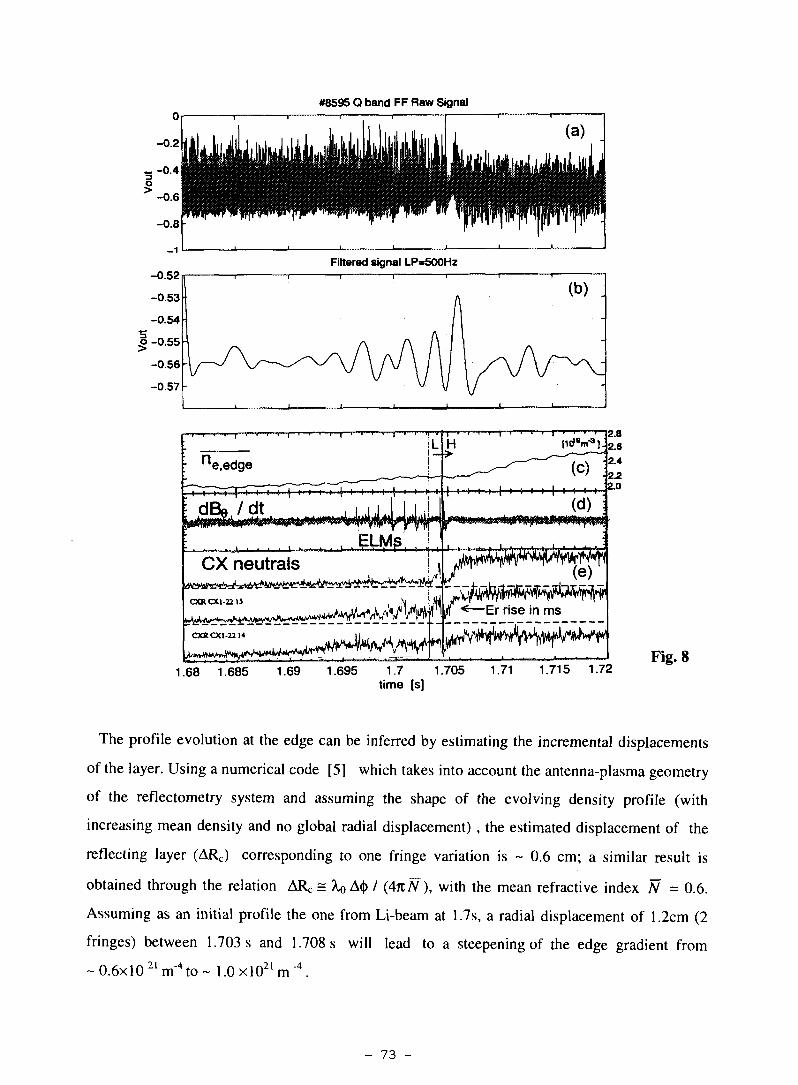
#8595 Q band FF Raw Signal
CX neutrals .
CXROCl-2215
CXRCXl-22 141 ^ ^ ^
(e)
«•—Er rise in ms
1.68 1.685 1.69 1.695 1.7 1.705 1.71 1.715 1.72time [s]
Fig. 8
The profile evolution at the edge can be inferred by estimating the incremental displacements
of the layer. Using a numerical code [5] which takes into account the antenna-plasma geometry
of the reflectometry system and assuming the shape of the evolving density profile (with
increasing mean density and no global radial displacement) , the estimated displacement of the
reflecting layer (ARC) corresponding to one fringe variation is ~ 0.6 cm; a similar result is
obtained through the relation ARc = Xo A<|) / (4nN), with the mean refractive index N = 0.6.
Assuming as an initial profile the one from Li-beam at 1.7s, a radial displacement of 1.2cm (2
fringes) between 1.703 s and 1.708 s will lead to a steepening of the edge gradient from
0.6x10 21m"4 t o - 1.0xl021m"4.
- 73 -
The impact on the density profile of the full development of the transport barrier might
therefore be tracked with the "continuous" temporal probing of several density layers (from the
edge up to the bulk plasma), as foreseen for the next measuring campaign (with probed densities
up to ~ 14xl0 l 9m3) . However, an heterodyne detection system for the direct measurement of the
phase will be important in order to overcome ambiguities that might occur with fringe detection
when the plasma layers move back and forth (as in the profile changes caused by ELMs).
4. Discussion and concluding remarks
Broadband results
A new data analysis method was applied to broadband reflectometry which unfolds the energy
associated with the reflection from the plasma and the energy scattered by fluctuations, giving its
particular location in time (density) and frequency.
From the point of view of profile evaluation this is very important because it avoids the use
of narrow digital filtering and therefore retains details of the group delay curve that may be
important for profile accuracy. It also "smooth" errors that occur when a significant part of the
energy is scattered by fluctuations and the spectral peak deviates from the average beat
frequency. Profiles were measured in ASDEX Upgrade showing that during an ELM, the profile
flattens inside the separatrix coinciding with the rise of the Da signal; for t> 500 ^s the profile
is already peaking and continues until a new ELM occurs. The detailed profile changes in each
density layer and the evolution of the local energy spectrum of plasma perturbations were
obtained from the history of the energy spectrum in each window of analysis. Strong
perturbations were observed during ELMs and between ELMs in the middle region of the
plasma, and also at the onset of the ELM, in the inner zone where the profile flattening occurs.
Further and more detailed experiments (with sweeps of 20(is, spaced by 30|is) are foreseen
to determine if the observed perturbations can be attributed to MHD activity.
Fixed frequency results
In addition to information about the abrupt decrease of turbulence and about the increase of
plasma rotation at the L - H transition, the spectral content of the reflected signals was also used
to obtain insight about density profile changes. By low-pass filtering the spectra of the reflected
- 74 -
signals, fringes due to radial displacement of the density layers during the profile build-up can be
identified. With this technique the incremental shift of the position of the reflecting layer can be
estimated with an accuracy in the millimetre range.
A new reflectometry channel has been recently installed for monitoring the L - H transition on
ASDEX Upgrade, to operate in fixed frequency independently of the other channels [6].
Simultaneous measurements with fixed frequency and broadband operation in the same discharge
(as foreseen for the next measuring campaign on ASDEX Upgrade), will provide density profile
measurements with high temporal and spatial resolutions and further indication about the
absolute position of the layers probed in fixed frequency. The potential of a such a highly
performant reflectometry diagnostic suggests the possibility of tracking continuously the motion
of plasma layers associated with important physical phenomena where fast profile changes occur
(such as L-H transition, ELMs and MARFES).
Acknowledgments
This work has been carried out in the frame of the Contract of Association between the
European Atomic Energy Community and "Instituto Superior Técnico" and has also received
financial support from "Junta Nacional de Investigaçâo Cientifica e Tecnologica" and PRAXIS
XXI.
References
l\l A. Silva et al., Rev. Sci. Instrum. 67 (12), 1996.
Ill B. Porat, Digital Processing of Random Signals, Prentice-Hall, Englewood Cliffs, 1994
131 J. Santos et al., (1997), III Reflectometry Workshop for Fusion Plasmas, Madrid, 1997.
14/ W. Herrmann et al., Phys. Rev. Lett. 75, 4401, 1995.
151 T. Grossmann et al., this Conference, III Reflectometry Workshop for Fusion Plasmas,
Madrid, 1997.
/6/ A. Silva et al., Ill Reflectometry Workshop for Fusion Plasmas, Madrid, 1997.
- 75 -
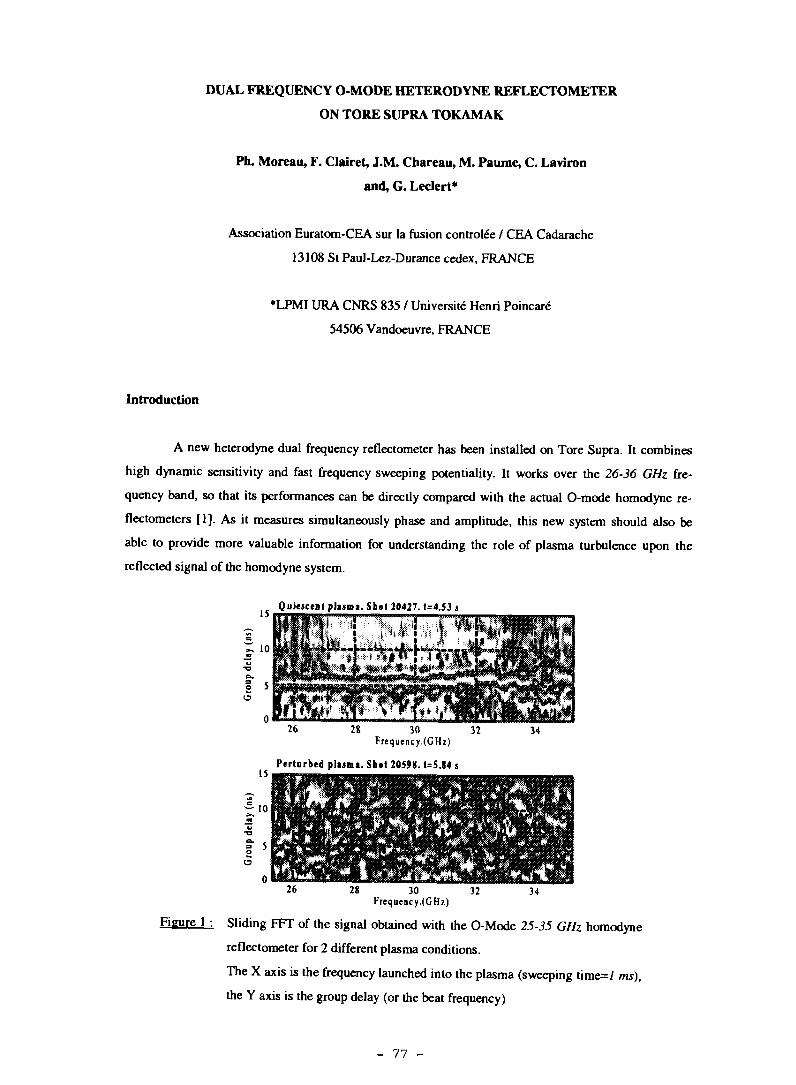
DUAL FREQUENCY 0-MODE HETERODYNE REFLECTOMETER
ON TORE SUPRA TOKAMAK
Ph. Moreau, F. Clairet, J.M. Chareau, M. Paume, C. Laviron
and, G. Leclert*
Association Euratom-CEA sur la fusion contrôlée / CEA Cadarache
13108 St Paul-Lez-Durance cedex, FRANCE
*LPMI URA CNRS 835 / Université Henri Poincaré
54506 Vandoeuvre, FRANCE
Introduction
A new heterodyne dual frequency reflectometer has been installed on Tore Supra. It combines
high dynamic sensitivity and fast frequency sweeping potentiality. It works over the 26-36 GHz fre-
quency band, so that its performances can be directly compared with the actual 0-mode homodyne re-
flectometers [1]. As it measures simultaneously phase and amplitude, this new system should also be
able to provide more valuable information for understanding the role of plasma turbulence upon the
reflected signal of the homodyne system.
Q u i t t e n t plasma. Shot 20427. t=4.53 s
Figure
34
Perturbed plasma. Shot 20598. t=5.84 s
28 30 32Frequency.(GHz)
34
Sliding FFT of the signal obtained with the O-Mode 25-35 GHz homodyne
reflectometer for 2 different plasma conditions.
The X axis is the frequency launched into the plasma (sweeping time=7 ms),
the Y axis is the group delay (or the beat frequency)
- 77 -
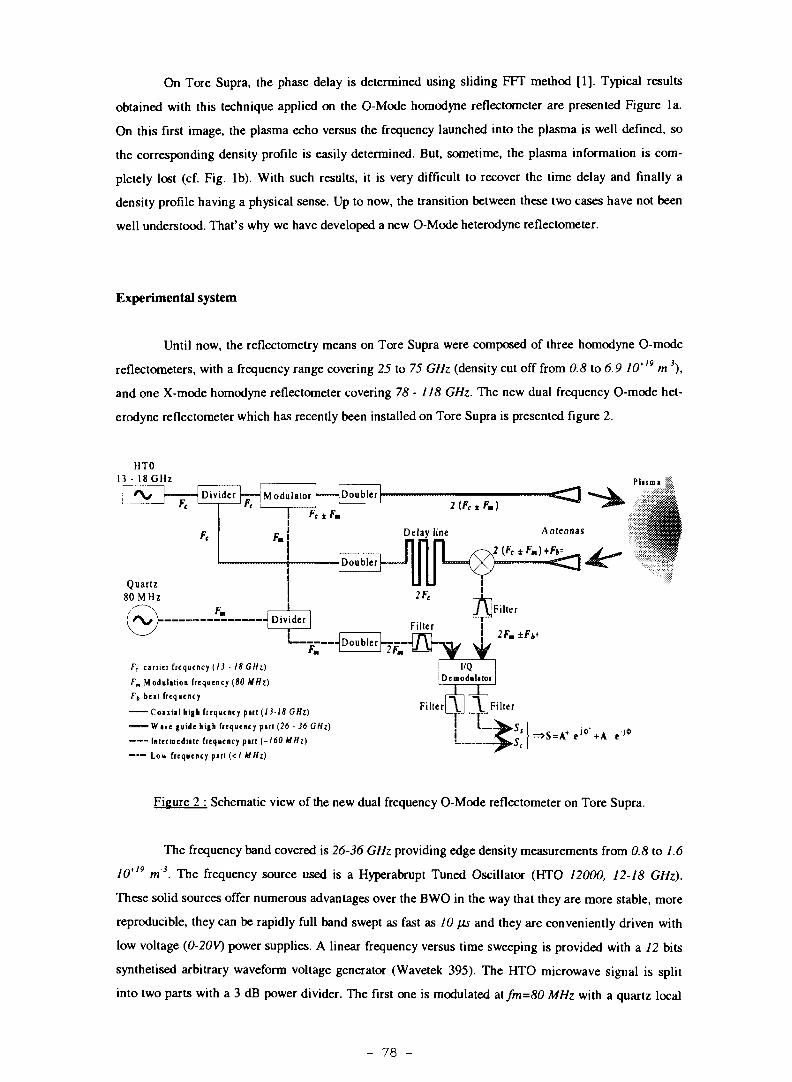
On Tore Supra, the phase delay is determined using sliding FFT method [1]. Typical results
obtained with this technique applied on the O-Mode homodyne reflectometer are presented Figure la.
On this first image, the plasma echo versus the frequency launched into the plasma is well defined, so
the corresponding density profile is easily determined. But, sometime, the plasma information is com-
pletely lost (cf. Fig. lb). With such results, it is very difficult to recover the time delay and finally a
density profile having a physical sense. Up to now, the transition between these two cases have not been
well understood. That's why we have developed a new O-Mode heterodyne reflectometer.
Experimental system
Until now, the reflectometry means on Tore Supra were composed of three homodyne O-mode
reflectometers, with a frequency range covering 25 to 75 GHz (density cut off from 0.8 to 6.9 10*'9 m3),
and one X-mode homodyne reflectometer covering 78 - 118 GHz- The new dual frequency O-mode het-
erodyne reflectometer which has recently been installed on Tore Supra is presented figure 2.
Plisraa
Fc carrier frequency {13 - 18 GHz)
Fm Modulation frequency (80 MHz)
Ft, beit frequency
C o n n I high frequency pirt {13-18 GHz)aBSBB™i Wive guide high frequency pitt [26 • 36 G Hi)
——— Intermediate frequency part {-160 MHz)
—— Low frequency pirt (</ MHz)
Filter[y| | \ J Filterl5>J < r
Figure 2 : Schematic view of the new dual frequency O-Mode reflectometer on Tore Supra.
The frequency band covered is 26-36 GHz providing edge density measurements from 0.8 to 1.6
10*'9 m3. The frequency source used is a Hyperabrupt Tuned Oscillator (HTO 12000, 12-18 GHz).
These solid sources offer numerous advantages over the BWO in the way that they are more stable, more
reproducible, they can be rapidly full band swept as fast as 10 fis and they are conveniently driven with
low voltage (0-20VO power supplies. A linear frequency versus time sweeping is provided with a 12 bits
synthetised arbitrary waveform voltage generator (Wavetek 395). The HTO microwave signal is split
into two parts with a 3 dB power divider. The first one is modulated atfm=80 MHz with a quartz local
- 78 -
oscillator and then frequency doubled with an active frequency doubler. Therefore, two frequencies sepa-
rated by 320 MHz {2F+2fm and also 2F-2fm) are launched into the plasma through 4 m of fundamental
wave guides. The other part is used as phase reference with a line delay to allow to compensate for phase
differences of the probing wave due to the propagation into the emitter and receiver wave guides. To
emit and receive the signal, two closely separated rectangular antennas (49 x 37 mm2 20 dB gain) are
used.
When the plasma and reference wave are mixed the resulting signal is at twice the modulation
frequency 2fm=160 MHz and contains information from the two cut off layers as two beat frequencies
noted fb+ and fb.. Finally, the detection is completed using an I/Q mixer providing in-phase and 90°-
phase signals and allowing absolute phase and amplitude detection for both frequencies launched into
the plasma. The demodulation is performed with the same quartz oscillator providing no need of phase
locking system.
The key point in this heterodyne reflectometer, is the modulator to frequency convert the prob-
ing wave. In a first prototype, the modulation has been done with a single side band modulator (SSBM)
supposed to provide only one frequency F+fm. It then would have been possible to perform density pro-
file as well as density fluctuation measurements. But after active doubling, the lower side band 2(F-fm)
reached a non negligible intensity (WdB) below the 2(F+fm) of interest. The lower band level was not
satisfactory so, we have replaced the SSBM with a simple mixer providing identical side bands.
The dynamic range of such heterodyne detection typically lies around 60 dB (to be compared to
20-30 dB for homodyne detection).
Data acquisition system
We have made numerous sweeping time tests to study the turbulence influence on the phase
detected. When the sweeping time decreases, the beat frequency is proportionally increased, needing to
adapt the acquisition system.
The first plasma experiments were done with 1 ms sweeping time, the beat frequency was of the
order of 200 kHz, and the acquisition was performed with a CAMAC 6810 (72 bits resolution, sampling
frequency I MHz, memory IMo).
The results down to JOO/Js sweeping time providing beat frequencies up to 2 MHz were re-
corded with ICM101 acquisition modules with 4 MHz sampling frequency and 12 bits resolution.
- 79 -
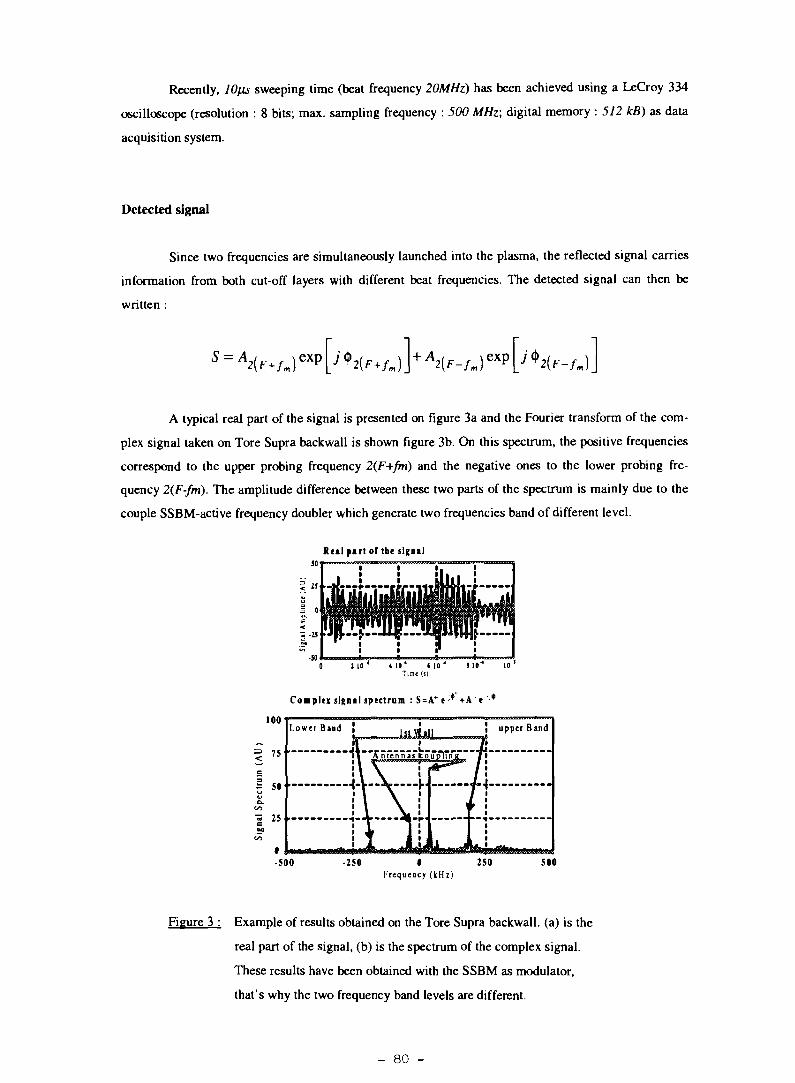
Recently, 70/is sweeping time (beat frequency 20MHz) has been achieved using a LeCroy 334
oscilloscope (resolution : 8 bits; max. sampling frequency : 500 MHz; digital memory : 512 kB) as data
acquisition system.
Detected signal
Since two frequencies are simultaneously launched into the plasma, the reflected signal carries
information from both cut-off layers with different beat frequencies. The detected signal can then be
written :
A typical real part of the signal is presented on figure 3a and the Fourier transform of the com-
plex signal taken on Tore Supra backwall is shown figure 3b. On this spectrum, the positive frequencies
correspond to the upper probing frequency 2(F+jm) and the negative ones to the lower probing fre-
quency 2(F-fm). The amplitude difference between these two parts of the spectrum is mainly due to the
couple SSBM-active frequency doubler which generate two frequencies band of different level.
Keil part of the signal
C o m p l u signal spectrum : S = A * e * +A e J*
100
-500 •250 IFrequency (kHz)
500
Figure 3 : Example of results obtained on the Tore Supra backwall. (a) is the
real part of the signal, (b) is the spectrum of the complex signal.
These results have been obtained with the SSBM as modulator,
that's why the two frequency band levels are different.
- 80 -
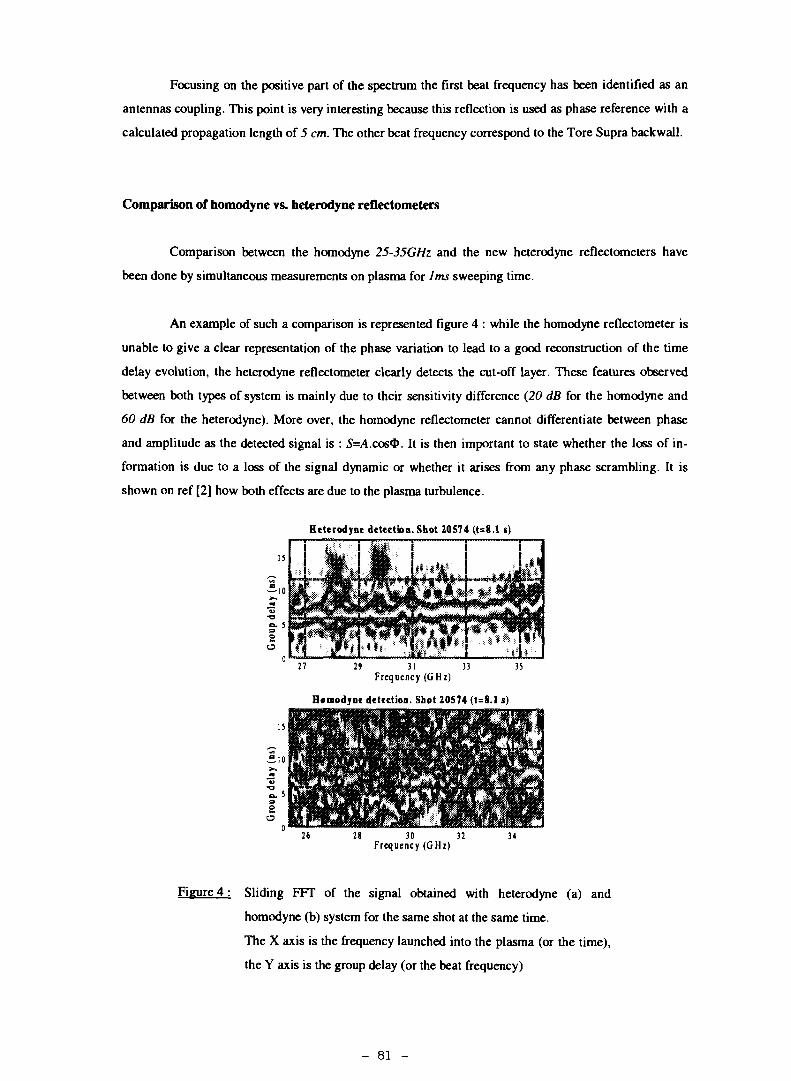
Focusing on the positive part of the spectrum the first beat frequency has been identified as an
antennas coupling. This point is very interesting because this reflection is used as phase reference with a
calculated propagation length of 5 cm. The other beat frequency correspond to the Tore Supra backwall.
Comparison of homodyne vs. heterodyne reflectometers
Comparison between the homodyne 25-35GHz and the new heterodyne reflectometers have
been done by simultaneous measurements on plasma for lms sweeping time.
An example of such a comparison is represented figure 4 : while the homodyne reflectometer is
unable to give a clear representation of the phase variation to lead to a good reconstruction of the time
delay evolution, the heterodyne reflectometer clearly detects the cut-off layer. These features observed
between both types of system is mainly due to their sensitivity difference (20 dB for the homodyne and
60 dB for the heterodyne). More over, the homodyne reflectometer cannot differentiate between phase
and amplitude as the detected signal is : S=/4.cos«J>. It is then important to state whether the loss of in-
formation is due to a loss of the signal dynamic or whether it arises from any phase scrambling. It is
shown on ref [2] how both effects are due to the plasma turbulence.
Heterodyne detection. Shot 20S74 (t=8.1 s)
29 31 33Frequency (GHz)
Homodyne detection. Shot 20574 (t=8.1 s)
35
28 30 32Frequency (GHz)
Figure 4 : Sliding FFT of the signal obtained with heterodyne (a) and
homodyne (b) system for the same shot at the same time.
The X axis is the frequency launched into the plasma (or the time),
the Y axis is the group delay (or the beat frequency)
- 81 -
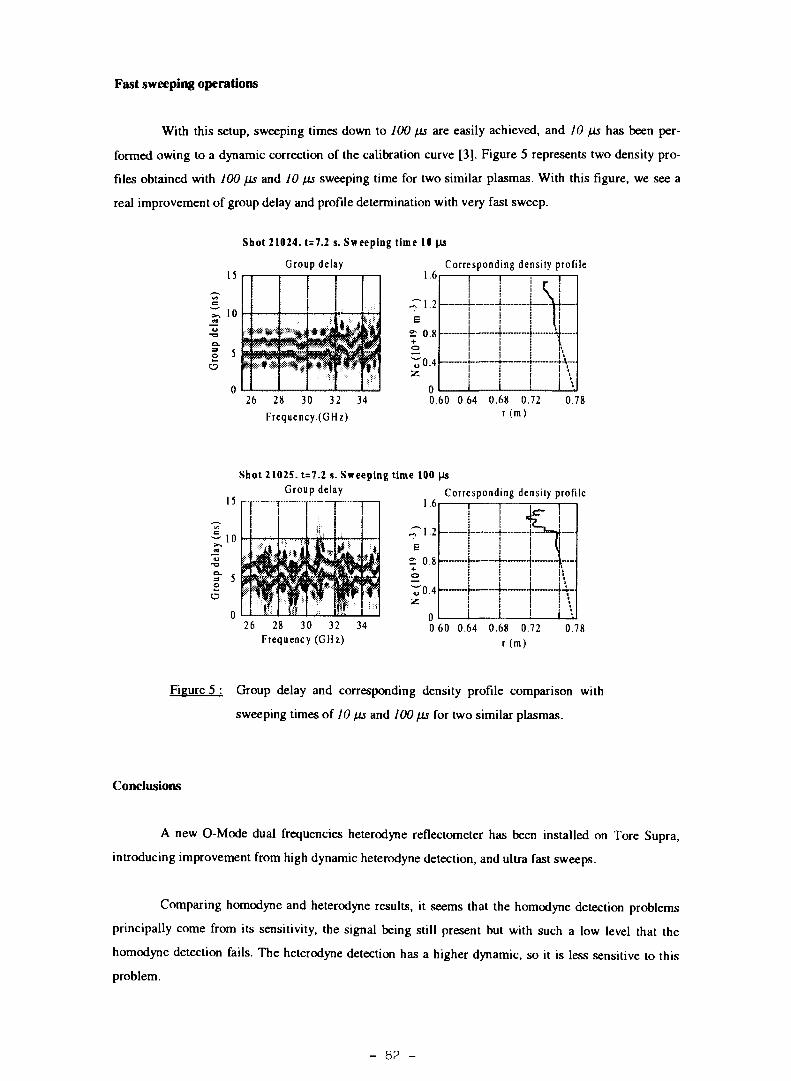
Fast sweeping operations
With this setup, sweeping times down to 100 /is are easily achieved, and 10 /js has been per-
formed owing to a dynamic correction of the calibration curve [3]. Figure 5 represents two density pro-
files obtained with 100 /us and 10 /us sweeping time for two similar plasmas. With this figure, we see a
real improvement of group delay and profile determination with very fast sweep.
Shot 21024. t=7.2 s. Sweeping time 10 \is
Group delay
o
26 28 30 32 34
Frequency.(GHz)
Corresponding density profile
0.60 0.64 0.68 0.72r(m)
0.78
Shot 21025. t=7.2 s. Sweeping time 100 Us
15
10
o
O
Group delay
*iif
mkmm"
m I ;:
«1
fir •
«II
m
hi
26 28 30 32 34Frequency (GHz)
Corresponding density profile
00.60 0.64 0.68 0.72
r (m)
Figure 5 : Group delay and corresponding density profile comparison with
sweeping times of 10 fis and 700 [is for two similar plasmas.
Conclusions
A new O-Mode dual frequencies heterodyne reflectometer has been installed on Tore Supra,
introducing improvement from high dynamic heterodyne detection, and ultra fast sweeps.
Comparing homodyne and heterodyne results, it seems that the homodyne detection problems
principally come from its sensitivity, the signal being still present but with such a low level that the
homodyne detection fails. The heterodyne detection has a higher dynamic, so it is less sensitive to this
problem.
- 82 -

The use of a solid state source HTO provides an ultra fast sweeping time (10 [is). We have
compared results with different sweeping times and we can conclude that the profile determination is
greatly enhanced with faster sweep.
This new reflectometer launches two frequencies into the plasma, amplitude and phase being
measured separately for each one. This particularity provides numerous physical studies as developped
in [2].
[1] M. Paume, J.M. Chareau, F. Clairet and X.L. Zou, Proc. IAEA Tech. Comm. Meeting on
microwave reflectometry for fusion plasma (Abingdon 1992) 21.
[2] F. Clairet, Ph. Moreau, J.M. Chareau, M. Paumeand G. Leclert, this workshop.
[3] C. Laviron, Ph. Moreau, F. Clairet J.M. Chareau and M. Paume this workshop.
SSiXTleft BLAWK
- 83 -
REFLECTOMETRY MEASUREMENTS ON THE
TORE SUPRA TOKAMAK
F. Clairet, P. Moreau, J.M. Chareau, M. Paume, C. Laviron
and, G. Leclert*
Association Euratom-CEA sur la fusion contrôlée / CEA Cadarache
13108 St Paul-Lez-Durance cedex, FRANCE
*LPMI URA CNRS 835 / Université Henri Poincaré
54506 Vandoeuvre, FRANCE
Introduction
Among the diagnostics measuring the electron density profiles, the reflectometry offers
the advantages of low cost, low maintenance, low access need, no sensitivity to radiation
and provides a good spatial resolution. However, this technique, based on phase delay
measurement of the reflected wave, suffers phase perturbation due to the plasma
turbulence. Despite numerous works, theoretical as well as experimental, the effects are
still not well understood. So we are still facing questions like : What is the turbulence?
What is its origin? How to characterise the perturbation? How localised is the
reflectometry measurement? And finally, how to get rid of the problem?.
Data processing: FFT technique vs. Phase unwrapping
The challenge of reflectometry as a radar technique is to measure the phase delay
experienced by a wave launched into a plasma :
— / N ( r , F ) d r - ^c a 2
where N(r,F) is the refraction index, re is the cut-off position and a is the plasma edge.
By linearly sweeping the frequency with respect to the time, the density profile
reconstruction is performed with the experimental determination of the time delay of the
wave propagating through the plasma up to the cut-off layer. This time delay is related to1 d<t>
the derivative of the phase : x = .
- 85 -
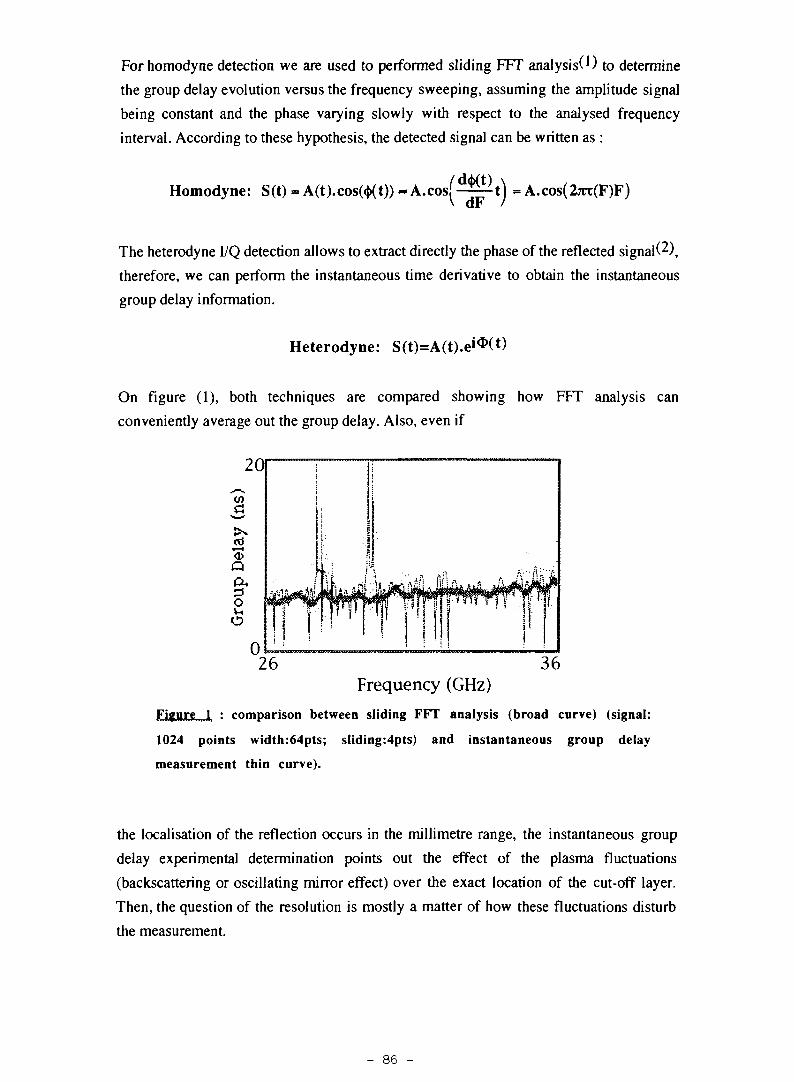
For homodyne detection we are used to performed sliding FFT analysis^) to determine
the group delay evolution versus the frequency sweeping, assuming the amplitude signal
being constant and the phase varying slowly with respect to the analysed frequency
interval. According to these hypothesis, the detected signal can be written as :
Homodyne: S(t) = A(t).cos(<Kt)) - A . c o s ( - ^ t ) = A.COS(2JCT(F)F)\ dF /
The heterodyne I/Q detection allows to extract directly the phase of the reflected signal^),
therefore, we can perform the instantaneous time derivative to obtain the instantaneous
group delay information.
Heterodyne: S(t)=A(t).e»^(t)
On figure (1), both techniques are compared showing how FFT analysis can
conveniently average out the group delay. Also, even if
20
i
!j . -1}•
i ;
' • ! '
; L A
w1 !fi
•
•
,3
iM I!|l1
ï i |M
026 36
Frequency (GHz)
Ejgurf;._! : comparison between sliding FFT analysis (broad curve) (signal:
1024 points width:64pts; sliding:4pts) and instantaneous group delay
measurement thin curve).
the localisation of the reflection occurs in the millimetre range, the instantaneous group
delay experimental determination points out the effect of the plasma fluctuations
(backscattering or oscillating mirror effect) over the exact location of the cut-off layer.
Then, the question of the resolution is mostly a matter of how these fluctuations disturb
the measurement.
- 86 -
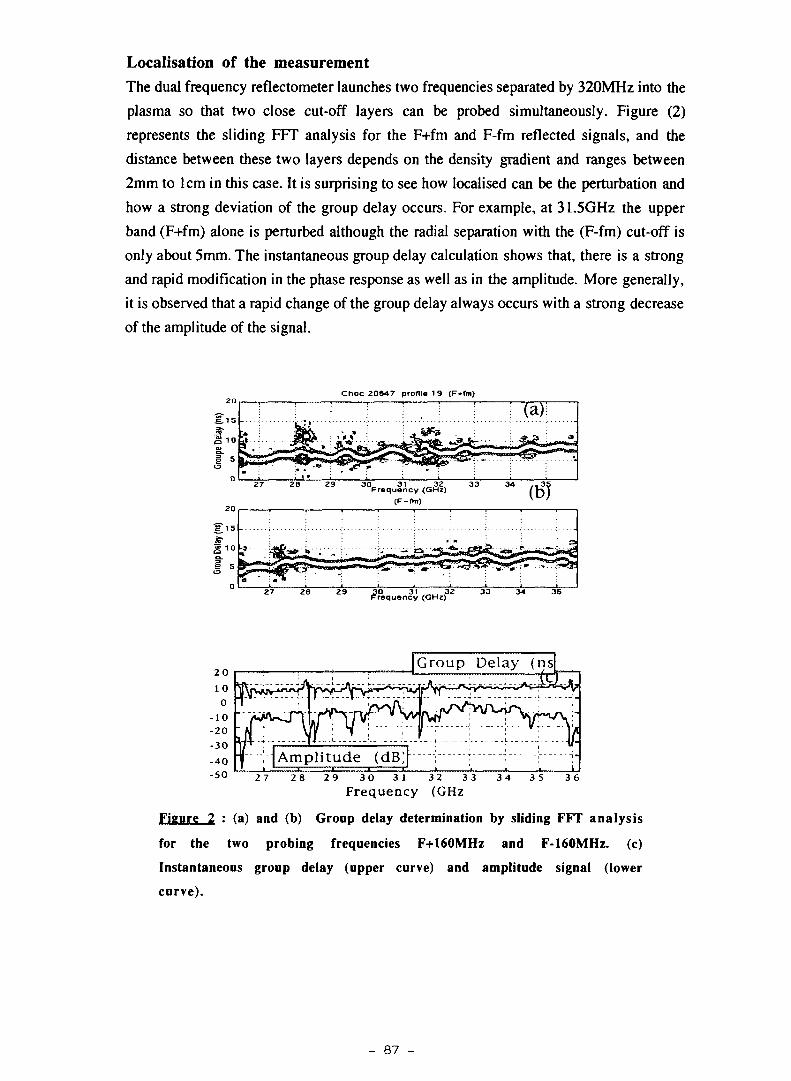
Localisation of the measurementThe dual frequency reflectometer launches two frequencies separated by 320MHz into the
plasma so that two close cut-off layers can be probed simultaneously. Figure (2)
represents the sliding FFT analysis for the F+fm and F-fm reflected signals, and the
distance between these two layers depends on the density gradient and ranges between
2mm to lcm in this case. It is surprising to see how localised can be the perturbation and
how a strong deviation of the group delay occurs. For example, at 31.5GHz the upper
band (F+fm) alone is perturbed although the radial separation with the (F-fm) cut-off is
only about 5mm. The instantaneous group delay calculation shows that, there is a strong
and rapid modification in the phase response as well as in the amplitude. More generally,
it is observed that a rapid change of the group delay always occurs with a strong decrease
of the amplitude of the signal.
0 i.
Choc 20847 profile 1 9 (F-.frn)
: : (aji
Z7 2B 29 30 31 32 33 34 , , 3ÇFrequency (GHz)
20 -
10 *
0 1- 1 0
-20 •-30 '- 4 0
i . i
! ^ ^r r Amplitude
•(dB;
jGroup
;
Delay (ns
VL
32 33 34 35 36
Frequency (GHz
Figure 2 : (a) and (b) Group delay determination by sliding FFT analysis
for the two probing frequencies F+160MHz and F-160MHz. (c)
Instantaneous group delay (upper curve) and amplitude signal (lower
curve).
- 87 -
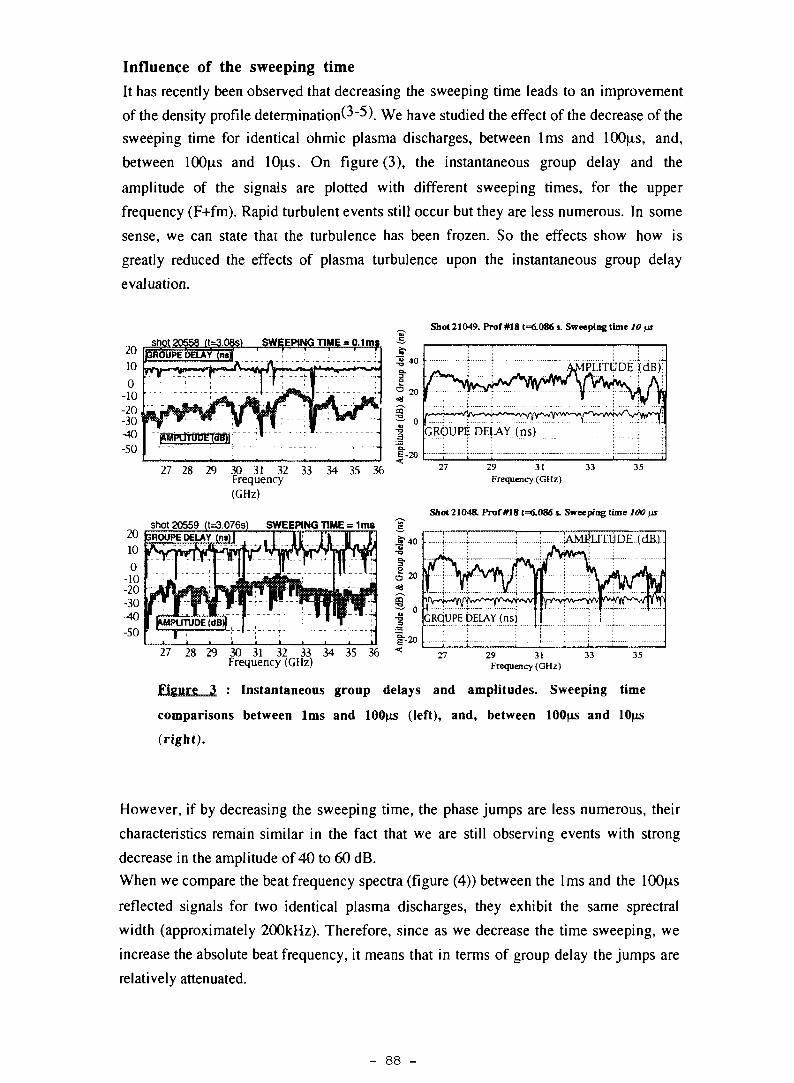
Influence of the sweeping time
It has recently been observed that decreasing the sweeping time leads to an improvement
of the density profile determination^-^) We have studied the effect of the decrease of the
sweeping time for identical ohmic plasma discharges, between lms and lOOjas, and,
between lOO^s and lO^is. On figure (3), the instantaneous group delay and the
amplitude of the signals are plotted with different sweeping times, for the upper
frequency (F+fm). Rapid turbulent events still occur but they are less numerous. In some
sense, we can state that the turbulence has been frozen. So the effects show how is
greatly reduced the effects of plasma turbulence upon the instantaneous group delay
evaluation.
Shot 21049. Prof #18t=<S.O86 s. Sweeping time 10 \x
shot 20558 tt=3 08s)
2010
0-10-20-30-40-50
27 28 29 30 31 32 33 34 35 36Frequency
(GHz)
shot 20559 (t=3.076s) SWEEPING TIME = 1 ma
29 31 33Frequency (GHz)
35
Shoe 21048. Prof 018 1=6.086*. Sweeping time 100 pi
ËROUPE DELAY (ns) I
mm| |AMPUTUDE (dB)| '
F
II 1 I 11 ' I '
JT40ota
O 20
f-2027 28 29 30 31 32 33 34 35 36 <
Frequency (GHz)
GRCUPE DELAY (ns
;..._ _
!+
]i
AMF
/vv—-,
IIT1
i
JDE (dB.).
27 29 31 33Frequency (GHz)
35
Figure 3 : Instantaneous group delays and amplitudes. Sweeping time
comparisons between lms and 100|iS (left), and, between lOO is and
(right).
However, if by decreasing the sweeping time, the phase jumps are less numerous, their
characteristics remain similar in the fact that we are still observing events with strong
decrease in the amplitude of 40 to 60 dB.
When we compare the beat frequency spectra (figure (4)) between the lms and the lOOfis
reflected signals for two identical plasma discharges, they exhibit the same sprectral
width (approximately 200kHz). Therefore, since as we decrease the time sweeping, we
increase the absolute beat frequency, it means that in terms of group delay the jumps are
relatively attenuated.
- 88 -

; . . . .LL.- .L _[ 'r --T Ifi ^ ,r _
. L M.1 . . i j L r~
. . iji-_ .ft i. ' !!
I j t LW j L • LAt™ X m s 1 —
i , i
i > i
i . i.!_ _ . _J i
h «T r ' i m i a i n it il t 1&O 2 OO Z S O 3 O Q JLS Q -*OO - • S O SOO
requency (kHz)
.... .i.viuflVfc-.m-o ^ or» 002000^ Or» 4 O O fe ÇUO S O O 1 O 0 O 1 2 O U I ^ O O v l GOO1 a
Frequency Otftz)
Figure 4 : Beat frequency spectra for lms and lOO s sweeping time of reflected
signals on two identical plasma discharges.
Origin of the turbulence: plasma parameters
The definition of a turbulent plasma needs to be clarified from the refiectometrist point of
view, i.e. when the group delay exhibits more and more jumps(6). From highly turbulent
plasma discharges, it appears that the relevant phase information is definitively lost.
Numerous theoretical investigations have developped in order to understand this
problem, but codes suffer from a lack of knowledge of the turbulence itself in terms of
geometrical configuration and dynamical behaviour. In order to get some insight in the
origin of this turbulence, we havve created a database from several ohmic shots looking
at how perturbed was the reflected signal of the edge homodyne refiectometer signal
(which is the most sensitive to the turbulence), and, we have tried to correlate this
phenomenon to physical plasma parameters. On figure (5), we have ordered three
classes of plasmas : high, medium and low turbulent plasma. It came out from this study
that the collisionallity is the relevant plasma parameter for triggering and increasing the
turbulence rather than simply a radius effect.
1 .20
1 .00
0.80
a. 0 . 6 0
O. 40
0.20
0.00
1 1
• - - [ • - --^3K
<! 1
1 1 O 1 00 1 OOO 1 0000 1 00000
Figure 5 Statistic between perturbed (closed circles), slightly
perturbed (squares), and, non perturbed (open circles) plasma discharges
as function of the effective collisionality (v*), and, the normalised
plasma radius (p). (data from the 25-35GHz homodyne refiectometer).
- 89 -
ConclusionHeterodyne I/Q detection combines high sensitivity with phase and amplitude separation.
Both characteristics allow a better understanding of the reflected signal : phase jumps
occur very rapidly, of the order of few microsecondes, and simultaneously with a strong
decrease of the amplitude signal (as much as 60dB). Ultra fast sweep technique
considerably improves the group delay measurements. These features considerably help
to perform accurate and reliable density profile measurement by reflectometry.
Reflectometry measurement is very localised and the turbulence may perturb the reflected
signal very locally within few millimetres. Strong jumps in the group delay values show
how the fluctuations limit the resolution of the density profile measurement. However, if
the physical characteristics of the turbulence needs be clarified, the high localisation as
well as the resistivity dependence suggest that a low wave number and resistive MHD
type turbulence rather than a microturbulence; However, the apparent intermittent and
small scale behaviour of the perturbed reflected signal may not be sufficient to describe
the turbulence since reflectometry look at the plasma in a closely one dimensional
geometry.
(^ M. Paume, F. Clairet, X.L. Zou, et al. : Proceedings of the 1st IAEA Technical Metting on
Microwave Reflectometry for Fusion Plasma Diagnostics Abingdon (1992).
(2) p. Moreau, F. Clairet, M.Paume, et al : these proceedings.
(3) T. Tokuzawa, A. Mase, N. Oyama, et al. : Rev.Sci. Instrum. 68,443 (1996)
(4) K.W. Kim.EJ. Doyle,T.L. Rhodes, et al. : Rev.Sci. Instrum. 6&, 466 (1996)
(5> A. Silva, M.E. Manso, L. Cupido, et al. : Rev.Sci. Instrum. 67, 4138 (1996)
(6) F. Clairet, M. Paume, X.L. Zou, et al. : Proceedings of the 2nd IAEA Technical Metting on
Microwave Reflectometry for Fusion Plasma Diagnostics Princeton (1994).
- 90 -
Investigation of Density Profile Perturbations bymeans of Pulsed Radar Reflectometry
P.C. de Vries1, A.J.H. Donné1, S.H. Heijnen1 {, C.A.J. Hugenholtz1,A. Krämer-Flecken2, F.C. Schüller1 and G Waidmann2
Partners in the Trilateral Euregio Cluster1 FOM-Instituut voor Plasmafysica 'Rijnhuizen', Association EURATOM-FOM,P.O.Box 1207, 3430 BE Nieuwegein, The Netherlands2 Institut für Plasmaphysik, Forschungszentrum Jülich GmbH.,Association EURATOM-KFA, P.O. Box 1913, 52425 Jülich, Germany
Abstract. Density profile perturbations due to large rotating m/n = 2/1magnetic islands have been studied by means of a four channel pulsed radarreflectometer in TEXTOR-94. The flight time of the microwave pulses wasstrongly effected by the shallow density gradients over the magnetic islands.A detailed analysis showed the existence of secondary reflection layers insidethe magnetic island, which is an indication of a strong density peaking. Thismay be explained by assuming that the particle transport is reduced inside themagnetic island.
1. Introduction
A tokamak [1] is a toroidal device in which a hot plasma is confined by means of magneticfields in order to study thermonuclear fusion. The equilibrium magnetic field configurationconsists of magnetic field lines which are toroidal helices and lie on radially nested toroidalsurfaces with constant magnetic flux. The helicity is given by the safety factor q [1]. Becausethe transport in a tokamak along field lines is much faster than in perpendicular, or radial,direction the pressure is constant on these flux surfaces. The set of flux surfaces is the magneticstructure which confines the plasma.
Major points of interest in tokamak plasma research are the quality of confinement andthe stability of the magnetized plasma. Various magnetohydrodynamic (MHD) instabilitiesare thought to perturb the ideal magnetic structure. On surfaces with a rational helicity,q = m/n (m and n are integer numbers) the magnetic field lines are closed in themselves. Theseflux surfaces may tear and reconnect, forming so-called magnetic islands and perturbing the
Î Present address: IRCTR, Univ. of Technology Delft, The Netherlands§ Contribution to the 3 r d Workshop on Reflectometry for Fusion Plasmas, Madrid (1997)
- 91 -
equilibrium [1, 2]. Magnetic islands are helical perturbations of the flux surfaces characterizedby a poloidal and toroidal mode number, m and n, respectively and a radial extension orwidth, w. Around the centre, or O-point, of the magnetic island a new set of closed magneticflux surfaces is found. This set of reconnected flux surfaces of the magnetic island short-circuitradially separated points, which were located before the generation of the magnetic island onseparated flux surfaces. This may lead to a local flattening of the pressure profile [3] andthereby causing a degradation of plasma confinement. It is thought that the destruction ofmagnetic flux surfaces due to small magnetic islands may cause an enhancement of energyand particle transport [4, 5]. A complete loss of confinement can be caused by the growthof magnetic islands, leading to a disruption of the tokamak discharge [6]. Therefore manytheoretical and experimental studies are devoted to these perturbations.
The distribution of the temperature and density inside the magnetic island is determinedby the balance of transport along the flux surfaces and that perpendicular to them. Althoughthe transport coefficients along the field lines are much larger than the perpendicular ones,perpendicular fluxes may still be larger because the gradient length is smaller. It has beenshown that over small magnetic islands the perpendicular transport still dominates yielding atemperature and density gradient over the full magnetic island width [3, 7]. A critical width,wc, exists above which the density or temperature will be a flux function inside the magneticisland. For the density one finds [3],
esssnwhere rs,ea and sa are the position of the m/n = 2/1 magnetic island, the local aspectratio, rs/R0, and the local shear, respectively. If one assumes the parallel diffusion, D^ tobe determined by the parallel conductivity and that in the perpendicular direction, D±, tohave the same anomalous value as in the plasma outside the magnetic island, one finds forTEXTOR-94 that wc « 8.5cm. Similarly, using the heat transport coefficients, the criticalwidth for the temperature to become a flux function inside the magnetic island can be found.If no heat sources are present inside a magnetic island, the temperature is expected to flattenover a mjn = 2/1 magnetic island larger than 2.3cm [3, 8].
Because of plasma rotation the perturbations due to magnetic islands appear as oscillationson the time traces of the various diagnostics. Alternating the O-points and the knots ofthe magnetic island, X-points, are observed. Magnetic pick-up coils, located outside theplasma provide little information on the local structure of the magnetic islands. Observationof local temperature profile perturbations, by means of Electron Cyclotron Emission (ECE)diagnostics, may reveal this information. The width and position of the magnetic island havebeen determined at TEXTOR-94 by means of temperature profile measurements with a goodradial resolution [8].
Previously it has been shown that a local temperature maximum exists inside the O-pointof large magnetic islands in TEXTOR-94, which shows that a nett heat source may be presentand that energy is confined inside [8]. The question arises how the density profile is perturbedover the magnetic island.
In this paper measurements of density profile perturbations will be shown, which havebeen performed by means of pulsed radar reflectometry. First the diagnostic will be describedbriefly after which the measurements will be presented. In the last section the effect of shallow
- 92 -
density gradients on the pulsed radar refelctometer signals will be discussed in order to revealinformation on the density gradient inside the magnetic island.
2. Pu l sed Radar Ref lectometry at T E X T O R - 9 4
Local measurements of the plasma density cannot be performed easily. Interferometry canbe used to determine density profiles, however, this technique has its limitations because ofthe line-integrated nature versus the localized dynamic behaviour of density profiles. Localmeasurements can be achieved by means of reflectometry [9]. A four-channel pulsed radarreflectometer which was originally developed for the RTP tokamak has recently been installedat TEXTOR-94 (Ro = 1.75m, a = 0.46m and BT = 2.25T) [9, 10, 11, 12].
The pulsed radar reflectometer launches short microwave pulses (FWHM = 1.5ns) withfour different frequencies (29,33,36 and 39GHz) into the plasma with a repetition rate of125kHz. The microwaves are in ordinary mode, i.e. the electric field wave vector is parallelto the magnetic field in the plasma. The refractive index of the plasma determines thepropagation of the waves. A cut-off for these microwave pulses is found at the plasma frequency,ujpe, which is determined by the plasma density. Each pulse is reflected in the plasma whereits frequency matches the local plasma frequency. The flight time of the reflected pulse ismeasured, hence the position of the density layers with ne = 1.0, 1.4, 1.6 and 1.9 • 1019m~3
are probed. If no reflection layer is present in the plasma, because the density is too low,the pulse is reflected at the vessel back-wall. For the measurements presented in this letterthe flight time of a back wall reflection in vacuum is defined to be zero. The flight time isdetermined by the distance to the reflecting layer and the group velocity of the pulse. Becausethe pulse moves slower in a dense plasma, the flight time will be longer in this situationcompared to that in the vacuum case. The effect on the group velocity is also important inthe analysis of reflections by plasma density layers. Especially in the case of non-monotoniedensity profiles, as can be expected in the presence of magnetic islands, one should interpretthe data with great care. When a pulse is reflected at a density layer, with a shallow densitygradient just before it, the flight time may be much longer than that of pulses with slightlyhigher frequencies, reflecting from density layers further inside the plasma [12, 13]. Secondaryeffects on the time-of-flight measurement could be caused by pulse broadening and refraction inregions with a shallow density gradient. Because of the finite pulse width (1.5ns) all frequencycomponents of the pulse will reflect at slightly different density layers. In severe cases thereflected pulse might become too spread out to be detected.
3. Observation of Magnet ic Islands
Large magnetic islands have been observed in TEXTOR-94 with a typical width of several cm.Flux surface perturbations of this amplitude can be detected by the pulsed radar reflectometer.An example of the observation of MHD modes by means of pulsed radar reflectometry can beillustrated by a specific discharge. During this discharge the current was ramped-up to 475kA(qa = 2.7) which led to a minor disruption at t = 0.528s and a major one at t = 0.560s. Thecentral density rose to 2.5 • 1019m~3 as shown in Fig. 1. In the same figure the time-of-flight ofone of the pulsed radar reflectometer channels is pictured. In the early phase of the discharge,
- 93 -
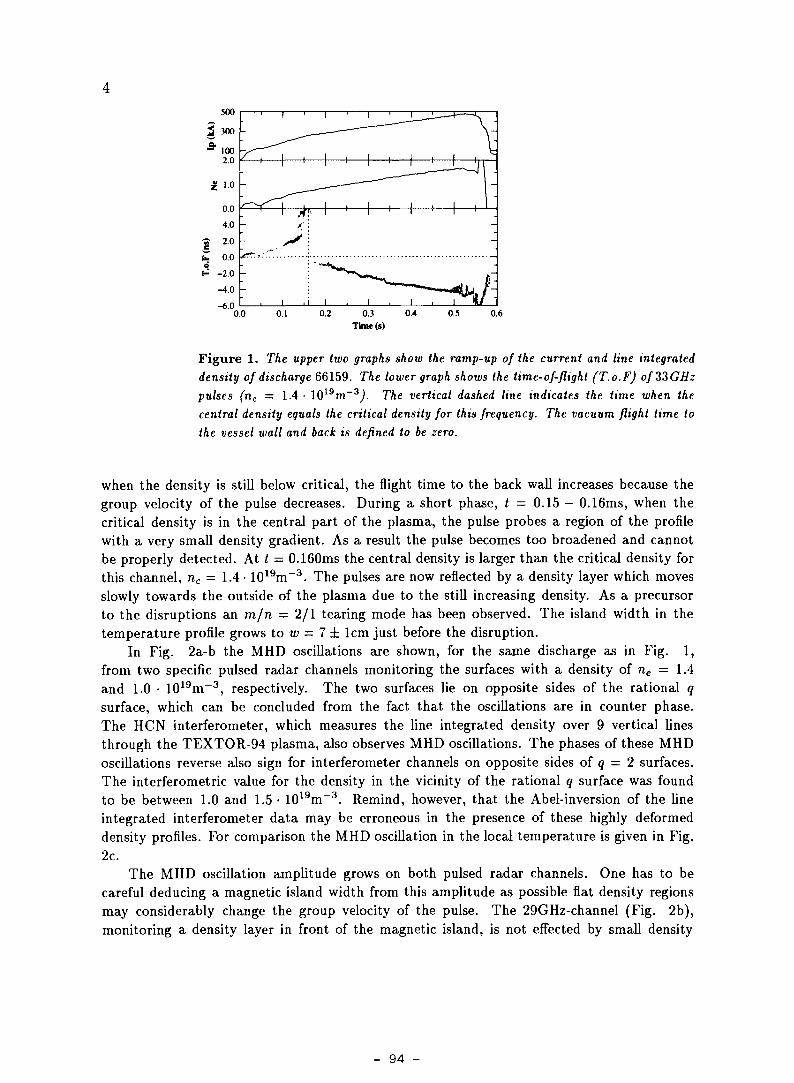
Figure 1. The upper two graphs show the ramp-up of the current and line integrated
density of discharge 66159. The lower graph shows the time-of-flight (T.o.F) ofZZGHz
pulses (nc = 1.4 • 1019m~3). The vertical dashed line indicates the time when the
central density equals the critical density for this frequency. The vacuum flight time to
the vessel wall and back is defined to be zero.
when the density is still below critical, the flight time to the back wall increases because thegroup velocity of the pulse decreases. During a short phase, t — 0.15 — 0.16ms, when thecritical density is in the central part of the plasma, the pulse probes a region of the profilewith a very small density gradient. As a result the pulse becomes too broadened and cannotbe properly detected. At t — 0.160ms the central density is larger than the critical density forthis channel, nc = 1.4 • 1019m~3. The pulses are now reflected by a density layer which movesslowly towards the outside of the plasma due to the still increasing density. As a precursorto the disruptions an m/n = 2/1 tearing mode has been observed. The island width in thetemperature profile grows to w = 7 ± lcm just before the disruption.
In Fig. 2a-b the MHD oscillations are shown, for the same discharge as in Fig. 1,from two specific pulsed radar channels monitoring the surfaces with a density of ne = 1.4and 1.0 • 1019m~3, respectively. The two surfaces lie on opposite sides of the rational qsurface, which can be concluded from the fact that the oscillations are in counter phase.The HCN interferometer, which measures the line integrated density over 9 vertical linesthrough the TEXTOR-94 plasma, also observes MHD oscillations. The phases of these MHDoscillations reverse also sign for interferometer channels on opposite sides of q = 2 surfaces.The interferometric value for the density in the vicinity of the rational q surface was foundto be between 1.0 and 1.5 • 1019m~3. Remind, however, that the Abel-inversion of the lineintegrated interferometer data may be erroneous in the presence of these highly deformeddensity profiles. For comparison the MHD oscillation in the local temperature is given in Fig.2c.
The MHD oscillation amplitude grows on both pulsed radar channels. One has to becareful deducing a magnetic island width from this amplitude as possible flat density regionsmay considerably change the group velocity of the pulse. The 29GHz-channel (Fig. 2b),monitoring a density layer in front of the magnetic island, is not effected by small density
- 94 -
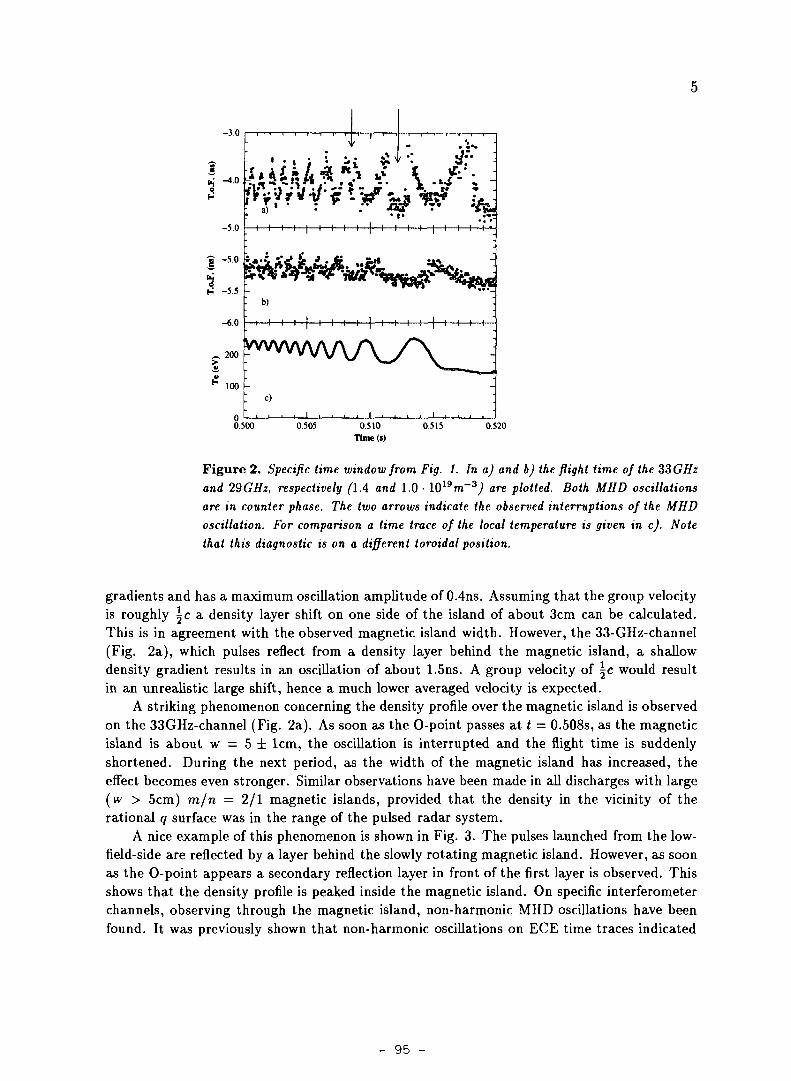
-3.0
-4.0
-5.0
-5.0
î -„-6.0
100 -
ù
H—I—I—I—|—I—I—I—I—I—I—I—I—I—|—I—I—I—I-
b)
H—I—I——I—I—I—I——I—I—I—I——h-H—I—H
0.500 0.505 0.510
Time (s)
0.515 0.520
Figure 2. Specific time window from Fig. 1. In a) and b) the flight time of the iZGHz
and 29GHz, respectively (IA and 1.0 • 1019m~3J are plotted. Both MHD oscillations
are in counter phase. The two arrows indicate the observed interruptions of the MHD
oscillation. For comparison a time trace of the local temperature is given in c). Note
that this diagnostic is on a different toroidal position.
gradients and has a maximum oscillation amplitude of 0.4ns. Assuming that the group velocityis roughly \c a density layer shift on one side of the island of about 3cm can be calculated.This is in agreement with the observed magnetic island width. However, the 33-GHz-channel(Fig. 2a), which pulses reflect from a density layer behind the magnetic island, a shallowdensity gradient results in an oscillation of about 1.5ns. A group velocity of \c would resultin an unrealistic large shift, hence a much lower averaged velocity is expected.
A striking phenomenon concerning the density profile over the magnetic island is observedon the 33GHz-channel (Fig. 2a). As soon as the O-point passes at t = 0.508s, as the magneticisland is about w = 5 ± lcm, the oscillation is interrupted and the flight time is suddenlyshortened. During the next period, as the width of the magnetic island has increased, theeffect becomes even stronger. Similar observations have been made in all discharges with large(w > 5cm) m/n = 2/1 magnetic islands, provided that the density in the vicinity of therational q surface was in the range of the pulsed radar system.
A nice example of this phenomenon is shown in Fig. 3. The pulses launched from the low-field-side are reflected by a layer behind the slowly rotating magnetic island. However, as soonas the O-point appears a secondary reflection layer in front of the first layer is observed. Thisshows that the density profile is peaked inside the magnetic island. On specific interferometerchannels, observing through the magnetic island, non-harmonic MHD oscillations have beenfound. It was previously shown that non-harmonic oscillations on ECE time traces indicated
- 95 -
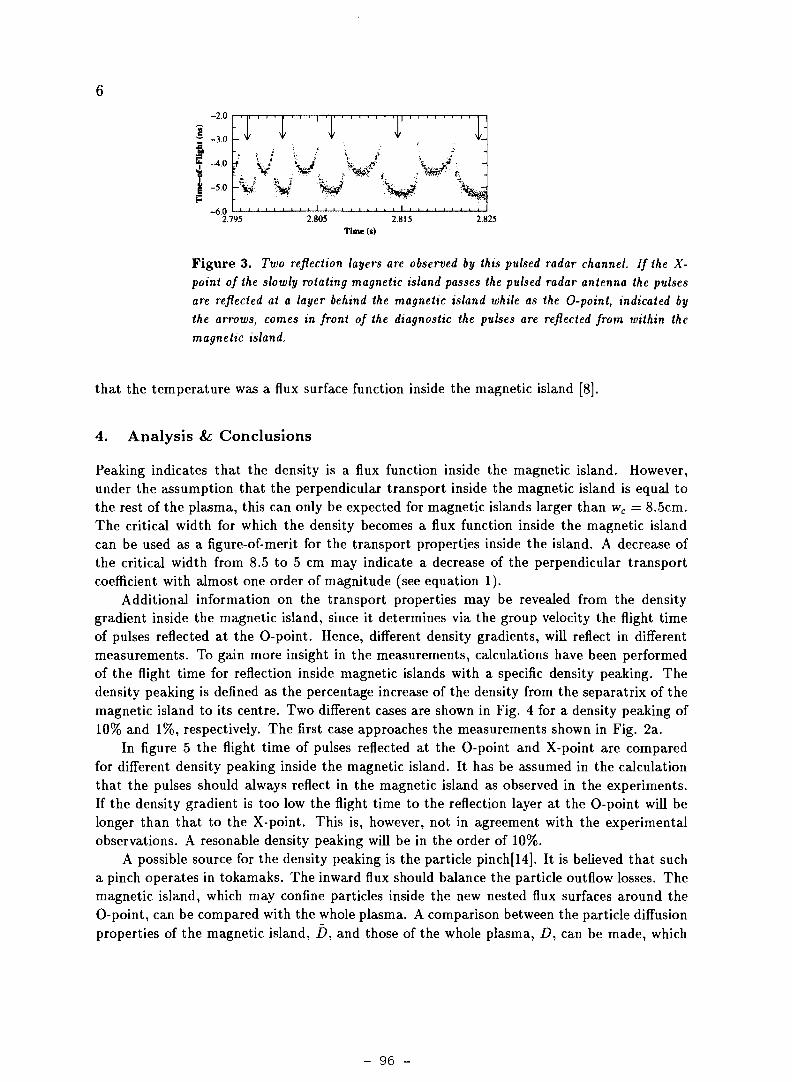
-2.0
-6.02.795 2.805 2.815 2.825
Time (s)
Figure 3. Two reflection layers are observed by thts pulsed radar channel. If the X-
point of the slowly rotating magnetic island passes the pulsed radar antenna the pulses
are reflected at a layer behind the magnetic island while as the O-point, indicated by
the arrows, comes in front of the diagnostic the pulses are reflected from within the
magnetic island.
that the temperature was a flux surface function inside the magnetic island [8].
4. Analysis & Conclusions
Peaking indicates that the density is a flux function inside the magnetic island. However,under the assumption that the perpendicular transport inside the magnetic island is equal tothe rest of the plasma, this can only be expected for magnetic islands larger than wc = 8.5cm.The critical width for which the density becomes a flux function inside the magnetic islandcan be used as a figure-of-merit for the transport properties inside the island. A decrease ofthe critical width from 8.5 to 5 cm may indicate a decrease of the perpendicular transportcoefficient with almost one order of magnitude (see equation 1).
Additional information on the transport properties may be revealed from the densitygradient inside the magnetic island, since it determines via the group velocity the flight timeof pulses reflected at the O-point. Hence, different density gradients, will reflect in differentmeasurements. To gain more insight in the measurements, calculations have been performedof the flight time for reflection inside magnetic islands with a specific density peaking. Thedensity peaking is defined as the percentage increase of the density from the separatrix of themagnetic island to its centre. Two different cases are shown in Fig. 4 for a density peaking of10% and 1%, respectively. The first case approaches the measurements shown in Fig. 2a.
In figure 5 the flight time of pulses reflected at the O-point and X-point are comparedfor different density peaking inside the magnetic island. It has be assumed in the calculationthat the pulses should always reflect in the magnetic island as observed in the experiments.If the density gradient is too low the flight time to the reflection layer at the O-point will belonger than that to the X-point. This is, however, not in agreement with the experimentalobservations. A resonable density peaking will be in the order of 10%.
A possible source for the density peaking is the particle pinch[14]. It is believed that sucha pinch operates in tokamaks. The inward flux should balance the particle outflow losses. Themagnetic island, which may confine particles inside the new nested flux surfaces around theO-point, can be compared with the whole plasma. A comparison between the particle diffusionproperties of the magnetic island, D, and those of the whole plasma, D, can be made, which
- 96 -
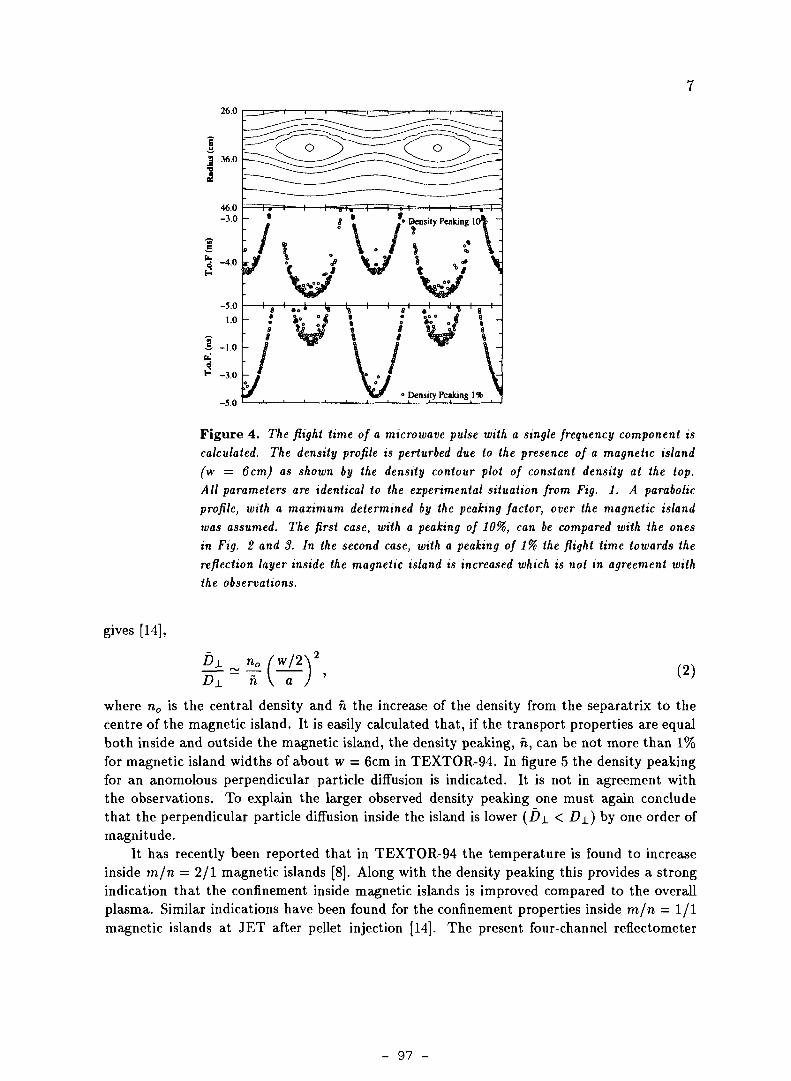
26.0
gives [14],
-5.0» Density Peaking 1*
Figure 4. TAe /?ijA< <ime of a microwave pulse with a single frequency component is
calculated. The density profile is perturbed due to the presence of a magnetic island
(w = 6cm) as shown by the density contour plot of constant density at the top.
All parameters are identical to the experimental situation from Fig. 1. A parabolic
profile, with a maximum determined by the peaking factor, over the magnetic island
was assumed. The first case, with a peaking of 10%, can be compared with the ones
in Fig. 2 and 3. In the second case, with a peaking of 1% the flight time towards the
reflection layer inside the magnetic island is increased which is not in agreement with
the observations.
D\ h a )(2)
where n0 is the central density and n the increase of the density from the separatrix to thecentre of the magnetic island. It is easily calculated that, if the transport properties are equalboth inside and outside the magnetic island, the density peaking, n, can be not more than 1%for magnetic island widths of about w = 6cm in TEXTOR-94. In figure 5 the density peakingfor an anomolous perpendicular particle diffusion is indicated. It is not in agreement withthe observations. To explain the larger observed density peaking one must again concludethat the perpendicular particle diffusion inside the island is lower (Dj_ < D±) by one order ofmagnitude.
It has recently been reported that in TEXTOR-94 the temperature is found to increaseinside ro/n = 2/1 magnetic islands [8]. Along with the density peaking this provides a strongindication that the confinement inside magnetic islands is improved compared to the overallplasma. Similar indications have been found for the confinement properties inside m/n = 1/1magnetic islands at JET after pellet injection [14]. The present four-channel reflectometer
- 97 -
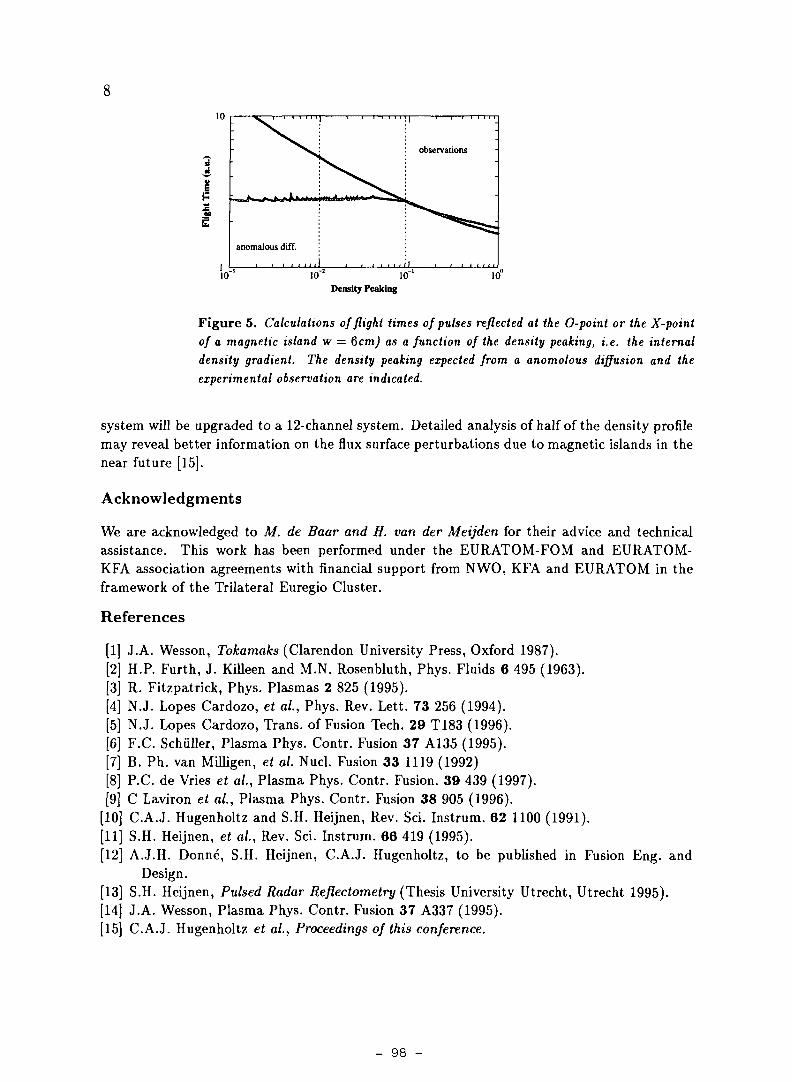
10 10"' 10"Density Peaking
10
Figure 5. Calculations of flight times of pulses reflected at the O-point or the X-point
of a magnetic island w = 6cm) as a function of the density peaking, i.e. the internal
density gradient. The density peaking expected from a anomolous diffusion and the
experimental observation are indicated.
system will be upgraded to a 12-channel system. Detailed analysis of half of the density profilemay reveal better information on the flux surface perturbations due to magnetic islands in thenear future [15].
Acknowledgments
We are acknowledged to M. de Baar and H. van der Meijden for their advice and technicalassistance. This work has been performed under the EURATOM-FOM and EURATOM-KFA association agreements with financial support from NWO, KFA and EURATOM in theframework of the Trilateral Euregio Cluster.
References
[1] J.A. Wesson, Tokamaks (Clarendon University Press, Oxford 1987).[2] H.P. Furth, J. Killeen and M.N. Rosenbluth, Phys. Fluids 6 495 (1963).[3] R. Fitzpatrick, Phys. Plasmas 2 825 (1995).[4] N.J. Lopes Cardozo, et ai, Phys. Rev. Lett. 73 256 (1994).[5] N.J. Lopes Cardozo, Trans, of Fusion Tech. 29 T183 (1996).[6] F.C. Schuller, Plasma Phys. Contr. Fusion 37 A135 (1995).[7] B. Ph. van Mffligen, et ai Nucl. Fusion 33 1119 (1992)[8] P.C. de Vries et ai, Plasma Phys. Contr. Fusion. 39 439 (1997).[9] C Laviron et al., Plasma Phys. Contr. Fusion 38 905 (1996).
[10] C.A.J. Hugenholtz and S.H. Heijnen, Rev. Sci. Instrum. 62 1100 (1991).[11] S.H. Heijnen, et ai, Rev. Sci. Instrum. 66 419 (1995).[12] A.J.H. Donné, S.H. Heijnen, C.A.J. Hugenholtz, to be published in Fusion Eng. and
Design.[13] S.H. Heijnen, Pulsed Radar Reflectometry (Thesis University Utrecht, Utrecht 1995).[14] J.A. Wesson, Plasma Phys. Contr. Fusion 37 A337 (1995).[15] C.A.J. Hugenholtz et ai, Proceedings of this conference.
- 98 -

MULTI-CHANNEL PULSED RADAR SYSTEMFOR THE TEXTOR TOKAMAK
C.A.J. Hugenholtz1, J.F.M. van Gelder1, AJ.H. Donné1, B.S.Q. Elzendoorn1, G.P. Ermak3,W. Kooijman1, H.A. van der Laan1, G. Land1, H.J. van der Meiden1, A.J. Putter1,
H.J.F. van Ramele1, P.C. de Vries1, G. Waidmann2, F. Wijnoltz1
Trilateral Euregio Cluster
1FOMInstituut voor Plasmafysica 'Rijnhuizen', Association EURATOM-FOMP.O. Box 1207, 3430 BE Nieuwegein, The Netherlands
2Institut für Plasmaphysik, Forschungszentrum Jülich GmbH., Association EURATOM-KFA,P.O. Box 1913, 52425 Jülich, Germany
3Institute of Radiophysics and Electronics of the Ukraine,AL Proskura st. 12, Kharkov 310085, Ukraine
Abstract
A ten-channel pulsed radar reflectometer is under development for the TEXTOR Tokamak.The frequency range is 18 GHz to 57 GHz corresponding to pulse reflections at layers with criticaldensities between 4xl018and 4xlO19 m'3. Two variable frequency channels (35 - 36 GHz and 49 -51 GHz), in combination with two fixed frequency channels (36 GHz and 51 GHz), are availableto perform correlation measurements on density fluctuations.
All sources have an individual modulator to produce a 1 ns radar pulse and a 20 ns LO-pulse. The 20 ns LO-pulse selects a time window for the corresponding radar channel. Profilemeasurements with an accuracy of 70 ps will be possible with a 2 MHz repetition rate, giving64 Mb of data points. Correlation measurements will run at a 10 MHz repetition rate. Anembedded controller in VME will store the data with a speed of 20 Msamples/s. A custom-madepulsed radar controller will manage the system. Remote operation with a data link to FOM-Rijnhuizen will be possible.
Introduction
In pulsed radar reflectometry, short microwave pulses in the order of 1 ns are launched intothe plasma [1,2]. Depending on the radar frequency and the plasma parameters, the pulse isreflected by a critical density layer and received again by the diagnostic equipment. The basicquantity that is measured by the pulsed radar diagnostic is the flight time of the microwave pulsebetween transmission and detection.
Although the physical mechanisms underlying the various reflectometry techniques arebasically the same, each technique has some specific merits and drawbacks. With the new set-up,an upgrade of the four-channel pulsed radar described by Heijnen [3], the amount of drawbacks isreduced. The number of channels is increased to ten and two variable frequency channels are
- 99 -
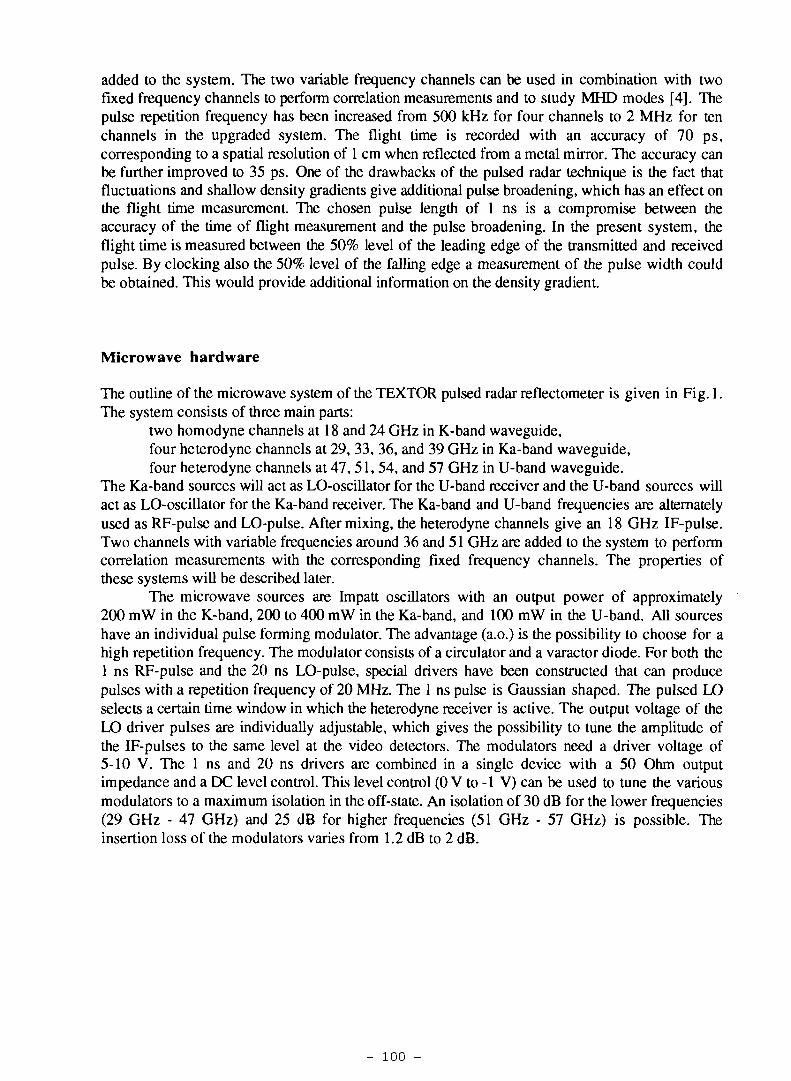
added to the system. The two variable frequency channels can be used in combination with twofixed frequency channels to perform correlation measurements and to study MHD modes [4]. Thepulse repetition frequency has been increased from 500 kHz for four channels to 2 MHz for tenchannels in the upgraded system. The flight time is recorded with an accuracy of 70 ps,corresponding to a spatial resolution of 1 cm when reflected from a metal mirror. The accuracy canbe further improved to 35 ps. One of the drawbacks of the pulsed radar technique is the fact thatfluctuations and shallow density gradients give additional pulse broadening, which has an effect onthe flight time measurement. The chosen pulse length of 1 ns is a compromise between theaccuracy of the time of flight measurement and the pulse broadening. In the present system, theflight time is measured between the 50% level of the leading edge of the transmitted and receivedpulse. By clocking also the 50% level of the falling edge a measurement of the pulse width couldbe obtained. This would provide additional information on the density gradient.
Microwave hardware
The outline of the microwave system of the TEXTOR pulsed radar reflectometer is given in Fig. 1.The system consists of three main parts:
two homodyne channels at 18 and 24 GHz in K-band waveguide,four heterodyne channels at 29, 33, 36, and 39 GHz in Ka-band waveguide,four heterodyne channels at 47, 51, 54, and 57 GHz in U-band waveguide.
The Ka-band sources will act as LO-oscillator for the U-band receiver and the U-band sources willact as LO-oscillator for the Ka-band receiver. The Ka-band and U-band frequencies are alternatelyused as RF-pulse and LO-pulse. After mixing, the heterodyne channels give an 18 GHz IF-pulse.Two channels with variable frequencies around 36 and 51 GHz are added to the system to performcorrelation measurements with the corresponding fixed frequency channels. The properties ofthese systems will be described later.
The microwave sources are Impatt oscillators with an output power of approximately200 mW in the K-band, 200 to 400 mW in the Ka-band, and 100 mW in the U-band. AU sourceshave an individual pulse forming modulator. The advantage (a.o.) is the possibility to choose for ahigh repetition frequency. The modulator consists of a circulator and a varactor diode. For both the1 ns RF-pulse and the 20 ns LO-pulse, special drivers have been constructed that can producepulses with a repetition frequency of 20 MHz. The 1 ns pulse is Gaussian shaped. The pulsed LOselects a certain time window in which the heterodyne receiver is active. The output voltage of theLO driver pulses are individually adjustable, which gives the possibility to tune the amplitude ofthe IF-pulses to the same level at the video detectors. The modulators need a driver voltage of5-10 V. The 1 ns and 20 ns drivers are combined in a single device with a 50 Ohm outputimpedance and a DC level control. This level control (0 V to -1 V) can be used to tune the variousmodulators to a maximum isolation in the off-state. An isolation of 30 dB for the lower frequencies(29 GHz - 47 GHz) and 25 dB for higher frequencies (51 GHz - 57 GHz) is possible. Theinsertion loss of the modulators varies from 1.2 dB to 2 dB.
- 100 -
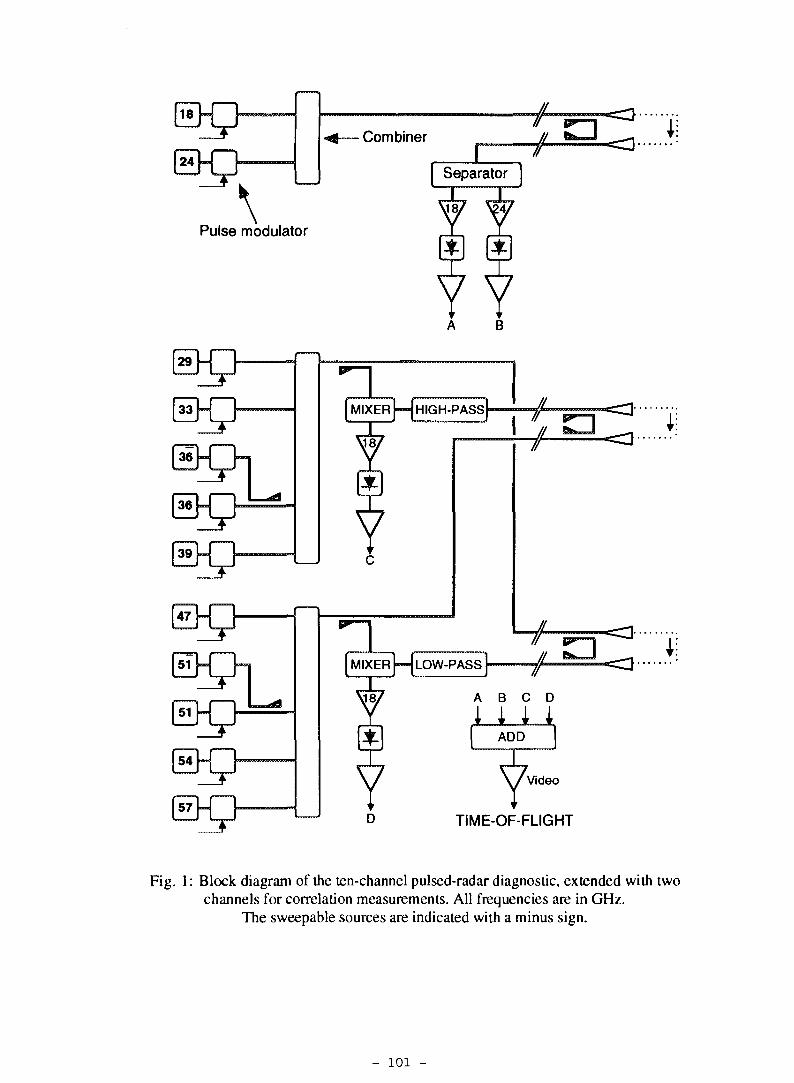
18
\Pulse modulator
33
39
47
51
51
54
57
36
JLCombiner
MIXER
ISeparator
A B
| MIXER "-{HIGH-PASS
JL
A B C D
1 1 1 1ADD
'Video
TIME-OF-FLIGHT
=3-
Fig. 1 : Block diagram of the ten-channel pulsed-radar diagnostic, extended with twochannels for correlation measurements. All frequencies are in GHz.
The sweepable sources are indicated with a minus sign.
- loi -
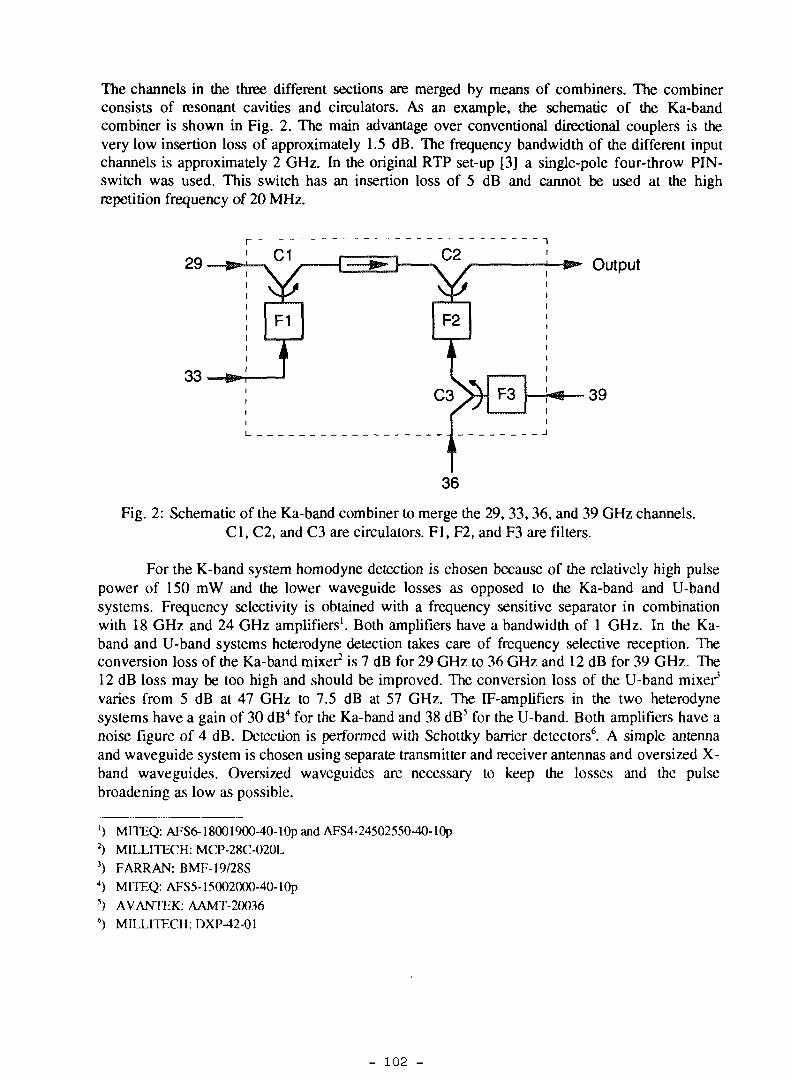
The channels in the three different sections are merged by means of combiners. The combinerconsists of resonant cavities and circulators. As an example, the schematic of the Ka-bandcombiner is shown in Fig. 2. The main advantage over conventional directional couplers is thevery low insertion loss of approximately 1.5 dB. The frequency bandwidth of the different inputchannels is approximately 2 GHz. In the original RTP set-up [3] a single-pole four-throw PIN-switch was used. This switch has an insertion loss of 5 dB and cannot be used at the highrepetition frequency of 20 MHz.
29 Output
Fig. 2: Schematic of the Ka-band combiner to merge the 29, 33,36, and 39 GHz channels.Cl, C2, and C3 are circulators. Fl, F2, and F3 are filters.
For the K-band system homodyne detection is chosen because of the relatively high pulsepower of 150 mW and the lower waveguide losses as opposed to the Ka-band and U-bandsystems. Frequency selectivity is obtained with a frequency sensitive separator in combinationwith 18 GHz and 24 GHz amplifiers1. Both amplifiers have a bandwidth of 1 GHz. In the Ka-band and U-band systems heterodyne detection takes care of frequency selective reception. Theconversion loss of the Ka-band mixer2 is 7 dB for 29 GHz to 36 GHz and 12 dB for 39 GHz. The12 dB loss may be too high and should be improved. The conversion loss of the U-band mixer3
varies from 5 dB at 47 GHz to 7.5 dB at 57 GHz. The IF-amplifiers in the two heterodynesystems have a gain of 30 dB4 for the Ka-band and 38 dB5 for the U-band. Both amplifiers have anoise figure of 4 dB. Detection is performed with Schottky barrier detectors6. A simple antennaand waveguide system is chosen using separate transmitter and receiver antennas and oversized X-band waveguides. Oversized waveguides are necessary to keep the losses and the pulsebroadening as low as possible.
1 ) MITEQ: AFS6-18001900-40-1 Op and AFS4-24502550-40-1 OpMILLITECH: MCP-28C-020LFARRAN: BMF-19/28SMITEQ: AFS5-15002000-40-10pAVANTEK: AAMT-20036MILLITECH: DXP-42-01
- 102 -
The distance from the antennas to the radar set-up is about 10 meters. Two echopulses will be received from each transmitted radar pulse. The first one is a start pulse travellingvia the bypass and the second one is the stop pulse reflected at the critical density layer. Jitters inthe electronics are irrelevant in this set-up. The minimum time between the two pulses is 4 nswhich is determined by the constant fraction discriminator (CFD) in the video section of the set-up(Fig. 3). The longest time delay is obtained from reflections at the far wall when the density risesto near the critical density (nc). The time delay with plasma densities near nc is about 6 ns longerthan the time delay without plasma. Calibration is performed using the TOF of the reflected pulseat the far wall. The bypass consists of two 10 dB directional couplers, an attenuator and a shortsection of waveguide. The position of the bypass must be chosen in such a way that the start andstop pulse coincide with the 20 ns LO-pulse. Tuning is possible by adjusting the length of thewaveguide. The attenuator must be set such that the start and stop pulse have approximately thesame power level. After detection, the four video channels (A, B, C, and D) are pre-amplified withpre-settable amplifiers. The four signals are added and then amplified to a level of about 5 Voltsand fed to a constant fraction discriminator (CFD)7. The two output pulses will start and stop atime-of-flight counter (TOF), developed at Rijnhuizen using eight parallel gated counters [3,7].The data produced by the TOF-counter is fed to a data acquisition system built in VME. The datahandling, storage etc. will be described in a separate section.
Ethernet
SOURCE «*
1
TEXTOR Start-
start/stop
TOF
?CPU
MEMORY
ARBITRARYWAVE GENERATOR
Control
Data
TIMING
Fig. 3: Timing, control and data storage.
7) EG&G ORTEC, Model 9307
- 103 -
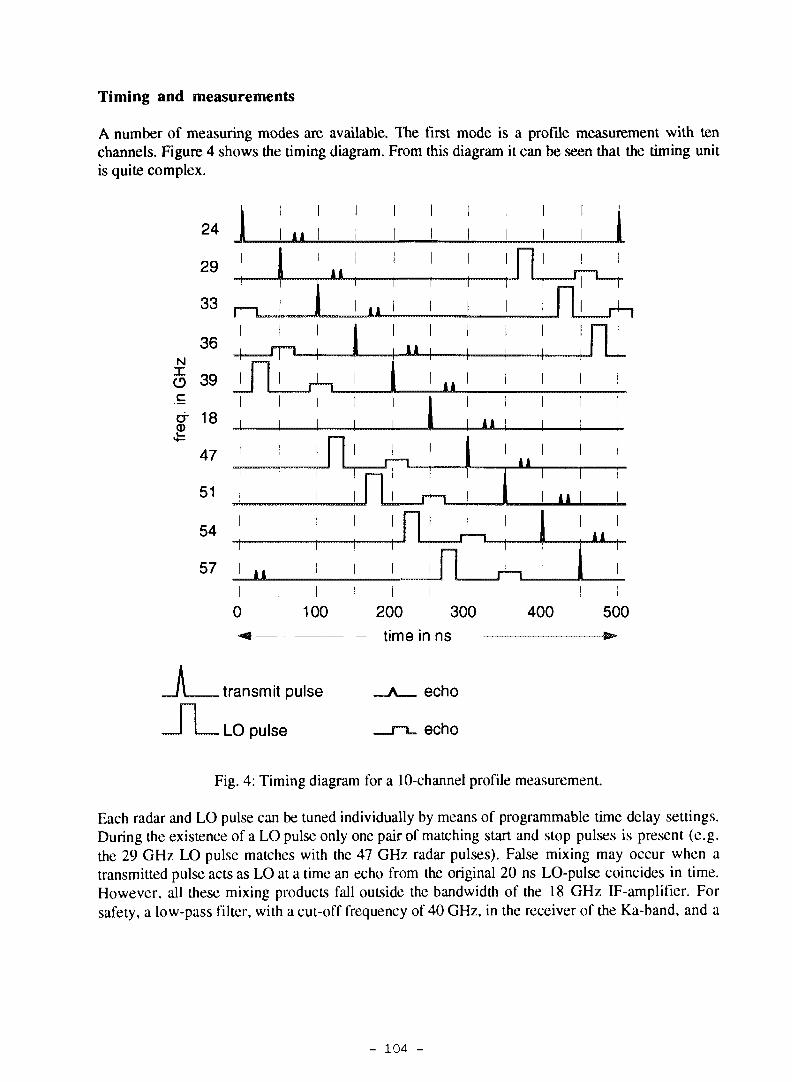
Timing and measurements
A number of measuring modes are available. The first mode is a profile measurement with tenchannels. Figure 4 shows the timing diagram. From this diagram it can be seen that the timing unitis quite complex.
24
29
33
36N
5 39
<jf 18
47
51
54
57
1 JLL
i l
l i
JJL
I l i I
l i
l i
! I I Ii 1 1 r
l i I I ! I
i i
oi i i
100 200 300
time in ns
I ! i4 0 0 5 0 0
_JL transmit pulse
_J L_LO pulse
Fig. 4: Timing diagram for a 10-channel profile measurement.
Each radar and LO pulse can be tuned individually by means of programmable time delay settings.During the existence of a LO pulse only one pair of matching start and stop pulses is present (e.g.the 29 GHz LO pulse matches with the 47 GHz radar pulses). False mixing may occur when atransmitted pulse acts as LO at a time an echo from the original 20 ns LO-pulse coincides in time.However, all these mixing products fall outside the bandwidth of the 18 GHz IF-amplifier. Forsafety, a low-pass filter, with a cut-off frequency of 40 GHz, in the receiver of the Ka-band, and a
- 104 -
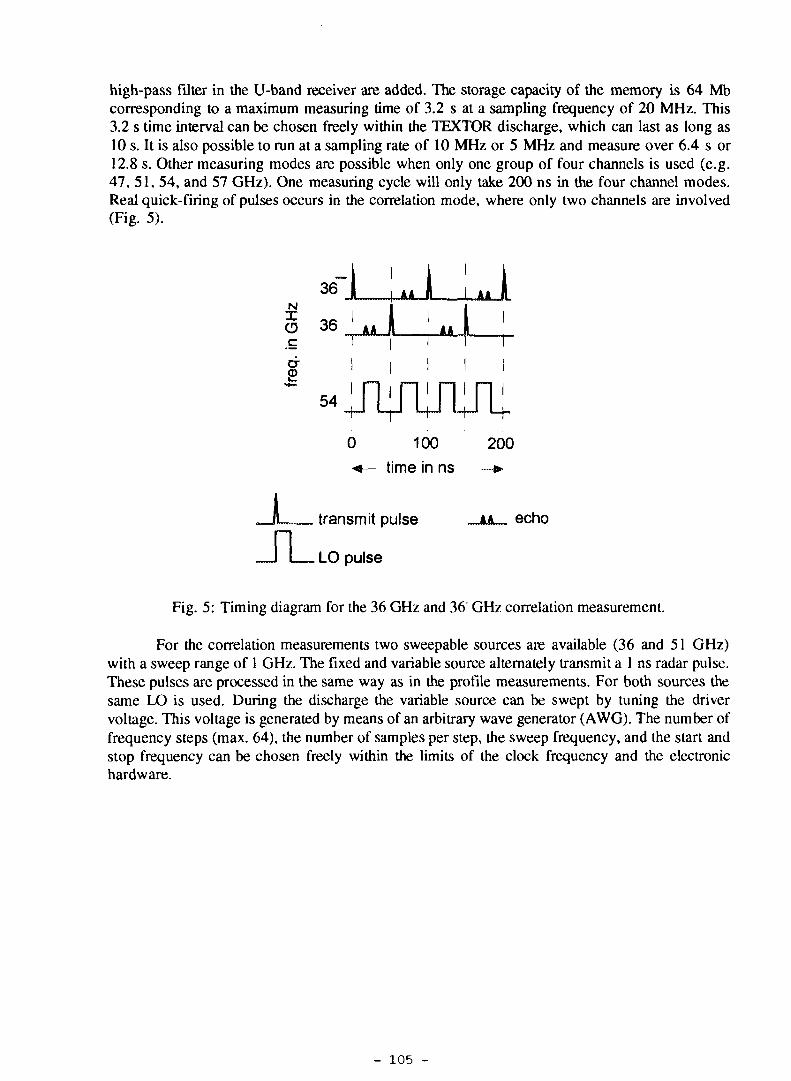
high-pass filter in the U-band receiver are added. The storage capacity of the memory is 64 Mbcorresponding to a maximum measuring time of 3.2 s at a sampling frequency of 20 MHz. This3.2 s time interval can be chosen freely within the TEXTOR discharge, which can last as long as10 s. It is also possible to run at a sampling rate of 10 MHz or 5 MHz and measure over 6.4 s or12.8 s. Other measuring modes are possible when only one group of four channels is used (e.g.47, 51, 54, and 57 GHz). One measuring cycle will only take 200 ns in the four channel modes.Real quick-firing of pulses occurs in the correlation mode, where only two channels are involved(Fig. 5).
36N
5 36 ' AÀc "1
•I ' I ' II I A * il I A l jl
1 J J L
54
"L
0 100 200
<— time in ns —•
transmit pulse AA echo
LO pulse
Fig. 5: Timing diagram for the 36 GHz and 36' GHz correlation measurement.
For the correlation measurements two sweepable sources are available (36 and 51 GHz)with a sweep range of 1 GHz. The fixed and variable source alternately transmit a 1 ns radar pulse.These pulses are processed in the same way as in the profile measurements. For both sources thesame LO is used. During the discharge the variable source can be swept by tuning the drivervoltage. This voltage is generated by means of an arbitrary wave generator (AWG). The number offrequency steps (max. 64), the number of samples per step, the sweep frequency, and the start andstop frequency can be chosen freely within the limits of the clock frequency and the electronichardware.
- 105 -
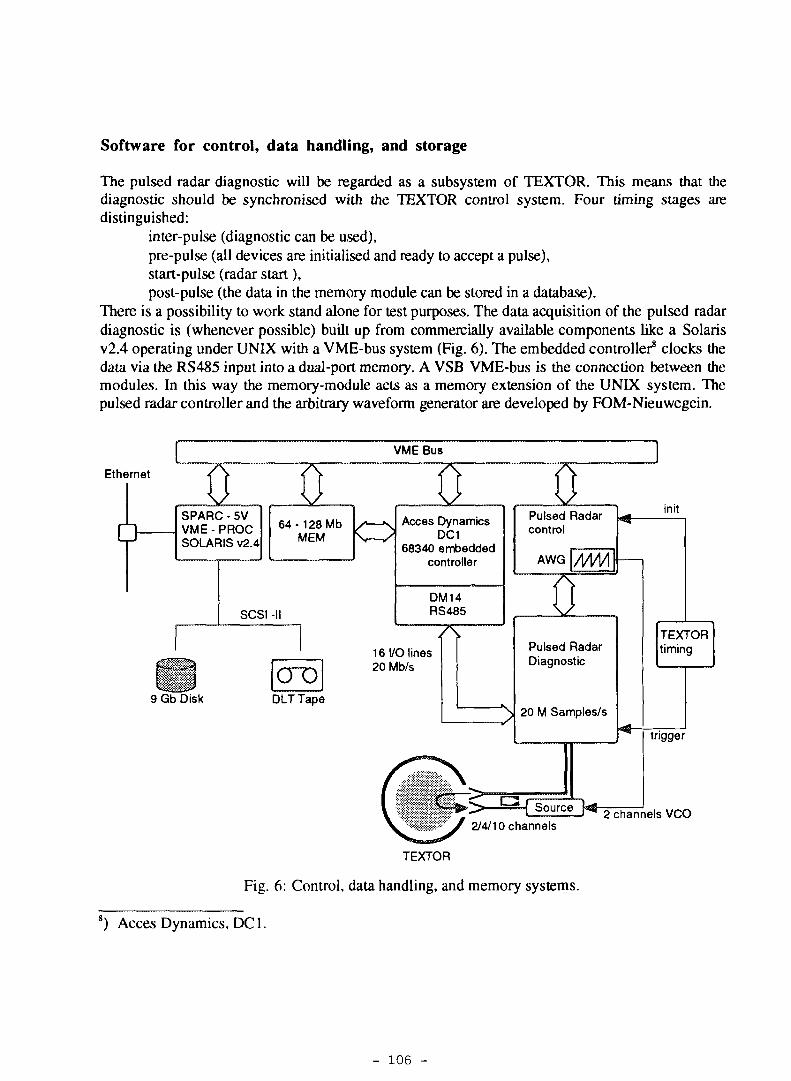
Software for control, data handling, and storage
The pulsed radar diagnostic will be regarded as a subsystem of TEXTOR. This means that thediagnostic should be synchronised with the TEXTOR control system. Four timing stages aredistinguished:
inter-pulse (diagnostic can be used),pre-pulse (all devices are initialised and ready to accept a pulse),start-pulse (radar start ),post-pulse (the data in the memory module can be stored in a database).
There is a possibility to work stand alone for test purposes. The data acquisition of the pulsed radardiagnostic is (whenever possible) built up from commercially available components like a Solarisv2.4 operating under UNIX with a VME-bus system (Fig. 6). The embedded controller8 clocks thedata via the RS485 input into a dual-port memory. A VSB VME-bus is the connection between themodules. In this way the memory-module acts as a memory extension of the UNIX system. Thepulsed radar controller and the arbitrary waveform generator are developed by FOM-Nieuwegein.
VME Bus
Ethernet
SPARC - 5VVME-PROCSOLARIS V2.4
64-128 MbMEM
SCSI -II
nAccès Dynamics
DC168340 embedded
controller
DM14RS485
Pulsed Radarcontrol
AWG MM
in it
7 \
cro9 Gb Disk
16 I/O lines20 Mb/s
DLT Tape
Pulsed RadarDiagnostic
20 M Samples/s
Source
TEXTORtiming
trigger
2 channels VCO2/4/10 channels
TEXTOR
Fig. 6: Control, data handling, and memory systems.
) Accès Dynamics, DC 1.
- 106 -
The software for the user application will be in IDL (Interactive Data Language). This language isused for several reasons: FOM-Nieuwegein and IPP-Jiilich both have experience with this tool. Itis easy to make menus and buttons, to visualise the data, to do calculations with the DDL-standardlibrary, and to make connections with software written in FORTRAN or C.
The communication between the existing local area network (LAN) in Julich, and the FOM-Nieuwegein LAN is necessary for the intended Remote Control Room. A demonstrator for thisproject is being developed at the University of Utrecht. Because of the remote control room, thedata will be distributed over several sites. CORB A-standardisation will be used to connect thedifferent computer systems (CORBA: Common Object Request Broker Architecture). CORBA is astrongly object-oriented protocol. The basic idea is that CORBA transforms objects to the localformats and takes care of the transport to other computer systems. This communication and data-conversion is hidden from the user. The data will be stored in an Object Oriented DistributedDatabase. By standardisation of the data handling system, extension of the subsystems with newapplication software will be relatively simple.
Acknowledgement
The work described in this paper was performed as part of a research programme of the'Stichting voor Fundamenteel Onderzoek der Materie' (FOM) with financial support from the'Nederlandse Organisatie voor Wetenschappelijk Onderzoek' (NWO) and EURATOM.
References
[1] C.A.J. Hugenholtz and S.H. Heijnen, Pulsed radar technique for reflectometry onthermonuclear plasmas. Rev. Sci. Instrum. 62 (1991) 1100.
[2] V.F. Shevchenko et al, Plasma study at T-11M tokamak by microwave pulse radarreflectometer, Proc. 20th Conf. on Contr. Fusion and Plasma Phys., Lisbon (1993), Part III,p. 1167.
[3] S.H. Heijnen, Pulsed Radar Reflectometry, Thesis University of Utrecht, Utrecht (1995).
[4] A.J.H. Donné, S.H. Heijnen, C.A.J. Hugenholtz, Fusion Engineering and Design (1997),Accepted for publication.
[5] S.H. Heijnen et al., Rev. Sci. Instrum. 66 (1995) 419.
[6] P.C. de Vries et al., Submitted to Phys. Lett.
[7] M.J. van de Pol, S.H. Heijnen, C.A.J. Hugenholtz, Proc. of the IAEA Technical Committee
Meeting on Microwave Reflectometry for Fusion Plasma Diagnostics, JET (1992) p. 228-235.
"EXT PA@S(S)left BLAS3K
- 107 -
AM Reflectorneter Density Profile Measurements on TdeVD.Pinsonneault,a) B. Quirion,b) J.L. Lachambre,c) C. Legrosd)
Centre canadien de fusion magnétique, 1804 Boul. Lionel-Boulet, Varennes, Québec, Canada J3X1S1
Abstract
The TdeV AM reflectometer measuring edge electron density profiles from the X-mode upper cut-off layer hasrecently been modified. In addition to the original reflectometer channel operating at 33-50 GHz and amplitude modulatedat 201 MHz, a second at 50-75 GHz with a 200 MHz amplitude modulation is now operational. The first channel probesthe scrape-off layer (SOL) while the second extends the spatial coverage up to typical values of r/a ~ 0.9. Densities oflxl0'*sn.(m"3)s3xl0" can be measured for 1.8 T operation. These two channels are coupled to a single transmission Unewith one set of antennae. Two distinct modulation frequencies were adopted to enable simultaneous detection. Althoughthese modulation frequencies correspond to plasma measurements with two slightly different sideband spatial separations,good agreement between the two channels has been found. The reflected envelopes, carrying the time delay information, aredownconverted to a 1 MHz IF signal to facilitate narrow-band filtering and phase detection. To improve the performanceof the detection system, low-noise amplifiers and limiting amplifiers are presently being used. Additionally, filters with 1kHz bandwiths presently allow for faster fullband sweeps. As a result, density profiles for various plasma conditions haverecently been measured. Also, reflectometry data, such as the density scale length and the density at the separatrix, areprovided as boundary conditions for the inversion of FIR interferometer data to obtain accurate density profiles. The designand construction of the AM reflectometer will be described and recent experimental results will be presented.
1. Introduction
The AM reflectometer1 operating on TdeV has recently been modified to accommodate the
geometry of the upgraded TdeV-962. TdeV-96 is a divertor tokamak which now operates with
higher toroidal fields up to 2.0 T and with smaller major and minor radii of 0.83 m and 0.22 m
respectively. The divertor was redesigned for higher power handling capability and to allow for a
more flexible divertor geometry. For biasing purposes, the divertor plates are electrically insulated
from the vacuum vesseL For the results presented here the 1.3 MW lower hybrid system which is
generally used for both heating and current drive was not operational The X-mode upper cut-off
layer is used. To investigate fully the edge region under these new operating conditions, a second
channel covering the frequency range of 50.0 s f (GHz) s 75.0 and amplitude modulated at 200 MHz
has been added to the existing first channel operating at 33.0if (GHz)s50.0 with a 201 MHz
amplitude modulation. The first channel probes the scrape-off layer (SOL) while the second extends
the spatial coverage up to typical values of r/a ~ 0.9. Densities of lx lO'^n^m^SxlO 1 9 can be
measured for 1.8 T operation. Additional modifications to the detection system have also been made;
low-noise amplifiers and limiting amplifiers considerably improve the power dynamic range and filters
"INRS-Énergie et Matériaux, Varennes, Québec. Canada."TDécatron, St-Bruno, Québec, Canada.c)Hydor-Québec, Varennes, Québec, Canada."'Inspected! 2000, St-Sulpice. Québec. Canada
- 109 -
with 1 kHz bandwiths presently allow for faster fullband sweeps. In vessel calibration checks proved
to be essential for optimizing the final detection stage. The two channel reflectometer will be
described in detail and recent experimental results will be presented.
2. AM reflectometer
A block diagram of the two channel AM reflectometer is shown in fig. 1. Two BWO sources
operating in the frequency range of 33-50 GHz and 50-75 GHz are modulated in amplitude by two
separate PIN diode modulators at 201 and 200 MHz respectively. Two distinct modulation
frequencies were adopted to enable simultaneous detection. The additional 200 MHz source needed
is obtained by mixing signals from the 201-MHz generator with that of a 1-MHz reference and by
filtering the resulting signal (BW.-400 kHz at 200 MHz). Each PIN modulator operates with a DC
bias of +10V and a RF modulation signal of 13 dBm leading to an average carrier insertion loss of
6 dB. At the cut-off, these frequencies yield a radial separation between the carrier and the sidebands
of the launched AM spectra of the order of 1 mm for typical plasma conditions. For each channel the
carrier frequency is determined by applying a control voltage to the appropriate BWO power supply
and is accurately measured by monitoring the high voltage biasing of the helicoidal grid of the BWO
head. This frequency control technique is valid for sweep rates >25 ms. To ensure measurements
along the same Une of sight, the two channels are coupled through a diplexer to a single WR-22
waveguide run. Isolators are introduced between the PIN modulators and the diplexer to prevent
modulation crosstalk between the channels in the vicinity of 50 GHz. As the BWOs, the isolators
were shielded to avoid stray magnetic fields, while the PIN modulators proved to be insensitive to
these fields. Two separate standard 25-dB gain antennae are used, one as a launcher and the second
as a receiver. The apertures are aligned vertically on each side of the torus midplane at ~23 cm from
the last closed flux surface and are oriented to enable measurements from reflections on the midplane.
A 0.09 mm thick silica window provides the vacuum seaL The total emitted power is approximately
-10 dBm averaged over the full bandwidth and coupling losses of ~25-30 dB between the antennae
were measured with a metallic reflector. At the receiving antenna, the two reflected signals are
separated into their respective bandwidths by a diplexer and detected with two distinct DC biased
detectors. A 110 \i A biasing current is applied to optimize the output signal leveL These signals are
filtered and pre-amplified immediately after detection to minimize sensitivity to EM pickup. A
shielded coaxial cable carries the resulting signals to the electronics located 8 m from the machine.
The detected signals are frequency-downconverted to 1 MHz for final detection with low-
frequency limiting amplifiers and phase detectors. This frequency downshift is performed by simply
mixing the detected 201-MHz signal with the 200-MHz reference source for the 33-50 GHz channel
and by mixing the detected signal at 200-MHz with that from the 201-MHz oscillator for the 50-
75 GHz channel. At this point, these signals are separately filtered with a BP filter (BW: 1 kHz at
- no -
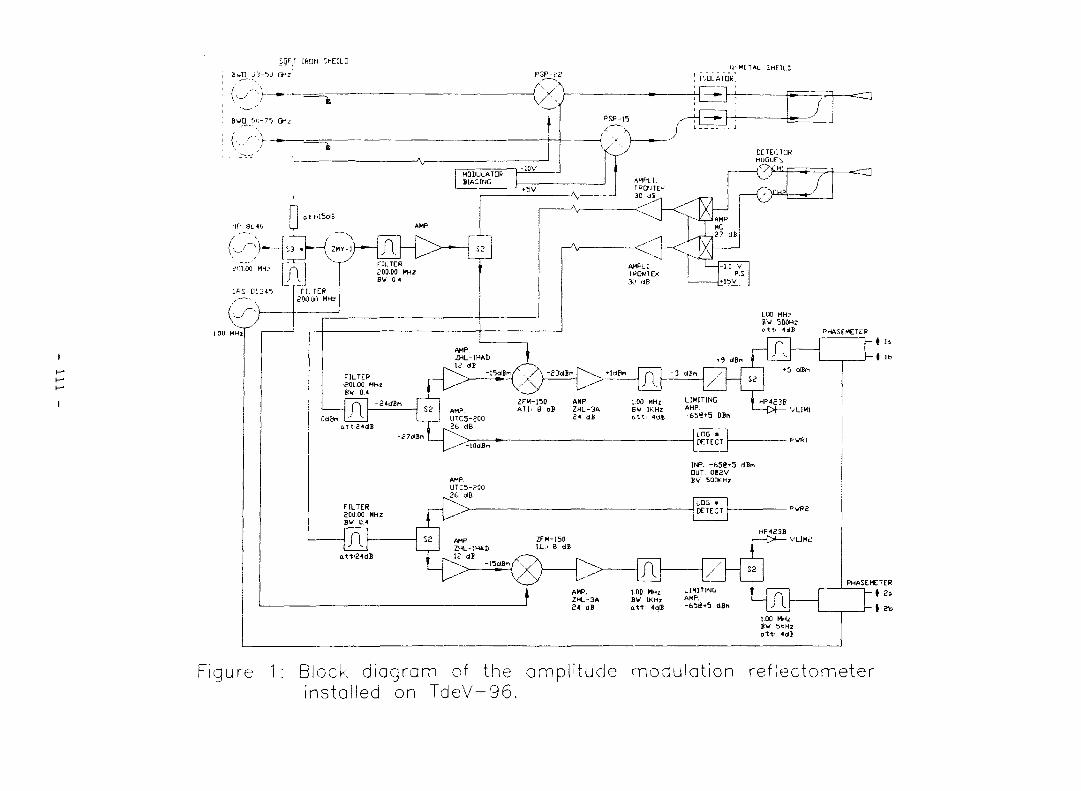
son ISDN :HEILI_U-MET»L SHElLD
I'DLATDRi
; / ,
; BWG.SU-7.5
' ÇA-MODUL.BIA
1ULATDR HGING _J_
Qtt'lSdB
r~"v
O
1.00 MHz
ott. «P PNASEMETER
AMP.ZHL-1HM1£
FILTER"20100 MHzBW 0.4
A -3 dBn/
dBr r A+5
A UTC5-S0OdB
ZFM-150 AMP.ATT. 8 dB ZHL-3A
24 dB
100 NHz LIMITINGBU 1KHz A M P
1 HP4S3E> O — VLIM1
Vf. -65M dBnDUT. 0Í2VBV 5QQKH2
FILTERS0Ü00 MHzBW 0.4
1.00 MHz LIMITINGBW I K H I AMf>
Ott 4dï -65lít5 dTjA
1-00 MH2BW 5KHz
Figure 1: Block diagram of the amplitude modulation reflectometerinstalled on TdeV-96.
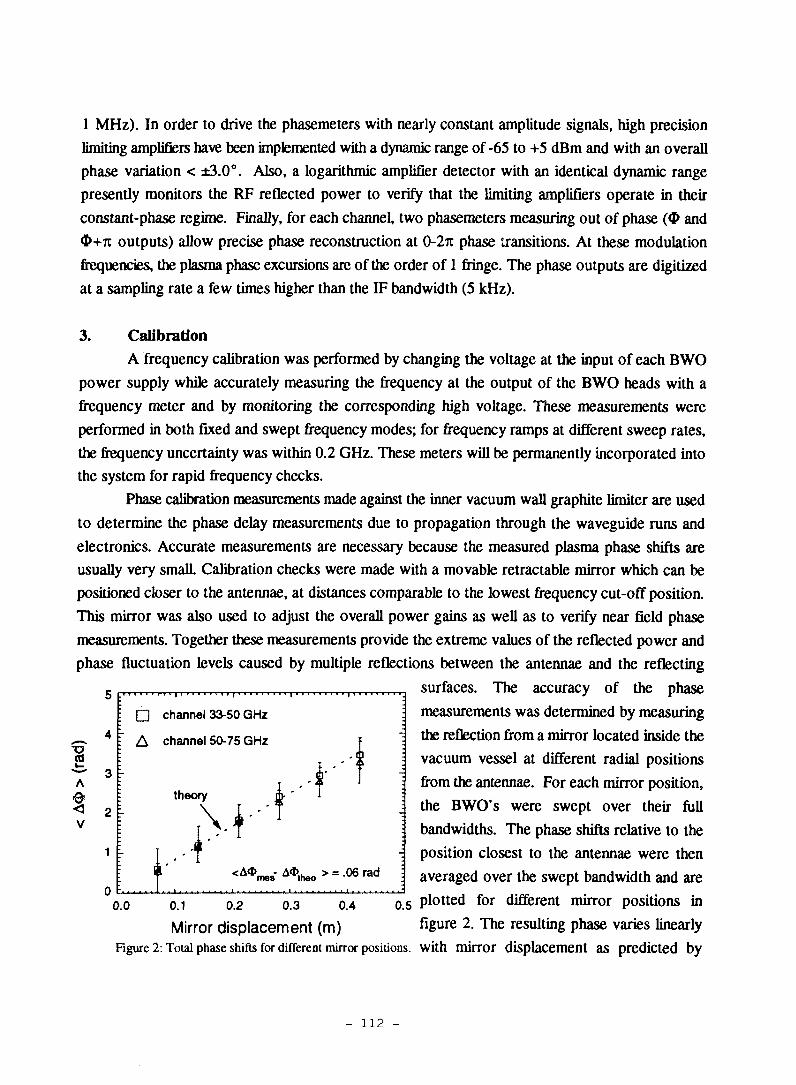
1 MHz). In order to drive the phasemeters with nearly constant amplitude signals, high precision
limiting amplifiers have been implemented with a dynamic range of-65 to +5 dBm and with an overall
phase variation < ±3.0°. Also, a logarithmic amplifier detector with an identical dynamic range
presently monitors the RF reflected power to verify that the limiting amplifiers operate in their
constant-phase regime. Finally, for each channel, two phasemeters measuring out of phase (O and
$+rc outputs) allow precise phase reconstruction at 0-2TI phase transitions. At these modulation
frequencies, the plasma phase excursions are of the order of 1 fringe. The phase outputs are digitized
at a sampling rate a few times higher than the IF bandwidth (5 kHz).
3. Calibration
A frequency calibration was performed by changing the voltage at the input of each BWO
power supply while accurately measuring the frequency at the output of the BWO heads with a
frequency meter and by monitoring the corresponding high voltage. These measurements were
performed in both fixed and swept frequency modes; for frequency ramps at different sweep rates,
the frequency uncertainty was within 0.2 GHz. These meters will be permanently incorporated into
the system for rapid frequency checks.
Phase calibration measurements made against the inner vacuum wall graphite limiter are used
to determine the phase delay measurements due to propagation through the waveguide runs and
electronics. Accurate measurements are necessary because the measured plasma phase shifts are
usually very smalL Calibration checks were made with a movable retractable mirror which can be
positioned closer to the antennae, at distances comparable to the lowest frequency cut-off position.
This mirror was also used to adjust the overall power gains as well as to verify near field phase
measurements. Together these measurements provide the extreme values of the reflected power and
phase fluctuation levels caused by multiple reflections between the antennae and the reflecting
surfaces. The accuracy of the phase
measurements was determined by measuring
s,A
IV
n channel 33-50 GHz
A channel 50-75 GHz.0
i - n
theory
r<A*met A * t h e o > = 0 6 r a d
the reflection from a mirror located inside the
vacuum vessel at different radial positions
from the antennae. For each mirror position,
the BWO's were swept over their full
bandwidths. The phase shifts relative to the
position closest to the antennae were then
averaged over the swept bandwidth and are
0 0 0_i 0 2 o.3 0.4 a s P l o t t e d ft>r different mirror positions in
Mirror displacement (m) fiêure 2- The resulting phase varies linearlyFigure 2: Total phase shifts for different mirror positions, with mirror displacement as predicted by
- 112 -
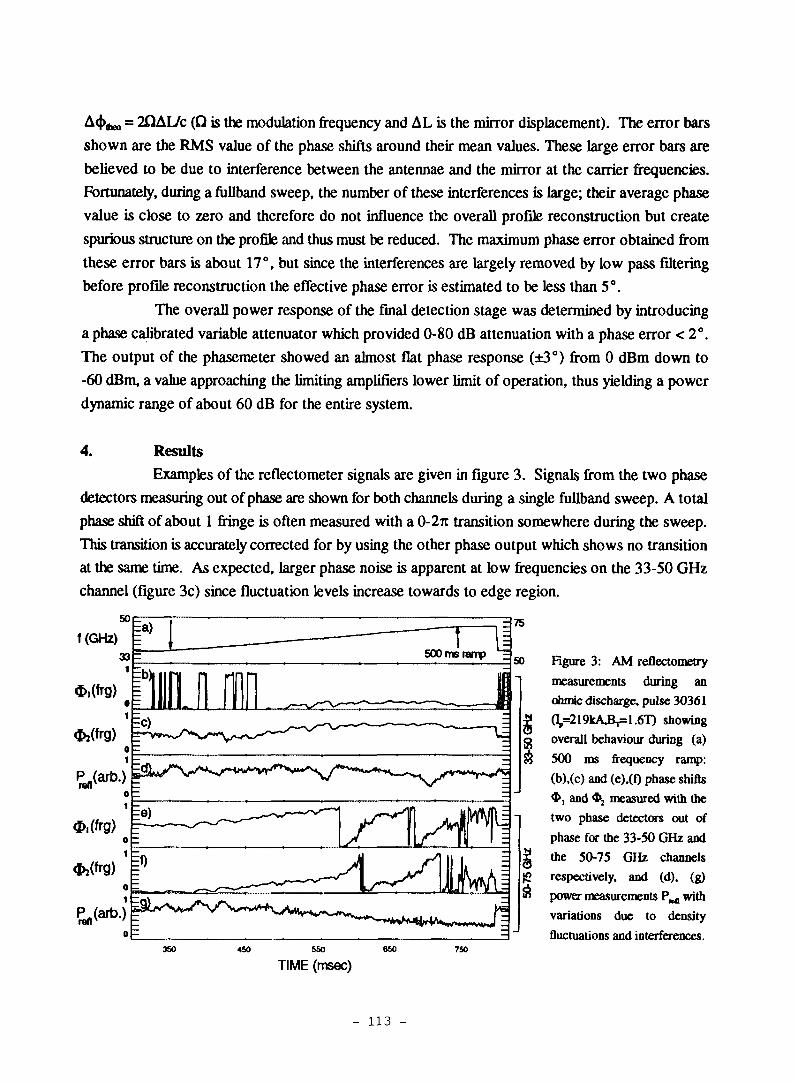
o = 2QAL/C (Q is the modulation frequency and AL is the mirror displacement). The error bars
shown are the RMS value of the phase shifts around their mean values. These large error bars are
believed to be due to interference between the antennae and the mirror at the carrier frequencies.
Fortunately, during a fullband sweep, the number of these interferences is large; their average phase
value is close to zero and therefore do not influence the overall profile reconstruction but create
spurious structure on the profile and thus must be reduced. The maximum phase error obtained from
these error bars is about 17°, but since the interferences are largely removed by low pass filtering
before profile reconstruction the effective phase error is estimated to be less than 5°.
The overall power response of the final detection stage was determined by introducing
a phase calibrated variable attenuator which provided 0-80 dB attenuation with a phase error < 2°.
The output of the phasemeter showed an almost flat phase response (±3°) from 0 dBra down to
-60 dBm, a value approaching the limiting amplifiers lower limit of operation, thus yielding a power
dynamic range of about 60 dB for the entire system.
331
75
500 ms tamp ^50
4. ResultsExamples of the reflectometer signals are given in figure 3. Signals from the two phase
detectors measuring out of phase are shown for both channels during a single fullband sweep. A total
phase shift of about 1 fringe is often measured with a 0-271 transition somewhere during the sweep.
This transition is accurately corrected for by using the other phase output which shows no transition
at the same time. As expected, larger phase noise is apparent at low frequencies on the 33-50 GHz
channel (figure 3c) since fluctuation levels increase towards to edge region.
50
f(GHz)
Figure 3: AM reflectometry
measurements during an
ohmic discharge, pulse 30361
a,=219kAJBr=1.6T) showing
overall behaviour during (a)
500 ms frequency ramp:
(b),(c) and (e),(f) phase shifts
$ , and % measured with the
two phase detectors out of
phase for the 33-50 GHz and
the 50-75 GHz channels
respectively, and (d). (g)
power measurements P ^ with
variations due to density
fluctuations and interferences.
o i.
0 =
re)
o =i
350 450 550 650 750
TIME (msec)
- 113 -
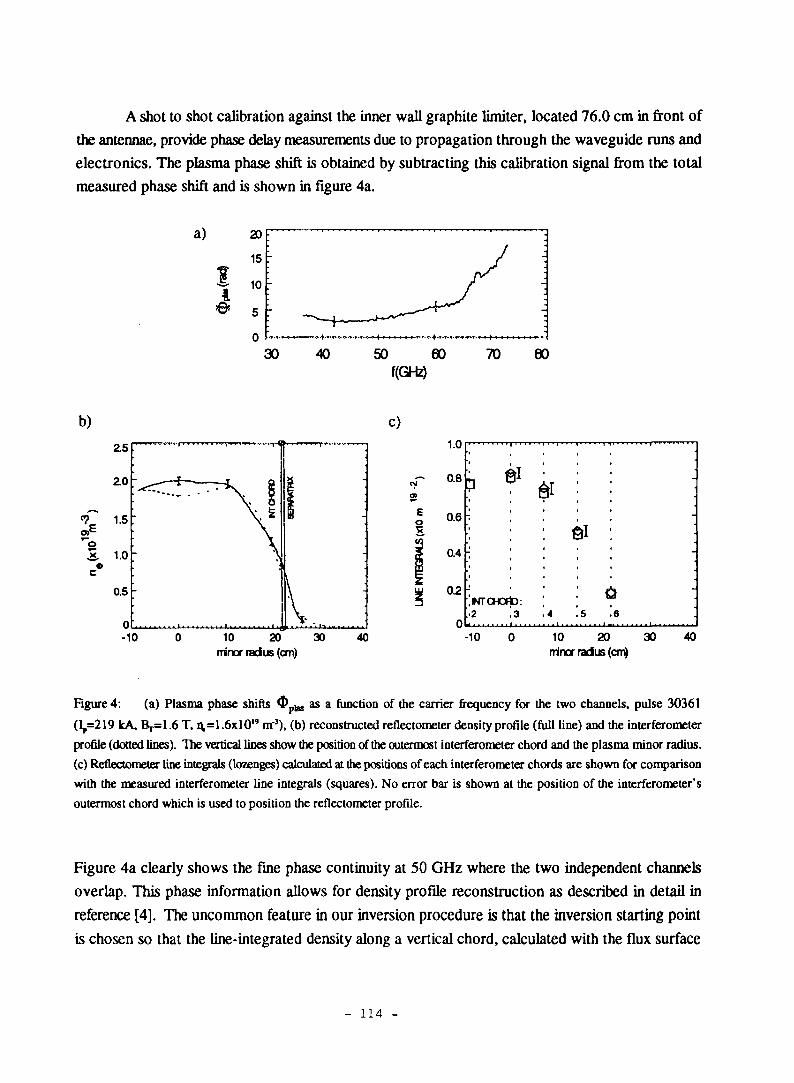
A shot to shot calibration against the inner wall graphite limiter, located 76.0 cm in front of
the antennae, provide phase delay measurements due to propagation through the waveguide runs and
electronics. The plasma phase shift is obtained by subtracting this calibration signal from the total
measured phase shift and is shown in figure 4a.
a)
50 60f(GHz)
80
b) C)
0 10 20 30 40minor radius (cm)
1.0
0.8
0.6
0.4
0.2
-10
Ù6
10 20 30minor radus (cm)
40
Figure 4: (a) Plasma phase shifts Oplas as a function of the carrier frequency for the two channels, pulse 30361
(1^=219 kA, B^ l .6 T, ^=1.6x10" m"3), (b) reconstructed reflectometer density profile (full line) and the interferometer
profile (dotted lines). The vertical lines show the position of the outermost interferometer chord and the plasma minor radius,
(c) Reflectometer line integrals (lozenges) calculated at the positions of each interferometer chords are shown for comparison
with the measured interferometer line integrals (squares). No error bar is shown at the position of the interferometer's
outermost chord which is used to position the reflectometer profile.
Figure 4a clearly shows the fine phase continuity at 50 GHz where the two independent channels
overlap. This phase information allows for density profile reconstruction as described in detail in
reference [4]. The uncommon feature in our inversion procedure is that the inversion starting point
is chosen so that the line-integrated density along a vertical chord, calculated with the flux surface
- 114 -
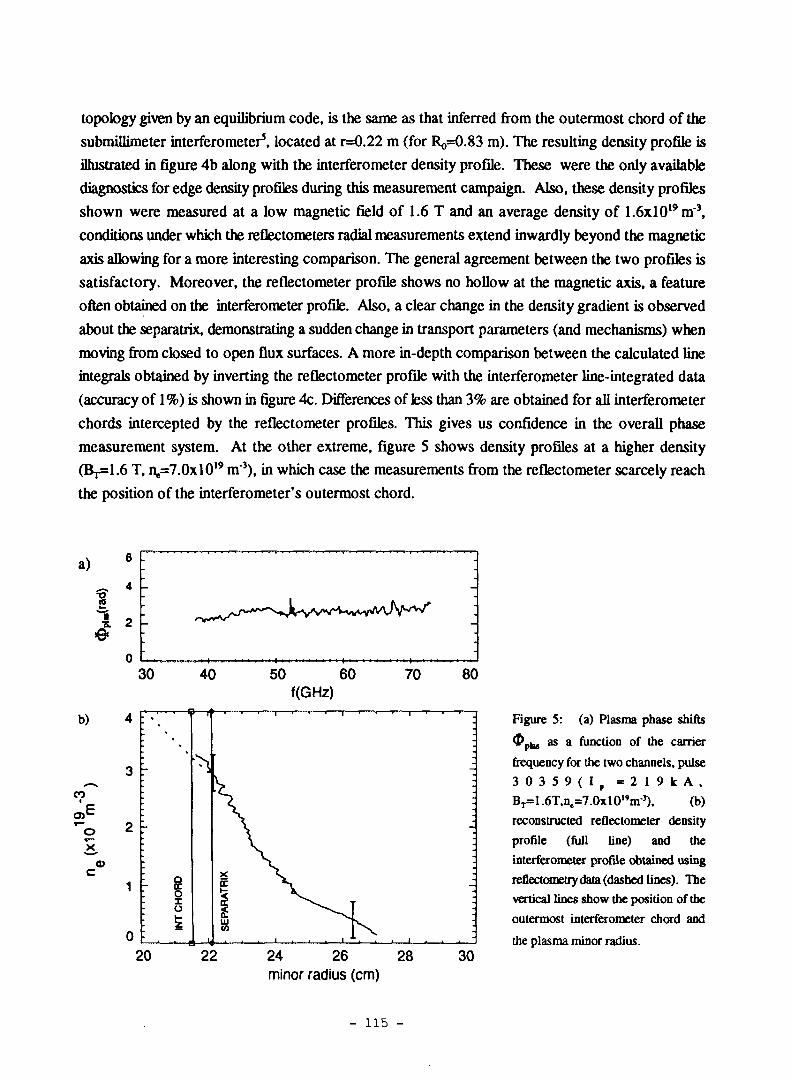
topology given by an equilibrium code, is the same as that inferred from the outermost chord of the
submillimeter interferometer5, located at r=0.22 m (for 1^=0.83 m). The resulting density profile is
illustrated in figure 4b along with the interferometer density profile. These were the only available
diagnostics for edge density profiles during this measurement campaign. Also, these density profiles
shown were measured at a low magnetic field of 1.6 T and an average density of 1.6xl0l9m'3,
conditions under which the reflectometers radial measurements extend inwardly beyond the magnetic
axis allowing for a more interesting comparison. The general agreement between the two profiles is
satisfactory. Moreover, the reflectometer profile shows no hollow at the magnetic axis, a feature
often obtained on the interferometer profile. Also, a clear change in the density gradient is observed
about the separatrix, demonstrating a sudden change in transport parameters (and mechanisms) when
moving from closed to open flux surfaces. A more in-depth comparison between the calculated line
integrals obtained by inverting the reflectometer profile with the interferometer line-integrated data
(accuracy of 1%) is shown in figure 4c. Differences of less than 3% are obtained for all interferometer
chords intercepted by the reflectometer profiles. This gives us confidence in the overall phase
measurement system. At the other extreme, figure 5 shows density profiles at a higher density
(Br=1.6 T, ^=7.0x10" m"3), in which case the measurements from the reflectometer scarcely reach
the position of the interferometer's outermost chord.
b)
CO
cc
40
22
50 60f(GHz)
70 80
24 26 28minor radius (cm)
30
Figure S: (a) Plasma phase shifts
$ p ] u as a function of the carrier
frequency for the two channels, pulse
3 0 3 5 9 ( 1 , = 2 1 9 k A ,
BT=1.6T,n.=7.0xl01»m-3), (b)
reconstructed reflectometer density
profile (full line) and the
interferometer profile obtained using
refkctometrydata (dashed lines). The
vertical Unes show the position of the
outermost interferometer chord and
the plasma minor radius.
- 115 -
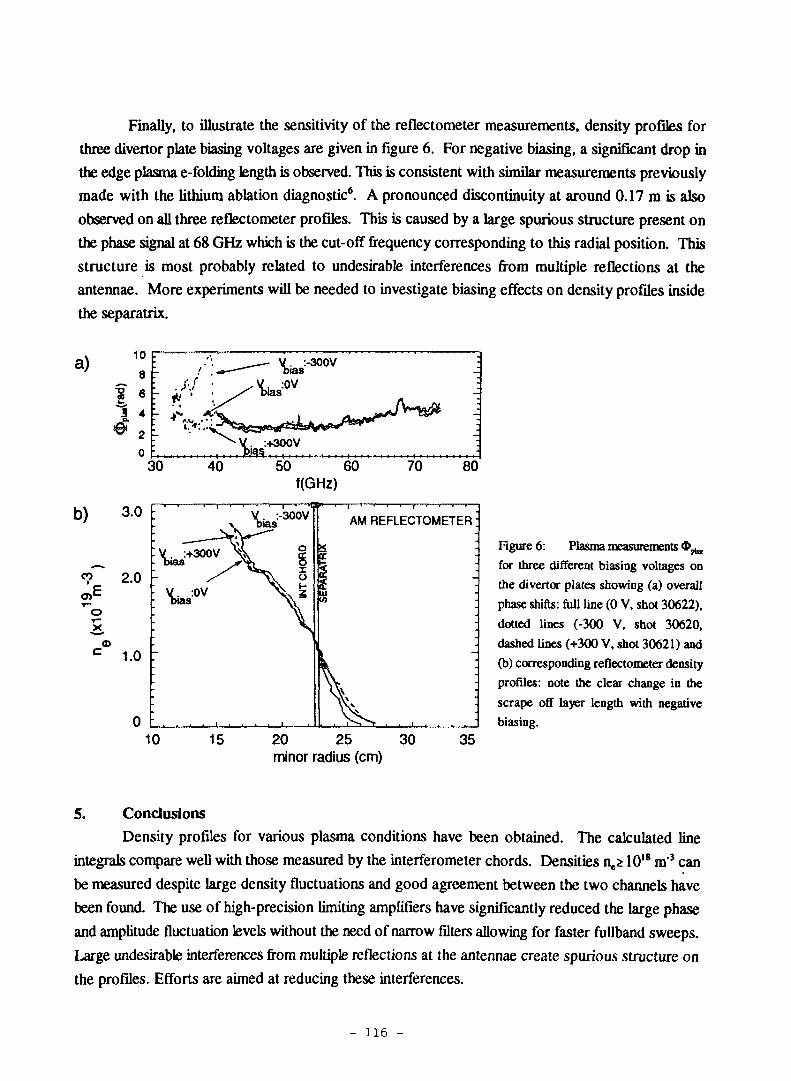
Finally, to illustrate the sensitivity of the reflectometer measurements, density profiles for
three divertor plate biasing voltages are given in figure 6. For negative biasing, a significant drop in
the edge plasma e-folding length is observed. This is consistent with similar measurements previously
made with the lithium ablation diagnostic6. A pronounced discontinuity at around 0.17 m is also
observed on all three reflectometer profiles. This is caused by a large spurious structure present on
the phase signal at 68 GHz which is the cut-off frequency corresponding to this radial position. This
structure is most probably related to undesirable interferences from multiple reflections at the
antennae. More experiments will be needed to investigate biasing effects on density profiles inside
the separatrix.
a)
b) 3.0
«? 2 0 -
50 60f(GHz)
70 80
10 15 20 25 30minor radius (cm)
35
Figure 6: Plasma measurements «D^
for three different biasing voltages on
the divertor plates showing (a) overall
phase shifts: full Une (0 V, shot 30622),
dotted lines (-300 V, shot 30620,
dashed lines (+300 V, shot 30621) and
(b) corresponding reflectometer density
profiles: note the clear change in the
scrape off layer length with negative
biasing.
5. Conclusions
Density profiles for various plasma conditions have been obtained. The calculated line
integrals compare well with those measured by the interferometer chords. Densities n,.* 1018 m* can
be measured despite large density fluctuations and good agreement between the two channels have
been found. The use of high-precision limiting amplifiers have significantly reduced the large phase
and amplitude fluctuation levels without the need of narrow filters allowing for faster fullband sweeps.
Large undesirable interferences from multiple reflections at the antennae create spurious structure on
the profiles. Efforts are aimed at reducing these interferences.
- 116 -
AcknowledgementsThe authors are grateful to Dr. G. R. Hanson of Oak Ridge National Laboratory for guidance
and stimulating discussions during the initial developing stages of the reflectometer. Also, we wish
to thank Dr. A. E. Hubbard of Alcator C-Mod, Dr. F. Skiff and Dr. Derek Boyd of IPR University
of Maryland for continuous discussions and encouragement. We acknowledge the contribution and
support of the TdeV team. This work was funded by the Government of Canada, Hydro-Québec, and
the Institut national de la recherche scientifique.
References'D. Pinsonneault, B. Quirion, J.-L.Lachambre, Rev. ScL Instrum., 68, 990(1997)2R. Décoste et ai, Proceedings of the 16th IAEA International Conference, Canada, 1996 to bepublished
3J. Sanchez, B. Branas, E. De la Luna, and T. Estrada, Rev. Sci. Inst., 64, 487 (1993).4H. Bottollier-Curtet and G. Ichtchenko, Rev. Sci. Instrum., 58, 539 (1987)5J.L .Lachambre and M. Gagné, Rev. ScL Instrum., 65, 3428 (1994)6J.L. Lachambre et aL, Nuclear Fusion, 34(11), 1431(1994)
• leftgLAMK- 117 -
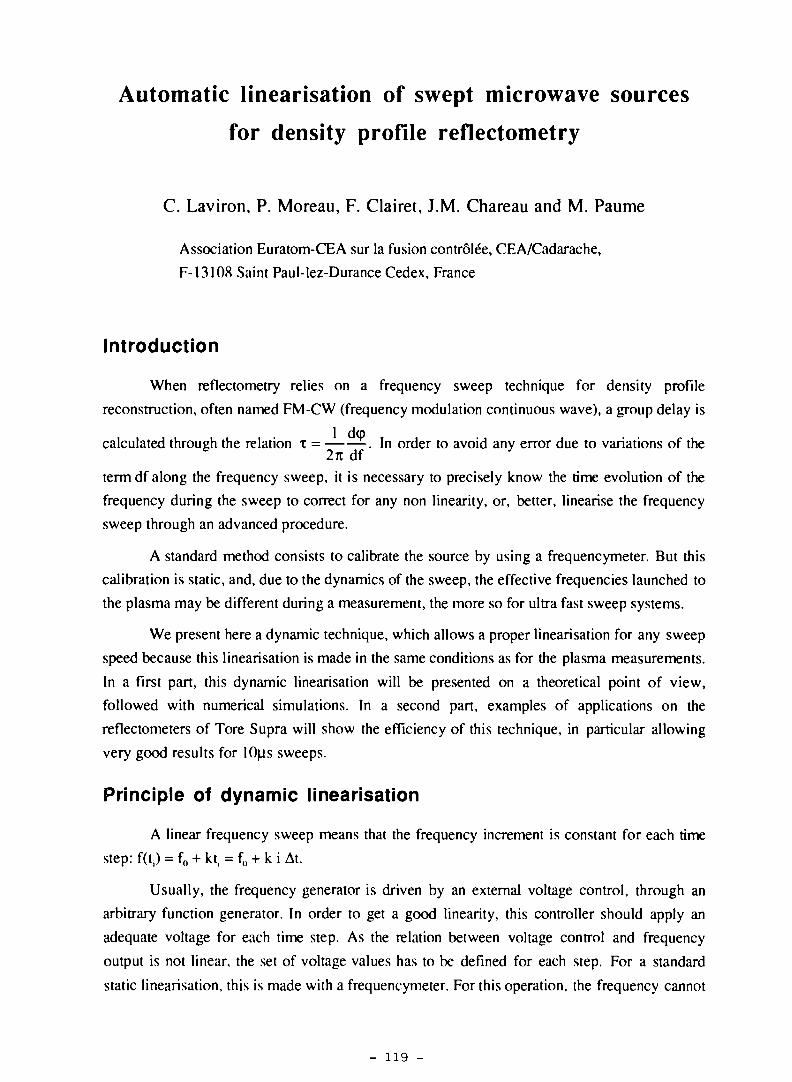
Automatic linearisation of swept microwave sources
for density profile reflectometry
C. Laviron, P. Moreau, F. Clairet, J.M. Chareau and M. Paume
Association Euratom-CEA sur la fusion contrôlée, CEA/Cadarache,
F-13108 Saint Paul-lez-Durance Cedex, France
Introduction
When reflectometry relies on a frequency sweep technique for density profile
reconstruction, often named FM-CW (frequency modulation continuous wave), a group delay is
calculated through the relation x = . In order to avoid any error due to variations of the2n df
term df along the frequency sweep, it is necessary to precisely know the time evolution of the
frequency during the sweep to correct for any non linearity, or, better, linearise the frequency
sweep through an advanced procedure.
A standard method consists to calibrate the source by using a frequencymeter. But this
calibration is static, and, due to the dynamics of the sweep, the effective frequencies launched to
the plasma may be different during a measurement, the more so for ultra fast sweep systems.
We present here a dynamic technique, which allows a proper linearisation for any sweep
speed because this linearisation is made in the same conditions as for the plasma measurements.
In a first part, this dynamic linearisation will be presented on a theoretical point of view,
followed with numerical simulations. In a second part, examples of applications on the
reflectometers of Tore Supra will show the efficiency of this technique, in particular allowing
very good results for IO^IS sweeps.
Principle of dynamic linearisation
A linear frequency sweep means that the frequency increment is constant for each time
step: f(t,) = f0 + kt, = f() + k i At.
Usually, the frequency generator is driven by an external voltage control, through an
arbitrary function generator. In order to get a good linearity, this controller should apply an
adequate voltage for each time step. As the relation between voltage control and frequency
output is not linear, the set of voltage values has to be defined for each step. For a standard
static linearisation, this is made with a frequencymeter. For this operation, the frequency cannot
- 119 -
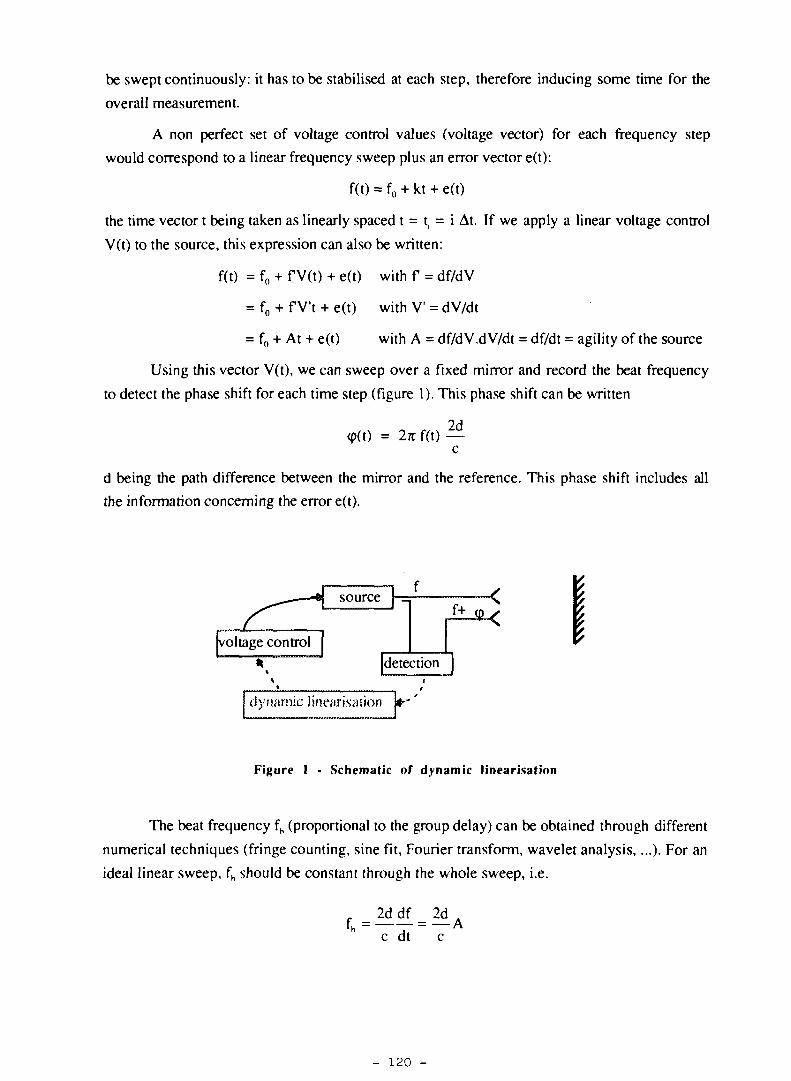
be swept continuously: it has to be stabilised at each step, therefore inducing some time for the
overall measurement.
A non perfect set of voltage control values (voltage vector) for each frequency step
would correspond to a linear frequency sweep plus an error vector e(t):
f(t) = f0 + kt + e(t)
the time vector t being taken as linearly spaced t = t, = i At. If we apply a linear voltage control
V(t) to the source, this expression can also be written:
f(t) = f0 + f V(t) + e(t) with f = df/dV
= f0 + fV't + e(t) with V = dV/dt
= f0 + At + e(t) with A = df/dV.dV/dt = df/dt = agility of the source
Using this vector V(t), we can sweep over a fixed mirror and record the beat frequency
to detect the phase shift for each time step (figure 1). This phase shift can be written
<p(t) = 2TC f(t) —c
d being the path difference between the mirror and the reference. This phase shift includes all
the information concerning the error e(t).
dynamic linearisation
Figure 1 • Schematic of dynamic linearisation
The beat frequency fh (proportional to the group delay) can be obtained through different
numerical techniques (fringe counting, sine fit, Fourier transform, wavelet analysis,...). For an
ideal linear sweep, fh should be constant through the whole sweep, i.e.
h c dt ~ c
- 120 -
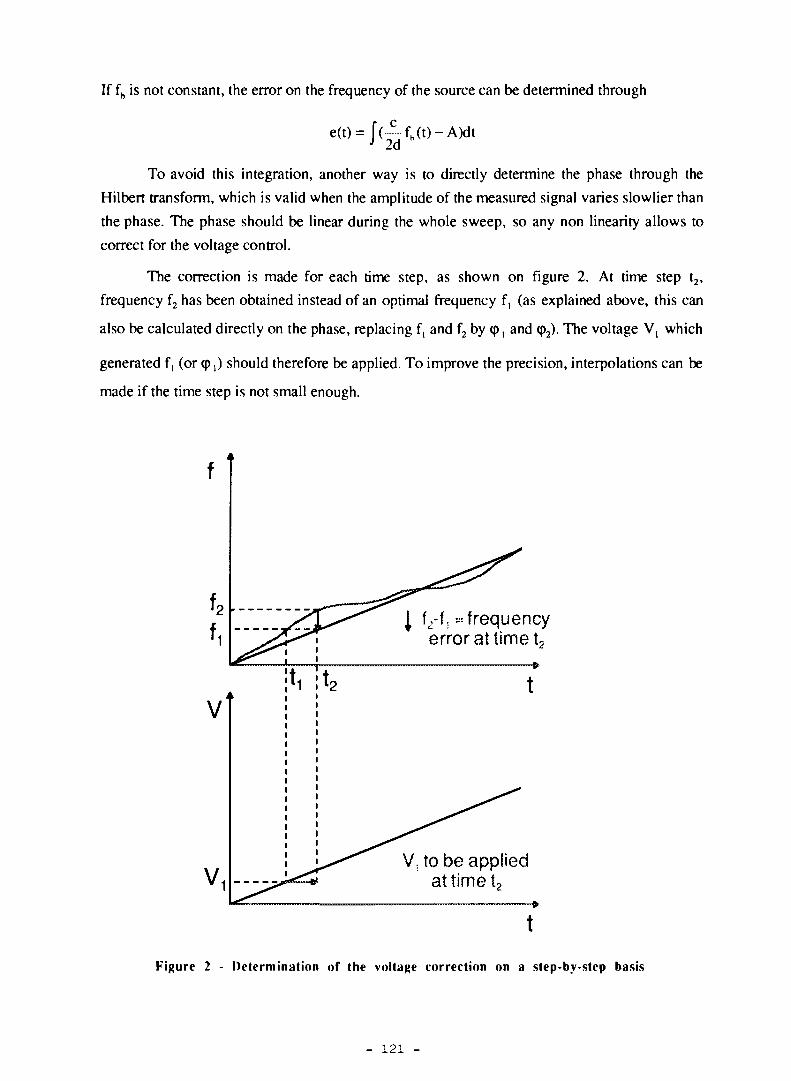
If fb is not constant, the error on the frequency of the source can be determined through
e(t)= f(~fh(t)-A)dt2d
To avoid this integration, another way is to directly determine the phase through the
Hilbert transform, which is valid when the amplitude of the measured signal varies slowlier than
the phase. The phase should be linear during the whole sweep, so any non linearity allows to
correct for the voltage control.
The correction is made for each time step, as shown on figure 2. At time step t2,
frequency f2 has been obtained instead of an optimal frequency f, (as explained above, this can
also be calculated directly on the phase, replacing f, and f2 by <p, and (p2). The voltage V, which
generated f, (or cp,) should therefore be applied. To improve the precision, interpolations can be
made if the time step is not small enough.
f2-f, = frequencyerror at time t,
V; to be appliedat time t2
Figure 2 - Determination of the voltage correction on a step-by-step basis
- 121 -

Numerical simulations have been made to validate this concept, before any
implementation on the reflectometers. Figure 3 shows an example of such a simulation: for
errors extending over few hundred MHz (fig. 3, left), the beat frequency (fig. 3, right) is broad
(dash-dotted line) and its value cannot be precisely defined. After linearisation, a sharp peak is
obtained (dashed line), exactly placed compared to the ideal linearity (plain line).
This example shown on figure 3 allows to obtain a S/N ratio of about 25 dB after
linearisation (dashed line), although the theoretical perfect linearity should give 40 dB (plain
line). To improve it, if necessary, the operation could be iterated using the new voltage control
vector as initial conditions.
60
50
40
30
[ 20)
10
0
10
-20
•h •
f
•'V.j.;.--• - * • - * "
j i : • . : ' . •
i
A . >'•' /• i.
I . j 1
•. 3
: > "
i
[!
ifHn.ï ?bk
\ •
20 i0 60beat frequency (au ]
100
Figure 3 - Numerical simulation of linearisation in the W band (75-110 GHz): simulatederror (left), and beat frequency (right) without linearity error (solid line), with simulatederror (dashdotted) and after linearisation (dashed).
Simulations show that when the starting conditions are too far from the optimum
linearity, the correction may induce a drift through successive iterations. This drift is due to
frequency edge effects (fmm and fmi, through Vmin and Vmax) and to the fact that the exact position
of the mirror is not perfectly known: a calculated distance dcalc, obtained from the average of the
measurements, has to be used ford. To avoid this drift, we can impose no edge correction for
min and Vmlx. A better constraint is to impose d from previous measurements (i.e. Wmn - Vmin =
constant). In any case, it is better not to iterate and to linearise from "not-too-bad" conditions. A
preliminary static linearisation can be used as a starting point, which allows to obtain a good
linearity in a single pass, without iteration.
Application to Tore Supra reflectometers
This technique has been successfully applied, in laboratory tests as well as on Tore
Supra, for the standard O-mode reflectometers |1], as well as for the new heterodyne
system [2]. The Tore Supra backwall is used as a reflecting mirror. First experiments have
- 122 -
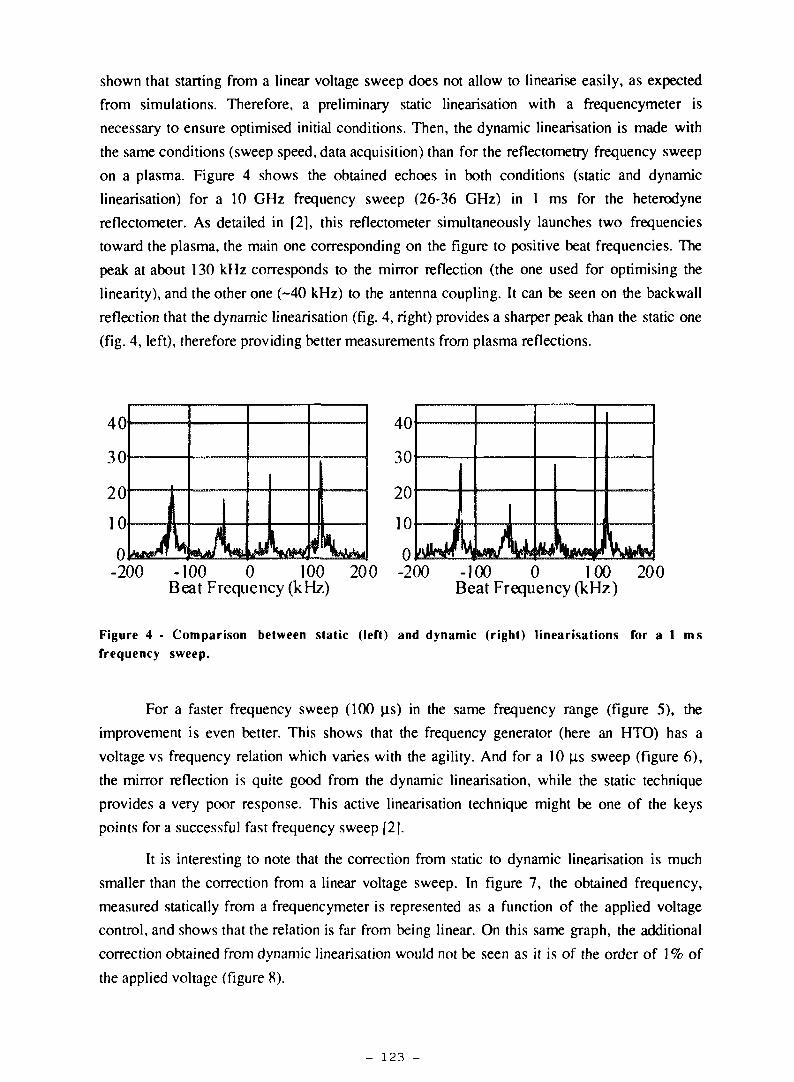
shown that starting from a linear voltage sweep does not allow to linearise easily, as expected
from simulations. Therefore, a preliminary static linearisation with a frequencymeter is
necessary to ensure optimised initial conditions. Then, the dynamic linearisation is made with
the same conditions (sweep speed, data acquisition) than for the reflectometry frequency sweep
on a plasma. Figure 4 shows the obtained echoes in both conditions (static and dynamic
linearisation) for a 10 GHz frequency sweep (26-36 GHz) in 1 ms for the heterodyne
reflectometer. As detailed in [2], this reflectometer simultaneously launches two frequencies
toward the plasma, the main one corresponding on the figure to positive beat frequencies. The
peak at about 130 kHz corresponds to the mirror reflection (the one used for optimising the
linearity), and the other one (-40 kHz) to the antenna coupling. It can be seen on the backwall
reflection that the dynamic linearisation (fig. 4, right) provides a sharper peak than the static one
(fig. 4, left), therefore providing better measurements from plasma reflections.
40
30
20
10
0-200
1 140
30
20
10
0
1I _____m
-100 0 100 200Beat Frequency (kHz)
-200 -100 0 100Beat Frequency (kHz)
200
Figure 4 - Comparison between static (left) and dynamic (right) linearisations for a 1 m sfrequency sweep.
For a faster frequency sweep (100 |is) in the same frequency range (figure 5), the
improvement is even better. This shows that the frequency generator (here an HTO) has a
voltage vs frequency relation which varies with the agility. And for a 10 [is, sweep (figure 6),
the mirror reflection is quite good from the dynamic linearisation, while the static technique
provides a very poor response. This active linearisation technique might be one of the keys
points for a successful fast frequency sweep [2).
It is interesting to note that the correction from static to dynamic linearisation is much
smaller than the correction from a linear voltage sweep. In figure 7, the obtained frequency,
measured statically from a frequencymeter is represented as a function of the applied voltage
control, and shows that the relation is far from being linear. On this same graph, the additional
correction obtained from dynamic linearisation would not be seen as it is of the order of 1% of
the applied voltage (figure 8).
- 123 -
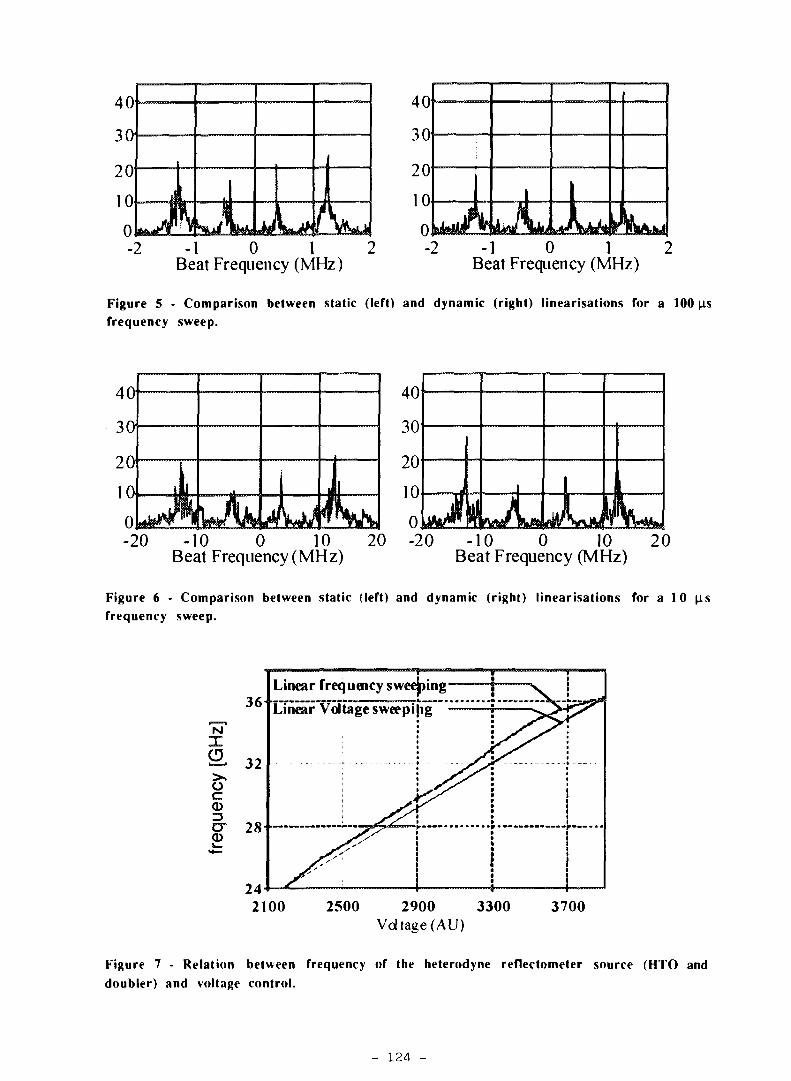
- 1 0 1Beat Frequency (MHz)
40
30
20
1 0
0
JI |
- 2 - 1 0 1Beat Frequency (MHz)
Figure 5 - Comparison between static (left) and dynamic (right) linearisations for a 100 (isfrequency sweep.
40
30
20
10 i
40
30
20
10
0
1i J \ i
0-20 -10 0 10
Beat Frequency (MHz)20 -20 -10 0 10 20
Beat Frequency (MHz)
Figure 6 • Comparison between static (left) and dynamic (right) linearisations for a 10 |isfrequency sweep.
NI
Iooc
Linear frequaicy sweeping
Linear Voltage sweeping
2100 2500 2900 3300Vdtage(AU)
3700
Figure 7 - Relation between frequency of the heterodyne reflectometer source (HTO anddoubler) and voltage control.
- 124 -
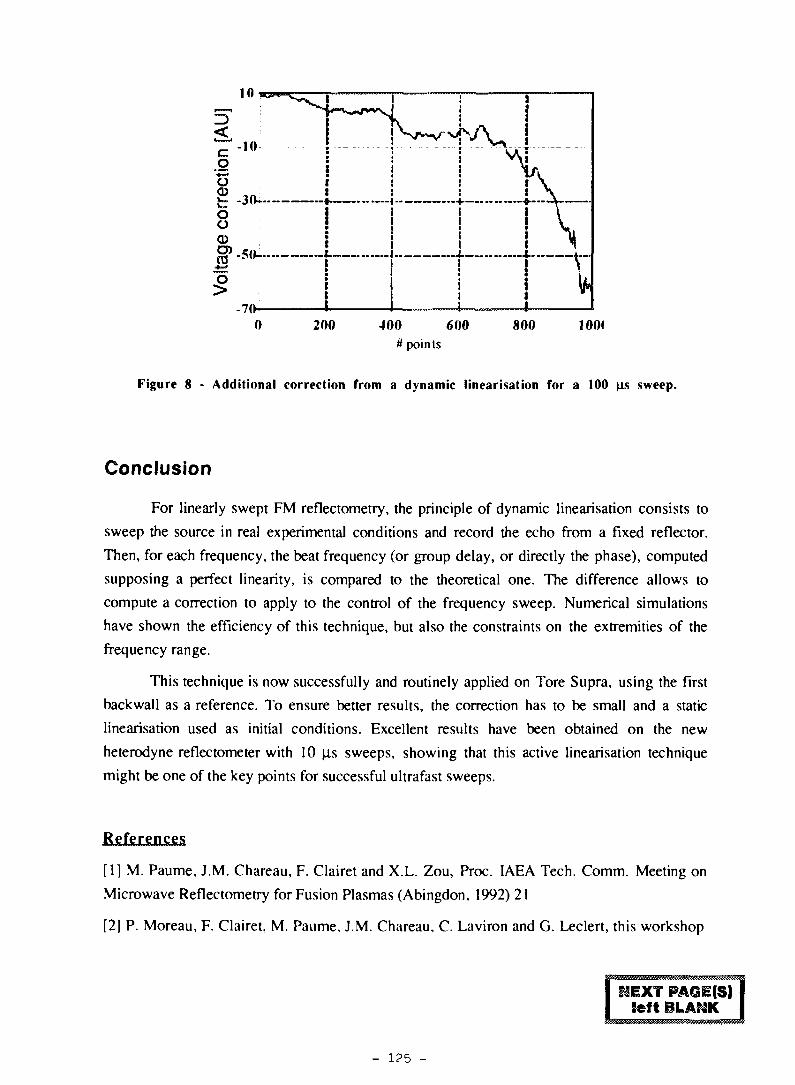
10*3
200 400 600# points
800 100(
Figure 8 - Additional correction from a dynamic linearisation for a 100 us sweep.
Conclusion
For linearly swept FM reflectometry, the principle of dynamic linearisation consists to
sweep the source in real experimental conditions and record the echo from a fixed reflector.
Then, for each frequency, the beat frequency (or group delay, or directly the phase), computed
supposing a perfect linearity, is compared to the theoretical one. The difference allows to
compute a correction to apply to the control of the frequency sweep. Numerical simulations
have shown the efficiency of this technique, but also the constraints on the extremities of the
frequency range.
This technique is now successfully and routinely applied on Tore Supra, using the first
backwall as a reference. To ensure better results, the correction has to be small and a static
linearisation used as initial conditions. Excellent results have been obtained on the new
heterodyne reflectometer with 10 jxs sweeps, showing that this active linearisation technique
might be one of the key points for successful ultrafast sweeps.
References
[11 M. Paume, J.M. Chareau, F. Clairet and X.L. Zou, Proc. IAEA Tech. Comm. Meeting on
Microwave Reflectometry for Fusion Plasmas (Abingdon, 1992) 21
[21 P. Moreau, F. Clairet, M. Paume, J.M. Chareau, C. Laviron and G. Leclert, this workshop
!œft BLA33K
- 125 -
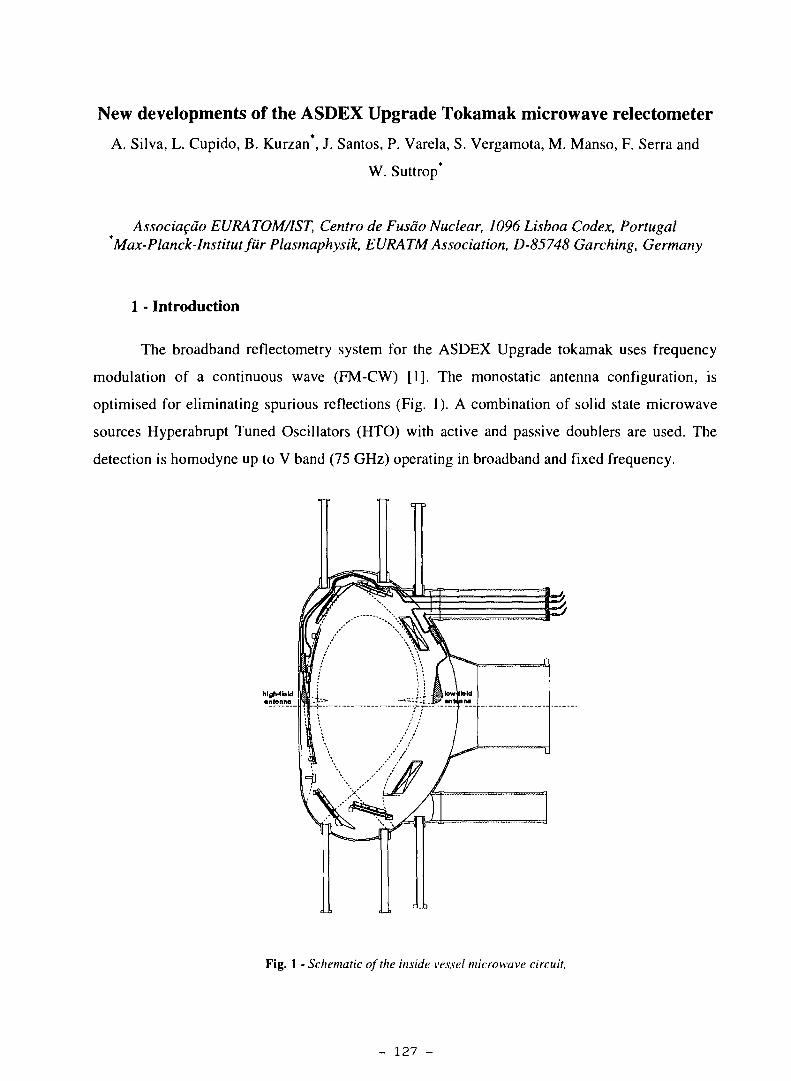
New developments of the ASDEX Upgrade Tokamak microwave relectometer
A. Silva, L. Cupido, B. Kurzan , J. Santos, P. Varela, S. Vergamota, M. Manso, F. Serra and
W. Suttrop*
Associaçào EURATOM/IST, Centro de Fusâo Nuclear, 1096 Lisboa Codex, PortugalMax-Planck-Institutfiir Plasmaphysik, EURATM Association, D-85748 Garching, Germany
1 - Introduction
The broadband reflectometry system for the ASDEX Upgrade tokamak uses frequency
modulation of a continuous wave (FM-CW) [1]. The monostatic antenna configuration, is
optimised for eliminating spurious reflections (Fig. 1). A combination of solid state microwave
sources Hyperabrupt Tuned Oscillators (HTO) with active and passive doublers are used. The
detection is homodyne up to V band (75 GHz) operating in broadband and fixed frequency.
Fig. 1 - Schematic of the inside vessel microwave circuit.
- 127 -
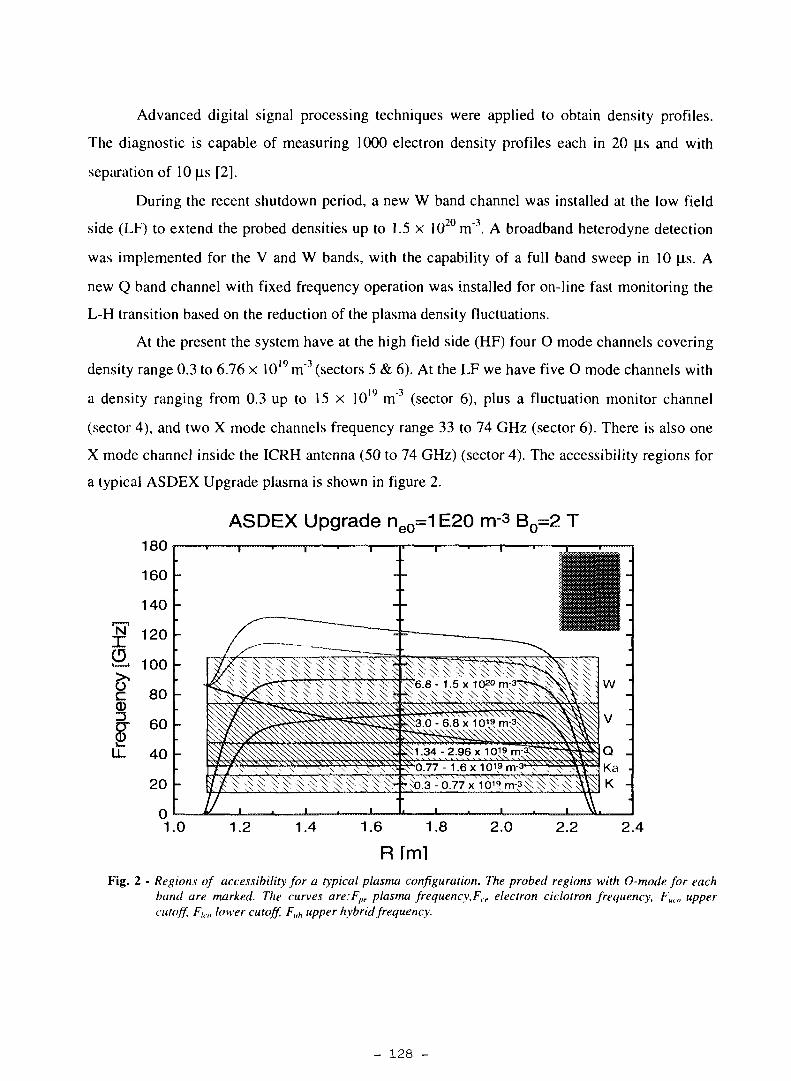
Advanced digital signal processing techniques were applied to obtain density profiles.
The diagnostic is capable of measuring 1000 electron density profiles each in 20 |is and with
separation of 10 |xs [2].
During the recent shutdown period, a new W band channel was installed at the low field
side (LF) to extend the probed densities up to 1.5 x 10²⁰m"3. A broadband heterodyne detection
was implemented for the V and W bands, with the capability of a full band sweep in 10 fis. A
new Q band channel with fixed frequency operation was installed for on-line fast monitoring the
L-H transition based on the reduction of the plasma density fluctuations.
At the present the system have at the high field side (HF) four O mode channels covering
density range 0.3 to 6.76 x 10¹⁹ m 3 (sectors 5 & 6). At the LF we have five O mode channels with
a density ranging from 0.3 up to 15 x 1019 m"3 (sector 6), plus a fluctuation monitor channel
(sector 4), and two X mode channels frequency range 33 to 74 GHz (sector 6). There is also one
X mode channel inside the ICRH antenna (50 to 74 GHz) (sector 4). The accessibility regions for
a typical ASDEX Upgrade plasma is shown in figure 2.
ASDEX Upgrade ne0=1 E20 m-3 B0=2 T
2.4
Fig. 2 - Regions of accessibility for a typical plasma configuration. The probed regions with O-mode for eachband are marked. The curves are:Ffe plasma frequency,Fce electron ciclotron frequency, FUCI, uppercutoff, F/a, lower cutoff, Fuh upper hybrid frequency.
- 128 -
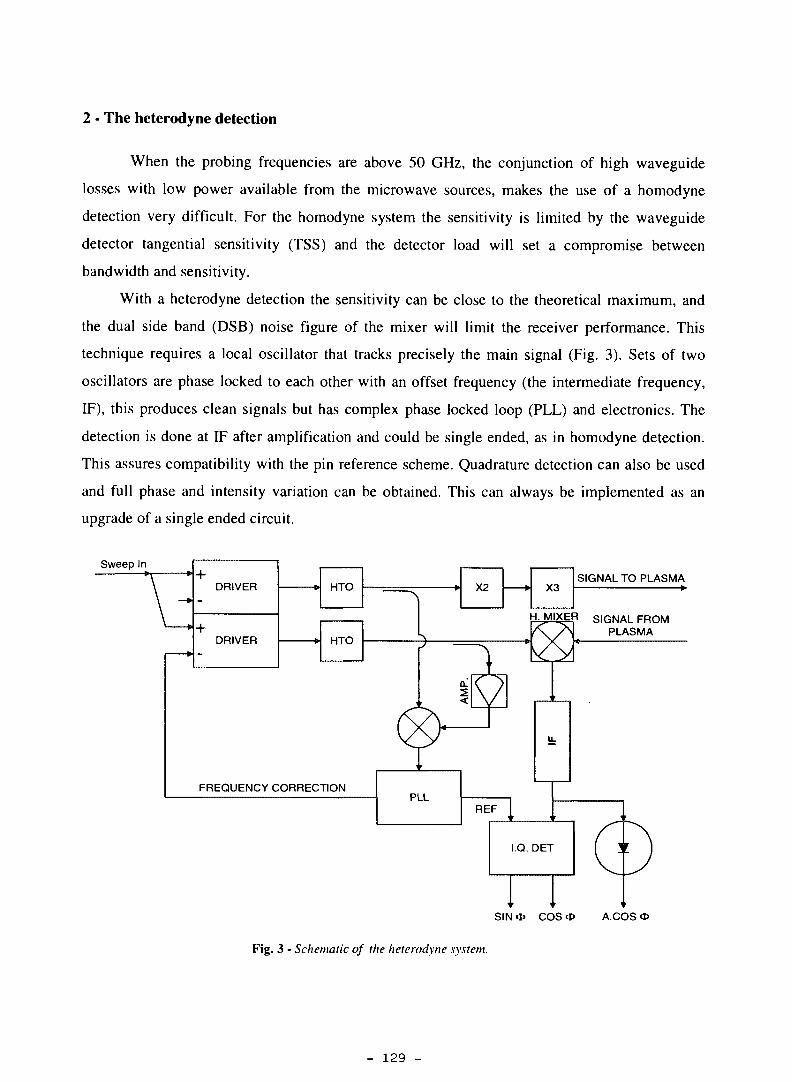
2 - The heterodyne detection
When the probing frequencies are above 50 GHz, the conjunction of high waveguide
losses with low power available from the microwave sources, makes the use of a homodyne
detection very difficult. For the homodyne system the sensitivity is limited by the waveguide
detector tangential sensitivity (TSS) and the detector load will set a compromise between
bandwidth and sensitivity.
With a heterodyne detection the sensitivity can be close to the theoretical maximum, and
the dual side band (DSB) noise figure of the mixer will limit the receiver performance. This
technique requires a local oscillator that tracks precisely the main signal (Fig. 3). Sets of two
oscillators are phase locked to each other with an offset frequency (the intermediate frequency,
IF), this produces clean signals but has complex phase locked loop (PLL) and electronics. The
detection is done at IF after amplification and could be single ended, as in homodyne detection.
This assures compatibility with the pin reference scheme. Quadrature detection can also be used
and full phase and intensity variation can be obtained. This can always be implemented as an
upgrade of a single ended circuit.
Sweep In
DRIVER
DRIVER
HTO
HTO
X3
H. MIXER
FREQUENCY CORRECTIONPLL
SIGNAL TO PLASMA
SIGNAL FROMPLASMA
REF
I.Q. DET
I iSIN<t> C O S * A . C O S *
Fig. 3 - Schematic of the heterodyne system.
- 129 -
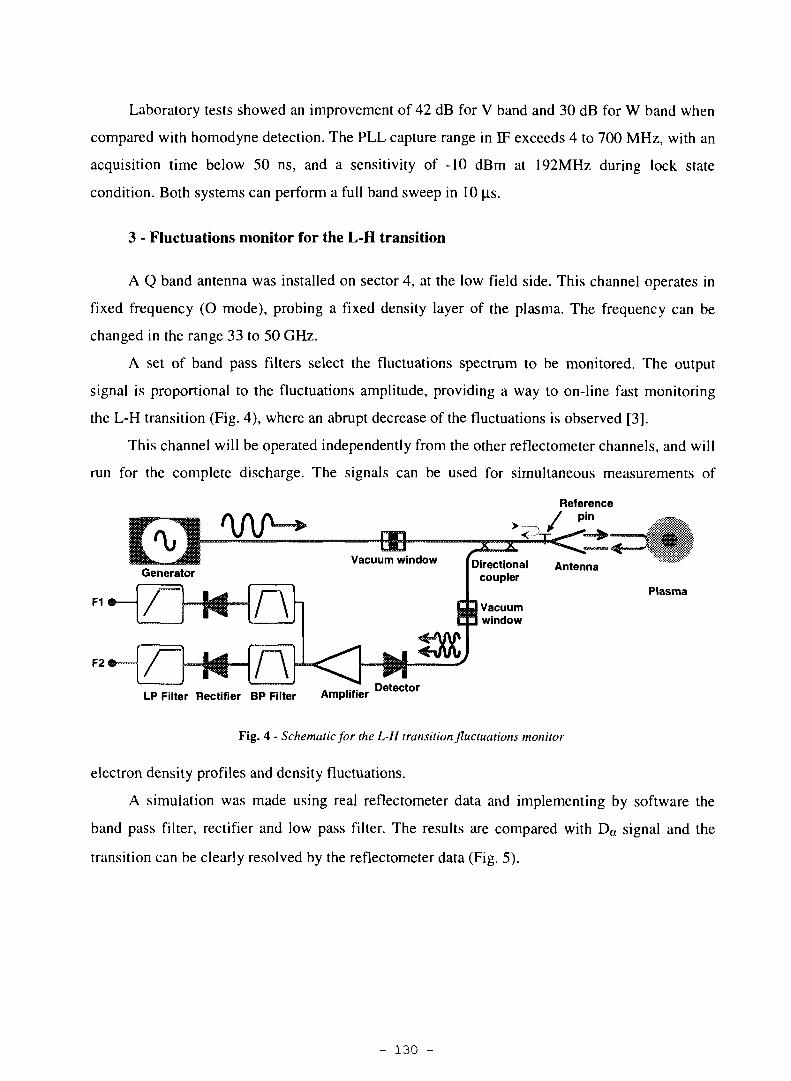
Laboratory tests showed an improvement of 42 dB for V band and 30 dB for W band when
compared with homodyne detection. The PLL capture range in IF exceeds 4 to 700 MHz, with an
acquisition time below 50 ns, and a sensitivity of -10 dBm at 192MHz during lock state
condition. Both systems can perform a full band sweep in 10 p.s.
3 - Fluctuations monitor for the L-H transition
A Q band antenna was installed on sector 4, at the low field side. This channel operates in
fixed frequency (O mode), probing a fixed density layer of the plasma. The frequency can be
changed in the range 33 to 50 GHz.
A set of band pass filters select the fluctuations spectrum to be monitored. The output
signal is proportional to the fluctuations amplitude, providing a way to on-line fast monitoring
the L-H transition (Fig. 4), where an abrupt decrease of the fluctuations is observed [3].
This channel will be operated independently from the other reflectometer channels, and will
run for the complete discharge. The signals can be used for simultaneous measurements of
Reference
F1Plasma
LP Filter Rectifier BP Filter AmplifierDetector
Fig. 4 - Schematic for the L-H transition fluctuations monitor
electron density profiles and density fluctuations.
A simulation was made using real reflectometer data and implementing by software the
band pass filter, rectifier and low pass filter. The results are compared with Da signal and the
transition can be clearly resolved by the reflectometer data (Fig. 5).
- 130 -
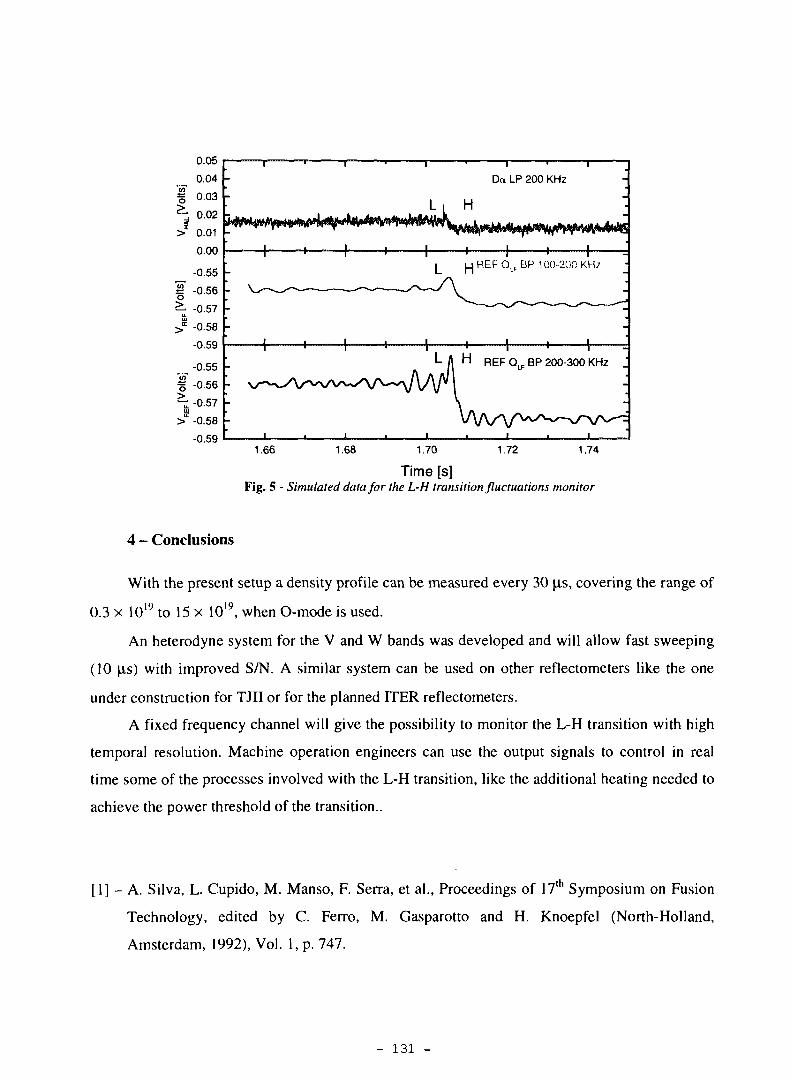
0.05
„ 0.04
I 0.03^ 0.02
>x 0.01
0.00
„ "°-55
Î -0.56^ -0.57
>S -0.58
-0.59
_, -0.55
% -0.56
^ -0.57UJ
> -0.58
-0.59
Da LP 200 KHz
^ ^ I M H
4—+• + -{ H — +L H
-+•REFQ.BP 100-200 KHz
REF QLF BP 200-300 KHz
1.66 1.68 1.70 1.72 1.74
Time [s]Fig. 5 - Simulated data for the L-H transition fluctuations monitor
4 - Conclusions
With the present setup a density profile can be measured every 30 |is, covering the range of
0.3 x 10¹⁹ to 15 x 1019, when O-mode is used.
An heterodyne system for the V and W bands was developed and will allow fast sweeping
(10 |is) with improved S/N. A similar system can be used on other reflectometers like the one
under construction for TJII or for the planned ITER reflectometers.
A fixed frequency channel will give the possibility to monitor the L-H transition with high
temporal resolution. Machine operation engineers can use the output signals to control in real
time some of the processes involved with the L-H transition, like the additional heating needed to
achieve the power threshold of the transition..
7th[1] - A. Silva, L. Cupido, M. Manso, F. Serra, et al., Proceedings of 17 Symposium on Fusion
Technology, edited by C. Ferro, M. Gasparotto and H. Knoepfel (North-Holland,
Amsterdam, 1992), Vol. 1, p. 747.
- 131 -

[2] - A. Silva, M. E. Manso, L. Cupido, M. Albrecht, F. Serra, P. Varela, et al., Rev. Sci.
Instruments 67, 4138 (1996).
[3] - Recent results, this Workshop.
- 132 -
A Novel Fast Frequency Modulation Scheme for theJET Multi-channel Reflectometer
N Deliyanakis
JET Joint Undertaking, Abingdon, Oxon, 0X14 3EA, UK
1. INTRODUCTION
Several different modulation schemes are employed in reflectometer systems to determinethe group delay time required for density profile measurements (Laviron et al, 1996).The JET multi-channel reflectometer uses slow, narrow-band sweeps of the microwavefrequency in each of the channels (Sips and Kramer, 1993). 10 channels of the originalsystem are currently in operation, spanning the range from 18 to 70GHz, in the O-mode. Three problems are associated with this approach: First, the frequency sweepis slow (6ms) in comparison to the time-scale of most plasma fluctuations, whetherturbulent or coherent. Second, the corresponding phase change is measured by fringecounters which rely on the signals being continuously present during the sweep. Third,the exact frequency excursion depends on the characteristics of the microwave sources.These circumstances result in frequent loss of profile information, or in relatively largeerrors in the position of the density profiles, as well as errors in their shape, thoughthe latter are partially corrected by making use of the phase evolution during the fixed-frequency intervals between sweeps. These limitations are significant in measurementsof edge density gradients and densities, both important in the study of high-confinement(H-mode) plasmas in JET (Deliyanakis et al, 1994). On the other hand, the presentsystem can perform simultaneous measurements of density fluctuations at 10 radialpositions: such measurements were crucial in identifying the so-called outer modes,external kink modes limiting the performance of H-mode plasmas (Smeulders et al,1995). The present system is also able to function in conjunction with the long waveguideruns needed at JET.
To eliminate the problems discussed above and improve the general performanceof this diagnostic, whilst retaining the advantageous aspects of the present system,a novel scheme relying on fast frequency modulation has been designed and is beingimplemented. This paper discusses the underlying theory and technical aspects of thisnovel system. These will be illustrated with examples of preliminary measurements.
- 133 -
2. Theory
In the fast-frequency modulation (FFM) scheme.f the microwave sources are frequency-modulated by a stable oscillator at 65MHz. The time dependence of the wave launchedby each source is given by
S{t) = Acos{2irfct + msin2nfmt), (1)
where /',• is the carrier frequency and /n l is the modulation frequency-, and m isthe modulation index. The modulation bandwidth is comparable to the modulationfrequency, that is, the modulation index is small. It should be noted that this schemeis similar, in terms of the launched microwave spectrum, to amplitude modulation ordifferential-phase schemes, but is simpler to implement technically as it does not involveany modifications to the microwave components of the existing system. In the presentscheme, the bandwidth of the launched microwave power is limited by the IF bandwidth.In general, however, one can increase this bandwidth for an FM system, by increasingthe modulation index for a fixed modulation frequency. Some models (Vayakis, 1995)suggest that the robustness of the measured group delay against density fluctuations isenhanced when the bandwidth exceeds the correlation bandwidth of the fluctuations.
The modulation frequency has been chosen to be much higher than the plasmafluctuation frequencies (typically up to 1MHz), but low enough to eliminate phaseambiguity (the largest displacement within the JET cross-section is approximately2m. corresponding to an optical path change of 4m, whereas the wavelength of themodulating signal is 4.6m). The phase measurement is now performed at the modulationfrequency, which depends on the stable oscillator and not on the microwave sources. Thegroup delay time is given by
rG = ^ - (2)
within one period of the modulating signal, for a phase $m between 0 and 2TT. Becausethere is no phase ambiguity, a measured phase corresponds to a single value for thegroup delay time, and such a measurement can in effect be performed instantaneously.A spatial resolution of lem in vacuum entails a phase resolution (and stability of thecorresponding group delay time in the instrumentation) of 1.6°.
3. Technical aspects
To measure the group delay time, the received microwave signal is down-converted toan intermediate frequency (IF) of approximately 300MHz, using the heterodyne receiver
J many authors of reHectometry articles use the term frequency modulation to refer to frequencysweeping: in this paper, this term is used in the sense usual in communications
- 134 -
of the exisiting system; the modulating signal is recovered from the limited IF signalusing a frequency discriminator; and its phase, relative to the reference signal from themaster oscillator, is measured using an IQ demodulator.
Shown in figure 1 are the microwave components and electronic instrumentation forone of the 10 channels of the reflectometer. Both transmitter and local oscillator arevaractor-tuned Gunn oscillators. A single oscillator at 65MHz and indidual. variable-gain amplifiers are used to modulate the transmitter oscillators. The local oscillatoroperates at a fixed frequency and the need for a phase-lock loop is obviated. Should thetransmitter or local oscillator sources drift in frequency, the resulting drift in frequencyof the IF signal would not affect the phase measurement at the modulation frequency;nevertheless, a slow compensating circuit (not shown) has been included to maintain aconstant intermediate frequency. The IF signal from the heterodyne receiver is limitedin power, by means of a feed-forward gain control loop. This uses a Schottky powerdetector controlling a PIN-diode attenuator, and has its bandwidth limited to 1MHz.this being sufficient to eliminate power variations in the IF signal due to the plasma.This arrangement is preferable to a limiting amplifier, because of its linearity and groupdelay stability (phase variations in the IF signal are of course unimportant). Followingthis section, is a frequency discriminator which recovers the modulating signal by mixingthe incoming modulated signal with a delayed version of itself (the delay is such that thecarrier is eliminated or considerably attenuated). Finally, an IQ (in-phase/quadrature)demodulator is used to extract the phase information from the recovered modulatingsignal centred at 65MHz. The 65MHz signal from the master oscillator is used asreference; if the oscillator is stable, there is no need for a delay line. The two videosignals produced by the IQ demodulator are digitized, at 5kHz and 250kHz, and areused for the calculation of the group delay. The group delays from the 10 channelsare then used in an Abel inversion procedure to obtain the density profile. Naturally,certain assumptions have to be made about the variation of the group delay betweensuccessive channels, and also below the lowest density that is probed.
Also shown in figure 1, is a secondary circuit which generates a homodyne signal,by mixing the IF signal originating in the plasma with a corresponding signal fromthe reference waveguide of the existing system. This homodyne signal, which clearlyresponds to the phase and amplitude of the microwave carrier, is used for densityfluctuation measurements.
The frequency discriminator and IQ demodulator have both been specificallydeveloped for this application, the main design object being to optimize the groupdelay stability of the discriminator and the phase resolution of the IQ demodulator.The latter has been optimized by careful design of the video amplifiers, and by biasingthe 90° hvbrid and the two mixers of the circuit.
- 135 -
4. Simulations
The modulation system described above has been simulated by a code which models,in the time domain, both coherent and turbulent fluctuations in the plasma, and theimperfect electronic components of the modulation and detection circuits. Shown infigures 2 and 3. are the power and phase spectra of the detected modulating signalgenerated, respectively, in the absence of plasma, and from a plasma with coherentfluctuations, resulting in fluctuations in both the phase and amplitude of the reflectedsignal. Shown in figure 4, are the temporal variations of the group delay, obtainedfrom the phase of the detected signal, and of the power of the latter. It is clearthat, despite the artificially introduced imperfections, the position and movement ofthe plasma, reflection layer can be accurately reconstructed. Shown in figure 5, is theeffect of a spurious reflection (10% of the incident power): such a spurious reflection canresult in a distortion of the movement of the reflection layer, and also manifests itselfin a modulation of the power of the detected signal.
5. Preliminary measurements
The hardware described above has been installed and commissioned satisfactorily, withthe exception of the discriminator circuits (these include the gain-control loop): thelatter have been developed but not delivered. Preliminary experiments were carried outusing a commercially obtained limiting amplifier in the place of the gain-control loop.Figure G shows the power spectra of the launched microwave and down-converted IFsignals for one of the channels of the system. Clear from these figures is the structure ofthe FM spectrum, with a carrier and only two sidebands (because of the low modulationindex). Figure 7 shows the recovered signals at the modulation frequency of 65MHz. inthe absence of plasma (reflection from the back wall of the vessel), and with plasma. Theeffect of plasma fluctuations in this signal is evident. It should be noted that, whilstthe power at the centre frequency is attenuated (by about 4.5dB). the peak remainssharp. Finally, figure 8 shows the equivalent vacuum displacement of the reflectionlayer as obtained from the measured phase of the recovered modulating signal, and thecorresponding movement of the plasma boundary (LCFS) as obtained from a magneticreconstruction code (XLOC). Whilst the measured phase clearly exhibits the movementof the plasma, the latter is grossly overestimated (by a factor of about 15). This seriousdifficulty has been attributed to the limiting amplifier used, and has led to the designof the gain-control loop described above. Two further solutions to this problem will beconsidered, should this approach fail. First, the limiting process may be eliminated;the simulation shows that good resolution in position can be obtained even in thepresence of large power variations. Second, amplitude modulation can be implemented
- 136 -
instead of frequency modulation, with relatively few changes to the existing system (PINmodulators would have to be included in the four microwave bands of the instrument).
References
Doliyanakis N et al 1994 The VH-mode at JET Plasma Phys. Control. Fusion 36 1159
Laviron C et al 1996 Reflectoinetry techniques for density profile measurements on fusion plasmasPlasma Phys. Control. FxLsion 38 9
Sips A C C and Kramer G J 1993 Analysis of reflectometry density profile measurements in JET Plasma
Phys. Control. Fusion 35 743Smoulders P et al 1995 Influence of MHD instabilities on JET high performance Controlled Fusion and
Plasma Physics, Proc. 22nd Eur. Conf. (Bournemouth, 1995) vol 19C IV-061Yayakis G 1995 A model of the effect of Plasma Turbulence on Time Delay Measurements by
Reflectometry JET Report JET-P(95)76
- 137 -
Figure captions
Figure 1. Schematic diagram of the microwave components (bold lines) and electronic
instrumentation of the fast frequency modulation (FFM) system, for one of the 10
channels of the JET reflectometer (KG3)
Figure 2. Power and phase spectra of recovered modulation signal at 65MHz. assimulated in the absence of plasma
Figure 3. Power and phase spectra of recovered modulation signal at 65MHz, assimulated for a plasma with coherent fluctuations at 2MHz
Figure 4. Temporal variation of group delay (in fringes) and power of recoveredmodulation signal, as determined by simulated IQ demodulation. The group delayis compared to the corresponding delay calculated directly from the position of thereflection layer. The mean position and movement are accurately reconstructed.
- 138 -
Figure 5. As figure 4. but with a spurious reflection of 10% of the launched power.The movement of the reflection layer is distorted, but. the mean position is not affected;the power of the detected signal is strongly modulated.
Figure 6. Power spectra of (a) launched microwave from channel 3, centred at29.0GHz; and (b) down-converted IF signal, centred at 316MHz. The two sidebandsarising from the frequency modulation are separated from the carrier by the modulatingfrequency of 65MHz. (The wider peaks in the microwave spectrum correspond tospurious mixing products.)
Figure 7. Power spectra of recovered modulating signal at G5MHz, obtained(a) without, plasma (back wall reflection), and (b) with plasma.
Figure 8. (a) Equivalent vacuum displacement of reflection layer corresponding tochannel 3 (29.0GHz), as obtained from the measured phase of the recovered modulatingsignal; (b) Corresponding movement of plasma boundary from magnetic data.
- 139 -
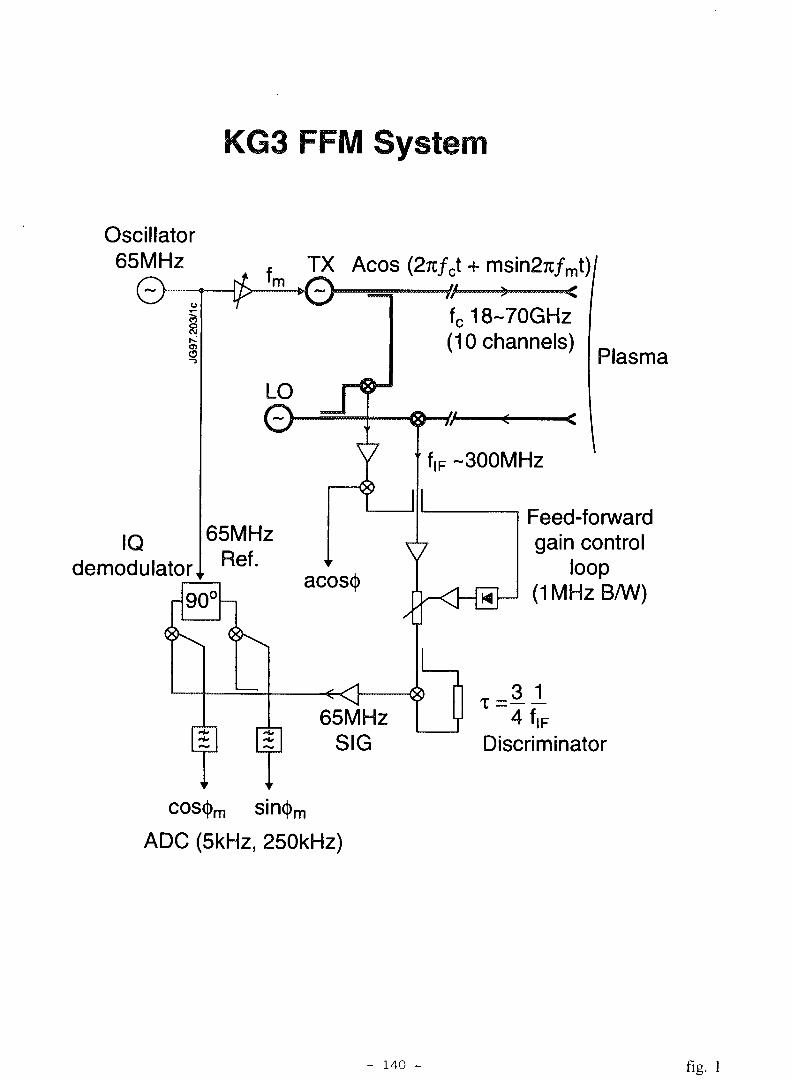
KG3 FFM System
Oscillator65MHz
G>
IQdemodulator
•mTX Acos (27c/ct + msin27c/mt)
0
LO
fc18~70GHz(10 channels)
65MHzRef.
f,F ~300MHz
Plasma
90cacoscj)
T T65MHz
SIG
cos(()m sin<()m
ADC (5kHz, 250kHz)
Feed-forwardgain control
loop(1 MHz B/W)
4f,FDiscriminator
- 140 - fig-
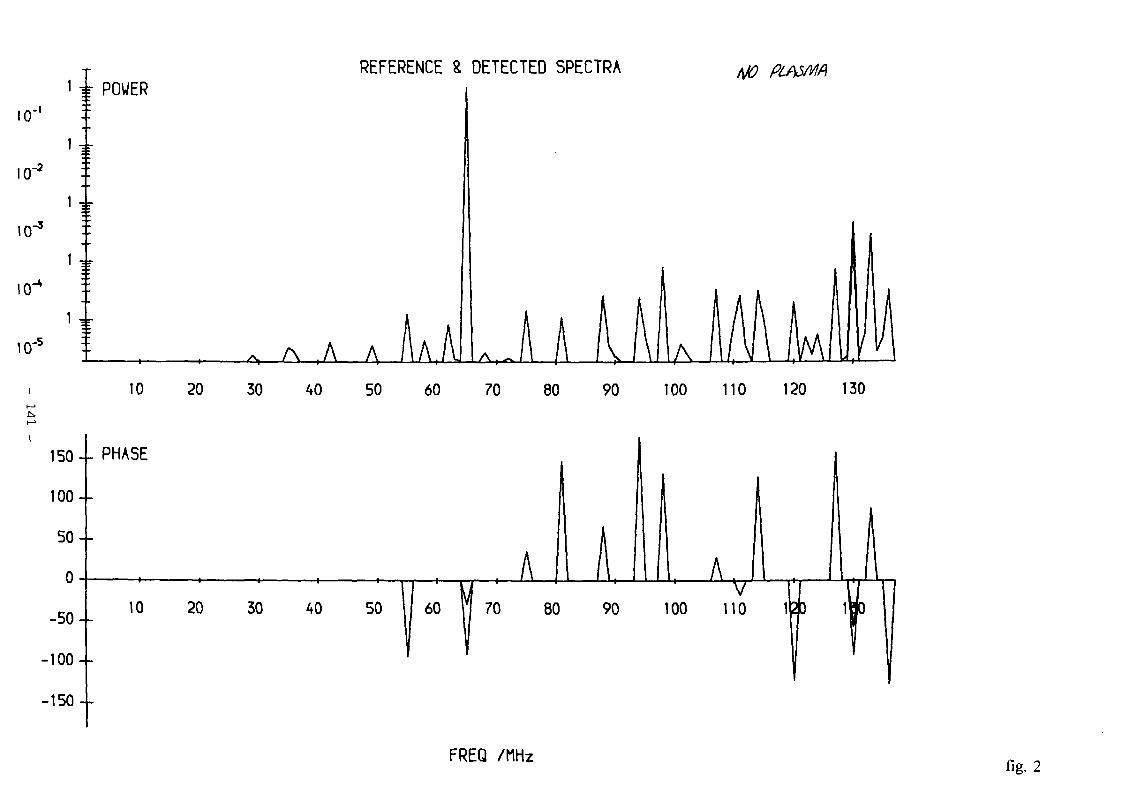
i POWER10
10"
10"
-I
10 -5
150 4- PHASE
100 4-
50 4-
0
-50
-100--
-150-
REFERENCE & DETECTED SPECTRA
TV... A A AAA
A A
FREQ /MHz
10 20 30 40 50 60 70 80 90 100 110 120 130
10 20 30 40 50 || 60 n 70 80 90 100 110 it
fig. 2
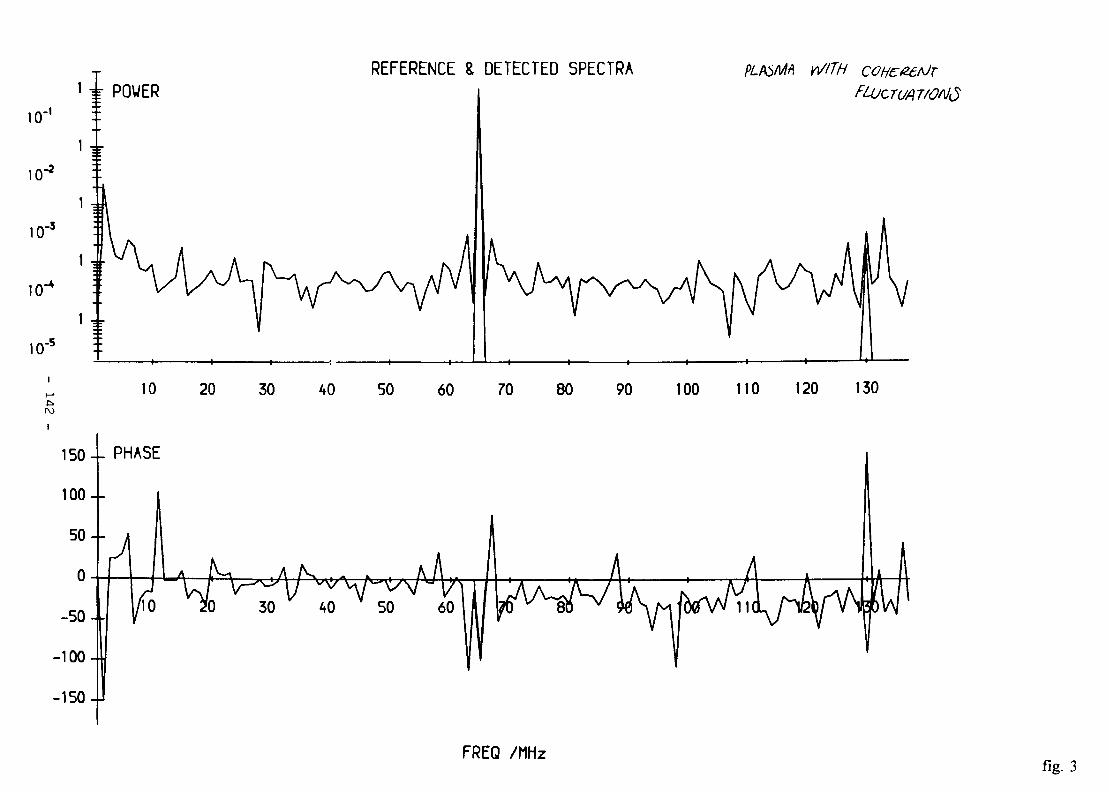
REFERENCE & DETECTED SPECTRA- POWER
10
10"
- i
1 , r
10
10"
-3
1 , r
FLUCTUATfONÔ
10 20 30 40 50 60 70 80 90 100 110 120 130
FREQ /MHzfig. 3
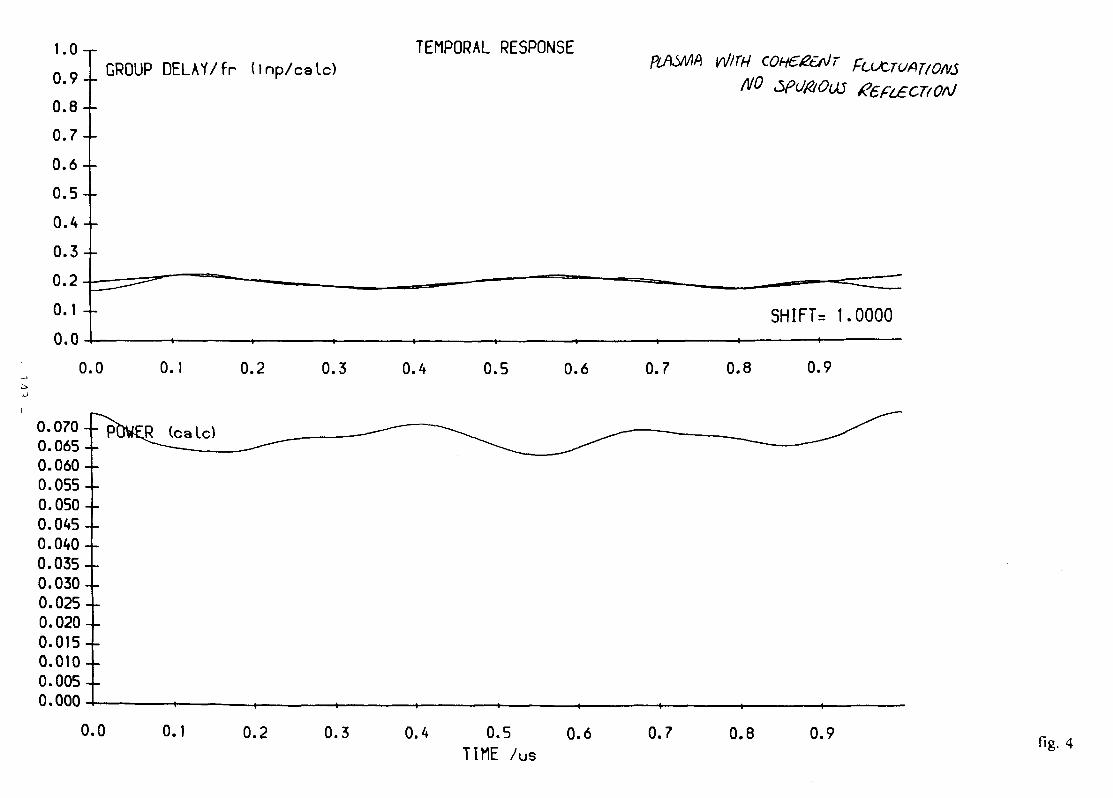
1.0-r
0.9
0.8
0.7
0.6
0.5
0.4
0.3
0.2
0.1 -
0.0-
0
TEMPORAL RESPONSEGROUP DELAY/fr (Inp/calc) CONÇUT
SHIFT= 1.0000
0 0. 0.2 0.3 0.4 0.5 0.6 0.7 0.8 0.9
0.0700.065 --0.060 --0.055 --0.050 --0.045 --0.040 --0.035 --0.030 --0.025--0.020--0.015 --0.010--0.005 --0.000 - -
0.0 0.1 0.2 0.3 0.4 0.5TIME /us
0.6 0.7 0.8 0.9fig. 4
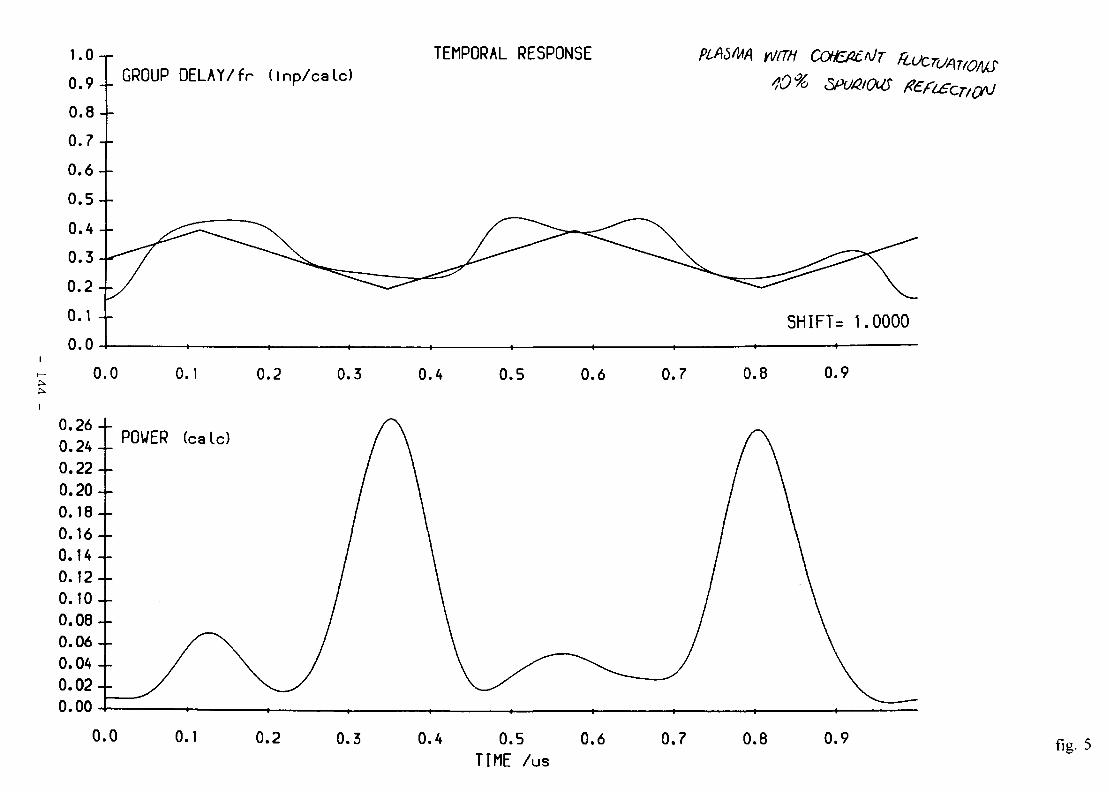
I .On
0 . 9 -
0 . 8 -
0 . 7 -
0 . 6 -
0 . 5 -
0 . 4 -
0 . 3 -
0 . 2 -
0.1 -
0 . 0 -
_ GROUP DELAY/fr ( Inp/ca lc)TEMPORAL RESPONSE PlAbfafK wm COHCfictiT fit
10 So SPU/&04S f?t
SHIFT= 1.0000
0.0 0.1 0.2 0.3 0.4 0.5 0.6 0.7 0.8 0.9
0.260.240.220.200.180.160.140.120.100.080.060.040.020.00
POWER (cale)
0.0 0.1 0.2 0.3 0.4 0.5TIME /us
0.6 0.7 0.8 0.9 fig-5
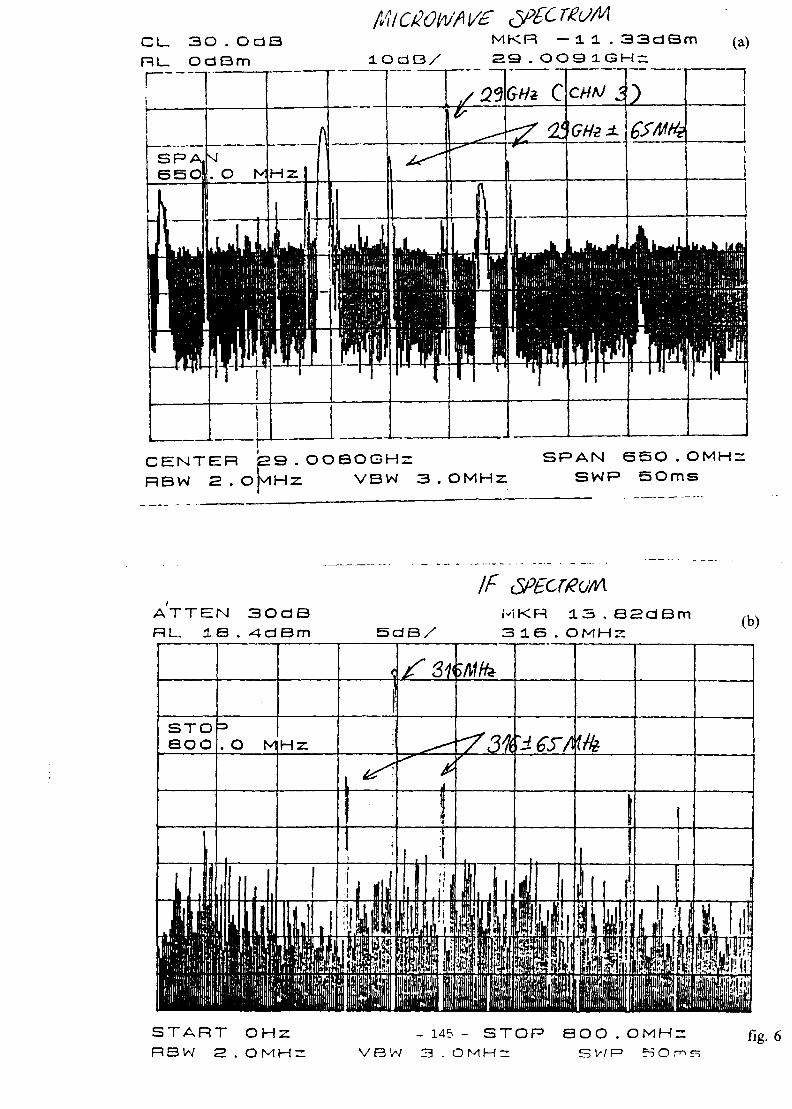
Cl_ 3O . OdBRl_ OdBm
MKR -11 .33dBmi o a B /
— i — —
/SIGH* C CHAJ 5
GHe±
1GSMfe
CENTER 29.OOBOGHzRBW 2.OMHZ V B W 3.OMHZ
SPAN S5O . OMH:SWP 5Oms
ATTEN 3OdBRL. 18.4dBm
IF
5dB/MKR 13 , B2clBm3 IS .
START OHZRBW S.OMHr:
-145- STOP 8OO.OMHVBW 3 . OMHr: SWP SO
flg. 6
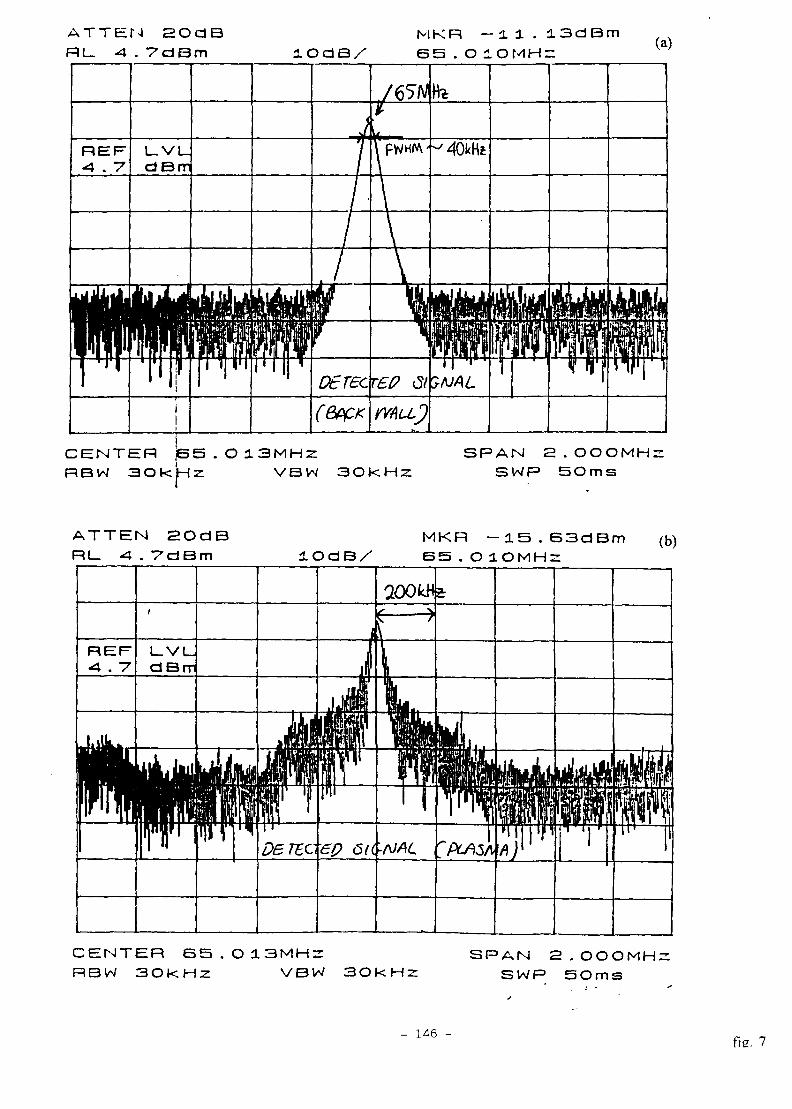
ATTEN 2OdBRL_ -4 . 7dBm l O d B /
MKR — l l , 1 3 d B m
6 5 . O lOMHrz(a)
CENTER P5.O13MHZRBW 3OkHz VBW 3OkH:
SPAN 2 . OOOMH:SWP SOms
ATTEN 2OdBRL A.7dBm lOdB/
MKR -15.63dBm (b)65.O1OMH2
REFA . "7
HHN[
Pi
L_Vt_dBm
iff!wmH
ijji
mw1 \Darec}ep OU
aoowi
I
i i-NAL
yK§y£TO?
. |L JjijjLjIjJ
1 r I'
CENTER 65.O13MH2RBW 3OkHz VBW 3OkHz
SPAN 2 . OOOMH.SWP 5Oms
- 146 -fie. 7
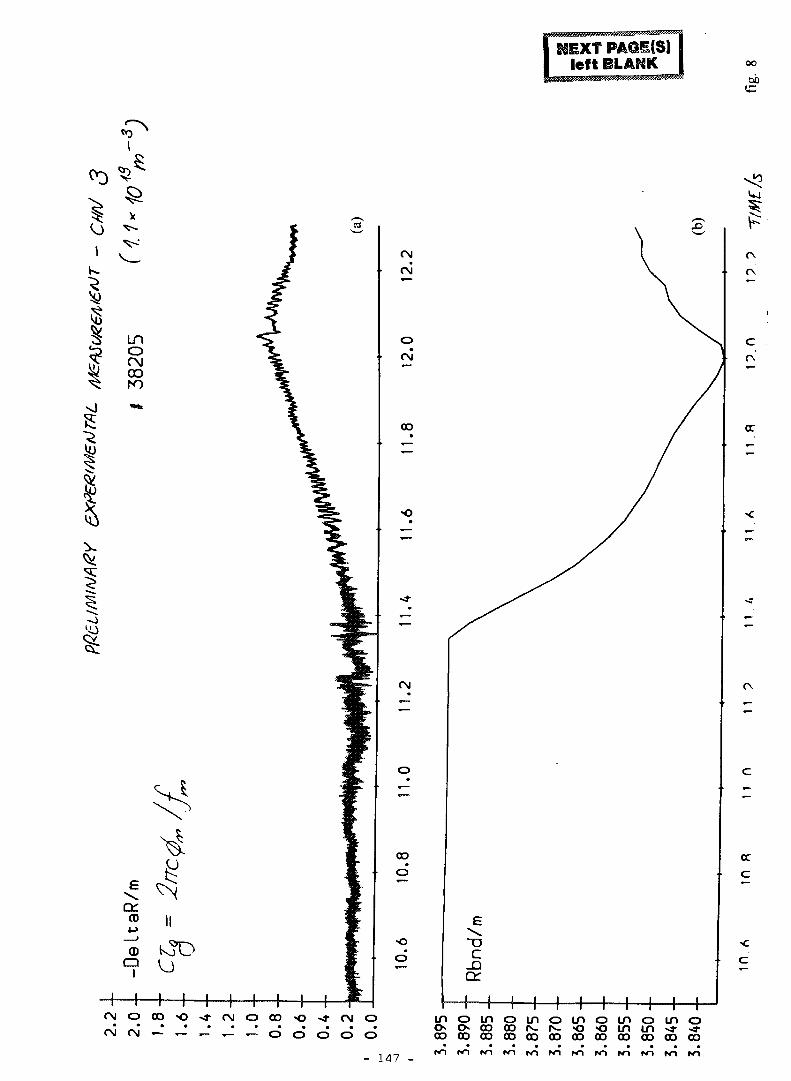
oo
ci)
*
I
IIs
1
mo(Moo
u
CO
CDQ
I
I I I I I I
c
GO
CM
00
o
-om
O
occ
C
ce
1 I I I I I I I I(M CM - r - ^- ^ — o o o o o
- 147
i n o m o i n o i n o i n o m oO O G O G O O O O O O O O O C O O O G O O O O O
Effects of Turbulence in Profile Reflectometry
J. Sanchez, T. Estrada, V. Zhuravlev, M. Frances, B. Branas, E. de la Luna
Asociacion Euratom-CIEMAT, 28040 Madrid Spain.
Abstract
Reflectometry for density profile measurements uses typically beams with several cm
diameter but mm probing wavelengths. The beam is reflected in a corrugated critical layer
with structures which have a typical wavelength of several cm. Under these conditions
(extended beam with short wavelength) WKB -2 dim ray tracing can give a good
description to the interference phenomena arising. This approach requires less computing
time than Full Wave 2-dim calculations and therefore it allows for a more comprehensive
analysis of the effect of the density fluctuations on the reflectometry signal, either in
fluctuations or profile studies.
The 2-dim WKB code [1] has been used to simulate the reflectometry signals in profile
measurements under turbulent conditions. The signal for a given reflectometry system
(AM, FM, Pulse) can be synthesized. Special attention has been paid to the effect of
rotating structures, which lead to phase runaway effects and can have a clear impact on
the profile measurements. Comparison between AM ( pulse radar behaves in a similar
way) and swept FM reflectometry is made for different rotation speeds and turbulence
levels.
IntroductionOne of the limiting factors in reflectometers when trying to measure the density profile in
fusion plasmas is the existence of a fraction of experiments where the measurement
becomes impossible: very noisy signals leading to nonsense density profiles. Those so
called "bad shots" are usually linked with strongly turbulent plasmas and the remaining
problem is to be able to assess "a priori" if the data coming from a given experiment will
correspond to a normal profile or if they will be meaningless.
The effect of turbulence in the reflectometer signal is twofold, temporal and spatial.
The temporal effect is seen in swept frequency systems which use consecutive
measurements to determine the time delay (9<j>/3f) function: the profile changes locally
during the measurement (false fringes in frequency swept homodyne systems). These
effects are usually overcome in the experiments by sweeping fast ( frequency sweep rate
in the order of 1 GHz/^ts have been achieved, leading to clean results).
- 149 -
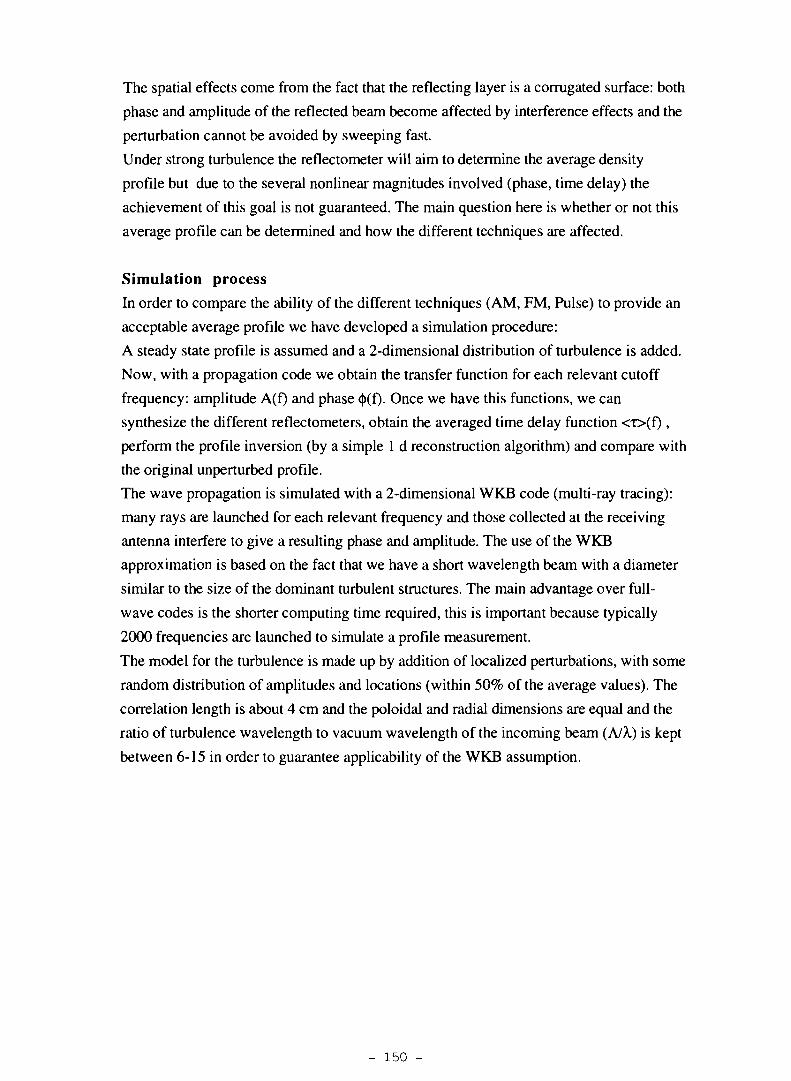
The spatial effects come from the fact that the reflecting layer is a corrugated surface: both
phase and amplitude of the reflected beam become affected by interference effects and the
perturbation cannot be avoided by sweeping fast.
Under strong turbulence the reflectometer will aim to determine the average density
profile but due to the several nonlinear magnitudes involved (phase, time delay) the
achievement of this goal is not guaranteed. The main question here is whether or not this
average profile can be determined and how the different techniques are affected.
Simulation processIn order to compare the ability of the different techniques (AM, FM, Pulse) to provide an
acceptable average profile we have developed a simulation procedure:
A steady state profile is assumed and a 2-dimensional distribution of turbulence is added.
Now, with a propagation code we obtain the transfer function for each relevant cutoff
frequency: amplitude A(f) and phase <j)(f)- Once we have this functions, we can
synthesize the different reflectometers, obtain the averaged time delay function <x>(f),
perform the profile inversion (by a simple 1 d reconstruction algorithm) and compare with
the original unperturbed profile.
The wave propagation is simulated with a 2-dimensional WKB code (multi-ray tracing):
many rays are launched for each relevant frequency and those collected at the receiving
antenna interfere to give a resulting phase and amplitude. The use of the WKB
approximation is based on the fact that we have a short wavelength beam with a diameter
similar to the size of the dominant turbulent structures. The main advantage over full-
wave codes is the shorter computing time required, this is important because typically
2000 frequencies are launched to simulate a profile measurement.
The model for the turbulence is made up by addition of localized perturbations, with some
random distribution of amplitudes and locations (within 50% of the average values). The
correlation length is about 4 cm and the poloidal and radial dimensions are equal and the
ratio of turbulence wavelength to vacuum wavelength of the incoming beam (A/A,) is kept
between 6-15 in order to guarantee applicability of the WKB assumption.
- 150 -
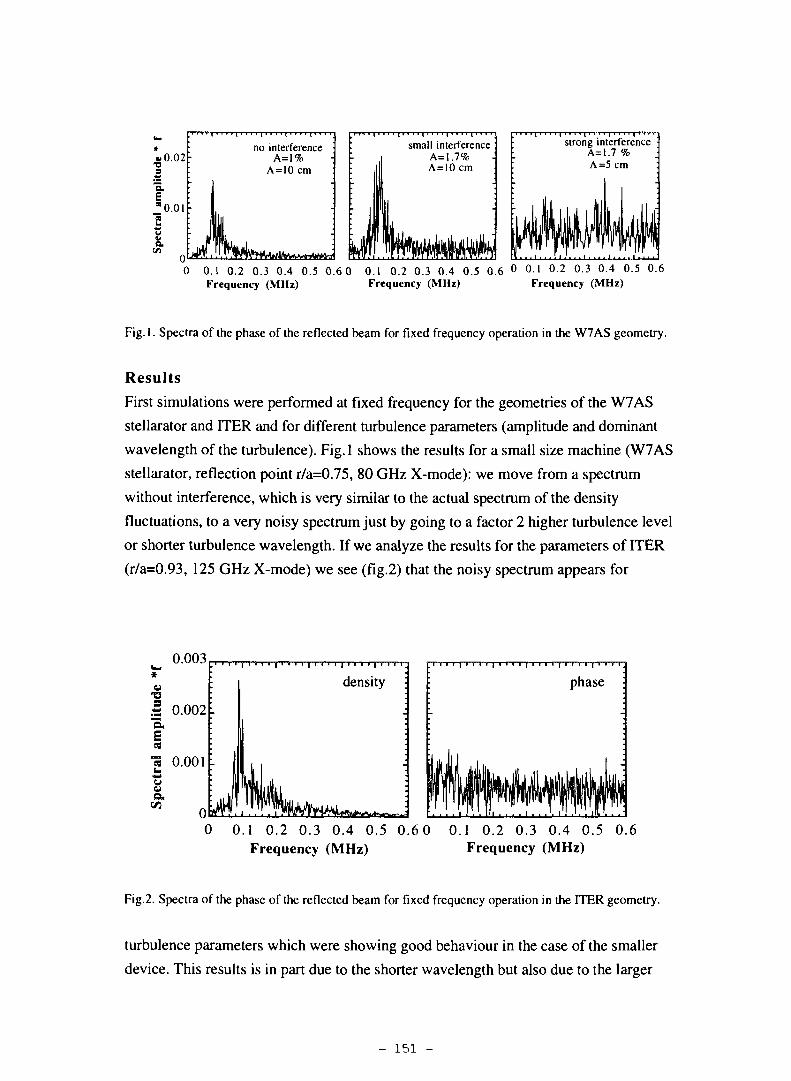
>0.02•os
a.
^0.01
a
no interferenceA=l%
A = 10cm
small interferenceA=1.7%A = 10 cm
strong interferenceA=1.7 %A =5 cm
0.1 0.2 0.3 0.4 0.5 0.6 0Frequency (MHz)
0.1 0.2 0.3 0.4 0.5 0.6Frequency (MHz)
Ol ° 2 °-3 ° - 4 °-5 °-6Frequency (MHz)
Fig.l. Spectra of the phase of the reflected beam for fixed frequency operation in the W7AS geometry.
ResultsFirst simulations were performed at fixed frequency for the geometries of the W7AS
stellarator and ITER and for different turbulence parameters (amplitude and dominant
wavelength of the turbulence). Fig. 1 shows the results for a small size machine (W7AS
stellarator, reflection point r/a=0.75, 80 GHz X-mode): we move from a spectrum
without interference, which is very similar to the actual spectrum of the density
fluctuations, to a very noisy spectrum just by going to a factor 2 higher turbulence level
or shorter turbulence wavelength. If we analyze the results for the parameters of ITER
(r/a=0.93, 125 GHz X-mode) we see (fig.2) that the noisy spectrum appears for
0.003
<u
5 0.002 L"s,Esa
1 o.ooi"5a
0 0.1 0.2 0.3 0.4 0.5 0 . 6 0 0.1 0.2 0.3 0.4 0.5 0.6Frequency (MHz) Frequency (MHz)
Fig.2. Spectra of the phase of the reflected beam for fixed frequency operation in the ITER geometry.
turbulence parameters which were showing good behaviour in the case of the smaller
device. This results is in part due to the shorter wavelength but also due to the larger
- 151 -
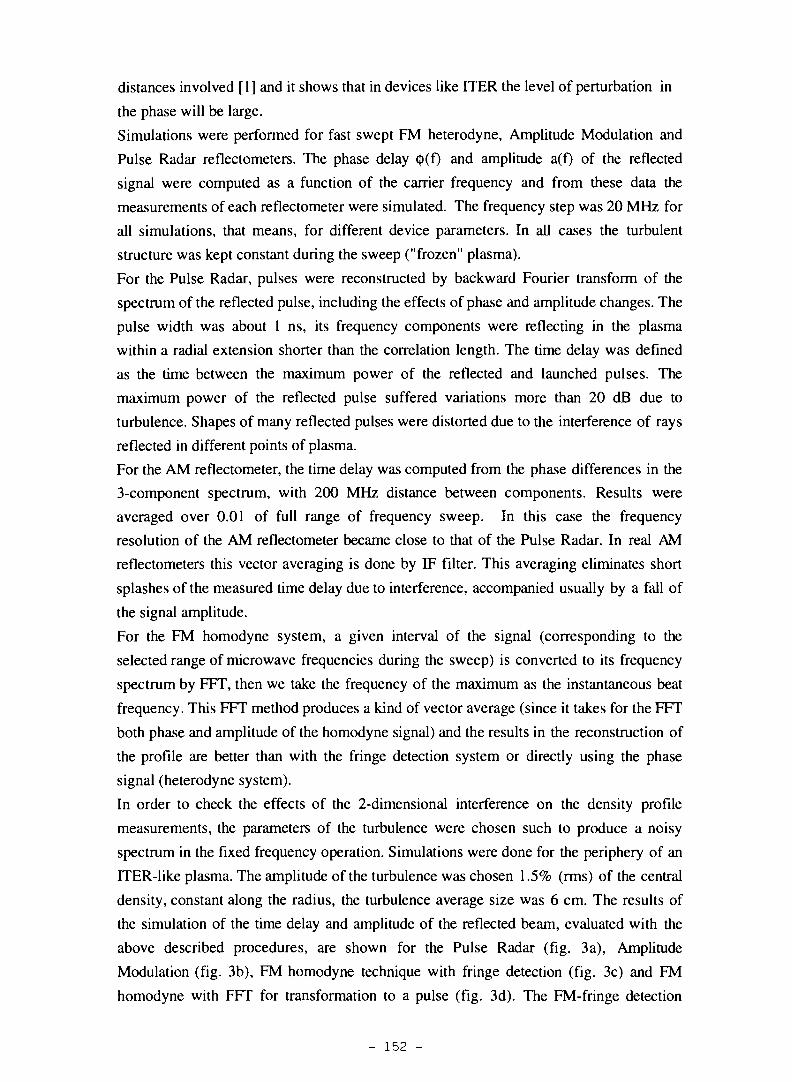
distances involved [1] and it shows that in devices like ITER the level of perturbation in
the phase will be large.
Simulations were performed for fast swept FM heterodyne, Amplitude Modulation and
Pulse Radar reflectometers. The phase delay 0(0 and amplitude a(f) of the reflected
signal were computed as a function of the carrier frequency and from these data the
measurements of each reflectometer were simulated. The frequency step was 20 MHz for
all simulations, that means, for different device parameters. In all cases the turbulent
structure was kept constant during the sweep ("frozen" plasma).
For the Pulse Radar, pulses were reconstructed by backward Fourier transform of the
spectrum of the reflected pulse, including the effects of phase and amplitude changes. The
pulse width was about 1 ns, its frequency components were reflecting in the plasma
within a radial extension shorter than the correlation length. The time delay was defined
as the time between the maximum power of the reflected and launched pulses. The
maximum power of the reflected pulse suffered variations more than 20 dB due to
turbulence. Shapes of many reflected pulses were distorted due to the interference of rays
reflected in different points of plasma.
For the AM reflectometer, the time delay was computed from the phase differences in the
3-component spectrum, with 200 MHz distance between components. Results were
averaged over 0.01 of full range of frequency sweep. In this case the frequency
resolution of the AM reflectometer became close to that of the Pulse Radar. In real AM
reflectometers this vector averaging is done by IF filter. This averaging eliminates short
splashes of the measured time delay due to interference, accompanied usually by a fall of
the signal amplitude.
For the FM homodyne system, a given interval of the signal (corresponding to the
selected range of microwave frequencies during the sweep) is converted to its frequency
spectrum by FFT, then we take the frequency of the maximum as the instantaneous beat
frequency. This FFT method produces a kind of vector average (since it takes for the FFT
both phase and amplitude of the homodyne signal) and the results in the reconstruction of
the profile are better than with the fringe detection system or directly using the phase
signal (heterodyne system).
In order to check the effects of the 2-dimensional interference on the density profile
measurements, the parameters of the turbulence were chosen such to produce a noisy
spectrum in the fixed frequency operation. Simulations were done for the periphery of an
ITER-like plasma. The amplitude of the turbulence was chosen 1.5% (rms) of the central
density, constant along the radius, the turbulence average size was 6 cm. The results of
the simulation of the time delay and amplitude of the reflected beam, evaluated with the
above described procedures, are shown for the Pulse Radar (fig. 3a), Amplitude
Modulation (fig. 3b), FM homodyne technique with fringe detection (fig. 3c) and FM
homodyne with FFT for transformation to a pulse (fig. 3d). The FM-fringe detection
- 152 -
simulation has been shown without smoothing. Turbulence causes strong, more than 20
dB, modulation of power of reflected signal of AM reflectometer and pulse radar, for the
FM homodyne system the amplitude oscillations during the sweep were smaller. The
corresponding density profile reconstruction is shown on fig. 4 As we can observe, the
30
105 115 125 135 145 155Frequency (GHz)
Fig.3. Simulated time delay and amplitude of the reflected beam for the different techniques: pulse (a),
AM (b), FM-fringe detection (c), FM-FFT (d)
FM homodyne system with fringe detection (presently used very seldom in the
experiments) leads to accumulated errors and produces an unacceptable density profile.
On the other hand, Pulse Radar as well as AM and FM (FFT technique) are able to
produce a good approach to the original unperturbed profile, which is an encouraging
result towards the operation of reflectometers in large devices under turbulence.
- 153 -
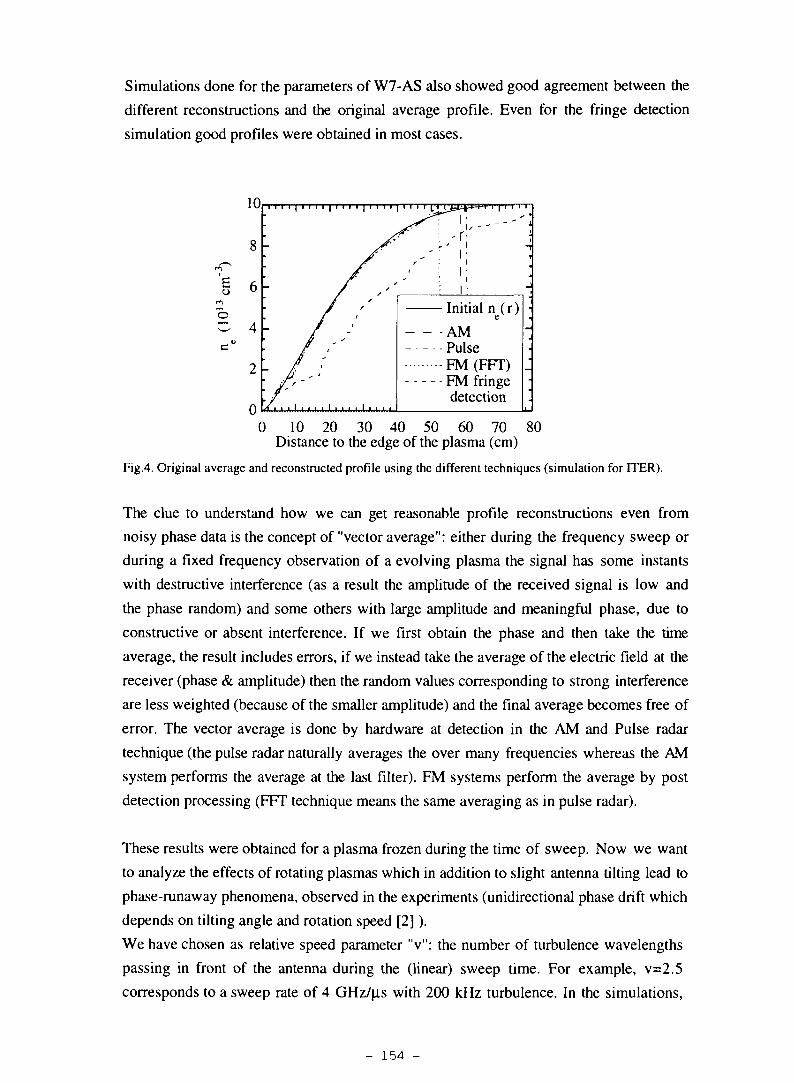
Simulations done for the parameters of W7-AS also showed good agreement between the
different reconstructions and the original average profile. Even for the fringe detection
simulation good profiles were obtained in most cases.
I
1 1 • 1 1 • I 1 1 1 1 • 1 I 1 1 1 1 1
/
11;
1-
- Initial n (r)
AMPulse
- FM (FFT)FM fringedetection
-I
-
8 -
6 -
4 -
2 -
00 10 20 30 40 50 60 70 80
Distance to the edge of the plasma (cm)
Fig.4. Original average and reconstructed profile using the different techniques (simulation for HER).
The clue to understand how we can get reasonable profile reconstructions even from
noisy phase data is the concept of "vector average": either during the frequency sweep or
during a fixed frequency observation of a evolving plasma the signal has some instants
with destructive interference (as a result the amplitude of the received signal is low and
the phase random) and some others with large amplitude and meaningful phase, due to
constructive or absent interference. If we first obtain the phase and then take the time
average, the result includes errors, if we instead take the average of the electric field at the
receiver (phase & amplitude) then the random values corresponding to strong interference
are less weighted (because of the smaller amplitude) and the final average becomes free of
error. The vector average is done by hardware at detection in the AM and Pulse radar
technique (the pulse radar naturally averages the over many frequencies whereas the AM
system performs the average at the last filter). FM systems perform the average by post
detection processing (FFT technique means the same averaging as in pulse radar).
These results were obtained for a plasma frozen during the time of sweep. Now we want
to analyze the effects of rotating plasmas which in addition to slight antenna tilting lead to
phase-runaway phenomena, observed in the experiments (unidirectional phase drift which
depends on tilting angle and rotation speed [2] ).
We have chosen as relative speed parameter "v": the number of turbulence wavelengths
passing in front of the antenna during the (linear) sweep time. For example, v=2.5
corresponds to a sweep rate of 4 GHz/|is with 200 kHz turbulence. In the simulations,
- 154 -
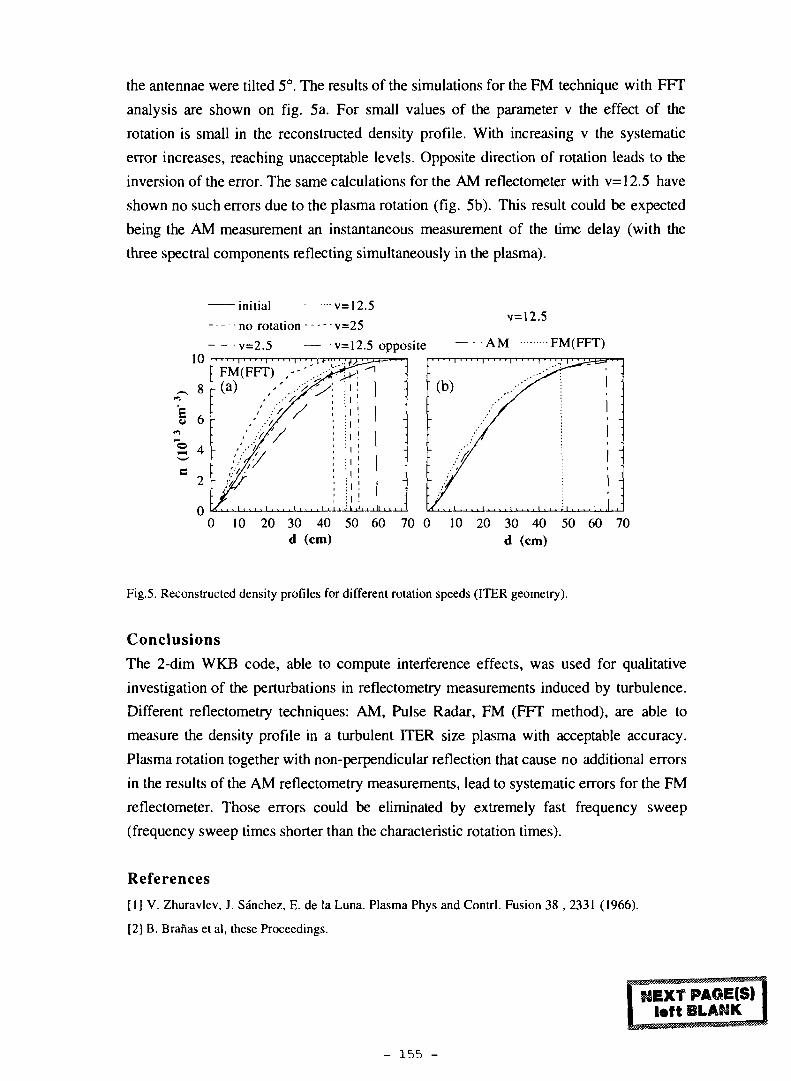
the antennae were tilted 5°. The results of the simulations for the FM technique with FFT
analysis are shown on fig. 5a. For small values of the parameter v the effect of the
rotation is small in the reconstructed density profile. With increasing v the systematic
error increases, reaching unacceptable levels. Opposite direction of rotation leads to the
inversion of the error. The same calculations for the AM reflectometer with v=12.5 have
shown no such errors due to the plasma rotation (fig. 5b). This result could be expected
being the AM measurement an instantaneous measurement of the time delay (with the
three spectral components reflecting simultaneously in the plasma).
10
I 6
E 4
2
initial
no rotation
v=2.5
FM(FFT)-(a)
•v=12 .5
• v = 2 5
v=12.5 opposite
v=12.5
AM FM(FFT)
0 10 20 30 40 50 60d (cm)
70 0 10 20 30 40 50 60 70d (cm)
Fig.5. Reconstructed density profiles for different rotation speeds (ITER geometry).
ConclusionsThe 2-dim WKB code, able to compute interference effects, was used for qualitative
investigation of the perturbations in reflectometry measurements induced by turbulence.
Different reflectometry techniques: AM, Pulse Radar, FM (FFT method), are able to
measure the density profile in a turbulent ITER size plasma with acceptable accuracy.
Plasma rotation together with non-perpendicular reflection that cause no additional errors
in the results of the AM reflectometry measurements, lead to systematic errors for the FM
reflectometer. Those errors could be eliminated by extremely fast frequency sweep
(frequency sweep times shorter than the characteristic rotation times).
References
[1] V. Zhuravlev, J. Sanchez, E. de la Luna. Plasma Phys and Contrl. Fusion 38 , 2331 (1966).
[2] B. Branas et al, these Proceedings.
- 155 -

3rd Workshop on Microwave Reflectometry for Fusion Plasma Diagnostics, Madrid, May 5th - 7th 1997
The challenge of reflectometry on ITER
G.Vayakis and the ITER JCT and Home Teams*ITER JCT, San Diego JWS, 11025 N. Torrey
Pines Rd., La Jolla, CA92037, U.S.A.
Abstract In present day devices, reflectometry has evolved into a useful plasma diagnostic, both for the
measurement of profiles and for the measurement of transient events and fluctuations. Reflectometry is in
principle a reactor friendly diagnostic, and as such is counted on to provide a wide range of measurements
for ITER. The first part of this paper is a short summary of the role that reflectometry is expected to play
on ITER, and the constraints imposed by a reactor grade device on the implementation of the system
designs. A brief report of the status of each system is given, with emphasis on the progress in the
optimisation process which balances the desired system functions and performance with the realities of
incorporating the corresponding front end into the machine. Despite the difficulties, it appears that the
ITER measurement requirements can be met.
1. Introduction
Reflectometry has evolved into a useful plasma diagnostic, both for the measurement of profiles and for themeasurement of transient events and fluctuations. Reflectometry is also relatively "reactor friendly": Itneeds, in principle, comparatively small penetrations through the first wall and neutron shield, and thesignal can be routed in complex paths to minimise neutron streaming. In addition, the front end requireslittle or no maintenance, because it is resistant to damage from the plasma, and essentially immune toneutron irradiation effects. For these reasons it is planned to deploy a substantial number of reflectometrysystems on ITER.
Nevertheless there are significant problems to overcome: access to the plasma through the plasmafacing components, access to the front end for installation and maintenance, calibration to provide immunityto machine movements during the long pulses planned, long transmission lines and relatively ambitiousfrequency ranges. Although it is fair to state that most of these problems have to be dealt with on presentgeneration tokamaks, ITER presents an unusual challenge in that the problems occur simultaneously. Inparticular, the access to the plasma is restricted to an unusual degree, due to the stringent thermal andmechanical requirements on the first wall and neutron shield structures.
The paper outline is as follows: in section 2 we examine the measurement role of reflectometry in theITER diagnostic system. In section 3 we outline the implementation constraints that apply to all the ITERreflectometry systems. Sections 4, 5, and 6 contain a summary of the present state of the design of thesystems, with an emphasis on the relation between the system functions and the front end distribution foreach system and the solutions adopted to the problems outlined above. Finally, section 7 draws someconclusions and outlines future work on the systems.
* Special acknowledgements to D. Wagner, L. deKock, A. Costley, T. Ando, E. Martin, C. Lippert and to the membersof the Reflectometry Working Group: N. Bretz , E. Doyle, V. A. Vershkov. A.J.H. Donné, J. Irby, M.E. Manso, A.Mase, J Sanchez, V.F. Shevchenko, and C.I. Walker.
- 157 -
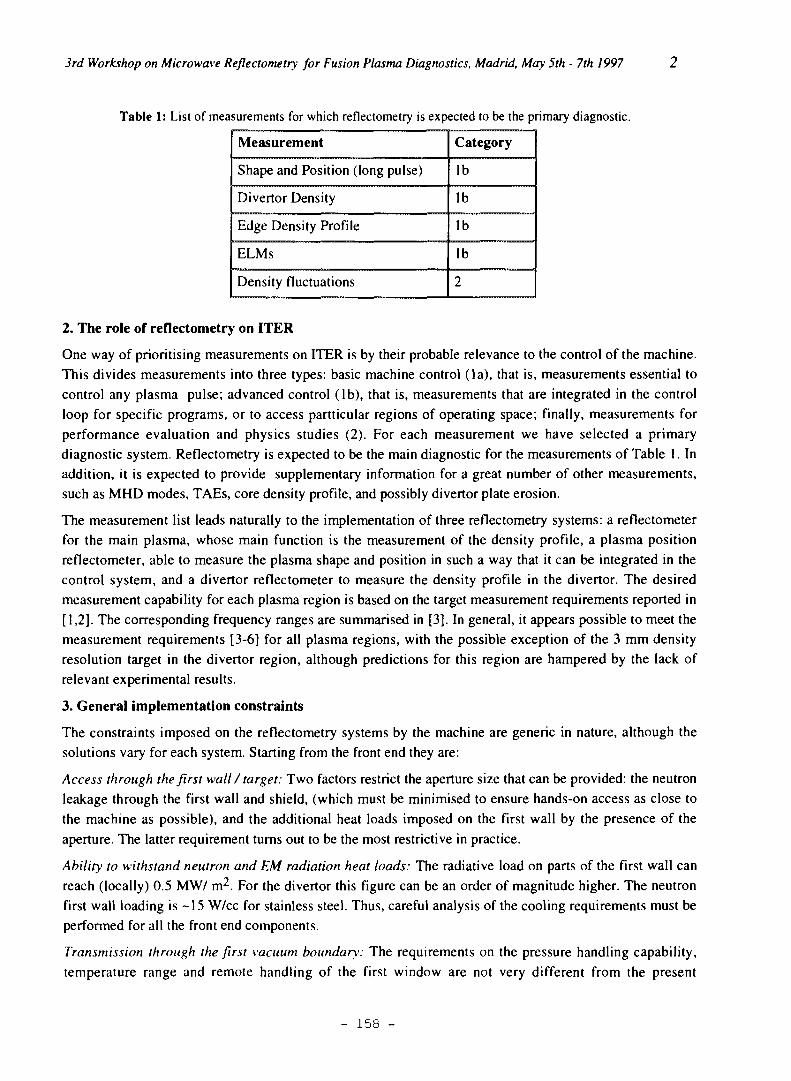
3rd Workshop on Microwave Reflectometry for Fusion Plasma Diagnostics, Madrid, May 5th - 7th 1997
Table 1: List of measurements for which reflectometry is expected to be the primary diagnostic.
Measurement
Shape and Position (long pulse)
Divertor Density
Edge Density Profile
ELMs
Density fluctuations
Category
lb
lb
lb
lb
2
2. The role of reflectometry on ITER
One way of prioritising measurements on ITER is by their probable relevance to the control of the machine.This divides measurements into three types: basic machine control (la), that is, measurements essential tocontrol any plasma pulse; advanced control (lb), that is, measurements that are integrated in the controlloop for specific programs, or to access particular regions of operating space; finally, measurements forperformance evaluation and physics studies (2). For each measurement we have selected a primarydiagnostic system. Reflectometry is expected to be the main diagnostic for the measurements of Table 1. Inaddition, it is expected to provide supplementary information for a great number of other measurements,such as MHD modes, TAEs, core density profile, and possibly divertor plate erosion.
The measurement list leads naturally to the implementation of three reflectometry systems: a reflectometerfor the main plasma, whose main function is the measurement of the density profile, a plasma positionreflectometer, able to measure the plasma shape and position in such a way that it can be integrated in thecontrol system, and a divertor reflectometer to measure the density profile in the divertor. The desiredmeasurement capability for each plasma region is based on the target measurement requirements reported in[1,2]. The corresponding frequency ranges are summarised in [3]. In general, it appears possible to meet themeasurement requirements [3-6] for all plasma regions, with the possible exception of the 3 mm densityresolution target in the divertor region, although predictions for this region are hampered by the lack ofrelevant experimental results.
3. General implementation constraints
The constraints imposed on the reflectometry systems by the machine are generic in nature, although thesolutions vary for each system. Starting from the front end they are:
Access through the first wall / target: Two factors restrict the aperture size that can be provided: the neutronleakage through the first wall and shield, (which must be minimised to ensure hands-on access as close tothe machine as possible), and the additional heat loads imposed on the first wall by the presence of theaperture. The latter requirement turns out to be the most restrictive in practice.
Ability to withstand neutron and EM radiation heat loads: The radiative load on parts of the first wall canreach (locally) 0.5 MW/ m2. For the divertor this figure can be an order of magnitude higher. The neutronfirst wall loading is -15 W/cc for stainless steel. Thus, careful analysis of the cooling requirements must beperformed for all the front end components.
Transmission through the first vacuum boundary: The requirements on the pressure handling capability,temperature range and remote handling of the first window are not very different from the present
- 158 -
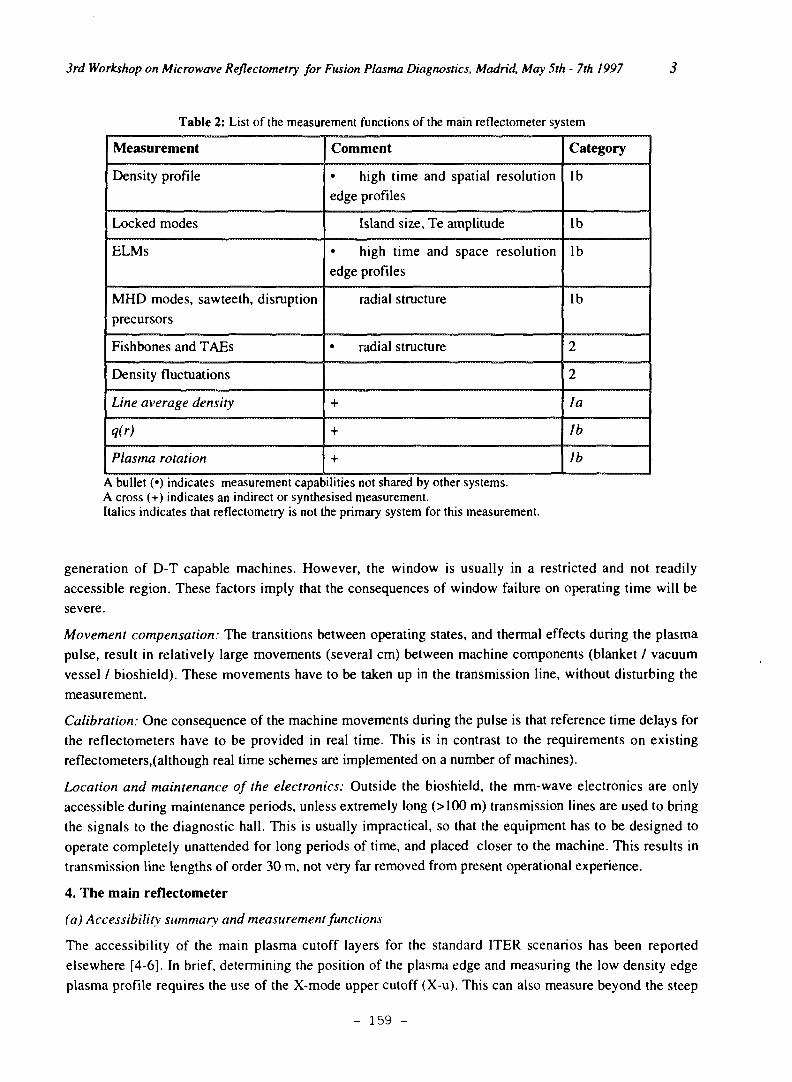
3rd Workshop on Microwave Reflectometry for Fusion Plasma Diagnostics, Madrid, May 5th - 7th 1997
Table 2: List of the measurement functions of the main reflectometer system
Measurement
Density profile
Locked modes
ELMs
MHD modes, sawteeth, disruptionprecursors
Fishbones and TAEs
Density fluctuations
Line average density
q(r)
Plasma rotation
Comment
• high time and spatial resolutionedge profiles
Island size, Te amplitude
• high time and space resolutionedge profiles
radial structure
• radial structure
+
+
+
Category
lb
lb
lb
lb
2
2
la
lb
lb
A bullet (•) indicates measurement capabilities not shared by other systems.A cross (+) indicates an indirect or synthesised measurement.Italics indicates that reflectometry is not the primary system for this measurement.
generation of D-T capable machines. However, the window is usually in a restricted and not readilyaccessible region. These factors imply that the consequences of window failure on operating time will besevere.
Movement compensation: The transitions between operating states, and thermal effects during the plasmapulse, result in relatively large movements (several cm) between machine components (blanket / vacuumvessel / bioshield). These movements have to be taken up in the transmission line, without disturbing themeasurement.
Calibration: One consequence of the machine movements during the pulse is that reference time delays forthe reflectometers have to be provided in real time. This is in contrast to the requirements on existingreflectometers,(although real time schemes are implemented on a number of machines).
Location and maintenance of the electronics: Outside the bioshield, the mm-wave electronics are onlyaccessible during maintenance periods, unless extremely long (>100 m) transmission lines are used to bringthe signals to the diagnostic hall. This is usually impractical, so that the equipment has to be designed tooperate completely unattended for long periods of time, and placed closer to the machine. This results intransmission line lengths of order 30 m, not very far removed from present operational experience.
4. The main reflectometer
(a) Accessibility summary and measurement functions
The accessibility of the main plasma cutoff layers for the standard ITER scenarios has been reportedelsewhere [4-6], In brief, determining the position of the plasma edge and measuring the low density edgeplasma profile requires the use of the X-mode upper cutoff (X-u). This can also measure beyond the steep
- 159 -
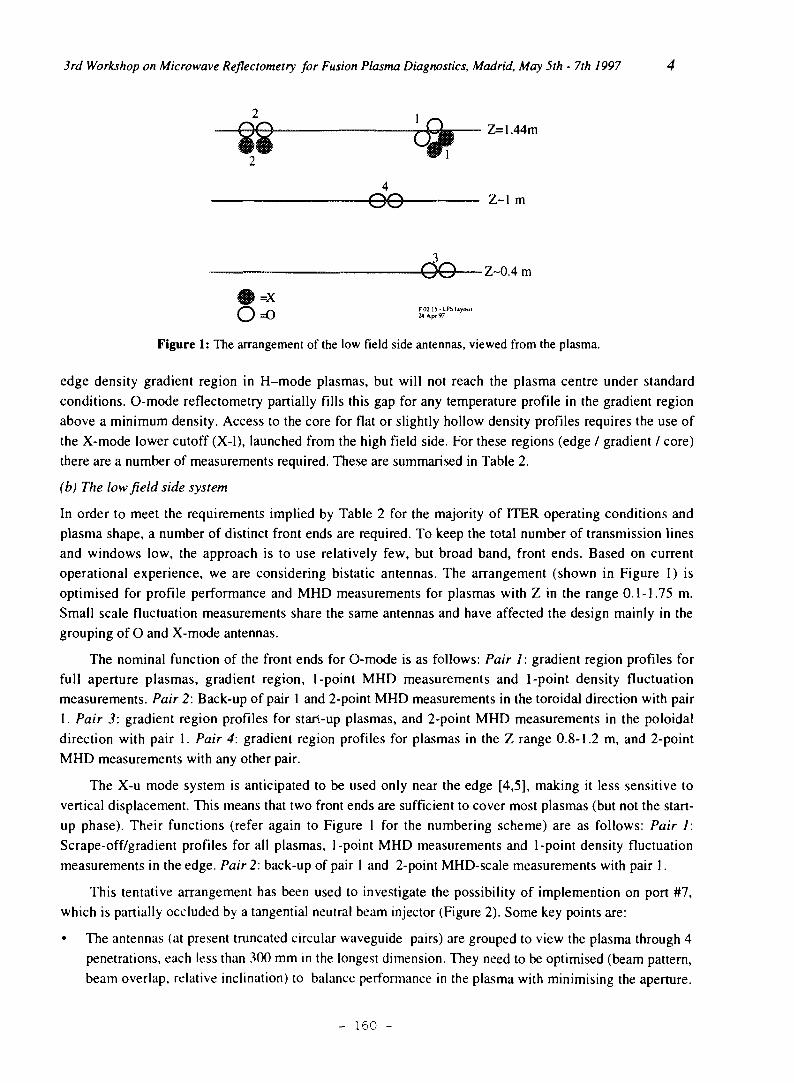
3rd Workshop on Microwave Reflectometry for Fusion Plasma Diagnostics, Madrid, May 5th - 7th 1997
Z= 1.44m
4-O0 . Z-lm
y Z~0.4m
Figure 1: The arrangement of the low field side antennas, viewed from the plasma.
edge density gradient region in H-mode plasmas, but will not reach the plasma centre under standardconditions. O-mode reflectometry partially fills this gap for any temperature profile in the gradient regionabove a minimum density. Access to the core for flat or slightly hollow density profiles requires the use ofthe X-mode lower cutoff (X-l), launched from the high field side. For these regions (edge / gradient / core)there are a number of measurements required. These are summarised in Table 2.
(b) The low field side system
In order to meet the requirements implied by Table 2 for the majority of ITER operating conditions andplasma shape, a number of distinct front ends are required. To keep the total number of transmission linesand windows low, the approach is to use relatively few, but broad band, front ends. Based on currentoperational experience, we are considering bistatic antennas. The arrangement (shown in Figure 1) isoptimised for profile performance and MHD measurements for plasmas with Z in the range 0.1-1.75 m.Small scale fluctuation measurements share the same antennas and have affected the design mainly in thegrouping of O and X-mode antennas.
The nominal function of the front ends for O-mode is as follows: Pair 1: gradient region profiles forfull aperture plasmas, gradient region, 1-point MHD measurements and 1-point density fluctuationmeasurements. Pair 2: Back-up of pair 1 and 2-point MHD measurements in the toroidal direction with pair1. Pair 3: gradient region profiles for starl-up plasmas, and 2-point MHD measurements in the poloidaldirection with pair 1. Pair 4: gradient region profiles for plasmas in the Z range 0.8-1.2 m, and 2-pointMHD measurements with any other pair.
The X-u mode system is anticipated to be used only near the edge [4,5], making it less sensitive tovertical displacement. This means that two front ends are sufficient to cover most plasmas (but not the start-up phase). Their functions (refer again to Figure 1 for the numbering scheme) are as follows: Pair 1:Scrape-off/gradient profiles for all plasmas, 1-point MHD measurements and 1-point density fluctuationmeasurements in the edge. Pair 2: back-up of pair 1 and 2-point MHD-scale measurements with pair 1.
This tentative arrangement has been used to investigate the possibility of implemention on port #7,which is partially occluded by a tangential neutral beam injector (Figure 2). Some key points are:
• The antennas (at present truncated circular waveguide pairs) are grouped to view the plasma through 4penetrations, each less than 300 mm in the longest dimension. They need to be optimised (beam pattern,beam overlap, relative inclination) to balance performance in the plasma with minimising the aperture.
- 160 -
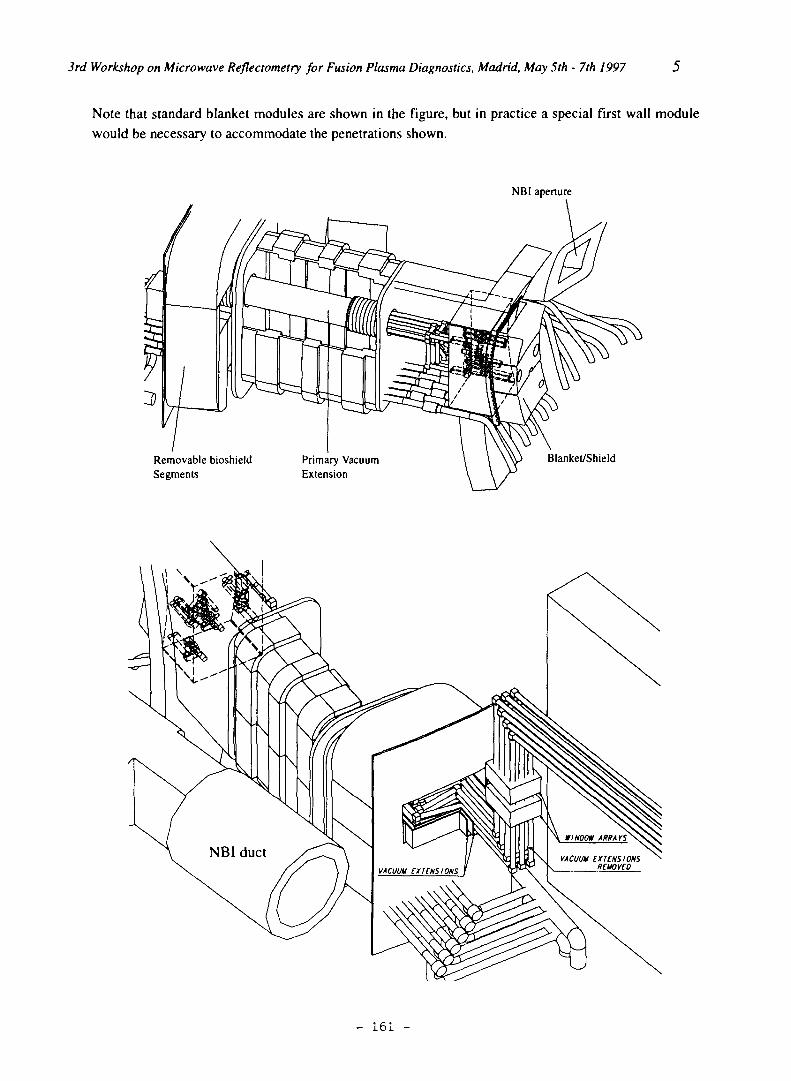
3rd Workshop on Microwave Reflectometry for Fusion Plasma Diagnostics, Madrid, May 5th - 7th 1997 5
Note that standard blanket modules are shown in the figure, but in practice a special first wall modulewould be necessary to accommodate the penetrations shown.
NBI aperture
Removable bioshieldSegments
Primary VacuumExtension
Blanket/Shield
- 161 -
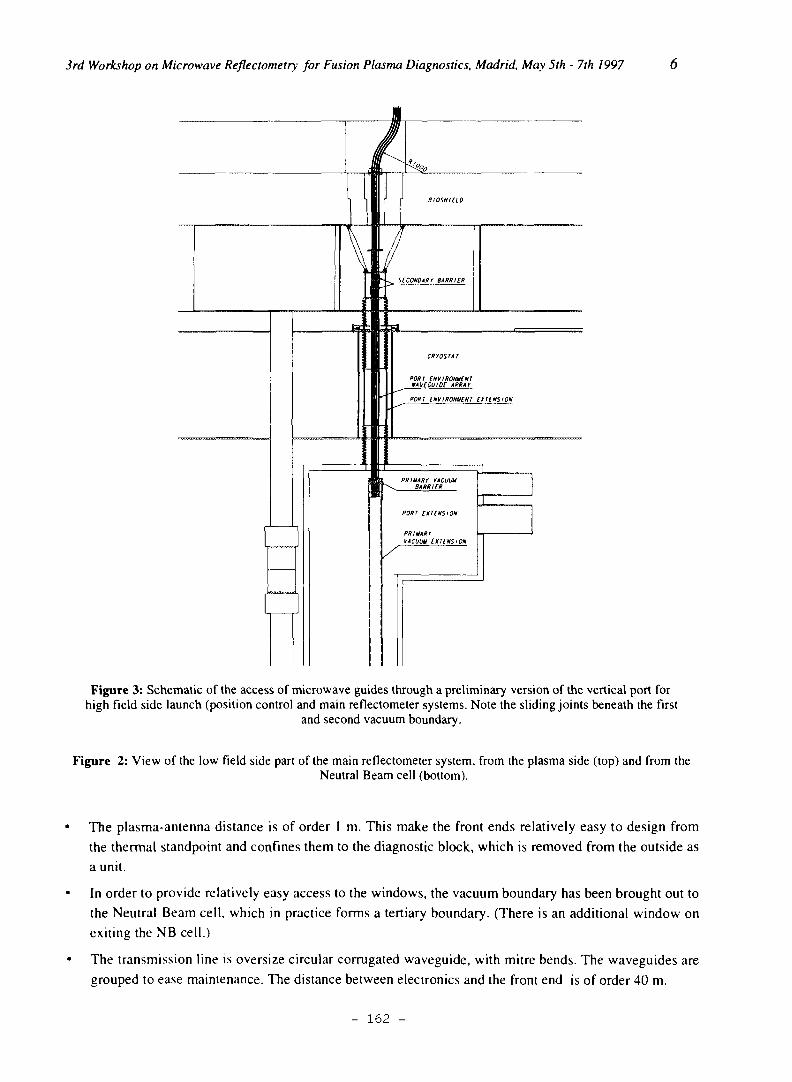
3rd Workshop on Microwave Reflectometry for Fusion Plasma Diagnostics, Madrid, May 5th - 7th 1997
Figure 3: Schematic of the access of microwave guides through a preliminary version of the vertical port forhigh field side launch (position control and main reflectometer systems. Note the sliding joints beneath the first
and second vacuum boundary.
Figure 2: View of the low field side part of the main reflectometer system, from the plasma side (top) and from iheNeutral Beam cell (bottom).
The plasma-antenna distance is of order 1 m. This make the front ends relatively easy to design from
the thermal standpoint and confines them to the diagnostic block, which is removed from the outside as
a unit.
In order to provide relatively easy access to the windows, the vacuum boundary has been brought out to
the Neutral Beam cell, which in practice forms a tertiary boundary. (There is an additional window on
exiting the NB cell.)
The transmission line is oversize circular corrugated waveguide, with mitre bends. The waveguides are
grouped to ease maintenance. The distance between electronics and the front end is of order 40 m.
- 162 -
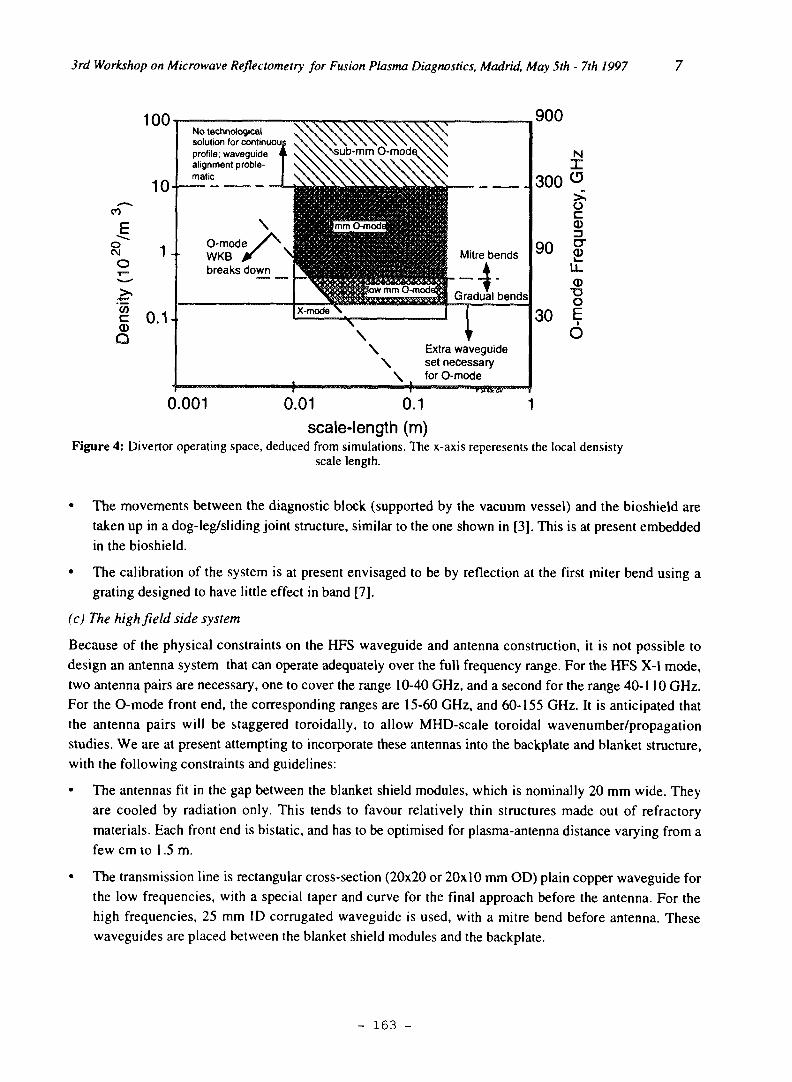
3rd Workshop on Microwave Reflectometry for Fusion Plasma Diagnostics, Madrid, May 5th - 7th 1997
100
10
oC\J
V)
Q
1-
0.1-
No technologicalsolution for continuoujprofile; waveguidealignment proble-matic
O-modeWKBbreaks down
Mitre bends
Gradual bends
\\
Extra waveguideset necessaryfor O-mode
900
NX
300
90
30
oCD
CT
o
O
Ô
0.001 0.01 0.1scale-length (m)
Figure 4: Divertor operating space, deduced from simulations. The x-axis reperesents the local densistyscale length.
• The movements between the diagnostic block (supported by the vacuum vessel) and the bioshield aretaken up in a dog-leg/sliding joint structure, similar to the one shown in [3]. This is at present embeddedin the bioshield.
• The calibration of the system is at present envisaged to be by reflection at the first miter bend using agrating designed to have little effect in band [7].
(c) The high field side system
Because of the physical constraints on the HFS waveguide and antenna construction, it is not possible todesign an antenna system that can operate adequately over the full frequency range. For the HFS X-l mode,two antenna pairs are necessary, one to cover the range 10-40 GHz, and a second for the range 40-110 GHz.For the O-mode front end, the corresponding ranges are 15-60 GHz, and 60-155 GHz. It is anticipated thatthe antenna pairs will be staggered toroidally, to allow MHD-scale toroidal wavenumber/propagationstudies. We are at present attempting to incorporate these antennas into the backplate and blanket structure,with the following constraints and guidelines:
• The antennas fit in the gap between the blanket shield modules, which is nominally 20 mm wide. Theyare cooled by radiation only. This tends to favour relatively thin structures made out of refractorymaterials. Each front end is bistatic, and has to be optimised for plasma-antenna distance varying from afew cm to 1.5 m.
• The transmission line is rectangular cross-section (20x20 or 20x 10 mm OD) plain copper waveguide forthe low frequencies, with a special taper and curve for the final approach before the antenna. For thehigh frequencies, 25 mm ID corrugated waveguide is used, with a mitre bend before antenna. Thesewaveguides are placed between the blanket shield modules and the backplate.
- 163 -
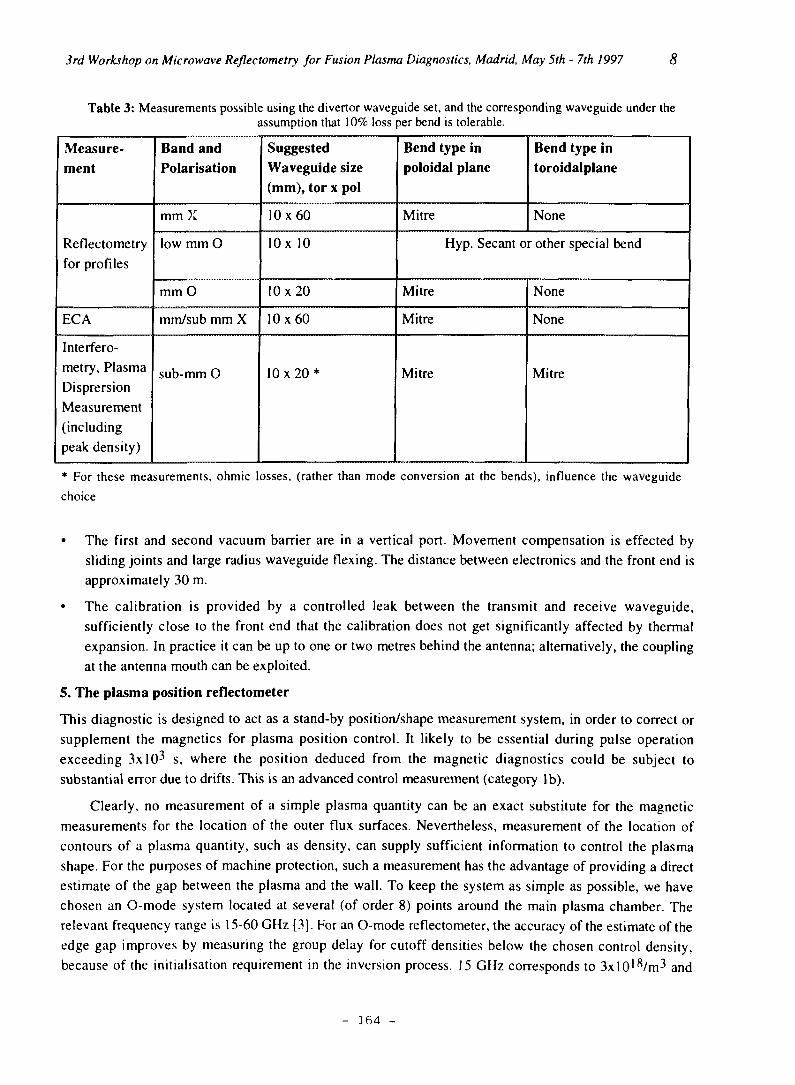
3rd Workshop on Microwave Reflectometry for Fusion Plasma Diagnostics, Madrid, May 5th - 7th 1997 8
Table 3: Measurements possible using the divertor waveguide set, and the corresponding waveguide under theassumption that 10% loss per bend is tolerable.
Measure-ment
Reflectometryfor profiles
ECA
Interfero-metry, Plasma
DisprersionMeasurement(includingpeak density)
Band andPolarisation
mm X
low mm 0
mm O
mm/sub mm X
sub-mm O
SuggestedWaveguide size(mm), tor x pol
10x60
lOx 10
10x20
10x60
10 x 20 *
Bend type inpoloidal plane
Mitre
Bend type intoroidalplane
None
Hyp. Secant or other special bend
Mitre
Mitre
Mitre
None
None
Mitre
• For these measurements, ohmic losses, (rather than mode conversion at the bends), influence the waveguidechoice
• The first and second vacuum barrier are in a vertical port. Movement compensation is effected bysliding joints and large radius waveguide flexing. The distance between electronics and the front end isapproximately 30 m.
• The calibration is provided by a controlled leak between the transmit and receive waveguide,sufficiently close to the front end that the calibration does not get significantly affected by thermalexpansion. In practice it can be up to one or two metres behind the antenna; alternatively, the couplingat the antenna mouth can be exploited.
5. The plasma position reflectometer
This diagnostic is designed to act as a stand-by position/shape measurement system, in order to correct orsupplement the magnetics for plasma position control. It likely to be essential during pulse operationexceeding 3xlO3 s, where the position deduced from the magnetic diagnostics could be subject tosubstantial error due to drifts. This is an advanced control measurement (category lb).
Clearly, no measurement of a simple plasma quantity can be an exact substitute for the magneticmeasurements for the location of the outer flux surfaces. Nevertheless, measurement of the location ofcontours of a plasma quantity, such as density, can supply sufficient information to control the plasmashape. For the purposes of machine protection, such a measurement has the advantage of providing a directestimate of the gap between the plasma and the wall. To keep the system as simple as possible, we havechosen an O-mode system located at several (of order 8) points around the main plasma chamber. Therelevant frequency range is 15-60 GHz [3]. For an O-mode reflectometer, the accuracy of the estimate of theedge gap improves by measuring the group delay for cutoff densities below the chosen control density,because of the initialisation requirement in the inversion process. 15 GHz corresponds to 3xlO18/m3 and
- 164 -
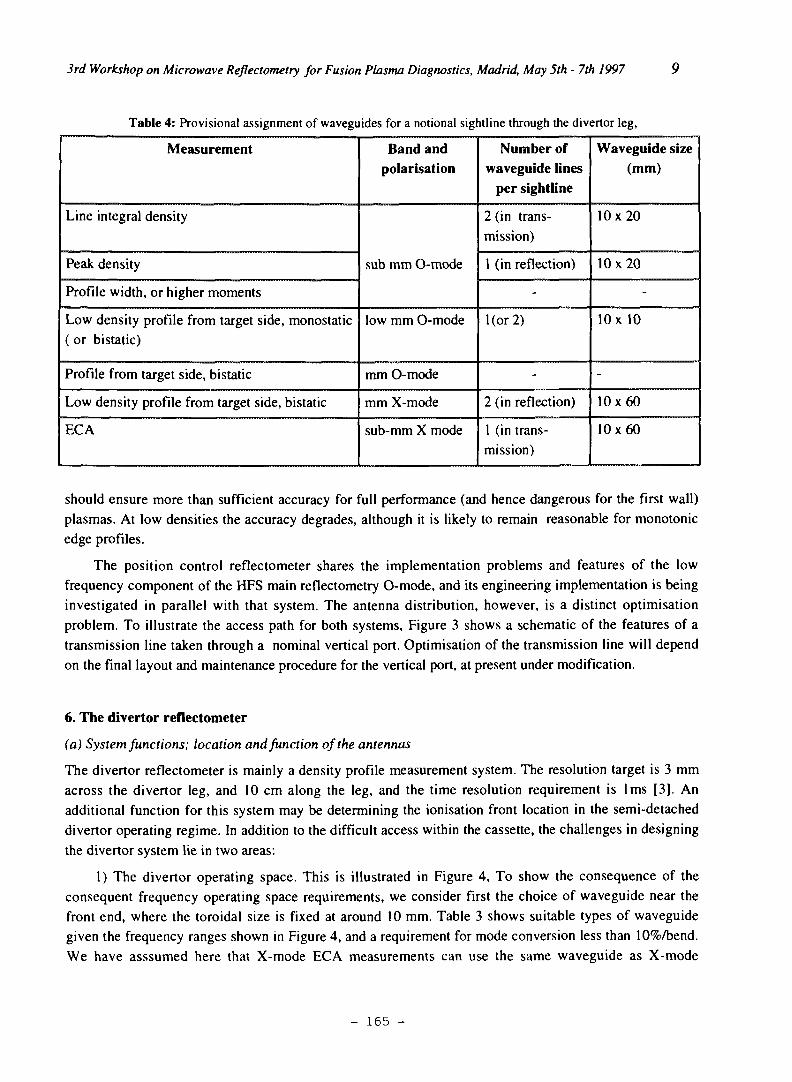
3rd Workshop on Microwave Reflectometry for Fusion Plasma Diagnostics, Madrid, May 5th - 7th 1997
Table 4: Provisional assignment of waveguides for a notional sightline through the divertor leg,
Measurement
Line integral density
Peak density
Profile width, or higher moments
Low density profile from target side, monostatic( or bistatic)
Profile from target side, bistatic
Low density profile from target side, bistatic
ECA
Band andpolarisation
sub mm O-mode
low mm O-mode
mm O-mode
mm X-mode
sub-mm X mode
Number ofwaveguide lines
per sightline
2 (in trans-mission)
1 (in reflection)
-
I(or2)
-
2 (in reflection)
1 (in trans-mission)
Waveguide size(mm)
10x20
10x20
-
10x10
-
10x60
10x60
should ensure more than sufficient accuracy for full performance (and hence dangerous for the first wall)plasmas. At low densities the accuracy degrades, although it is likely to remain reasonable for monotonieedge profiles.
The position control reflectometer shares the implementation problems and features of the lowfrequency component of the HFS main reflectometry O-mode, and its engineering implementation is beinginvestigated in parallel with that system. The antenna distribution, however, is a distinct optimisationproblem. To illustrate the access path for both systems, Figure 3 shows a schematic of the features of atransmission line taken through a nominal vertical port. Optimisation of the transmission line will dependon the final layout and maintenance procedure for the vertical port, at present under modification.
6. The divertor reflectometer
(a) System functions; location and function of the antennas
The divertor reflectometer is mainly a density profile measurement system. The resolution target is 3 mmacross the divertor leg, and 10 cm along the leg, and the time resolution requirement is lms [3]. Anadditional function for this system may be determining the ionisation front location in the semi-detacheddivertor operating regime. In addition to the difficult access within the cassette, the challenges in designingthe divertor system lie in two areas:
1 ) The divertor operating space. This is illustrated in Figure 4, To show the consequence of theconsequent frequency operating space requirements, we consider first the choice of waveguide near thefront end, where the toroidal size is fixed at around 10 mm. Table 3 shows suitable types of waveguidegiven the frequency ranges shown in Figure 4, and a requirement for mode conversion less than 10%/bend.We have asssumed here that X-mode ECA measurements can use the same waveguide as X-mode
- 165 -
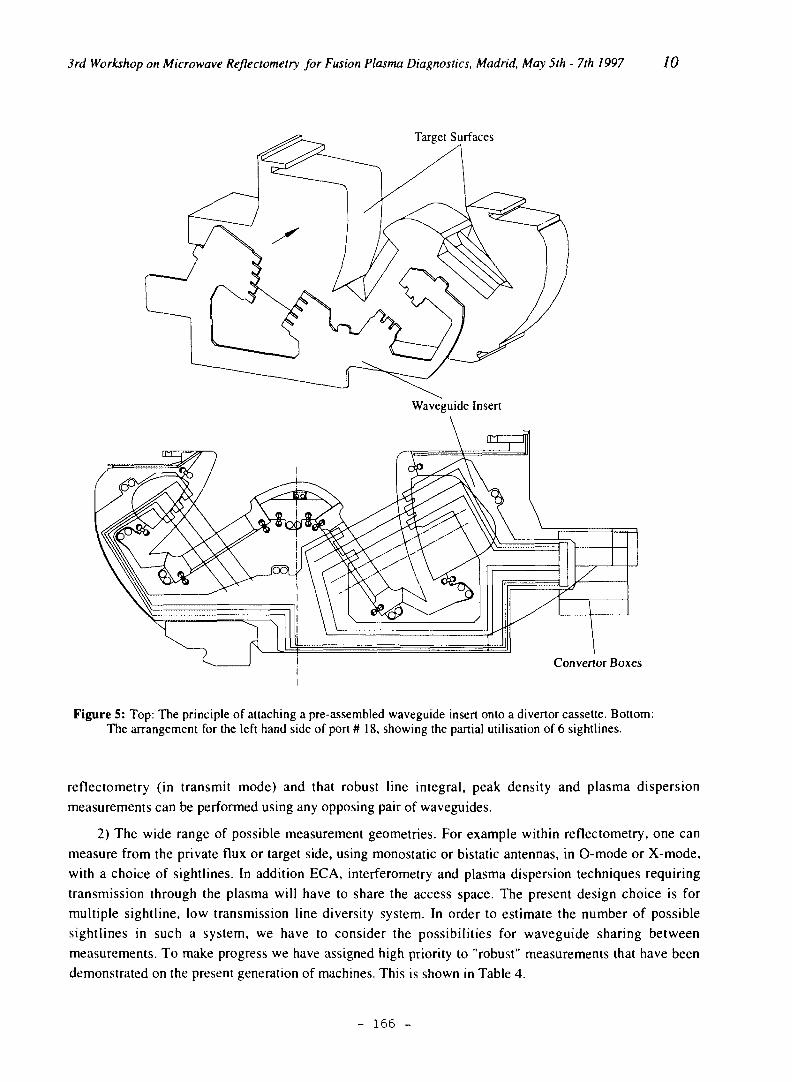
3rd Workshop on Microwave Reflectometry for Fusion Plasma Diagnostics, Madrid, May 5th - 7th 1997 10
Target Surfaces
Convenor Boxes
Figure 5: Top: The principle of attaching a pre-assembled waveguide insert onto a divertor cassette. Bottom:The arrangement for the left hand side of port # 18, showing the partial utilisation of 6 sightlines.
reflectometry (in transmit mode) and that robust line integral, peak density and plasma dispersionmeasurements can be performed using any opposing pair of waveguides.
2) The wide range of possible measurement geometries. For example within reflectometry, one canmeasure from the private flux or target side, using monostatic or bistatic antennas, in O-mode or X-mode,with a choice of sightlines. In addition ECA, interferometry and plasma dispersion techniques requiringtransmission through the plasma will have to share the access space. The present design choice is formultiple sightline, low transmission line diversity system. In order to estimate the number of possiblesightlines in such a system, we have to consider the possibilities for waveguide sharing betweenmeasurements. To make progress we have assigned high priority to "robust" measurements that have beendemonstrated on the present generation of machines. This is shown in Table 4.
- 166 -
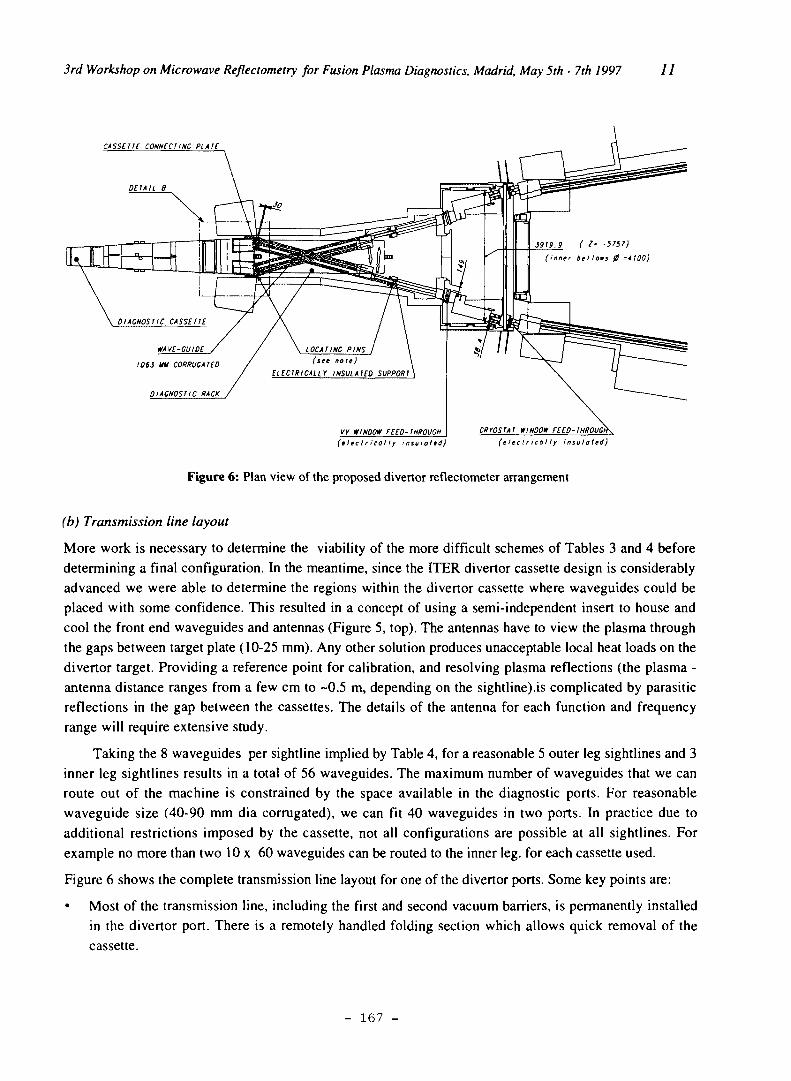
3rd Workshop on Microwave Reflectometry for Fusion Plasma Diagnostics, Madrid, May 5th - 7th 1997 11
CASSETTE CONNECTING PLAIE
DETAIL 8
LOCATINC PINS(see note)
ELECTRICALLY INSULATED SUPPORT
DIAGNOSTIC RACK
VV WINDOW FEED-THROUGH(electricolIy insuloted)
CRYOSTAT WINDOW FEED-THROUGf)
(electricolly insulated)
Figure 6: Plan view of the proposed divertor reflectometer arrangement
(b) Transmission line layout
More work is necessary to determine the viability of the more difficult schemes of Tables 3 and 4 beforedetermining a final configuration. In the meantime, since the ITER divertor cassette design is considerablyadvanced we were able to determine the regions within the divertor cassette where waveguides could beplaced with some confidence. This resulted in a concept of using a semi-independent insert to house andcool the front end waveguides and antennas (Figure 5, top). The antennas have to view the plasma throughthe gaps between target plate (10-25 mm). Any other solution produces unacceptable local heat loads on thedivertor target. Providing a reference point for calibration, and resolving plasma reflections (the plasma -antenna distance ranges from a few cm to -0.5 m, depending on the sightline).is complicated by parasiticreflections in the gap between the cassettes. The details of the antenna for each function and frequencyrange will require extensive study.
Taking the 8 waveguides per sightline implied by Table 4, for a reasonable 5 outer leg sightlines and 3inner leg sightlines results in a total of 56 waveguides. The maximum number of waveguides that we canroute out of the machine is constrained by the space available in the diagnostic ports. For reasonablewaveguide size (40-90 mm dia corrugated), we can fit 40 waveguides in two ports. In practice due toadditional restrictions imposed by the cassette, not all configurations are possible at all sightlines. Forexample no more than two 10 x 60 waveguides can be routed to the inner leg. for each cassette used.
Figure 6 shows the complete transmission line layout for one of the divertor ports. Some key points are:
• Most of the transmission line, including the first and second vacuum barriers, is permanently installedin the divertor port. There is a remotely handled folding section which allows quick removal of thecassette.
- 167 -
3rd Workshop on Microwave Reflectometry for Fusion Plasma Diagnostics, Madrid, May 5th - 7th 1997 12
• The transition between the oversize corrugated waveguide and the rectangular waveguide within thecassette is performed quasi-optically, in a set of assemblies ("convenor boxes" in Figure 5) attached tothe divertor cassette. The distance between the electronics and the front end is about 40 m.
• Movement compensation is provided by a dog-leg and sliding joint assembly located in the interspacebetween the vacuum vessel and cryostat seal plates. This has to be removed to allow access to thewindows on the vacuum vessel flange.
• 7. Conclusions
Reflectometry is expected to be routinely useful in ITER for a wide range of measurements, many of whichare required to form part of real-time control loops used to operate the machine. As a result we haveplanned for thorough coverage of all plasma regions. There are great differences in the details of theimplementation of each system, but also some common themes (not all of which have been explored in thispaper), which will form the backbone of future work on these systems:
One common theme is the requirement for optimisation of a limited number of antennas for a widerange of functions. This optimisation depends both on the antenna distribution, which must be sufficient forthe coverage of expected plasmas, and the optimisation of individual front ends for the full frequency andradial range expected with the minimum disturbance to the first wall or target and neutron shield structures.In principle, solutions have been found for this key problem of access through the first wall for all thesystems, but much work remains, including a reliable assessment of the likely effect of fluctuations on frontend performance. Another common element is the need for rugged calibration schemes that will allow thereal time reference of the density profile to a hardware feature of the machine (backplate , vacuum vessel ordivertor cassette). Again, this is linked to the detailed optimisation of the front end. For all systems there isa need to mitigate the effects of parasitic reflections that arise from the close fitting apertures through whichthe antenna views the plasma. It is a common observation in complex mm-wave systems that theperformance of the whole system depends on interactions between the components, which sometimesproduce undesirable and unpredicted results. Given the effort required to place diagnostics with a machinesuch as ITER, it is expected that prototype transmission lines will have to be thoroughly tested for all thesystems before installation.
Acknowledgement
This report has been prepared as an account of work performed under the Agreement among the EuropeanAtomic Energy Community, the Government of Japan, the Government of the Russian Federation, and theGovernment of the United States of America on Cooperation in the Engineering Design Activities for theInternational Thermonuclear Experimental Reactor ("ITER EDA Agreement") under the auspices of theInternational Atomic Energy Agency (IAEA).
References
[1] A. Costley et al, in "Diagnostics for Experimental Thermonuclear Fusion Reactors", P.E. Stott, G.Gorini and E. Sindoni Eds., Plenum Press, New York and London 1996, p. 23 ff[2] K. Young et al, Rev. Sci. Instrum. 68 (1), 1997, p. 862[3] G. Vayakis et al, ibid. p. 435[4] M.E. Manso et al, in "Diagnostics for Experimental Thermonuclear Fusion Reactors", P.E. Stott, G.Gorini and E. Sindoni Eds., Plenum Press, New York and London 1996,. p 133 ff[5] V.A. Vershkov, ibid, p 143 ff[6] E.J Doyle et al, ibid. p. 117ff[7] L.Empacher et al, to appear in Proceedings 10th Joint Workshop on Electron Cyclotron Emission andElectron Cyclotron Resonance Heating, Ameland, the Netherlands April 1997.
- 168 -
Phase runaway effects on Wendelstein 7-ASB. Branas, M. Hirsch*, V. Zhuravlev, J. Baldzuhn*, J. Sanchez, T. Estrada, T. Geist*, H.J.
HartfuB*
Asociaciôn EURATOM-CIEMAT, Madrid, Spain
*Max-Planck-Institut fiir Plasmaphysik, EURATOM-Ass, 85748 Garching, Germany
Abstract. The phase runaway phenomenon has been studied using the W7-AS heterodyne reflectometer.The phase evolution is intermittent, changing rapidly in certain time intervals that show a strong level ofamplitude fluctuations. There is a clear dependence of the value of the runaway phase <dcp/dt> with the localand global plasma parameters. Several authors have proposed that the phase runaway is due to rotation ofturbulent structures provided that some asymmetry between these structures and the reflectometer axis exists.The relation between the phase runaway and plasma rotation has been confirmed at W7-AS. The radial profileof the runaway qualitatively corresponds with the plasma poloidal rotation profile. Besides, the observedphase drift can be inverted by inverting the toroidal magnetic field of the stellarator, thus changing therotation direction of the plasma. This result implies that the neccessary asymmetry is independent on thedirection of plasma rotation. 2D WKB simulations of the reflection on a poloidally rotating turbulent plasmafor the W7-AS reflectometer and plasma parameters reproduce qualitatively the experimental features(intermittent phase drift, relation between phase and amplitude changes) of the measured phase signal.
I. Introduction
Under turbulent plasma conditions a drift of the measured reflectometer phase is observed
which can not be explained by a realistic radial movement of the cut-off layer due to density changes.
This so called "phase runaway", that complicates and in occasions impairs completely the density
measurements, has been observed for many plasma conditions with almost all reflectometers able to
follow such a phase drift [1-6].
The phase runaway can affect the density profile measurements performed by some
reflectometry techniques. The relevant magnitude to be measured for obtaining the density profile is
the time delay T(F)=1/2TT (d(p/dF), where F denotes the microwave frequency. Techniques like FM
reflectometry measure the time delay from the time derivative of the phase as the frequency is swept
with time. Under these conditions the phase runaway directly affects the measurements since it
simply adds to the actual phase derivative. The problem can be overcome by sweeping the frequency
fast enough or by using techniques like Pulse Radar or Amplitude Modulation (also differential phase
techniques) which determine the time delay from simultaneous measurements of the phase at
neighboring frequencies.
Concerning the density turbulence measurements, the time scales of the phase excursions that
give rise to the phase drift and that of the turbulence induced phase fluctuations are similar. This
makes the separation of both parts of the signal very difficult and sometimes impossible. On the other
hand, the phase runaway itself is a consequence of the plasma density turbulence. An understanding
of this phenomenon is therefore essential for the correct interpretation of the reflectometer signal in
terms of plasma density turbulence. With this aim experiments and simulations have been carried out
at W7-AS.
It has been suggested that the phase runaway represents the Doppler shift of the probing
radiation reflected from rotating cut-off layer disturbances [2,4,5]. Either these disturbances are
assymmetric [2,4] or a misalignment of the reflectometer axis with respect to the normal at the cut-off
- 169 -
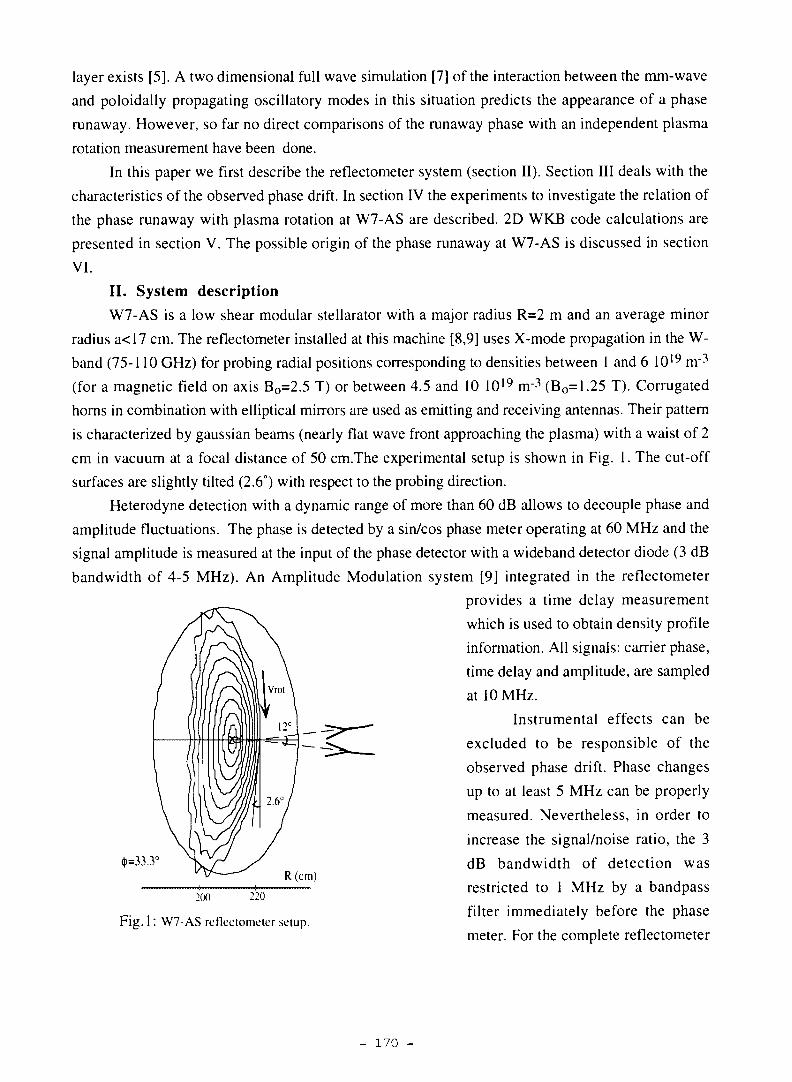
layer exists [5]. A two dimensional full wave simulation [7] of the interaction between the mm-wave
and poloidally propagating oscillatory modes in this situation predicts the appearance of a phase
runaway. However, so far no direct comparisons of the runaway phase with an independent plasma
rotation measurement have been done.
In this paper we first describe the reflectometer system (section II). Section III deals with the
characteristics of the observed phase drift. In section IV the experiments to investigate the relation of
the phase runaway with plasma rotation at W7-AS are described. 2D WKB code calculations are
presented in section V. The possible origin of the phase runaway at W7-AS is discussed in section
VI.
II. System description
W7-AS is a low shear modular stellarator with a major radius R=2 m and an average minor
radius a<17 cm. The reflectometer installed at this machine [8,9] uses X-mode propagation in the W-
band (75-110 GHz) for probing radial positions corresponding to densities between 1 and 6 1019 nr3
(for a magnetic field on axis BO=2.5 T) or between 4.5 and 10 1019 rrr3 (BO=1.25 T). Corrugated
horns in combination with elliptical mirrors are used as emitting and receiving antennas. Their pattern
is characterized by gaussian beams (nearly flat wave front approaching the plasma) with a waist of 2
cm in vacuum at a focal distance of 50 cm.The experimental setup is shown in Fig. 1. The cut-off
surfaces are slightly tilted (2.6°) with respect to the probing direction.
Heterodyne detection with a dynamic range of more than 60 dB allows to decouple phase and
amplitude fluctuations. The phase is detected by a sin/cos phase meter operating at 60 MHz and the
signal amplitude is measured at the input of the phase detector with a wideband detector diode (3 dB
bandwidth of 4-5 MHz). An Amplitude Modulation system [9] integrated in the reflectometer
provides a time delay measurement
which is used to obtain density profile
information. All signals: carrier phase,
time delay and amplitude, are sampled
at 10 MHz.
Instrumental effects can be
excluded to be responsible of the
observed phase drift. Phase changes
up to at least 5 MHz can be properly
measured. Nevertheless, in order to
increase the signal/noise ratio, the 3
dB bandwidth of detection was
restricted to 1 MHz by a bandpass
filter immediately before the phase
meter. For the complete reflectometer
<|>=33.3O
R(cm)
200 220
Fig. 1 : W7-AS reflectometer setup.
- 170 -
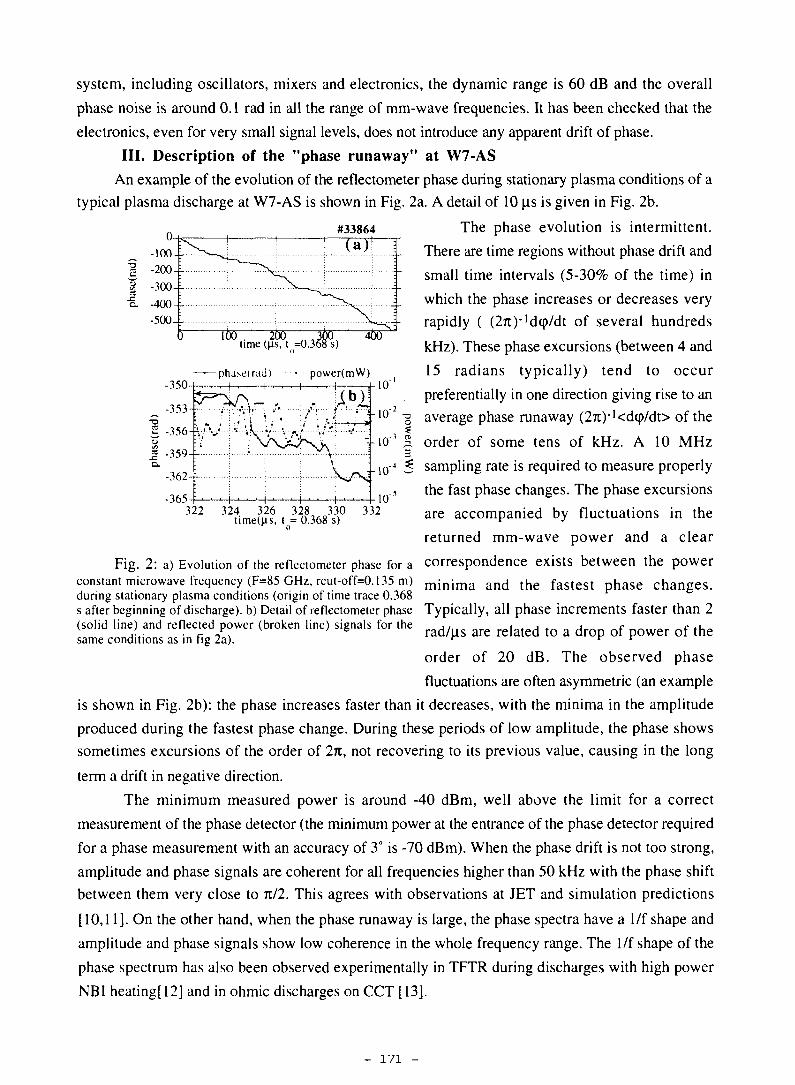
#33864
system, including oscillators, mixers and electronics, the dynamic range is 60 dB and the overall
phase noise is around 0.1 rad in all the range of mm-wave frequencies. It has been checked that the
electronics, even for very small signal levels, does not introduce any apparent drift of phase.
III. Description of the "phase runaway" at W7-AS
An example of the evolution of the reflectometer phase during stationary plasma conditions of a
typical plasma discharge at W7-AS is shown in Fig. 2a. A detail of 10 u.s is given in Fig. 2b.
The phase evolution is intermittent.
There are time regions without phase drift and
small time intervals (5-30% of the time) in
which the phase increases or decreases very
rapidly ( (2Tt)-'d(p/dt of several hundreds
kHz). These phase excursions (between 4 and
15 radians typically) tend to occur
preferentially in one direction giving rise to an
average phase runaway (2TC)" ' <dtp/dt> of the
3. order of some tens of kHz. A 10 MHz
-350-
time ((Is, t =0.368 "s)
-phase(rad) power(mW)
-365324 326 328 330 332
time(us, t = 0.368 s)
sampling rate is required to measure properly
the fast phase changes. The phase excursions
are accompanied by fluctuations in the
returned mm-wave power and a clear
Fig. 2: a) Evolution of the reflectometer phase for a correspondence exists between the powerconstant microwave frequency (F=85 GHz, rcut-off=0.135 m) m in ima and the fastest phase changes,during stationary plasma conditions (origin of time trace 0.368s after beginning of discharge), b) Detail of reflectometer phase Typically, all phase increments faster than 2(solid line) and reflected power (broken line) signals for the d , d d f f ^same conditions as in fig 2a). ^ r r
order of 20 dB. The observed phase
fluctuations are often asymmetric (an example
is shown in Fig. 2b): the phase increases faster than it decreases, with the minima in the amplitude
produced during the fastest phase change. During these periods of low amplitude, the phase shows
sometimes excursions of the order of IK, not recovering to its previous value, causing in the long
term a drift in negative direction.
The minimum measured power is around -40 dBm, well above the limit for a correct
measurement of the phase detector (the minimum power at the entrance of the phase detector required
for a phase measurement with an accuracy of 3° is -70 dBm). When the phase drift is not too strong,
amplitude and phase signals are coherent for all frequencies higher than 50 kHz with the phase shift
between them very close to nil. This agrees with observations at JET and simulation predictions
[10,11]. On the other hand, when the phase runaway is large, the phase spectra have a 1/f shape and
amplitude and phase signals show low coherence in the whole frequency range. The 1/f shape of the
phase spectrum has also been observed experimentally in TFTR during discharges with high power
NBI heating[12] and in ohmic discharges on CCT [13].
- 171 -
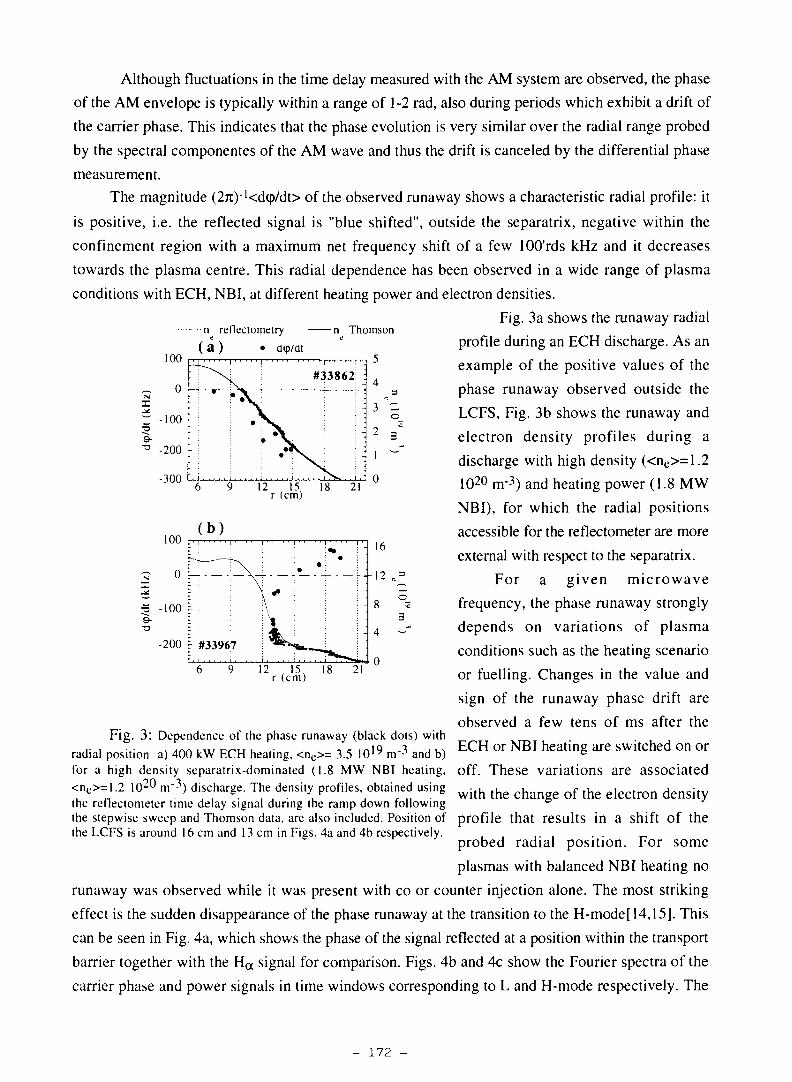
n reflectometry
( a ) • d(p/ût
-n Thomson
#33862! :
-300
100
©_
3
12 15r (cm)
21
Although fluctuations in the time delay measured with the AM system are observed, the phase
of the AM envelope is typically within a range of 1-2 rad, also during periods which exhibit a drift of
the carrier phase. This indicates that the phase evolution is very similar over the radial range probed
by the spectral componentes of the AM wave and thus the drift is canceled by the differential phase
measurement.
The magnitude (27i)"'<d(f>/dt> of the observed runaway shows a characteristic radial profile: it
is positive, i.e. the reflected signal is "blue shifted", outside the separatrix, negative within the
confinement region with a maximum net frequency shift of a few 100'rds kHz and it decreases
towards the plasma centre. This radial dependence has been observed in a wide range of plasma
conditions with ECH, NBI, at different heating power and electron densities.
Fig. 3a shows the runaway radial
profile during an ECH discharge. As an
example of the positive values of the
phase runaway observed outside the
LCFS, Fig. 3b shows the runaway and
electron density profiles during a
discharge with high density (<ne>=1.2
1020 nr3) and heating power (1.8 MW
NBI), for which the radial positions
accessible for the reflectometer are more
external with respect to the separatrix.
For a given microwave
frequency, the phase runaway strongly
depends on variations of plasma
conditions such as the heating scenario
or fuelling. Changes in the value and
sign of the runaway phase drift are
observed a few tens of ms after theFig. 3: Dependence of the phase runaway (black dots) with
. . . . . , .„„ . „ . cni_,, ,. -i ç ini9 -3 AU\ ECH or NBI heating are switched on orradial position a) 400 kW ECH heating, <ne>= 3.5 ÎO1* m - and b) b
for a high density separatrix-dominated (1.8 MW NBI heating, off. These variations are associated<ne>=1.2 1020 m-3) discharge. The density profiles obtained using w h h t h g c h Q f ^ d e c t r o n d e n s i
the reflectometer time delay signal during the ramp down following °the stepwise sweep and Thomson data, are also included. Position of profile that results in a shift of thethe LCFS is around 16 cm and 13 cm in Figs. 4a and 4b respectively. , , ,. , . . „
probed radial position. For some
plasmas with balanced NBI heating no
runaway was observed while it was present with co or counter injection alone. The most striking
effect is the sudden disappearance of the phase runaway at the transition to the H-mode[14,15]. This
can be seen in Fig. 4a, which shows the phase of the signal reflected at a position within the transport
barrier together with the Ha signal for comparison. Figs. 4b and 4c show the Fourier spectra of the
carrier phase and power signals in time windows corresponding to L and H-mode respectively. The
3
12 15r (cm) 21
- 172 -
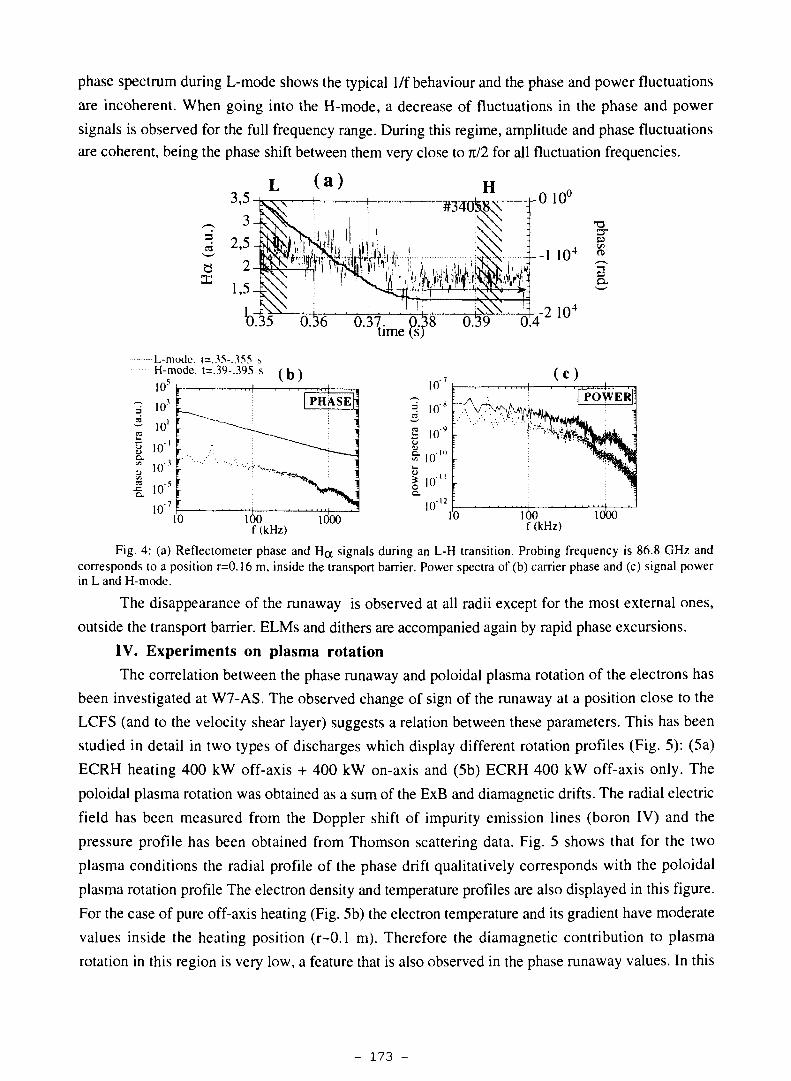
phase spectrum during L-mode shows the typical 1/f behaviour and the phase and power fluctuations
are incoherent. When going into the H-mode, a decrease of fluctuations in the phase and power
signals is observed for the full frequency range. During this regime, amplitude and phase fluctuations
are coherent, being the phase shift between them very close to nil for all fluctuation frequencies.
(a)0 10°
-1 104
-2 104
Q .
time i
-L-mcxU\ t=.35-.355 sH-mode. t=.39-.395 s
10
1010
f (kHz)1000
10'10
f(kHz)1000
Fig. 4: (a) Reflectometer phase and H a signals during an L-H transition. Probing frequency is 86.8 GHz andcorresponds to a position r=0.16 m, inside the transport barrier. Power spectra of (b) carrier phase and (c) signal powerin L and H-mode.
The disappearance of the runaway is observed at all radii except for the most external ones,
outside the transport barrier. ELMs and dithers are accompanied again by rapid phase excursions.
IV. Experiments on plasma rotation
The correlation between the phase runaway and poloidal plasma rotation of the electrons has
been investigated at W7-AS. The observed change of sign of the runaway at a position close to the
LCFS (and to the velocity shear layer) suggests a relation between these parameters. This has been
studied in detail in two types of discharges which display different rotation profiles (Fig. 5): (5a)
ECRH heating 400 kW off-axis + 400 kW on-axis and (5b) ECRH 400 kW off-axis only. The
poloidal plasma rotation was obtained as a sum of the ExB and diamagnetic drifts. The radial electric
field has been measured from the Doppler shift of impurity emission lines (boron IV) and the
pressure profile has been obtained from Thomson scattering data. Fig. 5 shows that for the two
plasma conditions the radial profile of the phase drift qualitatively corresponds with the poloidal
plasma rotation profile The electron density and temperature profiles are also displayed in this figure.
For the case of pure off-axis heating (Fig. 5b) the electron temperature and its gradient have moderate
values inside the heating position (r~0.1 m). Therefore the diamagnetic contribution to plasma
rotation in this region is very low, a feature that is also observed in the phase runaway values. In this
- 173 -

experiment positions outside the LCFS could not be reached with the reflectometer and no positive
values of the runaway were found.
(a) ECRH :400 kW on axis +400 kW off axis
(b) ECRH :400 kW off axis
- ^
•
•
" • • • : . \ \
I. :
: '•« '•
0.1 0.15r(m)
0.05 0.1 0.15r(m)
1.5
I
0.5
o.2°
2 104
0.1 0.11 0.12 0.13 0.14 0.15r (m)
0
-50
£-100J-150}-200
-250
-300
' ' ' 1 • • ' 1 ' ' • ! '
r : 9 '•'"
^ f.o*.f..S...;...
: \ r * • • • •
' • • . . . \ . . . \ . . \
• #33869o #33885
Of-
-
-
0.04 0.06 0.08 0.1 0.12 0.14r(m)
200,#33860 / 33937
_ 1 0 0 I-I
~ 0
• + Bo -B
Fig. 5: Radial profiles of electron density and temperature, electron poloidal rotation and phase runaway, (a)ECRH heating 400 kW off axis + 400 kW on axis, (b) ECRH 400 kW off axis only. For each case, the values of therunaway in two identical discharges are shown.
To confirm the relation between the
phase runaway and plasma rotation, the
stellarator magnetic field has been inverted for
a series of ECRH heated discharges keeping
all other plasma parameters constant.
The electron density profile (measured
with Thomson scattering, reflectometry and
-100
-200-0.08 0.1 0.12
r (in)0.14
y p g p pkept constant while magnetic field and rotation have opposite E Π) d o t c h e a g
sign in both. °
Li-beam) and the electron temperature profilerig. 6: dcp/dt as a function of radius in two
symmetrical plasma configurations. All plasma parameters are (measured with Thomson scattering andm a g n e t i c f i d d i s
reversed. Impurity rotation changes sign
confirming the inversion of the ExB velocity.
Fig. 6 shows the radial profile of the phase drift for positive and negative magnetic field: for all
probed radial positions the drift is inverted as the plasma rotation is reversed. Nevertheless, for some
- 174 -
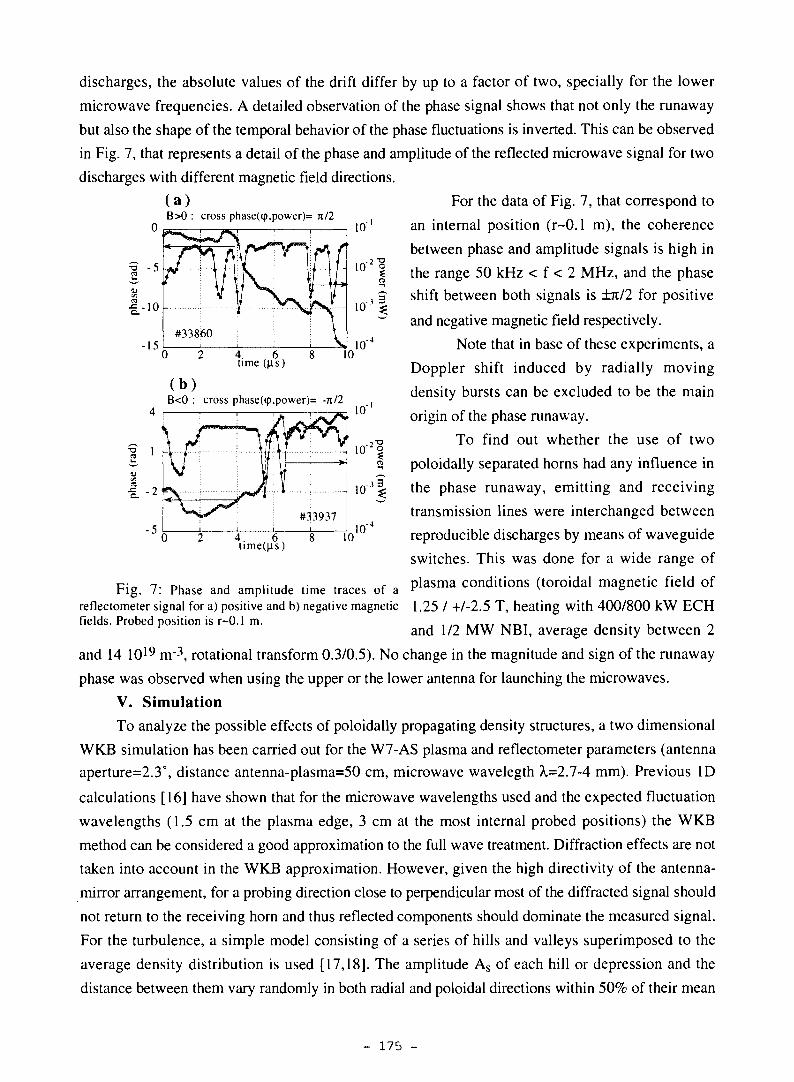
( a )B>0 : cross phase(<p,power)= it/2
4 6time (us)
( b )B<0 : cross phase(<p,power)= -JC/2
1010'
discharges, the absolute values of the drift differ by up to a factor of two, specially for the lower
microwave frequencies. A detailed observation of the phase signal shows that not only the runaway
but also the shape of the temporal behavior of the phase fluctuations is inverted. This can be observed
in Fig. 7, that represents a detail of the phase and amplitude of the reflected microwave signal for two
discharges with different magnetic field directions.
For the data of Fig. 7, that correspond to
an internal position (r~0.1 m), the coherence
between phase and amplitude signals is high in
the range 50 kHz < f < 2 MHz, and the phase
shift between both signals is +7T./2 for positive
and negative magnetic field respectively.
Note that in base of these experiments, a
Doppler shift induced by radially moving
density bursts can be excluded to be the main
origin of the phase runaway.
To find out whether the use of two
poloidally separated horns had any influence in
the phase runaway, emitting and receiving
transmission lines were interchanged between
reproducible discharges by means of waveguide
switches. This was done for a wide range of
c- -,. D. , ... , ,. , , plasma conditions (toroidal magnetic field ofr i g . / : Phase and amplitude time traces of a ^ v °
reflectometer signal for a) positive and b) negative magnetic 1.25 / +/-2.5 T, heating with 400/800 kW ECHfields. Probed position is r~0.1 m. , , ,_ . , , , . . T _ T , . , _
and 1/2 MW NBI, average density between 2
and 14 1019 n r \ rotational transform 0.3/0.5). No change in the magnitude and sign of the runaway
phase was observed when using the upper or the lower antenna for launching the microwaves.
V. SimulationTo analyze the possible effects of poloidally propagating density structures, a two dimensional
WKB simulation has been carried out for the W7-AS plasma and reflectometer parameters (antenna
aperture=2.3°, distance antenna-plasma=50 cm, microwave wavelegth ?i=2.7-4 mm). Previous ID
calculations [16] have shown that for the microwave wavelengths used and the expected fluctuation
wavelengths (1.5 cm at the plasma edge, 3 cm at the most internal probed positions) the WKB
method can be considered a good approximation to the full wave treatment. Diffraction effects are not
taken into account in the WKB approximation. However, given the high directivity of the antenna-
mirror arrangement, for a probing direction close to perpendicular most of the diffracted signal should
not return to the receiving horn and thus reflected components should dominate the measured signal.
For the turbulence, a simple model consisting of a series of hills and valleys superimposed to the
average density distribution is used [17,18]. The amplitude As of each hill or depression and the
distance between them vary randomly in both radial and poloidal directions within 50% of their mean
4. 6xtime(|is)
- 175 -
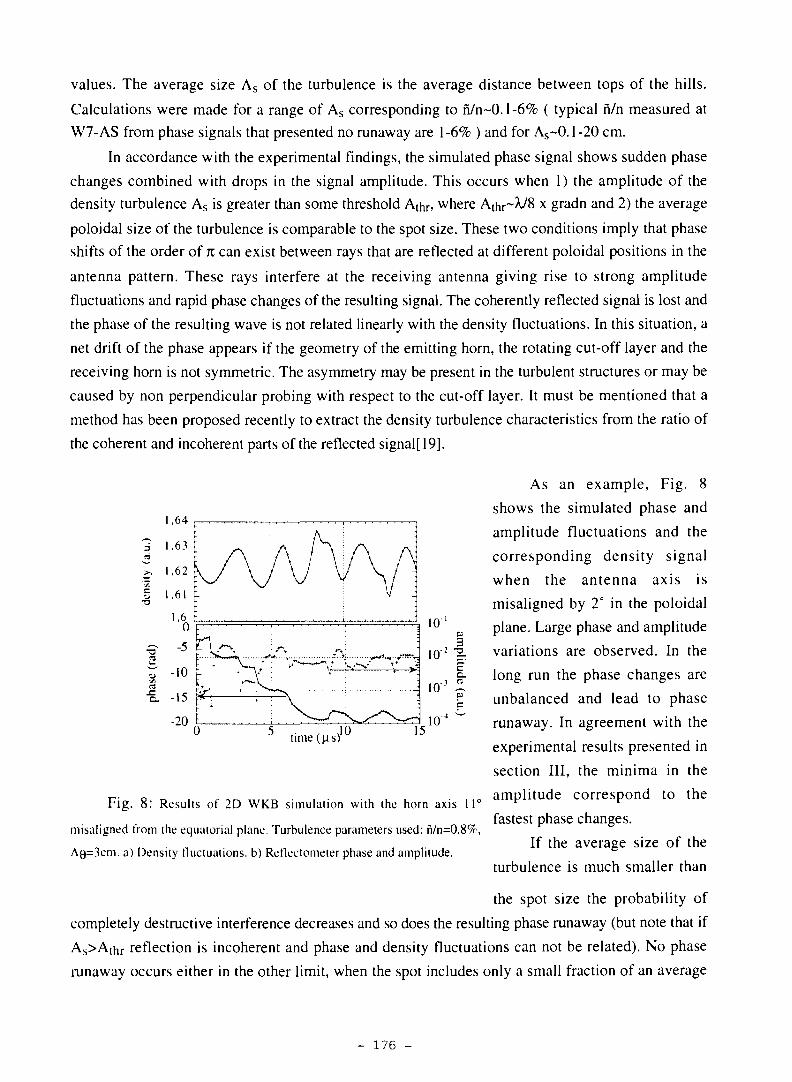
values. The average size As of the turbulence is the average distance between tops of the hills.
Calculations were made for a range of As corresponding to n/n~0.1-6% ( typical n/n measured at
W7-AS from phase signals that presented no runaway are 1-6% ) and for As~0.1-20 cm.
In accordance with the experimental findings, the simulated phase signal shows sudden phase
changes combined with drops in the signal amplitude. This occurs when 1) the amplitude of the
density turbulence As is greater than some threshold Athr, where Athr~A/8 x gradn and 2) the average
poloidal size of the turbulence is comparable to the spot size. These two conditions imply that phase
shifts of the order of K can exist between rays that are reflected at different poloidal positions in the
antenna pattern. These rays interfere at the receiving antenna giving rise to strong amplitude
fluctuations and rapid phase changes of the resulting signal. The coherently reflected signal is lost and
the phase of the resulting wave is not related linearly with the density fluctuations. In this situation, a
net drift of the phase appears if the geometry of the emitting horn, the rotating cut-off layer and the
receiving horn is not symmetric. The asymmetry may be present in the turbulent structures or may be
caused by non perpendicular probing with respect to the cut-off layer. It must be mentioned that a
method has been proposed recently to extract the density turbulence characteristics from the ratio of
the coherent and incoherent parts of the reflected signal[19].
As an example, Fig. 8
shows the simulated phase and
amplitude fluctuations and the
corresponding density signal
when the antenna axis is
misaligned by 2° in the poloidal
plane. Large phase and amplitude
variations are observed. In the
long run the phase changes are
unbalanced and lead to phase
runaway. In agreement with the
experimental results presented in
section III, the minima in the
c . o . . . amplitude correspond to theFig. 8: Results ot 2D WKB simulation with the horn axis 11° F F
fastest phase changes.
If the average size of the
turbulence is much smaller than
-o
time (us) 15
misaligned from the equatorial plane. Turbulence parameters used: n/n=0.8%,
A0=3cm. a) Density fluctuations, b) Reflectometer phase and amplitude.
the spot size the probability of
completely destructive interference decreases and so does the resulting phase runaway (but note that if
As>Athr reflection is incoherent and phase and density fluctuations can not be related). No phase
runaway occurs either in the other limit, when the spot includes only a small fraction of an average
- 176 -
wavelength. For intermediate values of As and provided the necessary condition As>Athr is fulfilled,
the resulting runaway is larger the larger is the amplitude of the density turbulence As. For large As,
strong fluctuations in the signal amplitude that are incoherent with the phase oscillations appear and
the phase spectra have a 1/f behaviour, (even when no asymmetry exists[18]). For low values of As
the phase runaway <d(p/dt> is lower, phase fluctuations correlated with density fluctuations can be
distinguished from the phase of the incoherent signal and the phase spectra are different from 1/f.
This is consistent with the experimental observations that were described in section III and coincides
also with the predictions of the random phase screen model [12,20] for low and high turbulence cases
when the measurement takes place beyond the diffraction scale length for the phase screen.
The wavelengths of the fluctuations are supposed to be much larger in toroidal than in poloidal
direction [21]. If this is the case, the effect of the toroidal pattern of the cut-off layer on the resulting
amplitude and phase signals should be much smaller than the effect of the poloidal pattern. This is the
reason why the toroidal rotation has not been considered in the simulation.
In conclusion, the simulations confirm that a drift in the phase can appear when there are
poloidally rotating structures in the plasma provided some asymmetry exists. The drift is due to the
existence of a rough cut-off surface (A>Athr) and the finite spot size. Recently, a 2D full wave code
has been developed [16] and its predictions will be compared to the ones of the WKB code.
VI. ConclusionsThe reflectometry system at W7-AS has been used to investigate the phase runaway effect
observed at most reflectometer devices. Due to the dynamic range and bandwidth of the system an
instrumental origin of the phenomenon, e.g. due to intermittent loss of the reflected signal, can be
excluded. Besides, the measured phase runaway strongly depends on plasma conditions.
It has been proposed [7,2,4,5] that the phase runaway can be explained by a Doppler shift of
the reflected radiation caused e.g. by plasma rotation and either a non-perpendicular line of sight or
poloidally asymmetric density structures at the cut-off layer. The relation of the phase runaway with
plasma rotation in W7-AS has been confirmed by a comparison of the runaway radial profile with the
plasma poloidal rotation profile as obtained from impurity spectroscopy. In addition, it has been
demonstrated that the direction of the phase drift can be inverted by inverting plasma rotation.
Therefore, an explanation based on the existence of asymmetric density structures would require that
the asymmetry be independent on the rotation direction. For example, velocity shear induced
asymmetries should be excluded. The most plausible explanation of the asymmetry in W7-AS would
then be a tilt of the antenna axis with respect to the plasma.
2D WKB simulations of reflection on a rotating plasma made for the W7-AS plasma and
reflectometer parameters show that for the expected turbulence conditions a phase runaway can
appear due to the slight tilt of the antennas (2.6°) with respect to the normal to the cut-off surfaces.
Moreover, the simulations reproduce qualitatively some of the experimentally observed features of the
phase runaway: the 1/f phase spectra and the correspondence between minima in the amplitude of
reflected signal and the fastest phase changes. Quantitative results cannot be deduced from these
- 177 -
simulations as the phase response is very sensitive to the particular parameters of plasma turbulence
and the antenna-plasma geometry. In particular the orientation of the cut-off surfaces at the plasma
edge of the low shear stellarator W7-AS can change due to the neighbourhood of island structures
and thus depends on the edge rotational transform.
It is difficult to extract information about the plasma rotation velocity from the mean phase
runaway measurements, as the phase drift depends on turbulence parameters (amplitude and
wavelengths) which are usually unkonwn. Besides, the observed intermittent phase evolution
complicates even more the interpretation of the phase runaway in terms of plasma rotation. This
behaviour can in principle be explained by the non-linear response of the phase measurement to the
local density fluctuations at the reflecting layer (small changes in the amplitude and wavelength
characteristics can produce a completely different phase response). However, the intermittency could
also be the result of a real intermittent behaviour of the plasma : the appearance and disappearance of
small turbulent structures or a sudden change in their characteristics. It is worth to be mentioned that
given the high instantaneous dcp/dt, great care must be taken when measuring the profiles with FM
techniques.
Based on the comparison betweeen the experimental results and the 2D WKB simulation we
can state that the observation of a phase runaway is a consequence of the 2-dimensionality of the
reflection process (which under turbulent plasma conditions is modified by refraction, diffraction and
scattering phenomena). The absence of the phase runaway is a necessary but nevertheless not
sufficient condition to state that 2D effects do not affect the fluctuation measurement (e.g. runaway is
not present in cases without asymmetry or with very broad antenna pattern). However, for plasma
regimes where the phase signal shows no runaway and fluctuations of the reflected signal amplitude
are low - like in the H-mode - the measured phase can be related with the density at the cut-off layer
following a ID scheme.
AcknowledgementsThe authors would like to thank G. Kuhner for the Thomson scattering data and Ch. Konrad
for help with the data acquisition.
References
[I] Sips AC C 1991 Ph. D. Thesis Eindhoven Holland[2] Aleksandrov V O, Bulanin V V, Korneyev D O, Sergeyev A A, 1992 Proc. 19th Eur. Conf. onControlled Fusion and Plasma Physics (Berlin) vol 16C I 111[3] Hanson G R et al. 1992 Nucl. Fusion 32 1593[4] Sanchez J, Estrada T, Hartfufi H J 1992 Proc. 1st IAEA Tech. Comm. Meeting on MicrowaveReflectometry for Fusion Plasma Diagnostics (Abingdon) 133[5] Bulanin V V, Korneev D O 1994 Plasma Physics Reports 20 (1) 14[6] Ejiri A, Kawahata K, Tanaka K and JIPP TII-U group 1995 Proc. Toki Conference[7] Irby J H, Home S, Hutchinson IH, Stek P C 1993 Plasma Phys. Control. Fusion. 35 601[8] Hartfufi H J, Estrada T, Hirsch M, Geist T, Sanchez J 1994 Rev. Sci. Instrum 65 (7) 2284[9] Hirsch M, Hartfufi H J, Geist T, de la Luna E 1996 Rev. Sci. Instrum. 67(5) 1807[10] Conway G D. "2D Physical optics simulationoffluctuation reflectometry". These proceedings[11 ] Conway G D, Vayakis G, Bartlett D V. "Reflectometer fluctuation and correlation studies onJET". These proceedings[12] Nazikian R, Mazzucato E 1995 Rev. Sci. Instrum. 66 392
- 178 -
[13] Rhodes T L. "Comparison of Density Fluctuation Measurements from Reflectometry andLangmuir Probes". These proceedings[14] Branas B, Hirsch M, Zhuravlev J, Sanchez J, de la Luna E, Estrada T, Geist T, Hartfufi H J1995 Proc. 22nd Eur. Conf on Controlled Fusion and Plasma Physics (Bournemouth) vol. 19C IV161.[15] Hirsch M et al 1996 Plasma Physics and Controlled Nuclear Fusion Research (Proc. 16th Int.Conf. Montreal) IAEA-F1-CN-64/CP 26[16] Grossmann M T, Holzhauer E, Hirsch M, Serra F, Manso M.E., Nunes I. " A 2D Code for theAnalysis of Microwave Reflectometry Measurements in Fusion Experiments ". These proceedings[17] Zhuravlev V, Sanchez J, de la Luna E 1995. Proc. 22nd Eur. Conf. on Controlled Fusion andPlasma Physics (Bournemouth) vol. 19CIV 433.[18 JZhuravlev V, Sanchez J, de la Luna E 1996 Plasma Phys. Control. Fusion 38(12A) 2231[19 JConway G D, Schott L, Hirose A 1996 Plasma Phys. Control. Fusion 38 451[20] Mazzucato E, Nazikian R 1995 Rev. Sci. Instrum. 66 1237[21] Rudyj A et al 1989 Proc. 16th Eur. Conf. on Controlled Fusion and Plasma Physics (Venice)vol. 13B I 27.
- 179 -