
Ieder proces kent niet wenselijke variatie, · The necessity of training farm hands for first class...
101
Procesvariatie Ieder proces kent niet wenselijke variatie, kan ik er iets aan doen ? www.Holland-innovative.nl
Transcript of Ieder proces kent niet wenselijke variatie, · The necessity of training farm hands for first class...

Procesvariatie
Ieder proces kent niet wenselijke variatie,
kan ik er iets aan doen ?
www.Holland-innovative.nl

© Holland Innovative SKL Event - Jan. 11th 2019
Introduction
2006 - 2011
MBB; Program Mgr; DfX
Mfg & Dev
Six Sigma (DMAIC & DIDOV)
Electrical cabinets
1994 – 2001
Department Head
Melotte BV
Marcel Logger
2011 - 2016
MBB
Log & Business
Lean Six Sigma (DMAIC & DIDOV)
2001 - 2006
Quality + BB
Mfg & Dev
Six Sigma (DMAIC)
www.Holland-innovative.nl

Holland Innovative
© Holland Innovative SKL Event - Jan. 11th 2019E
xecutive E
vents
Round T
able
Meetings
Tra
inin
g a
nd S
em
inars
User
Gro
ups
Why improve processes?
© Holland Innovative SKL Event - Jan. 11th 2019

Typical issues - Cost
© Holland Innovative SKL Event - Jan. 11th 2019
M0012-5
(Netherlands: total medical costs are 14% of GNP)
• Examples:– Low utilization of high CAPEX resources (MRI, CAT scanners)
– Inefficient deployment of staff.
– Long length-of-stay of patients.
– Waste of food, linen, pharmaceuticals → Inefficient inventory management policies (“Just buy a lot …”)
→ Poor process control (<43% of food is actually consumed by
patients …)
– Naïve purchasing policies.→ Purchase price vs. Total Cost of Ownership
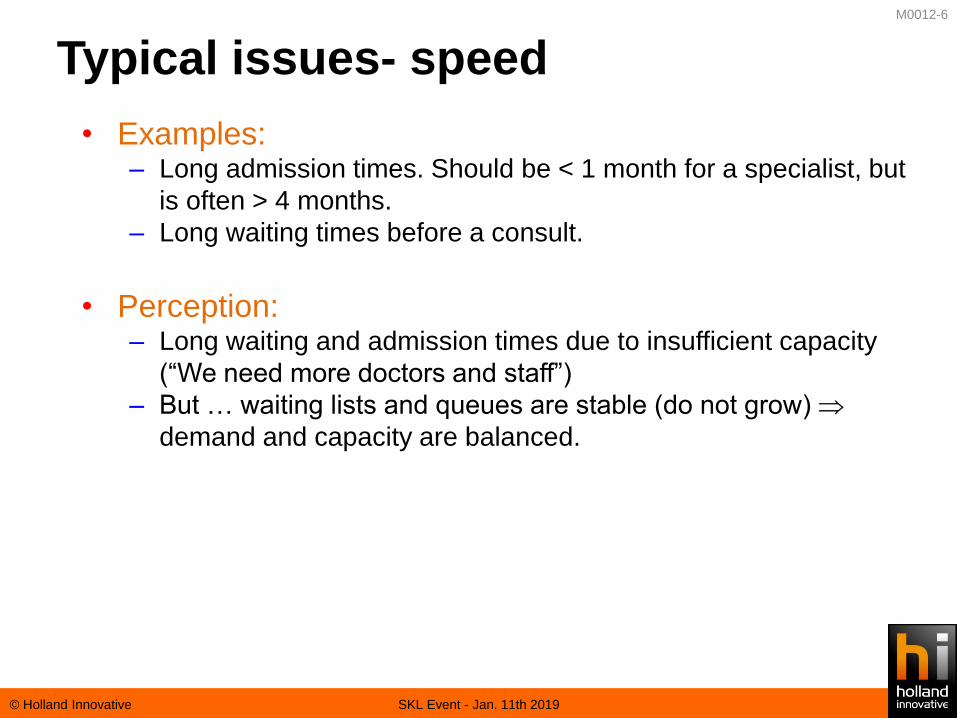
Typical issues- speed
© Holland Innovative SKL Event - Jan. 11th 2019
M0012-6
• Examples:– Long admission times. Should be < 1 month for a specialist, but
is often > 4 months.
– Long waiting times before a consult.
• Perception: – Long waiting and admission times due to insufficient capacity
(“We need more doctors and staff”)
– But … waiting lists and queues are stable (do not grow)
demand and capacity are balanced.
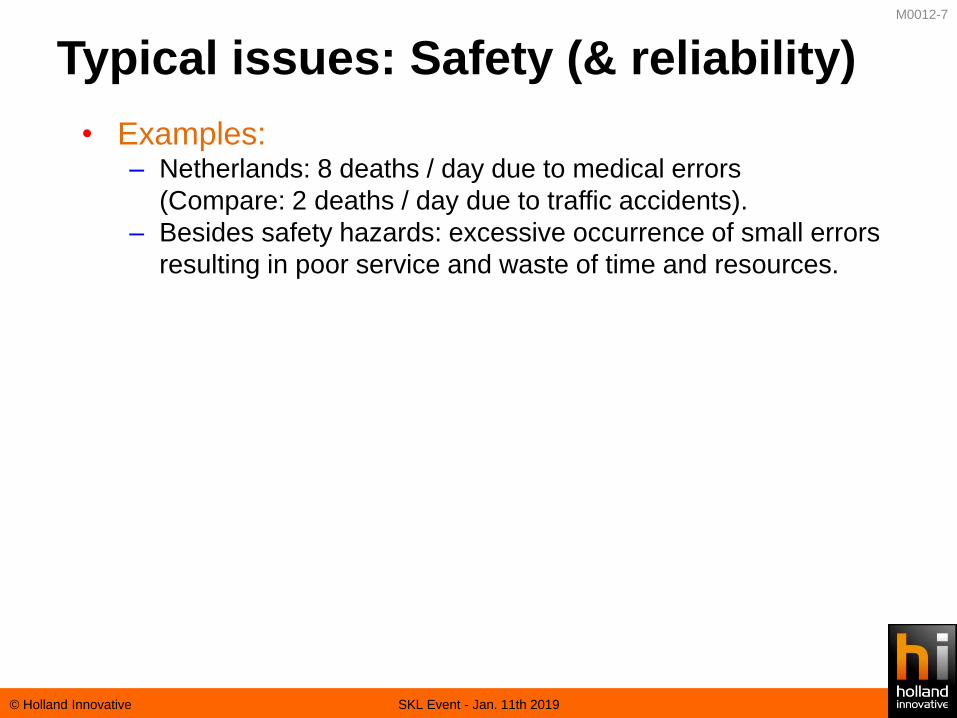
Typical issues: Safety (& reliability)
© Holland Innovative SKL Event - Jan. 11th 2019
M0012-7
• Examples:– Netherlands: 8 deaths / day due to medical errors
(Compare: 2 deaths / day due to traffic accidents).
– Besides safety hazards: excessive occurrence of small errors
resulting in poor service and waste of time and resources.
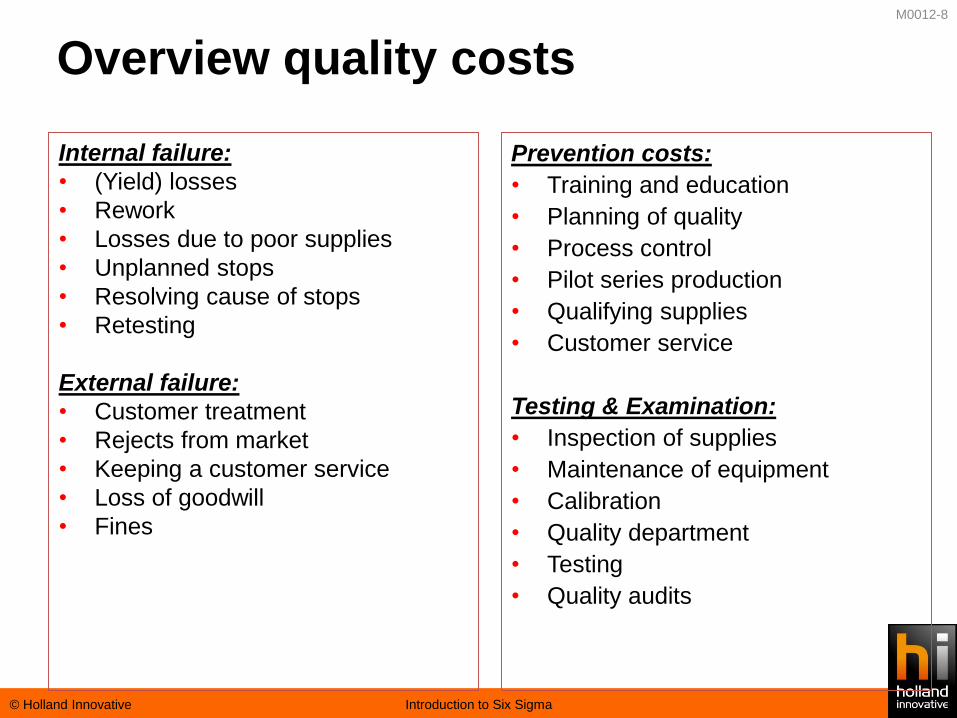
Overview quality costs
© Holland Innovative Introduction to Six Sigma
Internal failure:
• (Yield) losses
• Rework
• Losses due to poor supplies
• Unplanned stops
• Resolving cause of stops
• Retesting
External failure:
• Customer treatment
• Rejects from market
• Keeping a customer service
• Loss of goodwill
• Fines
Prevention costs:
• Training and education
• Planning of quality
• Process control
• Pilot series production
• Qualifying supplies
• Customer service
Testing & Examination:
• Inspection of supplies
• Maintenance of equipment
• Calibration
• Quality department
• Testing
• Quality audits
M0012-8
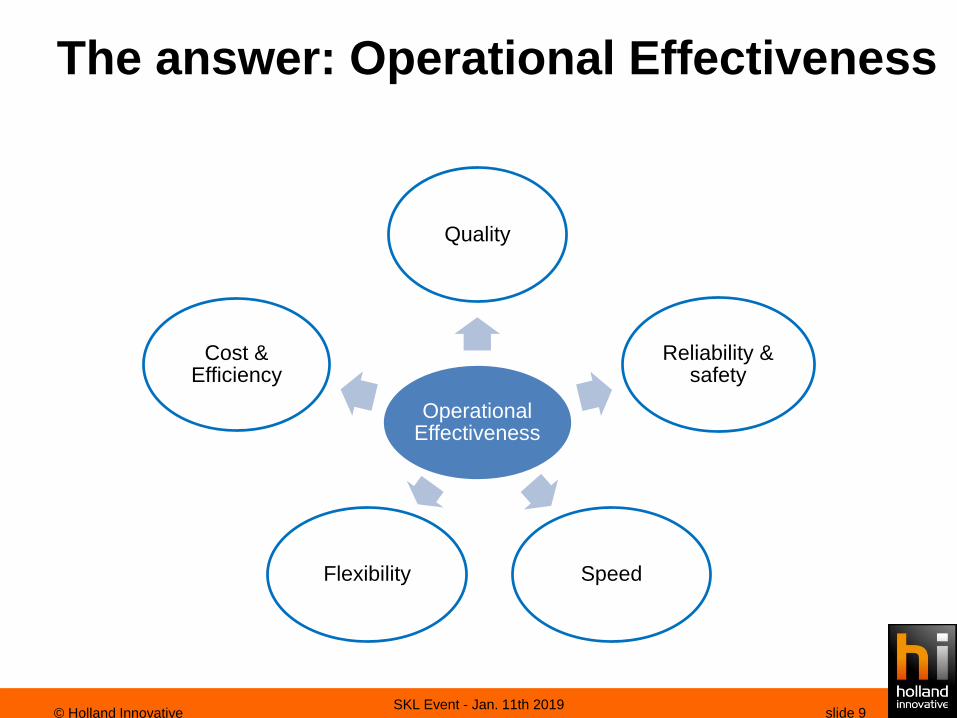
The answer: Operational Effectiveness
Operational Effectiveness
Quality
Reliability & safety
SpeedFlexibility
Cost & Efficiency
slide 9© Holland InnovativeSKL Event - Jan. 11th 2019

Operational Effectiveness
slide 10© Holland Innovative
Juran Deming
• Lean Six Sigma
• 1990s:– Six Sigma
– Lean Thinking & Just-In-Time
– Theory of Constraints (TOC)
– Business Process Management (BPM)
• 1980s:– Total Quality Management (TQM)
– Business Process Reengineering (BPR)
• 1920–1950s:– Quality Control
• 1880–1920s:– Scientific management
Ohno
Taylor Gantt
SKL Event - Jan. 11th 2019
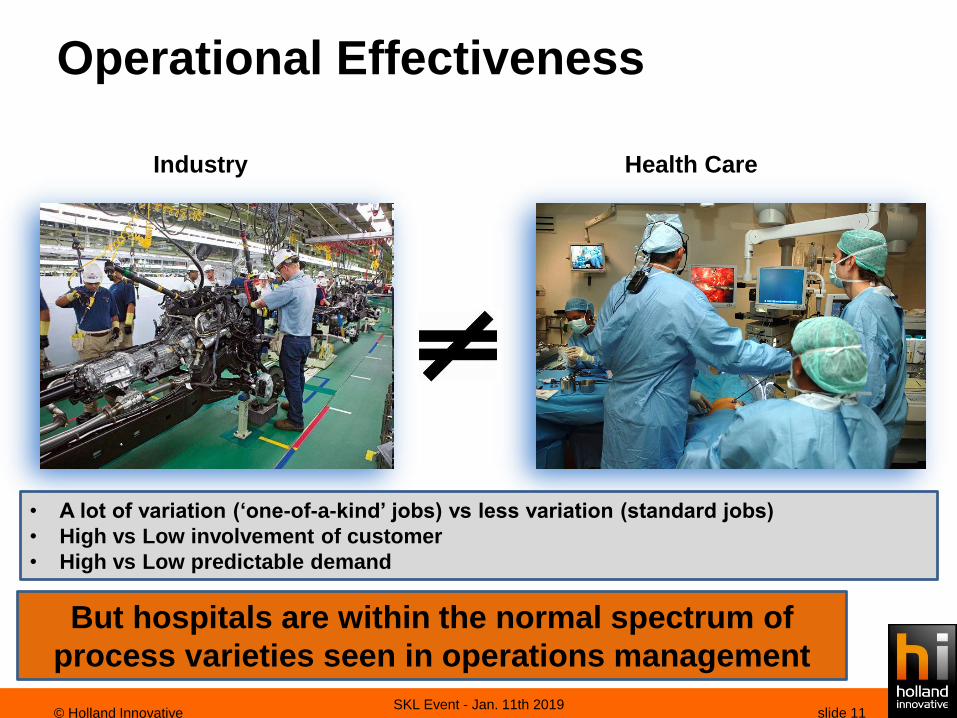
Operational Effectiveness
slide 11© Holland Innovative
Industry Health Care
• A lot of variation (‘one-of-a-kind’ jobs) vs less variation (standard jobs)
• High vs Low involvement of customer
• High vs Low predictable demand
SKL Event - Jan. 11th 2019
But hospitals are within the normal spectrum of
process varieties seen in operations management

Lean Six Sigma
• Lean Six Sigma is a combination of two powerful
methodologies: Lean and Six Sigma
• The Lean toolkit provides ways to streamline processes by
reducing Waste.
• The Six Sigma toolkit provides tools to reduce defects by
conducting root cause analysis.
• Together, they provide the fastest, most effective way to
improve processes.
Lean Six Sigma
© Holland Innovative SKL Event - Jan. 11th 2019

Lean Six Sigma
SKL Event - Jan. 11th 2019
Lean
Eliminate Waste
Process Flow
Pull Systems
Easy, Visual
Approach
IncrementalChange
Smaller / shorterprojects
Six Sigma
Eliminatie Defects
Process Yield
Capable Systems
Rigorous, Analytical,
Approach
Large impact
Larger / longerprojects
© Holland Innovative

Benefits
Reductions in:
Defects
Quality issues
Variation
Lead time
Inventory
Waste
Employee Engagement
Quality improvement
Customer satisfaction
Bottom line savings
Customer focused
Data based decisions
Profit
Safety
Responsiveness
Productivity
© Holland Innovative SKL Event - Jan. 11th 2019
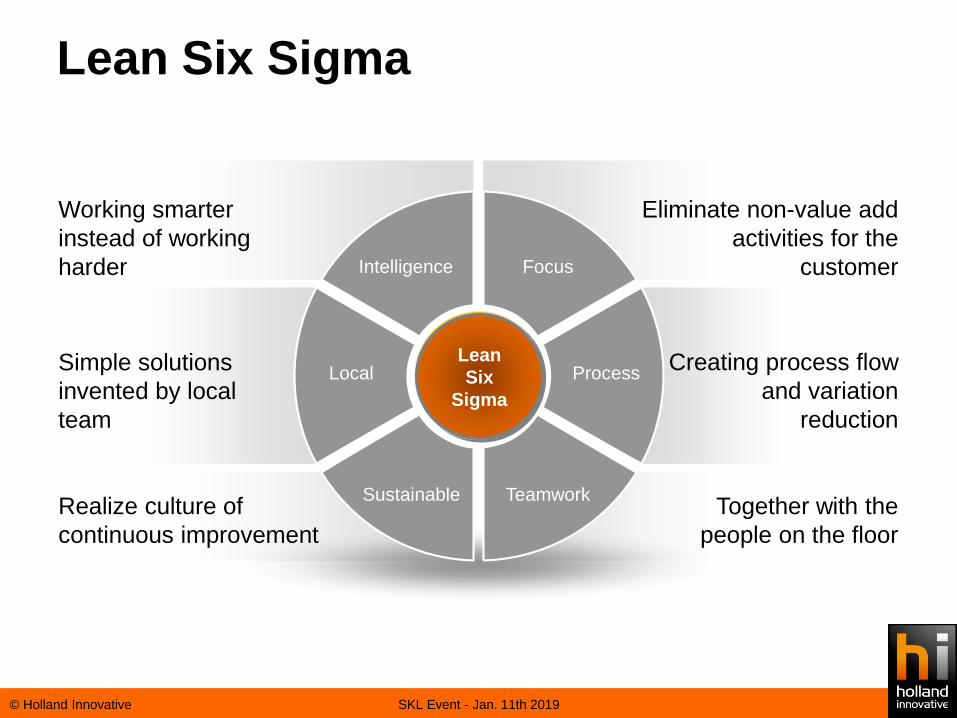
Lean Six Sigma
SKL Event - Jan. 11th 2019
Eliminate non-value add
activities for the
customer
Creating process flow
and variation
reduction
Realize culture of
continuous improvement
Working smarter
instead of working
harder
Simple solutions
invented by local
team
Teamwork
Process
Together with the
people on the floor
Sustainable
Local
Intelligence
LEAN
Focus
Lean
Six
Sigma
© Holland Innovative
An approach, a philosophy
© Holland Innovative SKL Event - Jan. 11th 2019
• An Attitude, a structured way to execute activities (a
philosophy) to be engraved in your DNA.
• A Method, to achieve the first time right development and
sustainable improvement.
• A Metric, related to variation related to a specification.

Sigma - a Metric
© Holland Innovative SKL Event - Jan. 11th 2019
Sigma:
• Greek character “σ”
• Measure for spread or variation from an mean value
In statistics:
• Standard Deviation of a population
Six Sigma - a Metric
© Holland Innovative SKL Event - Jan. 11th 2019
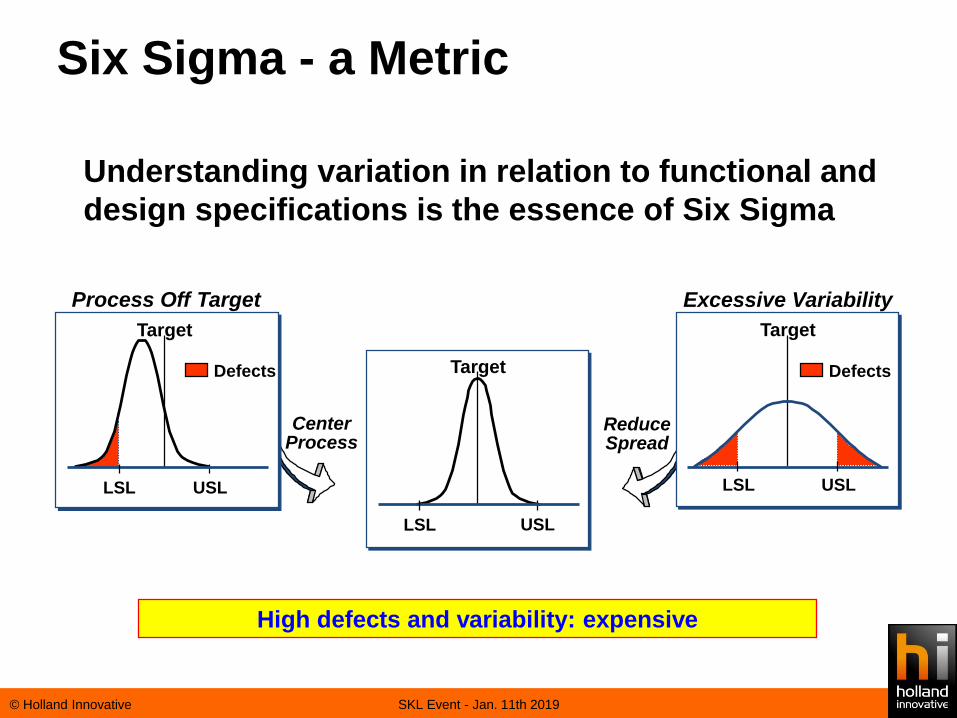
Target
USLLSL
CenterProcess
ReduceSpread
Target
USLLSL
Process Off Target
Defects
Target
USLLSL
Excessive Variability
Defects
High defects and variability: expensive
Understanding variation in relation to functional and
design specifications is the essence of Six Sigma
Based on…..
© Holland Innovative SKL Event - Jan. 11th 2019
• Understanding customers needs,
• Understanding Performance Specifications at all
levels.
• Meeting these needs every time, over a specified
lifetime, under all use conditions.

• Purpose: Demonstrates Variation
• Instructions:– Read the next page carefully.
– How many times does the 6th letter of the Alphabet appear in the
text?
– You will have 2 minutes.
Exercise
YB LSS Training

Exercise
YB LSS Training
The necessity of training farm hands for first class farms in the fatherly handling of farm livestock is foremost in the eyes of farm owners. Since the forefathers of the farm owners trained the farm hands for first class farms in the fatherly handling of farm livestock, the farm owners feel they should carry on with the family tradition of training farm hands of first class farmers in the fatherly handling of farm livestock because they believe it is the basis of good fundamental farm management.
What is variation?YB LSS Training
• Variation is deviation from expectation.
• It’s part of everydays life and part of every
organisation.
• Inevitable change in the output or result of a process.
• All processes vary over time.
• The goal is to understand variation, control it, and
minimize its impact.

Interest in variation
YB LSS Training
Spread = big
Centred
Capability = poor
Spread = small
Off-centred
Capability = poor
Spread = small
Centred
Capability = great
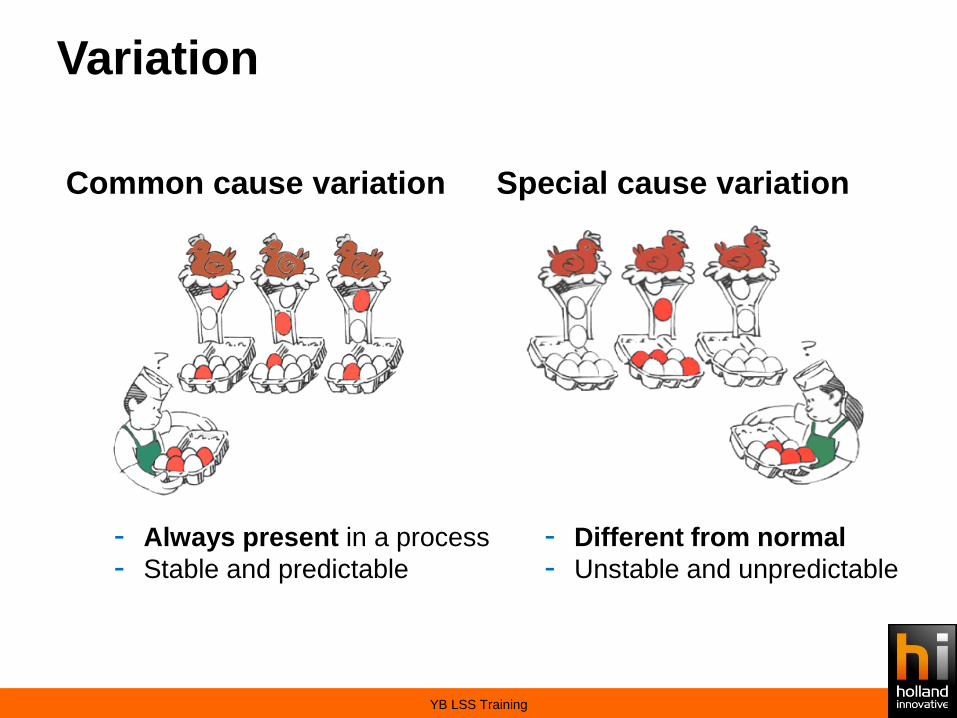
Variation
YB LSS Training
Common cause variation
- Always present in a process
- Stable and predictable
Special cause variation
- Different from normal
- Unstable and unpredictable
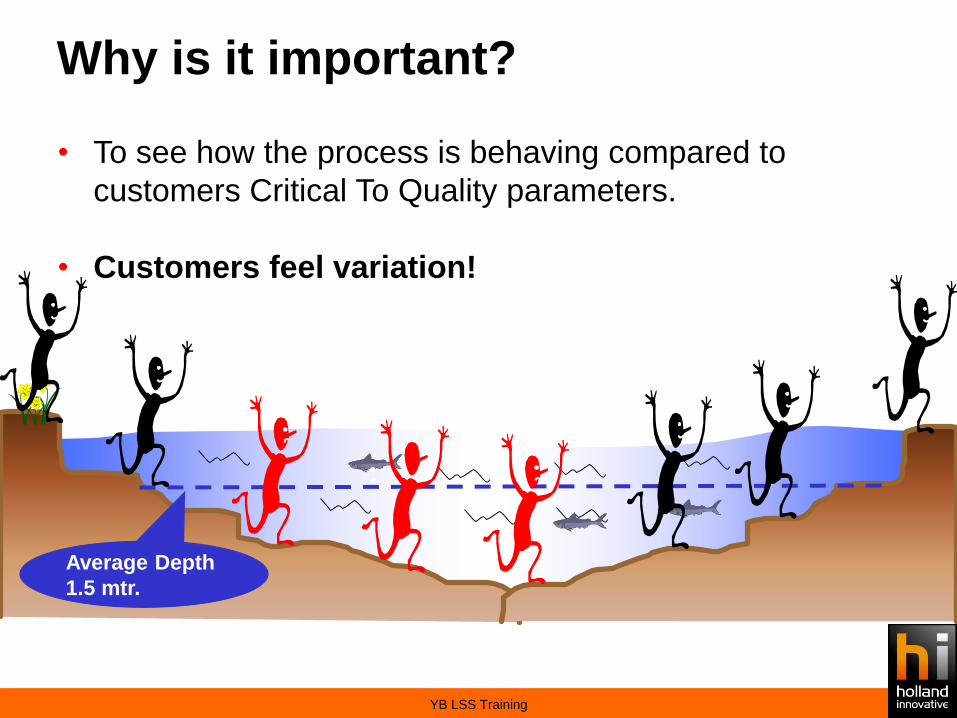
Why is it important?
YB LSS Training
• To see how the process is behaving compared to
customers Critical To Quality parameters.
• Customers feel variation!
Average Depth
1.5 mtr.

YB LSS Training
Who is your customer? What are your customers'
requirements?
© Holland Innovative CTQ Flow Down
M0043-28

• A CTQ is important for the Customer, in other words it is a
characteristic that determines whether the overall process
or product performance is perceived to meet the Customers
Expectation
Critical to Quality (CTQ) Definition
CTQ Flow Down© Holland Innovative
M0043-29
Target value
Tolerance
KPI
Output
characteristic

slide 30FMEA – 3-1: CTQ Flowdown© Holland Innovative
Product or
service
People
Equipment
Methods
Material
Environment
Knowledge
The
customer
The Process
Voice of customer
Voice of Process

CTQ Flow Down (1/2)
• CTQ flow down is a method of converting the Voice of the
Customer into specific features for a service or product
which have a significant impact on the Customer Experience
© Holland Innovative CTQ Flow Down
M0043-31
Voice of
Customer
(VOC)
Voice of
Business
(VOB)
Quality
Time
Cost
........
Need Aspects (CTQs) Measurable characteristic
CTQ 3 Critical factor
CTQ 2 Continuous
CTQ 1 Discrete

CTQ example – newspaper subscriber
slide 32FMEA – 3-1: CTQ Flowdown© Holland Innovative
Be well informed
about situation in
the world
Good readability
articles
Quick navigating
through headers
On time delivery
Good font
No language errors
Remarkably stated
Must cover topic
Correct delivery time
Undamaged
Before 7 am
VOC
CTQ
CTQ
CTQ
CTQ
CTQ
CTQ

CTQ example – infusion pumps
slide 33FMEA – 3-1: CTQ Flowdown© Holland Innovative
Operational costs
# in
use
# in
stock
# in
maintenance#
lost
Total costs
Usage & maintenance
Amount of pumpsCosts usage and maintenance
(per piece)
Strategic
focus
Project target
CTQ CTQ CTQ CTQ
CTQ
# maintenance
events
Throughput
time
CTQ CTQ

Measurement System Analysis
© Holland Innovative Measurement System Analysis
S2000-34

If you cannot measure, you
cannot improve!
© Holland Innovative Measurement System Analysis
“Taguchi”
S2000-35

Where is Data coming from?
© Holland Innovative Measurement System Analysis
S2000-36
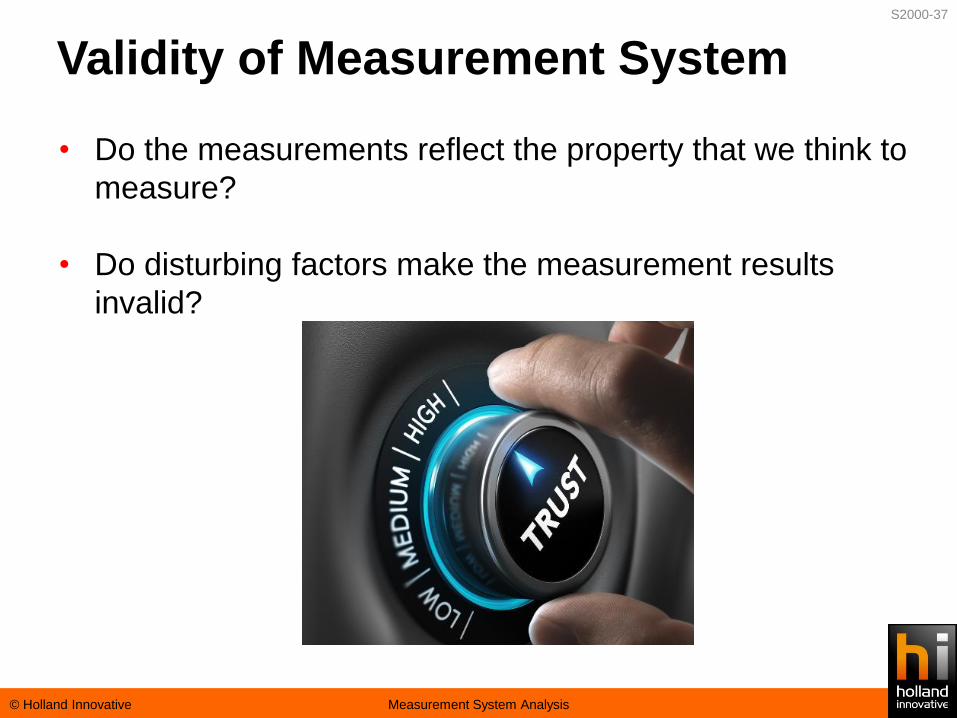
Validity of Measurement System
© Holland Innovative Measurement System Analysis
• Do the measurements reflect the property that we think to
measure?
• Do disturbing factors make the measurement results
invalid?
S2000-37

© Holland Innovative Measurement System Analysis
Measurement Devices
S2000-38
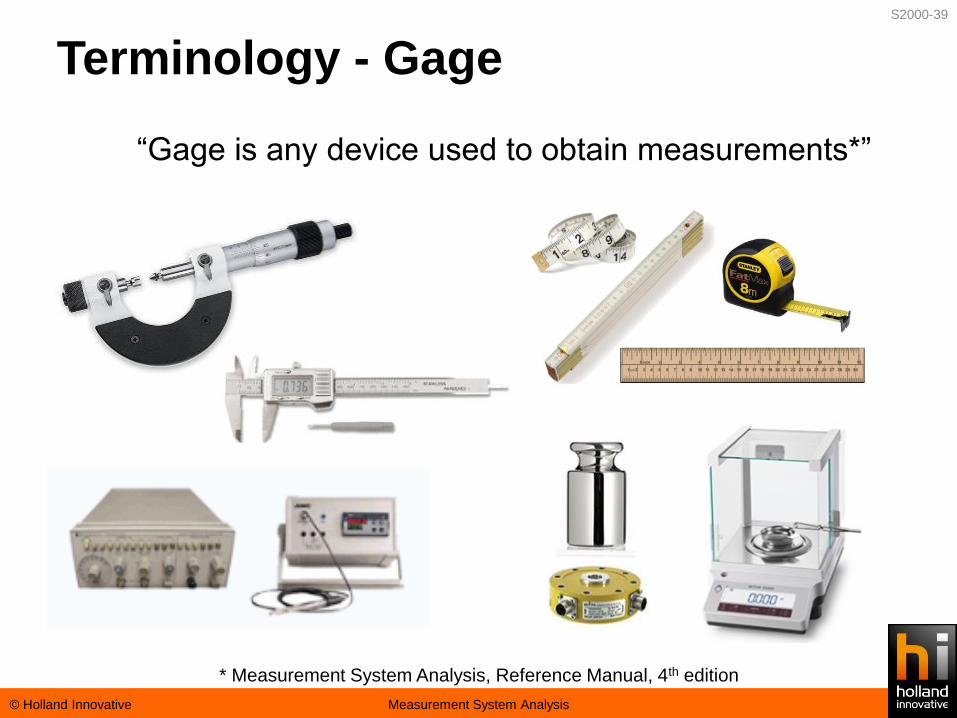
“Gage is any device used to obtain measurements*”
Terminology - Gage
© Holland Innovative Measurement System Analysis
* Measurement System Analysis, Reference Manual, 4th edition
S2000-39
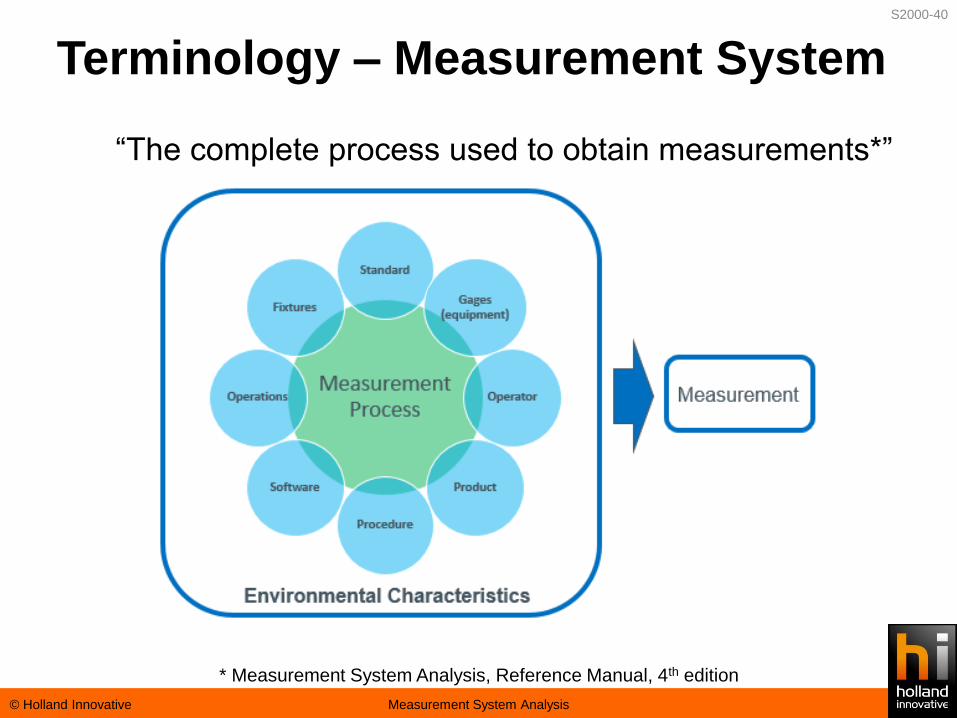
“The complete process used to obtain measurements*”
Terminology – Measurement System
© Holland Innovative Measurement System Analysis
* Measurement System Analysis, Reference Manual, 4th edition
S2000-40
• Too many business problems are analyzed with data that is
known to be suspect.
• Just as a process has inherent variation, the process of
measurement has variation too.
• Process variation observed comprises of the true process
variation and the measurement variation.
• When unaware, we face the
risk of making a poor decision.
Process of Measurement
© Holland Innovative Measurement System Analysis
S2000-41

What is a MSA?
© Holland Innovative Measurement System Analysis
• Measurement System Analysis (MSA), is a designed
experiment to determine the amount of variation contributed
by the measurement system.
• Objective:– Confirm that the measurement system used to collect the data is
valid (fit for use)
– Minimize the measurement system variation,
– And its impact on the total variation so the amount of process
variation can be understood as precisely as possible
S2000-42
Sources of Variation
© Holland Innovative Measurement System Analysis
• Observed variation is the sum of all variation-sources:
– Part-to-Part variation
– Measurement system variation
• If measurement system variation is large compared to the total
observed variation
then– your measurements will not tell much about process quality
– It is not possible to distinguish between part-to-part variation and
measurement system variation
– you cannot predict if your customer will get satisfactory products.
S2000-43

“Measurement variation
is often the biggest
source of variation”
© Holland Innovative Measurement System Analysis
S2000-44
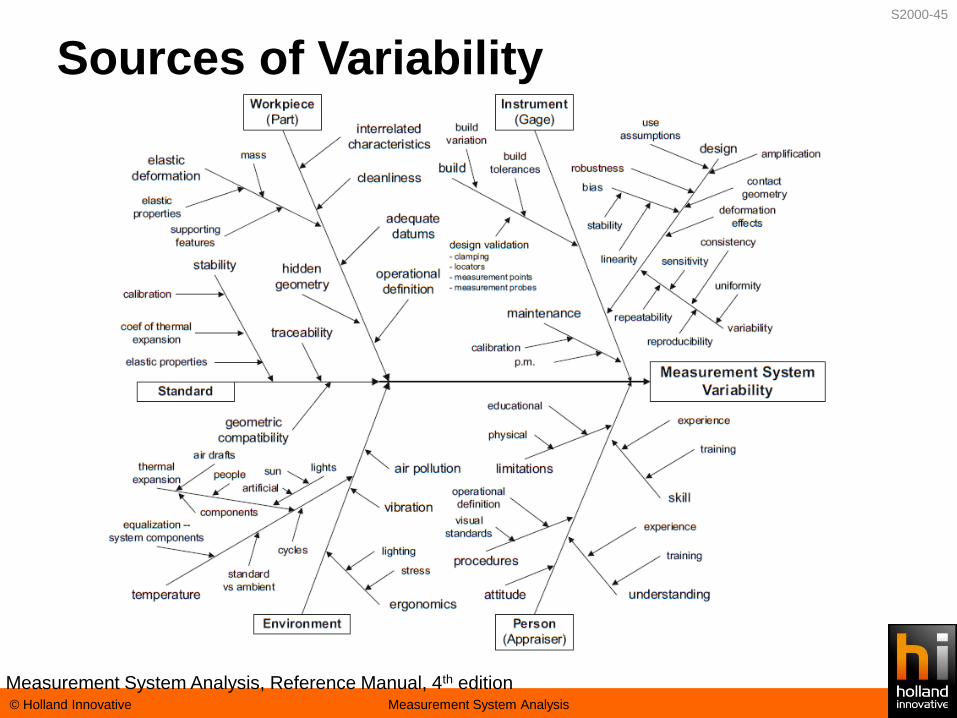
Sources of Variability
© Holland Innovative Measurement System Analysis
Measurement System Analysis, Reference Manual, 4th edition
S2000-45
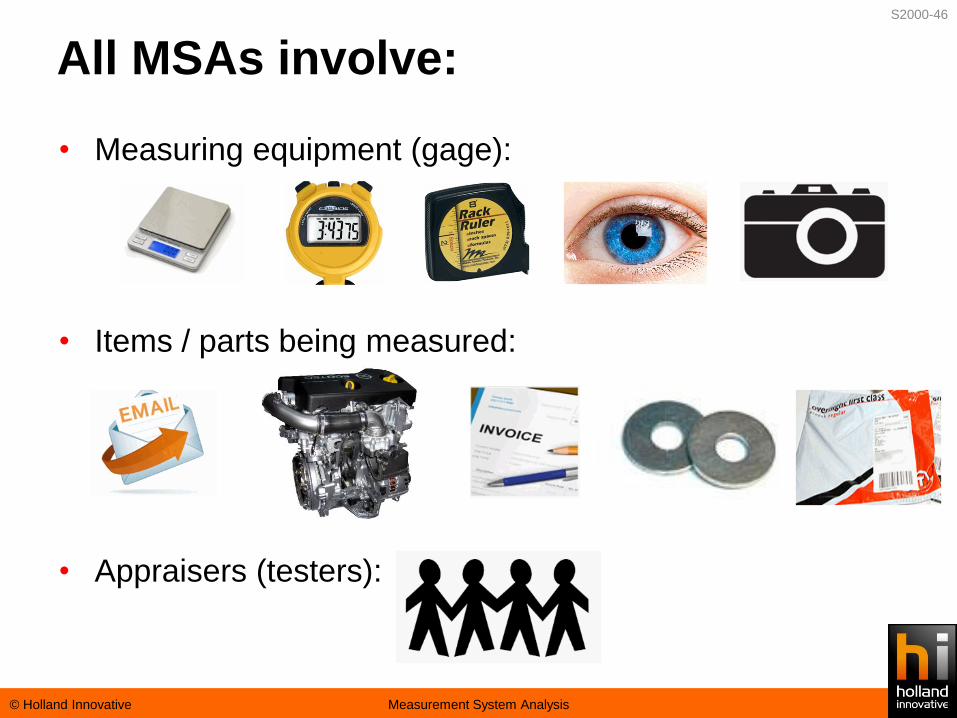
• Measuring equipment (gage):
• Items / parts being measured:
• Appraisers (testers):
All MSAs involve:
© Holland Innovative Measurement System Analysis
S2000-46
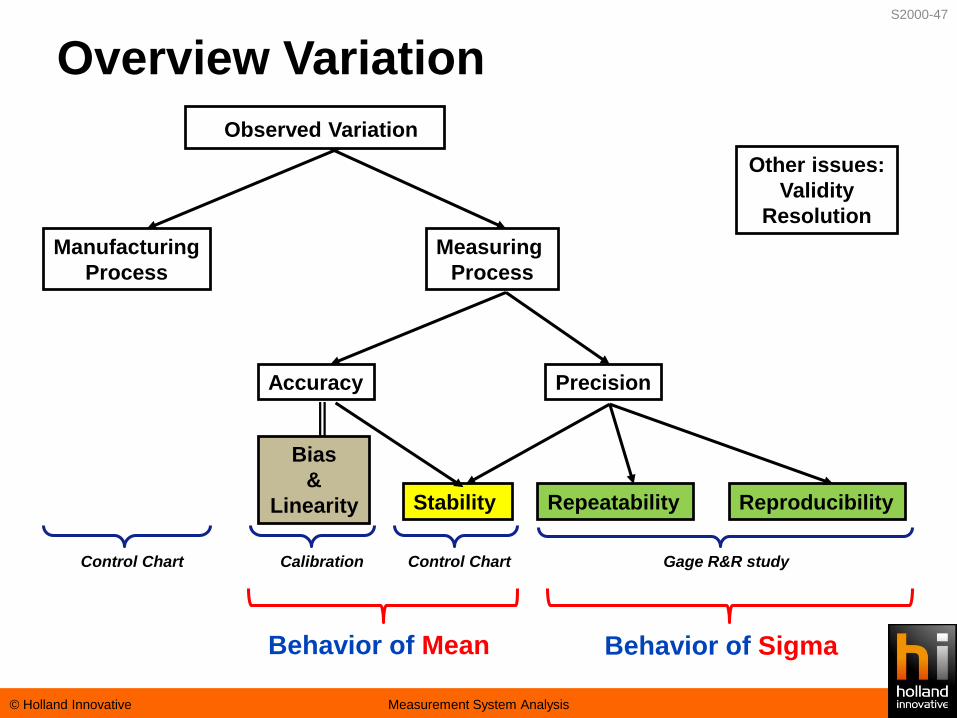
Overview Variation
© Holland Innovative Measurement System Analysis
Bias
&
Linearity
Observed Variation
Manufacturing
Process
Measuring
Process
Accuracy Precision
Stability Repeatability Reproducibility
Control Chart Calibration Control Chart Gage R&R study
Other issues:
Validity
Resolution
Behavior of Mean Behavior of Sigma
S2000-47
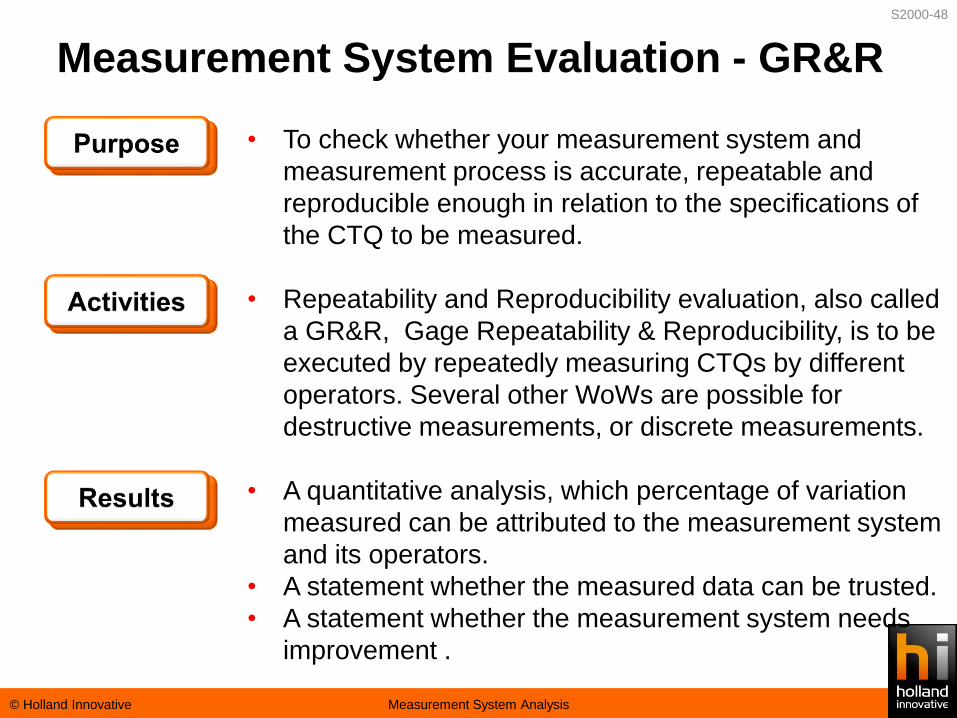
• To check whether your measurement system and
measurement process is accurate, repeatable and
reproducible enough in relation to the specifications of
the CTQ to be measured.
• Repeatability and Reproducibility evaluation, also called
a GR&R, Gage Repeatability & Reproducibility, is to be
executed by repeatedly measuring CTQs by different
operators. Several other WoWs are possible for
destructive measurements, or discrete measurements.
• A quantitative analysis, which percentage of variation
measured can be attributed to the measurement system
and its operators.
• A statement whether the measured data can be trusted.
• A statement whether the measurement system needs
improvement .
Measurement System Evaluation - GR&R
© Holland Innovative Measurement System Analysis
S2000-48
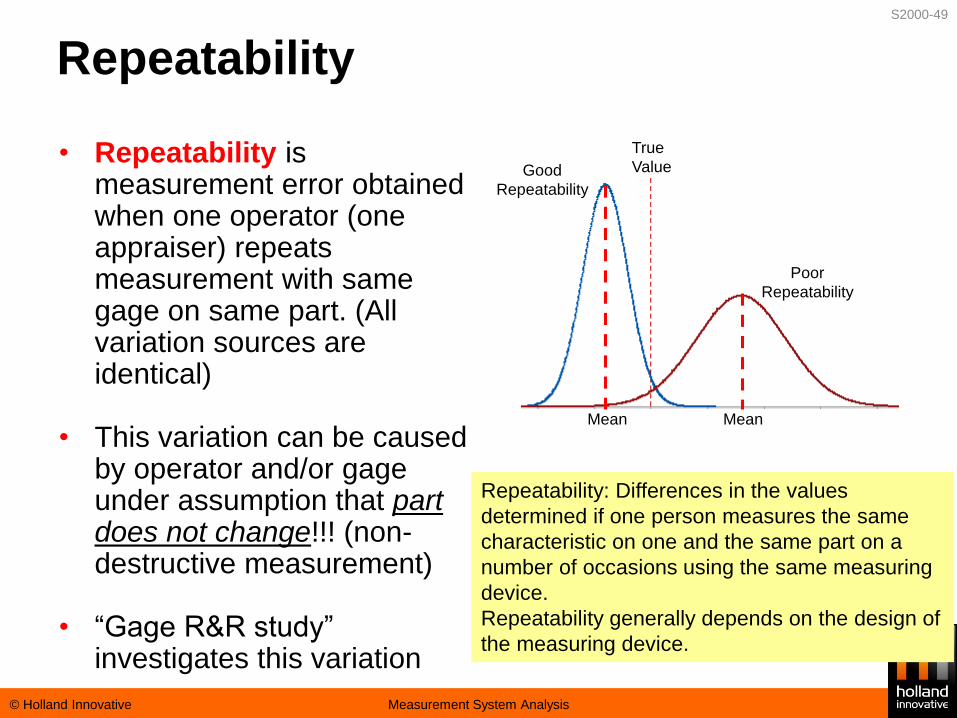
Repeatability
© Holland Innovative Measurement System Analysis
• Repeatability is measurement error obtained when one operator (one appraiser) repeats measurement with same gage on same part. (All variation sources are identical)
• This variation can be caused by operator and/or gage under assumption that part does not change!!! (non-destructive measurement)
• “Gage R&R study” investigates this variation
Repeatability: Differences in the values
determined if one person measures the same
characteristic on one and the same part on a
number of occasions using the same measuring
device.
Repeatability generally depends on the design of
the measuring device.
Poor
Repeatability
True
Value
Mean Mean
Good
Repeatability
S2000-49

Reproducibility
© Holland Innovative Measurement System Analysis
• Reproducibility is
measurement error obtained
when different operators
(appraisers) reproduce
measurement with same gage
on same part.
(One variation source is
changed!!)
• This variation can be caused by
operator and/or gage under
assumption that part does not
change!!! (non-destructive
measurement)
• “Gage R&R study” is used to
investigate this variation
Reproducibility: Difference between the
average measured values determined with
the same measuring device by different
persons or at different locations if the same
characteristic is measured on the same part.
Good
Reproducibility
Poor
Reproducibility
Op1 Op2 Op3 Op1 Op2 Op3
S2000-50

Risk Analysis

Why should companies invest time and
money in Risk analyses?
Why Risk analyses?
© Holland Innovative FMEA - 1-1: Introduction slide 52

Need for FMEA
Failure Mode and Effects Analysis is the key tool that supports
high Reliability, ensures Safety and achieves Customer
Satisfaction
– It is required by standards…
– It is required by customers…
– It is required by your company …
But most of all …
Benefit for you and your company!
© Holland Innovative FMEA - 1-1: Introduction slide 53
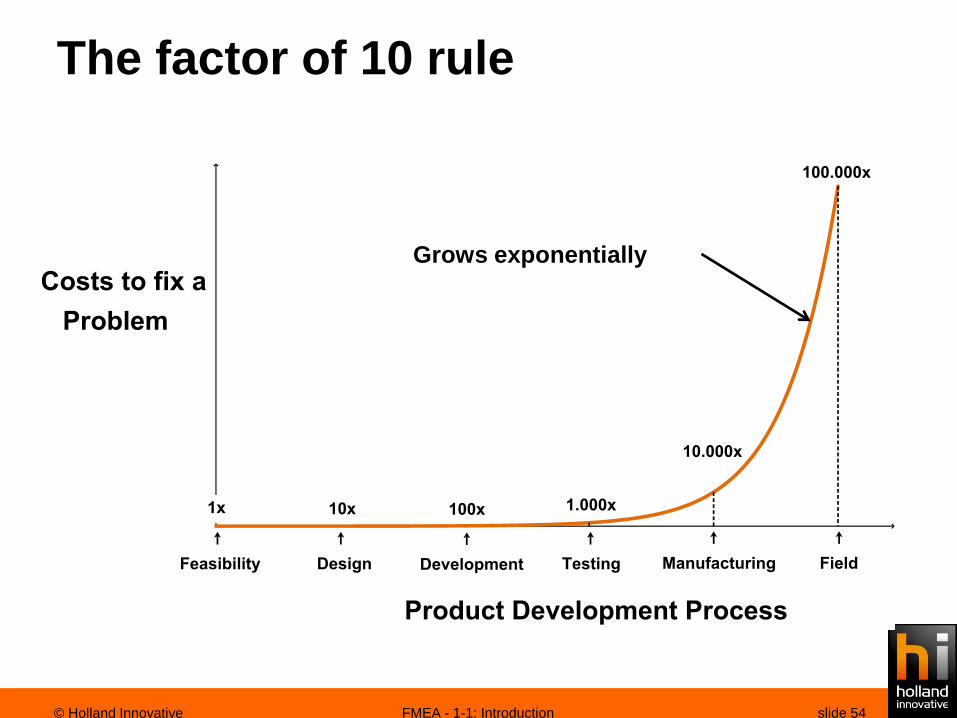
The factor of 10 rule
Grows exponentially
© Holland Innovative FMEA - 1-1: Introduction slide 54

Other benefits
• Effective FMEA studies are powerful tools that benefit the organization,
customers, and end users by:– Improving Yield and profit margins
– Reducing time to market
– Increasing machine and human resource availability
– Ensuring employee and customer safety
– Identifying necessary controls and developing test procedures
– Supporting due diligence claims in legal disputes
slide 55FMEA - 1-1: Introduction© Holland Innovative
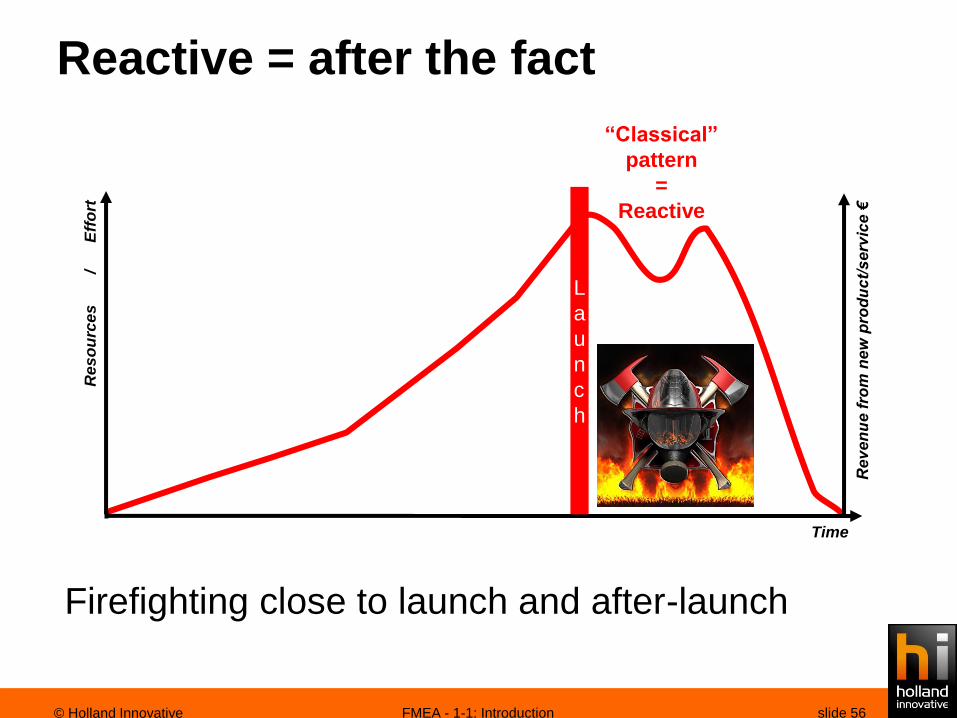
Reactive = after the fact
slide 56FMEA - 1-1: Introduction© Holland Innovative
Rev
en
ue f
rom
ne
w p
rod
uc
t/s
erv
ice €
Res
ou
rce
s
/
E
ffo
rt
Time
“Classical”
pattern
=
Reactive
L
a
u
n
c
h
Firefighting close to launch and after-launch
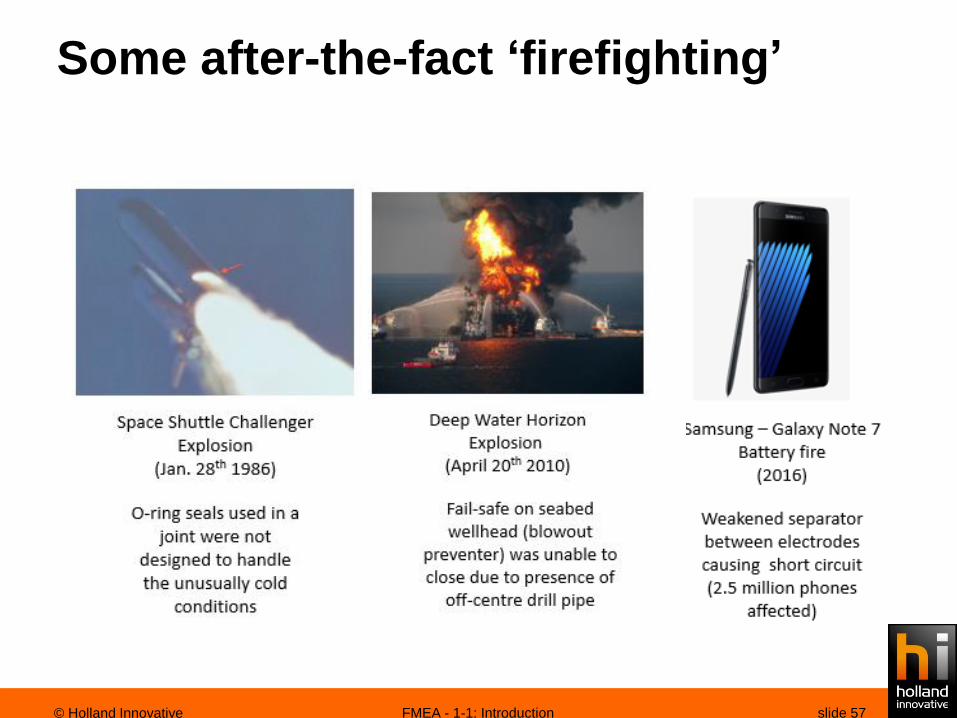
Some after-the-fact ‘firefighting’
slide 57FMEA - 1-1: Introduction© Holland Innovative
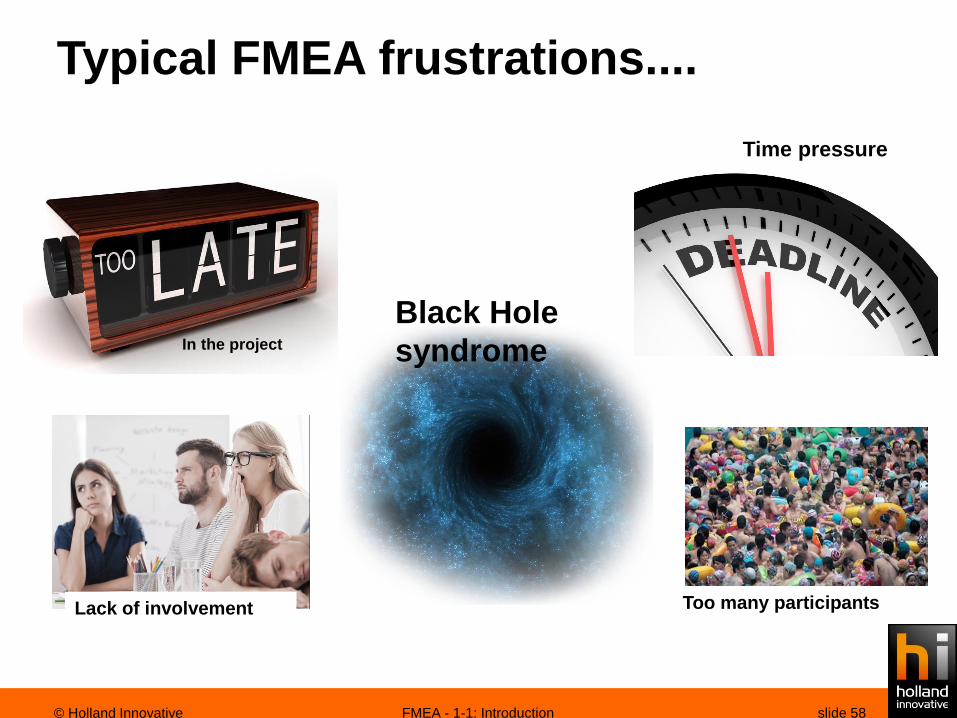
Typical FMEA frustrations....
slide 58FMEA - 1-1: Introduction© Holland Innovative
In the project
Lack of involvement
Black Hole
syndrome
Too many participants
Time pressure

slide 59FMEA - 1-1: Introduction© Holland Innovative
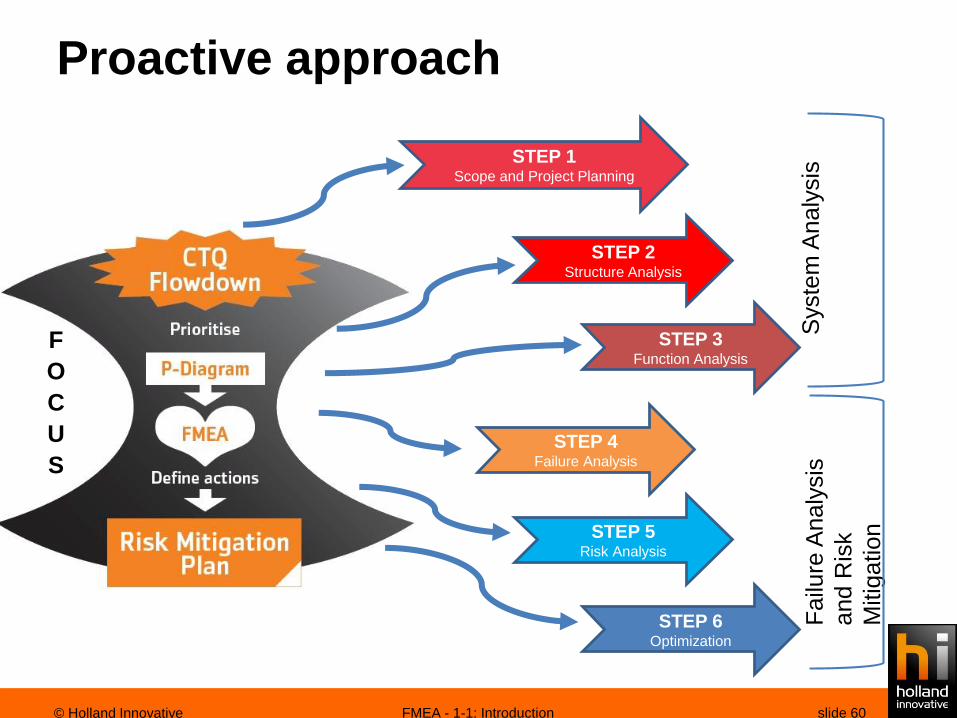
Proactive approach
slide 60FMEA - 1-1: Introduction© Holland Innovative
Syste
m A
naly
sis
Fa
ilure
Analy
sis
and R
isk
Mitig
ation
STEP 1Scope and Project Planning
STEP 2Structure Analysis
STEP 3Function Analysis
STEP 5Risk Analysis
STEP 6Optimization
F
O
C
U
SSTEP 4
Failure Analysis

1st Step: Scope Definition
• Important points in the scope steps are:
slide 61FMEA - 1-1: Introduction© Holland Innovative
Five T’s Block Diagram
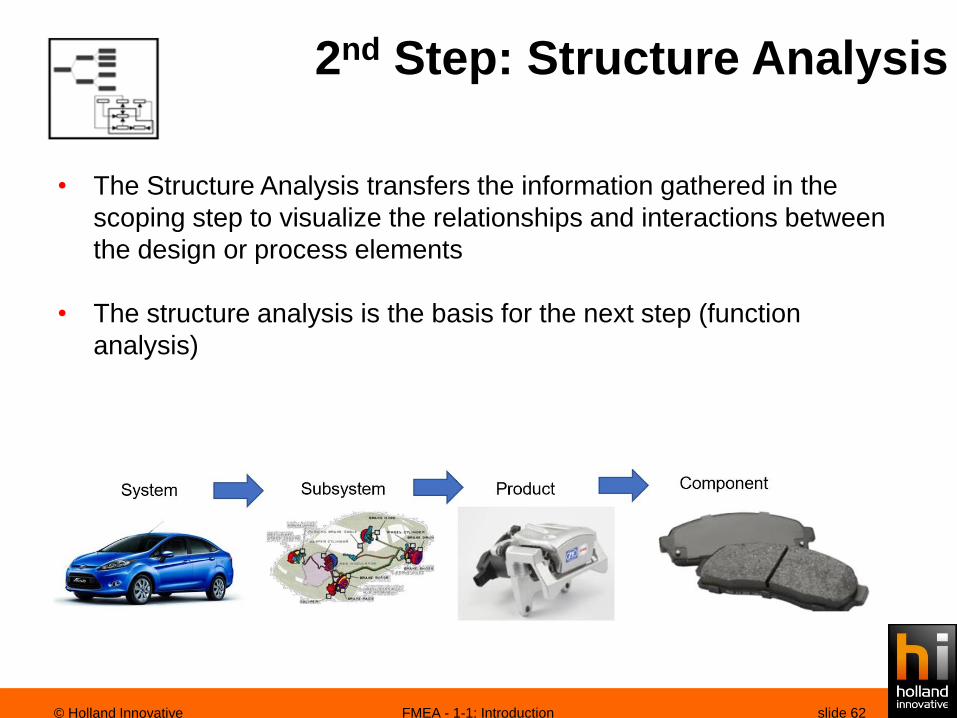
2nd Step: Structure Analysis
• The Structure Analysis transfers the information gathered in the
scoping step to visualize the relationships and interactions between
the design or process elements
• The structure analysis is the basis for the next step (function
analysis)
slide 62FMEA - 1-1: Introduction© Holland Innovative

3rd Step: Function Analysis
• In this step the functionality of the product or processes are ensured
by allocating a description of the activities, purposes or tasks
intended for the product performance.
slide 63FMEA - 1-1: Introduction© Holland Innovative
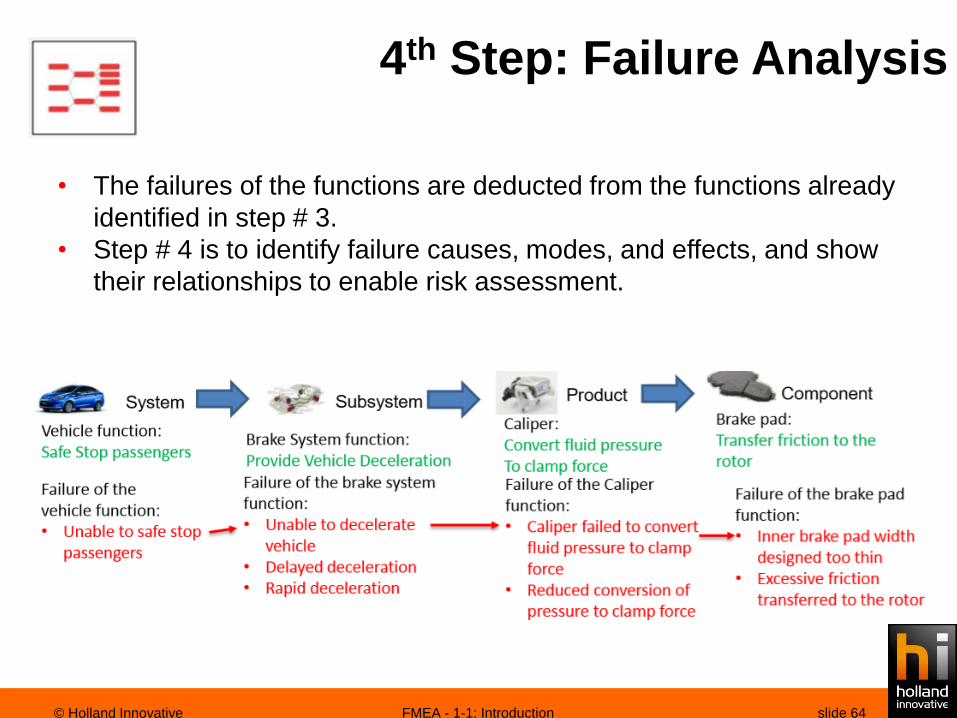
4th Step: Failure Analysis
• The failures of the functions are deducted from the functions already
identified in step # 3.
• Step # 4 is to identify failure causes, modes, and effects, and show
their relationships to enable risk assessment.
slide 64FMEA - 1-1: Introduction© Holland Innovative

5th Step: Risk Analysis
• In this step prevention and detection controls are assigned, as well
as the rankings for severity, occurrence and detection
• Risk Priority Number is calculated and decided when to take action
– action prioritization.
slide 65FMEA - 1-1: Introduction© Holland Innovative
6th Step: Optimization
• The primary objective of optimization is to develop actions that
reduce risk and increase customer satisfaction by improving the
design or process.
• The FMEA can be used as the basis for continuous improvement for
design or process.
slide 66FMEA - 1-1: Introduction© Holland Innovative

Frontloading
slide 67FMEA - 1-1: Introduction© Holland Innovative
Rev
en
ue f
rom
ne
w p
rod
uc
t/s
erv
ice €
Res
ou
rce
s
/
E
ffo
rt
Time
L
a
u
n
c
h
Proper Risk
Management
mindset
=
Pro-active
Frontloading
“Classical”
pattern
=
Reactive
L
a
u
n
c
h
Stay ahead of the game!
• On time!
• Less time pressure!
• Better involvement!

Applications
Aerospace Energy ICT Transport
Medical Automotive Production More…
© Holland Innovative FMEA - 1-1: Introduction slide 68

Why utilize Lean Six Sigma?
• Unlike industry, where a defective product can be rejected
without any problem, in healthcare defects and rework
directly affect the patient and therefore, the patient’s
perception of quality.
• Decisions are often based on assumptions and feelings and
on inaccurate and incomplete information.
• Utilising Lean Six Sigma personnel can take responsibility
and provide management with solutions based on facts and
data.
Why Lean Six Sigma?
© Holland Innovative SKL Event - Jan. 11th 2019
* Van den Heuvel, J., Does, R.J.M.M and Verver, J.P.S (2005) ‘Six Sigma in healthcare: Lessons learned from a hospital’

• Progress of LSS projects is very easy to manage due to the
uniformity of the project approach in 12 steps and well
defined outcomes.– This transparency has proven to be a very powerful management
tool.
– It limits developing each and every time a project approach, project
documentation, planning, etc.
Why Lean Six Sigma
© Holland Innovative SKL Event - Jan. 11th 2019
* Van den Heuvel, J., Does, R.J.M.M and Verver, J.P.S (2005) ‘Six Sigma in healthcare: Lessons learned from a hospital’

(Design for) Six Sigma Benefits
© Holland Innovative Introduction to Six Sigma
ValueValue
Price Price
New Products
Cost Cost
Yield lower
Improved Q-cost
Net income
Customer Satisfaction
time
demand
price
DMAIC - Lean
DIDOV – ReliabilityDIDOV DMAIC
Benefits
• Value creation by
Customer focus
• Capable processes
• Quality products meeting
Customer Expectation
• Knowledge building by
fact based and structured
way of working
• Awareness of design
rules & risk management
• Focus: Robustness, error
proneness and tolerance
• Shorter time to market
M0012-72
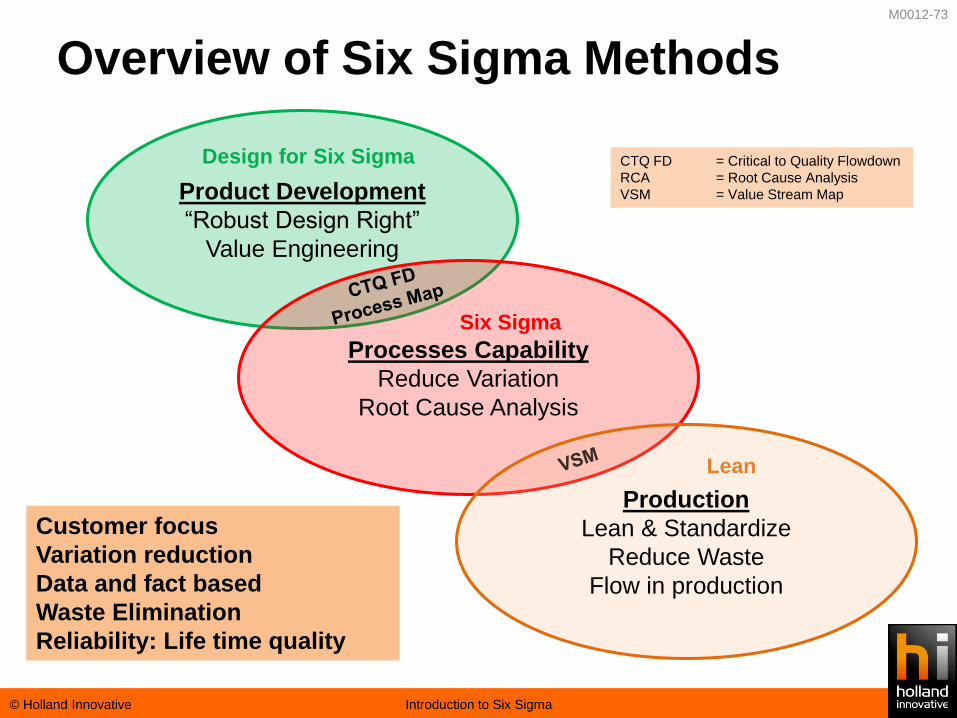
Customer focus
Variation reduction
Data and fact based
Waste Elimination
Reliability: Life time quality
Overview of Six Sigma Methods
© Holland Innovative Introduction to Six Sigma
Product Development
“Robust Design Right”
Value Engineering
Processes Capability
Reduce Variation
Root Cause Analysis
Design for Six Sigma
Six Sigma
Lean
CTQ FD = Critical to Quality Flowdown
RCA = Root Cause Analysis
VSM = Value Stream Map
Production
Lean & Standardize
Reduce Waste
Flow in production
M0012-73

• Shortening the length of stay of patients– Reducing admission time
– Analysing full content of a clinical pathway
– Potential result:• Positive net effect on budget
• More patients can be admitted using the same capacity
• Optimal usage of available bed capacity
• Minimising the use of materials and devices– Intravenous medication change to oral medication at the earliest
possible moment
– Reducing the number of intravenous pumps by pooling
Potential area’s to improve*
© Holland Innovative SKL Event - Jan. 11th 2019
* Van den Heuvel, J., Does, R.J.M.M and Verver, J.P.S (2005) ‘Six Sigma in healthcare: Lessons learned from a hospital’
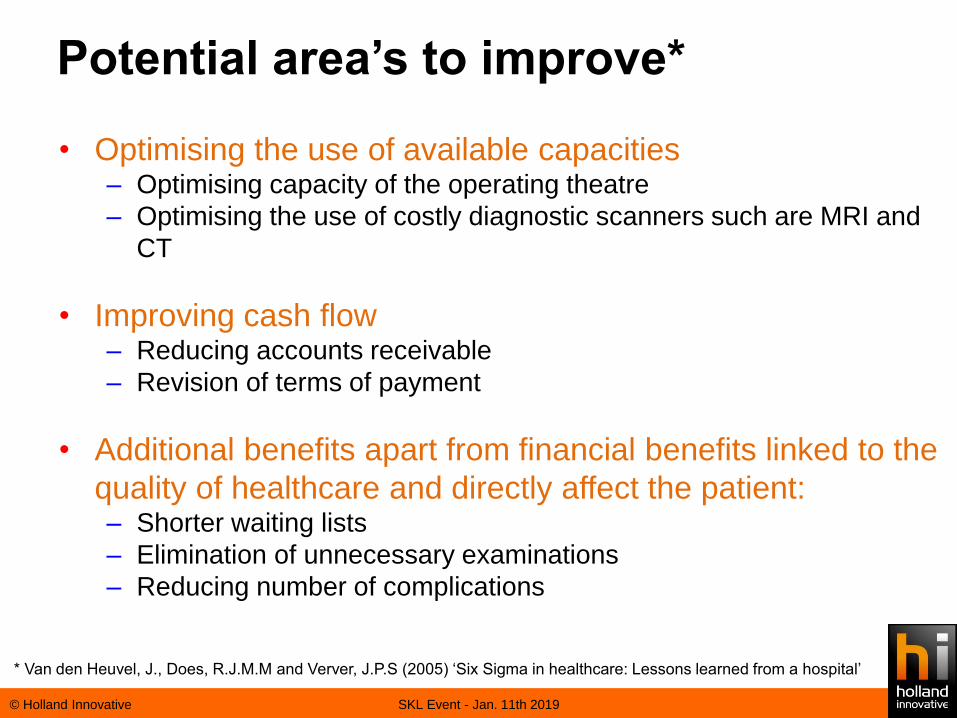
• Optimising the use of available capacities– Optimising capacity of the operating theatre
– Optimising the use of costly diagnostic scanners such are MRI and
CT
• Improving cash flow– Reducing accounts receivable
– Revision of terms of payment
• Additional benefits apart from financial benefits linked to the
quality of healthcare and directly affect the patient:– Shorter waiting lists
– Elimination of unnecessary examinations
– Reducing number of complications
Potential area’s to improve*
© Holland Innovative SKL Event - Jan. 11th 2019
* Van den Heuvel, J., Does, R.J.M.M and Verver, J.P.S (2005) ‘Six Sigma in healthcare: Lessons learned from a hospital’
Example projects

Shortening the length of stay of
gynaecology patients
• In The Netherlands, hospitals receive, as part of their
budgets, a fixed amount of money for every admission.
Therefore, reducing the length of stay of patients has a
direct impact on the financial results of the hospital because
more patients can be admitted.
• The objective of this project was to shorten the stay of
gynaecologypatients who had to undergoan abdominal
uterus extirpation (AUE) or a vaginal uterus extirpation
(VUE).
Background*
© Holland Innovative SKL Event - Jan. 11th 2019
* Van den Heuvel J., Does R.J.M.M, and Vermaat T.M.B. ‘Six Sigma in a Hospital : does it work in a nursing department’?”

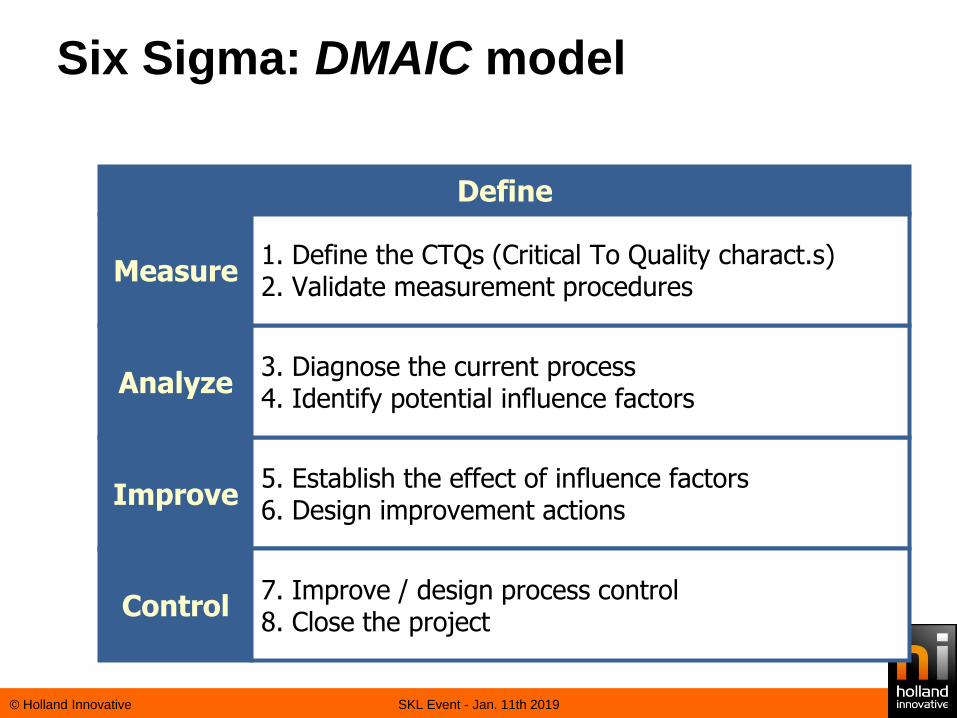
Six Sigma: DMAIC model
© Holland Innovative SKL Event - Jan. 11th 2019
Measure
Analyze
Improve
Control
5. Establish the effect of influence factors6. Design improvement actions
7. Improve / design process control8. Close the project
3. Diagnose the current process4. Identify potential influence factors
1. Define the CTQs (Critical To Quality charact.s)2. Validate measurement procedures
Define
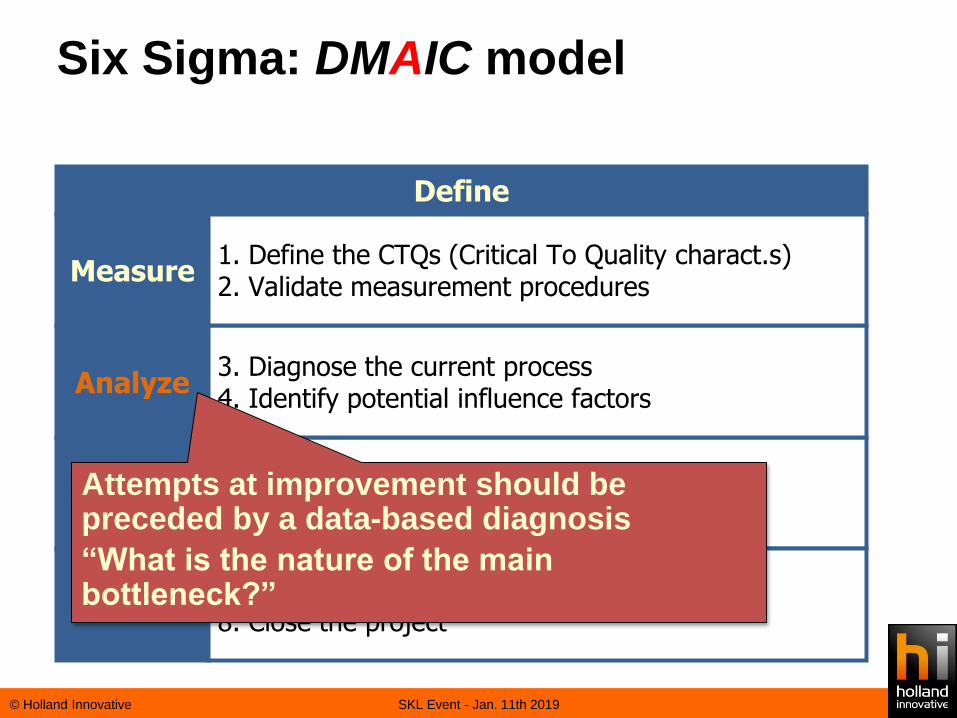
Objective: Shorten stay of gynaecology patients
Financial benefit estimation: € 57 800
Additional benefit: Reduction in waiting lists
Project duration estimated: 6 month
Carried out by two Green Belts in training

Six Sigma: DMAIC model
© Holland Innovative SKL Event - Jan. 11th 2019
Measure
Analyze
Improve
Control
5. Establish the effect of influence factors6. Design improvement actions
7. Improve / design process control8. Close the project
3. Diagnose the current process4. Identify potential influence factors
1. Define the CTQs (Critical To Quality charact.s)2. Validate measurement procedures
Define
Project objectives are translated into measurable and quantitative metrics
“You cannot improve what you cannot measure”
Six Sigma: DMAIC model
© Holland Innovative SKL Event - Jan. 11th 2019
• CTQ characteristic is the length of stay of patients with AUE
or VUE. This CTQ was defined as the length of the stay
measured in days.
• Only patients who had to undergo an AUE or VUE were
included.
• The measurement of the length of stay by means of the
computer system had to be validated. This was done by
comparing the length of stay measuring 30 patient dossiers.
• There were no differencesfoundin this sample. Based on
these observations we concludedthat the
measurementsystem was valid.
Six Sigma: DMAIC model
© Holland Innovative SKL Event - Jan. 11th 2019
Measure
Analyze
Improve
Control
5. Establish the effect of influence factors6. Design improvement actions
7. Improve / design process control8. Close the project
3. Diagnose the current process4. Identify potential influence factors
1. Define the CTQs (Critical To Quality charact.s)2. Validate measurement procedures
Define
Attempts at improvement should be preceded by a data-based diagnosis
“What is the nature of the main bottleneck?”

Six Sigma: DMAIC model
© Holland Innovative SKL Event - Jan. 11th 2019
• Data for one year was used.
• There appeared to be a few outliers, which were analyses
and excluded from the data by performing capability
analysis.
• The average stay of patients with VUE or AUE was 7 days,
and the standard deviation was 2 days.
• Factors influencing the length of stay were listed by using a
cause and effect diagram and a failure mode and effect
analysis (FMEA)

Six Sigma: DMAIC model
© Holland Innovative SKL Event - Jan. 11th 2019
Measure
Analyze
Improve
Control
5. Establish the effect of influence factors6. Design improvement actions
7. Improve / design process control8. Close the project
3. Diagnose the current process4. Identify potential influence factors
1. Define the CTQs (Critical To Quality charact.s)2. Validate measurement procedures
Define
The effectiveness of proposed interventions must be demonstrated:
Evidence-based intervention
“In God we trust, all others must bring data”
Six Sigma: DMAIC model
© Holland Innovative SKL Event - Jan. 11th 2019
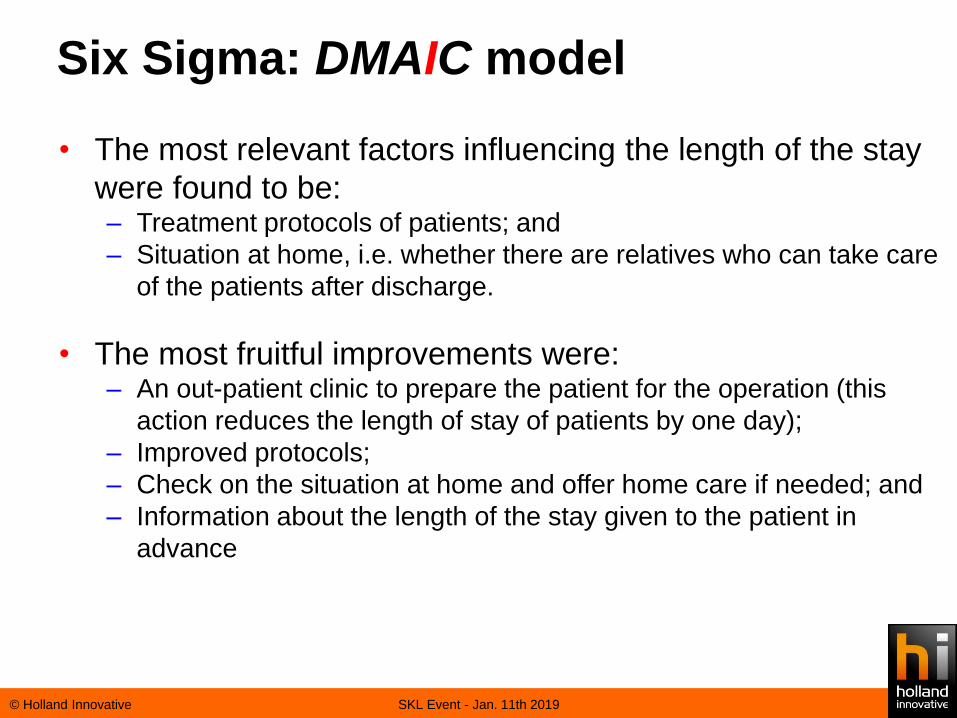
• The most relevant factors influencing the length of the stay
were found to be:– Treatment protocols of patients; and
– Situation at home, i.e. whether there are relatives who can take care
of the patients after discharge.
• The most fruitful improvements were:– An out-patient clinic to prepare the patient for the operation (this
action reduces the length of stay of patients by one day);
– Improved protocols;
– Check on the situation at home and offer home care if needed; and
– Information about the length of the stay given to the patient in
advance

Six Sigma: DMAIC model
© Holland Innovative SKL Event - Jan. 11th 2019
Measure
Analyze
Improve
Control
5. Establish the effect of influence factors6. Design improvement actions
7. Improve / design process control8. Close the project
3. Diagnose the current process4. Identify potential influence factors
1. Define the CTQs (Critical To Quality charact.s)2. Validate measurement procedures
Define
Structures for continued control and improvement of the process
“It takes all the running you can do to stay in the same place”
Previous suggested improvements were
implemented and resulted in:
• The average length of stay reduced to 5.2 days
• The standard deviation reduced to 0.9 days
Improving a CAT scan process
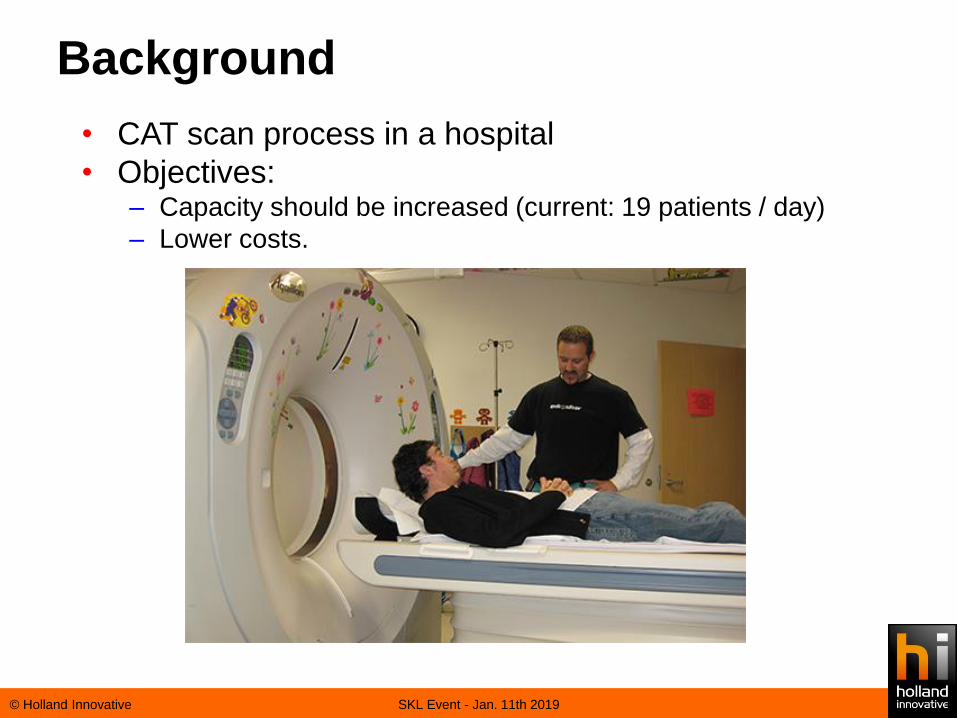
Background
© Holland Innovative SKL Event - Jan. 11th 2019
• CAT scan process in a hospital
• Objectives:– Capacity should be increased (current: 19 patients / day)
– Lower costs.
Six Sigma: DMAIC model
© Holland Innovative SKL Event - Jan. 11th 2019
Measure
Analyze
Improve
Control
5. Establish the effect of influence factors6. Design improvement actions
7. Improve / design process control8. Close the project
3. Diagnose the current process4. Identify potential influence factors
1. Define the CTQs (Critical To Quality charact.s)2. Validate measurement procedures
Define
Project objectives are translated into measurable and quantitative metrics
“You cannot improve what you cannot measure”
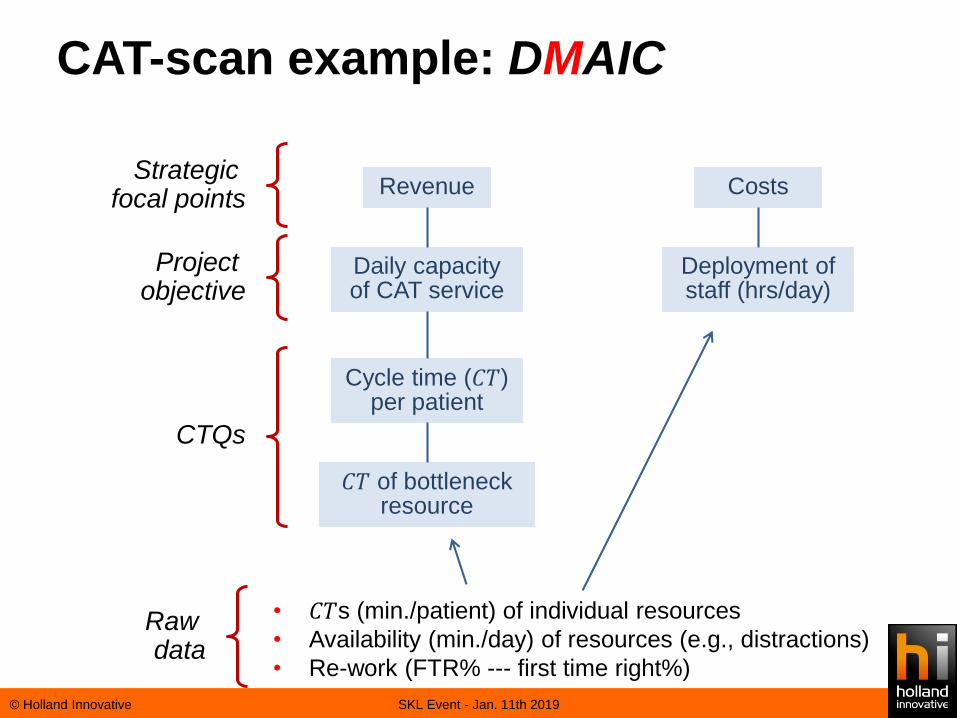
CAT-scan example: DMAIC
© Holland Innovative SKL Event - Jan. 11th 2019
Revenue
Daily capacity of CAT service
Cycle time (𝐶𝑇)per patient
𝐶𝑇 of bottleneck resource
Costs
Deployment of staff (hrs/day)
• 𝐶𝑇s (min./patient) of individual resources
• Availability (min./day) of resources (e.g., distractions)
• Re-work (FTR% --- first time right%)
Project objective
Strategic focal points
CTQs
Raw data

Six Sigma: DMAIC model
© Holland Innovative SKL Event - Jan. 11th 2019
Measure
Analyze
Improve
Control
5. Establish the effect of influence factors6. Design improvement actions
7. Improve / design process control8. Close the project
3. Diagnose the current process4. Identify potential influence factors
1. Define the CTQs (Critical To Quality charact.s)2. Validate measurement procedures
Define
Attempts at improvement should be preceded by a data-based diagnosis
“What is the nature of the main bottleneck?”

CAT-scan example: DMAIC
© Holland Innovative SKL Event - Jan. 11th 2019
Micro process A: CT scan19.3 ≤ TCapA ≤ 22.4 p/d81.7% ≤ SEA ≤ 95%86.1% ≤ TUtA ≤ 100%
Micro process A: CT scan19.3 ≤ TCapA ≤ 22.4 p/d81.7% ≤ SEA ≤ 95%86.1% ≤ TUtA ≤ 100%
Task 1: (Un)dressTask 1: (Un)dress
Task 2: Scan (FTR2 = 100%)Task 2: Scan (FTR2 = 100%)
WT: 7.1 min
QueueQueue
Resource II:
Radiographer 1
TotTII: 5 h/d
NII: 1
CTII: 2.7 m/p
PCapII: 111.1 p/d
AVII: 95%
ECapII: 105.5 p/d
EUtII: 18.3%
Resource V:
CT scanner
TotTV: 5 h/d
NV: 1
CTV: 4.6 m/p
PCapV: 65.2 p/d
AVV: 100%
ECapV: 65.2 p/d
EUtV: 29.6%
Resource I:
Dressing room
TotTI: 5 h/d
NI: 3
CTI: 19.7 m/p
PCapI: 45.7 p/d
AVI: 100%
FTRI: 100%
ECapI: 45.7 p/d
EUtI: 39.4%
Resource III:
Scan room
TotTIII: 5 h/d
NIII: 1
CTII: 12.7 m/p
PCapIII: 23.6 p/d
AVIII: 100%
ECapIII: 23.6 p/d
EUtIII: 81.7%
Resource III:
Scan room
TotTIII: 5 h/d
NIII: 1
CTII: 12.7 m/p
PCapIII: 23.6 p/d
AVIII: 100%
ECapIII: 23.6 p/d
EUtIII: 81.7%
Resource IV:
Radiographer 2
TotTIV: 5 h/d
NIV: 1
CTIV: 6.9 m/p
PCapIV: 43.5 p/d
AVIV: 95%
ECapIV: 41.3 p/d
EUtIV: 46.7%
33
22
TP
A=
19
.3 p
/d
h/d = hours per day; m/p = minutes per patient; p/d = patients per day
AppointmentAppointment
QueueScheduledWT: 30.8 d
QueueScheduledWT: 30.8 d
11
WL
A1:
18
p/d
OutpatientOutpatient
EmergencyEmergency
WL
A2:
1.3
p/d
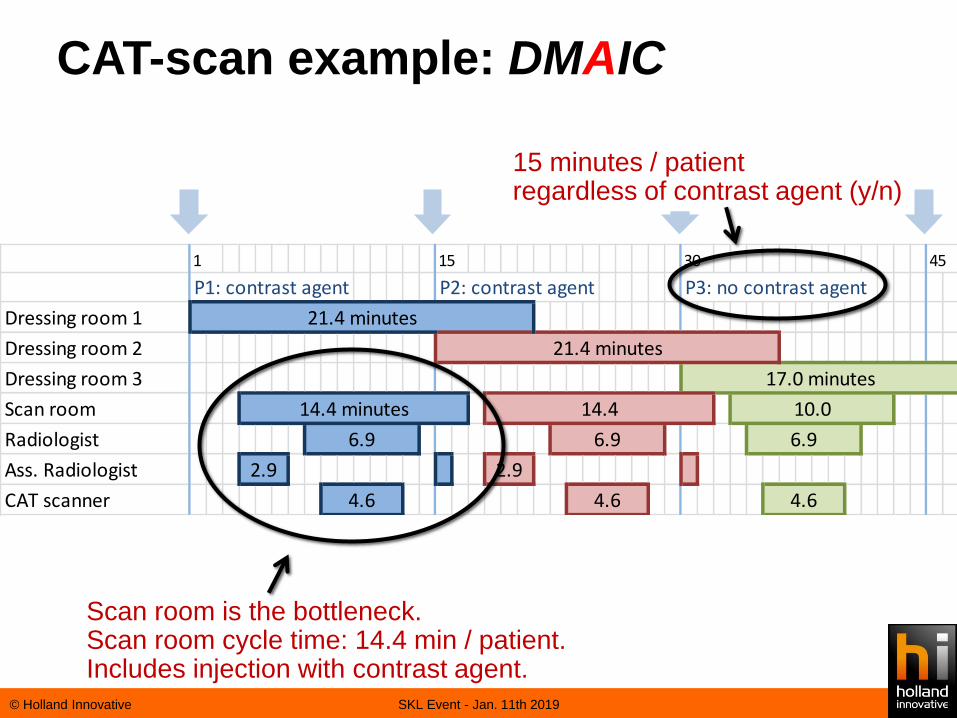
CAT-scan example: DMAIC
© Holland Innovative SKL Event - Jan. 11th 2019
P1: contrast agent P2: contrast agent P3: no contrast agent
Dressing room 1
Dressing room 2
Dressing room 3
Scan room
Radiologist
Ass. Radiologist
CAT scanner
6.9
4.6
151 30 45
4.6
21.4 minutes
14.4
6.9
2.9
4.6
17.0 minutes
10.0
21.4 minutes
14.4 minutes
2.9
6.9
Scan room is the bottleneck.Scan room cycle time: 14.4 min / patient.Includes injection with contrast agent.
15 minutes / patientregardless of contrast agent (y/n)
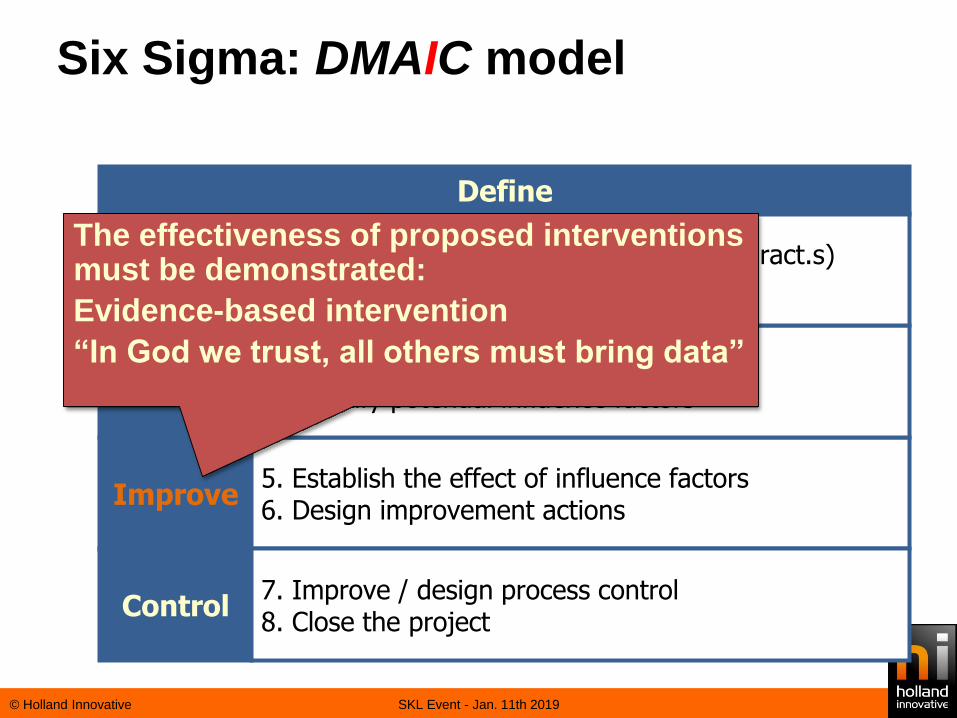
Six Sigma: DMAIC model
© Holland Innovative SKL Event - Jan. 11th 2019
Measure
Analyze
Improve
Control
5. Establish the effect of influence factors6. Design improvement actions
7. Improve / design process control8. Close the project
3. Diagnose the current process4. Identify potential influence factors
1. Define the CTQs (Critical To Quality charact.s)2. Validate measurement procedures
Define
The effectiveness of proposed interventions must be demonstrated:
Evidence-based intervention
“In God we trust, all others must bring data”

CAT-scan example: DMAIC
© Holland Innovative SKL Event - Jan. 11th 2019
• The scan room is the bottleneck, so should be the focus:– Move tasks (injection) from the scan room elsewhere:
• Schedule patients without contrast agent in shorter time
slot.
• Assist. Radiologist is not needed for patients without
contrast agent– Schedule patients without contrast agent in one block; the
assist. radiologist is not needed in this time slot.
Capacity from 19 to 30 patients / day.
P1: contrast agent P2: contrast agent P3: contrast agent
Dressing room 1
Dressing room 2
Dressing room 3
Scan room
Radiologist
Ass. Radiologist
CAT scanner
10.0 10.0
1 10 20
6.9 6.9 6.9
2.9 2.9
4.6 4.6 4.6
2.9
21.4 minutes
21.4 minutes

Six Sigma: DMAIC model
© Holland Innovative SKL Event - Jan. 11th 2019
Measure
Analyze
Improve
Control
5. Establish the effect of influence factors6. Design improvement actions
7. Improve / design process control8. Close the project
3. Diagnose the current process4. Identify potential influence factors
1. Define the CTQs (Critical To Quality charact.s)2. Validate measurement procedures
Define
Structures for continued control and improvement of the process
“It takes all the running you can do to stay in the same place”

• Focus on: Variation & Waste
• How?– Measure data with adequate measurement method -> Performance– Aquire customer requirements
• Performance + Requirements = potential performane gap
• Which could be the start of an improvement event
• Choose any method.....– Lean– Six Sigma– Design for Six Sigma– 8D– .........
Summary
© Holland Innovative SKL Event - Jan. 11th 2019
M0012-112

Appendix
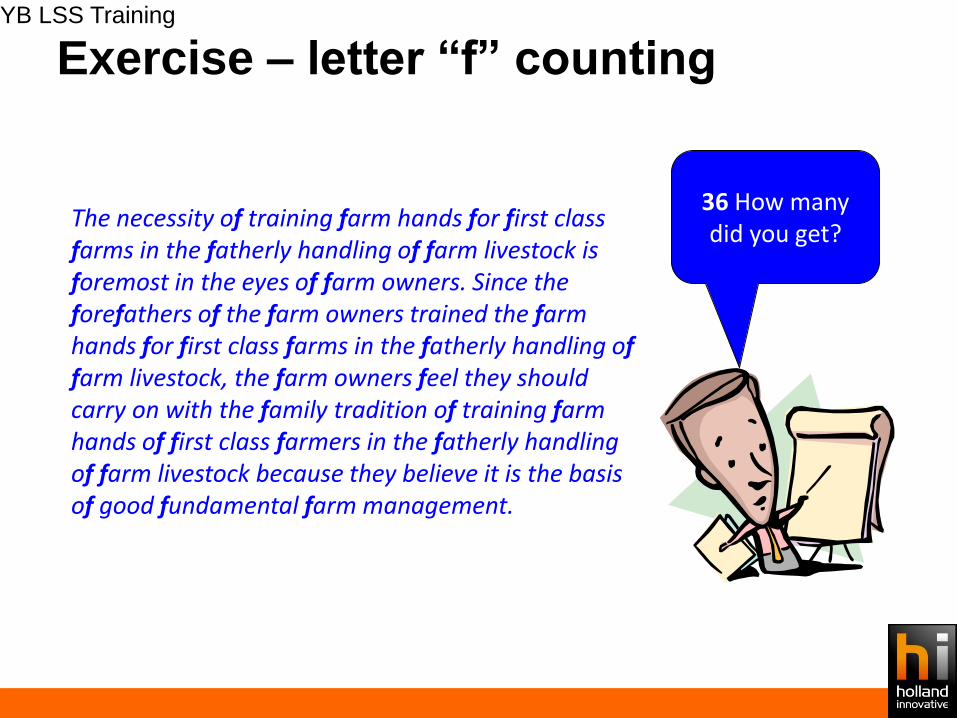
Exercise – letter “f” countingYB LSS Training
The necessity of training farm hands for first class farms in the fatherly handling of farm livestock is foremost in the eyes of farm owners. Since the forefathers of the farm owners trained the farm hands for first class farms in the fatherly handling of farm livestock, the farm owners feel they should carry on with the family tradition of training farm hands of first class farmers in the fatherly handling of farm livestock because they believe it is the basis of good fundamental farm management.
36 How many did you get?