Governance Matters VI
105
Policy Research Working Paper 4978 Governance Matters VIII Aggregate and Individual Governance Indicators 1996–2008 Daniel Kaufmann Aart Kraay Massimo Mastruzzi e World Bank Development Research Group Macroeconomics and Growth Team June 2009 WPS4978
Transcript of Governance Matters VI
Policy Research Working Paper 4978
Governance Matters VIII
Aggregate and Individual Governance Indicators 1996–2008
Daniel Kaufmann Aart Kraay
Massimo Mastruzzi
The World BankDevelopment Research GroupMacroeconomics and Growth TeamJune 2009
WPS4978
Produced by the Research Support Team
Abstract
The Policy Research Working Paper Series disseminates the findings of work in progress to encourage the exchange of ideas about development issues. An objective of the series is to get the findings out quickly, even if the presentations are less than fully polished. The papers carry the names of the authors and should be cited accordingly. The findings, interpretations, and conclusions expressed in this paper are entirely those of the authors. They do not necessarily represent the views of the International Bank for Reconstruction and Development/World Bank and its affiliated organizations, or those of the Executive Directors of the World Bank or the governments they represent.
Policy Research Working Paper 4978
This paper reports on the 2009 update of the Worldwide Governance Indicators (WGI) research project, covering 212 countries and territories and measuring six dimensions of governance between 1996 and 2008: Voice and Accountability, Political Stability and Absence of Violence/Terrorism, Government Effectiveness, Regulatory Quality, Rule of Law, and Control of Corruption. These aggregate indicators are based on hundreds of specific and disaggregated individual variables measuring various dimensions of governance, taken from 35 data sources provided by 33 different organizations. The data reflect the views on governance
This paper—a product of the Growth and the Macroeconomics Team, Development Research Group—is part of a larger effort in the department to study the causes and consequences of governance for development. Policy Research Working Papers are also posted on the Web at http://econ.worldbank.org. The authors may be contacted at [email protected], [email protected], and [email protected].
of public sector, private sector and NGO experts, as well as thousands of citizen and firm survey respondents worldwide. The authors also explicitly report the margins of error accompanying each country estimate. These reflect the inherent difficulties in measuring governance using any kind of data. They find that even after taking margins of error into account, the WGI permit meaningful cross-country comparisons as well as monitoring progress over time. The aggregate indicators, together with the disaggregated underlying indicators, are available at www.govindicators.org.
Governance Matters VIII: Aggregate and Individual Governance Indicators
1996-2008
Daniel Kaufmann, Brookings Institution Aart Kraay and Massimo Mastruzzi, The World Bank
________________________________________ [email protected], [email protected], [email protected]. The views expressed here are the authors' and do not necessarily reflect those of the Brookings Institution, the World Bank, its Executive Directors, or the countries they represent. The Worldwide Governance Indicators are not used by the World Bank for resource allocation. We would like to thank B. Parks, S. Rose, S. Radelet, C. Logan, M. Neumann, N. Meisel, J. Ould-Auodia, R. Fullenbaum, Z. Nyiri, M. Seligson, F. Marzo, C. Walker, P. Wongwan, V. Hollingsworth, S. Hatipoglu, D. Cingranelli, D. Richards, M. Lagos, R. Coutinho, S. Mannan, Z. Tabernacki, J. Auger, L. Mootz, N. Heller, G. Kisunko, J. Rodriguez Mesa, J. Riano, B. Clausen and D. Cieslikowsky for providing data and comments, and answering our numerous questions.
2
1. Introduction
This paper presents the latest update of the Worldwide Governance Indicators
(WGI) research project.1 The indicators measure six dimensions of governance: Voice
and Accountability, Political Stability and Absence of Violence/Terrorism, Government
Effectiveness, Regulatory Quality, Rule of Law, and Control of Corruption. They cover
212 countries and territories for 1996, 1998, 2000, and annually for 2002-2008.2
The margins of error we report are not unique to the WGI, nor are they unique to
perceptions-based measures of governance on which we rely. Measurement error is
pervasive among all indicators of governance and institutional quality, including
individual indicators as well as ‘objective’ or fact-based ones -- if these are available at
The
indicators are based on several hundred individual variables measuring perceptions of
governance, drawn from 35 separate data sources constructed by 33 different
organizations from around the world. We assign these individual measures to
categories capturing the six dimensions of governance, and use an unobserved
components model to construct six aggregate governance indicators in each period.
We complement our estimates of governance for each country with margins of
error that indicate the unavoidable uncertainty associated with measuring governance
across countries. These margins of error have declined over time with the addition of
new data sources to our aggregate indicators, and are substantially smaller than for any
of the individual sources. We urge users of the governance indicators to take these
margins of error into account when making comparisons of governance across
countries, and within countries over time. A useful rule of thumb is that when confidence
intervals for governance based on our reported margins of error overlap when
comparing two countries, or a single country over time, the data do not reveal
statistically (or likely practically) significant differences in governance.
1 This paper is the eighth in a series of estimates of governance across countries. Documentation of previous rounds can be found in Kaufmann, Kraay, and Zoido-Lobatón (1999a,b,2002), and Kaufmann, Kraay, and Mastruzzi (2004, 2005, 2006a, 2006b, 2007b, and 2008). For broader survey review on governance indicators see Kaufmann and Kraay (2008). 2 A few of the entities covered by our indicators are not fully independent states (e.g. Puerto Rico, Hong Kong, West Bank/Gaza, Martinique, French Guyana and others). A handful of very small independent principalities (e.g. Monaco, San Marino, Lichtenstein and Andorra) are also included. For stylistic convenience all 212 entities are referred to in this paper as “countries”.
3
all. Unfortunately, typically little if any effort is devoted to estimating, let alone reporting,
the substantial margins of error in any other governance and/or investment climate
indicators – objective or subjective, aggregate or individual. A key advantage of the WGI
is that we are explicit about the accompanying margins of error, whereas in most other
cases they are often left implicit or ignored altogether.3
The aggregate indicators that we report constitute a useful way of organizing and
summarizing the very large and disparate amount of information on governance
embodied in all of our underlying data sources. The specific aggregation procedure we
use also allows us to calculate explicit margins of error to capture the inherent
uncertainties in measuring governance. At the same time, we recognize that for some
purposes the information in the many individual underlying data sources can be of
interest to users. For example, several of these provide highly specific and
disaggregated information about particular dimensions of governance that could be of
interest for monitoring particular reforms. For this reason, we report country scores on
the individual indicators underlying our aggregate governance indicators, on the WGI
Despite these margins of error, the WGI are sufficiently informative that many
cross-country comparisons result in statistically (and likely also practically) significant
differences in estimated governance. In comparing governance levels across countries,
for example, we document that over 64 percent of all cross-country comparisons using
the WGI for 2008 result in statistically significant differences at the 90 percent
significance level, and nearly 74 percent of comparisons are significant at the less
stringent 75 percent significance level. In assessing trends over time, we find that 35
percent of countries experience significant changes (at the 90 percent level) over the
decade 1998-2008 in at least one of the six indicators (roughly evenly divided between
significant improvements and deteriorations). This highlights the fact that governance
can and does change even over relatively short periods of time. This should both
provide encouragement to reformers seeking to improve governance, as well as warn
against complacency in other cases, as sharp deteriorations in governance are possible
as well.
3 The only other governance-related indicators that we are aware of that now report margins of error are the Transparency International Corruption Perceptions Index and the Global Integrity Index.
4
website at www.govindicators.org. These disaggregated underlying indicators are
presented for the entire time period covered by the aggregate indicators, from 1996 to
2008.
As in past years, the WGI are based exclusively on subjective or perceptions-
based data on governance reflecting the views of a diverse range of informed
stakeholders, including tens of thousands of household and firm survey respondents, as
well as thousands of experts working for the private sector, NGOs, and public sector
agencies. We rely on the reports of these stakeholders, which reflect their judgments
and perceptions, for three main reasons.
First and most basic, perceptions matter because agents base their actions on
their perceptions, impression, and views. If citizens believe that the courts are inefficient
or the police are corrupt, they are unlikely to avail themselves of their services.
Similarly, enterprises base their investment decisions - and citizens their voting
decisions - on their perceived view of the investment climate and the government's
performance. Second, in many areas of governance, there are few alternatives to
relying on perceptions data. This is most particularly so for the case of corruption, which
almost by definition leaves no 'paper trail' that can be captured by purely objective
measures. Third, we note that even when objective or fact-based data are available,
often such data may capture a de jure notion of laws 'on the books' that differs
substantially from the de facto reality that exists 'on the ground'. In fact, in Kaufmann,
Kraay and Mastruzzi (2005) we document sharp divergences between de jure and de
facto measures of business entry regulation and find that corruption explains a good
deal of the extent to which the former are subverted in practice.
And finally, we note, as discussed in more detail in Kaufmann and Kraay (2008),
that virtually all measures of governance and the investment climate rely on judgment in
some measure, so that the distinction between 'subjective' and 'objective' data is
somewhat of a false dichotomy. Rather, a more useful distinction is between efforts to
measure formal rules as distinct from their implementation in practice, recognizing that
changes in formal rules (often associated with so-called 'actionable' indicators) need not
lead to desired changes in outcomes.
5
As we have emphasized with past releases of the WGI, the composite indicators
we construct are useful as a first tool for broad cross-country comparisons and for
evaluating broad trends over time. However, they are often too blunt a tool to be useful
in formulating specific governance reforms in particular country contexts. Such reforms,
and evaluation of their progress, need to be informed by much more detailed and
country-specific diagnostic data that can identify the relevant constraints on governance
in particular country circumstances. We therefore view the WGI as complementary to a
large number of other efforts to construct more detailed measures of governance, often
just for a single country. Furthermore, due to the complementarity between the
composite governance indicators and their disaggregated individual inputs (and the
value of reviewing the detail on the latter), we continue our past practice of publishing
virtually all of the disaggregated source variables underlying the WGI.
We begin by describing the data used to construct this round of the governance
indicators in Section 2, as well as various revisions to the data for previous years.
These revisions have resulted in minor changes to our previous estimates for 1996-
2007, and so the entire new dataset described here supersedes previous releases. In
Section 3 we briefly describe cross-country differences and changes over time in
governance as measured by our aggregate indicators. Section 4 concludes.
2. Methodology and Data Sources for 2008
In this section we briefly describe the latest update of the WGI. Our methodology
for constructing aggregate governance indicators has not changed from past years, and
a detailed description can be found in Kaufmann, Kraay, and Mastruzzi (2004), as well
as in a technical Appendix D to this paper.
We define governance broadly as the traditions and institutions by which
authority in a country is exercised. This includes the process by which governments are
selected, monitored and replaced; the capacity of the government to effectively
formulate and implement sound policies; and the respect of citizens and the state for the
institutions that govern economic and social interactions among them. The six
dimensions of governance corresponding to this definition that we measure are:
6
1. Voice and Accountability (VA) – capturing perceptions of the extent to which a
country's citizens are able to participate in selecting their government, as well as
freedom of expression, freedom of association, and a free media.
2. Political Stability and Absence of Violence (PV) – capturing perceptions of the
likelihood that the government will be destabilized or overthrown by
unconstitutional or violent means, including politically-motivated violence and
terrorism.
3. Government Effectiveness (GE) – capturing perceptions of the quality of public
services, the quality of the civil service and the degree of its independence from
political pressures, the quality of policy formulation and implementation, and the
credibility of the government's commitment to such policies.
4. Regulatory Quality (RQ) – capturing perceptions of the ability of the government
to formulate and implement sound policies and regulations that permit and
promote private sector development.
5. Rule of Law (RL) – capturing perceptions of the extent to which agents have
confidence in and abide by the rules of society, and in particular the quality of
contract enforcement, property rights, the police, and the courts, as well as the
likelihood of crime and violence.
6. Control of Corruption (CC) – capturing perceptions of the extent to which public
power is exercised for private gain, including both petty and grand forms of
corruption, as well as "capture" of the state by elites and private interests.
We first organize the many individual sources of data on governance perceptions
so that we can assign them to these six broad categories. We then use a statistical
methodology known as an unobserved components model to construct aggregate
indicators from these individual measures. These aggregate indicators are weighted
averages of the underlying data, with weights reflecting the precision of the individual
data sources. Crucially our methodology also generates margins of error for the
estimates of governance for each country, which need to be taken into account when
making comparisons of governance across countries and over time.
7
2.1 Underlying Data Sources
We rely on a large number of individual data sources that provide us with
information on the perceptions of governance of a wide range of stakeholders. These
data sources consist of surveys of firms and individuals, as well as the assessments of
commercial risk rating agencies, non-governmental organizations, and a number of
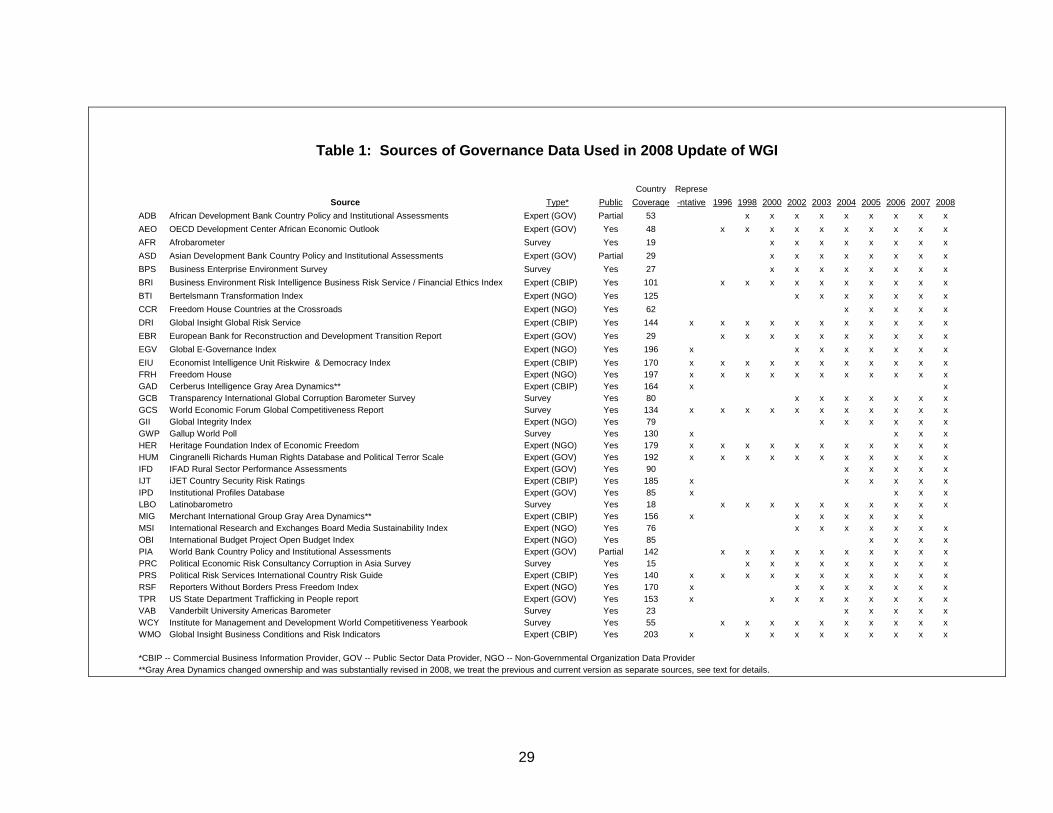
multilateral aid agencies and other public sector organizations. A full list of these
sources is presented in Table 1. For the 2008 round of the WGI, we rely on a total of
441 individual variables measuring different dimensions of governance. These are taken
from 35 different sources, produced by 33 different organizations. Appendices A and B
provide a detailed description of each data source, and document how we have
assigned individual questions from these data sources to our six aggregate indicators.
Almost all of our data sources are available annually, and we use the data only from the
most recent year available from each source in our aggregate indicators. In a few
cases, as noted in Appendix A, we use data lagged one or two years if current data are
not available. In some cases we use several individual variables from a single data
source in our aggregate indicators. When we do so, we first compute a simple average
of these variables from a single source, and then treat the average of these individual
questions as a single observation from that data source.
The WGI data sources reflect the perceptions of a very diverse group of
respondents. Several are surveys of individuals or domestic firms with first-hand
knowledge of the governance situation in the country. These include the World
Economic Forum’s Global Competitiveness Report, the Institute for Management
Development’s World Competitiveness Yearbook, the World Bank / EBRD’s business
environment surveys, the Gallup World Poll, Latinobarometro, Afrobarometro, and the
AmericasBarometer. We refer to these as "Surveys" in Table 1. We also capture the
perceptions of country analysts at the major multilateral development agencies (the
European Bank for Reconstruction and Development, the African Development Bank,
the Asian Development Bank, and the World Bank), reflecting these individuals’ in-depth
experience working on the countries they assess. Together with some expert
assessments provided by the United States Department of State and the French Ministry
of Finance, Industry and Employment, we classify these as "Public Sector Data
Providers" in Table 1. We also have a number of data sources provided by various
8
nongovernmental organizations such as Reporters Without Borders, Freedom House,
and the Bertelsmann Foundation. Finally, an important category of data sources for us
are commercial business information providers, such as the Economist Intelligence Unit,
Global Insight, and Political Risk Services. These last two types of data providers
typically base their assessments on a global network of correspondents with extensive
experience in the countries they are rating.
The data sources in Table 1 are fairly evenly divided among these four
categories. Of the 35 data sources, seven are from commercial business information
providers and the remaining categories have nine data sources each. However, an
important distinction is that the commercial business information providers typically
report data for much larger country samples than our other types of sources. An
extreme example is the Global Insight Business Conditions and Risk Indicators, which
provides information on 203 countries in each of our six aggregate indicators. Primarily
for reasons of cost, household and firm surveys typically have much smaller country
coverage. Our largest surveys, the Global Competitiveness Report survey and the
Gallup World Poll each cover around 130 countries in 2008, and several regional
surveys cover necessarily smaller sets of countries. Some of the expert assessments
provided by NGOs and public sector organizations have quite substantial country
coverage, but others, particularly regionally-focused ones again have much smaller
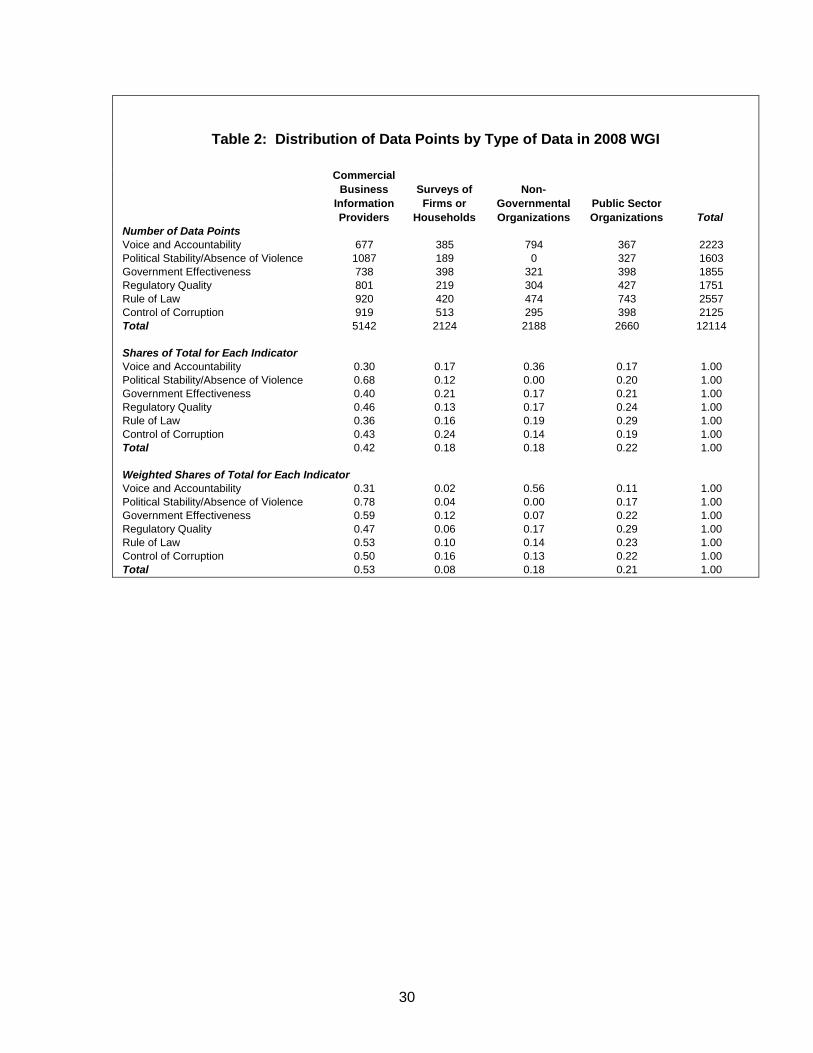
country coverage. The top two panels of Table 2 summarize the distribution of country-
level data points from all of our underlying sources for each of the six indicators in 2008.
The 2008 WGI are based on a total of 12,114 country level data points (after averaging
multiple questions from individual sources), of which 42 percent come from commercial
business information providers. The remaining data points are fairly evenly distributed
between the remaining three types of data providers.
As in the past several years, we report the underlying data from virtually all of the
individual data sources that go into our aggregate indicators at www.govindicators.org.
The sources we have made available through our website are noted in Table 1. A
number of our data sources, such as Freedom House and Reporters Without Borders
have always been publicly available through the publications and/or websites of their
respective organizations. Several of our other sources provided by commercial risk
rating agencies and commercial survey organizations have only been available for a fee.
9
In the interests of greater transparency, these organizations have kindly agreed to allow
us to report their proprietary data in the form in which it enters our governance
indicators. As mentioned above, and as documented in detail in Appendix A and B, we
in some cases use a simple average of multiple questions from the same source as an
ingredient in our governance indicators. We do this when we find more than one
question from a single data source that is relevant to one of the dimensions of
governance that we measure. On the interactive part of our website we report either the
individual question, or the average of individual questions, from each source that enters
into our governance indicators. All the individual variables have been rescaled to run
from zero to one, with higher values indicating better outcomes.
These individual indicators can be used to make comparisons of countries over
time, as all of our underlying sources use reasonably comparable methodologies from
one year to the next. They also can be used to compare different countries' scores on
each of the individual indicators, recognizing however that these types of comparisons
too are subject to margins of error. We caution users however not to compare directly
the scores from different sources for a single country, as they are not comparable. To
take a specific example, it does not make sense to compare a question rated on a 1-10
scale from a data source covering only developing countries with a similar question rated
on the same 1-10 scale, but covering developed countries, as the distribution of true
governance is likely different in the two groups. For example, the same score of 7 out of
10 on the two sources might correspond to quite different levels of governance quality.
As discussed in detail in Kaufmann, Kraay, and Mastruzzi (2004) and also in Appendix
D, our aggregation procedure provides a way of placing such different sources in
common units that allows for meaningful aggregation across sources.
The only data sources we have not been able to obtain permission to publicize
fully are the World Bank's Country Policy and Institutional Assessment, and the
corresponding internal assessments produced by the African Development Bank and the
Asian Development Bank. We do note however that starting in 2002 the World Bank
began publishing limited information on its CPIA assessments on its external website.
For the years 2002-2004 the overall CPIA ratings are reported by quintile for countries
eligible to borrow from the International Development Association (IDA), the
concessional lending window of the World Bank. Starting in 2005, the individual country
10
scores for the IDA resource allocation index, a rating that reflects the CPIA as well as
other considerations, is now publicly available for IDA borrowers. The African
Development Bank's CPIA ratings are also publicly available by quintile only since 2004,
and are fully public since 2005, and the Asian Development Bank's scores have been
fully public for its concessional borrowers since 2005.
2.2 Revisions to Underlying Data Sources
We have made a number of revisions to the data sources underlying the current
update of the WGI. These revisions affect the data for all past years of the WGI, and so
the current release of the data 1996-2008 supersedes previous releases. As we
describe below, however, the revisions to the data for 1996-2007 are minor.
Beginning in 2006, we have included the new Index of Democracy produced by
the Economist Intelligence Unit. This index ranks 167 countries on 60 dimensions of
democracy, grouped into five clusters. Country scores are produced and reviewed by
the EIU’s international network of correspondents, and details of the questionnaire and
methodology can be found at www. eiu.com. This index was first produced in 2006, and
was updated in 2008, with plans for biannual subsequent updates. We average this
measure together with several other variables also produced by the Economist
Intelligence Unit as a component of our Voice and Accountability measure. Details can
be found in Appendix Table A11.
A second data revision applies to two sources produced by Business
Environment Risk Intelligence, a commercial business information provider. In the past,
we used data from a number of their products with differing country coverage: the
Political Risk Index and Operational Risk Index for 50 countries, and the Quantitative
Risk Measure for 115 countries. Given the small country coverage of the data we had
previously obtained from the former two, we treated the first two as a non-representative
source, and the third as a representative source (see Appendix D for details on why this
matters for the aggregation procedure that we use). This year we have acquired data
from all three sources for 120 countries going back to 1996. We average the together
the various variables from all three products and treat it as a single representative
source.
11
Three of our data sources have undergone significant revisions in the past year.
First, following changes to the OECD development center’s African Economic Outlook
publication, we have dropped one variable altogether (“Hardening of the Regime”) and
replaced the indicator “Political Troubles” with the new indicator of “Civil Tensions” that
the AEO reports going back to 1996. We note that this new variable is highly correlated
with their previous “Political Troubles” rating. We use this variable as an ingredient in
Political Stability and Absence of Violence/Terrorism going back to 1996.
The second applies to the Gray Area Dynamics ratings previously produced by
Merchant International Group (MIG), a commercial business information provider. MIG
was acquired in 2008 by Cerberus Corporate Intelligence, and the Gray Area Dynamics
ratings were completely revised. This has resulted in a new set of 30 indicators starting
in 2008. We find these to be a significant improvement over the previous version, with
much more detailed definitions of concepts being measured, and more explicit guidance
as to the rating scale. Since the new version of Gray Area Dynamics is not available in
previous years, and since it differs substantially from the previous version, we treat it as
a new data source beginning in 2008. At the same time, we retain the old version of
Gray Area Dynamics as we used it before during 2002-2007, continuing to refer to the
latter as MIG. The new and old versions of this source are described in Appendix Table
A23. Finally, there has been a significant simplification in the questionnaire for the
Business Environment and Enterprise Performance surveys (BPS), with the result that
several questions asked in previous years were not asked in the latest round of the BPS.
In order to ensure over time comparability for this source, we drop these questions from
the previous rounds of the BPS as well. These changes are detailed in Appendix Table
A5.
We have also made a few further minor revisions to various sources. We have
added a few questions available in the Afrobarometer surveys that we had not used in
past years to make the source completely consistent over time. At the request of Global
Integrity, we have dropped the 2003 round of the Global Integrity Index from our
indicators for 2003, 2004, and 2005, as there were changes in Global Integrity’s
methodology between the first and subsequent rounds of this exercise, making the first
round not fully comparable with subsequent rounds. We have also dropped a question
12
on exchange rate policy from the World Competitiveness Yearbook (WCY) survey for all
years to ensure over time comparability for this source, as it was not asked in 2008. For
similar reasons we have dropped a question on the composition of public spending from
the Global Competitiveness Report survey (GCS). And finally, at the time of the release
of the last round of the WGI, data from the 2007 Cingranelli-Richards Human Rights
database (HUM) and the US State Department Trafficking in Persons Report (TPR)
were not available, and so we used data from 2006. We have now updated the 2007
data to reflect the available 2007 data, and we use the same data for 2008 as well (as
the latest 2008 data was not available at the time of writing).
Readers interested in any further details of these changes in individual indicators
can compare Appendix A of this paper with Appendix A of Kaufmann, Kraay, and
Mastruzzi (2008) describing the 1996-2007 dataset. These minor revisions to the
historical data result in only trivial changes in the six aggregate WGI over the period
1996-2007 when compared with last year's data. In all cases over the past 10 years, the
correlation between the original and the revised indicators is 0.99 or higher, and in no
cases are changes to scores for a single country due to revisions statistically significant
at the 90 percent level.
2.3 Aggregation Methodology
We combine the many individual data sources into six aggregate governance
indicators, corresponding to the six dimensions of governance described above. The
premise underlying this statistical approach should not be too controversial – each of the
individual data sources provides an imperfect signal of some deeper underlying notion of
governance that is difficult to observe directly. This means that, as users of the
individual sources, we face a signal-extraction problem – how do we isolate an
informative signal about governance from each individual data source, and how do we
optimally combine the many data sources to get the best possible signal of governance
in a country based on all the available data? The statistical procedure we use to perform
this aggregation, known as the unobserved components model, is described in detail in
our past work (see for example Kaufmann, Kraay and Mastruzzi (2004), as well as
Appendix D). The main advantage of this approach is that the aggregate indicators are
more informative about unobserved governance than any individual data source.
13
Moreover, the methodology allows us to be explicit about the precision – or imprecision
– of our estimates of governance in each country. This imprecision is not a
consequence of our reliance on subjective or perceptions data on governance – rather
imprecision is an issue that should be squarely addressed in all efforts to measure the
quality of governance, recognizing the inherent complexity and imprecision associated
with such a task.
The aggregation procedure first rescales the individual indicators from each
underlying source in order to make them comparable across data sources. It then
constructs a weighted average of each of these rescaled data sources to arrive at an
aggregate indicator of governance. The weights assigned to each data source are in
turn based on the estimates of the precision of each source that are produced by the
unobserved components model. In brief, the identifying assumption in the unobserved
components model is that any observed correlation between two measures of
corruption, for example, is due to their common, but unobserved, signal of corruption.
From this assumption it follows that data sources that are more correlated with each
other provide more reliable information about corruption, and so receive greater weight.
In past work, we have discussed in detail the merits of this approach--see particularly
Kaufmann, Kraay and Mastruzzi (2006a, Section 3). We have also documented that,
since the underlying data sources on average are quite correlated with each other, the
choice of weights used to construct the aggregate indicator does not substantially affect
the estimates of governance that we report (Kaufmann, Kraay and Mastruzzi 2006a,
2007a).4
Here we briefly report some summary information on the weights for the 2008
indicators.
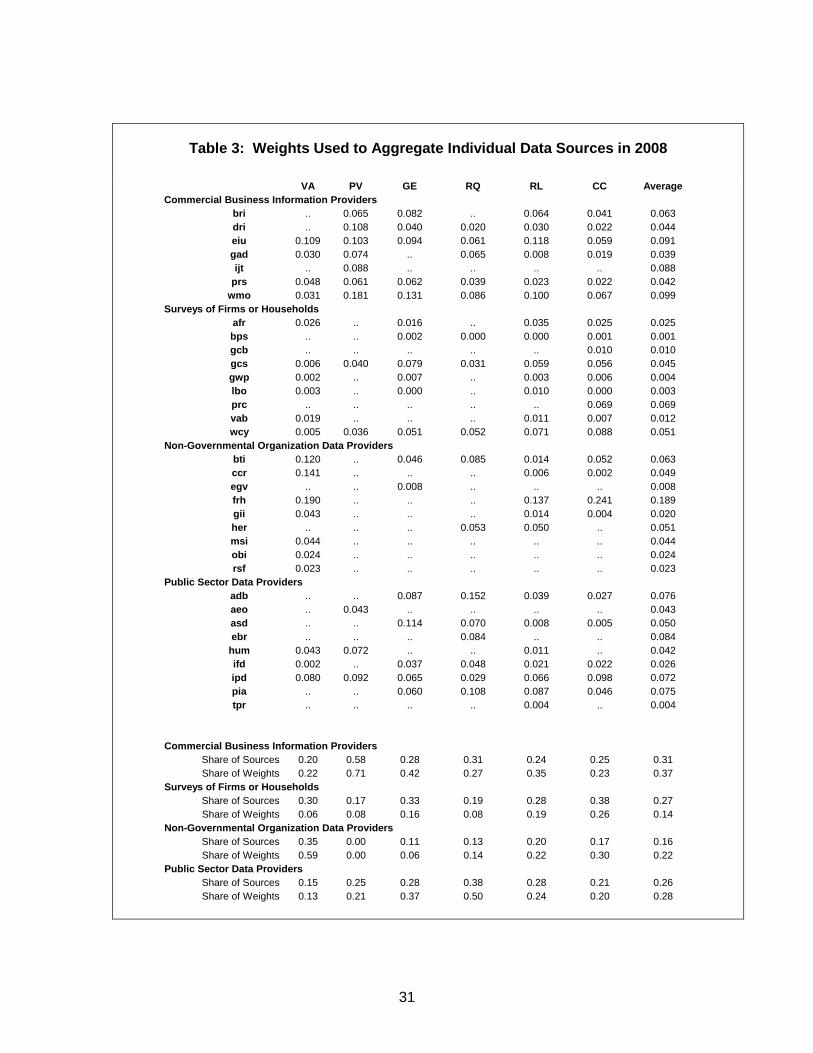
Table 3 reports the weights assigned to each data source in each of the six
governance indicators in 2008. 5
4 It is also worth noting that a far more consequential weighting decision is whether to include a data source or not. In the WGI we have for the most part opted to include as many data sources as possible, then allowing the data and aggregation procedure to select the weights. In contrast, household-survey based data sources receive zero weight in the Transparency International Corruption Perceptions Index (TI-CPI) because the constructors of that measure have chosen to exclude all such data sources.
This table reports the weights that would be used in the
case of a hypothetical country appearing in all of the available underlying data sources
5 A full version of this table reporting the weights for all years in Excel format is available for downloading on the Resources tab of www.govindicators.org
14
for each indicator. Because of gaps in the country coverage of all of our data sources,
no single country appears in all data sources. Nevertheless, the information reported in
Table 3 is informative about the relative weights of the underlying indicators. The
weights used to construct the aggregate governance indicators for any particular country
are approximately equal to the relative weights reported in Table 3 for the subset of
indicators in which that country appears.6
One noteworthy feature in
Table 3 is that there are some systematic differences
in the weights assigned to different types of sources. These are summarized in the
bottom panel of the table. For each of the four types of data sources, we first report the
share of each type in the total number of sources for each indicator. For example, for
Government Effectiveness, we rely on a total of 18 data sources, of which 5, or 28
percent, are from commercial business information providers. We also report the share
of the total weights accounted for by each type of indicator. Taking the same example of
Government Effectiveness, these 5 data sources together receive a somewhat higher
share of the total weight in the indicator, at 42 percent. The last column reports a simple
average of these two figures across all six indicators. These show that data from
commercial business information providers and data from non-governmental
organizations receive weights that are somewhat higher than their proportion in the total
number of data sources (37 versus 31 percent and 22 versus 16 percent respectively).
In contrast, survey-based indicators account for 14 percent of the weight on average, but
account for 27 percent of sources; and indicators provided by public-sector organizations
get almost exactly the same weight on average as their prevalence among the number
of sources would suggest (28 versus 26 percent).
We can combine this information with the information on country coverage of
data sources reported in Table 2. In particular, in the bottom panel of Table 2 we report
the distribution of country-level data points, weighting each point by the weight it
receives in the corresponding aggregate indicator for each country. In light of the higher
weights assigned to data from commercial business information providers, we find that
the weighted average share of country-level data points for this type of source rises from
43 percent (unweighted) to 53 percent (weighted). Correspondingly, the weighted share
6 The precise expression for the weights used for each country can be found in Kaufmann, Kraay and Mastruzzi (2004, Equation (2)) and in the technical Appendix D to this paper.
15
of household surveys declines somewhat from 18 percent to 8 percent. In contrast, the
weighted and unweighted shares of total data points are roughly the same for NGO and
public sector data providers.
We conclude this discussion of weighting by noting that while the weighting
scheme we use has the attraction in principle of reducing the variance of the overall
governance estimates, in practice this effect is relatively small, with the standard errors
of the governance estimates declining by about 10 percent relative to an unweighted
benchmark. Moreover, if we compare our precision-weighted estimates of governance
with an alternative set of aggregate indicators based on simple averages of the
underlying indicators, we find that the two estimates of governance are very similar, with
correlations of 0.99 on average across all our indicators and periods. This reflects the
fact that all of our underlying data sources do, in most cases, provide fairly similar cross-
country ratings of governance. We have also experimented with alternative weighting
schemes that equally weight each type of governance indicator (of the four types
identified in Table 1). Again we find that the correlations are very high with our
benchmark indicators (see Kaufmann, Kraay, and Mastruzzi (2007a), Critique 8, for
details).
3. Estimates of Governance 1996-2008
In Appendix C we report the aggregate governance indicators, for all countries,
for each of the six indicators, for all ten periods. The aggregate indicators for all periods,
as well as virtually all of the underlying indicators, are also available at
www.govindicators.org. The units in which governance is measured follow a normal
distribution with a mean of zero and a standard deviation of one in each period. This
implies that virtually all scores lie between -2.5 and 2.5, with higher scores
corresponding to better outcomes.7
7 These boundaries correspond to the 0.005 and 0.995 percentiles of the standard normal distribution. For a handful of cases, individual country ratings can exceed these boundaries when scores from individual data sources are particularly high or low. Note also that small adjustments to this distribution of scores are made for earlier years to correct for compositional effects driven by expansion of the sample of countries covered. See Appendix D for details.
This also implies that our aggregate estimates
convey no information about trends in global averages of governance, but they are of
course informative about changes in individual countries’ relative positions over time.
16
Moreover, as we discuss below, we find little evidence from our individual data sources
of any substantial trends in world averages of governance. As a result, relative and
absolute changes in countries' governance scores are likely to coincide quite closely.
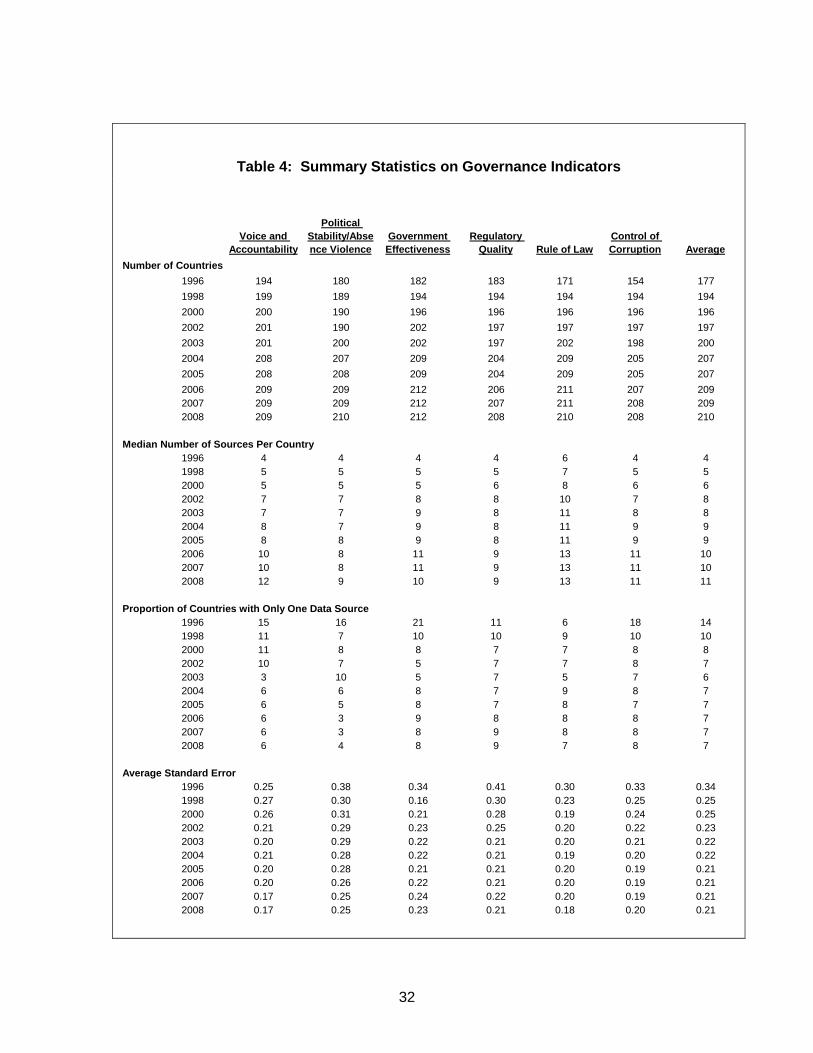
Table 4 summarizes some of the key features of our governance indicators. In
the top panel we show the number of countries included in each of the six indicators and
ten periods of WGI measurement since 1996. Depending on the governance
component, for 2008 the indicators cover between 208 and 212 countries. Over time,
there has been a steady increase in the number of sources included in each of our
indicators. This increase in the number of data sources is reflected in an increase in the
median number of sources available per country, which, depending on the governance
component, ranges from four to six in 1996, and from nine to 13 in 2008. Thanks to the
increase in sources, the proportion of countries in our sample for which our governance
estimates are based on only one source has also declined considerably, from an
average of 14 percent of countries in 1996 to an average of only seven percent in 2008.
An important consequence of this expanding data availability is that the standard
errors of the governance indicators have declined substantially, as shown in the final
panel of Table 4.8 In 1996 the average (for all countries and indicators) of the standard
error was 0.34. Across the six governance indicators, in 2008 the standard error ranges
from 0.17 to 0.25, with an average of 0.21. These substantial declines in standard errors
(on average lowering them by over one-third) illustrate the benefits in terms of precision
of constructing composite indicators based on an expanding number of data sources
incorporating as much information as possible. Of course, since our aggregate
indicators combine information from all of these sources, they have greater precision
than any individual underlying data source. Looking across all ten time periods, the
median standard error of the individual data sources for the governance indicators was
substantially higher at 0.59, with an interquartile range from 0.46 to 0.84.9
8 As described in detail in Kaufmann, Kraay and Mastruzzi (2004), the output of our aggregation procedure is a distribution of possible values of governance for a country, conditional on the observed data for that country. The mean of this conditional distribution is our estimate of governance, and we refer to the standard deviation of this conditional distribution as the “standard error” of the governance estimate.
In other
9 In an earlier paper (Kaufmann, Kraay and Mastruzzi (2004)) we showed how to obtain margins of errors for other ‘objective’ measures of governance and found that they were as large, or larger than those of the individual subjective measures on which we rely for the WGI (and thus
17
words, on average the current set of aggregate WGI indicators exhibit standard errors
which are less than one-half those of a typical individual indicator. This highlights the
benefit of averaging data from many different sources when seeking to measure broad
concepts of governance as we do. Moreover, the likelihood of encountering an extreme
outlier in a country's aggregate governance score is commensurately lower than in any
individual source.
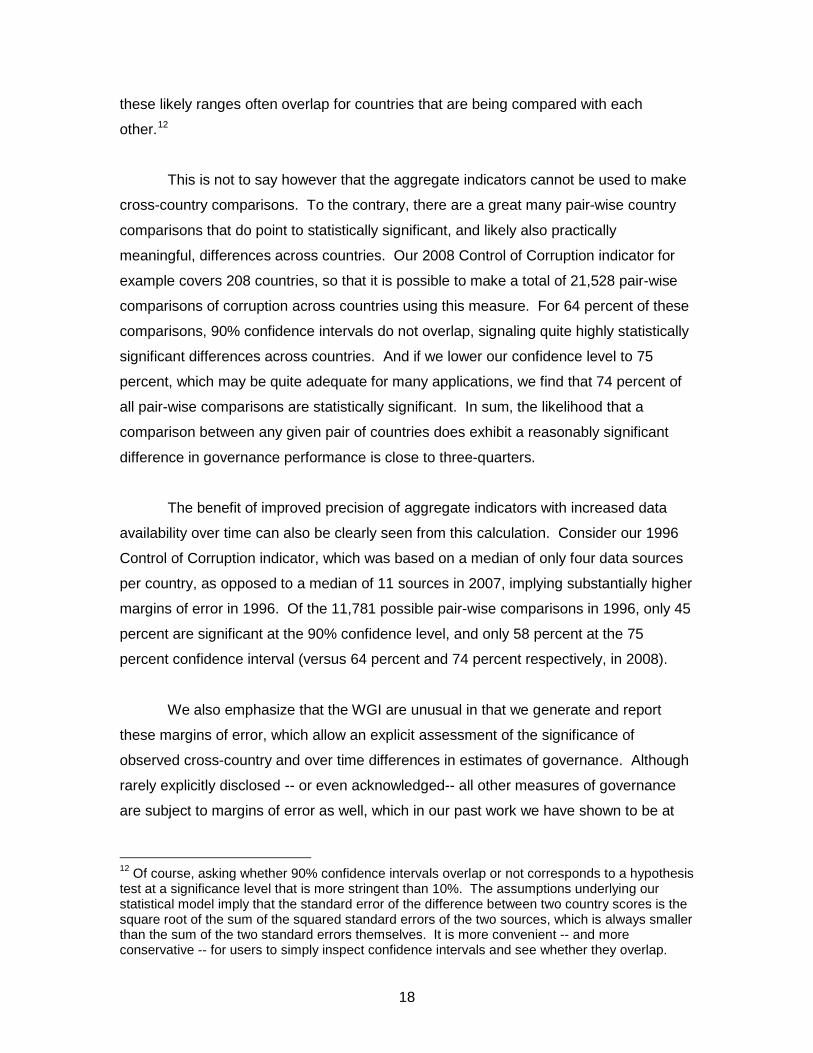
3.1 Cross-Country Comparisons of Governance Using the WGI
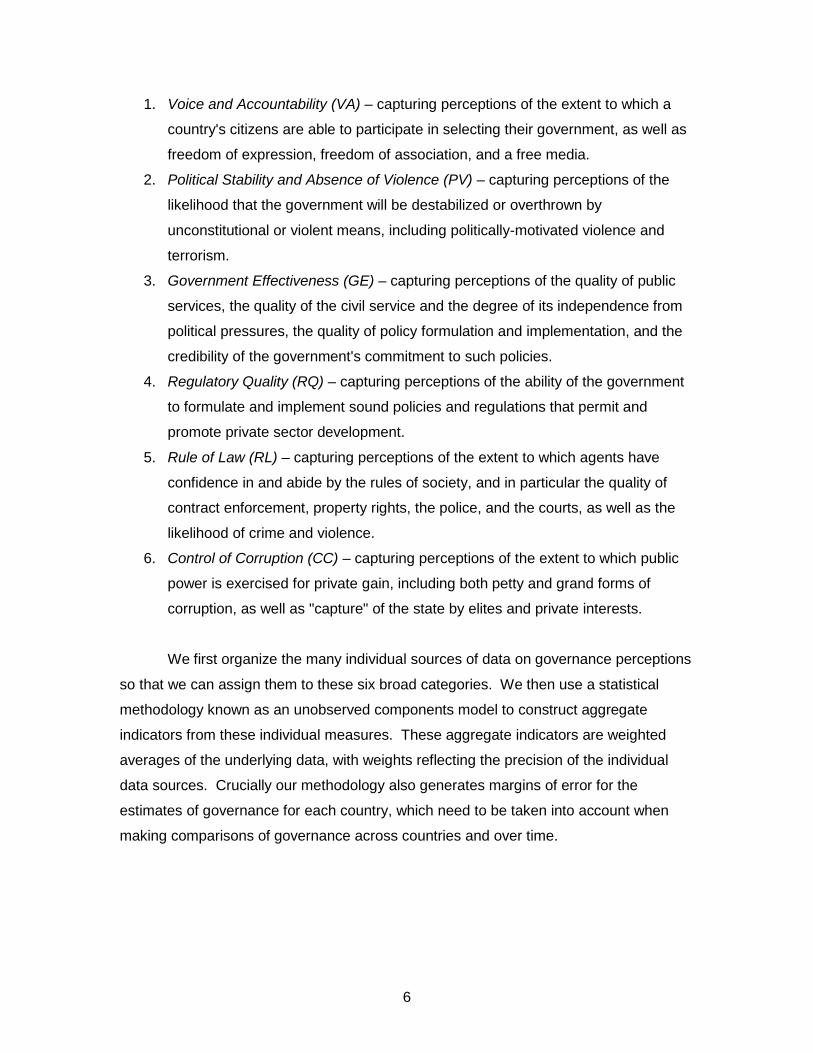
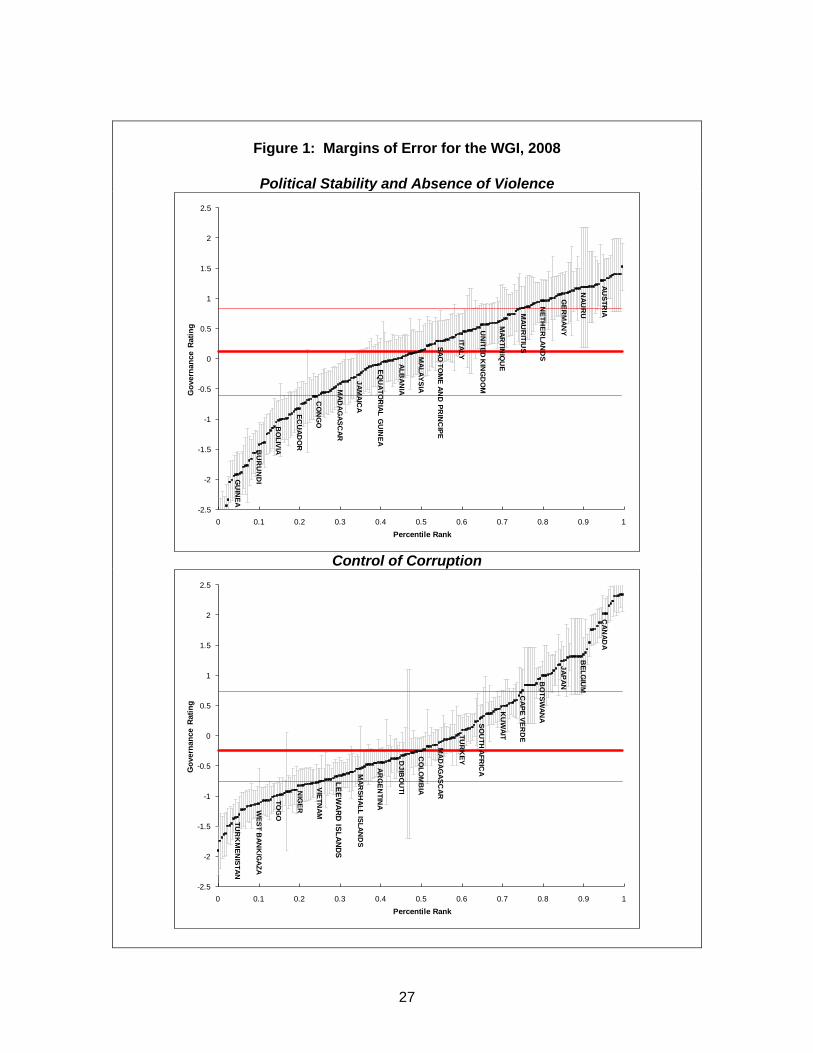
We use Figure 1 and Figure 2 to emphasize the importance of taking these
standard errors into account when making comparisons of governance across countries
and over time. In the two panels of Figure 1, we order countries in ascending order
according to their point estimates of governance in 2008 on the horizontal axis, and on
the vertical axis we plot the estimate of governance and the associated 90% confidence
intervals.10 These intervals indicate the range in which it is 90 percent likely that the true
governance score falls.11
Figure 1
We do this for two of the six governance indicators, Political
Stability and Absence of Violence/Terrorism, and Control of Corruption. The size of
these confidence intervals varies across countries, as different countries appear in
different numbers of sources with different levels of precision. The resulting confidence
intervals are substantial relative to the units in which governance is measured. From
it should also be evident that many of the small differences in estimates of
governance across countries are not likely to be statistically significant at reasonable
confidence levels, since the associated 90 percent confidence intervals are likely to
overlap. For many applications, instead of merely observing the point estimates, it is
often more useful to focus on the range of possible governance values for each country
(as summarized in the 90% confidence intervals shown in Figure 1), recognizing that
obviously (thanks to the aggregation) we also found that the WGI had much lower margins of error than any ‘objective’ measure. This underscores the fact that all efforts to measure governance involve margins of error, often non-trivial. 10 Due to space constraints we cannot label all countries in Figure 1. Instead we show country names for countries at or near the vintiles of the distribution of the governance indicator. 11 A x% confidence interval for governance can be obtained as the point estimate of governance plus or minus the standard error times the (100-x)/2th percentile of the standard normal distribution. For example, the 90% confidence intervals we report throughout the paper are the point estimate plus or minus 1.64 times the standard error.
18
these likely ranges often overlap for countries that are being compared with each
other.12
We also emphasize that the WGI are unusual in that we generate and report
these margins of error, which allow an explicit assessment of the significance of
observed cross-country and over time differences in estimates of governance. Although
rarely explicitly disclosed -- or even acknowledged-- all other measures of governance
are subject to margins of error as well, which in our past work we have shown to be at
This is not to say however that the aggregate indicators cannot be used to make
cross-country comparisons. To the contrary, there are a great many pair-wise country
comparisons that do point to statistically significant, and likely also practically
meaningful, differences across countries. Our 2008 Control of Corruption indicator for
example covers 208 countries, so that it is possible to make a total of 21,528 pair-wise
comparisons of corruption across countries using this measure. For 64 percent of these
comparisons, 90% confidence intervals do not overlap, signaling quite highly statistically
significant differences across countries. And if we lower our confidence level to 75
percent, which may be quite adequate for many applications, we find that 74 percent of
all pair-wise comparisons are statistically significant. In sum, the likelihood that a
comparison between any given pair of countries does exhibit a reasonably significant
difference in governance performance is close to three-quarters.
The benefit of improved precision of aggregate indicators with increased data
availability over time can also be clearly seen from this calculation. Consider our 1996
Control of Corruption indicator, which was based on a median of only four data sources
per country, as opposed to a median of 11 sources in 2007, implying substantially higher
margins of error in 1996. Of the 11,781 possible pair-wise comparisons in 1996, only 45
percent are significant at the 90% confidence level, and only 58 percent at the 75
percent confidence interval (versus 64 percent and 74 percent respectively, in 2008).
12 Of course, asking whether 90% confidence intervals overlap or not corresponds to a hypothesis test at a significance level that is more stringent than 10%. The assumptions underlying our statistical model imply that the standard error of the difference between two country scores is the square root of the sum of the squared standard errors of the two sources, which is always smaller than the sum of the two standard errors themselves. It is more convenient -- and more conservative -- for users to simply inspect confidence intervals and see whether they overlap.
19
least as large as those we calculate for our individual and aggregate indicators.13
We now turn to the changes over time in our estimates of governance in
individual countries.
This
underscores the need for caution in making cross-country comparisons with any type of
governance indicator.
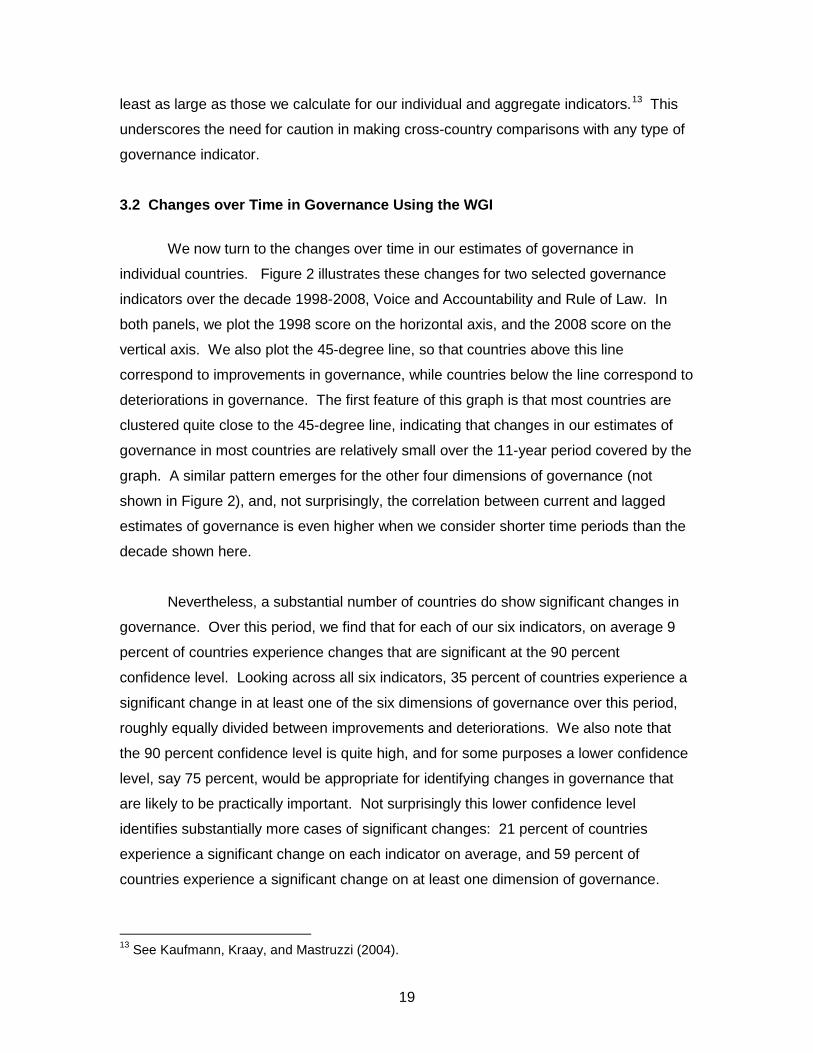
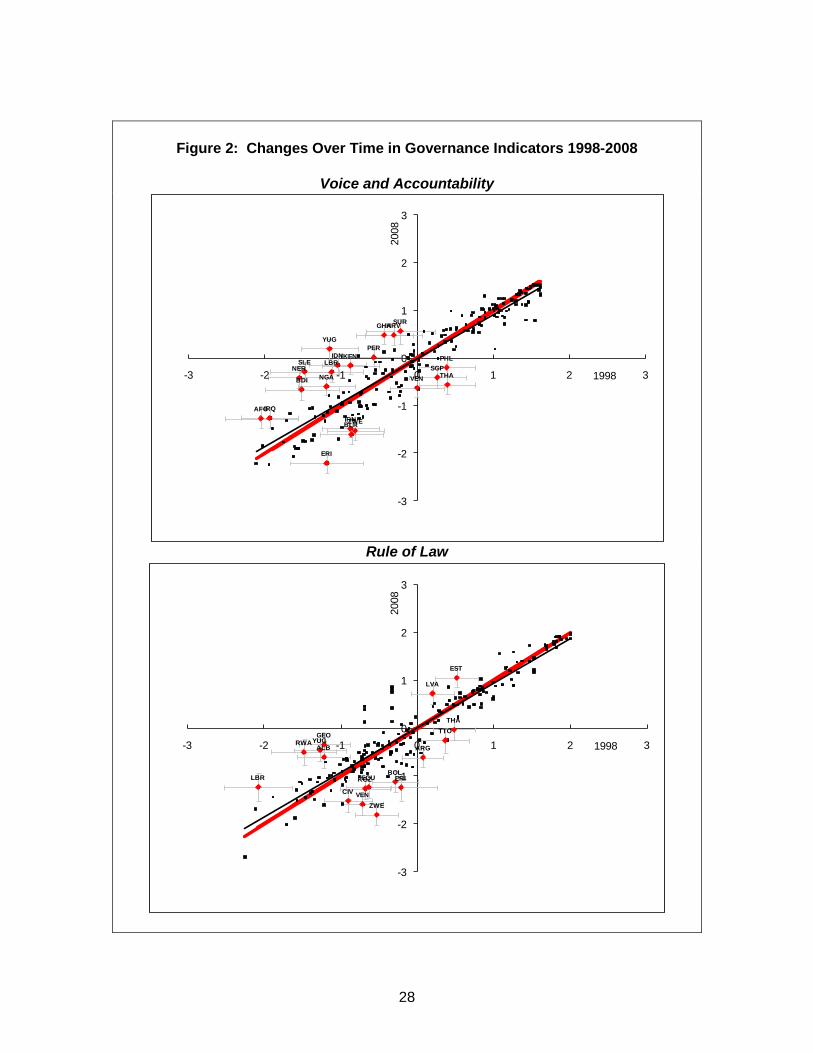
3.2 Changes over Time in Governance Using the WGI
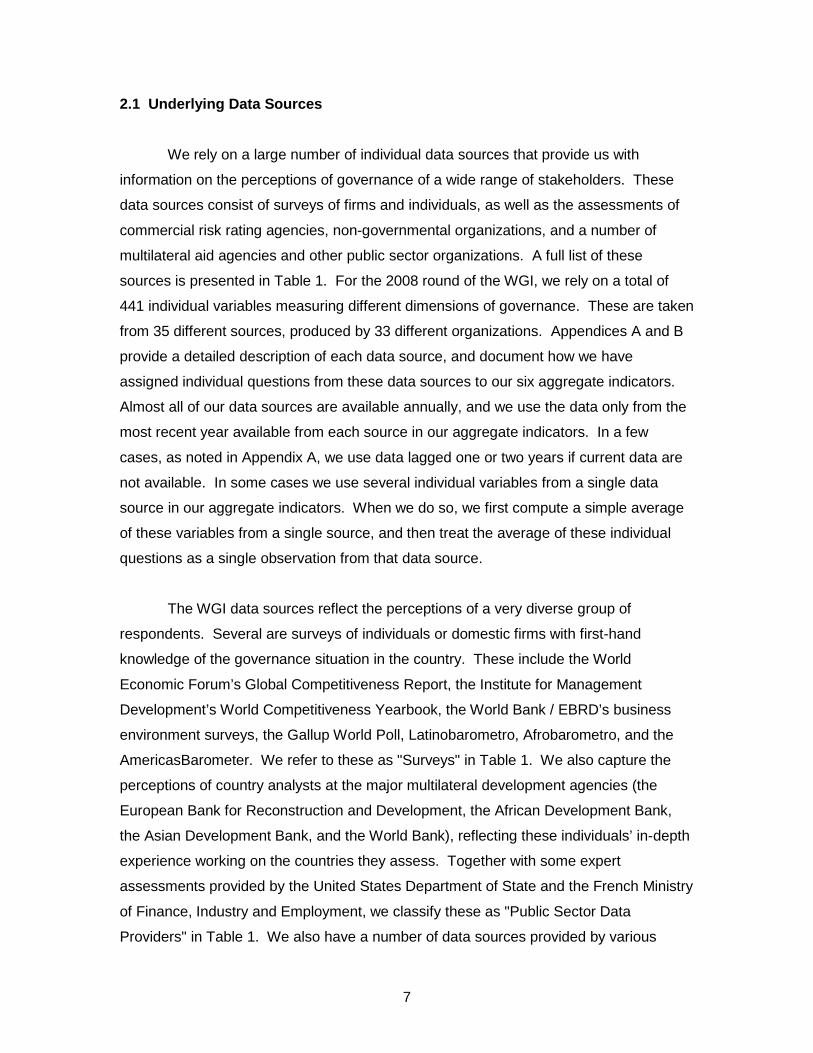
Figure 2 illustrates these changes for two selected governance
indicators over the decade 1998-2008, Voice and Accountability and Rule of Law. In
both panels, we plot the 1998 score on the horizontal axis, and the 2008 score on the
vertical axis. We also plot the 45-degree line, so that countries above this line
correspond to improvements in governance, while countries below the line correspond to
deteriorations in governance. The first feature of this graph is that most countries are
clustered quite close to the 45-degree line, indicating that changes in our estimates of
governance in most countries are relatively small over the 11-year period covered by the
graph. A similar pattern emerges for the other four dimensions of governance (not
shown in Figure 2), and, not surprisingly, the correlation between current and lagged
estimates of governance is even higher when we consider shorter time periods than the
decade shown here.
Nevertheless, a substantial number of countries do show significant changes in
governance. Over this period, we find that for each of our six indicators, on average 9
percent of countries experience changes that are significant at the 90 percent
confidence level. Looking across all six indicators, 35 percent of countries experience a
significant change in at least one of the six dimensions of governance over this period,
roughly equally divided between improvements and deteriorations. We also note that
the 90 percent confidence level is quite high, and for some purposes a lower confidence
level, say 75 percent, would be appropriate for identifying changes in governance that
are likely to be practically important. Not surprisingly this lower confidence level
identifies substantially more cases of significant changes: 21 percent of countries
experience a significant change on each indicator on average, and 59 percent of
countries experience a significant change on at least one dimension of governance.
13 See Kaufmann, Kraay, and Mastruzzi (2004).
20
In Figure 2 we have labeled those countries for which the change in estimated
governance over the 1998-2008 period is sufficiently large that the 90% confidence
intervals for governance in the two periods do not overlap.14
Figure 2
Examples of such
substantial changes in governance estimates between 1998 and 2008 include significant
improvements in Voice and Accountability in countries such as Ghana, Indonesia,
Kenya, Nigeria, and Peru, but also declines in that component in countries such as
Belarus, Zimbabwe and Venezuela. In Rule of Law we see improvements in countries
such as Georgia, Liberia, Rwanda, and Estonia, contrasting with declines in countries
such as Cote D’Ivoire, Ecuador, Bolivia and Zimbabwe. Other examples of
improvements in estimates of governance not shown in include Rwanda,
Algeria, Angola and Serbia in Political Stability and Absence of Violence/Terrorism,
Afghanistan, Colombia and Ethiopia in Government Effectiveness; Georgia, Libya and
the Democratic Republic of Congo in Regulatory Quality; and Tanzania, Liberia and
Serbia in Control of Corruption.
In Table 5 we provide more detail on all of the statistically significant (at the 90
percent level) changes in our six governance indicators over the period 1998-2008. The
first three columns report the level of governance in the two periods, and the change.
The next three columns report on how the underlying data sources move for each case.
In the column labeled “Agree” we report the number of sources available in both periods
which move in the same direction as the aggregate indicator. The columns labeled “No
Change” and “Disagree” report the number of sources on which that country’s score
does not change or moves in the opposite direction to the aggregate indicator. For each
country we also summarize the extent to which changes in the individual sources agree
with the direction of change in the aggregate indicator by calculating the “Agreement
Ratio”, or “Agree” / (“Agree” + “Disagree”). The agreement ratio is quite high for
countries with large changes in governance. Averaging across all countries and
indicators, we find an average agreement ratio of 0.90 for the period 1998-2008, as
reported in Table 5. This provides confidence that for countries with statistically
14 While this is not a formal test of the statistical significance of changes over time in governance, it is a very simple and transparent rule of thumb for identifying changes in governance that are likely to be significant. In Kaufmann, Kraay, and Mastruzzi (2005, 2006) we have shown in more detail how to assess the statistical significance of changes in governance, and that this simple rule of thumb turns out to be a fairly good approximation.
21
significant changes in our aggregate governance estimates, these changes are reflected
in a strong majority of the individual underlying data sources.
The last three columns of Table 5 address directly the issue of adding sources
over time. Averaging over all the significant changes, we find that for a typical change,
between three and four new data sources were added between 1998 and 2008. One
might reasonably wonder about the extent to which changes in the aggregate indicators
are driven by the addition of sources whose ratings differed from those for 2008 provided
by sources also available in 1998. It turns out however that this effect is small in most
cases. To see this, in the second-last column, we have calculated the change that we
would have seen in the aggregate indicators had we used only those same data sources
available in both 1998 and 2008 for the indicated country. We refer to this as the
"balanced" change. The final column reports the ratio of this balanced change to the
actual change reported in the third column of Table 5. If this ratio is less than one, the
actual change exceeds (in absolute value) the balanced change, indicating that the
addition of sources magnified the change relative to what would have been observed
using only the balanced set of sources. And if this ratio is greater than one, the addition
of new sources offsets the change observed among the balanced sources.15
It turns out that these compositional effects are not large. For 103 of the 126
significant changes reported in
Table 5, the ratio of the balanced change to the actual
change is between 0.75 and 1.25, i.e. the balanced change is within 25 percent of the
actual change. Another way to see the relative unimportance of compositional effects is
to calculate the correlation between the balanced and unbalanced changes. Pooling all
six indicators, this correlation is equal to 0.99.
Finally, it is worth noting that the agreement ratios for significant changes in
governance are substantially higher than the agreement ratios for all changes in
governance. This can be seen in Table 6 which computes the same agreement ratio,
but for all countries over the period 1998-2008. The agreement ratio averages 69
percent, compared with 90 percent for large changes, suggesting that for the more
15 We note that there is a significant increase in the number of sources on which the WGI are based in 2002. As a result, over time comparisons from 2002 onwards show a far smaller incidence of added sources.
22
typical smaller changes in our governance estimates, there is relatively more
disagreement across individual sources about the direction of the change than there is
for large changes. Nevertheless, even for these smaller changes, typically the majority
of underlying individual sources agree about the direction of the change. These
examples underscore the importance of carefully examining the factors underlying
changes in the aggregate governance indicators in particular countries. In order to
facilitate this, on the WGI website users can retrieve the data from the individual
indicators underlying our aggregate indicators and use this to examine trends in the
underlying data as well as changes over time in the composition of data sources on
which the estimates are based.
3.3 Trends in Global Averages of Governance
We conclude by reviewing the available evidence on trends in global averages of
governance. As we have already noted, the aggregate WGI measures are not
informative about trends in global averages because we assume that world averages of
governance are zero in each period, as a convenient choice of units. While the
aggregate indicators are of course informative about the relative performance of
individual (or groups of) countries over time, in order to assess trends in global averages
of governance we need to return to our underlying individual data sources.
In Table 7 we summarize trends in world averages in a number of our individual
data sources. Most of the sources in this table are polls of experts, with data extending
over the period 1998-2008. Only one of them, GCS, is a survey with sufficiently
standard format to enable comparisons of global averages for a large set of countries
over a reasonable period of time, in this case from 2003 to 2008 (prior to 2003 country
coverage for GCS was substantially lower). The first column reports the number of
countries covered by the source in each of the periods shown, and the next three
columns present the average across all countries of each of the sources for 1998, 2003,
and 2008. The underlying data have been rescaled to run from zero to one, and for
each source and governance component, we report the score on the same question or
average of questions that we use in the aggregate indicator. The next three columns
report the standard deviation across countries for each source. The remaining columns
23
report the t-statistics associated with the test of the null hypothesis that the change in the
global averages of the indicators is zero over the indicated sub-periods.
Over the period 1998-2003 the data show little evidence of substantial trends in
world averages of governance. Looking across all six indicators, there are five cases
where world averages of sources decline significantly, and 10 cases where the world
averages increase significantly (at the 90 percent confidence level). However, a closer
look at the table reveals that half of these significant improvements are concentrated in
just one source, DRI, whose global averages on the five indicators in which it appears
fluctuate substantially. Apart from this one source, all remaining significant changes are
split evenly between increases and decreases. We note also that the magnitude of the
changes is in most cases quite small. Averaging across all indicators and sources, the
mean change in the world average is just 0.02 (on a scale from 0 to 1). And if we
disregard the one source DRI that shows very large fluctuations in its global averages,
the mean change in the world average is just 0.01.
A similar picture of mostly small changes in world averages persists when we
consider separately the sub-periods 1998-2003 and 2003-2008. During the first sub-
period, we find seven significant declines and three significant improvements. Once
again however we see that five of the significant changes are concentrated in just one
source, DRI. Setting this one source aside we find that significant changes in world
averages are roughly evenly split between declines (two) and improvements (three).
And once again changes in world averages are small, averaging to just -0.01 (or 0.00 if
we disregard DRI). Over the period 2003-2008 there are some glimmerings of evidence
of improvements in world averages, with seven significant cases of improvements, but
once again five of these are due to just one source, DRI. The improvement in the world
average is slightly larger during this period, at 0.03, but is again driven mostly by DRI.
Excluding this one source we find that the overall world average improves by just 0.01.
While we do not want to over-interpret the limited information on trends in world
averages provided in Table 7, we see it as broadly consistent with the view that there is
little evidence of significant (or quantitatively important) changes in world averages of
governance over the past decade. At a technical level, this is consistent with our choice
of units for the aggregate governance indicators (where the mean is set to zero in each
24
period as a convenient choice of units). And more substantively, this evidence highlights
major governance challenges worldwide, where improvements in governance in some
countries are largely offset by declines in others, with the result that world averages
show little change.
4. Conclusions
In this paper we have reported on the latest update of the Worldwide
Governance Indicators for 2008. The WGI are available biannually since 1996, and
annually for 2002-2008. We have also continued our practice of reporting the individual
indicators underlying the aggregate WGI. It is our hope that timely annual reporting, as
well as providing access to individual indicators, are making the aggregate indicators
more useful to users in academic and policymaking circles.
We nevertheless emphasize to all users the limitations of these measures of
governance, which are shared by virtually all efforts to measure governance across
countries and over time. The aggregate indicators we construct are useful for broad
cross-country and over-time comparisons of governance, but all such comparisons
should take appropriate account of the margins of error associated with the governance
estimates. These margins of error are not unique to our perceptions-based measures
but are present -- if not explicitly acknowledged -- in any effort to measure governance.
They naturally reflect the inherent difficulty in measuring something as complicated and
multifaceted as governance. However, we have shown the feasibility of using the
aggregate indicators to make comparisons of governance across countries and over
time, subject to appropriate consideration of margins of error. In this paper we also gave
a brief account of the evolution of the WGI over the past decade or so, including how the
margins of error have declined over time, mostly due to the increasing availability of
individual sources. Thus, while margins of error remain non-trivial, it is worth noting that
for the current 2008 data we see that 64 percent of all cross-country comparisons result
in highly-significant differences (at 90 percent confidence levels), and that about one-
third of countries have experienced substantial changes in at least one dimension of
governance between 1998 and 2008.
25
We also caution users that the aggregate indicators can in some circumstances
be a rather blunt tool for policy advice at the country level. We expect that the provision
of the underlying data will help users in identifying -- and acting upon -- more specific
aspects of governance that may be problematic in a given country. And we also
encourage using these aggregate and individual indicators in conjunction with a wealth
of possible more detailed and nuanced sources of country-level data and diagnostics on
governance in formulating policy advice.
26
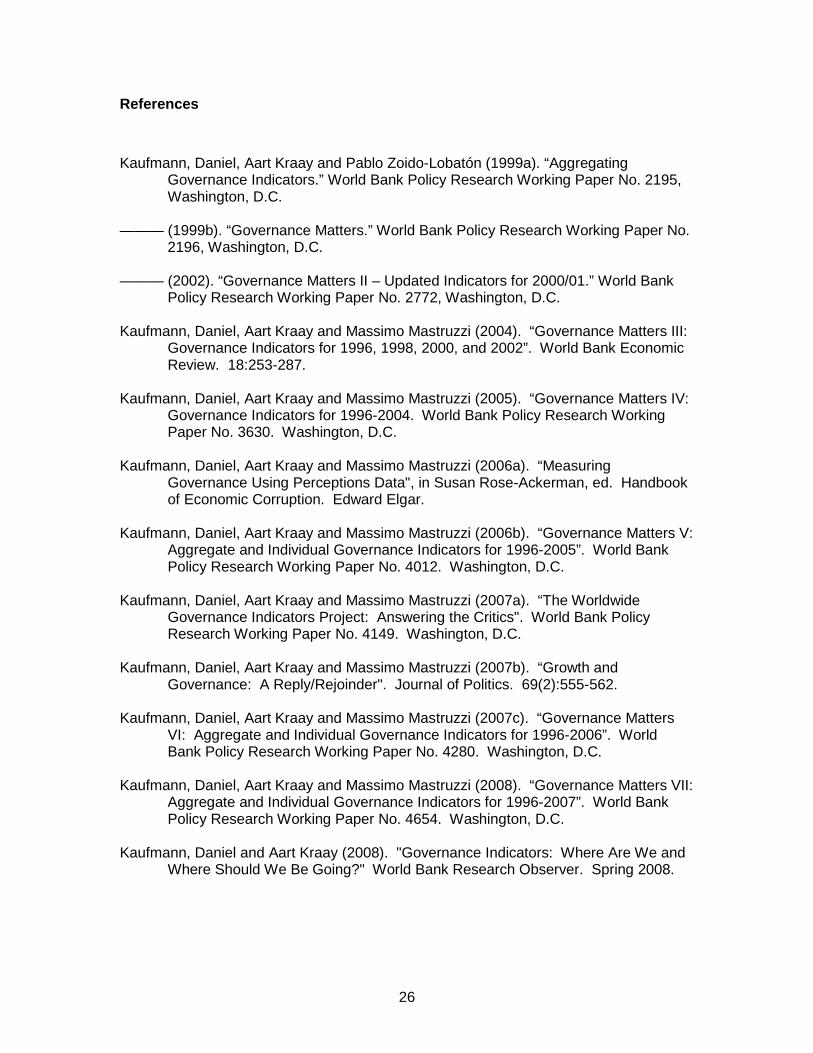
References
Kaufmann, Daniel, Aart Kraay and Pablo Zoido-Lobatón (1999a). “Aggregating
Governance Indicators.” World Bank Policy Research Working Paper No. 2195, Washington, D.C.
——— (1999b). “Governance Matters.” World Bank Policy Research Working Paper No.
2196, Washington, D.C. ——— (2002). “Governance Matters II – Updated Indicators for 2000/01.” World Bank
Policy Research Working Paper No. 2772, Washington, D.C. Kaufmann, Daniel, Aart Kraay and Massimo Mastruzzi (2004). “Governance Matters III:
Governance Indicators for 1996, 1998, 2000, and 2002”. World Bank Economic Review. 18:253-287.
Kaufmann, Daniel, Aart Kraay and Massimo Mastruzzi (2005). “Governance Matters IV:
Governance Indicators for 1996-2004. World Bank Policy Research Working Paper No. 3630. Washington, D.C.
Kaufmann, Daniel, Aart Kraay and Massimo Mastruzzi (2006a). “Measuring
Governance Using Perceptions Data", in Susan Rose-Ackerman, ed. Handbook of Economic Corruption. Edward Elgar.
Kaufmann, Daniel, Aart Kraay and Massimo Mastruzzi (2006b). “Governance Matters V:
Aggregate and Individual Governance Indicators for 1996-2005”. World Bank Policy Research Working Paper No. 4012. Washington, D.C.
Kaufmann, Daniel, Aart Kraay and Massimo Mastruzzi (2007a). “The Worldwide
Governance Indicators Project: Answering the Critics". World Bank Policy Research Working Paper No. 4149. Washington, D.C.
Kaufmann, Daniel, Aart Kraay and Massimo Mastruzzi (2007b). “Growth and
Governance: A Reply/Rejoinder". Journal of Politics. 69(2):555-562. Kaufmann, Daniel, Aart Kraay and Massimo Mastruzzi (2007c). “Governance Matters
VI: Aggregate and Individual Governance Indicators for 1996-2006”. World Bank Policy Research Working Paper No. 4280. Washington, D.C.
Kaufmann, Daniel, Aart Kraay and Massimo Mastruzzi (2008). “Governance Matters VII:
Aggregate and Individual Governance Indicators for 1996-2007”. World Bank Policy Research Working Paper No. 4654. Washington, D.C.
Kaufmann, Daniel and Aart Kraay (2008). "Governance Indicators: Where Are We and
Where Should We Be Going?" World Bank Research Observer. Spring 2008.
27
Figure 1: Margins of Error for the WGI, 2008
Political Stability and Absence of Violence
ALBAN
IA
AUSTR
IA
BU
RU
ND
I
BO
LIVIA
CO
NG
O
GER
MAN
Y
ECU
ADO
R
UN
ITED K
ING
DO
M
GU
INEA
EQU
ATOR
IAL GU
INEA
ITALY
JAMAIC
A
MAD
AGASC
AR
MAR
TINIQ
UE
MAU
RITIU
S
MALAYSIA
NETH
ERLAN
DS
NAU
RU
SAO TO
ME AN
D PR
INC
IPE
-2.5
-2
-1.5
-1
-0.5
0
0.5
1
1.5
2
2.5
0 0.1 0.2 0.3 0.4 0.5 0.6 0.7 0.8 0.9 1
Gov
erna
nce
Ratin
g
Percentile Rank
Control of Corruption
ARG
ENTIN
A
BELG
IUM
BO
TSWAN
A
CAN
ADA
CO
LOM
BIA
CAPE VER
DE
DJIB
OU
TI
JAPAN
KU
WAIT
LEEWARD ISLANDS
MAD
AGASC
AR
MAR
SHALL ISLAN
DS
NIG
ER
TOG
O
TUR
KM
ENISTAN
TUR
KEY
VIETNAMW
EST BAN
K/G
AZA
SOU
TH AFR
ICA
-2.5
-2
-1.5
-1
-0.5
0
0.5
1
1.5
2
2.5
0 0.1 0.2 0.3 0.4 0.5 0.6 0.7 0.8 0.9 1
Gov
erna
nce
Ratin
g
Percentile Rank
28
Figure 2: Changes Over Time in Governance Indicators 1998-2008
Voice and Accountability
AFG
BDI
BLR
ERI
GHAHRV
IDN
IRNIRQ
KENLBR
NERNGA
PERPHL
SGPSLE
SUR
THAVEN
YUG
ZWE
-3
-2
-1
0
1
2
3
-3 -2 -1 0 1 2 3
2008
1998
Rule of Law
ALB ARG
BOL
CIV
ECU ERI
EST
GEO
KGZLBR
LVA
RWA
THATTO
VEN
YUG
ZWE
-3
-2
-1
0
1
2
3
-3 -2 -1 0 1 2 3
2008
1998
29
Table 1: Sources of Governance Data Used in 2008 Update of WGI
Country RepreseSource Type* Public Coverage -ntative 1996 1998 2000 2002 2003 2004 2005 2006 2007 2008
ADB African Development Bank Country Policy and Institutional Assessments Expert (GOV) Partial 53 x x x x x x x x xAEO OECD Development Center African Economic Outlook Expert (GOV) Yes 48 x x x x x x x x x xAFR Afrobarometer Survey Yes 19 x x x x x x x xASD Asian Development Bank Country Policy and Institutional Assessments Expert (GOV) Partial 29 x x x x x x x xBPS Business Enterprise Environment Survey Survey Yes 27 x x x x x x x xBRI Business Environment Risk Intelligence Business Risk Service / Financial Ethics Index Expert (CBIP) Yes 101 x x x x x x x x x xBTI Bertelsmann Transformation Index Expert (NGO) Yes 125 x x x x x x xCCR Freedom House Countries at the Crossroads Expert (NGO) Yes 62 x x x x xDRI Global Insight Global Risk Service Expert (CBIP) Yes 144 x x x x x x x x x x xEBR European Bank for Reconstruction and Development Transition Report Expert (GOV) Yes 29 x x x x x x x x x xEGV Global E-Governance Index Expert (NGO) Yes 196 x x x x x x x xEIU Economist Intelligence Unit Riskwire & Democracy Index Expert (CBIP) Yes 170 x x x x x x x x x x xFRH Freedom House Expert (NGO) Yes 197 x x x x x x x x x x xGAD Cerberus Intelligence Gray Area Dynamics** Expert (CBIP) Yes 164 x xGCB Transparency International Global Corruption Barometer Survey Survey Yes 80 x x x x x x xGCS World Economic Forum Global Competitiveness Report Survey Yes 134 x x x x x x x x x x xGII Global Integrity Index Expert (NGO) Yes 79 x x x x x xGWP Gallup World Poll Survey Yes 130 x x x xHER Heritage Foundation Index of Economic Freedom Expert (NGO) Yes 179 x x x x x x x x x x xHUM Cingranelli Richards Human Rights Database and Political Terror Scale Expert (GOV) Yes 192 x x x x x x x x x x xIFD IFAD Rural Sector Performance Assessments Expert (GOV) Yes 90 x x x x xIJT iJET Country Security Risk Ratings Expert (CBIP) Yes 185 x x x x x xIPD Institutional Profiles Database Expert (GOV) Yes 85 x x x xLBO Latinobarometro Survey Yes 18 x x x x x x x x x xMIG Merchant International Group Gray Area Dynamics** Expert (CBIP) Yes 156 x x x x x x xMSI International Research and Exchanges Board Media Sustainability Index Expert (NGO) Yes 76 x x x x x x xOBI International Budget Project Open Budget Index Expert (NGO) Yes 85 x x x xPIA World Bank Country Policy and Institutional Assessments Expert (GOV) Partial 142 x x x x x x x x x xPRC Political Economic Risk Consultancy Corruption in Asia Survey Survey Yes 15 x x x x x x x x xPRS Political Risk Services International Country Risk Guide Expert (CBIP) Yes 140 x x x x x x x x x x xRSF Reporters Without Borders Press Freedom Index Expert (NGO) Yes 170 x x x x x x x xTPR US State Department Trafficking in People report Expert (GOV) Yes 153 x x x x x x x x xVAB Vanderbilt University Americas Barometer Survey Yes 23 x x x x xWCY Institute for Management and Development World Competitiveness Yearbook Survey Yes 55 x x x x x x x x x xWMO Global Insight Business Conditions and Risk Indicators Expert (CBIP) Yes 203 x x x x x x x x x x
*CBIP -- Commercial Business Information Provider, GOV -- Public Sector Data Provider, NGO -- Non-Governmental Organization Data Provider**Gray Area Dynamics changed ownership and was substantially revised in 2008, we treat the previous and current version as separate sources, see text for details.
30
Table 2: Distribution of Data Points by Type of Data in 2008 WGI
Commercial Business
Information Providers
Surveys of Firms or
Households
Non-Governmental Organizations
Public Sector Organizations Total
Number of Data PointsVoice and Accountability 677 385 794 367 2223Political Stability/Absence of Violence 1087 189 0 327 1603Government Effectiveness 738 398 321 398 1855Regulatory Quality 801 219 304 427 1751Rule of Law 920 420 474 743 2557Control of Corruption 919 513 295 398 2125Total 5142 2124 2188 2660 12114
Shares of Total for Each IndicatorVoice and Accountability 0.30 0.17 0.36 0.17 1.00Political Stability/Absence of Violence 0.68 0.12 0.00 0.20 1.00Government Effectiveness 0.40 0.21 0.17 0.21 1.00Regulatory Quality 0.46 0.13 0.17 0.24 1.00Rule of Law 0.36 0.16 0.19 0.29 1.00Control of Corruption 0.43 0.24 0.14 0.19 1.00Total 0.42 0.18 0.18 0.22 1.00
Weighted Shares of Total for Each IndicatorVoice and Accountability 0.31 0.02 0.56 0.11 1.00Political Stability/Absence of Violence 0.78 0.04 0.00 0.17 1.00Government Effectiveness 0.59 0.12 0.07 0.22 1.00Regulatory Quality 0.47 0.06 0.17 0.29 1.00Rule of Law 0.53 0.10 0.14 0.23 1.00Control of Corruption 0.50 0.16 0.13 0.22 1.00Total 0.53 0.08 0.18 0.21 1.00
31
Table 3: Weights Used to Aggregate Individual Data Sources in 2008
VA PV GE RQ RL CC AverageCommercial Business Information Providers
bri .. 0.065 0.082 .. 0.064 0.041 0.063dri .. 0.108 0.040 0.020 0.030 0.022 0.044eiu 0.109 0.103 0.094 0.061 0.118 0.059 0.091gad 0.030 0.074 .. 0.065 0.008 0.019 0.039ijt .. 0.088 .. .. .. .. 0.088
prs 0.048 0.061 0.062 0.039 0.023 0.022 0.042wmo 0.031 0.181 0.131 0.086 0.100 0.067 0.099
Surveys of Firms or Householdsafr 0.026 .. 0.016 .. 0.035 0.025 0.025bps .. .. 0.002 0.000 0.000 0.001 0.001gcb .. .. .. .. .. 0.010 0.010gcs 0.006 0.040 0.079 0.031 0.059 0.056 0.045gwp 0.002 .. 0.007 .. 0.003 0.006 0.004lbo 0.003 .. 0.000 .. 0.010 0.000 0.003prc .. .. .. .. .. 0.069 0.069vab 0.019 .. .. .. 0.011 0.007 0.012wcy 0.005 0.036 0.051 0.052 0.071 0.088 0.051
Non-Governmental Organization Data Providersbti 0.120 .. 0.046 0.085 0.014 0.052 0.063ccr 0.141 .. .. .. 0.006 0.002 0.049egv .. .. 0.008 .. .. .. 0.008frh 0.190 .. .. .. 0.137 0.241 0.189gii 0.043 .. .. .. 0.014 0.004 0.020her .. .. .. 0.053 0.050 .. 0.051msi 0.044 .. .. .. .. .. 0.044obi 0.024 .. .. .. .. .. 0.024rsf 0.023 .. .. .. .. .. 0.023
Public Sector Data Providersadb .. .. 0.087 0.152 0.039 0.027 0.076aeo .. 0.043 .. .. .. .. 0.043asd .. .. 0.114 0.070 0.008 0.005 0.050ebr .. .. .. 0.084 .. .. 0.084
hum 0.043 0.072 .. .. 0.011 .. 0.042ifd 0.002 .. 0.037 0.048 0.021 0.022 0.026ipd 0.080 0.092 0.065 0.029 0.066 0.098 0.072pia .. .. 0.060 0.108 0.087 0.046 0.075tpr .. .. .. .. 0.004 .. 0.004
Commercial Business Information ProvidersShare of Sources 0.20 0.58 0.28 0.31 0.24 0.25 0.31Share of Weights 0.22 0.71 0.42 0.27 0.35 0.23 0.37
Surveys of Firms or HouseholdsShare of Sources 0.30 0.17 0.33 0.19 0.28 0.38 0.27Share of Weights 0.06 0.08 0.16 0.08 0.19 0.26 0.14
Non-Governmental Organization Data ProvidersShare of Sources 0.35 0.00 0.11 0.13 0.20 0.17 0.16Share of Weights 0.59 0.00 0.06 0.14 0.22 0.30 0.22
Public Sector Data ProvidersShare of Sources 0.15 0.25 0.28 0.38 0.28 0.21 0.26Share of Weights 0.13 0.21 0.37 0.50 0.24 0.20 0.28
32
Table 4: Summary Statistics on Governance Indicators
Voice and Accountability
Political Stability/Absence Violence
Government Effectiveness
Regulatory Quality Rule of Law
Control of Corruption Average
Number of Countries1996 194 180 182 183 171 154 1771998 199 189 194 194 194 194 1942000 200 190 196 196 196 196 1962002 201 190 202 197 197 197 1972003 201 200 202 197 202 198 2002004 208 207 209 204 209 205 2072005 208 208 209 204 209 205 2072006 209 209 212 206 211 207 2092007 209 209 212 207 211 208 2092008 209 210 212 208 210 208 210
Median Number of Sources Per Country1996 4 4 4 4 6 4 41998 5 5 5 5 7 5 52000 5 5 5 6 8 6 62002 7 7 8 8 10 7 82003 7 7 9 8 11 8 82004 8 7 9 8 11 9 92005 8 8 9 8 11 9 92006 10 8 11 9 13 11 102007 10 8 11 9 13 11 102008 12 9 10 9 13 11 11
Proportion of Countries with Only One Data Source1996 15 16 21 11 6 18 141998 11 7 10 10 9 10 102000 11 8 8 7 7 8 82002 10 7 5 7 7 8 72003 3 10 5 7 5 7 62004 6 6 8 7 9 8 72005 6 5 8 7 8 7 72006 6 3 9 8 8 8 72007 6 3 8 9 8 8 72008 6 4 8 9 7 8 7
Average Standard Error1996 0.25 0.38 0.34 0.41 0.30 0.33 0.341998 0.27 0.30 0.16 0.30 0.23 0.25 0.252000 0.26 0.31 0.21 0.28 0.19 0.24 0.252002 0.21 0.29 0.23 0.25 0.20 0.22 0.232003 0.20 0.29 0.22 0.21 0.20 0.21 0.222004 0.21 0.28 0.22 0.21 0.19 0.20 0.222005 0.20 0.28 0.21 0.21 0.20 0.19 0.212006 0.20 0.26 0.22 0.21 0.20 0.19 0.212007 0.17 0.25 0.24 0.22 0.20 0.19 0.212008 0.17 0.25 0.23 0.21 0.18 0.20 0.21
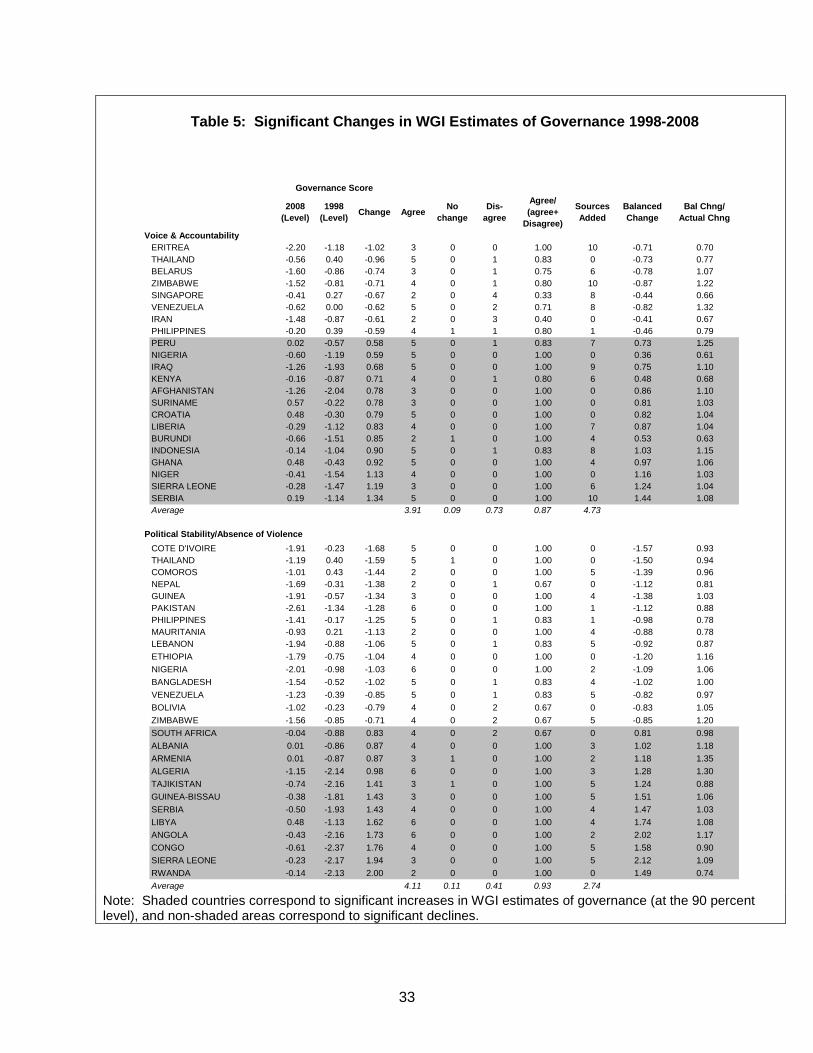
33
Table 5: Significant Changes in WGI Estimates of Governance 1998-2008
Governance Score
2008 (Level)
1998 (Level) Change Agree No
changeDis-
agree
Agree/ (agree+
Disagree)
Sources Added
Balanced Change
Bal Chng/ Actual Chng
Voice & AccountabilityERITREA -2.20 -1.18 -1.02 3 0 0 1.00 10 -0.71 0.70THAILAND -0.56 0.40 -0.96 5 0 1 0.83 0 -0.73 0.77BELARUS -1.60 -0.86 -0.74 3 0 1 0.75 6 -0.78 1.07ZIMBABWE -1.52 -0.81 -0.71 4 0 1 0.80 10 -0.87 1.22SINGAPORE -0.41 0.27 -0.67 2 0 4 0.33 8 -0.44 0.66VENEZUELA -0.62 0.00 -0.62 5 0 2 0.71 8 -0.82 1.32IRAN -1.48 -0.87 -0.61 2 0 3 0.40 0 -0.41 0.67PHILIPPINES -0.20 0.39 -0.59 4 1 1 0.80 1 -0.46 0.79PERU 0.02 -0.57 0.58 5 0 1 0.83 7 0.73 1.25NIGERIA -0.60 -1.19 0.59 5 0 0 1.00 0 0.36 0.61IRAQ -1.26 -1.93 0.68 5 0 0 1.00 9 0.75 1.10KENYA -0.16 -0.87 0.71 4 0 1 0.80 6 0.48 0.68AFGHANISTAN -1.26 -2.04 0.78 3 0 0 1.00 0 0.86 1.10SURINAME 0.57 -0.22 0.78 3 0 0 1.00 0 0.81 1.03CROATIA 0.48 -0.30 0.79 5 0 0 1.00 0 0.82 1.04LIBERIA -0.29 -1.12 0.83 4 0 0 1.00 7 0.87 1.04BURUNDI -0.66 -1.51 0.85 2 1 0 1.00 4 0.53 0.63INDONESIA -0.14 -1.04 0.90 5 0 1 0.83 8 1.03 1.15GHANA 0.48 -0.43 0.92 5 0 0 1.00 4 0.97 1.06NIGER -0.41 -1.54 1.13 4 0 0 1.00 0 1.16 1.03SIERRA LEONE -0.28 -1.47 1.19 3 0 0 1.00 6 1.24 1.04SERBIA 0.19 -1.14 1.34 5 0 0 1.00 10 1.44 1.08Average 3.91 0.09 0.73 0.87 4.73
Political Stability/Absence of ViolenceCOTE D'IVOIRE -1.91 -0.23 -1.68 5 0 0 1.00 0 -1.57 0.93THAILAND -1.19 0.40 -1.59 5 1 0 1.00 0 -1.50 0.94COMOROS -1.01 0.43 -1.44 2 0 0 1.00 5 -1.39 0.96NEPAL -1.69 -0.31 -1.38 2 0 1 0.67 0 -1.12 0.81GUINEA -1.91 -0.57 -1.34 3 0 0 1.00 4 -1.38 1.03PAKISTAN -2.61 -1.34 -1.28 6 0 0 1.00 1 -1.12 0.88PHILIPPINES -1.41 -0.17 -1.25 5 0 1 0.83 1 -0.98 0.78MAURITANIA -0.93 0.21 -1.13 2 0 0 1.00 4 -0.88 0.78LEBANON -1.94 -0.88 -1.06 5 0 1 0.83 5 -0.92 0.87ETHIOPIA -1.79 -0.75 -1.04 4 0 0 1.00 0 -1.20 1.16NIGERIA -2.01 -0.98 -1.03 6 0 0 1.00 2 -1.09 1.06BANGLADESH -1.54 -0.52 -1.02 5 0 1 0.83 4 -1.02 1.00VENEZUELA -1.23 -0.39 -0.85 5 0 1 0.83 5 -0.82 0.97BOLIVIA -1.02 -0.23 -0.79 4 0 2 0.67 0 -0.83 1.05ZIMBABWE -1.56 -0.85 -0.71 4 0 2 0.67 5 -0.85 1.20SOUTH AFRICA -0.04 -0.88 0.83 4 0 2 0.67 0 0.81 0.98ALBANIA 0.01 -0.86 0.87 4 0 0 1.00 3 1.02 1.18ARMENIA 0.01 -0.87 0.87 3 1 0 1.00 2 1.18 1.35ALGERIA -1.15 -2.14 0.98 6 0 0 1.00 3 1.28 1.30TAJIKISTAN -0.74 -2.16 1.41 3 1 0 1.00 5 1.24 0.88GUINEA-BISSAU -0.38 -1.81 1.43 3 0 0 1.00 5 1.51 1.06SERBIA -0.50 -1.93 1.43 4 0 0 1.00 4 1.47 1.03LIBYA 0.48 -1.13 1.62 6 0 0 1.00 4 1.74 1.08ANGOLA -0.43 -2.16 1.73 6 0 0 1.00 2 2.02 1.17CONGO -0.61 -2.37 1.76 4 0 0 1.00 5 1.58 0.90SIERRA LEONE -0.23 -2.17 1.94 3 0 0 1.00 5 2.12 1.09RWANDA -0.14 -2.13 2.00 2 0 0 1.00 0 1.49 0.74Average 4.11 0.11 0.41 0.93 2.74
Note: Shaded countries correspond to significant increases in WGI estimates of governance (at the 90 percent level), and non-shaded areas correspond to significant declines.
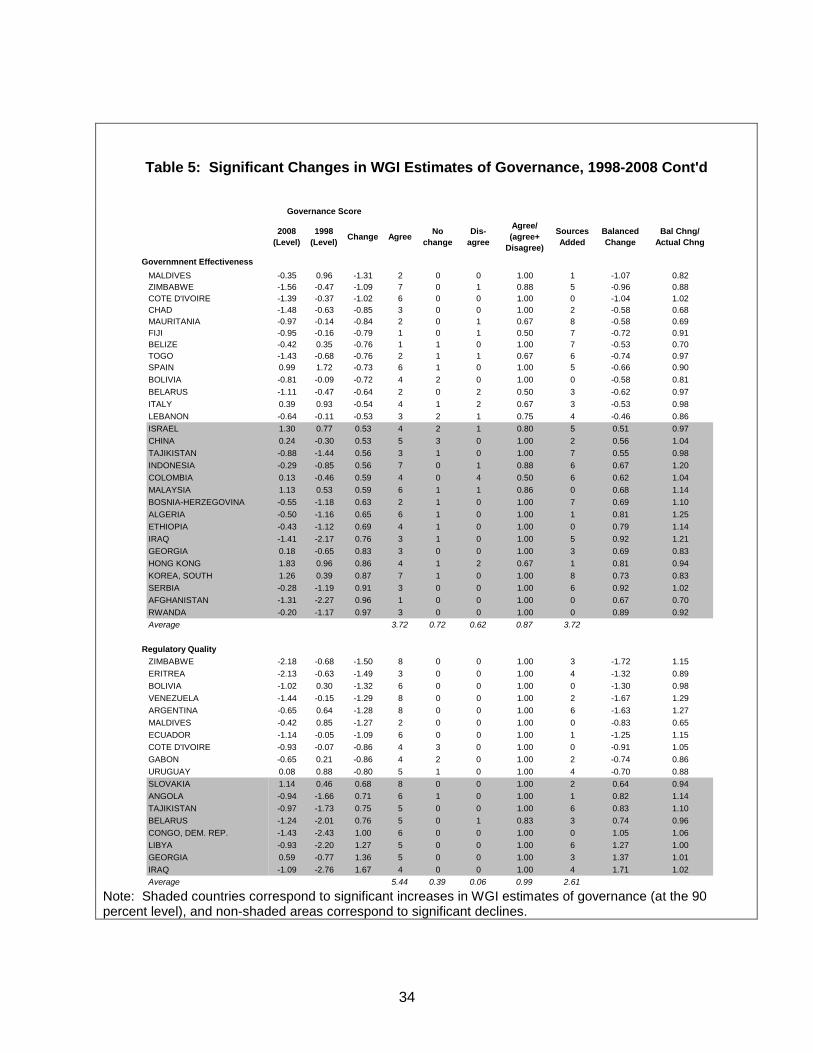
34
Table 5: Significant Changes in WGI Estimates of Governance, 1998-2008 Cont'd
Governance Score
2008 (Level)
1998 (Level) Change Agree No
changeDis-
agree
Agree/ (agree+
Disagree)
Sources Added
Balanced Change
Bal Chng/ Actual Chng
Governmnent EffectivenessMALDIVES -0.35 0.96 -1.31 2 0 0 1.00 1 -1.07 0.82ZIMBABWE -1.56 -0.47 -1.09 7 0 1 0.88 5 -0.96 0.88COTE D'IVOIRE -1.39 -0.37 -1.02 6 0 0 1.00 0 -1.04 1.02CHAD -1.48 -0.63 -0.85 3 0 0 1.00 2 -0.58 0.68MAURITANIA -0.97 -0.14 -0.84 2 0 1 0.67 8 -0.58 0.69FIJI -0.95 -0.16 -0.79 1 0 1 0.50 7 -0.72 0.91BELIZE -0.42 0.35 -0.76 1 1 0 1.00 7 -0.53 0.70TOGO -1.43 -0.68 -0.76 2 1 1 0.67 6 -0.74 0.97SPAIN 0.99 1.72 -0.73 6 1 0 1.00 5 -0.66 0.90BOLIVIA -0.81 -0.09 -0.72 4 2 0 1.00 0 -0.58 0.81BELARUS -1.11 -0.47 -0.64 2 0 2 0.50 3 -0.62 0.97ITALY 0.39 0.93 -0.54 4 1 2 0.67 3 -0.53 0.98LEBANON -0.64 -0.11 -0.53 3 2 1 0.75 4 -0.46 0.86ISRAEL 1.30 0.77 0.53 4 2 1 0.80 5 0.51 0.97CHINA 0.24 -0.30 0.53 5 3 0 1.00 2 0.56 1.04TAJIKISTAN -0.88 -1.44 0.56 3 1 0 1.00 7 0.55 0.98INDONESIA -0.29 -0.85 0.56 7 0 1 0.88 6 0.67 1.20COLOMBIA 0.13 -0.46 0.59 4 0 4 0.50 6 0.62 1.04MALAYSIA 1.13 0.53 0.59 6 1 1 0.86 0 0.68 1.14BOSNIA-HERZEGOVINA -0.55 -1.18 0.63 2 1 0 1.00 7 0.69 1.10ALGERIA -0.50 -1.16 0.65 6 1 0 1.00 1 0.81 1.25ETHIOPIA -0.43 -1.12 0.69 4 1 0 1.00 0 0.79 1.14IRAQ -1.41 -2.17 0.76 3 1 0 1.00 5 0.92 1.21GEORGIA 0.18 -0.65 0.83 3 0 0 1.00 3 0.69 0.83HONG KONG 1.83 0.96 0.86 4 1 2 0.67 1 0.81 0.94KOREA, SOUTH 1.26 0.39 0.87 7 1 0 1.00 8 0.73 0.83SERBIA -0.28 -1.19 0.91 3 0 0 1.00 6 0.92 1.02AFGHANISTAN -1.31 -2.27 0.96 1 0 0 1.00 0 0.67 0.70RWANDA -0.20 -1.17 0.97 3 0 0 1.00 0 0.89 0.92Average 3.72 0.72 0.62 0.87 3.72
Regulatory QualityZIMBABWE -2.18 -0.68 -1.50 8 0 0 1.00 3 -1.72 1.15ERITREA -2.13 -0.63 -1.49 3 0 0 1.00 4 -1.32 0.89BOLIVIA -1.02 0.30 -1.32 6 0 0 1.00 0 -1.30 0.98VENEZUELA -1.44 -0.15 -1.29 8 0 0 1.00 2 -1.67 1.29ARGENTINA -0.65 0.64 -1.28 8 0 0 1.00 6 -1.63 1.27MALDIVES -0.42 0.85 -1.27 2 0 0 1.00 0 -0.83 0.65ECUADOR -1.14 -0.05 -1.09 6 0 0 1.00 1 -1.25 1.15COTE D'IVOIRE -0.93 -0.07 -0.86 4 3 0 1.00 0 -0.91 1.05GABON -0.65 0.21 -0.86 4 2 0 1.00 2 -0.74 0.86URUGUAY 0.08 0.88 -0.80 5 1 0 1.00 4 -0.70 0.88SLOVAKIA 1.14 0.46 0.68 8 0 0 1.00 2 0.64 0.94ANGOLA -0.94 -1.66 0.71 6 1 0 1.00 1 0.82 1.14TAJIKISTAN -0.97 -1.73 0.75 5 0 0 1.00 6 0.83 1.10BELARUS -1.24 -2.01 0.76 5 0 1 0.83 3 0.74 0.96CONGO, DEM. REP. -1.43 -2.43 1.00 6 0 0 1.00 0 1.05 1.06LIBYA -0.93 -2.20 1.27 5 0 0 1.00 6 1.27 1.00GEORGIA 0.59 -0.77 1.36 5 0 0 1.00 3 1.37 1.01IRAQ -1.09 -2.76 1.67 4 0 0 1.00 4 1.71 1.02Average 5.44 0.39 0.06 0.99 2.61
Note: Shaded countries correspond to significant increases in WGI estimates of governance (at the 90 percent level), and non-shaded areas correspond to significant declines.
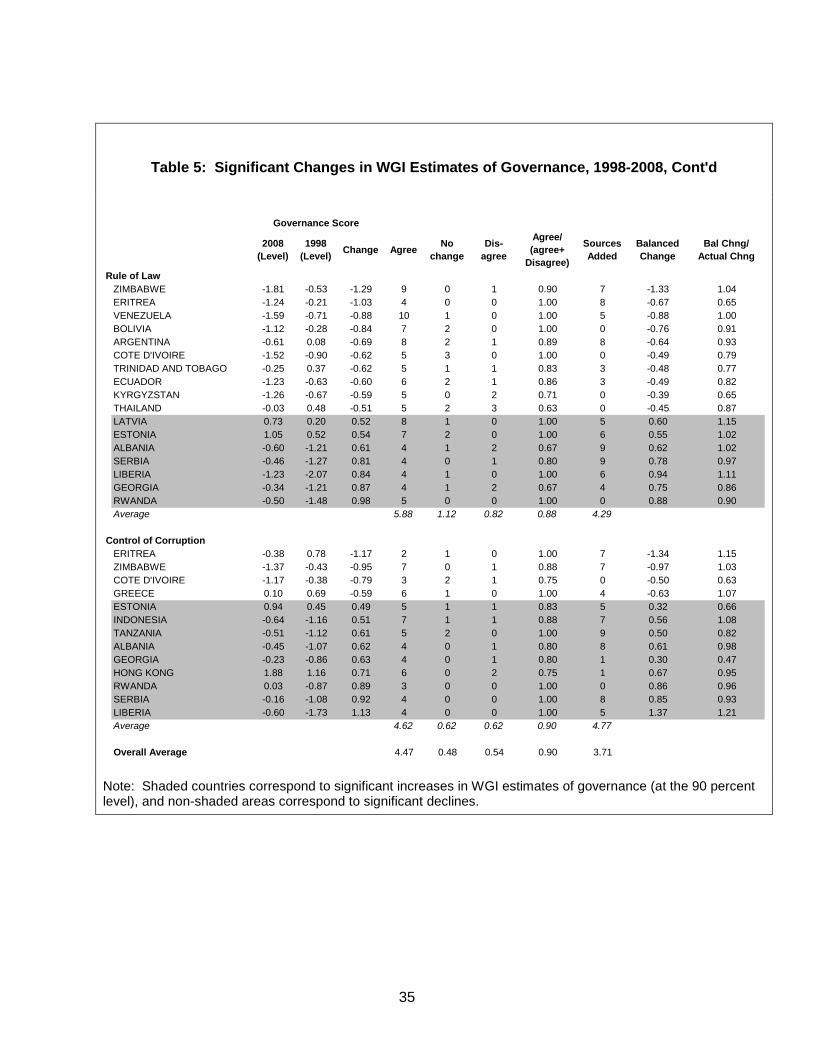
35
Table 5: Significant Changes in WGI Estimates of Governance, 1998-2008, Cont'd
Governance Score
2008 (Level)
1998 (Level) Change Agree No
changeDis-
agree
Agree/ (agree+
Disagree)
Sources Added
Balanced Change
Bal Chng/ Actual Chng
Rule of LawZIMBABWE -1.81 -0.53 -1.29 9 0 1 0.90 7 -1.33 1.04ERITREA -1.24 -0.21 -1.03 4 0 0 1.00 8 -0.67 0.65VENEZUELA -1.59 -0.71 -0.88 10 1 0 1.00 5 -0.88 1.00BOLIVIA -1.12 -0.28 -0.84 7 2 0 1.00 0 -0.76 0.91ARGENTINA -0.61 0.08 -0.69 8 2 1 0.89 8 -0.64 0.93COTE D'IVOIRE -1.52 -0.90 -0.62 5 3 0 1.00 0 -0.49 0.79TRINIDAD AND TOBAGO -0.25 0.37 -0.62 5 1 1 0.83 3 -0.48 0.77ECUADOR -1.23 -0.63 -0.60 6 2 1 0.86 3 -0.49 0.82KYRGYZSTAN -1.26 -0.67 -0.59 5 0 2 0.71 0 -0.39 0.65THAILAND -0.03 0.48 -0.51 5 2 3 0.63 0 -0.45 0.87LATVIA 0.73 0.20 0.52 8 1 0 1.00 5 0.60 1.15ESTONIA 1.05 0.52 0.54 7 2 0 1.00 6 0.55 1.02ALBANIA -0.60 -1.21 0.61 4 1 2 0.67 9 0.62 1.02SERBIA -0.46 -1.27 0.81 4 0 1 0.80 9 0.78 0.97LIBERIA -1.23 -2.07 0.84 4 1 0 1.00 6 0.94 1.11GEORGIA -0.34 -1.21 0.87 4 1 2 0.67 4 0.75 0.86RWANDA -0.50 -1.48 0.98 5 0 0 1.00 0 0.88 0.90Average 5.88 1.12 0.82 0.88 4.29
Control of CorruptionERITREA -0.38 0.78 -1.17 2 1 0 1.00 7 -1.34 1.15ZIMBABWE -1.37 -0.43 -0.95 7 0 1 0.88 7 -0.97 1.03COTE D'IVOIRE -1.17 -0.38 -0.79 3 2 1 0.75 0 -0.50 0.63GREECE 0.10 0.69 -0.59 6 1 0 1.00 4 -0.63 1.07ESTONIA 0.94 0.45 0.49 5 1 1 0.83 5 0.32 0.66INDONESIA -0.64 -1.16 0.51 7 1 1 0.88 7 0.56 1.08TANZANIA -0.51 -1.12 0.61 5 2 0 1.00 9 0.50 0.82ALBANIA -0.45 -1.07 0.62 4 0 1 0.80 8 0.61 0.98GEORGIA -0.23 -0.86 0.63 4 0 1 0.80 1 0.30 0.47HONG KONG 1.88 1.16 0.71 6 0 2 0.75 1 0.67 0.95RWANDA 0.03 -0.87 0.89 3 0 0 1.00 0 0.86 0.96SERBIA -0.16 -1.08 0.92 4 0 0 1.00 8 0.85 0.93LIBERIA -0.60 -1.73 1.13 4 0 0 1.00 5 1.37 1.21Average 4.62 0.62 0.62 0.90 4.77
Overall Average 4.47 0.48 0.54 0.90 3.71 Note: Shaded countries correspond to significant increases in WGI estimates of governance (at the 90 percent level), and non-shaded areas correspond to significant declines.
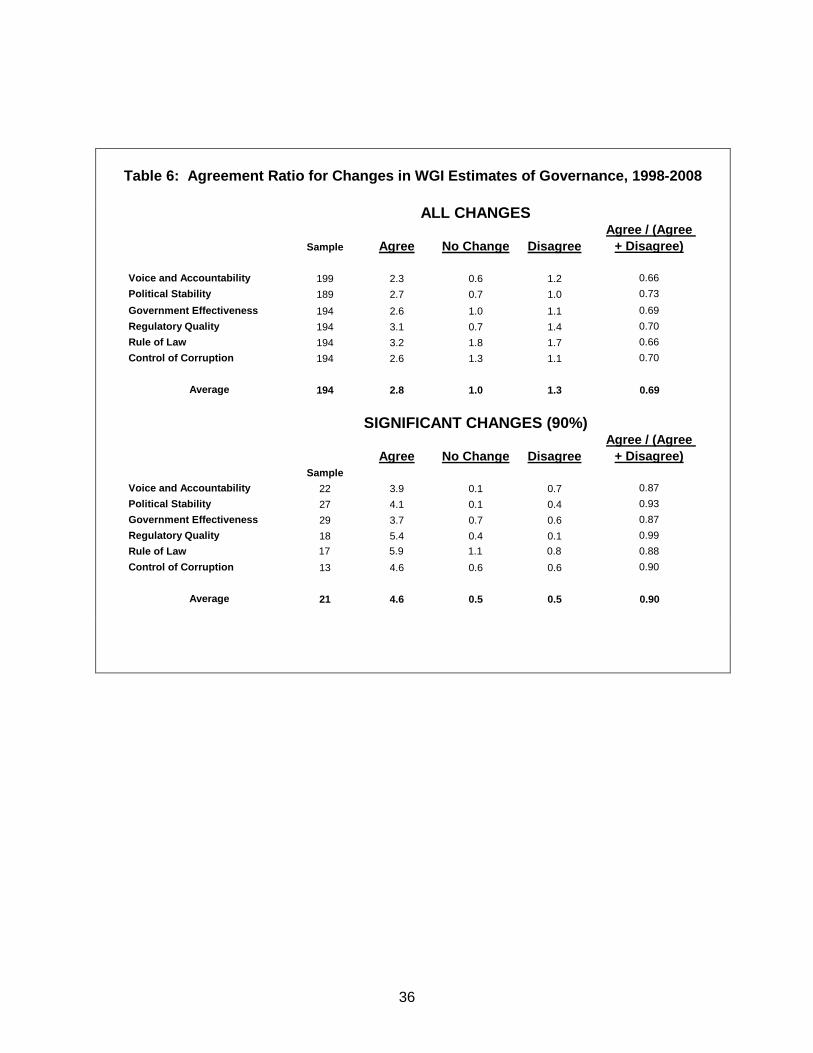
36
Table 6: Agreement Ratio for Changes in WGI Estimates of Governance, 1998-2008
ALL CHANGES
Sample Agree No Change DisagreeAgree / (Agree
+ Disagree)
Voice and Accountability 199 2.3 0.6 1.2 0.66Political Stability 189 2.7 0.7 1.0 0.73Government Effectiveness 194 2.6 1.0 1.1 0.69Regulatory Quality 194 3.1 0.7 1.4 0.70Rule of Law 194 3.2 1.8 1.7 0.66Control of Corruption 194 2.6 1.3 1.1 0.70
Average 194 2.8 1.0 1.3 0.69
SIGNIFICANT CHANGES (90%)
Agree No Change DisagreeAgree / (Agree
+ Disagree)Sample
Voice and Accountability 22 3.9 0.1 0.7 0.87Political Stability 27 4.1 0.1 0.4 0.93Government Effectiveness 29 3.7 0.7 0.6 0.87Regulatory Quality 18 5.4 0.4 0.1 0.99Rule of Law 17 5.9 1.1 0.8 0.88Control of Corruption 13 4.6 0.6 0.6 0.90
Average 21 4.6 0.5 0.5 0.90
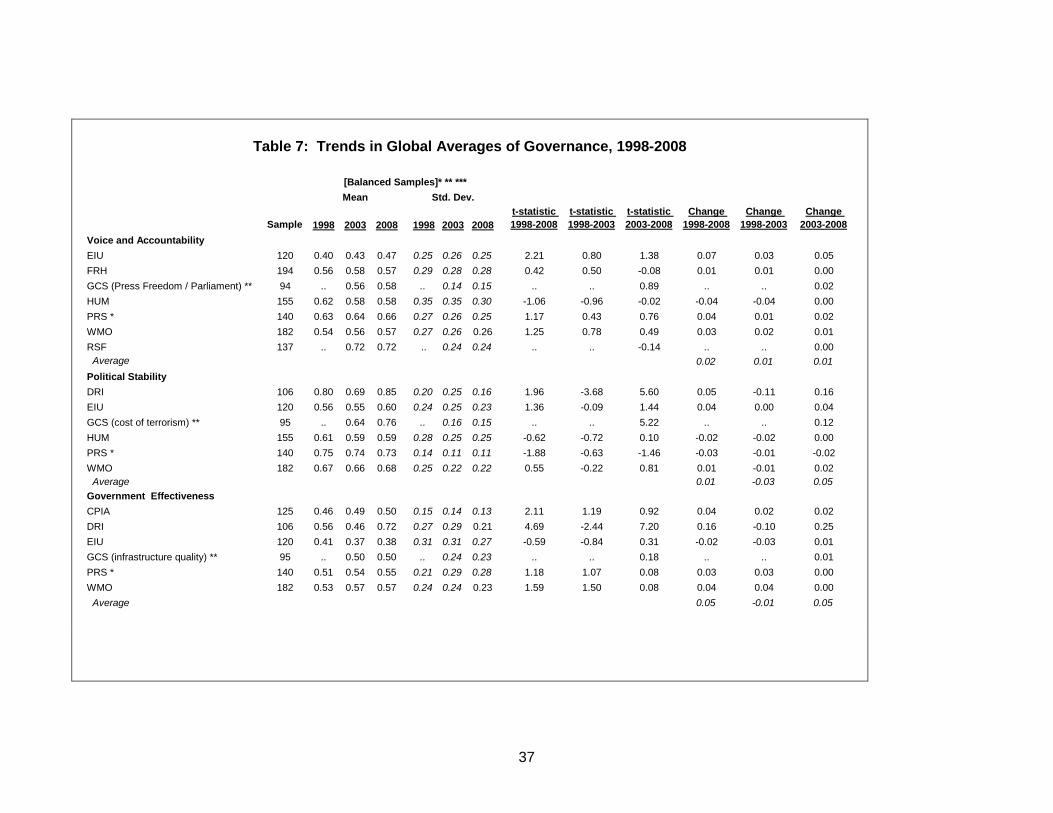
37
Table 7: Trends in Global Averages of Governance, 1998-2008
[Balanced Samples]* ** ***Mean Std. Dev.
Sample 1998 2003 2008 1998 2003 2008t-statistic 1998-2008
t-statistic 1998-2003
t-statistic 2003-2008
Change 1998-2008
Change 1998-2003
Change 2003-2008
Voice and AccountabilityEIU 120 0.40 0.43 0.47 0.25 0.26 0.25 2.21 0.80 1.38 0.07 0.03 0.05FRH 194 0.56 0.58 0.57 0.29 0.28 0.28 0.42 0.50 -0.08 0.01 0.01 0.00GCS (Press Freedom / Parliament) ** 94 .. 0.56 0.58 .. 0.14 0.15 .. .. 0.89 .. .. 0.02HUM 155 0.62 0.58 0.58 0.35 0.35 0.30 -1.06 -0.96 -0.02 -0.04 -0.04 0.00PRS * 140 0.63 0.64 0.66 0.27 0.26 0.25 1.17 0.43 0.76 0.04 0.01 0.02WMO 182 0.54 0.56 0.57 0.27 0.26 0.26 1.25 0.78 0.49 0.03 0.02 0.01RSF 137 .. 0.72 0.72 .. 0.24 0.24 .. .. -0.14 .. .. 0.00 Average 0.02 0.01 0.01Political StabilityDRI 106 0.80 0.69 0.85 0.20 0.25 0.16 1.96 -3.68 5.60 0.05 -0.11 0.16EIU 120 0.56 0.55 0.60 0.24 0.25 0.23 1.36 -0.09 1.44 0.04 0.00 0.04GCS (cost of terrorism) ** 95 .. 0.64 0.76 .. 0.16 0.15 .. .. 5.22 .. .. 0.12HUM 155 0.61 0.59 0.59 0.28 0.25 0.25 -0.62 -0.72 0.10 -0.02 -0.02 0.00PRS * 140 0.75 0.74 0.73 0.14 0.11 0.11 -1.88 -0.63 -1.46 -0.03 -0.01 -0.02WMO 182 0.67 0.66 0.68 0.25 0.22 0.22 0.55 -0.22 0.81 0.01 -0.01 0.02 Average 0.01 -0.03 0.05Government EffectivenessCPIA 125 0.46 0.49 0.50 0.15 0.14 0.13 2.11 1.19 0.92 0.04 0.02 0.02DRI 106 0.56 0.46 0.72 0.27 0.29 0.21 4.69 -2.44 7.20 0.16 -0.10 0.25EIU 120 0.41 0.37 0.38 0.31 0.31 0.27 -0.59 -0.84 0.31 -0.02 -0.03 0.01GCS (infrastructure quality) ** 95 .. 0.50 0.50 .. 0.24 0.23 .. .. 0.18 .. .. 0.01PRS * 140 0.51 0.54 0.55 0.21 0.29 0.28 1.18 1.07 0.08 0.03 0.03 0.00WMO 182 0.53 0.57 0.57 0.24 0.24 0.23 1.59 1.50 0.08 0.04 0.04 0.00 Average 0.05 -0.01 0.05
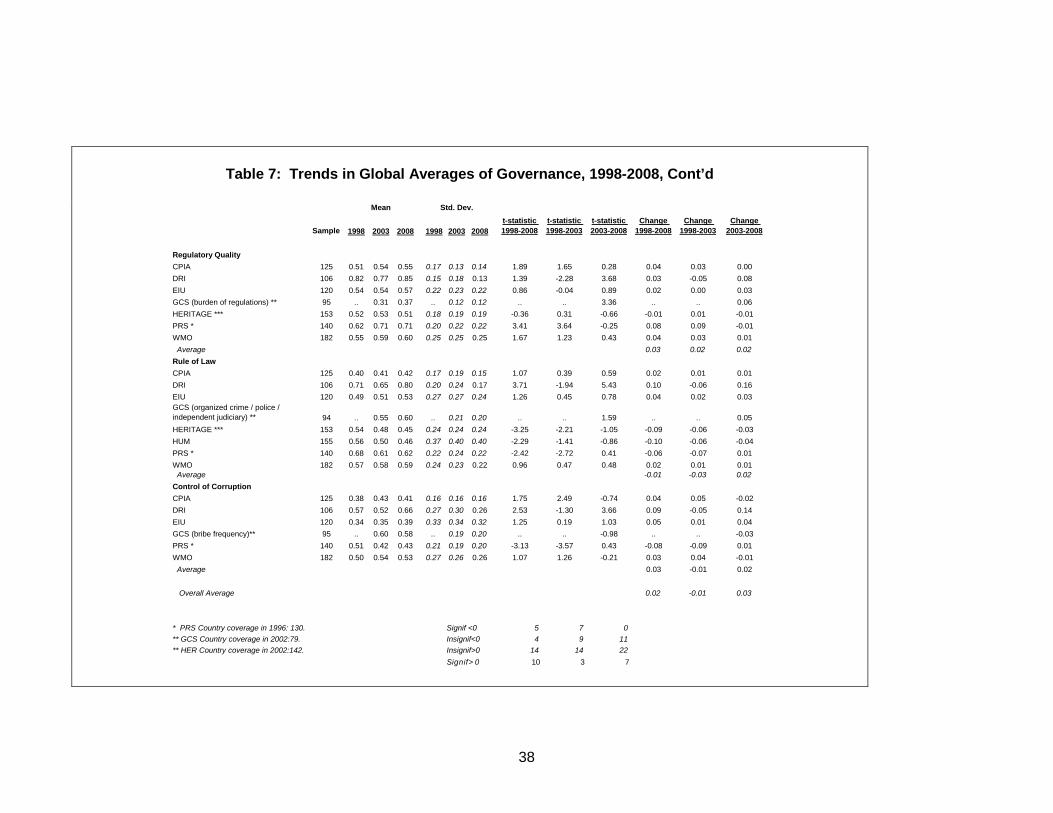
38
Table 7: Trends in Global Averages of Governance, 1998-2008, Cont’d
Mean Std. Dev.
Sample 1998 2003 2008 1998 2003 2008t-statistic 1998-2008
t-statistic 1998-2003
t-statistic 2003-2008
Change 1998-2008
Change 1998-2003
Change 2003-2008
Regulatory QualityCPIA 125 0.51 0.54 0.55 0.17 0.13 0.14 1.89 1.65 0.28 0.04 0.03 0.00DRI 106 0.82 0.77 0.85 0.15 0.18 0.13 1.39 -2.28 3.68 0.03 -0.05 0.08EIU 120 0.54 0.54 0.57 0.22 0.23 0.22 0.86 -0.04 0.89 0.02 0.00 0.03GCS (burden of regulations) ** 95 .. 0.31 0.37 .. 0.12 0.12 .. .. 3.36 .. .. 0.06HERITAGE *** 153 0.52 0.53 0.51 0.18 0.19 0.19 -0.36 0.31 -0.66 -0.01 0.01 -0.01PRS * 140 0.62 0.71 0.71 0.20 0.22 0.22 3.41 3.64 -0.25 0.08 0.09 -0.01WMO 182 0.55 0.59 0.60 0.25 0.25 0.25 1.67 1.23 0.43 0.04 0.03 0.01 Average 0.03 0.02 0.02Rule of LawCPIA 125 0.40 0.41 0.42 0.17 0.19 0.15 1.07 0.39 0.59 0.02 0.01 0.01DRI 106 0.71 0.65 0.80 0.20 0.24 0.17 3.71 -1.94 5.43 0.10 -0.06 0.16EIU 120 0.49 0.51 0.53 0.27 0.27 0.24 1.26 0.45 0.78 0.04 0.02 0.03GCS (organized crime / police / independent judiciary) ** 94 .. 0.55 0.60 .. 0.21 0.20 .. .. 1.59 .. .. 0.05HERITAGE *** 153 0.54 0.48 0.45 0.24 0.24 0.24 -3.25 -2.21 -1.05 -0.09 -0.06 -0.03HUM 155 0.56 0.50 0.46 0.37 0.40 0.40 -2.29 -1.41 -0.86 -0.10 -0.06 -0.04PRS * 140 0.68 0.61 0.62 0.22 0.24 0.22 -2.42 -2.72 0.41 -0.06 -0.07 0.01WMO 182 0.57 0.58 0.59 0.24 0.23 0.22 0.96 0.47 0.48 0.02 0.01 0.01 Average -0.01 -0.03 0.02Control of CorruptionCPIA 125 0.38 0.43 0.41 0.16 0.16 0.16 1.75 2.49 -0.74 0.04 0.05 -0.02DRI 106 0.57 0.52 0.66 0.27 0.30 0.26 2.53 -1.30 3.66 0.09 -0.05 0.14EIU 120 0.34 0.35 0.39 0.33 0.34 0.32 1.25 0.19 1.03 0.05 0.01 0.04GCS (bribe frequency)** 95 .. 0.60 0.58 .. 0.19 0.20 .. .. -0.98 .. .. -0.03PRS * 140 0.51 0.42 0.43 0.21 0.19 0.20 -3.13 -3.57 0.43 -0.08 -0.09 0.01WMO 182 0.50 0.54 0.53 0.27 0.26 0.26 1.07 1.26 -0.21 0.03 0.04 -0.01 Average 0.03 -0.01 0.02
Overall Average 0.02 -0.01 0.03
* PRS Country coverage in 1996: 130. Signif <0 5 7 0** GCS Country coverage in 2002:79. Insignif<0 4 9 11** HER Country coverage in 2002:142. Insignif>0 14 14 22
Signif>0 10 3 7
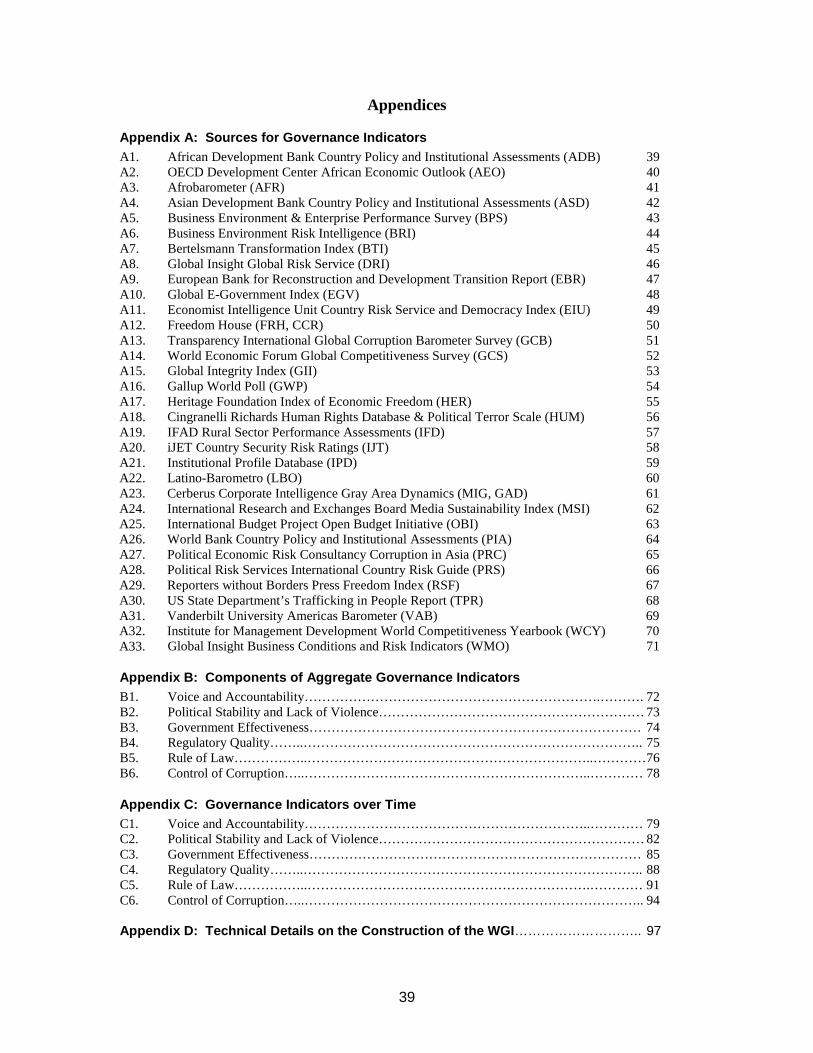
39
Appendices
Appendix A: Sources for Governance Indicators A1. African Development Bank Country Policy and Institutional Assessments (ADB) 39 A2. OECD Development Center African Economic Outlook (AEO) 40 A3. Afrobarometer (AFR) 41 A4. Asian Development Bank Country Policy and Institutional Assessments (ASD) 42 A5. Business Environment & Enterprise Performance Survey (BPS) 43 A6. Business Environment Risk Intelligence (BRI) 44 A7. Bertelsmann Transformation Index (BTI) 45 A8. Global Insight Global Risk Service (DRI) 46 A9. European Bank for Reconstruction and Development Transition Report (EBR) 47 A10. Global E-Government Index (EGV) 48 A11. Economist Intelligence Unit Country Risk Service and Democracy Index (EIU) 49 A12. Freedom House (FRH, CCR) 50 A13. Transparency International Global Corruption Barometer Survey (GCB) 51 A14. World Economic Forum Global Competitiveness Survey (GCS) 52 A15. Global Integrity Index (GII) 53 A16. Gallup World Poll (GWP) 54 A17. Heritage Foundation Index of Economic Freedom (HER) 55 A18. Cingranelli Richards Human Rights Database & Political Terror Scale (HUM) 56 A19. IFAD Rural Sector Performance Assessments (IFD) 57 A20. iJET Country Security Risk Ratings (IJT) 58 A21. Institutional Profile Database (IPD) 59 A22. Latino-Barometro (LBO) 60 A23. Cerberus Corporate Intelligence Gray Area Dynamics (MIG, GAD) 61 A24. International Research and Exchanges Board Media Sustainability Index (MSI) 62 A25. International Budget Project Open Budget Initiative (OBI) 63 A26. World Bank Country Policy and Institutional Assessments (PIA) 64 A27. Political Economic Risk Consultancy Corruption in Asia (PRC) 65 A28. Political Risk Services International Country Risk Guide (PRS) 66 A29. Reporters without Borders Press Freedom Index (RSF) 67 A30. US State Department’s Trafficking in People Report (TPR) 68 A31. Vanderbilt University Americas Barometer (VAB) 69 A32. Institute for Management Development World Competitiveness Yearbook (WCY) 70 A33. Global Insight Business Conditions and Risk Indicators (WMO) 71
Appendix B: Components of Aggregate Governance Indicators B1. Voice and Accountability………………………………………………………….………. 72 B2. Political Stability and Lack of Violence…………………………………………………… 73 B3. Government Effectiveness………………………………………………………………… 74 B4. Regulatory Quality……..………………………………………………………………….. 75 B5. Rule of Law……………..………………………………………………………..………… 76 B6. Control of Corruption…..………………………………………………………..………… 78
Appendix C: Governance Indicators over Time C1. Voice and Accountability………………………………………………………..………… 79 C2. Political Stability and Lack of Violence…………………………………………………… 82 C3. Government Effectiveness………………………………………………………………… 85 C4. Regulatory Quality……..………………………………………………………………….. 88 C5. Rule of Law……………..……………………………………………………….………… 91 C6. Control of Corruption…..………………………………………………………………….. 94 Appendix D: Technical Details on the Construction of the WGI……………………….. 97
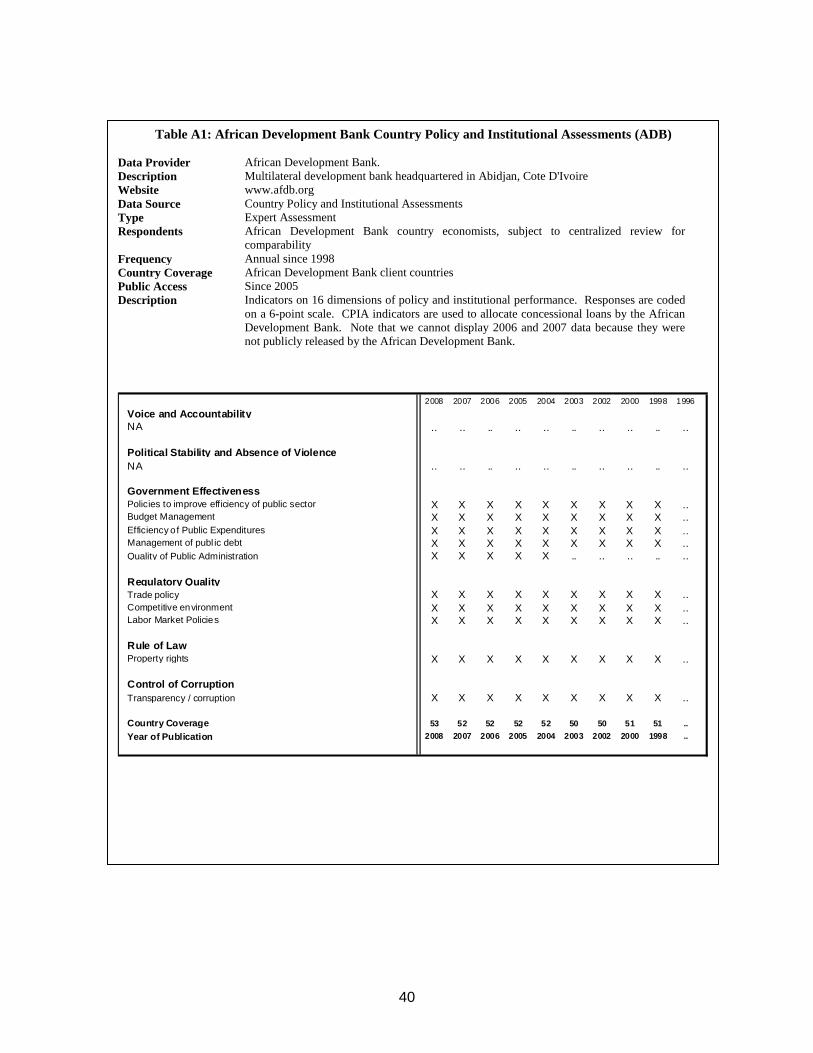
40
Table A1: African Development Bank Country Policy and Institutional Assessments (ADB)
Data Provider African Development Bank. Description Multilateral development bank headquartered in Abidjan, Cote D'Ivoire Website www.afdb.org Data Source Country Policy and Institutional Assessments Type Expert Assessment Respondents African Development Bank country economists, subject to centralized review for
comparability Frequency Annual since 1998 Country Coverage African Development Bank client countries Public Access Since 2005 Description Indicators on 16 dimensions of policy and institutional performance. Responses are coded
on a 6-point scale. CPIA indicators are used to allocate concessional loans by the African Development Bank. Note that we cannot display 2006 and 2007 data because they were not publicly released by the African Development Bank.
2008 2007 2006 2005 2004 2003 2002 2000 1998 1996Voice and AccountabilityNA .. .. .. .. .. .. .. .. .. ..
Political Stability and Absence of ViolenceNA .. .. .. .. .. .. .. .. .. ..
Government EffectivenessPolicies to improve efficiency of public sector X X X X X X X X X ..Budget Management X X X X X X X X X ..Efficiency of Public Expenditures X X X X X X X X X ..Management of publ ic debt X X X X X X X X X ..Quality of Public Administration X X X X X .. .. .. .. ..
Regulatory QualityTrade policy X X X X X X X X X ..Competitive environment X X X X X X X X X ..Labor Market Policies X X X X X X X X X ..
Rule of LawProperty rights X X X X X X X X X ..
Control of CorruptionTransparency / corruption X X X X X X X X X ..
Country Coverage 53 52 52 52 52 50 50 51 51 ..Year of Publication 2008 2007 2006 2005 2004 2003 2002 2000 1998 ..
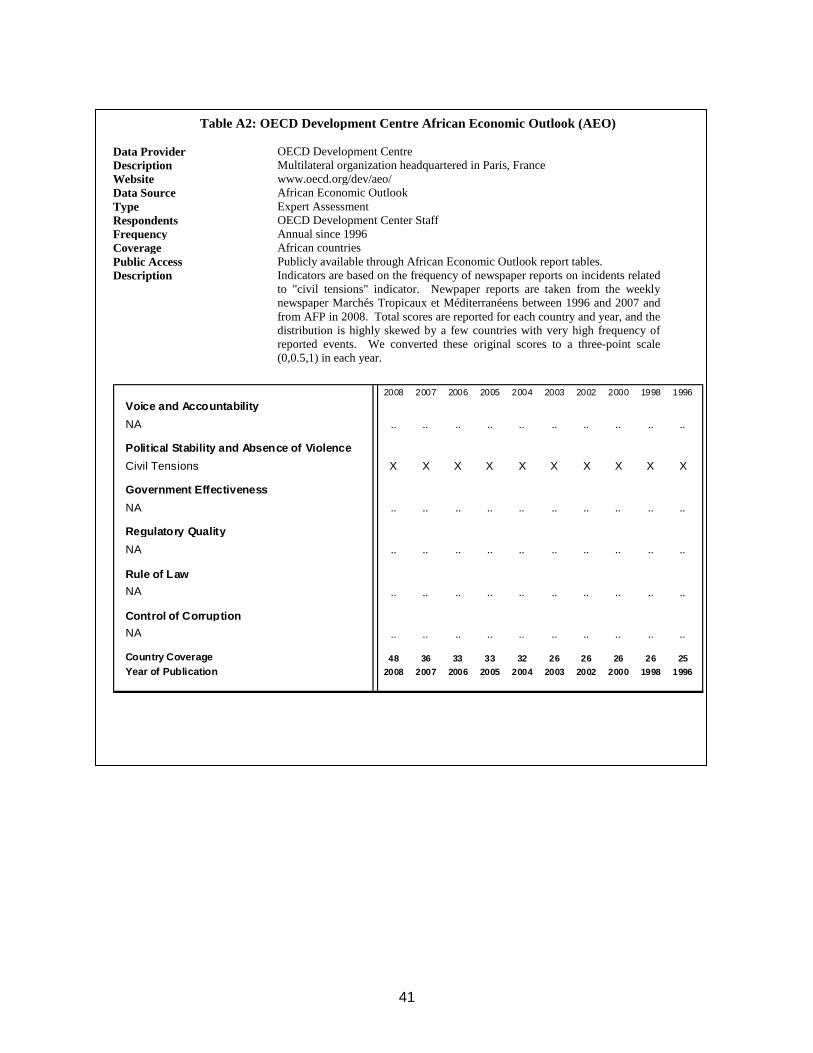
41
Table A2: OECD Development Centre African Economic Outlook (AEO)
Data Provider OECD Development Centre Description Multilateral organization headquartered in Paris, France Website www.oecd.org/dev/aeo/ Data Source African Economic Outlook Type Expert Assessment Respondents OECD Development Center Staff Frequency Annual since 1996 Coverage African countries Public Access Publicly available through African Economic Outlook report tables. Description Indicators are based on the frequency of newspaper reports on incidents related
to "civil tensions" indicator. Newpaper reports are taken from the weekly newspaper Marchés Tropicaux et Méditerranéens between 1996 and 2007 and from AFP in 2008. Total scores are reported for each country and year, and the distribution is highly skewed by a few countries with very high frequency of reported events. We converted these original scores to a three-point scale (0,0.5,1) in each year.
2008 2007 2006 2005 2004 2003 2002 2000 1998 1996Voice and AccountabilityNA .. .. .. .. .. .. .. .. .. ..
Political Stability and Absence of ViolenceCivil Tensions X X X X X X X X X X
Government EffectivenessNA .. .. .. .. .. .. .. .. .. ..
Regulatory QualityNA .. .. .. .. .. .. .. .. .. ..
Rule of LawNA .. .. .. .. .. .. .. .. .. ..
Control of CorruptionNA .. .. .. .. .. .. .. .. .. ..
Country Coverage 48 36 33 33 32 26 26 26 26 25Year of Publication 2008 2007 2006 2005 2004 2003 2002 2000 1998 1996
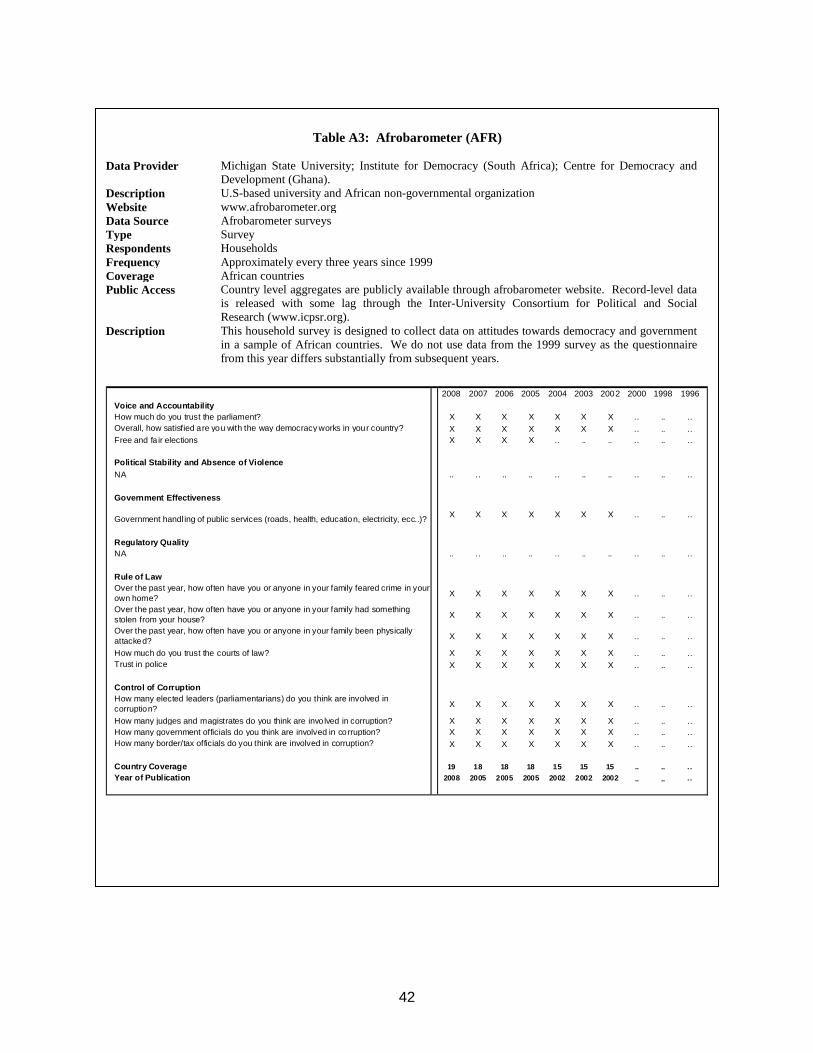
42
Table A3: Afrobarometer (AFR)
Data Provider Michigan State University; Institute for Democracy (South Africa); Centre for Democracy and
Development (Ghana). Description U.S-based university and African non-governmental organization Website www.afrobarometer.org Data Source Afrobarometer surveys Type Survey Respondents Households Frequency Approximately every three years since 1999 Coverage African countries Public Access Country level aggregates are publicly available through afrobarometer website. Record-level data
is released with some lag through the Inter-University Consortium for Political and Social Research (www.icpsr.org).
Description This household survey is designed to collect data on attitudes towards democracy and government in a sample of African countries. We do not use data from the 1999 survey as the questionnaire from this year differs substantially from subsequent years.
2008 2007 2006 2005 2004 2003 2002 2000 1998 1996
Voice and AccountabilityHow much do you trust the parliament? X X X X X X X .. .. ..Overall, how satisfied are you with the way democracy works in your country? X X X X X X X .. .. ..Free and fa ir elections X X X X .. .. .. .. .. ..
Political Stability and Absence of ViolenceNA .. .. .. .. .. .. .. .. .. ..
Government Effectiveness
Government handl ing of public services (roads, health, education, electricity, ecc..)? X X X X X X X .. .. ..
Regulatory QualityNA .. .. .. .. .. .. .. .. .. ..
Rule of LawOver the past year, how often have you or anyone in your family feared crime in your own home? X X X X X X X .. .. ..
Over the past year, how often have you or anyone in your family had something stolen from your house? X X X X X X X .. .. ..
Over the past year, how often have you or anyone in your family been physically attacked? X X X X X X X .. .. ..
How much do you trust the courts of law? X X X X X X X .. .. ..Trust in police X X X X X X X .. .. ..
Control of CorruptionHow many elected leaders (parliamentarians) do you think are involved in corruption? X X X X X X X .. .. ..
How many judges and magistrates do you think are invo lved in corruption? X X X X X X X .. .. ..How many government officials do you think are involved in corruption? X X X X X X X .. .. ..How many border/tax officials do you think are involved in corruption? X X X X X X X .. .. ..
Country Coverage 19 18 18 18 15 15 15 .. .. . .Year of Publication 2008 2005 2005 2005 2002 2002 2002 .. .. . .
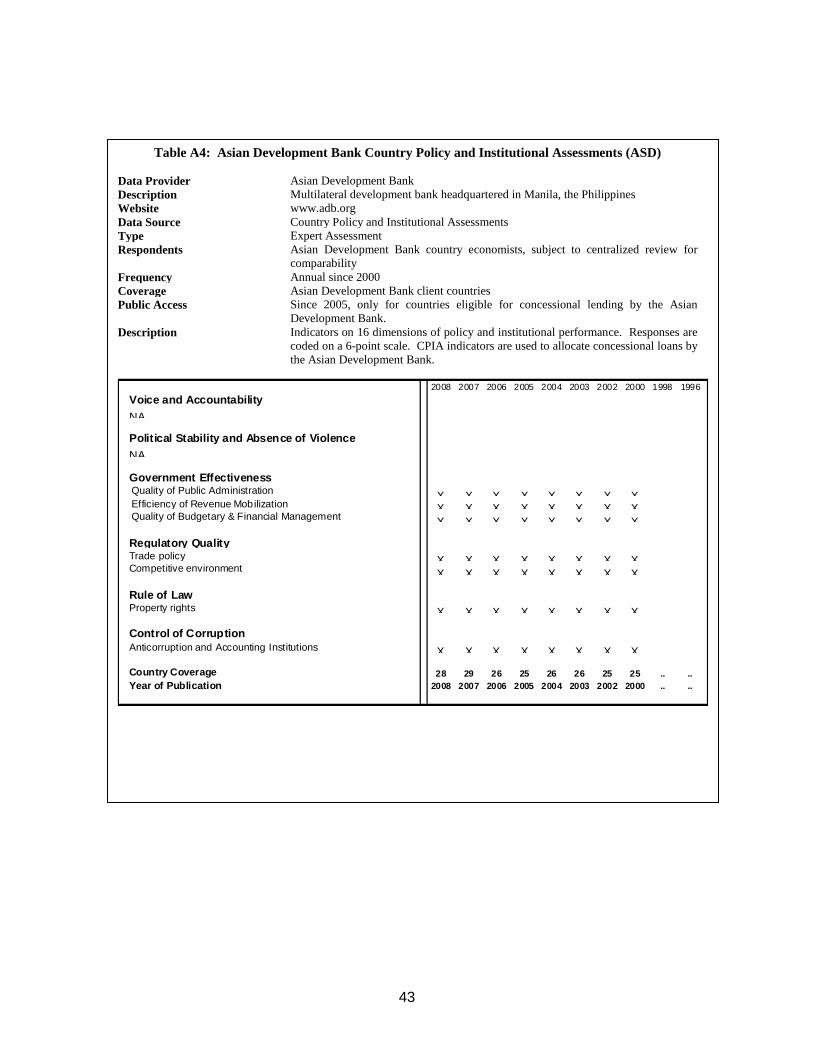
43
Table A4: Asian Development Bank Country Policy and Institutional Assessments (ASD)
Data Provider Asian Development Bank Description Multilateral development bank headquartered in Manila, the Philippines Website www.adb.org Data Source Country Policy and Institutional Assessments Type Expert Assessment Respondents Asian Development Bank country economists, subject to centralized review for
comparability Frequency Annual since 2000 Coverage Asian Development Bank client countries Public Access Since 2005, only for countries eligible for concessional lending by the Asian
Development Bank. Description Indicators on 16 dimensions of policy and institutional performance. Responses are
coded on a 6-point scale. CPIA indicators are used to allocate concessional loans by the Asian Development Bank.
2008 2007 2006 2005 2004 2003 2002 2000 1998 1996Voice and AccountabilityNA .. .. .. .. .. .. .. .. .. ..
Political Stability and Absence of ViolenceNA .. .. .. .. .. .. .. .. .. ..
Government Effectiveness Quality of Public Administration X X X X X X X X .. .. Efficiency of Revenue Mobilization X X X X X X X X .. .. Quality of Budgetary & Financial Management X X X X X X X X .. ..
Regulatory QualityTrade policy X X X X X X X X .. ..Competitive environment X X X X X X X X .. ..
Rule of LawProperty rights X X X X X X X X .. ..
Control of CorruptionAnticorruption and Accounting Institutions X X X X X X X X .. ..
Country Coverage 28 29 26 25 26 26 25 25 .. ..Year of Publication 2008 2007 2006 2005 2004 2003 2002 2000 .. ..
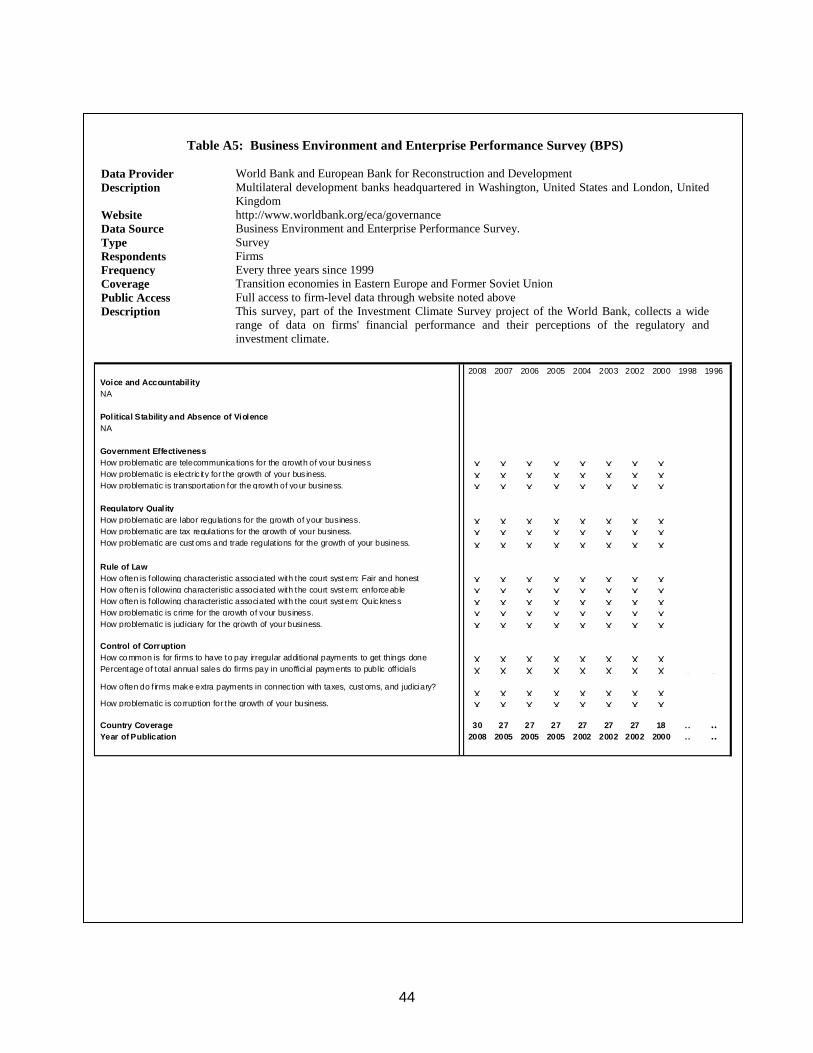
44
Table A5: Business Environment and Enterprise Performance Survey (BPS)
Data Provider World Bank and European Bank for Reconstruction and Development Description Multilateral development banks headquartered in Washington, United States and London, United
Kingdom Website http://www.worldbank.org/eca/governance Data Source Business Environment and Enterprise Performance Survey. Type Survey Respondents Firms Frequency Every three years since 1999 Coverage Transition economies in Eastern Europe and Former Soviet Union Public Access Full access to firm-level data through website noted above Description This survey, part of the Investment Climate Survey project of the World Bank, collects a wide
range of data on firms' financial performance and their perceptions of the regulatory and investment climate.
2008 2007 2006 2005 2004 2003 2002 2000 1998 1996Voice and Accountabil ityNA .. .. .. .. .. .. .. .. .. ..
Political Stability and Absence of ViolenceNA .. .. .. .. .. .. .. .. .. ..
Government EffectivenessHow problematic are telecommunica tions for the growth of your business X X X X X X X X .. ..How problematic is electric ity for the growth of your bus iness. X X X X X X X X .. ..How problematic is transportation for the growth of your business. X X X X X X X X .. .. Regulatory QualityHow problematic are labor regulations for the growth of your business. X X X X X X X X .. ..How problematic are tax regulations for the growth of your business. X X X X X X X X .. ..How problematic are cust oms and trade regulat ions for the growth of your business. X X X X X X X X .. ..
Rule of LawHow often is following characteristic associated with the court syst em: Fair and honest X X X X X X X X .. ..How often is following characteristic associated with the court syst em: enforceable X X X X X X X X .. ..How often is following characteristic associated with the court syst em: Quickness X X X X X X X X .. ..How problematic is crime for the growth of your business. X X X X X X X X .. ..How problematic is judiciary for the growth of your business. X X X X X X X X .. ..
Control of CorruptionHow common is for firms to have to pay irregular additional payments to get things done X X X X X X X X .. ..Percentage of total annual sales do firms pay in unofficial payments to public off icials X X X X X X X X .. ..How often do f irms make extra payments in connec tion with taxes, cust oms, and judiciary?
X X X X X X X X .. ..How problematic is co rruption for the growth of your business. X X X X X X X X .. ..
Country Coverage 30 27 27 27 27 27 27 18 .. ..Year of Publication 2008 2005 2005 2005 2002 2002 2002 2000 .. ..
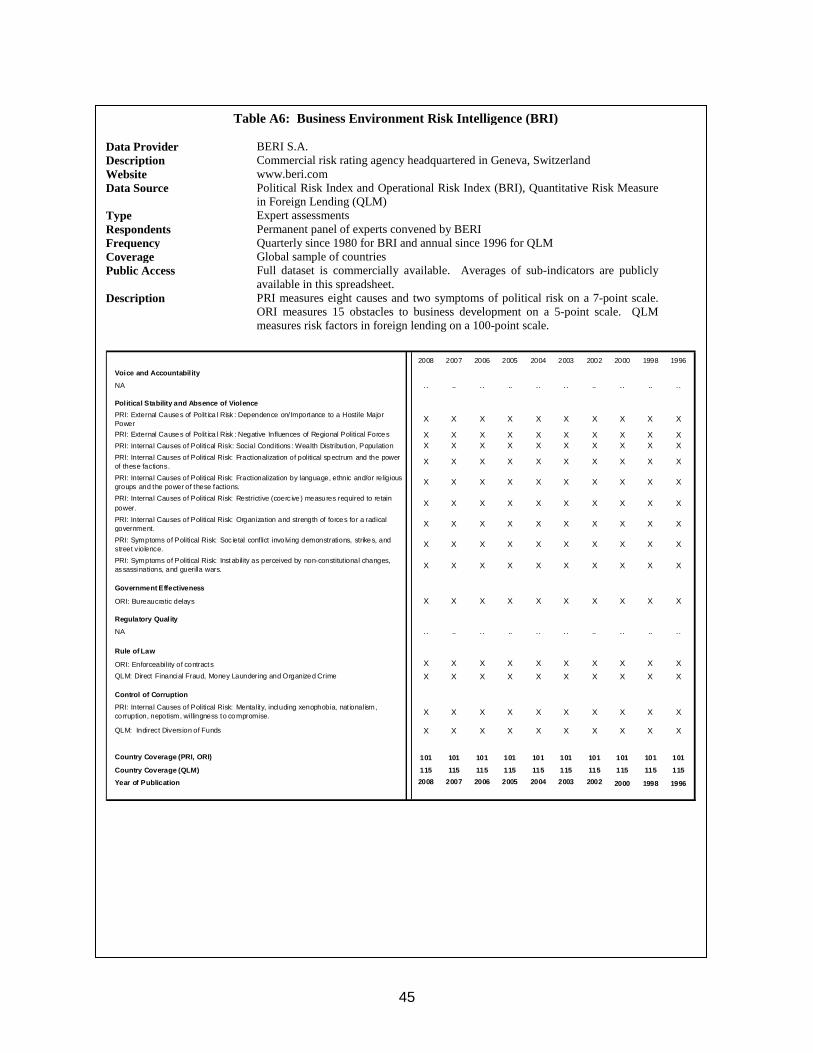
45
Table A6: Business Environment Risk Intelligence (BRI)
Data Provider BERI S.A. Description Commercial risk rating agency headquartered in Geneva, Switzerland Website www.beri.com Data Source Political Risk Index and Operational Risk Index (BRI), Quantitative Risk Measure
in Foreign Lending (QLM) Type Expert assessments Respondents Permanent panel of experts convened by BERI Frequency Quarterly since 1980 for BRI and annual since 1996 for QLM Coverage Global sample of countries Public Access Full dataset is commercially available. Averages of sub-indicators are publicly
available in this spreadsheet. Description PRI measures eight causes and two symptoms of political risk on a 7-point scale.
ORI measures 15 obstacles to business development on a 5-point scale. QLM measures risk factors in foreign lending on a 100-point scale.
2008 2007 2006 2005 2004 2003 2002 2000 1998 1996
Voice and Accountabil ity
NA .. .. .. .. .. .. .. .. .. ..
Political Stability and Absence of ViolencePRI: External Causes of Polit ica l Risk : Dependence on/Importance to a Hostile Major Power X X X X X X X X X X
PRI: External Causes of Polit ica l Risk : Negative Influences of Regional Political Forces X X X X X X X X X XPRI: Internal Causes of Political Risk: Social Conditions : Wealth Distribution, Population X X X X X X X X X XPRI: Internal Causes of Political Risk: Fractionalization of political spectrum and the power of these factions. X X X X X X X X X X
PRI: Internal Causes of Political Risk: Fractionalization by language, ethnic and/or religious groups and the power of these factions. X X X X X X X X X X
PRI: Internal Causes of Political Risk: Restrictive (coerc ive ) measures required to retain power. X X X X X X X X X X
PRI: Internal Causes of Political Risk: Organization and strength of forces for a radical government. X X X X X X X X X X
PRI: Symptoms of Political Risk: Soc ietal conf lict invo lving demonstrations, strikes, and street violence. X X X X X X X X X X
PRI: Symptoms of Political Risk: Inst ability as perceived by non-constitut ional changes, assassi nations, and guerilla wars. X X X X X X X X X X
Government Effectiveness
ORI: Bureaucratic delays X X X X X X X X X X
Regulatory Quality
NA .. .. .. .. .. .. .. .. .. ..
Rule of Law
ORI: Enforceability of contracts X X X X X X X X X XQLM: Direct Financial Fraud, Money Laundering and Organized Crime X X X X X X X X X X
Control of Corruption
PRI: Internal Causes of Political Risk: Mentality, including xenophobia, nat ionalism, co rruption, nepotism, willingness to compromise. X X X X X X X X X X
QLM: Indirect Diversion of Funds X X X X X X X X X X
Country Coverage (PRI, ORI) 101 101 101 101 101 101 101 101 101 101
Country Coverage (QLM) 115 115 115 115 115 115 115 115 115 115
Year of Publication 2008 2007 2006 2005 2004 2003 2002 2000 1998 1996
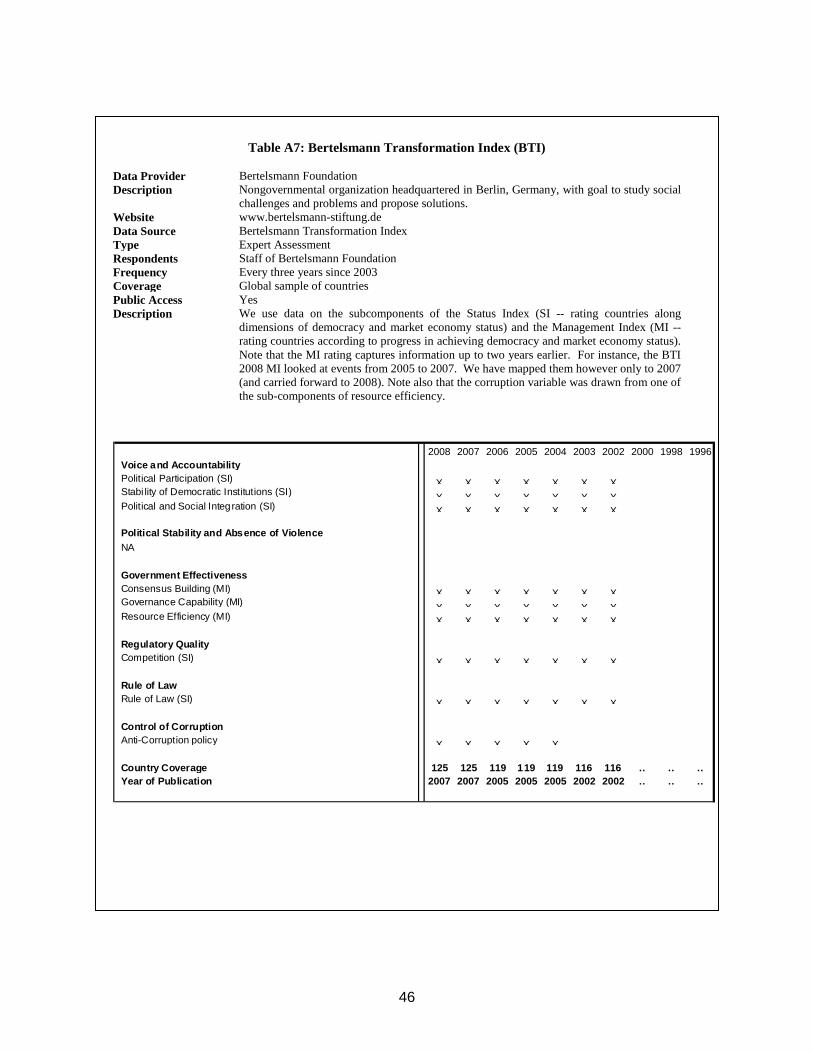
46
Table A7: Bertelsmann Transformation Index (BTI)
Data Provider Bertelsmann Foundation Description Nongovernmental organization headquartered in Berlin, Germany, with goal to study social
challenges and problems and propose solutions. Website www.bertelsmann-stiftung.de Data Source Bertelsmann Transformation Index Type Expert Assessment Respondents Staff of Bertelsmann Foundation Frequency Every three years since 2003 Coverage Global sample of countries Public Access Yes Description We use data on the subcomponents of the Status Index (SI -- rating countries along
dimensions of democracy and market economy status) and the Management Index (MI -- rating countries according to progress in achieving democracy and market economy status). Note that the MI rating captures information up to two years earlier. For instance, the BTI 2008 MI looked at events from 2005 to 2007. We have mapped them however only to 2007 (and carried forward to 2008). Note also that the corruption variable was drawn from one of the sub-components of resource efficiency.
2008 2007 2006 2005 2004 2003 2002 2000 1998 1996
Voice and AccountabilityPolitical Participation (SI) X X X X X X X .. .. ..Stabi lity of Democratic Institutions (SI) X X X X X X X .. .. ..Political and Social Integration (SI) X X X X X X X .. .. .. Political Stability and Absence of ViolenceNA .. .. .. .. .. .. .. .. .. ..
Government EffectivenessConsensus Building (MI) X X X X X X X .. .. ..Governance Capability (MI) X X X X X X X .. .. ..Resource Efficiency (MI) X X X X X X X .. .. ..
Regulatory QualityCompetition (SI) X X X X X X X .. .. .. Rule of LawRule of Law (SI) X X X X X X X .. .. ..
Control of CorruptionAnti-Corruption policy X X X X X .. .. .. .. ..
Country Coverage 125 125 119 119 119 116 116 .. .. ..Year of Publication 2007 2007 2005 2005 2005 2002 2002 .. .. ..
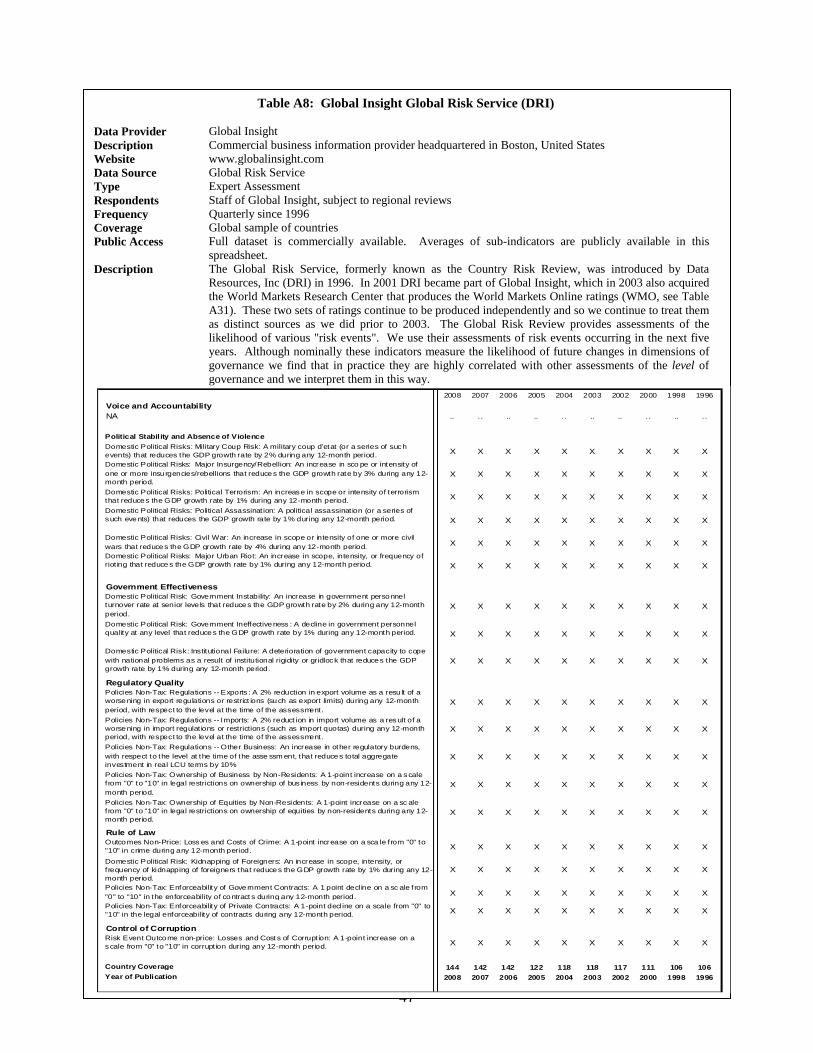
47
Table A8: Global Insight Global Risk Service (DRI)
Data Provider Global Insight Description Commercial business information provider headquartered in Boston, United States Website www.globalinsight.com Data Source Global Risk Service Type Expert Assessment Respondents Staff of Global Insight, subject to regional reviews Frequency Quarterly since 1996 Coverage Global sample of countries Public Access Full dataset is commercially available. Averages of sub-indicators are publicly available in this
spreadsheet. Description The Global Risk Service, formerly known as the Country Risk Review, was introduced by Data
Resources, Inc (DRI) in 1996. In 2001 DRI became part of Global Insight, which in 2003 also acquired the World Markets Research Center that produces the World Markets Online ratings (WMO, see Table A31). These two sets of ratings continue to be produced independently and so we continue to treat them as distinct sources as we did prior to 2003. The Global Risk Review provides assessments of the likelihood of various "risk events". We use their assessments of risk events occurring in the next five years. Although nominally these indicators measure the likelihood of future changes in dimensions of governance we find that in practice they are highly correlated with other assessments of the level of governance and we interpret them in this way.
2008 2007 2006 2005 2004 2003 2002 2000 1998 1996Voice and AccountabilityNA .. .. .. .. .. .. .. .. .. ..
Political Stabil ity and Absence of ViolenceDomestic Political Risks: Military Coup Risk: A military coup d’etat (or a series of such events) that reduces the GDP growth rate by 2% during any 12-month period. X X X X X X X X X X
Domestic Political Risks: Major Insurgency/Rebellion: An increase in sco pe or intensity of one or more insurgencies/rebellions that reduces the GDP growth rate by 3% during any 12-month period.
X X X X X X X X X X
Domestic Political Risks: Political Terrorism: An increase in scope or intensity of terrorism that reduces the GDP growth rate by 1% during any 12-month period. X X X X X X X X X X
Domestic Political Risks: Political Assassinat ion: A political assassinat ion (or a series of such events) that reduces the GDP growth rate by 1% during any 12-month period. X X X X X X X X X X
Domestic Political Risks: Civil War: An increase in scope or intensity of one or more civil wars that reduces the GDP growth rate by 4% during any 12-month period. X X X X X X X X X X
Domestic Political Risks: Major Urban Riot: An increase in scope, intensity, or frequency of riot ing that reduces the GDP growth rate by 1% during any 12-month period. X X X X X X X X X X
Government EffectivenessDomestic Political Risk: Government Instability: An increase in government personnel turnover rate at senior leve ls that reduces the GDP growth rate by 2% during any 12-month period.
X X X X X X X X X X
Domestic Political Risk: Government Ineffectiveness : A decline in government personnel quality at any level that reduces the GDP growth rate by 1% during any 12-month period. X X X X X X X X X X
Domestic Political Risk: Institutional Failure: A deterioration of government capacity to cope with national problems as a result of institutional rigidity or gridlock that reduces the GDP growth rate by 1% during any 12-month period.
X X X X X X X X X X
Regulatory QualityPolicies Non-Tax: Regulations -- Exports : A 2% reduction in export volume as a resu lt of a worsening in export regulations or restrict ions (such as export limits) during any 12-month period, with respect to the level at the time of the assessment.
X X X X X X X X X X
Policies Non-Tax: Regulations -- Imports: A 2% reduct ion in import volume as a result of a worsening in import regulat ions or restrictions (such as import quotas) during any 12-month period, with respect to the level at the time of the assessment.
X X X X X X X X X X
Policies Non-Tax: Regulations -- Other Business: An increase in other regulatory burdens, with respect to the level at the time of the asse ssm ent, that reduces total aggregate investment in real LCU terms by 10%
X X X X X X X X X X
Policies Non-Tax: Ownership of Business by Non-Residents: A 1-point increase on a scale from "0" to "10" in legal restrictions on ownership of bus iness by non-residents during any 12-month period.
X X X X X X X X X X
Policies Non-Tax: Ownership of Equities by Non-Residents: A 1-point increase on a sc ale from "0" to "10" in legal restrictions on ownership of equities by non-residents during any 12-month period.
X X X X X X X X X X
Rule of LawOutcomes Non-Price: Loss es and Costs of Crime: A 1-point increase on a sca le from "0" to "10" in crime during any 12-month period. X X X X X X X X X X
Domestic Political Risk: Kidnapping of Foreigners: An increase in scope, intensity, or f requency of kidnapping of foreigners that reduces the GDP growth rate by 1% during any 12-month period.
X X X X X X X X X X
Policies Non-Tax: Enforceability of Government Contracts: A 1 point decline on a sc ale from "0" to "10" in the enforceability of contract s during any 12-month period. X X X X X X X X X X
Policies Non-Tax: Enforceability of Private Contracts: A 1-point decline on a scale from "0" to "10" in the legal enforceability of contracts during any 12-month period. X X X X X X X X X X
Control of CorruptionRisk Event Outcome non-price: Losses and Cost s of Corrupt ion: A 1-point increase on a scale from "0" to "10" in corrupt ion during any 12-month period. X X X X X X X X X X
Country Coverage 144 142 142 122 118 118 117 111 106 106Year of Publication 2008 2007 2006 2005 2004 2003 2002 2000 1998 1996
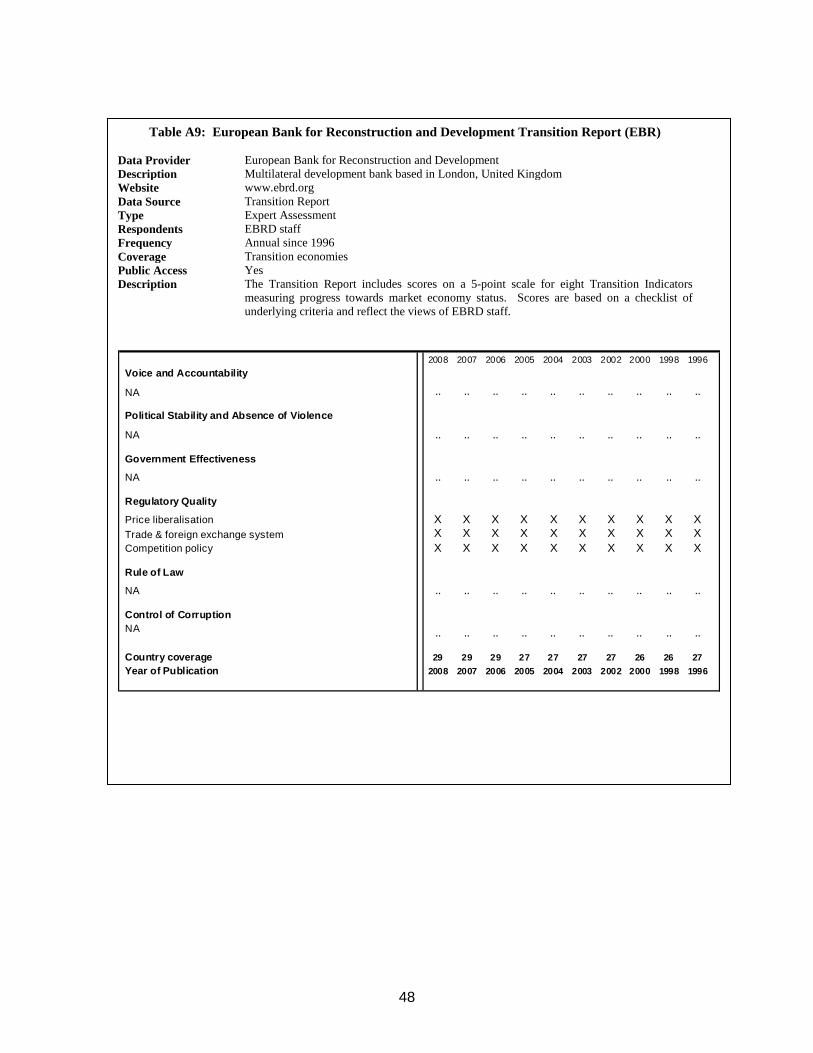
48
Table A9: European Bank for Reconstruction and Development Transition Report (EBR)
Data Provider European Bank for Reconstruction and Development Description Multilateral development bank based in London, United Kingdom Website www.ebrd.org Data Source Transition Report Type Expert Assessment Respondents EBRD staff Frequency Annual since 1996 Coverage Transition economies Public Access Yes Description The Transition Report includes scores on a 5-point scale for eight Transition Indicators
measuring progress towards market economy status. Scores are based on a checklist of underlying criteria and reflect the views of EBRD staff.
2008 2007 2006 2005 2004 2003 2002 2000 1998 1996Voice and Accountability
NA .. .. .. .. .. .. .. .. .. ..
Political Stability and Absence of Violence
NA .. .. .. .. .. .. .. .. .. ..
Government Effectiveness
NA .. .. .. .. .. .. .. .. .. ..
Regulatory Quality
Price liberalisation X X X X X X X X X XTrade & foreign exchange system X X X X X X X X X XCompetition policy X X X X X X X X X X
Rule of Law
NA .. .. .. .. .. .. .. .. .. ..
Control of CorruptionNA .. .. .. .. .. .. .. .. .. ..
Country coverage 29 29 29 27 27 27 27 26 26 27Year of Publication 2008 2007 2006 2005 2004 2003 2002 2000 1998 1996
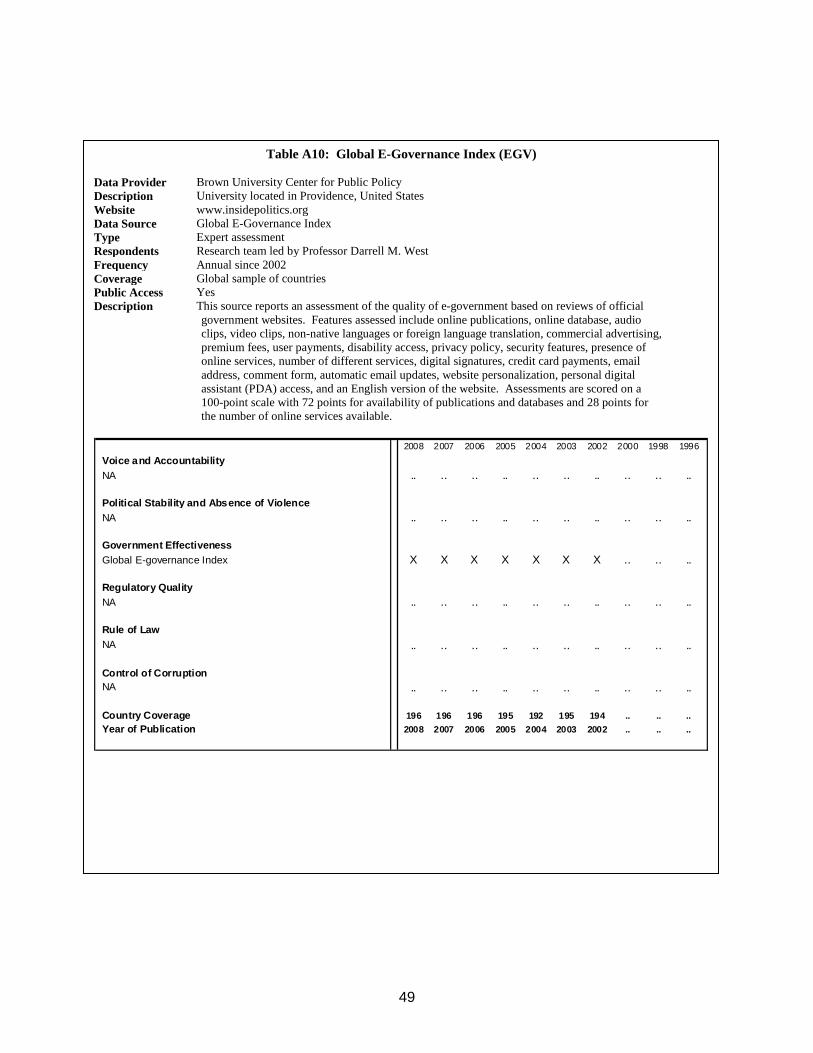
49
Table A10: Global E-Governance Index (EGV)
Data Provider Brown University Center for Public Policy Description University located in Providence, United States Website www.insidepolitics.org Data Source Global E-Governance Index Type Expert assessment Respondents Research team led by Professor Darrell M. West Frequency Annual since 2002 Coverage Global sample of countries Public Access Yes Description This source reports an assessment of the quality of e-government based on reviews of official
government websites. Features assessed include online publications, online database, audio clips, video clips, non-native languages or foreign language translation, commercial advertising, premium fees, user payments, disability access, privacy policy, security features, presence of online services, number of different services, digital signatures, credit card payments, email address, comment form, automatic email updates, website personalization, personal digital assistant (PDA) access, and an English version of the website. Assessments are scored on a 100-point scale with 72 points for availability of publications and databases and 28 points for the number of online services available.
2008 2007 2006 2005 2004 2003 2002 2000 1998 1996Voice and AccountabilityNA .. .. .. .. .. .. .. .. .. ..
Political Stability and Absence of ViolenceNA .. .. .. .. .. .. .. .. .. ..
Government EffectivenessGlobal E-governance Index X X X X X X X .. .. ..
Regulatory QualityNA .. .. .. .. .. .. .. .. .. ..
Rule of LawNA .. .. .. .. .. .. .. .. .. ..
Control of CorruptionNA .. .. .. .. .. .. .. .. .. ..
Country Coverage 196 196 196 195 192 195 194 .. .. ..Year of Publication 2008 2007 2006 2005 2004 2003 2002 .. .. ..
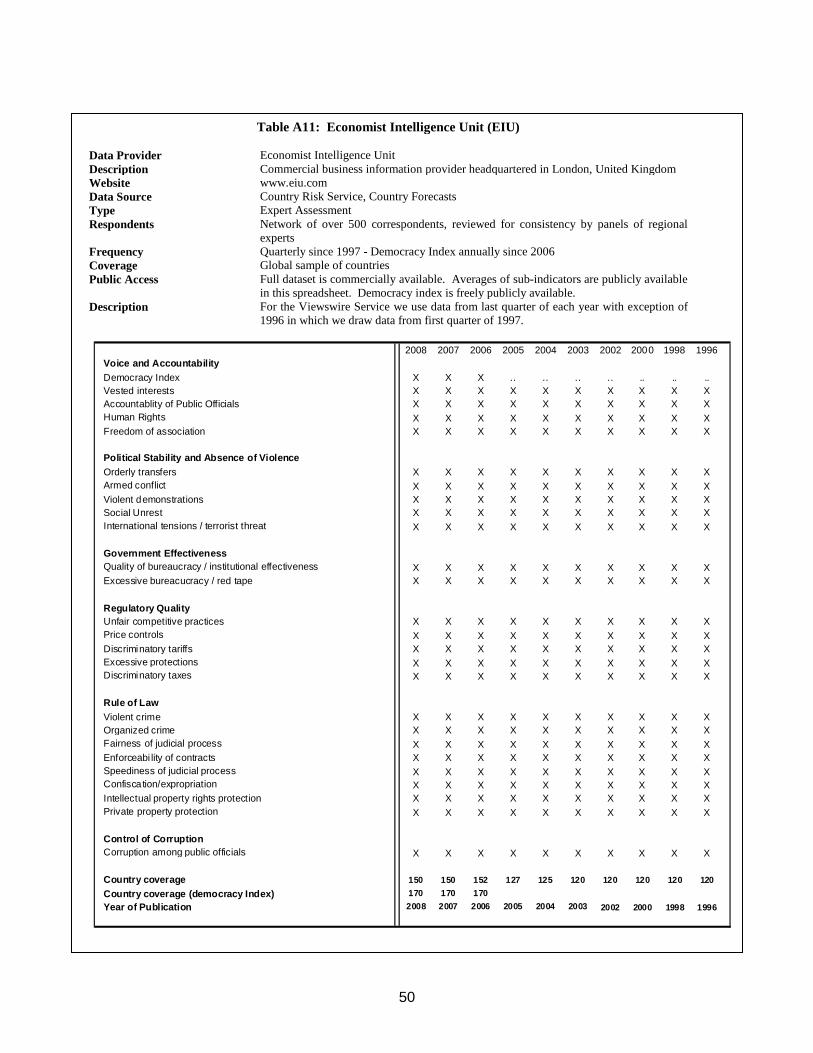
50
Table A11: Economist Intelligence Unit (EIU)
Data Provider Economist Intelligence Unit Description Commercial business information provider headquartered in London, United Kingdom Website www.eiu.com Data Source Country Risk Service, Country Forecasts Type Expert Assessment Respondents Network of over 500 correspondents, reviewed for consistency by panels of regional
experts Frequency Quarterly since 1997 - Democracy Index annually since 2006 Coverage Global sample of countries Public Access Full dataset is commercially available. Averages of sub-indicators are publicly available
in this spreadsheet. Democracy index is freely publicly available. Description For the Viewswire Service we use data from last quarter of each year with exception of
1996 in which we draw data from first quarter of 1997.
2008 2007 2006 2005 2004 2003 2002 2000 1998 1996Voice and AccountabilityDemocracy Index X X X .. .. .. .. .. .. ..Vested interests X X X X X X X X X XAccountablity of Public Officials X X X X X X X X X XHuman Rights X X X X X X X X X XFreedom of association X X X X X X X X X X
Political Stability and Absence of ViolenceOrderly transfers X X X X X X X X X XArmed conflict X X X X X X X X X XViolent demonstrations X X X X X X X X X XSocial Unrest X X X X X X X X X XInternational tensions / terrorist threat X X X X X X X X X X
Government EffectivenessQuality of bureaucracy / institutional effectiveness X X X X X X X X X XExcessive bureacucracy / red tape X X X X X X X X X X
Regulatory QualityUnfair competitive practices X X X X X X X X X XPrice controls X X X X X X X X X XDiscriminatory tariffs X X X X X X X X X XExcessive protections X X X X X X X X X XDiscriminatory taxes X X X X X X X X X X
Rule of LawViolent crime X X X X X X X X X XOrganized crime X X X X X X X X X XFairness of judicial process X X X X X X X X X XEnforceabi lity of contracts X X X X X X X X X XSpeediness of judicial process X X X X X X X X X XConfiscation/expropriation X X X X X X X X X XIntellectual property rights protection X X X X X X X X X XPrivate property protection X X X X X X X X X X
Control of CorruptionCorruption among public officials X X X X X X X X X X
Country coverage 150 150 152 127 125 120 120 120 120 120Country coverage (democracy Index) 170 170 170Year of Publication 2008 2007 2006 2005 2004 2003 2002 2000 1998 1996
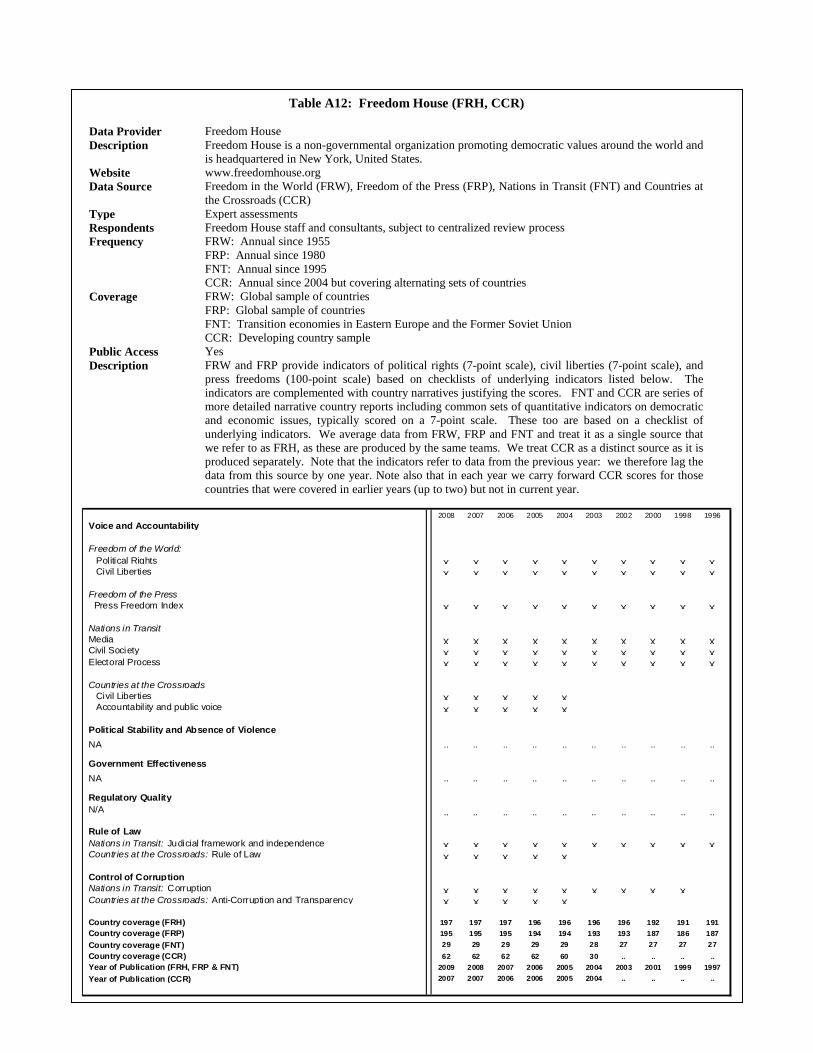
51
Table A12: Freedom House (FRH, CCR)
Data Provider Freedom House Description Freedom House is a non-governmental organization promoting democratic values around the world and
is headquartered in New York, United States. Website www.freedomhouse.org Data Source Freedom in the World (FRW), Freedom of the Press (FRP), Nations in Transit (FNT) and Countries at
the Crossroads (CCR) Type Expert assessments Respondents Freedom House staff and consultants, subject to centralized review process Frequency FRW: Annual since 1955
FRP: Annual since 1980 FNT: Annual since 1995 CCR: Annual since 2004 but covering alternating sets of countries
Coverage FRW: Global sample of countries FRP: Global sample of countries FNT: Transition economies in Eastern Europe and the Former Soviet Union CCR: Developing country sample
Public Access Yes Description FRW and FRP provide indicators of political rights (7-point scale), civil liberties (7-point scale), and
press freedoms (100-point scale) based on checklists of underlying indicators listed below. The indicators are complemented with country narratives justifying the scores. FNT and CCR are series of more detailed narrative country reports including common sets of quantitative indicators on democratic and economic issues, typically scored on a 7-point scale. These too are based on a checklist of underlying indicators. We average data from FRW, FRP and FNT and treat it as a single source that we refer to as FRH, as these are produced by the same teams. We treat CCR as a distinct source as it is produced separately. Note that the indicators refer to data from the previous year: we therefore lag the data from this source by one year. Note also that in each year we carry forward CCR scores for those countries that were covered in earlier years (up to two) but not in current year.
2008 2007 2006 2005 2004 2003 2002 2000 1998 1996Voice and Accountability
Freedom of the World: Political Rights X X X X X X X X X X Civil Liberties X X X X X X X X X X
Freedom of the Press Press Freedom Index X X X X X X X X X X
Nations in TransitMedia X X X X X X X X X XCivil Society X X X X X X X X X XElectoral Process X X X X X X X X X X
Countries at the CrossroadsCivil Liberties X X X X X .. .. .. .. ..Accountabil ity and public voice X X X X X .. .. .. .. ..
Political Stability and Absence of ViolenceNA .. .. .. .. .. .. .. .. .. ..
Government EffectivenessNA .. .. .. .. .. .. .. .. .. ..
Regulatory QualityN/A .. .. .. .. .. .. .. .. .. ..
Rule of LawNations in Transit: Judicial framework and independence X X X X X X X X X XCountries at the Crossroads: Rule of Law X X X X X .. .. .. .. ..
Control of CorruptionNations in Transit: Corruption X X X X X X X X X ..Countries at the Crossroads: Anti-Corruption and Transparency X X X X X .. .. .. .. ..
Country coverage (FRH) 197 197 197 196 196 196 196 192 191 191Country coverage (FRP) 195 195 195 194 194 193 193 187 186 187Country coverage (FNT) 29 29 29 29 29 28 27 27 27 27Country coverage (CCR) 62 62 62 62 60 30 .. .. .. ..Year of Publication (FRH, FRP & FNT) 2009 2008 2007 2006 2005 2004 2003 2001 1999 1997Year of Publication (CCR) 2007 2007 2006 2006 2005 2004 .. .. .. ..
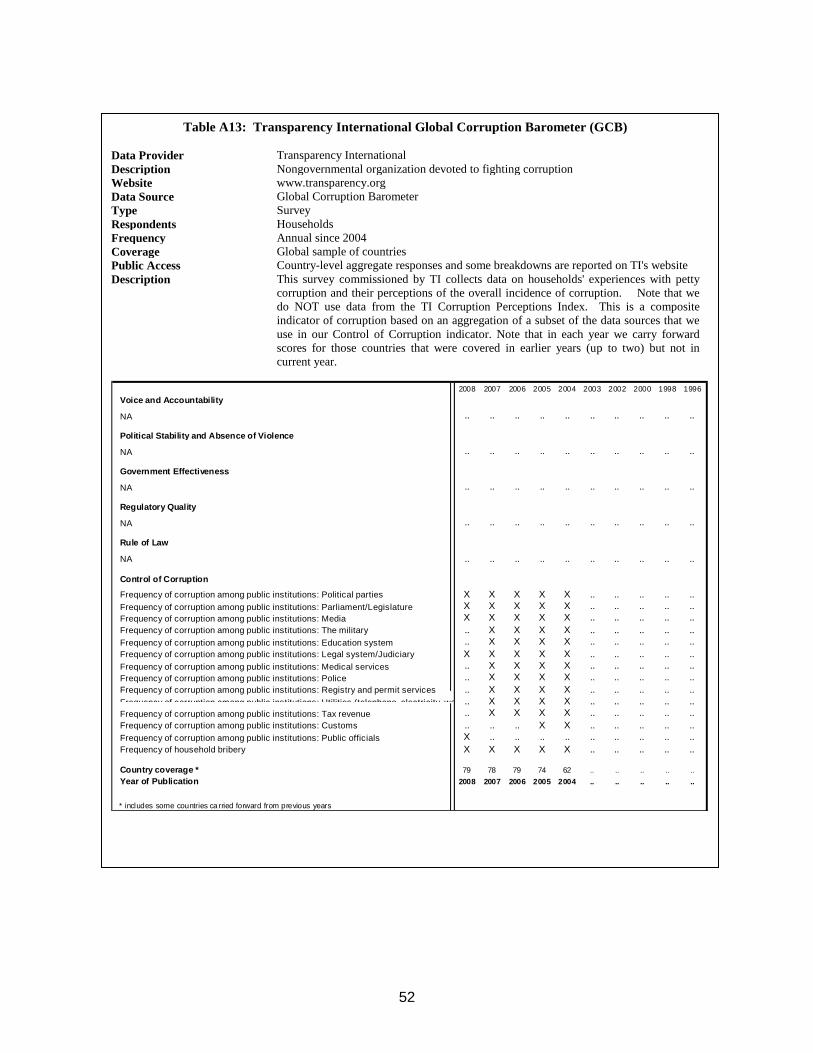
52
Table A13: Transparency International Global Corruption Barometer (GCB)
Data Provider Transparency International Description Nongovernmental organization devoted to fighting corruption Website www.transparency.org Data Source Global Corruption Barometer Type Survey Respondents Households Frequency Annual since 2004 Coverage Global sample of countries Public Access Country-level aggregate responses and some breakdowns are reported on TI's website Description This survey commissioned by TI collects data on households' experiences with petty
corruption and their perceptions of the overall incidence of corruption. Note that we do NOT use data from the TI Corruption Perceptions Index. This is a composite indicator of corruption based on an aggregation of a subset of the data sources that we use in our Control of Corruption indicator. Note that in each year we carry forward scores for those countries that were covered in earlier years (up to two) but not in current year.
2008 2007 2006 2005 2004 2003 2002 2000 1998 1996Voice and Accountability
NA .. .. .. .. .. .. .. .. .. .. Political Stability and Absence of Violence
NA .. .. .. .. .. .. .. .. .. ..
Government Effectiveness
NA .. .. .. .. .. .. .. .. .. ..
Regulatory Quality
NA .. .. .. .. .. .. .. .. .. ..
Rule of Law
NA .. .. .. .. .. .. .. .. .. ..
Control of Corruption
Frequency of corruption among public institutions: Political parties X X X X X .. .. .. .. ..Frequency of corruption among public institutions: Parliament/Legislature X X X X X .. .. .. .. ..Frequency of corruption among public institutions: Media X X X X X .. .. .. .. ..Frequency of corruption among public institutions: The military .. X X X X .. .. .. .. ..Frequency of corruption among public institutions: Education system .. X X X X .. .. .. .. ..Frequency of corruption among public institutions: Legal system/Judiciary X X X X X .. .. .. .. ..Frequency of corruption among public institutions: Medical services .. X X X X .. .. .. .. ..Frequency of corruption among public institutions: Police .. X X X X .. .. .. .. ..Frequency of corruption among public institutions: Registry and permit services .. X X X X .. .. .. .. ..Frequency of corruption among public institutions: Utilities (telephone, electricity, wa .. X X X X .. .. .. .. ..Frequency of corruption among public institutions: Tax revenue .. X X X X .. .. .. .. ..Frequency of corruption among public institutions: Customs .. .. .. X X .. .. .. .. ..Frequency of corruption among public institutions: Public officials X .. .. .. .. .. .. .. .. ..Frequency of household bribery X X X X X .. .. .. .. ..
Country coverage * 79 78 79 74 62 .. .. .. .. ..Year of Publication 2008 2007 2006 2005 2004 .. .. .. .. ..
* includes some countries ca rried forward from previous years
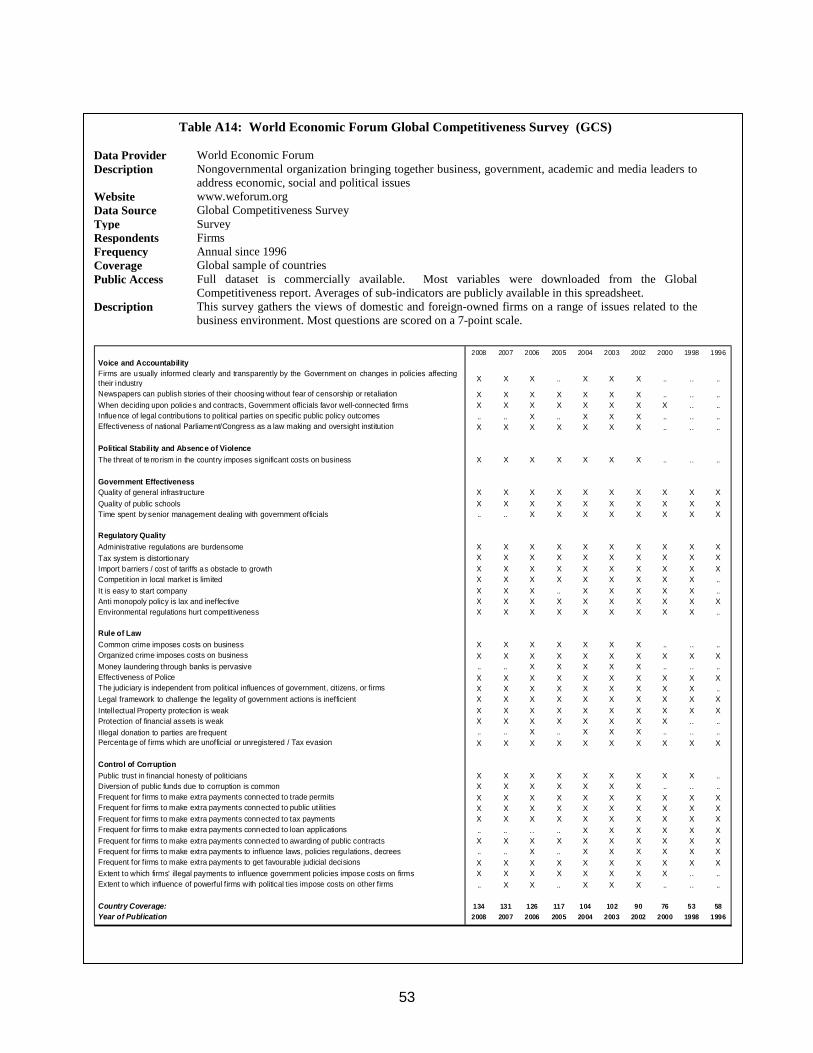
53
Table A14: World Economic Forum Global Competitiveness Survey (GCS)
Data Provider World Economic Forum Description Nongovernmental organization bringing together business, government, academic and media leaders to
address economic, social and political issues Website www.weforum.org Data Source Global Competitiveness Survey Type Survey Respondents Firms Frequency Annual since 1996 Coverage Global sample of countries Public Access Full dataset is commercially available. Most variables were downloaded from the Global
Competitiveness report. Averages of sub-indicators are publicly available in this spreadsheet. Description This survey gathers the views of domestic and foreign-owned firms on a range of issues related to the
business environment. Most questions are scored on a 7-point scale.
2008 2007 2006 2005 2004 2003 2002 2000 1998 1996Voice and AccountabilityFirms are usually informed clearly and transparently by the Government on changes in policies affectingtheir industry X X X .. X X X .. .. ..
Newspapers can publish stories of their choosing without fear of censorship or retaliation X X X X X X X .. .. ..When deciding upon policies and contracts, Government officials favor well-connected firms X X X X X X X X .. ..Influence of legal contributions to political parties on specific public policy outcomes .. .. X .. X X X .. .. ..Effectiveness of national Parliament/Congress as a law making and oversight institution X X X X X X X .. .. ..
Political Stability and Absence of ViolenceThe threat of terrorism in the country imposes significant costs on business X X X X X X X .. .. ..
Government EffectivenessQuality of general infrastructure X X X X X X X X X XQuality of public schools X X X X X X X X X XTime spent by senior management dealing with government officials .. .. X X X X X X X X
Regulatory QualityAdministrative regulations are burdensome X X X X X X X X X XTax system is distortionary X X X X X X X X X XImport barriers / cost of tariffs as obstacle to growth X X X X X X X X X XCompetition in local market is limited X X X X X X X X X ..It is easy to start company X X X .. X X X X X ..Anti monopoly policy is lax and ineffective X X X X X X X X X XEnvironmental regulations hurt competitiveness X X X X X X X X X ..
Rule of LawCommon crime imposes costs on business X X X X X X X .. .. ..Organized crime imposes costs on business X X X X X X X X X XMoney laundering through banks is pervasive .. .. X X X X X .. .. ..Effectiveness of Police X X X X X X X X X XThe judiciary is independent from political influences of government, citizens, or firms X X X X X X X X X ..Legal framework to challenge the legality of government actions is inefficient X X X X X X X X X XIntellectual Property protection is weak X X X X X X X X X XProtection of financial assets is weak X X X X X X X X .. ..Illegal donation to parties are frequent .. .. X .. X X X .. .. ..Percentage of firms which are unofficial or unregistered / Tax evasion X X X X X X X X X X
Control of CorruptionPublic trust in financial honesty of politicians X X X X X X X X X ..Diversion of public funds due to corruption is common X X X X X X X .. .. ..Frequent for firms to make extra payments connected to trade permits X X X X X X X X X XFrequent for firms to make extra payments connected to public utilities X X X X X X X X X XFrequent for firms to make extra payments connected to tax payments X X X X X X X X X XFrequent for firms to make extra payments connected to loan applications .. .. .. .. X X X X X XFrequent for firms to make extra payments connected to awarding of public contracts X X X X X X X X X XFrequent for firms to make extra payments to influence laws, policies regulations, decrees .. .. X .. X X X X X XFrequent for firms to make extra payments to get favourable judicial decisions X X X X X X X X X XExtent to which firms' illegal payments to influence government policies impose costs on firms X X X X X X X X .. ..Extent to which influence of powerful firms with political ties impose costs on other firms .. X X .. X X X .. .. ..
Country Coverage: 134 131 126 117 104 102 90 76 53 58Year of Publication 2008 2007 2006 2005 2004 2003 2002 2000 1998 1996
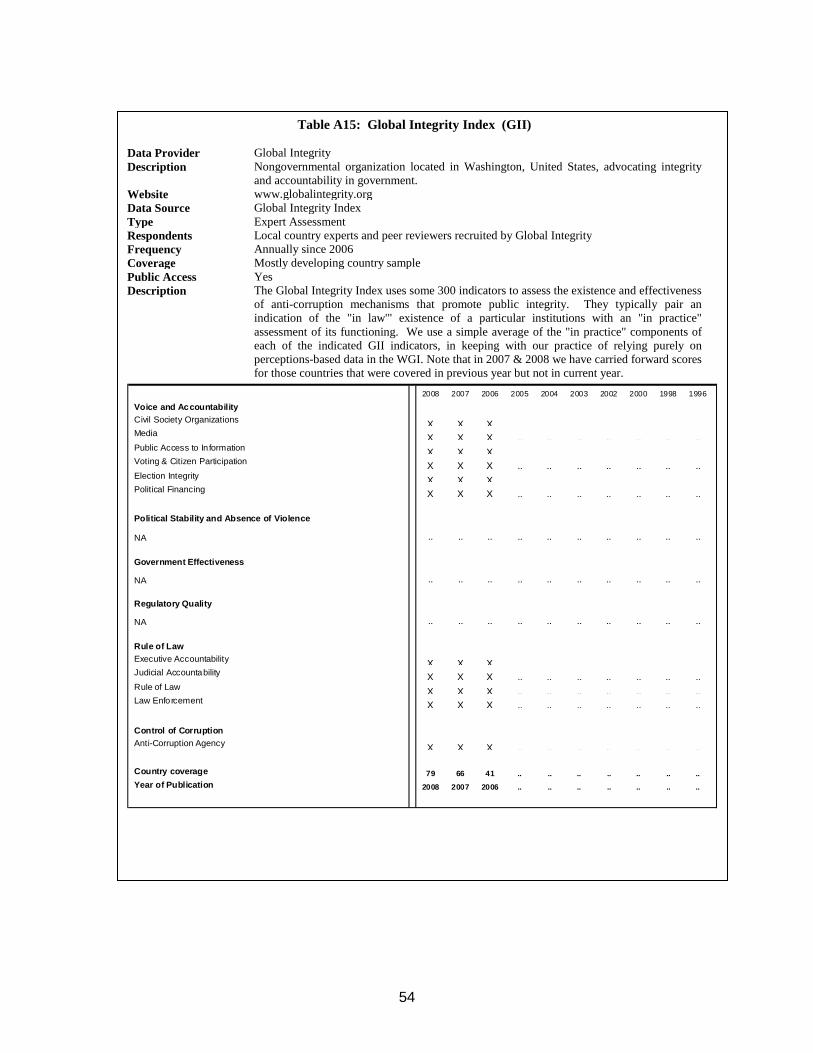
54
Table A15: Global Integrity Index (GII)
Data Provider Global Integrity Description Nongovernmental organization located in Washington, United States, advocating integrity
and accountability in government. Website www.globalintegrity.org Data Source Global Integrity Index Type Expert Assessment Respondents Local country experts and peer reviewers recruited by Global Integrity Frequency Annually since 2006 Coverage Mostly developing country sample Public Access Yes Description The Global Integrity Index uses some 300 indicators to assess the existence and effectiveness
of anti-corruption mechanisms that promote public integrity. They typically pair an indication of the "in law'" existence of a particular institutions with an "in practice" assessment of its functioning. We use a simple average of the "in practice" components of each of the indicated GII indicators, in keeping with our practice of relying purely on perceptions-based data in the WGI. Note that in 2007 & 2008 we have carried forward scores for those countries that were covered in previous year but not in current year.
2008 2007 2006 2005 2004 2003 2002 2000 1998 1996
Voice and AccountabilityCivil Society Organizations X X X .. .. .. .. .. .. ..Media X X X .. .. .. .. .. .. ..Public Access to In formation X X X .. .. .. .. .. .. ..Voting & Citizen Participation X X X .. .. .. .. .. .. ..Election Integrity X X X .. .. .. .. .. .. ..Political Financing X X X .. .. .. .. .. .. .. Political Stability and Absence of Violence
NA .. .. .. .. .. .. .. .. .. ..
Government Effectiveness
NA .. .. .. .. .. .. .. .. .. ..
Regulatory Quality
NA .. .. .. .. .. .. .. .. .. ..
Rule of LawExecutive Accountability X X X .. .. .. .. .. .. ..Judicial Accountability X X X .. .. .. .. .. .. ..Rule of Law X X X .. .. .. .. .. .. ..Law Enforcement X X X .. .. .. .. .. .. ..
Control of CorruptionAnti-Corruption Agency X X X .. .. .. .. .. .. ..
Country coverage 79 66 41 .. .. .. .. .. .. ..Year of Publication 2008 2007 2006 .. .. .. .. .. .. ..
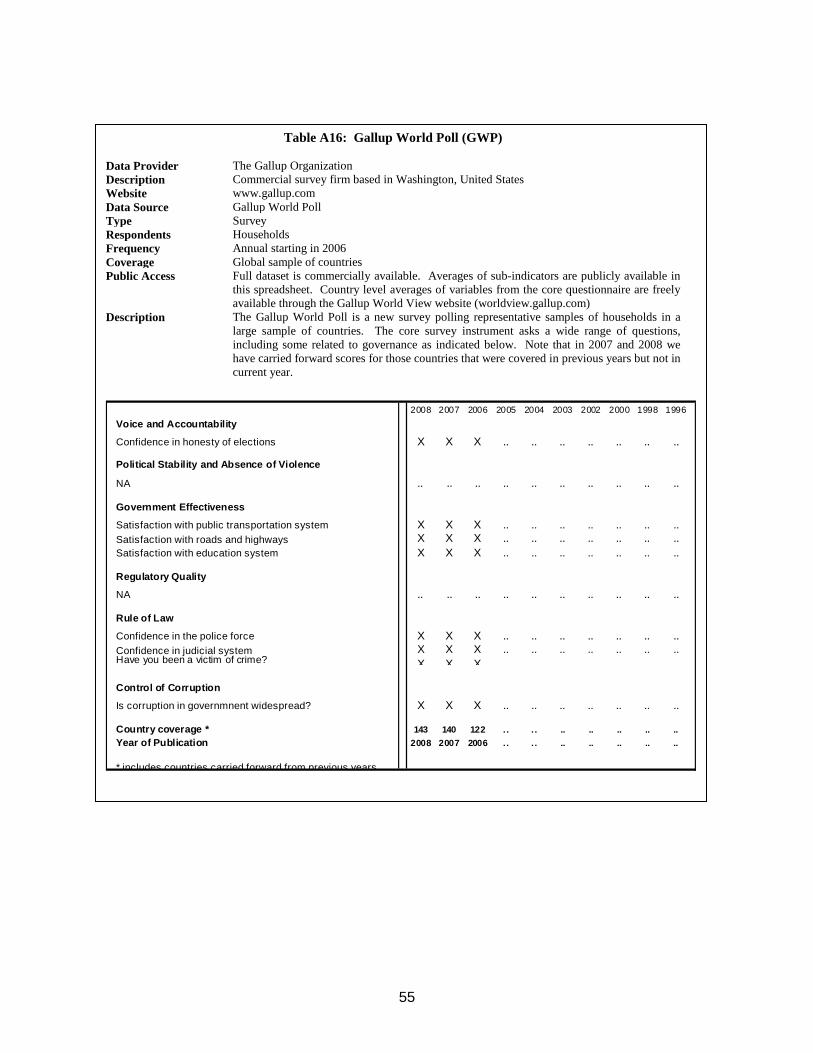
55
Table A16: Gallup World Poll (GWP)
Data Provider The Gallup Organization Description Commercial survey firm based in Washington, United States Website www.gallup.com Data Source Gallup World Poll Type Survey Respondents Households Frequency Annual starting in 2006 Coverage Global sample of countries Public Access Full dataset is commercially available. Averages of sub-indicators are publicly available in
this spreadsheet. Country level averages of variables from the core questionnaire are freely available through the Gallup World View website (worldview.gallup.com)
Description The Gallup World Poll is a new survey polling representative samples of households in a large sample of countries. The core survey instrument asks a wide range of questions, including some related to governance as indicated below. Note that in 2007 and 2008 we have carried forward scores for those countries that were covered in previous years but not in current year.
2008 2007 2006 2005 2004 2003 2002 2000 1998 1996
Voice and Accountability
Confidence in honesty of elections X X X .. .. .. .. .. .. .. Political Stability and Absence of Violence
NA .. .. .. .. .. .. .. .. .. ..
Government Effectiveness
Satisfaction with public transportation system X X X .. .. .. .. .. .. ..Satisfaction with roads and highways X X X .. .. .. .. .. .. ..Satisfaction with education system X X X .. .. .. .. .. .. ..
Regulatory Quality
NA .. .. .. .. .. .. .. .. .. ..
Rule of Law
Confidence in the police force X X X .. .. .. .. .. .. ..Confidence in judicial system X X X .. .. .. .. .. .. ..Have you been a victim of crime? X X X .. .. .. .. .. .. ..
Control of Corruption
Is corruption in governmnent widespread? X X X .. .. .. .. .. .. ..
Country coverage * 143 140 122 .. . . .. .. .. .. ..Year of Publication 2008 2007 2006 .. . . .. .. .. .. ..
* includes countries carried forward from previous years
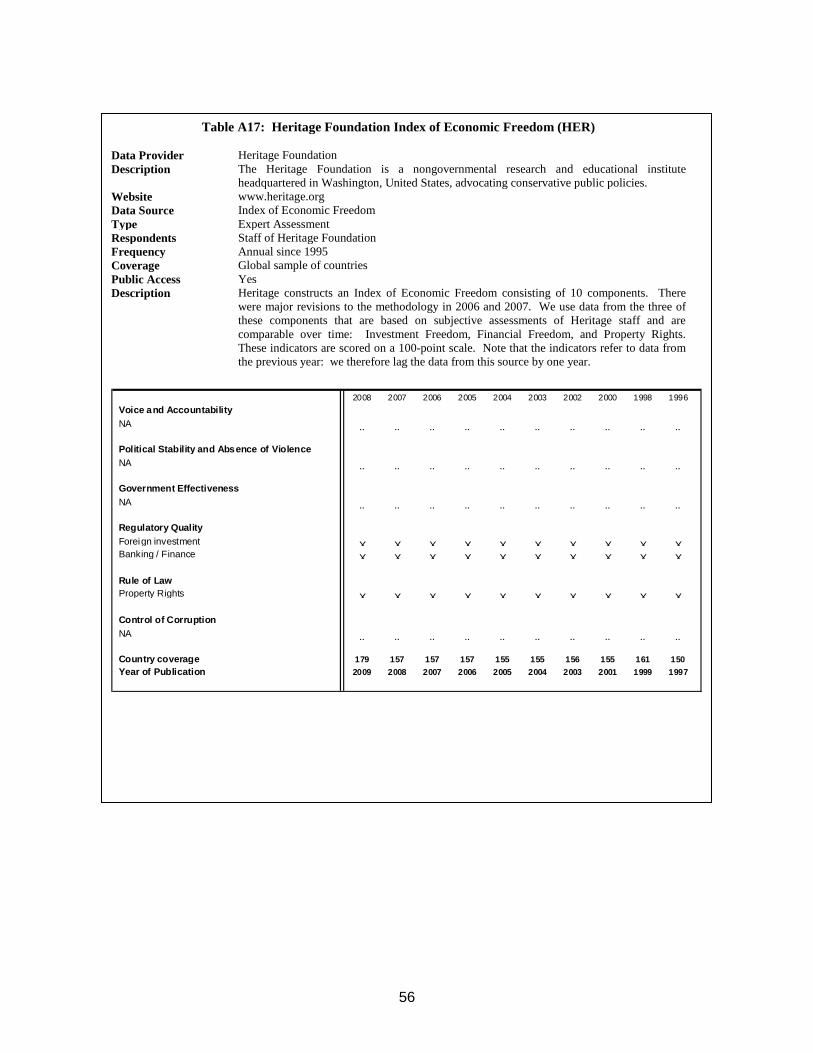
56
Table A17: Heritage Foundation Index of Economic Freedom (HER)
Data Provider Heritage Foundation Description The Heritage Foundation is a nongovernmental research and educational institute
headquartered in Washington, United States, advocating conservative public policies. Website www.heritage.org Data Source Index of Economic Freedom Type Expert Assessment Respondents Staff of Heritage Foundation Frequency Annual since 1995 Coverage Global sample of countries Public Access Yes Description Heritage constructs an Index of Economic Freedom consisting of 10 components. There
were major revisions to the methodology in 2006 and 2007. We use data from the three of these components that are based on subjective assessments of Heritage staff and are comparable over time: Investment Freedom, Financial Freedom, and Property Rights. These indicators are scored on a 100-point scale. Note that the indicators refer to data from the previous year: we therefore lag the data from this source by one year.
2008 2007 2006 2005 2004 2003 2002 2000 1998 1996
Voice and AccountabilityNA .. .. .. .. .. .. .. .. .. ..
Political Stability and Absence of ViolenceNA .. .. .. .. .. .. .. .. .. ..
Government EffectivenessNA .. .. .. .. .. .. .. .. .. ..
Regulatory QualityForeign investment X X X X X X X X X XBanking / Finance X X X X X X X X X X
Rule of LawProperty Rights X X X X X X X X X X
Control of CorruptionNA .. .. .. .. .. .. .. .. .. ..
Country coverage 179 157 157 157 155 155 156 155 161 150Year of Publication 2009 2008 2007 2006 2005 2004 2003 2001 1999 1997
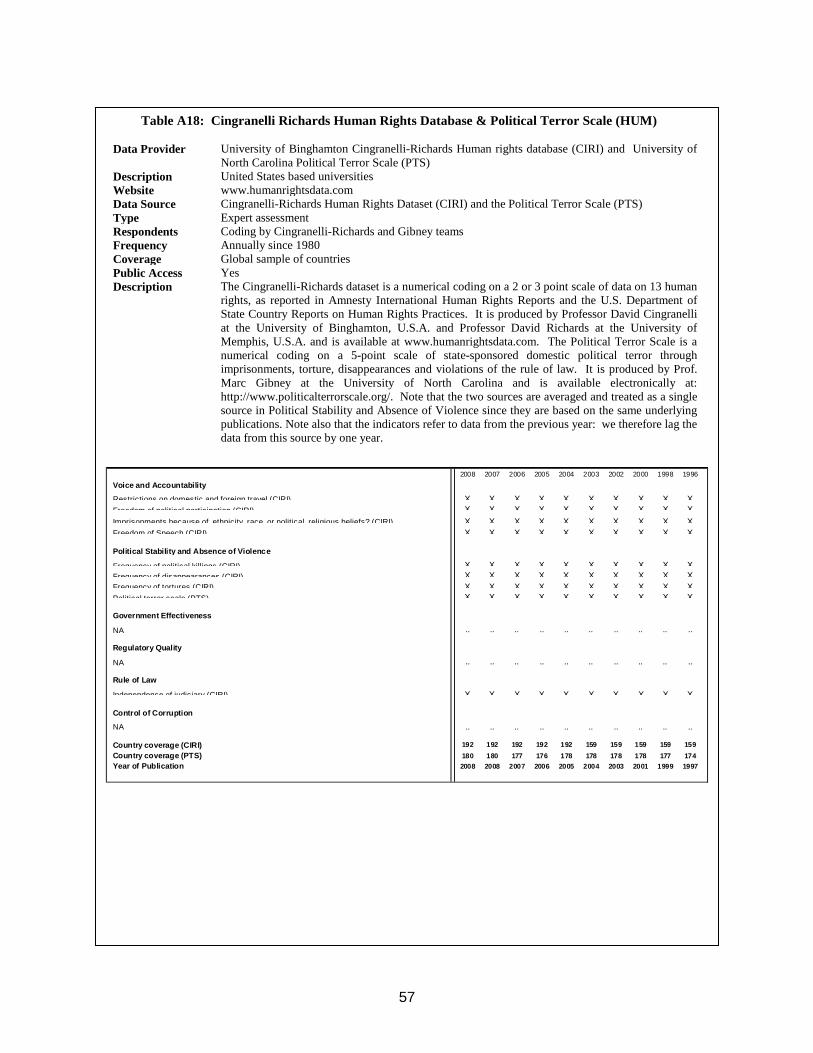
57
Table A18: Cingranelli Richards Human Rights Database & Political Terror Scale (HUM)
Data Provider University of Binghamton Cingranelli-Richards Human rights database (CIRI) and University of North Carolina Political Terror Scale (PTS)
Description United States based universities Website www.humanrightsdata.com Data Source Cingranelli-Richards Human Rights Dataset (CIRI) and the Political Terror Scale (PTS) Type Expert assessment Respondents Coding by Cingranelli-Richards and Gibney teams Frequency Annually since 1980 Coverage Global sample of countries Public Access Yes Description The Cingranelli-Richards dataset is a numerical coding on a 2 or 3 point scale of data on 13 human
rights, as reported in Amnesty International Human Rights Reports and the U.S. Department of State Country Reports on Human Rights Practices. It is produced by Professor David Cingranelli at the University of Binghamton, U.S.A. and Professor David Richards at the University of Memphis, U.S.A. and is available at www.humanrightsdata.com. The Political Terror Scale is a numerical coding on a 5-point scale of state-sponsored domestic political terror through imprisonments, torture, disappearances and violations of the rule of law. It is produced by Prof. Marc Gibney at the University of North Carolina and is available electronically at: http://www.politicalterrorscale.org/. Note that the two sources are averaged and treated as a single source in Political Stability and Absence of Violence since they are based on the same underlying publications. Note also that the indicators refer to data from the previous year: we therefore lag the data from this source by one year.
2008 2007 2006 2005 2004 2003 2002 2000 1998 1996
Voice and Accountability
Restrictions on domestic and foreign travel (CIRI) X X X X X X X X X XFreedom of political participation (CIRI) X X X X X X X X X XImprisonments because of ethnicity, race, or political, religious beliefs? (CIRI) X X X X X X X X X XFreedom of Speech (CIRI) X X X X X X X X X X
Political Stability and Absence of Violence
Frequency of political killings (CIRI) X X X X X X X X X XFrequency of disappearances (CIRI) X X X X X X X X X XFrequency of tortures (CIRI) X X X X X X X X X XPolitical terror scale (PTS) X X X X X X X X X X
Government Effectiveness
NA .. .. .. .. .. .. .. .. .. ..
Regulatory Quality
NA .. .. .. .. .. .. .. .. .. ..
Rule of Law
Independence of judiciary (CIRI) X X X X X X X X X X
Control of Corruption
NA .. .. .. .. .. .. .. .. .. ..
Country coverage (CIRI) 192 192 192 192 192 159 159 159 159 159Country coverage (PTS) 180 180 177 176 178 178 178 178 177 174Year of Publication 2008 2008 2007 2006 2005 2004 2003 2001 1999 1997
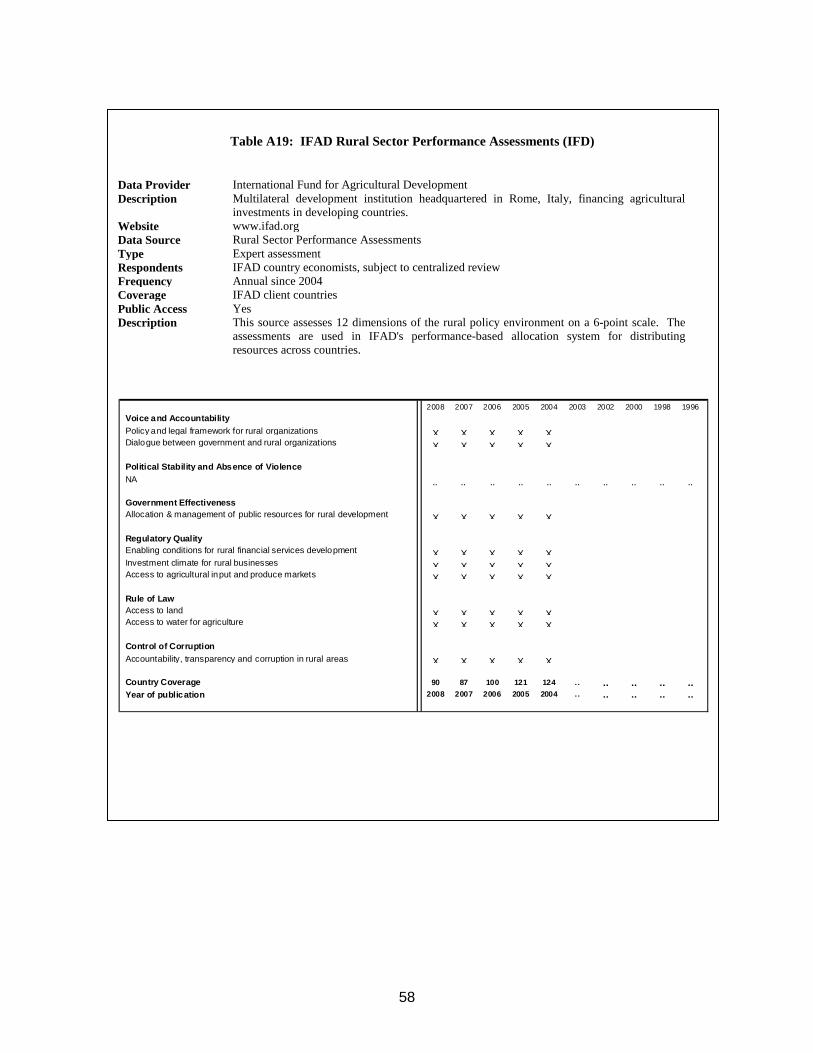
58
Table A19: IFAD Rural Sector Performance Assessments (IFD)
Data Provider International Fund for Agricultural Development Description Multilateral development institution headquartered in Rome, Italy, financing agricultural
investments in developing countries. Website www.ifad.org Data Source Rural Sector Performance Assessments Type Expert assessment Respondents IFAD country economists, subject to centralized review Frequency Annual since 2004 Coverage IFAD client countries Public Access Yes Description This source assesses 12 dimensions of the rural policy environment on a 6-point scale. The
assessments are used in IFAD's performance-based allocation system for distributing resources across countries.
2008 2007 2006 2005 2004 2003 2002 2000 1998 1996Voice and AccountabilityPolicy and legal framework for rural organizations X X X X X .. .. .. .. ..Dialogue between government and rural organizations X X X X X .. .. .. .. ..
Political Stability and Absence of ViolenceNA .. .. .. .. .. .. .. .. .. ..
Government EffectivenessAllocation & management of public resources for rural development X X X X X .. .. .. .. ..
Regulatory QualityEnabling conditions for rural financial services development X X X X X .. .. .. .. ..Investment climate for rural businesses X X X X X .. .. .. .. ..Access to agricultural input and produce markets X X X X X .. .. .. .. ..
Rule of LawAccess to land X X X X X .. .. .. .. ..Access to water for agriculture X X X X X .. .. .. .. ..
Control of CorruptionAccountability, transparency and corruption in rural areas X X X X X .. .. .. .. ..
Country Coverage 90 87 100 121 124 .. .. .. .. ..Year of publication 2008 2007 2006 2005 2004 .. .. .. .. ..
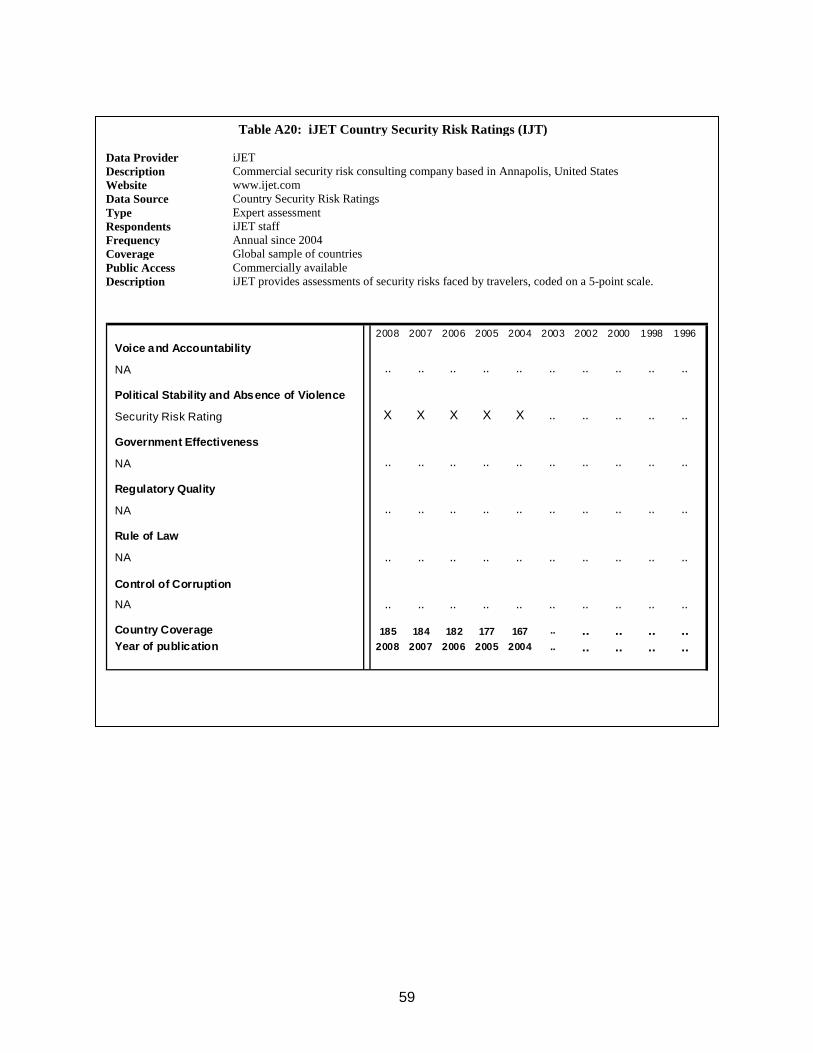
59
Table A20: iJET Country Security Risk Ratings (IJT)
Data Provider iJET Description Commercial security risk consulting company based in Annapolis, United States Website www.ijet.com Data Source Country Security Risk Ratings Type Expert assessment Respondents iJET staff Frequency Annual since 2004 Coverage Global sample of countries Public Access Commercially available Description iJET provides assessments of security risks faced by travelers, coded on a 5-point scale.
2008 2007 2006 2005 2004 2003 2002 2000 1998 1996Voice and Accountability
NA .. .. .. .. .. .. .. .. .. .. Political Stability and Absence of Violence
Security Risk Rating X X X X X .. .. .. .. ..
Government Effectiveness
NA .. .. .. .. .. .. .. .. .. ..
Regulatory Quality
NA .. .. .. .. .. .. .. .. .. ..
Rule of Law
NA .. .. .. .. .. .. .. .. .. ..
Control of Corruption
NA .. .. .. .. .. .. .. .. .. ..
Country Coverage 185 184 182 177 167 .. .. .. .. ..Year of publication 2008 2007 2006 2005 2004 .. .. .. .. ..
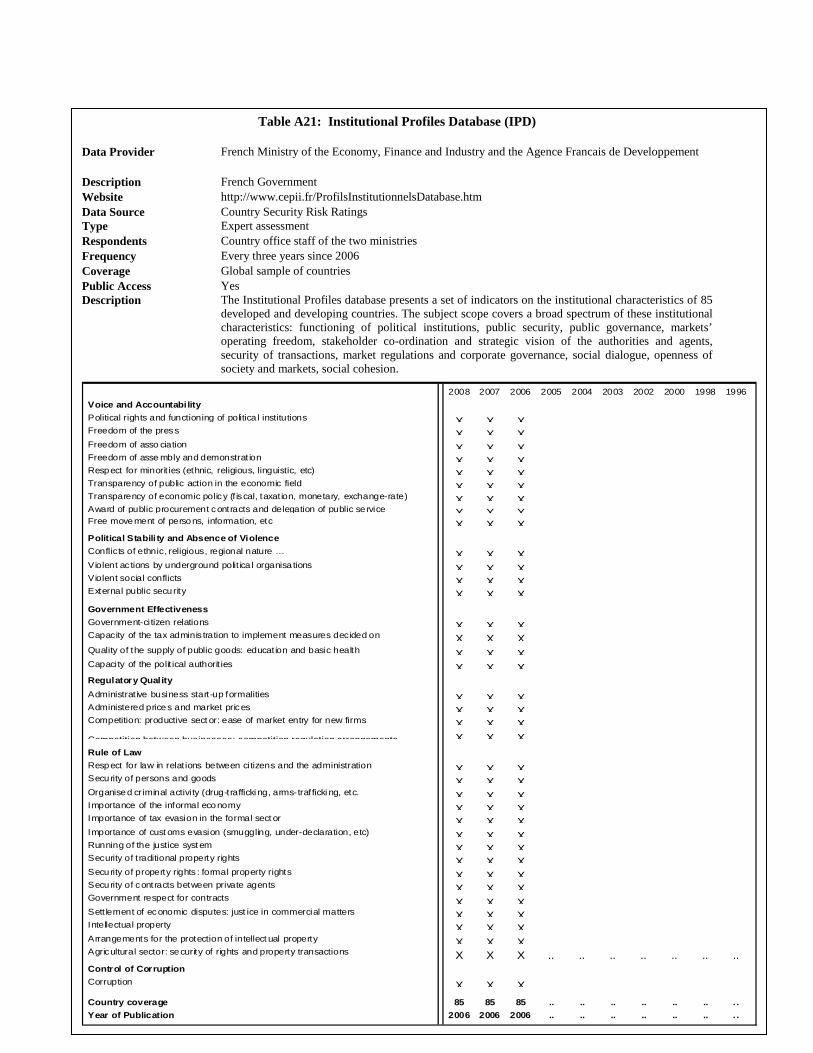
60
Table A21: Institutional Profiles Database (IPD)
Data Provider French Ministry of the Economy, Finance and Industry and the Agence Francais de Developpement
Description French Government Website http://www.cepii.fr/ProfilsInstitutionnelsDatabase.htm Data Source Country Security Risk Ratings Type Expert assessment Respondents Country office staff of the two ministries Frequency Every three years since 2006 Coverage Global sample of countries Public Access Yes Description The Institutional Profiles database presents a set of indicators on the institutional characteristics of 85
developed and developing countries. The subject scope covers a broad spectrum of these institutional characteristics: functioning of political institutions, public security, public governance, markets’ operating freedom, stakeholder co-ordination and strategic vision of the authorities and agents, security of transactions, market regulations and corporate governance, social dialogue, openness of society and markets, social cohesion.
2008 2007 2006 2005 2004 2003 2002 2000 1998 1996Voice and AccountabilityPolitical rights and functioning of politica l institutions X X X .. .. .. .. .. .. ..Freedom of the press X X X .. .. .. .. .. .. ..Freedom of asso ciation X X X .. .. .. .. .. .. ..Freedom of asse mbly and demonstrat ion X X X .. .. .. .. .. .. ..Respect for minorit ies (ethnic, religious, linguistic, etc) X X X .. .. .. .. .. .. ..Transparency of public action in the economic field X X X .. .. .. .. .. .. ..Transparency of economic policy (f iscal, taxat ion, monetary, exchange-rate) X X X .. .. .. .. .. .. ..Award of public procurement contracts and delegation of public se rvice X X X .. .. .. .. .. .. ..Free movement of persons, information, etc X X X .. .. .. .. .. .. ..Political Stabili ty and Absence of ViolenceConflicts of ethnic, religious, regional nature … X X X .. .. .. .. .. .. ..Violent ac tions by underground polit ica l organisa tions X X X .. .. .. .. .. .. ..Violent social conflicts X X X .. .. .. .. .. .. ..External public security X X X .. .. .. .. .. .. ..Government EffectivenessGovernment-citizen relations X X X .. .. .. .. .. .. ..Capacity of the tax adminis tration to implement measures decided on X X X .. .. .. .. .. .. ..Quality of the supply of public goods: educat ion and basic health X X X .. .. .. .. .. .. ..Capacity of the polit ical authorit ies X X X .. .. .. .. .. .. ..Regulatory QualityAdministrat ive business start-up formalities X X X .. .. .. .. .. .. ..Administered prices and market prices X X X .. .. .. .. .. .. ..Competition: productive sect or: ease of market entry for new firms X X X .. .. .. .. .. .. ..Competition between businesses: competition regulation arrangements X X X .. .. .. .. .. .. ..Rule of LawRespect for law in relat ions between citizens and the administration X X X .. .. .. .. .. .. ..Security of persons and goods X X X .. .. .. .. .. .. ..Organised cr iminal activity (drug-trafficki ng, arms-traf ficki ng, etc. X X X .. .. .. .. .. .. ..Importance of the informal economy X X X .. .. .. .. .. .. ..Importance of tax evasion in the formal sect or X X X .. .. .. .. .. .. ..Importance of cust oms evasion (smuggling, under-declaration, etc) X X X .. .. .. .. .. .. ..Running of the justice syst em X X X .. .. .. .. .. .. ..Security of t raditional property rights X X X .. .. .. .. .. .. ..Security of property rights : formal property rights X X X .. .. .. .. .. .. ..Security of contracts between private agents X X X .. .. .. .. .. .. ..Government respect for contracts X X X .. .. .. .. .. .. ..Sett lement of economic disputes: just ice in commercial matters X X X .. .. .. .. .. .. ..Intellectual property X X X .. .. .. .. .. .. ..Arrangements for the protection of intellect ual property X X X .. .. .. .. .. .. ..Agricultural sector: security of rights and property transactions X X X .. .. .. .. .. .. ..Control of CorruptionCorruption X X X .. .. .. .. .. .. ..Country coverage 85 85 85 .. .. .. .. .. .. . .Year of Publication 2006 2006 2006 .. .. .. .. .. .. . .
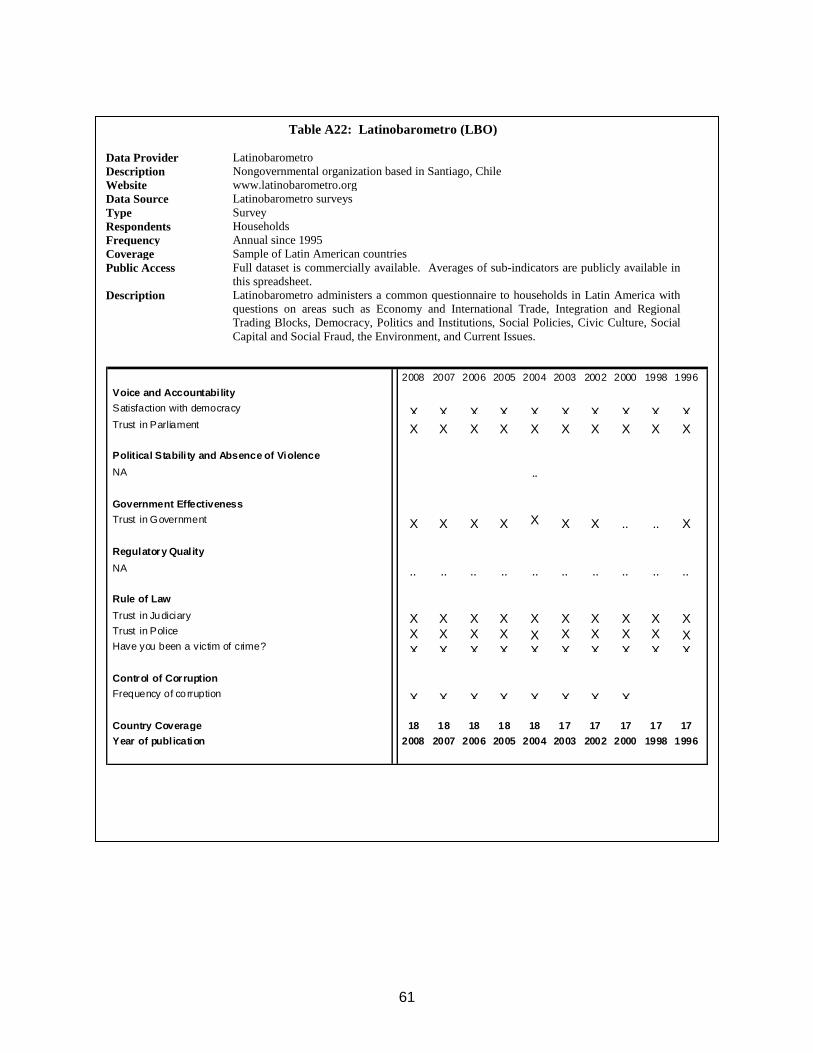
61
Table A22: Latinobarometro (LBO)
Data Provider Latinobarometro Description Nongovernmental organization based in Santiago, Chile Website www.latinobarometro.org Data Source Latinobarometro surveys Type Survey Respondents Households Frequency Annual since 1995 Coverage Sample of Latin American countries Public Access Full dataset is commercially available. Averages of sub-indicators are publicly available in
this spreadsheet. Description Latinobarometro administers a common questionnaire to households in Latin America with
questions on areas such as Economy and International Trade, Integration and Regional Trading Blocks, Democracy, Politics and Institutions, Social Policies, Civic Culture, Social Capital and Social Fraud, the Environment, and Current Issues.
2008 2007 2006 2005 2004 2003 2002 2000 1998 1996
Voice and AccountabilitySatisfaction with democracy X X X X X X X X X XTrust in Parliament X X X X X X X X X X
Political Stabili ty and Absence of ViolenceNA .. .. .. .. .. .. .. .. .. ..
Government EffectivenessTrust in Government X X X X X X X .. .. X
Regulatory QualityNA .. .. .. .. .. .. .. .. .. ..
Rule of LawTrust in Judiciary X X X X X X X X X XTrust in Police X X X X X X X X X XHave you been a victim of crime? X X X X X X X X X X
Control of CorruptionFrequency of co rruption X X X X X X X X .. ..
Country Coverage 18 18 18 18 18 17 17 17 17 17Year of publication 2008 2007 2006 2005 2004 2003 2002 2000 1998 1996
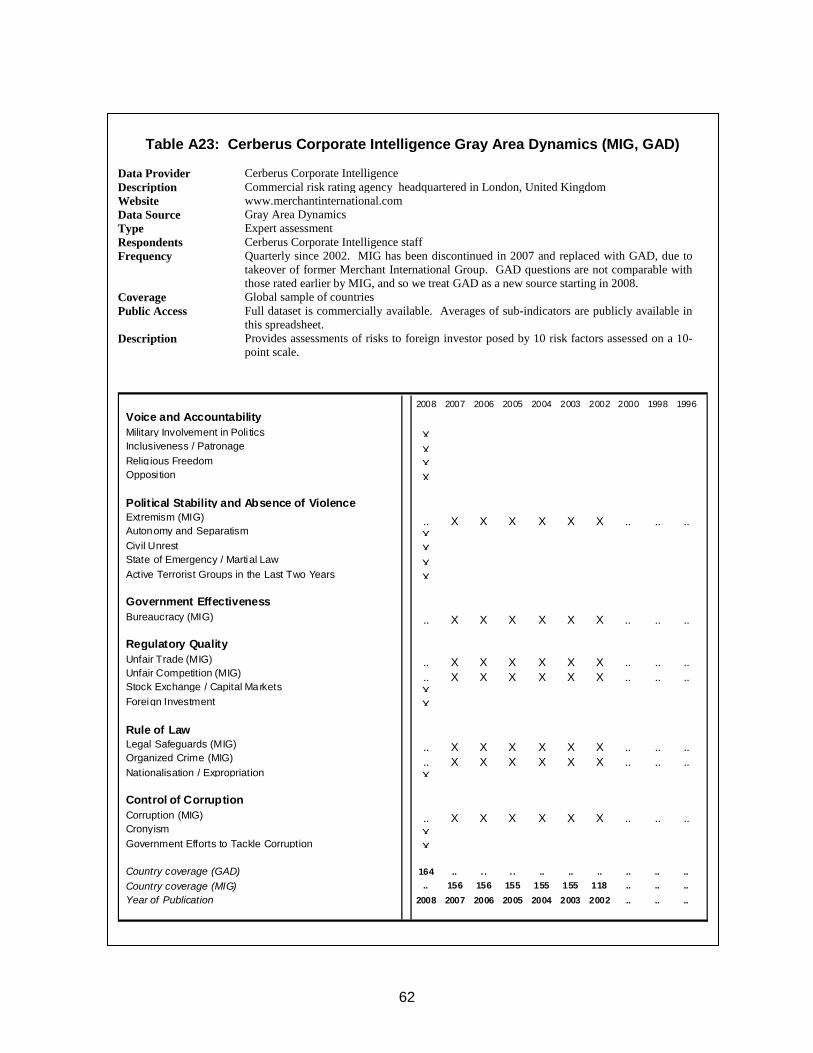
62
Table A23: Cerberus Corporate Intelligence Gray Area Dynamics (MIG, GAD)
Data Provider Cerberus Corporate Intelligence Description Commercial risk rating agency headquartered in London, United Kingdom Website www.merchantinternational.com Data Source Gray Area Dynamics Type Expert assessment Respondents Cerberus Corporate Intelligence staff Frequency Quarterly since 2002. MIG has been discontinued in 2007 and replaced with GAD, due to
takeover of former Merchant International Group. GAD questions are not comparable with those rated earlier by MIG, and so we treat GAD as a new source starting in 2008.
Coverage Global sample of countries Public Access Full dataset is commercially available. Averages of sub-indicators are publicly available in
this spreadsheet. Description Provides assessments of risks to foreign investor posed by 10 risk factors assessed on a 10-
point scale.
2008 2007 2006 2005 2004 2003 2002 2000 1998 1996Voice and AccountabilityMilitary Involvement in Poli tics X .. .. .. .. .. .. .. .. ..Inclusiveness / Patronage X .. .. .. .. .. .. .. .. ..Relig ious Freedom X .. .. .. .. .. .. .. .. ..Opposi tion X .. .. .. .. .. .. .. .. ..
Political Stability and Absence of ViolenceExtremism (MIG) .. X X X X X X .. .. ..Autonomy and Separatism X .. .. .. .. .. .. .. .. ..Civil Unrest X .. .. .. .. .. .. .. .. ..State of Emergency / Martial Law X .. .. .. .. .. .. .. .. ..Active Terrorist Groups in the Last Two Years X .. .. .. .. .. .. .. .. ..
Government EffectivenessBureaucracy (MIG) .. X X X X X X .. .. ..
Regulatory QualityUnfair Trade (MIG) .. X X X X X X .. .. ..Unfair Competition (MIG) .. X X X X X X .. .. ..Stock Exchange / Capital Markets X .. .. .. .. .. .. .. .. ..Foreign Investment X .. .. .. .. .. .. .. .. ..
Rule of LawLegal Safeguards (MIG) .. X X X X X X .. .. ..Organized Crime (MIG) .. X X X X X X .. .. ..Nationalisation / Expropriation X .. .. .. .. .. .. .. .. ..
Control of CorruptionCorruption (MIG) .. X X X X X X .. .. ..Cronyism X .. .. .. .. .. .. .. .. ..Government Efforts to Tackle Corruption X .. .. .. .. .. .. .. .. ..
Country coverage (GAD) 164 .. . . . . .. .. .. .. .. ..Country coverage (MIG) .. 156 156 155 155 155 118 .. .. ..Year of Publication 2008 2007 2006 2005 2004 2003 2002 .. .. ..
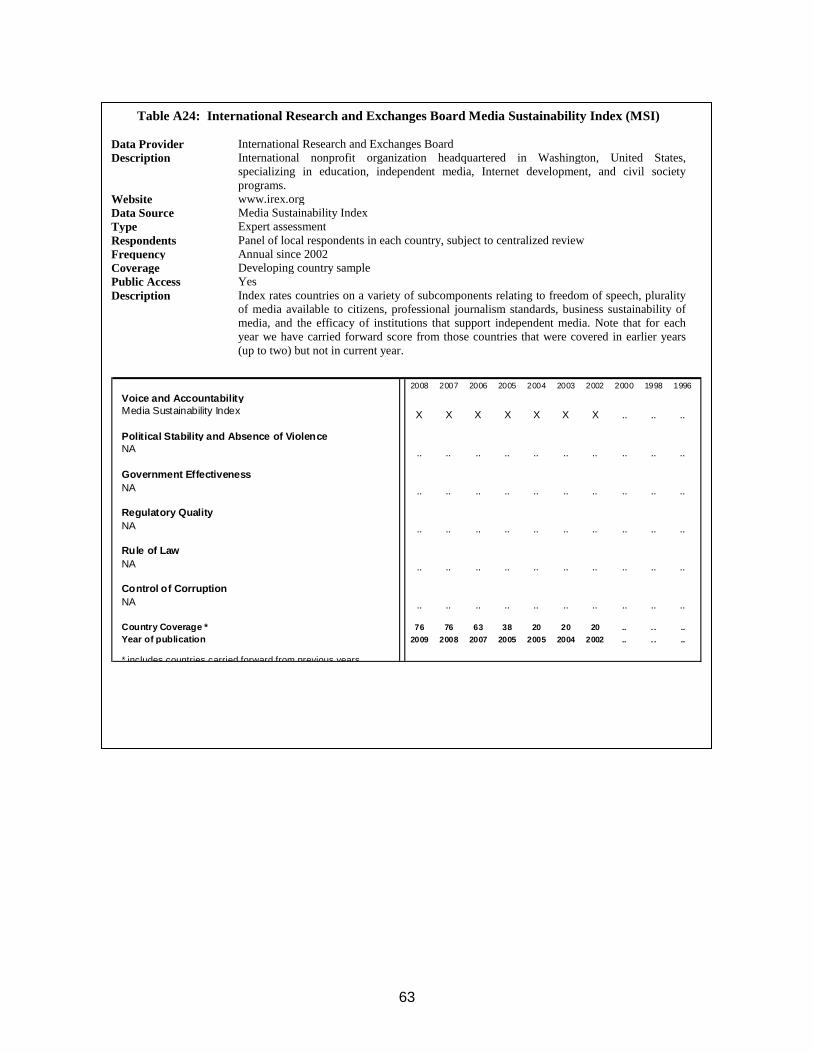
63
Table A24: International Research and Exchanges Board Media Sustainability Index (MSI)
Data Provider International Research and Exchanges Board Description International nonprofit organization headquartered in Washington, United States,
specializing in education, independent media, Internet development, and civil society programs.
Website www.irex.org Data Source Media Sustainability Index Type Expert assessment Respondents Panel of local respondents in each country, subject to centralized review Frequency Annual since 2002 Coverage Developing country sample Public Access Yes Description Index rates countries on a variety of subcomponents relating to freedom of speech, plurality
of media available to citizens, professional journalism standards, business sustainability of media, and the efficacy of institutions that support independent media. Note that for each year we have carried forward score from those countries that were covered in earlier years (up to two) but not in current year.
2008 2007 2006 2005 2004 2003 2002 2000 1998 1996Voice and AccountabilityMedia Sustainability Index X X X X X X X .. .. ..
Political Stability and Absence of ViolenceNA .. .. .. .. .. .. .. .. .. ..
Government EffectivenessNA .. .. .. .. .. .. .. .. .. ..
Regulatory QualityNA .. .. .. .. .. .. .. .. .. ..
Rule of LawNA .. .. .. .. .. .. .. .. .. ..
Control of CorruptionNA .. .. .. .. .. .. .. .. .. ..
Country Coverage * 76 76 63 38 20 20 20 .. . . ..Year of publication 2009 2008 2007 2005 2005 2004 2002 .. . . ..
* includes countries carried forward from previous years
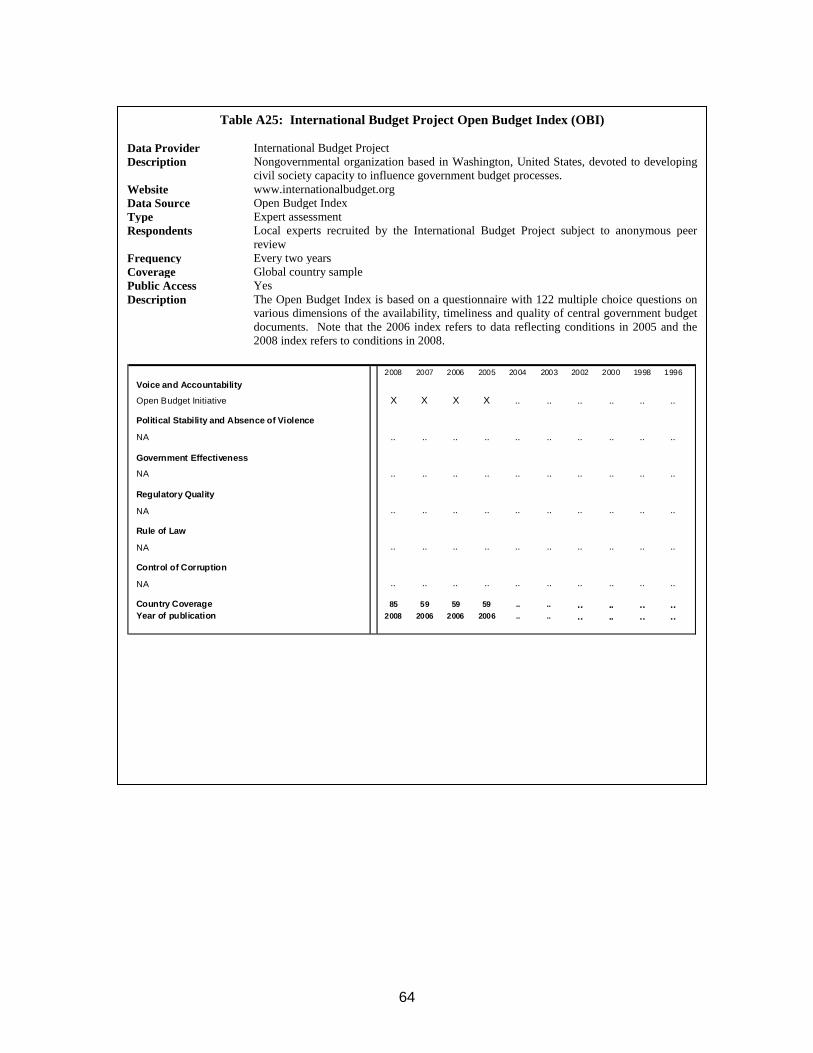
64
Table A25: International Budget Project Open Budget Index (OBI)
Data Provider International Budget Project Description Nongovernmental organization based in Washington, United States, devoted to developing
civil society capacity to influence government budget processes. Website www.internationalbudget.org Data Source Open Budget Index Type Expert assessment Respondents Local experts recruited by the International Budget Project subject to anonymous peer
review Frequency Every two years Coverage Global country sample Public Access Yes Description The Open Budget Index is based on a questionnaire with 122 multiple choice questions on
various dimensions of the availability, timeliness and quality of central government budget documents. Note that the 2006 index refers to data reflecting conditions in 2005 and the 2008 index refers to conditions in 2008.
2008 2007 2006 2005 2004 2003 2002 2000 1998 1996Voice and Accountability
Open Budget Initiative X X X X .. .. .. .. .. .. Political Stability and Absence of Violence
NA .. .. .. .. .. .. .. .. .. ..
Government Effectiveness
NA .. .. .. .. .. .. .. .. .. ..
Regulatory Quality
NA .. .. .. .. .. .. .. .. .. ..
Rule of Law
NA .. .. .. .. .. .. .. .. .. ..
Control of Corruption
NA .. .. .. .. .. .. .. .. .. ..
Country Coverage 85 59 59 59 .. .. .. .. .. ..Year of publication 2008 2006 2006 2006 .. .. .. .. .. ..
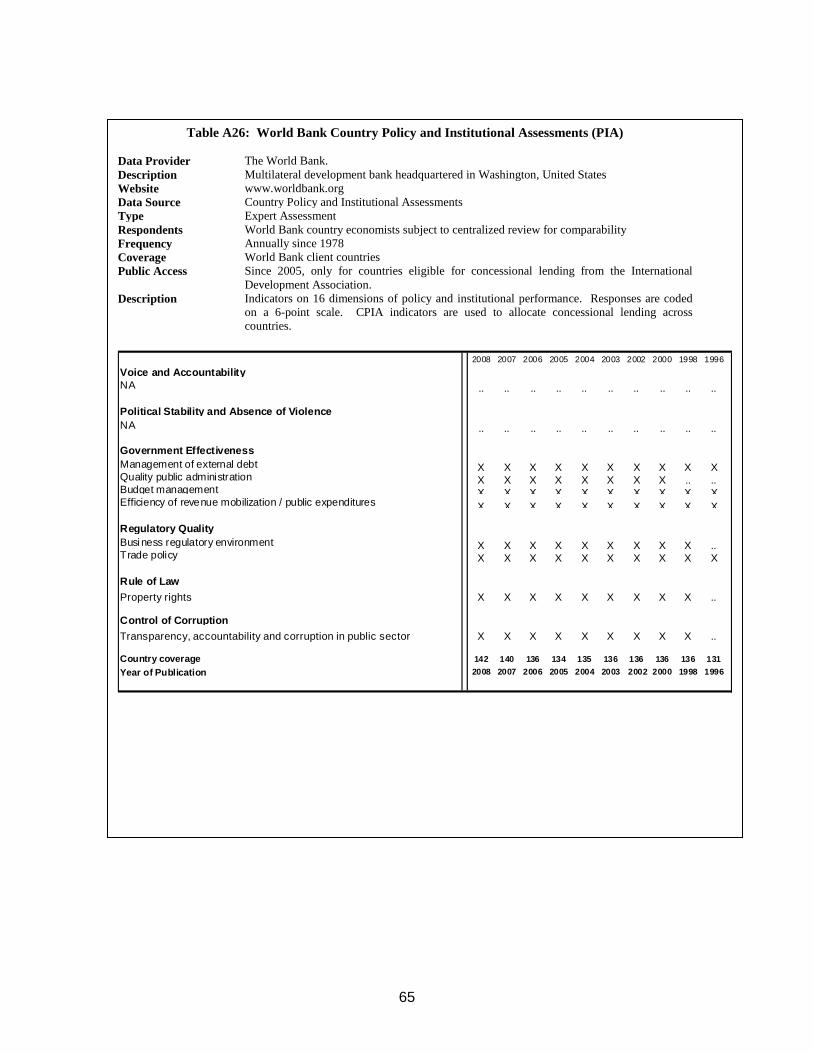
65
Table A26: World Bank Country Policy and Institutional Assessments (PIA)
Data Provider The World Bank. Description Multilateral development bank headquartered in Washington, United States Website www.worldbank.org Data Source Country Policy and Institutional Assessments Type Expert Assessment Respondents World Bank country economists subject to centralized review for comparability Frequency Annually since 1978 Coverage World Bank client countries Public Access Since 2005, only for countries eligible for concessional lending from the International
Development Association. Description Indicators on 16 dimensions of policy and institutional performance. Responses are coded
on a 6-point scale. CPIA indicators are used to allocate concessional lending across countries.
2008 2007 2006 2005 2004 2003 2002 2000 1998 1996
Voice and AccountabilityNA .. .. .. .. .. .. .. .. .. ..
Political Stability and Absence of ViolenceNA .. .. .. .. .. .. .. .. .. ..
Government EffectivenessManagement of external debt X X X X X X X X X XQuality public administration X X X X X X X X .. ..Budget management X X X X X X X X X XEfficiency of revenue mobilization / public expenditures X X X X X X X X X X
Regulatory QualityBusiness regulatory environment X X X X X X X X X ..Trade policy X X X X X X X X X X Rule of LawProperty rights X X X X X X X X X ..
Control of CorruptionTransparency, accountability and corruption in public sector X X X X X X X X X ..
Country coverage 142 140 136 134 135 136 136 136 136 131Year of Publication 2008 2007 2006 2005 2004 2003 2002 2000 1998 1996
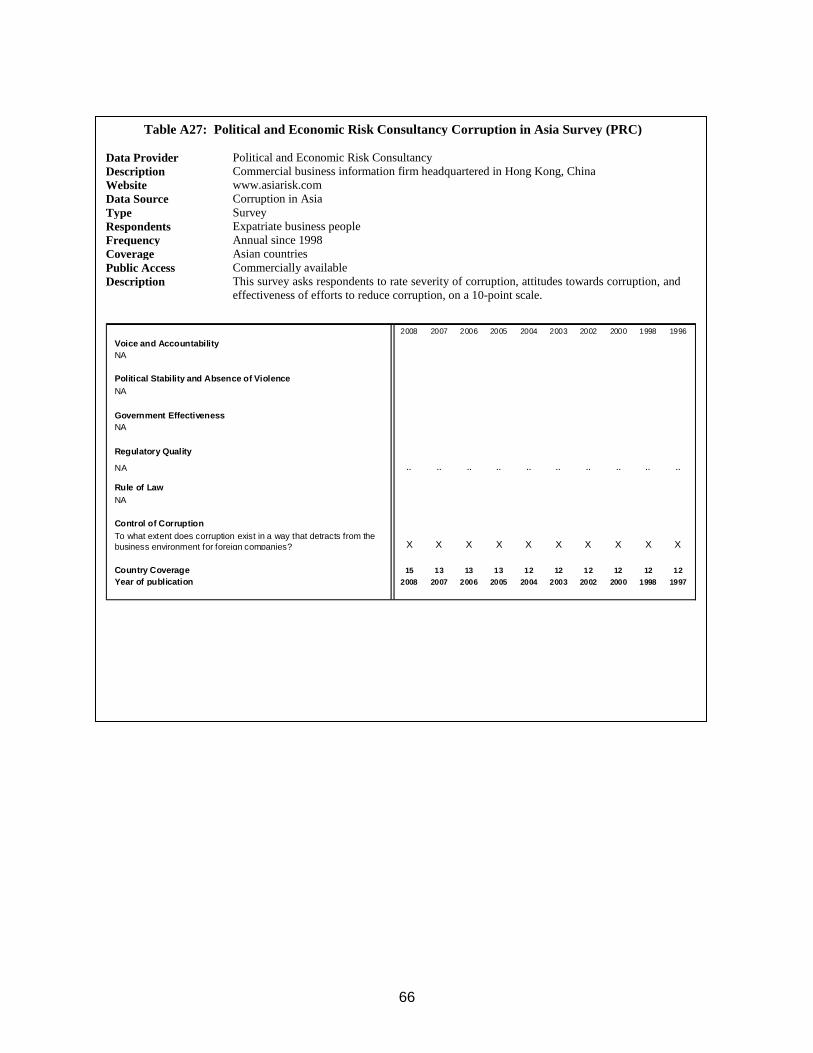
66
Table A27: Political and Economic Risk Consultancy Corruption in Asia Survey (PRC)
Data Provider Political and Economic Risk Consultancy Description Commercial business information firm headquartered in Hong Kong, China Website www.asiarisk.com Data Source Corruption in Asia Type Survey Respondents Expatriate business people Frequency Annual since 1998 Coverage Asian countries Public Access Commercially available Description This survey asks respondents to rate severity of corruption, attitudes towards corruption, and
effectiveness of efforts to reduce corruption, on a 10-point scale.
2008 2007 2006 2005 2004 2003 2002 2000 1998 1996Voice and AccountabilityNA .. .. .. .. .. .. .. .. .. ..
Political Stability and Absence of ViolenceNA .. .. .. .. .. .. .. .. .. ..
Government EffectivenessNA .. .. .. .. .. .. .. .. .. ..
Regulatory Quality
NA .. .. .. .. .. .. .. .. .. ..
Rule of LawNA .. .. .. .. .. .. .. .. .. ..
Control of CorruptionTo what extent does corruption exist in a way that detracts from the business environment for foreign companies? X X X X X X X X X X
Country Coverage 15 13 13 13 12 12 12 12 12 12Year of publication 2008 2007 2006 2005 2004 2003 2002 2000 1998 1997
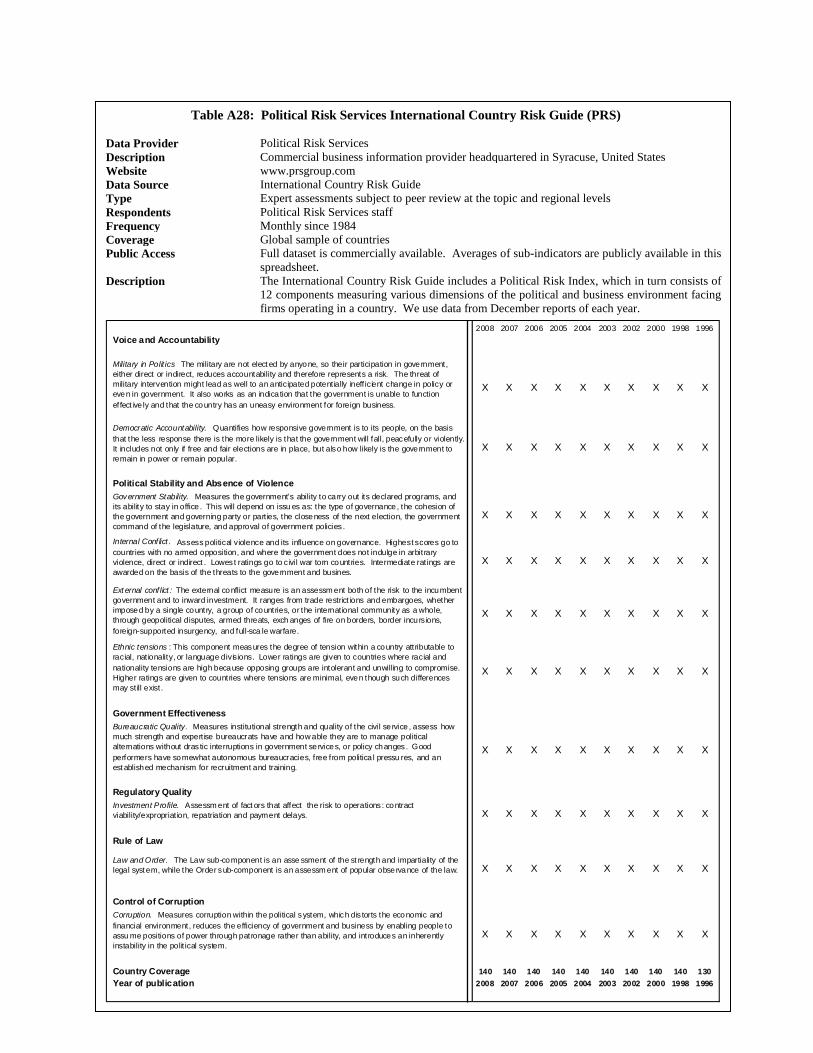
67
Table A28: Political Risk Services International Country Risk Guide (PRS)
Data Provider Political Risk Services Description Commercial business information provider headquartered in Syracuse, United States Website www.prsgroup.com Data Source International Country Risk Guide Type Expert assessments subject to peer review at the topic and regional levels Respondents Political Risk Services staff Frequency Monthly since 1984 Coverage Global sample of countries Public Access Full dataset is commercially available. Averages of sub-indicators are publicly available in this
spreadsheet. Description The International Country Risk Guide includes a Political Risk Index, which in turn consists of
12 components measuring various dimensions of the political and business environment facing firms operating in a country. We use data from December reports of each year.
2008 2007 2006 2005 2004 2003 2002 2000 1998 1996Voice and Accountability
Military in Polit ics The military are not elect ed by anyone, so their participation in government, either direct or indirect, reduces accountability and therefore represents a risk. The threat of military intervention might lead as well to an anticipated potent ially ineff icient change in policy or even in government. It also works as an indica tion that the government is unable to function effect ive ly and that the country has an uneasy environment for foreign business.
X X X X X X X X X X
Democratic Accountability. Quantifies how responsive government is to its people, on the basis that the less response there is the more likely is that the government will fall, peacefully or violently. It includes not only if free and fair elections are in place, but also how likely is the government to remain in power or remain popular.
X X X X X X X X X X
Political Stability and Absence of ViolenceGovernment Stability. Measures the government’s ability to ca rry out its declared programs, and its ability to stay in office . This will depend on issu es as: the type of governance , the cohesion of the government and governing party or part ies, the closeness of the next election, the government command of the legislature, and approval of government policies .
X X X X X X X X X X
Internal Conf lict . Assess political violence and its influence on governance. Highest scores go to countries with no armed opposition, and where the government does not indulge in arbit rary violence, direct or indirect . Lowes t ratings go to c ivi l war torn countries. Intermediate rat ings are awarded on the basis of the threats to the government and busines.
X X X X X X X X X X
Ext ernal conf lict : The external conflict measure is an assessm ent both of the risk to the incumbent government and to inward investment. It ranges from trade restrict ions and embargoes, whether imposed by a single country, a group of countries, or the internat ional community as a whole, through geopolitical disputes, armed threats, exch anges of fire on borders, border incurs ions, foreign-supported insurgency, and full-sca le warfare.
X X X X X X X X X X
Ethnic tensions : This component measures the degree of tension within a country attributable to racial, nat ionality, or language divisions. Lower ratings are given to countries where racial and nationality tensions are high because opposing groups are intolerant and unwilling to compromise. Higher ratings are given to countries where tensions are minimal, even though such differences may st ill exist .
X X X X X X X X X X
Government EffectivenessBureaucratic Quality. Measures institutional strength and quality of the civi l se rvice , assess how much strength and expert ise bureaucrats have and how able they are to manage political alternations without dras tic interruptions in government se rvices, or policy changes . Good performers have somewhat autonomous bureaucracies, f ree from politica l pressu res, and an est ablished mechanism for recruitment and training.
X X X X X X X X X X
Regulatory QualityInvestment Profile. Assessm ent of fact ors that affect the risk to operations : contract viability/expropriat ion, repatriation and payment delays. X X X X X X X X X X
Rule of Law
Law and Order. The Law sub-component is an asse ssment of the st rength and impartiality of the legal syst em, while the Order sub-component is an assessm ent of popular observance of the law. X X X X X X X X X X
Control of CorruptionCorruption. Measures corruption within the political system, which dis torts the economic and financial environment, reduces the efficiency of government and business by enabling people to assu me positions of power through patronage rather than ability, and introduces an inherently instability in the polit ical system.
X X X X X X X X X X
Country Coverage 140 140 140 140 140 140 140 140 140 130Year of publication 2008 2007 2006 2005 2004 2003 2002 2000 1998 1996
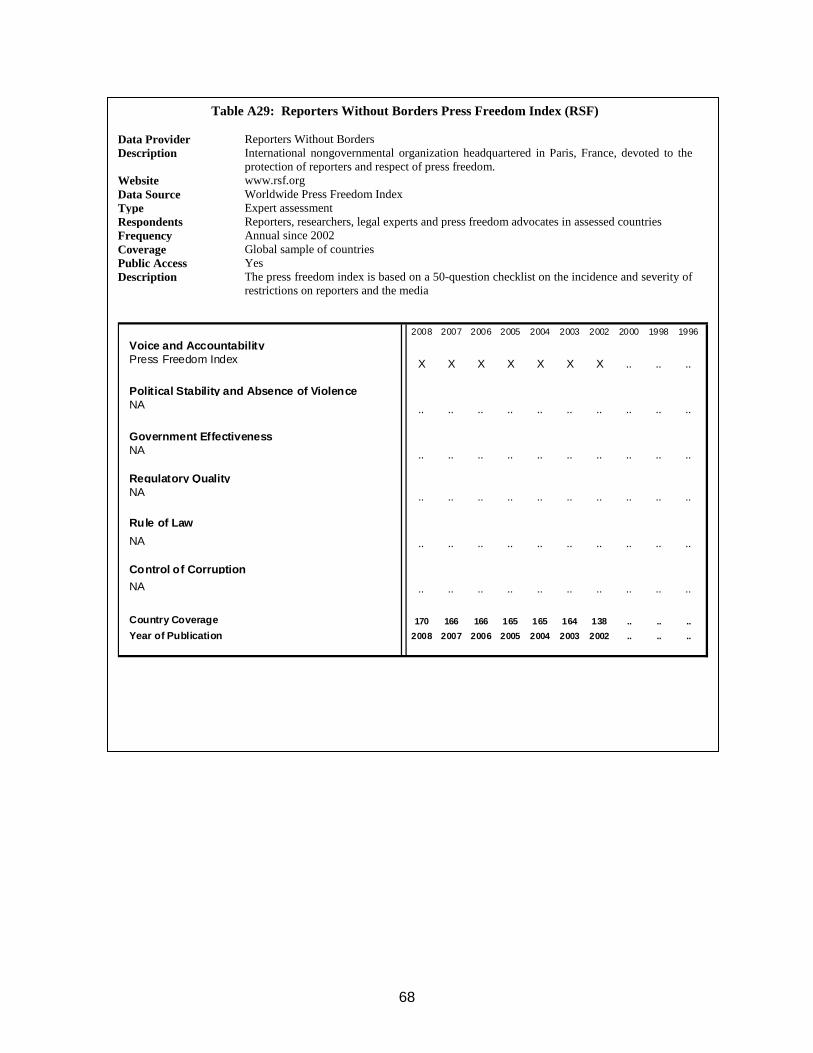
68
Table A29: Reporters Without Borders Press Freedom Index (RSF)
Data Provider Reporters Without Borders Description International nongovernmental organization headquartered in Paris, France, devoted to the
protection of reporters and respect of press freedom. Website www.rsf.org Data Source Worldwide Press Freedom Index Type Expert assessment Respondents Reporters, researchers, legal experts and press freedom advocates in assessed countries Frequency Annual since 2002 Coverage Global sample of countries Public Access Yes Description The press freedom index is based on a 50-question checklist on the incidence and severity of
restrictions on reporters and the media
2008 2007 2006 2005 2004 2003 2002 2000 1998 1996Voice and AccountabilityPress Freedom Index X X X X X X X .. .. ..
Political Stability and Absence of ViolenceNA .. .. .. .. .. .. .. .. .. ..
Government EffectivenessNA .. .. .. .. .. .. .. .. .. ..
Regulatory QualityNA .. .. .. .. .. .. .. .. .. ..
Rule of LawNA .. .. .. .. .. .. .. .. .. ..
Control of CorruptionNA .. .. .. .. .. .. .. .. .. ..
Country Coverage 170 166 166 165 165 164 138 .. .. ..Year of Publication 2008 2007 2006 2005 2004 2003 2002 .. .. ..
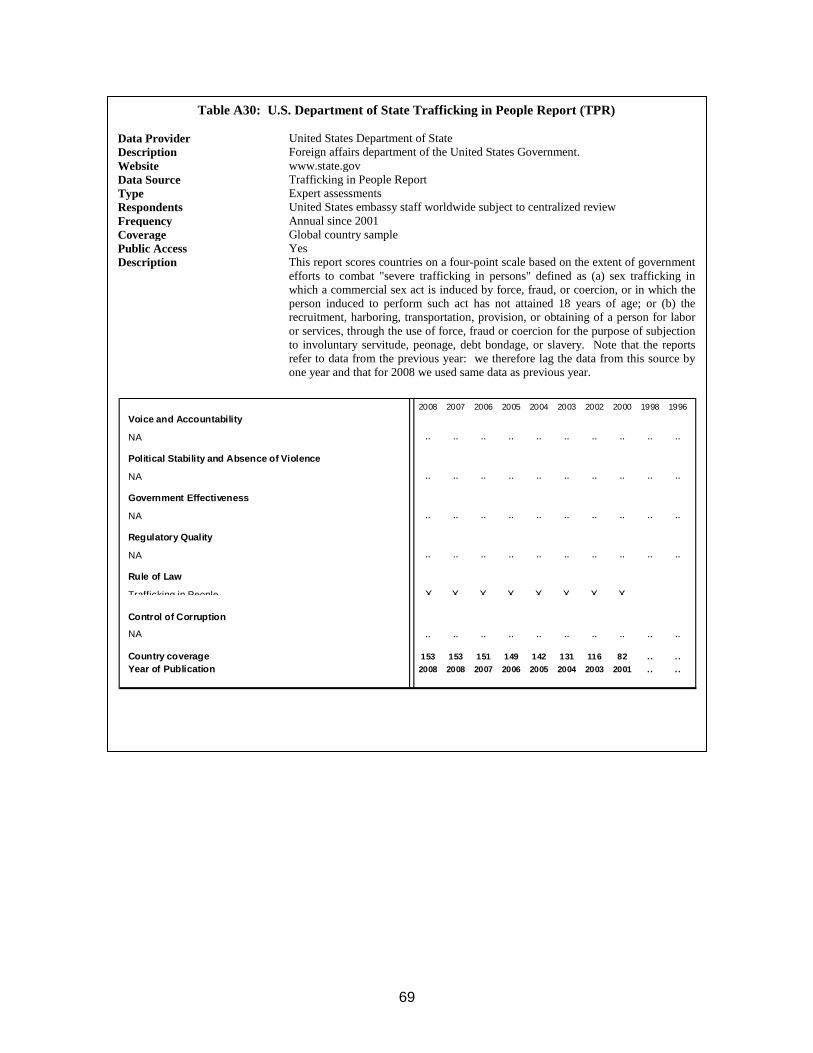
69
Table A30: U.S. Department of State Trafficking in People Report (TPR)
Data Provider United States Department of State Description Foreign affairs department of the United States Government. Website www.state.gov Data Source Trafficking in People Report Type Expert assessments Respondents United States embassy staff worldwide subject to centralized review Frequency Annual since 2001 Coverage Global country sample Public Access Yes Description This report scores countries on a four-point scale based on the extent of government
efforts to combat "severe trafficking in persons" defined as (a) sex trafficking in which a commercial sex act is induced by force, fraud, or coercion, or in which the person induced to perform such act has not attained 18 years of age; or (b) the recruitment, harboring, transportation, provision, or obtaining of a person for labor or services, through the use of force, fraud or coercion for the purpose of subjection to involuntary servitude, peonage, debt bondage, or slavery. Note that the reports refer to data from the previous year: we therefore lag the data from this source by one year and that for 2008 we used same data as previous year.
2008 2007 2006 2005 2004 2003 2002 2000 1998 1996Voice and Accountability
NA .. .. .. .. .. .. .. .. .. ..
Political Stability and Absence of Violence
NA .. .. .. .. .. .. .. .. .. ..
Government Effectiveness
NA .. .. .. .. .. .. .. .. .. ..
Regulatory Quality
NA .. .. .. .. .. .. .. .. .. ..
Rule of Law
Trafficking in People X X X X X X X X .. ..
Control of Corruption
NA .. .. .. .. .. .. .. .. .. ..
Country coverage 153 153 151 149 142 131 116 82 .. . .Year of Publication 2008 2008 2007 2006 2005 2004 2003 2001 .. . .
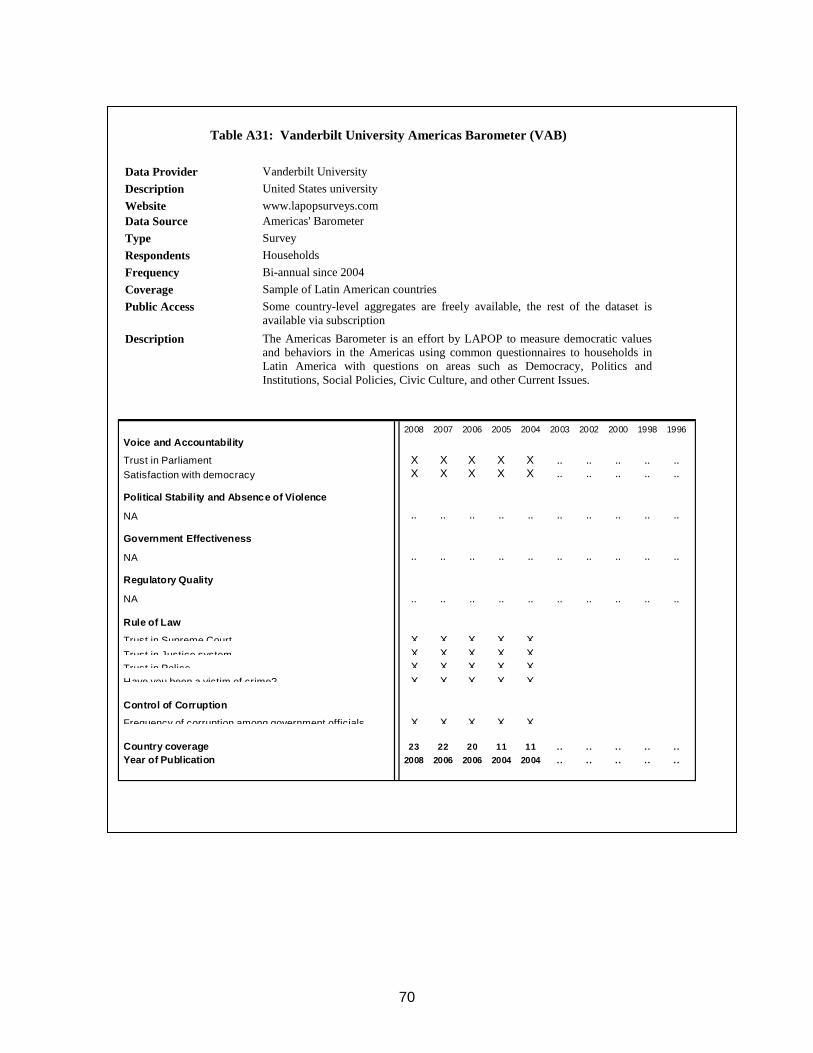
70
Table A31: Vanderbilt University Americas Barometer (VAB)
Data Provider Vanderbilt University Description United States university Website www.lapopsurveys.com Data Source Americas' Barometer Type Survey Respondents Households Frequency Bi-annual since 2004 Coverage Sample of Latin American countries Public Access Some country-level aggregates are freely available, the rest of the dataset is
available via subscription Description The Americas Barometer is an effort by LAPOP to measure democratic values
and behaviors in the Americas using common questionnaires to households in Latin America with questions on areas such as Democracy, Politics and Institutions, Social Policies, Civic Culture, and other Current Issues.
2008 2007 2006 2005 2004 2003 2002 2000 1998 1996
Voice and Accountability
Trust in Parliament X X X X X .. .. .. .. ..Satisfaction with democracy X X X X X .. .. .. .. ..
Political Stability and Absence of Violence
NA .. .. .. .. .. .. .. .. .. ..
Government Effectiveness
NA .. .. .. .. .. .. .. .. .. ..
Regulatory Quality
NA .. .. .. .. .. .. .. .. .. ..
Rule of Law
Trust in Supreme Court X X X X X .. .. .. .. ..Trust in Justice system X X X X X .. .. .. .. ..Trust in Police X X X X X .. .. .. .. ..Have you been a victim of crime? X X X X X .. .. .. .. ..
Control of Corruption
Frequency of corruption among government officials X X X X X .. .. .. .. ..
Country coverage 23 22 20 11 11 .. . . . . . . . .Year of Publication 2008 2006 2006 2004 2004 .. . . . . . . . .
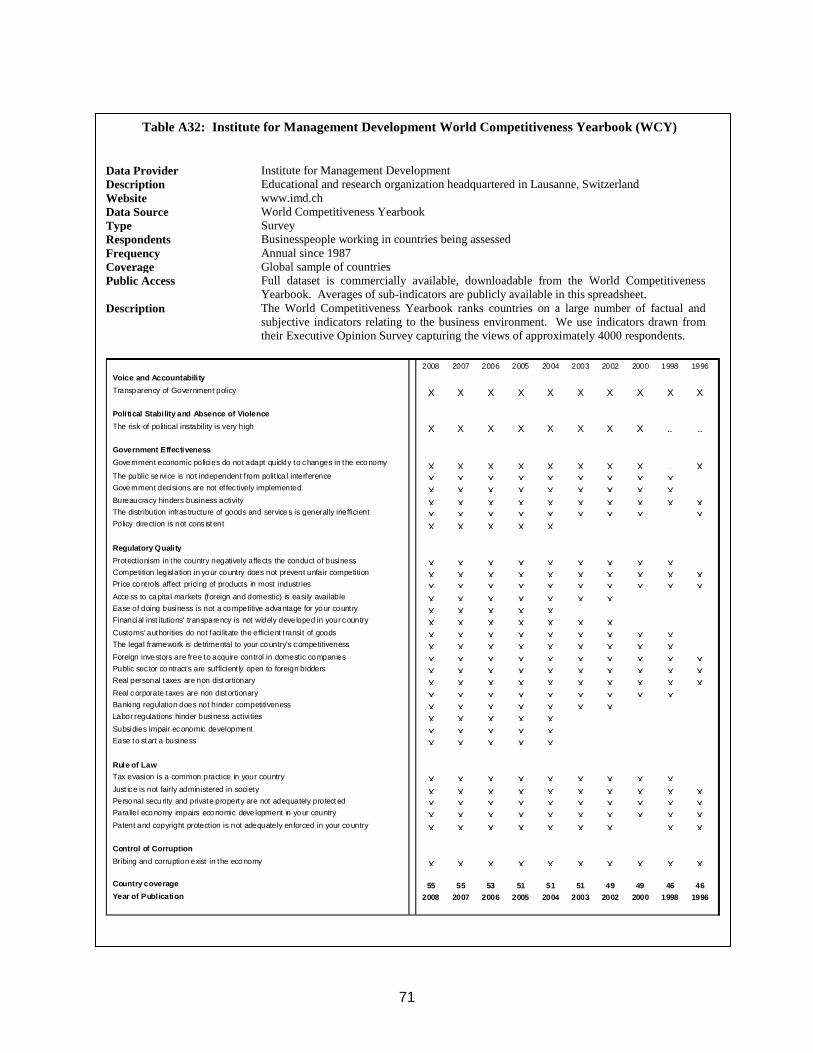
71
Table A32: Institute for Management Development World Competitiveness Yearbook (WCY)
Data Provider Institute for Management Development Description Educational and research organization headquartered in Lausanne, Switzerland Website www.imd.ch Data Source World Competitiveness Yearbook Type Survey Respondents Businesspeople working in countries being assessed Frequency Annual since 1987 Coverage Global sample of countries Public Access Full dataset is commercially available, downloadable from the World Competitiveness
Yearbook. Averages of sub-indicators are publicly available in this spreadsheet. Description The World Competitiveness Yearbook ranks countries on a large number of factual and
subjective indicators relating to the business environment. We use indicators drawn from their Executive Opinion Survey capturing the views of approximately 4000 respondents.
2008 2007 2006 2005 2004 2003 2002 2000 1998 1996Voice and Accountabili tyTransparency of Government policy X X X X X X X X X X
Political Stability and Absence of ViolenceThe risk of political instability is very high X X X X X X X X .. ..
Government EffectivenessGovernment economic policies do not adapt quickl y to changes in the economy X X X X X X X X .. XThe public se rvice is not independent f rom polit ica l interference X X X X X X X X X ..Government decisions are not ef fec tively implemented X X X X X X X X X ..Bureaucracy hinders business activity X X X X X X X X X XThe distribution infras tructure of goods and services is generally inefficient X X X X X X X X .. XPolicy direction is not cons ist ent X X X X X .. .. .. .. ..
Regulatory QualityProtectionism in the country negatively affects the conduct of business X X X X X X X X X ..Competition legislation in your country does not prevent unfair competition X X X X X X X X X XPrice controls affect pricing of products in most industries X X X X X X X X X XAcce ss to capital markets (foreign and domestic) is easily available X X X X X X X .. .. ..Ease of doing business is not a competitive advantage for your country X X X X X .. .. .. .. ..Financial inst itutions' transparency is not widely deve loped in your country X X X X X X X .. .. ..Customs' authorities do not facilitate the efficient t ransit of goods X X X X X X X X X ..The legal framework is detrimental to your country's competitiveness X X X X X X X X X ..Foreign investors are free to acquire control in domestic companies X X X X X X X X X XPublic sec tor contract s are sufficient ly open to foreign bidders X X X X X X X X X XReal personal taxes are non dist ortionary X X X X X X X X X XReal corporate taxes are non dist ortionary X X X X X X X X X ..Banking regulation does not hinder competitiveness X X X X X X X .. .. ..Labor regulations hinder business activities X X X X X .. .. .. .. ..Subsidies impair economic development X X X X X .. .. .. .. ..Ease to st art a business X X X X X .. .. .. .. ..
Rule of LawTax evasion is a common practice in your country X X X X X X X X X ..Just ice is not fairly administered in society X X X X X X X X X XPersonal security and private property are not adequately protect ed X X X X X X X X X XParallel economy impairs economic deve lopment in your country X X X X X X X X X XPatent and copyright protection is not adequately enforced in your country X X X X X X X .. X X
Control of CorruptionBribing and corruption exist in the economy X X X X X X X X X X
Country coverage 55 55 53 51 51 51 49 49 46 46Year of Publication 2008 2007 2006 2005 2004 2003 2002 2000 1998 1996
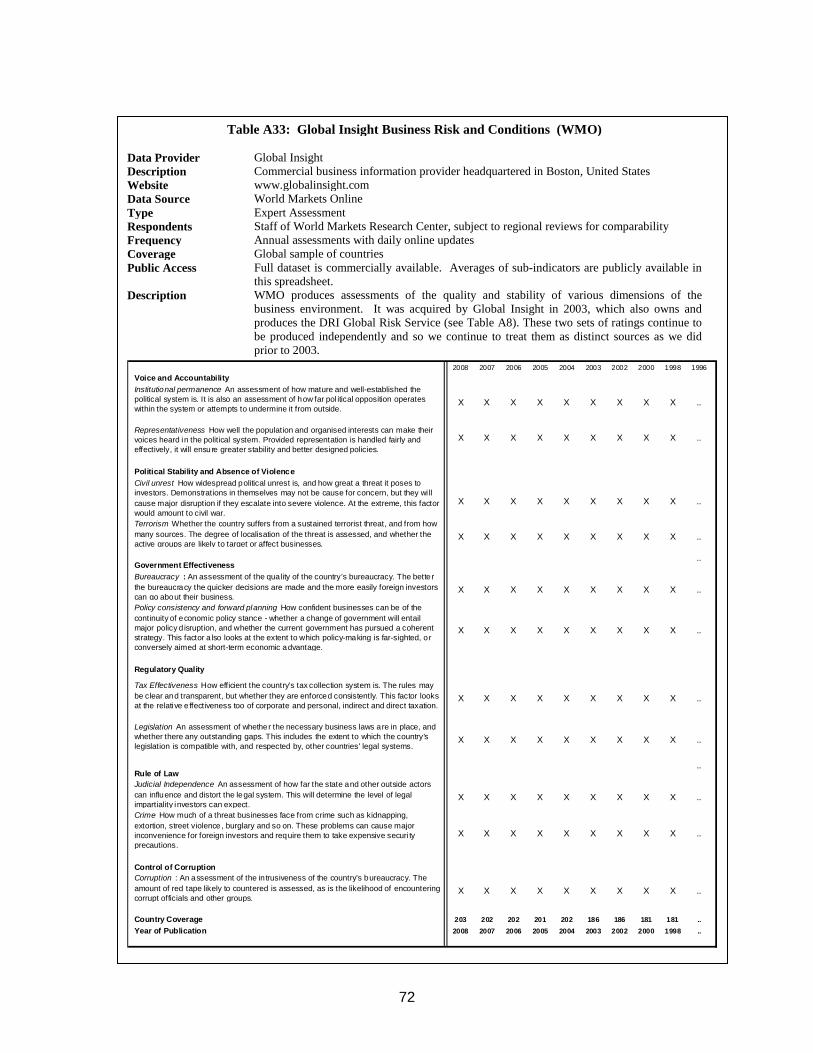
72
Table A33: Global Insight Business Risk and Conditions (WMO)
Data Provider Global Insight Description Commercial business information provider headquartered in Boston, United States Website www.globalinsight.com Data Source World Markets Online Type Expert Assessment Respondents Staff of World Markets Research Center, subject to regional reviews for comparability Frequency Annual assessments with daily online updates Coverage Global sample of countries Public Access Full dataset is commercially available. Averages of sub-indicators are publicly available in
this spreadsheet. Description WMO produces assessments of the quality and stability of various dimensions of the
business environment. It was acquired by Global Insight in 2003, which also owns and produces the DRI Global Risk Service (see Table A8). These two sets of ratings continue to be produced independently and so we continue to treat them as distinct sources as we did prior to 2003.
2008 2007 2006 2005 2004 2003 2002 2000 1998 1996
Voice and AccountabilityInstitutional permanence An assessment of how mature and well-established the political system is. It is also an assessment of how far pol itical opposition operates within the system or attempts to undermine it from outside.
X X X X X X X X X ..
Representativeness How well the population and organised interests can make their voices heard in the political system. Provided representation is handled fairly and effectively, it will ensure greater stability and better designed policies.
X X X X X X X X X ..
Political Stability and Absence of ViolenceCivil unrest How widespread political unrest is, and how great a threat it poses to investors. Demonstrations in themselves may not be cause for concern, but they wi ll cause major disruption if they escalate into severe violence. At the extreme, this factor would amount to civil war.
X X X X X X X X X ..
Terrorism Whether the country suffers from a sustained terrorist threat, and from how many sources. The degree of localisation of the threat is assessed, and whether the active groups are likely to target or affect businesses.
X X X X X X X X X ..
..Government EffectivenessBureaucracy : An assessment of the quality of the country’s bureaucracy. The better the bureaucracy the quicker decisions are made and the more easily foreign investors can go about their business.
X X X X X X X X X ..
Policy consistency and forward planning How confident businesses can be of the continuity of economic policy stance - whether a change of government will entail major policy d isruption, and whether the current government has pursued a coherent strategy. This factor a lso looks at the extent to which policy-making is far-sighted, or conversely aimed at short-term economic advantage.
X X X X X X X X X ..
Regulatory Quality
Tax Effectiveness How efficient the country’s tax collection system is. The rules may be clear and transparent, but whether they are enforced consistently. This factor looks at the relative effectiveness too of corporate and personal, indirect and direct taxation.
X X X X X X X X X ..
Legislation An assessment of whether the necessary business laws are in place, and whether there any outstanding gaps. This includes the extent to which the country's legislation is compatible with, and respected by, other countries' legal systems.
X X X X X X X X X ..
..Rule of LawJudicial Independence An assessment of how far the state and other outside actors can influence and distort the legal system. This will determine the level of legal impartiality investors can expect.
X X X X X X X X X ..
Crime How much of a threat businesses face from crime such as kidnapping, extortion, street violence, burglary and so on. These problems can cause major inconvenience for foreign investors and require them to take expensive securi ty precautions.
X X X X X X X X X ..
Control of CorruptionCorruption : An assessment of the in trusiveness of the country’s bureaucracy. The amount of red tape likely to countered is assessed, as is the likelihood of encountering corrupt officials and other groups.
X X X X X X X X X ..
Country Coverage 203 202 202 201 202 186 186 181 181 ..Year of Publication 2008 2007 2006 2005 2004 2003 2002 2000 1998 ..
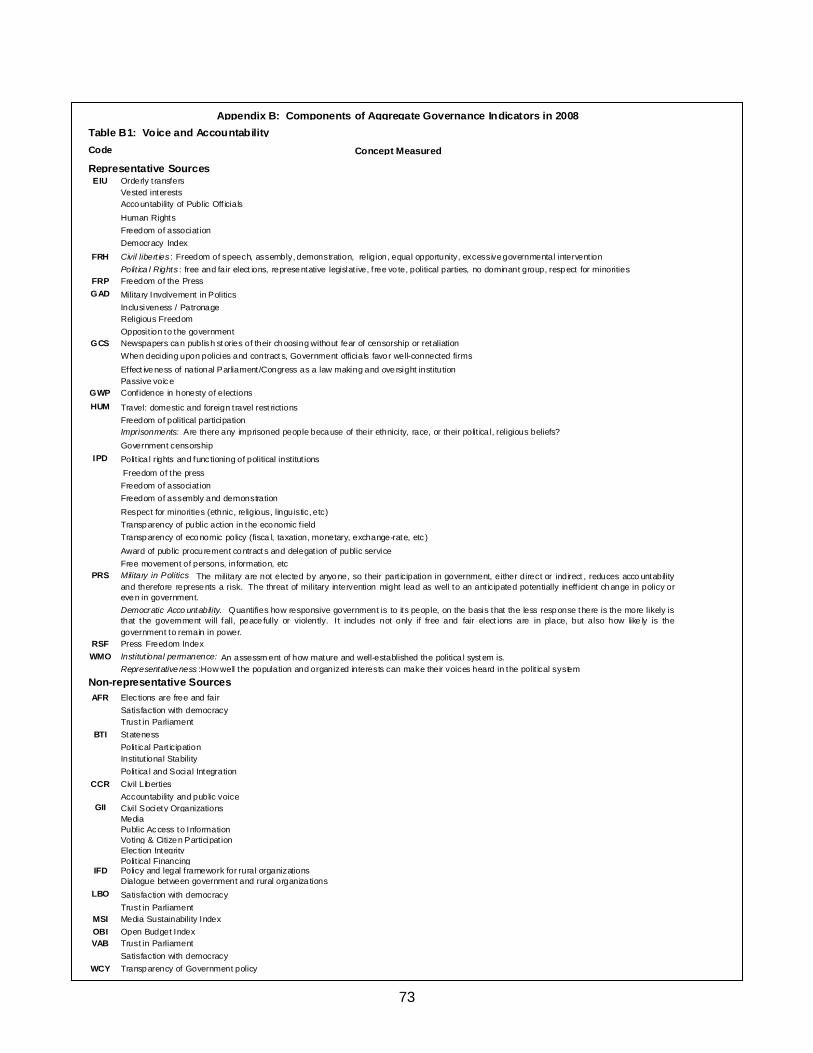
73
Appendix B: Components of Aggregate Governance Indicators in 2008 Table B1: Voice and Accountability
Code Concept Measured
Representative SourcesEIU Orderly t ransfers
Vested interestsAccountability of Public Off icialsHuman RightsFreedom of associat ionDemocracy Index
FRH Civil libert ies : Freedom of speech, assembly, demonstration, religion, equal opportunity, excessive governmental intervent ionPolit ica l Rights : free and fair elect ions, representative legislat ive, f ree vo te, political parties, no dominant group, respect for minorities
FRP Freedom of the PressGAD Military Involvement in Politics
Inclusiveness / PatronageReligious FreedomOpposit ion to the government
GCS Newspapers can publish st ories of their choosing without fear of censorship or retaliationWhen deciding upon policies and contract s, Government officials favor well-connected firmsEffect iveness of national Parliament/Congress as a law making and oversight institutionPassive voice
GWP Confidence in honesty of electionsHUM Travel: domestic and foreign travel rest rictions
Freedom of political participationImprisonments: Are there any imprisoned people because of their ethnicity, race, or their polit ica l, religious beliefs?Government censorship
IPD Polit ica l rights and func tioning of political institut ions Freedom of the pressFreedom of associat ionFreedom of assembly and demonstrationRespect for minorities (ethnic, religious, linguistic, etc)Transparency of public action in the economic f ieldTransparency of economic policy (fisca l, taxation, monetary, exchange-rate, etc )Award of public procurement contract s and delegat ion of public serviceFree movement of persons, information, etc
PRS Military in Politics The military are not elected by anyone, so their part icipation in government, either direct or indirect , reduces acco untabilityand therefore represents a risk. The threat of military intervention might lead as well to an ant icipated potentially ineff icient change in policy oreven in government. Democratic Acco untability. Quantifies how responsive government is to its people, on the basis that the less response there is the more likely isthat the government will fall, peace fully or violently. I t includes not only if free and fair elect ions are in place, but also how like ly is thegovernment to remain in power.
RSF Press Freedom IndexWMO Institut ional permanence: An assessm ent of how mature and well-established the politica l syst em is.
Representativeness :How well the population and organized interests can make their voices heard in the polit ical systemNon-representative SourcesAFR Elec tions are free and fair
Satisfaction with democracyTrust in Parliament
BTI StatenessPolit ical Part icipationInstitut ional StabilityPolit ica l and Social Integration
CCR Civil LibertiesAccountability and public voice
GII Civil Society OrganizationsMediaPublic Access to InformationVoting & Citizen Participat ionElec tion IntegrityPolit ical Financing
IFD Policy and legal f ramework for rural organizationsDialogue between government and rural organiza tions
LBO Satisfaction with democracyTrust in Parliament
MSI Media Sustainability IndexOBI Open Budget IndexVAB Trust in Parliament
Satisfaction with democracyWCY Transparency of Government policy
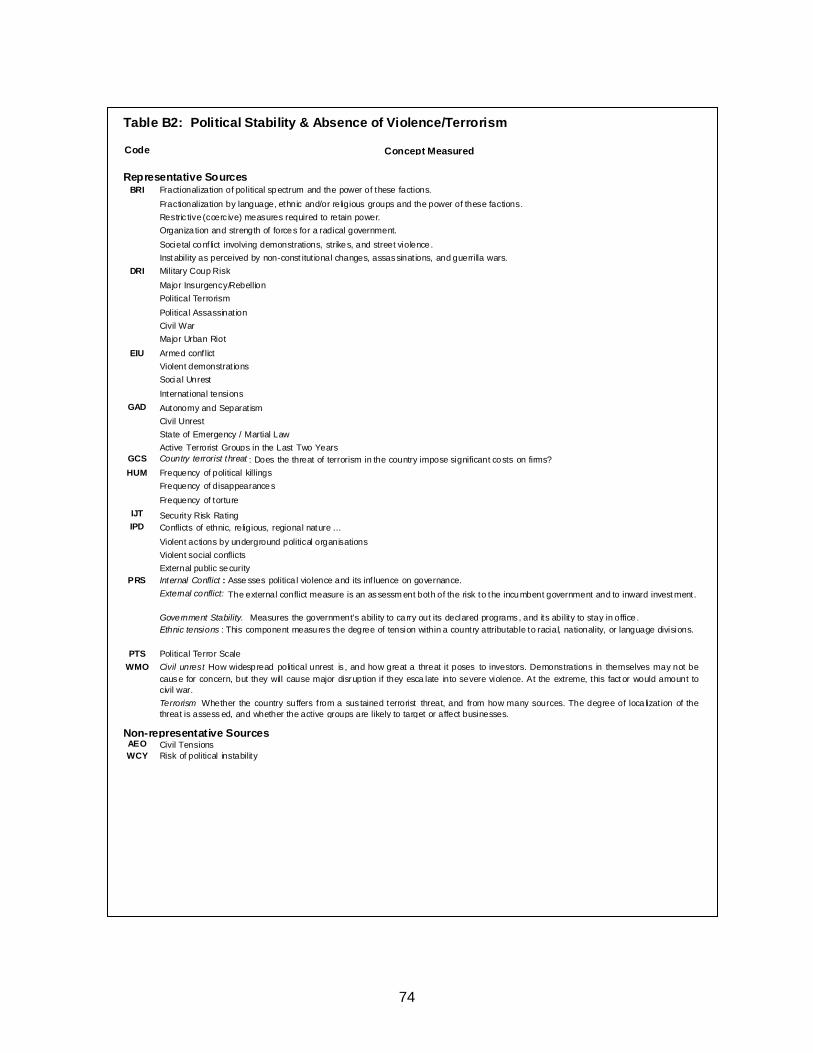
74
Table B2: Political Stability & Absence of Violence/Terrorism
Code Concept Measured
Representative SourcesBRI Fractionalization of political spectrum and the power of these factions.
Fractionalization by language, ethnic and/or religious groups and the power of these factions.Restric tive (coerc ive) measures required to retain power.Organiza tion and strength of forces for a radical government.
Societal conf lict involving demonstrations, strikes, and street violence .Inst ability as perceived by non-const itut ional changes, assassinat ions, and guerrilla wars.
DRI Military Coup RiskMajor Insurgency/RebellionPolitical TerrorismPolitical Assassinat ionCivil WarMajor Urban Riot
EIU Armed conf lictViolent demonstrat ionsSocial UnrestInternat ional tensions
GAD Autonomy and Separat ismCivil UnrestState of Emergency / Martial LawActive Terrorist Groups in the Last Two Years
GCS Country terrorist threat : Does the threat of terrorism in the country impose significant costs on firms?HUM Frequency of political killings
Frequency of disappearancesFrequency of torture
IJT Security Risk RatingIPD Conflicts of ethnic, religious, regional nature …
Violent actions by underground political organisations Violent social conflicts External public security
PRS Internal Conflict : Asse sses politica l violence and its inf luence on governance. External conflict: The external conflict measure is an assessm ent both of the risk to the incumbent government and to inward invest ment.
Government Stability. Measures the government’s ability to ca rry out its declared programs, and its ability to stay in office . Ethnic tensions : This component measures the degree of tension within a country attributable to racial, nationality, or language divisions.
PTS Political Terror ScaleWMO Civil unrest How widespread political unrest is , and how great a threat it poses to investors. Demonstrations in themselves may not be
cause for concern, but they will cause major disruption if they esca late into severe violence. At the extreme, this fact or would amount tocivil war.Terrorism Whether the country suffers from a sus tained terrorist threat, and from how many sources. The degree of loca lizat ion of thethreat is assess ed, and whether the active groups are likely to target or affect businesses.
Non-representative SourcesAEO Civil TensionsWCY Risk of political instability
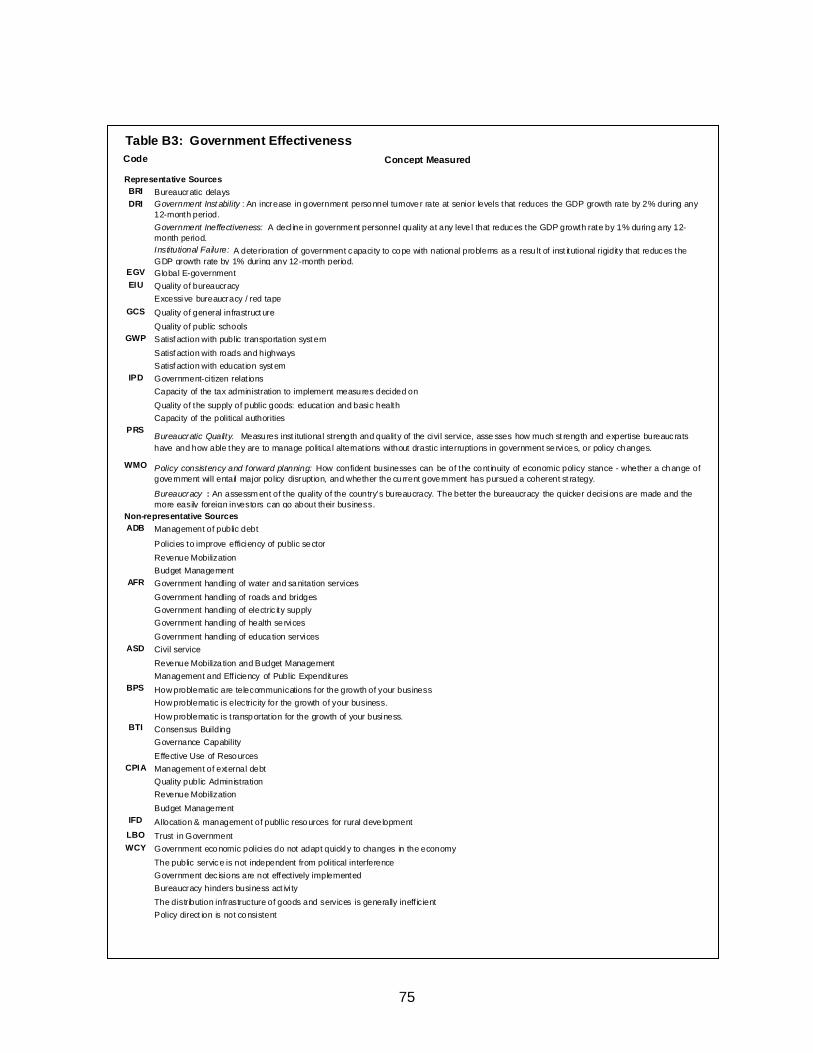
75
Table B3: Government Effectiveness Code Concept Measured
Representative SourcesBRI Bureaucratic delaysDRI Government Inst ability : An increase in government personnel turnover rate at senior levels that reduces the GDP growth rate by 2% during any
12-month period.Government Ineffectiveness: A decline in government personnel quality at any leve l that reduces the GDP growth rate by 1% during any 12-month period.Institutional Failure: A deterioration of government capacity to cope with national problems as a resu lt of inst itutional rigidity that reduces the GDP growth rate by 1% during any 12-month period.
EGV Global E-governmentEIU Quality of bureaucracy
Excessi ve bureaucracy / red tapeGCS Quality of general infrastruct ure
Quality of public schoolsGWP Satisf action with public transportation syst em
Satisf action with roads and highwaysSatisf action with educat ion syst em
IPD Government-citizen relat ionsCapacity of the tax administration to implement measures decided onQuality of the supply of public goods: educat ion and basic healthCapacity of the political authorities
PRSBureaucratic Quality. Measures inst itutional strength and quality of the civi l service, asse sses how much st rength and expertise bureaucrats have and how able they are to manage politica l alternat ions without drastic interruptions in government se rvices, or policy changes.
WMO Policy consistency and forward planning: How confident businesses can be of the cont inuity of economic policy stance - whether a change ofgovernment will entail major policy disrupt ion, and whether the cu rrent government has pursued a coherent st rategy.
Bureaucracy : An assessm ent of the quality of the country’s bureaucracy. The better the bureaucracy the quicker decisions are made and the more easily foreign investors can go about their business.
Non-representative SourcesADB Management of public debt
Policies to improve efficiency of public sectorRevenue Mobilization Budget Management
AFR Government handling of water and sanitation servicesGovernment handling of roads and bridgesGovernment handling of electric ity supplyGovernment handling of health se rvicesGovernment handling of educa tion services
ASD Civil serviceRevenue Mobiliza tion and Budget ManagementManagement and Eff iciency of Public Expenditures
BPS How problematic are telecommunications for the growth of your business How problematic is electricity for the growth of your business.How problematic is t ransportat ion for the growth of your business.
BTI Consensus BuildingGovernance CapabilityEffective Use of Resources
CPIA Management of external debtQuality public AdministrationRevenue Mobilization Budget Management
IFD Allocation & management of publlic resources for rural deve lopmentLBO Trust in GovernmentWCY Government economic policies do not adapt quickl y to changes in the economy
The public service is not independent from political interferenceGovernment dec isions are not effectively implementedBureaucracy hinders business act ivityThe distribution infrastructure of goods and services is generally ineff icientPolicy direct ion is not consistent
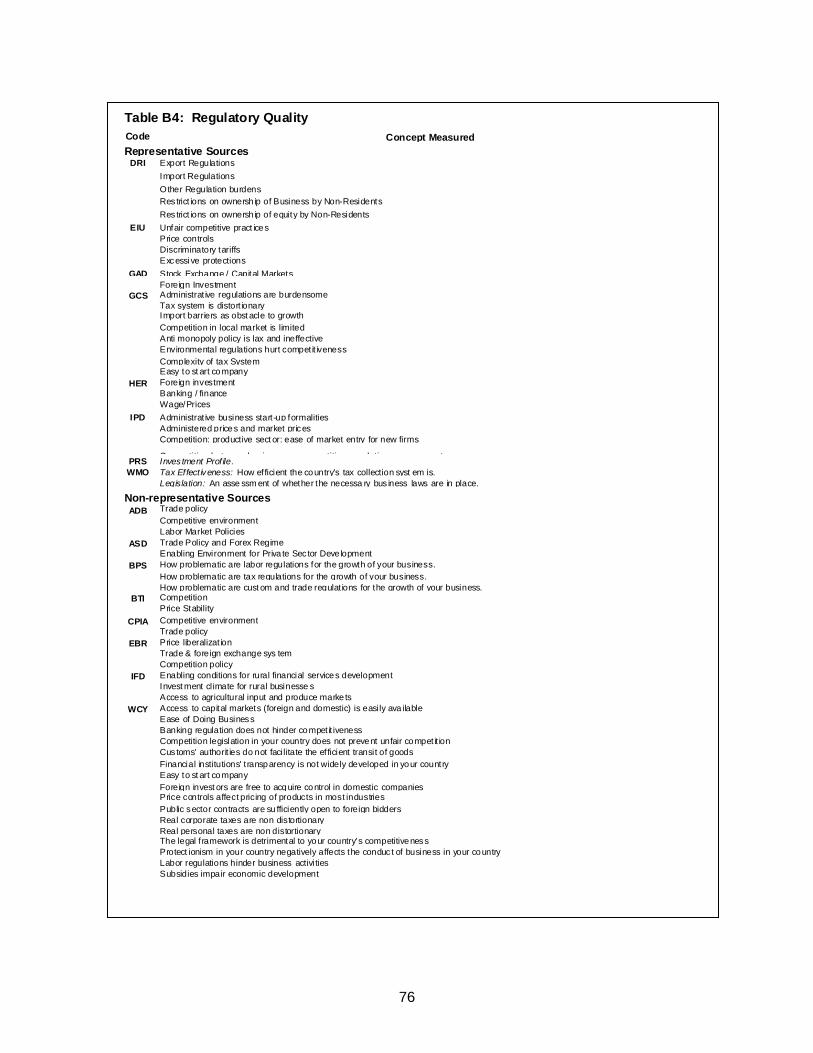
76
Table B4: Regulatory Quality Code Concept Measured
Representative SourcesDRI Export Regulations
Import Regulations Other Regulation burdensRes trict ions on ownersh ip of Business by Non-ResidentsRes trict ions on ownersh ip of equity by Non-Residents
EIU Unfair competitive pract icesPrice controlsDiscriminatory tariffsExcessi ve protections
GAD Stock Exchange / Capital MarketsForeign Investment
GCS Administrat ive regulations are burdensomeTax system is distort ionaryImport barriers as obst acle to growthCompetition in local market is limitedAnti monopoly policy is lax and ineffectiveEnvironmental regulations hurt competit ivenessComplexity of tax SystemEasy to st art company
HER Foreign investmentBanking / financeWage/Prices
IPD Administrat ive business start-up formalitiesAdministered prices and market pricesCompetition: productive sect or: ease of market entry for new firms
Competition between businesses: competition regulation arrangements PRS Inves tment Prof ile.WMO Tax Effect iveness: How efficient the country’s tax collection syst em is.
Legislation: An asse ssm ent of whether the necessa ry bus iness laws are in place.
Non-representative SourcesADB Trade policy
Competitive environmentLabor Market Policies
ASD Trade Policy and Forex RegimeEnabling Environment for Priva te Sec tor Deve lopment
BPS How problematic are labor regulations for the growth of your business.How problematic are tax regulations for the growth of your business.
How problematic are cust om and trade regulat ions for the growth of your business.BTI Competition
Price StabilityCPIA Competitive environment
Trade policyEBR Price liberalizat ion
Trade & foreign exchange sys tem Competition policy
IFD Enabling conditions for rural financial services developmentInvest ment cl imate for rural businesse sAccess to agricultural input and produce marke ts
WCY Access to capital markets (foreign and domestic) is easily ava ilableEase of Doing BusinessBanking regulation does not hinder competit ivenessCompetition legislation in your country does not prevent unfair competit ionCus toms' authorit ies do not facilitate the efficient transit of goodsFinancial institutions' t ransparency is not widely developed in your countryEasy to st art companyForeign invest ors are free to acquire control in domestic companiesPrice controls affect pricing of products in most industriesPublic sector contracts are su fficiently open to foreign biddersReal corporate taxes are non distortionaryReal personal taxes are non distortionaryThe legal f ramework is detrimental to your country's competitivenessProtect ionism in your country negatively affects the conduc t of business in your countryLabor regulations hinder business activitiesSubsidies impair economic development
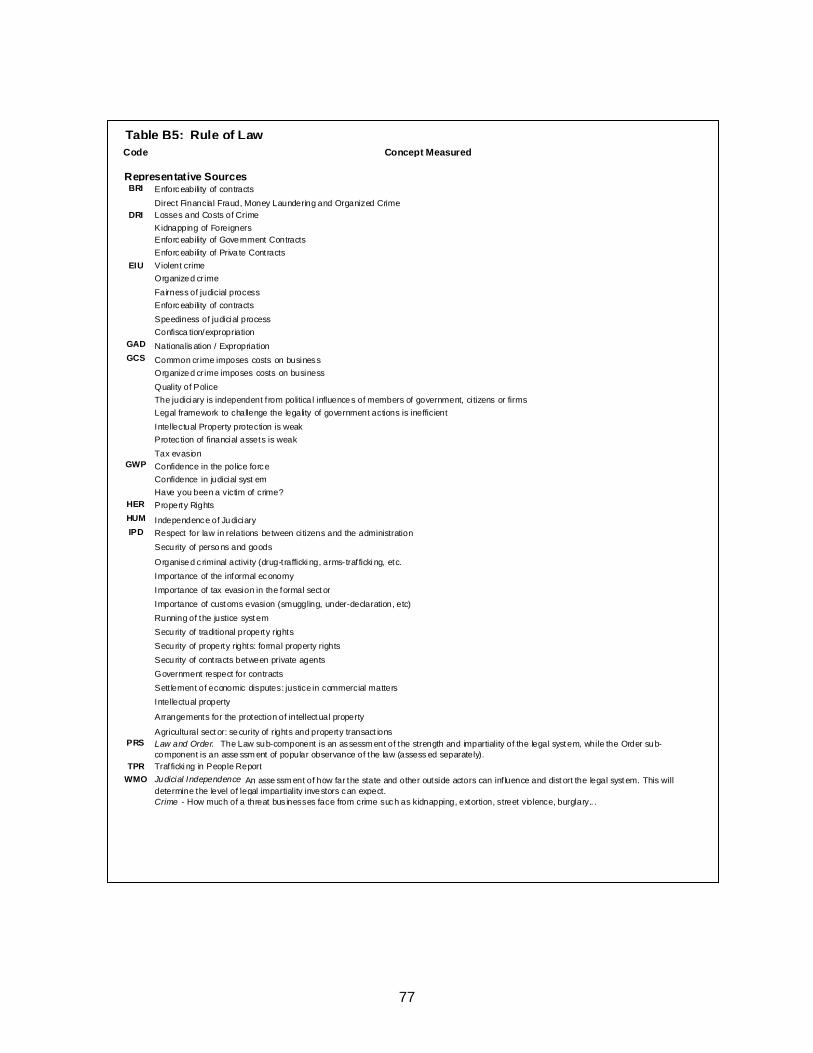
77
Table B5: Rule of Law Code Concept Measured
Representative SourcesBRI Enforceability of contracts
Direct Financial Fraud, Money Laundering and Organized CrimeDRI Losses and Costs of Crime
Kidnapping of ForeignersEnforceability of Government ContractsEnforceability of Priva te Contracts
EIU Violent crimeOrganized cr imeFairness of judicial processEnforceability of contractsSpeediness of judicial processConfisca tion/expropriation
GAD Nationalisation / ExpropriationGCS Common cr ime imposes costs on business
Organized cr ime imposes costs on businessQuality of PoliceThe judiciary is independent f rom politica l influences of members of government, citizens or firmsLegal framework to challenge the legality of government actions is inefficientIntellectual Property protection is weak Protec tion of financial assets is weakTax evasion
GWP Confidence in the police forceConfidence in judicial syst emHave you been a victim of crime?
HER Property RightsHUM Independence of JudiciaryIPD Respect for law in relations between citizens and the administration
Security of persons and goods
Organised c riminal activity (drug-trafficki ng, arms-traf ficki ng, etc.Importance of the informal economyImportance of tax evasion in the formal sect orImportance of cust oms evasion (smuggling, under-declaration, etc)Running of the justice syst emSecurity of traditional property rightsSecurity of property rights: formal property rightsSecurity of contracts between private agentsGovernment respect for contractsSett lement of economic disputes: justice in commercial mattersIntellectual property
Arrangements for the protection of intellect ual property
Agricultural sect or: security of rights and property transact ionsPRS Law and Order. The Law sub-component is an assessm ent of the strength and impartiality of the legal syst em, while the Order sub-
component is an asse ssm ent of popular observance of the law (assess ed separately).TPR Trafficki ng in People Report
WMO Judicial Independence An asse ssm ent of how far the state and other outside actors can inf luence and dist ort the legal syst em. This will determine the level of legal impartiality investors can expect. Crime - How much of a threat bus inesses face from crime such as kidnapping, extortion, street violence, burglary.. .
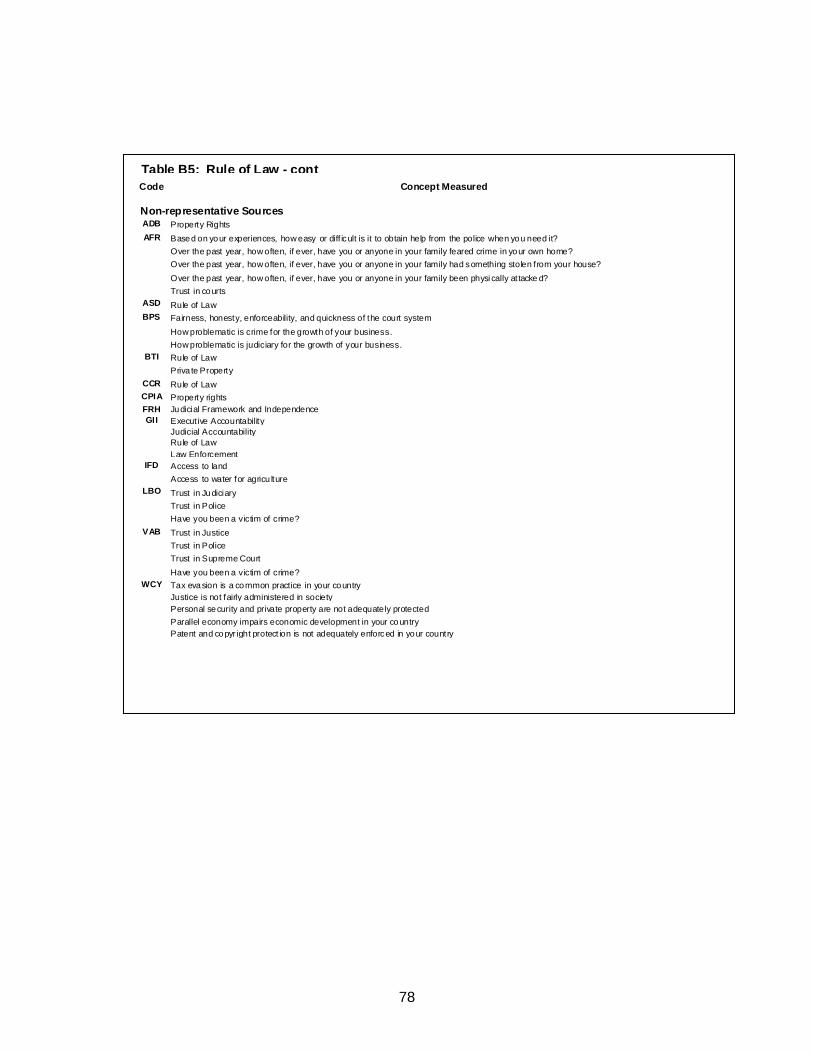
78
Table B5: Rule of Law - cont Code Concept Measured
Non-representative SourcesADB Property RightsAFR Based on your experiences, how easy or diff icult is it to obtain help from the police when you need it?
Over the past year, how often, if ever, have you or anyone in your family feared crime in your own home?Over the past year, how often, if ever, have you or anyone in your family had something stolen from your house?Over the past year, how often, if ever, have you or anyone in your family been physi cally at tacke d?Trust in courts
ASD Rule of LawBPS Fairness, honesty, enforceability, and quickness of the court system
How problematic is crime for the growth of your business. How problematic is judiciary for the growth of your business.
BTI Rule of LawPriva te Property
CCR Rule of LawCPIA Property rightsFRH Judicial Framework and IndependenceGII Execut ive Accountability
Judicial AccountabilityRule of LawLaw Enforcement
IFD Access to landAccess to water for agricu lture
LBO Trust in JudiciaryTrust in PoliceHave you been a victim of crime?
VAB Trust in JusticeTrust in PoliceTrust in Supreme CourtHave you been a victim of crime?
WCY Tax evasion is a common practice in your country Justice is not fairly administered in society
Personal security and private property are not adequately protectedParallel economy impairs economic development in your countryPatent and copyr ight protect ion is not adequately enforced in your country
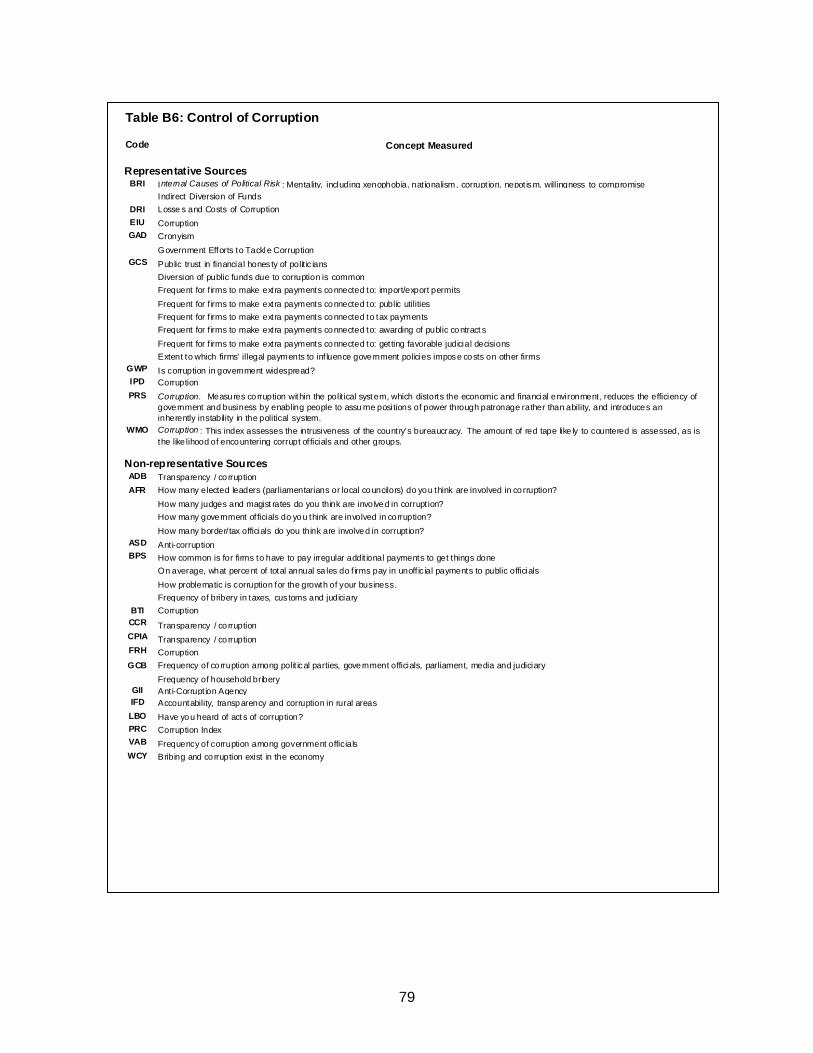
79
Table B6: Control of Corruption
Code Concept Measured
Representative SourcesBRI Internal Causes of Political Risk : Mentality, including xenophobia, nat ionalism, corrupt ion, nepot ism, willingness to compromise
Indirect Diversion of FundsDRI Losse s and Costs of CorruptionEIU CorruptionGAD Cronyism
Government Efforts to Tackl e CorruptionGCS Public trust in financial hones ty of polit ic ians
Diversion of public funds due to corruption is commonFrequent for f irms to make extra payments connected to: import/export permitsFrequent for f irms to make extra payments connected to: public utilitiesFrequent for f irms to make extra payments connected to tax paymentsFrequent for f irms to make extra payments connected to: awarding of public contract sFrequent for f irms to make extra payments connected to: getting favorable judicial decisionsExtent to which firms' illegal payments to inf luence government policies impose costs on other firms
GWP Is corruption in government widespread?IPD CorruptionPRS Corruption. Measures co rruption within the polit ical syst em, which distorts the economic and financial environment, reduces the efficiency of
government and business by enabling people to assu me positions of power through patronage rather than ability, and introduces an inherently instability in the political system.
WMO Corruption : This index assesses the intrusiveness of the country’s bureaucracy. The amount of red tape like ly to countered is assessed, as isthe like lihood of encountering corrupt of ficials and other groups.
Non-representative SourcesADB Transparency / co rruptionAFR How many elected leaders (parliamentarians or local councilors) do you think are involved in co rruption?
How many judges and magist rates do you think are invo lved in corrupt ion?How many government of ficials do you think are involved in co rruption?How many border/ tax officials do you think are involved in corrupt ion?
ASD Anti-corruptionBPS How common is for firms to have to pay irregular addit ional payments to get things done
On average, what percent of total annual sa les do f irms pay in unoff ic ial payments to public officialsHow problematic is corruption for the growth of your business.Frequency of bribery in taxes, cus toms and judiciary
BTI CorruptionCCR Transparency / co rruptionCPIA Transparency / co rruptionFRH CorruptionGCB Frequency of co rruption among polit ical parties, government officials, parliament, media and judiciary
Frequency of household briberyGII Anti-Corrupt ion AgencyIFD Accountability, transparency and corruption in rural areasLBO Have you heard of act s of corruption?PRC Corruption IndexVAB Frequency of corruption among government officialsWCY Bribing and corruption exist in the economy
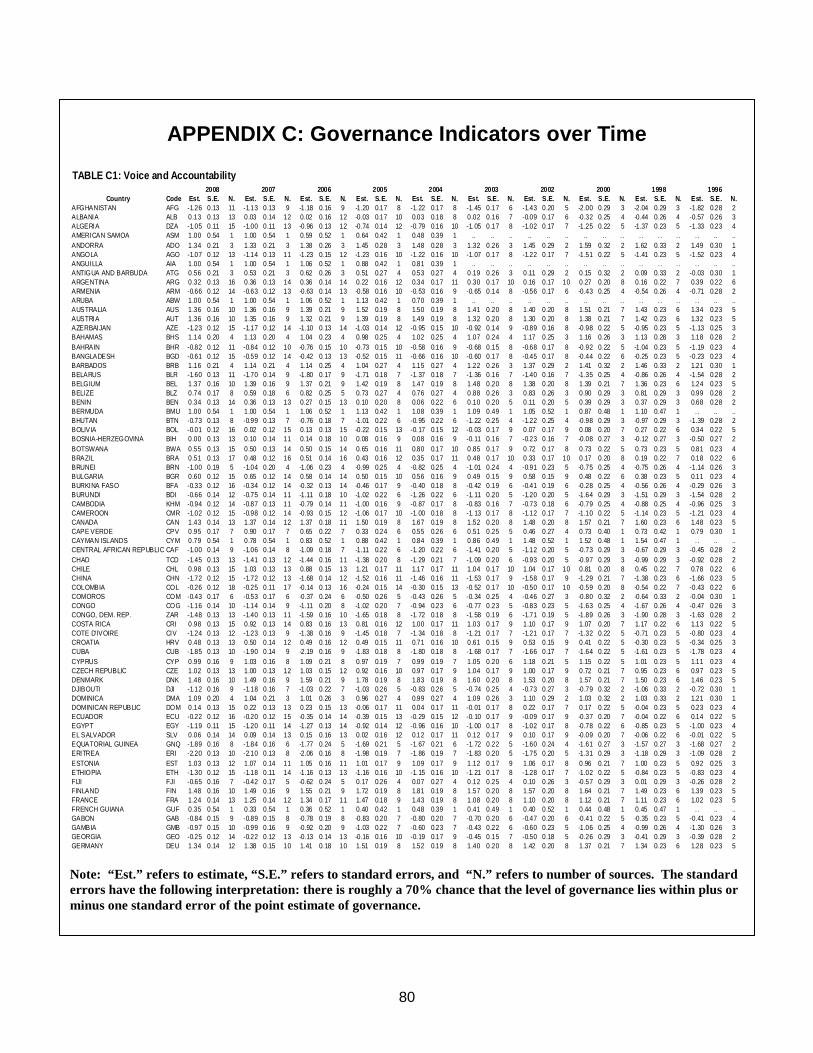
80
APPENDIX C: Governance Indicators over Time TABLE C1: Voice and Accountability
2008 2007 2006 2005 2004 2003 2002 2000 1998 1996Country Code Est. S.E. N. Est. S.E. N. Est. S.E. N. Est. S.E. N. Est. S.E. N. Est. S.E. N. Est. S.E. N. Est. S.E. N. Est. S.E. N. Est. S.E. N.
AFGHANISTAN AFG -1.26 0.13 11 -1.13 0.13 9 -1.18 0.16 9 -1.20 0.17 8 -1.22 0.17 8 -1.45 0.17 6 -1.43 0.20 5 -2.00 0.29 3 -2.04 0.29 3 -1.82 0.28 2ALBANIA ALB 0.13 0.13 13 0.03 0.14 12 0.02 0.16 12 -0.03 0.17 10 0.03 0.18 8 0.02 0.16 7 -0.09 0.17 6 -0.32 0.25 4 -0.44 0.26 4 -0.57 0.26 3ALGERIA DZA -1.05 0.11 15 -1.00 0.11 13 -0.96 0.13 12 -0.74 0.14 12 -0.79 0.16 10 -1.05 0.17 8 -1.02 0.17 7 -1.25 0.22 5 -1.37 0.23 5 -1.33 0.23 4AMERICAN SAMOA ASM 1.00 0.54 1 1.00 0.54 1 0.59 0.52 1 0.64 0.42 1 0.48 0.39 1 .. .. .. .. .. .. .. .. . . . . . . . . . . .. ..ANDORRA ADO 1.34 0.21 3 1.33 0.21 3 1.38 0.26 3 1.45 0.28 3 1.48 0.28 3 1.32 0.26 3 1.45 0.29 2 1.59 0.32 2 1.62 0.33 2 1.49 0.30 1ANGOLA AGO -1.07 0.12 13 -1.14 0.13 11 -1.23 0.15 12 -1.23 0.16 10 -1.22 0.16 10 -1.07 0.17 8 -1.22 0.17 7 -1.51 0.22 5 -1.41 0.23 5 -1.52 0.23 4ANGUILLA AIA 1.00 0.54 1 1.00 0.54 1 1.06 0.52 1 0.88 0.42 1 0.81 0.39 1 .. .. .. .. .. .. .. .. . . . . . . . . . . .. ..ANTIGUA AND BARBUDA ATG 0.56 0.21 3 0.53 0.21 3 0.62 0.26 3 0.51 0.27 4 0.53 0.27 4 0.19 0.26 3 0.11 0.29 2 0.15 0.32 2 0.09 0.33 2 -0.03 0.30 1ARGENTINA ARG 0.32 0.13 16 0.36 0.13 14 0.36 0.14 14 0.22 0.16 12 0.34 0.17 11 0.30 0.17 10 0.16 0.17 10 0.27 0.20 8 0.16 0.22 7 0.39 0.22 6ARMENIA ARM -0.66 0.12 14 -0.63 0.12 13 -0.63 0.14 13 -0.58 0.16 10 -0.53 0.16 9 -0.65 0.14 8 -0.56 0.17 6 -0.43 0.25 4 -0.54 0.26 4 -0.71 0.28 2ARUBA ABW 1.00 0.54 1 1.00 0.54 1 1.06 0.52 1 1.13 0.42 1 0.70 0.39 1 .. .. .. .. .. .. .. .. . . . . . . . . . . .. ..AUSTRALIA AUS 1.36 0.16 10 1.36 0.16 9 1.39 0.21 9 1.52 0.19 8 1.50 0.19 8 1.41 0.20 8 1.40 0.20 8 1.51 0.21 7 1.43 0.23 6 1.34 0.23 5AUSTRIA AUT 1.36 0.16 10 1.35 0.16 9 1.32 0.21 9 1.39 0.19 8 1.49 0.19 8 1.32 0.20 8 1.30 0.20 8 1.38 0.21 7 1.42 0.23 6 1.32 0.23 5AZERBAIJAN AZE -1.23 0.12 15 -1.17 0.12 14 -1.10 0.13 14 -1.03 0.14 12 -0.95 0.15 10 -0.92 0.14 9 -0.89 0.16 8 -0.98 0.22 5 -0.95 0.23 5 -1.13 0.25 3BAHAMAS BHS 1.14 0.20 4 1.13 0.20 4 1.04 0.23 4 0.98 0.25 4 1.02 0.25 4 1.07 0.24 4 1.17 0.25 3 1.16 0.26 3 1.13 0.28 3 1.18 0.28 2BAHRAIN BHR -0.82 0.12 11 -0.84 0.12 10 -0.76 0.15 10 -0.73 0.15 10 -0.58 0.16 9 -0.68 0.15 8 -0.68 0.17 8 -0.92 0.22 5 -1.04 0.23 5 -1.19 0.23 4BANGLADESH BGD -0.61 0.12 15 -0.59 0.12 14 -0.42 0.13 13 -0.52 0.15 11 -0.66 0.16 10 -0.60 0.17 8 -0.45 0.17 8 -0.44 0.22 6 -0.25 0.23 5 -0.23 0.23 4BARBADOS BRB 1.16 0.21 4 1.14 0.21 4 1.14 0.25 4 1.04 0.27 4 1.15 0.27 4 1.22 0.26 3 1.37 0.29 2 1.41 0.32 2 1.46 0.33 2 1.21 0.30 1BELARUS BLR -1.60 0.13 11 -1.70 0.14 9 -1.80 0.17 9 -1.71 0.18 7 -1.37 0.18 7 -1.36 0.16 7 -1.40 0.16 7 -1.35 0.25 4 -0.86 0.26 4 -1.54 0.28 2BELGIUM BEL 1.37 0.16 10 1.39 0.16 9 1.37 0.21 9 1.42 0.19 8 1.47 0.19 8 1.48 0.20 8 1.38 0.20 8 1.39 0.21 7 1.36 0.23 6 1.24 0.23 5BELIZE BLZ 0.74 0.17 8 0.59 0.18 6 0.82 0.25 5 0.73 0.27 4 0.76 0.27 4 0.88 0.26 3 0.83 0.26 3 0.90 0.29 3 0.81 0.29 3 0.99 0.28 2BENIN BEN 0.34 0.13 14 0.36 0.13 13 0.27 0.15 13 0.10 0.20 8 0.06 0.22 6 0.10 0.20 5 0.11 0.20 5 0.39 0.29 3 0.37 0.29 3 0.68 0.28 2BERMUDA BMU 1.00 0.54 1 1.00 0.54 1 1.06 0.52 1 1.13 0.42 1 1.08 0.39 1 1.09 0.49 1 1.05 0.52 1 0.87 0.48 1 1.10 0.47 1 .. .. ..BHUTAN BTN -0.73 0.13 8 -0.99 0.13 7 -0.76 0.18 7 -1.01 0.22 6 -0.95 0.22 6 -1.22 0.25 4 -1.22 0.25 4 -0.98 0.29 3 -0.97 0.29 3 -1.39 0.28 2BOLIVIA BOL -0.01 0.12 16 0.02 0.12 15 0.13 0.13 15 -0.22 0.15 13 -0.17 0.15 12 -0.03 0.17 9 0.07 0.17 9 0.08 0.20 7 0.27 0.22 6 0.34 0.22 5BOSNIA-HERZEGOVINA BIH 0.00 0.13 13 0.10 0.14 11 0.14 0.18 10 0.08 0.16 9 0.08 0.16 9 -0.11 0.16 7 -0.23 0.16 7 -0.08 0.27 3 -0.12 0.27 3 -0.50 0.27 2BOTSWANA BWA 0.55 0.13 15 0.50 0.13 14 0.50 0.15 14 0.65 0.16 11 0.80 0.17 10 0.85 0.17 9 0.72 0.17 8 0.73 0.22 5 0.73 0.23 5 0.81 0.23 4BRAZIL BRA 0.51 0.13 17 0.48 0.12 16 0.51 0.14 16 0.43 0.16 12 0.35 0.17 11 0.48 0.17 10 0.33 0.17 10 0.17 0.20 8 0.19 0.22 7 0.18 0.22 6BRUNEI BRN -1.00 0.19 5 -1.04 0.20 4 -1.06 0.23 4 -0.99 0.25 4 -0.82 0.25 4 -1.01 0.24 4 -0.91 0.23 5 -0.75 0.25 4 -0.75 0.26 4 -1.14 0.26 3BULGARIA BGR 0.60 0.12 15 0.65 0.12 14 0.58 0.14 14 0.50 0.15 10 0.56 0.16 9 0.49 0.15 9 0.58 0.15 9 0.48 0.22 6 0.38 0.23 5 0.11 0.23 4BURKINA FASO BFA -0.33 0.12 16 -0.34 0.12 14 -0.32 0.13 14 -0.46 0.17 9 -0.40 0.18 8 -0.42 0.19 6 -0.41 0.19 6 -0.28 0.25 4 -0.56 0.26 4 -0.29 0.26 3BURUNDI BDI -0.66 0.14 12 -0.75 0.14 11 -1.11 0.18 10 -1.02 0.22 6 -1.26 0.22 6 -1.11 0.20 5 -1.20 0.20 5 -1.64 0.29 3 -1.51 0.29 3 -1.54 0.28 2CAMBODIA KHM -0.94 0.12 14 -0.87 0.13 11 -0.79 0.14 11 -1.00 0.16 9 -0.87 0.17 8 -0.83 0.16 7 -0.73 0.18 6 -0.79 0.25 4 -0.88 0.25 4 -0.96 0.25 3CAMEROON CMR -1.02 0.12 15 -0.98 0.12 14 -0.93 0.15 12 -1.06 0.17 10 -1.00 0.18 8 -1.13 0.17 8 -1.12 0.17 7 -1.10 0.22 5 -1.14 0.23 5 -1.21 0.23 4CANADA CAN 1.43 0.14 13 1.37 0.14 12 1.37 0.18 11 1.50 0.19 8 1.67 0.19 8 1.52 0.20 8 1.48 0.20 8 1.57 0.21 7 1.60 0.23 6 1.48 0.23 5CAPE VERDE CPV 0.95 0.17 7 0.90 0.17 7 0.65 0.22 7 0.33 0.24 6 0.55 0.26 6 0.51 0.25 5 0.46 0.27 4 0.73 0.40 1 0.73 0.42 1 0.79 0.30 1CAYMAN ISLANDS CYM 0.79 0.54 1 0.78 0.54 1 0.83 0.52 1 0.88 0.42 1 0.84 0.39 1 0.86 0.49 1 1.48 0.52 1 1.52 0.48 1 1.54 0.47 1 .. .. ..CENTRAL AFRICAN REPUBLIC CAF -1.00 0.14 9 -1.06 0.14 8 -1.09 0.18 7 -1.11 0.22 6 -1.20 0.22 6 -1.41 0.20 5 -1.12 0.20 5 -0.73 0.29 3 -0.67 0.29 3 -0.45 0.28 2CHAD TCD -1.45 0.13 13 -1.41 0.13 12 -1.44 0.16 11 -1.38 0.20 8 -1.29 0.21 7 -1.09 0.20 6 -0.93 0.20 5 -0.97 0.29 3 -0.99 0.29 3 -0.92 0.28 2CHILE CHL 0.98 0.13 15 1.03 0.13 13 0.88 0.15 13 1.21 0.17 11 1.17 0.17 11 1.04 0.17 10 1.04 0.17 10 0.81 0.20 8 0.45 0.22 7 0.78 0.22 6CHINA CHN -1.72 0.12 15 -1.72 0.12 13 -1.68 0.14 12 -1.52 0.16 11 -1.46 0.16 11 -1.53 0.17 9 -1.58 0.17 9 -1.29 0.21 7 -1.38 0.23 6 -1.66 0.23 5COLOMBIA COL -0.26 0.12 18 -0.25 0.11 17 -0.14 0.13 16 -0.24 0.15 14 -0.30 0.15 13 -0.52 0.17 10 -0.50 0.17 10 -0.59 0.20 8 -0.54 0.22 7 -0.43 0.22 6COMOROS COM -0.43 0.17 6 -0.53 0.17 6 -0.37 0.24 6 -0.50 0.26 5 -0.43 0.26 5 -0.34 0.25 4 -0.46 0.27 3 -0.80 0.32 2 -0.64 0.33 2 -0.04 0.30 1CONGO COG -1.16 0.14 10 -1.14 0.14 9 -1.11 0.20 8 -1.02 0.20 7 -0.94 0.23 6 -0.77 0.23 5 -0.83 0.23 5 -1.63 0.25 4 -1.67 0.26 4 -0.47 0.26 3CONGO, DEM. REP. ZAR -1.48 0.13 13 -1.40 0.13 11 -1.59 0.16 10 -1.65 0.18 8 -1.72 0.18 8 -1.58 0.19 6 -1.71 0.19 5 -1.89 0.26 3 -1.90 0.28 3 -1.63 0.28 2COSTA RICA CRI 0.98 0.13 15 0.92 0.13 14 0.83 0.16 13 0.81 0.16 12 1.00 0.17 11 1.03 0.17 9 1.10 0.17 9 1.07 0.20 7 1.17 0.22 6 1.13 0.22 5COTE D'IVOIRE CIV -1.24 0.13 12 -1.23 0.13 9 -1.38 0.16 9 -1.45 0.18 7 -1.34 0.18 8 -1.21 0.17 7 -1.21 0.17 7 -1.32 0.22 5 -0.71 0.23 5 -0.80 0.23 4CROATIA HRV 0.48 0.13 13 0.50 0.14 12 0.49 0.16 12 0.49 0.15 11 0.71 0.16 10 0.61 0.15 9 0.53 0.15 9 0.41 0.22 5 -0.30 0.23 5 -0.34 0.25 3CUBA CUB -1.85 0.13 10 -1.90 0.14 9 -2.19 0.16 9 -1.83 0.18 8 -1.80 0.18 8 -1.68 0.17 7 -1.66 0.17 7 -1.64 0.22 5 -1.61 0.23 5 -1.78 0.23 4CYPRUS CYP 0.99 0.16 9 1.03 0.16 8 1.09 0.21 8 0.97 0.19 7 0.99 0.19 7 1.05 0.20 6 1.18 0.21 5 1.15 0.22 5 1.01 0.23 5 1.11 0.23 4CZECH REPUBLIC CZE 1.02 0.13 13 1.00 0.13 12 1.03 0.15 12 0.92 0.16 10 0.97 0.17 9 1.04 0.17 9 1.00 0.17 9 0.72 0.21 7 0.95 0.23 6 0.97 0.23 5DENMARK DNK 1.48 0.16 10 1.49 0.16 9 1.59 0.21 9 1.78 0.19 8 1.83 0.19 8 1.60 0.20 8 1.53 0.20 8 1.57 0.21 7 1.50 0.23 6 1.46 0.23 5DJIBOUTI DJI -1.12 0.16 9 -1.18 0.16 7 -1.03 0.22 7 -1.03 0.26 5 -0.83 0.26 5 -0.74 0.25 4 -0.73 0.27 3 -0.79 0.32 2 -1.06 0.33 2 -0.72 0.30 1DOMINICA DMA 1.09 0.20 4 1.04 0.21 3 1.01 0.26 3 0.96 0.27 4 0.99 0.27 4 1.09 0.26 3 1.10 0.29 2 1.03 0.32 2 1.03 0.33 2 1.21 0.30 1DOMINICAN REPUBLIC DOM 0.14 0.13 15 0.22 0.13 13 0.23 0.15 13 -0.06 0.17 11 0.04 0.17 11 -0.01 0.17 8 0.22 0.17 7 0.17 0.22 5 -0.04 0.23 5 0.23 0.23 4ECUADOR ECU -0.22 0.12 16 -0.20 0.12 15 -0.35 0.14 14 -0.39 0.15 13 -0.29 0.15 12 -0.10 0.17 9 -0.09 0.17 9 -0.37 0.20 7 -0.04 0.22 6 0.14 0.22 5EGYPT EGY -1.19 0.11 15 -1.20 0.11 14 -1.27 0.13 14 -0.92 0.14 12 -0.96 0.16 10 -1.00 0.17 8 -1.02 0.17 8 -0.78 0.22 6 -0.85 0.23 5 -1.00 0.23 4EL SALVADOR SLV 0.06 0.14 14 0.09 0.14 13 0.15 0.16 13 0.02 0.16 12 0.12 0.17 11 0.12 0.17 9 0.10 0.17 9 -0.09 0.20 7 -0.06 0.22 6 -0.01 0.22 5EQUATORIAL GUINEA GNQ -1.89 0.16 8 -1.84 0.16 6 -1.77 0.24 5 -1.69 0.21 5 -1.67 0.21 6 -1.72 0.22 5 -1.60 0.24 4 -1.61 0.27 3 -1.57 0.27 3 -1.68 0.27 2ERITREA ERI -2.20 0.13 10 -2.10 0.13 8 -2.06 0.16 8 -1.98 0.19 7 -1.86 0.19 7 -1.83 0.20 5 -1.75 0.20 5 -1.31 0.29 3 -1.18 0.29 3 -1.09 0.28 2ESTONIA EST 1.03 0.13 12 1.07 0.14 11 1.05 0.16 11 1.01 0.17 9 1.09 0.17 9 1.12 0.17 9 1.06 0.17 8 0.96 0.21 7 1.00 0.23 5 0.92 0.25 3ETHIOPIA ETH -1.30 0.12 15 -1.18 0.11 14 -1.16 0.13 13 -1.16 0.16 10 -1.15 0.16 10 -1.21 0.17 8 -1.28 0.17 7 -1.02 0.22 5 -0.84 0.23 5 -0.83 0.23 4FIJI FJI -0.65 0.16 7 -0.42 0.17 5 -0.62 0.24 5 0.17 0.26 4 0.07 0.27 4 0.12 0.25 4 0.10 0.26 3 -0.57 0.29 3 0.01 0.29 3 -0.26 0.28 2FINLAND FIN 1.48 0.16 10 1.49 0.16 9 1.55 0.21 9 1.72 0.19 8 1.81 0.19 8 1.57 0.20 8 1.57 0.20 8 1.64 0.21 7 1.49 0.23 6 1.39 0.23 5FRANCE FRA 1.24 0.14 13 1.25 0.14 12 1.34 0.17 11 1.47 0.18 9 1.43 0.19 8 1.08 0.20 8 1.10 0.20 8 1.12 0.21 7 1.11 0.23 6 1.02 0.23 5FRENCH GUIANA GUF 0.35 0.54 1 0.33 0.54 1 0.36 0.52 1 0.40 0.42 1 0.48 0.39 1 0.41 0.49 1 0.40 0.52 1 0.44 0.48 1 0.45 0.47 1 .. .. ..GABON GAB -0.84 0.15 9 -0.89 0.15 8 -0.78 0.19 8 -0.83 0.20 7 -0.80 0.20 7 -0.70 0.20 6 -0.47 0.20 6 -0.41 0.22 5 -0.35 0.23 5 -0.41 0.23 4GAMBIA GMB -0.97 0.15 10 -0.99 0.16 9 -0.92 0.20 9 -1.03 0.22 7 -0.60 0.23 7 -0.43 0.22 6 -0.60 0.23 5 -1.06 0.25 4 -0.99 0.26 4 -1.30 0.26 3GEORGIA GEO -0.25 0.12 14 -0.22 0.12 13 -0.13 0.14 13 -0.16 0.16 10 -0.19 0.17 9 -0.45 0.15 7 -0.50 0.18 5 -0.26 0.29 3 -0.41 0.29 3 -0.39 0.28 2GERMANY DEU 1.34 0.14 12 1.38 0.15 10 1.41 0.18 10 1.51 0.19 8 1.52 0.19 8 1.40 0.20 8 1.42 0.20 8 1.37 0.21 7 1.34 0.23 6 1.28 0.23 5 Note: “Est.” refers to estimate, “S.E.” refers to standard errors, and “N.” refers to number of sources. The standard errors have the following interpretation: there is roughly a 70% chance that the level of governance lies within plus or minus one standard error of the point estimate of governance.
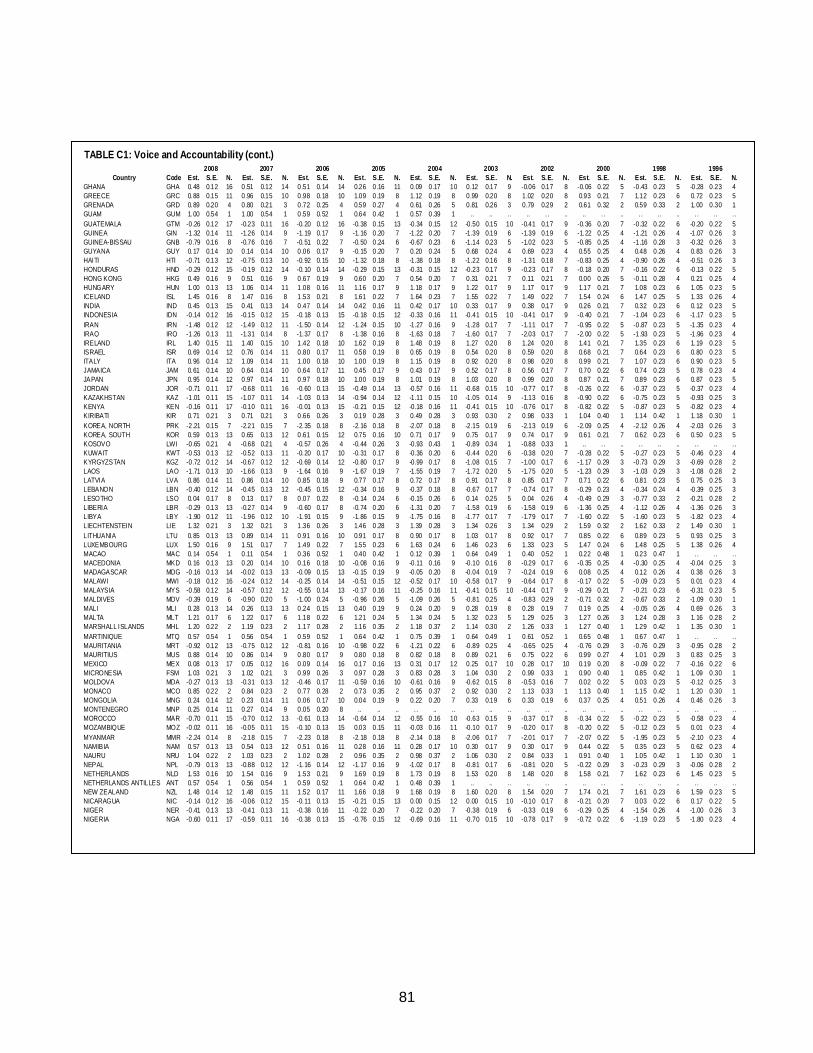
81
TABLE C1: Voice and Accountability (cont.)2008 2007 2006 2005 2004 2003 2002 2000 1998 1996
Country Code Est. S.E. N. Est. S.E. N. Est. S.E. N. Est. S.E. N. Est. S.E. N. Est. S.E. N. Est. S.E. N. Est. S.E. N. Est. S.E. N. Est. S.E. N.GHANA GHA 0.48 0.12 16 0.51 0.12 14 0.51 0.14 14 0.26 0.16 11 0.09 0.17 10 0.12 0.17 9 -0.06 0.17 8 -0.06 0.22 5 -0.43 0.23 5 -0.28 0.23 4GREECE GRC 0.88 0.15 11 0.96 0.15 10 0.98 0.18 10 1.09 0.19 8 1.12 0.19 8 0.99 0.20 8 1.02 0.20 8 0.93 0.21 7 1.12 0.23 6 0.72 0.23 5GRENADA GRD 0.89 0.20 4 0.80 0.21 3 0.72 0.25 4 0.59 0.27 4 0.61 0.26 5 0.81 0.26 3 0.79 0.29 2 0.61 0.32 2 0.59 0.33 2 1.00 0.30 1GUAM GUM 1.00 0.54 1 1.00 0.54 1 0.59 0.52 1 0.64 0.42 1 0.57 0.39 1 .. .. . . .. . . .. .. . . .. . . .. .. . . .. . .GUATEMALA GTM -0.26 0.12 17 -0.23 0.11 16 -0.20 0.12 16 -0.38 0.15 13 -0.34 0.15 12 -0.50 0.15 10 -0.41 0.17 9 -0.36 0.20 7 -0.32 0.22 6 -0.20 0.22 5GUINEA GIN -1.32 0.14 11 -1.26 0.14 9 -1.19 0.17 9 -1.16 0.20 7 -1.22 0.20 7 -1.39 0.19 6 -1.39 0.19 6 -1.22 0.25 4 -1.21 0.26 4 -1.07 0.26 3GUINEA-BISSAU GNB -0.79 0.16 8 -0.76 0.16 7 -0.51 0.22 7 -0.50 0.24 6 -0.67 0.23 6 -1.14 0.23 5 -1.02 0.23 5 -0.85 0.25 4 -1.16 0.28 3 -0.32 0.26 3GUYANA GUY 0.17 0.14 10 0.14 0.14 10 0.06 0.17 9 -0.15 0.20 7 0.20 0.24 5 0.68 0.24 4 0.69 0.23 4 0.55 0.25 4 0.48 0.26 4 0.83 0.26 3HAITI HTI -0.71 0.13 12 -0.75 0.13 10 -0.92 0.15 10 -1.32 0.18 8 -1.38 0.18 8 -1.22 0.16 8 -1.31 0.18 7 -0.83 0.25 4 -0.90 0.26 4 -0.51 0.26 3HONDURAS HND -0.29 0.12 15 -0.19 0.12 14 -0.10 0.14 14 -0.29 0.15 13 -0.31 0.15 12 -0.23 0.17 9 -0.23 0.17 8 -0.18 0.20 7 -0.16 0.22 6 -0.13 0.22 5HONG KONG HKG 0.49 0.16 9 0.51 0.16 9 0.67 0.19 9 0.60 0.20 7 0.54 0.20 7 0.31 0.21 7 0.11 0.21 7 0.00 0.26 5 -0.11 0.28 4 0.21 0.25 4HUNGARY HUN 1.00 0.13 13 1.06 0.14 11 1.08 0.16 11 1.16 0.17 9 1.18 0.17 9 1.22 0.17 9 1.17 0.17 9 1.17 0.21 7 1.08 0.23 6 1.05 0.23 5ICELAND ISL 1.45 0.16 8 1.47 0.16 8 1.53 0.21 8 1.61 0.22 7 1.64 0.23 7 1.55 0.22 7 1.49 0.22 7 1.54 0.24 6 1.47 0.25 5 1.33 0.26 4INDIA IND 0.45 0.13 15 0.41 0.13 14 0.47 0.14 14 0.42 0.16 11 0.42 0.17 10 0.33 0.17 9 0.38 0.17 9 0.26 0.21 7 0.32 0.23 6 0.12 0.23 5INDONESIA IDN -0.14 0.12 16 -0.15 0.12 15 -0.18 0.13 15 -0.18 0.15 12 -0.33 0.16 11 -0.41 0.15 10 -0.41 0.17 9 -0.40 0.21 7 -1.04 0.23 6 -1.17 0.23 5IRAN IRN -1.48 0.12 12 -1.49 0.12 11 -1.50 0.14 12 -1.24 0.15 10 -1.27 0.16 9 -1.28 0.17 7 -1.11 0.17 7 -0.95 0.22 5 -0.87 0.23 5 -1.35 0.23 4IRAQ IRQ -1.26 0.13 11 -1.31 0.14 8 -1.37 0.17 8 -1.38 0.16 8 -1.63 0.18 7 -1.60 0.17 7 -2.03 0.17 7 -2.00 0.22 5 -1.93 0.23 5 -1.96 0.23 4IRELAND IRL 1.40 0.15 11 1.40 0.15 10 1.42 0.18 10 1.62 0.19 8 1.48 0.19 8 1.27 0.20 8 1.24 0.20 8 1.41 0.21 7 1.35 0.23 6 1.19 0.23 5ISRAEL ISR 0.69 0.14 12 0.76 0.14 11 0.80 0.17 11 0.58 0.19 8 0.65 0.19 8 0.54 0.20 8 0.59 0.20 8 0.68 0.21 7 0.64 0.23 6 0.80 0.23 5ITALY ITA 0.96 0.14 12 1.09 0.14 11 1.00 0.18 10 1.00 0.19 8 1.15 0.19 8 0.92 0.20 8 0.98 0.20 8 0.99 0.21 7 1.07 0.23 6 0.90 0.23 5JAMAICA JAM 0.61 0.14 10 0.64 0.14 10 0.64 0.17 11 0.45 0.17 9 0.43 0.17 9 0.52 0.17 8 0.56 0.17 7 0.70 0.22 6 0.74 0.23 5 0.78 0.23 4JAPAN JPN 0.95 0.14 12 0.97 0.14 11 0.97 0.18 10 1.00 0.19 8 1.01 0.19 8 1.03 0.20 8 0.99 0.20 8 0.87 0.21 7 0.89 0.23 6 0.87 0.23 5JORDAN JOR -0.71 0.11 17 -0.68 0.11 16 -0.60 0.13 15 -0.49 0.14 13 -0.57 0.16 11 -0.68 0.15 10 -0.77 0.17 8 -0.26 0.22 6 -0.37 0.23 5 -0.37 0.23 4KAZAKHSTAN KAZ -1.01 0.11 15 -1.07 0.11 14 -1.03 0.13 14 -0.94 0.14 12 -1.11 0.15 10 -1.05 0.14 9 -1.13 0.16 8 -0.90 0.22 6 -0.75 0.23 5 -0.93 0.25 3KENYA KEN -0.16 0.11 17 -0.10 0.11 16 -0.01 0.13 15 -0.21 0.15 12 -0.18 0.16 11 -0.41 0.15 10 -0.76 0.17 8 -0.82 0.22 5 -0.87 0.23 5 -0.82 0.23 4KIRIBATI KIR 0.71 0.21 3 0.71 0.21 3 0.66 0.26 3 0.19 0.28 3 0.49 0.28 3 0.93 0.30 2 0.98 0.33 1 1.04 0.40 1 1.14 0.42 1 1.18 0.30 1KOREA, NORTH PRK -2.21 0.15 7 -2.21 0.15 7 -2.35 0.18 8 -2.16 0.18 8 -2.07 0.18 8 -2.15 0.19 6 -2.13 0.19 6 -2.09 0.25 4 -2.12 0.26 4 -2.03 0.26 3KOREA, SOUTH KOR 0.59 0.13 13 0.65 0.13 12 0.61 0.15 12 0.75 0.16 10 0.71 0.17 9 0.75 0.17 9 0.74 0.17 9 0.61 0.21 7 0.62 0.23 6 0.50 0.23 5KOSOVO LWI -0.65 0.21 4 -0.68 0.21 4 -0.57 0.26 4 -0.44 0.26 3 -0.93 0.43 1 -0.89 0.34 1 -0.88 0.33 1 .. . . .. . . .. .. . . .. . .KUWAIT KWT -0.53 0.13 12 -0.52 0.13 11 -0.20 0.17 10 -0.31 0.17 8 -0.36 0.20 6 -0.44 0.20 6 -0.38 0.20 7 -0.28 0.22 5 -0.27 0.23 5 -0.46 0.23 4KYRGYZSTAN KGZ -0.72 0.12 14 -0.67 0.12 12 -0.69 0.14 12 -0.80 0.17 9 -0.99 0.17 8 -1.08 0.15 7 -1.00 0.17 6 -1.17 0.29 3 -0.73 0.29 3 -0.69 0.28 2LAOS LAO -1.71 0.13 10 -1.66 0.13 9 -1.64 0.16 9 -1.67 0.19 7 -1.55 0.19 7 -1.72 0.20 5 -1.75 0.20 5 -1.23 0.29 3 -1.03 0.29 3 -1.08 0.28 2LATVIA LVA 0.86 0.14 11 0.86 0.14 10 0.85 0.18 9 0.77 0.17 8 0.72 0.17 8 0.91 0.17 8 0.85 0.17 7 0.71 0.22 6 0.81 0.23 5 0.75 0.25 3LEBANON LBN -0.40 0.12 14 -0.45 0.13 12 -0.45 0.15 12 -0.34 0.16 9 -0.37 0.18 8 -0.67 0.17 7 -0.74 0.17 8 -0.29 0.23 4 -0.34 0.24 4 -0.39 0.25 3LESOTHO LSO 0.04 0.17 8 0.13 0.17 8 0.07 0.22 8 -0.14 0.24 6 -0.15 0.26 6 0.14 0.25 5 0.04 0.26 4 -0.49 0.29 3 -0.77 0.33 2 -0.21 0.28 2LIBERIA LBR -0.29 0.13 13 -0.27 0.14 9 -0.60 0.17 8 -0.74 0.20 6 -1.31 0.20 7 -1.58 0.19 6 -1.58 0.19 6 -1.36 0.25 4 -1.12 0.26 4 -1.36 0.26 3LIBYA LBY -1.90 0.12 11 -1.96 0.12 10 -1.91 0.15 9 -1.86 0.15 9 -1.75 0.16 8 -1.77 0.17 7 -1.79 0.17 7 -1.60 0.22 5 -1.60 0.23 5 -1.82 0.23 4LIECHTENSTEIN LIE 1.32 0.21 3 1.32 0.21 3 1.36 0.26 3 1.46 0.28 3 1.39 0.28 3 1.34 0.26 3 1.34 0.29 2 1.59 0.32 2 1.62 0.33 2 1.49 0.30 1LITHUANIA LTU 0.85 0.13 13 0.89 0.14 11 0.91 0.16 10 0.91 0.17 8 0.90 0.17 8 1.03 0.17 8 0.92 0.17 7 0.85 0.22 6 0.89 0.23 5 0.93 0.25 3LUXEMBOURG LUX 1.50 0.16 9 1.51 0.17 7 1.49 0.22 7 1.55 0.23 6 1.63 0.24 6 1.46 0.23 6 1.33 0.23 5 1.47 0.24 6 1.48 0.25 5 1.38 0.26 4MACAO MAC 0.14 0.54 1 0.11 0.54 1 0.36 0.52 1 0.40 0.42 1 0.12 0.39 1 0.64 0.49 1 0.40 0.52 1 0.22 0.48 1 0.23 0.47 1 .. .. . .MACEDONIA MKD 0.16 0.13 13 0.20 0.14 10 0.16 0.18 10 -0.08 0.16 9 -0.11 0.16 9 -0.10 0.16 8 -0.29 0.17 6 -0.35 0.25 4 -0.30 0.25 4 -0.04 0.25 3MADAGASCAR MDG -0.16 0.13 14 -0.02 0.13 13 -0.09 0.15 13 -0.15 0.19 9 -0.05 0.20 8 -0.04 0.19 7 -0.24 0.19 6 0.08 0.25 4 0.12 0.26 4 0.38 0.26 3MALAWI MWI -0.18 0.12 16 -0.24 0.12 14 -0.25 0.14 14 -0.51 0.15 12 -0.52 0.17 10 -0.58 0.17 9 -0.64 0.17 8 -0.17 0.22 5 -0.09 0.23 5 0.01 0.23 4MALAYSIA MYS -0.58 0.12 14 -0.57 0.12 12 -0.55 0.14 13 -0.17 0.16 11 -0.25 0.16 11 -0.41 0.15 10 -0.44 0.17 9 -0.29 0.21 7 -0.21 0.23 6 -0.31 0.23 5MALDIVES MDV -0.39 0.19 6 -0.90 0.20 5 -1.00 0.24 5 -0.96 0.26 5 -1.09 0.26 5 -0.81 0.25 4 -0.83 0.29 2 -0.71 0.32 2 -0.67 0.33 2 -1.09 0.30 1MALI MLI 0.28 0.13 14 0.26 0.13 13 0.24 0.15 13 0.40 0.19 9 0.24 0.20 9 0.28 0.19 8 0.28 0.19 7 0.19 0.25 4 -0.05 0.26 4 0.69 0.26 3MALTA MLT 1.21 0.17 6 1.22 0.17 6 1.18 0.22 6 1.21 0.24 5 1.34 0.24 5 1.32 0.23 5 1.29 0.25 3 1.27 0.26 3 1.24 0.28 3 1.16 0.28 2MARSHALL ISLANDS MHL 1.20 0.22 2 1.19 0.23 2 1.17 0.28 2 1.16 0.35 2 1.18 0.37 2 1.14 0.30 2 1.26 0.33 1 1.27 0.40 1 1.29 0.42 1 1.35 0.30 1MARTINIQUE MTQ 0.57 0.54 1 0.56 0.54 1 0.59 0.52 1 0.64 0.42 1 0.75 0.39 1 0.64 0.49 1 0.61 0.52 1 0.65 0.48 1 0.67 0.47 1 .. .. . .MAURITANIA MRT -0.92 0.12 13 -0.75 0.12 12 -0.81 0.16 10 -0.98 0.22 6 -1.21 0.22 6 -0.89 0.25 4 -0.65 0.25 4 -0.76 0.29 3 -0.76 0.29 3 -0.95 0.28 2MAURITIUS MUS 0.88 0.14 10 0.86 0.14 9 0.80 0.17 9 0.80 0.18 8 0.82 0.18 8 0.89 0.21 6 0.75 0.22 6 0.99 0.27 4 1.01 0.29 3 0.83 0.25 3MEXICO MEX 0.08 0.13 17 0.05 0.12 16 0.09 0.14 16 0.17 0.16 13 0.31 0.17 12 0.25 0.17 10 0.28 0.17 10 0.19 0.20 8 -0.09 0.22 7 -0.16 0.22 6MICRONESIA FSM 1.03 0.21 3 1.02 0.21 3 0.99 0.26 3 0.97 0.28 3 0.83 0.28 3 1.04 0.30 2 0.99 0.33 1 0.90 0.40 1 0.85 0.42 1 1.09 0.30 1MOLDOVA MDA -0.27 0.13 13 -0.31 0.13 12 -0.46 0.17 11 -0.59 0.16 10 -0.61 0.16 9 -0.62 0.15 8 -0.53 0.16 7 0.02 0.22 5 0.03 0.23 5 -0.12 0.25 3MONACO MCO 0.85 0.22 2 0.84 0.23 2 0.77 0.28 2 0.73 0.35 2 0.95 0.37 2 0.92 0.30 2 1.13 0.33 1 1.13 0.40 1 1.15 0.42 1 1.20 0.30 1MONGOLIA MNG 0.24 0.14 12 0.23 0.14 11 0.06 0.17 10 0.04 0.19 9 0.22 0.20 7 0.33 0.19 6 0.33 0.19 6 0.37 0.25 4 0.51 0.26 4 0.46 0.26 3MONTENEGRO MNP 0.25 0.14 11 0.27 0.14 9 0.05 0.20 8 .. .. .. . . .. . . .. .. . . .. . . .. .. . . .. . . .. .. . . .. . .MOROCCO MAR -0.70 0.11 15 -0.70 0.12 13 -0.61 0.13 14 -0.64 0.14 12 -0.55 0.16 10 -0.63 0.15 9 -0.37 0.17 8 -0.34 0.22 5 -0.22 0.23 5 -0.58 0.23 4MOZAMBIQUE MOZ -0.02 0.11 16 -0.05 0.11 15 -0.10 0.13 15 0.03 0.15 11 -0.03 0.16 11 -0.10 0.17 9 -0.20 0.17 8 -0.20 0.22 5 -0.12 0.23 5 0.01 0.23 4MYANMAR MMR -2.24 0.14 8 -2.18 0.15 7 -2.23 0.18 8 -2.18 0.18 8 -2.14 0.18 8 -2.06 0.17 7 -2.01 0.17 7 -2.07 0.22 5 -1.95 0.23 5 -2.10 0.23 4NAMIBIA NAM 0.57 0.13 13 0.54 0.13 12 0.51 0.16 11 0.28 0.16 11 0.28 0.17 10 0.30 0.17 9 0.30 0.17 9 0.44 0.22 5 0.35 0.23 5 0.62 0.23 4NAURU NRU 1.04 0.22 2 1.03 0.23 2 1.02 0.28 2 0.96 0.35 2 0.98 0.37 2 1.06 0.30 2 0.84 0.33 1 0.91 0.40 1 1.05 0.42 1 1.10 0.30 1NEPAL NPL -0.79 0.13 13 -0.88 0.12 12 -1.16 0.14 12 -1.17 0.16 9 -1.02 0.17 8 -0.81 0.17 6 -0.81 0.20 5 -0.22 0.29 3 -0.23 0.29 3 -0.06 0.28 2NETHERLANDS NLD 1.53 0.16 10 1.54 0.16 9 1.53 0.21 9 1.69 0.19 8 1.73 0.19 8 1.53 0.20 8 1.48 0.20 8 1.58 0.21 7 1.62 0.23 6 1.45 0.23 5NETHERLANDS ANTILLES ANT 0.57 0.54 1 0.56 0.54 1 0.59 0.52 1 0.64 0.42 1 0.48 0.39 1 .. .. . . .. . . .. .. . . .. . . .. .. . . .. . .NEW ZEALAND NZL 1.48 0.14 12 1.48 0.15 11 1.52 0.17 11 1.66 0.18 9 1.68 0.19 8 1.60 0.20 8 1.54 0.20 7 1.74 0.21 7 1.61 0.23 6 1.59 0.23 5NICARAGUA NIC -0.14 0.12 16 -0.06 0.12 15 -0.11 0.13 15 -0.21 0.15 13 0.00 0.15 12 0.00 0.15 10 -0.10 0.17 8 -0.21 0.20 7 0.03 0.22 6 0.17 0.22 5NIGER NER -0.41 0.13 13 -0.41 0.13 11 -0.38 0.16 11 -0.22 0.20 7 -0.22 0.20 7 -0.38 0.19 6 -0.33 0.19 6 -0.29 0.25 4 -1.54 0.26 4 -1.00 0.26 3NIGERIA NGA -0.60 0.11 17 -0.59 0.11 16 -0.38 0.13 15 -0.76 0.15 12 -0.69 0.16 11 -0.70 0.15 10 -0.78 0.17 9 -0.72 0.22 6 -1.19 0.23 5 -1.80 0.23 4
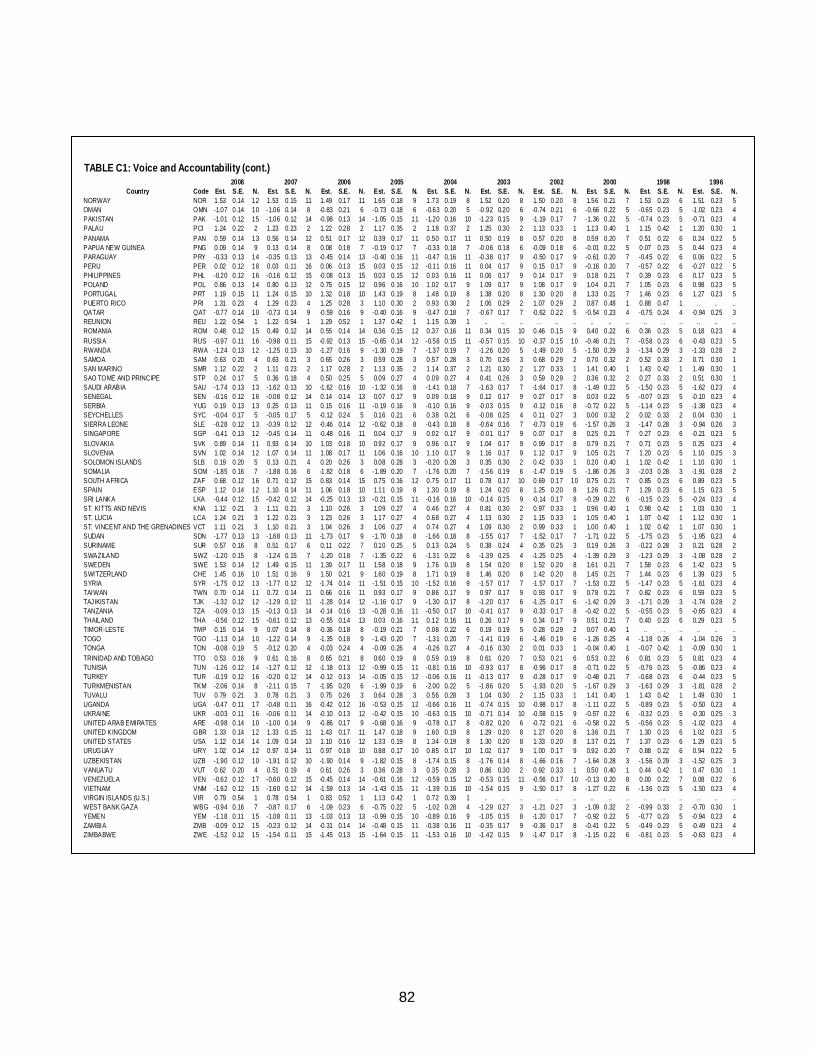
82
TABLE C1: Voice and Accountability (cont.)
2008 2007 2006 2005 2004 2003 2002 2000 1998 1996Country Code Est. S.E. N. Est. S.E. N. Est. S.E. N. Est. S.E. N. Est. S.E. N. Est. S.E. N. Est. S.E. N. Est. S.E. N. Est. S.E. N. Est. S.E. N.
NORWAY NOR 1.53 0.14 12 1.53 0.15 11 1.49 0.17 11 1.65 0.18 9 1.73 0.19 8 1.52 0.20 8 1.50 0.20 8 1.56 0.21 7 1.53 0.23 6 1.51 0.23 5OMAN OMN -1.07 0.14 10 -1.06 0.14 8 -0.83 0.21 6 -0.73 0.18 6 -0.63 0.20 5 -0.92 0.20 6 -0.74 0.21 6 -0.66 0.22 5 -0.65 0.23 5 -1.02 0.23 4PAKISTAN PAK -1.01 0.12 15 -1.06 0.12 14 -0.98 0.13 14 -1.05 0.15 11 -1.20 0.16 10 -1.23 0.15 9 -1.19 0.17 7 -1.36 0.22 5 -0.74 0.23 5 -0.71 0.23 4PALAU PCI 1.24 0.22 2 1.23 0.23 2 1.22 0.28 2 1.17 0.35 2 1.18 0.37 2 1.25 0.30 2 1.13 0.33 1 1.13 0.40 1 1.15 0.42 1 1.20 0.30 1PANAMA PAN 0.59 0.14 13 0.56 0.14 12 0.51 0.17 12 0.39 0.17 11 0.50 0.17 11 0.50 0.19 8 0.57 0.20 8 0.59 0.20 7 0.51 0.22 6 0.24 0.22 5PAPUA NEW GUINEA PNG 0.09 0.14 9 0.13 0.14 8 0.08 0.18 7 -0.19 0.17 7 -0.33 0.18 7 -0.06 0.18 6 -0.09 0.18 6 -0.01 0.22 5 0.07 0.23 5 0.44 0.23 4PARAGUAY PRY -0.33 0.13 14 -0.35 0.13 13 -0.45 0.14 13 -0.40 0.16 11 -0.47 0.16 11 -0.38 0.17 9 -0.50 0.17 9 -0.61 0.20 7 -0.45 0.22 6 0.06 0.22 5PERU PER 0.02 0.12 18 0.03 0.11 16 0.06 0.13 15 0.03 0.15 12 -0.11 0.16 11 0.04 0.17 9 0.15 0.17 9 -0.16 0.20 7 -0.57 0.22 6 -0.27 0.22 5PHILIPPINES PHL -0.20 0.12 16 -0.16 0.12 15 -0.08 0.13 15 0.03 0.15 12 0.03 0.16 11 0.06 0.17 9 0.14 0.17 9 0.18 0.21 7 0.39 0.23 6 0.17 0.23 5POLAND POL 0.86 0.13 14 0.80 0.13 12 0.75 0.15 12 0.96 0.16 10 1.02 0.17 9 1.09 0.17 9 1.08 0.17 9 1.04 0.21 7 1.05 0.23 6 0.98 0.23 5PORTUGAL PRT 1.19 0.15 11 1.24 0.15 10 1.32 0.18 10 1.43 0.19 8 1.48 0.19 8 1.38 0.20 8 1.30 0.20 8 1.33 0.21 7 1.46 0.23 6 1.27 0.23 5PUERTO RICO PRI 1.31 0.23 4 1.29 0.23 4 1.25 0.28 3 1.10 0.30 2 0.93 0.30 2 1.06 0.29 2 1.07 0.29 2 0.87 0.48 1 0.88 0.47 1 .. .. ..QATAR QAT -0.77 0.14 10 -0.73 0.14 9 -0.59 0.16 9 -0.40 0.16 9 -0.47 0.18 7 -0.67 0.17 7 -0.62 0.22 5 -0.54 0.23 4 -0.75 0.24 4 -0.94 0.25 3REUNION REU 1.22 0.54 1 1.22 0.54 1 1.29 0.52 1 1.37 0.42 1 1.15 0.39 1 .. .. .. . . .. . . .. .. .. .. . . .. . . .. ..ROMANIA ROM 0.48 0.12 15 0.49 0.12 14 0.55 0.14 14 0.36 0.15 12 0.37 0.16 11 0.34 0.15 10 0.46 0.15 9 0.40 0.22 6 0.36 0.23 5 0.18 0.23 4RUSSIA RUS -0.97 0.11 16 -0.98 0.11 15 -0.92 0.13 15 -0.65 0.14 12 -0.58 0.15 11 -0.57 0.15 10 -0.37 0.15 10 -0.46 0.21 7 -0.58 0.23 6 -0.43 0.23 5RWANDA RWA -1.24 0.13 12 -1.25 0.13 10 -1.27 0.16 9 -1.30 0.19 7 -1.37 0.19 7 -1.26 0.20 5 -1.49 0.20 5 -1.50 0.29 3 -1.34 0.29 3 -1.33 0.28 2SAMOA SAM 0.63 0.20 4 0.63 0.21 3 0.65 0.26 3 0.59 0.28 3 0.57 0.28 3 0.70 0.26 3 0.68 0.29 2 0.70 0.32 2 0.52 0.33 2 0.71 0.30 1SAN MARINO SMR 1.12 0.22 2 1.11 0.23 2 1.17 0.28 2 1.13 0.35 2 1.14 0.37 2 1.21 0.30 2 1.27 0.33 1 1.41 0.40 1 1.43 0.42 1 1.49 0.30 1SAO TOME AND PRINCIPE STP 0.24 0.17 5 0.36 0.18 4 0.50 0.25 5 0.09 0.27 4 0.09 0.27 4 0.41 0.26 3 0.59 0.29 2 0.36 0.32 2 0.27 0.33 2 0.51 0.30 1SAUDI ARABIA SAU -1.74 0.13 13 -1.62 0.13 10 -1.62 0.16 10 -1.32 0.16 8 -1.41 0.18 7 -1.63 0.17 7 -1.64 0.17 8 -1.49 0.22 5 -1.50 0.23 5 -1.62 0.23 4SENEGAL SEN -0.16 0.12 16 -0.08 0.12 14 0.14 0.14 13 0.07 0.17 9 0.09 0.18 9 0.12 0.17 9 0.27 0.17 8 0.03 0.22 5 -0.07 0.23 5 -0.10 0.23 4SERBIA YUG 0.19 0.13 13 0.25 0.13 11 0.15 0.16 11 -0.19 0.16 9 -0.10 0.16 9 -0.03 0.15 9 -0.12 0.16 8 -0.72 0.22 5 -1.14 0.23 5 -1.38 0.23 4SEYCHELLES SYC -0.04 0.17 5 -0.05 0.17 5 -0.12 0.24 5 0.16 0.21 6 0.38 0.21 6 -0.08 0.25 4 0.11 0.27 3 0.00 0.32 2 0.02 0.33 2 0.04 0.30 1SIERRA LEONE SLE -0.28 0.12 13 -0.39 0.12 12 -0.46 0.14 12 -0.62 0.18 8 -0.43 0.18 8 -0.64 0.16 7 -0.73 0.19 6 -1.57 0.26 3 -1.47 0.28 3 -0.94 0.26 3SINGAPORE SGP -0.41 0.13 12 -0.45 0.14 11 -0.48 0.16 11 0.04 0.17 9 0.02 0.17 9 -0.01 0.17 9 0.07 0.17 8 0.25 0.21 7 0.27 0.23 6 -0.21 0.23 5SLOVAKIA SVK 0.89 0.14 11 0.93 0.14 10 1.03 0.18 10 0.92 0.17 9 0.96 0.17 9 1.04 0.17 9 0.99 0.17 8 0.79 0.21 7 0.71 0.23 5 0.25 0.23 4SLOVENIA SVN 1.02 0.14 12 1.07 0.14 11 1.08 0.17 11 1.06 0.16 10 1.10 0.17 9 1.16 0.17 9 1.12 0.17 9 1.05 0.21 7 1.20 0.23 5 1.10 0.25 3SOLOMON ISLANDS SLB 0.19 0.20 5 0.13 0.21 4 0.20 0.26 3 0.08 0.28 3 -0.20 0.28 3 0.35 0.30 2 0.42 0.33 1 0.20 0.40 1 1.02 0.42 1 1.10 0.30 1SOMALIA SOM -1.85 0.16 7 -1.88 0.16 6 -1.82 0.18 6 -1.89 0.20 7 -1.76 0.20 7 -1.56 0.19 6 -1.47 0.19 5 -1.86 0.26 3 -2.03 0.28 3 -1.91 0.28 2SOUTH AFRICA ZAF 0.68 0.12 16 0.71 0.12 15 0.83 0.14 15 0.75 0.16 12 0.75 0.17 11 0.78 0.17 10 0.69 0.17 10 0.75 0.21 7 0.85 0.23 6 0.89 0.23 5SPAIN ESP 1.12 0.14 12 1.10 0.14 11 1.06 0.18 10 1.11 0.19 8 1.30 0.19 8 1.24 0.20 8 1.25 0.20 8 1.26 0.21 7 1.29 0.23 6 1.15 0.23 5SRI LANKA LKA -0.44 0.12 15 -0.42 0.12 14 -0.25 0.13 13 -0.21 0.15 11 -0.16 0.16 10 -0.14 0.15 9 -0.14 0.17 8 -0.29 0.22 6 -0.15 0.23 5 -0.24 0.23 4ST. KITTS AND NEVIS KNA 1.12 0.21 3 1.11 0.21 3 1.10 0.26 3 1.09 0.27 4 0.46 0.27 4 0.81 0.30 2 0.97 0.33 1 0.96 0.40 1 0.98 0.42 1 1.03 0.30 1ST. LUCIA LCA 1.24 0.21 3 1.22 0.21 3 1.23 0.26 3 1.17 0.27 4 0.68 0.27 4 1.13 0.30 2 1.15 0.33 1 1.05 0.40 1 1.07 0.42 1 1.12 0.30 1ST. VINCENT AND THE GRENADINES VCT 1.11 0.21 3 1.10 0.21 3 1.04 0.26 3 1.06 0.27 4 0.74 0.27 4 1.09 0.30 2 0.99 0.33 1 1.00 0.40 1 1.02 0.42 1 1.07 0.30 1SUDAN SDN -1.77 0.13 13 -1.68 0.13 11 -1.73 0.17 9 -1.70 0.18 8 -1.66 0.18 8 -1.55 0.17 7 -1.52 0.17 7 -1.71 0.22 5 -1.75 0.23 5 -1.95 0.23 4SURINAME SUR 0.57 0.16 8 0.51 0.17 6 0.11 0.22 7 0.10 0.25 5 0.13 0.24 5 0.38 0.24 4 0.35 0.25 3 0.19 0.26 3 -0.22 0.28 3 0.21 0.28 2SWAZILAND SWZ -1.20 0.15 8 -1.24 0.15 7 -1.20 0.18 7 -1.35 0.22 6 -1.31 0.22 6 -1.39 0.25 4 -1.25 0.25 4 -1.39 0.29 3 -1.23 0.29 3 -1.08 0.28 2SWEDEN SWE 1.53 0.14 12 1.49 0.15 11 1.39 0.17 11 1.58 0.18 9 1.76 0.19 8 1.54 0.20 8 1.52 0.20 8 1.61 0.21 7 1.58 0.23 6 1.42 0.23 5SWITZERLAND CHE 1.45 0.16 10 1.51 0.16 9 1.50 0.21 9 1.60 0.19 8 1.71 0.19 8 1.46 0.20 8 1.42 0.20 8 1.45 0.21 7 1.44 0.23 6 1.39 0.23 5SYRIA SYR -1.75 0.12 13 -1.77 0.12 12 -1.74 0.14 11 -1.51 0.15 10 -1.52 0.16 9 -1.57 0.17 7 -1.57 0.17 7 -1.53 0.22 5 -1.47 0.23 5 -1.61 0.23 4TAIWAN TWN 0.70 0.14 11 0.72 0.14 11 0.66 0.16 11 0.93 0.17 9 0.86 0.17 9 0.97 0.17 9 0.93 0.17 9 0.78 0.21 7 0.82 0.23 6 0.59 0.23 5TAJIKISTAN TJK -1.32 0.12 12 -1.29 0.12 11 -1.28 0.14 12 -1.16 0.17 9 -1.30 0.17 8 -1.20 0.17 6 -1.25 0.17 6 -1.42 0.29 3 -1.71 0.29 3 -1.74 0.28 2TANZANIA TZA -0.09 0.13 15 -0.13 0.13 14 -0.14 0.16 13 -0.28 0.16 11 -0.50 0.17 10 -0.41 0.17 9 -0.33 0.17 8 -0.42 0.22 5 -0.55 0.23 5 -0.65 0.23 4THAILAND THA -0.56 0.12 15 -0.61 0.12 13 -0.55 0.14 13 0.03 0.16 11 0.12 0.16 11 0.26 0.17 9 0.34 0.17 9 0.51 0.21 7 0.40 0.23 6 0.29 0.23 5TIMOR-LESTE TMP 0.15 0.14 9 0.07 0.14 8 -0.36 0.18 8 -0.19 0.21 7 0.08 0.22 6 0.19 0.19 5 0.28 0.29 2 0.07 0.40 1 .. . . .. . . .. ..TOGO TGO -1.13 0.14 10 -1.22 0.14 9 -1.35 0.18 9 -1.43 0.20 7 -1.31 0.20 7 -1.41 0.19 6 -1.46 0.19 6 -1.26 0.25 4 -1.18 0.26 4 -1.04 0.26 3TONGA TON -0.08 0.19 5 -0.12 0.20 4 -0.03 0.24 4 -0.09 0.26 4 -0.26 0.27 4 -0.16 0.30 2 0.01 0.33 1 -0.04 0.40 1 -0.07 0.42 1 -0.09 0.30 1TRINIDAD AND TOBAGO TTO 0.53 0.16 9 0.61 0.16 8 0.65 0.21 8 0.60 0.19 8 0.59 0.19 8 0.61 0.20 7 0.53 0.21 6 0.53 0.22 6 0.81 0.23 5 0.81 0.23 4TUNISIA TUN -1.26 0.12 14 -1.27 0.12 12 -1.18 0.13 12 -0.99 0.15 11 -0.81 0.16 10 -0.93 0.17 8 -0.96 0.17 8 -0.71 0.22 5 -0.76 0.23 5 -0.86 0.23 4TURKEY TUR -0.19 0.12 16 -0.20 0.12 14 -0.12 0.13 14 -0.05 0.15 12 -0.06 0.16 11 -0.13 0.17 9 -0.28 0.17 9 -0.48 0.21 7 -0.68 0.23 6 -0.44 0.23 5TURKMENISTAN TKM -2.06 0.14 8 -2.11 0.15 7 -1.95 0.20 6 -1.99 0.19 6 -2.00 0.22 5 -1.86 0.20 5 -1.93 0.20 5 -1.67 0.29 3 -1.63 0.29 3 -1.81 0.28 2TUVALU TUV 0.79 0.21 3 0.78 0.21 3 0.75 0.26 3 0.64 0.28 3 0.56 0.28 3 1.04 0.30 2 1.15 0.33 1 1.41 0.40 1 1.43 0.42 1 1.49 0.30 1UGANDA UGA -0.47 0.11 17 -0.48 0.11 16 -0.42 0.12 16 -0.53 0.15 12 -0.66 0.16 11 -0.74 0.15 10 -0.98 0.17 8 -1.11 0.22 5 -0.89 0.23 5 -0.50 0.23 4UKRAINE UKR -0.03 0.11 16 -0.06 0.11 14 -0.10 0.13 12 -0.42 0.15 10 -0.63 0.15 10 -0.71 0.14 10 -0.58 0.15 9 -0.57 0.22 6 -0.32 0.23 5 -0.30 0.25 3UNITED ARAB EMIRATES ARE -0.98 0.14 10 -1.00 0.14 9 -0.86 0.17 9 -0.68 0.16 9 -0.78 0.17 8 -0.82 0.20 6 -0.72 0.21 6 -0.58 0.22 5 -0.56 0.23 5 -1.02 0.23 4UNITED KINGDOM GBR 1.33 0.14 12 1.33 0.15 11 1.43 0.17 11 1.47 0.18 9 1.60 0.19 8 1.29 0.20 8 1.27 0.20 8 1.36 0.21 7 1.30 0.23 6 1.02 0.23 5UNITED STATES USA 1.12 0.14 14 1.09 0.14 13 1.10 0.16 12 1.33 0.19 8 1.34 0.19 8 1.30 0.20 8 1.33 0.20 8 1.37 0.21 7 1.37 0.23 6 1.29 0.23 5URUGUAY URY 1.02 0.14 12 0.97 0.14 11 0.97 0.18 10 0.88 0.17 10 0.85 0.17 10 1.02 0.17 9 1.00 0.17 9 0.92 0.20 7 0.88 0.22 6 0.94 0.22 5UZBEKISTAN UZB -1.90 0.12 10 -1.91 0.12 10 -1.90 0.14 9 -1.82 0.15 8 -1.74 0.15 8 -1.76 0.14 8 -1.66 0.16 7 -1.64 0.28 3 -1.56 0.29 3 -1.52 0.25 3VANUATU VUT 0.62 0.20 4 0.51 0.19 4 0.61 0.26 3 0.36 0.28 3 0.35 0.28 3 0.86 0.30 2 0.92 0.33 1 0.50 0.40 1 0.44 0.42 1 0.47 0.30 1VENEZUELA VEN -0.62 0.12 17 -0.60 0.12 15 -0.45 0.14 14 -0.61 0.16 12 -0.59 0.15 12 -0.53 0.15 11 -0.56 0.17 10 -0.13 0.20 8 0.00 0.22 7 0.08 0.22 6VIETNAM VNM -1.62 0.12 15 -1.60 0.12 14 -1.59 0.13 14 -1.43 0.15 11 -1.39 0.16 10 -1.54 0.15 9 -1.50 0.17 8 -1.27 0.22 6 -1.36 0.23 5 -1.50 0.23 4VIRGIN ISLANDS (U.S.) VIR 0.79 0.54 1 0.78 0.54 1 0.83 0.52 1 1.13 0.42 1 0.72 0.39 1 .. .. .. . . .. . . .. .. .. .. . . .. . . .. ..WEST BANK GAZA WBG -0.94 0.16 7 -0.87 0.17 6 -1.09 0.23 6 -0.75 0.22 5 -1.02 0.28 4 -1.29 0.27 3 -1.21 0.27 3 -1.09 0.32 2 -0.99 0.33 2 -0.70 0.30 1YEMEN YEM -1.18 0.11 15 -1.08 0.11 13 -1.03 0.13 13 -0.99 0.15 10 -0.89 0.16 9 -1.05 0.15 8 -1.20 0.17 7 -0.92 0.22 5 -0.77 0.23 5 -0.94 0.23 4ZAMBIA ZMB -0.09 0.12 15 -0.23 0.12 14 -0.31 0.14 14 -0.48 0.15 11 -0.38 0.16 11 -0.35 0.17 9 -0.36 0.17 8 -0.41 0.22 5 -0.49 0.23 5 -0.49 0.23 4ZIMBABWE ZWE -1.52 0.12 15 -1.54 0.11 15 -1.45 0.13 15 -1.64 0.15 11 -1.53 0.16 10 -1.42 0.15 9 -1.47 0.17 8 -1.15 0.22 6 -0.81 0.23 5 -0.63 0.23 4
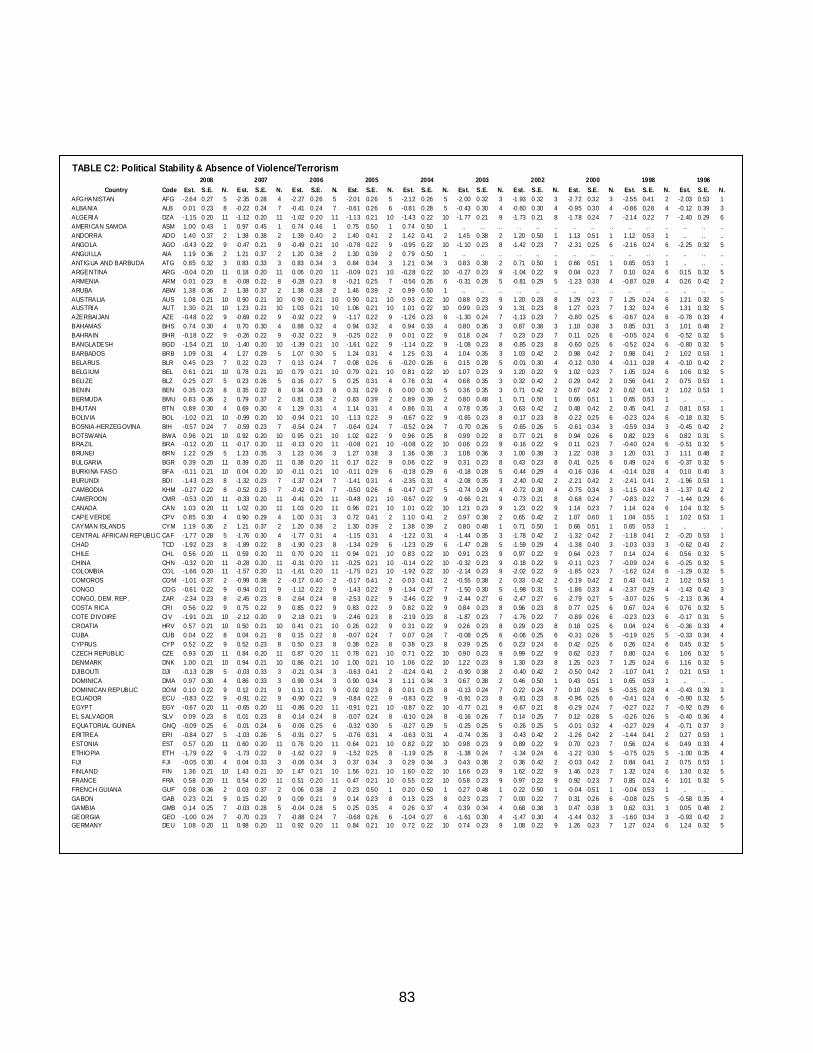
83
TABLE C2: Political Stability & Absence of Violence/Terrorism2008 2007 2006 2005 2004 2003 2002 2000 1998 1996
Country Code Est. S.E. N. Est. S.E. N. Est. S.E. N. Est. S.E. N. Est. S.E. N. Est. S.E. N. Est. S.E. N. Est. S.E. N. Est. S.E. N. Est. S.E. N.AFGHANISTAN AFG -2.64 0.27 5 -2.35 0.28 4 -2.27 0.26 5 -2.01 0.26 5 -2.12 0.26 5 -2.00 0.32 3 -1.93 0.32 3 -2.72 0.32 3 -2.55 0.41 2 -2.03 0.53 1ALBANIA ALB 0.01 0.23 8 -0.22 0.24 7 -0.41 0.24 7 -0.61 0.26 6 -0.81 0.28 5 -0.43 0.30 4 -0.60 0.30 4 -0.95 0.30 4 -0.86 0.28 4 -0.12 0.39 3ALGERIA DZA -1.15 0.20 11 -1.12 0.20 11 -1.02 0.20 11 -1.13 0.21 10 -1.43 0.22 10 -1.77 0.21 9 -1.73 0.21 8 -1.78 0.24 7 -2.14 0.22 7 -2.40 0.29 6AMERICAN SAMOA ASM 1.00 0.43 1 0.97 0.45 1 0.74 0.46 1 0.75 0.50 1 0.74 0.50 1 .. .. .. . . .. .. .. .. . . .. . . .. .. . . ..ANDORRA ADO 1.40 0.37 2 1.38 0.38 2 1.39 0.40 2 1.40 0.41 2 1.42 0.41 2 1.45 0.38 2 1.20 0.50 1 1.13 0.51 1 1.12 0.53 1 .. . . ..ANGOLA AGO -0.43 0.22 9 -0.47 0.21 9 -0.49 0.21 10 -0.78 0.22 9 -0.95 0.22 10 -1.10 0.23 8 -1.42 0.23 7 -2.31 0.25 6 -2.16 0.24 6 -2.25 0.32 5ANGUILLA AIA 1.19 0.36 2 1.21 0.37 2 1.20 0.38 2 1.30 0.39 2 0.79 0.50 1 .. .. .. . . .. .. .. .. . . .. . . .. .. . . ..ANTIGUA AND BARBUDA ATG 0.85 0.32 3 0.83 0.33 3 0.83 0.34 3 0.84 0.34 3 1.21 0.34 3 0.83 0.38 2 0.71 0.50 1 0.66 0.51 1 0.65 0.53 1 .. . . ..ARGENTINA ARG -0.04 0.20 11 0.18 0.20 11 0.06 0.20 11 -0.09 0.21 10 -0.28 0.22 10 -0.27 0.23 9 -1.04 0.22 9 0.04 0.23 7 0.10 0.24 6 0.15 0.32 5ARMENIA ARM 0.01 0.23 8 -0.08 0.22 8 -0.28 0.23 8 -0.21 0.25 7 -0.56 0.26 6 -0.31 0.28 5 -0.81 0.29 5 -1.23 0.30 4 -0.87 0.28 4 0.26 0.42 2ARUBA ABW 1.38 0.36 2 1.38 0.37 2 1.38 0.38 2 1.46 0.39 2 0.99 0.50 1 .. .. .. . . .. .. .. .. . . .. . . .. .. . . ..AUSTRALIA AUS 1.08 0.21 10 0.90 0.21 10 0.90 0.21 10 0.90 0.21 10 0.93 0.22 10 0.88 0.23 9 1.20 0.23 8 1.29 0.23 7 1.25 0.24 6 1.21 0.32 5AUSTRIA AUT 1.30 0.21 10 1.23 0.21 10 1.03 0.21 10 1.06 0.21 10 1.01 0.22 10 0.99 0.23 9 1.31 0.23 8 1.27 0.23 7 1.32 0.24 6 1.31 0.32 5AZERBAIJAN AZE -0.48 0.22 9 -0.69 0.22 9 -0.92 0.22 9 -1.17 0.22 9 -1.26 0.23 8 -1.30 0.24 7 -1.13 0.23 7 -0.80 0.25 6 -0.67 0.24 6 -0.78 0.33 4BAHAMAS BHS 0.74 0.30 4 0.70 0.30 4 0.88 0.32 4 0.94 0.32 4 0.94 0.33 4 0.80 0.36 3 0.87 0.38 3 1.10 0.38 3 0.85 0.31 3 1.01 0.48 2BAHRAIN BHR -0.18 0.22 9 -0.26 0.22 9 -0.32 0.22 9 -0.25 0.22 9 0.01 0.22 9 0.18 0.24 7 0.23 0.23 7 0.11 0.25 6 -0.05 0.24 6 -0.52 0.32 5BANGLADESH BGD -1.54 0.21 10 -1.40 0.20 10 -1.39 0.21 10 -1.61 0.22 9 -1.14 0.22 9 -1.08 0.23 8 -0.85 0.23 8 -0.60 0.25 6 -0.52 0.24 6 -0.80 0.32 5BARBADOS BRB 1.09 0.31 4 1.27 0.29 5 1.07 0.30 5 1.24 0.31 4 1.25 0.31 4 1.04 0.35 3 1.03 0.42 2 0.98 0.42 2 0.98 0.41 2 1.02 0.53 1BELARUS BLR 0.45 0.23 7 0.22 0.23 7 0.13 0.24 7 0.08 0.26 6 -0.20 0.26 6 0.15 0.28 5 -0.01 0.30 4 -0.12 0.30 4 -0.11 0.28 4 -0.10 0.42 2BELGIUM BEL 0.61 0.21 10 0.78 0.21 10 0.79 0.21 10 0.79 0.21 10 0.81 0.22 10 1.07 0.23 9 1.20 0.22 9 1.02 0.23 7 1.05 0.24 6 1.06 0.32 5BELIZE BLZ 0.25 0.27 5 0.23 0.26 5 0.16 0.27 5 0.25 0.31 4 0.76 0.31 4 0.68 0.35 3 0.32 0.42 2 0.29 0.42 2 0.56 0.41 2 0.75 0.53 1BENIN BEN 0.35 0.23 8 0.35 0.22 8 0.34 0.23 8 0.31 0.29 6 0.00 0.30 5 0.36 0.35 3 0.71 0.42 2 0.67 0.42 2 0.62 0.41 2 1.02 0.53 1BERMUDA BMU 0.83 0.36 2 0.79 0.37 2 0.81 0.38 2 0.83 0.39 2 0.89 0.39 2 0.80 0.48 1 0.71 0.50 1 0.66 0.51 1 0.65 0.53 1 .. . . ..BHUTAN BTN 0.89 0.30 4 0.69 0.30 4 1.29 0.31 4 1.14 0.31 4 0.86 0.31 4 0.78 0.35 3 0.63 0.42 2 0.48 0.42 2 0.45 0.41 2 0.81 0.53 1BOLIVIA BOL -1.02 0.21 10 -0.99 0.20 10 -0.94 0.21 10 -1.13 0.22 9 -0.67 0.22 9 -0.65 0.23 8 -0.17 0.23 8 -0.22 0.25 6 -0.23 0.24 6 -0.18 0.32 5BOSNIA-HERZEGOVINA BIH -0.57 0.24 7 -0.59 0.23 7 -0.54 0.24 7 -0.64 0.24 7 -0.52 0.24 7 -0.70 0.26 5 -0.65 0.26 5 -0.61 0.34 3 -0.59 0.34 3 -0.45 0.42 2BOTSWANA BWA 0.96 0.21 10 0.92 0.20 10 0.95 0.21 10 1.02 0.22 9 0.96 0.25 8 0.99 0.22 8 0.77 0.21 8 0.94 0.26 6 0.82 0.23 6 0.82 0.31 5BRAZIL BRA -0.12 0.20 11 -0.17 0.20 11 -0.13 0.20 11 -0.08 0.21 10 -0.08 0.22 10 0.06 0.23 9 -0.16 0.22 9 0.11 0.23 7 -0.40 0.24 6 -0.51 0.32 5BRUNEI BRN 1.22 0.29 5 1.23 0.35 3 1.23 0.36 3 1.27 0.38 3 1.36 0.38 3 1.08 0.36 3 1.00 0.38 3 1.22 0.38 3 1.20 0.31 3 1.11 0.48 2BULGARIA BGR 0.39 0.20 11 0.39 0.20 11 0.38 0.20 11 0.17 0.22 9 0.06 0.22 9 0.31 0.23 8 0.43 0.23 8 0.41 0.25 6 0.49 0.24 6 -0.37 0.32 5BURKINA FASO BFA -0.11 0.21 10 0.04 0.20 10 -0.11 0.21 10 -0.11 0.29 6 -0.18 0.29 6 -0.18 0.28 5 -0.44 0.29 4 -0.16 0.36 4 -0.14 0.28 4 0.10 0.40 3BURUNDI BDI -1.43 0.23 8 -1.32 0.23 7 -1.37 0.24 7 -1.41 0.31 4 -2.35 0.31 4 -2.08 0.35 3 -2.40 0.42 2 -2.21 0.42 2 -2.41 0.41 2 -1.96 0.53 1CAMBODIA KHM -0.27 0.22 8 -0.52 0.23 7 -0.42 0.24 7 -0.50 0.26 6 -0.47 0.27 5 -0.74 0.29 4 -0.72 0.30 4 -0.75 0.34 3 -1.15 0.34 3 -1.37 0.42 2CAMEROON CMR -0.53 0.20 11 -0.33 0.20 11 -0.41 0.20 11 -0.48 0.21 10 -0.67 0.22 9 -0.66 0.21 9 -0.73 0.21 8 -0.68 0.24 7 -0.83 0.22 7 -1.44 0.29 6CANADA CAN 1.03 0.20 11 1.02 0.20 11 1.03 0.20 11 0.96 0.21 10 1.01 0.22 10 1.21 0.23 9 1.23 0.22 9 1.14 0.23 7 1.14 0.24 6 1.04 0.32 5CAPE VERDE CPV 0.85 0.30 4 0.90 0.29 4 1.00 0.31 3 0.72 0.41 2 1.10 0.41 2 0.97 0.38 2 0.65 0.42 2 1.07 0.60 1 1.04 0.55 1 1.02 0.53 1CAYMAN ISLANDS CYM 1.19 0.36 2 1.21 0.37 2 1.20 0.38 2 1.30 0.39 2 1.38 0.39 2 0.80 0.48 1 0.71 0.50 1 0.66 0.51 1 0.65 0.53 1 .. . . ..CENTRAL AFRICAN REPUBLIC CAF -1.77 0.28 5 -1.76 0.30 4 -1.77 0.31 4 -1.15 0.31 4 -1.22 0.31 4 -1.44 0.35 3 -1.78 0.42 2 -1.32 0.42 2 -1.18 0.41 2 -0.20 0.53 1CHAD TCD -1.92 0.23 8 -1.89 0.22 8 -1.90 0.23 8 -1.34 0.29 6 -1.23 0.29 6 -1.47 0.28 5 -1.59 0.29 4 -1.38 0.40 3 -1.03 0.33 3 -0.62 0.43 2CHILE CHL 0.56 0.20 11 0.59 0.20 11 0.70 0.20 11 0.94 0.21 10 0.83 0.22 10 0.91 0.23 9 0.97 0.22 9 0.64 0.23 7 0.14 0.24 6 0.56 0.32 5CHINA CHN -0.32 0.20 11 -0.28 0.20 11 -0.31 0.20 11 -0.25 0.21 10 -0.14 0.22 10 -0.32 0.23 9 -0.18 0.22 9 -0.11 0.23 7 -0.09 0.24 6 -0.25 0.32 5COLOMBIA COL -1.66 0.20 11 -1.57 0.20 11 -1.61 0.20 11 -1.75 0.21 10 -1.92 0.22 10 -2.14 0.23 9 -2.02 0.22 9 -1.85 0.23 7 -1.62 0.24 6 -1.29 0.32 5COMOROS COM -1.01 0.37 2 -0.99 0.38 2 -0.17 0.40 2 -0.17 0.41 2 0.03 0.41 2 -0.55 0.38 2 0.33 0.42 2 -0.19 0.42 2 0.43 0.41 2 1.02 0.53 1CONGO COG -0.61 0.22 9 -0.94 0.21 9 -1.12 0.22 9 -1.43 0.22 9 -1.34 0.27 7 -1.50 0.30 5 -1.98 0.31 5 -1.86 0.33 4 -2.37 0.29 4 -1.43 0.42 3CONGO, DEM. REP. ZAR -2.34 0.23 8 -2.45 0.23 8 -2.64 0.24 8 -2.53 0.22 9 -2.46 0.22 9 -2.44 0.27 6 -2.47 0.27 6 -2.79 0.27 5 -3.07 0.26 5 -2.13 0.36 4COSTA RICA CRI 0.56 0.22 9 0.75 0.22 9 0.85 0.22 9 0.83 0.22 9 0.82 0.22 9 0.84 0.23 8 0.96 0.23 8 0.77 0.25 6 0.67 0.24 6 0.76 0.32 5COTE D'IVOIRE CIV -1.91 0.21 10 -2.12 0.20 9 -2.18 0.21 9 -2.46 0.23 8 -2.19 0.23 8 -1.87 0.23 7 -1.76 0.22 7 -0.89 0.26 6 -0.23 0.23 6 -0.17 0.31 5CROATIA HRV 0.57 0.21 10 0.50 0.21 10 0.41 0.21 10 0.26 0.22 9 0.31 0.22 9 0.26 0.23 8 0.29 0.23 8 0.18 0.25 6 0.04 0.24 6 -0.36 0.33 4CUBA CUB 0.04 0.22 8 0.04 0.21 8 0.15 0.22 8 -0.07 0.24 7 0.07 0.24 7 -0.08 0.25 6 -0.06 0.25 6 -0.31 0.26 5 -0.19 0.25 5 -0.33 0.34 4CYPRUS CYP 0.52 0.22 9 0.52 0.23 8 0.50 0.23 8 0.38 0.23 8 0.38 0.23 8 0.39 0.25 6 0.23 0.24 6 0.42 0.25 6 0.26 0.24 6 0.45 0.32 5CZECH REPUBLIC CZE 0.93 0.20 11 0.84 0.20 11 0.87 0.20 11 0.78 0.21 10 0.71 0.22 10 0.90 0.23 9 0.99 0.22 9 0.62 0.23 7 0.80 0.24 6 1.06 0.32 5DENMARK DNK 1.00 0.21 10 0.94 0.21 10 0.86 0.21 10 1.00 0.21 10 1.06 0.22 10 1.22 0.23 9 1.30 0.23 8 1.25 0.23 7 1.25 0.24 6 1.16 0.32 5DJIBOUTI DJI -0.13 0.28 5 -0.03 0.33 3 -0.21 0.34 3 -0.63 0.41 2 -0.24 0.41 2 -0.90 0.38 2 -0.40 0.42 2 -0.50 0.42 2 -1.07 0.41 2 0.21 0.53 1DOMINICA DMA 0.97 0.30 4 0.86 0.33 3 0.99 0.34 3 0.90 0.34 3 1.11 0.34 3 0.67 0.38 2 0.46 0.50 1 0.43 0.51 1 0.65 0.53 1 .. . . ..DOMINICAN REPUBLIC DOM 0.10 0.22 9 0.12 0.21 9 0.11 0.21 9 0.02 0.23 8 0.01 0.23 8 -0.13 0.24 7 0.22 0.24 7 0.10 0.26 5 -0.35 0.28 4 -0.43 0.39 3ECUADOR ECU -0.83 0.22 9 -0.91 0.22 9 -0.90 0.22 9 -0.84 0.22 9 -0.83 0.22 9 -0.91 0.23 8 -0.81 0.23 8 -0.96 0.25 6 -0.41 0.24 6 -0.90 0.32 5EGYPT EGY -0.67 0.20 11 -0.65 0.20 11 -0.86 0.20 11 -0.91 0.21 10 -0.87 0.22 10 -0.77 0.21 9 -0.67 0.21 8 -0.29 0.24 7 -0.27 0.22 7 -0.92 0.29 6EL SALVADOR SLV 0.09 0.23 8 0.01 0.23 8 -0.14 0.24 8 -0.07 0.24 8 -0.10 0.24 8 -0.16 0.26 7 0.14 0.25 7 0.12 0.28 5 -0.26 0.26 5 -0.40 0.36 4EQUATORIAL GUINEA GNQ -0.09 0.25 6 -0.01 0.24 6 -0.06 0.25 6 -0.32 0.30 5 -0.27 0.29 5 -0.25 0.25 5 -0.26 0.25 5 -0.01 0.32 4 -0.27 0.29 4 -0.71 0.37 3ERITREA ERI -0.84 0.27 5 -1.03 0.26 5 -0.91 0.27 5 -0.76 0.31 4 -0.63 0.31 4 -0.74 0.35 3 -0.43 0.42 2 -1.26 0.42 2 -1.44 0.41 2 0.27 0.53 1ESTONIA EST 0.57 0.20 11 0.60 0.20 11 0.76 0.20 11 0.64 0.21 10 0.82 0.22 10 0.98 0.23 9 0.89 0.22 9 0.70 0.23 7 0.56 0.24 6 0.49 0.33 4ETHIOPIA ETH -1.79 0.22 9 -1.73 0.22 9 -1.62 0.22 9 -1.52 0.25 8 -1.19 0.25 8 -1.38 0.24 7 -1.34 0.24 6 -1.22 0.30 5 -0.75 0.25 5 -1.00 0.35 4FIJI FJI -0.05 0.30 4 0.04 0.33 3 -0.06 0.34 3 0.37 0.34 3 0.29 0.34 3 0.43 0.38 2 0.36 0.42 2 -0.03 0.42 2 0.84 0.41 2 0.75 0.53 1FINLAND FIN 1.36 0.21 10 1.43 0.21 10 1.47 0.21 10 1.56 0.21 10 1.60 0.22 10 1.66 0.23 9 1.62 0.22 9 1.46 0.23 7 1.32 0.24 6 1.30 0.32 5FRANCE FRA 0.58 0.20 11 0.54 0.20 11 0.51 0.20 11 0.47 0.21 10 0.55 0.22 10 0.58 0.23 9 0.97 0.22 9 0.92 0.23 7 0.85 0.24 6 1.01 0.32 5FRENCH GUIANA GUF 0.08 0.36 2 0.03 0.37 2 0.06 0.38 2 0.23 0.50 1 0.20 0.50 1 0.27 0.48 1 0.22 0.50 1 -0.04 0.51 1 -0.04 0.53 1 .. . . ..GABON GAB 0.23 0.21 9 0.15 0.20 9 0.09 0.21 9 0.14 0.23 8 0.13 0.23 8 0.23 0.23 7 0.00 0.22 7 0.31 0.26 6 -0.08 0.25 5 -0.58 0.35 4GAMBIA GMB 0.14 0.25 7 -0.03 0.28 5 -0.04 0.28 5 0.25 0.35 4 0.26 0.37 4 0.39 0.34 4 0.68 0.38 3 0.47 0.38 3 0.62 0.31 3 0.05 0.48 2GEORGIA GEO -1.00 0.24 7 -0.70 0.23 7 -0.88 0.24 7 -0.68 0.26 6 -1.04 0.27 6 -1.61 0.30 4 -1.47 0.30 4 -1.44 0.32 3 -1.60 0.34 3 -0.93 0.42 2GERMANY DEU 1.08 0.20 11 0.98 0.20 11 0.92 0.20 11 0.84 0.21 10 0.72 0.22 10 0.74 0.23 9 1.08 0.22 9 1.26 0.23 7 1.27 0.24 6 1.24 0.32 5
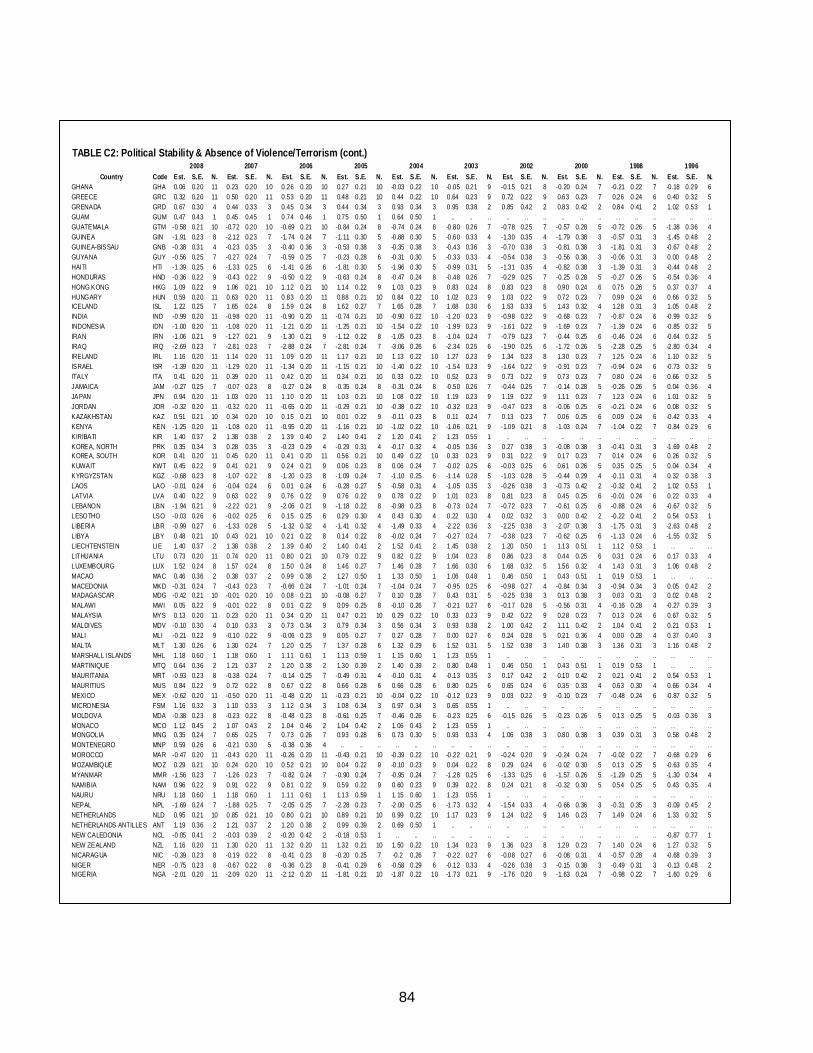
84
TABLE C2: Political Stability & Absence of Violence/Terrorism (cont.)
2008 2007 2006 2005 2004 2003 2002 2000 1998 1996Country Code Est. S.E. N. Est. S.E. N. Est. S.E. N. Est. S.E. N. Est. S.E. N. Est. S.E. N. Est. S.E. N. Est. S.E. N. Est. S.E. N. Est. S.E. N.
GHANA GHA 0.06 0.20 11 0.23 0.20 10 0.26 0.20 10 0.27 0.21 10 -0.03 0.22 10 -0.05 0.21 9 -0.15 0.21 8 -0.20 0.24 7 -0.21 0.22 7 -0.18 0.29 6GREECE GRC 0.32 0.20 11 0.50 0.20 11 0.53 0.20 11 0.48 0.21 10 0.44 0.22 10 0.64 0.23 9 0.72 0.22 9 0.63 0.23 7 0.26 0.24 6 0.40 0.32 5GRENADA GRD 0.67 0.30 4 0.44 0.33 3 0.45 0.34 3 0.44 0.34 3 0.93 0.34 3 0.95 0.38 2 0.85 0.42 2 0.83 0.42 2 0.84 0.41 2 1.02 0.53 1GUAM GUM 0.47 0.43 1 0.45 0.45 1 0.74 0.46 1 0.75 0.50 1 0.64 0.50 1 .. .. . . .. . . .. .. . . .. . . .. .. . . .. . .GUATEMALA GTM -0.58 0.21 10 -0.72 0.20 10 -0.69 0.21 10 -0.84 0.24 8 -0.74 0.24 8 -0.80 0.26 7 -0.78 0.25 7 -0.57 0.28 5 -0.72 0.26 5 -1.38 0.36 4GUINEA GIN -1.91 0.23 8 -2.12 0.23 7 -1.74 0.24 7 -1.11 0.30 5 -0.88 0.30 5 -0.60 0.33 4 -1.30 0.35 4 -1.79 0.38 3 -0.57 0.31 3 -1.45 0.48 2GUINEA-BISSAU GNB -0.38 0.31 4 -0.23 0.35 3 -0.40 0.36 3 -0.53 0.38 3 -0.35 0.38 3 -0.43 0.36 3 -0.70 0.38 3 -0.81 0.38 3 -1.81 0.31 3 -0.67 0.48 2GUYANA GUY -0.56 0.25 7 -0.27 0.24 7 -0.59 0.25 7 -0.23 0.28 6 -0.31 0.30 5 -0.33 0.33 4 -0.54 0.38 3 -0.56 0.38 3 -0.06 0.31 3 0.00 0.48 2HAITI HTI -1.39 0.25 6 -1.33 0.25 6 -1.41 0.26 6 -1.81 0.30 5 -1.96 0.30 5 -0.99 0.31 5 -1.31 0.35 4 -0.82 0.38 3 -1.39 0.31 3 -0.44 0.48 2HONDURAS HND -0.36 0.22 9 -0.43 0.22 9 -0.50 0.22 9 -0.63 0.24 8 -0.47 0.24 8 -0.48 0.26 7 -0.29 0.25 7 -0.25 0.28 5 -0.27 0.26 5 -0.54 0.36 4HONG KONG HKG 1.09 0.22 9 1.06 0.21 10 1.12 0.21 10 1.14 0.22 9 1.03 0.23 9 0.83 0.24 8 0.83 0.23 8 0.90 0.24 6 0.75 0.26 5 0.37 0.37 4HUNGARY HUN 0.59 0.20 11 0.63 0.20 11 0.83 0.20 11 0.88 0.21 10 0.84 0.22 10 1.02 0.23 9 1.03 0.22 9 0.72 0.23 7 0.99 0.24 6 0.66 0.32 5ICELAND ISL 1.22 0.25 7 1.65 0.24 8 1.59 0.24 8 1.62 0.27 7 1.65 0.28 7 1.68 0.30 6 1.53 0.33 5 1.43 0.32 4 1.28 0.31 3 1.05 0.48 2INDIA IND -0.99 0.20 11 -0.98 0.20 11 -0.90 0.20 11 -0.74 0.21 10 -0.90 0.22 10 -1.20 0.23 9 -0.98 0.22 9 -0.68 0.23 7 -0.87 0.24 6 -0.99 0.32 5INDONESIA IDN -1.00 0.20 11 -1.08 0.20 11 -1.21 0.20 11 -1.25 0.21 10 -1.54 0.22 10 -1.99 0.23 9 -1.61 0.22 9 -1.69 0.23 7 -1.39 0.24 6 -0.85 0.32 5IRAN IRN -1.06 0.21 9 -1.27 0.21 9 -1.30 0.21 9 -1.12 0.22 8 -1.05 0.23 8 -1.04 0.24 7 -0.79 0.23 7 -0.44 0.25 6 -0.46 0.24 6 -0.64 0.32 5IRAQ IRQ -2.69 0.23 7 -2.81 0.23 7 -2.88 0.24 7 -2.81 0.24 7 -3.06 0.26 6 -2.34 0.25 6 -1.90 0.25 6 -1.72 0.26 5 -2.28 0.25 5 -2.80 0.34 4IRELAND IRL 1.16 0.20 11 1.14 0.20 11 1.09 0.20 11 1.17 0.21 10 1.13 0.22 10 1.27 0.23 9 1.34 0.23 8 1.30 0.23 7 1.25 0.24 6 1.10 0.32 5ISRAEL ISR -1.39 0.20 11 -1.29 0.20 11 -1.34 0.20 11 -1.15 0.21 10 -1.40 0.22 10 -1.54 0.23 9 -1.64 0.22 9 -0.91 0.23 7 -0.94 0.24 6 -0.73 0.32 5ITALY ITA 0.41 0.20 11 0.39 0.20 11 0.42 0.20 11 0.34 0.21 10 0.33 0.22 10 0.52 0.23 9 0.73 0.22 9 0.73 0.23 7 0.80 0.24 6 0.66 0.32 5JAMAICA JAM -0.27 0.25 7 -0.07 0.23 8 -0.27 0.24 8 -0.35 0.24 8 -0.31 0.24 8 -0.50 0.26 7 -0.44 0.25 7 -0.14 0.28 5 -0.26 0.26 5 0.04 0.36 4JAPAN JPN 0.94 0.20 11 1.03 0.20 11 1.10 0.20 11 1.03 0.21 10 1.08 0.22 10 1.19 0.23 9 1.19 0.22 9 1.11 0.23 7 1.23 0.24 6 1.01 0.32 5JORDAN JOR -0.32 0.20 11 -0.32 0.20 11 -0.65 0.20 11 -0.29 0.21 10 -0.38 0.22 10 -0.32 0.23 9 -0.47 0.23 8 -0.06 0.25 6 -0.21 0.24 6 0.08 0.32 5KAZAKHSTAN KAZ 0.51 0.21 10 0.34 0.20 10 0.15 0.21 10 0.01 0.22 9 -0.11 0.23 8 0.11 0.24 7 0.13 0.23 7 0.06 0.25 6 0.09 0.24 6 -0.42 0.33 4KENYA KEN -1.25 0.20 11 -1.08 0.20 11 -0.95 0.20 11 -1.16 0.21 10 -1.02 0.22 10 -1.06 0.21 9 -1.09 0.21 8 -1.03 0.24 7 -1.04 0.22 7 -0.84 0.29 6KIRIBATI KIR 1.40 0.37 2 1.38 0.38 2 1.39 0.40 2 1.40 0.41 2 1.20 0.41 2 1.23 0.55 1 .. . . .. .. . . .. . . .. .. . . .. . .KOREA, NORTH PRK 0.35 0.34 3 0.28 0.35 3 -0.23 0.29 4 -0.29 0.31 4 -0.17 0.32 4 -0.05 0.36 3 0.27 0.38 3 -0.08 0.38 3 -0.41 0.31 3 -1.69 0.48 2KOREA, SOUTH KOR 0.41 0.20 11 0.45 0.20 11 0.41 0.20 11 0.56 0.21 10 0.49 0.22 10 0.33 0.23 9 0.31 0.22 9 0.17 0.23 7 0.14 0.24 6 0.26 0.32 5KUWAIT KWT 0.45 0.22 9 0.41 0.21 9 0.24 0.21 9 0.06 0.23 8 0.06 0.24 7 -0.02 0.25 6 -0.03 0.25 6 0.61 0.26 5 0.35 0.25 5 0.04 0.34 4KYRGYZSTAN KGZ -0.68 0.23 8 -1.07 0.22 8 -1.20 0.23 8 -1.09 0.24 7 -1.10 0.25 6 -1.14 0.28 5 -1.03 0.28 5 -0.44 0.29 4 -0.11 0.31 4 0.32 0.38 3LAOS LAO -0.01 0.24 6 -0.04 0.24 6 0.01 0.24 6 -0.28 0.27 5 -0.58 0.31 4 -1.05 0.35 3 -0.26 0.38 3 -0.73 0.42 2 -0.32 0.41 2 1.02 0.53 1LATVIA LVA 0.40 0.22 9 0.63 0.22 9 0.76 0.22 9 0.76 0.22 9 0.78 0.22 9 1.01 0.23 8 0.81 0.23 8 0.45 0.25 6 -0.01 0.24 6 0.22 0.33 4LEBANON LBN -1.94 0.21 9 -2.22 0.21 9 -2.06 0.21 9 -1.18 0.22 8 -0.98 0.23 8 -0.73 0.24 7 -0.72 0.23 7 -0.61 0.25 6 -0.88 0.24 6 -0.67 0.32 5LESOTHO LSO -0.03 0.26 6 -0.02 0.25 6 0.15 0.25 6 0.29 0.30 4 0.43 0.30 4 0.22 0.30 4 0.02 0.32 3 0.00 0.42 2 -0.22 0.41 2 0.54 0.53 1LIBERIA LBR -0.99 0.27 6 -1.33 0.28 5 -1.32 0.32 4 -1.41 0.32 4 -1.49 0.33 4 -2.22 0.36 3 -2.25 0.38 3 -2.07 0.38 3 -1.75 0.31 3 -2.63 0.48 2LIBYA LBY 0.48 0.21 10 0.43 0.21 10 0.21 0.22 8 0.14 0.22 8 -0.02 0.24 7 -0.27 0.24 7 -0.38 0.23 7 -0.62 0.25 6 -1.13 0.24 6 -1.55 0.32 5LIECHTENSTEIN LIE 1.40 0.37 2 1.38 0.38 2 1.39 0.40 2 1.40 0.41 2 1.52 0.41 2 1.45 0.38 2 1.20 0.50 1 1.13 0.51 1 1.12 0.53 1 .. .. . .LITHUANIA LTU 0.73 0.20 11 0.74 0.20 11 0.80 0.21 10 0.79 0.22 9 0.82 0.22 9 1.04 0.23 8 0.86 0.23 8 0.44 0.25 6 0.31 0.24 6 0.17 0.33 4LUXEMBOURG LUX 1.52 0.24 8 1.57 0.24 8 1.50 0.24 8 1.46 0.27 7 1.46 0.28 7 1.66 0.30 6 1.68 0.32 5 1.56 0.32 4 1.43 0.31 3 1.06 0.48 2MACAO MAC 0.46 0.36 2 0.38 0.37 2 0.99 0.38 2 1.27 0.50 1 1.33 0.50 1 1.06 0.48 1 0.46 0.50 1 0.43 0.51 1 0.19 0.53 1 .. .. . .MACEDONIA MKD -0.31 0.24 7 -0.43 0.23 7 -0.66 0.24 7 -1.01 0.24 7 -1.04 0.24 7 -0.95 0.25 6 -0.98 0.27 4 -0.84 0.34 3 -0.94 0.34 3 0.05 0.42 2MADAGASCAR MDG -0.42 0.21 10 -0.01 0.20 10 0.08 0.21 10 -0.08 0.27 7 0.10 0.28 7 0.43 0.31 5 -0.25 0.38 3 0.13 0.38 3 0.03 0.31 3 0.02 0.48 2MALAWI MWI 0.05 0.22 9 -0.01 0.22 8 0.01 0.22 9 0.09 0.25 8 -0.10 0.26 7 -0.21 0.27 6 -0.17 0.28 5 -0.56 0.31 4 -0.16 0.28 4 -0.27 0.39 3MALAYSIA MYS 0.13 0.20 11 0.23 0.20 11 0.34 0.20 11 0.47 0.21 10 0.29 0.22 10 0.33 0.23 9 0.42 0.22 9 0.28 0.23 7 0.13 0.24 6 0.67 0.32 5MALDIVES MDV -0.10 0.30 4 0.10 0.33 3 0.73 0.34 3 0.79 0.34 3 0.56 0.34 3 0.93 0.38 2 1.00 0.42 2 1.11 0.42 2 1.04 0.41 2 0.21 0.53 1MALI MLI -0.21 0.22 9 -0.10 0.22 9 -0.06 0.23 9 0.05 0.27 7 0.27 0.28 7 0.00 0.27 6 0.24 0.28 5 0.21 0.36 4 0.00 0.28 4 0.37 0.40 3MALTA MLT 1.30 0.26 6 1.30 0.24 7 1.20 0.25 7 1.37 0.28 6 1.32 0.29 6 1.52 0.31 5 1.52 0.38 3 1.40 0.38 3 1.36 0.31 3 1.16 0.48 2MARSHALL ISLANDS MHL 1.18 0.60 1 1.18 0.60 1 1.11 0.61 1 1.13 0.59 1 1.15 0.60 1 1.23 0.55 1 .. . . .. .. . . .. . . .. .. . . .. . .MARTINIQUE MTQ 0.64 0.36 2 1.21 0.37 2 1.20 0.38 2 1.30 0.39 2 1.40 0.39 2 0.80 0.48 1 0.46 0.50 1 0.43 0.51 1 0.19 0.53 1 .. .. . .MAURITANIA MRT -0.93 0.23 8 -0.38 0.24 7 -0.14 0.25 7 -0.49 0.31 4 -0.10 0.31 4 -0.13 0.35 3 0.17 0.42 2 0.10 0.42 2 0.21 0.41 2 0.54 0.53 1MAURITIUS MUS 0.84 0.22 9 0.72 0.22 8 0.67 0.22 8 0.66 0.28 6 0.66 0.28 6 0.80 0.25 6 0.65 0.24 6 0.35 0.33 4 0.63 0.30 4 0.66 0.34 4MEXICO MEX -0.62 0.20 11 -0.50 0.20 11 -0.48 0.20 11 -0.23 0.21 10 -0.04 0.22 10 -0.12 0.23 9 0.03 0.22 9 -0.10 0.23 7 -0.48 0.24 6 -0.87 0.32 5MICRONESIA FSM 1.16 0.32 3 1.10 0.33 3 1.12 0.34 3 1.08 0.34 3 0.97 0.34 3 0.65 0.55 1 .. . . .. .. . . .. . . .. .. . . .. . .MOLDOVA MDA -0.38 0.23 8 -0.23 0.22 8 -0.48 0.23 8 -0.61 0.25 7 -0.46 0.26 6 -0.23 0.25 6 -0.15 0.26 5 -0.23 0.26 5 0.13 0.25 5 -0.03 0.36 3MONACO MCO 1.12 0.45 2 1.07 0.43 2 1.04 0.46 2 1.04 0.42 2 1.06 0.43 2 1.23 0.55 1 .. . . .. .. . . .. . . .. .. . . .. . .MONGOLIA MNG 0.35 0.24 7 0.65 0.25 7 0.73 0.26 7 0.93 0.28 6 0.73 0.30 5 0.93 0.33 4 1.06 0.38 3 0.80 0.38 3 0.39 0.31 3 0.58 0.48 2MONTENEGRO MNP 0.59 0.26 6 -0.21 0.30 5 -0.38 0.36 4 .. .. .. . . .. . . .. .. . . .. . . .. .. . . .. . . .. .. . . .. . .MOROCCO MAR -0.47 0.20 11 -0.43 0.20 11 -0.26 0.20 11 -0.43 0.21 10 -0.39 0.22 10 -0.22 0.21 9 -0.24 0.20 9 -0.24 0.24 7 -0.02 0.22 7 -0.68 0.29 6MOZAMBIQUE MOZ 0.29 0.21 10 0.24 0.20 10 0.52 0.21 10 0.04 0.22 9 -0.10 0.23 9 0.04 0.22 8 0.29 0.24 6 -0.02 0.30 5 0.13 0.25 5 -0.63 0.35 4MYANMAR MMR -1.56 0.23 7 -1.26 0.23 7 -0.82 0.24 7 -0.90 0.24 7 -0.95 0.24 7 -1.28 0.25 6 -1.33 0.25 6 -1.57 0.26 5 -1.29 0.25 5 -1.30 0.34 4NAMIBIA NAM 0.96 0.22 9 0.91 0.22 9 0.81 0.22 9 0.59 0.22 9 0.60 0.23 9 0.39 0.22 8 0.24 0.21 8 -0.32 0.30 5 0.54 0.25 5 0.43 0.35 4NAURU NRU 1.18 0.60 1 1.18 0.60 1 1.11 0.61 1 1.13 0.59 1 1.15 0.60 1 1.23 0.55 1 .. . . .. .. . . .. . . .. .. . . .. . .NEPAL NPL -1.69 0.24 7 -1.88 0.25 7 -2.05 0.25 7 -2.28 0.23 7 -2.00 0.25 6 -1.73 0.32 4 -1.54 0.33 4 -0.66 0.36 3 -0.31 0.35 3 -0.09 0.45 2NETHERLANDS NLD 0.95 0.21 10 0.85 0.21 10 0.80 0.21 10 0.89 0.21 10 0.99 0.22 10 1.17 0.23 9 1.24 0.22 9 1.46 0.23 7 1.49 0.24 6 1.33 0.32 5NETHERLANDS ANTILLES ANT 1.19 0.36 2 1.21 0.37 2 1.20 0.38 2 0.99 0.39 2 0.69 0.50 1 .. .. . . .. . . .. .. . . .. . . .. .. . . .. . .NEW CALEDONIA NCL -0.05 0.41 2 -0.03 0.39 2 -0.20 0.42 2 -0.18 0.53 1 .. .. . . .. .. . . .. . . .. .. . . .. . . .. .. -0.87 0.77 1NEW ZEALAND NZL 1.16 0.20 11 1.30 0.20 11 1.32 0.20 11 1.32 0.21 10 1.50 0.22 10 1.34 0.23 9 1.36 0.23 8 1.29 0.23 7 1.40 0.24 6 1.27 0.32 5NICARAGUA NIC -0.39 0.23 8 -0.19 0.22 8 -0.41 0.23 8 -0.20 0.25 7 -0.2 0.26 7 -0.22 0.27 6 -0.08 0.27 6 -0.08 0.31 4 -0.57 0.28 4 -0.68 0.39 3NIGER NER -0.75 0.23 8 -0.67 0.22 8 -0.36 0.23 8 -0.41 0.29 6 -0.58 0.29 6 -0.12 0.33 4 -0.26 0.38 3 -0.15 0.38 3 -0.49 0.31 3 -0.13 0.48 2NIGERIA NGA -2.01 0.20 11 -2.09 0.20 11 -2.12 0.20 11 -1.81 0.21 10 -1.87 0.22 10 -1.73 0.21 9 -1.76 0.20 9 -1.63 0.24 7 -0.98 0.22 7 -1.60 0.29 6
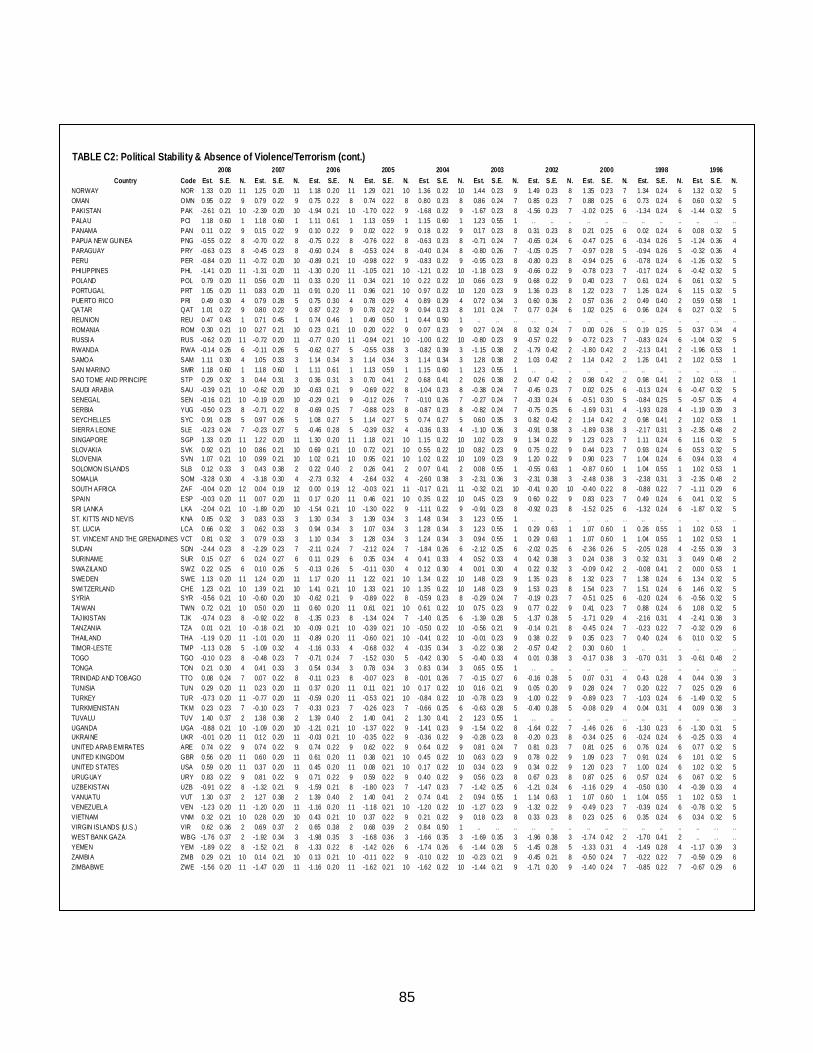
85
TABLE C2: Political Stability & Absence of Violence/Terrorism (cont.)
2008 2007 2006 2005 2004 2003 2002 2000 1998 1996Country Code Est. S.E. N. Est. S.E. N. Est. S.E. N. Est. S.E. N. Est. S.E. N. Est. S.E. N. Est. S.E. N. Est. S.E. N. Est. S.E. N. Est. S.E. N.
NORWAY NOR 1.33 0.20 11 1.25 0.20 11 1.18 0.20 11 1.29 0.21 10 1.36 0.22 10 1.44 0.23 9 1.49 0.23 8 1.35 0.23 7 1.34 0.24 6 1.32 0.32 5OMAN OMN 0.95 0.22 9 0.79 0.22 9 0.75 0.22 8 0.74 0.22 8 0.80 0.23 8 0.86 0.24 7 0.85 0.23 7 0.88 0.25 6 0.73 0.24 6 0.60 0.32 5PAKISTAN PAK -2.61 0.21 10 -2.39 0.20 10 -1.94 0.21 10 -1.70 0.22 9 -1.68 0.22 9 -1.67 0.23 8 -1.56 0.23 7 -1.02 0.25 6 -1.34 0.24 6 -1.44 0.32 5PALAU PCI 1.18 0.60 1 1.18 0.60 1 1.11 0.61 1 1.13 0.59 1 1.15 0.60 1 1.23 0.55 1 .. .. .. .. .. . . .. .. .. .. . . ..PANAMA PAN 0.11 0.22 9 0.15 0.22 9 0.10 0.22 9 0.02 0.22 9 0.18 0.22 9 0.17 0.23 8 0.31 0.23 8 0.21 0.25 6 0.02 0.24 6 0.08 0.32 5PAPUA NEW GUINEA PNG -0.55 0.22 8 -0.70 0.22 8 -0.75 0.22 8 -0.76 0.22 8 -0.63 0.23 8 -0.71 0.24 7 -0.65 0.24 6 -0.47 0.25 6 -0.34 0.26 5 -1.24 0.36 4PARAGUAY PRY -0.63 0.23 8 -0.45 0.23 8 -0.60 0.24 8 -0.53 0.24 8 -0.40 0.24 8 -0.80 0.26 7 -1.05 0.25 7 -0.97 0.28 5 -0.94 0.26 5 -0.32 0.36 4PERU PER -0.84 0.20 11 -0.72 0.20 10 -0.89 0.21 10 -0.98 0.22 9 -0.83 0.22 9 -0.95 0.23 8 -0.80 0.23 8 -0.94 0.25 6 -0.78 0.24 6 -1.26 0.32 5PHILIPPINES PHL -1.41 0.20 11 -1.31 0.20 11 -1.30 0.20 11 -1.05 0.21 10 -1.21 0.22 10 -1.18 0.23 9 -0.66 0.22 9 -0.78 0.23 7 -0.17 0.24 6 -0.42 0.32 5POLAND POL 0.79 0.20 11 0.56 0.20 11 0.33 0.20 11 0.34 0.21 10 0.22 0.22 10 0.66 0.23 9 0.68 0.22 9 0.40 0.23 7 0.61 0.24 6 0.61 0.32 5PORTUGAL PRT 1.05 0.20 11 0.83 0.20 11 0.91 0.20 11 0.96 0.21 10 0.97 0.22 10 1.20 0.23 9 1.36 0.23 8 1.22 0.23 7 1.26 0.24 6 1.15 0.32 5PUERTO RICO PRI 0.49 0.30 4 0.79 0.28 5 0.75 0.30 4 0.78 0.29 4 0.89 0.29 4 0.72 0.34 3 0.60 0.36 2 0.57 0.36 2 0.49 0.40 2 0.59 0.58 1QATAR QAT 1.01 0.22 9 0.80 0.22 9 0.87 0.22 9 0.78 0.22 9 0.94 0.23 8 1.01 0.24 7 0.77 0.24 6 1.02 0.25 6 0.96 0.24 6 0.27 0.32 5REUNION REU 0.47 0.43 1 0.71 0.45 1 0.74 0.46 1 0.49 0.50 1 0.44 0.50 1 .. .. .. . . .. .. .. .. . . .. .. .. .. . . ..ROMANIA ROM 0.30 0.21 10 0.27 0.21 10 0.23 0.21 10 0.20 0.22 9 0.07 0.23 9 0.27 0.24 8 0.32 0.24 7 0.00 0.26 5 0.19 0.25 5 0.37 0.34 4RUSSIA RUS -0.62 0.20 11 -0.72 0.20 11 -0.77 0.20 11 -0.94 0.21 10 -1.00 0.22 10 -0.80 0.23 9 -0.57 0.22 9 -0.72 0.23 7 -0.83 0.24 6 -1.04 0.32 5RWANDA RWA -0.14 0.26 6 -0.11 0.26 5 -0.62 0.27 5 -0.55 0.38 3 -0.82 0.39 3 -1.15 0.38 2 -1.79 0.42 2 -1.80 0.42 2 -2.13 0.41 2 -1.96 0.53 1SAMOA SAM 1.11 0.30 4 1.05 0.33 3 1.14 0.34 3 1.14 0.34 3 1.14 0.34 3 1.28 0.38 2 1.03 0.42 2 1.14 0.42 2 1.26 0.41 2 1.02 0.53 1SAN MARINO SMR 1.18 0.60 1 1.18 0.60 1 1.11 0.61 1 1.13 0.59 1 1.15 0.60 1 1.23 0.55 1 .. .. .. .. .. . . .. .. .. .. . . ..SAO TOME AND PRINCIPE STP 0.29 0.32 3 0.44 0.31 3 0.36 0.31 3 0.70 0.41 2 0.68 0.41 2 0.26 0.38 2 0.47 0.42 2 0.98 0.42 2 0.98 0.41 2 1.02 0.53 1SAUDI ARABIA SAU -0.39 0.21 10 -0.62 0.20 10 -0.63 0.21 9 -0.69 0.22 8 -1.04 0.23 8 -0.38 0.24 7 -0.45 0.23 7 0.02 0.25 6 -0.13 0.24 6 -0.47 0.32 5SENEGAL SEN -0.16 0.21 10 -0.19 0.20 10 -0.29 0.21 9 -0.12 0.26 7 -0.10 0.26 7 -0.27 0.24 7 -0.33 0.24 6 -0.51 0.30 5 -0.84 0.25 5 -0.57 0.35 4SERBIA YUG -0.50 0.23 8 -0.71 0.22 8 -0.69 0.25 7 -0.88 0.23 8 -0.87 0.23 8 -0.82 0.24 7 -0.75 0.25 6 -1.69 0.31 4 -1.93 0.28 4 -1.19 0.39 3SEYCHELLES SYC 0.91 0.28 5 0.97 0.26 5 1.08 0.27 5 1.14 0.27 5 0.74 0.27 5 0.60 0.35 3 0.82 0.42 2 1.14 0.42 2 0.98 0.41 2 1.02 0.53 1SIERRA LEONE SLE -0.23 0.24 7 -0.23 0.27 5 -0.46 0.28 5 -0.39 0.32 4 -0.36 0.33 4 -1.10 0.36 3 -0.91 0.38 3 -1.89 0.38 3 -2.17 0.31 3 -2.35 0.48 2SINGAPORE SGP 1.33 0.20 11 1.22 0.20 11 1.30 0.20 11 1.18 0.21 10 1.15 0.22 10 1.02 0.23 9 1.34 0.22 9 1.23 0.23 7 1.11 0.24 6 1.16 0.32 5SLOVAKIA SVK 0.92 0.21 10 0.86 0.21 10 0.69 0.21 10 0.72 0.21 10 0.55 0.22 10 0.82 0.23 9 0.75 0.22 9 0.44 0.23 7 0.93 0.24 6 0.53 0.32 5SLOVENIA SVN 1.07 0.21 10 0.99 0.21 10 1.02 0.21 10 0.95 0.21 10 1.02 0.22 10 1.09 0.23 9 1.20 0.22 9 0.90 0.23 7 1.04 0.24 6 0.94 0.33 4SOLOMON ISLANDS SLB 0.12 0.33 3 0.43 0.38 2 0.22 0.40 2 0.26 0.41 2 0.07 0.41 2 0.08 0.55 1 -0.55 0.63 1 -0.87 0.60 1 1.04 0.55 1 1.02 0.53 1SOMALIA SOM -3.28 0.30 4 -3.18 0.30 4 -2.73 0.32 4 -2.64 0.32 4 -2.60 0.38 3 -2.31 0.36 3 -2.31 0.38 3 -2.48 0.38 3 -2.38 0.31 3 -2.35 0.48 2SOUTH AFRICA ZAF -0.04 0.20 12 0.04 0.19 12 0.00 0.19 12 -0.03 0.21 11 -0.17 0.21 11 -0.32 0.21 10 -0.41 0.20 10 -0.40 0.22 8 -0.88 0.22 7 -1.11 0.29 6SPAIN ESP -0.03 0.20 11 0.07 0.20 11 0.17 0.20 11 0.46 0.21 10 0.35 0.22 10 0.45 0.23 9 0.60 0.22 9 0.83 0.23 7 0.49 0.24 6 0.41 0.32 5SRI LANKA LKA -2.04 0.21 10 -1.89 0.20 10 -1.54 0.21 10 -1.30 0.22 9 -1.11 0.22 9 -0.91 0.23 8 -0.92 0.23 8 -1.52 0.25 6 -1.32 0.24 6 -1.87 0.32 5ST. KITTS AND NEVIS KNA 0.85 0.32 3 0.83 0.33 3 1.30 0.34 3 1.39 0.34 3 1.48 0.34 3 1.23 0.55 1 .. .. .. .. .. . . .. .. .. .. . . ..ST. LUCIA LCA 0.66 0.32 3 0.62 0.33 3 0.94 0.34 3 1.07 0.34 3 1.28 0.34 3 1.23 0.55 1 0.29 0.63 1 1.07 0.60 1 0.26 0.55 1 1.02 0.53 1ST. VINCENT AND THE GRENADINES VCT 0.81 0.32 3 0.79 0.33 3 1.10 0.34 3 1.28 0.34 3 1.24 0.34 3 0.94 0.55 1 0.29 0.63 1 1.07 0.60 1 1.04 0.55 1 1.02 0.53 1SUDAN SDN -2.44 0.23 8 -2.29 0.23 7 -2.11 0.24 7 -2.12 0.24 7 -1.84 0.26 6 -2.12 0.25 6 -2.02 0.25 6 -2.36 0.26 5 -2.05 0.28 4 -2.55 0.39 3SURINAME SUR 0.15 0.27 6 0.24 0.27 6 0.11 0.29 6 0.35 0.34 4 0.41 0.33 4 0.52 0.33 4 0.42 0.38 3 0.24 0.38 3 0.32 0.31 3 0.49 0.48 2SWAZILAND SWZ 0.22 0.25 6 0.10 0.26 5 -0.13 0.26 5 -0.11 0.30 4 0.12 0.30 4 0.01 0.30 4 0.22 0.32 3 -0.09 0.42 2 -0.08 0.41 2 0.00 0.53 1SWEDEN SWE 1.13 0.20 11 1.24 0.20 11 1.17 0.20 11 1.22 0.21 10 1.34 0.22 10 1.48 0.23 9 1.35 0.23 8 1.32 0.23 7 1.38 0.24 6 1.34 0.32 5SWITZERLAND CHE 1.23 0.21 10 1.39 0.21 10 1.41 0.21 10 1.33 0.21 10 1.35 0.22 10 1.48 0.23 9 1.53 0.23 8 1.54 0.23 7 1.51 0.24 6 1.46 0.32 5SYRIA SYR -0.56 0.21 10 -0.60 0.20 10 -0.62 0.21 9 -0.89 0.22 8 -0.59 0.23 8 -0.29 0.24 7 -0.19 0.23 7 -0.51 0.25 6 -0.20 0.24 6 -0.56 0.32 5TAIWAN TWN 0.72 0.21 10 0.50 0.20 11 0.60 0.20 11 0.61 0.21 10 0.61 0.22 10 0.75 0.23 9 0.77 0.22 9 0.41 0.23 7 0.88 0.24 6 1.08 0.32 5TAJIKISTAN TJK -0.74 0.23 8 -0.92 0.22 8 -1.35 0.23 8 -1.34 0.24 7 -1.40 0.25 6 -1.39 0.28 5 -1.37 0.28 5 -1.71 0.29 4 -2.16 0.31 4 -2.41 0.38 3TANZANIA TZA 0.01 0.21 10 -0.18 0.21 10 -0.09 0.21 10 -0.39 0.21 10 -0.50 0.22 10 -0.56 0.21 9 -0.14 0.21 8 -0.45 0.24 7 -0.23 0.22 7 -0.32 0.29 6THAILAND THA -1.19 0.20 11 -1.01 0.20 11 -0.89 0.20 11 -0.60 0.21 10 -0.41 0.22 10 -0.01 0.23 9 0.38 0.22 9 0.35 0.23 7 0.40 0.24 6 0.10 0.32 5TIMOR-LESTE TMP -1.13 0.28 5 -1.09 0.32 4 -1.16 0.33 4 -0.68 0.32 4 -0.35 0.34 3 -0.22 0.38 2 -0.57 0.42 2 0.30 0.60 1 .. .. .. .. . . ..TOGO TGO -0.10 0.23 8 -0.48 0.23 7 -0.71 0.24 7 -1.52 0.30 5 -0.42 0.30 5 -0.40 0.33 4 0.01 0.38 3 -0.17 0.38 3 -0.70 0.31 3 -0.61 0.48 2TONGA TON 0.21 0.30 4 0.41 0.33 3 0.54 0.34 3 0.78 0.34 3 0.83 0.34 3 0.65 0.55 1 .. .. .. .. .. . . .. .. .. .. . . ..TRINIDAD AND TOBAGO TTO 0.08 0.24 7 0.07 0.22 8 -0.11 0.23 8 -0.07 0.23 8 -0.01 0.26 7 -0.15 0.27 6 -0.16 0.28 5 0.07 0.31 4 0.43 0.28 4 0.44 0.39 3TUNISIA TUN 0.29 0.20 11 0.23 0.20 11 0.37 0.20 11 0.11 0.21 10 0.17 0.22 10 0.16 0.21 9 0.05 0.20 9 0.28 0.24 7 0.20 0.22 7 0.25 0.29 6TURKEY TUR -0.73 0.20 11 -0.77 0.20 11 -0.59 0.20 11 -0.53 0.21 10 -0.84 0.22 10 -0.78 0.23 9 -1.00 0.22 9 -0.89 0.23 7 -1.03 0.24 6 -1.49 0.32 5TURKMENISTAN TKM 0.23 0.23 7 -0.10 0.23 7 -0.33 0.23 7 -0.26 0.23 7 -0.66 0.25 6 -0.63 0.28 5 -0.40 0.28 5 -0.08 0.29 4 0.04 0.31 4 0.09 0.38 3TUVALU TUV 1.40 0.37 2 1.38 0.38 2 1.39 0.40 2 1.40 0.41 2 1.30 0.41 2 1.23 0.55 1 .. .. .. .. .. . . .. .. .. .. . . ..UGANDA UGA -0.88 0.21 10 -1.09 0.20 10 -1.21 0.21 10 -1.37 0.22 9 -1.41 0.23 9 -1.54 0.22 8 -1.64 0.22 7 -1.46 0.26 6 -1.30 0.23 6 -1.30 0.31 5UKRAINE UKR -0.01 0.20 11 0.12 0.20 11 -0.03 0.21 10 -0.35 0.22 9 -0.36 0.22 9 -0.28 0.23 8 -0.20 0.23 8 -0.34 0.25 6 -0.24 0.24 6 -0.25 0.33 4UNITED ARAB EMIRATES ARE 0.74 0.22 9 0.74 0.22 9 0.74 0.22 9 0.62 0.22 9 0.64 0.22 9 0.81 0.24 7 0.81 0.23 7 0.81 0.25 6 0.76 0.24 6 0.77 0.32 5UNITED KINGDOM GBR 0.56 0.20 11 0.60 0.20 11 0.61 0.20 11 0.38 0.21 10 0.45 0.22 10 0.63 0.23 9 0.78 0.22 9 1.09 0.23 7 0.91 0.24 6 1.01 0.32 5UNITED STATES USA 0.59 0.20 11 0.37 0.20 11 0.45 0.20 11 0.08 0.21 10 0.17 0.22 10 0.34 0.23 9 0.34 0.22 9 1.20 0.23 7 1.00 0.24 6 1.02 0.32 5URUGUAY URY 0.83 0.22 9 0.81 0.22 9 0.71 0.22 9 0.59 0.22 9 0.40 0.22 9 0.56 0.23 8 0.67 0.23 8 0.87 0.25 6 0.57 0.24 6 0.67 0.32 5UZBEKISTAN UZB -0.91 0.22 8 -1.32 0.21 9 -1.59 0.21 8 -1.80 0.23 7 -1.47 0.23 7 -1.42 0.25 6 -1.21 0.24 6 -1.16 0.29 4 -0.50 0.30 4 -0.39 0.33 4VANUATU VUT 1.30 0.37 2 1.27 0.38 2 1.39 0.40 2 1.40 0.41 2 0.74 0.41 2 0.94 0.55 1 1.14 0.63 1 1.07 0.60 1 1.04 0.55 1 1.02 0.53 1VENEZUELA VEN -1.23 0.20 11 -1.20 0.20 11 -1.16 0.20 11 -1.18 0.21 10 -1.20 0.22 10 -1.27 0.23 9 -1.32 0.22 9 -0.49 0.23 7 -0.39 0.24 6 -0.78 0.32 5VIETNAM VNM 0.32 0.21 10 0.28 0.20 10 0.43 0.21 10 0.37 0.22 9 0.21 0.22 9 0.18 0.23 8 0.33 0.23 8 0.23 0.25 6 0.35 0.24 6 0.34 0.32 5VIRGIN ISLANDS (U.S.) VIR 0.62 0.36 2 0.69 0.37 2 0.65 0.38 2 0.68 0.39 2 0.84 0.50 1 .. .. .. . . .. .. .. .. . . .. .. .. .. . . ..WEST BANK GAZA WBG -1.76 0.37 2 -1.92 0.34 3 -1.98 0.35 3 -1.68 0.36 3 -1.66 0.35 3 -1.69 0.35 3 -1.96 0.38 3 -1.74 0.42 2 -1.70 0.41 2 .. . . ..YEMEN YEM -1.89 0.22 8 -1.52 0.21 8 -1.33 0.22 8 -1.42 0.26 6 -1.74 0.26 6 -1.44 0.28 5 -1.45 0.28 5 -1.33 0.31 4 -1.49 0.28 4 -1.17 0.39 3ZAMBIA ZMB 0.29 0.21 10 0.14 0.21 10 0.13 0.21 10 -0.11 0.22 9 -0.10 0.22 10 -0.23 0.21 9 -0.45 0.21 8 -0.50 0.24 7 -0.22 0.22 7 -0.59 0.29 6ZIMBABWE ZWE -1.56 0.20 11 -1.47 0.20 11 -1.16 0.20 11 -1.62 0.21 10 -1.62 0.22 10 -1.44 0.21 9 -1.71 0.20 9 -1.40 0.24 7 -0.85 0.22 7 -0.67 0.29 6
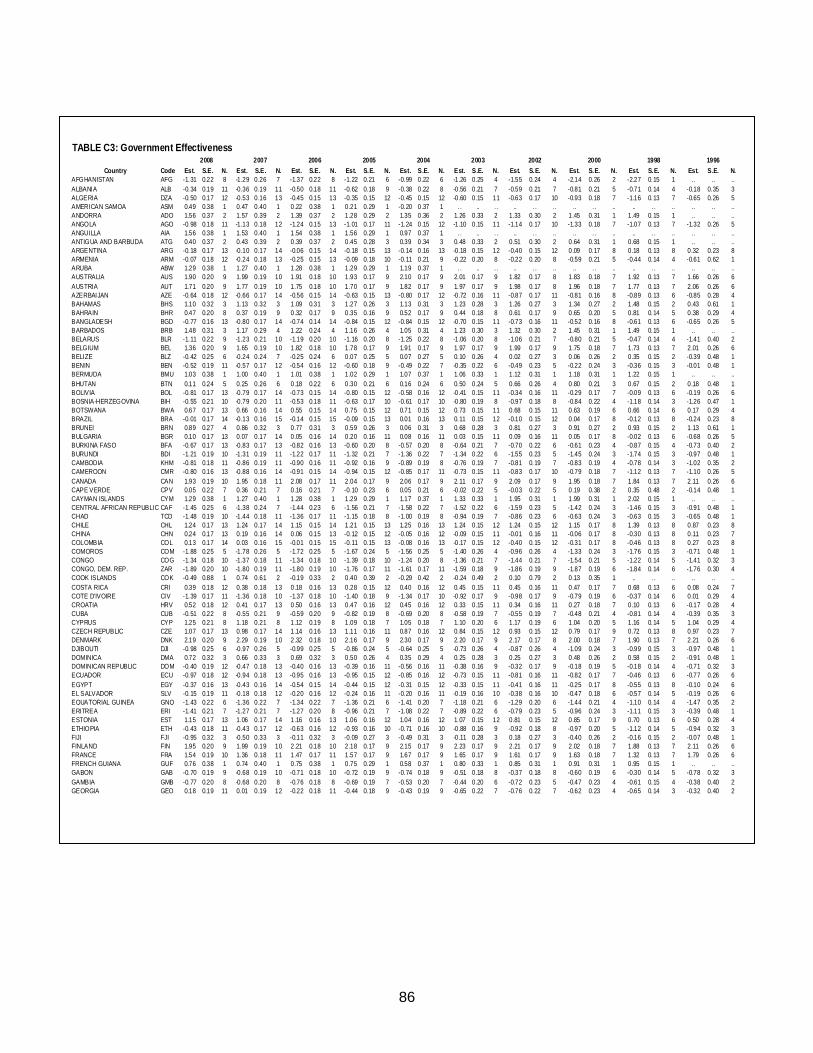
86
TABLE C3: Government Effectiveness
2008 2007 2006 2005 2004 2003 2002 2000 1998 1996Country Code Est. S.E. N. Est. S.E. N. Est. S.E. N. Est. S.E. N. Est. S.E. N. Est. S.E. N. Est. S.E. N. Est. S.E. N. Est. S.E. N. Est. S.E. N.
AFGHANISTAN AFG -1.31 0.22 8 -1.29 0.26 7 -1.37 0.22 8 -1.22 0.21 6 -0.99 0.22 6 -1.26 0.25 4 -1.55 0.24 4 -2.14 0.26 2 -2.27 0.15 1 .. .. ..ALBANIA ALB -0.34 0.19 11 -0.36 0.19 11 -0.50 0.18 11 -0.62 0.18 9 -0.38 0.22 8 -0.56 0.21 7 -0.59 0.21 7 -0.81 0.21 5 -0.71 0.14 4 -0.18 0.35 3ALGERIA DZA -0.50 0.17 12 -0.53 0.16 13 -0.45 0.15 13 -0.35 0.15 12 -0.45 0.15 12 -0.60 0.15 11 -0.63 0.17 10 -0.93 0.18 7 -1.16 0.13 7 -0.65 0.26 5AMERICAN SAMOA ASM 0.49 0.38 1 0.47 0.40 1 0.22 0.38 1 0.21 0.29 1 -0.20 0.37 1 .. .. . . .. . . .. .. . . .. .. . . .. .. .. ..ANDORRA ADO 1.56 0.37 2 1.57 0.39 2 1.39 0.37 2 1.28 0.29 2 1.35 0.36 2 1.26 0.33 2 1.33 0.30 2 1.45 0.31 1 1.49 0.15 1 .. .. ..ANGOLA AGO -0.98 0.18 11 -1.13 0.18 12 -1.24 0.15 13 -1.01 0.17 11 -1.24 0.15 12 -1.10 0.15 11 -1.14 0.17 10 -1.33 0.18 7 -1.07 0.13 7 -1.32 0.26 5ANGUILLA AIA 1.56 0.38 1 1.53 0.40 1 1.54 0.38 1 1.56 0.29 1 0.97 0.37 1 .. .. . . .. . . .. .. . . .. .. . . .. .. .. ..ANTIGUA AND BARBUDA ATG 0.40 0.37 2 0.43 0.39 2 0.39 0.37 2 0.45 0.28 3 0.39 0.34 3 0.48 0.33 2 0.51 0.30 2 0.64 0.31 1 0.68 0.15 1 .. .. ..ARGENTINA ARG -0.18 0.17 13 -0.10 0.17 14 -0.06 0.15 14 -0.18 0.15 13 -0.14 0.16 13 -0.18 0.15 12 -0.40 0.15 12 0.09 0.17 8 0.18 0.13 8 0.32 0.23 8ARMENIA ARM -0.07 0.18 12 -0.24 0.18 13 -0.25 0.15 13 -0.09 0.18 10 -0.11 0.21 9 -0.22 0.20 8 -0.22 0.20 8 -0.59 0.21 5 -0.44 0.14 4 -0.61 0.62 1ARUBA ABW 1.29 0.38 1 1.27 0.40 1 1.28 0.38 1 1.29 0.29 1 1.19 0.37 1 .. .. . . .. . . .. .. . . .. .. . . .. .. .. ..AUSTRALIA AUS 1.90 0.20 9 1.99 0.19 10 1.91 0.18 10 1.93 0.17 9 2.10 0.17 9 2.01 0.17 9 1.82 0.17 8 1.83 0.18 7 1.92 0.13 7 1.66 0.26 6AUSTRIA AUT 1.71 0.20 9 1.77 0.19 10 1.75 0.18 10 1.70 0.17 9 1.82 0.17 9 1.97 0.17 9 1.98 0.17 8 1.96 0.18 7 1.77 0.13 7 2.06 0.26 6AZERBAIJAN AZE -0.64 0.18 12 -0.66 0.17 14 -0.56 0.15 14 -0.63 0.15 13 -0.80 0.17 12 -0.72 0.16 11 -0.87 0.17 11 -0.81 0.16 8 -0.89 0.13 6 -0.85 0.28 4BAHAMAS BHS 1.10 0.32 3 1.13 0.32 3 1.09 0.31 3 1.27 0.26 3 1.13 0.31 3 1.23 0.28 3 1.26 0.27 3 1.34 0.27 2 1.48 0.15 2 0.43 0.61 1BAHRAIN BHR 0.47 0.20 8 0.37 0.19 9 0.32 0.17 9 0.35 0.16 9 0.52 0.17 9 0.44 0.18 8 0.61 0.17 9 0.65 0.20 5 0.81 0.14 5 0.38 0.29 4BANGLADESH BGD -0.77 0.16 13 -0.80 0.17 14 -0.74 0.14 14 -0.84 0.15 12 -0.84 0.15 12 -0.70 0.15 11 -0.73 0.16 11 -0.52 0.16 8 -0.61 0.13 6 -0.65 0.26 5BARBADOS BRB 1.48 0.31 3 1.17 0.29 4 1.22 0.24 4 1.16 0.26 4 1.05 0.31 4 1.23 0.30 3 1.32 0.30 2 1.45 0.31 1 1.49 0.15 1 .. .. ..BELARUS BLR -1.11 0.22 9 -1.23 0.21 10 -1.19 0.20 10 -1.16 0.20 8 -1.25 0.22 8 -1.06 0.20 8 -1.06 0.21 7 -0.80 0.21 5 -0.47 0.14 4 -1.41 0.40 2BELGIUM BEL 1.36 0.20 9 1.65 0.19 10 1.82 0.18 10 1.78 0.17 9 1.91 0.17 9 1.97 0.17 9 1.99 0.17 9 1.75 0.18 7 1.73 0.13 7 2.01 0.26 6BELIZE BLZ -0.42 0.25 6 -0.24 0.24 7 -0.25 0.24 6 0.07 0.25 5 0.07 0.27 5 0.10 0.26 4 0.02 0.27 3 0.06 0.26 2 0.35 0.15 2 -0.39 0.48 1BENIN BEN -0.52 0.19 11 -0.57 0.17 12 -0.54 0.16 12 -0.60 0.18 9 -0.49 0.22 7 -0.35 0.22 6 -0.49 0.23 5 -0.22 0.24 3 -0.36 0.15 3 -0.01 0.48 1BERMUDA BMU 1.03 0.38 1 1.00 0.40 1 1.01 0.38 1 1.02 0.29 1 1.07 0.37 1 1.06 0.33 1 1.12 0.31 1 1.18 0.31 1 1.22 0.15 1 .. .. ..BHUTAN BTN 0.11 0.24 5 0.25 0.26 6 0.18 0.22 6 0.30 0.21 6 0.16 0.24 6 0.50 0.24 5 0.66 0.26 4 0.80 0.21 3 0.67 0.15 2 0.18 0.48 1BOLIVIA BOL -0.81 0.17 13 -0.79 0.17 14 -0.73 0.15 14 -0.80 0.15 12 -0.58 0.16 12 -0.41 0.15 11 -0.34 0.16 11 -0.29 0.17 7 -0.09 0.13 6 -0.19 0.26 6BOSNIA-HERZEGOVINA BIH -0.55 0.21 10 -0.79 0.20 11 -0.53 0.18 11 -0.63 0.17 10 -0.61 0.17 10 -0.80 0.19 8 -0.97 0.18 8 -0.84 0.22 4 -1.18 0.14 3 -1.26 0.47 1BOTSWANA BWA 0.67 0.17 13 0.66 0.16 14 0.55 0.15 14 0.75 0.15 12 0.71 0.15 12 0.73 0.15 11 0.68 0.15 11 0.63 0.19 6 0.66 0.14 6 0.17 0.29 4BRAZIL BRA -0.01 0.17 14 -0.13 0.16 15 -0.14 0.15 15 -0.09 0.15 13 0.01 0.16 13 0.11 0.15 12 -0.10 0.15 12 0.04 0.17 8 -0.12 0.13 8 -0.24 0.23 8BRUNEI BRN 0.89 0.27 4 0.86 0.32 3 0.77 0.31 3 0.59 0.26 3 0.06 0.31 3 0.68 0.28 3 0.81 0.27 3 0.91 0.27 2 0.93 0.15 2 1.13 0.61 1BULGARIA BGR 0.10 0.17 13 0.07 0.17 14 0.05 0.16 14 0.20 0.16 11 0.08 0.16 11 0.03 0.15 11 0.09 0.16 11 0.05 0.17 8 -0.02 0.13 6 -0.68 0.26 5BURKINA FASO BFA -0.67 0.17 13 -0.83 0.17 13 -0.82 0.16 13 -0.60 0.20 8 -0.57 0.20 8 -0.64 0.21 7 -0.70 0.22 6 -0.61 0.23 4 -0.87 0.15 4 -0.73 0.40 2BURUNDI BDI -1.21 0.19 10 -1.31 0.19 11 -1.22 0.17 11 -1.32 0.21 7 -1.36 0.22 7 -1.34 0.22 6 -1.55 0.23 5 -1.45 0.24 3 -1.74 0.15 3 -0.97 0.48 1CAMBODIA KHM -0.81 0.18 11 -0.86 0.19 11 -0.90 0.16 11 -0.92 0.16 9 -0.89 0.19 8 -0.76 0.19 7 -0.81 0.19 7 -0.83 0.19 4 -0.78 0.14 3 -1.02 0.35 2CAMEROON CMR -0.80 0.16 13 -0.88 0.16 14 -0.91 0.15 14 -0.94 0.15 12 -0.85 0.17 11 -0.73 0.15 11 -0.83 0.17 10 -0.79 0.18 7 -1.12 0.13 7 -1.10 0.26 5CANADA CAN 1.93 0.19 10 1.95 0.18 11 2.08 0.17 11 2.04 0.17 9 2.06 0.17 9 2.11 0.17 9 2.09 0.17 9 1.95 0.18 7 1.84 0.13 7 2.11 0.26 6CAPE VERDE CPV 0.05 0.22 7 0.36 0.21 7 0.16 0.21 7 -0.10 0.23 6 0.05 0.21 6 -0.02 0.22 5 -0.03 0.22 5 0.19 0.38 2 0.35 0.48 2 -0.14 0.48 1CAYMAN ISLANDS CYM 1.29 0.38 1 1.27 0.40 1 1.28 0.38 1 1.29 0.29 1 1.17 0.37 1 1.33 0.33 1 1.95 0.31 1 1.99 0.31 1 2.02 0.15 1 .. .. ..CENTRAL AFRICAN REPUBLIC CAF -1.45 0.25 6 -1.38 0.24 7 -1.44 0.23 6 -1.56 0.21 7 -1.58 0.22 7 -1.52 0.22 6 -1.59 0.23 5 -1.42 0.24 3 -1.46 0.15 3 -0.91 0.48 1CHAD TCD -1.48 0.19 10 -1.44 0.18 11 -1.36 0.17 11 -1.15 0.18 8 -1.00 0.19 8 -0.94 0.19 7 -0.86 0.23 6 -0.63 0.24 3 -0.63 0.15 3 -0.65 0.48 1CHILE CHL 1.24 0.17 13 1.24 0.17 14 1.15 0.15 14 1.21 0.15 13 1.25 0.16 13 1.24 0.15 12 1.24 0.15 12 1.15 0.17 8 1.39 0.13 8 0.87 0.23 8CHINA CHN 0.24 0.17 13 0.19 0.16 14 0.06 0.15 13 -0.12 0.15 12 -0.05 0.16 12 -0.09 0.15 11 -0.01 0.16 11 -0.06 0.17 8 -0.30 0.13 8 0.11 0.23 7COLOMBIA COL 0.13 0.17 14 0.03 0.16 15 -0.01 0.15 15 -0.11 0.15 13 -0.08 0.16 13 -0.17 0.15 12 -0.40 0.15 12 -0.31 0.17 8 -0.46 0.13 8 0.27 0.23 8COMOROS COM -1.88 0.25 5 -1.78 0.26 5 -1.72 0.25 5 -1.67 0.24 5 -1.56 0.25 5 -1.40 0.26 4 -0.96 0.26 4 -1.33 0.24 3 -1.76 0.15 3 -0.71 0.48 1CONGO COG -1.34 0.18 10 -1.37 0.18 11 -1.34 0.18 10 -1.39 0.18 10 -1.24 0.20 8 -1.36 0.21 7 -1.44 0.21 7 -1.54 0.21 5 -1.22 0.14 5 -1.41 0.32 3CONGO, DEM. REP. ZAR -1.89 0.20 10 -1.80 0.19 11 -1.80 0.19 10 -1.76 0.17 11 -1.61 0.17 11 -1.59 0.18 9 -1.86 0.19 9 -1.87 0.19 6 -1.84 0.14 6 -1.76 0.30 4COOK ISLANDS COK -0.49 0.88 1 0.74 0.61 2 -0.19 0.33 2 0.40 0.39 2 -0.29 0.42 2 -0.24 0.49 2 0.10 0.79 2 0.13 0.35 1 .. . . .. .. .. ..COSTA RICA CRI 0.39 0.18 12 0.38 0.18 13 0.18 0.16 13 0.28 0.15 12 0.40 0.16 12 0.45 0.15 11 0.45 0.16 11 0.47 0.17 7 0.68 0.13 6 0.08 0.24 7COTE D'IVOIRE CIV -1.39 0.17 11 -1.36 0.18 10 -1.37 0.18 10 -1.40 0.18 9 -1.34 0.17 10 -0.92 0.17 9 -0.98 0.17 9 -0.79 0.19 6 -0.37 0.14 6 0.01 0.29 4CROATIA HRV 0.52 0.18 12 0.41 0.17 13 0.50 0.16 13 0.47 0.16 12 0.45 0.16 12 0.33 0.15 11 0.34 0.16 11 0.27 0.18 7 0.10 0.13 6 -0.17 0.28 4CUBA CUB -0.51 0.22 8 -0.55 0.21 9 -0.59 0.20 9 -0.82 0.19 8 -0.69 0.20 8 -0.58 0.19 7 -0.55 0.19 7 -0.48 0.21 4 -0.81 0.14 4 -0.39 0.35 3CYPRUS CYP 1.25 0.21 8 1.18 0.21 8 1.12 0.19 8 1.09 0.18 7 1.05 0.18 7 1.10 0.20 6 1.17 0.19 6 1.04 0.20 5 1.16 0.14 5 1.04 0.29 4CZECH REPUBLIC CZE 1.07 0.17 13 0.98 0.17 14 1.14 0.16 13 1.11 0.16 11 0.87 0.16 12 0.84 0.15 12 0.93 0.15 12 0.79 0.17 9 0.72 0.13 8 0.97 0.23 7DENMARK DNK 2.19 0.20 9 2.29 0.19 10 2.32 0.18 10 2.16 0.17 9 2.30 0.17 9 2.20 0.17 9 2.17 0.17 8 2.00 0.18 7 1.90 0.13 7 2.21 0.26 6DJIBOUTI DJI -0.98 0.25 6 -0.97 0.26 5 -0.99 0.25 5 -0.86 0.24 5 -0.64 0.25 5 -0.73 0.26 4 -0.87 0.26 4 -1.09 0.24 3 -0.99 0.15 3 -0.97 0.48 1DOMINICA DMA 0.72 0.32 3 0.66 0.33 3 0.69 0.32 3 0.50 0.26 4 0.35 0.29 4 0.25 0.28 3 0.25 0.27 3 0.48 0.26 2 0.58 0.15 2 -0.91 0.48 1DOMINICAN REPUBLIC DOM -0.40 0.19 12 -0.47 0.18 13 -0.40 0.16 13 -0.39 0.16 11 -0.56 0.16 11 -0.38 0.16 9 -0.32 0.17 9 -0.18 0.19 5 -0.18 0.14 4 -0.71 0.32 3ECUADOR ECU -0.97 0.18 12 -0.94 0.18 13 -0.95 0.16 13 -0.95 0.15 12 -0.85 0.16 12 -0.73 0.15 11 -0.81 0.16 11 -0.82 0.17 7 -0.46 0.13 6 -0.77 0.26 6EGYPT EGY -0.37 0.16 13 -0.43 0.16 14 -0.54 0.15 14 -0.44 0.15 12 -0.31 0.15 12 -0.33 0.15 11 -0.41 0.16 11 -0.25 0.17 8 -0.55 0.13 8 -0.10 0.24 6EL SALVADOR SLV -0.15 0.19 11 -0.18 0.18 12 -0.20 0.16 12 -0.24 0.16 11 -0.20 0.16 11 -0.19 0.16 10 -0.38 0.16 10 -0.47 0.18 6 -0.57 0.14 5 -0.19 0.26 6EQUATORIAL GUINEA GNQ -1.43 0.22 6 -1.36 0.22 7 -1.34 0.22 7 -1.36 0.21 6 -1.41 0.20 7 -1.18 0.21 6 -1.29 0.20 6 -1.44 0.21 4 -1.10 0.14 4 -1.47 0.35 2ERITREA ERI -1.41 0.21 7 -1.27 0.21 7 -1.27 0.20 8 -0.96 0.21 7 -1.08 0.22 7 -0.89 0.22 6 -0.79 0.23 5 -0.96 0.24 3 -1.11 0.15 3 -0.39 0.48 1ESTONIA EST 1.15 0.17 13 1.06 0.17 14 1.16 0.16 13 1.06 0.16 12 1.04 0.16 12 1.07 0.15 12 0.81 0.15 12 0.85 0.17 9 0.70 0.13 6 0.50 0.28 4ETHIOPIA ETH -0.43 0.18 11 -0.43 0.17 12 -0.63 0.16 12 -0.93 0.16 10 -0.71 0.16 10 -0.88 0.16 9 -0.92 0.18 8 -0.97 0.20 5 -1.12 0.14 5 -0.94 0.32 3FIJI FJI -0.95 0.32 3 -0.50 0.33 3 -0.11 0.32 3 -0.09 0.27 3 -0.49 0.31 3 -0.11 0.28 3 0.18 0.27 3 -0.40 0.26 2 -0.16 0.15 2 -0.07 0.48 1FINLAND FIN 1.95 0.20 9 1.99 0.19 10 2.21 0.18 10 2.18 0.17 9 2.15 0.17 9 2.23 0.17 9 2.21 0.17 9 2.02 0.18 7 1.88 0.13 7 2.11 0.26 6FRANCE FRA 1.54 0.19 10 1.36 0.18 11 1.47 0.17 11 1.57 0.17 9 1.67 0.17 9 1.65 0.17 9 1.61 0.17 9 1.63 0.18 7 1.32 0.13 7 1.79 0.26 6FRENCH GUIANA GUF 0.76 0.38 1 0.74 0.40 1 0.75 0.38 1 0.75 0.29 1 0.58 0.37 1 0.80 0.33 1 0.85 0.31 1 0.91 0.31 1 0.95 0.15 1 .. .. ..GABON GAB -0.70 0.19 9 -0.68 0.19 10 -0.71 0.18 10 -0.72 0.19 9 -0.74 0.18 9 -0.51 0.18 8 -0.37 0.18 8 -0.60 0.19 6 -0.30 0.14 5 -0.78 0.32 3GAMBIA GMB -0.77 0.20 8 -0.68 0.20 8 -0.76 0.18 8 -0.69 0.19 7 -0.53 0.20 7 -0.44 0.20 6 -0.72 0.23 5 -0.47 0.23 4 -0.61 0.15 4 -0.38 0.40 2GEORGIA GEO 0.18 0.19 11 0.01 0.19 12 -0.22 0.18 11 -0.44 0.18 9 -0.43 0.19 9 -0.65 0.22 7 -0.76 0.22 7 -0.62 0.23 4 -0.65 0.14 3 -0.32 0.40 2
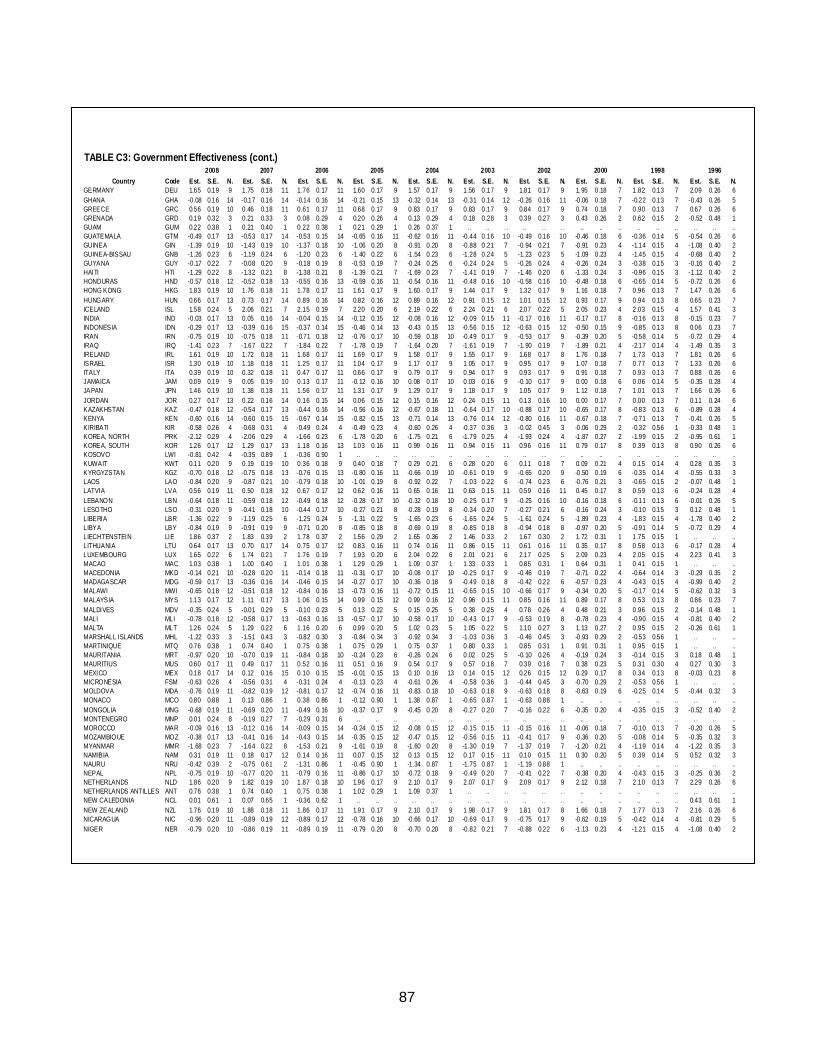
87
TABLE C3: Government Effectiveness (cont.)
2008 2007 2006 2005 2004 2003 2002 2000 1998 1996Country Code Est. S.E. N. Est. S.E. N. Est. S.E. N. Est. S.E. N. Est. S.E. N. Est. S.E. N. Est. S.E. N. Est. S.E. N. Est. S.E. N. Est. S.E. N.
GERMANY DEU 1.65 0.19 9 1.75 0.18 11 1.76 0.17 11 1.60 0.17 9 1.57 0.17 9 1.56 0.17 9 1.81 0.17 9 1.95 0.18 7 1.82 0.13 7 2.09 0.26 6GHANA GHA -0.08 0.16 14 -0.17 0.16 14 -0.14 0.16 14 -0.21 0.15 13 -0.32 0.14 13 -0.31 0.14 12 -0.26 0.16 11 -0.06 0.18 7 -0.22 0.13 7 -0.43 0.26 5GREECE GRC 0.56 0.19 10 0.46 0.18 11 0.61 0.17 11 0.68 0.17 9 0.83 0.17 9 0.83 0.17 9 0.84 0.17 9 0.74 0.18 7 0.90 0.13 7 0.67 0.26 6GRENADA GRD 0.19 0.32 3 0.21 0.33 3 0.08 0.29 4 0.20 0.26 4 0.13 0.29 4 0.18 0.28 3 0.39 0.27 3 0.43 0.26 2 0.62 0.15 2 -0.52 0.48 1GUAM GUM 0.22 0.38 1 0.21 0.40 1 0.22 0.38 1 0.21 0.29 1 0.26 0.37 1 .. .. . . .. . . . . .. .. .. .. .. .. . . . . ..GUATEMALA GTM -0.49 0.17 13 -0.53 0.17 14 -0.53 0.15 14 -0.65 0.16 11 -0.62 0.16 11 -0.44 0.16 10 -0.49 0.16 10 -0.46 0.18 6 -0.36 0.14 5 -0.54 0.26 6GUINEA GIN -1.39 0.19 10 -1.43 0.19 10 -1.37 0.18 10 -1.06 0.20 8 -0.91 0.20 8 -0.88 0.21 7 -0.94 0.21 7 -0.91 0.23 4 -1.14 0.15 4 -1.08 0.40 2GUINEA-BISSAU GNB -1.26 0.23 6 -1.19 0.24 6 -1.20 0.23 6 -1.40 0.22 6 -1.54 0.23 6 -1.28 0.24 5 -1.23 0.23 5 -1.09 0.23 4 -1.45 0.15 4 -0.68 0.40 2GUYANA GUY -0.17 0.22 7 -0.08 0.20 9 -0.18 0.19 8 -0.53 0.19 7 -0.24 0.25 6 -0.24 0.24 5 -0.26 0.24 4 -0.26 0.24 3 -0.38 0.15 3 -0.16 0.40 2HAITI HTI -1.29 0.22 8 -1.32 0.21 8 -1.38 0.21 8 -1.39 0.21 7 -1.69 0.23 7 -1.41 0.19 7 -1.46 0.20 6 -1.33 0.24 3 -0.96 0.15 3 -1.12 0.40 2HONDURAS HND -0.57 0.18 12 -0.52 0.18 13 -0.55 0.16 13 -0.59 0.16 11 -0.54 0.16 11 -0.48 0.16 10 -0.58 0.16 10 -0.48 0.18 6 -0.65 0.14 5 -0.72 0.26 6HONG KONG HKG 1.83 0.19 10 1.76 0.18 11 1.78 0.17 11 1.61 0.17 9 1.60 0.17 9 1.44 0.17 9 1.32 0.17 9 1.16 0.18 7 0.96 0.13 7 1.47 0.26 6HUNGARY HUN 0.66 0.17 13 0.73 0.17 14 0.89 0.16 14 0.82 0.16 12 0.89 0.16 12 0.91 0.15 12 1.01 0.15 12 0.93 0.17 9 0.94 0.13 8 0.65 0.23 7ICELAND ISL 1.58 0.24 5 2.06 0.21 7 2.15 0.19 7 2.20 0.20 6 2.19 0.22 6 2.24 0.21 6 2.07 0.22 5 2.05 0.23 4 2.03 0.15 4 1.57 0.41 3INDIA IND -0.03 0.17 13 0.05 0.16 14 -0.04 0.15 14 -0.12 0.15 12 -0.08 0.16 12 -0.09 0.15 11 -0.17 0.16 11 -0.17 0.17 8 -0.16 0.13 8 -0.15 0.23 7INDONESIA IDN -0.29 0.17 13 -0.39 0.16 15 -0.37 0.14 15 -0.46 0.14 13 -0.43 0.15 13 -0.56 0.15 12 -0.63 0.15 12 -0.50 0.15 9 -0.85 0.13 8 0.06 0.23 7IRAN IRN -0.75 0.19 10 -0.75 0.18 11 -0.71 0.18 12 -0.76 0.17 10 -0.59 0.18 10 -0.49 0.17 9 -0.53 0.17 9 -0.39 0.20 5 -0.58 0.14 5 -0.72 0.29 4IRAQ IRQ -1.41 0.23 7 -1.67 0.22 7 -1.84 0.22 7 -1.78 0.19 7 -1.64 0.20 7 -1.61 0.19 7 -1.90 0.19 7 -1.89 0.21 4 -2.17 0.14 4 -1.49 0.35 3IRELAND IRL 1.61 0.19 10 1.72 0.18 11 1.68 0.17 11 1.69 0.17 9 1.58 0.17 9 1.55 0.17 9 1.68 0.17 8 1.76 0.18 7 1.73 0.13 7 1.81 0.26 6ISRAEL ISR 1.30 0.19 10 1.18 0.18 11 1.25 0.17 11 1.04 0.17 9 1.17 0.17 9 1.05 0.17 9 0.95 0.17 9 1.07 0.18 7 0.77 0.13 7 1.33 0.26 6ITALY ITA 0.39 0.19 10 0.32 0.18 11 0.47 0.17 11 0.66 0.17 9 0.79 0.17 9 0.94 0.17 9 0.93 0.17 9 0.91 0.18 7 0.93 0.13 7 0.88 0.26 6JAMAICA JAM 0.09 0.19 9 0.05 0.19 10 0.13 0.17 11 -0.12 0.16 10 0.08 0.17 10 0.03 0.16 9 -0.10 0.17 9 0.00 0.18 6 0.06 0.14 5 -0.35 0.28 4JAPAN JPN 1.46 0.19 10 1.38 0.18 11 1.56 0.17 11 1.31 0.17 9 1.29 0.17 9 1.18 0.17 9 1.05 0.17 9 1.12 0.18 7 1.01 0.13 7 1.66 0.26 6JORDAN JOR 0.27 0.17 13 0.22 0.16 14 0.16 0.15 14 0.06 0.15 12 0.15 0.16 12 0.24 0.15 11 0.13 0.16 10 0.00 0.17 7 0.00 0.13 7 0.11 0.24 6KAZAKHSTAN KAZ -0.47 0.18 12 -0.54 0.17 13 -0.44 0.16 14 -0.56 0.16 12 -0.67 0.18 11 -0.64 0.17 10 -0.88 0.17 10 -0.65 0.17 8 -0.83 0.13 6 -0.89 0.28 4KENYA KEN -0.60 0.16 14 -0.60 0.15 15 -0.67 0.14 15 -0.82 0.15 13 -0.71 0.14 13 -0.76 0.14 12 -0.80 0.16 11 -0.67 0.18 7 -0.71 0.13 7 -0.41 0.26 5KIRIBATI KIR -0.58 0.26 4 -0.68 0.31 4 -0.49 0.24 4 -0.49 0.23 4 -0.60 0.26 4 -0.37 0.36 3 -0.02 0.45 3 -0.06 0.29 2 -0.32 0.56 1 -0.33 0.48 1KOREA, NORTH PRK -2.12 0.29 4 -2.06 0.29 4 -1.66 0.23 6 -1.78 0.20 6 -1.75 0.21 6 -1.79 0.25 4 -1.93 0.24 4 -1.87 0.27 2 -1.99 0.15 2 -0.95 0.61 1KOREA, SOUTH KOR 1.26 0.17 12 1.29 0.17 13 1.18 0.16 13 1.03 0.16 11 0.99 0.16 11 0.94 0.15 11 0.96 0.16 11 0.79 0.17 8 0.39 0.13 8 0.90 0.26 6KOSOVO LWI -0.81 0.42 4 -0.35 0.89 1 -0.36 0.90 1 .. .. .. . . .. .. .. .. . . .. . . . . .. .. .. .. .. .. . . . . ..KUWAIT KWT 0.11 0.20 9 0.19 0.19 10 0.36 0.18 9 0.40 0.18 7 0.29 0.21 6 0.28 0.20 6 0.11 0.18 7 0.09 0.21 4 0.15 0.14 4 0.28 0.35 3KYRGYZSTAN KGZ -0.70 0.18 12 -0.75 0.18 13 -0.76 0.15 13 -0.80 0.16 11 -0.66 0.19 10 -0.61 0.19 9 -0.65 0.20 9 -0.50 0.19 6 -0.35 0.14 4 -0.55 0.33 3LAOS LAO -0.84 0.20 9 -0.87 0.21 10 -0.79 0.18 10 -1.01 0.19 8 -0.92 0.22 7 -1.03 0.22 6 -0.74 0.23 6 -0.76 0.21 3 -0.65 0.15 2 -0.07 0.48 1LATVIA LVA 0.56 0.19 11 0.50 0.18 12 0.67 0.17 12 0.62 0.16 11 0.65 0.16 11 0.63 0.15 11 0.59 0.16 11 0.45 0.17 8 0.59 0.13 6 -0.24 0.28 4LEBANON LBN -0.64 0.18 11 -0.59 0.18 12 -0.49 0.18 12 -0.28 0.17 10 -0.32 0.18 10 -0.25 0.17 9 -0.25 0.16 10 -0.16 0.18 6 -0.11 0.13 6 -0.01 0.26 5LESOTHO LSO -0.31 0.20 9 -0.41 0.18 10 -0.44 0.17 10 -0.27 0.21 8 -0.28 0.19 8 -0.34 0.20 7 -0.27 0.21 6 -0.16 0.24 3 -0.10 0.15 3 0.12 0.48 1LIBERIA LBR -1.36 0.22 9 -1.19 0.25 6 -1.25 0.24 5 -1.31 0.22 5 -1.65 0.23 6 -1.65 0.24 5 -1.61 0.24 5 -1.89 0.23 4 -1.83 0.15 4 -1.78 0.40 2LIBYA LBY -0.84 0.19 9 -0.91 0.19 9 -0.71 0.20 8 -0.85 0.18 8 -0.69 0.19 8 -0.85 0.18 8 -0.94 0.18 8 -0.97 0.20 5 -0.91 0.14 5 -0.72 0.29 4LIECHTENSTEIN LIE 1.86 0.37 2 1.83 0.39 2 1.78 0.37 2 1.56 0.29 2 1.65 0.36 2 1.46 0.33 2 1.67 0.30 2 1.72 0.31 1 1.75 0.15 1 .. . . ..LITHUANIA LTU 0.64 0.17 13 0.70 0.17 14 0.75 0.17 12 0.83 0.16 11 0.74 0.16 11 0.86 0.15 11 0.61 0.16 11 0.35 0.17 8 0.58 0.13 6 -0.17 0.28 4LUXEMBOURG LUX 1.65 0.22 6 1.74 0.21 7 1.76 0.19 7 1.93 0.20 6 2.04 0.22 6 2.01 0.21 6 2.17 0.25 5 2.09 0.23 4 2.05 0.15 4 2.23 0.41 3MACAO MAC 1.03 0.38 1 1.00 0.40 1 1.01 0.38 1 1.29 0.29 1 1.09 0.37 1 1.33 0.33 1 0.85 0.31 1 0.64 0.31 1 0.41 0.15 1 .. . . ..MACEDONIA MKD -0.14 0.21 10 -0.28 0.20 11 -0.14 0.18 11 -0.31 0.17 10 -0.08 0.17 10 -0.25 0.17 9 -0.46 0.19 7 -0.71 0.22 4 -0.64 0.14 3 -0.29 0.35 2MADAGASCAR MDG -0.59 0.17 13 -0.36 0.16 14 -0.46 0.15 14 -0.27 0.17 10 -0.36 0.18 9 -0.49 0.18 8 -0.42 0.22 6 -0.57 0.23 4 -0.43 0.15 4 -0.99 0.40 2MALAWI MWI -0.65 0.18 12 -0.51 0.18 12 -0.84 0.16 13 -0.73 0.16 11 -0.72 0.15 11 -0.65 0.15 10 -0.66 0.17 9 -0.34 0.20 5 -0.17 0.14 5 -0.62 0.32 3MALAYSIA MYS 1.13 0.17 12 1.11 0.17 13 1.06 0.15 14 0.99 0.15 12 0.99 0.16 12 0.96 0.15 11 0.85 0.16 11 0.89 0.17 8 0.53 0.13 8 0.86 0.23 7MALDIVES MDV -0.35 0.24 5 -0.01 0.29 5 -0.10 0.23 5 0.13 0.22 5 0.15 0.25 5 0.38 0.25 4 0.78 0.26 4 0.48 0.21 3 0.96 0.15 2 -0.14 0.48 1MALI MLI -0.78 0.18 12 -0.58 0.17 13 -0.63 0.16 13 -0.57 0.17 10 -0.58 0.17 10 -0.43 0.17 9 -0.53 0.19 8 -0.78 0.23 4 -0.90 0.15 4 -0.81 0.40 2MALTA MLT 1.26 0.24 5 1.29 0.22 6 1.16 0.20 6 0.99 0.20 5 1.02 0.23 5 1.05 0.22 5 1.10 0.27 3 1.13 0.27 2 0.95 0.15 2 -0.26 0.61 1MARSHALL ISLANDS MHL -1.22 0.33 3 -1.51 0.43 3 -0.82 0.30 3 -0.84 0.34 3 -0.92 0.34 3 -1.03 0.36 3 -0.46 0.45 3 -0.93 0.29 2 -0.53 0.56 1 .. . . ..MARTINIQUE MTQ 0.76 0.38 1 0.74 0.40 1 0.75 0.38 1 0.75 0.29 1 0.75 0.37 1 0.80 0.33 1 0.85 0.31 1 0.91 0.31 1 0.95 0.15 1 .. . . ..MAURITANIA MRT -0.97 0.20 10 -0.70 0.19 11 -0.84 0.18 10 -0.24 0.23 6 -0.26 0.24 6 0.02 0.25 5 -0.10 0.26 4 -0.19 0.24 3 -0.14 0.15 3 0.18 0.48 1MAURITIUS MUS 0.60 0.17 11 0.49 0.17 11 0.52 0.16 11 0.51 0.16 9 0.54 0.17 9 0.57 0.18 7 0.39 0.18 7 0.38 0.23 5 0.31 0.30 4 0.27 0.30 3MEXICO MEX 0.18 0.17 14 0.12 0.16 15 0.10 0.15 15 -0.01 0.15 13 0.10 0.16 13 0.14 0.15 12 0.26 0.15 12 0.29 0.17 8 0.34 0.13 8 -0.03 0.23 8MICRONESIA FSM -0.63 0.26 4 -0.56 0.31 4 -0.31 0.24 4 -0.13 0.23 4 -0.61 0.26 4 -0.58 0.36 3 -0.44 0.45 3 -0.70 0.29 2 -0.53 0.56 1 .. . . ..MOLDOVA MDA -0.76 0.19 11 -0.82 0.19 12 -0.81 0.17 12 -0.74 0.16 11 -0.83 0.18 10 -0.63 0.18 9 -0.63 0.18 8 -0.63 0.19 6 -0.25 0.14 5 -0.44 0.32 3MONACO MCO 0.80 0.88 1 0.13 0.86 1 0.38 0.86 1 -0.12 0.90 1 1.38 0.87 1 -0.65 0.87 1 -0.63 0.88 1 .. .. .. .. .. .. . . . . ..MONGOLIA MNG -0.68 0.19 11 -0.69 0.20 11 -0.49 0.16 10 -0.37 0.17 9 -0.45 0.20 8 -0.27 0.20 7 -0.16 0.22 6 -0.35 0.20 4 -0.35 0.15 3 -0.52 0.40 2MONTENEGRO MNP 0.01 0.24 8 -0.19 0.27 7 -0.29 0.31 6 .. .. .. . . .. .. .. .. . . .. . . . . .. .. .. .. .. .. . . . . ..MOROCCO MAR -0.09 0.16 13 -0.12 0.16 14 -0.09 0.15 14 -0.24 0.15 12 -0.08 0.15 12 -0.15 0.15 11 -0.15 0.16 11 -0.06 0.18 7 -0.10 0.13 7 -0.20 0.26 5MOZAMBIQUE MOZ -0.38 0.17 13 -0.41 0.16 14 -0.43 0.15 14 -0.35 0.15 12 -0.47 0.15 12 -0.56 0.15 11 -0.41 0.17 9 -0.36 0.20 5 -0.08 0.14 5 -0.35 0.32 3MYANMAR MMR -1.68 0.23 7 -1.64 0.22 8 -1.53 0.21 9 -1.61 0.19 8 -1.60 0.20 8 -1.30 0.19 7 -1.37 0.19 7 -1.20 0.21 4 -1.19 0.14 4 -1.22 0.35 3NAMIBIA NAM 0.31 0.19 11 0.18 0.17 12 0.14 0.16 11 0.07 0.15 12 0.13 0.15 12 0.17 0.15 11 0.10 0.15 11 0.30 0.20 5 0.39 0.14 5 0.52 0.32 3NAURU NRU -0.42 0.39 2 -0.75 0.61 2 -1.31 0.86 1 -0.45 0.90 1 -1.34 0.87 1 -1.75 0.87 1 -1.19 0.88 1 .. .. .. .. .. .. . . . . ..NEPAL NPL -0.75 0.19 10 -0.77 0.20 11 -0.79 0.16 11 -0.86 0.17 10 -0.72 0.18 9 -0.49 0.20 7 -0.41 0.22 7 -0.38 0.20 4 -0.43 0.15 3 -0.25 0.36 2NETHERLANDS NLD 1.86 0.20 9 1.82 0.19 10 1.87 0.18 10 1.96 0.17 9 2.10 0.17 9 2.07 0.17 9 2.09 0.17 9 2.12 0.18 7 2.10 0.13 7 2.29 0.26 6NETHERLANDS ANTILLES ANT 0.76 0.38 1 0.74 0.40 1 0.75 0.38 1 1.02 0.29 1 1.09 0.37 1 .. .. . . .. . . . . .. .. .. .. .. .. . . . . ..NEW CALEDONIA NCL 0.01 0.61 1 0.07 0.65 1 -0.36 0.62 1 .. .. .. . . .. .. .. .. . . .. . . . . .. .. .. .. .. .. 0.43 0.61 1NEW ZEALAND NZL 1.76 0.19 10 1.88 0.18 11 1.86 0.17 11 1.91 0.17 9 2.10 0.17 9 1.98 0.17 9 1.81 0.17 8 1.66 0.18 7 1.77 0.13 7 2.16 0.26 6NICARAGUA NIC -0.96 0.20 11 -0.89 0.19 12 -0.89 0.17 12 -0.78 0.16 10 -0.66 0.17 10 -0.69 0.17 9 -0.75 0.17 9 -0.62 0.19 5 -0.42 0.14 4 -0.81 0.29 5NIGER NER -0.79 0.20 10 -0.86 0.19 11 -0.89 0.19 11 -0.79 0.20 8 -0.70 0.20 8 -0.82 0.21 7 -0.88 0.22 6 -1.13 0.23 4 -1.21 0.15 4 -1.08 0.40 2
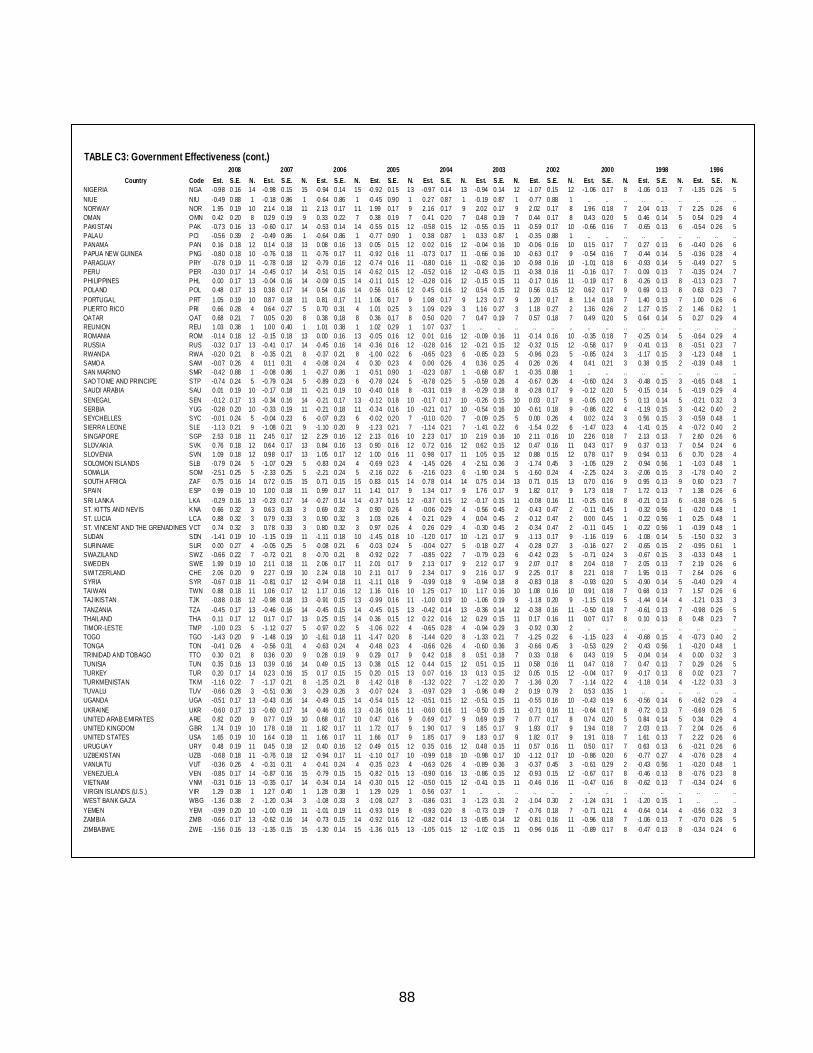
88
TABLE C3: Government Effectiveness (cont.)
2008 2007 2006 2005 2004 2003 2002 2000 1998 1996Country Code Est. S.E. N. Est. S.E. N. Est. S.E. N. Est. S.E. N. Est. S.E. N. Est. S.E. N. Est. S.E. N. Est. S.E. N. Est. S.E. N. Est. S.E. N.
NIGERIA NGA -0.98 0.16 14 -0.98 0.15 15 -0.94 0.14 15 -0.92 0.15 13 -0.97 0.14 13 -0.94 0.14 12 -1.07 0.15 12 -1.06 0.17 8 -1.06 0.13 7 -1.35 0.26 5NIUE NIU -0.49 0.88 1 -0.18 0.86 1 -0.64 0.86 1 -0.45 0.90 1 0.27 0.87 1 -0.19 0.87 1 -0.77 0.88 1 .. .. . . . . .. .. .. .. ..NORWAY NOR 1.95 0.19 10 2.14 0.18 11 2.13 0.17 11 1.99 0.17 9 2.16 0.17 9 2.02 0.17 9 2.02 0.17 8 1.96 0.18 7 2.04 0.13 7 2.25 0.26 6OMAN OMN 0.42 0.20 8 0.29 0.19 9 0.33 0.22 7 0.38 0.19 7 0.41 0.20 7 0.48 0.19 7 0.44 0.17 8 0.43 0.20 5 0.46 0.14 5 0.54 0.29 4PAKISTAN PAK -0.73 0.16 13 -0.60 0.17 14 -0.53 0.14 14 -0.55 0.15 12 -0.58 0.15 12 -0.55 0.15 11 -0.59 0.17 10 -0.66 0.16 7 -0.65 0.13 6 -0.54 0.26 5PALAU PCI -0.56 0.39 2 -0.49 0.86 1 -0.64 0.86 1 -0.77 0.90 1 0.38 0.87 1 0.33 0.87 1 -0.35 0.88 1 .. .. . . . . .. .. .. .. ..PANAMA PAN 0.16 0.18 12 0.14 0.18 13 0.08 0.16 13 0.05 0.15 12 0.02 0.16 12 -0.04 0.16 10 -0.06 0.16 10 0.15 0.17 7 0.27 0.13 6 -0.40 0.26 6PAPUA NEW GUINEA PNG -0.80 0.18 10 -0.76 0.18 11 -0.76 0.17 11 -0.92 0.16 11 -0.73 0.17 11 -0.66 0.16 10 -0.63 0.17 9 -0.54 0.16 7 -0.44 0.14 5 -0.36 0.28 4PARAGUAY PRY -0.78 0.19 11 -0.78 0.18 12 -0.79 0.16 12 -0.74 0.16 11 -0.80 0.16 11 -0.82 0.16 10 -0.98 0.16 10 -1.01 0.18 6 -0.93 0.14 5 -0.49 0.27 5PERU PER -0.30 0.17 14 -0.45 0.17 14 -0.51 0.15 14 -0.62 0.15 12 -0.52 0.16 12 -0.43 0.15 11 -0.38 0.16 11 -0.16 0.17 7 0.09 0.13 7 -0.35 0.24 7PHILIPPINES PHL 0.00 0.17 13 -0.04 0.16 14 -0.09 0.15 14 -0.11 0.15 12 -0.28 0.16 12 -0.15 0.15 11 -0.17 0.16 11 -0.19 0.17 8 -0.26 0.13 8 -0.13 0.23 7POLAND POL 0.48 0.17 13 0.38 0.17 14 0.54 0.16 14 0.56 0.16 12 0.45 0.16 12 0.54 0.15 12 0.56 0.15 12 0.62 0.17 9 0.69 0.13 8 0.63 0.23 7PORTUGAL PRT 1.05 0.19 10 0.87 0.18 11 0.81 0.17 11 1.06 0.17 9 1.08 0.17 9 1.23 0.17 9 1.20 0.17 8 1.14 0.18 7 1.40 0.13 7 1.00 0.26 6PUERTO RICO PRI 0.66 0.28 4 0.64 0.27 5 0.70 0.31 4 1.01 0.25 3 1.09 0.29 3 1.16 0.27 3 1.18 0.27 2 1.36 0.26 2 1.27 0.15 2 1.46 0.62 1QATAR QAT 0.68 0.21 7 0.05 0.20 8 0.38 0.18 8 0.36 0.17 8 0.50 0.20 7 0.47 0.19 7 0.57 0.18 7 0.49 0.20 5 0.64 0.14 5 0.27 0.29 4REUNION REU 1.03 0.38 1 1.00 0.40 1 1.01 0.38 1 1.02 0.29 1 1.07 0.37 1 .. .. .. .. .. .. .. .. . . . . .. .. .. .. ..ROMANIA ROM -0.14 0.18 12 -0.15 0.18 13 0.00 0.16 13 -0.05 0.16 12 0.01 0.16 12 -0.09 0.16 11 -0.14 0.16 10 -0.35 0.18 7 -0.25 0.14 5 -0.64 0.29 4RUSSIA RUS -0.32 0.17 13 -0.41 0.17 14 -0.45 0.16 14 -0.36 0.16 12 -0.28 0.16 12 -0.21 0.15 12 -0.32 0.15 12 -0.58 0.17 9 -0.41 0.13 8 -0.51 0.23 7RWANDA RWA -0.20 0.21 8 -0.35 0.21 8 -0.37 0.21 8 -1.00 0.22 6 -0.65 0.23 6 -0.85 0.23 5 -0.96 0.23 5 -0.85 0.24 3 -1.17 0.15 3 -1.23 0.48 1SAMOA SAM -0.07 0.26 4 0.11 0.31 4 -0.08 0.24 4 0.30 0.23 4 0.00 0.26 4 0.36 0.25 4 0.26 0.26 4 0.41 0.21 3 0.38 0.15 2 -0.39 0.48 1SAN MARINO SMR -0.42 0.88 1 -0.08 0.86 1 -0.27 0.86 1 -0.51 0.90 1 -0.23 0.87 1 -0.68 0.87 1 -0.35 0.88 1 .. .. . . . . .. .. .. .. ..SAO TOME AND PRINCIPE STP -0.74 0.24 5 -0.79 0.24 5 -0.89 0.23 6 -0.78 0.24 5 -0.78 0.25 5 -0.59 0.26 4 -0.67 0.26 4 -0.60 0.24 3 -0.48 0.15 3 -0.65 0.48 1SAUDI ARABIA SAU 0.01 0.19 10 -0.17 0.18 11 -0.21 0.19 10 -0.40 0.18 8 -0.31 0.19 8 -0.29 0.18 8 -0.28 0.17 9 -0.12 0.20 5 -0.15 0.14 5 -0.19 0.29 4SENEGAL SEN -0.12 0.17 13 -0.34 0.16 14 -0.21 0.17 13 -0.12 0.18 10 -0.17 0.17 10 -0.26 0.15 10 0.03 0.17 9 -0.05 0.20 5 0.13 0.14 5 -0.21 0.32 3SERBIA YUG -0.28 0.20 10 -0.33 0.19 11 -0.21 0.18 11 -0.34 0.16 10 -0.21 0.17 10 -0.54 0.16 10 -0.61 0.18 9 -0.86 0.22 4 -1.19 0.15 3 -0.42 0.40 2SEYCHELLES SYC -0.01 0.24 5 -0.04 0.23 6 -0.07 0.23 6 -0.02 0.20 7 -0.10 0.20 7 -0.09 0.25 5 0.00 0.26 4 0.02 0.24 3 0.56 0.15 3 -0.59 0.48 1SIERRA LEONE SLE -1.13 0.21 9 -1.08 0.21 9 -1.10 0.20 9 -1.23 0.21 7 -1.14 0.21 7 -1.41 0.22 6 -1.54 0.22 6 -1.47 0.23 4 -1.41 0.15 4 -0.72 0.40 2SINGAPORE SGP 2.53 0.18 11 2.45 0.17 12 2.29 0.16 12 2.13 0.16 10 2.23 0.17 10 2.19 0.16 10 2.11 0.16 10 2.26 0.18 7 2.13 0.13 7 2.60 0.26 6SLOVAKIA SVK 0.76 0.18 12 0.64 0.17 13 0.84 0.16 13 0.90 0.16 12 0.72 0.16 12 0.62 0.15 12 0.47 0.16 11 0.43 0.17 9 0.37 0.13 7 0.54 0.24 6SLOVENIA SVN 1.09 0.18 12 0.98 0.17 13 1.05 0.17 12 1.00 0.16 11 0.98 0.17 11 1.05 0.15 12 0.88 0.15 12 0.78 0.17 9 0.94 0.13 6 0.70 0.28 4SOLOMON ISLANDS SLB -0.79 0.24 5 -1.07 0.29 5 -0.83 0.24 4 -0.69 0.23 4 -1.45 0.26 4 -2.51 0.36 3 -1.74 0.45 3 -1.05 0.29 2 -0.94 0.56 1 -1.03 0.48 1SOMALIA SOM -2.51 0.25 5 -2.33 0.25 5 -2.21 0.24 5 -2.16 0.22 6 -2.16 0.23 6 -1.90 0.24 5 -1.60 0.24 4 -2.25 0.24 3 -2.06 0.15 3 -1.78 0.40 2SOUTH AFRICA ZAF 0.75 0.16 14 0.72 0.15 15 0.71 0.15 15 0.83 0.15 14 0.78 0.14 14 0.75 0.14 13 0.71 0.15 13 0.70 0.16 9 0.95 0.13 9 0.60 0.23 7SPAIN ESP 0.99 0.19 10 1.00 0.18 11 0.99 0.17 11 1.41 0.17 9 1.34 0.17 9 1.76 0.17 9 1.82 0.17 9 1.73 0.18 7 1.72 0.13 7 1.38 0.26 6SRI LANKA LKA -0.29 0.16 13 -0.23 0.17 14 -0.27 0.14 14 -0.37 0.15 12 -0.37 0.15 12 -0.17 0.15 11 -0.08 0.16 11 -0.25 0.16 8 -0.21 0.13 6 -0.38 0.26 5ST. KITTS AND NEVIS KNA 0.66 0.32 3 0.63 0.33 3 0.69 0.32 3 0.90 0.26 4 -0.06 0.29 4 -0.56 0.45 2 -0.43 0.47 2 -0.11 0.45 1 -0.32 0.56 1 -0.20 0.48 1ST. LUCIA LCA 0.88 0.32 3 0.79 0.33 3 0.90 0.32 3 1.03 0.26 4 0.21 0.29 4 0.04 0.45 2 -0.12 0.47 2 0.00 0.45 1 -0.22 0.56 1 0.25 0.48 1ST. VINCENT AND THE GRENADINES VCT 0.74 0.32 3 0.78 0.33 3 0.80 0.32 3 0.97 0.26 4 0.26 0.29 4 -0.30 0.45 2 -0.34 0.47 2 -0.11 0.45 1 -0.22 0.56 1 -0.39 0.48 1SUDAN SDN -1.41 0.19 10 -1.15 0.19 11 -1.11 0.18 10 -1.45 0.18 10 -1.20 0.17 10 -1.21 0.17 9 -1.13 0.17 9 -1.16 0.19 6 -1.08 0.14 5 -1.50 0.32 3SURINAME SUR 0.00 0.27 4 -0.05 0.25 5 -0.08 0.21 6 -0.03 0.24 5 -0.04 0.27 5 -0.18 0.27 4 -0.28 0.27 3 -0.16 0.27 2 -0.65 0.15 2 -0.95 0.61 1SWAZILAND SWZ -0.66 0.22 7 -0.72 0.21 8 -0.70 0.21 8 -0.92 0.22 7 -0.85 0.22 7 -0.79 0.23 6 -0.42 0.23 5 -0.71 0.24 3 -0.67 0.15 3 -0.33 0.48 1SWEDEN SWE 1.99 0.19 10 2.11 0.18 11 2.06 0.17 11 2.01 0.17 9 2.13 0.17 9 2.12 0.17 9 2.07 0.17 8 2.04 0.18 7 2.05 0.13 7 2.19 0.26 6SWITZERLAND CHE 2.06 0.20 9 2.27 0.19 10 2.24 0.18 10 2.11 0.17 9 2.34 0.17 9 2.16 0.17 9 2.25 0.17 8 2.21 0.18 7 1.95 0.13 7 2.64 0.26 6SYRIA SYR -0.67 0.18 11 -0.81 0.17 12 -0.94 0.18 11 -1.11 0.18 9 -0.99 0.18 9 -0.94 0.18 8 -0.83 0.18 8 -0.93 0.20 5 -0.90 0.14 5 -0.40 0.29 4TAIWAN TWN 0.88 0.18 11 1.06 0.17 12 1.17 0.16 12 1.16 0.16 10 1.25 0.17 10 1.17 0.16 10 1.08 0.16 10 0.91 0.18 7 0.68 0.13 7 1.57 0.26 6TAJIKISTAN TJK -0.88 0.18 12 -0.98 0.18 13 -0.91 0.15 13 -0.99 0.16 11 -1.00 0.19 10 -1.06 0.19 9 -1.18 0.20 9 -1.15 0.19 5 -1.44 0.14 4 -1.21 0.33 3TANZANIA TZA -0.45 0.17 13 -0.46 0.16 14 -0.45 0.15 14 -0.45 0.15 13 -0.42 0.14 13 -0.36 0.14 12 -0.38 0.16 11 -0.50 0.18 7 -0.61 0.13 7 -0.98 0.26 5THAILAND THA 0.11 0.17 12 0.17 0.17 13 0.25 0.15 14 0.36 0.15 12 0.22 0.16 12 0.29 0.15 11 0.17 0.16 11 0.07 0.17 8 0.10 0.13 8 0.48 0.23 7TIMOR-LESTE TMP -1.00 0.23 5 -1.12 0.27 5 -0.97 0.22 5 -1.06 0.22 4 -0.65 0.28 4 -0.94 0.29 3 -0.92 0.30 2 .. .. . . . . .. .. .. .. ..TOGO TGO -1.43 0.20 9 -1.48 0.19 10 -1.61 0.18 11 -1.47 0.20 8 -1.44 0.20 8 -1.33 0.21 7 -1.25 0.22 6 -1.15 0.23 4 -0.68 0.15 4 -0.73 0.40 2TONGA TON -0.41 0.26 4 -0.56 0.31 4 -0.63 0.24 4 -0.48 0.23 4 -0.66 0.26 4 -0.60 0.36 3 -0.66 0.45 3 -0.53 0.29 2 -0.43 0.56 1 -0.20 0.48 1TRINIDAD AND TOBAGO TTO 0.30 0.21 8 0.36 0.20 9 0.28 0.19 9 0.29 0.17 9 0.42 0.18 8 0.51 0.18 7 0.33 0.18 6 0.43 0.19 5 -0.04 0.14 4 0.00 0.32 3TUNISIA TUN 0.35 0.16 13 0.39 0.16 14 0.49 0.15 13 0.38 0.15 12 0.44 0.15 12 0.51 0.15 11 0.58 0.16 11 0.47 0.18 7 0.47 0.13 7 0.29 0.26 5TURKEY TUR 0.20 0.17 14 0.23 0.16 15 0.17 0.15 15 0.20 0.15 13 0.07 0.16 13 0.13 0.15 12 0.05 0.15 12 -0.04 0.17 9 -0.17 0.13 8 0.02 0.23 7TURKMENISTAN TKM -1.16 0.22 7 -1.17 0.21 8 -1.25 0.21 8 -1.42 0.18 8 -1.32 0.22 7 -1.22 0.20 7 -1.36 0.20 7 -1.14 0.22 4 -1.18 0.14 4 -1.22 0.33 3TUVALU TUV -0.66 0.28 3 -0.51 0.36 3 -0.29 0.26 3 -0.07 0.24 3 -0.97 0.29 3 -0.96 0.49 2 0.19 0.79 2 0.53 0.35 1 .. .. .. .. .. ..UGANDA UGA -0.51 0.17 13 -0.43 0.16 14 -0.49 0.15 14 -0.54 0.15 12 -0.51 0.15 12 -0.51 0.15 11 -0.55 0.16 10 -0.43 0.19 6 -0.56 0.14 6 -0.62 0.29 4UKRAINE UKR -0.60 0.17 13 -0.60 0.17 14 -0.46 0.16 13 -0.36 0.16 11 -0.60 0.16 11 -0.50 0.15 11 -0.71 0.16 11 -0.64 0.17 8 -0.72 0.13 7 -0.69 0.26 5UNITED ARAB EMIRATES ARE 0.82 0.20 9 0.77 0.19 10 0.68 0.17 10 0.47 0.16 9 0.69 0.17 9 0.69 0.19 7 0.77 0.17 8 0.74 0.20 5 0.84 0.14 5 0.34 0.29 4UNITED KINGDOM GBR 1.74 0.19 10 1.78 0.18 11 1.82 0.17 11 1.72 0.17 9 1.90 0.17 9 1.85 0.17 9 1.93 0.17 9 1.94 0.18 7 2.03 0.13 7 2.04 0.26 6UNITED STATES USA 1.65 0.19 10 1.64 0.18 11 1.66 0.17 11 1.66 0.17 9 1.85 0.17 9 1.83 0.17 9 1.82 0.17 9 1.91 0.18 7 1.61 0.13 7 2.22 0.26 6URUGUAY URY 0.48 0.19 11 0.45 0.18 12 0.40 0.16 12 0.49 0.15 12 0.35 0.16 12 0.48 0.15 11 0.57 0.16 11 0.50 0.17 7 0.63 0.13 6 -0.21 0.26 6UZBEKISTAN UZB -0.68 0.18 11 -0.76 0.18 12 -0.94 0.17 11 -1.10 0.17 10 -0.99 0.18 10 -0.98 0.17 10 -1.12 0.17 10 -0.86 0.20 6 -0.77 0.27 4 -0.76 0.28 4VANUATU VUT -0.36 0.26 4 -0.31 0.31 4 -0.41 0.24 4 -0.35 0.23 4 -0.63 0.26 4 -0.89 0.36 3 -0.37 0.45 3 -0.61 0.29 2 -0.43 0.56 1 -0.20 0.48 1VENEZUELA VEN -0.85 0.17 14 -0.87 0.16 15 -0.79 0.15 15 -0.82 0.15 13 -0.90 0.16 13 -0.86 0.15 12 -0.93 0.15 12 -0.67 0.17 8 -0.46 0.13 8 -0.76 0.23 8VIETNAM VNM -0.31 0.16 13 -0.35 0.17 14 -0.34 0.14 14 -0.30 0.15 12 -0.50 0.15 12 -0.41 0.15 11 -0.46 0.16 11 -0.47 0.16 8 -0.62 0.13 7 -0.34 0.24 6VIRGIN ISLANDS (U.S.) VIR 1.29 0.38 1 1.27 0.40 1 1.28 0.38 1 1.29 0.29 1 0.56 0.37 1 .. .. .. .. .. .. .. .. . . . . .. .. .. .. ..WEST BANK GAZA WBG -1.36 0.38 2 -1.20 0.34 3 -1.08 0.33 3 -1.08 0.27 3 -0.86 0.31 3 -1.23 0.31 2 -1.04 0.30 2 -1.24 0.31 1 -1.20 0.15 1 .. .. ..YEMEN YEM -0.99 0.20 10 -1.00 0.19 11 -1.01 0.19 11 -0.93 0.19 8 -0.93 0.20 8 -0.73 0.19 7 -0.76 0.18 7 -0.71 0.21 4 -0.64 0.14 4 -0.56 0.32 3ZAMBIA ZMB -0.66 0.17 13 -0.62 0.16 14 -0.73 0.15 14 -0.92 0.16 12 -0.82 0.14 13 -0.85 0.14 12 -0.81 0.16 11 -0.96 0.18 7 -1.06 0.13 7 -0.70 0.26 5ZIMBABWE ZWE -1.56 0.16 13 -1.35 0.15 15 -1.30 0.14 15 -1.36 0.15 13 -1.05 0.15 12 -1.02 0.15 11 -0.96 0.16 11 -0.89 0.17 8 -0.47 0.13 8 -0.34 0.24 6
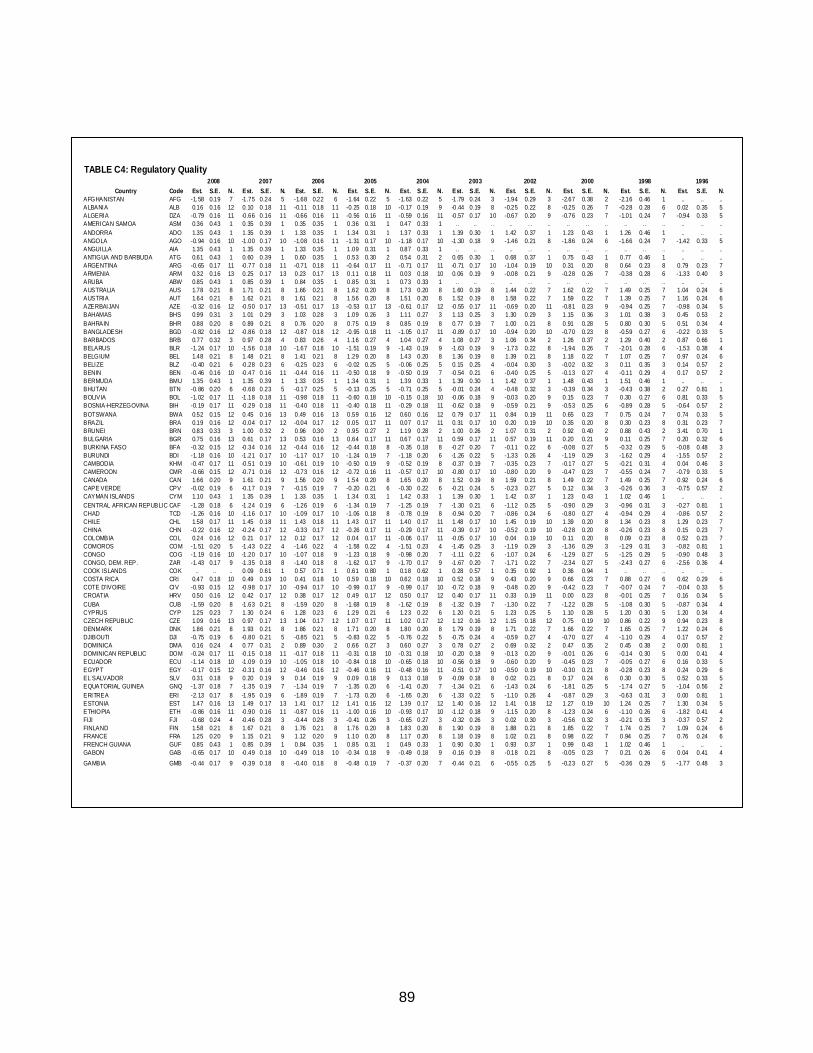
89
TABLE C4: Regulatory Quality
2008 2007 2006 2005 2004 2003 2002 2000 1998 1996Country Code Est. S.E. N. Est. S.E. N. Est. S.E. N. Est. S.E. N. Est. S.E. N. Est. S.E. N. Est. S.E. N. Est. S.E. N. Est. S.E. N. Est. S.E. N.
AFGHANISTAN AFG -1.58 0.19 7 -1.75 0.24 5 -1.68 0.22 6 -1.64 0.22 5 -1.63 0.22 5 -1.79 0.24 3 -1.94 0.29 3 -2.67 0.38 2 -2.16 0.46 1 .. .. ..ALBANIA ALB 0.16 0.16 12 0.10 0.18 11 -0.11 0.18 11 -0.25 0.18 10 -0.17 0.19 9 -0.44 0.19 8 -0.25 0.22 8 -0.25 0.26 7 -0.28 0.28 6 0.02 0.35 5ALGERIA DZA -0.79 0.16 11 -0.66 0.16 11 -0.66 0.16 11 -0.56 0.16 11 -0.59 0.16 11 -0.57 0.17 10 -0.67 0.20 9 -0.76 0.23 7 -1.01 0.24 7 -0.94 0.33 5AMERICAN SAMOA ASM 0.36 0.43 1 0.35 0.39 1 0.35 0.35 1 0.36 0.31 1 0.47 0.33 1 .. .. . . .. . . .. .. . . .. .. . . .. .. .. ..ANDORRA ADO 1.35 0.43 1 1.35 0.39 1 1.33 0.35 1 1.34 0.31 1 1.37 0.33 1 1.39 0.30 1 1.42 0.37 1 1.23 0.43 1 1.26 0.46 1 .. .. ..ANGOLA AGO -0.94 0.16 10 -1.00 0.17 10 -1.08 0.16 11 -1.31 0.17 10 -1.18 0.17 10 -1.30 0.18 9 -1.46 0.21 8 -1.86 0.24 6 -1.66 0.24 7 -1.42 0.33 5ANGUILLA AIA 1.35 0.43 1 1.35 0.39 1 1.33 0.35 1 1.09 0.31 1 0.87 0.33 1 .. .. . . .. . . .. .. . . .. .. . . .. .. .. ..ANTIGUA AND BARBUDA ATG 0.61 0.43 1 0.60 0.39 1 0.60 0.35 1 0.53 0.30 2 0.54 0.31 2 0.65 0.30 1 0.68 0.37 1 0.75 0.43 1 0.77 0.46 1 .. .. ..ARGENTINA ARG -0.65 0.17 11 -0.77 0.18 11 -0.71 0.18 11 -0.64 0.17 11 -0.71 0.17 11 -0.71 0.17 10 -1.04 0.19 10 0.31 0.20 8 0.64 0.23 8 0.79 0.23 7ARMENIA ARM 0.32 0.16 13 0.25 0.17 13 0.23 0.17 13 0.11 0.18 11 0.03 0.18 10 0.06 0.19 9 -0.08 0.21 9 -0.28 0.26 7 -0.38 0.28 6 -1.33 0.40 3ARUBA ABW 0.85 0.43 1 0.85 0.39 1 0.84 0.35 1 0.85 0.31 1 0.73 0.33 1 .. .. . . .. . . .. .. . . .. .. . . .. .. .. ..AUSTRALIA AUS 1.78 0.21 8 1.71 0.21 8 1.66 0.21 8 1.62 0.20 8 1.73 0.20 8 1.60 0.19 8 1.44 0.22 7 1.62 0.22 7 1.49 0.25 7 1.04 0.24 6AUSTRIA AUT 1.64 0.21 8 1.62 0.21 8 1.61 0.21 8 1.56 0.20 8 1.51 0.20 8 1.52 0.19 8 1.58 0.22 7 1.59 0.22 7 1.39 0.25 7 1.16 0.24 6AZERBAIJAN AZE -0.32 0.16 12 -0.50 0.17 13 -0.51 0.17 13 -0.53 0.17 13 -0.61 0.17 12 -0.55 0.17 11 -0.69 0.20 11 -0.81 0.23 9 -0.94 0.25 7 -0.98 0.34 5BAHAMAS BHS 0.99 0.31 3 1.01 0.29 3 1.03 0.28 3 1.09 0.26 3 1.11 0.27 3 1.13 0.25 3 1.30 0.29 3 1.15 0.36 3 1.01 0.38 3 0.45 0.53 2BAHRAIN BHR 0.88 0.20 8 0.89 0.21 8 0.76 0.20 8 0.75 0.19 8 0.85 0.19 8 0.77 0.19 7 1.00 0.21 8 0.91 0.28 5 0.80 0.30 5 0.51 0.34 4BANGLADESH BGD -0.82 0.16 12 -0.86 0.18 12 -0.87 0.18 12 -0.95 0.18 11 -1.05 0.17 11 -0.89 0.17 10 -0.94 0.20 10 -0.70 0.23 8 -0.59 0.27 6 -0.22 0.33 5BARBADOS BRB 0.77 0.32 3 0.97 0.28 4 0.83 0.26 4 1.16 0.27 4 1.04 0.27 4 1.08 0.27 3 1.06 0.34 2 1.26 0.37 2 1.29 0.40 2 0.87 0.66 1BELARUS BLR -1.24 0.17 10 -1.56 0.18 10 -1.67 0.18 10 -1.51 0.19 9 -1.43 0.19 9 -1.63 0.19 9 -1.73 0.22 8 -1.94 0.26 7 -2.01 0.28 6 -1.53 0.38 4BELGIUM BEL 1.48 0.21 8 1.48 0.21 8 1.41 0.21 8 1.29 0.20 8 1.43 0.20 8 1.36 0.19 8 1.39 0.21 8 1.18 0.22 7 1.07 0.25 7 0.97 0.24 6BELIZE BLZ -0.40 0.21 6 -0.28 0.23 6 -0.25 0.23 6 -0.02 0.25 5 -0.06 0.25 5 0.15 0.25 4 -0.04 0.30 3 -0.02 0.32 3 0.11 0.35 3 0.14 0.57 2BENIN BEN -0.46 0.16 10 -0.47 0.16 11 -0.44 0.16 11 -0.50 0.18 9 -0.50 0.19 7 -0.54 0.21 6 -0.40 0.25 5 -0.13 0.27 4 -0.11 0.29 4 0.17 0.57 2BERMUDA BMU 1.35 0.43 1 1.35 0.39 1 1.33 0.35 1 1.34 0.31 1 1.39 0.33 1 1.39 0.30 1 1.42 0.37 1 1.48 0.43 1 1.51 0.46 1 .. .. ..BHUTAN BTN -0.86 0.20 6 -0.68 0.23 5 -0.17 0.25 5 -0.13 0.25 5 -0.71 0.25 5 -0.01 0.24 4 -0.48 0.32 3 -0.39 0.34 3 -0.43 0.38 2 0.27 0.81 1BOLIVIA BOL -1.02 0.17 11 -1.18 0.18 11 -0.98 0.18 11 -0.60 0.18 10 -0.15 0.18 10 -0.06 0.18 9 -0.03 0.20 9 0.15 0.23 7 0.30 0.27 6 0.81 0.33 5BOSNIA-HERZEGOVINA BIH -0.19 0.17 11 -0.29 0.18 11 -0.40 0.18 11 -0.40 0.18 11 -0.29 0.18 11 -0.62 0.18 9 -0.59 0.21 9 -0.53 0.25 6 -0.89 0.28 5 -0.64 0.57 2BOTSWANA BWA 0.52 0.15 12 0.45 0.16 13 0.49 0.16 13 0.59 0.16 12 0.60 0.16 12 0.79 0.17 11 0.84 0.19 11 0.65 0.23 7 0.75 0.24 7 0.74 0.33 5BRAZIL BRA 0.19 0.16 12 -0.04 0.17 12 -0.04 0.17 12 0.05 0.17 11 0.07 0.17 11 0.31 0.17 10 0.20 0.19 10 0.35 0.20 8 0.30 0.23 8 0.31 0.23 7BRUNEI BRN 0.83 0.33 3 1.00 0.32 2 0.96 0.30 2 0.95 0.27 2 1.19 0.28 2 1.00 0.26 2 1.07 0.31 2 0.92 0.40 2 0.88 0.43 2 3.41 0.70 1BULGARIA BGR 0.75 0.16 13 0.61 0.17 13 0.53 0.16 13 0.64 0.17 11 0.67 0.17 11 0.59 0.17 11 0.57 0.19 11 0.20 0.21 9 0.11 0.25 7 0.20 0.32 6BURKINA FASO BFA -0.32 0.15 12 -0.34 0.16 12 -0.44 0.16 12 -0.44 0.18 8 -0.35 0.18 8 -0.27 0.20 7 -0.11 0.22 6 -0.08 0.27 5 -0.32 0.29 5 -0.08 0.48 3BURUNDI BDI -1.18 0.16 10 -1.21 0.17 10 -1.17 0.17 10 -1.24 0.19 7 -1.18 0.20 6 -1.26 0.22 5 -1.33 0.26 4 -1.19 0.29 3 -1.62 0.29 4 -1.55 0.57 2CAMBODIA KHM -0.47 0.17 11 -0.51 0.19 10 -0.61 0.19 10 -0.50 0.19 9 -0.52 0.19 8 -0.37 0.19 7 -0.35 0.23 7 -0.17 0.27 5 -0.21 0.31 4 0.04 0.46 3CAMEROON CMR -0.66 0.15 12 -0.71 0.16 12 -0.73 0.16 12 -0.72 0.16 11 -0.57 0.17 10 -0.80 0.17 10 -0.80 0.20 9 -0.47 0.23 7 -0.55 0.24 7 -0.79 0.33 5CANADA CAN 1.66 0.20 9 1.61 0.21 9 1.56 0.20 9 1.54 0.20 8 1.65 0.20 8 1.52 0.19 8 1.59 0.21 8 1.49 0.22 7 1.49 0.25 7 0.92 0.24 6CAPE VERDE CPV -0.02 0.19 6 -0.17 0.19 7 -0.15 0.19 7 -0.20 0.21 6 -0.30 0.22 6 -0.21 0.24 5 -0.23 0.27 5 0.12 0.34 3 -0.26 0.36 3 -0.75 0.57 2CAYMAN ISLANDS CYM 1.10 0.43 1 1.35 0.39 1 1.33 0.35 1 1.34 0.31 1 1.42 0.33 1 1.39 0.30 1 1.42 0.37 1 1.23 0.43 1 1.02 0.46 1 .. .. ..CENTRAL AFRICAN REPUBLIC CAF -1.28 0.18 6 -1.24 0.19 6 -1.26 0.19 6 -1.34 0.19 7 -1.25 0.19 7 -1.30 0.21 6 -1.12 0.25 5 -0.90 0.29 3 -0.96 0.31 3 -0.27 0.81 1CHAD TCD -1.26 0.16 10 -1.16 0.17 10 -1.09 0.17 10 -1.06 0.18 8 -0.78 0.19 8 -0.94 0.20 7 -0.86 0.24 6 -0.80 0.27 4 -0.94 0.29 4 -0.86 0.57 2CHILE CHL 1.58 0.17 11 1.45 0.18 11 1.43 0.18 11 1.43 0.17 11 1.40 0.17 11 1.48 0.17 10 1.45 0.19 10 1.39 0.20 8 1.34 0.23 8 1.29 0.23 7CHINA CHN -0.22 0.16 12 -0.24 0.17 12 -0.33 0.17 12 -0.26 0.17 11 -0.29 0.17 11 -0.39 0.17 10 -0.52 0.19 10 -0.28 0.20 8 -0.26 0.23 8 0.15 0.23 7COLOMBIA COL 0.24 0.16 12 0.21 0.17 12 0.12 0.17 12 0.04 0.17 11 -0.06 0.17 11 -0.05 0.17 10 0.04 0.19 10 0.11 0.20 8 0.09 0.23 8 0.52 0.23 7COMOROS COM -1.51 0.20 5 -1.43 0.22 4 -1.46 0.22 4 -1.58 0.22 4 -1.51 0.23 4 -1.45 0.25 3 -1.19 0.29 3 -1.36 0.29 3 -1.29 0.31 3 -0.82 0.81 1CONGO COG -1.19 0.16 10 -1.20 0.17 10 -1.07 0.18 9 -1.23 0.18 9 -0.98 0.20 7 -1.11 0.22 6 -1.07 0.24 6 -1.29 0.27 5 -1.25 0.29 5 -0.90 0.48 3CONGO, DEM. REP. ZAR -1.43 0.17 9 -1.35 0.18 8 -1.40 0.18 8 -1.62 0.17 9 -1.70 0.17 9 -1.67 0.20 7 -1.71 0.22 7 -2.34 0.27 5 -2.43 0.27 6 -2.56 0.36 4COOK ISLANDS COK .. .. .. 0.09 0.61 1 0.57 0.71 1 0.61 0.80 1 0.18 0.62 1 0.28 0.57 1 0.35 0.92 1 0.36 0.94 1 .. . . .. .. .. ..COSTA RICA CRI 0.47 0.18 10 0.49 0.19 10 0.41 0.18 10 0.59 0.18 10 0.62 0.18 10 0.52 0.18 9 0.43 0.20 9 0.66 0.23 7 0.88 0.27 6 0.62 0.29 6COTE D'IVOIRE CIV -0.93 0.15 12 -0.98 0.17 10 -0.94 0.17 10 -0.99 0.17 9 -0.99 0.17 10 -0.72 0.18 9 -0.48 0.20 9 -0.42 0.23 7 -0.07 0.24 7 -0.04 0.33 5CROATIA HRV 0.50 0.16 12 0.42 0.17 12 0.38 0.17 12 0.49 0.17 12 0.50 0.17 12 0.40 0.17 11 0.33 0.19 11 0.00 0.23 8 -0.01 0.25 7 0.16 0.34 5CUBA CUB -1.59 0.20 8 -1.63 0.21 8 -1.59 0.20 8 -1.68 0.19 8 -1.62 0.19 8 -1.32 0.19 7 -1.30 0.22 7 -1.22 0.28 5 -1.08 0.30 5 -0.87 0.34 4CYPRUS CYP 1.25 0.23 7 1.30 0.24 6 1.28 0.23 6 1.29 0.21 6 1.23 0.22 6 1.20 0.21 5 1.23 0.25 5 1.10 0.28 5 1.20 0.30 5 1.20 0.34 4CZECH REPUBLIC CZE 1.09 0.16 13 0.97 0.17 13 1.04 0.17 12 1.07 0.17 11 1.02 0.17 12 1.12 0.16 12 1.15 0.18 12 0.75 0.19 10 0.86 0.22 9 0.94 0.23 8DENMARK DNK 1.86 0.21 8 1.93 0.21 8 1.86 0.21 8 1.71 0.20 8 1.80 0.20 8 1.79 0.19 8 1.71 0.22 7 1.66 0.22 7 1.65 0.25 7 1.22 0.24 6DJIBOUTI DJI -0.75 0.19 6 -0.80 0.21 5 -0.85 0.21 5 -0.83 0.22 5 -0.76 0.22 5 -0.75 0.24 4 -0.59 0.27 4 -0.70 0.27 4 -1.10 0.29 4 0.17 0.57 2DOMINICA DMA 0.16 0.24 4 0.77 0.31 2 0.89 0.30 2 0.66 0.27 3 0.60 0.27 3 0.78 0.27 2 0.69 0.32 2 0.47 0.35 2 0.45 0.38 2 0.00 0.81 1DOMINICAN REPUBLIC DOM -0.24 0.17 11 -0.15 0.18 11 -0.17 0.18 11 -0.31 0.18 10 -0.31 0.18 10 -0.20 0.18 9 -0.13 0.20 9 -0.01 0.26 6 -0.14 0.30 5 0.00 0.41 4ECUADOR ECU -1.14 0.18 10 -1.09 0.19 10 -1.05 0.18 10 -0.84 0.18 10 -0.65 0.18 10 -0.56 0.18 9 -0.60 0.20 9 -0.45 0.23 7 -0.05 0.27 6 0.16 0.33 5EGYPT EGY -0.17 0.15 12 -0.31 0.16 12 -0.46 0.16 12 -0.46 0.16 11 -0.48 0.16 11 -0.51 0.17 10 -0.50 0.19 10 -0.30 0.21 8 -0.28 0.23 8 0.24 0.29 6EL SALVADOR SLV 0.31 0.18 9 0.20 0.19 9 0.14 0.19 9 0.09 0.18 9 0.13 0.18 9 -0.09 0.18 8 0.02 0.21 8 0.17 0.24 6 0.30 0.30 5 0.52 0.33 5EQUATORIAL GUINEA GNQ -1.37 0.18 7 -1.35 0.19 7 -1.34 0.19 7 -1.35 0.20 6 -1.41 0.20 7 -1.34 0.21 6 -1.43 0.24 6 -1.81 0.25 5 -1.74 0.27 5 -1.04 0.56 2ERITREA ERI -2.13 0.17 8 -1.95 0.19 6 -1.89 0.19 7 -1.73 0.20 6 -1.65 0.20 6 -1.33 0.22 5 -1.10 0.26 4 -0.87 0.29 3 -0.63 0.31 3 0.00 0.81 1ESTONIA EST 1.47 0.16 13 1.49 0.17 13 1.41 0.17 12 1.41 0.16 12 1.39 0.17 12 1.40 0.16 12 1.41 0.18 12 1.27 0.19 10 1.24 0.25 7 1.30 0.34 5ETHIOPIA ETH -0.86 0.16 11 -0.90 0.16 11 -0.87 0.16 11 -1.00 0.16 10 -0.93 0.17 10 -1.12 0.18 9 -1.15 0.20 8 -1.23 0.24 6 -1.10 0.26 6 -1.82 0.41 4FIJI FJI -0.68 0.24 4 -0.46 0.28 3 -0.44 0.28 3 -0.41 0.26 3 -0.65 0.27 3 -0.32 0.26 3 0.02 0.30 3 -0.56 0.32 3 -0.21 0.35 3 -0.37 0.57 2FINLAND FIN 1.58 0.21 8 1.67 0.21 8 1.76 0.21 8 1.76 0.20 8 1.83 0.20 8 1.90 0.19 8 1.88 0.21 8 1.85 0.22 7 1.74 0.25 7 1.09 0.24 6FRANCE FRA 1.25 0.20 9 1.15 0.21 9 1.12 0.20 9 1.10 0.20 8 1.17 0.20 8 1.18 0.19 8 1.02 0.21 8 0.98 0.22 7 0.94 0.25 7 0.76 0.24 6FRENCH GUIANA GUF 0.85 0.43 1 0.85 0.39 1 0.84 0.35 1 0.85 0.31 1 0.49 0.33 1 0.90 0.30 1 0.93 0.37 1 0.99 0.43 1 1.02 0.46 1 .. .. ..GABON GAB -0.65 0.17 10 -0.49 0.18 10 -0.49 0.18 10 -0.34 0.18 9 -0.49 0.18 9 -0.16 0.19 8 -0.18 0.21 8 -0.05 0.23 7 0.21 0.26 6 0.04 0.41 4GAMBIA GMB -0.44 0.17 9 -0.39 0.18 8 -0.40 0.18 8 -0.48 0.19 7 -0.37 0.20 7 -0.44 0.21 6 -0.55 0.25 5 -0.23 0.27 5 -0.36 0.29 5 -1.77 0.48 3
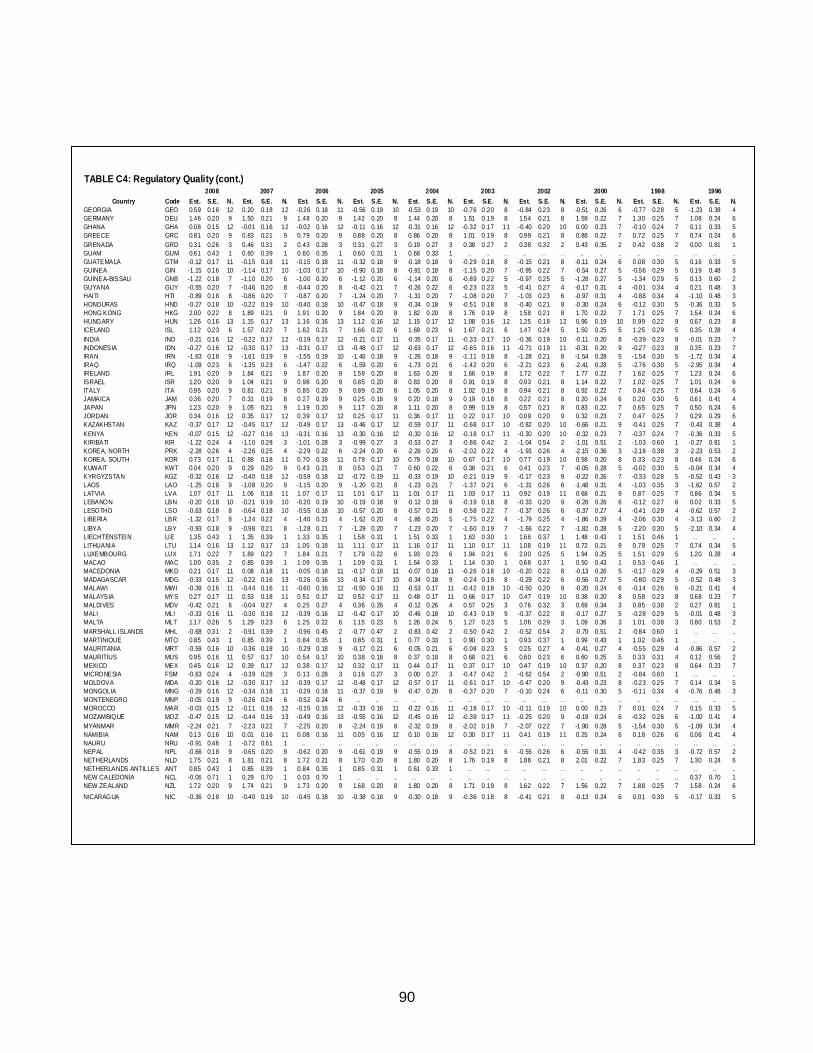
90
TABLE C4: Regulatory Quality (cont.)
2008 2007 2006 2005 2004 2003 2002 2000 1998 1996Country Code Est. S.E. N. Est. S.E. N. Est. S.E. N. Est. S.E. N. Est. S.E. N. Est. S.E. N. Est. S.E. N. Est. S.E. N. Est. S.E. N. Est. S.E. N.
GEORGIA GEO 0.59 0.16 12 0.20 0.18 12 -0.26 0.18 11 -0.56 0.19 10 -0.53 0.19 10 -0.76 0.20 8 -0.84 0.23 8 -0.51 0.26 6 -0.77 0.28 5 -1.23 0.38 4GERMANY DEU 1.46 0.20 9 1.50 0.21 9 1.48 0.20 9 1.42 0.20 8 1.44 0.20 8 1.51 0.19 8 1.54 0.21 8 1.59 0.22 7 1.30 0.25 7 1.08 0.24 6GHANA GHA 0.08 0.15 12 -0.01 0.16 12 -0.02 0.16 12 -0.11 0.16 12 -0.31 0.16 12 -0.32 0.17 11 -0.40 0.20 10 0.00 0.23 7 -0.10 0.24 7 0.11 0.33 5GREECE GRC 0.81 0.20 9 0.83 0.21 9 0.79 0.20 9 0.88 0.20 8 0.86 0.20 8 1.01 0.19 8 0.99 0.21 8 0.88 0.22 7 0.72 0.25 7 0.74 0.24 6GRENADA GRD 0.31 0.26 3 0.46 0.31 2 0.43 0.28 3 0.31 0.27 3 0.19 0.27 3 0.38 0.27 2 0.38 0.32 2 0.43 0.35 2 0.42 0.38 2 0.00 0.81 1GUAM GUM 0.61 0.43 1 0.60 0.39 1 0.60 0.35 1 0.60 0.31 1 0.68 0.33 1 .. .. . . .. . . . . .. .. .. .. .. .. . . . . ..GUATEMALA GTM -0.12 0.17 11 -0.15 0.18 11 -0.15 0.18 11 -0.32 0.18 9 -0.18 0.18 9 -0.29 0.18 8 -0.15 0.21 8 -0.11 0.24 6 0.08 0.30 5 0.16 0.33 5GUINEA GIN -1.15 0.16 10 -1.14 0.17 10 -1.03 0.17 10 -0.90 0.18 8 -0.91 0.18 8 -1.15 0.20 7 -0.95 0.22 7 -0.54 0.27 5 -0.56 0.29 5 0.19 0.48 3GUINEA-BISSAU GNB -1.22 0.18 7 -1.10 0.20 6 -1.00 0.20 6 -1.12 0.20 6 -1.14 0.20 6 -0.89 0.22 5 -0.97 0.25 5 -1.28 0.27 5 -1.34 0.29 5 0.13 0.60 2GUYANA GUY -0.55 0.20 7 -0.46 0.20 8 -0.44 0.20 8 -0.42 0.21 7 -0.26 0.22 6 -0.23 0.23 5 -0.41 0.27 4 -0.17 0.31 4 -0.01 0.34 4 0.21 0.48 3HAITI HTI -0.89 0.18 8 -0.86 0.20 7 -0.87 0.20 7 -1.24 0.20 7 -1.31 0.20 7 -1.08 0.20 7 -1.03 0.23 6 -0.97 0.31 4 -0.88 0.34 4 -1.10 0.48 3HONDURAS HND -0.27 0.18 10 -0.22 0.19 10 -0.40 0.18 10 -0.47 0.18 9 -0.34 0.18 9 -0.51 0.18 8 -0.40 0.21 8 -0.30 0.24 6 -0.12 0.30 5 -0.36 0.33 5HONG KONG HKG 2.00 0.22 8 1.89 0.21 9 1.91 0.20 9 1.84 0.20 8 1.82 0.20 8 1.76 0.19 8 1.58 0.21 8 1.70 0.22 7 1.71 0.25 7 1.54 0.24 6HUNGARY HUN 1.26 0.16 13 1.15 0.17 13 1.16 0.16 13 1.12 0.16 12 1.15 0.17 12 1.08 0.16 12 1.25 0.18 12 0.96 0.19 10 0.99 0.22 9 0.67 0.23 8ICELAND ISL 1.12 0.23 6 1.57 0.22 7 1.62 0.21 7 1.66 0.22 6 1.69 0.23 6 1.67 0.21 6 1.47 0.24 5 1.50 0.25 5 1.25 0.29 5 0.35 0.28 4INDIA IND -0.21 0.16 12 -0.22 0.17 12 -0.19 0.17 12 -0.21 0.17 11 -0.35 0.17 11 -0.33 0.17 10 -0.36 0.19 10 -0.11 0.20 8 -0.39 0.23 8 -0.01 0.23 7INDONESIA IDN -0.27 0.16 12 -0.30 0.17 13 -0.31 0.17 13 -0.48 0.17 12 -0.63 0.17 12 -0.65 0.16 11 -0.71 0.19 11 -0.31 0.20 9 -0.27 0.23 8 0.35 0.23 7IRAN IRN -1.63 0.18 9 -1.61 0.19 9 -1.55 0.19 10 -1.46 0.18 9 -1.26 0.18 9 -1.11 0.18 8 -1.28 0.21 8 -1.54 0.28 5 -1.54 0.30 5 -1.72 0.34 4IRAQ IRQ -1.09 0.23 6 -1.35 0.23 6 -1.47 0.22 6 -1.59 0.20 6 -1.73 0.21 6 -1.42 0.20 6 -2.21 0.23 6 -2.41 0.28 5 -2.76 0.30 5 -2.95 0.34 4IRELAND IRL 1.91 0.20 9 1.84 0.21 9 1.87 0.20 9 1.59 0.20 8 1.63 0.20 8 1.66 0.19 8 1.72 0.22 7 1.77 0.22 7 1.62 0.25 7 1.23 0.24 6ISRAEL ISR 1.20 0.20 9 1.04 0.21 9 0.98 0.20 9 0.85 0.20 8 0.83 0.20 8 0.91 0.19 8 0.93 0.21 8 1.14 0.22 7 1.02 0.25 7 1.01 0.24 6ITALY ITA 0.95 0.20 9 0.81 0.21 9 0.85 0.20 9 0.89 0.20 8 1.05 0.20 8 1.02 0.19 8 0.94 0.21 8 0.92 0.22 7 0.84 0.25 7 0.64 0.24 6JAMAICA JAM 0.36 0.20 7 0.31 0.19 8 0.27 0.19 9 0.25 0.18 9 0.20 0.18 9 0.19 0.18 8 0.22 0.21 8 0.20 0.24 6 0.20 0.30 5 0.61 0.41 4JAPAN JPN 1.23 0.20 9 1.05 0.21 9 1.19 0.20 9 1.17 0.20 8 1.11 0.20 8 0.99 0.19 8 0.57 0.21 8 0.83 0.22 7 0.65 0.25 7 0.50 0.24 6JORDAN JOR 0.34 0.16 12 0.35 0.17 12 0.39 0.17 12 0.25 0.17 11 0.36 0.17 11 0.22 0.17 10 0.09 0.20 9 0.32 0.23 7 0.47 0.25 7 0.29 0.29 6KAZAKHSTAN KAZ -0.37 0.17 12 -0.45 0.17 12 -0.49 0.17 13 -0.46 0.17 12 -0.59 0.17 11 -0.68 0.17 10 -0.82 0.20 10 -0.66 0.21 9 -0.41 0.25 7 -0.43 0.38 4KENYA KEN -0.07 0.15 12 -0.27 0.16 13 -0.31 0.16 13 -0.30 0.16 12 -0.30 0.16 12 -0.18 0.17 11 -0.30 0.20 10 -0.32 0.23 7 -0.37 0.24 7 -0.36 0.33 5KIRIBATI KIR -1.22 0.24 4 -1.10 0.28 3 -1.01 0.28 3 -0.99 0.27 3 -0.53 0.27 3 -0.86 0.42 2 -1.04 0.54 2 -1.01 0.51 2 -1.03 0.60 1 -0.27 0.81 1KOREA, NORTH PRK -2.28 0.26 4 -2.26 0.25 4 -2.29 0.22 6 -2.24 0.20 6 -2.26 0.20 6 -2.02 0.22 4 -1.93 0.26 4 -2.15 0.36 3 -2.18 0.38 3 -2.23 0.53 2KOREA, SOUTH KOR 0.73 0.17 11 0.88 0.18 11 0.70 0.18 11 0.79 0.17 10 0.79 0.18 10 0.67 0.17 10 0.77 0.19 10 0.58 0.20 8 0.33 0.23 8 0.46 0.24 6KUWAIT KWT 0.04 0.20 9 0.29 0.20 9 0.43 0.21 8 0.53 0.21 7 0.60 0.22 6 0.38 0.21 6 0.41 0.23 7 -0.05 0.28 5 -0.02 0.30 5 -0.04 0.34 4KYRGYZSTAN KGZ -0.32 0.16 12 -0.40 0.18 12 -0.59 0.18 12 -0.72 0.19 11 -0.33 0.19 10 -0.21 0.19 9 -0.17 0.23 9 -0.22 0.26 7 -0.33 0.28 5 -0.52 0.43 3LAOS LAO -1.25 0.18 9 -1.08 0.20 9 -1.15 0.20 9 -1.20 0.21 8 -1.23 0.21 7 -1.37 0.21 6 -1.31 0.26 6 -1.48 0.31 4 -1.03 0.35 3 -1.62 0.57 2LATVIA LVA 1.07 0.17 11 1.06 0.18 11 1.07 0.17 11 1.01 0.17 11 1.01 0.17 11 1.03 0.17 11 0.92 0.19 11 0.68 0.21 9 0.87 0.25 7 0.86 0.34 5LEBANON LBN -0.20 0.18 10 -0.21 0.19 10 -0.20 0.19 10 -0.19 0.18 9 -0.12 0.18 9 -0.19 0.18 8 -0.33 0.20 9 -0.28 0.26 6 -0.12 0.27 6 0.02 0.33 5LESOTHO LSO -0.63 0.18 8 -0.64 0.18 10 -0.55 0.18 10 -0.57 0.20 8 -0.57 0.21 8 -0.58 0.22 7 -0.37 0.26 6 -0.37 0.27 4 -0.41 0.29 4 -0.62 0.57 2LIBERIA LBR -1.32 0.17 8 -1.24 0.22 4 -1.40 0.21 4 -1.62 0.20 4 -1.86 0.20 5 -1.75 0.22 4 -1.79 0.25 4 -1.86 0.29 4 -2.06 0.30 4 -3.13 0.60 2LIBYA LBY -0.93 0.18 9 -0.98 0.21 8 -1.28 0.21 7 -1.29 0.20 7 -1.23 0.20 7 -1.60 0.19 7 -1.66 0.22 7 -1.82 0.28 5 -2.20 0.30 5 -2.10 0.34 4LIECHTENSTEIN LIE 1.35 0.43 1 1.35 0.39 1 1.33 0.35 1 1.58 0.31 1 1.51 0.33 1 1.63 0.30 1 1.66 0.37 1 1.48 0.43 1 1.51 0.46 1 .. . . ..LITHUANIA LTU 1.14 0.16 13 1.12 0.17 13 1.05 0.18 11 1.11 0.17 11 1.16 0.17 11 1.10 0.17 11 1.08 0.19 11 0.72 0.21 9 0.79 0.25 7 0.74 0.34 5LUXEMBOURG LUX 1.71 0.22 7 1.89 0.22 7 1.84 0.21 7 1.79 0.22 6 1.93 0.23 6 1.94 0.21 6 2.00 0.25 5 1.94 0.25 5 1.51 0.29 5 1.20 0.28 4MACAO MAC 1.00 0.35 2 0.85 0.39 1 1.09 0.35 1 1.09 0.31 1 1.54 0.33 1 1.14 0.30 1 0.68 0.37 1 0.50 0.43 1 0.53 0.46 1 .. . . ..MACEDONIA MKD 0.21 0.17 11 0.08 0.18 11 -0.05 0.18 11 -0.17 0.18 11 -0.07 0.18 11 -0.26 0.18 10 -0.20 0.22 8 -0.13 0.26 5 -0.17 0.29 4 -0.29 0.51 3MADAGASCAR MDG -0.33 0.15 12 -0.22 0.16 13 -0.26 0.16 13 -0.34 0.17 10 -0.34 0.18 9 -0.24 0.19 8 -0.29 0.22 6 -0.56 0.27 5 -0.80 0.29 5 -0.52 0.48 3MALAWI MWI -0.39 0.16 11 -0.44 0.16 11 -0.60 0.16 12 -0.50 0.16 11 -0.53 0.17 11 -0.42 0.18 10 -0.50 0.20 9 -0.20 0.24 6 -0.14 0.26 6 -0.21 0.41 4MALAYSIA MYS 0.27 0.17 11 0.53 0.18 11 0.51 0.17 12 0.52 0.17 11 0.48 0.17 11 0.66 0.17 10 0.47 0.19 10 0.38 0.20 8 0.58 0.23 8 0.68 0.23 7MALDIVES MDV -0.42 0.21 6 -0.04 0.27 4 0.25 0.27 4 0.36 0.26 4 -0.12 0.26 4 0.57 0.25 3 0.76 0.32 3 0.69 0.34 3 0.85 0.38 2 0.27 0.81 1MALI MLI -0.33 0.16 11 -0.30 0.16 12 -0.39 0.16 12 -0.42 0.17 10 -0.46 0.18 10 -0.43 0.19 9 -0.37 0.22 8 -0.17 0.27 5 -0.28 0.29 5 -0.01 0.48 3MALTA MLT 1.17 0.26 5 1.29 0.23 6 1.25 0.22 6 1.15 0.23 5 1.26 0.24 5 1.27 0.23 5 1.06 0.29 3 1.09 0.36 3 1.01 0.38 3 0.80 0.53 2MARSHALL ISLANDS MHL -0.68 0.31 2 -0.91 0.39 2 -0.96 0.45 2 -0.77 0.47 2 -0.83 0.42 2 -0.50 0.42 2 -0.52 0.54 2 -0.70 0.51 2 -0.84 0.60 1 .. . . ..MARTINIQUE MTQ 0.85 0.43 1 0.85 0.39 1 0.84 0.35 1 0.85 0.31 1 0.77 0.33 1 0.90 0.30 1 0.93 0.37 1 0.99 0.43 1 1.02 0.46 1 .. . . ..MAURITANIA MRT -0.59 0.16 10 -0.36 0.18 10 -0.29 0.18 9 -0.17 0.21 6 -0.05 0.21 6 -0.08 0.23 5 0.25 0.27 4 -0.41 0.27 4 -0.55 0.29 4 -0.86 0.57 2MAURITIUS MUS 0.95 0.16 11 0.57 0.17 10 0.54 0.17 10 0.38 0.18 8 0.37 0.18 8 0.68 0.21 6 0.60 0.23 6 0.60 0.25 5 0.33 0.31 4 0.12 0.56 2MEXICO MEX 0.45 0.16 12 0.39 0.17 12 0.38 0.17 12 0.32 0.17 11 0.44 0.17 11 0.37 0.17 10 0.47 0.19 10 0.37 0.20 8 0.37 0.23 8 0.64 0.23 7MICRONESIA FSM -0.63 0.24 4 -0.39 0.28 3 0.13 0.28 3 0.16 0.27 3 0.00 0.27 3 -0.47 0.42 2 -0.62 0.54 2 -0.90 0.51 2 -0.84 0.60 1 .. . . ..MOLDOVA MDA -0.20 0.16 12 -0.30 0.17 12 -0.39 0.17 12 -0.48 0.17 12 -0.57 0.17 11 -0.61 0.17 10 -0.47 0.20 9 -0.43 0.23 8 -0.23 0.25 7 0.14 0.34 5MONGOLIA MNG -0.29 0.16 12 -0.34 0.18 11 -0.29 0.18 11 -0.37 0.19 9 -0.47 0.20 8 -0.37 0.20 7 -0.10 0.24 6 -0.11 0.30 5 -0.11 0.34 4 -0.76 0.48 3MONTENEGRO MNP -0.05 0.19 9 -0.26 0.24 6 -0.52 0.24 6 .. .. .. . . .. .. .. .. . . .. . . . . .. .. .. .. .. .. . . . . ..MOROCCO MAR -0.03 0.15 12 -0.11 0.16 12 -0.15 0.16 12 -0.33 0.16 11 -0.22 0.16 11 -0.18 0.17 10 -0.11 0.19 10 0.00 0.23 7 0.01 0.24 7 0.15 0.33 5MOZAMBIQUE MOZ -0.47 0.15 12 -0.44 0.16 13 -0.49 0.16 13 -0.55 0.16 12 -0.45 0.16 12 -0.39 0.17 11 -0.25 0.20 9 -0.19 0.24 6 -0.32 0.26 6 -1.00 0.41 4MYANMAR MMR -2.24 0.21 7 -2.23 0.22 7 -2.25 0.20 8 -2.24 0.19 8 -2.32 0.19 8 -2.02 0.19 7 -2.07 0.22 7 -1.90 0.28 5 -1.54 0.30 5 -1.09 0.34 4NAMIBIA NAM 0.13 0.16 10 0.01 0.16 11 0.08 0.16 11 0.05 0.16 12 0.10 0.16 12 0.30 0.17 11 0.41 0.19 11 0.25 0.24 6 0.18 0.26 6 0.06 0.41 4NAURU NRU -0.91 0.46 1 -0.72 0.61 1 .. . . .. .. .. .. . . .. .. .. .. . . .. . . . . .. .. .. .. .. .. . . . . ..NEPAL NPL -0.66 0.18 9 -0.65 0.20 9 -0.62 0.20 9 -0.61 0.19 9 -0.55 0.19 8 -0.52 0.21 6 -0.55 0.26 6 -0.55 0.31 4 -0.42 0.35 3 -0.72 0.57 2NETHERLANDS NLD 1.75 0.21 8 1.81 0.21 8 1.72 0.21 8 1.70 0.20 8 1.80 0.20 8 1.76 0.19 8 1.88 0.21 8 2.01 0.22 7 1.83 0.25 7 1.30 0.24 6NETHERLANDS ANTILLES ANT 0.85 0.43 1 0.85 0.39 1 0.84 0.35 1 0.85 0.31 1 0.61 0.33 1 .. .. . . .. . . . . .. .. .. .. .. .. . . . . ..NEW CALEDONIA NCL -0.06 0.71 1 0.29 0.70 1 0.03 0.70 1 .. .. .. . . .. .. .. .. . . .. . . . . .. .. .. .. .. .. 0.37 0.70 1NEW ZEALAND NZL 1.72 0.20 9 1.74 0.21 9 1.73 0.20 9 1.68 0.20 8 1.80 0.20 8 1.71 0.19 8 1.62 0.22 7 1.56 0.22 7 1.88 0.25 7 1.58 0.24 6NICARAGUA NIC -0.36 0.18 10 -0.40 0.19 10 -0.45 0.18 10 -0.38 0.18 9 -0.30 0.18 9 -0.36 0.18 8 -0.41 0.21 8 -0.13 0.24 6 0.01 0.30 5 -0.17 0.33 5
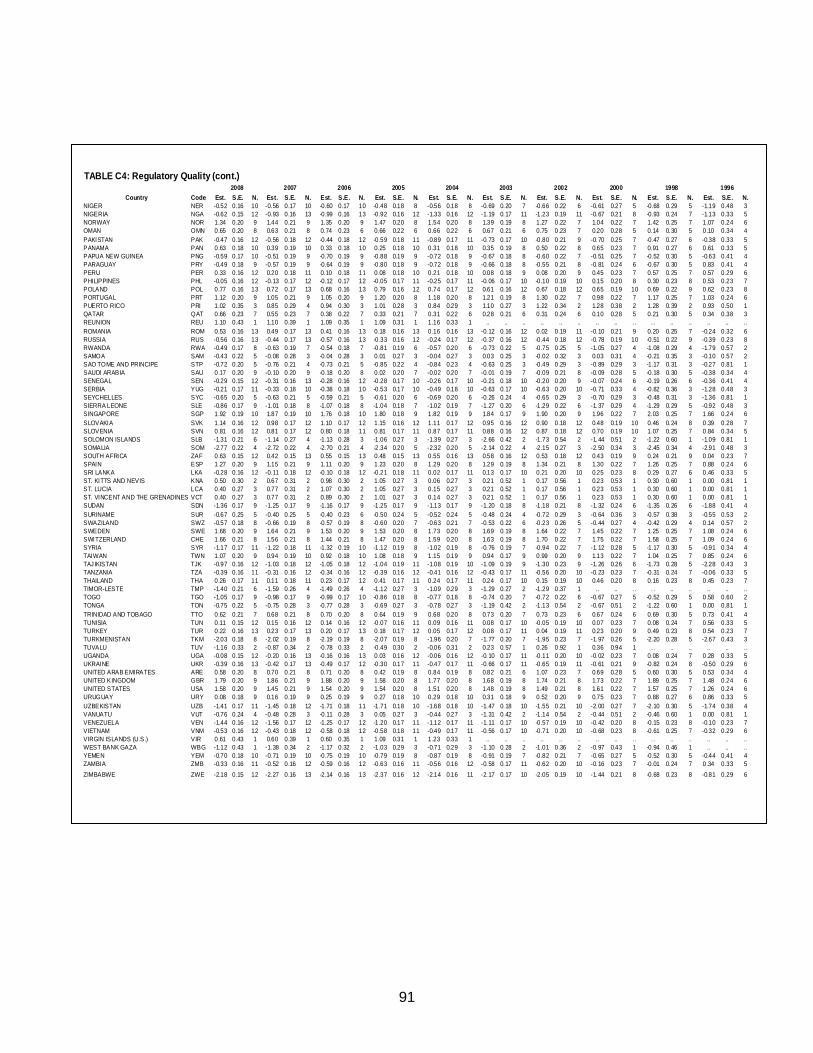
91
TABLE C4: Regulatory Quality (cont.)
2008 2007 2006 2005 2004 2003 2002 2000 1998 1996Country Code Est. S.E. N. Est. S.E. N. Est. S.E. N. Est. S.E. N. Est. S.E. N. Est. S.E. N. Est. S.E. N. Est. S.E. N. Est. S.E. N. Est. S.E. N.
NIGER NER -0.52 0.16 10 -0.56 0.17 10 -0.60 0.17 10 -0.48 0.18 8 -0.56 0.18 8 -0.69 0.20 7 -0.66 0.22 6 -0.61 0.27 5 -0.68 0.29 5 -1.19 0.48 3NIGERIA NGA -0.62 0.15 12 -0.93 0.16 13 -0.99 0.16 13 -0.92 0.16 12 -1.33 0.16 12 -1.19 0.17 11 -1.23 0.19 11 -0.67 0.21 8 -0.93 0.24 7 -1.13 0.33 5NORWAY NOR 1.34 0.20 9 1.44 0.21 9 1.35 0.20 9 1.47 0.20 8 1.54 0.20 8 1.39 0.19 8 1.27 0.22 7 1.04 0.22 7 1.42 0.25 7 1.07 0.24 6OMAN OMN 0.65 0.20 8 0.63 0.21 8 0.74 0.23 6 0.66 0.22 6 0.66 0.22 6 0.67 0.21 6 0.75 0.23 7 0.20 0.28 5 0.14 0.30 5 0.10 0.34 4PAKISTAN PAK -0.47 0.16 12 -0.56 0.18 12 -0.44 0.18 12 -0.59 0.18 11 -0.89 0.17 11 -0.73 0.17 10 -0.80 0.21 9 -0.70 0.25 7 -0.47 0.27 6 -0.38 0.33 5PANAMA PAN 0.63 0.18 10 0.39 0.19 10 0.33 0.18 10 0.25 0.18 10 0.31 0.18 10 0.35 0.19 8 0.50 0.22 8 0.65 0.23 7 0.91 0.27 6 0.61 0.33 5PAPUA NEW GUINEA PNG -0.59 0.17 10 -0.51 0.19 9 -0.70 0.19 9 -0.88 0.19 9 -0.72 0.18 9 -0.67 0.18 8 -0.60 0.22 7 -0.51 0.25 7 -0.52 0.30 5 -0.63 0.41 4PARAGUAY PRY -0.49 0.18 9 -0.57 0.19 9 -0.64 0.19 9 -0.80 0.18 9 -0.72 0.18 9 -0.66 0.18 8 -0.55 0.21 8 -0.81 0.24 6 -0.67 0.30 5 0.83 0.41 4PERU PER 0.33 0.16 12 0.20 0.18 11 0.10 0.18 11 0.08 0.18 10 0.21 0.18 10 0.08 0.18 9 0.08 0.20 9 0.45 0.23 7 0.57 0.25 7 0.57 0.29 6PHILIPPINES PHL -0.05 0.16 12 -0.13 0.17 12 -0.12 0.17 12 -0.05 0.17 11 -0.25 0.17 11 -0.06 0.17 10 -0.10 0.19 10 0.15 0.20 8 0.30 0.23 8 0.53 0.23 7POLAND POL 0.77 0.16 13 0.72 0.17 13 0.68 0.16 13 0.79 0.16 12 0.74 0.17 12 0.61 0.16 12 0.67 0.18 12 0.65 0.19 10 0.69 0.22 9 0.62 0.23 8PORTUGAL PRT 1.12 0.20 9 1.05 0.21 9 1.05 0.20 9 1.20 0.20 8 1.18 0.20 8 1.21 0.19 8 1.30 0.22 7 0.98 0.22 7 1.17 0.25 7 1.03 0.24 6PUERTO RICO PRI 1.02 0.35 3 0.85 0.29 4 0.94 0.30 3 1.01 0.28 3 0.84 0.29 3 1.10 0.27 3 1.22 0.34 2 1.28 0.38 2 1.28 0.39 2 0.93 0.50 1QATAR QAT 0.66 0.23 7 0.55 0.23 7 0.38 0.22 7 0.33 0.21 7 0.31 0.22 6 0.28 0.21 6 0.31 0.24 6 0.10 0.28 5 0.21 0.30 5 0.34 0.38 3REUNION REU 1.10 0.43 1 1.10 0.39 1 1.09 0.35 1 1.09 0.31 1 1.16 0.33 1 .. .. .. .. .. .. .. .. . . . . .. .. .. .. ..ROMANIA ROM 0.53 0.16 13 0.49 0.17 13 0.41 0.16 13 0.18 0.16 13 0.16 0.16 13 -0.12 0.16 12 0.02 0.19 11 -0.10 0.21 9 0.20 0.25 7 -0.24 0.32 6RUSSIA RUS -0.56 0.16 13 -0.44 0.17 13 -0.57 0.16 13 -0.33 0.16 12 -0.24 0.17 12 -0.37 0.16 12 -0.44 0.18 12 -0.78 0.19 10 -0.51 0.22 9 -0.39 0.23 8RWANDA RWA -0.49 0.17 8 -0.63 0.19 7 -0.54 0.18 7 -0.81 0.19 6 -0.57 0.20 6 -0.73 0.22 5 -0.75 0.25 5 -1.05 0.27 4 -1.08 0.29 4 -1.79 0.57 2SAMOA SAM -0.43 0.22 5 -0.08 0.28 3 -0.04 0.28 3 0.01 0.27 3 -0.04 0.27 3 0.03 0.25 3 -0.02 0.32 3 0.03 0.31 4 -0.21 0.35 3 -0.10 0.57 2SAO TOME AND PRINCIPE STP -0.72 0.20 5 -0.76 0.21 4 -0.73 0.21 5 -0.85 0.22 4 -0.84 0.23 4 -0.63 0.25 3 -0.49 0.29 3 -0.89 0.29 3 -1.17 0.31 3 -0.27 0.81 1SAUDI ARABIA SAU 0.17 0.20 9 -0.10 0.20 9 -0.18 0.20 8 0.02 0.20 7 -0.02 0.20 7 -0.01 0.19 7 -0.09 0.21 8 -0.09 0.28 5 -0.18 0.30 5 -0.38 0.34 4SENEGAL SEN -0.29 0.15 12 -0.31 0.16 13 -0.28 0.16 12 -0.28 0.17 10 -0.26 0.17 10 -0.21 0.18 10 -0.20 0.20 9 -0.07 0.24 6 -0.19 0.26 6 -0.36 0.41 4SERBIA YUG -0.21 0.17 11 -0.33 0.18 10 -0.38 0.18 10 -0.53 0.17 10 -0.49 0.18 10 -0.63 0.17 10 -0.63 0.20 10 -0.71 0.33 4 -0.82 0.36 3 -1.28 0.48 3SEYCHELLES SYC -0.65 0.20 5 -0.63 0.21 5 -0.59 0.21 5 -0.61 0.20 6 -0.69 0.20 6 -0.26 0.24 4 -0.65 0.29 3 -0.70 0.29 3 -0.48 0.31 3 -1.36 0.81 1SIERRA LEONE SLE -0.86 0.17 9 -1.01 0.18 8 -1.07 0.18 8 -1.04 0.18 7 -1.02 0.19 7 -1.27 0.20 6 -1.29 0.22 6 -1.37 0.29 4 -1.29 0.29 5 -0.92 0.48 3SINGAPORE SGP 1.92 0.19 10 1.87 0.19 10 1.76 0.18 10 1.80 0.18 9 1.82 0.19 9 1.84 0.17 9 1.90 0.20 9 1.96 0.22 7 2.03 0.25 7 1.66 0.24 6SLOVAKIA SVK 1.14 0.16 12 0.98 0.17 12 1.10 0.17 12 1.15 0.16 12 1.11 0.17 12 0.95 0.16 12 0.90 0.18 12 0.48 0.19 10 0.46 0.24 8 0.39 0.28 7SLOVENIA SVN 0.81 0.16 12 0.81 0.17 12 0.80 0.18 11 0.81 0.17 11 0.87 0.17 11 0.88 0.16 12 0.87 0.18 12 0.70 0.19 10 1.07 0.25 7 0.84 0.34 5SOLOMON ISLANDS SLB -1.31 0.21 6 -1.14 0.27 4 -1.13 0.28 3 -1.06 0.27 3 -1.39 0.27 3 -2.66 0.42 2 -1.73 0.54 2 -1.44 0.51 2 -1.22 0.60 1 -1.09 0.81 1SOMALIA SOM -2.77 0.22 4 -2.72 0.22 4 -2.70 0.21 4 -2.34 0.20 5 -2.32 0.20 5 -2.14 0.22 4 -2.15 0.27 3 -2.50 0.34 3 -2.45 0.34 4 -2.91 0.48 3SOUTH AFRICA ZAF 0.63 0.15 12 0.42 0.15 13 0.55 0.15 13 0.48 0.15 13 0.55 0.16 13 0.58 0.16 12 0.53 0.18 12 0.43 0.19 9 0.24 0.21 9 0.04 0.23 7SPAIN ESP 1.27 0.20 9 1.15 0.21 9 1.11 0.20 9 1.23 0.20 8 1.29 0.20 8 1.29 0.19 8 1.34 0.21 8 1.30 0.22 7 1.26 0.25 7 0.88 0.24 6SRI LANKA LKA -0.28 0.16 12 -0.11 0.18 12 -0.10 0.18 12 -0.21 0.18 11 0.02 0.17 11 0.13 0.17 10 0.21 0.20 10 0.25 0.23 8 0.29 0.27 6 0.46 0.33 5ST. KITTS AND NEVIS KNA 0.50 0.30 2 0.67 0.31 2 0.98 0.30 2 1.05 0.27 3 0.06 0.27 3 0.21 0.52 1 0.17 0.56 1 0.23 0.53 1 0.30 0.60 1 0.00 0.81 1ST. LUCIA LCA 0.40 0.27 3 0.77 0.31 2 1.07 0.30 2 1.05 0.27 3 0.15 0.27 3 0.21 0.52 1 0.17 0.56 1 0.23 0.53 1 0.30 0.60 1 0.00 0.81 1ST. VINCENT AND THE GRENADINES VCT 0.40 0.27 3 0.77 0.31 2 0.89 0.30 2 1.01 0.27 3 0.14 0.27 3 0.21 0.52 1 0.17 0.56 1 0.23 0.53 1 0.30 0.60 1 0.00 0.81 1SUDAN SDN -1.36 0.17 9 -1.25 0.17 9 -1.16 0.17 9 -1.25 0.17 9 -1.13 0.17 9 -1.20 0.18 8 -1.18 0.21 8 -1.32 0.24 6 -1.35 0.26 6 -1.88 0.41 4SURINAME SUR -0.67 0.25 5 -0.40 0.25 5 -0.40 0.23 6 -0.50 0.24 5 -0.52 0.24 5 -0.48 0.24 4 -0.72 0.29 3 -0.64 0.36 3 -0.57 0.38 3 -0.55 0.53 2SWAZILAND SWZ -0.57 0.18 8 -0.66 0.19 8 -0.57 0.19 8 -0.60 0.20 7 -0.63 0.21 7 -0.53 0.22 6 -0.23 0.26 5 -0.44 0.27 4 -0.42 0.29 4 0.14 0.57 2SWEDEN SWE 1.68 0.20 9 1.64 0.21 9 1.53 0.20 9 1.53 0.20 8 1.73 0.20 8 1.69 0.19 8 1.64 0.22 7 1.45 0.22 7 1.25 0.25 7 1.08 0.24 6SWITZERLAND CHE 1.66 0.21 8 1.56 0.21 8 1.44 0.21 8 1.47 0.20 8 1.59 0.20 8 1.63 0.19 8 1.70 0.22 7 1.75 0.22 7 1.58 0.25 7 1.09 0.24 6SYRIA SYR -1.17 0.17 11 -1.22 0.18 11 -1.32 0.19 10 -1.12 0.19 8 -1.02 0.19 8 -0.76 0.19 7 -0.94 0.22 7 -1.12 0.28 5 -1.17 0.30 5 -0.91 0.34 4TAIWAN TWN 1.07 0.20 9 0.94 0.19 10 0.92 0.18 10 1.08 0.18 9 1.15 0.19 9 0.94 0.17 9 0.99 0.20 9 1.13 0.22 7 1.04 0.25 7 0.85 0.24 6TAJIKISTAN TJK -0.97 0.16 12 -1.03 0.18 12 -1.05 0.18 12 -1.04 0.19 11 -1.08 0.19 10 -1.09 0.19 9 -1.30 0.23 9 -1.26 0.26 6 -1.73 0.28 5 -2.28 0.43 3TANZANIA TZA -0.39 0.16 11 -0.31 0.16 12 -0.34 0.16 12 -0.39 0.16 12 -0.41 0.16 12 -0.43 0.17 11 -0.56 0.20 10 -0.23 0.23 7 -0.31 0.24 7 -0.06 0.33 5THAILAND THA 0.26 0.17 11 0.11 0.18 11 0.23 0.17 12 0.41 0.17 11 0.24 0.17 11 0.24 0.17 10 0.15 0.19 10 0.46 0.20 8 0.16 0.23 8 0.45 0.23 7TIMOR-LESTE TMP -1.40 0.21 6 -1.59 0.26 4 -1.49 0.26 4 -1.12 0.27 3 -1.09 0.29 3 -1.29 0.27 2 -1.29 0.37 1 .. .. . . . . .. .. .. .. ..TOGO TGO -1.05 0.17 9 -0.98 0.17 9 -0.99 0.17 10 -0.86 0.18 8 -0.77 0.18 8 -0.74 0.20 7 -0.72 0.22 6 -0.67 0.27 5 -0.52 0.29 5 0.58 0.60 2TONGA TON -0.75 0.22 5 -0.75 0.28 3 -0.77 0.28 3 -0.69 0.27 3 -0.78 0.27 3 -1.19 0.42 2 -1.13 0.54 2 -0.67 0.51 2 -1.22 0.60 1 0.00 0.81 1TRINIDAD AND TOBAGO TTO 0.62 0.21 7 0.68 0.21 8 0.70 0.20 8 0.64 0.19 9 0.68 0.20 8 0.73 0.20 7 0.73 0.23 6 0.67 0.24 6 0.69 0.30 5 0.73 0.41 4TUNISIA TUN 0.11 0.15 12 0.15 0.16 12 0.14 0.16 12 -0.07 0.16 11 0.09 0.16 11 0.08 0.17 10 -0.05 0.19 10 0.07 0.23 7 0.08 0.24 7 0.56 0.33 5TURKEY TUR 0.22 0.16 13 0.23 0.17 13 0.20 0.17 13 0.18 0.17 12 0.05 0.17 12 0.08 0.17 11 0.04 0.19 11 0.23 0.20 9 0.49 0.23 8 0.54 0.23 7TURKMENISTAN TKM -2.03 0.18 8 -2.02 0.19 8 -2.19 0.19 8 -2.07 0.19 8 -1.96 0.20 7 -1.77 0.20 7 -1.95 0.23 7 -1.97 0.26 5 -2.20 0.28 5 -2.67 0.43 3TUVALU TUV -1.16 0.33 2 -0.87 0.34 2 -0.78 0.33 2 -0.49 0.30 2 -0.06 0.31 2 0.23 0.57 1 0.26 0.92 1 0.36 0.94 1 .. .. .. .. .. ..UGANDA UGA -0.08 0.15 12 -0.20 0.16 13 -0.16 0.16 13 0.03 0.16 12 -0.06 0.16 12 -0.10 0.17 11 -0.11 0.20 10 -0.02 0.23 7 0.08 0.24 7 0.28 0.33 5UKRAINE UKR -0.39 0.16 13 -0.42 0.17 13 -0.49 0.17 12 -0.30 0.17 11 -0.47 0.17 11 -0.66 0.17 11 -0.65 0.19 11 -0.61 0.21 9 -0.82 0.24 8 -0.50 0.29 6UNITED ARAB EMIRATES ARE 0.58 0.20 8 0.70 0.21 8 0.71 0.20 8 0.42 0.19 8 0.84 0.19 8 0.82 0.21 6 1.07 0.23 7 0.69 0.28 5 0.60 0.30 5 0.53 0.34 4UNITED KINGDOM GBR 1.79 0.20 9 1.86 0.21 9 1.88 0.20 9 1.58 0.20 8 1.77 0.20 8 1.68 0.19 8 1.74 0.21 8 1.73 0.22 7 1.89 0.25 7 1.48 0.24 6UNITED STATES USA 1.58 0.20 9 1.45 0.21 9 1.54 0.20 9 1.54 0.20 8 1.51 0.20 8 1.48 0.19 8 1.49 0.21 8 1.61 0.22 7 1.57 0.25 7 1.26 0.24 6URUGUAY URY 0.08 0.18 9 0.16 0.19 9 0.25 0.19 9 0.27 0.18 10 0.29 0.18 10 0.31 0.18 9 0.52 0.20 9 0.75 0.23 7 0.88 0.27 6 0.86 0.33 5UZBEKISTAN UZB -1.41 0.17 11 -1.45 0.18 12 -1.71 0.18 11 -1.71 0.18 10 -1.68 0.18 10 -1.47 0.18 10 -1.55 0.21 10 -2.00 0.27 7 -2.10 0.30 5 -1.74 0.38 4VANUATU VUT -0.76 0.24 4 -0.48 0.28 3 -0.11 0.28 3 0.05 0.27 3 -0.44 0.27 3 -1.31 0.42 2 -1.14 0.54 2 -0.44 0.51 2 -0.46 0.60 1 0.00 0.81 1VENEZUELA VEN -1.44 0.16 12 -1.56 0.17 12 -1.25 0.17 12 -1.20 0.17 11 -1.12 0.17 11 -1.11 0.17 10 -0.57 0.19 10 -0.42 0.20 8 -0.15 0.23 8 -0.10 0.23 7VIETNAM VNM -0.53 0.16 12 -0.43 0.18 12 -0.58 0.18 12 -0.58 0.18 11 -0.49 0.17 11 -0.56 0.17 10 -0.71 0.20 10 -0.68 0.23 8 -0.61 0.25 7 -0.32 0.29 6VIRGIN ISLANDS (U.S.) VIR 0.61 0.43 1 0.60 0.39 1 0.60 0.35 1 1.09 0.31 1 1.23 0.33 1 .. .. .. .. .. .. .. .. . . . . .. .. .. .. ..WEST BANK GAZA WBG -1.12 0.43 1 -1.38 0.34 2 -1.17 0.32 2 -1.03 0.29 3 -0.71 0.29 3 -1.10 0.28 2 -1.01 0.36 2 -0.97 0.43 1 -0.94 0.46 1 .. .. ..YEMEN YEM -0.70 0.18 10 -0.71 0.19 10 -0.75 0.19 10 -0.79 0.19 8 -0.87 0.19 8 -0.91 0.19 7 -0.82 0.21 7 -0.65 0.27 5 -0.52 0.30 5 -0.44 0.41 4ZAMBIA ZMB -0.33 0.16 11 -0.52 0.16 12 -0.59 0.16 12 -0.63 0.16 11 -0.56 0.16 12 -0.58 0.17 11 -0.62 0.20 10 -0.16 0.23 7 -0.01 0.24 7 0.34 0.33 5ZIMBABWE ZWE -2.18 0.15 12 -2.27 0.16 13 -2.14 0.16 13 -2.37 0.16 12 -2.14 0.16 11 -2.17 0.17 10 -2.05 0.19 10 -1.44 0.21 8 -0.68 0.23 8 -0.81 0.29 6
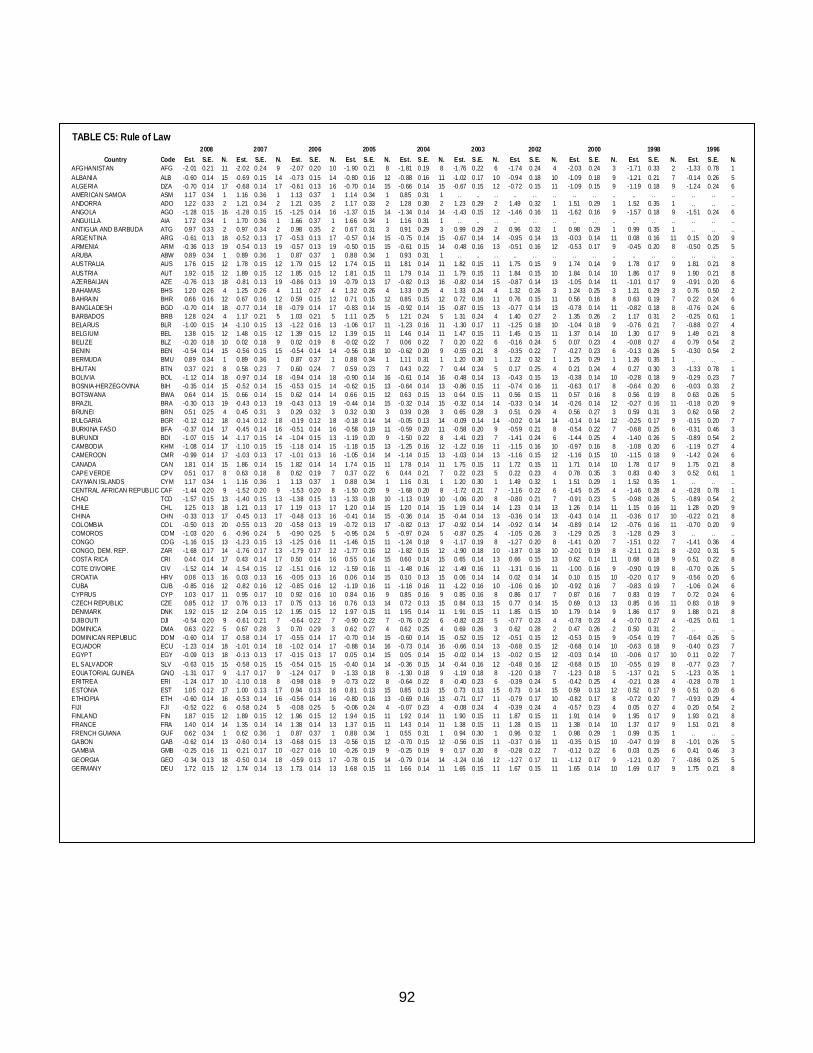
92
TABLE C5: Rule of Law2008 2007 2006 2005 2004 2003 2002 2000 1998 1996
Country Code Est. S.E. N. Est. S.E. N. Est. S.E. N. Est. S.E. N. Est. S.E. N. Est. S.E. N. Est. S.E. N. Est. S.E. N. Est. S.E. N. Est. S.E. N.AFGHANISTAN AFG -2.01 0.21 11 -2.02 0.24 9 -2.07 0.20 10 -1.90 0.21 8 -1.81 0.19 8 -1.76 0.22 6 -1.74 0.24 4 -2.03 0.24 3 -1.71 0.33 2 -1.33 0.78 1ALBANIA ALB -0.60 0.14 15 -0.69 0.15 14 -0.73 0.15 14 -0.80 0.16 12 -0.88 0.16 11 -1.02 0.17 10 -0.94 0.18 10 -1.09 0.18 9 -1.21 0.21 7 -0.14 0.26 5ALGERIA DZA -0.70 0.14 17 -0.68 0.14 17 -0.61 0.13 16 -0.70 0.14 15 -0.66 0.14 15 -0.67 0.15 12 -0.72 0.15 11 -1.09 0.15 9 -1.19 0.18 9 -1.24 0.24 6AMERICAN SAMOA ASM 1.17 0.34 1 1.16 0.36 1 1.13 0.37 1 1.14 0.34 1 0.85 0.31 1 .. .. . . .. . . .. .. . . .. .. . . .. .. .. ..ANDORRA ADO 1.22 0.33 2 1.21 0.34 2 1.21 0.35 2 1.17 0.33 2 1.28 0.30 2 1.23 0.29 2 1.49 0.32 1 1.51 0.29 1 1.52 0.35 1 .. .. ..ANGOLA AGO -1.28 0.15 16 -1.28 0.15 15 -1.25 0.14 16 -1.37 0.15 14 -1.34 0.14 14 -1.43 0.15 12 -1.46 0.16 11 -1.62 0.16 9 -1.57 0.18 9 -1.51 0.24 6ANGUILLA AIA 1.72 0.34 1 1.70 0.36 1 1.66 0.37 1 1.66 0.34 1 1.16 0.31 1 .. .. . . .. . . .. .. . . .. .. . . .. .. .. ..ANTIGUA AND BARBUDA ATG 0.97 0.33 2 0.97 0.34 2 0.98 0.35 2 0.67 0.31 3 0.91 0.29 3 0.99 0.29 2 0.96 0.32 1 0.98 0.29 1 0.99 0.35 1 .. .. ..ARGENTINA ARG -0.61 0.13 18 -0.52 0.13 17 -0.53 0.13 17 -0.57 0.14 15 -0.75 0.14 15 -0.67 0.14 14 -0.95 0.14 13 -0.03 0.14 11 0.08 0.16 11 0.15 0.20 9ARMENIA ARM -0.36 0.13 19 -0.54 0.13 19 -0.57 0.13 19 -0.50 0.15 15 -0.61 0.15 14 -0.48 0.16 13 -0.51 0.16 12 -0.53 0.17 9 -0.45 0.20 8 -0.50 0.25 5ARUBA ABW 0.89 0.34 1 0.89 0.36 1 0.87 0.37 1 0.88 0.34 1 0.93 0.31 1 .. .. . . .. . . .. .. . . .. .. . . .. .. .. ..AUSTRALIA AUS 1.76 0.15 12 1.78 0.15 12 1.79 0.15 12 1.74 0.15 11 1.81 0.14 11 1.82 0.15 11 1.75 0.15 9 1.74 0.14 9 1.78 0.17 9 1.81 0.21 8AUSTRIA AUT 1.92 0.15 12 1.89 0.15 12 1.85 0.15 12 1.81 0.15 11 1.79 0.14 11 1.79 0.15 11 1.84 0.15 10 1.84 0.14 10 1.86 0.17 9 1.90 0.21 8AZERBAIJAN AZE -0.76 0.13 18 -0.81 0.13 19 -0.86 0.13 19 -0.79 0.13 17 -0.82 0.13 16 -0.82 0.14 15 -0.87 0.14 13 -1.05 0.14 11 -1.01 0.17 9 -0.91 0.20 6BAHAMAS BHS 1.20 0.26 4 1.25 0.26 4 1.11 0.27 4 1.32 0.26 4 1.33 0.25 4 1.33 0.24 4 1.32 0.26 3 1.24 0.25 3 1.21 0.29 3 0.76 0.50 2BAHRAIN BHR 0.66 0.16 12 0.67 0.16 12 0.59 0.15 12 0.71 0.15 12 0.85 0.15 12 0.72 0.16 11 0.76 0.15 11 0.56 0.16 8 0.63 0.19 7 0.22 0.24 6BANGLADESH BGD -0.70 0.14 18 -0.77 0.14 18 -0.79 0.14 17 -0.83 0.14 15 -0.92 0.14 15 -0.87 0.15 13 -0.77 0.14 13 -0.78 0.14 11 -0.82 0.18 8 -0.76 0.24 6BARBADOS BRB 1.28 0.24 4 1.17 0.21 5 1.03 0.21 5 1.11 0.25 5 1.21 0.24 5 1.31 0.24 4 1.40 0.27 2 1.35 0.26 2 1.17 0.31 2 -0.25 0.61 1BELARUS BLR -1.00 0.15 14 -1.10 0.15 13 -1.22 0.16 13 -1.06 0.17 11 -1.23 0.16 11 -1.30 0.17 11 -1.25 0.18 10 -1.04 0.18 9 -0.76 0.21 7 -0.88 0.27 4BELGIUM BEL 1.38 0.15 12 1.48 0.15 12 1.39 0.15 12 1.39 0.15 11 1.46 0.14 11 1.47 0.15 11 1.45 0.15 11 1.37 0.14 10 1.30 0.17 9 1.49 0.21 8BELIZE BLZ -0.20 0.18 10 0.02 0.18 9 0.02 0.19 8 -0.02 0.22 7 0.06 0.22 7 0.20 0.22 6 -0.16 0.24 5 0.07 0.23 4 -0.08 0.27 4 0.79 0.54 2BENIN BEN -0.54 0.14 15 -0.56 0.15 15 -0.54 0.14 14 -0.56 0.18 10 -0.62 0.20 9 -0.55 0.21 8 -0.35 0.22 7 -0.27 0.23 6 -0.13 0.26 5 -0.30 0.54 2BERMUDA BMU 0.89 0.34 1 0.89 0.36 1 0.87 0.37 1 0.88 0.34 1 1.11 0.31 1 1.20 0.30 1 1.22 0.32 1 1.25 0.29 1 1.26 0.35 1 .. .. ..BHUTAN BTN 0.37 0.21 8 0.58 0.23 7 0.60 0.24 7 0.59 0.23 7 0.43 0.22 7 0.44 0.24 5 0.17 0.25 4 0.21 0.24 4 0.27 0.30 3 -1.33 0.78 1BOLIVIA BOL -1.12 0.14 18 -0.97 0.14 18 -0.94 0.14 18 -0.90 0.14 16 -0.61 0.14 16 -0.48 0.14 13 -0.43 0.15 13 -0.38 0.14 10 -0.28 0.18 9 -0.29 0.23 7BOSNIA-HERZEGOVINA BIH -0.35 0.14 15 -0.52 0.14 15 -0.53 0.15 14 -0.62 0.15 13 -0.64 0.14 13 -0.86 0.15 11 -0.74 0.16 11 -0.63 0.17 8 -0.64 0.20 6 -0.03 0.33 2BOTSWANA BWA 0.64 0.14 15 0.66 0.14 15 0.62 0.14 14 0.66 0.15 12 0.63 0.15 13 0.64 0.15 11 0.56 0.15 11 0.57 0.16 8 0.56 0.19 8 0.63 0.26 5BRAZIL BRA -0.30 0.13 19 -0.43 0.13 19 -0.43 0.13 19 -0.44 0.14 15 -0.32 0.14 15 -0.32 0.14 14 -0.33 0.14 14 -0.26 0.14 12 -0.27 0.16 11 -0.18 0.20 9BRUNEI BRN 0.51 0.25 4 0.45 0.31 3 0.29 0.32 3 0.32 0.30 3 0.39 0.28 3 0.65 0.28 3 0.51 0.29 4 0.56 0.27 3 0.59 0.31 3 0.62 0.58 2BULGARIA BGR -0.12 0.12 18 -0.14 0.12 18 -0.19 0.12 18 -0.18 0.14 14 -0.05 0.13 14 -0.09 0.14 14 -0.02 0.14 14 -0.14 0.14 12 -0.25 0.17 9 -0.15 0.20 7BURKINA FASO BFA -0.37 0.14 17 -0.45 0.14 16 -0.51 0.14 16 -0.58 0.19 11 -0.59 0.20 11 -0.58 0.20 9 -0.59 0.21 8 -0.54 0.22 7 -0.68 0.25 6 -0.31 0.46 3BURUNDI BDI -1.07 0.15 14 -1.17 0.15 14 -1.04 0.15 13 -1.19 0.20 9 -1.50 0.22 8 -1.41 0.23 7 -1.41 0.24 6 -1.44 0.25 4 -1.40 0.26 5 -0.89 0.54 2CAMBODIA KHM -1.08 0.14 17 -1.10 0.15 15 -1.18 0.14 15 -1.18 0.15 13 -1.25 0.16 12 -1.22 0.16 11 -1.15 0.16 10 -0.97 0.16 8 -1.08 0.20 6 -1.19 0.27 4CAMEROON CMR -0.99 0.14 17 -1.03 0.13 17 -1.01 0.13 16 -1.05 0.14 14 -1.14 0.15 13 -1.03 0.14 13 -1.16 0.15 12 -1.16 0.15 10 -1.15 0.18 9 -1.42 0.24 6CANADA CAN 1.81 0.14 15 1.86 0.14 15 1.82 0.14 14 1.74 0.15 11 1.78 0.14 11 1.75 0.15 11 1.72 0.15 11 1.71 0.14 10 1.78 0.17 9 1.75 0.21 8CAPE VERDE CPV 0.51 0.17 8 0.63 0.18 8 0.62 0.19 7 0.37 0.22 6 0.44 0.21 7 0.22 0.23 5 0.22 0.23 4 0.78 0.35 3 0.83 0.40 3 0.52 0.61 1CAYMAN ISLANDS CYM 1.17 0.34 1 1.16 0.36 1 1.13 0.37 1 0.88 0.34 1 1.16 0.31 1 1.20 0.30 1 1.49 0.32 1 1.51 0.29 1 1.52 0.35 1 .. .. ..CENTRAL AFRICAN REPUBLIC CAF -1.44 0.20 9 -1.52 0.20 9 -1.53 0.20 8 -1.50 0.20 9 -1.68 0.20 8 -1.72 0.21 7 -1.16 0.22 6 -1.45 0.25 4 -1.46 0.28 4 -0.28 0.78 1CHAD TCD -1.57 0.15 13 -1.40 0.15 13 -1.38 0.15 13 -1.33 0.18 10 -1.13 0.19 10 -1.06 0.20 8 -0.80 0.21 7 -0.91 0.23 5 -0.98 0.26 5 -0.89 0.54 2CHILE CHL 1.25 0.13 18 1.21 0.13 17 1.19 0.13 17 1.20 0.14 15 1.20 0.14 15 1.19 0.14 14 1.23 0.14 13 1.26 0.14 11 1.15 0.16 11 1.28 0.20 9CHINA CHN -0.33 0.13 17 -0.45 0.13 17 -0.48 0.13 16 -0.41 0.14 15 -0.36 0.14 15 -0.44 0.14 13 -0.36 0.14 13 -0.43 0.14 11 -0.36 0.17 10 -0.22 0.21 8COLOMBIA COL -0.50 0.13 20 -0.55 0.13 20 -0.58 0.13 19 -0.72 0.13 17 -0.82 0.13 17 -0.92 0.14 14 -0.92 0.14 14 -0.89 0.14 12 -0.76 0.16 11 -0.70 0.20 9COMOROS COM -1.03 0.20 6 -0.96 0.24 5 -0.90 0.25 5 -0.95 0.24 5 -0.97 0.24 5 -0.87 0.25 4 -1.05 0.26 3 -1.29 0.25 3 -1.28 0.29 3 .. .. ..CONGO COG -1.16 0.15 13 -1.23 0.15 13 -1.25 0.16 11 -1.46 0.15 11 -1.24 0.18 9 -1.17 0.19 8 -1.27 0.20 8 -1.41 0.20 7 -1.51 0.22 7 -1.41 0.36 4CONGO, DEM. REP. ZAR -1.68 0.17 14 -1.76 0.17 13 -1.79 0.17 12 -1.77 0.16 12 -1.82 0.15 12 -1.90 0.18 10 -1.87 0.18 10 -2.01 0.19 8 -2.11 0.21 8 -2.02 0.31 5COSTA RICA CRI 0.44 0.14 17 0.43 0.14 17 0.50 0.14 16 0.55 0.14 15 0.60 0.14 15 0.65 0.14 13 0.66 0.15 13 0.62 0.14 11 0.68 0.18 9 0.51 0.22 8COTE D'IVOIRE CIV -1.52 0.14 14 -1.54 0.15 12 -1.51 0.16 12 -1.59 0.16 11 -1.48 0.16 12 -1.49 0.16 11 -1.31 0.16 11 -1.00 0.16 9 -0.90 0.19 8 -0.70 0.26 5CROATIA HRV 0.08 0.13 16 0.03 0.13 16 -0.05 0.13 16 0.06 0.14 15 0.10 0.13 15 0.06 0.14 14 0.02 0.14 14 0.10 0.15 10 -0.20 0.17 9 -0.56 0.20 6CUBA CUB -0.85 0.16 12 -0.82 0.16 12 -0.85 0.16 12 -1.19 0.16 11 -1.16 0.16 11 -1.22 0.16 10 -1.06 0.16 10 -0.92 0.16 7 -0.83 0.19 7 -1.06 0.24 6CYPRUS CYP 1.03 0.17 11 0.95 0.17 10 0.92 0.16 10 0.84 0.16 9 0.85 0.16 9 0.85 0.16 8 0.86 0.17 7 0.87 0.16 7 0.83 0.19 7 0.72 0.24 6CZECH REPUBLIC CZE 0.85 0.12 17 0.76 0.13 17 0.75 0.13 16 0.76 0.13 14 0.72 0.13 15 0.84 0.13 15 0.77 0.14 15 0.69 0.13 13 0.85 0.16 11 0.83 0.18 9DENMARK DNK 1.92 0.15 12 2.04 0.15 12 1.95 0.15 12 1.97 0.15 11 1.95 0.14 11 1.91 0.15 11 1.85 0.15 10 1.79 0.14 9 1.86 0.17 9 1.88 0.21 8DJIBOUTI DJI -0.54 0.20 9 -0.61 0.21 7 -0.64 0.22 7 -0.90 0.22 7 -0.76 0.22 6 -0.82 0.23 5 -0.77 0.23 4 -0.78 0.23 4 -0.70 0.27 4 -0.25 0.61 1DOMINICA DMA 0.63 0.22 5 0.67 0.28 3 0.70 0.29 3 0.62 0.27 4 0.62 0.25 4 0.69 0.26 3 0.62 0.28 2 0.47 0.26 2 0.50 0.31 2 .. .. ..DOMINICAN REPUBLIC DOM -0.60 0.14 17 -0.58 0.14 17 -0.55 0.14 17 -0.70 0.14 15 -0.60 0.14 15 -0.52 0.15 12 -0.51 0.15 12 -0.53 0.15 9 -0.54 0.19 7 -0.64 0.26 5ECUADOR ECU -1.23 0.14 18 -1.01 0.14 18 -1.02 0.14 17 -0.88 0.14 16 -0.73 0.14 16 -0.66 0.14 13 -0.68 0.15 12 -0.68 0.14 10 -0.63 0.18 9 -0.40 0.23 7EGYPT EGY -0.09 0.13 18 -0.13 0.13 17 -0.15 0.13 17 0.05 0.14 15 0.05 0.14 15 -0.02 0.14 13 -0.02 0.15 12 -0.03 0.14 10 -0.06 0.17 10 0.11 0.22 7EL SALVADOR SLV -0.63 0.15 15 -0.58 0.15 15 -0.54 0.15 15 -0.40 0.14 14 -0.36 0.15 14 -0.44 0.16 12 -0.48 0.16 12 -0.68 0.15 10 -0.55 0.19 8 -0.77 0.23 7EQUATORIAL GUINEA GNQ -1.31 0.17 9 -1.17 0.17 9 -1.24 0.17 9 -1.33 0.18 8 -1.30 0.18 9 -1.19 0.18 8 -1.20 0.18 7 -1.23 0.18 5 -1.37 0.21 5 -1.23 0.35 1ERITREA ERI -1.24 0.17 10 -1.10 0.18 8 -0.98 0.18 9 -0.73 0.22 8 -0.64 0.22 8 -0.40 0.23 6 -0.39 0.24 5 -0.42 0.25 4 -0.21 0.28 4 -0.28 0.78 1ESTONIA EST 1.05 0.12 17 1.00 0.13 17 0.94 0.13 16 0.81 0.13 15 0.85 0.13 15 0.73 0.13 15 0.73 0.14 15 0.59 0.13 12 0.52 0.17 9 0.51 0.20 6ETHIOPIA ETH -0.60 0.14 16 -0.53 0.14 16 -0.56 0.14 16 -0.80 0.16 13 -0.69 0.16 13 -0.71 0.17 11 -0.79 0.17 10 -0.82 0.17 8 -0.72 0.20 7 -0.93 0.29 4FIJI FJI -0.52 0.22 6 -0.58 0.24 5 -0.08 0.25 5 -0.06 0.24 4 -0.07 0.23 4 -0.08 0.24 4 -0.39 0.24 4 -0.57 0.23 4 0.05 0.27 4 0.20 0.54 2FINLAND FIN 1.87 0.15 12 1.89 0.15 12 1.96 0.15 12 1.94 0.15 11 1.92 0.14 11 1.90 0.15 11 1.87 0.15 11 1.91 0.14 9 1.95 0.17 9 1.93 0.21 8FRANCE FRA 1.40 0.14 14 1.35 0.14 14 1.38 0.14 13 1.37 0.15 11 1.43 0.14 11 1.38 0.15 11 1.28 0.15 11 1.38 0.14 10 1.37 0.17 9 1.51 0.21 8FRENCH GUIANA GUF 0.62 0.34 1 0.62 0.36 1 0.87 0.37 1 0.88 0.34 1 0.55 0.31 1 0.94 0.30 1 0.96 0.32 1 0.98 0.29 1 0.99 0.35 1 .. .. ..GABON GAB -0.62 0.14 13 -0.60 0.14 13 -0.68 0.15 13 -0.56 0.15 12 -0.70 0.15 12 -0.56 0.15 11 -0.37 0.16 11 -0.35 0.15 10 -0.47 0.19 8 -1.01 0.26 5GAMBIA GMB -0.25 0.16 11 -0.21 0.17 10 -0.27 0.16 10 -0.26 0.19 9 -0.25 0.19 9 0.17 0.20 8 -0.28 0.22 7 -0.12 0.22 6 0.03 0.25 6 0.41 0.46 3GEORGIA GEO -0.34 0.13 18 -0.50 0.14 18 -0.59 0.13 17 -0.78 0.15 14 -0.79 0.14 14 -1.24 0.16 12 -1.27 0.17 11 -1.12 0.17 9 -1.21 0.20 7 -0.86 0.25 5GERMANY DEU 1.72 0.15 12 1.74 0.14 13 1.73 0.14 13 1.68 0.15 11 1.66 0.14 11 1.65 0.15 11 1.67 0.15 11 1.65 0.14 10 1.69 0.17 9 1.75 0.21 8
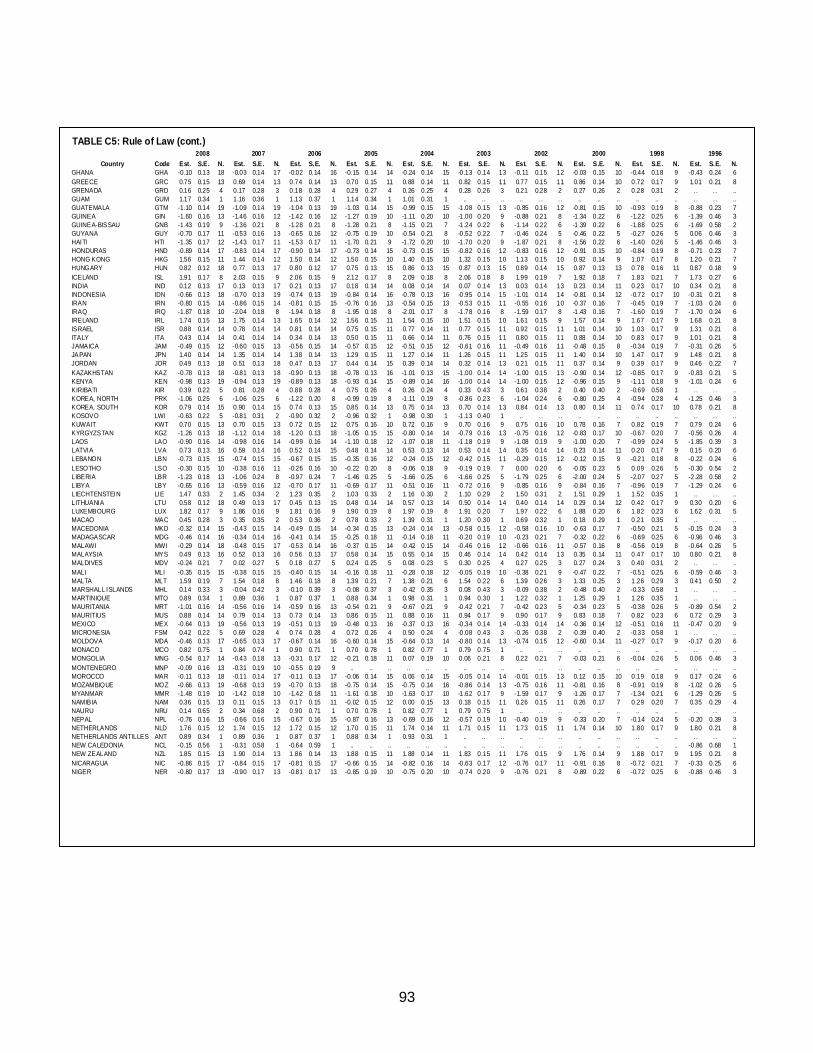
93
TABLE C5: Rule of Law (cont.)2008 2007 2006 2005 2004 2003 2002 2000 1998 1996
Country Code Est. S.E. N. Est. S.E. N. Est. S.E. N. Est. S.E. N. Est. S.E. N. Est. S.E. N. Est. S.E. N. Est. S.E. N. Est. S.E. N. Est. S.E. N.GHANA GHA -0.10 0.13 18 -0.03 0.14 17 -0.02 0.14 16 -0.15 0.14 14 -0.24 0.14 15 -0.13 0.14 13 -0.11 0.15 12 -0.03 0.15 10 -0.44 0.18 9 -0.43 0.24 6GREECE GRC 0.75 0.15 13 0.69 0.14 13 0.74 0.14 13 0.70 0.15 11 0.88 0.14 11 0.82 0.15 11 0.77 0.15 11 0.86 0.14 10 0.72 0.17 9 1.01 0.21 8GRENADA GRD 0.16 0.25 4 0.17 0.28 3 0.18 0.28 4 0.29 0.27 4 0.26 0.25 4 0.28 0.26 3 0.21 0.28 2 0.27 0.26 2 0.28 0.31 2 .. . . ..GUAM GUM 1.17 0.34 1 1.16 0.36 1 1.13 0.37 1 1.14 0.34 1 1.01 0.31 1 .. .. . . .. . . . . .. .. .. .. .. .. . . . . ..GUATEMALA GTM -1.10 0.14 19 -1.09 0.14 19 -1.04 0.13 19 -1.03 0.14 15 -0.99 0.15 15 -1.08 0.15 13 -0.85 0.16 12 -0.81 0.15 10 -0.93 0.19 8 -0.88 0.23 7GUINEA GIN -1.60 0.16 13 -1.46 0.16 12 -1.42 0.16 12 -1.27 0.19 10 -1.11 0.20 10 -1.00 0.20 9 -0.88 0.21 8 -1.34 0.22 6 -1.22 0.25 6 -1.39 0.46 3GUINEA-BISSAU GNB -1.43 0.19 9 -1.36 0.21 8 -1.28 0.21 8 -1.28 0.21 8 -1.15 0.21 7 -1.24 0.22 6 -1.14 0.22 6 -1.39 0.22 6 -1.88 0.25 6 -1.69 0.58 2GUYANA GUY -0.70 0.17 11 -0.53 0.16 13 -0.65 0.16 12 -0.75 0.19 10 -0.54 0.21 8 -0.52 0.22 7 -0.46 0.24 5 -0.46 0.22 5 -0.27 0.26 5 0.06 0.46 3HAITI HTI -1.35 0.17 12 -1.43 0.17 11 -1.53 0.17 11 -1.70 0.21 9 -1.72 0.20 10 -1.70 0.20 9 -1.87 0.21 8 -1.56 0.22 6 -1.40 0.26 5 -1.46 0.46 3HONDURAS HND -0.89 0.14 17 -0.83 0.14 17 -0.90 0.14 17 -0.73 0.14 15 -0.73 0.15 15 -0.82 0.16 12 -0.83 0.16 12 -0.91 0.15 10 -0.84 0.19 8 -0.71 0.23 7HONG KONG HKG 1.56 0.15 11 1.44 0.14 12 1.50 0.14 12 1.50 0.15 10 1.40 0.15 10 1.32 0.15 10 1.13 0.15 10 0.92 0.14 9 1.07 0.17 8 1.20 0.21 7HUNGARY HUN 0.82 0.12 18 0.77 0.13 17 0.80 0.12 17 0.75 0.13 15 0.86 0.13 15 0.87 0.13 15 0.89 0.14 15 0.87 0.13 13 0.78 0.16 11 0.87 0.18 9ICELAND ISL 1.91 0.17 8 2.03 0.15 9 2.06 0.15 9 2.12 0.17 8 2.09 0.18 8 2.06 0.18 8 1.99 0.19 7 1.92 0.18 7 1.83 0.21 7 1.73 0.27 6INDIA IND 0.12 0.13 17 0.13 0.13 17 0.21 0.13 17 0.18 0.14 14 0.08 0.14 14 0.07 0.14 13 0.03 0.14 13 0.23 0.14 11 0.23 0.17 10 0.34 0.21 8INDONESIA IDN -0.66 0.13 18 -0.70 0.13 19 -0.74 0.13 19 -0.84 0.14 16 -0.78 0.13 16 -0.95 0.14 15 -1.01 0.14 14 -0.81 0.14 12 -0.72 0.17 10 -0.31 0.21 8IRAN IRN -0.80 0.15 14 -0.86 0.15 14 -0.81 0.15 15 -0.76 0.16 13 -0.54 0.15 13 -0.53 0.15 11 -0.55 0.16 10 -0.37 0.16 7 -0.45 0.19 7 -1.03 0.24 6IRAQ IRQ -1.87 0.18 10 -2.04 0.18 8 -1.94 0.18 8 -1.95 0.18 8 -2.01 0.17 8 -1.78 0.16 8 -1.59 0.17 8 -1.43 0.16 7 -1.60 0.19 7 -1.70 0.24 6IRELAND IRL 1.74 0.15 13 1.75 0.14 13 1.65 0.14 12 1.56 0.15 11 1.54 0.15 10 1.51 0.15 10 1.61 0.15 9 1.57 0.14 9 1.67 0.17 9 1.68 0.21 8ISRAEL ISR 0.88 0.14 14 0.78 0.14 14 0.81 0.14 14 0.75 0.15 11 0.77 0.14 11 0.77 0.15 11 0.92 0.15 11 1.01 0.14 10 1.03 0.17 9 1.31 0.21 8ITALY ITA 0.43 0.14 14 0.41 0.14 14 0.34 0.14 13 0.50 0.15 11 0.66 0.14 11 0.76 0.15 11 0.80 0.15 11 0.88 0.14 10 0.83 0.17 9 1.01 0.21 8JAMAICA JAM -0.49 0.15 12 -0.60 0.15 13 -0.56 0.15 14 -0.57 0.15 12 -0.51 0.15 12 -0.61 0.16 11 -0.49 0.16 11 -0.48 0.15 8 -0.34 0.19 7 -0.31 0.26 5JAPAN JPN 1.40 0.14 14 1.35 0.14 14 1.38 0.14 13 1.29 0.15 11 1.27 0.14 11 1.26 0.15 11 1.25 0.15 11 1.40 0.14 10 1.47 0.17 9 1.48 0.21 8JORDAN JOR 0.49 0.13 18 0.51 0.13 18 0.47 0.13 17 0.44 0.14 15 0.39 0.14 14 0.32 0.14 13 0.21 0.15 11 0.37 0.14 9 0.39 0.17 9 0.46 0.22 7KAZAKHSTAN KAZ -0.78 0.13 18 -0.81 0.13 18 -0.90 0.13 18 -0.78 0.13 16 -1.01 0.13 15 -1.00 0.14 14 -1.00 0.15 13 -0.90 0.14 12 -0.85 0.17 9 -0.83 0.21 5KENYA KEN -0.98 0.13 19 -0.94 0.13 19 -0.89 0.13 18 -0.93 0.14 15 -0.89 0.14 16 -1.00 0.14 14 -1.00 0.15 12 -0.96 0.15 9 -1.11 0.18 9 -1.01 0.24 6KIRIBATI KIR 0.39 0.22 5 0.81 0.28 4 0.88 0.28 4 0.75 0.26 4 0.26 0.24 4 0.33 0.43 3 0.61 0.38 2 0.40 0.40 2 -0.69 0.58 1 .. . . ..KOREA, NORTH PRK -1.06 0.25 6 -1.06 0.25 6 -1.22 0.20 8 -0.99 0.19 8 -1.11 0.19 8 -0.86 0.23 6 -1.04 0.24 6 -0.80 0.25 4 -0.94 0.28 4 -1.25 0.46 3KOREA, SOUTH KOR 0.79 0.14 15 0.90 0.14 15 0.74 0.13 15 0.85 0.14 13 0.75 0.14 13 0.70 0.14 13 0.84 0.14 13 0.80 0.14 11 0.74 0.17 10 0.78 0.21 8KOSOVO LWI -0.63 0.22 5 -0.81 0.31 2 -0.90 0.32 2 -0.96 0.32 1 -0.98 0.30 1 -1.13 0.40 1 .. . . . . .. .. .. .. .. .. . . . . ..KUWAIT KWT 0.70 0.15 13 0.70 0.15 13 0.72 0.15 12 0.75 0.16 10 0.72 0.16 9 0.70 0.16 9 0.75 0.16 10 0.78 0.16 7 0.82 0.19 7 0.79 0.24 6KYRGYZSTAN KGZ -1.26 0.13 18 -1.12 0.14 18 -1.20 0.13 18 -1.05 0.15 15 -0.80 0.14 14 -0.79 0.16 13 -0.75 0.16 12 -0.83 0.17 10 -0.67 0.20 7 -0.56 0.26 4LAOS LAO -0.90 0.16 14 -0.98 0.16 14 -0.99 0.16 14 -1.10 0.18 12 -1.07 0.18 11 -1.18 0.19 9 -1.08 0.19 9 -1.00 0.20 7 -0.99 0.24 5 -1.85 0.39 3LATVIA LVA 0.73 0.13 16 0.59 0.14 16 0.52 0.14 15 0.48 0.14 14 0.53 0.13 14 0.53 0.14 14 0.35 0.14 14 0.23 0.14 11 0.20 0.17 9 0.15 0.20 6LEBANON LBN -0.73 0.15 15 -0.74 0.15 15 -0.67 0.15 15 -0.35 0.16 12 -0.24 0.15 12 -0.42 0.15 11 -0.29 0.15 12 -0.12 0.15 9 -0.21 0.18 8 -0.22 0.24 6LESOTHO LSO -0.30 0.15 10 -0.38 0.16 11 -0.26 0.16 10 -0.22 0.20 8 -0.06 0.18 9 -0.19 0.19 7 0.00 0.20 6 -0.05 0.23 5 0.09 0.26 5 -0.30 0.54 2LIBERIA LBR -1.23 0.18 13 -1.06 0.24 8 -0.97 0.24 7 -1.46 0.25 5 -1.66 0.25 6 -1.66 0.25 5 -1.79 0.25 6 -2.00 0.24 5 -2.07 0.27 5 -2.28 0.58 2LIBYA LBY -0.65 0.16 13 -0.59 0.16 12 -0.70 0.17 11 -0.69 0.17 11 -0.51 0.16 11 -0.72 0.16 9 -0.85 0.16 9 -0.84 0.16 7 -0.96 0.19 7 -1.29 0.24 6LIECHTENSTEIN LIE 1.47 0.33 2 1.45 0.34 2 1.23 0.35 2 1.03 0.33 2 1.16 0.30 2 1.10 0.29 2 1.50 0.31 2 1.51 0.29 1 1.52 0.35 1 .. . . ..LITHUANIA LTU 0.58 0.12 18 0.49 0.13 17 0.45 0.13 15 0.48 0.14 14 0.57 0.13 14 0.50 0.14 14 0.40 0.14 14 0.29 0.14 12 0.42 0.17 9 0.30 0.20 6LUXEMBOURG LUX 1.82 0.17 9 1.86 0.16 9 1.81 0.16 9 1.90 0.19 8 1.97 0.19 8 1.91 0.20 7 1.97 0.22 6 1.88 0.20 6 1.82 0.23 6 1.62 0.31 5MACAO MAC 0.45 0.28 3 0.35 0.35 2 0.53 0.36 2 0.78 0.33 2 1.39 0.31 1 1.20 0.30 1 0.69 0.32 1 0.18 0.29 1 0.21 0.35 1 .. . . ..MACEDONIA MKD -0.32 0.14 15 -0.43 0.15 14 -0.49 0.15 14 -0.34 0.15 13 -0.24 0.14 13 -0.58 0.15 12 -0.58 0.16 10 -0.63 0.17 7 -0.50 0.21 5 -0.15 0.24 3MADAGASCAR MDG -0.46 0.14 16 -0.34 0.14 16 -0.41 0.14 15 -0.25 0.18 11 -0.14 0.18 11 -0.20 0.19 10 -0.23 0.21 7 -0.32 0.22 6 -0.69 0.25 6 -0.96 0.46 3MALAWI MWI -0.29 0.14 18 -0.48 0.15 17 -0.53 0.14 16 -0.37 0.15 14 -0.42 0.15 14 -0.46 0.16 12 -0.66 0.16 11 -0.57 0.16 8 -0.56 0.19 8 -0.64 0.26 5MALAYSIA MYS 0.49 0.13 16 0.52 0.13 16 0.56 0.13 17 0.58 0.14 15 0.55 0.14 15 0.46 0.14 14 0.42 0.14 13 0.35 0.14 11 0.47 0.17 10 0.80 0.21 8MALDIVES MDV -0.24 0.21 7 0.02 0.27 5 0.18 0.27 5 0.24 0.25 5 0.08 0.23 5 0.30 0.25 4 0.27 0.25 3 0.27 0.24 3 0.40 0.31 2 .. . . ..MALI MLI -0.35 0.15 15 -0.38 0.15 15 -0.40 0.15 14 -0.16 0.18 11 -0.28 0.18 12 -0.05 0.19 10 -0.38 0.21 9 -0.47 0.22 7 -0.51 0.25 6 -0.59 0.46 3MALTA MLT 1.59 0.19 7 1.54 0.18 8 1.46 0.18 8 1.39 0.21 7 1.38 0.21 6 1.54 0.22 6 1.39 0.26 3 1.33 0.25 3 1.26 0.29 3 0.41 0.50 2MARSHALL ISLANDS MHL 0.14 0.33 3 -0.04 0.42 3 -0.10 0.39 3 -0.08 0.37 3 -0.42 0.35 3 0.08 0.43 3 -0.09 0.38 2 -0.48 0.40 2 -0.33 0.58 1 .. . . ..MARTINIQUE MTQ 0.89 0.34 1 0.89 0.36 1 0.87 0.37 1 0.88 0.34 1 0.98 0.31 1 0.94 0.30 1 1.22 0.32 1 1.25 0.29 1 1.26 0.35 1 .. . . ..MAURITANIA MRT -1.01 0.16 14 -0.56 0.16 14 -0.59 0.16 13 -0.54 0.21 9 -0.67 0.21 9 -0.42 0.21 7 -0.42 0.23 5 -0.34 0.23 5 -0.38 0.26 5 -0.89 0.54 2MAURITIUS MUS 0.88 0.14 14 0.79 0.14 13 0.73 0.14 13 0.86 0.15 11 0.88 0.16 11 0.94 0.17 9 0.90 0.17 9 0.83 0.18 7 0.82 0.23 6 0.72 0.29 3MEXICO MEX -0.64 0.13 19 -0.56 0.13 19 -0.51 0.13 19 -0.48 0.13 16 -0.37 0.13 16 -0.34 0.14 14 -0.33 0.14 14 -0.36 0.14 12 -0.51 0.16 11 -0.47 0.20 9MICRONESIA FSM 0.42 0.22 5 0.69 0.28 4 0.74 0.28 4 0.72 0.26 4 0.50 0.24 4 -0.08 0.43 3 -0.26 0.38 2 -0.39 0.40 2 -0.33 0.58 1 .. . . ..MOLDOVA MDA -0.46 0.13 17 -0.65 0.13 17 -0.67 0.14 16 -0.60 0.14 15 -0.64 0.13 14 -0.80 0.14 13 -0.74 0.15 12 -0.60 0.14 11 -0.27 0.17 9 -0.17 0.20 6MONACO MCO 0.82 0.75 1 0.84 0.74 1 0.90 0.71 1 0.70 0.78 1 0.82 0.77 1 0.79 0.75 1 .. . . . . .. .. .. .. .. .. . . . . ..MONGOLIA MNG -0.54 0.17 14 -0.43 0.18 13 -0.31 0.17 12 -0.21 0.18 11 0.07 0.19 10 0.06 0.21 8 0.22 0.21 7 -0.03 0.21 6 -0.04 0.26 5 0.06 0.46 3MONTENEGRO MNP -0.09 0.16 13 -0.31 0.19 10 -0.55 0.19 9 .. .. .. . . .. .. .. .. . . .. . . . . .. .. .. .. .. .. . . . . ..MOROCCO MAR -0.11 0.13 18 -0.11 0.14 17 -0.11 0.13 17 -0.06 0.14 15 0.06 0.14 15 -0.05 0.14 14 -0.01 0.15 13 0.12 0.15 10 0.19 0.18 9 0.17 0.24 6MOZAMBIQUE MOZ -0.66 0.13 19 -0.68 0.13 19 -0.70 0.13 18 -0.75 0.14 15 -0.75 0.14 16 -0.86 0.14 13 -0.75 0.16 11 -0.81 0.16 8 -0.91 0.19 8 -1.02 0.26 5MYANMAR MMR -1.48 0.19 10 -1.42 0.18 10 -1.42 0.18 11 -1.61 0.18 10 -1.63 0.17 10 -1.62 0.17 9 -1.59 0.17 9 -1.26 0.17 7 -1.34 0.21 6 -1.29 0.26 5NAMIBIA NAM 0.36 0.15 13 0.11 0.15 13 0.17 0.15 11 -0.02 0.15 12 0.00 0.15 13 0.18 0.15 11 0.26 0.15 11 0.26 0.17 7 0.29 0.20 7 0.35 0.29 4NAURU NRU 0.14 0.65 2 0.34 0.68 2 0.90 0.71 1 0.70 0.78 1 0.82 0.77 1 0.79 0.75 1 .. . . . . .. .. .. .. .. .. . . . . ..NEPAL NPL -0.76 0.16 15 -0.66 0.16 15 -0.67 0.16 15 -0.87 0.16 13 -0.69 0.16 12 -0.57 0.19 10 -0.40 0.19 9 -0.33 0.20 7 -0.14 0.24 5 -0.20 0.39 3NETHERLANDS NLD 1.76 0.15 12 1.74 0.15 12 1.72 0.15 12 1.70 0.15 11 1.74 0.14 11 1.71 0.15 11 1.73 0.15 11 1.74 0.14 10 1.80 0.17 9 1.80 0.21 8NETHERLANDS ANTILLES ANT 0.89 0.34 1 0.89 0.36 1 0.87 0.37 1 0.88 0.34 1 0.93 0.31 1 .. .. . . .. . . . . .. .. .. .. .. .. . . . . ..NEW CALEDONIA NCL -0.15 0.56 1 -0.31 0.58 1 -0.64 0.59 1 .. .. .. . . .. .. .. .. . . .. . . . . .. .. .. .. .. .. -0.86 0.68 1NEW ZEALAND NZL 1.85 0.15 13 1.90 0.14 13 1.86 0.14 13 1.88 0.15 11 1.88 0.14 11 1.83 0.15 11 1.76 0.15 9 1.76 0.14 9 1.88 0.17 9 1.95 0.21 8NICARAGUA NIC -0.86 0.15 17 -0.84 0.15 17 -0.81 0.15 17 -0.66 0.15 14 -0.82 0.16 14 -0.63 0.17 12 -0.76 0.17 11 -0.91 0.16 8 -0.72 0.21 7 -0.33 0.25 6NIGER NER -0.80 0.17 13 -0.90 0.17 13 -0.81 0.17 13 -0.85 0.19 10 -0.75 0.20 10 -0.74 0.20 9 -0.76 0.21 8 -0.89 0.22 6 -0.72 0.25 6 -0.88 0.46 3
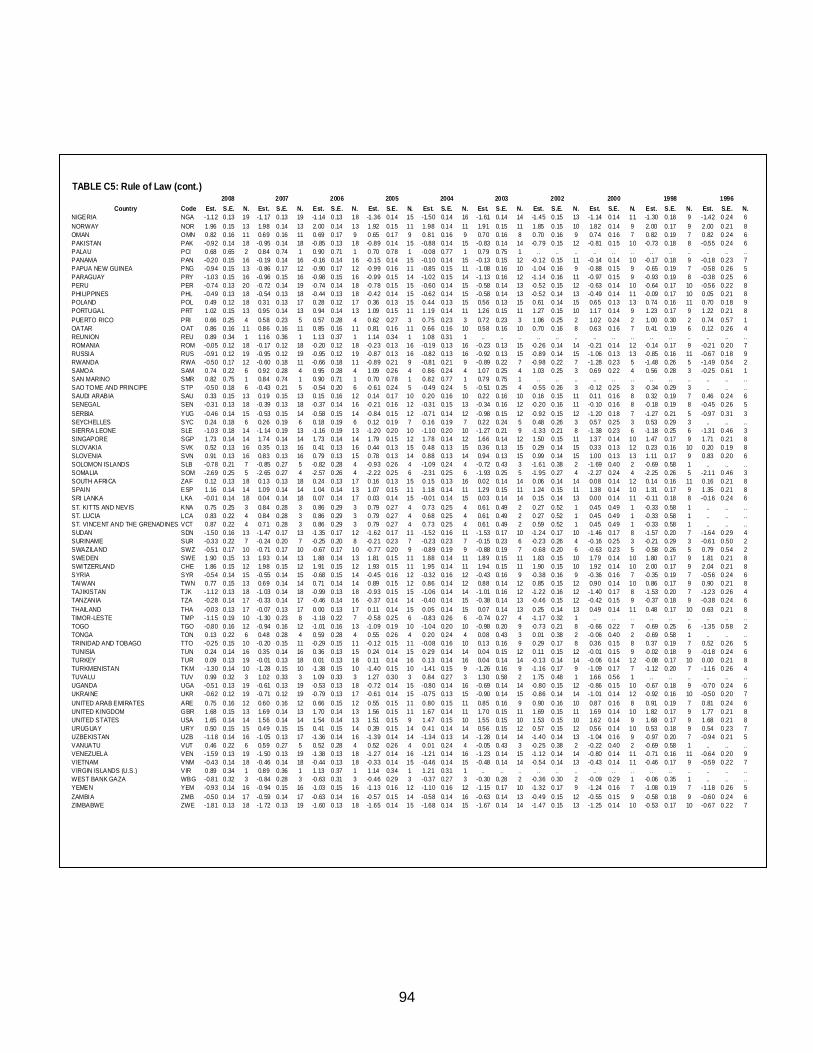
94
TABLE C5: Rule of Law (cont.)
2008 2007 2006 2005 2004 2003 2002 2000 1998 1996Country Code Est. S.E. N. Est. S.E. N. Est. S.E. N. Est. S.E. N. Est. S.E. N. Est. S.E. N. Est. S.E. N. Est. S.E. N. Est. S.E. N. Est. S.E. N.
NIGERIA NGA -1.12 0.13 19 -1.17 0.13 19 -1.14 0.13 18 -1.36 0.14 15 -1.50 0.14 16 -1.61 0.14 14 -1.45 0.15 13 -1.14 0.14 11 -1.30 0.18 9 -1.42 0.24 6NORWAY NOR 1.96 0.15 13 1.98 0.14 13 2.00 0.14 13 1.92 0.15 11 1.98 0.14 11 1.91 0.15 11 1.85 0.15 10 1.82 0.14 9 2.00 0.17 9 2.00 0.21 8OMAN OMN 0.82 0.16 11 0.69 0.16 11 0.69 0.17 9 0.65 0.17 9 0.81 0.16 9 0.70 0.16 8 0.70 0.16 9 0.74 0.16 7 0.82 0.19 7 0.82 0.24 6PAKISTAN PAK -0.92 0.14 18 -0.95 0.14 18 -0.85 0.13 18 -0.89 0.14 15 -0.88 0.14 15 -0.83 0.14 14 -0.79 0.15 12 -0.81 0.15 10 -0.73 0.18 8 -0.55 0.24 6PALAU PCI 0.68 0.65 2 0.84 0.74 1 0.90 0.71 1 0.70 0.78 1 -0.08 0.77 1 0.79 0.75 1 .. .. .. .. .. . . . . .. .. .. .. ..PANAMA PAN -0.20 0.15 16 -0.19 0.14 16 -0.16 0.14 16 -0.15 0.14 15 -0.10 0.14 15 -0.13 0.15 12 -0.12 0.15 11 -0.14 0.14 10 -0.17 0.18 9 -0.18 0.23 7PAPUA NEW GUINEA PNG -0.94 0.15 13 -0.86 0.17 12 -0.90 0.17 12 -0.99 0.16 11 -0.85 0.15 11 -1.08 0.16 10 -1.04 0.16 9 -0.88 0.15 9 -0.65 0.19 7 -0.58 0.26 5PARAGUAY PRY -1.03 0.15 16 -0.96 0.15 16 -0.98 0.15 16 -0.99 0.15 14 -1.02 0.15 14 -1.13 0.16 12 -1.14 0.16 11 -0.97 0.15 9 -0.93 0.19 8 -0.38 0.25 6PERU PER -0.74 0.13 20 -0.72 0.14 19 -0.74 0.14 18 -0.78 0.15 15 -0.60 0.14 15 -0.58 0.14 13 -0.52 0.15 12 -0.63 0.14 10 -0.64 0.17 10 -0.56 0.22 8PHILIPPINES PHL -0.49 0.13 18 -0.54 0.13 18 -0.44 0.13 18 -0.42 0.14 15 -0.62 0.14 15 -0.58 0.14 13 -0.52 0.14 13 -0.49 0.14 11 -0.09 0.17 10 0.05 0.21 8POLAND POL 0.49 0.12 18 0.31 0.13 17 0.28 0.12 17 0.36 0.13 15 0.44 0.13 15 0.56 0.13 15 0.61 0.14 15 0.65 0.13 13 0.74 0.16 11 0.70 0.18 9PORTUGAL PRT 1.02 0.15 13 0.95 0.14 13 0.94 0.14 13 1.09 0.15 11 1.19 0.14 11 1.26 0.15 11 1.27 0.15 10 1.17 0.14 9 1.23 0.17 9 1.22 0.21 8PUERTO RICO PRI 0.66 0.25 4 0.58 0.23 5 0.57 0.28 4 0.62 0.27 3 0.75 0.23 3 0.72 0.23 3 1.06 0.25 2 1.02 0.24 2 1.00 0.30 2 0.74 0.57 1QATAR QAT 0.86 0.16 11 0.86 0.16 11 0.85 0.16 11 0.81 0.16 11 0.66 0.16 10 0.58 0.16 10 0.70 0.16 8 0.63 0.16 7 0.41 0.19 6 0.12 0.26 4REUNION REU 0.89 0.34 1 1.16 0.36 1 1.13 0.37 1 1.14 0.34 1 1.08 0.31 1 .. .. .. .. .. .. .. .. . . . . .. .. .. .. ..ROMANIA ROM -0.05 0.12 18 -0.17 0.12 18 -0.20 0.12 18 -0.23 0.13 16 -0.19 0.13 16 -0.23 0.13 15 -0.26 0.14 14 -0.21 0.14 12 -0.14 0.17 9 -0.21 0.20 7RUSSIA RUS -0.91 0.12 19 -0.95 0.12 19 -0.95 0.12 19 -0.87 0.13 16 -0.82 0.13 16 -0.92 0.13 15 -0.89 0.14 15 -1.06 0.13 13 -0.85 0.16 11 -0.67 0.18 9RWANDA RWA -0.50 0.17 12 -0.60 0.18 11 -0.66 0.18 11 -0.89 0.21 9 -0.81 0.21 9 -0.89 0.22 7 -0.98 0.22 7 -1.28 0.23 5 -1.48 0.26 5 -1.49 0.54 2SAMOA SAM 0.74 0.22 6 0.92 0.28 4 0.95 0.28 4 1.09 0.26 4 0.86 0.24 4 1.07 0.25 4 1.03 0.25 3 0.69 0.22 4 0.56 0.28 3 -0.25 0.61 1SAN MARINO SMR 0.82 0.75 1 0.84 0.74 1 0.90 0.71 1 0.70 0.78 1 0.82 0.77 1 0.79 0.75 1 .. .. .. .. .. . . . . .. .. .. .. ..SAO TOME AND PRINCIPE STP -0.50 0.18 6 -0.43 0.21 5 -0.54 0.20 6 -0.61 0.24 5 -0.49 0.24 5 -0.51 0.25 4 -0.55 0.26 3 -0.12 0.25 3 -0.34 0.29 3 .. .. ..SAUDI ARABIA SAU 0.33 0.15 13 0.19 0.15 13 0.15 0.16 12 0.14 0.17 10 0.20 0.16 10 0.22 0.16 10 0.16 0.15 11 0.11 0.16 8 0.32 0.19 7 0.46 0.24 6SENEGAL SEN -0.31 0.13 18 -0.39 0.13 18 -0.37 0.14 16 -0.21 0.16 12 -0.31 0.15 13 -0.34 0.16 12 -0.20 0.16 11 -0.10 0.16 8 -0.18 0.19 8 -0.45 0.26 5SERBIA YUG -0.46 0.14 15 -0.53 0.15 14 -0.58 0.15 14 -0.84 0.15 12 -0.71 0.14 12 -0.98 0.15 12 -0.92 0.15 12 -1.20 0.18 7 -1.27 0.21 5 -0.97 0.31 3SEYCHELLES SYC 0.24 0.18 6 0.26 0.19 6 0.18 0.19 6 0.12 0.19 7 0.16 0.19 7 0.22 0.24 5 0.48 0.26 3 0.57 0.25 3 0.53 0.29 3 .. .. ..SIERRA LEONE SLE -1.03 0.18 14 -1.14 0.19 13 -1.16 0.19 13 -1.20 0.20 10 -1.10 0.20 10 -1.27 0.21 9 -1.33 0.21 8 -1.38 0.23 6 -1.18 0.25 6 -1.31 0.46 3SINGAPORE SGP 1.73 0.14 14 1.74 0.14 14 1.73 0.14 14 1.79 0.15 12 1.78 0.14 12 1.66 0.14 12 1.50 0.15 11 1.37 0.14 10 1.47 0.17 9 1.71 0.21 8SLOVAKIA SVK 0.52 0.13 16 0.35 0.13 16 0.41 0.13 16 0.44 0.13 15 0.48 0.13 15 0.36 0.13 15 0.29 0.14 15 0.33 0.13 12 0.23 0.16 10 0.20 0.19 8SLOVENIA SVN 0.91 0.13 16 0.83 0.13 16 0.79 0.13 15 0.78 0.13 14 0.88 0.13 14 0.94 0.13 15 0.99 0.14 15 1.00 0.13 13 1.11 0.17 9 0.83 0.20 6SOLOMON ISLANDS SLB -0.78 0.21 7 -0.85 0.27 5 -0.82 0.28 4 -0.93 0.26 4 -1.09 0.24 4 -0.72 0.43 3 -1.61 0.38 2 -1.69 0.40 2 -0.69 0.58 1 .. .. ..SOMALIA SOM -2.69 0.25 5 -2.65 0.27 4 -2.57 0.26 4 -2.22 0.25 6 -2.31 0.25 6 -1.93 0.25 5 -1.95 0.27 4 -2.27 0.24 4 -2.25 0.26 5 -2.11 0.46 3SOUTH AFRICA ZAF 0.12 0.13 18 0.13 0.13 18 0.24 0.13 17 0.16 0.13 15 0.15 0.13 16 0.02 0.14 14 0.06 0.14 14 0.08 0.14 12 0.14 0.16 11 0.16 0.21 8SPAIN ESP 1.16 0.14 14 1.09 0.14 14 1.04 0.14 13 1.07 0.15 11 1.18 0.14 11 1.29 0.15 11 1.24 0.15 11 1.38 0.14 10 1.31 0.17 9 1.35 0.21 8SRI LANKA LKA -0.01 0.14 18 0.04 0.14 18 0.07 0.14 17 0.03 0.14 15 -0.01 0.14 15 0.03 0.14 14 0.15 0.14 13 0.00 0.14 11 -0.11 0.18 8 -0.16 0.24 6ST. KITTS AND NEVIS KNA 0.75 0.25 3 0.84 0.28 3 0.86 0.29 3 0.79 0.27 4 0.73 0.25 4 0.61 0.49 2 0.27 0.52 1 0.45 0.49 1 -0.33 0.58 1 .. .. ..ST. LUCIA LCA 0.83 0.22 4 0.84 0.28 3 0.86 0.29 3 0.79 0.27 4 0.68 0.25 4 0.61 0.49 2 0.27 0.52 1 0.45 0.49 1 -0.33 0.58 1 .. .. ..ST. VINCENT AND THE GRENADINES VCT 0.87 0.22 4 0.71 0.28 3 0.86 0.29 3 0.79 0.27 4 0.73 0.25 4 0.61 0.49 2 0.59 0.52 1 0.45 0.49 1 -0.33 0.58 1 .. .. ..SUDAN SDN -1.50 0.16 13 -1.47 0.17 13 -1.35 0.17 12 -1.62 0.17 11 -1.52 0.16 11 -1.53 0.17 10 -1.24 0.17 10 -1.46 0.17 8 -1.57 0.20 7 -1.64 0.29 4SURINAME SUR -0.33 0.22 7 -0.24 0.20 7 -0.25 0.20 8 -0.21 0.23 7 -0.23 0.23 7 -0.15 0.23 6 -0.23 0.26 4 -0.16 0.25 3 -0.21 0.29 3 -0.61 0.50 2SWAZILAND SWZ -0.51 0.17 10 -0.71 0.17 10 -0.67 0.17 10 -0.77 0.20 9 -0.89 0.19 9 -0.88 0.19 7 -0.68 0.20 6 -0.63 0.23 5 -0.58 0.26 5 0.79 0.54 2SWEDEN SWE 1.90 0.15 13 1.93 0.14 13 1.88 0.14 13 1.81 0.15 11 1.88 0.14 11 1.89 0.15 11 1.83 0.15 10 1.79 0.14 10 1.80 0.17 9 1.81 0.21 8SWITZERLAND CHE 1.86 0.15 12 1.98 0.15 12 1.91 0.15 12 1.93 0.15 11 1.95 0.14 11 1.94 0.15 11 1.90 0.15 10 1.92 0.14 10 2.00 0.17 9 2.04 0.21 8SYRIA SYR -0.54 0.14 15 -0.55 0.14 15 -0.68 0.15 14 -0.45 0.16 12 -0.32 0.16 12 -0.43 0.16 9 -0.38 0.16 9 -0.36 0.16 7 -0.35 0.19 7 -0.56 0.24 6TAIWAN TWN 0.77 0.15 13 0.69 0.14 14 0.71 0.14 14 0.89 0.15 12 0.86 0.14 12 0.88 0.14 12 0.85 0.15 12 0.90 0.14 10 0.86 0.17 9 0.90 0.21 8TAJIKISTAN TJK -1.12 0.13 18 -1.03 0.14 18 -0.99 0.13 18 -0.93 0.15 15 -1.06 0.14 14 -1.01 0.16 12 -1.22 0.16 12 -1.40 0.17 8 -1.53 0.20 7 -1.23 0.26 4TANZANIA TZA -0.28 0.14 17 -0.33 0.14 17 -0.46 0.14 16 -0.37 0.14 14 -0.40 0.14 15 -0.38 0.14 13 -0.46 0.15 12 -0.42 0.15 9 -0.37 0.18 9 -0.38 0.24 6THAILAND THA -0.03 0.13 17 -0.07 0.13 17 0.00 0.13 17 0.11 0.14 15 0.05 0.14 15 0.07 0.14 13 0.25 0.14 13 0.49 0.14 11 0.48 0.17 10 0.63 0.21 8TIMOR-LESTE TMP -1.15 0.19 10 -1.30 0.23 8 -1.18 0.22 7 -0.58 0.25 6 -0.83 0.26 6 -0.74 0.27 4 -1.17 0.32 1 .. .. . . . . .. .. .. .. ..TOGO TGO -0.80 0.16 12 -0.94 0.16 12 -1.01 0.16 13 -1.09 0.19 10 -1.04 0.20 10 -0.98 0.20 9 -0.73 0.21 8 -0.66 0.22 7 -0.69 0.25 6 -1.35 0.58 2TONGA TON 0.13 0.22 6 0.48 0.28 4 0.59 0.28 4 0.55 0.26 4 0.20 0.24 4 0.08 0.43 3 0.01 0.38 2 -0.06 0.40 2 -0.69 0.58 1 .. .. ..TRINIDAD AND TOBAGO TTO -0.25 0.15 10 -0.20 0.15 11 -0.29 0.15 11 -0.12 0.15 11 -0.08 0.16 10 0.13 0.16 9 0.29 0.17 8 0.36 0.15 8 0.37 0.19 7 0.52 0.26 5TUNISIA TUN 0.24 0.14 16 0.35 0.14 16 0.36 0.13 15 0.24 0.14 15 0.29 0.14 14 0.04 0.15 12 0.11 0.15 12 -0.01 0.15 9 -0.02 0.18 9 -0.18 0.24 6TURKEY TUR 0.09 0.13 19 -0.01 0.13 18 0.01 0.13 18 0.11 0.14 16 0.13 0.14 16 0.04 0.14 14 -0.13 0.14 14 -0.06 0.14 12 -0.08 0.17 10 0.00 0.21 8TURKMENISTAN TKM -1.30 0.14 10 -1.28 0.15 10 -1.38 0.15 10 -1.40 0.15 10 -1.41 0.15 9 -1.26 0.16 9 -1.16 0.17 9 -1.09 0.17 7 -1.12 0.20 7 -1.16 0.26 4TUVALU TUV 0.99 0.32 3 1.02 0.33 3 1.09 0.33 3 1.27 0.30 3 0.84 0.27 3 1.30 0.58 2 1.75 0.48 1 1.66 0.56 1 .. .. .. .. .. ..UGANDA UGA -0.51 0.13 19 -0.61 0.13 19 -0.53 0.13 18 -0.72 0.14 15 -0.80 0.14 16 -0.69 0.14 14 -0.80 0.15 12 -0.86 0.15 10 -0.67 0.18 9 -0.70 0.24 6UKRAINE UKR -0.62 0.12 19 -0.71 0.12 19 -0.79 0.13 17 -0.61 0.14 15 -0.75 0.13 15 -0.90 0.14 15 -0.86 0.14 14 -1.01 0.14 12 -0.92 0.16 10 -0.50 0.20 7UNITED ARAB EMIRATES ARE 0.75 0.16 12 0.60 0.16 12 0.66 0.15 12 0.55 0.15 11 0.80 0.15 11 0.85 0.16 9 0.90 0.16 10 0.87 0.16 8 0.91 0.19 7 0.81 0.24 6UNITED KINGDOM GBR 1.68 0.15 13 1.69 0.14 13 1.70 0.14 13 1.56 0.15 11 1.67 0.14 11 1.70 0.15 11 1.69 0.15 11 1.69 0.14 10 1.82 0.17 9 1.77 0.21 8UNITED STATES USA 1.65 0.14 14 1.56 0.14 14 1.54 0.14 13 1.51 0.15 9 1.47 0.15 10 1.55 0.15 10 1.53 0.15 10 1.62 0.14 9 1.68 0.17 9 1.68 0.21 8URUGUAY URY 0.50 0.15 15 0.49 0.15 15 0.41 0.15 14 0.39 0.15 14 0.41 0.14 14 0.56 0.15 12 0.57 0.15 12 0.56 0.14 10 0.53 0.18 9 0.54 0.23 7UZBEKISTAN UZB -1.18 0.14 16 -1.05 0.13 17 -1.36 0.14 16 -1.39 0.14 14 -1.34 0.13 14 -1.28 0.14 14 -1.40 0.14 13 -1.04 0.16 9 -0.97 0.20 7 -0.94 0.21 5VANUATU VUT 0.46 0.22 6 0.59 0.27 5 0.52 0.28 4 0.52 0.26 4 0.01 0.24 4 -0.05 0.43 3 -0.25 0.38 2 -0.22 0.40 2 -0.69 0.58 1 .. .. ..VENEZUELA VEN -1.59 0.13 19 -1.50 0.13 19 -1.38 0.13 18 -1.27 0.14 16 -1.21 0.14 16 -1.23 0.14 15 -1.12 0.14 14 -0.80 0.14 11 -0.71 0.16 11 -0.64 0.20 9VIETNAM VNM -0.43 0.14 18 -0.46 0.14 18 -0.44 0.13 18 -0.33 0.14 15 -0.46 0.14 15 -0.48 0.14 14 -0.54 0.14 13 -0.43 0.14 11 -0.46 0.17 9 -0.59 0.22 7VIRGIN ISLANDS (U.S.) VIR 0.89 0.34 1 0.89 0.36 1 1.13 0.37 1 1.14 0.34 1 1.21 0.31 1 .. .. .. .. .. .. .. .. . . . . .. .. .. .. ..WEST BANK GAZA WBG -0.81 0.32 3 -0.84 0.28 3 -0.63 0.31 3 -0.46 0.29 3 -0.37 0.27 3 -0.30 0.28 2 -0.36 0.30 2 -0.09 0.29 1 -0.06 0.35 1 .. .. ..YEMEN YEM -0.93 0.14 16 -0.94 0.15 16 -1.03 0.15 16 -1.13 0.16 12 -1.10 0.16 12 -1.15 0.17 10 -1.32 0.17 9 -1.24 0.16 7 -1.08 0.19 7 -1.18 0.26 5ZAMBIA ZMB -0.50 0.14 17 -0.59 0.14 17 -0.63 0.14 16 -0.57 0.15 14 -0.58 0.14 16 -0.63 0.14 13 -0.49 0.15 12 -0.55 0.15 9 -0.58 0.18 9 -0.60 0.24 6ZIMBABWE ZWE -1.81 0.13 18 -1.72 0.13 19 -1.60 0.13 18 -1.65 0.14 15 -1.68 0.14 15 -1.67 0.14 14 -1.47 0.15 13 -1.25 0.14 10 -0.53 0.17 10 -0.67 0.22 7
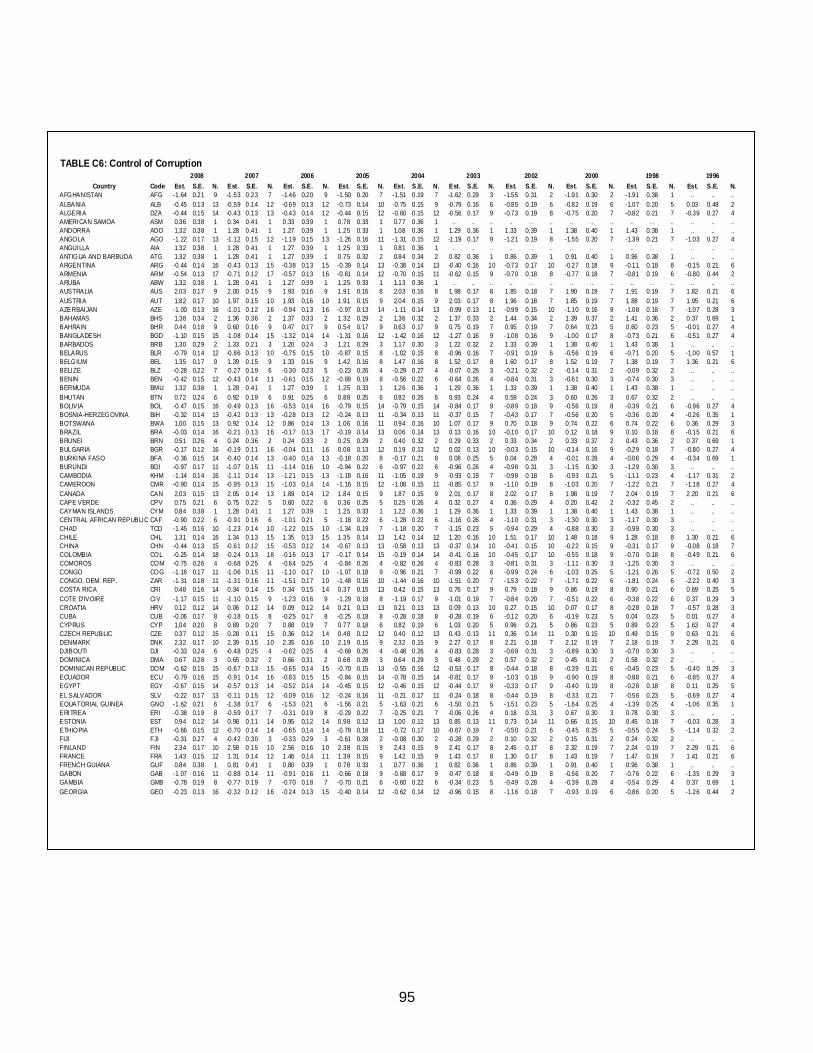
95
TABLE C6: Control of Corruption
2008 2007 2006 2005 2004 2003 2002 2000 1998 1996Country Code Est. S.E. N. Est. S.E. N. Est. S.E. N. Est. S.E. N. Est. S.E. N. Est. S.E. N. Est. S.E. N. Est. S.E. N. Est. S.E. N. Est. S.E. N.
AFGHANISTAN AFG -1.64 0.21 9 -1.53 0.23 7 -1.46 0.20 9 -1.50 0.20 7 -1.51 0.19 7 -1.62 0.29 3 -1.55 0.31 2 -1.91 0.30 2 -1.91 0.38 1 .. .. ..ALBANIA ALB -0.45 0.13 13 -0.59 0.14 12 -0.69 0.13 12 -0.73 0.14 10 -0.75 0.15 9 -0.79 0.16 6 -0.85 0.19 6 -0.82 0.19 6 -1.07 0.20 5 0.03 0.48 2ALGERIA DZA -0.44 0.15 14 -0.43 0.13 13 -0.43 0.14 12 -0.44 0.15 12 -0.60 0.15 12 -0.56 0.17 9 -0.73 0.19 8 -0.75 0.20 7 -0.82 0.21 7 -0.39 0.27 4AMERICAN SAMOA ASM 0.36 0.38 1 0.34 0.41 1 0.33 0.39 1 0.78 0.33 1 0.77 0.36 1 .. .. . . .. . . .. .. . . .. .. . . .. .. .. ..ANDORRA ADO 1.32 0.38 1 1.28 0.41 1 1.27 0.39 1 1.25 0.33 1 1.08 0.36 1 1.29 0.36 1 1.33 0.39 1 1.38 0.40 1 1.43 0.38 1 .. .. ..ANGOLA AGO -1.22 0.17 13 -1.12 0.15 12 -1.19 0.15 13 -1.26 0.16 11 -1.31 0.15 12 -1.19 0.17 9 -1.21 0.19 8 -1.55 0.20 7 -1.39 0.21 7 -1.03 0.27 4ANGUILLA AIA 1.32 0.38 1 1.28 0.41 1 1.27 0.39 1 1.25 0.33 1 0.81 0.36 1 .. .. . . .. . . .. .. . . .. .. . . .. .. .. ..ANTIGUA AND BARBUDA ATG 1.32 0.38 1 1.28 0.41 1 1.27 0.39 1 0.75 0.32 2 0.84 0.34 2 0.82 0.36 1 0.86 0.39 1 0.91 0.40 1 0.96 0.38 1 .. .. ..ARGENTINA ARG -0.44 0.14 16 -0.43 0.13 15 -0.38 0.13 15 -0.39 0.14 13 -0.38 0.14 13 -0.40 0.16 10 -0.73 0.17 10 -0.27 0.18 9 -0.11 0.18 8 -0.15 0.21 6ARMENIA ARM -0.54 0.13 17 -0.71 0.12 17 -0.57 0.13 16 -0.61 0.14 12 -0.70 0.15 11 -0.62 0.15 9 -0.70 0.18 8 -0.77 0.18 7 -0.81 0.19 6 -0.80 0.44 2ARUBA ABW 1.32 0.38 1 1.28 0.41 1 1.27 0.39 1 1.25 0.33 1 1.13 0.36 1 .. .. . . .. . . .. .. . . .. .. . . .. .. .. ..AUSTRALIA AUS 2.03 0.17 9 2.00 0.15 9 1.93 0.16 9 1.91 0.16 8 2.03 0.16 8 1.98 0.17 8 1.85 0.18 7 1.90 0.19 7 1.91 0.19 7 1.82 0.21 6AUSTRIA AUT 1.82 0.17 10 1.97 0.15 10 1.93 0.16 10 1.91 0.15 9 2.04 0.15 9 2.03 0.17 8 1.96 0.18 7 1.85 0.19 7 1.88 0.19 7 1.95 0.21 6AZERBAIJAN AZE -1.00 0.13 16 -1.01 0.12 16 -0.94 0.13 16 -0.97 0.13 14 -1.11 0.14 13 -0.99 0.13 11 -0.99 0.15 10 -1.10 0.16 9 -1.08 0.18 7 -1.07 0.28 3BAHAMAS BHS 1.38 0.34 2 1.36 0.36 2 1.37 0.33 2 1.32 0.29 2 1.36 0.32 2 1.37 0.33 2 1.44 0.34 2 1.39 0.37 2 1.41 0.36 2 0.37 0.69 1BAHRAIN BHR 0.44 0.18 9 0.60 0.16 9 0.47 0.17 9 0.54 0.17 9 0.63 0.17 9 0.75 0.19 7 0.95 0.19 7 0.64 0.23 5 0.60 0.23 5 -0.01 0.27 4BANGLADESH BGD -1.10 0.15 15 -1.08 0.14 15 -1.32 0.14 14 -1.31 0.16 12 -1.42 0.16 12 -1.27 0.16 9 -1.08 0.16 9 -1.00 0.17 8 -0.73 0.21 6 -0.51 0.27 4BARBADOS BRB 1.30 0.29 2 1.33 0.21 3 1.20 0.24 3 1.21 0.29 3 1.17 0.30 3 1.22 0.32 2 1.33 0.39 1 1.38 0.40 1 1.43 0.38 1 .. .. ..BELARUS BLR -0.79 0.14 12 -0.86 0.13 10 -0.75 0.15 10 -0.87 0.15 8 -1.02 0.15 8 -0.96 0.16 7 -0.91 0.19 6 -0.56 0.19 6 -0.71 0.20 5 -1.00 0.57 1BELGIUM BEL 1.35 0.17 9 1.39 0.15 9 1.33 0.16 9 1.42 0.16 8 1.47 0.16 8 1.52 0.17 8 1.60 0.17 8 1.52 0.19 7 1.38 0.19 7 1.36 0.21 6BELIZE BLZ -0.28 0.22 7 -0.27 0.19 6 -0.30 0.23 5 -0.23 0.26 4 -0.29 0.27 4 -0.07 0.26 3 -0.21 0.32 2 -0.14 0.31 2 -0.09 0.32 2 .. .. ..BENIN BEN -0.42 0.15 12 -0.43 0.14 11 -0.61 0.15 12 -0.89 0.19 8 -0.56 0.22 6 -0.64 0.26 4 -0.84 0.31 3 -0.61 0.30 3 -0.74 0.30 3 .. .. ..BERMUDA BMU 1.32 0.38 1 1.28 0.41 1 1.27 0.39 1 1.25 0.33 1 1.26 0.36 1 1.29 0.36 1 1.33 0.39 1 1.38 0.40 1 1.43 0.38 1 .. .. ..BHUTAN BTN 0.72 0.24 6 0.92 0.19 6 0.91 0.25 6 0.88 0.25 6 0.82 0.26 6 0.93 0.24 4 0.59 0.24 3 0.60 0.26 3 0.67 0.32 2 .. .. ..BOLIVIA BOL -0.47 0.15 16 -0.49 0.13 16 -0.53 0.14 16 -0.79 0.15 14 -0.79 0.15 14 -0.84 0.17 9 -0.89 0.18 9 -0.56 0.19 8 -0.39 0.21 6 -0.96 0.27 4BOSNIA-HERZEGOVINA BIH -0.32 0.14 13 -0.42 0.13 13 -0.28 0.13 12 -0.24 0.13 11 -0.34 0.13 11 -0.37 0.15 7 -0.43 0.17 7 -0.56 0.20 5 -0.36 0.20 4 -0.26 0.35 1BOTSWANA BWA 1.00 0.15 13 0.92 0.14 12 0.86 0.14 13 1.06 0.16 11 0.94 0.16 10 1.07 0.17 9 0.70 0.18 9 0.74 0.22 6 0.74 0.22 6 0.36 0.29 3BRAZIL BRA -0.03 0.14 16 -0.21 0.13 16 -0.17 0.13 17 -0.19 0.14 13 0.06 0.14 13 0.13 0.16 10 -0.10 0.17 10 0.12 0.18 9 0.10 0.18 8 -0.15 0.21 6BRUNEI BRN 0.51 0.26 4 0.24 0.36 2 0.24 0.33 2 0.25 0.29 2 0.40 0.32 2 0.29 0.33 2 0.33 0.34 2 0.33 0.37 2 0.43 0.36 2 0.37 0.69 1BULGARIA BGR -0.17 0.12 16 -0.19 0.11 16 -0.04 0.11 16 0.08 0.13 12 0.19 0.13 12 0.02 0.13 10 -0.03 0.15 10 -0.14 0.16 9 -0.29 0.18 7 -0.80 0.27 4BURKINA FASO BFA -0.36 0.15 14 -0.40 0.14 13 -0.40 0.14 13 -0.18 0.20 8 -0.17 0.21 8 0.08 0.25 5 0.04 0.28 4 -0.01 0.28 4 -0.06 0.29 4 -0.34 0.69 1BURUNDI BDI -0.97 0.17 11 -1.07 0.15 11 -1.14 0.16 10 -0.94 0.22 6 -0.97 0.22 6 -0.96 0.26 4 -0.98 0.31 3 -1.15 0.30 3 -1.29 0.30 3 .. .. ..CAMBODIA KHM -1.14 0.14 16 -1.11 0.14 13 -1.21 0.15 13 -1.18 0.16 11 -1.05 0.19 9 -0.93 0.19 7 -0.98 0.18 6 -0.93 0.21 5 -1.11 0.23 4 -1.17 0.31 2CAMEROON CMR -0.90 0.14 15 -0.95 0.13 15 -1.03 0.14 14 -1.16 0.15 12 -1.08 0.15 11 -0.85 0.17 9 -1.10 0.19 8 -1.03 0.20 7 -1.22 0.21 7 -1.18 0.27 4CANADA CAN 2.03 0.15 13 2.05 0.14 13 1.89 0.14 12 1.84 0.15 9 1.87 0.15 9 2.01 0.17 8 2.02 0.17 8 1.98 0.19 7 2.04 0.19 7 2.20 0.21 6CAPE VERDE CPV 0.75 0.21 6 0.75 0.22 5 0.60 0.22 6 0.36 0.25 5 0.25 0.26 4 0.32 0.27 4 0.36 0.29 4 0.20 0.42 2 -0.32 0.45 2 .. .. ..CAYMAN ISLANDS CYM 0.84 0.38 1 1.28 0.41 1 1.27 0.39 1 1.25 0.33 1 1.22 0.36 1 1.29 0.36 1 1.33 0.39 1 1.38 0.40 1 1.43 0.38 1 .. .. ..CENTRAL AFRICAN REPUBLIC CAF -0.90 0.22 6 -0.91 0.18 6 -1.01 0.21 5 -1.18 0.22 6 -1.28 0.22 6 -1.16 0.26 4 -1.10 0.31 3 -1.30 0.30 3 -1.17 0.30 3 .. .. ..CHAD TCD -1.45 0.16 10 -1.23 0.14 10 -1.22 0.15 10 -1.34 0.19 7 -1.18 0.20 7 -1.15 0.23 5 -0.94 0.29 4 -0.88 0.30 3 -0.99 0.30 3 .. .. ..CHILE CHL 1.31 0.14 16 1.34 0.13 15 1.35 0.13 15 1.35 0.14 13 1.42 0.14 12 1.20 0.16 10 1.51 0.17 10 1.48 0.18 9 1.28 0.18 8 1.30 0.21 6CHINA CHN -0.44 0.13 15 -0.61 0.12 15 -0.53 0.12 14 -0.67 0.13 13 -0.58 0.13 13 -0.37 0.14 10 -0.41 0.15 10 -0.22 0.15 9 -0.31 0.17 9 -0.08 0.18 7COLOMBIA COL -0.25 0.14 18 -0.24 0.13 18 -0.16 0.13 17 -0.17 0.14 15 -0.19 0.14 14 -0.41 0.16 10 -0.45 0.17 10 -0.55 0.18 9 -0.70 0.18 8 -0.49 0.21 6COMOROS COM -0.75 0.26 4 -0.68 0.25 4 -0.64 0.25 4 -0.84 0.26 4 -0.82 0.26 4 -0.83 0.28 3 -0.81 0.31 3 -1.11 0.30 3 -1.25 0.30 3 .. .. ..CONGO COG -1.16 0.17 11 -1.06 0.15 11 -1.10 0.17 10 -1.07 0.18 9 -0.96 0.21 7 -0.99 0.22 6 -0.99 0.24 6 -1.03 0.25 5 -1.21 0.26 5 -0.72 0.50 2CONGO, DEM. REP. ZAR -1.31 0.18 11 -1.31 0.16 11 -1.51 0.17 10 -1.48 0.16 10 -1.44 0.16 10 -1.51 0.20 7 -1.53 0.22 7 -1.71 0.22 6 -1.81 0.24 6 -2.22 0.40 3COSTA RICA CRI 0.48 0.16 14 0.34 0.14 15 0.34 0.15 14 0.37 0.15 13 0.42 0.15 13 0.76 0.17 9 0.79 0.18 9 0.86 0.19 8 0.90 0.21 6 0.69 0.25 5COTE D'IVOIRE CIV -1.17 0.15 11 -1.10 0.15 9 -1.23 0.16 9 -1.29 0.18 8 -1.19 0.17 9 -1.01 0.19 7 -0.84 0.20 7 -0.51 0.22 6 -0.38 0.22 6 0.37 0.29 3CROATIA HRV 0.12 0.12 14 0.06 0.12 14 0.09 0.12 14 0.21 0.13 13 0.21 0.13 13 0.09 0.13 10 0.27 0.15 10 0.07 0.17 8 -0.28 0.18 7 -0.57 0.28 3CUBA CUB -0.06 0.17 8 -0.18 0.15 8 -0.25 0.17 8 -0.25 0.18 8 -0.28 0.18 8 -0.28 0.19 6 -0.12 0.20 6 -0.19 0.23 5 0.04 0.23 5 0.01 0.27 4CYPRUS CYP 1.04 0.20 8 0.89 0.20 7 0.88 0.19 7 0.77 0.18 6 0.82 0.19 6 1.03 0.20 5 0.96 0.21 5 0.86 0.23 5 0.89 0.23 5 1.63 0.27 4CZECH REPUBLIC CZE 0.37 0.12 15 0.28 0.11 15 0.36 0.12 14 0.48 0.12 12 0.40 0.12 13 0.43 0.13 11 0.36 0.14 11 0.30 0.15 10 0.49 0.15 9 0.63 0.21 6DENMARK DNK 2.32 0.17 10 2.39 0.15 10 2.35 0.16 10 2.19 0.15 9 2.32 0.15 9 2.27 0.17 8 2.21 0.18 7 2.12 0.19 7 2.18 0.19 7 2.29 0.21 6DJIBOUTI DJI -0.33 0.24 6 -0.48 0.25 4 -0.62 0.25 4 -0.69 0.26 4 -0.48 0.26 4 -0.83 0.28 3 -0.69 0.31 3 -0.89 0.30 3 -0.70 0.30 3 .. .. ..DOMINICA DMA 0.67 0.28 3 0.65 0.32 2 0.66 0.31 2 0.68 0.28 3 0.64 0.29 3 0.48 0.29 2 0.57 0.32 2 0.45 0.31 2 0.58 0.32 2 .. .. ..DOMINICAN REPUBLIC DOM -0.62 0.15 15 -0.67 0.13 15 -0.65 0.14 15 -0.70 0.15 13 -0.55 0.16 12 -0.53 0.17 8 -0.44 0.18 8 -0.39 0.21 6 -0.45 0.23 5 -0.40 0.29 3ECUADOR ECU -0.79 0.16 15 -0.91 0.14 16 -0.83 0.15 15 -0.84 0.15 14 -0.78 0.15 14 -0.81 0.17 9 -1.03 0.18 9 -0.90 0.19 8 -0.88 0.21 6 -0.85 0.27 4EGYPT EGY -0.67 0.15 14 -0.57 0.13 14 -0.52 0.14 14 -0.45 0.15 12 -0.46 0.15 12 -0.44 0.17 9 -0.33 0.17 9 -0.40 0.19 8 -0.28 0.18 8 0.11 0.25 5EL SALVADOR SLV -0.22 0.17 13 -0.11 0.15 12 -0.09 0.16 12 -0.24 0.16 11 -0.21 0.17 11 -0.24 0.18 8 -0.44 0.19 8 -0.33 0.21 7 -0.56 0.23 5 -0.69 0.27 4EQUATORIAL GUINEA GNQ -1.62 0.21 6 -1.38 0.17 6 -1.53 0.21 6 -1.56 0.21 5 -1.63 0.21 6 -1.50 0.21 5 -1.51 0.23 5 -1.64 0.25 4 -1.39 0.25 4 -1.06 0.35 1ERITREA ERI -0.38 0.19 8 -0.59 0.17 7 -0.31 0.19 8 -0.29 0.22 7 -0.25 0.21 7 -0.06 0.26 4 0.18 0.31 3 0.67 0.30 3 0.78 0.30 3 .. .. ..ESTONIA EST 0.94 0.12 14 0.98 0.11 14 0.95 0.12 14 0.98 0.12 13 1.00 0.12 13 0.85 0.13 11 0.73 0.14 11 0.66 0.15 10 0.45 0.18 7 -0.03 0.28 3ETHIOPIA ETH -0.66 0.15 12 -0.70 0.14 14 -0.65 0.14 14 -0.79 0.16 11 -0.72 0.17 10 -0.67 0.19 7 -0.50 0.21 6 -0.45 0.25 5 -0.55 0.24 5 -1.14 0.32 2FIJI FJI -0.31 0.27 4 -0.42 0.30 3 -0.33 0.29 3 -0.61 0.28 2 -0.08 0.30 2 -0.28 0.29 2 0.10 0.32 2 0.15 0.31 2 0.24 0.32 2 .. .. ..FINLAND FIN 2.34 0.17 10 2.58 0.15 10 2.56 0.16 10 2.38 0.15 9 2.43 0.15 9 2.41 0.17 8 2.45 0.17 8 2.32 0.19 7 2.24 0.19 7 2.29 0.21 6FRANCE FRA 1.43 0.15 12 1.31 0.14 12 1.46 0.14 11 1.39 0.15 9 1.42 0.15 9 1.43 0.17 8 1.30 0.17 8 1.43 0.19 7 1.47 0.19 7 1.41 0.21 6FRENCH GUIANA GUF 0.84 0.38 1 0.81 0.41 1 0.80 0.39 1 0.78 0.33 1 0.77 0.36 1 0.82 0.36 1 0.86 0.39 1 0.91 0.40 1 0.96 0.38 1 .. .. ..GABON GAB -1.07 0.16 11 -0.88 0.14 11 -0.91 0.16 11 -0.66 0.18 9 -0.68 0.17 9 -0.47 0.18 8 -0.49 0.19 8 -0.56 0.20 7 -0.76 0.22 6 -1.35 0.29 3GAMBIA GMB -0.78 0.19 8 -0.77 0.19 7 -0.70 0.18 7 -0.70 0.21 6 -0.60 0.22 6 -0.34 0.23 5 -0.49 0.28 4 -0.39 0.28 4 -0.54 0.29 4 0.37 0.69 1GEORGIA GEO -0.23 0.13 16 -0.32 0.12 16 -0.24 0.13 15 -0.40 0.14 12 -0.62 0.14 12 -0.96 0.15 8 -1.16 0.18 7 -0.93 0.19 6 -0.86 0.20 5 -1.26 0.44 2
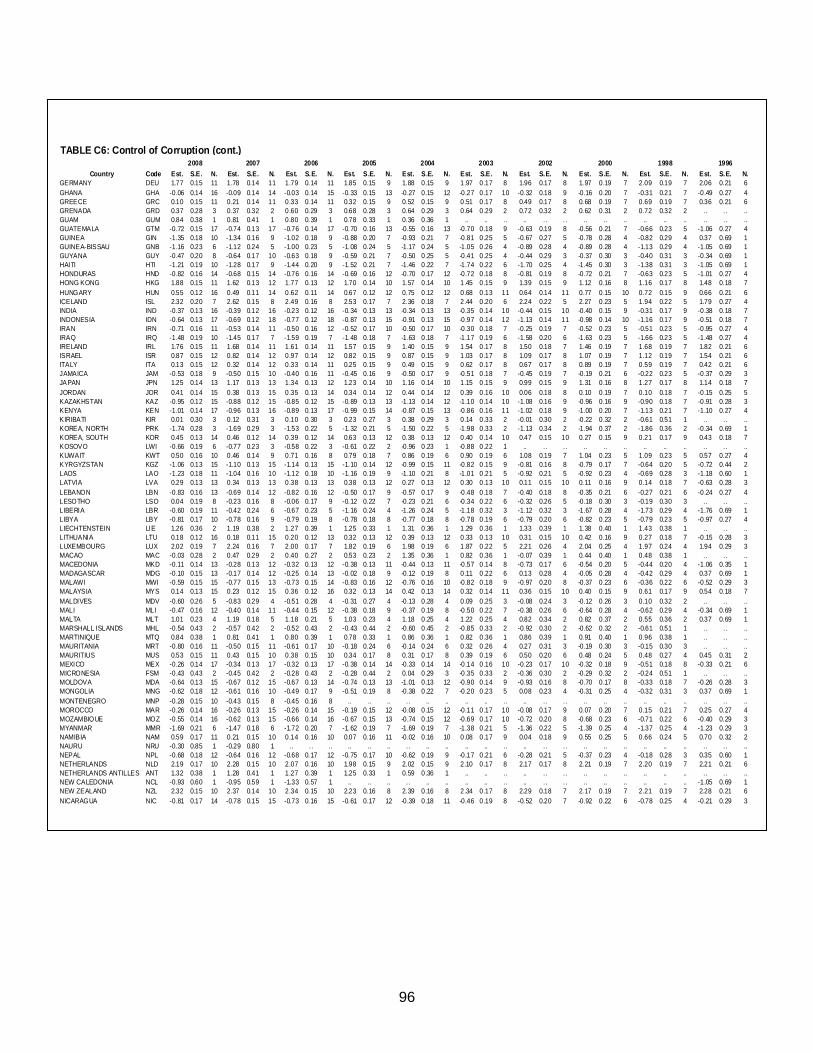
96
TABLE C6: Control of Corruption (cont.)
2008 2007 2006 2005 2004 2003 2002 2000 1998 1996Country Code Est. S.E. N. Est. S.E. N. Est. S.E. N. Est. S.E. N. Est. S.E. N. Est. S.E. N. Est. S.E. N. Est. S.E. N. Est. S.E. N. Est. S.E. N.
GERMANY DEU 1.77 0.15 11 1.78 0.14 11 1.79 0.14 11 1.85 0.15 9 1.88 0.15 9 1.97 0.17 8 1.96 0.17 8 1.97 0.19 7 2.09 0.19 7 2.06 0.21 6GHANA GHA -0.06 0.14 16 -0.09 0.14 14 -0.03 0.14 15 -0.33 0.15 13 -0.27 0.15 12 -0.27 0.17 10 -0.32 0.18 9 -0.16 0.20 7 -0.31 0.21 7 -0.49 0.27 4GREECE GRC 0.10 0.15 11 0.21 0.14 11 0.33 0.14 11 0.32 0.15 9 0.52 0.15 9 0.51 0.17 8 0.49 0.17 8 0.68 0.19 7 0.69 0.19 7 0.36 0.21 6GRENADA GRD 0.37 0.28 3 0.37 0.32 2 0.60 0.29 3 0.68 0.28 3 0.64 0.29 3 0.64 0.29 2 0.72 0.32 2 0.62 0.31 2 0.72 0.32 2 .. . . ..GUAM GUM 0.84 0.38 1 0.81 0.41 1 0.80 0.39 1 0.78 0.33 1 0.36 0.36 1 .. .. . . .. . . . . .. .. .. .. .. .. . . . . ..GUATEMALA GTM -0.72 0.15 17 -0.74 0.13 17 -0.76 0.14 17 -0.70 0.16 13 -0.55 0.16 13 -0.70 0.18 9 -0.63 0.19 8 -0.56 0.21 7 -0.66 0.23 5 -1.06 0.27 4GUINEA GIN -1.35 0.18 10 -1.34 0.16 9 -1.02 0.18 9 -0.88 0.20 7 -0.93 0.21 7 -0.81 0.25 5 -0.67 0.27 5 -0.78 0.28 4 -0.82 0.29 4 0.37 0.69 1GUINEA-BISSAU GNB -1.16 0.23 6 -1.12 0.24 5 -1.00 0.23 5 -1.08 0.24 5 -1.17 0.24 5 -1.05 0.26 4 -0.89 0.28 4 -0.89 0.28 4 -1.13 0.29 4 -1.05 0.69 1GUYANA GUY -0.47 0.20 8 -0.64 0.17 10 -0.63 0.18 9 -0.59 0.21 7 -0.50 0.25 5 -0.41 0.25 4 -0.44 0.29 3 -0.37 0.30 3 -0.40 0.31 3 -0.34 0.69 1HAITI HTI -1.21 0.19 10 -1.28 0.17 9 -1.44 0.20 9 -1.52 0.21 7 -1.46 0.22 7 -1.74 0.22 6 -1.70 0.25 4 -1.45 0.30 3 -1.38 0.31 3 -1.05 0.69 1HONDURAS HND -0.82 0.16 14 -0.68 0.15 14 -0.76 0.16 14 -0.69 0.16 12 -0.70 0.17 12 -0.72 0.18 8 -0.81 0.19 8 -0.72 0.21 7 -0.63 0.23 5 -1.01 0.27 4HONG KONG HKG 1.88 0.15 11 1.62 0.13 12 1.77 0.13 12 1.70 0.14 10 1.57 0.14 10 1.45 0.15 9 1.39 0.15 9 1.12 0.16 8 1.16 0.17 8 1.48 0.18 7HUNGARY HUN 0.55 0.12 16 0.49 0.11 14 0.62 0.11 14 0.67 0.12 12 0.75 0.12 12 0.68 0.13 11 0.64 0.14 11 0.77 0.15 10 0.72 0.15 9 0.66 0.21 6ICELAND ISL 2.32 0.20 7 2.62 0.15 8 2.49 0.16 8 2.53 0.17 7 2.36 0.18 7 2.44 0.20 6 2.24 0.22 5 2.27 0.23 5 1.94 0.22 5 1.79 0.27 4INDIA IND -0.37 0.13 16 -0.39 0.12 16 -0.23 0.12 16 -0.34 0.13 13 -0.34 0.13 13 -0.35 0.14 10 -0.44 0.15 10 -0.40 0.15 9 -0.31 0.17 9 -0.38 0.18 7INDONESIA IDN -0.64 0.13 17 -0.69 0.12 18 -0.77 0.12 18 -0.87 0.13 15 -0.91 0.13 15 -0.97 0.14 12 -1.13 0.14 11 -0.98 0.14 10 -1.16 0.17 9 -0.51 0.18 7IRAN IRN -0.71 0.16 11 -0.53 0.14 11 -0.50 0.16 12 -0.52 0.17 10 -0.50 0.17 10 -0.30 0.18 7 -0.25 0.19 7 -0.52 0.23 5 -0.51 0.23 5 -0.95 0.27 4IRAQ IRQ -1.48 0.19 10 -1.45 0.17 7 -1.59 0.19 7 -1.48 0.18 7 -1.63 0.18 7 -1.17 0.19 6 -1.58 0.20 6 -1.63 0.23 5 -1.66 0.23 5 -1.48 0.27 4IRELAND IRL 1.76 0.15 11 1.68 0.14 11 1.61 0.14 11 1.57 0.15 9 1.40 0.15 9 1.54 0.17 8 1.50 0.18 7 1.46 0.19 7 1.68 0.19 7 1.82 0.21 6ISRAEL ISR 0.87 0.15 12 0.82 0.14 12 0.97 0.14 12 0.82 0.15 9 0.87 0.15 9 1.03 0.17 8 1.09 0.17 8 1.07 0.19 7 1.12 0.19 7 1.54 0.21 6ITALY ITA 0.13 0.15 12 0.32 0.14 12 0.33 0.14 11 0.25 0.15 9 0.49 0.15 9 0.62 0.17 8 0.67 0.17 8 0.89 0.19 7 0.59 0.19 7 0.42 0.21 6JAMAICA JAM -0.53 0.18 9 -0.50 0.15 10 -0.40 0.16 11 -0.45 0.16 9 -0.50 0.17 9 -0.51 0.18 7 -0.45 0.19 7 -0.19 0.21 6 -0.22 0.23 5 -0.37 0.29 3JAPAN JPN 1.25 0.14 13 1.17 0.13 13 1.34 0.13 12 1.23 0.14 10 1.16 0.14 10 1.15 0.15 9 0.99 0.15 9 1.31 0.16 8 1.27 0.17 8 1.14 0.18 7JORDAN JOR 0.41 0.14 15 0.38 0.13 15 0.35 0.13 14 0.34 0.14 12 0.44 0.14 12 0.39 0.16 10 0.06 0.18 8 0.10 0.19 7 0.10 0.18 7 -0.15 0.25 5KAZAKHSTAN KAZ -0.95 0.12 15 -0.88 0.12 15 -0.85 0.12 15 -0.89 0.13 13 -1.13 0.14 12 -1.10 0.14 10 -1.08 0.16 9 -0.96 0.16 9 -0.90 0.18 7 -0.91 0.28 3KENYA KEN -1.01 0.14 17 -0.96 0.13 16 -0.89 0.13 17 -0.99 0.15 14 -0.87 0.15 13 -0.86 0.16 11 -1.02 0.18 9 -1.00 0.20 7 -1.13 0.21 7 -1.10 0.27 4KIRIBATI KIR 0.01 0.30 3 0.12 0.31 3 0.10 0.30 3 0.23 0.27 3 0.38 0.29 3 0.14 0.33 2 -0.01 0.30 2 -0.22 0.32 2 -0.61 0.51 1 .. . . ..KOREA, NORTH PRK -1.74 0.28 3 -1.69 0.29 3 -1.53 0.22 5 -1.32 0.21 5 -1.50 0.22 5 -1.98 0.33 2 -1.13 0.34 2 -1.94 0.37 2 -1.86 0.36 2 -0.34 0.69 1KOREA, SOUTH KOR 0.45 0.13 14 0.46 0.12 14 0.39 0.12 14 0.63 0.13 12 0.38 0.13 12 0.40 0.14 10 0.47 0.15 10 0.27 0.15 9 0.21 0.17 9 0.43 0.18 7KOSOVO LWI -0.66 0.19 6 -0.77 0.23 3 -0.58 0.22 3 -0.61 0.22 2 -0.96 0.23 1 -0.88 0.22 1 .. . . . . .. .. .. .. .. .. . . . . ..KUWAIT KWT 0.50 0.16 10 0.46 0.14 9 0.71 0.16 8 0.79 0.18 7 0.86 0.19 6 0.90 0.19 6 1.08 0.19 7 1.04 0.23 5 1.09 0.23 5 0.57 0.27 4KYRGYZSTAN KGZ -1.06 0.13 15 -1.10 0.13 15 -1.14 0.13 15 -1.10 0.14 12 -0.99 0.15 11 -0.82 0.15 9 -0.81 0.16 8 -0.79 0.17 7 -0.64 0.20 5 -0.72 0.44 2LAOS LAO -1.23 0.18 11 -1.04 0.16 10 -1.12 0.18 10 -1.16 0.19 9 -1.10 0.21 8 -1.01 0.21 5 -0.92 0.21 5 -0.92 0.23 4 -0.69 0.28 3 -1.18 0.60 1LATVIA LVA 0.29 0.13 13 0.34 0.13 13 0.38 0.13 13 0.38 0.13 12 0.27 0.13 12 0.30 0.13 10 0.11 0.15 10 0.11 0.16 9 0.14 0.18 7 -0.63 0.28 3LEBANON LBN -0.83 0.16 13 -0.69 0.14 12 -0.82 0.16 12 -0.50 0.17 9 -0.57 0.17 9 -0.48 0.18 7 -0.40 0.18 8 -0.35 0.21 6 -0.27 0.21 6 -0.24 0.27 4LESOTHO LSO 0.04 0.19 8 -0.23 0.16 8 -0.06 0.17 9 -0.12 0.22 7 -0.23 0.21 6 -0.34 0.22 6 -0.32 0.26 5 -0.18 0.30 3 -0.19 0.30 3 .. . . ..LIBERIA LBR -0.60 0.19 11 -0.42 0.24 6 -0.67 0.23 5 -1.16 0.24 4 -1.26 0.24 5 -1.18 0.32 3 -1.12 0.32 3 -1.67 0.28 4 -1.73 0.29 4 -1.76 0.69 1LIBYA LBY -0.81 0.17 10 -0.78 0.16 9 -0.79 0.19 8 -0.78 0.18 8 -0.77 0.18 8 -0.78 0.19 6 -0.79 0.20 6 -0.82 0.23 5 -0.79 0.23 5 -0.97 0.27 4LIECHTENSTEIN LIE 1.26 0.36 2 1.19 0.38 2 1.27 0.39 1 1.25 0.33 1 1.31 0.36 1 1.29 0.36 1 1.33 0.39 1 1.38 0.40 1 1.43 0.38 1 .. . . ..LITHUANIA LTU 0.18 0.12 16 0.18 0.11 15 0.20 0.12 13 0.32 0.13 12 0.39 0.13 12 0.33 0.13 10 0.31 0.15 10 0.42 0.16 9 0.27 0.18 7 -0.15 0.28 3LUXEMBOURG LUX 2.02 0.19 7 2.24 0.16 7 2.00 0.17 7 1.82 0.19 6 1.98 0.19 6 1.87 0.22 5 2.21 0.26 4 2.04 0.25 4 1.97 0.24 4 1.94 0.29 3MACAO MAC -0.03 0.28 2 0.47 0.29 2 0.40 0.27 2 0.53 0.23 2 1.35 0.36 1 0.82 0.36 1 -0.07 0.39 1 0.44 0.40 1 0.48 0.38 1 .. . . ..MACEDONIA MKD -0.11 0.14 13 -0.28 0.13 12 -0.32 0.13 12 -0.38 0.13 11 -0.44 0.13 11 -0.57 0.14 8 -0.73 0.17 6 -0.54 0.20 5 -0.44 0.20 4 -1.06 0.35 1MADAGASCAR MDG -0.10 0.15 13 -0.17 0.14 12 -0.25 0.14 13 -0.02 0.18 9 -0.12 0.19 8 0.11 0.22 6 0.13 0.28 4 -0.05 0.28 4 -0.42 0.29 4 0.37 0.69 1MALAWI MWI -0.59 0.15 15 -0.77 0.15 13 -0.73 0.15 14 -0.83 0.16 12 -0.76 0.16 10 -0.82 0.18 9 -0.97 0.20 8 -0.37 0.23 6 -0.36 0.22 6 -0.52 0.29 3MALAYSIA MYS 0.14 0.13 15 0.23 0.12 15 0.36 0.12 16 0.32 0.13 14 0.42 0.13 14 0.32 0.14 11 0.36 0.15 10 0.40 0.15 9 0.61 0.17 9 0.54 0.18 7MALDIVES MDV -0.60 0.26 5 -0.83 0.29 4 -0.51 0.28 4 -0.31 0.27 4 -0.13 0.28 4 0.09 0.25 3 -0.08 0.24 3 -0.12 0.26 3 0.10 0.32 2 .. . . ..MALI MLI -0.47 0.16 12 -0.40 0.14 11 -0.44 0.15 12 -0.38 0.18 9 -0.37 0.19 8 -0.50 0.22 7 -0.38 0.26 6 -0.64 0.28 4 -0.62 0.29 4 -0.34 0.69 1MALTA MLT 1.01 0.23 4 1.19 0.18 5 1.18 0.21 5 1.03 0.23 4 1.18 0.25 4 1.22 0.25 4 0.82 0.34 2 0.82 0.37 2 0.55 0.36 2 0.37 0.69 1MARSHALL ISLANDS MHL -0.54 0.43 2 -0.57 0.42 2 -0.52 0.43 2 -0.43 0.44 2 -0.60 0.45 2 -0.85 0.33 2 -0.92 0.30 2 -0.62 0.32 2 -0.61 0.51 1 .. . . ..MARTINIQUE MTQ 0.84 0.38 1 0.81 0.41 1 0.80 0.39 1 0.78 0.33 1 0.86 0.36 1 0.82 0.36 1 0.86 0.39 1 0.91 0.40 1 0.96 0.38 1 .. . . ..MAURITANIA MRT -0.80 0.16 11 -0.50 0.15 11 -0.61 0.17 10 -0.18 0.24 6 -0.14 0.24 6 0.32 0.26 4 0.27 0.31 3 -0.19 0.30 3 -0.15 0.30 3 .. . . ..MAURITIUS MUS 0.53 0.15 11 0.43 0.15 10 0.38 0.15 10 0.34 0.17 8 0.31 0.17 8 0.39 0.19 6 0.50 0.20 6 0.48 0.24 5 0.48 0.27 4 0.45 0.31 2MEXICO MEX -0.26 0.14 17 -0.34 0.13 17 -0.32 0.13 17 -0.38 0.14 14 -0.33 0.14 14 -0.14 0.16 10 -0.23 0.17 10 -0.32 0.18 9 -0.51 0.18 8 -0.33 0.21 6MICRONESIA FSM -0.43 0.43 2 -0.45 0.42 2 -0.28 0.43 2 -0.28 0.44 2 0.04 0.29 3 -0.35 0.33 2 -0.36 0.30 2 -0.29 0.32 2 -0.24 0.51 1 .. . . ..MOLDOVA MDA -0.64 0.13 15 -0.67 0.12 15 -0.67 0.13 14 -0.74 0.13 13 -1.01 0.13 12 -0.90 0.14 9 -0.93 0.16 8 -0.70 0.17 8 -0.33 0.18 7 -0.26 0.28 3MONGOLIA MNG -0.62 0.18 12 -0.61 0.16 10 -0.49 0.17 9 -0.51 0.19 8 -0.38 0.22 7 -0.20 0.23 5 0.08 0.23 4 -0.31 0.25 4 -0.32 0.31 3 0.37 0.69 1MONTENEGRO MNP -0.28 0.15 10 -0.43 0.15 8 -0.45 0.16 8 .. .. .. . . .. .. .. .. . . .. . . . . .. .. .. .. .. .. . . . . ..MOROCCO MAR -0.26 0.14 16 -0.26 0.13 15 -0.26 0.14 15 -0.19 0.15 12 -0.08 0.15 12 -0.11 0.17 10 -0.08 0.17 9 0.07 0.20 7 0.15 0.21 7 0.25 0.27 4MOZAMBIQUE MOZ -0.55 0.14 16 -0.62 0.13 15 -0.66 0.14 16 -0.67 0.15 13 -0.74 0.15 12 -0.69 0.17 10 -0.72 0.20 8 -0.68 0.23 6 -0.71 0.22 6 -0.40 0.29 3MYANMAR MMR -1.69 0.21 6 -1.47 0.18 6 -1.72 0.20 7 -1.62 0.19 7 -1.69 0.19 7 -1.38 0.21 5 -1.36 0.22 5 -1.39 0.25 4 -1.37 0.25 4 -1.23 0.29 3NAMIBIA NAM 0.59 0.17 11 0.21 0.15 10 0.14 0.16 10 0.07 0.16 11 -0.02 0.16 10 0.08 0.17 9 0.04 0.18 9 0.55 0.25 5 0.66 0.24 5 0.70 0.32 2NAURU NRU -0.30 0.85 1 -0.29 0.80 1 .. . . .. .. .. .. . . .. .. .. .. . . .. . . . . .. .. .. .. .. .. . . . . ..NEPAL NPL -0.68 0.18 12 -0.64 0.16 12 -0.68 0.17 12 -0.75 0.17 10 -0.62 0.19 9 -0.17 0.21 6 -0.28 0.21 5 -0.37 0.23 4 -0.18 0.28 3 0.35 0.60 1NETHERLANDS NLD 2.19 0.17 10 2.28 0.15 10 2.07 0.16 10 1.98 0.15 9 2.02 0.15 9 2.10 0.17 8 2.17 0.17 8 2.21 0.19 7 2.20 0.19 7 2.21 0.21 6NETHERLANDS ANTILLES ANT 1.32 0.38 1 1.28 0.41 1 1.27 0.39 1 1.25 0.33 1 0.59 0.36 1 .. .. . . .. . . . . .. .. .. .. .. .. . . . . ..NEW CALEDONIA NCL -0.93 0.60 1 -0.95 0.59 1 -1.33 0.57 1 .. .. .. . . .. .. .. .. . . .. . . . . .. .. .. .. .. .. -1.05 0.69 1NEW ZEALAND NZL 2.32 0.15 10 2.37 0.14 10 2.34 0.15 10 2.23 0.16 8 2.39 0.16 8 2.34 0.17 8 2.29 0.18 7 2.17 0.19 7 2.21 0.19 7 2.28 0.21 6NICARAGUA NIC -0.81 0.17 14 -0.78 0.15 15 -0.73 0.16 15 -0.61 0.17 12 -0.39 0.18 11 -0.46 0.19 8 -0.52 0.20 7 -0.92 0.22 6 -0.78 0.25 4 -0.21 0.29 3
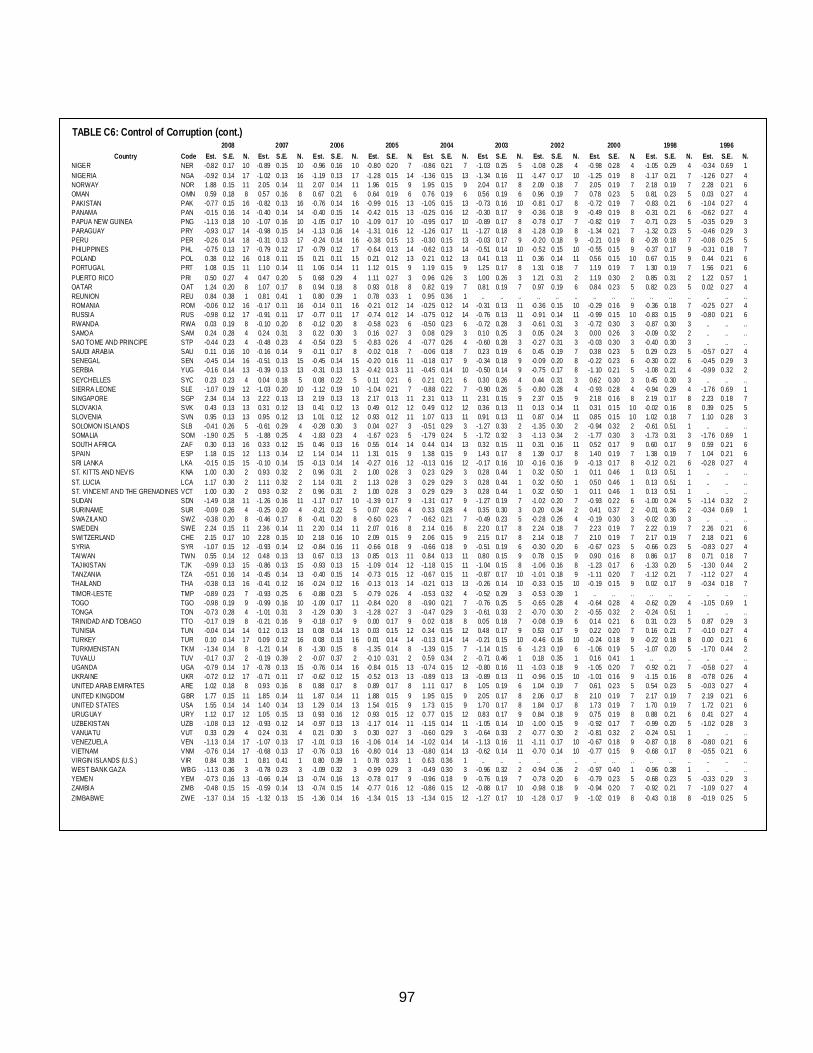
97
TABLE C6: Control of Corruption (cont.)2008 2007 2006 2005 2004 2003 2002 2000 1998 1996
Country Code Est. S.E. N. Est. S.E. N. Est. S.E. N. Est. S.E. N. Est. S.E. N. Est. S.E. N. Est. S.E. N. Est. S.E. N. Est. S.E. N. Est. S.E. N.NIGER NER -0.82 0.17 10 -0.89 0.15 10 -0.96 0.16 10 -0.80 0.20 7 -0.86 0.21 7 -1.03 0.25 5 -1.08 0.28 4 -0.98 0.28 4 -1.05 0.29 4 -0.34 0.69 1NIGERIA NGA -0.92 0.14 17 -1.02 0.13 16 -1.19 0.13 17 -1.28 0.15 14 -1.36 0.15 13 -1.34 0.16 11 -1.47 0.17 10 -1.25 0.19 8 -1.17 0.21 7 -1.26 0.27 4NORWAY NOR 1.88 0.15 11 2.05 0.14 11 2.07 0.14 11 1.96 0.15 9 1.95 0.15 9 2.04 0.17 8 2.09 0.18 7 2.05 0.19 7 2.18 0.19 7 2.28 0.21 6OMAN OMN 0.59 0.18 8 0.57 0.16 8 0.67 0.21 6 0.64 0.19 6 0.76 0.19 6 0.56 0.19 6 0.96 0.19 7 0.78 0.23 5 0.81 0.23 5 0.03 0.27 4PAKISTAN PAK -0.77 0.15 16 -0.82 0.13 16 -0.76 0.14 16 -0.99 0.15 13 -1.05 0.15 13 -0.73 0.16 10 -0.81 0.17 8 -0.72 0.19 7 -0.83 0.21 6 -1.04 0.27 4PANAMA PAN -0.15 0.16 14 -0.40 0.14 14 -0.40 0.15 14 -0.42 0.15 13 -0.25 0.16 12 -0.30 0.17 9 -0.36 0.18 9 -0.49 0.19 8 -0.31 0.21 6 -0.62 0.27 4PAPUA NEW GUINEA PNG -1.13 0.18 10 -1.07 0.16 10 -1.05 0.17 10 -1.09 0.17 10 -0.95 0.17 10 -0.89 0.17 8 -0.78 0.17 7 -0.82 0.19 7 -0.71 0.23 5 -0.35 0.29 3PARAGUAY PRY -0.93 0.17 14 -0.98 0.15 14 -1.13 0.16 14 -1.31 0.16 12 -1.26 0.17 11 -1.27 0.18 8 -1.28 0.19 8 -1.34 0.21 7 -1.32 0.23 5 -0.46 0.29 3PERU PER -0.26 0.14 18 -0.31 0.13 17 -0.24 0.14 16 -0.38 0.15 13 -0.30 0.15 13 -0.03 0.17 9 -0.20 0.18 9 -0.21 0.19 8 -0.28 0.18 7 -0.08 0.25 5PHILIPPINES PHL -0.75 0.13 17 -0.79 0.12 17 -0.79 0.12 17 -0.64 0.13 14 -0.62 0.13 14 -0.51 0.14 10 -0.52 0.15 10 -0.55 0.15 9 -0.37 0.17 9 -0.31 0.18 7POLAND POL 0.38 0.12 16 0.18 0.11 15 0.21 0.11 15 0.21 0.12 13 0.21 0.12 13 0.41 0.13 11 0.36 0.14 11 0.56 0.15 10 0.67 0.15 9 0.44 0.21 6PORTUGAL PRT 1.08 0.15 11 1.10 0.14 11 1.06 0.14 11 1.12 0.15 9 1.19 0.15 9 1.25 0.17 8 1.31 0.18 7 1.19 0.19 7 1.30 0.19 7 1.56 0.21 6PUERTO RICO PRI 0.50 0.27 4 0.47 0.20 5 0.68 0.29 4 1.11 0.27 3 0.96 0.26 3 1.00 0.26 3 1.21 0.31 2 1.19 0.30 2 0.85 0.31 2 1.22 0.57 1QATAR QAT 1.24 0.20 8 1.07 0.17 8 0.94 0.18 8 0.93 0.18 8 0.82 0.19 7 0.81 0.19 7 0.97 0.19 6 0.84 0.23 5 0.82 0.23 5 0.02 0.27 4REUNION REU 0.84 0.38 1 0.81 0.41 1 0.80 0.39 1 0.78 0.33 1 0.95 0.36 1 .. .. .. .. .. .. .. .. . . . . .. .. .. .. ..ROMANIA ROM -0.06 0.12 16 -0.17 0.11 16 -0.14 0.11 16 -0.21 0.12 14 -0.25 0.12 14 -0.31 0.13 11 -0.36 0.15 10 -0.29 0.16 9 -0.36 0.18 7 -0.25 0.27 4RUSSIA RUS -0.98 0.12 17 -0.91 0.11 17 -0.77 0.11 17 -0.74 0.12 14 -0.75 0.12 14 -0.76 0.13 11 -0.91 0.14 11 -0.99 0.15 10 -0.83 0.15 9 -0.80 0.21 6RWANDA RWA 0.03 0.19 8 -0.10 0.20 8 -0.12 0.20 8 -0.58 0.23 6 -0.50 0.23 6 -0.72 0.28 3 -0.61 0.31 3 -0.72 0.30 3 -0.87 0.30 3 .. .. ..SAMOA SAM 0.24 0.28 4 0.24 0.31 3 0.22 0.30 3 0.16 0.27 3 0.08 0.29 3 0.10 0.25 3 0.05 0.24 3 0.00 0.26 3 -0.09 0.32 2 .. .. ..SAO TOME AND PRINCIPE STP -0.44 0.23 4 -0.48 0.23 4 -0.54 0.23 5 -0.83 0.26 4 -0.77 0.26 4 -0.60 0.28 3 -0.27 0.31 3 -0.03 0.30 3 -0.40 0.30 3 .. .. ..SAUDI ARABIA SAU 0.11 0.16 10 -0.16 0.14 9 -0.11 0.17 8 -0.02 0.18 7 -0.06 0.18 7 0.23 0.19 6 0.45 0.19 7 0.38 0.23 5 0.29 0.23 5 -0.57 0.27 4SENEGAL SEN -0.45 0.14 16 -0.51 0.13 15 -0.45 0.14 15 -0.20 0.16 11 -0.18 0.17 9 -0.34 0.18 9 -0.09 0.20 8 -0.22 0.23 6 -0.30 0.22 6 -0.45 0.29 3SERBIA YUG -0.16 0.14 13 -0.39 0.13 13 -0.31 0.13 13 -0.42 0.13 11 -0.45 0.14 10 -0.50 0.14 9 -0.75 0.17 8 -1.10 0.21 5 -1.08 0.21 4 -0.99 0.32 2SEYCHELLES SYC 0.23 0.23 4 0.04 0.18 5 0.08 0.22 5 0.11 0.21 6 0.21 0.21 6 0.30 0.26 4 0.44 0.31 3 0.62 0.30 3 0.45 0.30 3 .. .. ..SIERRA LEONE SLE -1.07 0.19 12 -1.03 0.20 10 -1.12 0.19 10 -1.04 0.21 7 -0.88 0.22 7 -0.90 0.26 5 -0.80 0.28 4 -0.93 0.28 4 -0.94 0.29 4 -1.76 0.69 1SINGAPORE SGP 2.34 0.14 13 2.22 0.13 13 2.19 0.13 13 2.17 0.13 11 2.31 0.13 11 2.31 0.15 9 2.37 0.15 9 2.18 0.16 8 2.19 0.17 8 2.23 0.18 7SLOVAKIA SVK 0.43 0.13 13 0.31 0.12 13 0.41 0.12 13 0.49 0.12 12 0.49 0.12 12 0.36 0.13 11 0.13 0.14 11 0.31 0.15 10 -0.02 0.16 8 0.39 0.25 5SLOVENIA SVN 0.95 0.13 13 0.95 0.12 13 1.01 0.12 12 0.93 0.12 11 1.07 0.13 11 0.91 0.13 11 0.87 0.14 11 0.85 0.15 10 1.02 0.18 7 1.10 0.28 3SOLOMON ISLANDS SLB -0.41 0.26 5 -0.61 0.29 4 -0.28 0.30 3 0.04 0.27 3 -0.51 0.29 3 -1.27 0.33 2 -1.35 0.30 2 -0.94 0.32 2 -0.61 0.51 1 .. .. ..SOMALIA SOM -1.90 0.25 5 -1.88 0.25 4 -1.83 0.23 4 -1.67 0.23 5 -1.79 0.24 5 -1.72 0.32 3 -1.13 0.34 2 -1.77 0.30 3 -1.73 0.31 3 -1.76 0.69 1SOUTH AFRICA ZAF 0.30 0.13 16 0.33 0.12 15 0.46 0.13 16 0.55 0.14 14 0.44 0.14 13 0.32 0.15 11 0.31 0.16 11 0.52 0.17 9 0.60 0.17 9 0.59 0.21 6SPAIN ESP 1.18 0.15 12 1.13 0.14 12 1.14 0.14 11 1.31 0.15 9 1.38 0.15 9 1.43 0.17 8 1.39 0.17 8 1.40 0.19 7 1.38 0.19 7 1.04 0.21 6SRI LANKA LKA -0.15 0.15 15 -0.10 0.14 15 -0.13 0.14 14 -0.27 0.16 12 -0.13 0.16 12 -0.17 0.16 10 -0.16 0.16 9 -0.13 0.17 8 -0.12 0.21 6 -0.28 0.27 4ST. KITTS AND NEVIS KNA 1.00 0.30 2 0.93 0.32 2 0.96 0.31 2 1.00 0.28 3 0.23 0.29 3 0.28 0.44 1 0.32 0.50 1 0.11 0.46 1 0.13 0.51 1 .. .. ..ST. LUCIA LCA 1.17 0.30 2 1.11 0.32 2 1.14 0.31 2 1.13 0.28 3 0.29 0.29 3 0.28 0.44 1 0.32 0.50 1 0.50 0.46 1 0.13 0.51 1 .. .. ..ST. VINCENT AND THE GRENADINES VCT 1.00 0.30 2 0.93 0.32 2 0.96 0.31 2 1.00 0.28 3 0.29 0.29 3 0.28 0.44 1 0.32 0.50 1 0.11 0.46 1 0.13 0.51 1 .. .. ..SUDAN SDN -1.49 0.18 11 -1.26 0.16 11 -1.17 0.17 10 -1.39 0.17 9 -1.31 0.17 9 -1.27 0.19 7 -1.02 0.20 7 -0.93 0.22 6 -1.00 0.24 5 -1.14 0.32 2SURINAME SUR -0.09 0.26 4 -0.25 0.20 4 -0.21 0.22 5 0.07 0.26 4 0.33 0.28 4 0.35 0.30 3 0.20 0.34 2 0.41 0.37 2 -0.01 0.36 2 -0.34 0.69 1SWAZILAND SWZ -0.38 0.20 8 -0.46 0.17 8 -0.41 0.20 8 -0.60 0.23 7 -0.62 0.21 7 -0.49 0.23 5 -0.28 0.26 4 -0.19 0.30 3 -0.02 0.30 3 .. .. ..SWEDEN SWE 2.24 0.15 11 2.36 0.14 11 2.20 0.14 11 2.07 0.16 8 2.14 0.16 8 2.20 0.17 8 2.24 0.18 7 2.23 0.19 7 2.22 0.19 7 2.26 0.21 6SWITZERLAND CHE 2.15 0.17 10 2.28 0.15 10 2.18 0.16 10 2.09 0.15 9 2.06 0.15 9 2.15 0.17 8 2.14 0.18 7 2.10 0.19 7 2.17 0.19 7 2.18 0.21 6SYRIA SYR -1.07 0.15 12 -0.93 0.14 12 -0.84 0.16 11 -0.66 0.18 9 -0.66 0.18 9 -0.51 0.19 6 -0.30 0.20 6 -0.67 0.23 5 -0.66 0.23 5 -0.83 0.27 4TAIWAN TWN 0.55 0.14 12 0.48 0.13 13 0.67 0.13 13 0.85 0.13 11 0.84 0.13 11 0.80 0.15 9 0.78 0.15 9 0.90 0.16 8 0.86 0.17 8 0.71 0.18 7TAJIKISTAN TJK -0.99 0.13 15 -0.86 0.13 15 -0.93 0.13 15 -1.09 0.14 12 -1.18 0.15 11 -1.04 0.15 8 -1.06 0.16 8 -1.23 0.17 6 -1.33 0.20 5 -1.30 0.44 2TANZANIA TZA -0.51 0.16 14 -0.45 0.14 13 -0.40 0.15 14 -0.73 0.15 12 -0.67 0.15 11 -0.87 0.17 10 -1.01 0.18 9 -1.11 0.20 7 -1.12 0.21 7 -1.12 0.27 4THAILAND THA -0.38 0.13 16 -0.41 0.12 16 -0.24 0.12 16 -0.13 0.13 14 -0.21 0.13 13 -0.26 0.14 10 -0.33 0.15 10 -0.19 0.15 9 0.02 0.17 9 -0.34 0.18 7TIMOR-LESTE TMP -0.89 0.23 7 -0.93 0.25 6 -0.88 0.23 5 -0.79 0.26 4 -0.53 0.32 4 -0.52 0.29 3 -0.53 0.39 1 .. .. . . . . .. .. .. .. ..TOGO TGO -0.98 0.19 9 -0.99 0.16 10 -1.09 0.17 11 -0.84 0.20 8 -0.90 0.21 7 -0.76 0.25 5 -0.65 0.28 4 -0.64 0.28 4 -0.62 0.29 4 -1.05 0.69 1TONGA TON -0.73 0.28 4 -1.01 0.31 3 -1.29 0.30 3 -1.28 0.27 3 -0.47 0.29 3 -0.61 0.33 2 -0.70 0.30 2 -0.55 0.32 2 -0.24 0.51 1 .. .. ..TRINIDAD AND TOBAGO TTO -0.17 0.19 8 -0.21 0.16 9 -0.18 0.17 9 0.00 0.17 9 0.02 0.18 8 0.05 0.18 7 -0.08 0.19 6 0.14 0.21 6 0.31 0.23 5 0.87 0.29 3TUNISIA TUN -0.04 0.14 14 0.12 0.13 13 0.08 0.14 13 0.03 0.15 12 0.34 0.15 12 0.48 0.17 9 0.53 0.17 9 0.22 0.20 7 0.16 0.21 7 -0.10 0.27 4TURKEY TUR 0.10 0.14 17 0.09 0.12 16 0.08 0.13 16 0.01 0.14 14 -0.13 0.14 14 -0.21 0.15 10 -0.46 0.16 10 -0.24 0.18 9 -0.22 0.18 8 0.00 0.21 6TURKMENISTAN TKM -1.34 0.14 8 -1.21 0.14 8 -1.30 0.15 8 -1.35 0.14 8 -1.39 0.15 7 -1.14 0.15 6 -1.23 0.19 6 -1.06 0.19 5 -1.07 0.20 5 -1.70 0.44 2TUVALU TUV -0.17 0.37 2 -0.19 0.39 2 -0.07 0.37 2 -0.10 0.31 2 0.59 0.34 2 -0.71 0.46 1 0.18 0.35 1 0.16 0.41 1 .. .. .. .. .. ..UGANDA UGA -0.79 0.14 17 -0.78 0.13 15 -0.76 0.14 16 -0.84 0.15 13 -0.74 0.15 12 -0.80 0.16 11 -1.03 0.18 9 -1.05 0.20 7 -0.92 0.21 7 -0.58 0.27 4UKRAINE UKR -0.72 0.12 17 -0.71 0.11 17 -0.62 0.12 15 -0.52 0.13 13 -0.89 0.13 13 -0.89 0.13 11 -0.96 0.15 10 -1.01 0.16 9 -1.15 0.16 8 -0.78 0.26 4UNITED ARAB EMIRATES ARE 1.02 0.18 8 0.93 0.16 8 0.88 0.17 8 0.89 0.17 8 1.11 0.17 8 1.05 0.19 6 1.04 0.19 7 0.61 0.23 5 0.54 0.23 5 -0.03 0.27 4UNITED KINGDOM GBR 1.77 0.15 11 1.85 0.14 11 1.87 0.14 11 1.88 0.15 9 1.95 0.15 9 2.05 0.17 8 2.06 0.17 8 2.10 0.19 7 2.17 0.19 7 2.19 0.21 6UNITED STATES USA 1.55 0.14 14 1.40 0.14 13 1.29 0.14 13 1.54 0.15 9 1.73 0.15 9 1.70 0.17 8 1.84 0.17 8 1.73 0.19 7 1.70 0.19 7 1.72 0.21 6URUGUAY URY 1.12 0.17 12 1.05 0.15 13 0.93 0.16 12 0.93 0.15 12 0.77 0.15 12 0.83 0.17 9 0.84 0.18 9 0.75 0.19 8 0.88 0.21 6 0.41 0.27 4UZBEKISTAN UZB -1.08 0.13 12 -0.93 0.12 14 -0.97 0.13 13 -1.17 0.14 11 -1.15 0.14 11 -1.05 0.14 10 -1.00 0.15 9 -0.92 0.17 7 -0.99 0.20 5 -1.02 0.28 3VANUATU VUT 0.33 0.29 4 0.24 0.31 4 0.21 0.30 3 0.30 0.27 3 -0.60 0.29 3 -0.64 0.33 2 -0.77 0.30 2 -0.81 0.32 2 -0.24 0.51 1 .. .. ..VENEZUELA VEN -1.13 0.14 17 -1.07 0.13 17 -1.01 0.13 16 -1.06 0.14 14 -1.02 0.14 14 -1.13 0.16 11 -1.11 0.17 10 -0.67 0.18 9 -0.87 0.18 8 -0.80 0.21 6VIETNAM VNM -0.76 0.14 17 -0.68 0.13 17 -0.76 0.13 16 -0.80 0.14 13 -0.80 0.14 13 -0.62 0.14 11 -0.70 0.14 10 -0.77 0.15 9 -0.68 0.17 8 -0.55 0.21 6VIRGIN ISLANDS (U.S.) VIR 0.84 0.38 1 0.81 0.41 1 0.80 0.39 1 0.78 0.33 1 0.63 0.36 1 .. .. .. .. .. .. .. .. . . . . .. .. .. .. ..WEST BANK GAZA WBG -1.13 0.36 3 -0.78 0.23 3 -1.09 0.32 3 -0.99 0.29 3 -0.49 0.30 3 -0.96 0.32 2 -0.94 0.36 2 -0.97 0.40 1 -0.96 0.38 1 .. .. ..YEMEN YEM -0.73 0.16 13 -0.66 0.14 13 -0.74 0.16 13 -0.78 0.17 9 -0.96 0.18 9 -0.76 0.19 7 -0.78 0.20 6 -0.79 0.23 5 -0.68 0.23 5 -0.33 0.29 3ZAMBIA ZMB -0.48 0.15 15 -0.59 0.14 13 -0.74 0.15 14 -0.77 0.16 12 -0.86 0.15 12 -0.88 0.17 10 -0.98 0.18 9 -0.94 0.20 7 -0.92 0.21 7 -1.09 0.27 4ZIMBABWE ZWE -1.37 0.14 15 -1.32 0.13 15 -1.36 0.14 16 -1.34 0.15 13 -1.34 0.15 12 -1.27 0.17 10 -1.28 0.17 9 -1.02 0.19 8 -0.43 0.18 8 -0.19 0.25 5
98
Appendix D: Technical Details on the Construction of the WGI This appendix summarizes all of the relevant technical information regarding the construction of the Worldwide Governance Indicators (WGI). All of the technical details provided here can be found in various papers in the "Governance Matters" series (Kaufmann, Kraay and Zoido-Lobatón (1999a, 1999b and 2002) and Kaufmann, Kraay and Mastruzzi (2004, 2005, 2006 and 2007). The first section explains the Unobserved Components Model that provides the statistical basis for the WGI. The second section explains in detail two types of rescaling applied to the aggregate WGI. D1. The Unobserved Components Model (UCM) This section deals with the specification and estimation of the unobserved components model on which the WGI are based. The basic premise of the UCM is simple: each of our observed underlying data sources provides a noisy or imperfect signal of the true, but unobserved, level of governance in a country. The UCM provides a framework for extracting a minimum-variance estimate of governance from the observed data. Specification of the UCM Let gj denote the unobserved true level of a particular dimension of governance in country j, for example, Control of Corruption. The observed data on corruption consists of a cluster of k=1,...,K indicators, each one providing a numerical rating of some aspect of corruption in each of the j=1,..,Jk countries covered by that indicator. Note that each indicator might cover a different number of countries, hence Jk depends on the indicator k. Note also that each country j might appear in a different set of indicators, and let Kj denote the set of indicator in which country j appears. To conserve on notation we will also let Kj denote the number of indicators available for country j. Finally note that we are suppressing time subscripts here to keep notation simple. Let yjk denote the score of country j on indicator k. We assume that we can write the observed score as a linear function of unobserved governance, gj, and an error term, εjk, as follows: (1) ( )jkjkkjk gy ε+⋅β+α= where αk and βk are unknown parameters which map unobserved governance gj into the observed data yjk. As a choice of units, we assume that g(j) is a normal random variable with mean zero and variance one. We assume that the error term is also normally distributed with mean zero and standard deviation σk which varies across data sources k. We also assume that the error term is uncorrelated across data sources.16
The parameters of the unobserved components model, αk, βk and σk have very straightforward interpretations. Since the mean of unobserved governance and the error term are by assumption both zero, the parameter αk simply captures the mean of the
16 This is a strong assumption, but one that is necessary for identification. See Kaufmann, Kraay, and Zoido-Lobaton (1999a) and Kaufmann, Kraay, and Mastruzzi (2006) for detailed discussion of the validity of this assumption and the consequences of relaxing it.
99
observed data from indicator k. The parameter βk captures the slope of the relationship between true but unobserved governance and the observed data in indicator k. Since unobserved governance has a standard deviation of one, βk is the increase in the observed data associated with a one standard deviation improvement in unobserved true governance. Finally, the standard deviation of the error term, σk captures how informative the observed indicator of governance is about true governance. If σk is large (small), the observed data provides a very imprecise (precise) signal of true governance. The Conditional Distribution of Governance The assumptions of the UCM detailed above allow us to summarize our knowledge about the unobserved level of governance in each country by calculating the distribution of unobserved governance conditional on the observed data for each country. Let ( )
jjK1jj y,...,yy = denote the observed data for country j from each of the Kj data sources in which it appears. Since we have assumed that unobserved governance gj and the error terms εjk are jointly normally distributed, this implies that the joint distribution of the observed data, yj, and unobserved governance, gj, is also normal. This in turn means that the distribution of governance conditional on the observed data for each country will also be normal. Our estimate of governance for each country will simply be the mean of this conditional distribution, and the precision of this estimate will be the standard deviation of this conditional distribution. Applying standard results for the multivariate normal distribution, the conditional distribution of gj given the observed data yj is normal, with the following mean and variance:
(2) [ ] ∑∈
β
α−⋅=
jKk k
kjkjkjj
ywy|gE
(3) [ ]1
Kk
2kjj
j
1y|gV−
∈
−
σ+= ∑
In particular, the mean of governance conditional on the data available for country j, that we use as our estimate of governance, is just a weighted average of the standardized scores from each data source. The weights applied to each data source are inversely
proportional to the precision of each data source, i.e. 1
K'k
2'k
2kk
j
1w−
∈
−−
σ+⋅σ= ∑ . In other
words, data sources that provide a more precise signal of governance receive a greater weight in the conditional mean, and hence in our estimate of governance. The variance of the conditional distribution summarizes how reliable or precise is this estimate of governance. This variance is smaller the larger is the number of data sources available for each country, and the more precise are each of those data sources. We refer to the expression in Equation (2) as the "governance estimate" for each country, and the square root of the variance in Equation (3) as the "standard error" of the
100
estimate of governance for each country. We can also use these expressions to form confidence intervals for governance, that we sometimes also informally refer to as "margins of error". In particular, given our assumptions there is a 90 percent probability that the true level of governance falls in a range of +/- 1.64 x SD(gj|yj) around the estimate of governance.17
( )′αα=αjK1,...,
Estimating the Parameters of the UCM In order to implement (2) and (3), we need to first estimate the unknown parameters αk, βk and σk for every indicator k. This in turn requires us to distinguish between "representative" and "non-representative" indicators, which we treat differently in the estimation process. Representative indicators are indicators that cover a set of countries in which the distribution of governance is likely to be similar to that in the world as a whole. Practically these include all of our indicators with large cross-country coverage of developed and developing indicators. In contrast non-representative indicators cover either specific regions (for example the BEEPS survey of transition economies or the Latinobarometer survey of Latin American countries), or particular income levels (for example the World Bank CPIA ratings that cover only developing countries). Our classification of "representative" and "non-representative" indicators is given in Table 1 of this paper. For the set of representative indicators, we use the assumption of normality of gj and εjk to write down the likelihood function of the observed data. The assumption of representativeness is crucial here because it justifies our assumption of a common distribution of governance across these different sources. As useful notation, let
, ( )′ββ=βjK1,..., , ( )′σσ=σ 2
K21
2j
,..., and let B and Σ be diagonal matrices
with β and σ2 on the diagonal. Using this notation, the mean of yj is α and the variance of yj is 'BB' Σ+ββ≡Ω . The contribution to the log-likelihood of country j therefore given by: (4) )y()'y(||ln)y;,,(Lln j
1jj α−Ωα−+Ω∝σβα −
Summing these over all countries j and then maximizing over the unknown parameters delivers our maximum-likelihood estimates of αk, βk and σk for every representative indicator k. Identification requires that we have a minimum of three representative indicators. Note that the number of data sources available for each country varies, and so the dimension of yj and α is Kjx1, and conformably Ω is KjxKj. This way we are able to compile the likelihood function even though there potentially are missing observations for each country even among the representative indicators.
We cannot apply this method to non-representative indicators. To see why, consider the maximum-likelihood estimate of αk, which unsurprisingly is the mean score across countries on indicator k. It is straightforward to see from Equation (1) that the expected value of the sample mean of scores on indicator k is kkk g⋅β+α , where kg denotes the average level of governance in the sample of countries covered by indicator
17 See Kaufmann, Kraay and Zoido-Lobatón (1999a) for the Bayesian interpretation of these expressions.
101
k. For representative indicators, our choice of units for governance normalizes 0gk = , and so the sample mean delivers a consistent estimate of αk. However, for a non-representative indicator where the average level of governance is different from the world as a whole, 0gk ≠ and the sample mean does not provide a consistent estimate of αk.
We can nevertheless obtain consistent estimates of the unknown parameters of
the non-representative indicators by using the following simple argument. If gj were observable, we could estimate αk, βk and σk for any indicator by regressing the observed scores yjk on gj. Although gj is itself not observable, we do have an estimate of gj based on the representative indicators. In particular, let g*j denote this preliminary estimate of gj based on only on the data from the representative indicators. We can decompose this conditional mean into observed governance plus its deviation from the mean, i.e. g*j=gj+uj. Since uj is independent of gj, we can view g*j as measuring gj with classical measurement error. It is well-known that OLS estimates of βk from a regression of yjk on g*j will produce downward-biased estimates due to the usual attenuation bias. In
particular, the probability limit of the OLS slope coefficient is
−⋅β
]*g[V]u[V
1j
jk . Since
the variance of uj is simply the variance of the conditional mean of gj given in Equation (3), and since V[g*j] is observable, we can correct the OLS coefficients for this attenuation bias to arrive at consistent estimates of the parameters of the non-representative indicators.
Finally, we collect all of the parameter estimates from the representative and
non-representative surveys, and insert them into the expressions in Equations (2) and (3) to arrive at estimates of governance and standard errors for each country. As discussed in the next section, there are two further rescaling steps before we arrive at the final estimates that we report.
D2. Rescaling the Aggregate Governance Indicators We next perform two rescalings of the aggregate indicators obtained using the procedure described above. We first rescale the data to set the mean of the governance estimates to zero, and their standard deviation to one. The estimates of governance obtained from the UCM theoretically have a mean of zero, and a standard deviation slighly less than one. In any particular sample, however, the mean could be different. To avoid confusion in interpreting the data, we begin by setting the mean of the governance estimates for each indicator and year to zero, and the standard deviation to one. In particular, for each indicator and year, we subtract the sample mean (across countries) from each country, and divide by the sample standard deviation (across countries). We then also divide the standard errors of the governance estimates for each country by the sample standard deviation of the governance estimates. This first rescaling is just a renormalization of the scores, and of course has no impact on countries' relative positions on the governance indicators. It is also consistent with our choice of units for governance noted above, and notably that it has a mean of zero and a standard deviation of one in each period. If there were trends in global averages of governance over time, this choice of units would not be appropriate.
102
However, as we have documented in Kaufmann, Kraay and Mastruzzi (2004, 2005, 2006, 2007, and 2008) and in this paper, we do not find strong evidence of significant trends in world averages of governance in our underlying indicators. We therefore think this choice of units is appropriate. Moreover, absent any changes in global averages of governance, changes over time in countries' relative positions on the WGI can also be interpreted as changes in their absolute governance scores. The second rescaling is substantively more interesting, and addresses the fact that the sample of countries covered by our governance indicators has expanded since 1996, and quite considerably for some of our indicators. If the new countries added each year were broadly representative of the worldwide distribution of governance, this too would pose no special difficulties. However, for some of our indicators, we find that countries added in later years score on average somewhat higher than countries that were continuously in the sample. This in turn means that it would be inappropriate to impose a global average governance score of zero in earlier periods for the smaller set of countries for which data is available in the earlier periods, since our earlier estimates did not include the better-than-average performers added later. It also means that some countries in our aggregate indicators in the earlier years would have showed small declines in some dimensions of governance over time that were driven by the addition of better-performing countries in later years. We address this issue with a second simple re-scaling of the aggregate governance indicators. We take the most recent year of our indicators as a benchmark. In particular, the 2006 indicators cover between 206 and 212 countries, which we can think of as representative of the world as a whole. Consistent with our choice of units for governance, the estimates for 2006 have zero mean and standard deviation of one across countries due to the first standardization noted above. We next consider the countries that were added in 2006 relative to 2005. We then adjust the world-wide average score in 2005 so that it would have a mean of zero had we included the 2006 scores for those countries added in 2006 relative to 2005.18
18 The adjustment factor for the mean is simply
We then continue backwards in time in the same way to adjust the data for each previous year back to 1996. In particular, to arrive at the final score reported for each country, we need to subtract the adjusted mean and divide by the adjusted standard deviation. The standard error of the governance estimate also needs to be divided by the indicated adjusted standard deviation.
( ) 1T1TTT N/NNy −−−⋅− where NT is the number of
countries with data in period T and Ty is the average score of the additional countries in period T. The higher is the average score of the new entrants and/or the more new entrants there are, the more we lower the mean in the previous period. This ensures that a hypothetical sample consisting of our year T-1 adjusted scores for all countries combined with the year T scores for the countries added in year T relative to T-1 would have a mean of zero and standard deviation of one. We also adjust the standard deviation of the year T scores to ensure that the standard deviation of this hypothetical sample would be one. We do this by multiplying the scores (and the standard errors) for each country in year T-1 by a factor of
( )( ) 2
1T
2
TT1TTT1TT yyVN/NNN/N −−−− −
+−− , where VT is the variance across countries in our
estimates of governance in year T for the new entrants to the sample in period T. The greater is the dispersion in the scores of new entrants, the more we need to reduce the dispersion of scores in the previous years.
103
Four points are worth noting about this adjustment.
• Since we adjust the scores for all countries in a given year and indicator by the same amount, this adjustment also has no effect on the relative positions of countries on that indicator in that year. It does however make countries' scores more comparable over time, since the adjustment is designed to remove the effect of adding new countries on the scores of countries already in the sample.
• As a consequence of this adjustment, global averages of the adjusted data show moderate trends over-time, mostly improvements as the countries added over time typically have slightly better scores than those countries continuously in the sample. It is important to remember though that this improvement does not reflect an average improvement for all countries in the world. Rather it reflects the changing composition of our sample since the new entrants during this period have had above-average performance in this dimension of governance. As noted above there is no evidence of any significant improvement in the world average for the country sample that has been consistently covered over time.
• This rescaling of the aggregate indicators is perfectly consistent with the unobserved components model that we use to construct the aggregate indicators in each period. In particular, rescaling the mean and standard deviation of the aggregate indicators in the way that we do is equivalent to imposing slightly different means and standard deviations of governance as a choice of units in each of the periods. And as we have argued this changing choice of units is an appropriate way to correct for changes in the composition of countries covered by the indicators over time.
• Finally, for some purposes it is useful to look just at countries' percentile ranks rather than their scores on our governance indicators. Without similar adjustments these percentile ranks too would not be fully comparable over-time as they too would be influenced by new entrants. Thus, we also perform such adjustment to the percentile ranks, and when we report countries' scores in the form of percentile ranks on our website, we compute the percentile ranks based on a sample consisting of the actual data we have for that indicator and year, combined with imputed data from the nearest year as described above.


![Visual storytelling [storytelling matters]](https://static.fdocuments.nl/doc/165x107/54b865614a795970478b4802/visual-storytelling-storytelling-matters.jpg)