ERASMUS UNIVERSITEIT ROTTERDAM NADRUK VERBODEN … · Master Thesis Fiscal Economics N van Duurling...
57
ERASMUS UNIVERSITEIT ROTTERDAM NADRUK VERBODEN Erasmus School of Economics (ESE) Fiscaal Economisch Instituut (FEI) Gas stations and tax reforms in the Netherlands – analyzing border effects Date: 7/15/2015 Student name: Nikie van Duurling Student number: 329366 Supervisor: H. Vrijburg
Transcript of ERASMUS UNIVERSITEIT ROTTERDAM NADRUK VERBODEN … · Master Thesis Fiscal Economics N van Duurling...
ERASMUS UNIVERSITEIT ROTTERDAM NADRUK VERBODEN
Erasmus School of Economics (ESE)
Fiscaal Economisch Instituut (FEI)
Gas stations and tax reforms in the Netherlands – analyzing border effects
Date: 7/15/2015
Student name: Nikie van Duurling
Student number: 329366
Supervisor: H. Vrijburg
Master Thesis Fiscal Economics N van Duurling
2
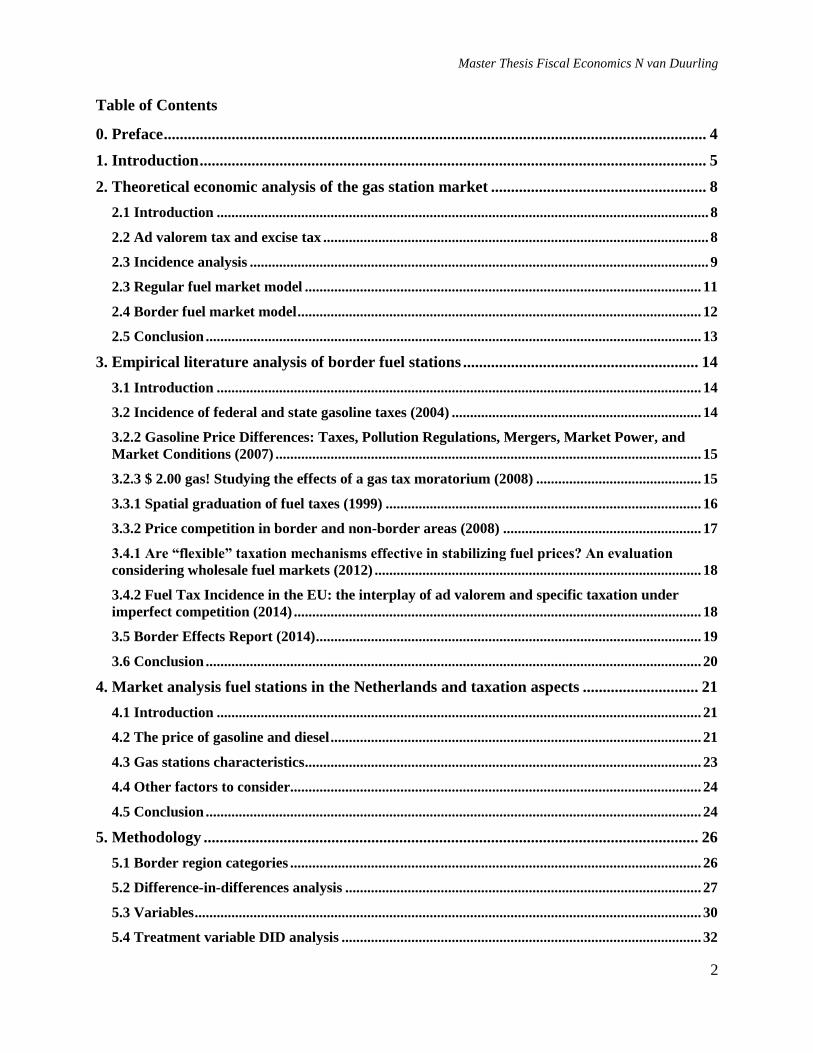
Table of Contents
0. Preface ........................................................................................................................................ 4
1. Introduction ............................................................................................................................... 5
2. Theoretical economic analysis of the gas station market ...................................................... 8
2.1 Introduction ...................................................................................................................................... 8
2.2 Ad valorem tax and excise tax ......................................................................................................... 8
2.3 Incidence analysis ............................................................................................................................. 9
2.3 Regular fuel market model ............................................................................................................ 11
2.4 Border fuel market model .............................................................................................................. 12
2.5 Conclusion ....................................................................................................................................... 13
3. Empirical literature analysis of border fuel stations ........................................................... 14
3.1 Introduction .................................................................................................................................... 14
3.2 Incidence of federal and state gasoline taxes (2004) .................................................................... 14
3.2.2 Gasoline Price Differences: Taxes, Pollution Regulations, Mergers, Market Power, and
Market Conditions (2007) .................................................................................................................... 15
3.2.3 $ 2.00 gas! Studying the effects of a gas tax moratorium (2008) ............................................. 15
3.3.1 Spatial graduation of fuel taxes (1999) ...................................................................................... 16
3.3.2 Price competition in border and non-border areas (2008) ...................................................... 17
3.4.1 Are “flexible” taxation mechanisms effective in stabilizing fuel prices? An evaluation
considering wholesale fuel markets (2012) ......................................................................................... 18
3.4.2 Fuel Tax Incidence in the EU: the interplay of ad valorem and specific taxation under
imperfect competition (2014) ............................................................................................................... 18
3.5 Border Effects Report (2014) ......................................................................................................... 19
3.6 Conclusion ....................................................................................................................................... 20
4. Market analysis fuel stations in the Netherlands and taxation aspects ............................. 21
4.1 Introduction .................................................................................................................................... 21
4.2 The price of gasoline and diesel ..................................................................................................... 21
4.3 Gas stations characteristics ............................................................................................................ 23
4.4 Other factors to consider................................................................................................................ 24
4.5 Conclusion ....................................................................................................................................... 24
5. Methodology ............................................................................................................................ 26
5.1 Border region categories ................................................................................................................ 26
5.2 Difference-in-differences analysis ................................................................................................. 27
5.3 Variables .......................................................................................................................................... 30
5.4 Treatment variable DID analysis .................................................................................................. 32
Master Thesis Fiscal Economics N van Duurling
3
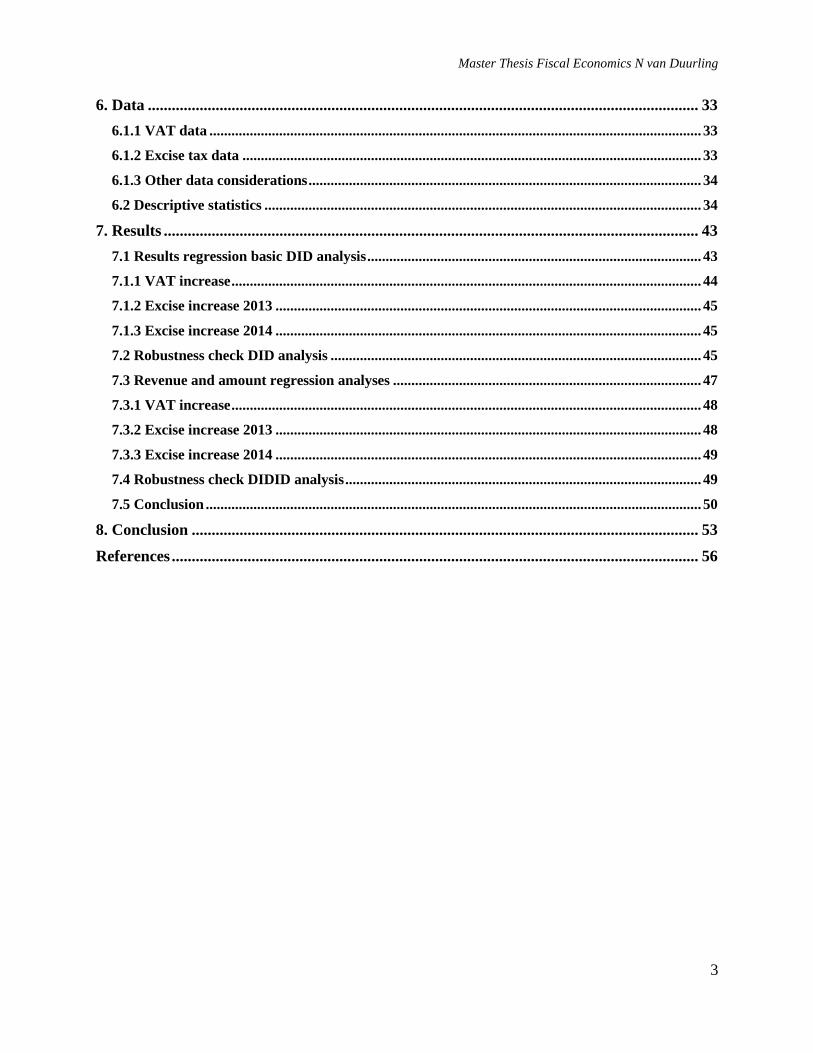
6. Data .......................................................................................................................................... 33
6.1.1 VAT data ...................................................................................................................................... 33
6.1.2 Excise tax data ............................................................................................................................. 33
6.1.3 Other data considerations ........................................................................................................... 34
6.2 Descriptive statistics ....................................................................................................................... 34
7. Results ...................................................................................................................................... 43
7.1 Results regression basic DID analysis ........................................................................................... 43
7.1.1 VAT increase ................................................................................................................................ 44
7.1.2 Excise increase 2013 .................................................................................................................... 45
7.1.3 Excise increase 2014 .................................................................................................................... 45
7.2 Robustness check DID analysis ..................................................................................................... 45
7.3 Revenue and amount regression analyses .................................................................................... 47
7.3.1 VAT increase ................................................................................................................................ 48
7.3.2 Excise increase 2013 .................................................................................................................... 48
7.3.3 Excise increase 2014 .................................................................................................................... 49
7.4 Robustness check DIDID analysis ................................................................................................. 49
7.5 Conclusion ....................................................................................................................................... 50
8. Conclusion ............................................................................................................................... 53
References .................................................................................................................................... 56
Master Thesis Fiscal Economics N van Duurling
4
0. Preface
As a precluding chapter to my thesis I wish to include this preface to the reader. I would hereby
like to seize this opportunity to express my sincere thanks to my supervisor Hendrik Vrijburg for
continued guidance and support during the process of writing this thesis. I also want to express my
gratitude towards Orange Peak Company who provided the data to conduct the analysis presented
in this thesis. Without the first initiative of offering this large set of independent data, the analysis
would not have been possible to the same extent and could have yielded a different level of
significance in the results. The gas stations that allowed Orange Peak Company to share this data
were an important factor in the provision of this data as well.
Master Thesis Fiscal Economics N van Duurling
5
1. Introduction
In 1991, the Minister of Finance Wim Kok introduced the ‘Quarter of Kok’ (Kwartje van Kok) on
fuel in the Netherlands. This excise tax represented a quarter of a guilder at that time, 25 cents, to
be paid on each liter of fuel in order to draw back budgetary issues1. The years preceding the
excise, additional tax was levied on fuel, and the Value Added Tax (VAT) in the Netherlands also
continued to increase from 17% to 19% to 21%, and the fuel price was once again heavily
impacted.
The excise tax is levied beside a consumer tax, which is levied on top of the excise tax. The
implication of the excise tax, however, differs compared to a regular consumer tax. From an
economist’s perspective, excise taxes are commonly introduced to circumvent certain consumer
behavior towards specific products (Rosen & Gayer, 2011). It is obvious that in the case of a fuel
excise tax, the government attempts to promote a healthier environment by discouraging
consumers to emit environmentally unfriendly gasses, driving the price of fuel up due to the excise
tax’ increasing effect. (In turn this could even lead to a double dividend by encouraging consumers
to create a more cleanly way of living by inventing engines that do not require fuel, such as electric
cars2). Of course, with respect to the ‘Quarter of Kok’ the government focused on an increase of
government funds, so these objectives most likely coexist. Aside from the excise tax, the VAT
increase caused all goods subject to the higher VAT rate to become more expensive, as some of
the burden is passed on to the consumer3. Economically, however, there is no substitution towards
other means of transportation, and the cross-border shopping dimension is the same.
The increase of both VAT and excise tax has led to outrage from lobbyists, companies and the
public, but the burden for producers and retailers is at least the same for all those operating in the
Netherlands. Unfortunately, the ‘inexistence’ of the Dutch border in the European Union does no
longer support neutrality among businesses in one country, since border companies feel a presence
in a larger market where substitutes are readily available at a lower price just across the border.
1 Kamerstukken II, 1991
2 OECD (2010), Taxation, Innovation and the Environment, OECD, Paris.
3 See for additional insight on this matter: Dijkstra, J., 2013, The Influence of the VAT Increase
on Consumer Prices, MasterThesis Erasmus University.
Master Thesis Fiscal Economics N van Duurling
6
Spokes groups like BOVAG concur that the excise taxes drive gas stations out of business due to
cross-border shopping and have supported some gas stations in an appeal4. The gas station owners
of two gas stations in border areas brought evidence before the court that their income loss was
directly related to the increase of excise taxes again in 2015. The court however, deemed the
evidence to be insufficient, and so the battle between the government and border gas stations
continues on. An actual investigation has yet to be conducted on the topic of border gas stations
and in what matter they are affected by the increase in VAT and excise tax over the past years.
I have therefore chosen to address the following research question in my master thesis:
“What is the effect of the increase of excise tax and VAT on fuel prices and revenue of
border gas stations in the Netherlands?”
There are a number of sub questions that will be addressed in specific chapters of my thesis. By
analyzing data of variables such as the price of fuel, the volume sold of fuel and variables
pertaining to the revenue generated in the store of the gas station, answers can be found to the
following research questions.
- What is the effect of the increase of VAT on the price of diesel and gasoline?
- What is the effect of the increase of excise tax on the price of diesel and gasoline?
- Which category or categories of border regions experiences a significant decrease in price,
different categories representing kilometers driven to the border?
- Which category or categories of border regions experiences a significant decrease in
revenue, different categories representing kilometers driven to the border?
Chapter 2 in this thesis will consist of creating an economical theoretical framework supported by
economic literature in order to draw on economic principles later on. Different market mechanisms
are identified within the gas station market and the economic incidence of an ad valorem tax and
excise tax is discussed. Chapter 3 will focus on a literature analysis of articles that have analyzed
data from other gas station markets and have drawn conclusions based on that data, and papers
that have examined the effects of cross border shopping. Based on these articles I will be able to
4 Their latest article was published on 3 February, 2015, retrieved from:
<http://www.bovag.nl/nieuws/Voorzieningenrechter_kan_accijnsschade_grenspompen_niet_bep
alen>
Master Thesis Fiscal Economics N van Duurling
7
distinguish between control variables needed for the regression of the difference in difference
analysis. Chapter 4 will serve as a stepping stone to the next part of the thesis and will present an
analysis of the Dutch gas station market.
After creating a foundation of theoretical and empirical research and describing the market of gas
stations in the Netherlands, the next part of the thesis will consist of the data analysis. In chapter
5 the methodology of the data analysis will be described and the variables used. Chapter 6 will
provide a description of the data and possible limitations of the data used, and chapter 7 will present
an overview of the results from the data analysis. In Chapter 8 I will draw my conclusions based
on the foregone analysis and I will discuss the consequences for Dutch policy makers with respect
to the excise tax and VAT tax increases on gasoline and diesel.
Master Thesis Fiscal Economics N van Duurling
8
2. Theoretical economic analysis of the gas station market
2.1 Introduction
In this chapter I will describe the economic mechanisms at work in a fuel market at the introduction
of an excise tax and a consumer tax (ad valorem tax). One of the key matters in welfare economics
is the analysis of tax incidence, which is a secondary focus in this chapter. In order to determine
the effect of the VAT and excise tax increase it is necessary to illustrate which parties bear the
burden of the market distortion. Fullerton and Metcalf distinguish between statutory incidence and
economic incidence (2002), where the first considers distribution of tax payments based on a legal
obligation and the latter refers to the change in economic welfare in society arising from a tax.
Often, the two are not the same, since companies are able to use tax shifting to pass on the burden
to the consumer. The incidence analysis is an important factor in the gravity of the situation of
border gas stations, because not all gas stations are subject to the same economic conditions, such
as gas stations being in relative close proximity to a border, which is the case in the European
Union. The price elasticity of demand of fuel plays a role in the determination of this as well, thus
a part of this chapter is devoted to the price elasticity of demand of fuel in most cases. The question
to investigate in this chapter is: Do border gas stations experience similar economic market
circumstances as regular gas stations?
2.2 Ad valorem tax and excise tax
A consumer tax, a tax charged at the point of sale and imposed on the end consumer, takes the
form of a percentage tax, or ad valorem tax, which is the case with the Value Added Tax (VAT)
imposed by the European Union. Producers pay the imposed VAT when purchasing products to
create or improve products that they wish to sell, and later they are able to deduct this tax when
they have proven they sold the product in turn after adding value. This way, the only ones who
bear the burden of the tax is the consumer, hence the term consumer tax. With an excise tax the
execution is different, because the excise tax is charged directly on top of the sales price at the
moment of sale, and this type of tax is usually used by the government to diminish a certain type
of undesirable behavior such as smoking, alcohol consumption and environmental pollution
(Rosen & Gayer, 2011). At the introduction of both a consumer tax and an excise tax in a regular
market, ceteris paribus, the supply curve shifts to the left, because producers continue to supply an
equal amount of goods. As a result, a movement up along the demand curve is witnessed due to
Master Thesis Fiscal Economics N van Duurling
9
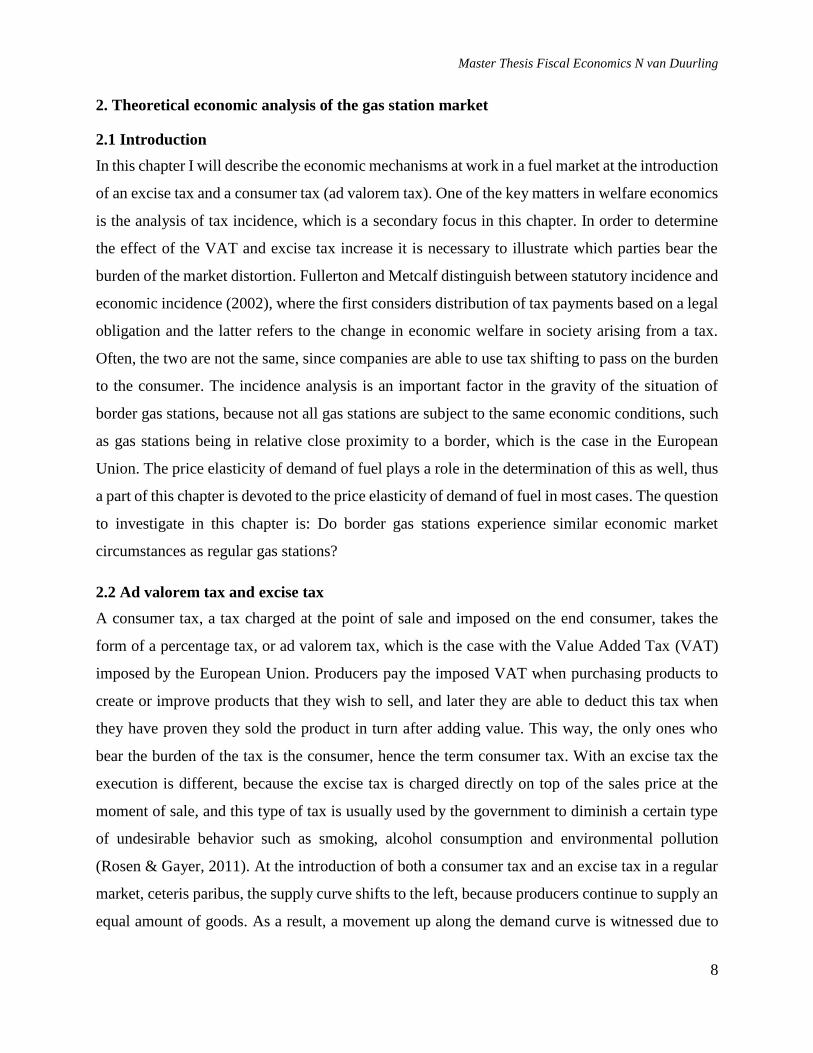
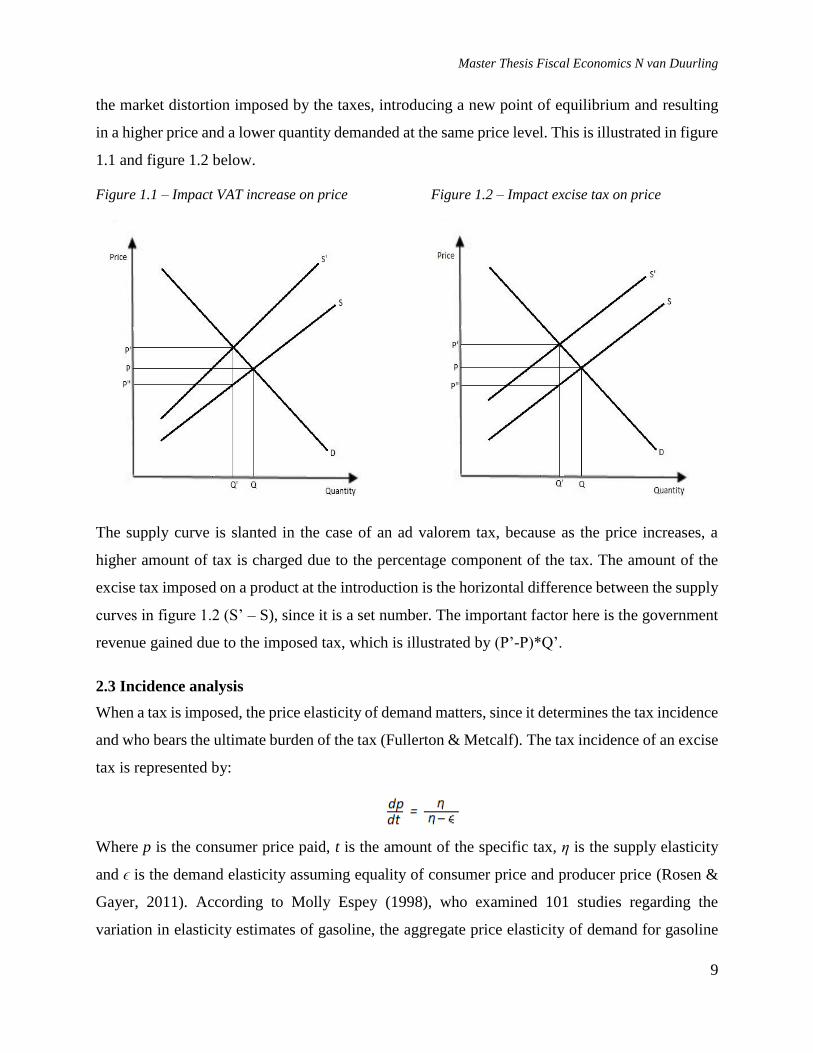
the market distortion imposed by the taxes, introducing a new point of equilibrium and resulting
in a higher price and a lower quantity demanded at the same price level. This is illustrated in figure
1.1 and figure 1.2 below.
Figure 1.1 – Impact VAT increase on price Figure 1.2 – Impact excise tax on price
The supply curve is slanted in the case of an ad valorem tax, because as the price increases, a
higher amount of tax is charged due to the percentage component of the tax. The amount of the
excise tax imposed on a product at the introduction is the horizontal difference between the supply
curves in figure 1.2 (S’ – S), since it is a set number. The important factor here is the government
revenue gained due to the imposed tax, which is illustrated by (P’-P)*Q’.
2.3 Incidence analysis
When a tax is imposed, the price elasticity of demand matters, since it determines the tax incidence
and who bears the ultimate burden of the tax (Fullerton & Metcalf). The tax incidence of an excise
tax is represented by:
Where p is the consumer price paid, t is the amount of the specific tax, η is the supply elasticity
and ϵ is the demand elasticity assuming equality of consumer price and producer price (Rosen &
Gayer, 2011). According to Molly Espey (1998), who examined 101 studies regarding the
variation in elasticity estimates of gasoline, the aggregate price elasticity of demand for gasoline
Master Thesis Fiscal Economics N van Duurling
10
was 0.26 in the United States. This is in line with the theory of inelastic demand, if the percentage
change in price is less compared to the percentage change in quantity demanded, demand is
relatively inelastic. Intuitively, this is the case for fuel, because consumers will not cease fuel
consumption as a result due to the existing need to commute and travel. Fuel can be viewed as a
necessity good according to Coyle, De Backer and Prisinzano (2012)5. This goes hand in hand
with any studies that have been conducted in relation to emission6, where the relative emission
‘punishment’ did not seem to cease fuel consumption. Using this information, at the introduction
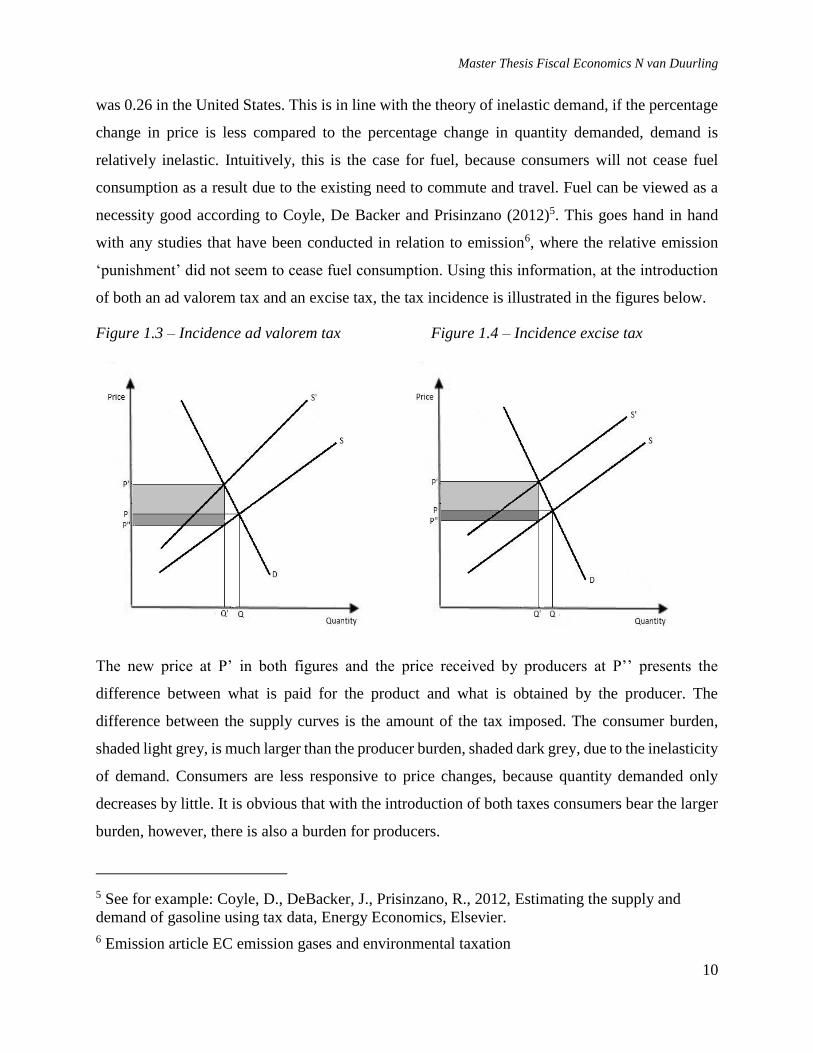
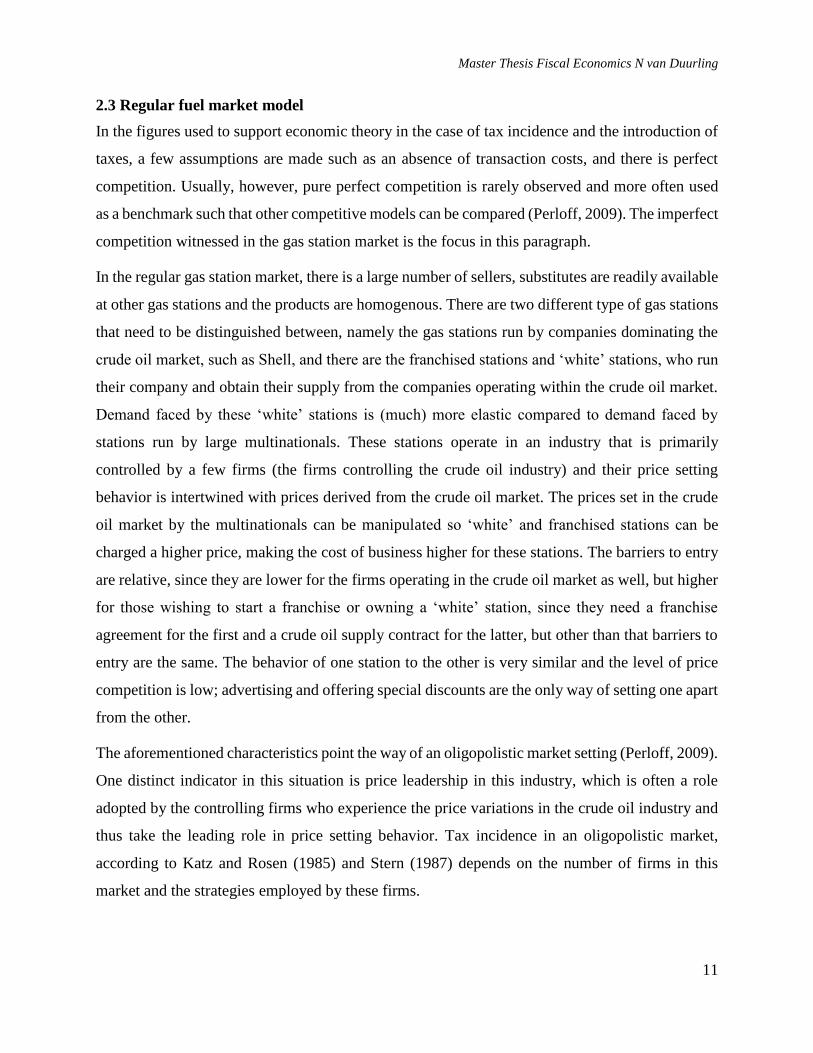
of both an ad valorem tax and an excise tax, the tax incidence is illustrated in the figures below.
Figure 1.3 – Incidence ad valorem tax Figure 1.4 – Incidence excise tax
The new price at P’ in both figures and the price received by producers at P’’ presents the
difference between what is paid for the product and what is obtained by the producer. The
difference between the supply curves is the amount of the tax imposed. The consumer burden,
shaded light grey, is much larger than the producer burden, shaded dark grey, due to the inelasticity
of demand. Consumers are less responsive to price changes, because quantity demanded only
decreases by little. It is obvious that with the introduction of both taxes consumers bear the larger
burden, however, there is also a burden for producers.
5 See for example: Coyle, D., DeBacker, J., Prisinzano, R., 2012, Estimating the supply and
demand of gasoline using tax data, Energy Economics, Elsevier.
6 Emission article EC emission gases and environmental taxation
Master Thesis Fiscal Economics N van Duurling
11
2.3 Regular fuel market model
In the figures used to support economic theory in the case of tax incidence and the introduction of
taxes, a few assumptions are made such as an absence of transaction costs, and there is perfect
competition. Usually, however, pure perfect competition is rarely observed and more often used
as a benchmark such that other competitive models can be compared (Perloff, 2009). The imperfect
competition witnessed in the gas station market is the focus in this paragraph.
In the regular gas station market, there is a large number of sellers, substitutes are readily available
at other gas stations and the products are homogenous. There are two different type of gas stations
that need to be distinguished between, namely the gas stations run by companies dominating the
crude oil market, such as Shell, and there are the franchised stations and ‘white’ stations, who run
their company and obtain their supply from the companies operating within the crude oil market.
Demand faced by these ‘white’ stations is (much) more elastic compared to demand faced by
stations run by large multinationals. These stations operate in an industry that is primarily
controlled by a few firms (the firms controlling the crude oil industry) and their price setting
behavior is intertwined with prices derived from the crude oil market. The prices set in the crude
oil market by the multinationals can be manipulated so ‘white’ and franchised stations can be
charged a higher price, making the cost of business higher for these stations. The barriers to entry
are relative, since they are lower for the firms operating in the crude oil market as well, but higher
for those wishing to start a franchise or owning a ‘white’ station, since they need a franchise
agreement for the first and a crude oil supply contract for the latter, but other than that barriers to
entry are the same. The behavior of one station to the other is very similar and the level of price
competition is low; advertising and offering special discounts are the only way of setting one apart
from the other.
The aforementioned characteristics point the way of an oligopolistic market setting (Perloff, 2009).
One distinct indicator in this situation is price leadership in this industry, which is often a role
adopted by the controlling firms who experience the price variations in the crude oil industry and
thus take the leading role in price setting behavior. Tax incidence in an oligopolistic market,
according to Katz and Rosen (1985) and Stern (1987) depends on the number of firms in this
market and the strategies employed by these firms.
Master Thesis Fiscal Economics N van Duurling
12
2.4 Border fuel market model
The barriers to entry principle in the market analysis of paragraph 2.3 suggests that they exist, but
are not as high. Gas stations experience a relative amount of freedom with respect to competition
strategies, and they could use the annexed store, the shop next to the gas station where cash
registers are present, to employ marketing strategies offering discounts on these products. An
important note to consider is the fact that these gas stations, when operating in an oligopolistic
market, are subject to the same rules and regulations of the country harboring this industry.
Through the expansion of the Dutch market into the European market, however, and the
accompanying free movement of people and capital, the market for fuel has expanded and gas
stations across the border entered this industry, willingly or unwillingly.
From a consumer point of view, consumers are now able to obtain fuel at a lower price just across
the border, and they will engage in cross-border shopping if the cost of travelling across the border
outweighs money saved and fuel demand in border regions will decrease. On the other hand, some
consumers, many of those traveling for work, may possess a lease card or gas card as a perk from
their employment, and they do not care about obtaining the lowest price for gas.
From a producer point of view, the quantity demanded will decrease due to the increase of
available substitutes at a lower price, which is the case for multinational companies. However, in
the case of the ‘white’ stations and franchises, they are not able to become price setters, because
oligopolistic market theory demands they follow the price setting behavior of the larger companies
in the industry. For the price setters in the market, who most likely operate in a multinational
fashion, there is no difference if consumers buy their product in country A as opposed to country
B just across the border. For the franchises and ‘white’ stations the decrease in demand leads to a
decrease in quantity sold of fuel, and perhaps a larger overall revenue loss due to the lack of
opportunity for customers to buy additional items in their annexed store. The producer side also
brings about price setting behavior with respect to informed consumers and uninformed
consumers. There are two types of consumers to attract, one being the informed consumer who
chases the lowest price possible and the other being the uninformed consumer that will visit the
gas station and store regardless of price setting behavior. For the first the tax reform of both the
VAT rate and the excise tax informed consumers will have the opportunity to switch, however the
Master Thesis Fiscal Economics N van Duurling
13
uninformed consumer will not do so. Producers therefore do still have the possibility to switch
their attention from informed to uninformed consumers.
2.5 Conclusion
The border gas stations appear to be present in a larger market due to the fact that there are other
stations across the border, which are not subject to the same rules and regulations. The VAT rate
differs across the border (21% in the Netherlands, higher than neighboring countries) and the
amount of excise tax is higher as well. The exact difference created by this larger market has,
however, not yet been analyzed. In the economic theory analysis above it is assumed that
consumers always attempt to find the lowest price and that there is perfect transparency and
information distribution for both the consumer and the producer in the market. It is therefore
necessary to conduct further research and to analyze the data to gain insight in the actual effect of
the taxes imposed on fuel.
Master Thesis Fiscal Economics N van Duurling
14
3. Empirical literature analysis of border fuel stations
3.1 Introduction
Over the years, much research was conducted based on price dispersion and cross border shopping
in the USA, mainly because different states in the US are subject to distinct rules and regulations,
including taxation regimes. In the Netherlands empirical research was also published with respect
to cross border fuel shopping. In the first part of this chapter I will discuss a paper focusing on
federal and state fuel taxes and relating fuel tax incidence. In the second part I will discuss
empirical research specific to the Netherlands. Recently Di Giacomo, Piacenza, Scervini and
Turati published (2014) a preliminary draft of empirical research regarding fuel tax incidence in
the EU. The Dutch government has also studied the effects of the border for gas stations in a study
called Border Effects Report (Grenseffectenrapportage), and furthermore, the BOVAG, an
organization focused on representing entrepreneurs in transportation, has also conducted some
studies on the effects of adjustments of the excise tax. This third part of the chapter comprises less
economic analysis and more specific data analysis from a recent point of view. By examining these
studies insight for the control variables in the used methodology is gained, and investigation
methods can be compared with respect to data analysis.
3.2 Incidence of federal and state gasoline taxes (2004)
The article written by Chouinard and Perloff (2004) examines the effects of tax incidence in fuel
prices on a federal and state level. The authors employ monthly data for the 48 states in the United
States of America (mainland only) estimating fixed effects from March 1989 to June 1997 focusing
on “retail, unleaded gasoline price equations” using a reduced-form price equation. The authors
use exogenous variables including “demand determinants, cost factors, seasonality dummies,
market power proxies, anti-pollution laws, vertical relations and taxes”. They also use a combined
state tax, specific federal gasoline tax and state tax interacted with the share of total quantity sold
in each state as tax variables. Through examining the significance of the independent variables
(demand, cost, seasonality, market power, pollution laws, vertical relations and taxes) by
performing a reduced-form price regression with retail and wholesale price as the dependent
variable, the authors find that the consumer incidence of a fuel tax specific to a state is greater than
the tax on a federal level. They also find that consumer incidence and producer incidence are
relatively equal for a federal tax imposed on the national level, whereas it is considerably higher
Master Thesis Fiscal Economics N van Duurling
15
for consumers in smaller states as opposed to larger states. This seems counterintuitive, because
consumers would have the opportunity to avoid the state taxes by shopping across state line, the
authors, however, do not explain this phenomenon. The article analyzes from a consumer
incidence point of view, which is interesting for the analysis, since the goal of this thesis is to
determine whether gas station owners attempt to shift the fuel taxes to the consumer and how this
in turn affects their revenue.
3.2.2 Gasoline Price Differences: Taxes, Pollution Regulations, Mergers, Market Power,
and Market Conditions (2007)
Chouinard and Perloff published a related study in 2007 examining the incidence of ad valorem
taxes per state in the United States and employing the data set and estimation analysis also used in
their analysis in 2004 under 3.2.1. They conclude from their findings that the imposed burden of
the excise tax under federal law is not shared equally amongst wholesalers and consumers, because
the consumer incidence amounts to 75% of the tax, whereas retailers only experience 25% of the
tax incidence. The state specific tax passes nearly the entire tax onto the consumers, and a 1%
increase in the ad valorem tax imposed by the state results in a 1.26% increase in retail gasoline
price. This, however, has no effect on the wholesale price, which is the price paid by the retailer
in order to import the fuel, instigating that the retailer is able to inflate their mark-up by passing
on the tax incidence burden to the consumer. In addition, no mention is made of the state tax being
shifted onto the consumer more due to cross-border shopping.
3.2.3 $ 2.00 gas! Studying the effects of a gas tax moratorium (2008)
Doyle and Samphantharak study the effects of the incidence of sales taxes per state with respect
to gasoline in order to determine how gasoline prices change in response to tax rate changes. They
employ a large data set and estimate, like Chouinard and Perloff, a reduced-form price equation.
Gasoline prices are estimated in a regression with numerous demand-side and cost-side variables
using data from two states during the spring of 2000 when a tax moratorium was offered in these
states (tax break). They find that approximately 70% of the decrease in taxes is passed onto
consumers by retailers adopting lower prices due to the tax decreases as opposed to the increase
in consumer tax incidence experienced when the tax was reinstated and prices in turn increased by
80% - 100%. Most articles in the US study an increase in taxes, but the authors were able to also
Master Thesis Fiscal Economics N van Duurling
16
study how a decrease in taxes affects a decrease in consumer incidence. It is still clear, however,
that consumer incidence is higher than before when taxes are reinstated.
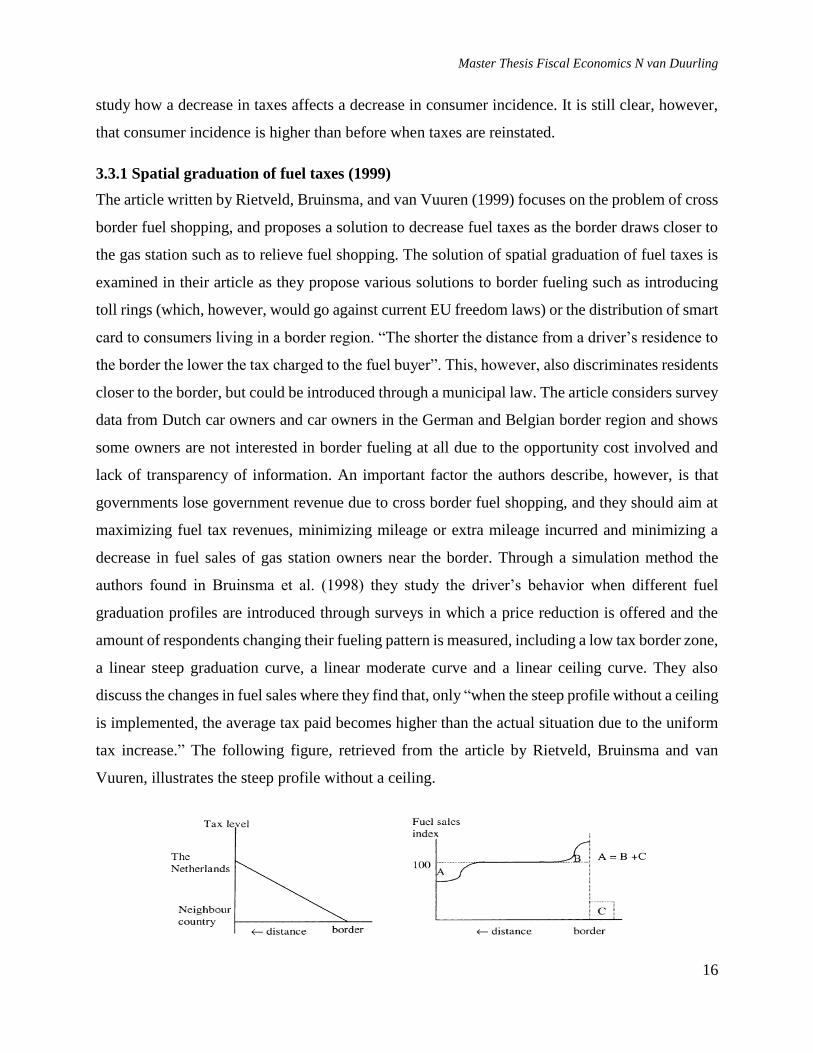
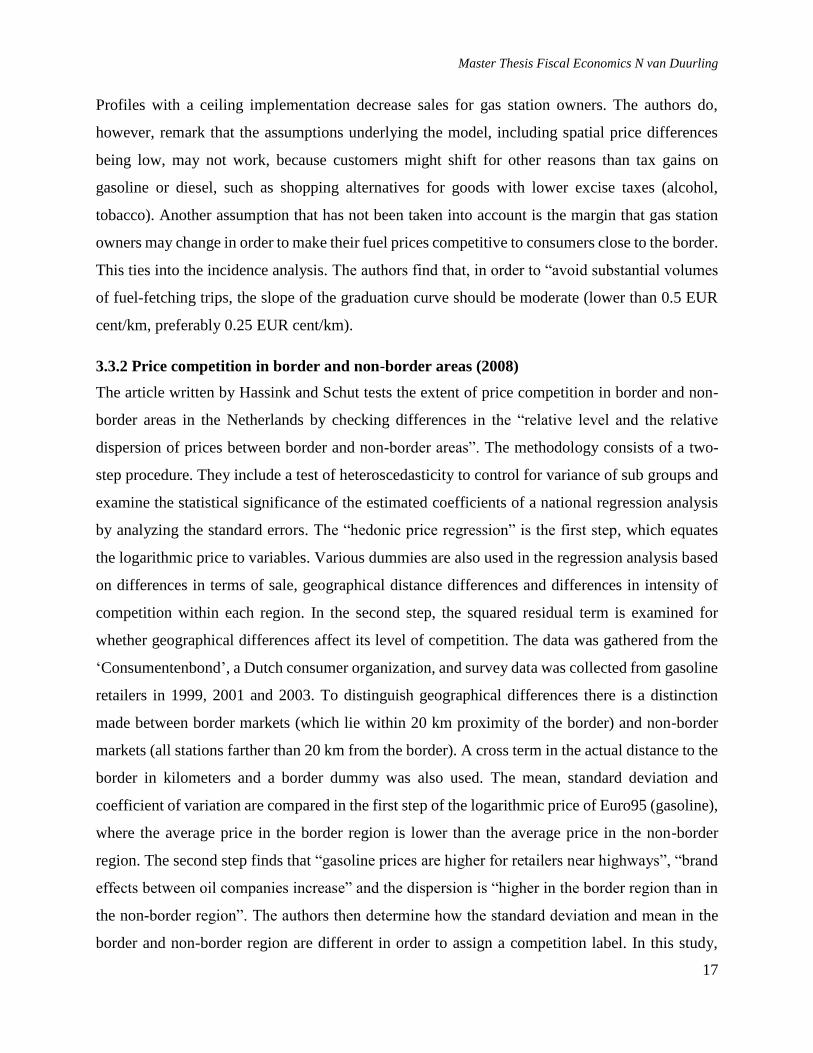
3.3.1 Spatial graduation of fuel taxes (1999)
The article written by Rietveld, Bruinsma, and van Vuuren (1999) focuses on the problem of cross
border fuel shopping, and proposes a solution to decrease fuel taxes as the border draws closer to
the gas station such as to relieve fuel shopping. The solution of spatial graduation of fuel taxes is
examined in their article as they propose various solutions to border fueling such as introducing
toll rings (which, however, would go against current EU freedom laws) or the distribution of smart
card to consumers living in a border region. “The shorter the distance from a driver’s residence to
the border the lower the tax charged to the fuel buyer”. This, however, also discriminates residents
closer to the border, but could be introduced through a municipal law. The article considers survey
data from Dutch car owners and car owners in the German and Belgian border region and shows
some owners are not interested in border fueling at all due to the opportunity cost involved and
lack of transparency of information. An important factor the authors describe, however, is that
governments lose government revenue due to cross border fuel shopping, and they should aim at
maximizing fuel tax revenues, minimizing mileage or extra mileage incurred and minimizing a
decrease in fuel sales of gas station owners near the border. Through a simulation method the
authors found in Bruinsma et al. (1998) they study the driver’s behavior when different fuel
graduation profiles are introduced through surveys in which a price reduction is offered and the
amount of respondents changing their fueling pattern is measured, including a low tax border zone,
a linear steep graduation curve, a linear moderate curve and a linear ceiling curve. They also
discuss the changes in fuel sales where they find that, only “when the steep profile without a ceiling
is implemented, the average tax paid becomes higher than the actual situation due to the uniform
tax increase.” The following figure, retrieved from the article by Rietveld, Bruinsma and van
Vuuren, illustrates the steep profile without a ceiling.
Master Thesis Fiscal Economics N van Duurling
17
Profiles with a ceiling implementation decrease sales for gas station owners. The authors do,
however, remark that the assumptions underlying the model, including spatial price differences
being low, may not work, because customers might shift for other reasons than tax gains on
gasoline or diesel, such as shopping alternatives for goods with lower excise taxes (alcohol,
tobacco). Another assumption that has not been taken into account is the margin that gas station
owners may change in order to make their fuel prices competitive to consumers close to the border.
This ties into the incidence analysis. The authors find that, in order to “avoid substantial volumes
of fuel-fetching trips, the slope of the graduation curve should be moderate (lower than 0.5 EUR
cent/km, preferably 0.25 EUR cent/km).
3.3.2 Price competition in border and non-border areas (2008)
The article written by Hassink and Schut tests the extent of price competition in border and non-
border areas in the Netherlands by checking differences in the “relative level and the relative
dispersion of prices between border and non-border areas”. The methodology consists of a two-
step procedure. They include a test of heteroscedasticity to control for variance of sub groups and
examine the statistical significance of the estimated coefficients of a national regression analysis
by analyzing the standard errors. The “hedonic price regression” is the first step, which equates
the logarithmic price to variables. Various dummies are also used in the regression analysis based
on differences in terms of sale, geographical distance differences and differences in intensity of
competition within each region. In the second step, the squared residual term is examined for
whether geographical differences affect its level of competition. The data was gathered from the
‘Consumentenbond’, a Dutch consumer organization, and survey data was collected from gasoline
retailers in 1999, 2001 and 2003. To distinguish geographical differences there is a distinction
made between border markets (which lie within 20 km proximity of the border) and non-border
markets (all stations farther than 20 km from the border). A cross term in the actual distance to the
border in kilometers and a border dummy was also used. The mean, standard deviation and
coefficient of variation are compared in the first step of the logarithmic price of Euro95 (gasoline),
where the average price in the border region is lower than the average price in the non-border
region. The second step finds that “gasoline prices are higher for retailers near highways”, “brand
effects between oil companies increase” and the dispersion is “higher in the border region than in
the non-border region”. The authors then determine how the standard deviation and mean in the
border and non-border region are different in order to assign a competition label. In this study,
Master Thesis Fiscal Economics N van Duurling
18
only prices are used of retailers and the authors include a market segmentation of firm and oil
companies, however these coefficients are not significant in 1998 and 2001. They also examine
the gasoline market in the Netherlands in this time period, however, they do not take average prices
of Germany and Belgium into account.
3.4.1 Are “flexible” taxation mechanisms effective in stabilizing fuel prices? An evaluation
considering wholesale fuel markets (2012)
Di Giacomo, Piacenza and Turati published an article in 2012 researching the Italian fuel market
and investigating tax incidence estimates with respect to gasoline and diesel price elasticities and
how these relate to excise tax changes and a change in oil price. They found that a 1% increase in
oil price resulted in an increase between 0.1% to 0.5% of gasoline and diesel wholesale prices,
whilst a 1% increase in excise tax on gasoline and diesel actually decreased fuel prices by
approximately 0.5% - 2%. This means the shift of taxes is less under the imposition of an excise
tax as opposed to increasing oil prices. The authors do not provide an explanation for this rather
peculiar effect. They also employ a simulation of a decrease in excise taxes on a one-to-one basis
with increasing crude oil prices as other fiscal policy simulations, a “sterilization policy”. The first
simulation results in higher fuel prices at retailer’s stations. The “speed of convergence to a zero
change in fuel price” is greater if the excise taxes do not change as much. The conclusion is that it
is more beneficial when there is no government intervention than when the government intervenes
through imposing “flexible tax measures” in response to oil price increases.
3.4.2 Fuel Tax Incidence in the EU: the interplay of ad valorem and specific taxation under
imperfect competition (2014)
The same authors including Scervini have recently brought out a preliminary draft, which has not
yet been published. Even though this paper has a draft status, their assertions are still relevant to
the research question in this thesis, hence the inclusion of this in this chapter. The authors use data
from the European Oil Bulletin by the EU Commission, Eurostat and the International Energy
Agency, collecting retail prices, excise taxes and VAT rates imposed on gasoline and diesel over
a time period from 1995-2010. The dependent variable is the monthly price of fuel sold at the gas
station, and demand side exogenous variables are included such as “quarterly GDP per capita,
monthly unemployment rates, yearly number of registered vehicles, share of population aged 15-
65 and heating degree days”. Market characteristics data is used including annual refinery capacity,
annual oil stocks and annual number of fuel retail outlets, and cost shifters such as interest rates
Master Thesis Fiscal Economics N van Duurling
19
and cost of labor. A reduced-form model specification is used for the pricing equations like
Chouinard and Perloff did in their studies, regressing the price of gasoline and diesel in a country
(i) at time (t) on independent variables including cost, insurance, and freight, crude oil price, excise
tax per fuel item and VAT tax rate, and including the control variables mentioned. The authors
preliminarily conclude that gasoline and diesel excise taxes are fully passed on to the consumer
and they are reflected in prices nearly right away, and when the VAT rate is higher, the tax
incidence rate increases.
3.5 Border Effects Report (2014)
The ‘Border Effects Report’ (Grenseffectenrapportage, 2014) conducted by the Dutch government
presents a report regarding excise taxes in the Netherlands of how these have influenced sales of
tobacco and alcohol products and combines numerous studies carried out by different
organizations. Though the study offers limited insight regarding gasoline and diesel sales, the other
numbers pertaining to tobacco and alcohol sales need to be taken into account as well, because
they create an incentive for consumers to travel across the border and not only engage in cross
border fuel shopping, but also in alcohol and tobacco shopping. The main conclusions of the study
are that the anticipation of revenue due to the alcohol excise tax is in line with the expectations
and that there are no specific border effects noticeable. For tobacco there was a decrease in
anticipated government revenue, which suggests according to the author that consumers have
engaged in cross border shopping. A summary of the results from a study performed by the
BOVAG (a lobby group related to fuel station owners) and two other organizations are presented
with respect to a survey done in July 2013 under 1776 car drivers, of which 1045 live in the border
region in the Netherlands and 731 live outside the border region (the definition of this border
region is not included). The goal was to find out how many Dutch car drivers feel that it is more
lucrative to shop across the border due to the relatively cheaper tobacco and fuel prices. 667
participants turn out to go across the border for fuel and tobacco shopping, of which 388 live in
the border region and 279 live outside of the border region. Participants living in the border region
buy 49% of their tobacco items outside of the Netherlands as well as 23% of the participants not
living in the border region. Most tobacco is purchased in Belgium, and larger amounts of tobacco
items are purchased per instance compared to non-border regions. The BOVAG and the two other
organizations also conducted a study in July 2013 using cash register data from gas stations in the
border region, looking into revenue with regard to tobacco items for the period of January 2012 to
Master Thesis Fiscal Economics N van Duurling
20
April 2012 and January 2013 to April 2013. They found that tobacco item sales dropped by 17%
in comparison.
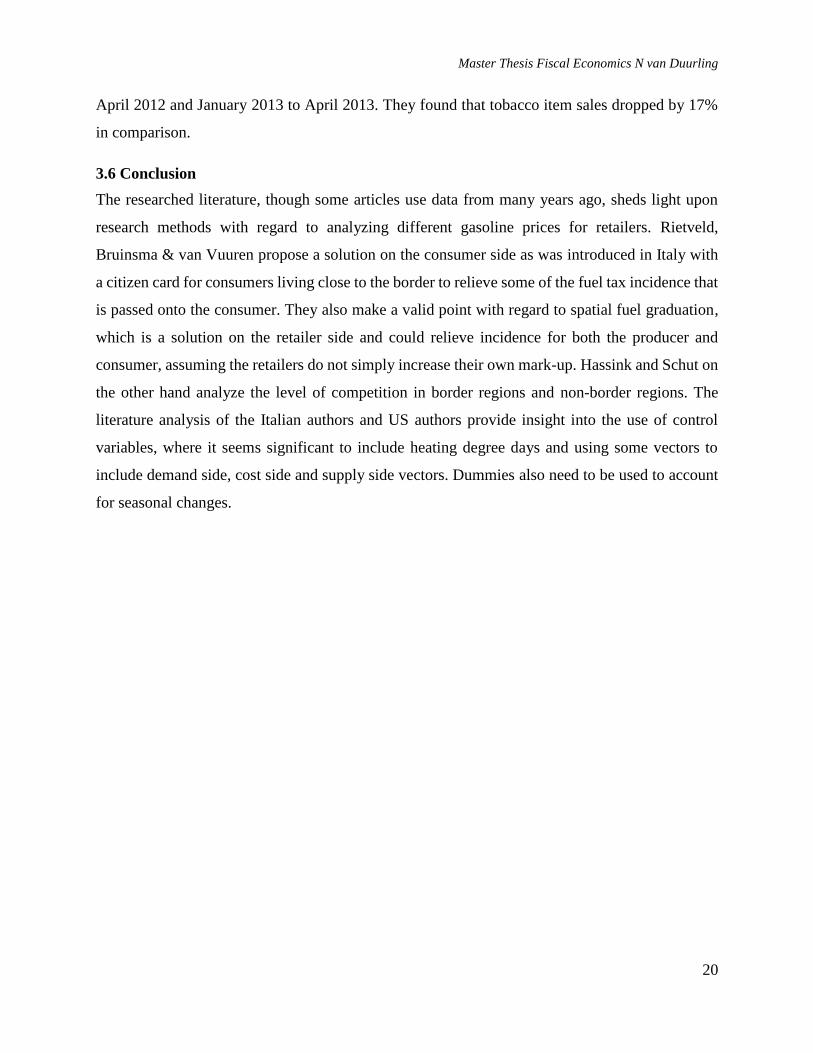
3.6 Conclusion
The researched literature, though some articles use data from many years ago, sheds light upon
research methods with regard to analyzing different gasoline prices for retailers. Rietveld,
Bruinsma & van Vuuren propose a solution on the consumer side as was introduced in Italy with
a citizen card for consumers living close to the border to relieve some of the fuel tax incidence that
is passed onto the consumer. They also make a valid point with regard to spatial fuel graduation,
which is a solution on the retailer side and could relieve incidence for both the producer and
consumer, assuming the retailers do not simply increase their own mark-up. Hassink and Schut on
the other hand analyze the level of competition in border regions and non-border regions. The
literature analysis of the Italian authors and US authors provide insight into the use of control
variables, where it seems significant to include heating degree days and using some vectors to
include demand side, cost side and supply side vectors. Dummies also need to be used to account
for seasonal changes.
Master Thesis Fiscal Economics N van Duurling
21
4. Market analysis fuel stations in the Netherlands and taxation aspects
4.1 Introduction
This chapter serves as a short outline in order to describe the Dutch gas station market in detail
with respect to the excise and VAT tax, price setting behavior, timing of tax payment, and
description of different types of gas stations, cash flow considerations, transportation costs and
seasonal effects. These occurrences are important to note before delving into the data description
and data analysis and how these effects will or will not influence the analysis outcome.
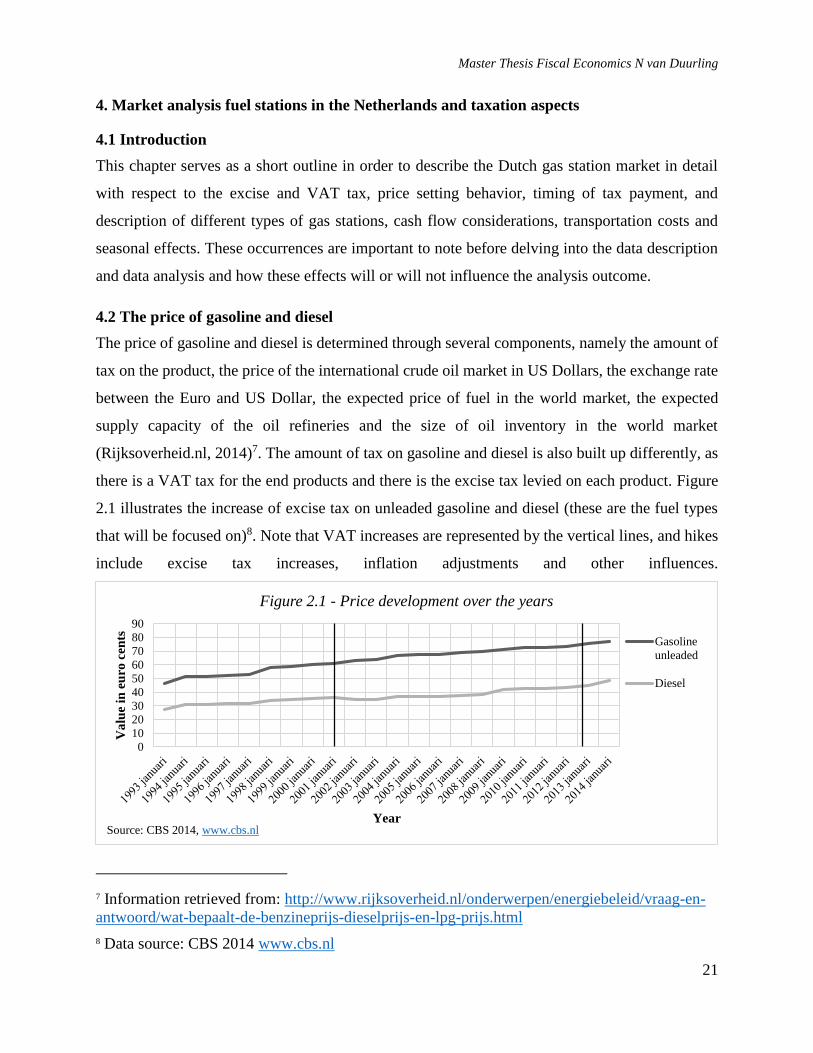
4.2 The price of gasoline and diesel
The price of gasoline and diesel is determined through several components, namely the amount of
tax on the product, the price of the international crude oil market in US Dollars, the exchange rate
between the Euro and US Dollar, the expected price of fuel in the world market, the expected
supply capacity of the oil refineries and the size of oil inventory in the world market
(Rijksoverheid.nl, 2014)7. The amount of tax on gasoline and diesel is also built up differently, as
there is a VAT tax for the end products and there is the excise tax levied on each product. Figure
2.1 illustrates the increase of excise tax on unleaded gasoline and diesel (these are the fuel types
that will be focused on)8. Note that VAT increases are represented by the vertical lines, and hikes
include excise tax increases, inflation adjustments and other influences.
7 Information retrieved from: http://www.rijksoverheid.nl/onderwerpen/energiebeleid/vraag-en-
antwoord/wat-bepaalt-de-benzineprijs-dieselprijs-en-lpg-prijs.html
8 Data source: CBS 2014 www.cbs.nl
0
10
20
30
40
50
60
70
80
90
Va
lue
in e
uro
cen
ts
Year
Figure 2.1 - Price development over the years
Gasoline
unleaded
Diesel
Source: CBS 2014, www.cbs.nl
Master Thesis Fiscal Economics N van Duurling
22
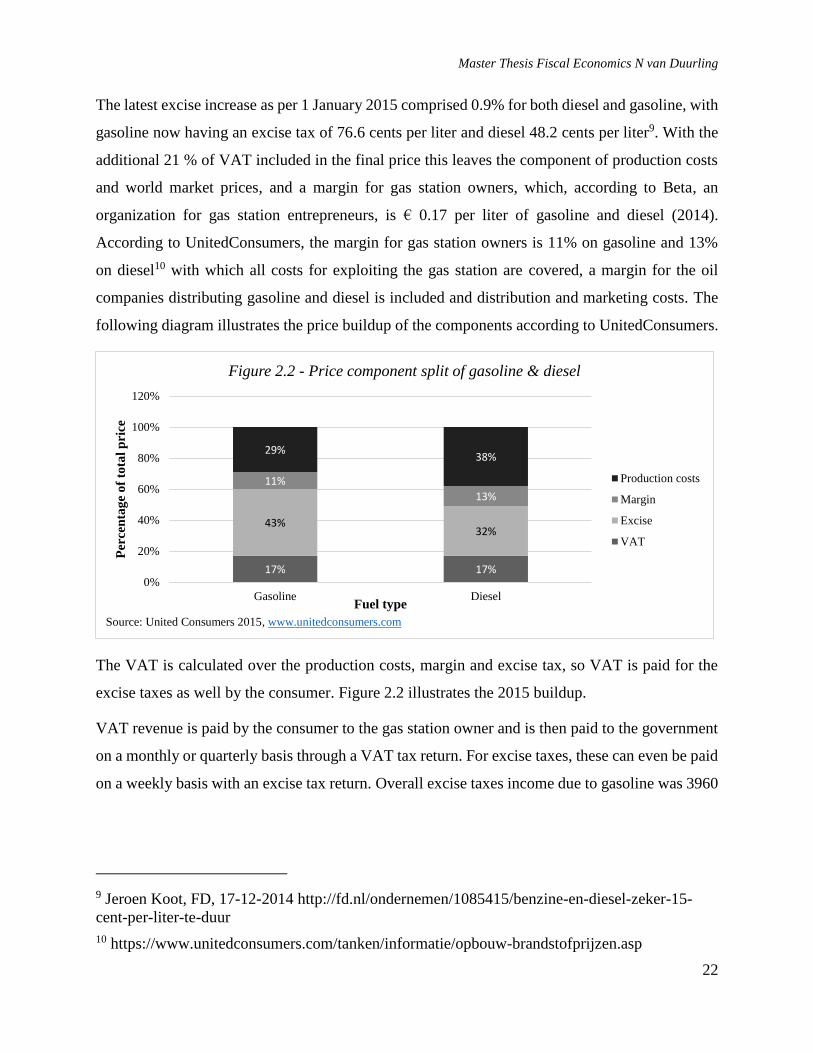
The latest excise increase as per 1 January 2015 comprised 0.9% for both diesel and gasoline, with
gasoline now having an excise tax of 76.6 cents per liter and diesel 48.2 cents per liter9. With the
additional 21 % of VAT included in the final price this leaves the component of production costs
and world market prices, and a margin for gas station owners, which, according to Beta, an
organization for gas station entrepreneurs, is € 0.17 per liter of gasoline and diesel (2014).
According to UnitedConsumers, the margin for gas station owners is 11% on gasoline and 13%
on diesel10 with which all costs for exploiting the gas station are covered, a margin for the oil
companies distributing gasoline and diesel is included and distribution and marketing costs. The
following diagram illustrates the price buildup of the components according to UnitedConsumers.
The VAT is calculated over the production costs, margin and excise tax, so VAT is paid for the
excise taxes as well by the consumer. Figure 2.2 illustrates the 2015 buildup.
VAT revenue is paid by the consumer to the gas station owner and is then paid to the government
on a monthly or quarterly basis through a VAT tax return. For excise taxes, these can even be paid
on a weekly basis with an excise tax return. Overall excise taxes income due to gasoline was 3960
9 Jeroen Koot, FD, 17-12-2014 http://fd.nl/ondernemen/1085415/benzine-en-diesel-zeker-15-
cent-per-liter-te-duur
10 https://www.unitedconsumers.com/tanken/informatie/opbouw-brandstofprijzen.asp
17% 17%
43%32%
11%
13%
29%38%
0%
20%
40%
60%
80%
100%
120%
Gasoline Diesel
Per
cen
tag
e o
f to
tal
pri
ce
Fuel type
Figure 2.2 - Price component split of gasoline & diesel
Production costs
Margin
Excise
VAT
Source: United Consumers 2015, www.unitedconsumers.com
Master Thesis Fiscal Economics N van Duurling
23
million in 2013 and 4042 million in 2014 as opposed to diesel and LPG excise taxes amounting to
3629 million in 2013 and 3832 million in 2014.
4.3 Gas stations characteristics
In the economic analysis there was a small section that focused on different gas stations within the
gas station industry. The industry in the Netherlands is comprised of three types of gas station
owners, namely the large multinational companies such as Shell, Total, Exxonmobil etc. who own
gas stations next to being large players in the crude oil market. The other two are franchises and
‘white’ stations. The first is a gas station that carries the name of one of the larger crude oil market
players, but pays a franchise fee and is backed by these companies. The latter, however, are
considered ‘white’ stations, because they purchase crude oil at the world market price and are
subject to any price changes on this market. They operate as personal owners and require a large
capital investment in order to enter the market of gas stations. They also are less able to make use
of economies of scale as opposed to the multinational companies who can be more efficient when
it comes to filing tax returns, can exploit distribution in a more effective manner by making use of
bulk discounts and do not possess the same knowledge as larger, more experienced firms might.
The ‘white’ station can, however, purchase crude oil at the lowest price from different oil
companies since their product choice is not secluded to one provider, but quite often they do not
add fuel improvement additives that the larger companies include (BOVAG).
Another factor that determines the revenue for gas stations is whether it chooses to act as a staffed
or unstaffed station. If there is a store in the gas station, it is almost always staffed, however, if
there are only filling stations there is no need to staff these stations. This drives down the costs of
doing business and therefore allows owners to lower prices if so desired whilst keeping up a margin
of revenue.
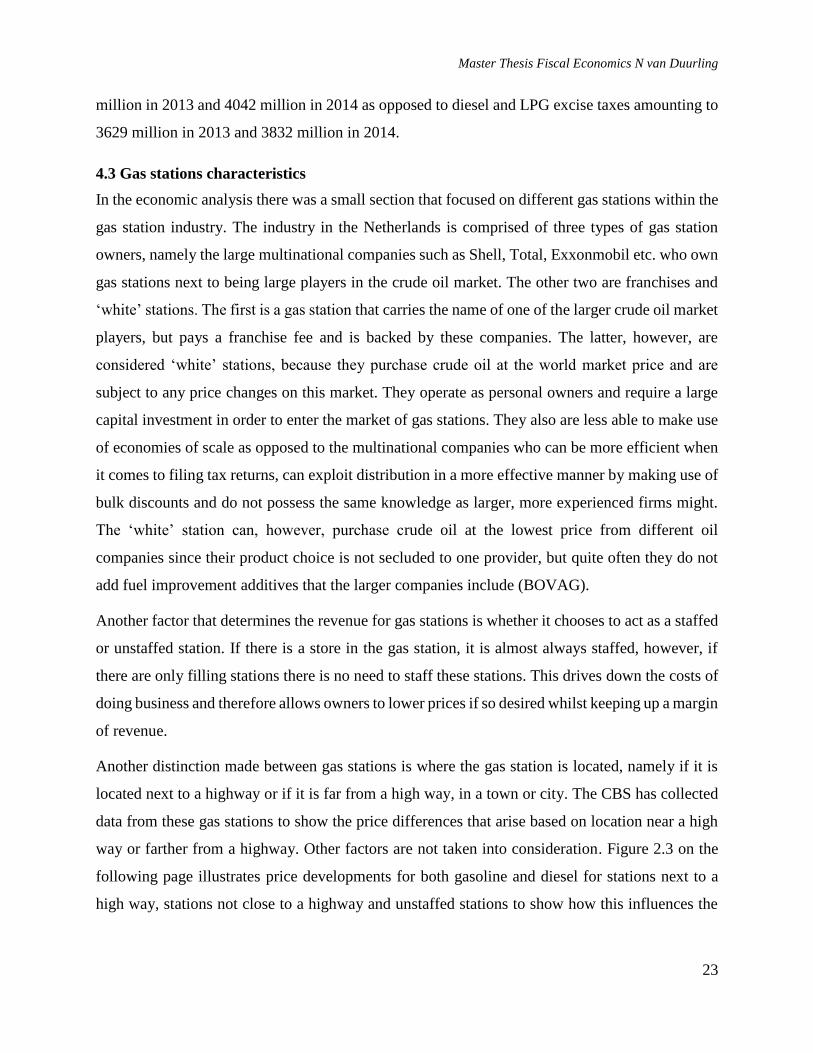
Another distinction made between gas stations is where the gas station is located, namely if it is
located next to a highway or if it is far from a high way, in a town or city. The CBS has collected
data from these gas stations to show the price differences that arise based on location near a high
way or farther from a highway. Other factors are not taken into consideration. Figure 2.3 on the
following page illustrates price developments for both gasoline and diesel for stations next to a
high way, stations not close to a highway and unstaffed stations to show how this influences the
Master Thesis Fiscal Economics N van Duurling
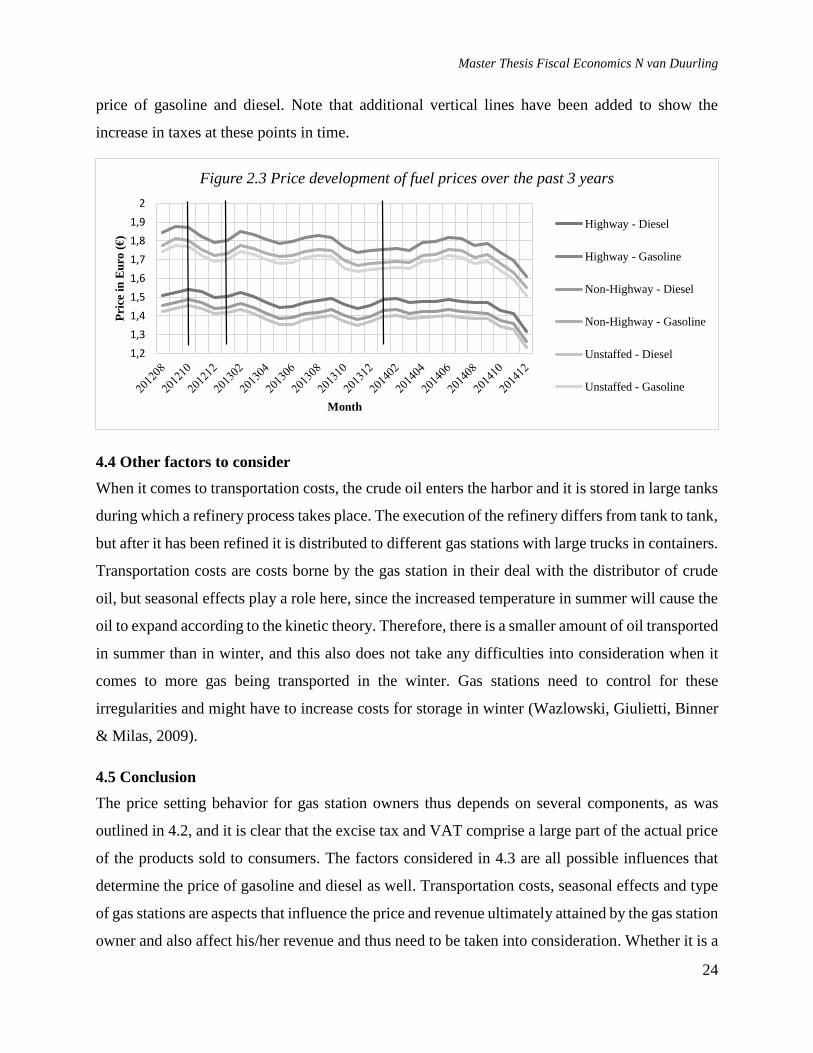
24
price of gasoline and diesel. Note that additional vertical lines have been added to show the
increase in taxes at these points in time.
4.4 Other factors to consider
When it comes to transportation costs, the crude oil enters the harbor and it is stored in large tanks
during which a refinery process takes place. The execution of the refinery differs from tank to tank,
but after it has been refined it is distributed to different gas stations with large trucks in containers.
Transportation costs are costs borne by the gas station in their deal with the distributor of crude
oil, but seasonal effects play a role here, since the increased temperature in summer will cause the
oil to expand according to the kinetic theory. Therefore, there is a smaller amount of oil transported
in summer than in winter, and this also does not take any difficulties into consideration when it
comes to more gas being transported in the winter. Gas stations need to control for these
irregularities and might have to increase costs for storage in winter (Wazlowski, Giulietti, Binner
& Milas, 2009).
4.5 Conclusion
The price setting behavior for gas station owners thus depends on several components, as was
outlined in 4.2, and it is clear that the excise tax and VAT comprise a large part of the actual price
of the products sold to consumers. The factors considered in 4.3 are all possible influences that
determine the price of gasoline and diesel as well. Transportation costs, seasonal effects and type
of gas stations are aspects that influence the price and revenue ultimately attained by the gas station
owner and also affect his/her revenue and thus need to be taken into consideration. Whether it is a
1,2
1,3
1,4
1,5
1,6
1,7
1,8
1,9
2
Pri
ce i
n E
uro
(€
)
Month
Figure 2.3 Price development of fuel prices over the past 3 years
Highway - Diesel
Highway - Gasoline
Non-Highway - Diesel
Non-Highway - Gasoline
Unstaffed - Diesel
Unstaffed - Gasoline
Master Thesis Fiscal Economics N van Duurling
25
multinational company or a ‘white’ station, and whether they are staffed or unstaffed it can be
necessary to account for these influences in the data analysis.
Master Thesis Fiscal Economics N van Duurling
26
5. Methodology
In this chapter I will outline the methodology I use to analyze the collected data in order to
determine whether the border regions in the Netherlands are affected by the increase in VAT and
excise tax. The research question is studied using a difference-in-differences analysis (DD
analysis). First, I will separate the data into several categories. Second, I will determine the average
treatment effect on the treated for both border stations and non-border stations. Third, I will use
the DD analysis to study the difference between the category unit price for gasoline or diesel using
the average fuel-price level in Belgium and Germany as a control group. The key objective is to
calculate a difference between border gas stations and other gas stations in the Netherlands by
making use of aggregated Belgian and German data and by comparing the DD analyses per
category.
5.1 Border region categories
First, I identified the border gas stations from the data set of 514 gas stations in the Netherlands
retrieved from Orange Peak Company. I analyzed their distance from the border by using Google
Maps to calculate the driven kilometers to the border. I used driven kilometers from the border,
because this is the measurement level a consumer would use to determine whether it is lucrative
to drive across the border to purchase gasoline or diesel. After this border point, consumers still
need to drive before they reach another gas station, but since this measurement is the same for all
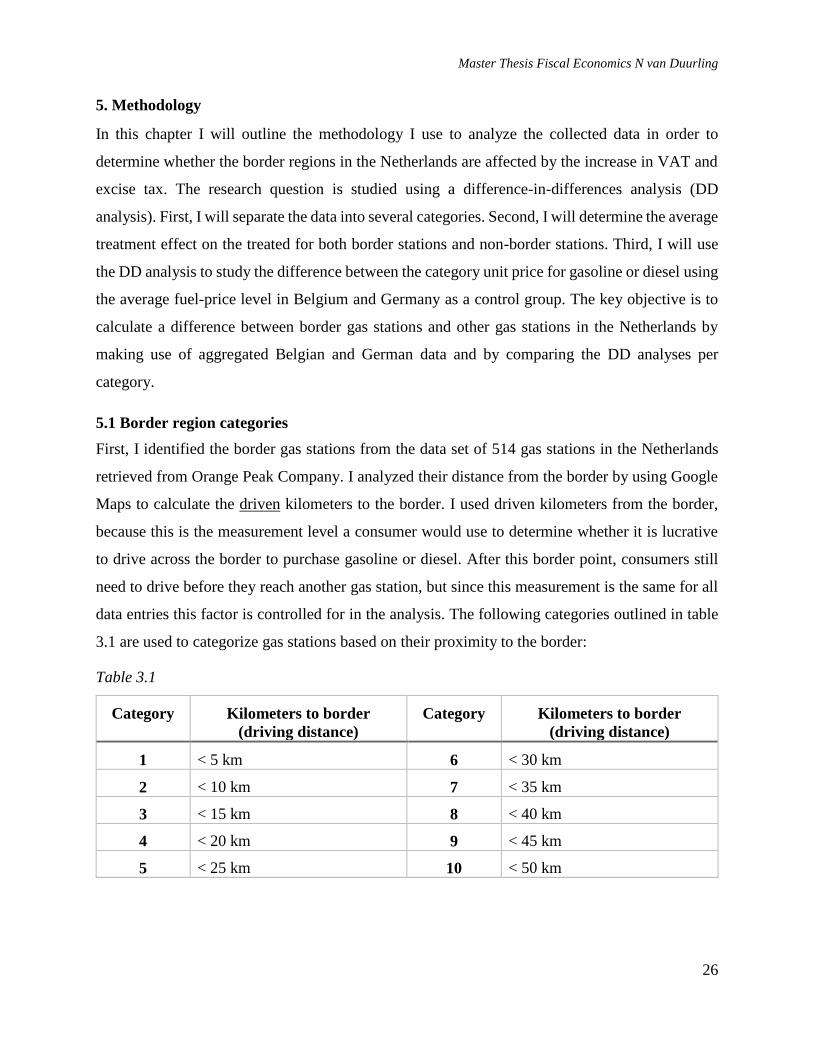
data entries this factor is controlled for in the analysis. The following categories outlined in table
3.1 are used to categorize gas stations based on their proximity to the border:
Table 3.1
Category Kilometers to border
(driving distance)
Category Kilometers to border
(driving distance)
1 < 5 km 6 < 30 km
2 < 10 km 7 < 35 km
3 < 15 km 8 < 40 km
4 < 20 km 9 < 45 km
5 < 25 km 10 < 50 km
Master Thesis Fiscal Economics N van Duurling
27
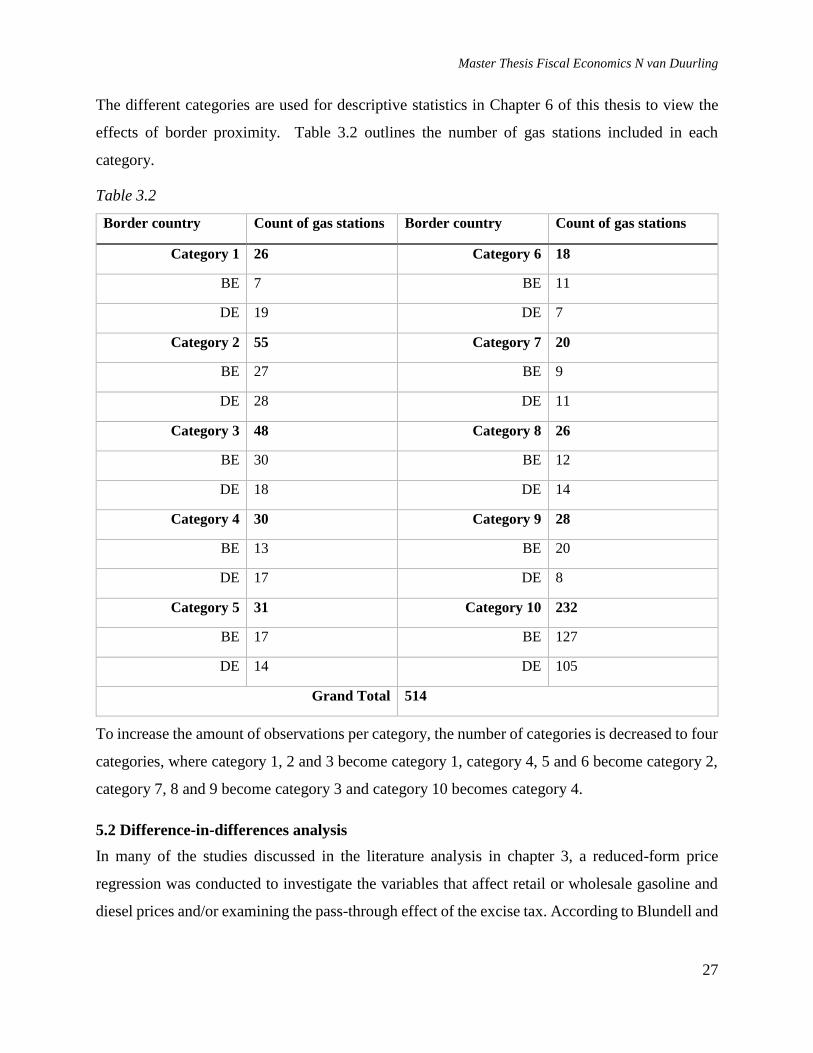
The different categories are used for descriptive statistics in Chapter 6 of this thesis to view the
effects of border proximity. Table 3.2 outlines the number of gas stations included in each
category.
Table 3.2
Border country Count of gas stations Border country Count of gas stations
Category 1 26 Category 6 18
BE 7 BE 11
DE 19 DE 7
Category 2 55 Category 7 20
BE 27 BE 9
DE 28 DE 11
Category 3 48 Category 8 26
BE 30 BE 12
DE 18 DE 14
Category 4 30 Category 9 28
BE 13 BE 20
DE 17 DE 8
Category 5 31 Category 10 232
BE 17 BE 127
DE 14 DE 105
Grand Total 514
To increase the amount of observations per category, the number of categories is decreased to four
categories, where category 1, 2 and 3 become category 1, category 4, 5 and 6 become category 2,
category 7, 8 and 9 become category 3 and category 10 becomes category 4.
5.2 Difference-in-differences analysis
In many of the studies discussed in the literature analysis in chapter 3, a reduced-form price
regression was conducted to investigate the variables that affect retail or wholesale gasoline and
diesel prices and/or examining the pass-through effect of the excise tax. According to Blundell and
Master Thesis Fiscal Economics N van Duurling
28
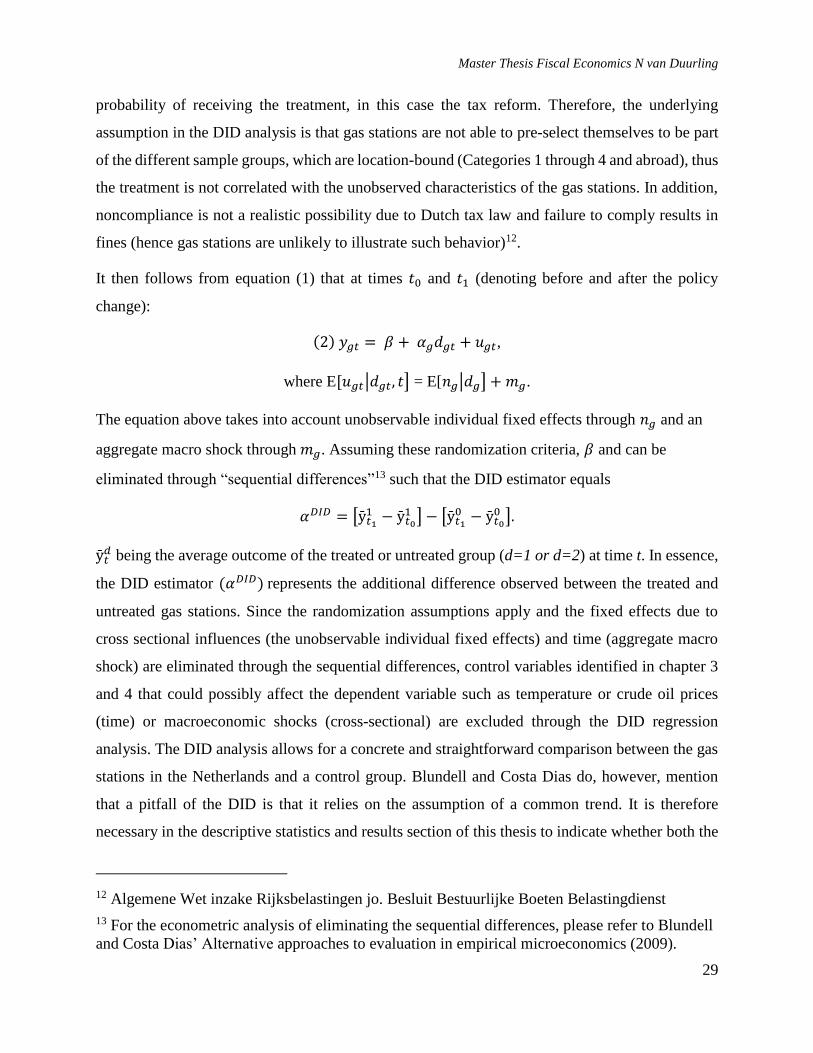
Costa Dias11, however, the “choice of evaluation method will depend on [...] the nature of the
question to be answered; the type and quality of data available; and the mechanism by which
individuals are allocated to the program or receive the policy”. The question to be answered is
what the effect of the VAT increase and excise tax increase has on gasoline and diesel price by
comparing this to an untreated control group in order to illustrate whether there is a difference.
According to Blundell and Costa Dias, if dummy variable d indicates treatment, 1 for treatment
and 0 for non-treatment, the potential outcomes for gas stations being y1g and y0
g for gas stations
subject and not subject to the reform, respectively, this is illustrated in the following manner (the
equations are amended to gas stations as individuals):
𝑦𝑔1 = 𝛽 + 𝛼𝑔 + 𝑢𝑔
𝑦𝑔0 = 𝛽 + 𝑢𝑔
Where 𝛽 is the intercept parameter, 𝛼𝑔 is the effect of the tax reform on the gas station and u being
an unobserved component of y, the observable outcome being:
𝑦𝑔 = 𝑑𝑔𝑦𝑔1 + (1 − 𝑑𝑔)𝑦𝑔
0,
such that: (1) 𝑦𝑔 = 𝛽 + 𝛼𝑔𝑑𝑔 + 𝑢𝑔.
The objective of this thesis is to study the effect of the tax reform on different border categories in
the Netherlands, and by comparing these to untreated control groups through a difference-in-
differences (DID) analysis this can be determined if the underlying conditions of a DID analysis
are satisfied. According to Blundell and Costa Dias, the DID estimator relies on a common trend
assumption, so it is necessary for both the control group as well as the treatment group to
experience a similar common trend, where the change over time for this trend per group (both
control and treatment) is the untreated outcome. This is denoted by “𝑚𝑔” under (2). Furthermore,
Blundell and Costa Dias discuss that there is assumedly “no selection on the transitory shock”.
This indicates that the treatment applied to the treatment group is not allowed to be correlated with
unobserved characteristics, denoted by 𝑢𝑔 under (2) for either the treatment or control group. This
correlation can solely occur when the individuals, in this case the gas stations, can influence the
11 Blundell, R., Dias, M.C., 2009. Alternative approaches to evaluation in empirical
microeconomics. The Journal of Human Resources. 44, 3. 2009.
Master Thesis Fiscal Economics N van Duurling
29
probability of receiving the treatment, in this case the tax reform. Therefore, the underlying
assumption in the DID analysis is that gas stations are not able to pre-select themselves to be part
of the different sample groups, which are location-bound (Categories 1 through 4 and abroad), thus
the treatment is not correlated with the unobserved characteristics of the gas stations. In addition,
noncompliance is not a realistic possibility due to Dutch tax law and failure to comply results in
fines (hence gas stations are unlikely to illustrate such behavior)12.
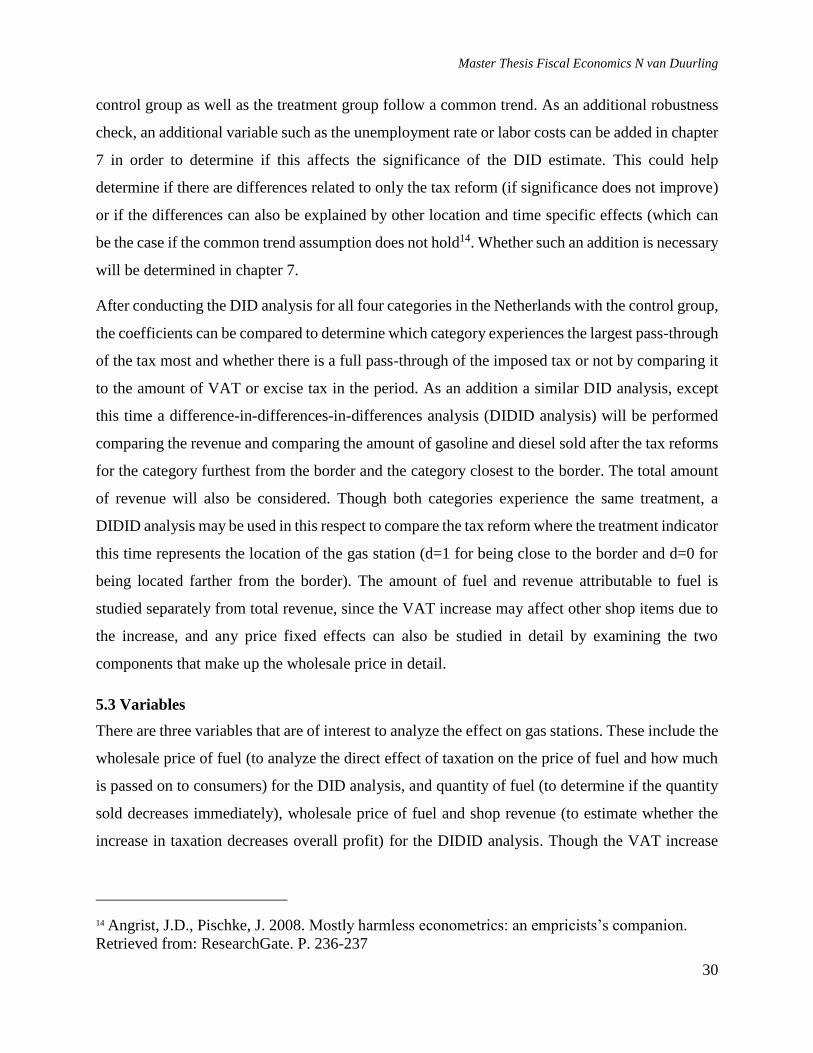
It then follows from equation (1) that at times 𝑡0 and 𝑡1 (denoting before and after the policy
change):
(2) 𝑦𝑔𝑡 = 𝛽 + 𝛼𝑔𝑑𝑔𝑡 + 𝑢𝑔𝑡,
where E[𝑢𝑔𝑡|𝑑𝑔𝑡, 𝑡] = E[𝑛𝑔|𝑑𝑔] + 𝑚𝑔.
The equation above takes into account unobservable individual fixed effects through 𝑛𝑔 and an
aggregate macro shock through 𝑚𝑔. Assuming these randomization criteria, 𝛽 and can be
eliminated through “sequential differences”13 such that the DID estimator equals
𝛼𝐷𝐼𝐷 = [ȳ𝑡11 − ȳ𝑡0
1 ] − [ȳ𝑡1
0 − ȳ𝑡0
0 ].
ȳ𝑡𝑑 being the average outcome of the treated or untreated group (d=1 or d=2) at time t. In essence,
the DID estimator (𝛼𝐷𝐼𝐷) represents the additional difference observed between the treated and
untreated gas stations. Since the randomization assumptions apply and the fixed effects due to
cross sectional influences (the unobservable individual fixed effects) and time (aggregate macro
shock) are eliminated through the sequential differences, control variables identified in chapter 3
and 4 that could possibly affect the dependent variable such as temperature or crude oil prices
(time) or macroeconomic shocks (cross-sectional) are excluded through the DID regression
analysis. The DID analysis allows for a concrete and straightforward comparison between the gas
stations in the Netherlands and a control group. Blundell and Costa Dias do, however, mention
that a pitfall of the DID is that it relies on the assumption of a common trend. It is therefore
necessary in the descriptive statistics and results section of this thesis to indicate whether both the
12 Algemene Wet inzake Rijksbelastingen jo. Besluit Bestuurlijke Boeten Belastingdienst
13 For the econometric analysis of eliminating the sequential differences, please refer to Blundell
and Costa Dias’ Alternative approaches to evaluation in empirical microeconomics (2009).
Master Thesis Fiscal Economics N van Duurling
30
control group as well as the treatment group follow a common trend. As an additional robustness
check, an additional variable such as the unemployment rate or labor costs can be added in chapter
7 in order to determine if this affects the significance of the DID estimate. This could help
determine if there are differences related to only the tax reform (if significance does not improve)
or if the differences can also be explained by other location and time specific effects (which can
be the case if the common trend assumption does not hold14. Whether such an addition is necessary
will be determined in chapter 7.
After conducting the DID analysis for all four categories in the Netherlands with the control group,
the coefficients can be compared to determine which category experiences the largest pass-through
of the tax most and whether there is a full pass-through of the imposed tax or not by comparing it
to the amount of VAT or excise tax in the period. As an addition a similar DID analysis, except
this time a difference-in-differences-in-differences analysis (DIDID analysis) will be performed
comparing the revenue and comparing the amount of gasoline and diesel sold after the tax reforms
for the category furthest from the border and the category closest to the border. The total amount
of revenue will also be considered. Though both categories experience the same treatment, a
DIDID analysis may be used in this respect to compare the tax reform where the treatment indicator
this time represents the location of the gas station (d=1 for being close to the border and d=0 for
being located farther from the border). The amount of fuel and revenue attributable to fuel is
studied separately from total revenue, since the VAT increase may affect other shop items due to
the increase, and any price fixed effects can also be studied in detail by examining the two
components that make up the wholesale price in detail.
5.3 Variables
There are three variables that are of interest to analyze the effect on gas stations. These include the
wholesale price of fuel (to analyze the direct effect of taxation on the price of fuel and how much
is passed on to consumers) for the DID analysis, and quantity of fuel (to determine if the quantity
sold decreases immediately), wholesale price of fuel and shop revenue (to estimate whether the
increase in taxation decreases overall profit) for the DIDID analysis. Though the VAT increase
14 Angrist, J.D., Pischke, J. 2008. Mostly harmless econometrics: an empricists’s companion.
Retrieved from: ResearchGate. P. 236-237
Master Thesis Fiscal Economics N van Duurling
31
does not affect the price of food and beverages in the shop of the gas station15, consumers will be
less likely to stop in order to purchase additional food or beverages. Impulse purchases can
decrease along with stops made for fuel purchases. As a control group, data from Germany and
Belgium will be used since these countries are located close to the Netherlands are expected to
experience similar macroeconomic shocks and seasonal influences. Whether the common trend
assumption for the DID analysis is met will be analyzed in the descriptive statistics section in
chapter 6 and the robustness check section in chapter 7. The DID analysis can only be conducted
for the unit price of gasoline and diesel, since data regarding the quantity of fuel and the shop
revenue for gas stations in Germany and Belgium is not available to be compared to. This data
can, however, be used for descriptive statistics to show development of these variables over time
for the different categories and for the DIDID analyses. The aggregates for Dutch, Belgian and
German gas stations in both border and non-border stations are compared in the DID analysis for:
1.1 The price of regular gasoline (unleaded 95)
1.2 The price of diesel
LPG and premium diesel and premium gasoline are left out of the analysis since unleaded gasoline
and diesel represent the types of fuel demanded most and these types are also used in Belgium and
Germany, allowing for a clean comparison in the DID analysis. Multiple linear regression analyses
are run for the different time periods, focusing on three different time frames representing the tax
reforms applicable:
The VAT increase in 2012 (t1)
The excise tax increase in 2013 (t2)
The excise tax increase in 2014 (t3)
Since not all 752 gas stations have data observations as of August 2012, only the gas stations with
data observations from the 1st of August 2012 are used for t1. The same goes for the other time
periods, t2 and t3, where data is filtered to only include gas stations that have full data available
during these time periods.
15 Omzetbelasting, Tabel I, the lower VAT rate of 6% applies to food and beverages.
Master Thesis Fiscal Economics N van Duurling
32
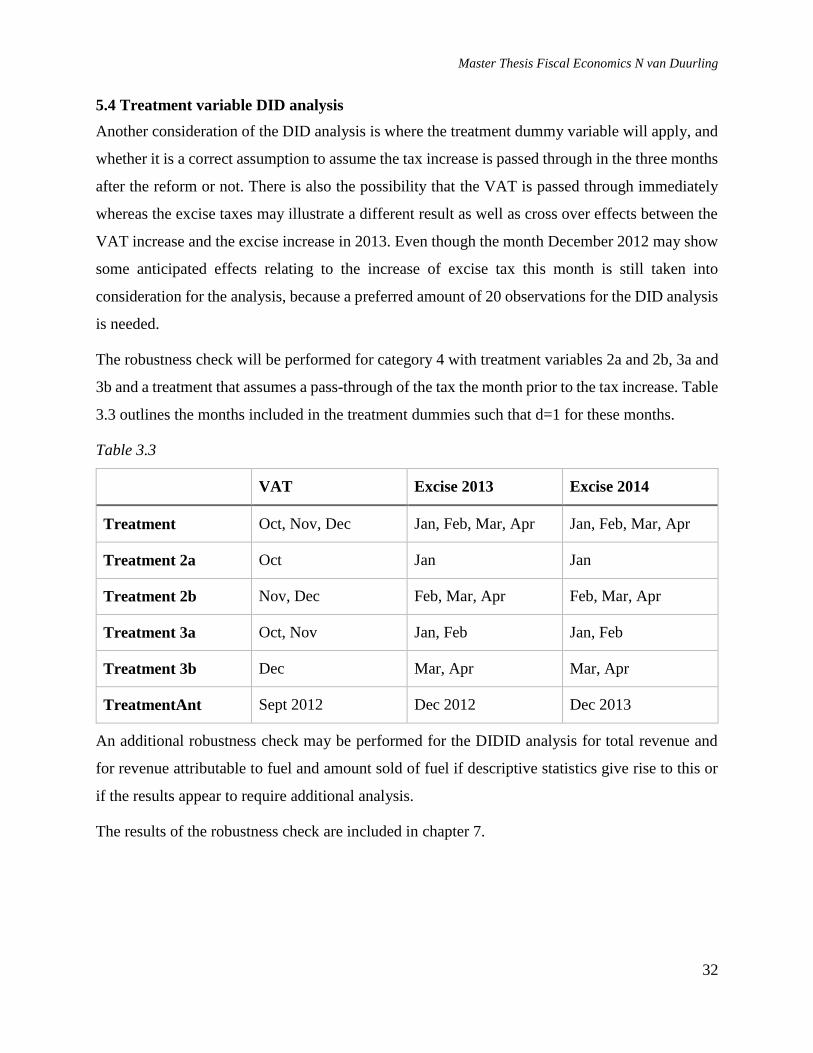
5.4 Treatment variable DID analysis
Another consideration of the DID analysis is where the treatment dummy variable will apply, and
whether it is a correct assumption to assume the tax increase is passed through in the three months
after the reform or not. There is also the possibility that the VAT is passed through immediately
whereas the excise taxes may illustrate a different result as well as cross over effects between the
VAT increase and the excise increase in 2013. Even though the month December 2012 may show
some anticipated effects relating to the increase of excise tax this month is still taken into
consideration for the analysis, because a preferred amount of 20 observations for the DID analysis
is needed.
The robustness check will be performed for category 4 with treatment variables 2a and 2b, 3a and
3b and a treatment that assumes a pass-through of the tax the month prior to the tax increase. Table
3.3 outlines the months included in the treatment dummies such that d=1 for these months.
Table 3.3
VAT Excise 2013 Excise 2014
Treatment Oct, Nov, Dec Jan, Feb, Mar, Apr Jan, Feb, Mar, Apr
Treatment 2a Oct Jan Jan
Treatment 2b Nov, Dec Feb, Mar, Apr Feb, Mar, Apr
Treatment 3a Oct, Nov Jan, Feb Jan, Feb
Treatment 3b Dec Mar, Apr Mar, Apr
TreatmentAnt Sept 2012 Dec 2012 Dec 2013
An additional robustness check may be performed for the DIDID analysis for total revenue and
for revenue attributable to fuel and amount sold of fuel if descriptive statistics give rise to this or
if the results appear to require additional analysis.
The results of the robustness check are included in chapter 7.
Master Thesis Fiscal Economics N van Duurling
33
6. Data
For the analysis, data was obtained from Orange Peak Company and from the database of the
Centraal Bureau voor Statistiek (CBS) to represent “white” gas stations in the Netherlands. Data
for Belgium and Germany was collected through the governmental institutions for data collection
and institutions that focus on collecting energy statistics16. Aggregated gasoline and diesel prices
were collected per month, whereas data from Orange Peak Company was analyzed on a weekly
basis and later converted into months for comparative purposes.
6.1.1 VAT data
The VAT was increased by 2%, from 19% to 21% on the 1st of October 2012. Data was collected
two months prior to the VAT increase from 1 August 2012 to 31 September 2012 to be
representative of the data set before the VAT increase and to represent the control and treatment
group before the treatment. This was done for all categories of border gas stations and other gas
stations in the Netherlands. Data was used after the VAT increase for three months, from 1 October
2012 to 31 December 2012. Average wholesale prices of both Belgium and Germany included
taxes were collected over the same period of time. Even though the month December 2012 may
show some anticipated effects relating to the increase of excise tax this month is still taken into
consideration for the analysis, because a preferred amount of 20 observations for the DID analysis
is needed (see chapter 5 for a discussion on the treatment variable).
6.1.2 Excise tax data
Data was collected three months before and 4 months after the increase of excise tax in 2013
(€0,016 for gasoline and €0,010 for diesel per liter sold) for 17 weeks. Data was collected over
2013 and over 2014 as well to analyze any effect that might have occurred before the new excise
tax increase in 2014 (€0,013 for gasoline and €0,038 for diesel per liter sold). Average wholesale
prices of both Belgium and Germany including taxes were collected over the same period of time.
For the increase of 2013 it is possible that the data in the months prior to the excise increase may
16 Data Germany: Mineralölwirtschaftsverband e.V. retrieved from:
http://www.mwv.de/index.php/daten/statistikenpreise/?loc=9
Data Belgium: Statistics Belgium retrieved from:
http://statbel.fgov.be/nl/statistieken/webinterface/beSTAT_home/#1
Master Thesis Fiscal Economics N van Duurling
34
show effects relating to the VAT increase as well, which is why a preferred regression analysis is
run to test whether inclusion of three, two or one month(s) leads to significance of the results. The
data for the time after the excise tax is limited to a maximum of four months to ensure exclusion
of any other price influences throughout the time period.
6.1.3 Other data considerations
The data obtained from Orange Peak Company included the amount of liters of gasoline and diesel
sold at the gas stations and included the revenue obtained per item. From this data, the retail price
of gasoline and diesel was calculated providing a real time price overview per week. This data was
aggregated into an average unit price of diesel or gasoline per border category over time. In order
to increase the amount of gas stations per DD analysis, since the time frame did not include all 752
gas stations and could only include the gas stations that had a full pallet of data over the time
period, the categories were transformed into four new categories, categories 1, 2 and 3 becoming
category 1, categories 4, 5 and 6 becoming category 2, categories 7, 8 and 9 becoming category 3
and category 10 becoming category 4.
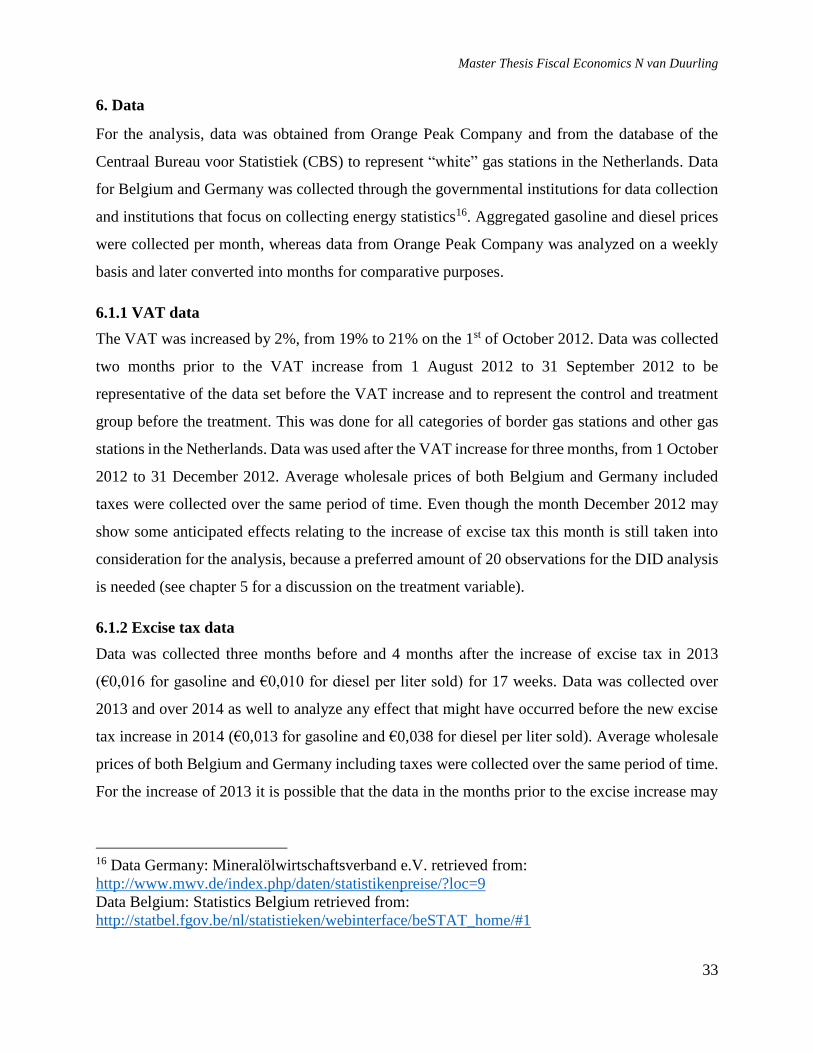
The amount of gas station observations after the time period restrictions and aggregation of the
categories is as presented in table 4.1:
Gas stations Count VAT increase Count Excise 2013
increase
Count Excise 2014
increase
Category 1 < 15km 29 29 22
Category 2 < 30km 19 19 19
Category 3 < 45km 16 16 16
Category 4 > 45km 72 72 79
The decrease in gas stations in category 1 is explained due to some missing data entries in the
midst of the time period t3 whereas the increase for category 4 can be explained by Orange Peak
collecting information from more gas stations.
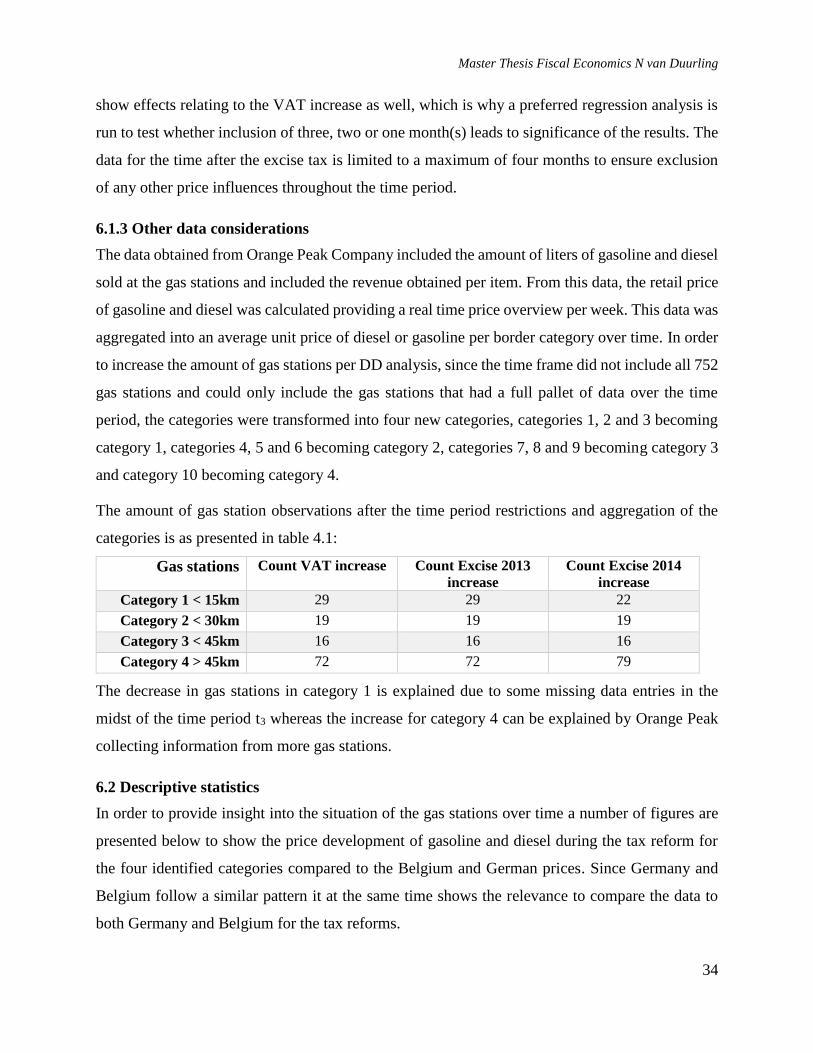
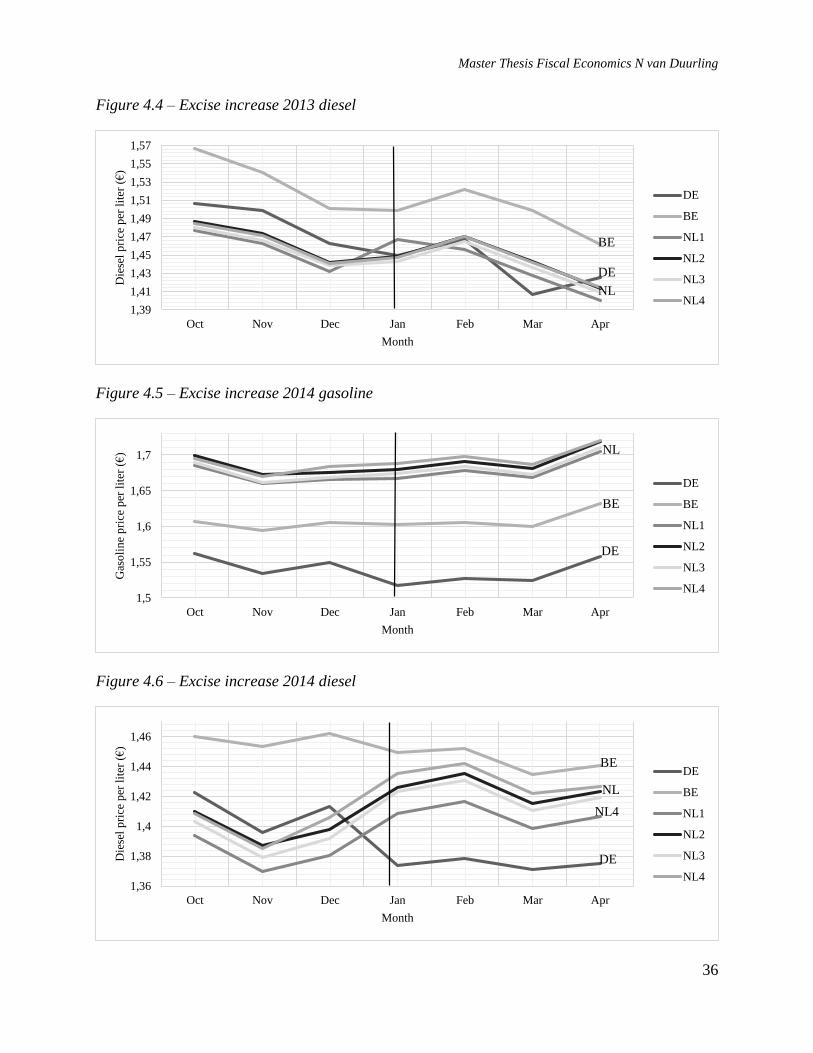
6.2 Descriptive statistics
In order to provide insight into the situation of the gas stations over time a number of figures are
presented below to show the price development of gasoline and diesel during the tax reform for
the four identified categories compared to the Belgium and German prices. Since Germany and
Belgium follow a similar pattern it at the same time shows the relevance to compare the data to
both Germany and Belgium for the tax reforms.
Master Thesis Fiscal Economics N van Duurling
35
Figure 4.1 – VAT increase gasoline
Figure 4.2 – VAT increase diesel
Figure 4.3 – Excise increase 2013 gasoline
1,55
1,6
1,65
1,7
1,75
1,8
1,85
Aug Sep Oct Nov Dec
Gas
oli
ne
pri
ce p
er l
iter
(€
)
Month
DE
BE
NL1
NL2
NL3
NL4
1,42
1,44
1,46
1,48
1,5
1,52
1,54
1,56
1,58
Aug Sep Oct Nov Dec
Die
sel
pri
ce p
er l
iter
(€
)
Month
DE
BE
NL1
NL2
NL3
NL4
1,55
1,6
1,65
1,7
1,75
1,8
Oct Nov Dec Jan Feb Mar Apr
Gas
oli
ne
pri
ce p
er l
iter
(€
)
Month
DE
BE
NL1
NL2
NL3
NL4
DE
BE
NL
NL
DE
BE
BE
DE
NL
Master Thesis Fiscal Economics N van Duurling
36
Figure 4.4 – Excise increase 2013 diesel
Figure 4.5 – Excise increase 2014 gasoline
Figure 4.6 – Excise increase 2014 diesel
1,39
1,41
1,43
1,45
1,47
1,49
1,51
1,53
1,55
1,57
Oct Nov Dec Jan Feb Mar Apr
Die
sel
pri
ce p
er l
iter
(€
)
Month
DE
BE
NL1
NL2
NL3
NL4
1,5
1,55
1,6
1,65
1,7
Oct Nov Dec Jan Feb Mar Apr
Gas
oli
ne
pri
ce p
er l
iter
(€
)
Month
DE
BE
NL1
NL2
NL3
NL4
1,36
1,38
1,4
1,42
1,44
1,46
Oct Nov Dec Jan Feb Mar Apr
Die
sel
pri
ce p
er l
iter
(€
)
Month
DE
BE
NL1
NL2
NL3
NL4
NL
DE
BE
BE
DE
NL
DE
BE
NL
NL4
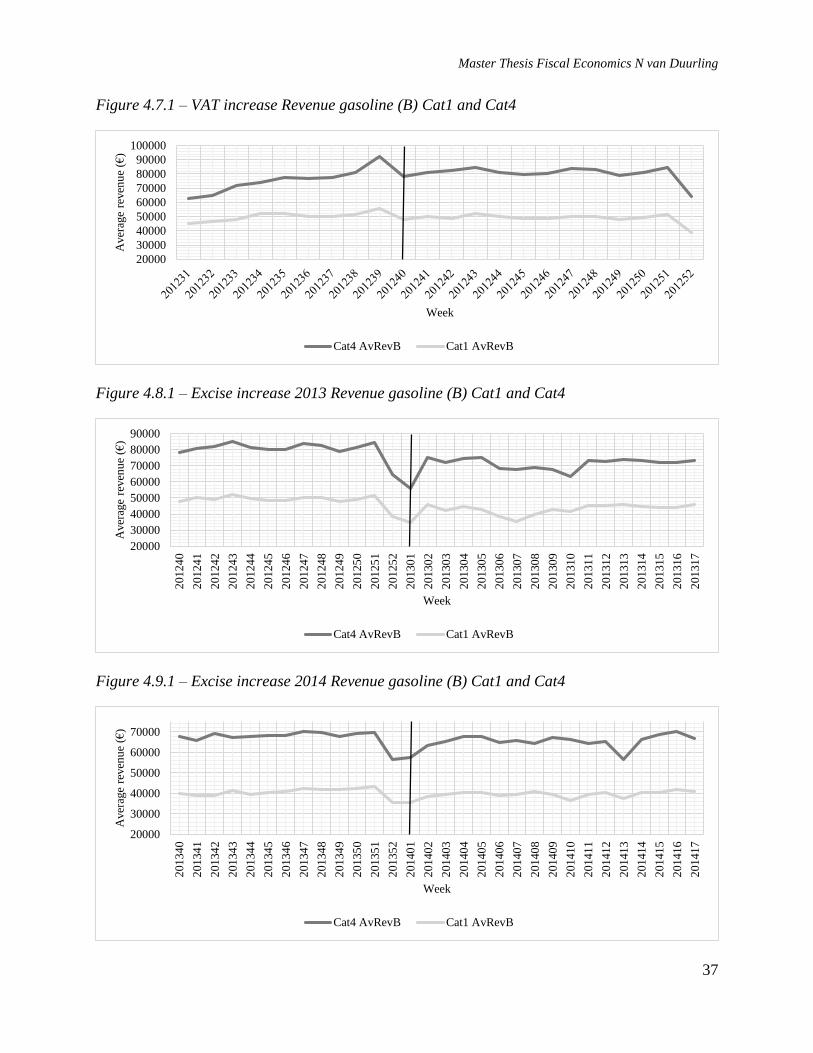
Master Thesis Fiscal Economics N van Duurling
37
Figure 4.7.1 – VAT increase Revenue gasoline (B) Cat1 and Cat4
Figure 4.8.1 – Excise increase 2013 Revenue gasoline (B) Cat1 and Cat4
Figure 4.9.1 – Excise increase 2014 Revenue gasoline (B) Cat1 and Cat4
20000
30000
40000
50000
60000
70000
80000
90000
100000
Aver
age
reven
ue
(€)
Week
Cat4 AvRevB Cat1 AvRevB
20000
30000
40000
50000
60000
70000
80000
90000
201
24
0
201
24
1
201
24
2
201
24
3
201
24
4
201
24
5
201
24
6
201
24
7
201
24
8
201
24
9
201
25
0
201
25
1
201
25
2
201
30
1
201
30
2
201
30
3
201
30
4
201
30
5
201
30
6
201
30
7
201
30
8
201
30
9
201
31
0
201
31
1
201
31
2
201
31
3
201
31
4
201
31
5
201
31
6
201
31
7
Aver
age
reven
ue
(€)
Week
Cat4 AvRevB Cat1 AvRevB
20000
30000
40000
50000
60000
70000
201
34
0
201
34
1
201
34
2
201
34
3
201
34
4
201
34
5
201
34
6
201
34
7
201
34
8
201
34
9
201
35
0
201
35
1
201
35
2
201
40
1
201
40
2
201
40
3
201
40
4
201
40
5
201
40
6
201
40
7
201
40
8
201
40
9
201
41
0
201
41
1
201
41
2
201
41
3
201
41
4
201
41
5
201
41
6
201
41
7
Aver
age
reven
ue
(€)
Week
Cat4 AvRevB Cat1 AvRevB
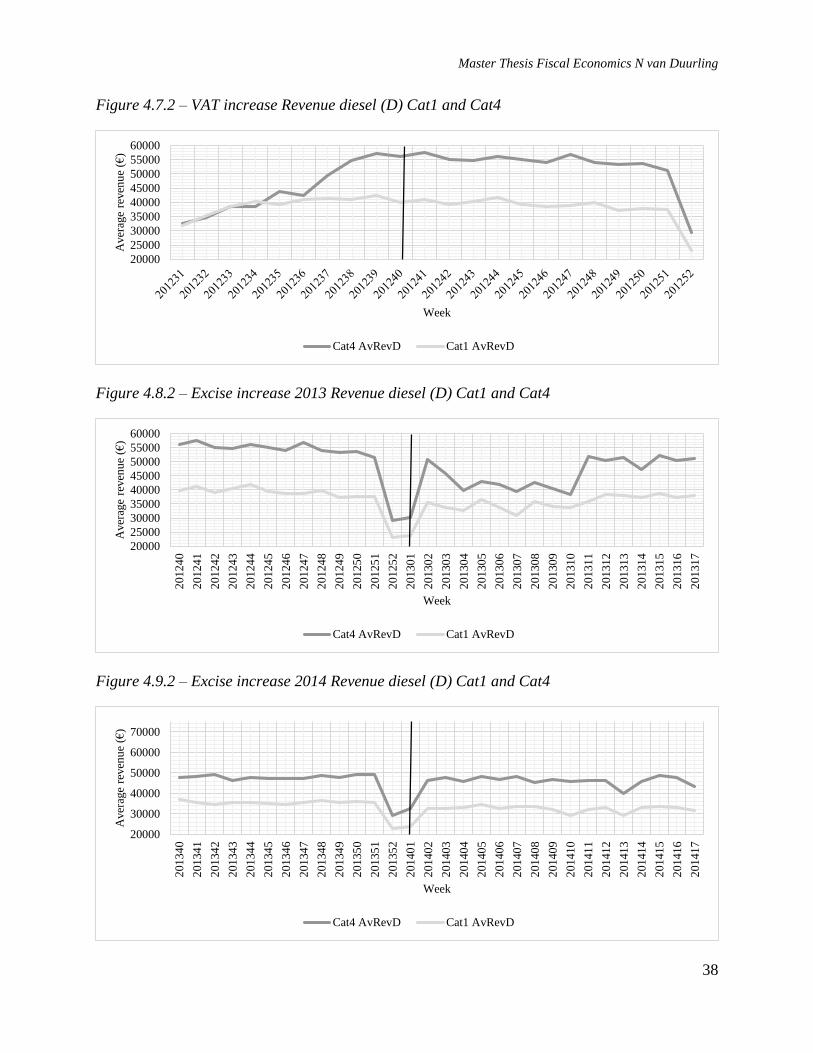
Master Thesis Fiscal Economics N van Duurling
38
Figure 4.7.2 – VAT increase Revenue diesel (D) Cat1 and Cat4
Figure 4.8.2 – Excise increase 2013 Revenue diesel (D) Cat1 and Cat4
Figure 4.9.2 – Excise increase 2014 Revenue diesel (D) Cat1 and Cat4
20000
25000
30000
35000
40000
45000
50000
55000
60000
Aver
age
reven
ue
(€)
Week
Cat4 AvRevD Cat1 AvRevD
20000
25000
30000
35000
40000
45000
50000
55000
60000
201
24
0
201
24
1
201
24
2
201
24
3
201
24
4
201
24
5
201
24
6
201
24
7
201
24
8
201
24
9
201
25
0
201
25
1
201
25
2
201
30
1
201
30
2
201
30
3
201
30
4
201
30
5
201
30
6
201
30
7
201
30
8
201
30
9
201
31
0
201
31
1
201
31
2
201
31
3
201
31
4
201
31
5
201
31
6
201
31
7
Aver
age
reven
ue
(€)
Week
Cat4 AvRevD Cat1 AvRevD
20000
30000
40000
50000
60000
70000
201
34
0
201
34
1
201
34
2
201
34
3
201
34
4
201
34
5
201
34
6
201
34
7
201
34
8
201
34
9
201
35
0
201
35
1
201
35
2
201
40
1
201
40
2
201
40
3
201
40
4
201
40
5
201
40
6
201
40
7
201
40
8
201
40
9
201
41
0
201
41
1
201
41
2
201
41
3
201
41
4
201
41
5
201
41
6
201
41
7
Aver
age
reven
ue
(€)
Week
Cat4 AvRevD Cat1 AvRevD
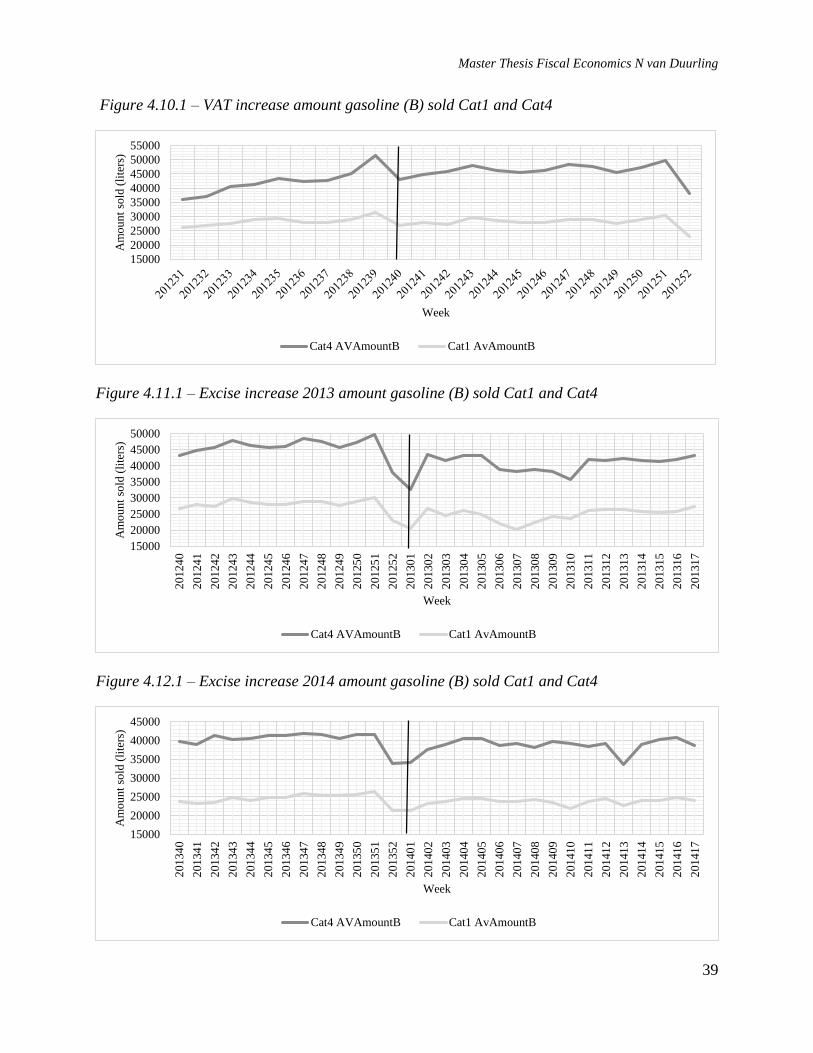
Master Thesis Fiscal Economics N van Duurling
39
Figure 4.10.1 – VAT increase amount gasoline (B) sold Cat1 and Cat4
Figure 4.11.1 – Excise increase 2013 amount gasoline (B) sold Cat1 and Cat4
Figure 4.12.1 – Excise increase 2014 amount gasoline (B) sold Cat1 and Cat4
15000
20000
25000
30000
35000
40000
45000
50000
55000
Am
ou
nt
sold
(li
ters
)
Week
Cat4 AVAmountB Cat1 AvAmountB
15000
20000
25000
30000
35000
40000
45000
50000
201
24
0
201
24
1
201
24
2
201
24
3
201
24
4
201
24
5
201
24
6
201
24
7
201
24
8
201
24
9
201
25
0
201
25
1
201
25
2
201
30
1
201
30
2
201
30
3
201
30
4
201
30
5
201
30
6
201
30
7
201
30
8
201
30
9
201
31
0
201
31
1
201
31
2
201
31
3
201
31
4
201
31
5
201
31
6
201
31
7
Am
ou
nt
sold
(li
ters
)
Week
Cat4 AVAmountB Cat1 AvAmountB
15000
20000
25000
30000
35000
40000
45000
201
34
0
201
34
1
201
34
2
201
34
3
201
34
4
201
34
5
201
34
6
201
34
7
201
34
8
201
34
9
201
35
0
201
35
1
201
35
2
201
40
1
201
40
2
201
40
3
201
40
4
201
40
5
201
40
6
201
40
7
201
40
8
201
40
9
201
41
0
201
41
1
201
41
2
201
41
3
201
41
4
201
41
5
201
41
6
201
41
7
Am
ou
nt
sold
(li
ters
)
Week
Cat4 AVAmountB Cat1 AvAmountB
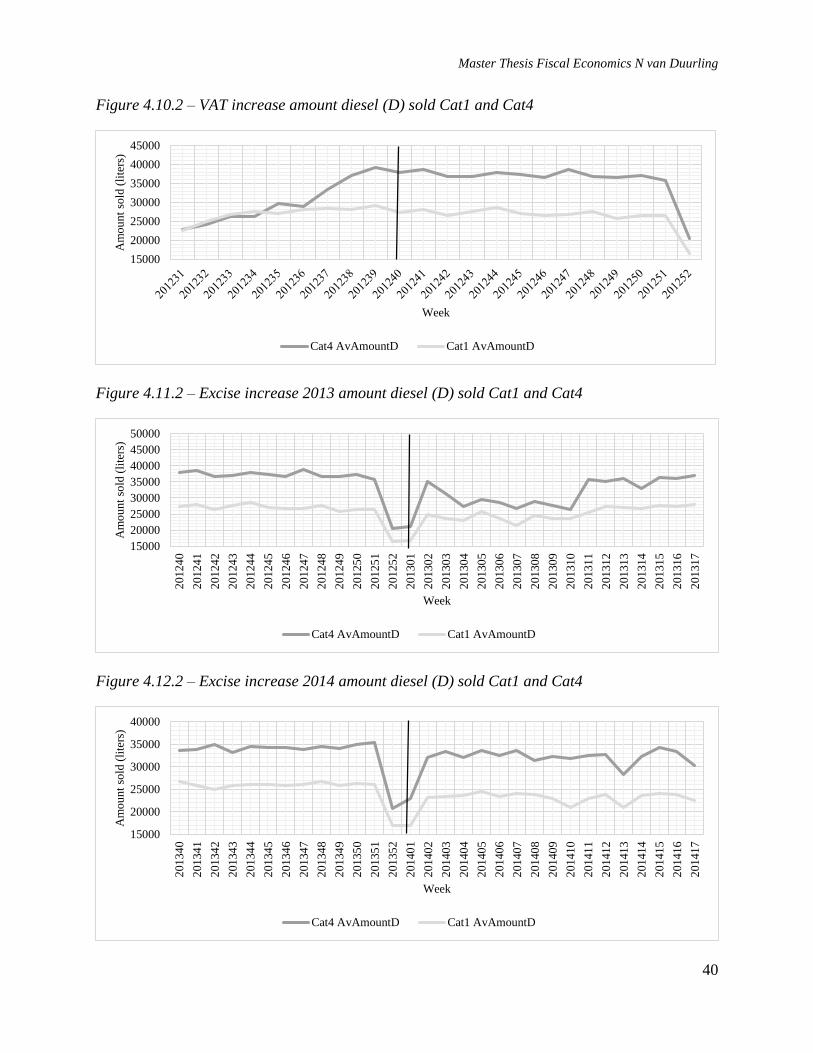
Master Thesis Fiscal Economics N van Duurling
40
Figure 4.10.2 – VAT increase amount diesel (D) sold Cat1 and Cat4
Figure 4.11.2 – Excise increase 2013 amount diesel (D) sold Cat1 and Cat4
Figure 4.12.2 – Excise increase 2014 amount diesel (D) sold Cat1 and Cat4
15000
20000
25000
30000
35000
40000
45000
Am
ou
nt
sold
(li
ters
)
Week
Cat4 AvAmountD Cat1 AvAmountD
15000
20000
25000
30000
35000
40000
45000
50000
201
24
0
201
24
1
201
24
2
201
24
3
201
24
4
201
24
5
201
24
6
201
24
7
201
24
8
201
24
9
201
25
0
201
25
1
201
25
2
201
30
1
201
30
2
201
30
3
201
30
4
201
30
5
201
30
6
201
30
7
201
30
8
201
30
9
201
31
0
201
31
1
201
31
2
201
31
3
201
31
4
201
31
5
201
31
6
201
31
7
Am
ou
nt
sold
(li
ters
)
Week
Cat4 AvAmountD Cat1 AvAmountD
15000
20000
25000
30000
35000
40000
201
34
0
201
34
1
201
34
2
201
34
3
201
34
4
201
34
5
201
34
6
201
34
7
201
34
8
201
34
9
201
35
0
201
35
1
201
35
2
201
40
1
201
40
2
201
40
3
201
40
4
201
40
5
201
40
6
201
40
7
201
40
8
201
40
9
201
41
0
201
41
1
201
41
2
201
41
3
201
41
4
201
41
5
201
41
6
201
41
7
Am
ou
nt
sold
(li
ters
)
Week
Cat4 AvAmountD Cat1 AvAmountD
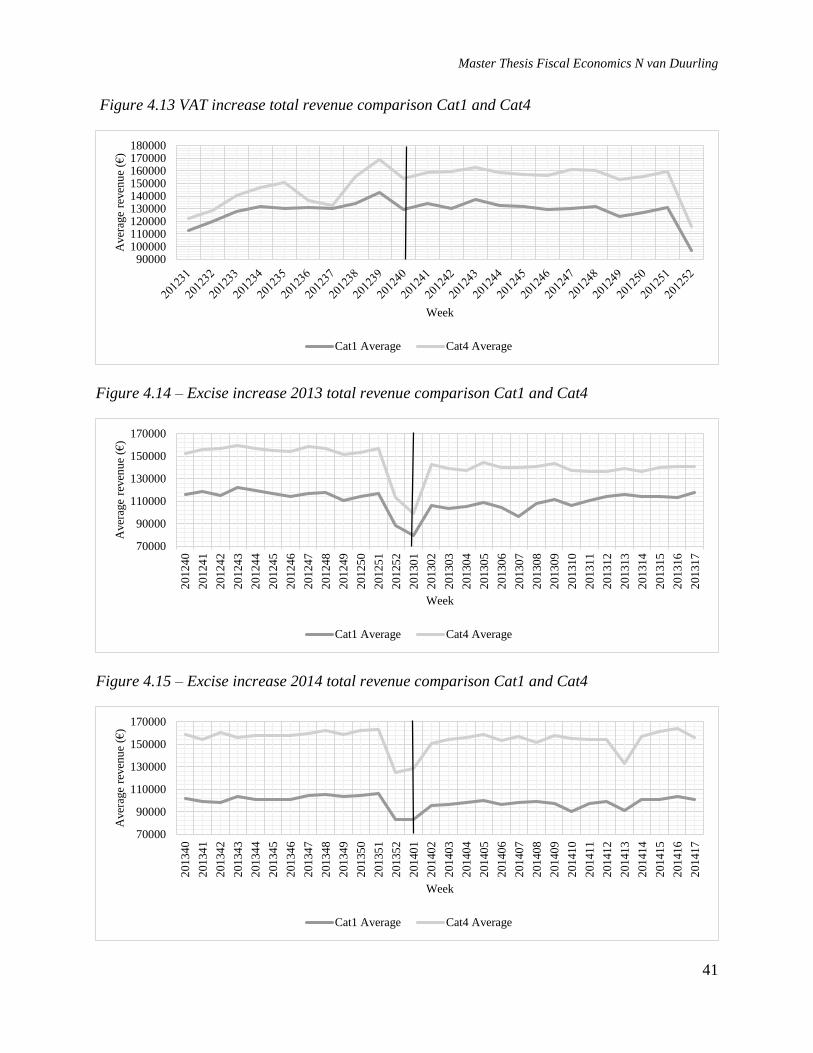
Master Thesis Fiscal Economics N van Duurling
41
Figure 4.13 VAT increase total revenue comparison Cat1 and Cat4
Figure 4.14 – Excise increase 2013 total revenue comparison Cat1 and Cat4
Figure 4.15 – Excise increase 2014 total revenue comparison Cat1 and Cat4
90000100000110000120000130000140000150000160000170000180000
Aver
age
reven
ue
(€)
Week
Cat1 Average Cat4 Average
70000
90000
110000
130000
150000
170000
201
24
0
201
24
1
201
24
2
201
24
3
201
24
4
201
24
5
201
24
6
201
24
7
201
24
8
201
24
9
201
25
0
201
25
1
201
25
2
201
30
1
201
30
2
201
30
3
201
30
4
201
30
5
201
30
6
201
30
7
201
30
8
201
30
9
201
31
0
201
31
1
201
31
2
201
31
3
201
31
4
201
31
5
201
31
6
201
31
7
Aver
age
reven
ue
(€)
Week
Cat1 Average Cat4 Average
70000
90000
110000
130000
150000
170000
201
34
0
201
34
1
201
34
2
201
34
3
201
34
4
201
34
5
201
34
6
201
34
7
201
34
8
201
34
9
201
35
0
201
35
1
201
35
2
201
40
1
201
40
2
201
40
3
201
40
4
201
40
5
201
40
6
201
40
7
201
40
8
201
40
9
201
41
0
201
41
1
201
41
2
201
41
3
201
41
4
201
41
5
201
41
6
201
41
7
Aver
age
reven
ue
(€)
Week
Cat1 Average Cat4 Average
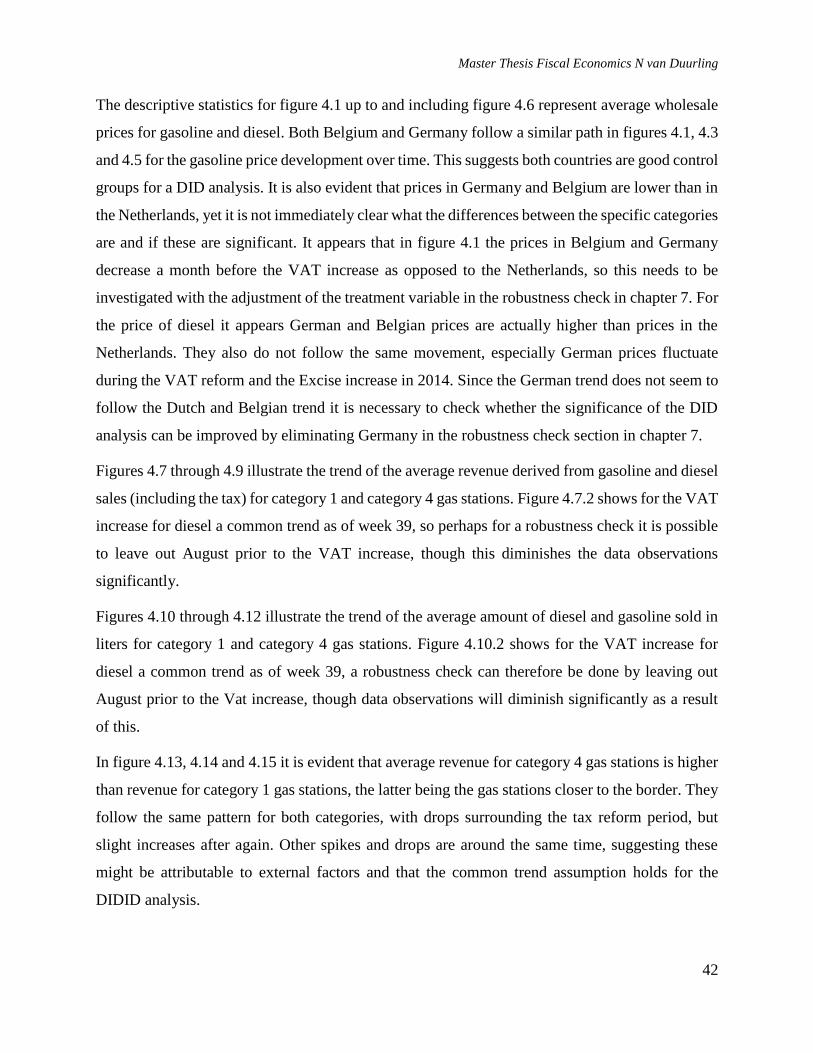
Master Thesis Fiscal Economics N van Duurling
42
The descriptive statistics for figure 4.1 up to and including figure 4.6 represent average wholesale
prices for gasoline and diesel. Both Belgium and Germany follow a similar path in figures 4.1, 4.3
and 4.5 for the gasoline price development over time. This suggests both countries are good control
groups for a DID analysis. It is also evident that prices in Germany and Belgium are lower than in
the Netherlands, yet it is not immediately clear what the differences between the specific categories
are and if these are significant. It appears that in figure 4.1 the prices in Belgium and Germany
decrease a month before the VAT increase as opposed to the Netherlands, so this needs to be
investigated with the adjustment of the treatment variable in the robustness check in chapter 7. For
the price of diesel it appears German and Belgian prices are actually higher than prices in the
Netherlands. They also do not follow the same movement, especially German prices fluctuate
during the VAT reform and the Excise increase in 2014. Since the German trend does not seem to
follow the Dutch and Belgian trend it is necessary to check whether the significance of the DID
analysis can be improved by eliminating Germany in the robustness check section in chapter 7.
Figures 4.7 through 4.9 illustrate the trend of the average revenue derived from gasoline and diesel
sales (including the tax) for category 1 and category 4 gas stations. Figure 4.7.2 shows for the VAT
increase for diesel a common trend as of week 39, so perhaps for a robustness check it is possible
to leave out August prior to the VAT increase, though this diminishes the data observations
significantly.
Figures 4.10 through 4.12 illustrate the trend of the average amount of diesel and gasoline sold in
liters for category 1 and category 4 gas stations. Figure 4.10.2 shows for the VAT increase for
diesel a common trend as of week 39, a robustness check can therefore be done by leaving out
August prior to the Vat increase, though data observations will diminish significantly as a result
of this.
In figure 4.13, 4.14 and 4.15 it is evident that average revenue for category 4 gas stations is higher
than revenue for category 1 gas stations, the latter being the gas stations closer to the border. They
follow the same pattern for both categories, with drops surrounding the tax reform period, but
slight increases after again. Other spikes and drops are around the same time, suggesting these
might be attributable to external factors and that the common trend assumption holds for the
DIDID analysis.
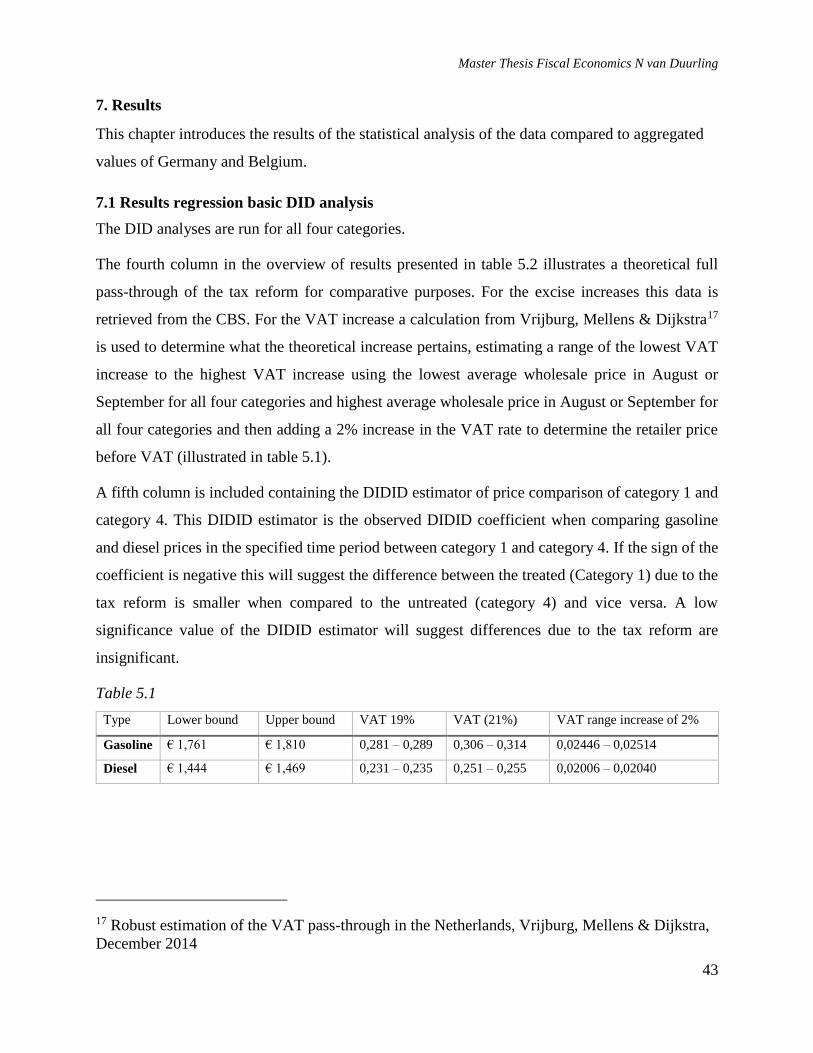
Master Thesis Fiscal Economics N van Duurling
43
7. Results
This chapter introduces the results of the statistical analysis of the data compared to aggregated
values of Germany and Belgium.
7.1 Results regression basic DID analysis
The DID analyses are run for all four categories.
The fourth column in the overview of results presented in table 5.2 illustrates a theoretical full
pass-through of the tax reform for comparative purposes. For the excise increases this data is
retrieved from the CBS. For the VAT increase a calculation from Vrijburg, Mellens & Dijkstra17
is used to determine what the theoretical increase pertains, estimating a range of the lowest VAT
increase to the highest VAT increase using the lowest average wholesale price in August or
September for all four categories and highest average wholesale price in August or September for
all four categories and then adding a 2% increase in the VAT rate to determine the retailer price
before VAT (illustrated in table 5.1).
A fifth column is included containing the DIDID estimator of price comparison of category 1 and
category 4. This DIDID estimator is the observed DIDID coefficient when comparing gasoline
and diesel prices in the specified time period between category 1 and category 4. If the sign of the
coefficient is negative this will suggest the difference between the treated (Category 1) due to the
tax reform is smaller when compared to the untreated (category 4) and vice versa. A low
significance value of the DIDID estimator will suggest differences due to the tax reform are
insignificant.
Table 5.1
Type Lower bound Upper bound VAT 19% VAT (21%) VAT range increase of 2%
Gasoline € 1,761 € 1,810 0,281 – 0,289 0,306 – 0,314 0,02446 – 0,02514
Diesel € 1,444 € 1,469 0,231 – 0,235 0,251 – 0,255 0,02006 – 0,02040
17 Robust estimation of the VAT pass-through in the Netherlands, Vrijburg, Mellens & Dijkstra,
December 2014
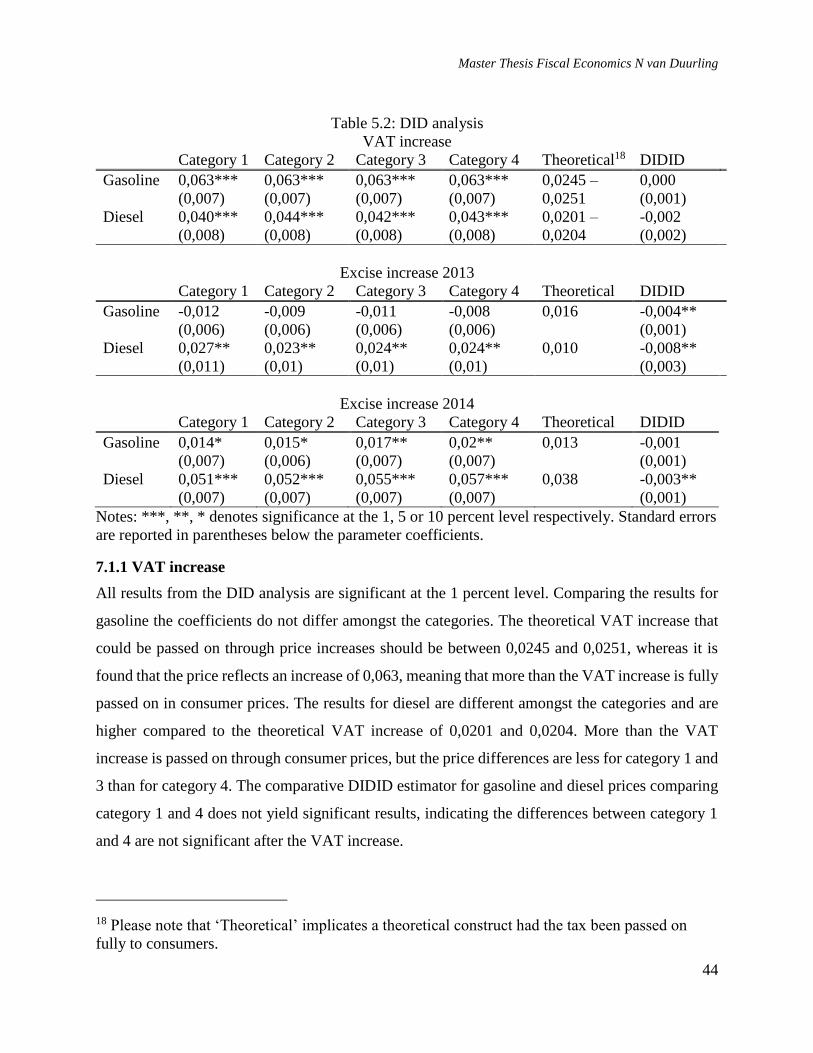
Master Thesis Fiscal Economics N van Duurling
44
Table 5.2: DID analysis
VAT increase
Category 1 Category 2 Category 3 Category 4 Theoretical18 DIDID
Gasoline 0,063*** 0,063*** 0,063*** 0,063*** 0,0245 – 0,000
(0,007) (0,007) (0,007) (0,007) 0,0251 (0,001)
Diesel 0,040*** 0,044*** 0,042*** 0,043*** 0,0201 – -0,002
(0,008) (0,008) (0,008) (0,008) 0,0204 (0,002)
Excise increase 2013
Category 1 Category 2 Category 3 Category 4 Theoretical DIDID
Gasoline -0,012 -0,009 -0,011 -0,008 0,016 -0,004**
(0,006) (0,006) (0,006) (0,006) (0,001)
Diesel 0,027** 0,023** 0,024** 0,024** 0,010 -0,008**
(0,011) (0,01) (0,01) (0,01) (0,003)
Excise increase 2014
Category 1 Category 2 Category 3 Category 4 Theoretical DIDID
Gasoline 0,014* 0,015* 0,017** 0,02** 0,013 -0,001
(0,007) (0,006) (0,007) (0,007) (0,001)
Diesel 0,051*** 0,052*** 0,055*** 0,057*** 0,038 -0,003**
(0,007) (0,007) (0,007) (0,007) (0,001)
Notes: ***, **, * denotes significance at the 1, 5 or 10 percent level respectively. Standard errors
are reported in parentheses below the parameter coefficients.
7.1.1 VAT increase
All results from the DID analysis are significant at the 1 percent level. Comparing the results for
gasoline the coefficients do not differ amongst the categories. The theoretical VAT increase that
could be passed on through price increases should be between 0,0245 and 0,0251, whereas it is
found that the price reflects an increase of 0,063, meaning that more than the VAT increase is fully
passed on in consumer prices. The results for diesel are different amongst the categories and are
higher compared to the theoretical VAT increase of 0,0201 and 0,0204. More than the VAT
increase is passed on through consumer prices, but the price differences are less for category 1 and
3 than for category 4. The comparative DIDID estimator for gasoline and diesel prices comparing
category 1 and 4 does not yield significant results, indicating the differences between category 1
and 4 are not significant after the VAT increase.
18 Please note that ‘Theoretical’ implicates a theoretical construct had the tax been passed on
fully to consumers.
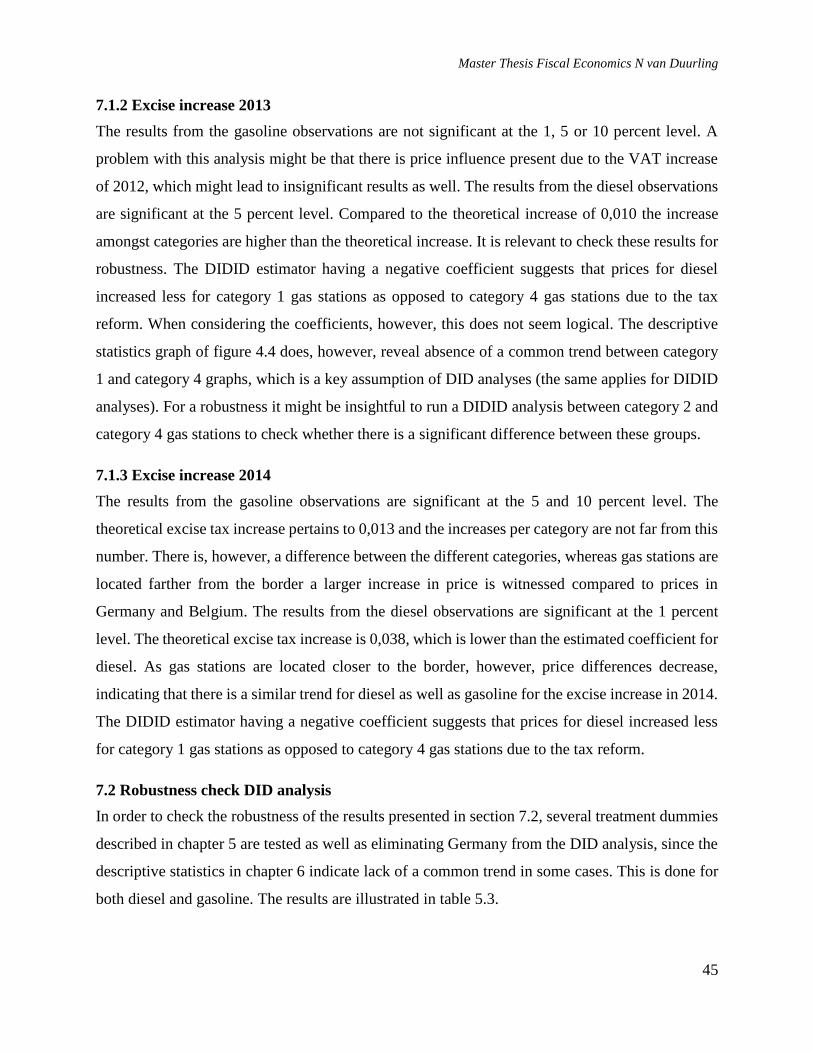
Master Thesis Fiscal Economics N van Duurling
45
7.1.2 Excise increase 2013
The results from the gasoline observations are not significant at the 1, 5 or 10 percent level. A
problem with this analysis might be that there is price influence present due to the VAT increase
of 2012, which might lead to insignificant results as well. The results from the diesel observations
are significant at the 5 percent level. Compared to the theoretical increase of 0,010 the increase
amongst categories are higher than the theoretical increase. It is relevant to check these results for
robustness. The DIDID estimator having a negative coefficient suggests that prices for diesel
increased less for category 1 gas stations as opposed to category 4 gas stations due to the tax
reform. When considering the coefficients, however, this does not seem logical. The descriptive
statistics graph of figure 4.4 does, however, reveal absence of a common trend between category
1 and category 4 graphs, which is a key assumption of DID analyses (the same applies for DIDID
analyses). For a robustness it might be insightful to run a DIDID analysis between category 2 and
category 4 gas stations to check whether there is a significant difference between these groups.
7.1.3 Excise increase 2014
The results from the gasoline observations are significant at the 5 and 10 percent level. The
theoretical excise tax increase pertains to 0,013 and the increases per category are not far from this
number. There is, however, a difference between the different categories, whereas gas stations are
located farther from the border a larger increase in price is witnessed compared to prices in
Germany and Belgium. The results from the diesel observations are significant at the 1 percent
level. The theoretical excise tax increase is 0,038, which is lower than the estimated coefficient for
diesel. As gas stations are located closer to the border, however, price differences decrease,
indicating that there is a similar trend for diesel as well as gasoline for the excise increase in 2014.
The DIDID estimator having a negative coefficient suggests that prices for diesel increased less
for category 1 gas stations as opposed to category 4 gas stations due to the tax reform.
7.2 Robustness check DID analysis
In order to check the robustness of the results presented in section 7.2, several treatment dummies
described in chapter 5 are tested as well as eliminating Germany from the DID analysis, since the
descriptive statistics in chapter 6 indicate lack of a common trend in some cases. This is done for
both diesel and gasoline. The results are illustrated in table 5.3.
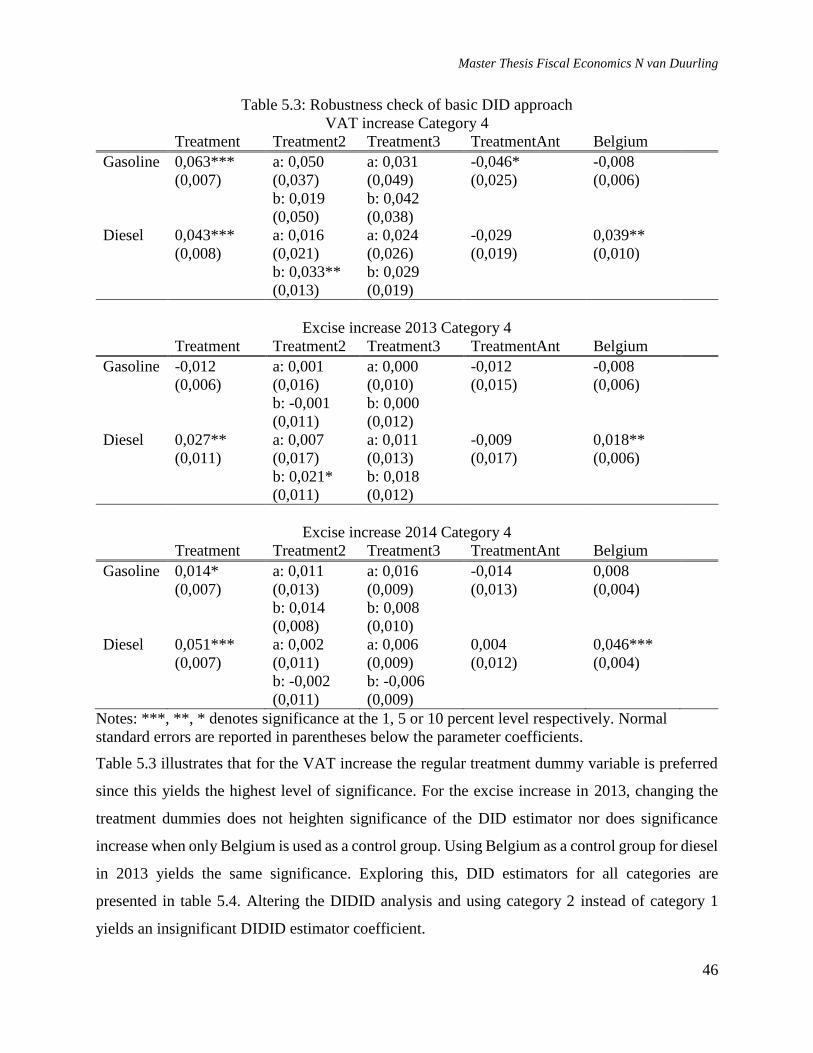
Master Thesis Fiscal Economics N van Duurling
46
Table 5.3: Robustness check of basic DID approach
VAT increase Category 4
Treatment Treatment2 Treatment3 TreatmentAnt Belgium
Gasoline 0,063*** a: 0,050 a: 0,031 -0,046* -0,008
(0,007) (0,037)
b: 0,019
(0,050)
(0,049)
b: 0,042
(0,038)
(0,025) (0,006)
Diesel 0,043*** a: 0,016 a: 0,024 -0,029 0,039**
(0,008) (0,021)
b: 0,033**
(0,013)
(0,026)
b: 0,029
(0,019)
(0,019) (0,010)
Excise increase 2013 Category 4
Treatment Treatment2 Treatment3 TreatmentAnt Belgium
Gasoline -0,012 a: 0,001 a: 0,000 -0,012 -0,008
(0,006) (0,016)
b: -0,001
(0,011)
(0,010)
b: 0,000
(0,012)
(0,015) (0,006)
Diesel 0,027** a: 0,007 a: 0,011 -0,009 0,018**
(0,011) (0,017)
b: 0,021*
(0,011)
(0,013)
b: 0,018
(0,012)
(0,017) (0,006)
Excise increase 2014 Category 4
Treatment Treatment2 Treatment3 TreatmentAnt Belgium
Gasoline 0,014* a: 0,011 a: 0,016 -0,014 0,008
(0,007) (0,013)
b: 0,014
(0,008)
(0,009)
b: 0,008
(0,010)
(0,013) (0,004)
Diesel 0,051*** a: 0,002 a: 0,006 0,004 0,046***
(0,007) (0,011)
b: -0,002
(0,011)
(0,009)
b: -0,006
(0,009)
(0,012) (0,004)
Notes: ***, **, * denotes significance at the 1, 5 or 10 percent level respectively. Normal
standard errors are reported in parentheses below the parameter coefficients.
Table 5.3 illustrates that for the VAT increase the regular treatment dummy variable is preferred
since this yields the highest level of significance. For the excise increase in 2013, changing the
treatment dummies does not heighten significance of the DID estimator nor does significance
increase when only Belgium is used as a control group. Using Belgium as a control group for diesel
in 2013 yields the same significance. Exploring this, DID estimators for all categories are
presented in table 5.4. Altering the DIDID analysis and using category 2 instead of category 1
yields an insignificant DIDID estimator coefficient.
Master Thesis Fiscal Economics N van Duurling
47
Table 5.4: Adjusted DID analysis Belgium only
Excise increase 2013
Category 1 Category 2 Category 3 Category 4 Theoretical DIDID cat219
Diesel 0,021 0,017** 0,018** 0,018** 0,010 -0,001
(0,011) (0,006) (0,006) (0,006) (0,001)
Excise increase 2014
Category 1 Category 2 Category 3 Category 4 Theoretical DIDID
Diesel 0,040*** 0,041*** 0,044*** 0,046*** 0,038 -0,003**
(0,005) (0,004) (0,005) (0,004) (0,001)
Notes: ***, **, * denotes significance at the 1, 5 or 10 percent level respectively. Normal
standard errors are reported in parentheses below the parameter coefficients.
The preferred DID analysis alters results for the excise increase in 2014 slightly, however, when
Germany is eliminated as a control group from the DID analysis for category 1 in 2013, the result
is no longer significant. This is especially interesting with respect to the consideration noted in
7.1.2 for the DIDID estimator where it is key that for category 1 and category 4 the common trend
assumption does not seem to hold, and the same applies when comparing category 1 and Belgium.
Following the common trend assumption category 1 should be excluded from this analysis.
Though the DIDID estimator between category 2 and category 4 gas stations is insignificant, the
results are only relevant when the common trend assumption is followed. Preferred DID analysis
is therefore adjusted for both the excise increase in 2013 as well as 2014. Following the adjustment
of 2014, it appears the tax is fully passed on to the consumer through wholesale prices and the
difference between category 1 gas stations and category 4 gas stations is significant for diesel
prices at the 5 percent level. The negative coefficient suggests that prices increased less for
category 1 gas stations as opposed to category 4 gas stations.
7.3 Revenue and amount regression analyses
DIDID analyses are run with the regular treatment variable comparing category 1 and category 4
gas stations. Table 5.5 illustrates the results from the DIDID analyses for total revenue. Table 5.6
illustrates results of the DIDID analysis of revenue attributable to gasoline and diesel and amount
of gasoline and diesel sold.
19 Note that this DIDID estimator results from comparing category 2 and category 4 gas stations.
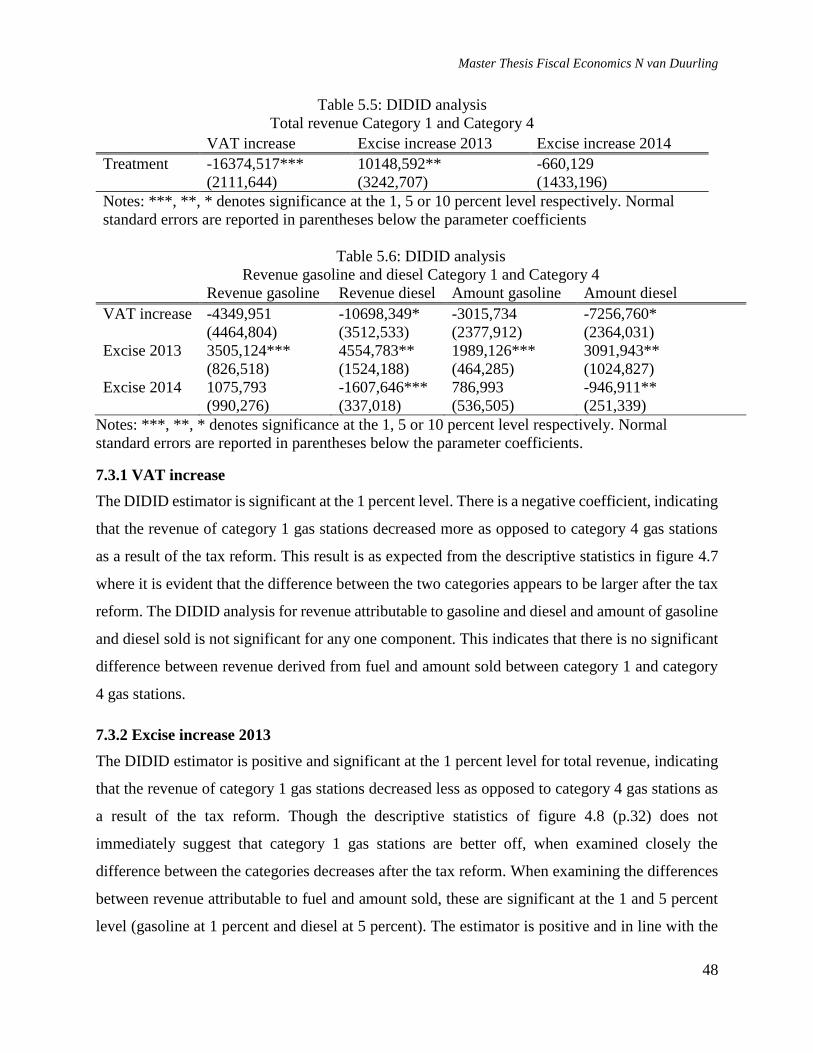
Master Thesis Fiscal Economics N van Duurling
48
Table 5.5: DIDID analysis
Total revenue Category 1 and Category 4
VAT increase Excise increase 2013 Excise increase 2014
Treatment
-16374,517***
(2111,644)
10148,592**
(3242,707)
-660,129
(1433,196)
Notes: ***, **, * denotes significance at the 1, 5 or 10 percent level respectively. Normal
standard errors are reported in parentheses below the parameter coefficients
Table 5.6: DIDID analysis
Revenue gasoline and diesel Category 1 and Category 4
Revenue gasoline Revenue diesel Amount gasoline Amount diesel
VAT increase
-4349,951
(4464,804)
-10698,349*
(3512,533)
-3015,734
(2377,912)
-7256,760*
(2364,031)
Excise 2013 3505,124***
(826,518)
4554,783**
(1524,188)
1989,126***
(464,285)
3091,943**
(1024,827)
Excise 2014 1075,793
(990,276)
-1607,646***
(337,018)
786,993
(536,505)
-946,911**
(251,339)
Notes: ***, **, * denotes significance at the 1, 5 or 10 percent level respectively. Normal
standard errors are reported in parentheses below the parameter coefficients.
7.3.1 VAT increase
The DIDID estimator is significant at the 1 percent level. There is a negative coefficient, indicating
that the revenue of category 1 gas stations decreased more as opposed to category 4 gas stations
as a result of the tax reform. This result is as expected from the descriptive statistics in figure 4.7
where it is evident that the difference between the two categories appears to be larger after the tax
reform. The DIDID analysis for revenue attributable to gasoline and diesel and amount of gasoline
and diesel sold is not significant for any one component. This indicates that there is no significant
difference between revenue derived from fuel and amount sold between category 1 and category
4 gas stations.
7.3.2 Excise increase 2013
The DIDID estimator is positive and significant at the 1 percent level for total revenue, indicating
that the revenue of category 1 gas stations decreased less as opposed to category 4 gas stations as
a result of the tax reform. Though the descriptive statistics of figure 4.8 (p.32) does not
immediately suggest that category 1 gas stations are better off, when examined closely the
difference between the categories decreases after the tax reform. When examining the differences
between revenue attributable to fuel and amount sold, these are significant at the 1 and 5 percent
level (gasoline at 1 percent and diesel at 5 percent). The estimator is positive and in line with the
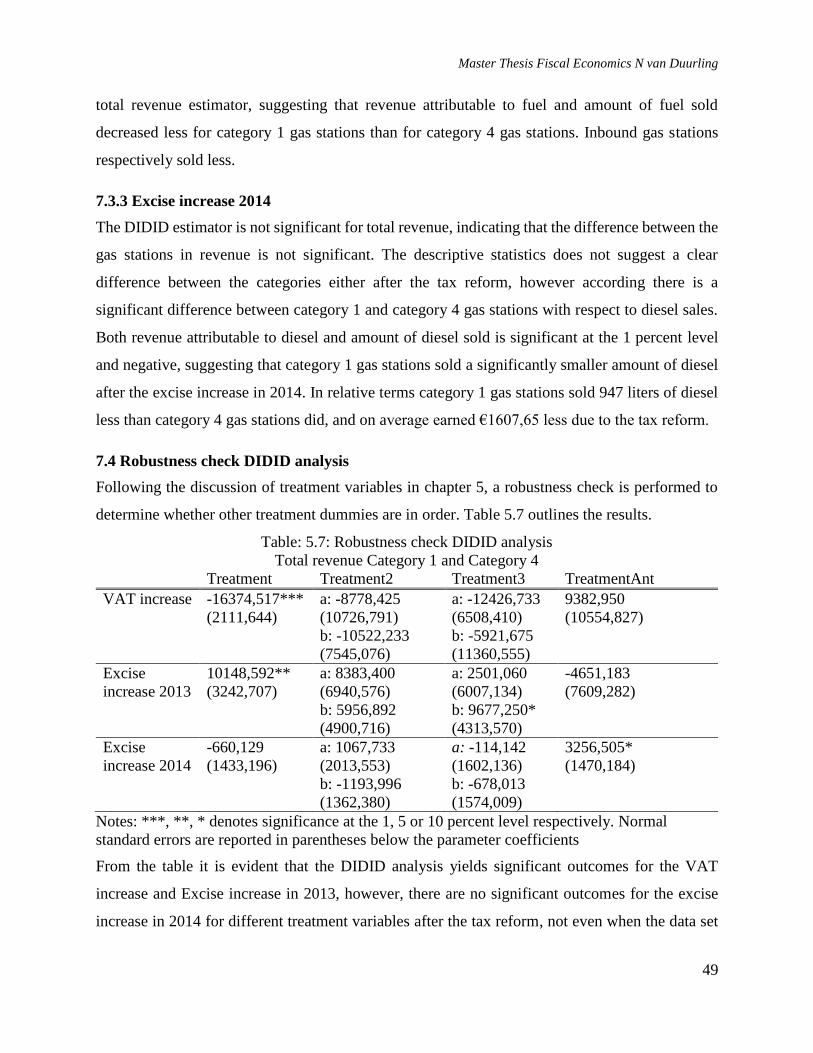
Master Thesis Fiscal Economics N van Duurling
49
total revenue estimator, suggesting that revenue attributable to fuel and amount of fuel sold
decreased less for category 1 gas stations than for category 4 gas stations. Inbound gas stations
respectively sold less.
7.3.3 Excise increase 2014
The DIDID estimator is not significant for total revenue, indicating that the difference between the
gas stations in revenue is not significant. The descriptive statistics does not suggest a clear
difference between the categories either after the tax reform, however according there is a
significant difference between category 1 and category 4 gas stations with respect to diesel sales.
Both revenue attributable to diesel and amount of diesel sold is significant at the 1 percent level
and negative, suggesting that category 1 gas stations sold a significantly smaller amount of diesel
after the excise increase in 2014. In relative terms category 1 gas stations sold 947 liters of diesel
less than category 4 gas stations did, and on average earned €1607,65 less due to the tax reform.
7.4 Robustness check DIDID analysis
Following the discussion of treatment variables in chapter 5, a robustness check is performed to
determine whether other treatment dummies are in order. Table 5.7 outlines the results.
Table: 5.7: Robustness check DIDID analysis
Total revenue Category 1 and Category 4
Treatment Treatment2 Treatment3 TreatmentAnt
VAT increase -16374,517*** a: -8778,425 a: -12426,733 9382,950
(2111,644) (10726,791)
b: -10522,233
(7545,076)
(6508,410)
b: -5921,675
(11360,555)
(10554,827)
Excise
increase 2013
10148,592**
(3242,707)
a: 8383,400
(6940,576)
b: 5956,892
(4900,716)
a: 2501,060
(6007,134)
b: 9677,250*
(4313,570)
-4651,183
(7609,282)
Excise
increase 2014
-660,129
(1433,196)
a: 1067,733
(2013,553)
b: -1193,996
(1362,380)
a: -114,142
(1602,136)
b: -678,013
(1574,009)
3256,505*
(1470,184)
Notes: ***, **, * denotes significance at the 1, 5 or 10 percent level respectively. Normal
standard errors are reported in parentheses below the parameter coefficients
From the table it is evident that the DIDID analysis yields significant outcomes for the VAT
increase and Excise increase in 2013, however, there are no significant outcomes for the excise
increase in 2014 for different treatment variables after the tax reform, not even when the data set
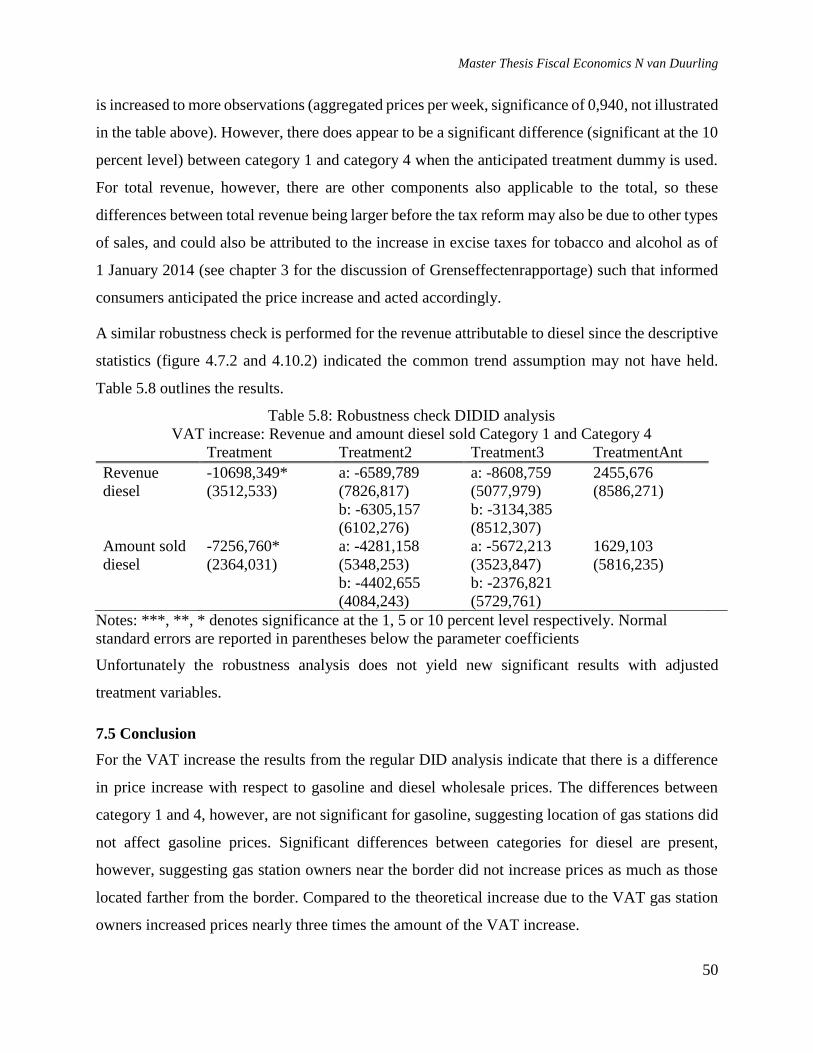
Master Thesis Fiscal Economics N van Duurling
50
is increased to more observations (aggregated prices per week, significance of 0,940, not illustrated
in the table above). However, there does appear to be a significant difference (significant at the 10
percent level) between category 1 and category 4 when the anticipated treatment dummy is used.
For total revenue, however, there are other components also applicable to the total, so these
differences between total revenue being larger before the tax reform may also be due to other types
of sales, and could also be attributed to the increase in excise taxes for tobacco and alcohol as of
1 January 2014 (see chapter 3 for the discussion of Grenseffectenrapportage) such that informed
consumers anticipated the price increase and acted accordingly.
A similar robustness check is performed for the revenue attributable to diesel since the descriptive
statistics (figure 4.7.2 and 4.10.2) indicated the common trend assumption may not have held.
Table 5.8 outlines the results.
Table 5.8: Robustness check DIDID analysis
VAT increase: Revenue and amount diesel sold Category 1 and Category 4
Treatment Treatment2 Treatment3 TreatmentAnt
Revenue
diesel
Amount sold
diesel
-10698,349*
(3512,533)
-7256,760*
(2364,031)
a: -6589,789
(7826,817)
b: -6305,157
(6102,276)
a: -4281,158
(5348,253)
b: -4402,655
(4084,243)
a: -8608,759
(5077,979)
b: -3134,385
(8512,307)
a: -5672,213
(3523,847)
b: -2376,821
(5729,761)
2455,676
(8586,271)
1629,103
(5816,235)
Notes: ***, **, * denotes significance at the 1, 5 or 10 percent level respectively. Normal
standard errors are reported in parentheses below the parameter coefficients
Unfortunately the robustness analysis does not yield new significant results with adjusted
treatment variables.
7.5 Conclusion
For the VAT increase the results from the regular DID analysis indicate that there is a difference
in price increase with respect to gasoline and diesel wholesale prices. The differences between
category 1 and 4, however, are not significant for gasoline, suggesting location of gas stations did
not affect gasoline prices. Significant differences between categories for diesel are present,
however, suggesting gas station owners near the border did not increase prices as much as those
located farther from the border. Compared to the theoretical increase due to the VAT gas station
owners increased prices nearly three times the amount of the VAT increase.
Master Thesis Fiscal Economics N van Duurling
51
For the excise increase in 2013 there is a significant difference in diesel wholesale price. For
gasoline this is not the case, however. Significant differences between categories for diesel are
present, category 1 having a lower coefficient than the others, which suggests that gas station
owners in border regions increased prices more compared to those located farther from the border.
When examining this more closely, however, from the descriptive statistics it can be deduced that
the common trend assumption does not apply to category 1 gas stations. When this is taken out of
the analysis and the DIDID estimator is recalculated with category 2, an insignificant estimator is
obtained though the differences between the categories do appear to be small. This indicates that
the DID and DIDID analyses provide accurate results when the common trend assumption applies.
The price differences for the three categories (leaving category 1 out of this analysis completely)
are nearly three times as high as the theoretical increase due to the excise tax. Though there are no
significant differences in gasoline wholesale price according to the DID analysis, a significant
difference is observed between categories 1 and 4, suggesting gas station owners in the border
region increased prices less after the tax reform. These results are vague, however, without the
support from significant DID estimators, since the insignificant coefficients suggest the opposite.
For the excise increase in 2014 there is a significant difference between both diesel and gasoline
prices before and after the increase in tax. Differences between the categories for both diesel and
gasoline are present, category 1 having a lower coefficient than the others. This suggests that gas
station owners in border regions increased prices less compared to those located farther from the
border after the tax reform. The price differences for the categories for diesel are again higher than
the theoretical increase due to the excise tax, however for gasoline the excise increase is passed on
nearly as much in category 1, though category 2, 3 and 4 pass on more than the theoretical excise
amount. After performing a DID analysis with Belgium as a control group only since descriptive
statistics the common trend assumption only held with Belgium, the DID estimator decreased,
indicating a bit more than full pass-through of the tax.
The DIDID analysis of the total revenue differences between category 1 and 4 indicates that there
was a significant difference between the decreases in revenue for category 1 gas stations after the
VAT increase. For the excise increase in 2013 revenue for category 4 gas stations decreased more
as opposed to category 1 gas stations, whereas no significant differences after the excise increase
in 2014 were observed between the two categories. Significant differences were observed after the
Master Thesis Fiscal Economics N van Duurling
52
excise increase in 2013 where revenue attributable to gasoline and diesel was significantly more
for category 1 gas stations as opposed to category 4 gas stations. In both 2012 after the VAT
increase and in 2014 after the excise increase, however, revenue attributable to diesel and amount
of diesel sold was significantly less compared to their category 4 counterparts.
Master Thesis Fiscal Economics N van Duurling
53
8. Conclusion
The news and convictions from the BOVAG and gas stations owners suggest that there is a clear
distinction between gas stations in border regions and gas stations located farther from the border.
Economic theory postulates that depending on consumer and producer incidence of an imposed
tax (whether this is an excise tax or an ad valorem tax) depends on the elasticity of the good sold.
The gasoline market in the Netherlands is characterized by usual gasoline retail seller factors,
however, the market has expanded due to the ease of travelling to bordering countries and cross-
border shopping for relatively expensive goods due to a higher VAT rate or excise tax has become
easier. Furthermore, gas station owners are not always multinationals that can obtain profits abroad
to counteract this effect.
In order to investigate differences between gas stations located in border regions and located
elsewhere, a difference-in-differences analysis was conducted between different categories of
border regions (less than 15km from the border, less than 30km from the border, less than 45 km
from the border and more than 45 km from the border) using both Belgium and Germany as a
control group if applicable. The common trend assumption seems to hold in most cases, and where
this did not apply a robustness check was performed. The analysis extended to wholesale fuel
prices calculated at the gas stations, which resulted from data obtained from “white” gas stations’
registers through OrangePeak Company, the wholesale prices being calculated from revenue per
product and quantity sold per product, entailing these effects in the variable. After the difference-
in-differences analysis per category it was possible to compare the obtained treatment coefficients
amongst the different categories to examine if a difference between the categories was observed.
At the same time, the difference per category was compared to the theoretical increase of the tax
to determine the pass-through of the tax to the consumer within the price. The revenue was
compared through a difference-in-differences-in-differences analysis between category 1 and
category 4 gas stations to determine if an observable difference between these categories was
present after a tax reform. To eliminate any effects in total revenue, the revenue attributable to
gasoline and diesel and the amount of fuel sold (separated into gasoline and diesel) was also
included in the analysis.
From the results I can conclude that a tax reform does not necessarily indicate that gas stations in
border regions are worse off than gas stations located elsewhere. After the VAT increase, gasoline
Master Thesis Fiscal Economics N van Duurling
54
wholesale prices were not significantly different depending on the categories, but diesel price
differences were significantly lower near the border. The excise increase in 2013 yielded
insignificant differences for gasoline, but for diesel the gas stations near the border increased prices
more after the reform as opposed to those located farther inbound. The excise increase in 2014 led
to higher price differences due to the reform for the categories, where prices were lower in the
border regions. For all the analyses there was a difference between the theoretical increase of the
tax and the price increase per category, where nearly all categories shifted more than the tax into
prices. Though this does not follow regular economic theory, the discussion surrounding the
oligopolistic market structure of gas stations might contribute to this, as suggested by Seade (1985)
as well. Retailers might react in anticipation to the expected lower demand when price increases
due to the excise tax seem inevitable, hence perhaps the more incredulous price change after the
tax reform. After the 2014 excise increase only category 1 gas stations increased an almost similar
amount as the theoretical tax increase, though category 2 was not far from category 1.
The total revenue analysis yielded differences between category 1 and category 4, which suggested
that, due to the VAT increase, gas stations near the border significantly experienced a decrease in
total shop revenue. When specifying these results to examine whether there was an increase or
decrease in amount or revenue attributable to diesel or gasoline sold, it was found that there were
significant decreases in category 1 with respect to diesel for both amount sold and revenue
attributable to diesel. After the excise increase in 2013, however, the difference yielded opposite
results, illustrating that gas stations farther from the borders experienced a significant decrease in
total shop revenue. The excise increase in 2014 illustrated there to be no significant difference
between gas stations far from and near the border in shop revenue after the tax reform. There was,
however, a significant decrease in diesel revenue and amount sold for category 1 gas stations. The
amount of excise increase in 2014 was much larger compared to the year prior to that, and perhaps
the size of the excise tax also influences the price setting behavior of gas station owners though
this was not applicable in 2014 during the VAT increase. It is also possible that consumers of
diesel, which includes truck drivers who are more informed consumers due to the nature of their
employment, feel the need to purchase diesel either within the Netherlands or choose to engage in
cross-border shopping. On the other hand, the excess cost might be borne by their employer.
Additional study could be done into the nature of diesel fuel as opposed to gasoline fuel with
respect to consumer and producer behavior.
Master Thesis Fiscal Economics N van Duurling
55
It is my conclusion that many factors play a role in gas station price setting behavior, such as crude
oil price shocks and seasonal effects. The descriptive statistics indicate that gas station owners
located closer to the border have lower revenues in general. There are, however, some significant
indications that gas stations near the border are affected more by a tax reform. Based on the results
from this data analysis an interesting path to investigate is to determine whether the amount of tax
increase yields different significant results and whether higher taxes instigate less pass-through of
the tax in the price rather than just a minor inflationary adjustment.
Master Thesis Fiscal Economics N van Duurling
56
References
Angrist, J.D., Pischke, J. 2008. Mostly harmless econometrics: an empricists’s companion.
Retrieved from: ResearchGate. P. 236-237
BOVAG: ‘BOVAG waarschuwt voor ontstaan spookdorpen langs de grens’ (2014). Retrieved on
31 January 2014 from: <http://www.bovag.nl/nieuws/>
Blundell, R., Dias, M.C., 2009. Alternative approaches to evaluation in empirical
microeconomics. The journal of Human Resources. 44, 3. 2009.
Carare, A. and S. Danninger, 2008. Inflation smoothing and the modest effect of VAT in
Germany. IMF Working Paper, WP/08/175.
Chouinard, H., Perloff, J.M., 2004. Incidence of Federal and State gasoline taxes. Economics
Letters, 83, 55-60.
Chouinard, H., Perloff, J.M., 2007. Gasoline Price Differences: Taxes, Pollution Regulations,
Mergers, Market Power, and Market Conditions. The B.E. Journal of Economic Analysis
and Policy 7 (1).
Coyle, D., DeBacker, J., Prisinzano, R., 2012, Estimating the supply and demand of gasoline
using tax data, Energy Economics, Elsevier.
Delipalla, S., Keen, M., 1992. The comparison between ad valorem and specific taxation under
imperfect competition. Journal of Public Economics 49, 351-367.
Di Giacomo, M., Piacenza, G. Turati, 2012. Are “flexible” taxation mechanisms effective in
stabilizing fuel prices? An evaluation considering wholesale fuel markets. Energy
Economics, 34, 1176-1186.
Dijkstra, J., 2013, The Influence of the VAT Increase on Consumer Prices, MasterThesis
Erasmus University.
Doyle, J., Samphantharak, K., 2008. $2.00 gas! Studying the effects of a gas tax moratorium.
Journal of Public Economics 92, 869-884.
Espey, M., 1998. Explaining the variation in elasticity estimates of gasoline demand in the
United States: A meta-analysis. Energy Journal. Elsevier.
Hassink, W.H.J., Schut, F.T., 2008, Price Competition in Border and Non-Border Areas: The
Master Thesis Fiscal Economics N van Duurling
57
Case of the Dutch Market of Gasoline Retailers, Applied Economics Quarterly Vol. 54.
No 2, Berlin.
OECD, (2010), Taxation, Innovation and the Environment, OECD, Paris.
Rietveld, P., Bruinsma, F.R., van Vuuren, D.J., (1991), Spatial graduation of fuel taxes;
consequences for cross-border and domestic fuelling, Vrije Universiteit, Amsterdam.
Saede, J., 1985. Profitable cost increases and the shifting of taxation: equilibrium responses of
markets in oligopoly. Warwick Economic Research Papers, No 260.
Stern, N., 1987. The effects of taxation, price control and government contracts in oligopoly and
monopolistic competition. Journal of Public Economics. 32, 133-158.
Vrijburg, H., Mellens, M., Dijkstra, J., 2014. Robust estimation of the VAT pass-through in the
Netherlands. CPB Discussion Paper | 297.
Wlazlowski, S., Giulietti, M., Binner, J., Milas, C., 2009. Price dynamics in European petroleum
markets. Energy Economics 31, 99108.
Wooldridge, J., 2007. What’s New in Econometrics: Lecture 10 Difference-in-Differences
Estimation, NBER Summer Institute.