Electron Paramagnetic Resonance and Electron Nuclear Double
96
Electron Paramagnetic Resonance and Electron Nuclear Double Resonance Spectroscopy at 275 GHz PROEFSCHRIFT ter verkrijging van de graad van Doctor aan de Universiteit van Leiden, op gezag van de Rector Magnificus Dr. D.D. Breimer, hoogleraar in de faculteit der Wiskunde en Natuurwetenschappen en die der Geneeskunde, volgens besluit van het College voor Promoties te verdedigen op woensdag 29 november 2006 klokke 15:00 uur door Huibrecht Blok geboren te Leiden in 1937
Transcript of Electron Paramagnetic Resonance and Electron Nuclear Double
Electron Paramagnetic Resonance and Electron
Nuclear Double Resonance Spectroscopy
at 275 GHz
PROEFSCHRIFT
ter verkrijging van de graad van Doctor aan de Universiteit van Leiden,
op gezag van de Rector Magnificus Dr. D.D. Breimer, hoogleraar in de faculteit der Wiskunde en
Natuurwetenschappen en die der Geneeskunde, volgens besluit van het College voor Promoties te verdedigen op woensdag 29 november 2006
klokke 15:00 uur
door
Huibrecht Blok geboren te Leiden
in 1937
Promotiecommissie: Promotoren: Prof. Dr. J. Schmidt Prof. Dr. E.J.J. Groenen Referent: Prof. Dr. K. Möbius (Freie Universität Berlin) Overige leden: Prof. Dr. J. Aarts Prof. Dr. C.A.J. Ammerlaan (Universiteit van Amsterdam) Prof. Dr. G.W. Canters Prof. Dr. P.H. Kes Dr. Ir. T.H. Oosterkamp The present work is supported by the Technology Foundation STW (the applied science division of NWO) and the technology program of the Ministry of Economic Affairs.
ii
Contents
Chapter 1 Introduction 1
Chapter 2 The 275 GHz spectrometer. First EPR results 7 Appendix A Pseudo-optics 25 Appendix B System description 33
Chapter 3 ENDOR spectroscopy at 275 GHz 43
Chapter 4 Dynamic Nuclear Polarization observed in EPR at 275 GHz 55
Chapter 5 EPR and ENDOR spectroscopy at 275 GHz on Poly(3-hexylthiophene) 67
Samenvatting 81
List of publications 87
Curriculum vitae 89
Nawoord 91
iii

iv
Chapter 1
Introduction
The beginning of Electron Paramagnetic Resonance (EPR) spectroscopy dates back to 1944 when Zavoisky [1.1] in Kazan in Russia recorded the first EPR spectrum. After the war the field developed rapidly owing to the advances in microwave technologies stimulated by the war efforts. One of the pioneering groups of researchers was active at the Clarendon Laboratory in Oxford in England where physicists studied metal ions in crystals and developed the theoretical description of the observed spectra [1.2, 1.3]. The first EPR spectra from organic free radicals were reported in 1952 [1.4]. The interest in the field then grew so strongly that around 1960 commercial spec-trometers became available. Since then the profusion of applications of EPR has been overwhelming and ranges over physical, chemical and biological sciences. Presently applications are even found in medical sciences.
Originally, the majority of the EPR experiments were carried out at X-band frequencies, i.e., around 9 GHz, although some experimentalists con-structed spectrometers operating at 25 GHz and 35 GHz. The choice of these frequencies was determined by the commercial microwave equipment available at that time and the limitations of the electro-magnets that were used to generate the magnetic fields up to 1.5 T.
In 1983 a remarkable paper was published by the group of the late Yakob Lebedev in Moscow [1.5]. The three authors, Grinberg, Dubinskii and Lebedev described the construction of a cw EPR spectrometer operating at the amazingly high frequency of 140 GHz (wavelength 2 mm), using a super-conducting magnet to generate the magnetic field of about 5.2 T. The results described in this paper were also quite striking. Spectra of random samples of organic radicals displayed a characteristic broadening caused by the g-anisotropy. This effect of the g-anisotropy is not observable at 9 GHz but at
- 1 -
Chapter 1
140 GHz it leads to a typical “powder” spectrum that allows the selection of radicals with a particular orientation in the random sample.
The results by Lebedev and coworkers stimulated several groups worldwide to develop similar high-frequency EPR spectrometers. In Berlin in Germany the group of Möbius started the construction of a cw EPR spectro-meter operating at 95 GHz [1.6]. They used a Fabry-Perot (multi-mode) reso-nator in a cw reflection bridge spectrometer and reported in 1988 on Electron Nuclear Double Resonance (ENDOR) observations [1.7]. At the same time at Cornell University in the USA the group of Freed [1.8] embarked on an even more challenging 250 GHz EPR project. The evolution of their design resulted in the first spectrometer with extensive utilization of pseudo-optic techniques [1.9]. In 1986 the group of Schmidt at Leiden University started with a pulsed 95 GHz EPR spectrometer [1.10]. This Electron Spin Echo spectrometer was extended to enable ENDOR operation [1.11]. Later on, the implementation of a single-mode TE011 resonator in this system resulted in a significant improvement in sensitivity and time resolution [1.12].
The results obtained by these groups convinced the Bruker Biospin company in Germany that it was worthwhile to develop a commercial high-frequency EPR spectrometer. This system, that can operate in cw as well as in pulsed mode at 95 GHz, made high-frequency EPR spectroscopy accessible for a large number of research groups worldwide and since the introduction of this instrument in 1995 the scientific activities in the field of high-frequency EPR have grown considerably.
Parallel to the activities mentioned above, high-frequency EPR spec-troscopy attracted also the interest of scientists working at specialized high-magnetic field laboratories in Europe, the USA and Japan [1.13]. At the High Magnetic Field Laboratory in Grenoble in France and in the National High Magnetic Field Laboratory in Tallahassee, EPR systems were built operating at frequencies up to 600 GHz, taking advantage of the exceptionally large magnetic fields available in these specialized institutes. In addition at St Andrews University in the UK a National EPR facility was started for multi-frequency EPR spectroscopy between 95 GHz and 270 GHz, utilizing a corrugated waveguide in the magnet bore [1.14]. The main philosophy behind these activities is to create national or even international centers for high-frequency EPR spectroscopy, thus providing access for academic research groups that do not have the financial and technical means to set up
- 2 -
Introduction
such complicated and expensive systems. The advantage of these centers is that multi-frequency EPR spectrometers are available between 95 GHz and 600 GHz. The disadvantages are that the allotted time of operation is usually limited to a few days and that the absolute sensitivity of these EPR spec-trometers is limited so that small samples cannot be studied in general. Importantly, Electron Nuclear Double Resonance (ENDOR) spectroscopy, a technique essential to identify the electronic and geometric structure of para-magnetic centers, has as yet not been developed in these specialized EPR centers.
The observation of the “powder” spectrum mentioned earlier is the result of the higher spectral resolution that is realized by going to higher frequencies in EPR. When EPR and ENDOR are combined we can benefit from the increased spectral resolution obtainable in the observation of both the electron- and the nuclear Zeeman interaction. In crystals this enables the separate investigation of sites with small differences in g-value. A second advantage is the increased absolute sensitivity that can be realized at high frequencies; investigation of materials that only can be prepared in small samples or small quantities is then facilitated. In the third place measure-ments on systems that have zero-field splitting parameters too high to be investigated at lower frequencies are enabled. Furthermore, the availability of EPR spectra from low to high frequency (multi-frequency EPR) will very often provide a better insight in the interactions involved.
In 1998 the idea was born at Leiden University to construct an EPR spectrometer at the highest frequency possible using commercially available superconducting magnets. The aim was to build an EPR system that allows for ENDOR spectroscopy and that can be accommodated in any physics or chemistry laboratory. Taking into account the limits of the superconducting magnet technology (and the related prize!), the decision was made to construct a system at 275 GHz using a superconducting magnet with a maxi-mum field of 14 T. This would allow for EPR spectroscopy on paramagnetic systems with a g-value of 2 at a magnetic field of 10 T and systems with a g-value as low as 1.4 at 14 T. In view of the experience acquired with the previously constructed 95 GHz EPR spectrometer, it was decided that the spectrometer should be able to operate in cw as well as in pulsed mode, at temperatures between 5 K and 300 K and that it should be equipped with a single-mode resonator. The great virtue of such a resonator is the high sensi-
- 3 -
Chapter 1
tivity that can be obtained and the possibility to study very small samples with linear dimensions in the order of only 0.1 mm.
In this thesis, the construction of a 275 GHz EPR/ENDOR spec-trometer and its performance will be presented. The spectrometer is equipped with a single-mode resonator and allows the study of minute samples between 5 K and 300 K. The system operates in cw as well as in pulsed mode and can easily be switched between the two types of operation. ENDOR spectroscopy can be performed as will be demonstrated by several examples. Perhaps the most important conclusion is that EPR and ENDOR spectroscopy can now be performed routinely at 275 GHz without the need to resort to specialized high-magnetic-field laboratories.
The thesis is organized as follows. In chapter 2, the general layout of the spectrometer is described and EPR results are discussed that serve to illustrate the performance of the system. In appendices to this chapter, some details of the system are highlighted. In appendix A the principles of the quasi-optical techniques are outlined, in particular in relation to a number of important quasi-optical components used in the 275 GHz microwave bridge. Appendix B covers some technical aspects of the spectrometer. In chapter 3, the first ENDOR results are presented and the special probe head that is essential for the ENDOR experiments. Chapters 2 and 3 are almost identical to two publications in the Journal of Magnetic Resonance in which these first results have been presented. Chapter 4 is based on a recent publication in Physical Review Letters in which dynamic nuclear polarization experiments for ZnO are described, performed at 275 GHz. In chapter 5 the EPR and ENDOR results at 275 GHz for Poly(3-hexylthiophene) (P3HT) with and without 0.1 % of 6,6-phenyl-C61-butyric acid methyl ester (PCBM) are presented and discussed.
- 4 -
Introduction
References
[1.1]. E. Zavoiski, J. Phys. USSR. 9, (211) 1945. [1.2]. B. Bleany and K.W.H. Stevens, Paramagnetic Resonance, Repts.
Progr. Phys. 16, 108 (1953). [1.3]. K.D. Bowers and J. Owen, Paramagnetic Resonance II, Repts.
Progr. Phys. 18, 304 (1955). [1.4]. G.E. Pake, J. Townsend and S.I. Weissman, Hyperfine Structure in
the Paramagnetic Resonance of the Ion (SO3)2NO--*, Phys. Rev. 85, 682 (1952).
[1.5]. O.Ya. Grinberg, A.A. Dubinskii and Ya.S. Lebedev, Russ. Chem. Rev. 52, 850 (1983).
[1.6]. E. Haindl, K. Möbius and H. Oloff, A 94 GHz EPR Spectrometer with Fabry-Perot Resonator, Z. Naturforsch. 40A, 169 (1985).
[1.7]. O. Burghaus, A. Toth-Kischkat, R. Klette and K. Möbius, Proton ENDOR at a Microwave Frequency of 97 GHz, J. Magn. Reson. 80, 383 (1988).
[1.8]. W.B. Lynch, K.A. Earle and J.H. Freed, 1-mm wave ESR spectrometer, Rev. Sci. Instr. 59, 1345 (1988).
[1.9]. K.A. Earle, D.E. Budil and J.H. Freed, in Advances in Magnetic and Optical Resonance, (W. Warren, Ed.) (Academic Press, New York, 1996).
[1.10]. R.T. Weber, J.A.J.M. Disselhorst, L.J. Prevo, J. Schmidt and W. Th. Wenckebach, Electron Spin-Echo Spectroscopy at 95 GHz, J. Magn. Reson. 81, 129 (1989).
[1.11]. J. Allgeier, J.A.J.M. Disselhorst, R.T. Weber, W. Th. Wenckebach and J. Schmidt, in Modern Pulsed and Continuous-Wave Electron Spin Resonance, (G. Kovan, M.K. Bowman, Ed.) (Wiley, New York, 1990).
[1.12]. J.A.J.M. Disselhorst, H. van der Meer, O.G. Poluektov and J. Schmidt, A Pulsed EPR and ENDOR Spectrometer Operating at 95 GHz, J. Magn. Reson. 115, 183 (1995).
[1.13]. F. Herlach and J.A.A.J. Perenboom, Magnet laboratory facilities worldwide - an update, Physica B 211 (1995).
- 5 -
Chapter 1
[1.14]. G.M. Smith, J.C.G. Lesurf, R.H. Mitchell and P.C. Reidi, Quasi-optical cw mm-wave electron spin resonance spectrometer, Rev. Sci. Instr. 69, 3924 (1998).
- 6 -
Chapter 2
The 275 GHz spectrometer. First EPR results
Abstract
An Electron Paramagnetic Resonance (EPR) spectrometer is described which allows for continuous-wave and pulsed EPR experiments at 275 GHz (wave-length 1.1 mm). The related magnetic field of 9.9 T for g ~ 2 is supplied by a superconducting solenoid. The microwave bridge employs quasi-optical as well as conventional waveguide components. A cylindrical, single-mode cavity provides a high filling factor and a high sensitivity for EPR detection. Even with the available microwave power of 1 mW incident at the cavity a high microwave magnetic field B1 is obtained of about 0.1 mT which permits π/2-pulses as short as 100 ns. The performance of the spectrometer is illus-trated with the help of spectra taken with several samples. The content of this chapter has been published: H. Blok, J.A.J.M. Disselhorst, S.B. Orlinskii and J. Schmidt ‘A continuous wave and pulsed electron spin resonance spectrometer operating at 275 GHz’ J. Magn. Reson. 166 (2004) 92-99.
- 7 -
Chapter 2
Introduction
In the last decade the interest in Electron Paramagnetic Resonance (EPR) spectroscopy at frequencies higher than 9-35 GHz has grown considerably [2.1]. In particular EPR at 95 GHz and 140 GHz is now widely applied [2.2] and several groups are presently developing the EPR technology to frequencies around 300 GHz and higher [2.3, 2.4]. The advantages of working at such high frequencies are manifold. First one benefits from the increased spectral resolution in the EPR as well as in the ENDOR (Electron Nuclear Double Resonance) spectra. In EPR spectroscopy of single crystals one can separate signals of sites with slightly different g-tensors. In random samples the anisotropy of the g tensor allows to perform orientationally selective EPR and ENDOR experiments. Secondly, the absolute sensitivity increases dramatically as a result of the large Boltzmann factor and the fact that very tiny samples can be used. Third, spin systems with S>1/2 with large zero-field splitting become accessible. Applications of high-frequency EPR range from semiconductor materials, spin cluster systems and metallo proteins to organic radicals in proteins [2.5]. The many possible applications have even led to ultrawide band multifrequency EPR spectrometers [2.6].
The EPR experiments performed at 95 GHz and 140 GHz demonstrate that it is attractive to have cw as well as pulsed techniques at one’s disposal [2.7]. Continuous-wave methods are usually applied to systems with relatively short spin-spin relaxation times and are excellently suited to measure lineshapes and hyperfine structures. Pulsed EPR methods allow to study T1- and T2-type relaxation processes and moreover appear to be very well suited to perform ENDOR experiments. With these aspects in mind we have decided to push the spectral resolution and the absolute sensitivity of cw and pulsed EPR to the limit that can be achieved with conventional super-conducting magnet technology by constructing a 275.7 GHz EPR spec-trometer that employs a superconducting magnet with a maximum field of 14 T and that allows for cw as well as pulsed operation.
In this chapter we present the design and performance of this spec-trometer. Inspired by the examples set by other groups [2.8, 2.9, 2.10] we have used quasi-optical transmission techniques to eliminate the unac-ceptably high transmission losses of conventional waveguide technology at this high frequency. The problem of separating the reflected cw EPR signal
- 8 -
EPR at 275 GHz
or the electron-spin-echo (ESE) signal from the excitation beam and the problem of combining the signal beam with the beam of the local oscillator for the superheterodyne detection process has been solved by taking advan-tage of specific properties of the quasi-optical microwave components. A combination of a Gunn diode at 91.9 GHz and a tripler produces a cw output of about 5 mW at 275.7 GHz. By using a PIN switch that modulates the output of the Gunn diode at 91.9 GHz, pulses are obtained at 275.7 GHz with an on-off ratio of more than 80 dB. An important aspect of the spectrometer is that a tunable single-mode cavity is used. The advantage is that even with this moderate microwave power pulsed EPR experiments can be performed with pulse durations of about 100 ns. The use of the single-mode cavity also leads to an excellent absolute sensitivity of ≈108 spins per mT at a bandwidth of 1 Hz. The spectrometer is flexible and can easily be switched from cw to pulsed operation as is demonstrated by several experimental results obtained on various samples. Experimental Outline of the spectrometer
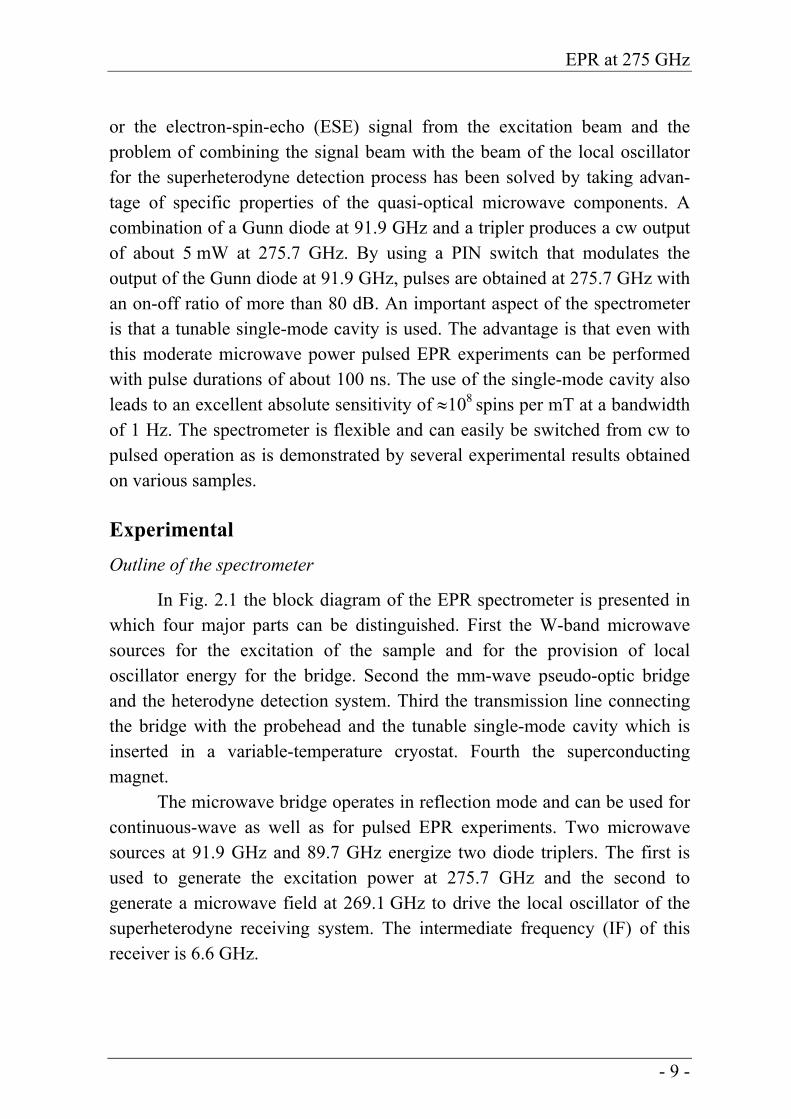
In Fig. 2.1 the block diagram of the EPR spectrometer is presented in which four major parts can be distinguished. First the W-band microwave sources for the excitation of the sample and for the provision of local oscillator energy for the bridge. Second the mm-wave pseudo-optic bridge and the heterodyne detection system. Third the transmission line connecting the bridge with the probehead and the tunable single-mode cavity which is inserted in a variable-temperature cryostat. Fourth the superconducting magnet.
The microwave bridge operates in reflection mode and can be used for continuous-wave as well as for pulsed EPR experiments. Two microwave sources at 91.9 GHz and 89.7 GHz energize two diode triplers. The first is used to generate the excitation power at 275.7 GHz and the second to generate a microwave field at 269.1 GHz to drive the local oscillator of the superheterodyne receiving system. The intermediate frequency (IF) of this receiver is 6.6 GHz.
- 9 -
Chapter 2
Fig. 2.1. Block diagram of the 275.7 GHz EPR spectrometer with the super-conducting magnet and the single-mode cavity. The pseudo-optic part is indicated within the dotted lines.
An important aspect of the bridge is that for the transport of the high-frequency microwave energy pseudo-optical, confined beams of electro-magnetic waves in free space are used. The advantage of applying this
- 10 -
EPR at 275 GHz
technique is that the microwave transmission losses, which would be unacceptably high when using traditional waveguides, are almost negligible.
The transmission line connecting the bridge with the probehead at the bottom of the variable-temperature cryostat is a special oversized, HE11 corrugated waveguide. The attraction of this structure is that the high-frequency microwaves are confined to a lateral dimension of 18 mm and that the transmission losses over the length of 1.2 m are very low. The probehead contains a tunable single-mode TE011, resonant cavity in which the sample is positioned. The magnet is a solenoid-type superconducting coil with a maximum field of 14 T. These items will be discussed in more detail after some general remarks about the use of the pseudo-optical beams. Pseudo-optical beams
In pseudo-optical systems beams of transverse electromagnetic waves are used to transport microwave energy from one place to another and Gaussian beams are a good representation for the propagation of the electro-magnetic waves in free space when the system dimensions are less than a few hundred wavelengths [2.11]. The beams can be focused by lenses and mirrors but, in contrast to ray optics, diffraction and the curved nature of the wave-front has to be taken into account in the description of their propagation. Gaussian beams convert and divert hyperbolically with a wavefront with varying curvature towards a non-zero minimum dimension, the waist (w0). At this position the wavefront is a plane wave. A fundamental Gaussian beam has a flat wavefront at the aperture z = 0 with a field amplitude Er that varies in the x-y plane according to a Gaussian function: Er = E0exp(-r2/w2), with r2 = x2 + y2 and produces a traveling wave (beam) in the z-direction. This beam remains Gaussian in the x-y plane, decreases in amplitude and expands in width. The width w varies with z as w2 = w0
2[1 + (z/z0)2]. The wavefront varies like a spherical wave with a radius R = z [1 + (z0/z)2]. In both formulas z0 = (πw0
2/λ) is also called the Rayleigh range or confocal distance, indicating the boundary between decreasing and increasing wavefront radius. Nearly all of the energy of a Gaussian beam (98.9 %) is confined within a cross-sectional area with a diameter three times the width w of the beam and since the beam is a free propagating electromagnetic wave the losses in the propa-gation path are negligible, especially when the beam handling is done with
- 11 -
Chapter 2
metallic mirrors. Mirrors have perfect reflecting properties, do not need anti-reflection coatings and can be machined very accurately. The dimensions of the mirrors should be chosen such that the aperture is sufficient to suppress higher-order modes possibly introduced by diffraction effects at the mirror boundaries.
A mirror that proves to be very useful in the design of the microwave bridge is the so-called rooftop mirror. This type of mirror is a combination of two flat mirrors touching each other along the rooftop line at a 900 angle. An incoming wave is reflected back in the same direction but owing to the fact that the resulting E-field at both reflection points has to be normal to the mirror planes the polarization of this reflected wave will be different. The rotation of the polarization is two times the angle between the incoming polarization and the rooftop line. More specifically when the incoming polarization is +450 then the reflected polarization is –450 with respect to the rooftop line, i.e., the incoming and reflected beams are orthogonally polarized.
Other important tools to manipulate the polarized beams in the micro-wave bridge are grids made of many thin, parallel wires. These wire grids act as virtually perfect mirrors for a wave with the E-field vector parallel to the wires whereas they are transparent to the orthogonally polarized waves. For our operating frequency a polarizer with wires of 20 μm at a pitch of 60 μm has a typical insertion loss of less than 0.1 dB for the properly polarized waves and a cross-polarization attenuation better than 30 dB.
The third quasi-optical component that plays an important part in the microwave bridge is the Martin-Puplett diplexer. It is used to combine the beam carrying the EPR signal and the beam of the local oscillator and to give them the same polarization. It consists of two rooftop mirrors combined with a wire-grid polarizer, which is rotated over 450. An incoming wave, polarized in the direction of the rooftop line will then be split into two orthogonally polarized components. One will be reflected towards the first mirror, rotated over 900 and then pass through the polarizer. The other component will pass through the polarizer and after reflection from the second rooftop mirror will be reflected at the polarizer to recombine with the first component. There will be a phase difference between the two components if the path lengths between the polarizer and the two rooftop mirrors differ. One of the mirrors is movable and can be adjusted for the second component to be either in-
- 12 -
EPR at 275 GHz
phase or out of phase with the first one. The resulting output wave is then either horizontally or vertically polarized. When another wave with a perpen-dicular polarization and a different wavelength is projected onto the polarizer the same process will result in an output with the same polarization as the first one, provided that the path-length difference Δ = nλ1 for the first and Δ = (n + ½)λ2 for the second wave. The resulting combined wave has a well-defined polarization and is directed towards the microwave mixer, which is polarization sensitive. Microwave bridge
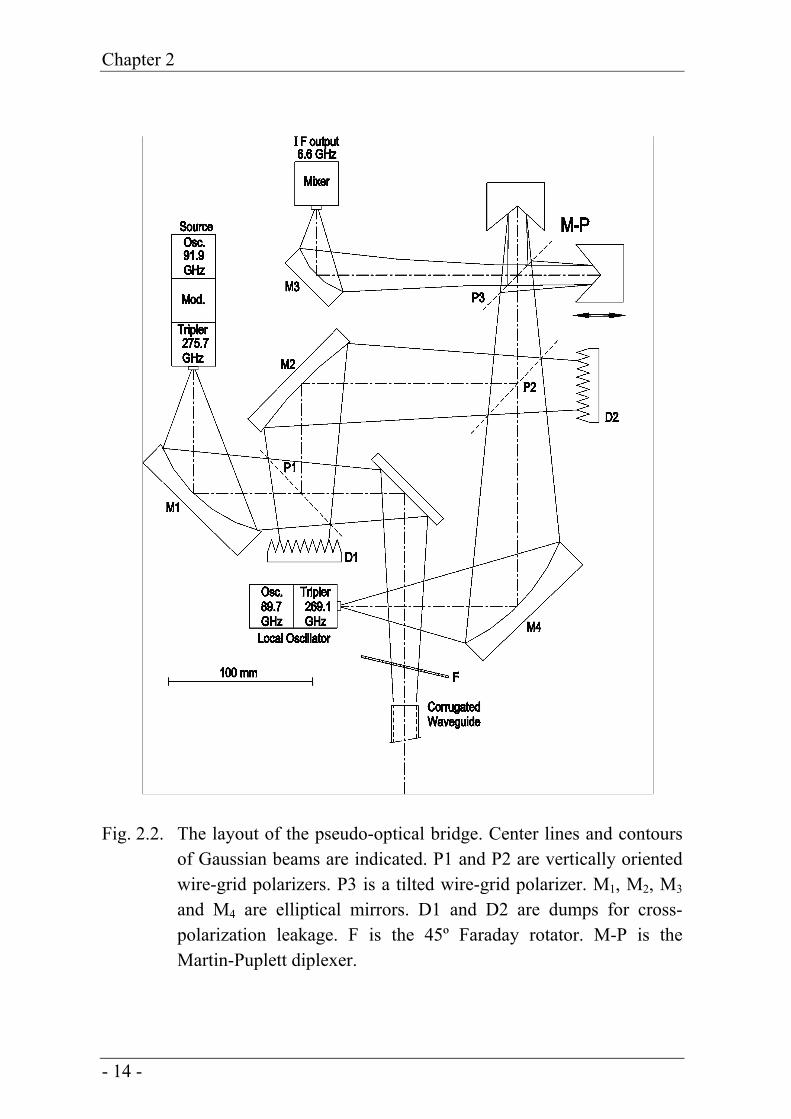
The layout of the microwave bridge, which is built by Radiometer Physics GmbH in Meckenheim in Germany, is given in Fig. 2.2. The micro-wave source is a Gunn diode oscillator at 91.9 GHz that is phase-locked to a 100 MHz crystal oscillator and whose output of 60 mW is fed into a frequency tripler. After the tripler about 5 mW is available at 275.7 GHz. In pulsed operation the output of the Gunn oscillator at 91.9 GHz is converted into pulses by a PIN switch with an on-off ratio of 20 dB, an insertion loss of 1.2 dB and a switching time of 5 ns. As a result of the non-linear behavior of the tripler the on-off ratio at 275.7 GHz is more than 80 dB. This high on-off ratio enables the detection of the faint echo signals against the noise in the IF band originating in the mixer. The 275.7 GHz output of the tripler is con-verted into a free propagating Gaussian beam with a waist of 1.8 mm by a scalar feed horn and transformed to a convergent beam by an off-axis focusing elliptical mirror. This beam is transmitted through a grid polarizer and then projected by a flat mirror to a waist at the entrance of a corrugated, circular waveguide. The waist w0 at the entrance of the corrugated waveguide is 5.45 mm which is about three times smaller than the inside diameter of 18 mm of this waveguide. As already mentioned, in this way virtually all microwave energy is coupled into the waveguide. A Faraday rotator (QMC Instruments Ltd, England) is positioned in this beam, which rotates the polarization of the wave over 450 in a clockwise direction. The second microwave source is also phase-locked to the same 100 MHz crystal oscillator and provides an output of 50 mW at 89.7 GHz. This 89.7 GHz signal is also tripled and the resulting signal at 269.1 GHz with a power of 2 mW serves as the local oscillator for the superheterodyne receiver.
- 13 -
Chapter 2
Fig. 2.2. The layout of the pseudo-optical bridge. Center lines and contours
of Gaussian beams are indicated. P1 and P2 are vertically oriented wire-grid polarizers. P3 is a tilted wire-grid polarizer. M1, M2, M3 and M4 are elliptical mirrors. D1 and D2 are dumps for cross-polarization leakage. F is the 45º Faraday rotator. M-P is the Martin-Puplett diplexer.
- 14 -
EPR at 275 GHz
The reflected cw EPR signal or the Electron Spin Echo signal produced by the sample in the resonator is also linearly polarized and travels back through the corrugated waveguide. Its polarization is now rotated over 450 counterclockwise with respect to the propagation direction by passing through the Faraday rotator and consequently is orthogonally polarized with respect to the incoming wave. The beam is reflected from the grid polarizer and refocused towards the Martin-Puplett diplexer via a grid polarizer, acting as a mirror. The output of the local oscillator at 269.1 GHz is orthogonally polarized and projected through the same polarizer. The Martin-Puplett diplexer is adjusted such that the incoming beams are not only combined but that they also have the same polarization at the output side. The output of the diplexer is then focused towards a waist at the entrance of a scalar horn and coupled to the mixer diode where the 6.6 GHz Intermediate Frequency (IF) signal is produced. This signal is amplified by an IF amplifier with a band-width of 280 MHz and a gain of 50 to 80 dB, rectified and fed to a lock-in detector for cw operation or to a boxcar integrator and data acquisition elec-tronics when the system is used in pulsed mode. Initially the outputs were presented on a Bruker EleXsys system, which also controlled the magnet sweeps. With the implementation of the pulsed ENDOR capabilities the system control was modified. Presently the system control and the data-acquisition is managed by a dedicated system PC. Corrugated waveguide and probehead
A corrugated circular waveguide (Thomas Keating Ltd in Billings-hurst, England) with an inside diameter of 18 mm is used to transport the microwave energy to the resonator at the bottom of a variable-temperature cryostat which in turn is positioned in the room-temperature bore of the superconducting magnet. The circumferentially corrugated structure of the wall presents a high longitudinal surface reactance to the microwave field. To this end the corrugations have a depth of λ/4 and a spacing of λ/2. The Gaussian beam emanating from the bridge is focused at the entrance of this waveguide and couples very effectively to a HE11 mode, which has zero field amplitude at the wall and propagates with very low loss and with conservation of its polarization in this waveguide. At the end of the 1 m long waveguide a corrugated tapered transition (Thomas Keating Ltd) modifies the
- 15 -
Chapter 2
propagation path from the large circular waveguide into a fundamental-mode rectangular one with inside dimensions of 0.44x0.88 mm. The microwave losses in the corrugated waveguide and the taper are less than 0.1 dB. From the 5 mW of microwave power available at the source tripler a little more than 1 mW reaches the cavity. The losses are mainly attributable to the Faraday rotator and the small section of fundamental-mode rectangular waveguide at the end of the taper.
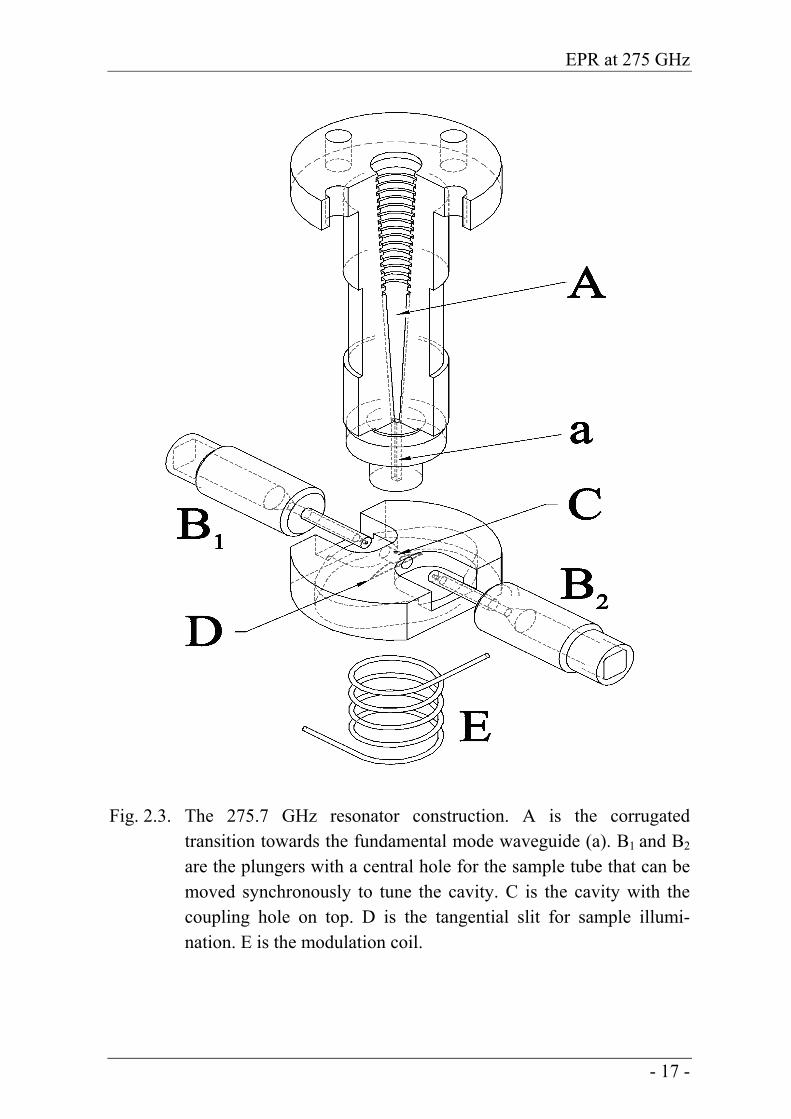
In Fig. 2.3 a schematic drawing is presented of the horizontally positioned TE011 cylindrical cavity that contains the sample. The cavity is coupled to the short piece of rectangular waveguide at the end of the tapered side of the corrugated waveguide through a small hole with a diameter of 0.34 mm in its shortened end. The diameter of the cavity is 1.40 mm and the length can be varied between 0.80 mm and 1.40 mm to enable tuning of the cavity to the operating frequency of 275.7 GHz. The actual length depends on the amount and type of material (sample and sample tube) in the cavity. The tuning is performed by moving two plungers at both sides of the cavity symmetrically and synchronously inward or outward with the help of two coupled differential reduction mechanisms. In this way the position of the coupling hole is maintained in the center between the two plungers. The positioning of the plungers can be achieved with an accuracy of about 1 μm. The loaded quality factor Q ≈ 1500. The sample is contained in a thin-walled suprasil quartz tube with an outside diameter of ≈ 0.27 mm and an inside diameter of 0.15 mm. This tube is inserted in the cavity through two 0.4 mm diameter holes through the center of the plungers. This sample tube can be rotated over 3600. The coupling between the fundamental-mode rectangular waveguide and the cavity is varied by rotating the cavity-plunger com-bination around a vertical axis that goes through the rectangular waveguide and the coupling hole. A coil is positioned directly underneath the cavity to enable the generation of a low-frequency modulation field in the same direction of the main magnetic field for lock-in detection of the resonance signal in cw operation. The coil is mechanically isolated from the cavity block. Illumination of the sample with light can be realized through a tangen-tial slit with a width of 0.1 mm in the bottom of the cavity.
- 16 -
EPR at 275 GHz
Fig. 2.3. The 275.7 GHz resonator construction. A is the corrugated transition towards the fundamental mode waveguide (a). B1 and B2
are the plungers with a central hole for the sample tube that can be moved synchronously to tune the cavity. C is the cavity with the coupling hole on top. D is the tangential slit for sample illumi-nation. E is the modulation coil.
- 17 -
Chapter 2
Variable-temperature cryostat
The combination of the corrugated waveguide and the probehead is inserted in a variable-temperature, helium gas-flow cryostat (SpectrostatCF by Oxford Instruments Ltd in England) that in turn is positioned in the room-temperature bore of the superconducting magnet. The whole insert including the probehead and the sample can be cooled from 300 K to 4.5 K by the flow of cold helium gas with a precision and stability of about 0.1 K. At the top of the cryostat a 0.2 mm thick kapton window, transparent to the microwaves, separates the helium atmosphere from the ambient. Magnet.
The magnet, type TeslatronTH14, constructed by Oxford Instruments Ltd in England, is a superconducting solenoid with a warm bore of 88 mm diameter and a maximum obtainable field of 14 Tesla. It has a specified homogeneity of 10-5 over a spherical volume with a diameter of 3 mm. In view of the fact that the linear dimensions of the sample size are only 0.1 mm the variation of the magnetic field over the sample is assumed to be of the order of 0.01 mT. The magnet is operated with the power supply leads permanently connected to the magnet. The inductance of the magnet is only 53.6 Henry and sweeps of 1 Tesla can be performed in 20 minutes, which is very advantageous for paramagnetic systems with a large g-anisotropy. The long-term stability over a period of 20 minutes is 0.02 mT whereas the short-term stability on a time-scale of 1 s is 0.01 mT. The disadvantage of this system compared to a persistent magnet equipped with a separate super-conducting sweep coil is the relatively high helium consumption. Without energizing the coils the helium boil-off rate is 0.1 liter per hour and at a field of 10 T it is 0.3 liter per hour. System performance
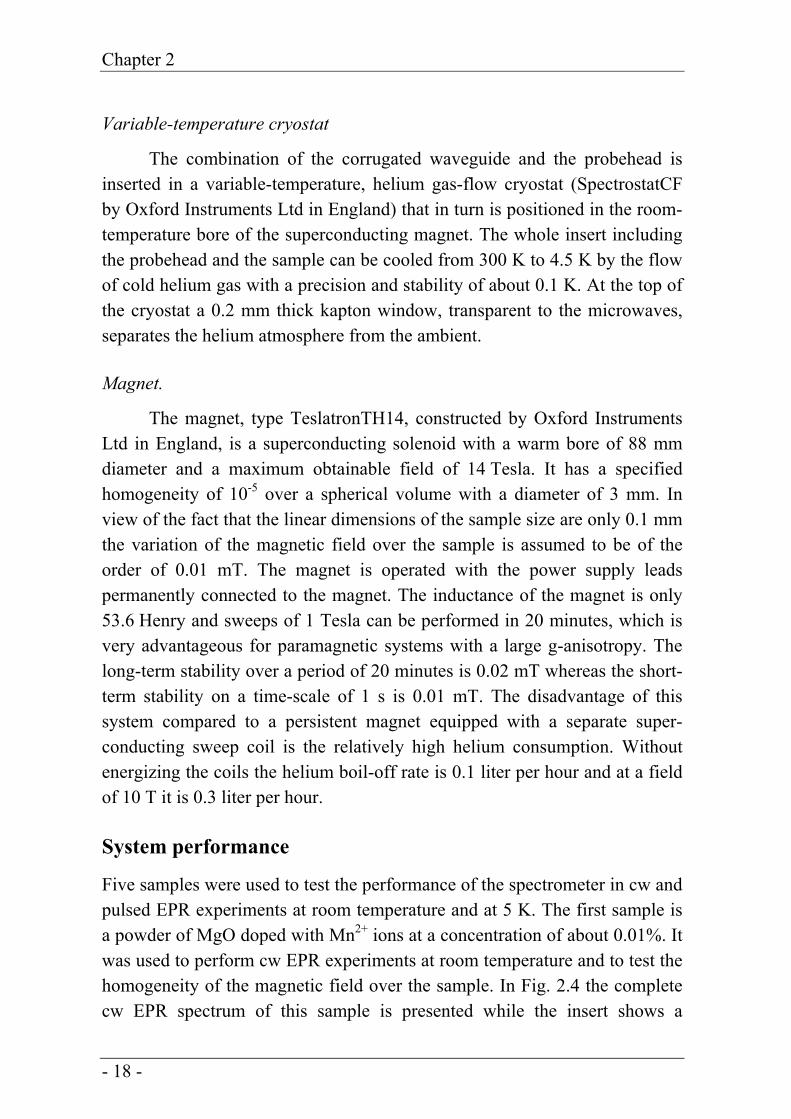
Five samples were used to test the performance of the spectrometer in cw and pulsed EPR experiments at room temperature and at 5 K. The first sample is a powder of MgO doped with Mn2+ ions at a concentration of about 0.01%. It was used to perform cw EPR experiments at room temperature and to test the homogeneity of the magnetic field over the sample. In Fig. 2.4 the complete cw EPR spectrum of this sample is presented while the insert shows a
- 18 -
EPR at 275 GHz
detailed recording of a hyperfine component. The linewidth observed for the six hyperfine components is 7x10⁻² mT. This value is identical to that observed at 95 GHz and shows that the inhomogeneity of the magnetic field is of the order of 10-2 mT or less at a resonance field of 9.8 T over the sample volume of 150x150x150 (μm)3. The detailed recording of one of the hyper-fine components illustrates that there is a small instability of the magnetic field of the order of 10-2 mT during the sweep.
9.820 9.830 9.840 9.850 9.860 9.870
Sign
al st
reng
th (a
.u.)
Magnetic field (T)9.8670 9.8672 9.8674 9.8676 9.8678 9.8680
Sign
al st
reng
th (a
.u.)
Magnetic field (T)
Fig. 2.4. The cw spectrum of the mS=+½↔mS=-½ transition of Mn2+ (S=5/2, I=5/2) in MgO. In the insert a recording is shown of one of the hyperfine components of the Mn2+ spectrum. This spectrum indicates that the inhomogeneity over the sample is ≤ 10-2 mT and that the instability of the magnetic field during the sweep ≈10-2 mT. The field modulation is at 1000 Hz with an amplitude of 10-2 mT.
- 19 -
Chapter 2
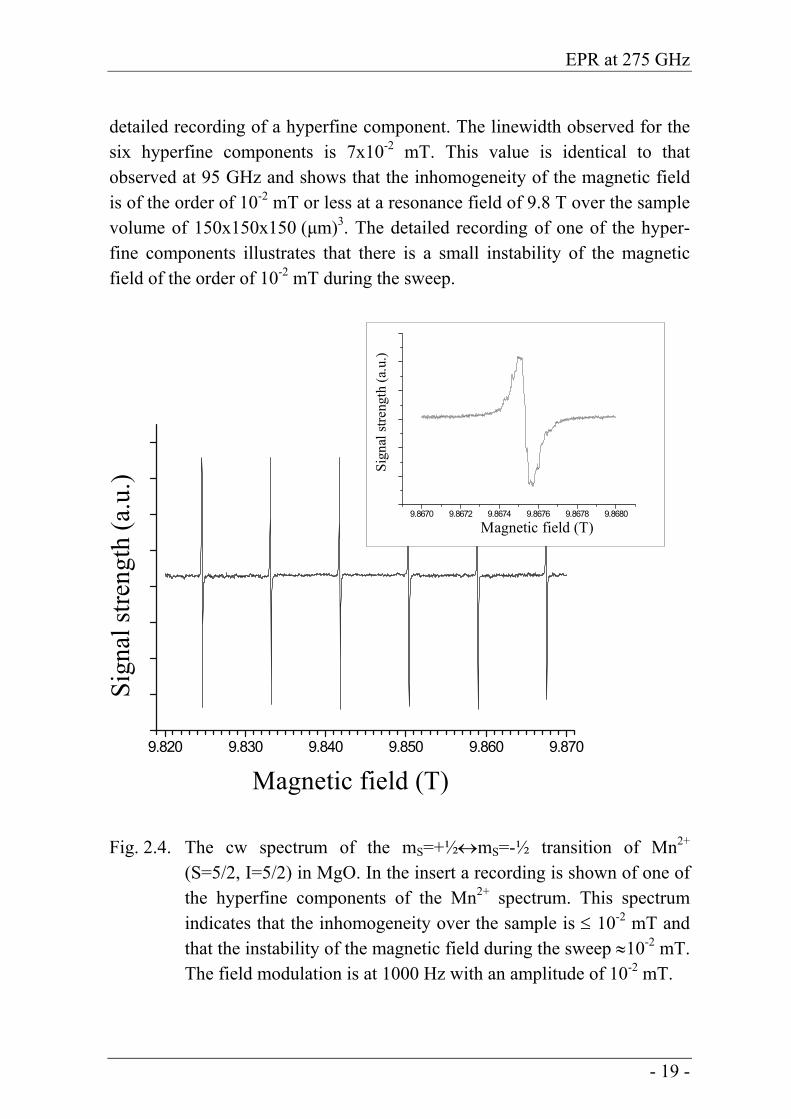
The second sample is a solution of a stable proxyl radical in toluene at a concentration of 10-4 M. The sample volume in the cavity is 17 nanoliter. In Fig. 2.5 the cw EPR spectrum of this sample with its characteristic splitting in three components caused by the hyperfine interaction with the 14N nuclear spin (I=1) is presented. From the observed signal-to-noise ratio of about 20 we conclude that the threshold sensitivity at room temperature of the spectrometer is 1.4x10⁸ spins/0.1mT/√Hz.
9.816 9.817 9.818 9.819 9.820 9.821 9.822 9.823
Sign
al st
reng
th (a
.u.)
M agnetic field (T)
Fig. 2.5. The cw EPR spectrum of 17 nanoliter of a 10-4 M solution of a proxyl radical in toluene.
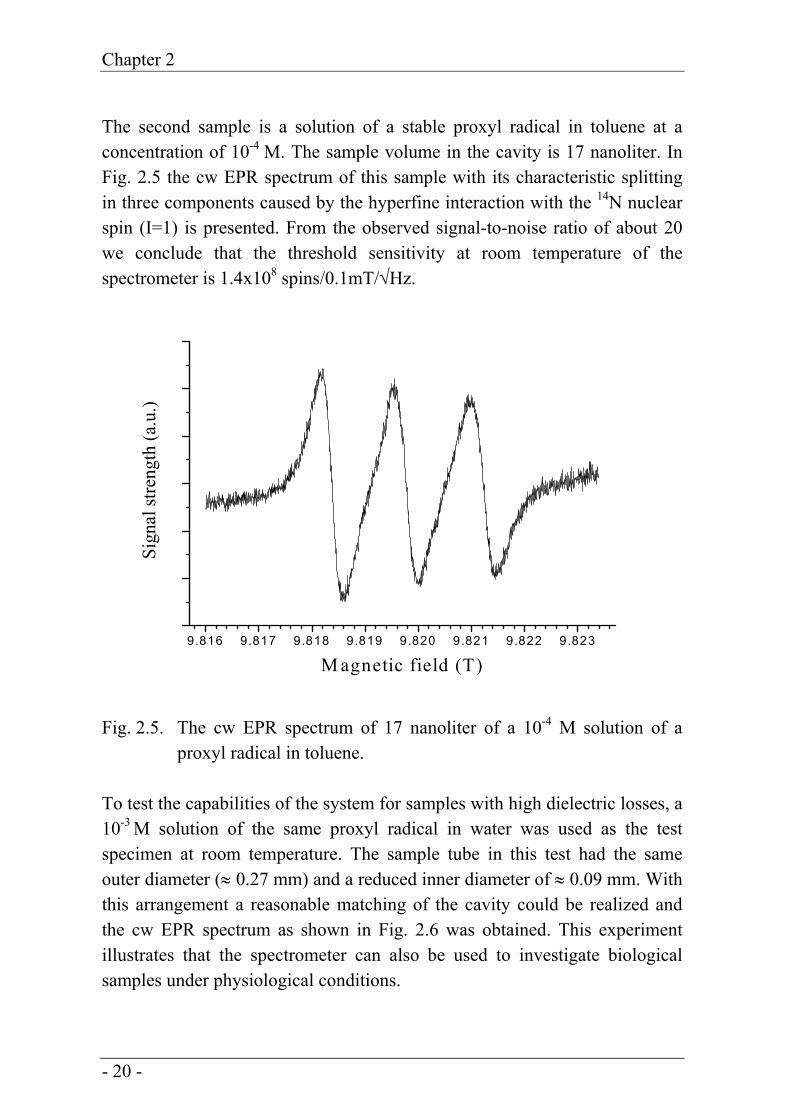
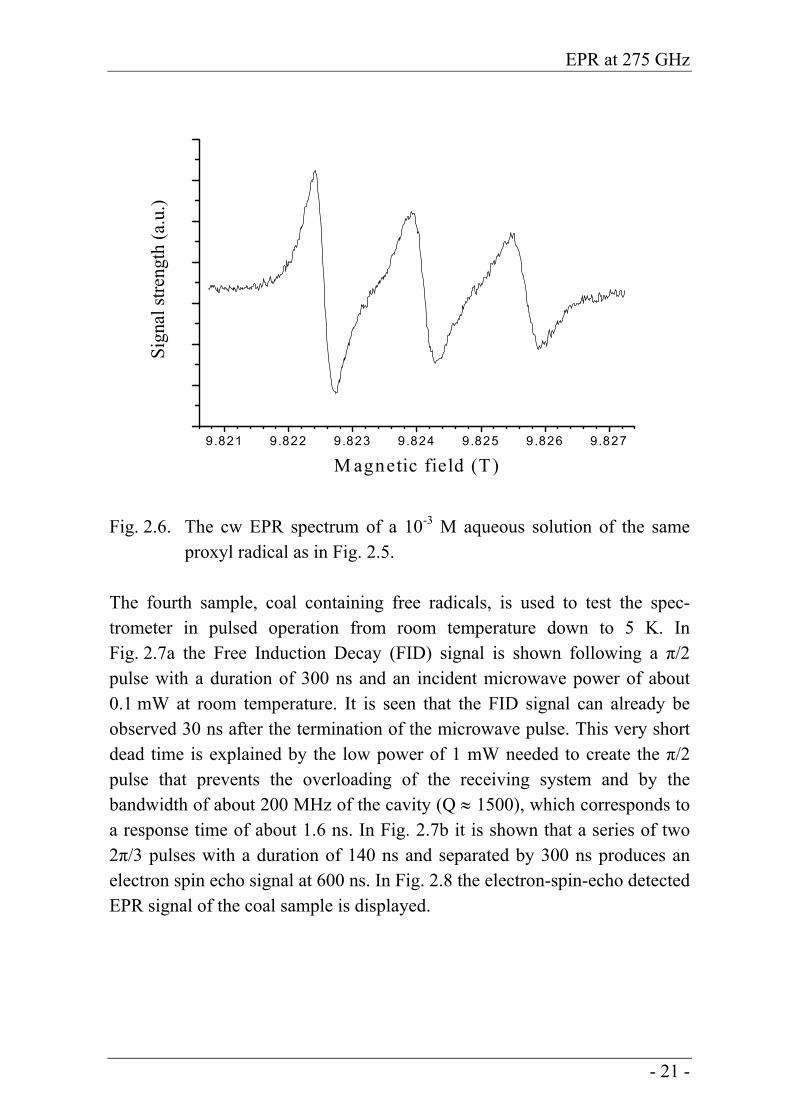
To test the capabilities of the system for samples with high dielectric losses, a 10-3 M solution of the same proxyl radical in water was used as the test specimen at room temperature. The sample tube in this test had the same outer diameter (≈ 0.27 mm) and a reduced inner diameter of ≈ 0.09 mm. With this arrangement a reasonable matching of the cavity could be realized and the cw EPR spectrum as shown in Fig. 2.6 was obtained. This experiment illustrates that the spectrometer can also be used to investigate biological samples under physiological conditions.
- 20 -
EPR at 275 GHz
9.821 9.822 9.823 9.824 9.825 9.826 9.827
Sign
al st
reng
th (a
.u.)
M agnetic field (T)
Fig. 2.6. The cw EPR spectrum of a 10-3 M aqueous solution of the same proxyl radical as in Fig. 2.5.
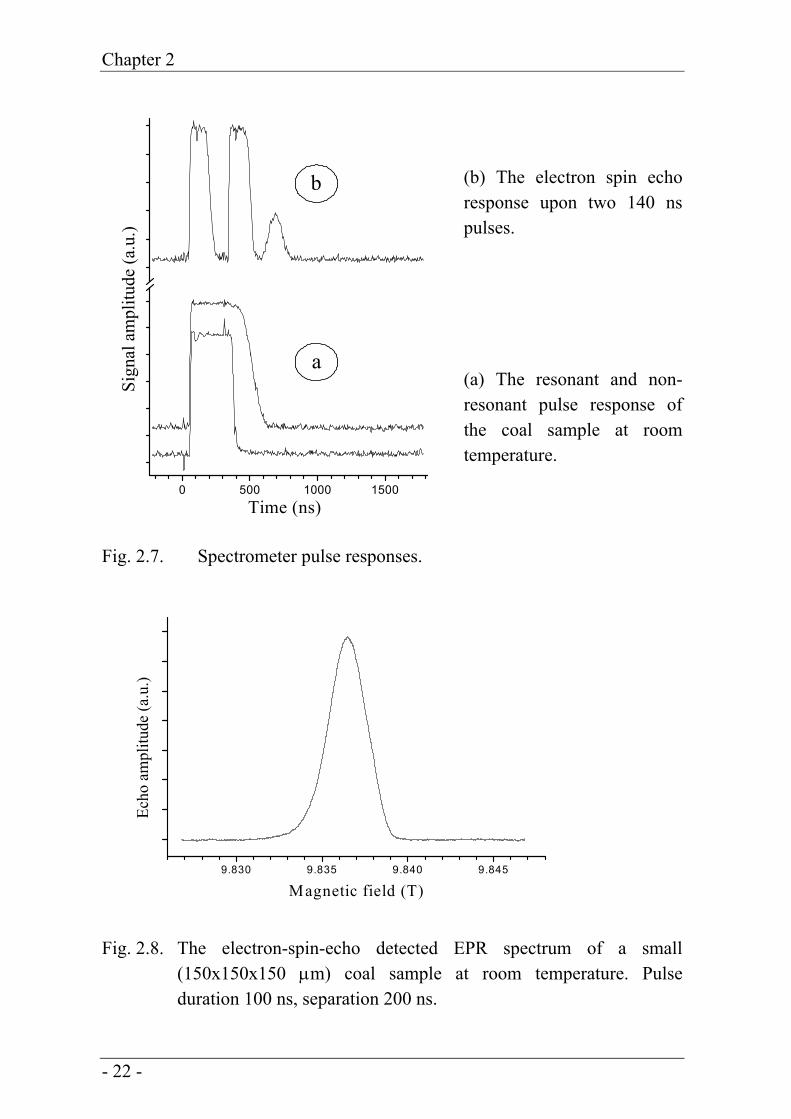
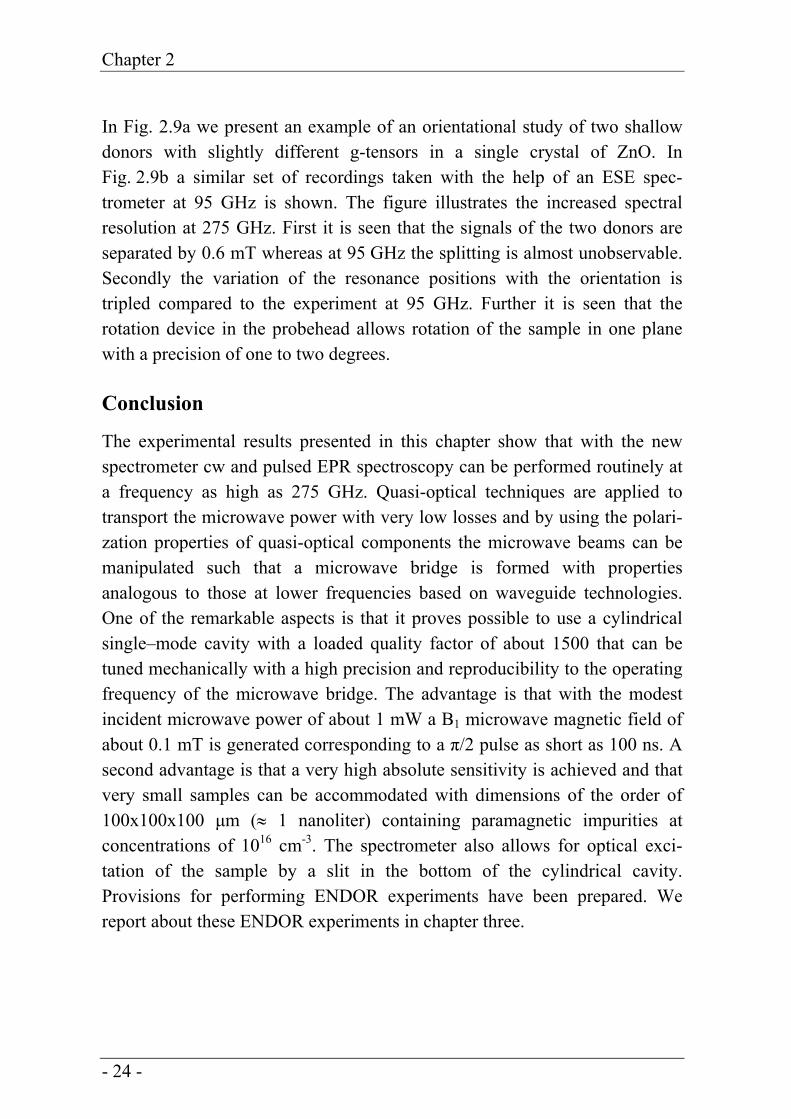
The fourth sample, coal containing free radicals, is used to test the spec-trometer in pulsed operation from room temperature down to 5 K. In Fig. 2.7a the Free Induction Decay (FID) signal is shown following a π/2 pulse with a duration of 300 ns and an incident microwave power of about 0.1 mW at room temperature. It is seen that the FID signal can already be observed 30 ns after the termination of the microwave pulse. This very short dead time is explained by the low power of 1 mW needed to create the π/2 pulse that prevents the overloading of the receiving system and by the bandwidth of about 200 MHz of the cavity (Q ≈ 1500), which corresponds to a response time of about 1.6 ns. In Fig. 2.7b it is shown that a series of two 2π/3 pulses with a duration of 140 ns and separated by 300 ns produces an electron spin echo signal at 600 ns. In Fig. 2.8 the electron-spin-echo detected EPR signal of the coal sample is displayed.
- 21 -
Chapter 2
0 500 1000 1500
Sign
al a
mpl
itude
(a.u
.)
Time (ns)
b
a
(b) The electron spin echo response upon two 140 ns pulses. (a) The resonant and non-resonant pulse response of the coal sample at room temperature.
Fig. 2.7. Spectrometer pulse responses.
9.830 9.835 9.840 9.845
Echo
am
plitu
de (a
.u.)
Magnetic field (T)
Fig. 2.8. The electron-spin-echo detected EPR spectrum of a small (150x150x150 μm) coal sample at room temperature. Pulse duration 100 ns, separation 200 ns.
- 22 -
EPR at 275 GHz
10.066 10.068 10.070 10.072 10.074 10.076
Sign
al in
tens
ity (a
.u.)
Magnetic field (T)
-12
96
84
72
60
48
36
24
12
0
Rotationangle(degrees)
a
3.466 3.467 3.468 3.469 3.470 3.471 3.472
Echo
am
plitu
de (a
.u.)
Magnetic field (T)
00
900
Rotationangle(degrees)
b
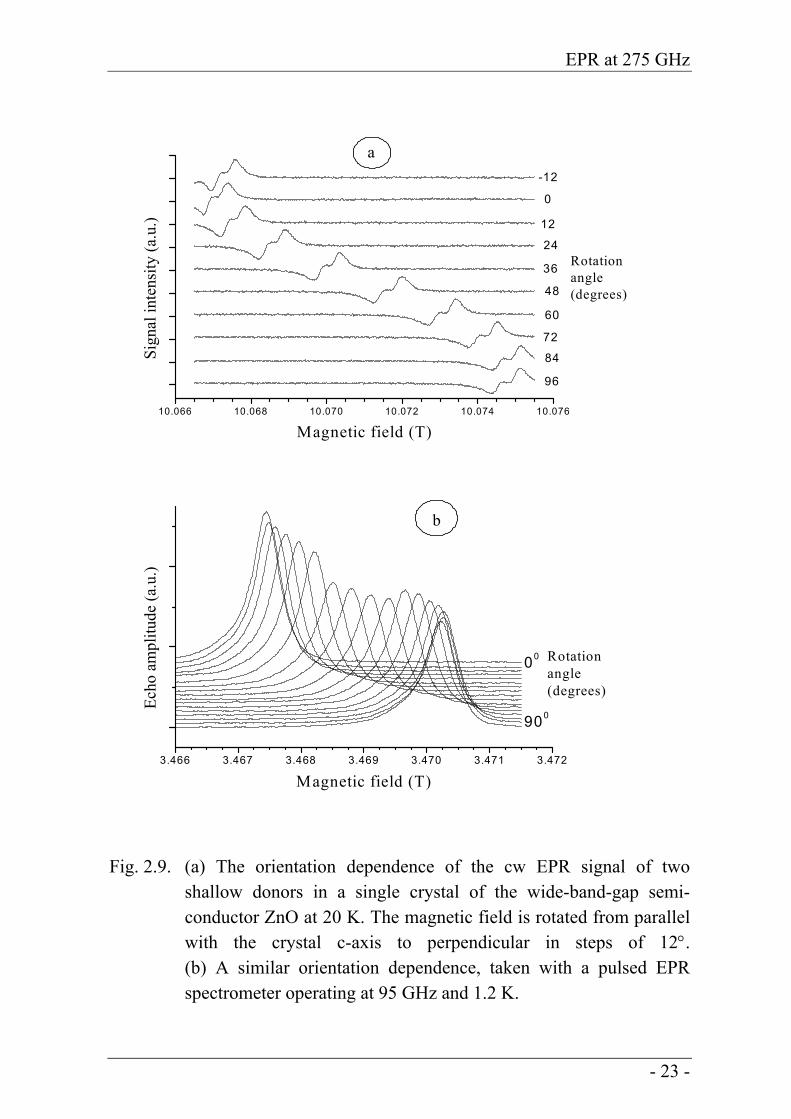
Fig. 2.9. (a) The orientation dependence of the cw EPR signal of two shallow donors in a single crystal of the wide-band-gap semi-conductor ZnO at 20 K. The magnetic field is rotated from parallel with the crystal c-axis to perpendicular in steps of 12°. (b) A similar orientation dependence, taken with a pulsed EPR spectrometer operating at 95 GHz and 1.2 K.
- 23 -
Chapter 2
In Fig. 2.9a we present an example of an orientational study of two shallow donors with slightly different g-tensors in a single crystal of ZnO. In Fig. 2.9b a similar set of recordings taken with the help of an ESE spec-trometer at 95 GHz is shown. The figure illustrates the increased spectral resolution at 275 GHz. First it is seen that the signals of the two donors are separated by 0.6 mT whereas at 95 GHz the splitting is almost unobservable. Secondly the variation of the resonance positions with the orientation is tripled compared to the experiment at 95 GHz. Further it is seen that the rotation device in the probehead allows rotation of the sample in one plane with a precision of one to two degrees. Conclusion
The experimental results presented in this chapter show that with the new spectrometer cw and pulsed EPR spectroscopy can be performed routinely at a frequency as high as 275 GHz. Quasi-optical techniques are applied to transport the microwave power with very low losses and by using the polari-zation properties of quasi-optical components the microwave beams can be manipulated such that a microwave bridge is formed with properties analogous to those at lower frequencies based on waveguide technologies. One of the remarkable aspects is that it proves possible to use a cylindrical single–mode cavity with a loaded quality factor of about 1500 that can be tuned mechanically with a high precision and reproducibility to the operating frequency of the microwave bridge. The advantage is that with the modest incident microwave power of about 1 mW a B1 microwave magnetic field of about 0.1 mT is generated corresponding to a π/2 pulse as short as 100 ns. A second advantage is that a very high absolute sensitivity is achieved and that very small samples can be accommodated with dimensions of the order of 100x100x100 μm (≈ 1 nanoliter) containing paramagnetic impurities at concentrations of 1016 cm-3. The spectrometer also allows for optical exci-tation of the sample by a slit in the bottom of the cylindrical cavity. Provisions for performing ENDOR experiments have been prepared. We report about these ENDOR experiments in chapter three.
- 24 -
Appendix A
Pseudo-optics
Introduction
In this appendix some aspects of pseudo-optical techniques and Gaussian-beam optics will be discussed to the extent needed to comprehend the details of the operation of the 275 GHz EPR spectrometer bridge presented in chapter 2. Paraxial approximation
For frequencies lower than 100 GHz electromagnetic waves can be trans-ported over distances in the order of one meter without appreciable loss via single-mode waveguides. For higher frequencies the loss quickly becomes larger and will be several dB/cm at frequencies of a few hundred GHz. This makes a standard waveguide unusable except for very short distances. For these frequencies narrow beams of electromagnetic waves in air can be used to transport radiation almost without loss. In Gaussian-beam-mode optics the propagation of the electromagnetic waves can be described by Maxwell’s equations for the situation where it is assumed that the radiation is moving in a paraxial beam that has a cross section too small to be handled as a plane wave. For a uniform medium, Maxwell’s equations are reduced to the Helmholtz equation
02222 =Ψ+Ψ∇ k . (2.1)
Where Ψ represent any component E or B of the radiation field and k = 2π/λ is the propagation constant of the medium. When we describe a beam travelling in the z-direction we assume field com-ponents of the form
( ) ( ) ( ikzzyxuzyx −=Ψ exp,,,, ) . (2.2)
- 25 -
Chapter 2A
Inserting (2.2) in (2.1) leads to the reduced wave equation
022
2
2
2
2
2
=∂∂
−∂∂
+∂∂
+∂∂
zuik
zu
yu
xu . (2.3)
In the paraxial approximation it is assumed that the variation of u along the z-direction is small and the third term can then be dropped. This gives the paraxial wave equation
022
2
2
2
=∂∂
−∂∂
+∂∂
zuik
yu
xu . (2.4)
Under the assumption of cylindrical symmetry, with x2+y2 = r2 and no dependency of u(r,z) on φ, the equation can be written as
0212
2
=∂∂
−∂∂
+∂∂
zuik
ru
rru . (2.5)
Solutions to this equation have the form
( ) ⎥⎦
⎤⎢⎣
⎡Φ+−
−= 0
2
2
20 exp, i
Rri
wr
ww
zruλπ . (2.6)
Where, for the fundamental mode
2
20
0 1 ⎟⎟⎠
⎞⎜⎜⎝
⎛+=
wzww
πλ (2.7)
⎥⎥
⎦
⎤
⎢⎢
⎣
⎡
⎟⎟⎠
⎞⎜⎜⎝
⎛+=
2201z
wzR
λπ (2.8)
20
0tanw
zπλ
=Φ (2.9)
These formulas describe a diverging beam with a Gaussian amplitude distri-bution in a plane perpendicular to the direction of propagation. The width w of the beam, defined as the radius of the beam at its 1/e value, has a minimum w0 (the waist) at z = 0. The radius of curvature R of the wavefront is infinite at z = 0, representing a plane wave, and decreases to a minimum of 2z0 at a distance z = z0. It then increases and approaches R = z for large distances, representing a spherical wave originating at the waist position. The Gaussian amplitude distribution formally extends to infinity but almost all energy
- 26 -
Pseudo-optics
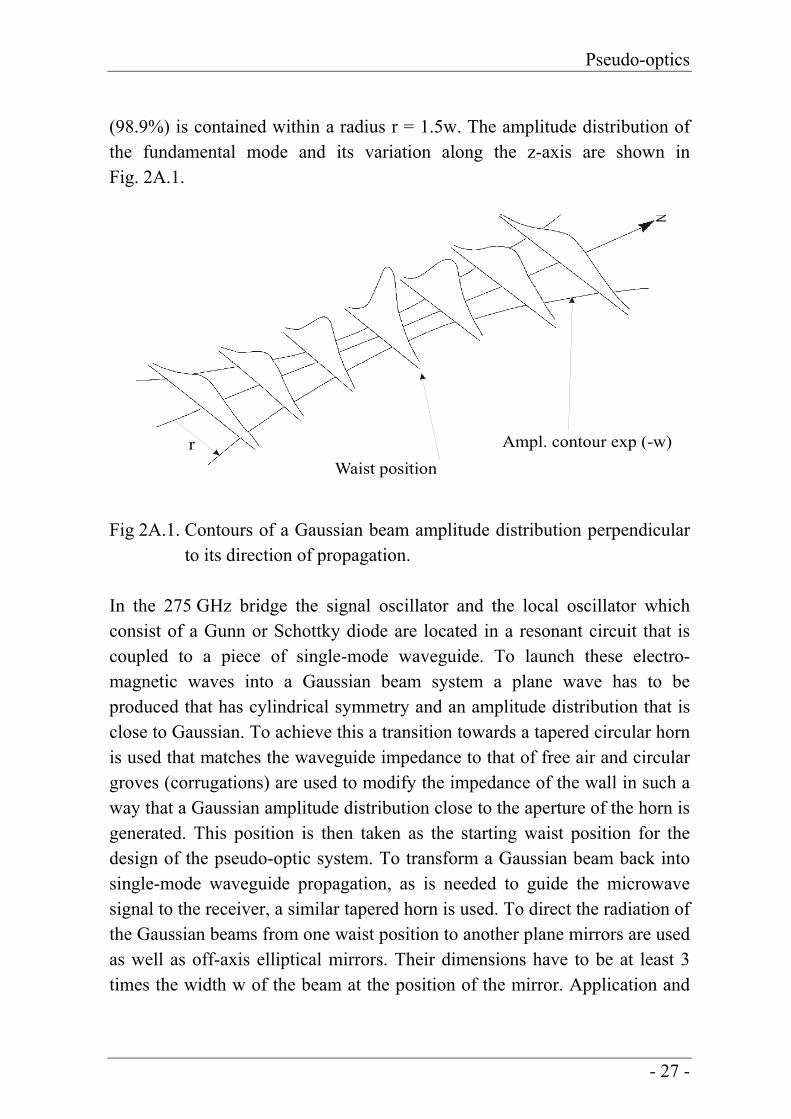
(98.9%) is contained within a radius r = 1.5w. The amplitude distribution of the fundamental mode and its variation along the z-axis are shown in Fig. 2A.1.
rWaist position
Ampl. contour exp (-w)
Fig 2A.1. Contours of a Gaussian beam amplitude distribution perpendicular to its direction of propagation.
In the 275 GHz bridge the signal oscillator and the local oscillator which consist of a Gunn or Schottky diode are located in a resonant circuit that is coupled to a piece of single-mode waveguide. To launch these electro-magnetic waves into a Gaussian beam system a plane wave has to be produced that has cylindrical symmetry and an amplitude distribution that is close to Gaussian. To achieve this a transition towards a tapered circular horn is used that matches the waveguide impedance to that of free air and circular groves (corrugations) are used to modify the impedance of the wall in such a way that a Gaussian amplitude distribution close to the aperture of the horn is generated. This position is then taken as the starting waist position for the design of the pseudo-optic system. To transform a Gaussian beam back into single-mode waveguide propagation, as is needed to guide the microwave signal to the receiver, a similar tapered horn is used. To direct the radiation of the Gaussian beams from one waist position to another plane mirrors are used as well as off-axis elliptical mirrors. Their dimensions have to be at least 3 times the width w of the beam at the position of the mirror. Application and
- 27 -
Chapter 2A
handling of Gaussian beams is reviewed in Goldsmith [2.11] and Lesurf [2.12].
In a uniform medium the propagation of the radiation in a Gaussian beam in free space is independent of its polarization, so generating beams with different polarization and manipulating them with polarization-dependent elements is possible. In this respect grids of very thin conducting wires, separated at distances of only a fraction of a wavelength are very effective polarizers. For radiation with the E-field in the direction of the wires currents are induced and the grid acts as a reflector whereas a perpen-dicular oriented E-field cannot induce currents and passes without attenuation. This property extends over a wide frequency band. For the frequency used in our spectrometer where λ ≈ 1 mm, grids with 20 μm wires at 60 μm spacing have a cross-polar leakage better than 30 dB and co-polar transmission loss less than 0.1 dB. Martin-Puplett configuration
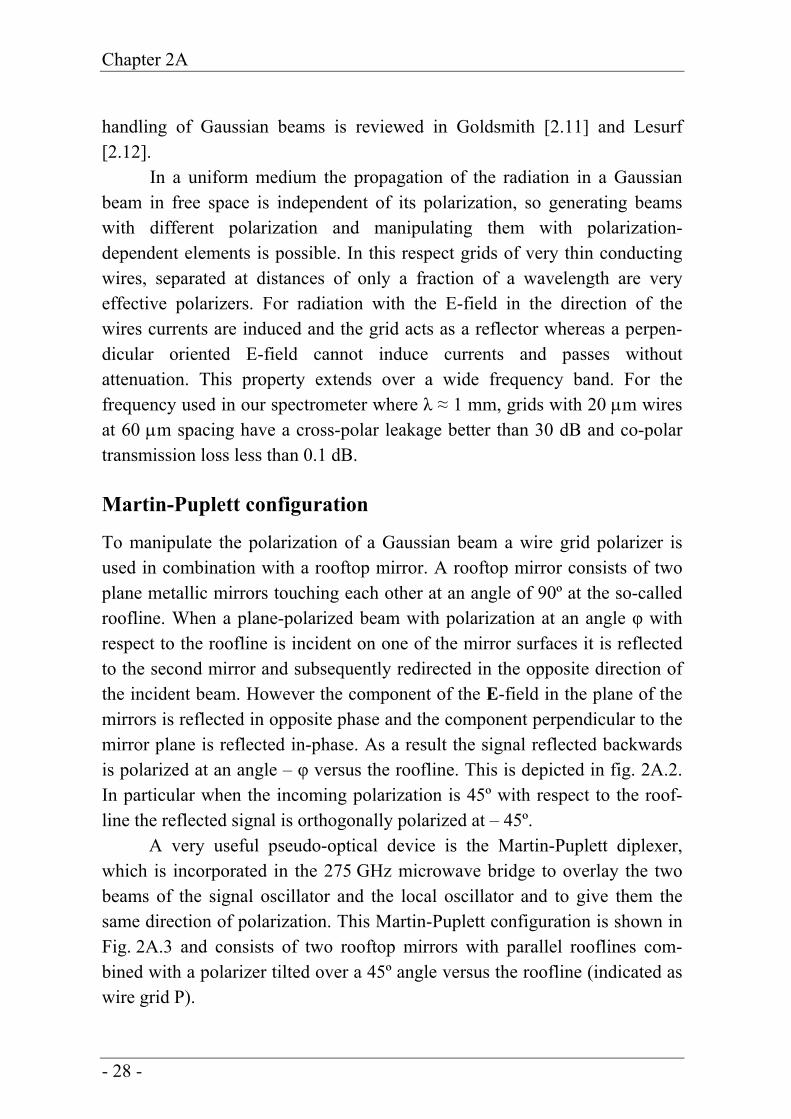
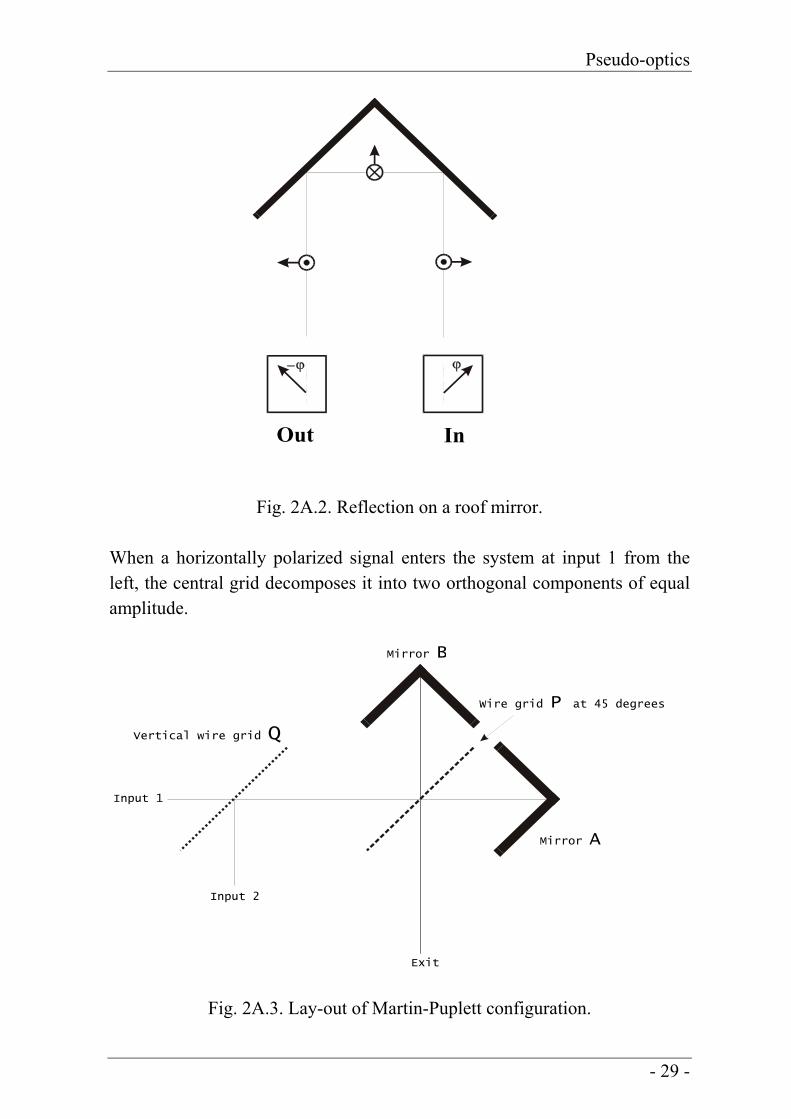
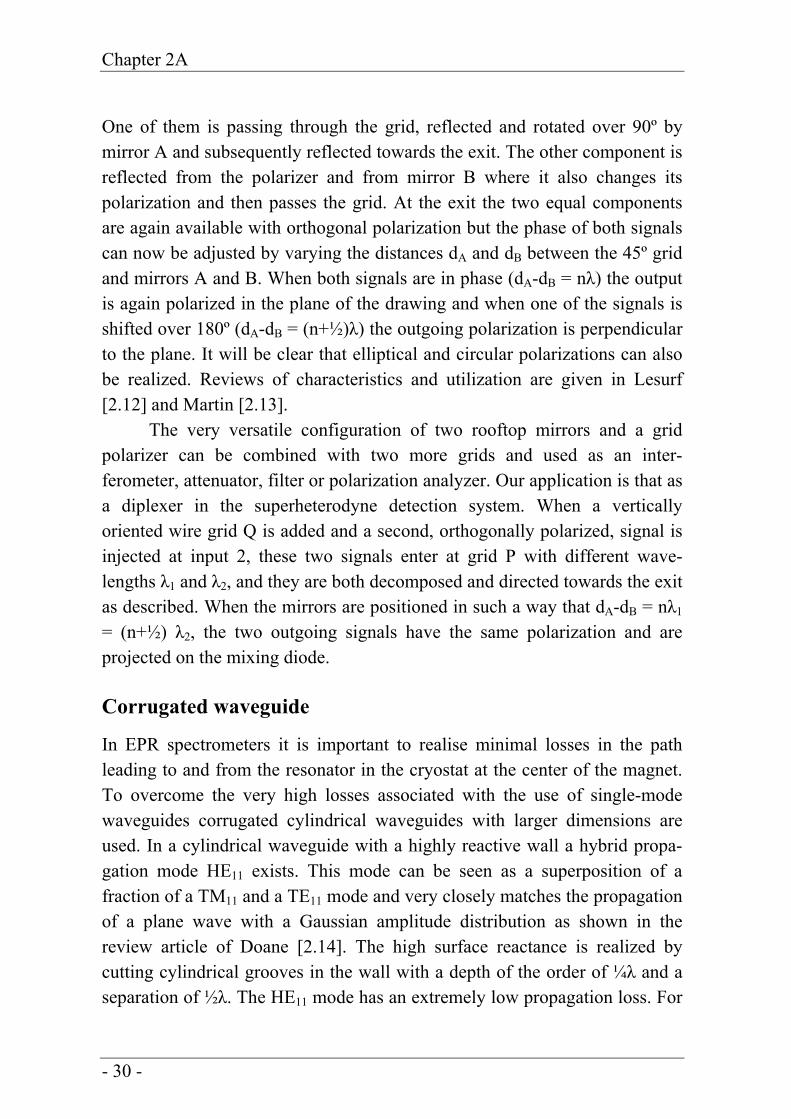
To manipulate the polarization of a Gaussian beam a wire grid polarizer is used in combination with a rooftop mirror. A rooftop mirror consists of two plane metallic mirrors touching each other at an angle of 90º at the so-called roofline. When a plane-polarized beam with polarization at an angle φ with respect to the roofline is incident on one of the mirror surfaces it is reflected to the second mirror and subsequently redirected in the opposite direction of the incident beam. However the component of the E-field in the plane of the mirrors is reflected in opposite phase and the component perpendicular to the mirror plane is reflected in-phase. As a result the signal reflected backwards is polarized at an angle – φ versus the roofline. This is depicted in fig. 2A.2. In particular when the incoming polarization is 45º with respect to the roof-line the reflected signal is orthogonally polarized at – 45º.
A very useful pseudo-optical device is the Martin-Puplett diplexer, which is incorporated in the 275 GHz microwave bridge to overlay the two beams of the signal oscillator and the local oscillator and to give them the same direction of polarization. This Martin-Puplett configuration is shown in Fig. 2A.3 and consists of two rooftop mirrors with parallel rooflines com-bined with a polarizer tilted over a 45º angle versus the roofline (indicated as wire grid P).
- 28 -
Pseudo-optics
Out In
Fig. 2A.2. Reflection on a roof mirror. When a horizontally polarized signal enters the system at input 1 from the left, the central grid decomposes it into two orthogonal components of equal amplitude.
Wire grid at 45 degreesP
Mirror A
Mirror B
Vertical wire grid Q
Exit
Input 1
Input 2
Fig. 2A.3. Lay-out of Martin-Puplett configuration.
- 29 -
Chapter 2A
One of them is passing through the grid, reflected and rotated over 90º by mirror A and subsequently reflected towards the exit. The other component is reflected from the polarizer and from mirror B where it also changes its polarization and then passes the grid. At the exit the two equal components are again available with orthogonal polarization but the phase of both signals can now be adjusted by varying the distances dA and dB between the 45º grid and mirrors A and B. When both signals are in phase (d
B
A-dBB = nλ) the output is again polarized in the plane of the drawing and when one of the signals is shifted over 180º (dA-dB = (n+½)λ) the outgoing polarization is perpendicular to the plane. It will be clear that elliptical and circular polarizations can also be realized. Reviews of characteristics and utilization are given in Lesurf [2.12] and Martin [2.13].
B
The very versatile configuration of two rooftop mirrors and a grid polarizer can be combined with two more grids and used as an inter-ferometer, attenuator, filter or polarization analyzer. Our application is that as a diplexer in the superheterodyne detection system. When a vertically oriented wire grid Q is added and a second, orthogonally polarized, signal is injected at input 2, these two signals enter at grid P with different wave-lengths λ1 and λ2, and they are both decomposed and directed towards the exit as described. When the mirrors are positioned in such a way that dA-dB = nλB 1 = (n+½) λ2, the two outgoing signals have the same polarization and are projected on the mixing diode. Corrugated waveguide
In EPR spectrometers it is important to realise minimal losses in the path leading to and from the resonator in the cryostat at the center of the magnet. To overcome the very high losses associated with the use of single-mode waveguides corrugated cylindrical waveguides with larger dimensions are used. In a cylindrical waveguide with a highly reactive wall a hybrid propa-gation mode HE11 exists. This mode can be seen as a superposition of a fraction of a TM11 and a TE11 mode and very closely matches the propagation of a plane wave with a Gaussian amplitude distribution as shown in the review article of Doane [2.14]. The high surface reactance is realized by cutting cylindrical grooves in the wall with a depth of the order of ¼λ and a separation of ½λ. The HE11 mode has an extremely low propagation loss. For
- 30 -
Pseudo-optics
a cylindrical waveguide with diameter d, a Gaussian beam, projected at the entrance of the waveguide with a waist w0, is propagating almost loss-free, provided that w0 < 0.35d. The Gaussian character of the field distribution, its plane wave character and its polarization are very well retained.
To separate the electromagnetic waves used to excite the sample in the cavity from the reflected one a slab of permanently magnetized barium/strontium hexaferrite (Ferroxdure 330) is used. The ferrite is magnetized in the direction of the waves and the interaction with the mag-netically induced anisotropy of the dielectric constant of the (non-conductive) material causes a Faraday rotation of the polarization of the waves. The rotation depends on the thickness of the slab, 45° in our situation, is right-handed for the waves travelling in the direction of the field and left-handed for the waves in the opposite direction. The result is a 90° polarization difference between both signals. When a wire grid, transparent to the exciting waves, is positioned in front of the Faraday rotator, the signal coming from the cavity is directed towards the receiver input of the spectrometer.
- 31 -
Chapter 2A
- 32 -
Appendix B
System description
Introduction
In this appendix some technical aspects of the microwave bridge of the 275 GHz EPR spectrometer are presented in greater detail. CW operation
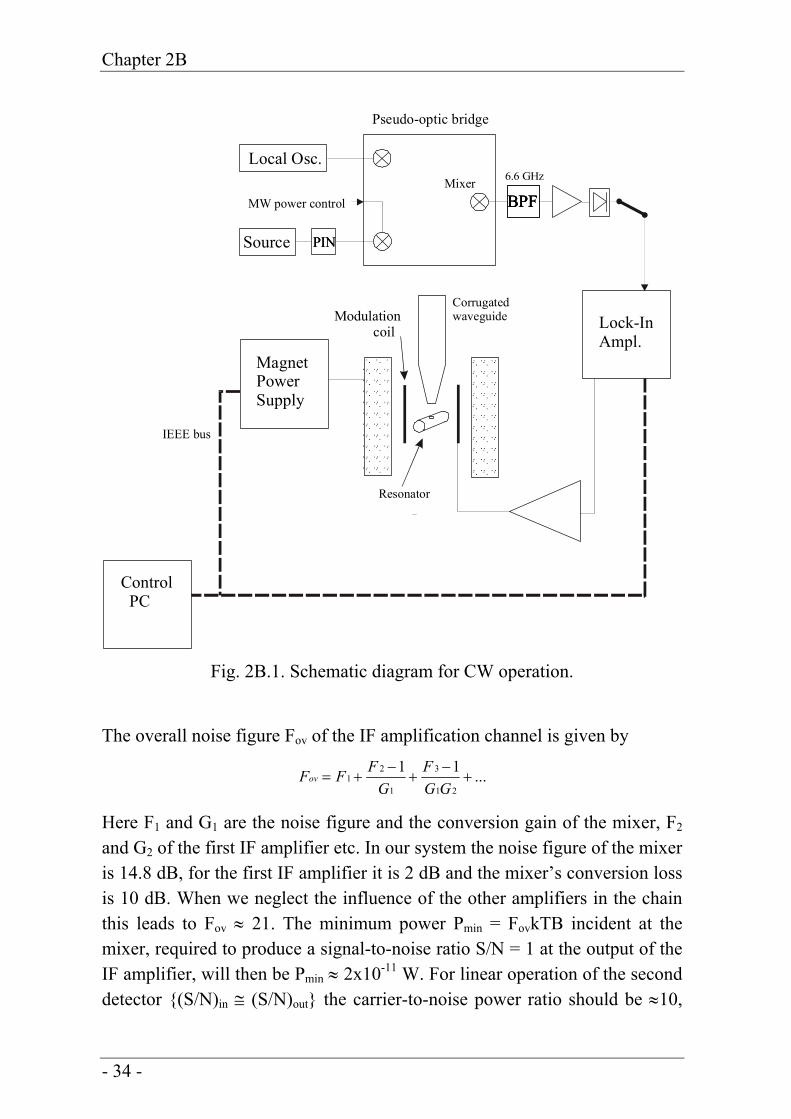
The schematic diagram for cw operation is shown in Fig. 2B.1. For clarity the details of the pseudo-optic bridge and the synchronisation of the Local Oscillator and the Source are omitted; they are already shown in figures 2.1 and 2.2. The “MW power control” indicated in the figure is effected by varying the DC bias of the frequency tripler. In this way the microwave power at the output of the tripler can be controlled over a range of 50 dB, resulting in a power between 10 nW and 1mW at the cavity. The method used to couple the microwaves into the cavity - rotating the cavity with respect to the microwave’s polarization in the final short piece of waveguide at the end of the taper - permits a maximum coupling of 20 dB, dependent on the sample’s characteristics. In this way up to 99 % of the microwave power is available in the cavity. The reflected microwaves are projected on the mixer together with those from the Local Oscillator to generate the IF signal at 6.6 GHz. This IF signal is amplified, filtered in a band pass filter (BPF) with a bandwidth B = 280 MHz and rectified in the second detector. Sub-sequently, conventional cw detection with field modulation and lock-in detection is applied. The figure also indicates that the Lock-In system, the magnetic field control and the data-acquisition and -display are managed via the system PC utilizing an IEEE-bus.
- 33 -
Chapter 2B
CorrugatedwaveguideModulation
coil
Resonator
6.6 GHz
BPFBPFBPF
Local Osc.
Source PINPIN
MW power control
MagnetPowerSupply
Lock-InAmpl.
Mixer
Pseudo-optic bridge
Control PC
IEEE bus
Fig. 2B.1. Schematic diagram for CW operation.
The overall noise figure Fov of the IF amplification channel is given by
...1121
3
1
21 +
−+
−+=
GGF
GFFFov
Here F1 and G1 are the noise figure and the conversion gain of the mixer, F2 and G2 of the first IF amplifier etc. In our system the noise figure of the mixer is 14.8 dB, for the first IF amplifier it is 2 dB and the mixer’s conversion loss is 10 dB. When we neglect the influence of the other amplifiers in the chain this leads to Fov ≈ 21. The minimum power Pmin = FovkTB incident at the mixer, required to produce a signal-to-noise ratio S/N = 1 at the output of the IF amplifier, will then be Pmin ≈ 2x10-11 W. For linear operation of the second detector (S/N)in ≅ (S/N)out the carrier-to-noise power ratio should be ≈10,
- 34 -
System
leading to a required minimum input power to the mixer, i.e., microwave power reflected from the cavity of ≈ 2x10⁻¹⁰ W. A good power level for operation of the second detector is 10-4 W (0.1 mW), for which an IF gain of ≈ 57 dB is required. In this situation the power incident at the cavity will be ≈ 2x10⁻⁸ W, about 47 dB below the maximum available power of 1 mW. This microwave power level is the minimum level at which the full capabilities of the lock-in processing can be utilized in cw mode. In practice this means that for cw EPR experiments at cryogenic temperatures, where samples may exhibit long relaxation times T1 and T2, one may run into saturation of the EPR transitions.
At lower levels of reflected power a gradual degradation will be observed due to additional noise produced in the rectification process. To enable the study of samples that saturate at very low power several options are available to improve the cw EPR capabilities. The first one is to reduce the noise at the second detector by decreasing the IF bandwidth to a value that can still accommodate the sidebands from the lock-in modulation. For modulation frequencies of a few thousand Hz a bandwidth of ≈ 20 kHz would suffice. In the practical situation such a narrow bandwidth at 6.6 GHz can only be realized by using a second heterodyne process, consequently increasing the complexity of the system. Additionally, two channels of IF would then be required because the bandwidth is too small for pulsed operation. A second way is to increase the reflected carrier power by decreasing the coupling of the microwaves into the cavity. In this case some spectrometer sensitivity is sacrificed to enable operation at lower microwave power. The third option is the application of “synchronous demodulation” at the second detector. The IF signal is then switched by a reference signal in synchronism with the IF carrier. In the ideal situation the IF signal is then just “shifted” towards zero frequency, retaining both its phase- and amplitude-information, without adding extra noise. This indicates that with such a detection scheme the bridge would produce the same carrier-to-noise ratio with approximately 10 dB lower (reflected) mw power. A very important requirement for this arrangement is that there is no phase noise between the reference carrier and the IF carrier. In our system this appeared to be impos-sible to accomplish. The three carriers – source, local oscillator and 6.6 GHz IF reference – are generated by phase-locked frequency multiplication of a 100 MHz stable oscillator signal via separate channels. In each channel some
- 35 -
Chapter 2B
phase noise is introduced. The high multiplication factors result in approxi-mately 90º of phase jitter between the reflected signal at the frequency (2757x100−2691x100) MHz with phase jitter (ϕN1+ϕN2) and the IF reference at 66x100 MHz with phase jitter ϕN3, where ϕN represent the independent phase noises. The resulting output noise – some 40% of the reflected signal amplitude – then dominates the signal information and for this reason this processing scheme was abandoned. Pulsed operation
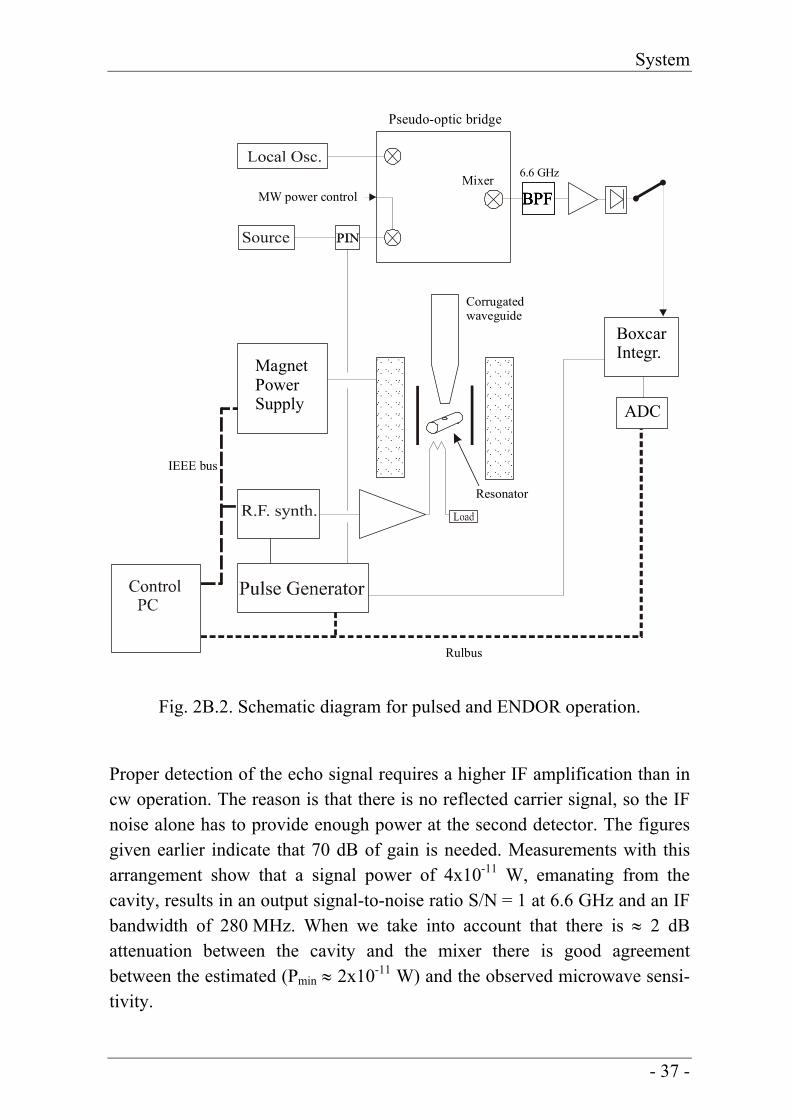
The configuration for measurements with pulsed microwaves is shown in Fig. 2B.2. In this mode of operation a PIN switch modulates the microwaves generated in the Source generator at 91.9 GHz before they are fed to the frequency tripler. Although the actual PIN-switch attenuation is only ≈ 18 dB, the reduction in output power at 275 GHz for the PIN-switch-tripler combination appears to be more than 120 dB. In the detection circuit the rectified IF signal is fed to a boxcar integrator. The modulating pulses for the microwaves (two for Hahn-echo detection, three for stimulated echo detection) and the gate for the boxcar integrator are produced by a pulse generator controlled by the system PC. The gate is positioned at the selected echo and the detected signal is then integrated over the duration of the gate. The integrated signal of a number of echo-pulses is averaged, converted to digital data with an analog-to-digital converter (ADC) and acquired by the system PC.
For ENDOR operation, the three-pulse MIMS sequence is used where an RF pulse is introduced between the second and the third microwave pulse. The RF pulses are generated by an RF synthesizer, amplified to a peak power of 100 W, fed to two small coils connected in the central conductor of a coaxial system that is terminated with a 50 Ω load. System control, data-acquisition and -presentation are executed by the system PC via an IEEE-bus and the locally developed Rulbus.
- 36 -
System
Corrugatedwaveguide
Resonator
6.6 GHz
BPFBPFBPFMW power control
MagnetPowerSupply
IEEE bus
BoxcarIntegr.
ADC
Mixer
Pseudo-optic bridge
Rulbus
Fig. 2B.2. Schematic diagram for pulsed and ENDOR operation.
Proper detection of the echo signal requires a higher IF amplification than in cw operation. The reason is that there is no reflected carrier signal, so the IF noise alone has to provide enough power at the second detector. The figures given earlier indicate that 70 dB of gain is needed. Measurements with this arrangement show that a signal power of 4x10-11 W, emanating from the cavity, results in an output signal-to-noise ratio S/N = 1 at 6.6 GHz and an IF bandwidth of 280 MHz. When we take into account that there is ≈ 2 dB attenuation between the cavity and the mixer there is good agreement between the estimated (Pmin ≈ 2x10-11 W) and the observed microwave sensi-tivity.
- 37 -
Chapter 2B
In pulsed operation it is essential that the microwave power emitted between the pulses is negligible in comparison with the input noise of the system. The leakage at maximum microwave power with the PIN-switch in the OFF position appeared to be equivalent to 5x10-16 W at the input to the mixer. This power is in the order of the background noise power (FovkTB) for a bandwidth of 5 kHz and can indeed be neglected.
It should be kept in mind that the minimum detectable signal is the power equal to the noise with a pre-detector bandwidth of 280 MHz. In actual situations the length of the pulses used is 100 ns or more. The processing in the boxcar will strongly reduce the noise on the detected amplitude of the echo signal. Firstly the integration over the length of the pulse reduces the noise roughly fivefold and subsequent integration over n repeated experi-ments decreases the observed noise with n . The final noise reduction is limited by the instability of the echo signals during the measurement, which can take a substantial time when long relaxation times are encountered.
The magnitude of the circularly polarized field Bc in the cavity can be calculated from the observed length of the π/2 microwave pulse of 100 ns, using the formula γeBBctp = π/2, with γe = 2πx2.8x10 s T . We find Bc
10 -1 -1
B = 0.89x10⁻⁴ T. A value for Bc can also be derived from the expression for the microwave power in the cavity [2.15].
ccL
VBQ
P 21000 )2()2(1 −= μω
Here P0 is the available microwave power at the cavity, ω0 the resonance frequency (radians s-1), μ0 = 4πx10-7 H/m and Vc the effective cavity volume (m3). For our configuration (cylindrical TE011 cavity) Vc ≈ 0.08xVcavity ≈ 0.12x10⁻⁹ m3 [2.16]. Taking P0 = 1 mW and QL = 1000, a value Bc = 0.55x10—4 T is obtained. This estimate does not take into account the con-centration effect on the microwave field from the quartz capillary containing the sample. A model calculation for the cavity and sample tube used [2.17] gives a factor of 1.73. The final estimate for the field at maximum power BBc ≈ 0.95x10 T agrees well with the value derived from the length of the π/2 microwave pulse.
-4
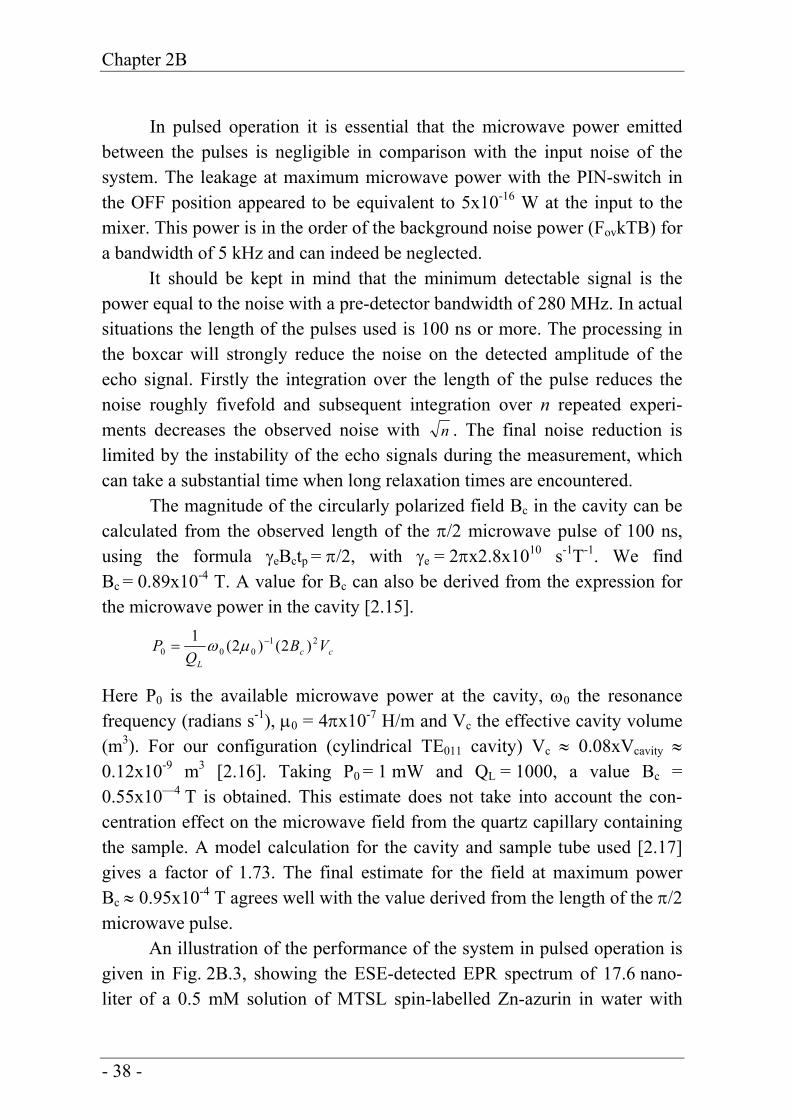
An illustration of the performance of the system in pulsed operation is given in Fig. 2B.3, showing the ESE-detected EPR spectrum of 17.6 nano-liter of a 0.5 mM solution of MTSL spin-labelled Zn-azurin in water with
- 38 -
System
glycerol at a temperature of 40 K [2.18]. The number of spins in the cavity is calculated to be ≈ 5x10¹². We observe an amplitude S/N ratio of ≈ 200 after averaging 100 outputs from the boxcar integrator and the equivalent total width of the spectrum is ≈ 10-2 T.
9.810 9.820 9.830 9.840
Echo
am
plitu
de (a
.u.)
M agnetic field (T)
Fig. 2B.3. The ESE detected EPR spectrum of spin-labelled Zn-Azurin at 40 K.
Spin dephasing processes cause a reduction of the echo amplitude by a factor exp(-2τ/T2) ≈ 0.8. In this formula τ is the separation of the two microwave pulses (200 ns) and T2 is the phase memory time (2400 ns). We can use the definition for the sensitivity of a pulsed EPR spectrometer proposed by Prisner [2.19]
E' = )/2(
2/1
2
/Te
NSBN τ−
Δ.
Here N is the number of spins in the test sample and S/N is the single shot echo amplitude to (rms) noise ratio when the detection bandwidth is matched to the echo shape. For our situation this leads to a sensitivity figure E' ≈ 2.0x10⁹ spins/0.1mT at 40 K. We see that this is a factor of 20 lower
- 39 -
Chapter 2B
than the estimate for the sensitivity in cw mode of Nmin ≈ 108 spins/0.1 mT per √Hz given in chapter 2 and observed for a solution of a proxyl radical in toluene at room temperature. Both figures and their ratio appear to be comparable with the figures (Epulse = 3x10⁹ spins/0.1 mT at 20 K and Ecw = 1.4x10⁸ spins/0.1 mT) given by Bennati et al. [2.20] for a spectrometer operating at a frequency of 140 GHz. This latter system, apart from the difference in resonance frequency, resembles strongly the spectrometer described in this thesis (TE011 cavity with slits and the same type of coupling).
- 40 -
System
References
[2.1]. D.E. Budil, K.A. Earle, W.B. Lynch and J.H. Freed, Electron Para-magnetic Resonance at 1 Millimeter Wavelengths, in Advanced EPR, applications in Biology and Biochemistry (A.J. Hoff, Ed.) (Elsevier, Amsterdam, 1989).
[2.2]. T.F. Prisner, S. Un and R.G. Griffin, Pulsed ESR at 140 GHz, Isr. J. Chem. 32, 357-363 (1992).
[2.3]. M.R. Fuchs, T.F. Prisner and K. Möbius, A High-Field/High-Frequency Heterodyne Induction-Mode EPR Spectrometer Operating at 360 GHz, Rev. Sci. Instrum. 70, 3681-3683 (1999). M.R. Fuchs, Ph. D. Thesis FU Berlin (2000), http://darwin.inf.fu-berlin.de/2000/7.
[2.4]. V.F. Tarasov and G.S. Shakurov, Submillimetre EPR Spectrometer, Appl. Magn. Reson. 2, 571-576 (1991).
[2.5]. J.H. Freed, New Technologies in Electron Spin Resonance, Annu. Rev. Phys. Chem. 51, 655-689 (2000).
[2.6]. A.K. Hassan, L.A. Pardi, J. Krzystek, A. Sienkiewicz, P. Goy, M. Rohrer and L.-C. Brunel, Ultrawide Band Multifrequency High-Field EMR Technique: A Methodology for Increasing Spectroscopic Information, J. Magn. Reson. 142, 300-312 (2000).
[2.7]. M. Rohrer, O. Brügmann, B. Kinzer and T.F. Prisner, A pulsed 180 GHz EPR Spectrometer, Appl. Magn. Res. 21, 257-274 (2001).
[2.8]. K.A. Earle, D.E. Budil and J.H. Freed, Electron Spin Resonance at 250 GHz Using Quasioptical Techniques, in Advances in Magnetic and Optical Resonance (W. Warren, Ed.) 19. (Academic Press, New York, 1996).
[2.9]. K.A. Earle, D.S. Tipikin and J.H. Freed, Far-infrared electron-para-magnetic-resonance spectrometer utilizing a quasioptical reflection bridge, Rev. Sci. Instrum. 67, 2502-2513 (1996).
[2.10]. G.M. Smith, J.C.G. Lesurf, R.H. Mitchel and P.C. Riedi, Quasi-optical cw mm-wave electron spin resonance spectrometer, Rev. Sci. Instrum. 69, 3924-3937 (1998).
[2.11]. P.F. Goldsmith, in Infrared and Millimeter waves (Academic, New York, 1982), Vol. 6, Chap. 5.
- 41 -
Chapter 2B
[2.12]. J.C.G. Lesurf, Millimetre-wave Optics, Devices and Systems, Adam Hilger, Bristol, (1990).
[2.13]. D.H. Martin, in Infrared and Millimeter waves (Academic, New York, 1982), Vol. 6, Chap. 2.
[2.14]. J.L. Doane, in Infrared and Millimeter waves (Academic, New York, 1985), Vol. 13, Chap. 5.
[2.15]. R.T. Weber, J.A.J.M. Disselhorst, L.J. Prevo, J. Schmidt and W. Th. Wenckebach, Electron Spin-Echo Spectroscopy at 95 GHz, J. Magn. Reson. 81, 129-144 (1989).
[2.16]. C.P. Poole Jr., Electron Spin Resonance (Dover, New York, 1983). [2.17]. G. Annino, private communication. [2.18]. M.G. Finiguerra, H. Blok, M. Ubbink and M. Huber, High-field
(275 GHz) spin-label EPR for high-resolution polarity deter-mination in proteins, J. Magn. Reson. 180, 197-202 (2006).
[2.19]. T.F. Prisner, in Advances in Magnetic and Optical Resonance, 20 (Academic Press, 1997).
[2.20]. M. Bennati, C.T. Farrar, J.A. Bryant, S.J. Inati, V. Weis, G.J. Gerfen, P. Riggs-Gelasco, J. Stubbe, and R.G. Griffin, Pulsed Electron-Nuclear Double Resonance (ENDOR) at 140 GHz, J. Magn. Reson. 138, 232-243 (1999).
- 42 -
Chapter 3
ENDOR spectroscopy at 275 GHz
Abstract
In this chapter the pulsed ENDOR operation of the 275 GHz spectrometer is described. The results demonstrate that this type of spectroscopy can now be performed routinely at this high microwave frequency. The advantages compared to conventional EPR frequencies are the high spectral resolution, time resolution and sensitivity. The content of this chapter is based on: H. Blok, J.A.J.M. Disselhorst, S.B. Orlinskii and J. Schmidt ‘ENDOR spectroscopy at 275 GHz’ J. Magn. Reson. 173 (2005) 49-53.
- 43 -
Chapter 3
Introduction
The attraction of Electron Nuclear Double Resonance (ENDOR) spec-troscopy is the possibility to measure unresolved hyperfine interactions in Electron Paramagnetic Resonance (EPR) spectra. The ENDOR spectra not only allow for an identification of the paramagnetic center but also supply detailed information about its electronic structure. In the last decade the ENDOR technique has seen a remarkable revival owing to the development of high-frequency EPR spectroscopy that started in 1981with the pioneering work of Lebedev and co-workers [3.1]. Already in1988 the first observation of ENDOR at 97 GHz was reported [3.2] and in this frequency band ENDOR is now a well-established technique [3.3]. The attractions are that in the related magnetic field of about 3.4 T the high Zeeman frequencies of the various nuclei lead to a high ENDOR sensitivity and moreover to a high spectral resolution. In addition it proves possible to perform orientationally selective ENDOR in random samples, owing to the high resolution of the g-tensor anisotropy. As a result ENDOR spectroscopy at W-band (95-97 GHz) provides information about the electronic structure of paramagnetic species that remains invisible at conventional EPR frequencies.
EPR experiments at W-band are now widely applied and the results have stimulated several groups to continue the development of EPR tech-nology to frequencies around 300 GHz and higher but reports about successful ENDOR spectrometers at these high frequencies are scarce. This is understandable because at these frequencies the construction of single-mode microwave resonators, necessary to obtain a strong microwave B1 field, requires an extreme mechanical precision. In addition, the requirement to apply a radio frequency (RF) field to induce the nuclear transitions makes the mechanical construction of the probe head even more demanding.
In this chapter we present the pulsed ENDOR performance of the spectrometer operating at the EPR frequency of 275 GHz. The system is essentially an extension of the EPR spectrometer described in chapter 2. The cylindrical, single-mode resonator that allows for pulsed EPR experiments with pulse durations of 100 ns with an incident microwave power of a little more than one milliwatt has now been equipped with narrow slits in the walls. These slits permit the RF field B2, generated in two small RF coils that
- 44 -
ENDOR at 275 GHz
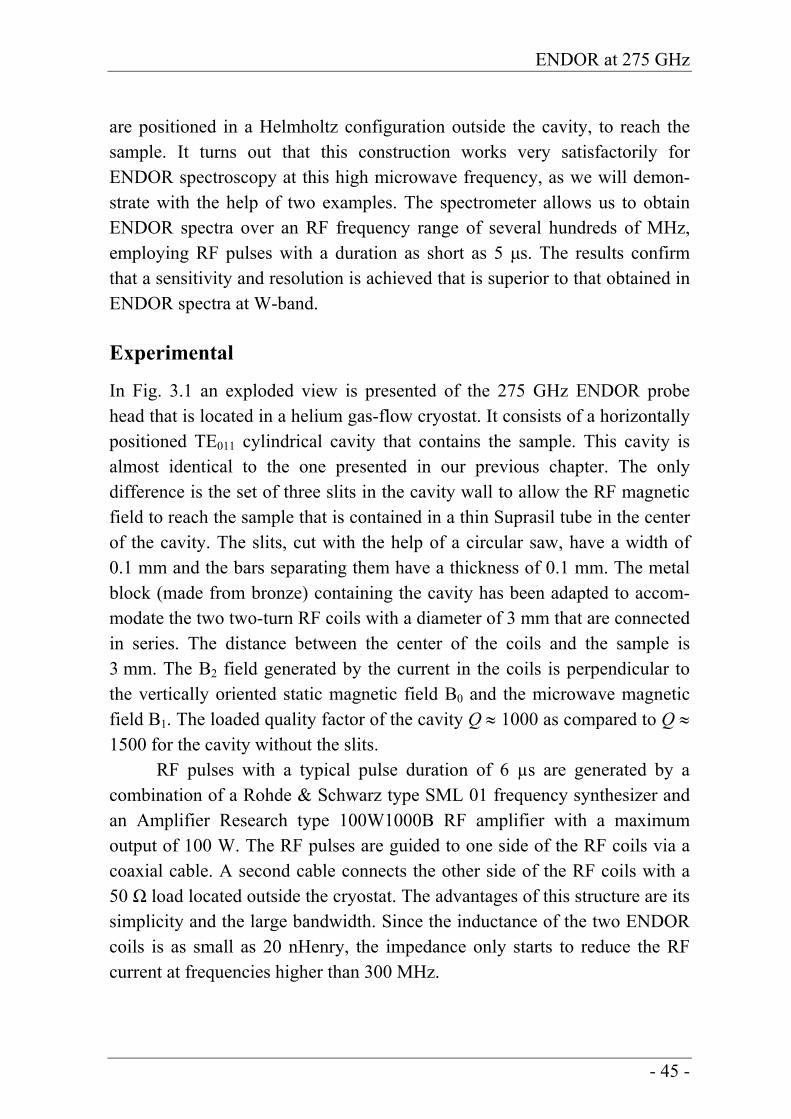
are positioned in a Helmholtz configuration outside the cavity, to reach the sample. It turns out that this construction works very satisfactorily for ENDOR spectroscopy at this high microwave frequency, as we will demon-strate with the help of two examples. The spectrometer allows us to obtain ENDOR spectra over an RF frequency range of several hundreds of MHz, employing RF pulses with a duration as short as 5 μs. The results confirm that a sensitivity and resolution is achieved that is superior to that obtained in ENDOR spectra at W-band. Experimental
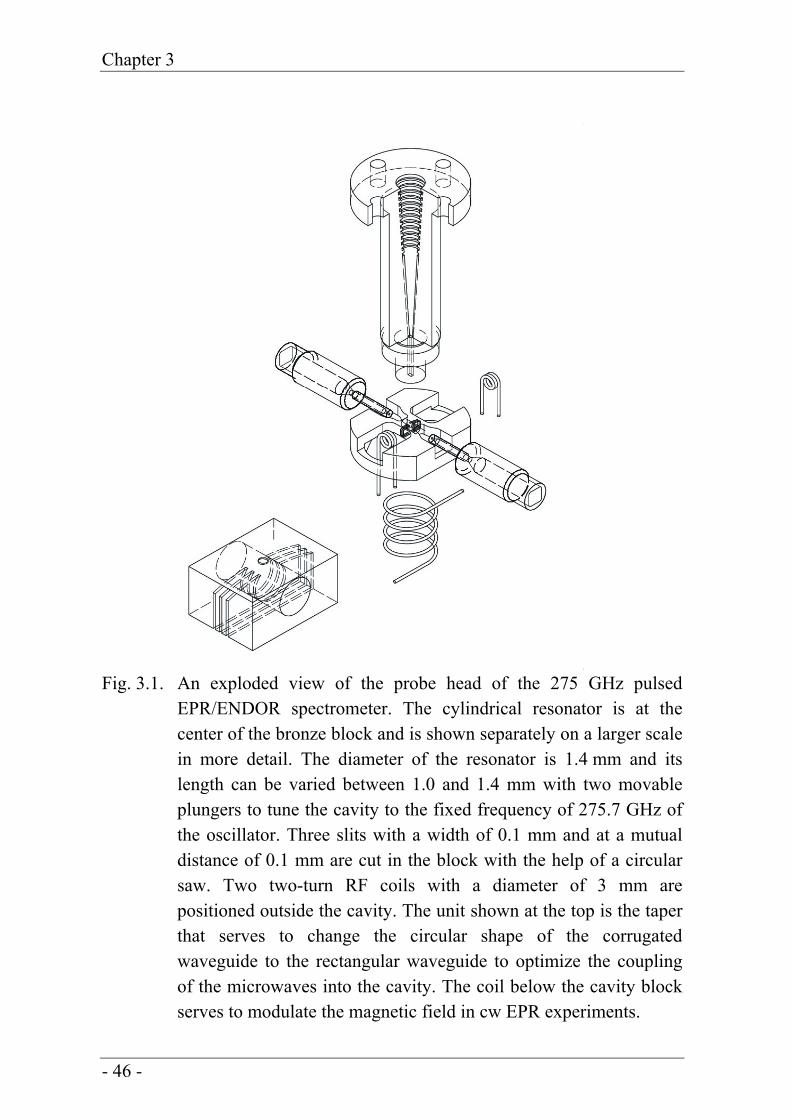
In Fig. 3.1 an exploded view is presented of the 275 GHz ENDOR probe head that is located in a helium gas-flow cryostat. It consists of a horizontally positioned TE011 cylindrical cavity that contains the sample. This cavity is almost identical to the one presented in our previous chapter. The only difference is the set of three slits in the cavity wall to allow the RF magnetic field to reach the sample that is contained in a thin Suprasil tube in the center of the cavity. The slits, cut with the help of a circular saw, have a width of 0.1 mm and the bars separating them have a thickness of 0.1 mm. The metal block (made from bronze) containing the cavity has been adapted to accom-modate the two two-turn RF coils with a diameter of 3 mm that are connected in series. The distance between the center of the coils and the sample is 3 mm. The BB2 field generated by the current in the coils is perpendicular to the vertically oriented static magnetic field B0 and the microwave magnetic field B1. The loaded quality factor of the cavity Q ≈ 1000 as compared to Q ≈ 1500 for the cavity without the slits.
RF pulses with a typical pulse duration of 6 µs are generated by a combination of a Rohde & Schwarz type SML 01 frequency synthesizer and an Amplifier Research type 100W1000B RF amplifier with a maximum output of 100 W. The RF pulses are guided to one side of the RF coils via a coaxial cable. A second cable connects the other side of the RF coils with a 50 Ω load located outside the cryostat. The advantages of this structure are its simplicity and the large bandwidth. Since the inductance of the two ENDOR coils is as small as 20 nHenry, the impedance only starts to reduce the RF current at frequencies higher than 300 MHz.
- 45 -
Chapter 3
Fig. 3.1. An exploded view of the probe head of the 275 GHz pulsed EPR/ENDOR spectrometer. The cylindrical resonator is at the center of the bronze block and is shown separately on a larger scale in more detail. The diameter of the resonator is 1.4 mm and its length can be varied between 1.0 and 1.4 mm with two movable plungers to tune the cavity to the fixed frequency of 275.7 GHz of the oscillator. Three slits with a width of 0.1 mm and at a mutual distance of 0.1 mm are cut in the block with the help of a circular saw. Two two-turn RF coils with a diameter of 3 mm are positioned outside the cavity. The unit shown at the top is the taper that serves to change the circular shape of the corrugated waveguide to the rectangular waveguide to optimize the coupling of the microwaves into the cavity. The coil below the cavity block serves to modulate the magnetic field in cw EPR experiments.
- 46 -
ENDOR at 275 GHz
System performance
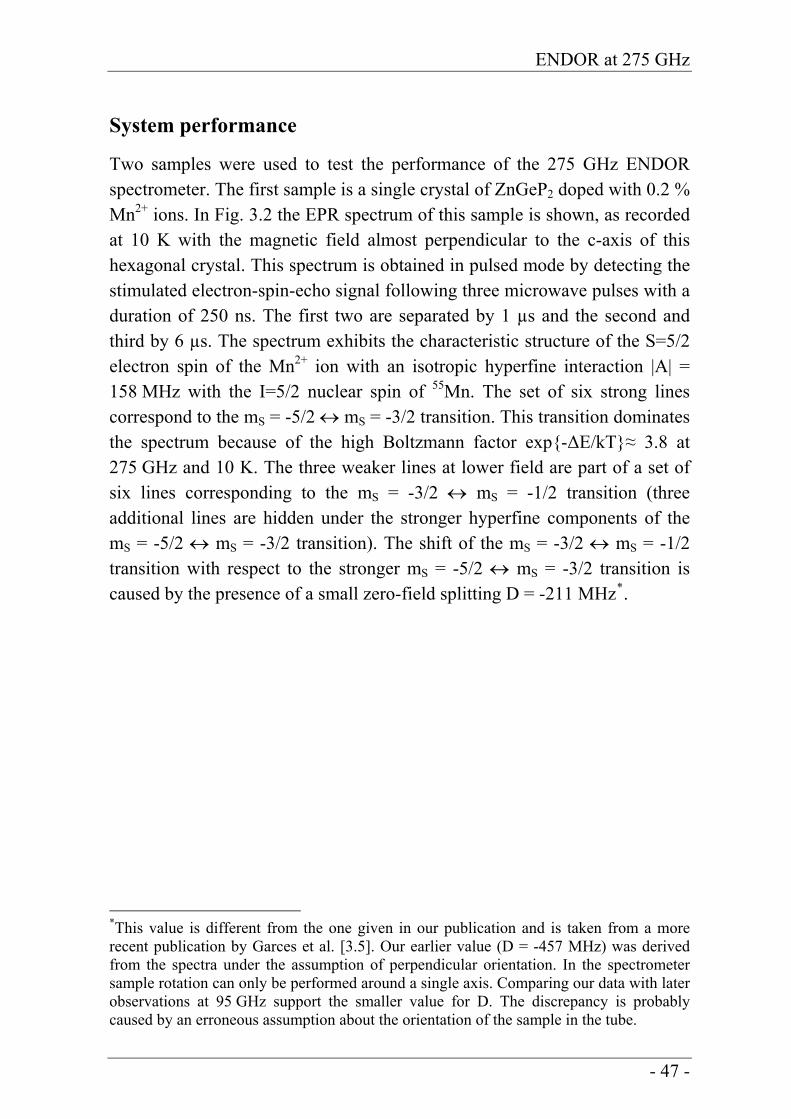
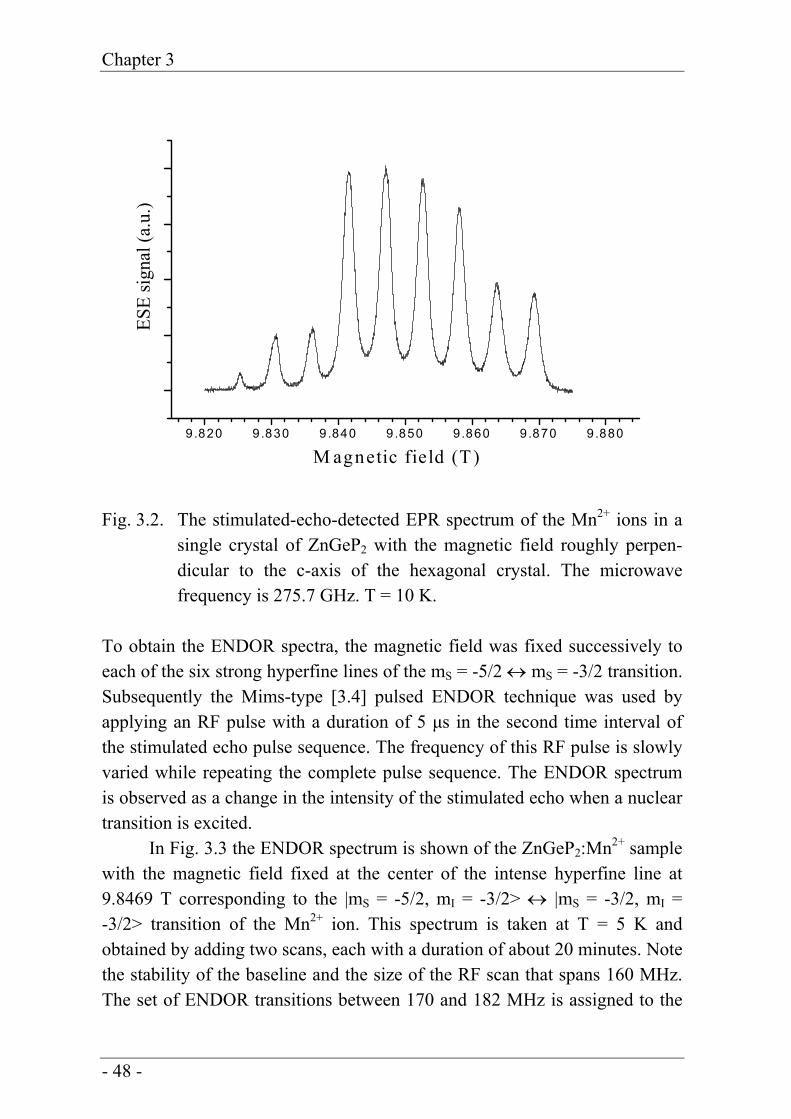
Two samples were used to test the performance of the 275 GHz ENDOR spectrometer. The first sample is a single crystal of ZnGeP2 doped with 0.2 % Mn2+ ions. In Fig. 3.2 the EPR spectrum of this sample is shown, as recorded at 10 K with the magnetic field almost perpendicular to the c-axis of this hexagonal crystal. This spectrum is obtained in pulsed mode by detecting the stimulated electron-spin-echo signal following three microwave pulses with a duration of 250 ns. The first two are separated by 1 µs and the second and third by 6 µs. The spectrum exhibits the characteristic structure of the S=5/2 electron spin of the Mn2+ ion with an isotropic hyperfine interaction |A| = 158 MHz with the I=5/2 nuclear spin of 55Mn. The set of six strong lines correspond to the mS = -5/2 ↔ mS = -3/2 transition. This transition dominates the spectrum because of the high Boltzmann factor exp-ΔE/kT≈ 3.8 at 275 GHz and 10 K. The three weaker lines at lower field are part of a set of six lines corresponding to the mS = -3/2 ↔ mS = -1/2 transition (three additional lines are hidden under the stronger hyperfine components of the mS = -5/2 ↔ mS = -3/2 transition). The shift of the mS = -3/2 ↔ mS = -1/2 transition with respect to the stronger mS = -5/2 ↔ mS = -3/2 transition is caused by the presence of a small zero-field splitting D = -211 MHz*.
*This value is different from the one given in our publication and is taken from a more recent publication by Garces et al. [3.5]. Our earlier value (D = -457 MHz) was derived from the spectra under the assumption of perpendicular orientation. In the spectrometer sample rotation can only be performed around a single axis. Comparing our data with later observations at 95 GHz support the smaller value for D. The discrepancy is probably caused by an erroneous assumption about the orientation of the sample in the tube.
- 47 -
Chapter 3
9.820 9.830 9.840 9.850 9.860 9.870 9.880
ESE
sign
al (a
.u.)
M agnetic field (T )
Fig. 3.2. The stimulated-echo-detected EPR spectrum of the Mn2+ ions in a single crystal of ZnGeP2 with the magnetic field roughly perpen-dicular to the c-axis of the hexagonal crystal. The microwave frequency is 275.7 GHz. T = 10 K.
To obtain the ENDOR spectra, the magnetic field was fixed successively to each of the six strong hyperfine lines of the mS = -5/2 ↔ mS = -3/2 transition. Subsequently the Mims-type [3.4] pulsed ENDOR technique was used by applying an RF pulse with a duration of 5 μs in the second time interval of the stimulated echo pulse sequence. The frequency of this RF pulse is slowly varied while repeating the complete pulse sequence. The ENDOR spectrum is observed as a change in the intensity of the stimulated echo when a nuclear transition is excited.
In Fig. 3.3 the ENDOR spectrum is shown of the ZnGeP2:Mn2+ sample with the magnetic field fixed at the center of the intense hyperfine line at 9.8469 T corresponding to the |mS = -5/2, mI = -3/2> ↔ |mS = -3/2, mI = -3/2> transition of the Mn2+ ion. This spectrum is taken at T = 5 K and obtained by adding two scans, each with a duration of about 20 minutes. Note the stability of the baseline and the size of the RF scan that spans 160 MHz. The set of ENDOR transitions between 170 and 182 MHz is assigned to the
- 48 -
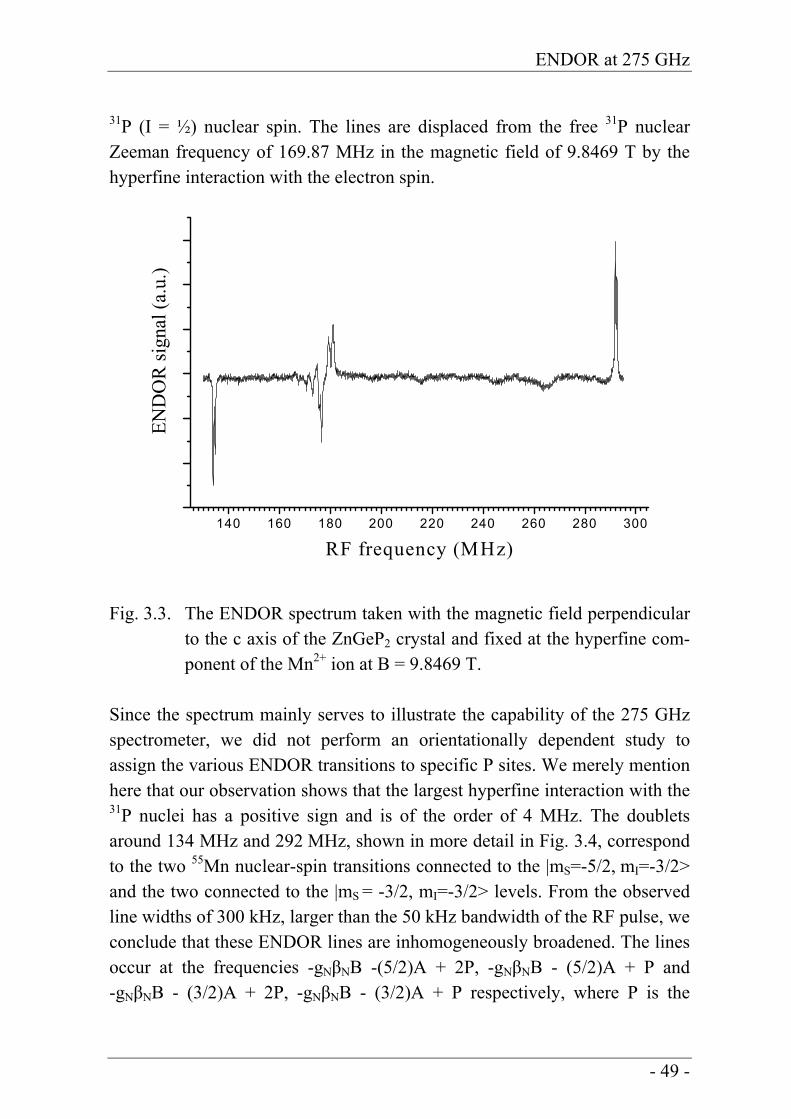
ENDOR at 275 GHz
31P (I = ½) nuclear spin. The lines are displaced from the free 31P nuclear Zeeman frequency of 169.87 MHz in the magnetic field of 9.8469 T by the hyperfine interaction with the electron spin.
140 160 180 200 220 240 260 280 300
END
OR
sign
al (a
.u.)
RF frequency (MHz)
Fig. 3.3. The ENDOR spectrum taken with the magnetic field perpendicular to the c axis of the ZnGeP2 crystal and fixed at the hyperfine com-ponent of the Mn2+ ion at B = 9.8469 T.
Since the spectrum mainly serves to illustrate the capability of the 275 GHz spectrometer, we did not perform an orientationally dependent study to assign the various ENDOR transitions to specific P sites. We merely mention here that our observation shows that the largest hyperfine interaction with the 31P nuclei has a positive sign and is of the order of 4 MHz. The doublets around 134 MHz and 292 MHz, shown in more detail in Fig. 3.4, correspond to the two 55Mn nuclear-spin transitions connected to the |mS=-5/2, mI=-3/2> and the two connected to the |mS = -3/2, mI=-3/2> levels. From the observed line widths of 300 kHz, larger than the 50 kHz bandwidth of the RF pulse, we conclude that these ENDOR lines are inhomogeneously broadened. The lines occur at the frequencies -gNβNB -(5/2)A + 2P, -gNβNB - (5/2)A + P and -gNβNB - (3/2)A + 2P, -gNβNB - (3/2)A + P respectively, where P is the
- 49 -
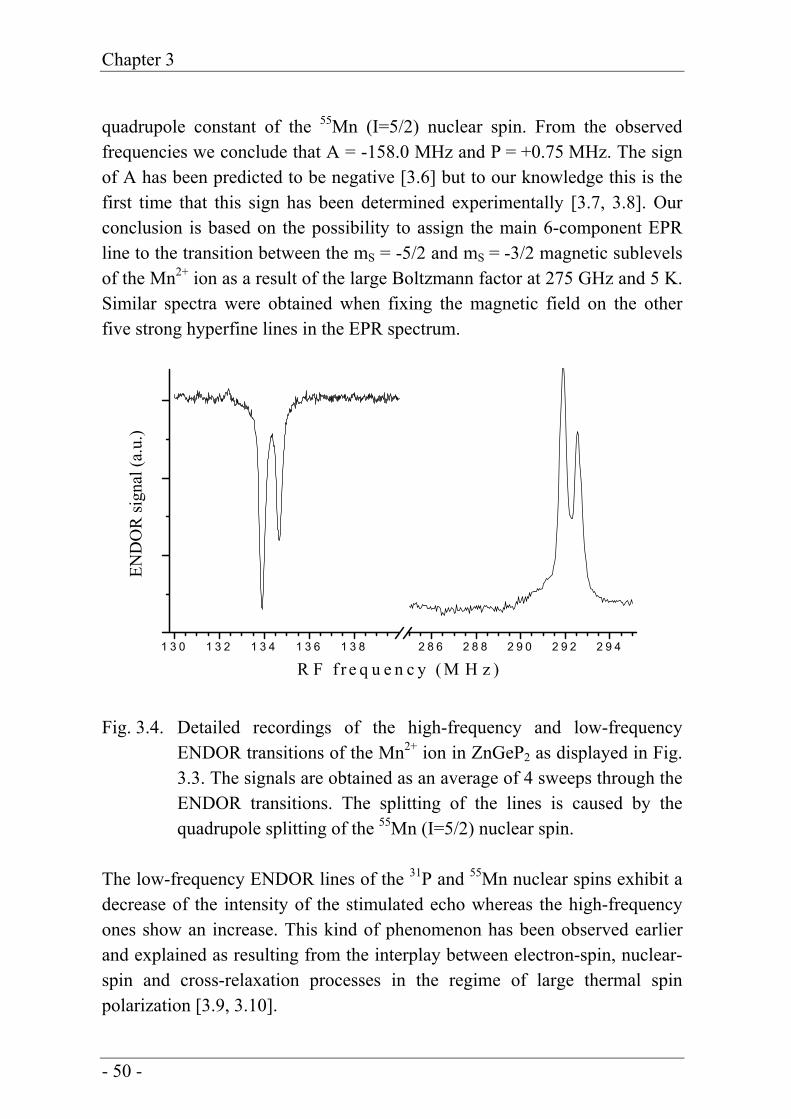
Chapter 3
quadrupole constant of the 55Mn (I=5/2) nuclear spin. From the observed frequencies we conclude that A = -158.0 MHz and P = +0.75 MHz. The sign of A has been predicted to be negative [3.6] but to our knowledge this is the first time that this sign has been determined experimentally [3.7, 3.8]. Our conclusion is based on the possibility to assign the main 6-component EPR line to the transition between the mS = -5/2 and mS = -3/2 magnetic sublevels of the Mn2+ ion as a result of the large Boltzmann factor at 275 GHz and 5 K. Similar spectra were obtained when fixing the magnetic field on the other five strong hyperfine lines in the EPR spectrum.
1 3 0 1 3 2 1 3 4 1 3 6 1 3 8 2 8 6 2 8 8 2 9 0 2 9 2 2 9 4
END
OR
sign
al (a
.u.)
R F f r e q u e n c y ( M H z )
Fig. 3.4. Detailed recordings of the high-frequency and low-frequency ENDOR transitions of the Mn2+ ion in ZnGeP2 as displayed in Fig. 3.3. The signals are obtained as an average of 4 sweeps through the ENDOR transitions. The splitting of the lines is caused by the quadrupole splitting of the 55Mn (I=5/2) nuclear spin.
The low-frequency ENDOR lines of the 31P and 55Mn nuclear spins exhibit a decrease of the intensity of the stimulated echo whereas the high-frequency ones show an increase. This kind of phenomenon has been observed earlier and explained as resulting from the interplay between electron-spin, nuclear-spin and cross-relaxation processes in the regime of large thermal spin polarization [3.9, 3.10].
- 50 -
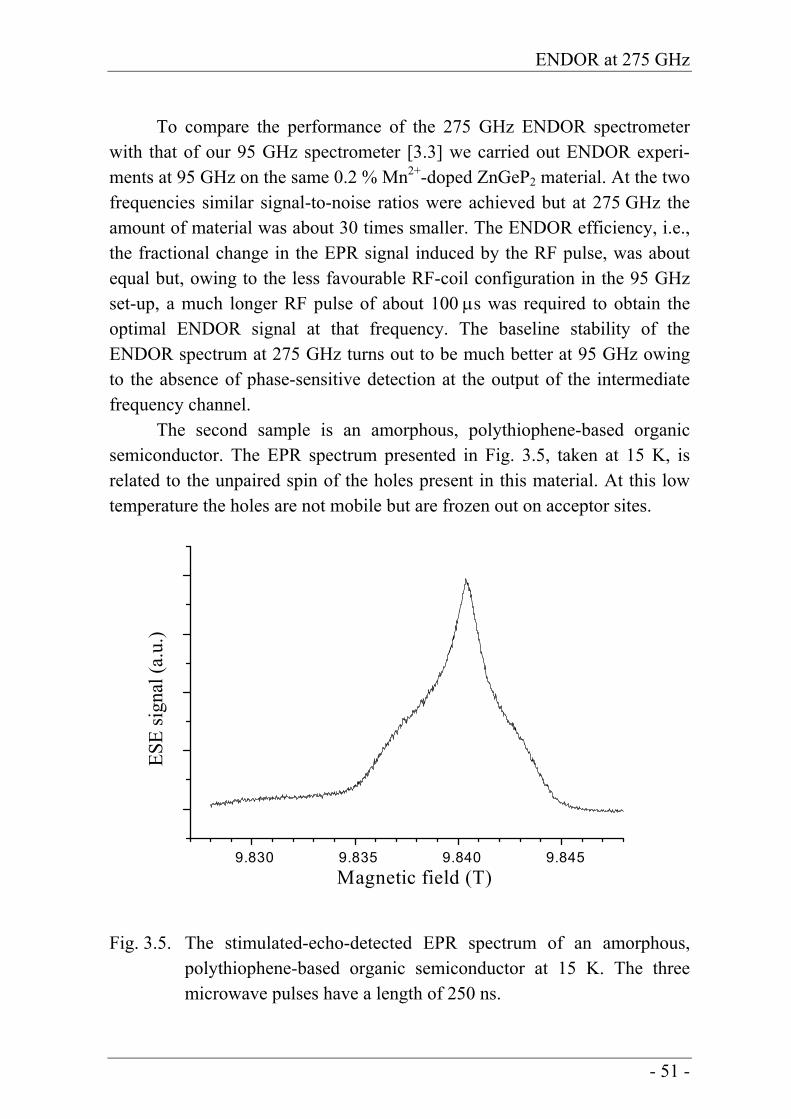
ENDOR at 275 GHz
To compare the performance of the 275 GHz ENDOR spectrometer with that of our 95 GHz spectrometer [3.3] we carried out ENDOR experi-ments at 95 GHz on the same 0.2 % Mn2+-doped ZnGeP2 material. At the two frequencies similar signal-to-noise ratios were achieved but at 275 GHz the amount of material was about 30 times smaller. The ENDOR efficiency, i.e., the fractional change in the EPR signal induced by the RF pulse, was about equal but, owing to the less favourable RF-coil configuration in the 95 GHz set-up, a much longer RF pulse of about 100 μs was required to obtain the optimal ENDOR signal at that frequency. The baseline stability of the ENDOR spectrum at 275 GHz turns out to be much better at 95 GHz owing to the absence of phase-sensitive detection at the output of the intermediate frequency channel.
The second sample is an amorphous, polythiophene-based organic semiconductor. The EPR spectrum presented in Fig. 3.5, taken at 15 K, is related to the unpaired spin of the holes present in this material. At this low temperature the holes are not mobile but are frozen out on acceptor sites.
9.830 9.835 9.840 9.845
ESE
sign
al (a
.u.)
Magnetic field (T)
Fig. 3.5. The stimulated-echo-detected EPR spectrum of an amorphous, polythiophene-based organic semiconductor at 15 K. The three microwave pulses have a length of 250 ns.
- 51 -
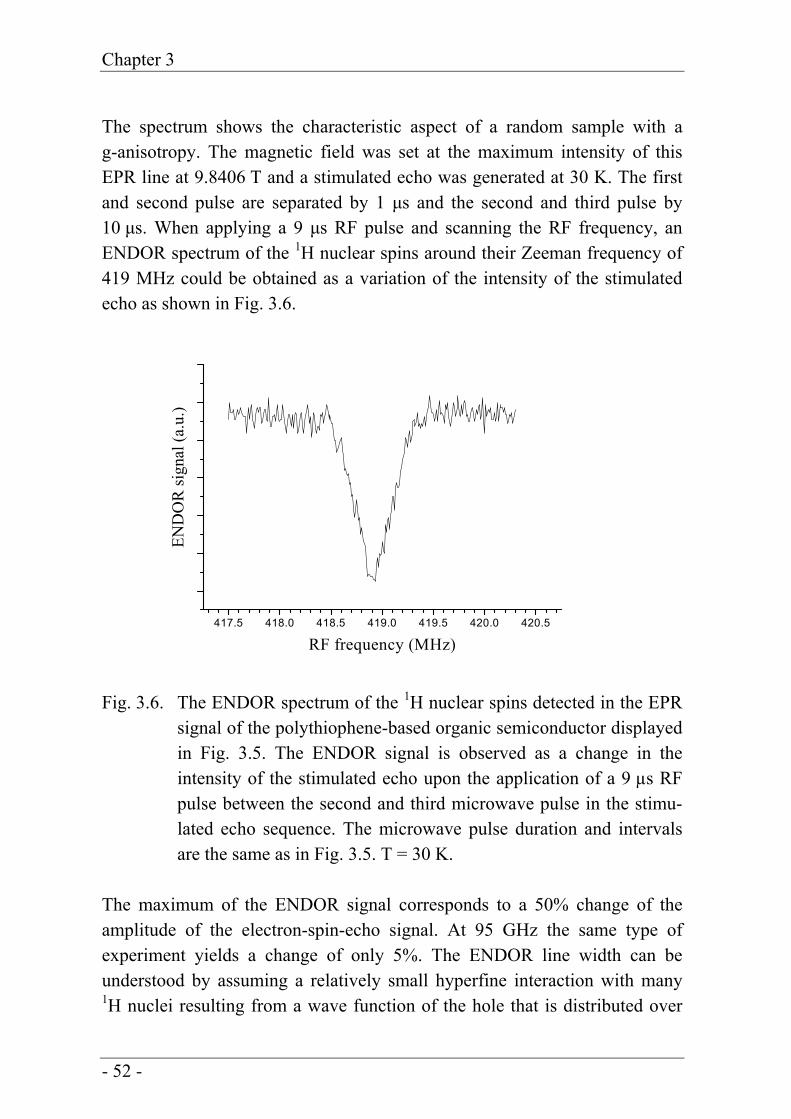
Chapter 3
The spectrum shows the characteristic aspect of a random sample with a g-anisotropy. The magnetic field was set at the maximum intensity of this EPR line at 9.8406 T and a stimulated echo was generated at 30 K. The first and second pulse are separated by 1 μs and the second and third pulse by 10 μs. When applying a 9 μs RF pulse and scanning the RF frequency, an ENDOR spectrum of the 1H nuclear spins around their Zeeman frequency of 419 MHz could be obtained as a variation of the intensity of the stimulated echo as shown in Fig. 3.6.
417.5 418.0 418.5 419.0 419.5 420.0 420.5
END
OR
sign
al (a
.u.)
RF frequency (MHz)
Fig. 3.6. The ENDOR spectrum of the 1H nuclear spins detected in the EPR signal of the polythiophene-based organic semiconductor displayed in Fig. 3.5. The ENDOR signal is observed as a change in the intensity of the stimulated echo upon the application of a 9 µs RF pulse between the second and third microwave pulse in the stimu-lated echo sequence. The microwave pulse duration and intervals are the same as in Fig. 3.5. T = 30 K.
The maximum of the ENDOR signal corresponds to a 50% change of the amplitude of the electron-spin-echo signal. At 95 GHz the same type of experiment yields a change of only 5%. The ENDOR line width can be understood by assuming a relatively small hyperfine interaction with many 1H nuclei resulting from a wave function of the hole that is distributed over
- 52 -
ENDOR at 275 GHz
many polythiophene units. In chapter 5 some further investigations of this material with the application of the ENDOR capabilities of the spectrometer will be presented.
The amplitude of the RF B2 field can be estimated from the pulse duration needed to saturate the ENDOR transition of the 1H nuclear spins in the case of the polythiophene sample. Although we did not observe nutation effects in the ENDOR signal, our observation that pulses of 20 μs suffice to saturate the ENDOR transition allows us to estimate that an RF field B2 ≈ 1 mT is attained in our set-up. This is about what one would expect in view of the input power of 100 W, the dimensions of the ENDOR coil and the position of the sample. Conclusion
The experimental results presented in the previous section show that pulsed ENDOR spectroscopy can now be performed routinely at a microwave frequency as high as 275 GHz. A high spectral resolution is obtained as a result of the large differences in nuclear Zeeman frequencies of different nuclei. The key to this success is the use of a cylindrical single-mode cavity equipped with slits to allow the RF magnetic field to reach the sample. The loaded quality factor of about 1000 allows the generation of microwave mag-netic fields with an amplitude of almost 0.1 mT, sufficient to generate π/2 pulses of the order of 250 ns used in the stimulated-echo sequence of the ENDOR measurements. In addition, a strong RF B2 field of about 1 mT is generated owing to the fact that the RF coils are positioned at a distance of only 3 mm from the sample.
- 53 -
Chapter 3
References
[3.1]. M. A. Ondar, A. A. Dubinskii, O. Ya. Grinberg, A. Grigor’ev, L. B. Volodarskii and Ya. S. Lebedev, Determination of the mag-netic parameters and structure of nitrosyl biradicals from the electron-spin resonance spectra in the 2 mm range, J. Struct. Chem. 22 (1981) 515-531.
[3.2]. O. Burghaus. A. Toth-Kischkat, R. Klette and K. Möbius, Proton ENDOR at a microwave frequency of 97 GHz, J. Magn. Reson. 80 (1988) 383-388.
[3.3]. O. G. Poluektov and J. Schmidt, Pulsed EPR and ENDOR spec-troscopy at 95 GHz. Bruker Report 143 (1996) 34-37.
[3.4]. W. B. Mims, Electron Spin Echoes, in Electron Paramagnetic Reso-nance (S. Geschwind Ed.) (Plenum Press, New-York-London, 1972).
[3.5]. N.Y. Garces, L.E. Halliburton, P.G. Schunemann and S.D. Setzler, Electron-nuclear double-resonance study of Mn2+ ions in ZnGeP2 crystals, Phys. Rev. B 72, 033202 (2005).
[3.6]. D. Arieli, A. Delabie, M. Groothaert, K. Pierloot and D. Goldfarb, The process of Mn(II) incorporation into Aluminophosphate zeo-types through high-field ENDOR spectroscopy and DFT calcu-lations, J. Phys. Chem. B 106 (2002) 9086-9097.
[3.7]. R. J. van Zee, D. A. Garland and W. Weltner Jr., ENDOR/ESR of Mn atoms and MnH molecules in solid argon, J. Chem. Phys. 85 (1986) 3237-3242.
[3.8]. D. W. Randall, M. K. Chan, W. H. Armstrong and R. D. Britt, Pulsed 1H and 55Mn ENDOR studies of dinuclear Mn(III)Mn(IV) model compound, Mol. Phys. 95 (1998) 1283-1294.
[3.9]. M. T. Bennebroek and J. Schmidt, Pulsed ENDOR spectroscopy at large thermal spin polarizations and the absolute sign of the hyper-fine interaction. J. Magn. Reson. 128 (1997) 199-206.
[3.10]. B. Epel, A. Pöppl, P. Manikandan, S. Vega and D. Goldfarb, The effect of spin relaxation on ENDOR spectra recorded at high mag-netic fields and low temperatures, J. Magn. Reson. 148 (2001) 388-397.
- 54 -
Chapter 4
Dynamic Nuclear Polarization observed in EPR
at 275 GHz
Abstract
Hole-burning in and displacements of the magnetic-resonance absorption line of the electron spin of the shallow hydrogen-related donor in ZnO are observed upon resonant irradiation with microwaves at 275 GHz and at 4.5 K in a magnetic field of 10 Tesla. These effects arise from an almost complete polarization of the many 67Zn (I=5/2) nuclear spins that have an isotropic hyperfine interaction with the electron spin of the shallow donor. It is proposed that this huge dynamic nuclear polarization is caused by a spon-taneous-emission-type cross relaxation in the coupled electron-spin nuclear-spin system induced by the zero-point fluctuations of the phonon field. The content of this chapter has been published in: H. Blok, S.B. Orlinski, J. Schmidt and P.G. Baranov ‘Overhauser Effect of 67Zn Nuclear Spins in ZnO via Cross Relaxation Induced by the Zero-Point Fluctuations of the Phonon Field’ Phys. Rev. Letters 92 (2004) 047602.
- 55 -
Chapter 4
Introduction
Recently, by an Electron Paramagnetic Resonance (EPR) and Electron Nuclear Double Resonance (ENDOR) study [4.1], it was demonstrated that hydrogen acts as a shallow donor in ZnO, thus confirming the observation of muon spin rotation [4.2] and the prediction of Van de Walle [4.3]. The experimental evidence was provided by the observation of the ENDOR signals of the nuclear spin of 1H (I=1/2) in the EPR signal of this shallow donor obtained at 95 GHz. In addition, the ENDOR signals were observed of the 67Zn nuclear spins (I = 5/2, abundance 4.1 %) that have an isotropic hyperfine (hf) interaction with the unpaired electron spin of the donor. The multitude of 67Zn nuclear-spin resonance lines, showing hf interactions ranging from a = 2.4 MHz to a = 0.01 MHz, is caused by the fact that the electronic wave function is distributed in the crystal according to a 1s-type wave function with a Bohr radius of 15 Å [4.1].
EPR measurements at 275 GHz on an annealed ZnO sample at low temperatures showed a strong influence of pre-irradiation with resonant microwaves. The shape of the EPR line indicated the effect of hole-burning and a significant shift in the position of the line was induced by repeated resonant cw excitation. In this chapter the observations are described and it is shown that the cause of the effects is the transfer of spin polarization of localised electrons to the nuclear spin system. Cross relaxation induced by the zero-point fluctuations of the phonon field is the cause of this transfer. Experimental
In an annealed ZnO sample only the EPR signal of the shallow H-related donor is observed. Using our new EPR spectrometer operating at 275 GHz this EPR signal has a Gaussian line shape with a width of 0.35 mT similar to the width of the resonance line observed at 95 GHz. The linewidth can be simulated by considering the isotropic hyperfine (hf) interaction with the 67Zn nuclear spins as measured in the ENDOR spectrum [4.1]. The observed Gaussian line shape and linewidth show that the concentration of shallow donors is low and that exchange narrowing, resulting from the overlap of the wave functions of neighboring donors, is negligible.
It appears that the EPR line shape at 275 GHz and 4.5 K depends strongly on pre-irradiation with resonant microwaves. This is shown in
- 56 -
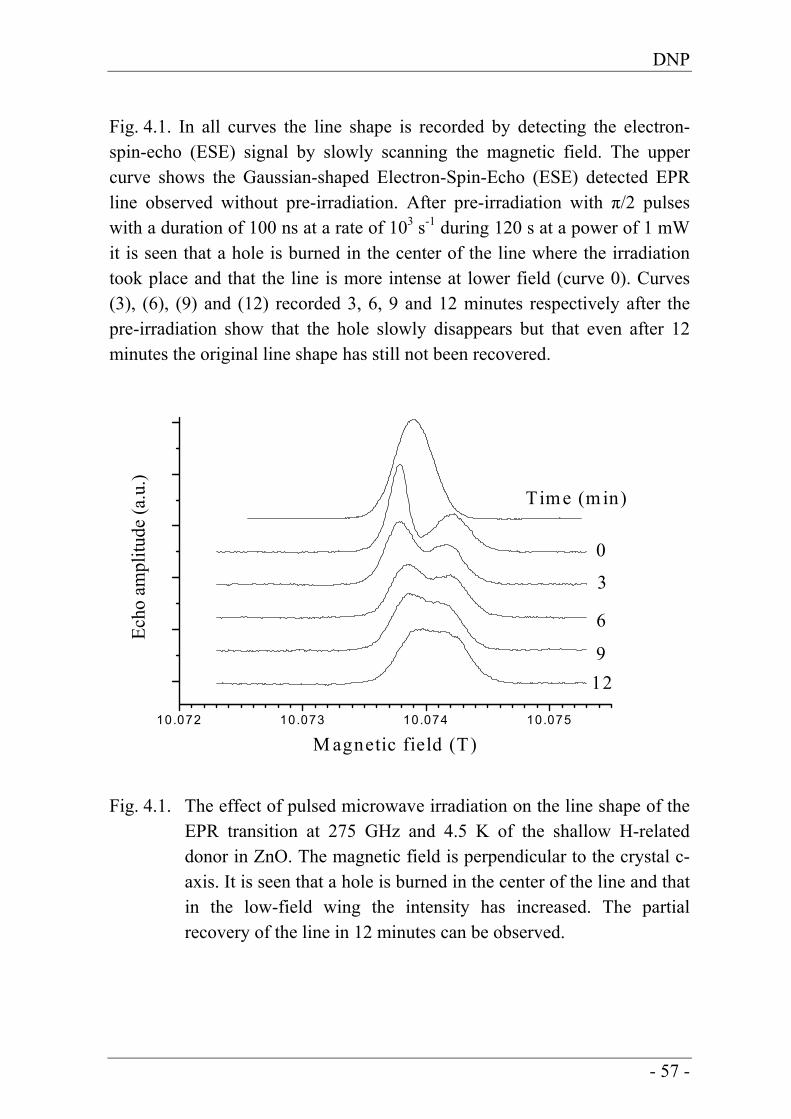
DNP
Fig. 4.1. In all curves the line shape is recorded by detecting the electron-spin-echo (ESE) signal by slowly scanning the magnetic field. The upper curve shows the Gaussian-shaped Electron-Spin-Echo (ESE) detected EPR line observed without pre-irradiation. After pre-irradiation with π/2 pulses with a duration of 100 ns at a rate of 103 s-1 during 120 s at a power of 1 mW it is seen that a hole is burned in the center of the line where the irradiation took place and that the line is more intense at lower field (curve 0). Curves (3), (6), (9) and (12) recorded 3, 6, 9 and 12 minutes respectively after the pre-irradiation show that the hole slowly disappears but that even after 12 minutes the original line shape has still not been recovered.
10.072 10.073 10.074 10.075
Echo
am
plitu
de (a
.u.)
M agnetic field (T)
0
3
6
912
Time (m in)
Fig. 4.1. The effect of pulsed microwave irradiation on the line shape of the EPR transition at 275 GHz and 4.5 K of the shallow H-related donor in ZnO. The magnetic field is perpendicular to the crystal c-axis. It is seen that a hole is burned in the center of the line and that in the low-field wing the intensity has increased. The partial recovery of the line in 12 minutes can be observed.
- 57 -
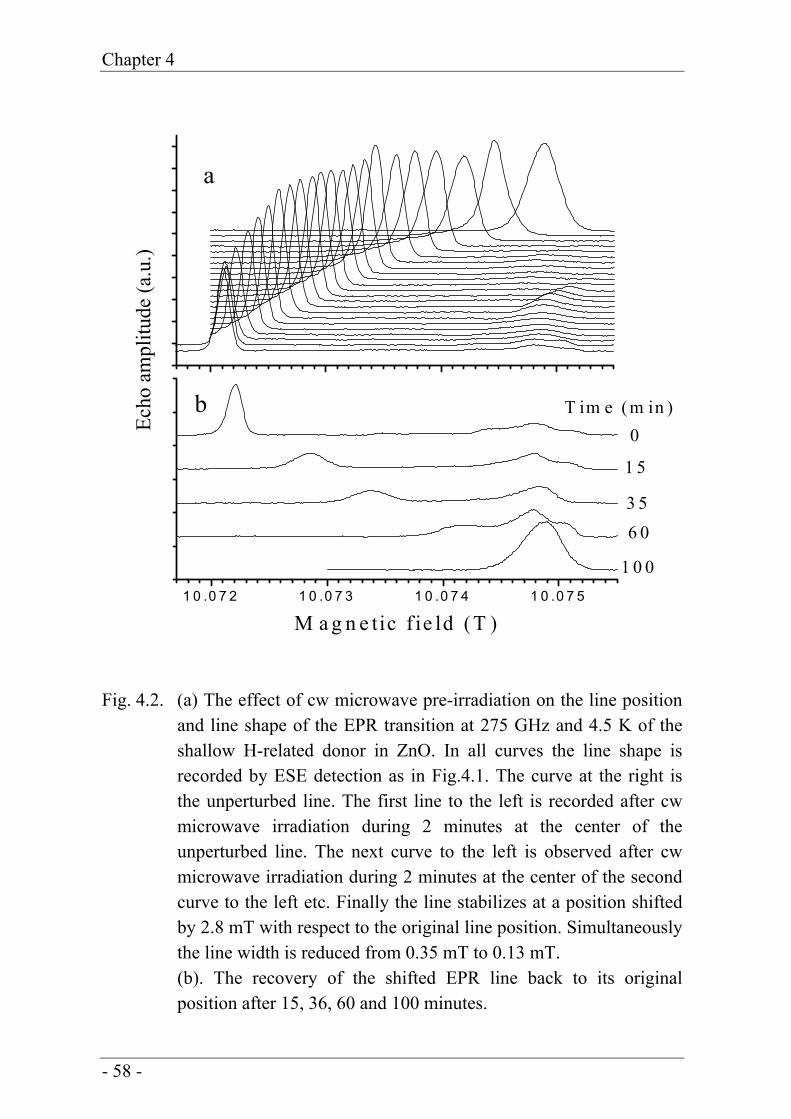
Chapter 4
1 0 .0 7 2 1 0 .0 7 3 1 0 .0 7 4 1 0 .0 7 5
a
Echo
am
plitu
de (a
.u.)
M a g n e tic f ie ld (T )
b T im e (m in )0
1 5
3 56 0
1 0 0
Fig. 4.2. (a) The effect of cw microwave pre-irradiation on the line position and line shape of the EPR transition at 275 GHz and 4.5 K of the shallow H-related donor in ZnO. In all curves the line shape is recorded by ESE detection as in Fig.4.1. The curve at the right is the unperturbed line. The first line to the left is recorded after cw microwave irradiation during 2 minutes at the center of the unperturbed line. The next curve to the left is observed after cw microwave irradiation during 2 minutes at the center of the second curve to the left etc. Finally the line stabilizes at a position shifted by 2.8 mT with respect to the original line position. Simultaneously the line width is reduced from 0.35 mT to 0.13 mT.
(b). The recovery of the shifted EPR line back to its original position after 15, 36, 60 and 100 minutes.
- 58 -
DNP
Even more remarkable effects are observed after pre-irradiation with cw microwaves at the center of the line. In Fig. 4.2a it is seen that the unper-turbed ESE-detected EPR line centered at 10.0749 T is displaced by 0.35 mT to lower field after irradiation with cw microwaves with a power of 1 mW during 120 s at the center of the unperturbed line. Irradiating at the center of this new line position with the same microwave power during the same time again displaces the line to lower field. When repeating this procedure the resonance line is finally displaced by 2.8 mT to 10.0721 T with a simul-taneous reduction of the line width by a factor of 2.5 to 0.13 mT. Fig. 4.2b shows that it takes about 100 minutes for the shifted line to relax back to its original unperturbed position. During this relaxation the line first broadens to its original width and then shifts to its starting position. Discussion
Since the line shape of the EPR transition of the shallow H-related donor is determined by the isotropic hyperfine interactions with the nuclear spins of the surrounding 67Zn nuclei it is obvious that the observed effects are related to a dynamic nuclear polarization (DNP) process. Apparently the microwave irradiation induces an efficient transfer of the large electron spin polarization (Boltzmann factor expgeβeB/kT = 18.7) to the 67Zn nuclear spin system.
The surprising aspect of the observed DNP is that it occurs for localized electron spins that are not expected to exhibit a rapid modulation of the hf interaction with the nuclear spins as required for an Overhauser effect [4.4, 4.5]. As yet, in semiconductors the Overhauser effect has been observed only for conduction electrons or for shallow donors at a relatively high concentration (>1016 cm-3) with an exchange interaction that leads to motional averaging of the EPR line [4.6]. In our case however the EPR line of the H donors is inhomogeneously broadened and the ENDOR transitions of the surrounding 67Zn spins can be observed without a sign of exchange averaging, proving that the concentration of donors is so low that the effect of exchange can be ignored.
The common DNP mechanism for localized spins is the Solid Effect [4.7, 4.8]. In this Solid Effect the transfer of the electron-spin polarization to the nuclear spins is achieved by saturating the forbidden EPR transitions which are weakly allowed by the presence of the dipolar interaction between
- 59 -
Chapter 4
the electron spins and the nuclear spins. We have saturated these forbidden transitions, which are shifted by ±27 MHz (the Zeeman frequency of the 67Zn nuclear spins) from the allowed EPR transition, but we could not find any shift of the EPR line caused by a nuclear polarization. We thus exclude that the Solid Effect can explain our observations.
We propose that in our case the DNP process is an Overhauser effect and that it finds its origin in a direct, spontaneous-emission-type cross-relaxation in the electron-spin-nuclear-spin system induced by the zero-point vibrations of the phonon field. In this cross-relaxation process the electron spin S = 1/2 of the shallow donor and the I = 5/2 nuclear spin of a 67Zn iso-tope undergo a simultaneous ΔmS = +1, ΔmI = -1 transition. The new aspect is that the modulation of the term ½a(t)S+I- + S-I+ of the isotropic hf interaction that induces the cross-relaxation is caused by the zero-point vibrations of the phonon field and not by the rapid relative motion of the spins of conduction electrons or by the spins of shallow donors that exhibit an exchange interaction [4.6]. In the magnetic field of 10 T the splitting of the electron-spin levels corresponds to 275 GHz and the splitting of the nuclear-spin levels to about 27 MHz. Since at 4.5 K the thermal energy kT is much smaller than the Zeeman splitting of the electron spin levels which corresponds to 13.2 K, the spin-lattice relaxation is a direct process, i.e., a change of the electron spin state is accompanied by the creation or the annihilation of a phonon with the same energy [4.9]. As a result of the large Boltzmann factor at 4.5 K and 10 T the relaxation rate from the upper to the lower spin manifold is about 20 times faster than the reverse process. In terms of the Einstein A and B coefficients for spontaneous emission and stimulated emission and absorption, the spontaneous-emission relaxation from the upper to the lower electron spin level, induced by the zero-point vibrations of the phonon field, dominates. An estimate of this spontaneous-emission-type relaxation rate has been obtained by pulsed EPR experiments from which we find a value of 1.6x10³ s-1 at 4.5 K. Similarly an estimate of the spontaneous-emission cross-relaxation rate is derived from the DNP experiments with pulsed and cw pre-irradiation. In the DNP experiments with pulsed pre-irradiation it takes about 120 s at a repetition rate of 103 s-1 to burn a hole in the EPR line. In the DNP experiments with cw pre-irradiation it also takes about 120 s to shift the EPR line. We thus conclude that the spontaneous-emission cross-relaxation rate is about 10-2 s-1 at 4.5 K, i.e.,
- 60 -
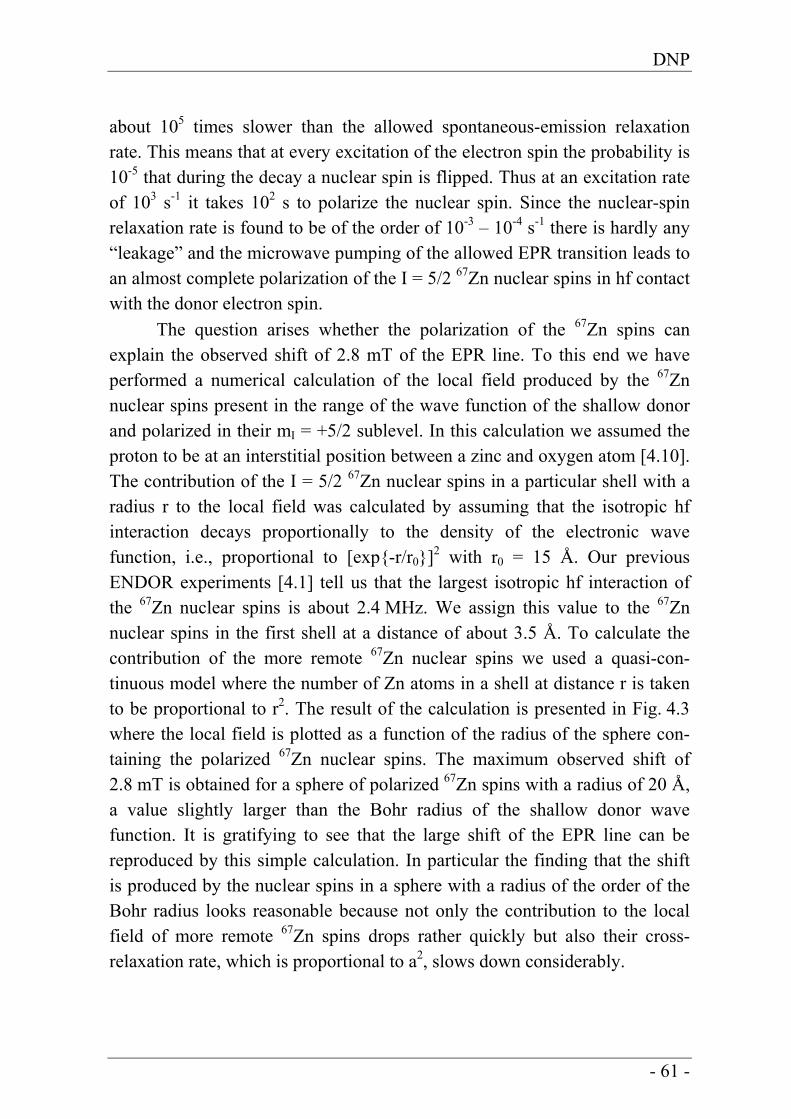
DNP
about 105 times slower than the allowed spontaneous-emission relaxation rate. This means that at every excitation of the electron spin the probability is 10-5 that during the decay a nuclear spin is flipped. Thus at an excitation rate of 103 s-1 it takes 102 s to polarize the nuclear spin. Since the nuclear-spin relaxation rate is found to be of the order of 10-3 – 10-4 s-1 there is hardly any “leakage” and the microwave pumping of the allowed EPR transition leads to an almost complete polarization of the I = 5/2 67Zn nuclear spins in hf contact with the donor electron spin.
The question arises whether the polarization of the 67Zn spins can explain the observed shift of 2.8 mT of the EPR line. To this end we have performed a numerical calculation of the local field produced by the 67Zn nuclear spins present in the range of the wave function of the shallow donor and polarized in their mI = +5/2 sublevel. In this calculation we assumed the proton to be at an interstitial position between a zinc and oxygen atom [4.10]. The contribution of the I = 5/2 67Zn nuclear spins in a particular shell with a radius r to the local field was calculated by assuming that the isotropic hf interaction decays proportionally to the density of the electronic wave function, i.e., proportional to [exp-r/r0]2 with r0 = 15 Å. Our previous ENDOR experiments [4.1] tell us that the largest isotropic hf interaction of the 67Zn nuclear spins is about 2.4 MHz. We assign this value to the 67Zn nuclear spins in the first shell at a distance of about 3.5 Å. To calculate the contribution of the more remote 67Zn nuclear spins we used a quasi-con-tinuous model where the number of Zn atoms in a shell at distance r is taken to be proportional to r2. The result of the calculation is presented in Fig. 4.3 where the local field is plotted as a function of the radius of the sphere con-taining the polarized 67Zn nuclear spins. The maximum observed shift of 2.8 mT is obtained for a sphere of polarized 67Zn spins with a radius of 20 Å, a value slightly larger than the Bohr radius of the shallow donor wave function. It is gratifying to see that the large shift of the EPR line can be reproduced by this simple calculation. In particular the finding that the shift is produced by the nuclear spins in a sphere with a radius of the order of the Bohr radius looks reasonable because not only the contribution to the local field of more remote 67Zn spins drops rather quickly but also their cross-relaxation rate, which is proportional to a2, slows down considerably.
- 61 -
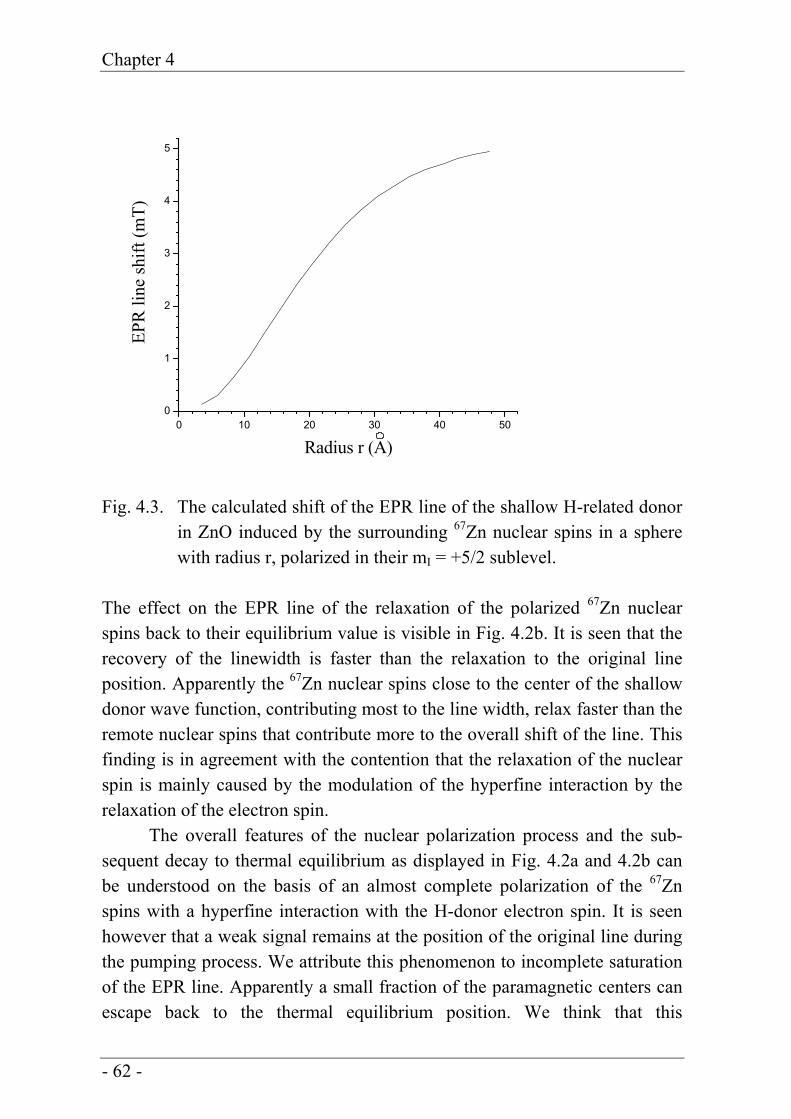
Chapter 4
0 10 20 30 40 500
1
2
3
4
5EP
R li
ne sh
ift (m
T)
Radius r (A)
Fig. 4.3. The calculated shift of the EPR line of the shallow H-related donor in ZnO induced by the surrounding 67Zn nuclear spins in a sphere with radius r, polarized in their mI = +5/2 sublevel.
The effect on the EPR line of the relaxation of the polarized 67Zn nuclear spins back to their equilibrium value is visible in Fig. 4.2b. It is seen that the recovery of the linewidth is faster than the relaxation to the original line position. Apparently the 67Zn nuclear spins close to the center of the shallow donor wave function, contributing most to the line width, relax faster than the remote nuclear spins that contribute more to the overall shift of the line. This finding is in agreement with the contention that the relaxation of the nuclear spin is mainly caused by the modulation of the hyperfine interaction by the relaxation of the electron spin.
The overall features of the nuclear polarization process and the sub-sequent decay to thermal equilibrium as displayed in Fig. 4.2a and 4.2b can be understood on the basis of an almost complete polarization of the 67Zn spins with a hyperfine interaction with the H-donor electron spin. It is seen however that a weak signal remains at the position of the original line during the pumping process. We attribute this phenomenon to incomplete saturation of the EPR line. Apparently a small fraction of the paramagnetic centers can escape back to the thermal equilibrium position. We think that this
- 62 -
DNP
incomplete saturation also explains the somewhat complex spectrum that develops during the recovery.
For half-integer paramagnetic spin systems the one-phonon, spon-taneous-emission-type relaxation rate is known to be proportional to ω5 where ω is the frequency of the splitting of the electron-spin levels [4.9]. We thus predict that at 95 GHz in a magnetic field of 3.4 T and at a temperature of 1.6 K where also spontaneous emission dominates, the relaxation rate is slower by a factor of (275/95)5 = 203. In practice we find that this ratio is 25. We explain this difference by phonon bottlenecking. We think that at 9.8 T the rate of creation of phonons at 275 GHz is so high that these phonons cannot thermalize quickly enough so that the relaxation rate in the spin system slows down. A direct proof of such phonon bottlenecking would be provided by Brillouin scattering from the heated phonon system as demonstrated by Geschwind [4.11].
In Fig. 4.4 we present hole-burning in the EPR line detected at 95 GHz and at 1.6 K of a shallow donor in nanoparticles of ZnO (diameter 3.4 nm and capped with Zn(OH)2) indicating that here the 67Zn nuclear spins also become polarized. As yet the nature of this shallow donor is unclear. The volume of these particles is so small that only 1 out of 103-104 particles is expected to contain a shallow donor. Thus delocalization of the donor wave function as a result of exchange interactions is excluded suggesting that a DNP process, similar to that in the bulk ZnO material, is causing the polarization of the 67Zn nuclear spins.
- 63 -
Chapter 4
3.42 3.43 3.44 3.45 3.46 3.47
b
aEPR
sign
al in
tens
ity (a
.u.)
Magnetic field (T)
Fig. 4.4. (a) The EPR line of a shallow donor in a dry powder of ZnO nanoparticles with a diameter of 3.4 nm observed at a frequency of 94.9 GHz and a temperature of 1.6 K. The EPR line has a width of about 9 mT compared to 0.35 mT for the shallow H-related donor in ZnO bulk single crystals as displayed in Fig.4.1. The larger line width is caused by the anisotropy of the g-tensor and the random character of the ZnO nanoparticles. (b) The same EPR line recorded after pre-irradiation with micro-waves during two minutes at one position in the EPR line. It is seen that a hole is burnt and an anti-hole develops. These effects are attributed to dynamic nuclear polarization of the 67Zn nuclear spins in the nanocrystals.
Conclusion
We have observed hole-burning in and shifts of the EPR line of the shallow H-related donor in bulk ZnO single crystals at 275 GHz and 4.5 K upon prolonged resonant irradiation of the EPR transition. This effect is caused by a dynamic nuclear polarization process that transfers the almost complete electron-spin polarization to the 67Zn (I = 5/2) nuclear spins. The mechanism responsible for this transfer is a cross relaxation induced by a modulation of
- 64 -
DNP
the isotropic hf interaction of the electron spin and the surrounding 67Zn nuclear spins. We propose that the modulation of this hf interaction is caused by the zero-point fluctuations of the phonon field. The DNP effect is so large because the starting electron-spin polarization is almost complete (> 95 %), because spontaneous-emission decay induced by the zero-point fluctuations of the phonon field dominates the relaxation process and because the intrinsic nuclear-spin relaxation rate is very slow. Thus the observed dynamic nuclear polarization mechanism is essentially an Overhauser effect. The remarkable aspect is that the effect occurs in a localized paramagnetic spin system in a solid, whereas it usually assumed that the Overhauser effect occurs for electron and nuclear systems that exhibit a rapid relative movement. In addition we report dynamic nuclear polarization effects in ZnO nanoparticles that seem to be caused by a similar mechanism.
- 65 -
Chapter 4
References
[4.1]. D. M. Hofmann, A. Hofstaetter, F. Leiter, H. Zhou, F. Henecker, B. K. Meyer, S. B. Orlinskii, J. Schmidt and P. G. Baranov, Hydrogen: A Relevant Shallow Donor in Zinc Oxide, Phys. Rev. Lett. 88, 045504 (2002).
[4.2]. S.F.J. Cox, E.A. Davis, S.P. Cottrell, P.J.C. King, J.S. Lord, J.M. Gil, H.V. Alberto, R.C. Vilão, J. Piroto Duarte, N. Ayres de Campos, A. Weidinger, R.L. Lichti, and S.J.C. Irvine, Experimental Confirmation of the Predicted Shallow Donor Hydrogen State in Zinc Oxide, Phys. Rev. Lett. 86, 2601 (2001).
[4.3]. C. G. Van de Walle, Hydrogen as a Cause of Doping in Zinc Oxide, Phys. Rev. Lett. 85, 1012-1015 (2000).
[4.4]. A. W. Overhauser, Paramagnetic Relaxation in Metals, Phys. Rev. 89, 689 (1953); 92, 411 (1953).
[4.5]. Carrington and A.D. McLachlan, Introduction to Magnetic Reso-nance, (Harper & Row New York, 1967).
[4.6]. G. Denninger and D. Reiser, Determination of electric field gradients in semiconductors with high precision and high sensitivity, Phys. Rev. B 55, 5073-5078 (1997).
[4.7]. C.D. Jeffries, in Electron Paramagnetic Resonance (S. Geschwind Ed.) (Plenum Press, New York, 1972).
[4.8]. A. Abragam and M. Goldman, Nuclear Magnetism: Order and Disorder, (Clarendon Press, Oxford 1982).
[4.9]. A. Abragam and B. Bleaney, Electron Paramagnetic Resonance of Transition Ions (Clarendon Press, Oxford 1982).
[4.10]. E. V. Lavrov, J. Weber, F. Börrnert, Chris G. Van de Walle and R. Helbig, Hydrogen-related defects in ZnO studied by infrared absorption spectroscopy, Phys. Rev. B 66 165205 (2002).
[4.11]. S. Geschwind, in Electron Paramagnetic Resonance (S. Geschwind Ed.) (Plenum Press, New York 1972).
- 66 -
Chapter 5
EPR and ENDOR Spectroscopy at 275 GHz on
Poly(3-hexylthiophene)
Abstract
Pulsed EPR and ENDOR spectroscopic experiments at 275 GHz have been carried out on poly(3-hexylthiophene) (P3HT) samples of high purity and on a mixed sample of P3HT and 6,6-phenyl-C61-butyric acid methyl ester (PCBM). From the results it is deduced that molecular oxygen can slowly diffuse into the pure P3HT material and that upon optical excitation an electron is transferred from P3HT to a P3HT-O2 complex. The g-tensors of (P3HT)+ and (P3HT-O2)- differ so little that only at 275 GHz the EPR signals of the two paramagnetic species can be distinguished. It is thought that the generation of (P3HT-O2)- is related to the degradation of P3HT-based semiconductor devices.
- 67 -
Chapter 5
Introduction
Presently a great deal of attention is devoted to the understanding of the physical properties of conjugated polymers because these materials exhibit conducting and semi-conducting properties. The most promising polymer for electronic devices is poly(3-hexylthiophene) (P3HT) and related compounds. It can easily be processed, it has a high charge mobility (up to 0.1 cm2/Vs) and excellent device properties. However, when exposed to air and light the semiconductor properties are gradually lost and the material ends up as a normal conductor. This degradation represents a considerable problem for the production of commercial devices.
It has been shown by Abdou et al [5.1] that, when exposed to air, oxygen diffuses into P3HT. These authors argue that a weak charge-transfer complex is formed between oxygen and the conjugated poly(3-alkylthiophene) molecules and they propose that it is this weak or “contact” charge-transfer complex that affects the conducting properties so dramatically. When increasing the oxygen pressure the Field-Effect-Transistor-like response of P3HT-based devices changes into an Ohmic behaviour. The I-V curves however are fully reversible upon the removal or addition of oxygen. It was suggested by Abdou et al. that the charge-transfer complex between the polymer and O2 facilitates the generation of p-type charge carriers in the polymer upon the application of an electric field.
EPR spectroscopy at 9 GHz by the same authors [5.1] has revealed an EPR spectrum that increases and decreases with the oxygen concentration. The unstructured Gaussian line shape was taken as indicative for the unpaired electrons in the P3HT-O2 charge-transfer complex. Since oxygen radical anions O2
*- are known to give broad signals, the observed EPR signal was suggested to arise from the unpaired spins related to the holes on the polymer backbone. This hypothesis however is not consistent with their experimental observations because the authors show that the position of the EPR line shifts with the amount of O2 diffused into the P3HT material.
In this chapter the results are presented of an EPR and ENDOR study at 275 GHz of P3HT of very high purity that has recently become available and that is used as the starting material for the production of semiconductor devices. The idea was that the high-field EPR and ENDOR technique might present new opportunities to elucidate the nature of the charge carriers
- 68 -
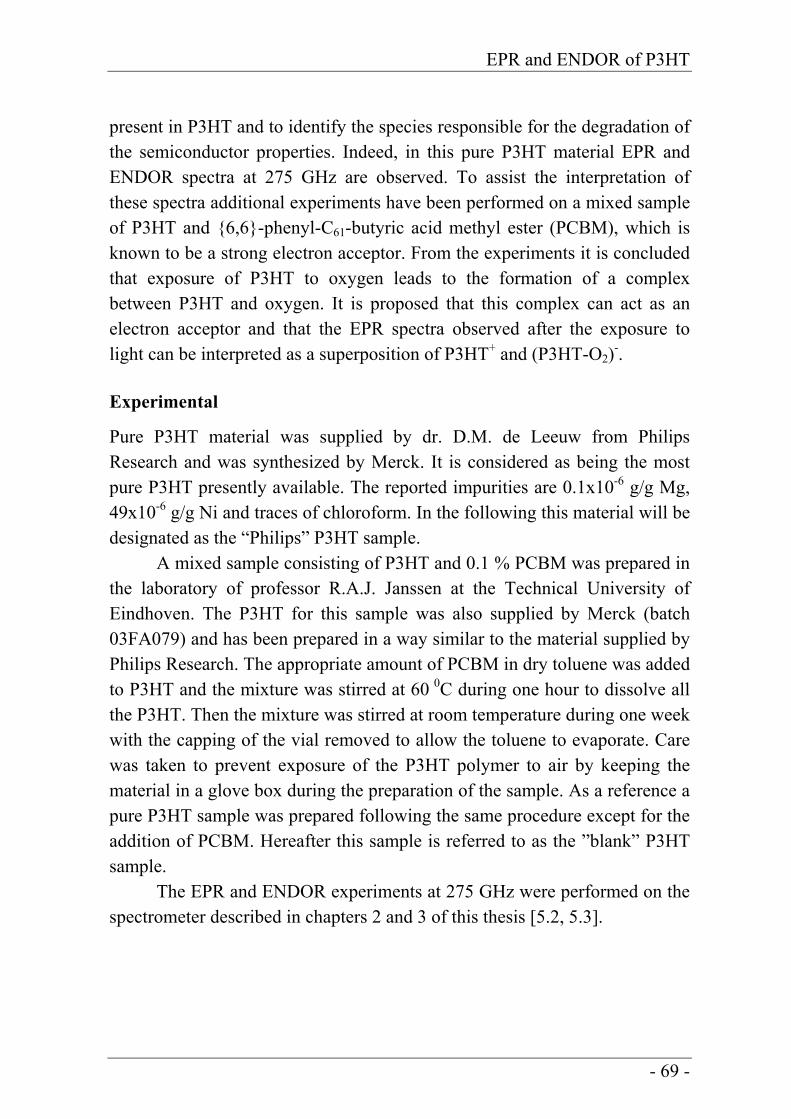
EPR and ENDOR of P3HT
present in P3HT and to identify the species responsible for the degradation of the semiconductor properties. Indeed, in this pure P3HT material EPR and ENDOR spectra at 275 GHz are observed. To assist the interpretation of these spectra additional experiments have been performed on a mixed sample of P3HT and 6,6-phenyl-C61-butyric acid methyl ester (PCBM), which is known to be a strong electron acceptor. From the experiments it is concluded that exposure of P3HT to oxygen leads to the formation of a complex between P3HT and oxygen. It is proposed that this complex can act as an electron acceptor and that the EPR spectra observed after the exposure to light can be interpreted as a superposition of P3HT+ and (P3HT-O2)-. Experimental
Pure P3HT material was supplied by dr. D.M. de Leeuw from Philips Research and was synthesized by Merck. It is considered as being the most pure P3HT presently available. The reported impurities are 0.1x10⁻⁶ g/g Mg, 49x10-6 g/g Ni and traces of chloroform. In the following this material will be designated as the “Philips” P3HT sample.
A mixed sample consisting of P3HT and 0.1 % PCBM was prepared in the laboratory of professor R.A.J. Janssen at the Technical University of Eindhoven. The P3HT for this sample was also supplied by Merck (batch 03FA079) and has been prepared in a way similar to the material supplied by Philips Research. The appropriate amount of PCBM in dry toluene was added to P3HT and the mixture was stirred at 60 0C during one hour to dissolve all the P3HT. Then the mixture was stirred at room temperature during one week with the capping of the vial removed to allow the toluene to evaporate. Care was taken to prevent exposure of the P3HT polymer to air by keeping the material in a glove box during the preparation of the sample. As a reference a pure P3HT sample was prepared following the same procedure except for the addition of PCBM. Hereafter this sample is referred to as the ”blank” P3HT sample.
The EPR and ENDOR experiments at 275 GHz were performed on the spectrometer described in chapters 2 and 3 of this thesis [5.2, 5.3].
- 69 -
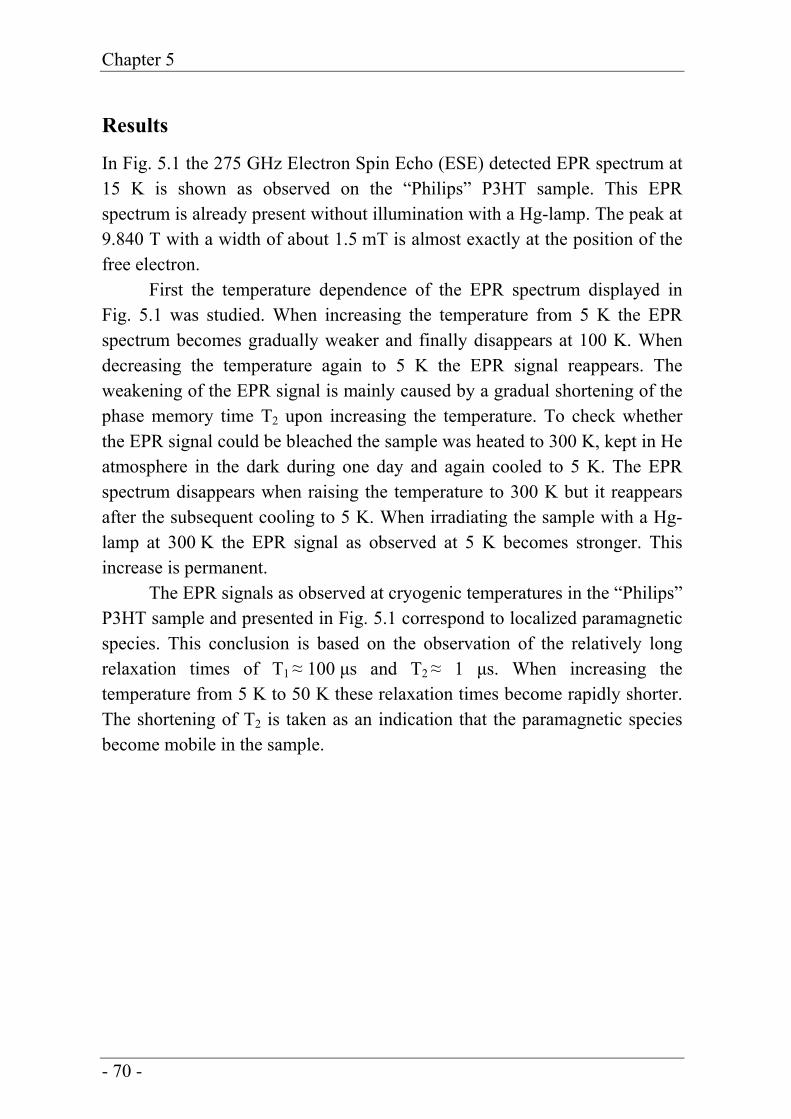
Chapter 5
Results
In Fig. 5.1 the 275 GHz Electron Spin Echo (ESE) detected EPR spectrum at 15 K is shown as observed on the “Philips” P3HT sample. This EPR spectrum is already present without illumination with a Hg-lamp. The peak at 9.840 T with a width of about 1.5 mT is almost exactly at the position of the free electron.
First the temperature dependence of the EPR spectrum displayed in Fig. 5.1 was studied. When increasing the temperature from 5 K the EPR spectrum becomes gradually weaker and finally disappears at 100 K. When decreasing the temperature again to 5 K the EPR signal reappears. The weakening of the EPR signal is mainly caused by a gradual shortening of the phase memory time T2 upon increasing the temperature. To check whether the EPR signal could be bleached the sample was heated to 300 K, kept in He atmosphere in the dark during one day and again cooled to 5 K. The EPR spectrum disappears when raising the temperature to 300 K but it reappears after the subsequent cooling to 5 K. When irradiating the sample with a Hg-lamp at 300 K the EPR signal as observed at 5 K becomes stronger. This increase is permanent.
The EPR signals as observed at cryogenic temperatures in the “Philips” P3HT sample and presented in Fig. 5.1 correspond to localized paramagnetic species. This conclusion is based on the observation of the relatively long relaxation times of T1 ≈ 100 μs and T2 ≈ 1 μs. When increasing the temperature from 5 K to 50 K these relaxation times become rapidly shorter. The shortening of T2 is taken as an indication that the paramagnetic species become mobile in the sample.
- 70 -
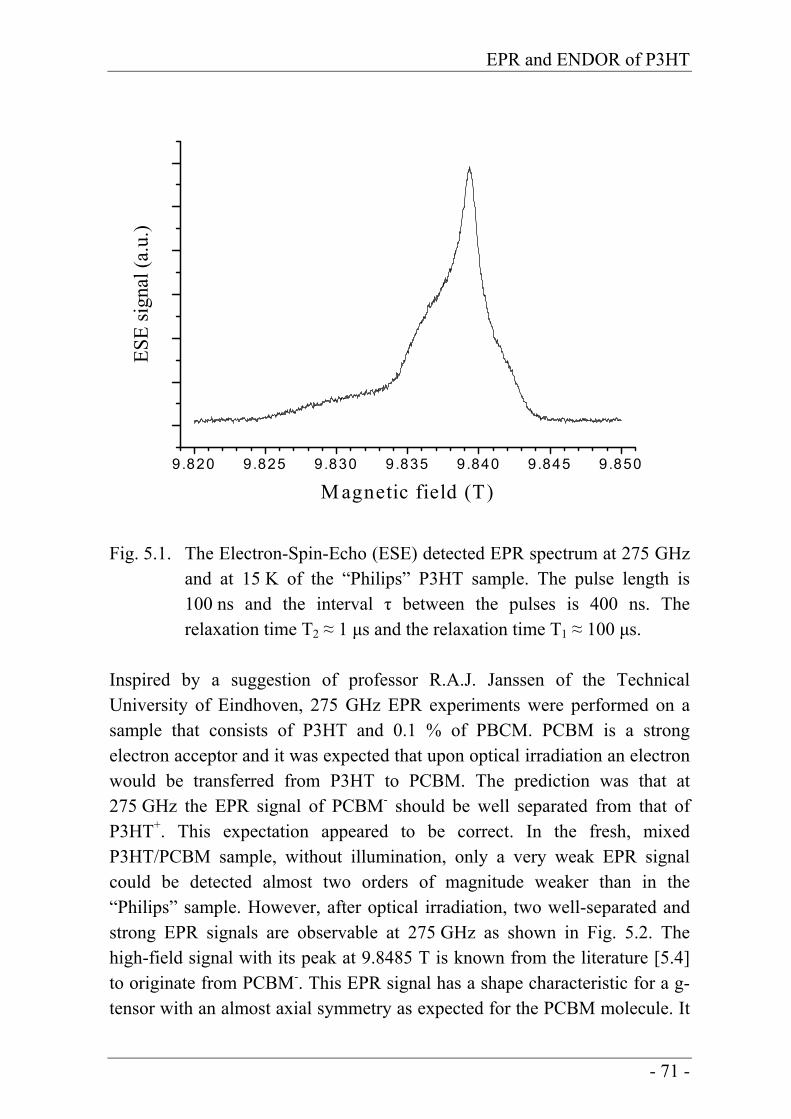
EPR and ENDOR of P3HT
9.820 9.825 9.830 9.835 9.840 9.845 9.850
ESE
sign
al (a
.u.)
M agnetic field (T)
Fig. 5.1. The Electron-Spin-Echo (ESE) detected EPR spectrum at 275 GHz and at 15 K of the “Philips” P3HT sample. The pulse length is 100 ns and the interval τ between the pulses is 400 ns. The relaxation time T2 ≈ 1 μs and the relaxation time T1 ≈ 100 μs.
Inspired by a suggestion of professor R.A.J. Janssen of the Technical University of Eindhoven, 275 GHz EPR experiments were performed on a sample that consists of P3HT and 0.1 % of PBCM. PCBM is a strong electron acceptor and it was expected that upon optical irradiation an electron would be transferred from P3HT to PCBM. The prediction was that at 275 GHz the EPR signal of PCBM- should be well separated from that of P3HT+. This expectation appeared to be correct. In the fresh, mixed P3HT/PCBM sample, without illumination, only a very weak EPR signal could be detected almost two orders of magnitude weaker than in the “Philips” sample. However, after optical irradiation, two well-separated and strong EPR signals are observable at 275 GHz as shown in Fig. 5.2. The high-field signal with its peak at 9.8485 T is known from the literature [5.4] to originate from PCBM-. This EPR signal has a shape characteristic for a g-tensor with an almost axial symmetry as expected for the PCBM molecule. It
- 71 -
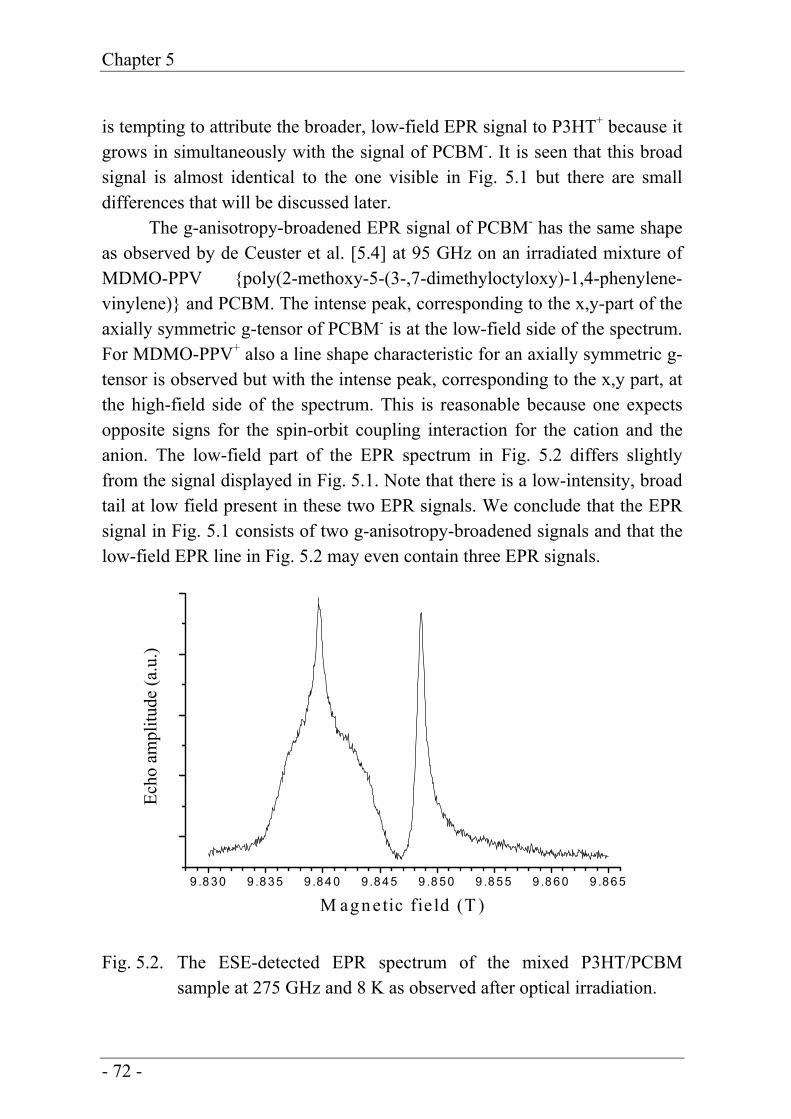
Chapter 5
is tempting to attribute the broader, low-field EPR signal to P3HT+ because it grows in simultaneously with the signal of PCBM-. It is seen that this broad signal is almost identical to the one visible in Fig. 5.1 but there are small differences that will be discussed later.
The g-anisotropy-broadened EPR signal of PCBM- has the same shape as observed by de Ceuster et al. [5.4] at 95 GHz on an irradiated mixture of MDMO-PPV poly(2-methoxy-5-(3-,7-dimethyloctyloxy)-1,4-phenylene-vinylene) and PCBM. The intense peak, corresponding to the x,y-part of the axially symmetric g-tensor of PCBM- is at the low-field side of the spectrum. For MDMO-PPV+ also a line shape characteristic for an axially symmetric g-tensor is observed but with the intense peak, corresponding to the x,y part, at the high-field side of the spectrum. This is reasonable because one expects opposite signs for the spin-orbit coupling interaction for the cation and the anion. The low-field part of the EPR spectrum in Fig. 5.2 differs slightly from the signal displayed in Fig. 5.1. Note that there is a low-intensity, broad tail at low field present in these two EPR signals. We conclude that the EPR signal in Fig. 5.1 consists of two g-anisotropy-broadened signals and that the low-field EPR line in Fig. 5.2 may even contain three EPR signals.
9 .8 30 9 .8 35 9 .8 4 0 9 .8 45 9 .8 50 9 .8 5 5 9 .8 6 0 9 .8 65
Echo
am
plitu
de (a
.u.)
M agnetic fie ld (T )
Fig. 5.2. The ESE-detected EPR spectrum of the mixed P3HT/PCBM sample at 275 GHz and 8 K as observed after optical irradiation.
- 72 -
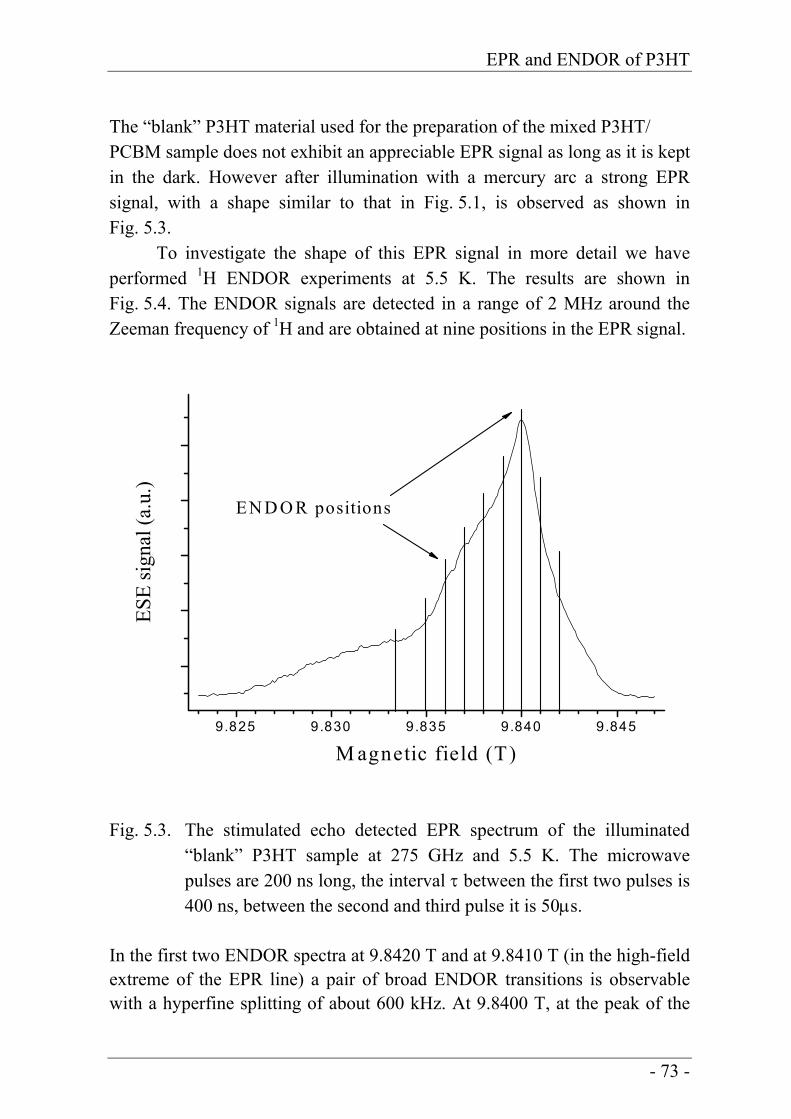
EPR and ENDOR of P3HT
The “blank” P3HT material used for the preparation of the mixed P3HT/ PCBM sample does not exhibit an appreciable EPR signal as long as it is kept in the dark. However after illumination with a mercury arc a strong EPR signal, with a shape similar to that in Fig. 5.1, is observed as shown in Fig. 5.3.
To investigate the shape of this EPR signal in more detail we have performed 1H ENDOR experiments at 5.5 K. The results are shown in Fig. 5.4. The ENDOR signals are detected in a range of 2 MHz around the Zeeman frequency of 1H and are obtained at nine positions in the EPR signal.
9.825 9.830 9.835 9.840 9.845
ESE
sign
al (a
.u.)
M agnetic field (T)
EN D O R positions
Fig. 5.3. The stimulated echo detected EPR spectrum of the illuminated “blank” P3HT sample at 275 GHz and 5.5 K. The microwave pulses are 200 ns long, the interval τ between the first two pulses is 400 ns, between the second and third pulse it is 50μs.
In the first two ENDOR spectra at 9.8420 T and at 9.8410 T (in the high-field extreme of the EPR line) a pair of broad ENDOR transitions is observable with a hyperfine splitting of about 600 kHz. At 9.8400 T, at the peak of the
- 73 -
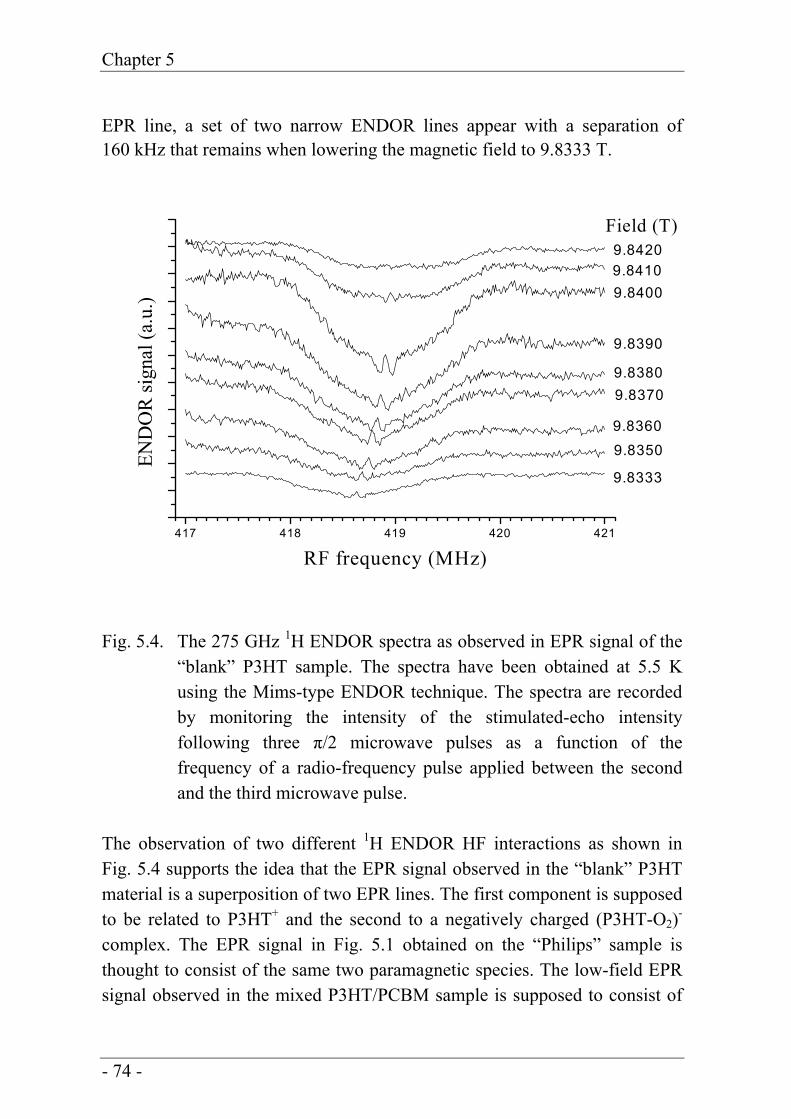
Chapter 5
EPR line, a set of two narrow ENDOR lines appear with a separation of 160 kHz that remains when lowering the magnetic field to 9.8333 T.
417 418 419 420 421
END
OR
sign
al (a
.u.)
RF frequency (MHz)
9.8333
9.8350
9.8360
9.83709.8380
9.8390
9.84009.84109.8420
Field (T)
Fig. 5.4. The 275 GHz 1H ENDOR spectra as observed in EPR signal of the “blank” P3HT sample. The spectra have been obtained at 5.5 K using the Mims-type ENDOR technique. The spectra are recorded by monitoring the intensity of the stimulated-echo intensity following three π/2 microwave pulses as a function of the frequency of a radio-frequency pulse applied between the second and the third microwave pulse.
The observation of two different 1H ENDOR HF interactions as shown in Fig. 5.4 supports the idea that the EPR signal observed in the “blank” P3HT material is a superposition of two EPR lines. The first component is supposed to be related to P3HT+ and the second to a negatively charged (P3HT-O2)- complex. The EPR signal in Fig. 5.1 obtained on the “Philips” sample is thought to consist of the same two paramagnetic species. The low-field EPR signal observed in the mixed P3HT/PCBM sample is supposed to consist of
- 74 -
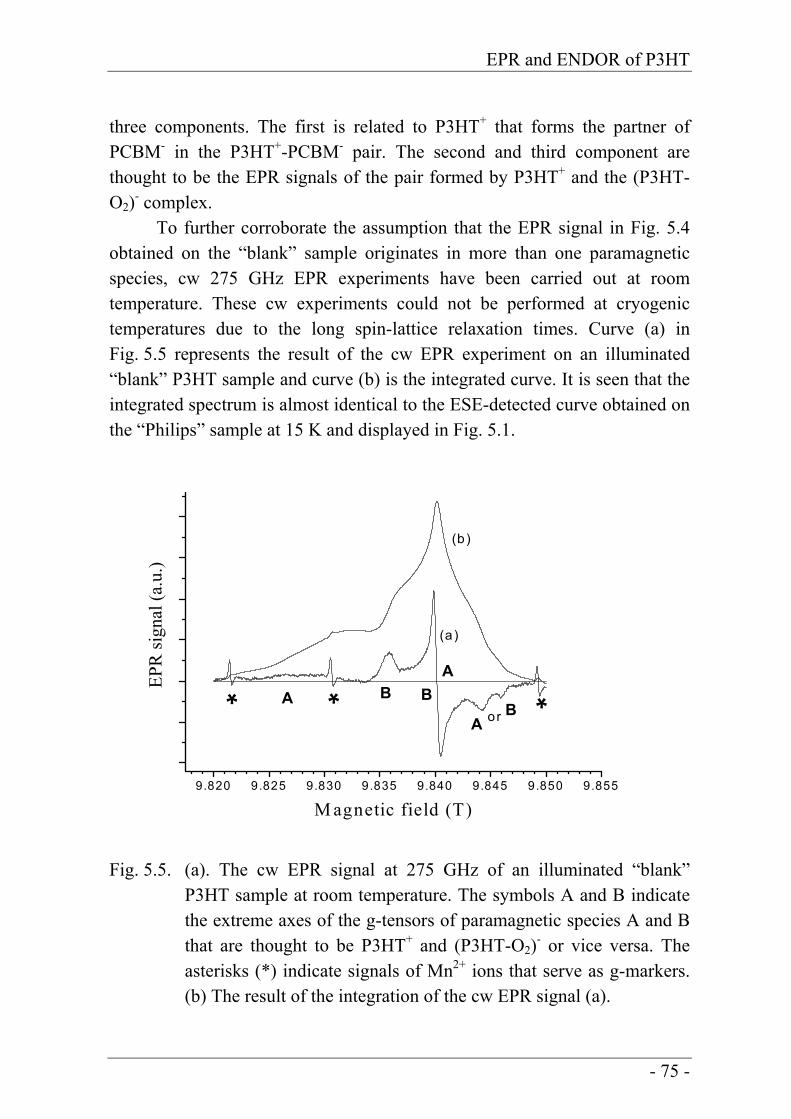
EPR and ENDOR of P3HT
three components. The first is related to P3HT+ that forms the partner of PCBM- in the P3HT+-PCBM- pair. The second and third component are thought to be the EPR signals of the pair formed by P3HT+ and the (P3HT-O2)- complex.
To further corroborate the assumption that the EPR signal in Fig. 5.4 obtained on the “blank” sample originates in more than one paramagnetic species, cw 275 GHz EPR experiments have been carried out at room temperature. These cw experiments could not be performed at cryogenic temperatures due to the long spin-lattice relaxation times. Curve (a) in Fig. 5.5 represents the result of the cw EPR experiment on an illuminated “blank” P3HT sample and curve (b) is the integrated curve. It is seen that the integrated spectrum is almost identical to the ESE-detected curve obtained on the “Philips” sample at 15 K and displayed in Fig. 5.1.
9.820 9.825 9.830 9.835 9.840 9.845 9.850 9.855
A
AB
BBA
***
(a)
(b)
EPR
sign
al (a
.u.)
M agnetic field (T)
or
Fig. 5.5. (a). The cw EPR signal at 275 GHz of an illuminated “blank” P3HT sample at room temperature. The symbols A and B indicate the extreme axes of the g-tensors of paramagnetic species A and B that are thought to be P3HT+ and (P3HT-O2)- or vice versa. The asterisks (*) indicate signals of Mn2+ ions that serve as g-markers. (b) The result of the integration of the cw EPR signal (a).
- 75 -
Chapter 5
From a comparison of curve (a) with the theoretical curve characteristic for a g-anisotropy broadened EPR line [5.5] it is concluded that it originates from at least two paramagnetic species A and B. In Fig. 5.5 the principal axes of these species A and B are indicated. Due to the extremely small difference in the g-tensors we have no means to attribute species A to P3HT+ and B to (P3HT-O2)- or vice versa. The “Philips” sample at room temperature exhibits a cw EPR spectrum that is almost identical to curve (a) in Fig. 5.5.
To check the influence of illumination and air the “blank” P3HT sample was subsequently subjected to several treatments at room temperature and the effect was monitored on the cw 275 GHz EPR signals. The results of these experiments are displayed in Fig. 5.6. First the sample was kept in the dark in a gaseous helium atmosphere and the EPR signal (a) was recorded. Then, still in the gaseous helium atmosphere, the sample was exposed to light from a Hg arc and an identical EPR signal was observed (b). Exposure to air without illumination did not affect the EPR signal (c). A considerable increase of the EPR signal was observed when exposing the sample to light and air (d). This signal did not change appreciably when subsequently keeping the sample in the dark (e). The experiments show that it is the combined effect of light and air (oxygen) that causes the generation of the paramagnetic species.
As shown in Fig. 5.1 the P3HT sample supplied by Philips, which has been exposed to air and ambient light during almost two years, exhibits a stable, strong EPR signal similar to the one observed in the illuminated, “blank” P3HT sample. However, the “blank” P3HT material exhibits no EPR signal as long as it is not exposed to light. Apparently, forced illumination or exposure to ambient light produces similar pairs of P3HT+ and (P3HT-O2)-. The stable character of the EPR signal in the “Philips“ sample may be explained by secondary reactions that stabilize the optically induced charge separation.
- 76 -
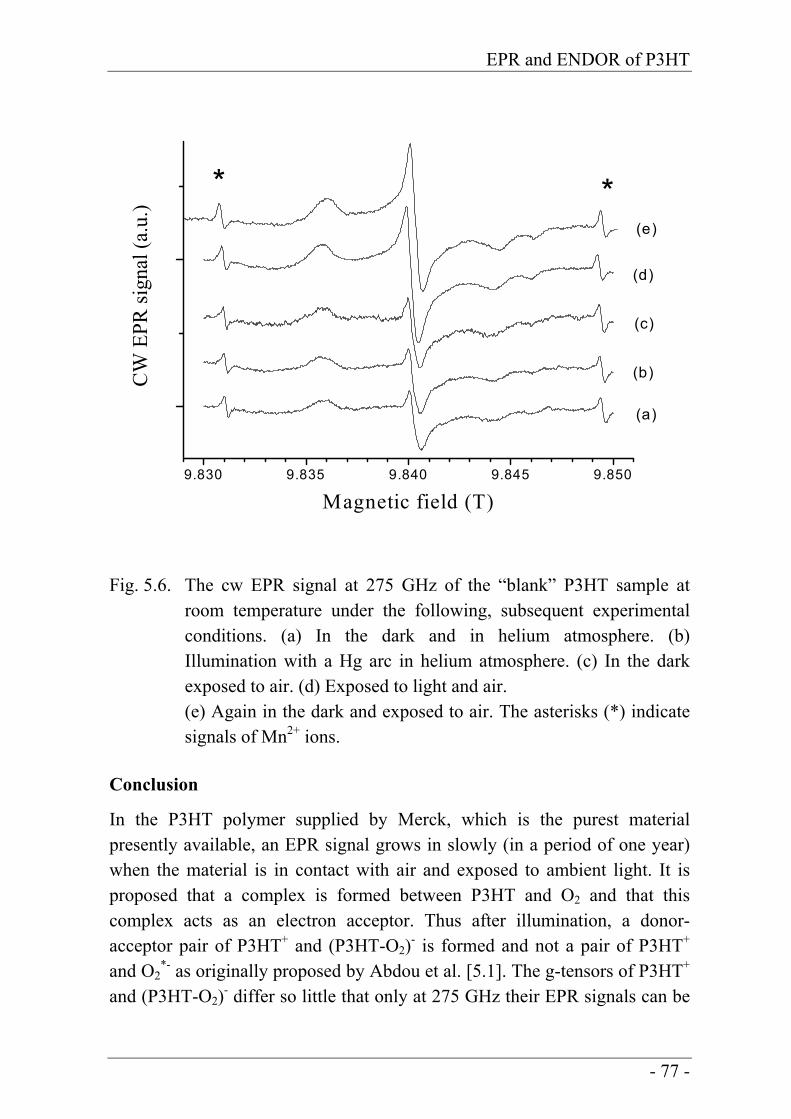
EPR and ENDOR of P3HT
9.830 9.835 9.840 9.845 9.850
CW
EPR
sign
al (a
.u.)
Magnetic field (T)
(a)
(b)
(c)
(d)
* *(e)
Fig. 5.6. The cw EPR signal at 275 GHz of the “blank” P3HT sample at room temperature under the following, subsequent experimental conditions. (a) In the dark and in helium atmosphere. (b) Illumination with a Hg arc in helium atmosphere. (c) In the dark exposed to air. (d) Exposed to light and air. (e) Again in the dark and exposed to air. The asterisks (*) indicate signals of Mn2+ ions.
Conclusion
In the P3HT polymer supplied by Merck, which is the purest material presently available, an EPR signal grows in slowly (in a period of one year) when the material is in contact with air and exposed to ambient light. It is proposed that a complex is formed between P3HT and O2 and that this complex acts as an electron acceptor. Thus after illumination, a donor-acceptor pair of P3HT+ and (P3HT-O2)- is formed and not a pair of P3HT+ and O2
*- as originally proposed by Abdou et al. [5.1]. The g-tensors of P3HT+ and (P3HT-O2)- differ so little that only at 275 GHz their EPR signals can be
- 77 -
Chapter 5
distinguished. In view of the purity of the Merck material we exclude that other impurities are involved in the formation of electron acceptor sites.
- 78 -
EPR and ENDOR of P3HT
References [5.1]. M.S.A. Abdou, F.P.Orfino, Y. Son and S. Holdcroft, Interaction of
Oxygen with Conjugated Polymers: Charge Transfer Complexes Formation with Poly(3-alkylthiophenes), J. Am. Chem. Soc. 119 (1997) 4518-4524.
[5.2]. H. Blok, J.A.J.M. Disselhorst, S.B. Orlinskii and J. Schmidt, A Continuous-wave and Pulsed Electron Spin Resonance Spectrometer Operating at 275 GHz, J. Magn. Reson. 166 (2004) 92-99.
[5.3]. H. Blok, J.A.J.M. Disselhorst, H. van der Meer, S.B. Orlinskii and J Schmidt, ENDOR Spectroscopy at 275 GHz, J. Magn. Reson. 173 (2005) 49-53.
[5.4]. J. de Ceuster, E. Goovaerts, A. Bouwen, J.C. Hummelen and V. Dyakonov, High-frequency (95 GHz) electron paramagnetic resonance study of the photo-induced charge transfer in conjugated polymer-fullerene composites, Phys. Rev. B 64 (2001) 195206.
[5.5]. J.E. Wertz and J.R. Bolton, Electron Spin Resonance: Elementary Theory and Practical Applications, (McGraw-Hill Book Company, New York, 1972) chapter 7.
- 79 -

Chapter 5
- 80 -
Samenvatting
In dit proefschrift wordt de constructie en het functioneren beschreven van een Elektron Paramagnetische Resonantie (EPR) spectrometer die werkt bij een frequentie van 275 GHz. Het benodigde magneetveld van 10 Tesla (100000 Gauss) wordt daarbij opgewekt door een supergeleidende magneet. EPR, ook wel ESR (Elektron Spin Resonantie) genoemd, maakt gebruik van het gegeven dat een elektron opgevat kan worden als een geladen deeltje dat tevens een klein magneetje is; het elektron heeft een “spin”. Bevinden zich een aantal elektronen in een baan rondom een kern dan heffen de magneetjes elkaar paarsgewijs op zodat geen netto magnetisch moment overblijft. Een ongepaard elektron echter kan ten opzichte van een magnetisch veld slechts twee richtingen aannemen, n.l. parallel of antiparallel. In een magnetisch veld hoort bij deze twee toestanden tevens een verschil in energie, overeenkomend met elektromagnetische straling (radiogolven of microgolven) van een bepaalde frequentie en de daarbij behorende golflengte.
EPR gebruikt nu deze ongepaarde elektronen als sensoren om inzicht te krijgen in de structuur van een grote variatie van moleculen en kristallen. Dit gebeurt door microgolfenergie aan het materiaal toe te voeren met een frequentie die “past” bij het energieverschil tussen de twee elektronen-toestanden in een magneetveld. Is de microgolffrequentie exact gelijk aan die horend bij dit energieverschil dan treedt resonantie op waarbij energie wordt geabsorbeerd. Deze absorptie wordt waargenomen als een vermindering van de intensiteit van het ingestraalde elektromagnetische veld. Het is ook mogelijk de microgolfenergie gepulst toe te voeren; de bij resonantie geab-sorbeerde energie produceert dan een pulsvormig echosignaal. De resonanties zijn zeer scherp en hun gedrag wordt mede bepaald door de moleculaire structuur in de omgeving van de elektronen. Het observeren van een zo gedetailleerd mogelijk spectrum is daarom gewenst. Voor een groot deel hangt de mogelijkheid om details te onderscheiden, de resolutie, samen met de gebruikte microgolffrequentie en het daarbij behorende magneetveld. De in dit proefschrift gepresenteerde spectrometer gebruikt een vaste frequentie van 275.7 Hz en een daarop afgestemde trilholte waarin zich het te onder-zoeken materiaal bevindt.
- 81 -
Samenvatting
Het verschijnsel van Elektron Paramagnetische Resonantie is voor het eerst waargenomen in 1944 door Zavoisky in Kazan in Rusland. Na de ont-dekking heeft de EPR spectroscopie een snelle ontwikkeling doorgemaakt. Dit was vooral te danken aan het beschikbaar zijn van microgolfbronnen en componenten die tijdens de oorlog waren ontwikkeld. In de magneetvelden van 3000 tot 4000 Gauss (0.3 - 0.4 Tesla), die door elektromagneten konden worden opgewekt, valt de resonantiefrequentie in de zogenaamde microgolf X-band (tussen 8.2 GHz en 12.4 GHz corresponderend met een golflengte van ongeveer 3 cm). De eerste EPR spectra werden waargenomen aan metaalionen in kristallen en de eerste spectra van organische vrije radicalen in 1952, waardoor niet alleen fysici maar ook chemici geïnteresseerd raakten in de EPR spectroscopie. Vanaf dat moment groeide de belangstelling aan-zienlijk, vooral toen vanaf 1960 ook commerciële EPR spectrometers beschikbaar kwamen.
Tegenwoordig vindt men toepassingen van EPR spectroscopie niet alleen in de fysica en de chemie maar ook in de biologie en in de medische wetenschappen. Hierbij is ook van belang dat indien in een materiaal geen ongepaarde elektronen aanwezig zijn, het op diverse manieren mogelijk is deze te introduceren. Zo kunnen bijvoorbeeld door speciale synthese-methoden in eiwitten op bepaalde posities kleine atoomgroepen die een ongepaard elektron bevatten, zogenoemde “spin labels”, worden geplaatst. Het EPR spectrum kan dan inzicht geven in de processen waarbij dat eiwit is betrokken. Een andere manier is om door bestraling met - meestal ultraviolet - licht ongepaarde elektronen in een materiaal te creëren en deze als sensoren daarin te gebruiken.
De meeste EPR experimenten uit de jaren 1945 tot 1985 werden uitge-voerd bij 9 GHz, hoewel ook spectrometers werden ontwikkeld bij 25 GHz en 35 GHz. Het voordeel van deze hogere frequenties is dat verschillende paramagnetische ionen beter gescheiden kunnen worden waargenomen (het zogenaamde oplossend vermogen neemt toe) en bovendien wordt een hogere gevoeligheid bereikt. EPR spectroscopie bij nog hogere frequenties was in die jaren nog niet mogelijk door het ontbreken van de benodigde micro-golfbronnen en andere microgolfcomponenten en doordat de bestaande elektromagneten geen hogere magneetvelden konden produceren dan ongeveer 1.5 Tesla.
- 82 -
Samenvatting
In 1983 verscheen een opmerkelijk artikel van de onderzoeksgroep van Lebedev in Moskou. In deze publicatie werd een EPR spectrometer beschreven die werkte bij de verbazend hoge frequentie van 140 GHz (golf-lengte 2 mm) en met een supergeleidende magneet die een magneetveld opwekte van 5.2 Tesla. De resultaten die in deze publicatie werden getoond waren ook indrukwekkend. Het oplossend vermogen van deze spectrometer was zo hoog dat in preparaten, waarin paramagnetische radicalen waren opgenomen in een lukrake oriëntatie, de anisotropie van de ruimtelijke verdeling zichtbaar was in de verbreding van het EPR spectrum. Deze waar-neming opende de mogelijkheid om paramagnetische moleculen met een goed bepaalde oriëntatie te selecteren in een lukraak verdeelde verzameling van moleculen.
De resultaten behaald door Lebedev en zijn medewerkers stimuleerden verschillende onderzoeksgroepen in de wereld om dit soort hoogfrequente EPR spectrometers te ontwikkelen. Aan de Freie Universität Berlin begon de groep van Möbius aan de constructie van een EPR spectrometer bij een microgolffrequentie van 95 GHz (golflengte 3 mm) terwijl aan Cornell University in de USA Freed begon aan een nog uitdagender project bij 250 GHz (golflengte 1.2 mm). In 1986 werd in Leiden in de groep van Schmidt begonnen met de bouw van een EPR spectrometer bij 95 GHz. Het bijzondere van dit instrument was dat het paramagnetisch preparaat aan korte microgolfpulsen werd onderworpen waardoor het mogelijk was ook de responstijden van paramagnetische preparaten te onderzoeken.
De belangrijkste producent van EPR spectrometers in de wereld, de firma Bruker Biospin in Duitsland, was zo onder de indruk van de behaalde resultaten dat men besloot een commerciële 95 GHz EPR spectrometer in productie te nemen die in 1998 op de markt kwam. Het door deze firma ont-wikkelde systeem maakte het voor onderzoeksgroepen over de hele wereld mogelijk EPR spectroscopisch onderzoek uit te voeren bij deze hoge frequentie en de wetenschappelijke activiteiten op dit gebied zijn sinds die jaren dan ook aanzienlijk gestegen.
Hoogfrequente EPR spectroscopie begon in die periode ook de aandacht te trekken van onderzoekers verbonden aan laboratoria gespeciali-seerd in het opwekken van heel sterke magneetvelden. In Frankrijk, in de USA en in Nijmegen in Nederland werden EPR systemen gebouwd met frequenties tot 600 GHz waarbij gebruik werd gemaakt van de exceptioneel
- 83 -
Samenvatting
hoge magneetvelden die in deze gespecialiseerde instituten konden worden opgewekt. Daarnaast werd in het Verenigd Koninkrijk een nationaal EPR instituut opgericht waarin EPR spectrometers werden ontwikkeld tussen 95 GHz en 270 GHz. De gedachte achter deze activiteiten was om nationale centra te creëren en daardoor onderzoeksgroepen aan universiteiten die on-voldoende financiële of technische ondersteuning hebben toegang te bieden tot deze nieuwe vorm van spectroscopie. Het nadeel van deze centra is dat in het algemeen slechts enkele dagen beschikbaar zijn voor het uitvoeren van experimenten. Bovendien is de gevoeligheid van veel van deze EPR spectro-meters beperkt en kunnen met geen van deze spectrometers zogenaamde ENDOR (Electron Nuclear Double Resonance) experimenten worden uit-gevoerd. ENDOR maakt gebruik van het verschijnsel dat ook atoomkernen een magnetisch moment kunnen hebben en in een magneetveld in resonantie kunnen worden gebracht, dit wordt kernspinresonantie genoemd, ook wel Nuclear Magnetic Resonance (NMR). Deze resonanties treden bij een zelfde magneetveld echter op bij veel lagere frequenties. Om in een EPR spectro-meter gedetailleerder de interactie van het elektron met de kernen in de omgeving te onderzoeken wordt nu z.g. dubbelresonantie gebruikt. In dit geval wordt het elektron in resonantie gebracht en tegelijkertijd wordt het materiaal onderworpen aan radiofrequente straling. Heeft het resonerende elektron een wisselwerking met een kern, dan kan dit worden waargenomen indien deze kern eveneens in resonantie wordt gebracht, vandaar “dubbel-resonantie”. Deze techniek is essentieel om de elektronische en geometrische structuur van paramagnetische centra te bepalen.
In 1998 ontstond in de groep van Schmidt in Leiden het idee om een EPR spectrometer te construeren bij de hoogst mogelijke frequentie gegeven de maximale veldsterkte van commercieel beschikbare supergeleidende magneten. Het doel was een spectrometer te bouwen die met continue zowel als met gepulste microgolfbronnen zou kunnen werken, die ENDOR experi-menten mogelijk zou maken en zou kunnen worden opgesteld in elk fysisch of chemisch laboratorium. Gezien de maximale veldsterkten van de beschik-bare magneten (en de prijs!) werd besloten een EPR spectrometer te bouwen bij 275 GHz, gebruik makend van een supergeleidende magneet met een maximum veld van 14 Tesla. Het temperatuurbereik zou moeten liggen tussen 5 K en 300 K (kamertemperatuur) en het besluit viel om de resonator-ruimte zo klein te laten zijn dat er een halve golflengte in zou moeten passen.
- 84 -
Samenvatting
Het grote voordeel hiervan is dat een heel sterk hoogfrequent veld kan worden opgewekt, zelfs bij een beperkt microgolfvermogen, en dat heel kleine preparaten met afmetingen van ongeveer 0.1 mm zouden kunnen worden bestudeerd.
In dit proefschrift wordt de constructie van de 275 GHz EPR spectro-meter beschreven zoals die door mij is ontworpen. Naast EPR spectroscopie met continue en met gepulste microgolfvelden kunnen ook ENDOR experi-menten worden uitgevoerd. De mogelijkheden van dit instrument worden geïllustreerd met verschillende voorbeelden. Een van de belangrijke con-clusies van dit proefschrift is dat EPR en ENDOR experimenten bij 275 GHz routinematig kunnen worden uitgevoerd zonder dat het nodig is uit te wijken naar laboratoria uitgerust met speciaal ontwikkelde, kostbare hoogmagneet-veld installaties.
In hoofdstuk 2 van dit proefschrift wordt de opbouw van de EPR spectrometer beschreven en enkele EPR spectra worden gepresenteerd die de prestaties van het instrument demonstreren. De bereikte hogere resolutie wordt geïllustreerd; tevens blijkt het mogelijk ook bij deze frequentie EPR-waarnemingen te verrichten aan spinsystemen in water bij kamertemperatuur, de ”natuurlijke” omgeving van biologische systemen. In de twee appendices van dit hoofdstuk wordt nader ingegaan op belangrijke onderdelen van het hele systeem. Zo worden in appendix A de principes besproken van de zoge-naamde quasi-optische techniek die wordt gebruikt voor de voortplanting van de microgolven bij 275 GHz. In appendix B worden een aantal andere tech-nische aspecten van de spectrometer besproken. In hoofdstuk 3 worden de eerste ENDOR resultaten gepresenteerd en wordt de speciale trilholte be-schreven die is ontwikkeld voor de ENDOR experimenten. In deze trilholte wordt het materiaal onderworpen aan zowel de microgolven van 275 GHz als radiofrequente straling met frequenties tussen 10 MHz en 420 MHz. Met name de stabiliteit van de gepulste manier van werken en het grote bereik van de radiofrequenties dat daarbij kan worden bestreken is opmerkelijk. De hoofdstukken 2 en 3 zijn bijna identiek aan twee publicaties in het tijdschrift “Journal of Magnetic Resonance”. Hoofdstuk 4 is gebaseerd op een publi-catie in het tijdschrift “Physical Review Letters” en beschrijft EPR experi-menten bij 275 GHz aan paramagnetische donor centra in ZnO waarbij polarisatie van de kernspins van 67Zn kernen is waargenomen. Het blijkt dat de spintoestand van elektronen bij deze hoge velden (en bij lage tempe-
- 85 -
Samenvatting
raturen) op de kernen kan worden overgedragen, waardoor deze gezamenlijk ter plaatse van de elektronen een extra magnetisch veld creëren. Dit extra veld zorgt voor een zeer duidelijk waarneembare verschuiving van de EPR resonantie. Tenslotte worden in hoofdstuk 5 EPR en ENDOR resultaten bij 275 GHz getoond aan paramagnetische centra in een organische halfgeleider, poly(3-hexyl-thiophene) ook wel afgekort tot P3HT. Dit materiaal speelt een rol bij de fabricage van halfgeleidercomponenten en het doel van dit onder-zoek was om na te gaan of EPR en ENDOR experimenten bij deze hoge frequentie uitsluitsel kunnen geven over de oorzaak van het verslechteren van de halfgeleider-eigenschappen van P3HT bij blootstelling aan licht en lucht.
- 86 -

List of publications
H. Blok, J.A. Kooter and J. Schmidt, Hyperfine and Quadrupole Coupling Constants of Deuterium Nuclei in the Phosphorescent Triplet States of Quinoline and Quinoxaline. Chem. Phys. Letters 30 (1975) 160-164.
H. Blok, J.A.J.M. Disselhorst, S.B. Orlinskii, J. Schmidt and P.G. Baranov, A new step in high-frequency EPR of defects in semiconductors, Physica B 340-342 (2003) 1147-1150.
H. Blok, J.A.J.M. Disselhorst, S.B. Orlinskii and J. Schmidt, A Continuous-wave and Pulsed Electron Spin Resonance Spectrometer Operating at 275 GHz, J. Magn. Reson. 166 (2004) 92-99.
H. Blok, S.B. Orlinskii, J. Schmidt and P.G. Baranov, Overhauser Effect of 67Zn Nuclear Spins in ZnO via Cross Relaxation Induced by the Zero-Point Fluctuations of the Phonon Field, Phys. Rev. Letters 92 (2004) 047602.
H. Blok, J.A.J.M. Disselhorst, H. van der Meer, S.B. Orlinskii and J. Schmidt, ENDOR Spectroscopy at 275 GHz, J. Magn. Reson. 173 (2005) 49-53.
H. Blok, J.A.J.M. Disselhorst, H. van der Meer, S.B. Orlinskii and J. Schmidt, CW and Pulsed EPR and ENDOR Spectroscopy at 275 GHz, Bruker Spin Report 156 (2004).
S.B. Orlinskii, H. Blok, E.J.J. Groenen, J. Schmidt, P.G. Baranov, C. de Mello Donega and A. Meijerink, High–frequency EPR and ENDOR spectroscopy on semiconductor nanocrystals, Magn. Reson. Chem. 43, 140-144 (2005).
M.G. Finiguerra, H. Blok, M. Ubbink and M. Huber, High field (275 GHz) spin-label EPR for high-resolution polarity determination in proteins, J. Magn. Reson. 180, 197-202 (2006).
S.B. Orlinskii, H. Blok, J. Schmidt, P.G. Baranov, C. de Mello Donega and A. Meijerink, Donor-acceptor pairs in the confined structure of ZnO nanocrystals, Phys. Rev. B 74, 045204 (2006)
- 87 -
Publications
- 88 -
Curriculum vitae
van Huib Blok, geboren te Leiden op 16 juli 1937. Na het behalen van het diploma HBS-B aan het Christelijk Lyceum in Leiden in 1955 volgde ik de studie Elektrotechniek aan de Hogere Technische School (HTS) in Haarlem, die ik in 1958 met het diploma afsloot. De eerste ervaringen met microgolven deed ik in die periode op tijdens een stage bij het Nederlands Radar Proefstation in Noordwijk aan Zee. Mijn dienstplicht werd daarna vervuld als Reserve Officier bij de Koninklijke Marine (KM), voor het grootste deel bij het Laboratorium Elektronische Ontwikkelingen voor de Krijgsmacht (LEOK) in Oegstgeest, en wel met de ontwikkeling van detectie-systemen voor akoestische signalen onder water. Als burgerambtenaar bij het ministerie van Defensie ontwikkelde en beproefde ik vervolgens apparatuur voor onderzeeboten. Dit betrof zowel passieve sonarsystemen als een simu-lator voor een detector van radarsignalen. Toen in 1965 de KM haar eerste panoramische actieve sonar aanschafte werd ik belast met de ontwikkeling van een trainer-simulator voor de opleiding van bedienaars van de sonar en voor het toetsen van de wijze van inzet van de sonar door onderzeeboot-bestrijdings-officieren.
In 1967 droeg ik de ontwikkeling over omdat ik in de gelegenheid werd gesteld Natuurkunde te studeren aan de Leidse Universiteit. Het prak-tische deel van de studie verrichtte ik in de groep van professor J. H. van der Waals. In die periode bouwde ik een EPR spectrometer die werkte bij een frequentie van 24 GHz. Het systeem is later uitgebreid met ENDOR moge-lijkheden en in gebruik gebleven totdat een spectrometer bij 95 GHz in de groep werd gerealiseerd.
Na afsluiting van mijn studie in 1971, teruggekeerd bij het LEOK, werd de analyse van uitgestraald geluid van bovenwaterschepen en onder-zeeboten mijn belangrijkste aandachtsgebied. In nauwe samenwerking met de Onderzeedienst en de “Long Range Maritime Patrol” vliegtuigen van de KM ontwikkelde en evalueerde ik onderzeeboot-apparatuur voor detectie en clas-sificatie van geruis uitstralende doelen. De samenwerking leidde tot de vorming van het Geruisanalysecentrum (GAC) van de Koninklijke Marine
- 89 -
Curriculum vitae
dat analyses uitvoerde van door schepen uitgestraald geluid, de classificatie van doelen ondersteunde en adviseerde m.b.t. geruisveiligheid van de schepen van de KM. Ik was, naast mijn functie bij het LEOK, weten-schappelijk onderhoofd van dit centrum dat tot 1985 op het terrein van het LEOK was gevestigd. Het centrum verrichtte daarna de operationele onder-steuning van passieve onderwaterdetectie vanaf het Marine Vliegkamp Valkenburg.
De aanschaf van een gesleept passief sonarsysteem voor bovenwater-schepen door de KM leidde tot een uitgebreide evaluatie van de inzet; geavanceerde registratie- en analyse-apparatuur werd daarvoor op het LEOK ontwikkeld. Dit project legde tevens de grondslag voor het uitrusten van nieuwe onderzeeboten met een vergelijkbaar systeem. Toen in 1985 het LEOK fuseerde met het toenmalige Physisch Laboratorium TNO en naar de Waalsdorpervlakte verhuisde werd ik belast met de TNO-inbreng in de evaluatie van deze Walrus-klasse onderzeeboten als totaal wapen- en sensor-systeem. In dit project werd daarvoor onder meer een gedetailleerd simulatie-model ontwikkeld.
In een NATO-samenwerkingsproject op het gebied van radar is destijds door een consortium van een vijftal radarproducenten een radar ont-wikkeld die bestand diende te zijn tegen z.g. Anti Radiation Missiles (ARM’s). Voor de evaluatie van de effectiviteit van de gebruikte technieken, die in Nederland werd verricht, is onder mijn leiding op het FEL-TNO (de nieuwe naam van het gefuseerde laboratorium) een uitgebreid registratie-systeem ontwikkeld. Tevens werd de infrastructuur gerealiseerd op Vlieg-basis De Peel, waar de evaluatie in samenwerking met de Koninklijke Lucht-macht werd uitgevoerd.
Door heroriëntatie en reorganisatie van de Defensieresearch kwam in 1995 ook mijn functie te vervallen. In vervolg op een toevallig contact heeft professor Schmidt mij toen voorgesteld de realisering van een EPR spectro-meter bij ca. 300 GHz ter hand te nemen, wat ik met graagte heb gedaan. Na de projectdefinitie is dit project in fasen gerealiseerd, eerst werd een systeem gebouwd voor EPR bij kamertemperatuur met een tweetal versies van de “probehead”, gevolgd door de implementatie van het werken bij lage tempe-ratuur in een flow-cryostaat en daarna de uitbreiding met de radiofrequente excitatie ten behoeve ENDOR.
- 90 -
Nawoord
De realisatie van de in dit proefschrift behandelde spectrometer is een proces geweest waaraan velen een essentiële bijdrage hebben geleverd. De MoNOS groep (eerder MAT) als geheel schept door haar enthousiasme voor het aan-pakken van nieuwe onderwerpen een omgeving waarin “het onmogelijke mogelijk wordt” en waarin “wonderen iets meer tijd vergen”. In dit kader noem ik allereerst de bijdrage van Jos Disselhorst met zijn gecombineerde kennis en kunde op zowel microgolf- als fijn-mechanisch gebied. Zijn “tips en trucs” verdienen terecht een medaille. Daarnaast realiseerde Harmen van der Meer op zijn eigen rustige wijze de benodigde nauwkeurige fijn-mechanische elementen. Ook de Electronische Afdeling met o.a. Arno van Amersfoort, Leendert Prevo en Bert Crama stonden altijd klaar voor het oplossen van problemen.
Veel heb ik te danken aan onze buitenlandse medewerkers. In this respect Sergei Orlinskii with his profound insight in the physics of EPR provided crucial support during measurements with the system and Pavel Baranov with his encyclopedic knowledge of solid state physics was always prepared to discuss the observations. The software package used to control the system was developed and tailored to our requirements by Jens Toerring. Giuseppe Annino provided an improved model of the cavity and his calculations initiated the aqueous tests at room temperature and Martina Huber prepared the samples for these tests.
Het gebruik van de z.g. pseudo-optiek was ook voor mij een nieuw terrein. The discussions with Richard Wylde and Graham Smith, whose set-up in St. Andrews (UK) we could use to test our first cavity construction, were very stimulating.
I also thank Dr. Detlev. M. Hofmann for supplying the ZnO samples on which we observed the Dynamic Nuclear Polarization (DNP). Ik denk bij DNP tevens met genoegen terug aan de discussies met professor W.Th. Wenckebach over onze waarnemingen van dit effect. Ik bedank ook professor R.A.J. Janssen (Technische Universiteit Eindhoven) en Dr. D.M. de Leeuw (Philips Research), die met hun suggesties en door het verschaffen van samples het onderzoek aan P3HT hebben gestimuleerd.
- 91 -
Nawoord
Niet alleen het laboratorium maar ook het “thuisfront” heeft een onmisbare bijdrage geleverd aan de totstandkoming van dit proefschrift. De motivatie door de kinderen en hun “aanhang” had ik van tijd tot tijd echt nodig. Als basis van dit thuisfront speelt echter Ria, al meer dan 50 jaar mijn steun, toeverlaat en “multifunctionele” de niet in woorden uit te drukken belangrijkste rol. Dus toch maar: “Bedankt Schat”.
- 92 -