Electrolux Interim Report Q2 2016 - Report
24
Interim Report January - June 2016 Stockholm, July 20, 2016 Highlights of the second quarter of 2016 • Net sales amounted to SEK 29,983m (31,355). • Organic sales declined by -0.9%, acquired growth was 0.1% and currency translation had a negative impact of -3.6% on net sales. • Improved results across most business areas. • Four of six business areas achieved an operating margin above 6%. • Operating income increased to SEK 1,564m (921), corresponding to a margin of 5.2% (2.9). • Strong operating cash flow after investments of SEK 4.1bn (2.9). • Income for the period was SEK 1,079m (608), and earnings per share was SEK 3.75 (2.12). Financial overview SEKm Q2 2016 Q2 2015 Change, % First half 2016 First half 2015 Change, % Net sales 29,983 31,355 -4 58,097 60,442 -4 Organic growth, % -0.9 7.0 0.3 3.2 Acquired growth, % 0.1 0.1 0.1 0.1 Changes in exchange rates, % -3.6 12.0 -4.3 13.0 Operating income 1,564 921 70 2,832 1,437 97 Margin, % 5.2 2.9 4.9 2.4 Income after financial items 1,448 815 78 2,611 1,265 106 Income for the period 1,079 608 77 1,954 947 106 Earnings per share, SEK 1) 3.75 2.12 6.80 3.30 Operating cash flow after investments 4,141 2,993 38 3,561 2,402 48 Return on net assets, % — — 25.7 10.8 1) Basic based on an average of 287.4 (287.4) million shares for the second quarter and 287.4 (286.9) million shares for the first half of 2016, excluding shares held by Electrolux. For definitions see page 23. About Electrolux Electrolux is a global leader in household appliances and appliances for professional use, selling more than 50 million products to customers in more than 150 markets every year. The company makes thoughtfully designed, innovative solutions based on extensive consumer research, meeting the desires of today’s consumers and professionals. Electrolux products include refrigerators, dishwashers, washing machines, cookers, air-conditioners and small appliances such as vacuum cleaners, all sold under esteemed brands like Electrolux, AEG, Zanussi and Frigidaire. In 2015, Electrolux had sales of SEK 124 billion and about 58,000 employees. For more information, go to www.electroluxgroup.com AB Electrolux (publ) 556009-4178
-
Upload
electrolux-group -
Category
Investor Relations
-
view
216 -
download
5
Transcript of Electrolux Interim Report Q2 2016 - Report
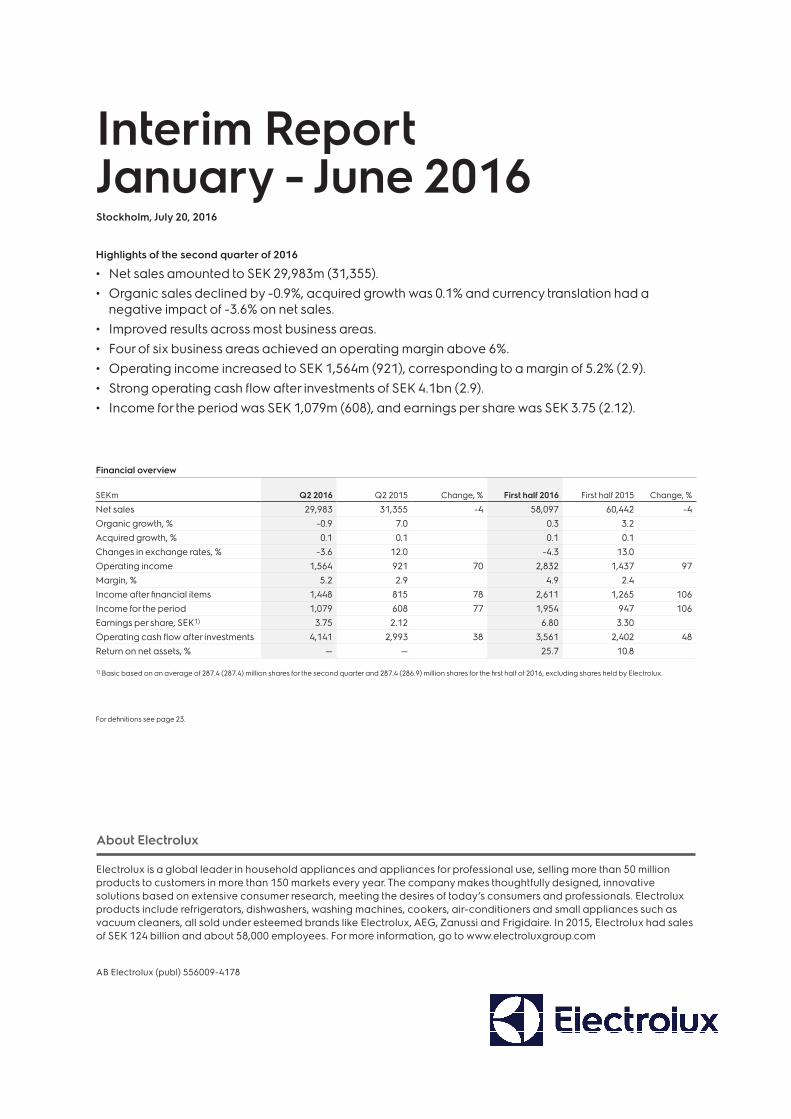
Interim Report January - June 2016Stockholm, July 20, 2016
Highlights of the second quarter of 2016
• Net sales amounted to SEK 29,983m (31,355). • Organic sales declined by -0.9%, acquired growth was 0.1% and currency translation had a
negative impact of -3.6% on net sales. • Improved results across most business areas. • Four of six business areas achieved an operating margin above 6%. • Operating income increased to SEK 1,564m (921), corresponding to a margin of 5.2% (2.9). • Strong operating cash flow after investments of SEK 4.1bn (2.9). • Income for the period was SEK 1,079m (608), and earnings per share was SEK 3.75 (2.12).
Financial overview
SEKm Q2 2016 Q2 2015 Change, % First half 2016 First half 2015 Change, %
Net sales 29,983 31,355 -4 58,097 60,442 -4Organic growth, % -0.9 7.0 0.3 3.2Acquired growth, % 0.1 0.1 0.1 0.1Changes in exchange rates, % -3.6 12.0 -4.3 13.0Operating income 1,564 921 70 2,832 1,437 97Margin, % 5.2 2.9 4.9 2.4Income after financial items 1,448 815 78 2,611 1,265 106Income for the period 1,079 608 77 1,954 947 106Earnings per share, SEK1) 3.75 2.12 6.80 3.30Operating cash flow after investments 4,141 2,993 38 3,561 2,402 48Return on net assets, % — — 25.7 10.8
1) Basic based on an average of 287.4 (287.4) million shares for the second quarter and 287.4 (286.9) million shares for the first half of 2016, excluding shares held by Electrolux.
For definitions see page 23.
About Electrolux
Electrolux is a global leader in household appliances and appliances for professional use, selling more than 50 million products to customers in more than 150 markets every year. The company makes thoughtfully designed, innovative solutions based on extensive consumer research, meeting the desires of today’s consumers and professionals. Electrolux products include refrigerators, dishwashers, washing machines, cookers, air-conditioners and small appliances such as vacuum cleaners, all sold under esteemed brands like Electrolux, AEG, Zanussi and Frigidaire. In 2015, Electrolux had sales of SEK 124 billion and about 58,000 employees. For more information, go to www.electroluxgroup.com
AB Electrolux (publ) 556009-4178
2AB ELECTROLUX INTERIM REPORT JANUARY-JUNE 2016
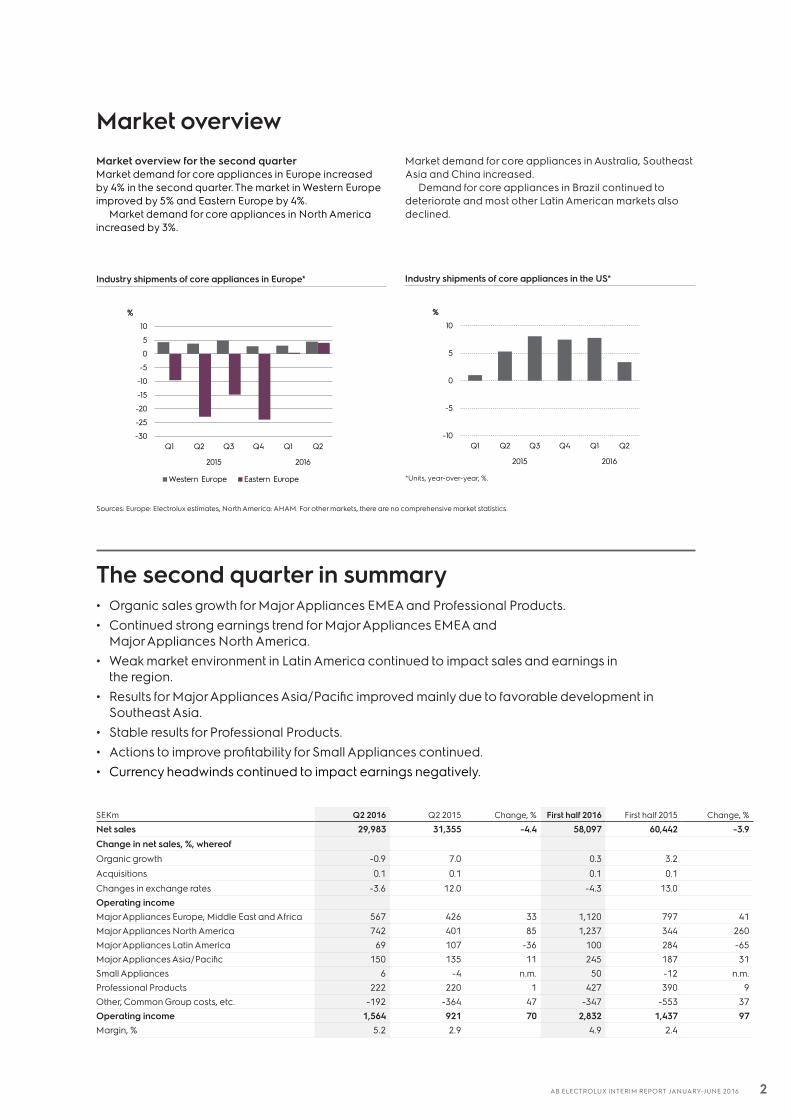
Market overviewMarket overview for the second quarterMarket demand for core appliances in Europe increased by 4% in the second quarter. The market in Western Europe improved by 5% and Eastern Europe by 4%.
Market demand for core appliances in North America increased by 3%.
Market demand for core appliances in Australia, Southeast Asia and China increased.
Demand for core appliances in Brazil continued to deteriorate and most other Latin American markets also declined.
The second quarter in summary• Organic sales growth for Major Appliances EMEA and Professional Products. • Continued strong earnings trend for Major Appliances EMEA and
Major Appliances North America.• Weak market environment in Latin America continued to impact sales and earnings in
the region.• Results for Major Appliances Asia/Pacific improved mainly due to favorable development in
Southeast Asia.• Stable results for Professional Products.• Actions to improve profitability for Small Appliances continued.• Currency headwinds continued to impact earnings negatively.
SEKm Q2 2016 Q2 2015 Change, % First half 2016 First half 2015 Change, %
Net sales 29,983 31,355 -4.4 58,097 60,442 -3.9Change in net sales, %, whereof Organic growth -0.9 7.0 0.3 3.2Acquisitions 0.1 0.1 0.1 0.1Changes in exchange rates -3.6 12.0 -4.3 13.0Operating incomeMajor Appliances Europe, Middle East and Africa 567 426 33 1,120 797 41Major Appliances North America 742 401 85 1,237 344 260Major Appliances Latin America 69 107 -36 100 284 -65Major Appliances Asia/Pacific 150 135 11 245 187 31Small Appliances 6 -4 n.m. 50 -12 n.m.Professional Products 222 220 1 427 390 9Other, Common Group costs, etc. -192 -364 47 -347 -553 37Operating income 1,564 921 70 2,832 1,437 97Margin, % 5.2 2.9 4.9 2.4
Industry shipments of core appliances in Europe* Industry shipments of core appliances in the US*
*Units, year-over-year, %.
Sources: Europe: Electrolux estimates, North America: AHAM. For other markets, there are no comprehensive market statistics.
-30
-25
-20
-15
-10
-5
0
5
10
Q1 Q2 Q3 Q4 Q1 Q2
2015 2016
%
Western Europe Eastern Europe
-10
-5
0
5
10
Q1 Q2 Q3 Q4 Q1 Q2
2015 2016
%
3AB ELECTROLUX INTERIM REPORT JANUARY-JUNE 2016
Net sales for the Electrolux Group decreased by 4.4% in the second quarter of 2016. Organic sales declined by 0.9%, acquisitions had a positive impact on sales of 0.1% and currency translation had a negative impact of 3.6%. Major Appliances EMEA and Professional Products re-ported organic sales growth. Sales for Major Appliances North America were impacted by lower sales of products under private labels. Weak markets continued to impact sales for Major Appliances Latin America. Sales for Major Appliances Asia/Pacific declined as a result of reposition-ing and reduced sales activities in China. Sales for Small Appliances also declined mainly as a result of measures to reposition operations and exiting from unprofitable prod-uct categories.
Operating income increased to SEK 1,564m (921), cor-responding to a margin of 5.2% (2.9).
Operating income for Major Appliances EMEA con-tinued to improve. Increased sales volumes, higher cost efficiency and product-mix improvements contributed to the positive earnings trend.
Operating income for Major Appliances North America improved year-over-year, mainly as a result of increased cost efficiency, higher sales volumes and an improved product mix.
Continued weak markets had a negative impact on earnings in Latin America.
Operating income for Major Appliances Asia/Pacific improved primarily due to positive development in South-east Asia.
Operating income for Small Appliances improved. Ac-tivities to restore profitability are in progress.
Professional Products continued to report a stable earn-ings trend.
Effects of changes in exchange ratesChanges in exchange rates had a negative impact of SEK 478m on operating income year-over-year. The impact of transaction effects was SEK -425m. The negative impact refers mainly to a stronger US dollar against several cur-rencies primarily in Latin America but also to currencies in Europe and the Middle East and Africa, compared with the same period of the previous year. This was partly mitigated by price/mix increases. Translation effects in the quarter amounted to SEK -53m.
Financial netNet financial items for the second quarter amounted to SEK -116m (–106).
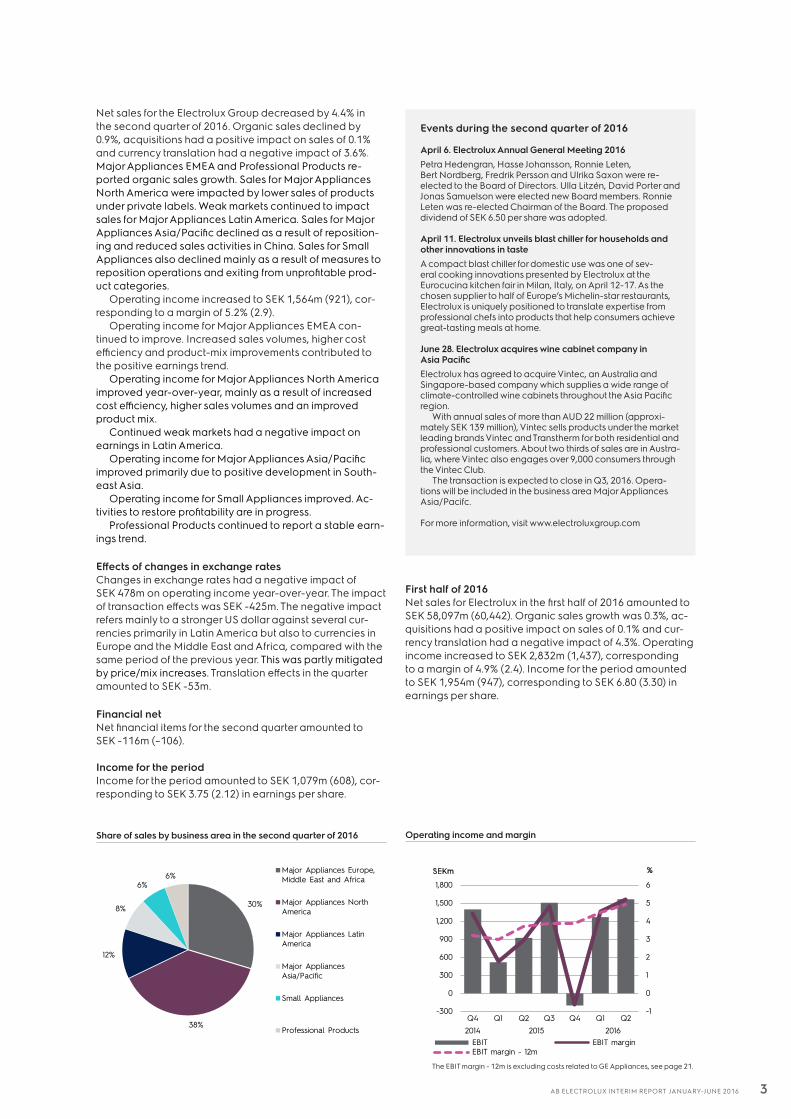
Income for the period Income for the period amounted to SEK 1,079m (608), cor-responding to SEK 3.75 (2.12) in earnings per share.
Share of sales by business area in the second quarter of 2016 Operating income and margin
Events during the second quarter of 2016
April 6. Electrolux Annual General Meeting 2016Petra Hedengran, Hasse Johansson, Ronnie Leten, Bert Nordberg, Fredrik Persson and Ulrika Saxon were re-elected to the Board of Directors. Ulla Litzén, David Porter and Jonas Samuelson were elected new Board members. Ronnie Leten was re-elected Chairman of the Board. The proposed dividend of SEK 6.50 per share was adopted.
April 11. Electrolux unveils blast chiller for households and other innovations in taste A compact blast chiller for domestic use was one of sev-eral cooking innovations presented by Electrolux at the Eurocucina kitchen fair in Milan, Italy, on April 12-17. As the chosen supplier to half of Europe’s Michelin-star restaurants, Electrolux is uniquely positioned to translate expertise from professional chefs into products that help consumers achieve great-tasting meals at home.
June 28. Electrolux acquires wine cabinet company in Asia PacificElectrolux has agreed to acquire Vintec, an Australia and Singapore-based company which supplies a wide range of climate-controlled wine cabinets throughout the Asia Pacific region.
With annual sales of more than AUD 22 million (approxi-mately SEK 139 million), Vintec sells products under the market leading brands Vintec and Transtherm for both residential and professional customers. About two thirds of sales are in Austra-lia, where Vintec also engages over 9,000 consumers through the Vintec Club.
The transaction is expected to close in Q3, 2016. Opera-tions will be included in the business area Major Appliances Asia/Pacifc.
For more information, visit www.electroluxgroup.com
First half of 2016Net sales for Electrolux in the first half of 2016 amounted to SEK 58,097m (60,442). Organic sales growth was 0.3%, ac-quisitions had a positive impact on sales of 0.1% and cur-rency translation had a negative impact of 4.3%. Operating income increased to SEK 2,832m (1,437), corresponding to a margin of 4.9% (2.4). Income for the period amounted to SEK 1,954m (947), corresponding to SEK 6.80 (3.30) in earnings per share.
The EBIT margin - 12m is excluding costs related to GE Appliances, see page 21.
-1
0
1
2
3
4
5
6
-300
0
300
600
900
1,200
1,500
1,800
Q4 Q1 Q2 Q3 Q4 Q1 Q22014 2015 2016
%SEKm
EBIT EBIT marginEBIT margin - 12m
30%
38%
12%
8%
6%6%
Major Appliances Europe,Middle East and Africa
Major Appliances NorthAmerica
Major Appliances LatinAmerica
Major AppliancesAsia/Pacific
Small Appliances
Professional Products
4AB ELECTROLUX INTERIM REPORT JANUARY-JUNE 2016
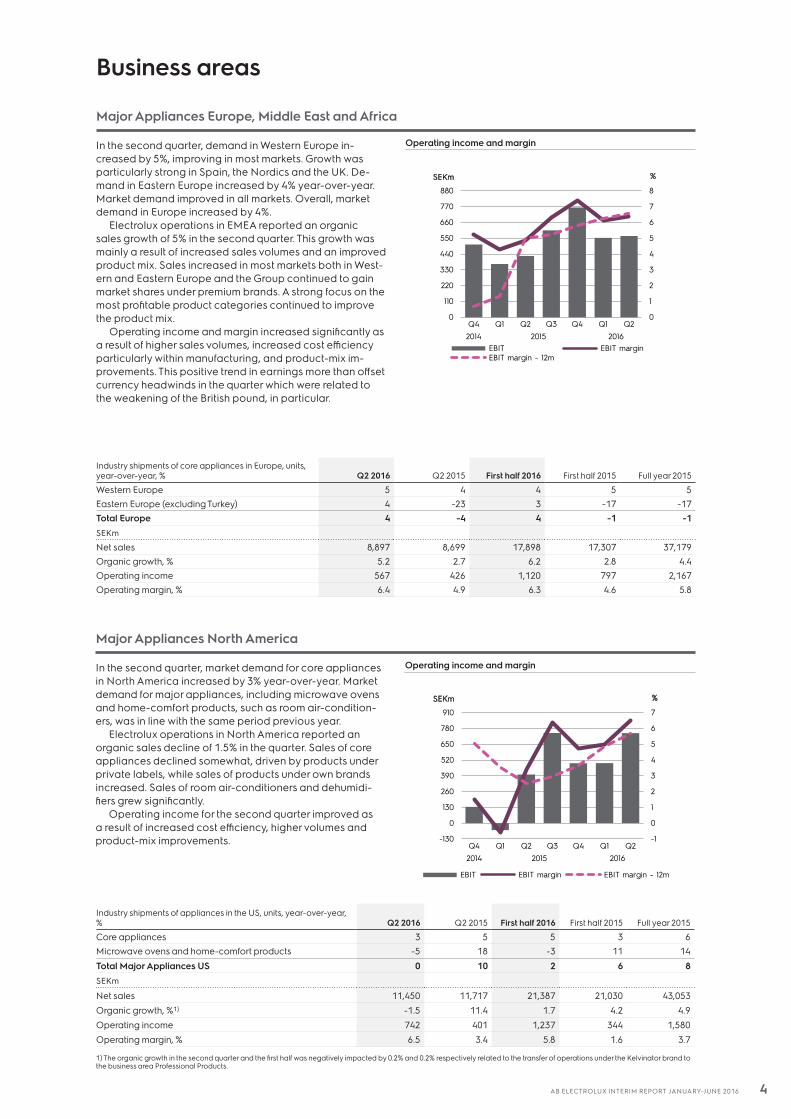
Major Appliances Europe, Middle East and Africa
In the second quarter, demand in Western Europe in-creased by 5%, improving in most markets. Growth was particularly strong in Spain, the Nordics and the UK. De-mand in Eastern Europe increased by 4% year-over-year. Market demand improved in all markets. Overall, market demand in Europe increased by 4%.
Electrolux operations in EMEA reported an organic sales growth of 5% in the second quarter. This growth was mainly a result of increased sales volumes and an improved product mix. Sales increased in most markets both in West-ern and Eastern Europe and the Group continued to gain market shares under premium brands. A strong focus on the most profitable product categories continued to improve the product mix.
Operating income and margin increased significantly as a result of higher sales volumes, increased cost efficiency particularly within manufacturing, and product-mix im-provements. This positive trend in earnings more than offset currency headwinds in the quarter which were related to the weakening of the British pound, in particular.
Operating income and margin
Major Appliances North America
In the second quarter, market demand for core appliances in North America increased by 3% year-over-year. Market demand for major appliances, including microwave ovens and home-comfort products, such as room air-condition-ers, was in line with the same period previous year.
Electrolux operations in North America reported an organic sales decline of 1.5% in the quarter. Sales of core appliances declined somewhat, driven by products under private labels, while sales of products under own brands increased. Sales of room air-conditioners and dehumidi-fiers grew significantly.
Operating income for the second quarter improved as a result of increased cost efficiency, higher volumes and product-mix improvements.
Operating income and margin
Business areas
Industry shipments of core appliances in Europe, units, year-over-year, % Q2 2016 Q2 2015 First half 2016 First half 2015 Full year 2015
Western Europe 5 4 4 5 5Eastern Europe (excluding Turkey) 4 -23 3 -17 -17Total Europe 4 -4 4 -1 -1SEKm
Net sales 8,897 8,699 17,898 17,307 37,179Organic growth, % 5.2 2.7 6.2 2.8 4.4Operating income 567 426 1,120 797 2,167Operating margin, % 6.4 4.9 6.3 4.6 5.8
Industry shipments of appliances in the US, units, year-over-year, % Q2 2016 Q2 2015 First half 2016 First half 2015 Full year 2015
Core appliances 3 5 5 3 6Microwave ovens and home-comfort products -5 18 -3 11 14Total Major Appliances US 0 10 2 6 8SEKm
Net sales 11,450 11,717 21,387 21,030 43,053Organic growth, %1) -1.5 11.4 1.7 4.2 4.9Operating income 742 401 1,237 344 1,580Operating margin, % 6.5 3.4 5.8 1.6 3.7
1) The organic growth in the second quarter and the first half was negatively impacted by 0.2% and 0.2% respectively related to the transfer of operations under the Kelvinator brand to the business area Professional Products.
0
1
2
3
4
5
6
7
8
0
110
220
330
440
550
660
770
880
Q4 Q1 Q2 Q3 Q4 Q1 Q22014 2015 2016
%SEKm
EBIT EBIT marginEBIT margin - 12m
-1
0
1
2
3
4
5
6
7
-130
0
130
260
390
520
650
780
910
Q4 Q1 Q2 Q3 Q4 Q1 Q22014 2015 2016
%SEKm
EBIT EBIT margin EBIT margin - 12m
5AB ELECTROLUX INTERIM REPORT JANUARY-JUNE 2016
Major Appliances Latin America
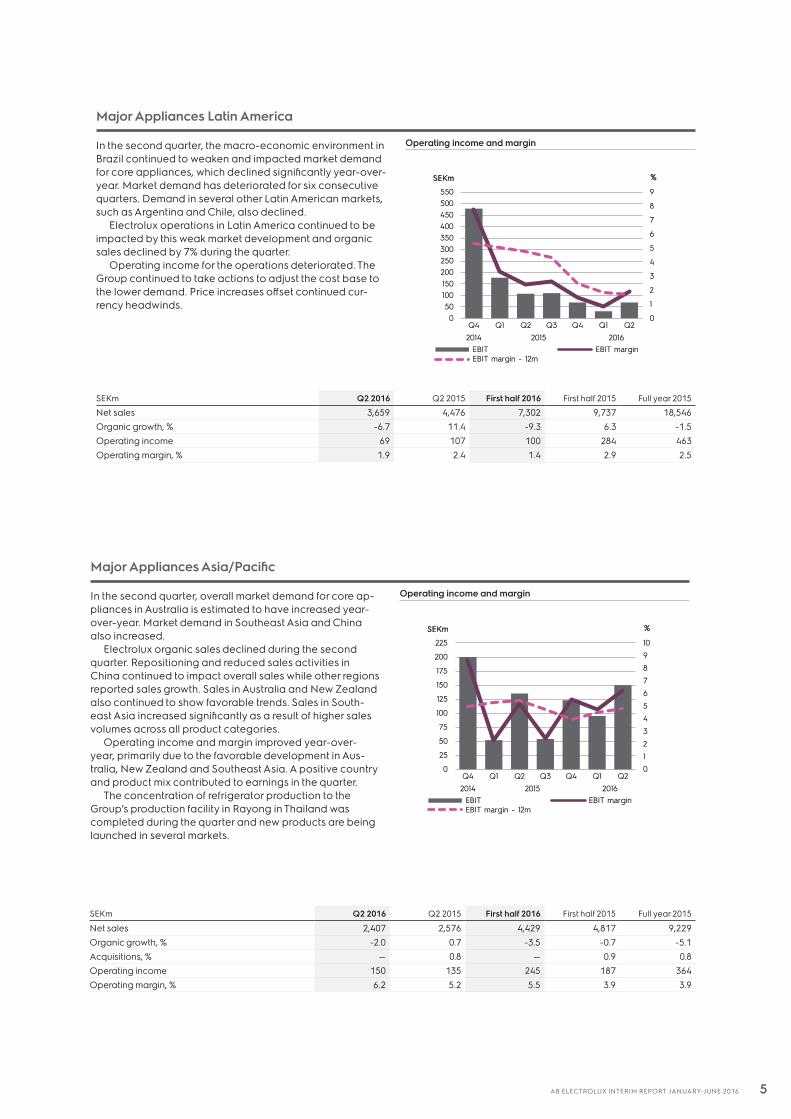
In the second quarter, the macro-economic environment in Brazil continued to weaken and impacted market demand for core appliances, which declined significantly year-over-year. Market demand has deteriorated for six consecutive quarters. Demand in several other Latin American markets, such as Argentina and Chile, also declined.
Electrolux operations in Latin America continued to be impacted by this weak market development and organic sales declined by 7% during the quarter.
Operating income for the operations deteriorated. The Group continued to take actions to adjust the cost base to the lower demand. Price increases offset continued cur-rency headwinds.
Operating income and margin
Major Appliances Asia/Pacific
In the second quarter, overall market demand for core ap-pliances in Australia is estimated to have increased year-over-year. Market demand in Southeast Asia and China also increased.
Electrolux organic sales declined during the second quarter. Repositioning and reduced sales activities in China continued to impact overall sales while other regions reported sales growth. Sales in Australia and New Zealand also continued to show favorable trends. Sales in South-east Asia increased significantly as a result of higher sales volumes across all product categories.
Operating income and margin improved year-over-year, primarily due to the favorable development in Aus-tralia, New Zealand and Southeast Asia. A positive country and product mix contributed to earnings in the quarter.
The concentration of refrigerator production to the Group’s production facility in Rayong in Thailand was completed during the quarter and new products are being launched in several markets.
Operating income and margin
SEKm Q2 2016 Q2 2015 First half 2016 First half 2015 Full year 2015
Net sales 3,659 4,476 7,302 9,737 18,546Organic growth, % -6.7 11.4 -9.3 6.3 -1.5Operating income 69 107 100 284 463Operating margin, % 1.9 2.4 1.4 2.9 2.5
SEKm Q2 2016 Q2 2015 First half 2016 First half 2015 Full year 2015
Net sales 2,407 2,576 4,429 4,817 9,229Organic growth, % -2.0 0.7 -3.5 -0.7 -5.1Acquisitions, % — 0.8 — 0.9 0.8Operating income 150 135 245 187 364Operating margin, % 6.2 5.2 5.5 3.9 3.9
0
1
2
3
4
5
6
7
8
9
050100150200250300350400450500550
Q4 Q1 Q2 Q3 Q4 Q1 Q22014 2015 2016
%SEKm
EBIT EBIT marginEBIT margin - 12m
012345678910
0
25
50
75
100
125
150
175
200
225
Q4 Q1 Q2 Q3 Q4 Q1 Q22014 2015 2016
%SEKm
EBIT EBIT marginEBIT margin - 12m
6AB ELECTROLUX INTERIM REPORT JANUARY-JUNE 2016
Small Appliances
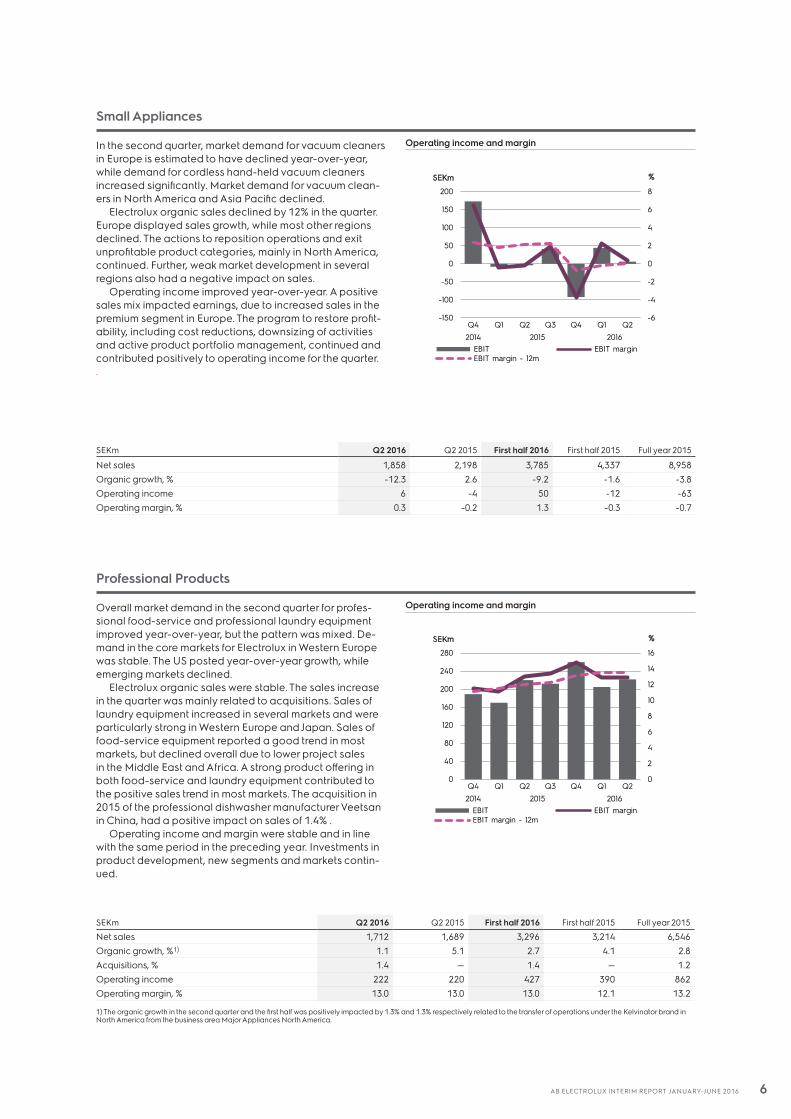
In the second quarter, market demand for vacuum cleaners in Europe is estimated to have declined year-over-year, while demand for cordless hand-held vacuum cleaners increased significantly. Market demand for vacuum clean-ers in North America and Asia Pacific declined.
Electrolux organic sales declined by 12% in the quarter. Europe displayed sales growth, while most other regions declined. The actions to reposition operations and exit unprofitable product categories, mainly in North America, continued. Further, weak market development in several regions also had a negative impact on sales.
Operating income improved year-over-year. A positive sales mix impacted earnings, due to increased sales in the premium segment in Europe. The program to restore profit-ability, including cost reductions, downsizing of activities and active product portfolio management, continued and contributed positively to operating income for the quarter..
Operating income and margin
Professional Products
Overall market demand in the second quarter for profes-sional food-service and professional laundry equipment improved year-over-year, but the pattern was mixed. De-mand in the core markets for Electrolux in Western Europe was stable. The US posted year-over-year growth, while emerging markets declined.
Electrolux organic sales were stable. The sales increase in the quarter was mainly related to acquisitions. Sales of laundry equipment increased in several markets and were particularly strong in Western Europe and Japan. Sales of food-service equipment reported a good trend in most markets, but declined overall due to lower project sales in the Middle East and Africa. A strong product offering in both food-service and laundry equipment contributed to the positive sales trend in most markets. The acquisition in 2015 of the professional dishwasher manufacturer Veetsan in China, had a positive impact on sales of 1.4% .
Operating income and margin were stable and in line with the same period in the preceding year. Investments in product development, new segments and markets contin-ued.
Operating income and margin
SEKm Q2 2016 Q2 2015 First half 2016 First half 2015 Full year 2015
Net sales 1,858 2,198 3,785 4,337 8,958Organic growth, % -12.3 2.6 -9.2 -1.6 -3.8Operating income 6 -4 50 -12 -63Operating margin, % 0.3 -0.2 1.3 -0.3 -0.7
SEKm Q2 2016 Q2 2015 First half 2016 First half 2015 Full year 2015
Net sales 1,712 1,689 3,296 3,214 6,546Organic growth, %1) 1.1 5.1 2.7 4.1 2.8Acquisitions, % 1.4 — 1.4 — 1.2Operating income 222 220 427 390 862Operating margin, % 13.0 13.0 13.0 12.1 13.2
1) The organic growth in the second quarter and the first half was positively impacted by 1.3% and 1.3% respectively related to the transfer of operations under the Kelvinator brand in North America from the business area Major Appliances North America.
-6
-4
-2
0
2
4
6
8
-150
-100
-50
0
50
100
150
200
Q4 Q1 Q2 Q3 Q4 Q1 Q22014 2015 2016
%SEKm
EBIT EBIT marginEBIT margin - 12m
0
2
4
6
8
10
12
14
16
0
40
80
120
160
200
240
280
Q4 Q1 Q2 Q3 Q4 Q1 Q22014 2015 2016
%SEKm
EBIT EBIT marginEBIT margin - 12m
7AB ELECTROLUX INTERIM REPORT JANUARY-JUNE 2016
Cash flow
SEKm Q2 2016 Q2 2015 First half 2016 First half 2015 Full year 2015
Operating income adjusted for non-cash items1) 2,707 2,043 5,027 3,609 7,235Change in operating assets and liabilities 1,855 1,910 -516 548 2,822Operating cash flow 4,562 3,953 4,511 4,157 10,057Investments in tangible and intangible assets -678 -889 -1 314 -1 642 -3 640Changes in other investments 257 -71 364 -113 328Operating cash flow after investments 4,141 2,993 3,561 2,402 6,745Acquisitions and divestments of operations — -78 -3 -78 -91Operating cash flow after structural changes 4,141 2,915 3,558 2,324 6,654Financial items paid, net2) -117 -107 -178 -123 -513Taxes paid -430 -420 -631 -701 -1,277Cash flow from operations and investments 3,594 2,388 2,749 1,500 4,864Dividend -1,868 -1,868 -1,868 -1,868 -1,870Share-based payments -3 — -57 — —Total cash flow, excluding changes in loans and short–term investments 1,723 520 824 -368 2,994
1) Operating income adjusted for depreciation, amortization and other non-cash items. 2) For the period January 1 to June 30. Interests and similar items received SEK 52m (70), interests and similar items paid SEK -243m (–229) and other financial items paid SEK –59m (–25).
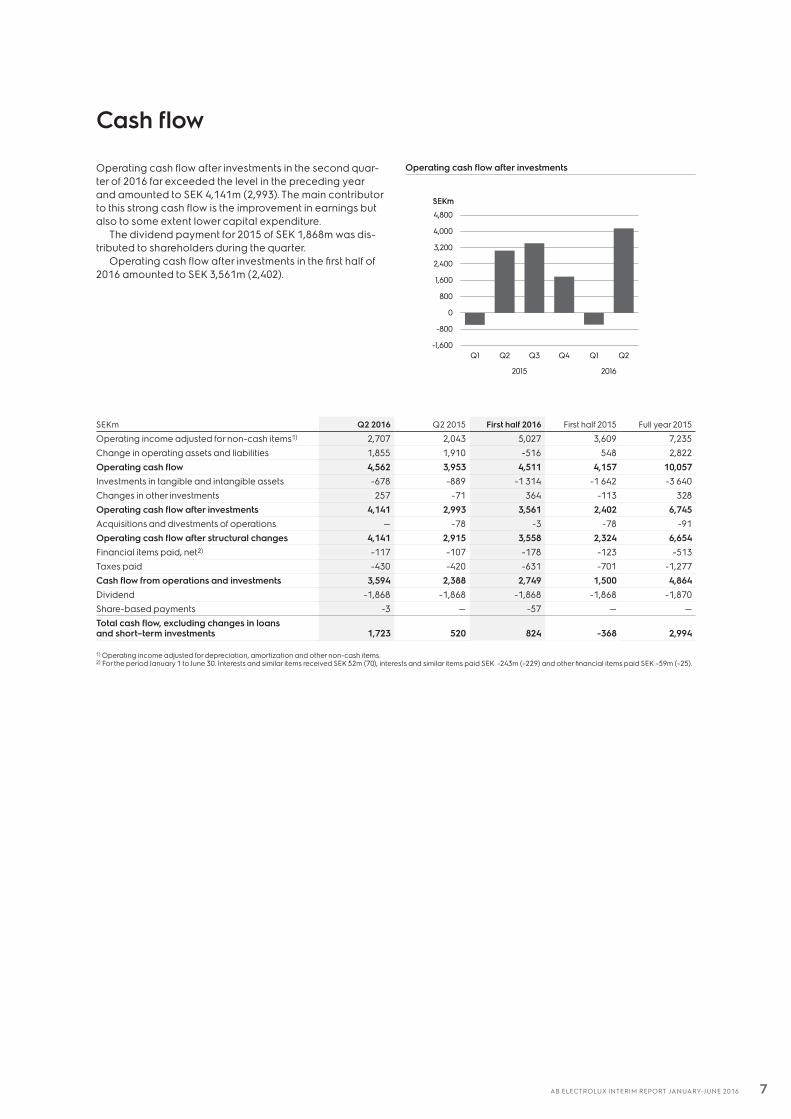
Operating cash flow after investments in the second quar-ter of 2016 far exceeded the level in the preceding year and amounted to SEK 4,141m (2,993). The main contributor to this strong cash flow is the improvement in earnings but also to some extent lower capital expenditure.
The dividend payment for 2015 of SEK 1,868m was dis-tributed to shareholders during the quarter.
Operating cash flow after investments in the first half of 2016 amounted to SEK 3,561m (2,402).
Operating cash flow after investments
-1,600
-800
0
800
1,600
2,400
3,200
4,000
4,800
Q1 Q2 Q3 Q4 Q1 Q2
2015 2016
SEKm
8AB ELECTROLUX INTERIM REPORT JANUARY-JUNE 2016
Financial position
Net debtThe financial net debt as of June 30, 2016, of SEK 1,271m, declined by SEK 627m compared to SEK 1,898m as of December 31, 2015. This is a result of the strong cash flow in the first half of 2016. Net provisions for post-employment benefits increased to SEK 6,455m. In total, net debt in-creased by SEK 1,319m in the first half of 2016.
Long-term borrowings and short-term part of long-term loans as of June 30, 2016, amounted to SEK 8,407m with average maturity of 3.2 years, compared to SEK 11,000m and 2.8 years at the end of 2015.
In the second quarter, long-term borrowings in the amount of SEK 2,656m were amortized. There are no more maturities of long-term borrowings in 2016.
Liquid funds as of June 30, 2016, amounted to SEK 8,988m (8,759), excluding short-term back-up facilities.
Net assets and working capital Average net assets for the first half of 2016 amounted to SEK 22,032m (26,668), corresponding to 19.0% (22.1) of an-nualized net sales. Net assets as of June 30, 2016, amount-ed to SEK 21,648m (25,286).
Working capital as of June 30, 2016, amounted to SEK –11,706m (–9,022), corresponding to –9.5% (–7.3) of annualized net sales.
Return on net assets was 25.7% (10.8), and return on equity was 27.3% (11.8).
Net debtSEKm June 30, 2016 June 30, 2015 Dec. 31, 2015
Short-term loans 1,267 1,749 1,499Short-term part of long-term loans - 3,373 2,677Trade receivables with recourse 321 312 328Short-term borrowings 1,588 5,434 4,504Financial derivative liabilities 241 175 215Accrued interest expenses and prepaid interest income 23 42 55Total short-term borrowings 1,852 5,651 4,774Long-term borrowings 8,407 8,256 8,323Total borrowings1) 10,259 13,907 13,097Cash and cash equivalents 8,538 8,258 10,696Short-term investments 3 78 108Financial derivative assets 191 164 141Prepaid interest expenses and accrued interest income 256 259 254Liquid funds2) 8,988 8,759 11,199Financial net debt 1,271 5,148 1,898Net provisions for post– employment benefits 6,455 4,060 4,509Net debt 7,726 9,208 6,407Net debt/equity ratio 0.55 0.57 0.43Equity 13,922 16,078 15,005Equity per share, SEK 48.44 55.94 52.21Return on equity, % 27.3 11.8 9.9Equity/assets ratio, % 19.0 21.4 20.8
1) Whereof interest-bearing liabilities in the amount of SEK 9,674m as of June 30, 2016, SEK 13,378m as of June 30, 2015 and SEK 12,499m as of December 31, 2015.2) Electrolux has one unused committed back-up multicurrency revolving credit facility of EUR 1, 000m, approximately SEK 9,400m, expiring in 2021 with two extension options of one year each. Electrolux also has two unused committed credit facilities, one of USD 300m, approximately SEK 2,500m, maturing in 2018 and one of USD 150m, approximately SEK 1,300m, maturing in 2016.
9AB ELECTROLUX INTERIM REPORT JANUARY-JUNE 2016
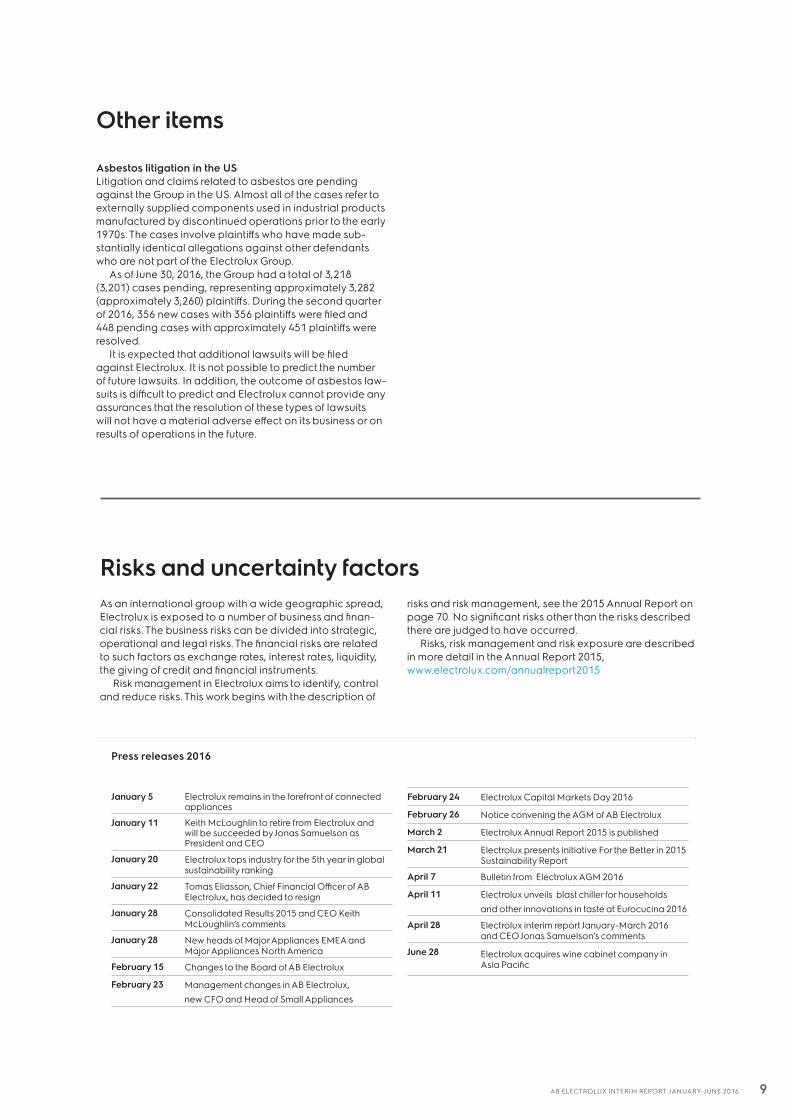
Other items
Risks and uncertainty factorsAs an international group with a wide geographic spread, Electrolux is exposed to a number of business and finan-cial risks. The business risks can be divided into strategic, operational and legal risks. The financial risks are related to such factors as exchange rates, interest rates, liquidity, the giving of credit and financial instruments.
Risk management in Electrolux aims to identify, control and reduce risks. This work begins with the description of
risks and risk management, see the 2015 Annual Report on page 70. No significant risks other than the risks described there are judged to have occurred.
Risks, risk management and risk exposure are described in more detail in the Annual Report 2015, www.electrolux.com/annualreport2015
Press releases 2016
January 5 Electrolux remains in the forefront of connected appliances
January 11 Keith McLoughlin to retire from Electrolux and will be succeeded by Jonas Samuelson as President and CEO
January 20 Electrolux tops industry for the 5th year in global sustainability ranking
January 22 Tomas Eliasson, Chief Financial Officer of AB Electrolux, has decided to resign
January 28 Consolidated Results 2015 and CEO Keith McLoughlin’s comments
January 28 New heads of Major Appliances EMEA and Major Appliances North America
February 15 Changes to the Board of AB Electrolux
February 23 Management changes in AB Electrolux,new CFO and Head of Small Appliances
February 24 Electrolux Capital Markets Day 2016
February 26 Notice convening the AGM of AB Electrolux
March 2 Electrolux Annual Report 2015 is published
March 21 Electrolux presents initiative For the Better in 2015 Sustainability Report
April 7 Bulletin from Electrolux AGM 2016
April 11 Electrolux unveils blast chiller for householdsand other innovations in taste at Eurocucina 2016
April 28 Electrolux interim report January-March 2016 and CEO Jonas Samuelson’s comments
June 28 Electrolux acquires wine cabinet company in Asia Pacific
Asbestos litigation in the US Litigation and claims related to asbestos are pending against the Group in the US. Almost all of the cases refer to externally supplied components used in industrial products manufactured by discontinued operations prior to the early 1970s. The cases involve plaintiffs who have made sub-stantially identical allegations against other defendants who are not part of the Electrolux Group.
As of June 30, 2016, the Group had a total of 3,218 (3,201) cases pending, representing approximately 3,282 (approximately 3,260) plaintiffs. During the second quarter of 2016, 356 new cases with 356 plaintiffs were filed and 448 pending cases with approximately 451 plaintiffs were resolved.
It is expected that additional lawsuits will be filed against Electrolux. It is not possible to predict the number of future lawsuits. In addition, the outcome of asbestos law-suits is difficult to predict and Electrolux cannot provide any assurances that the resolution of these types of lawsuits will not have a material adverse effect on its business or on results of operations in the future.
10AB ELECTROLUX INTERIM REPORT JANUARY-JUNE 2016
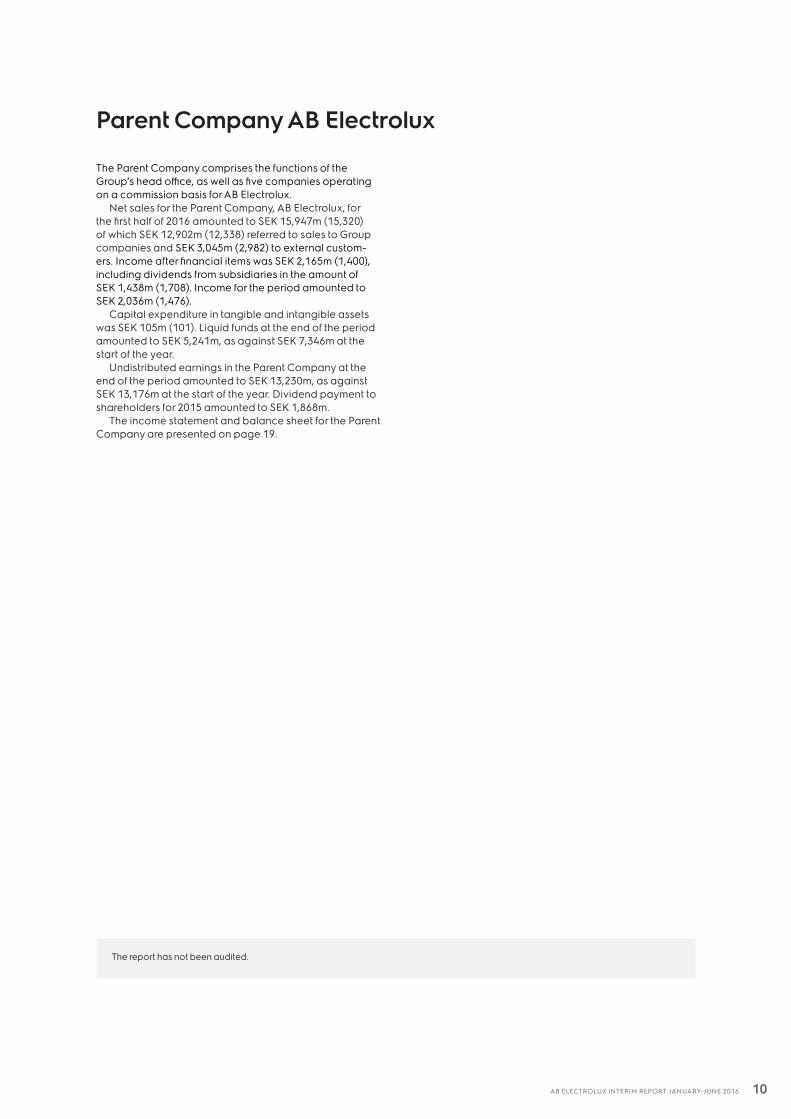
The Parent Company comprises the functions of the Group’s head office, as well as five companies operating on a commission basis for AB Electrolux.
Net sales for the Parent Company, AB Electrolux, for the first half of 2016 amounted to SEK 15,947m (15,320) of which SEK 12,902m (12,338) referred to sales to Group companies and SEK 3,045m (2,982) to external custom-ers. Income after financial items was SEK 2,165m (1,400), including dividends from subsidiaries in the amount of SEK 1,438m (1,708). Income for the period amounted to SEK 2,036m (1,476).
Capital expenditure in tangible and intangible assets was SEK 105m (101). Liquid funds at the end of the period amounted to SEK 5,241m, as against SEK 7,346m at the start of the year.
Undistributed earnings in the Parent Company at the end of the period amounted to SEK 13,230m, as against SEK 13,176m at the start of the year. Dividend payment to shareholders for 2015 amounted to SEK 1,868m.
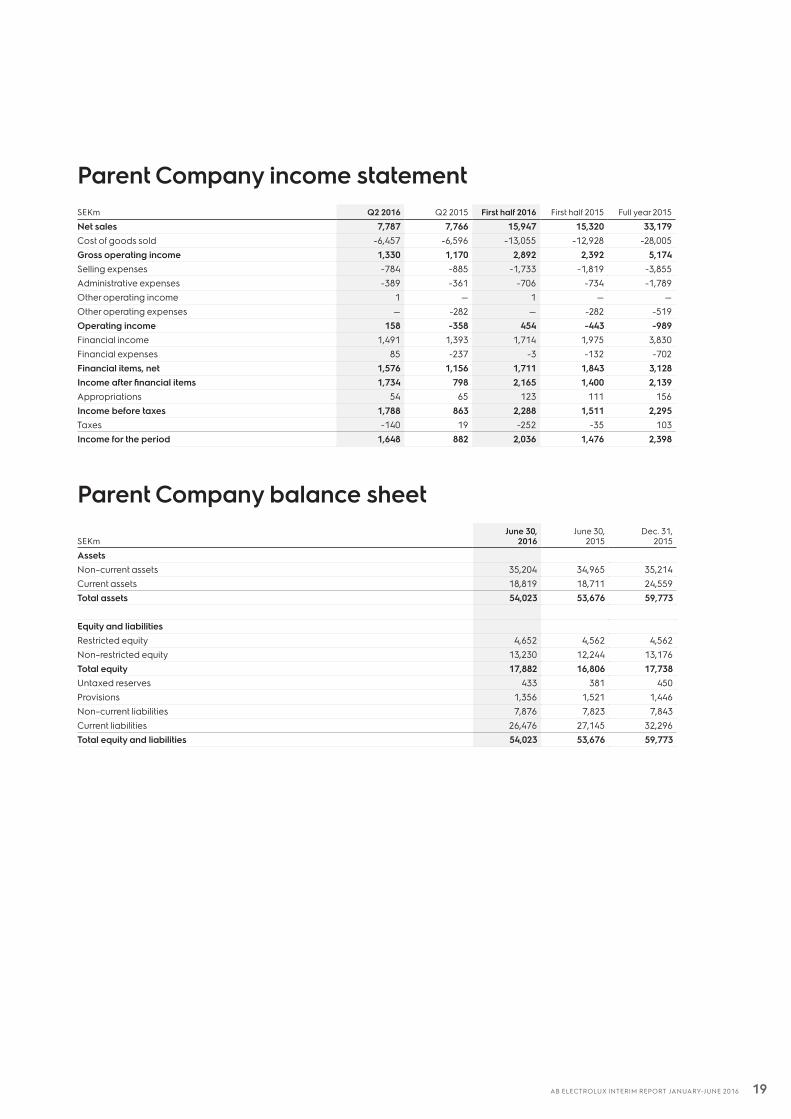
The income statement and balance sheet for the Parent Company are presented on page 19.
The report has not been audited.
Parent Company AB Electrolux
11AB ELECTROLUX INTERIM REPORT JANUARY-JUNE 2016
The Board of Directors and the President and CEO certify that the Interim Report for the period January – June 2016 gives a true and fair overview of the Parent Company AB Electrolux and the Group’s operations, their financial position and results of operations, and describes significant risks and uncertainties facing the Parent Company and other companies in the Group..
Stockholm, July 19, 2016
AB Electrolux (publ)556009-4178
Ronnie LetenChairman of the Board of Directors
Petra Hedengran Hasse Johansson Ulla Litzén Board member Board member Board member
Bert Nordberg Fredrik Persson David Porter Board member Board member Board member
Jonas Samuelson Ulrika Saxon Board member, President and CEO Board member
Ola Bertilsson Gunilla Brandt Ulf Carlsson Board member, Board member, Board member, employee representative employee representative employee representative
12AB ELECTROLUX INTERIM REPORT JANUARY-JUNE 2016
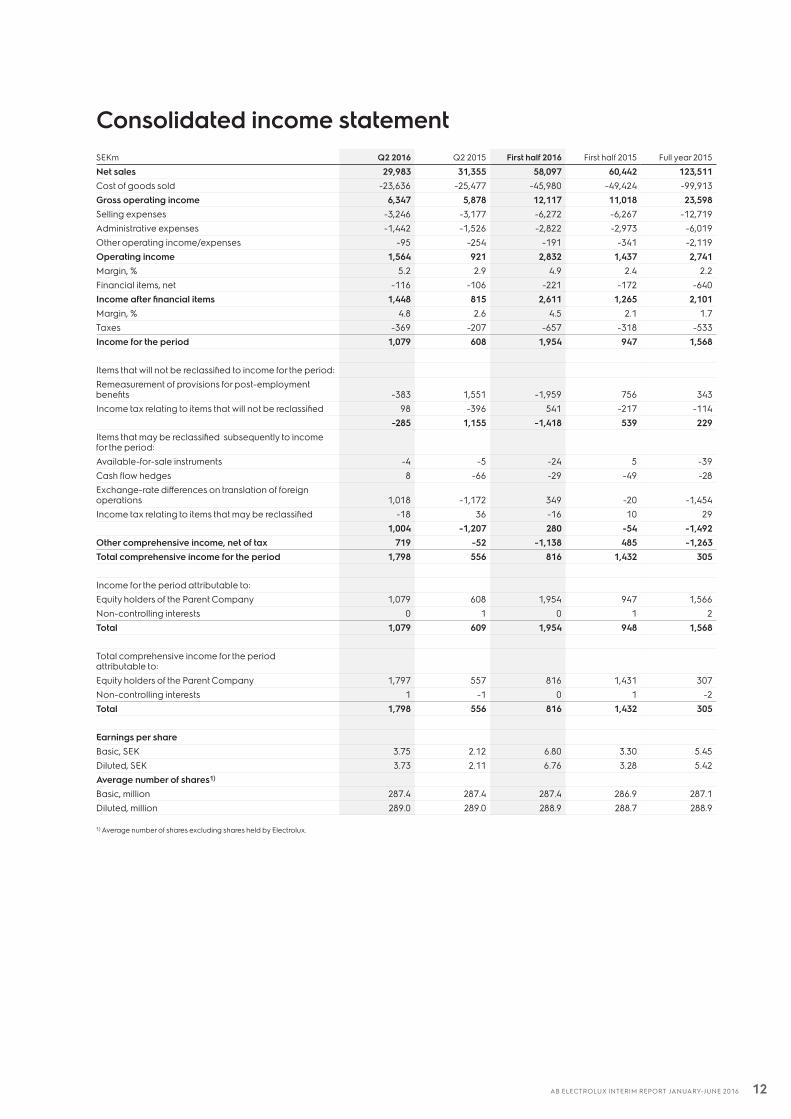
Consolidated income statementSEKm Q2 2016 Q2 2015 First half 2016 First half 2015 Full year 2015
Net sales 29,983 31,355 58,097 60,442 123,511Cost of goods sold -23,636 -25,477 -45,980 -49,424 -99,913Gross operating income 6,347 5,878 12,117 11,018 23,598Selling expenses -3,246 -3,177 -6,272 -6,267 -12,719Administrative expenses -1,442 -1,526 -2,822 -2,973 -6,019Other operating income/expenses -95 -254 -191 -341 -2,119Operating income 1,564 921 2,832 1,437 2,741Margin, % 5.2 2.9 4.9 2.4 2.2Financial items, net -116 -106 -221 -172 -640Income after financial items 1,448 815 2,611 1,265 2,101Margin, % 4.8 2.6 4.5 2.1 1.7Taxes -369 -207 -657 -318 -533Income for the period 1,079 608 1,954 947 1,568
Items that will not be reclassified to income for the period:Remeasurement of provisions for post-employment benefits -383 1,551 -1,959 756 343Income tax relating to items that will not be reclassified 98 -396 541 -217 -114
-285 1,155 -1,418 539 229Items that may be reclassified subsequently to income for the period:Available-for-sale instruments -4 -5 -24 5 -39Cash flow hedges 8 -66 -29 -49 -28Exchange-rate differences on translation of foreign operations 1,018 -1,172 349 -20 -1,454Income tax relating to items that may be reclassified -18 36 -16 10 29
1,004 -1,207 280 -54 -1,492Other comprehensive income, net of tax 719 -52 -1,138 485 -1,263Total comprehensive income for the period 1,798 556 816 1,432 305
Income for the period attributable to:Equity holders of the Parent Company 1,079 608 1,954 947 1,566Non-controlling interests 0 1 0 1 2Total 1,079 609 1,954 948 1,568
Total comprehensive income for the periodattributable to:Equity holders of the Parent Company 1,797 557 816 1,431 307Non-controlling interests 1 -1 0 1 -2Total 1,798 556 816 1,432 305
Earnings per shareBasic, SEK 3.75 2.12 6.80 3.30 5.45Diluted, SEK 3.73 2.11 6.76 3.28 5.42Average number of shares1)
Basic, million 287.4 287.4 287.4 286.9 287.1Diluted, million 289.0 289.0 288.9 288.7 288.9
1) Average number of shares excluding shares held by Electrolux.
13AB ELECTROLUX INTERIM REPORT JANUARY-JUNE 2016
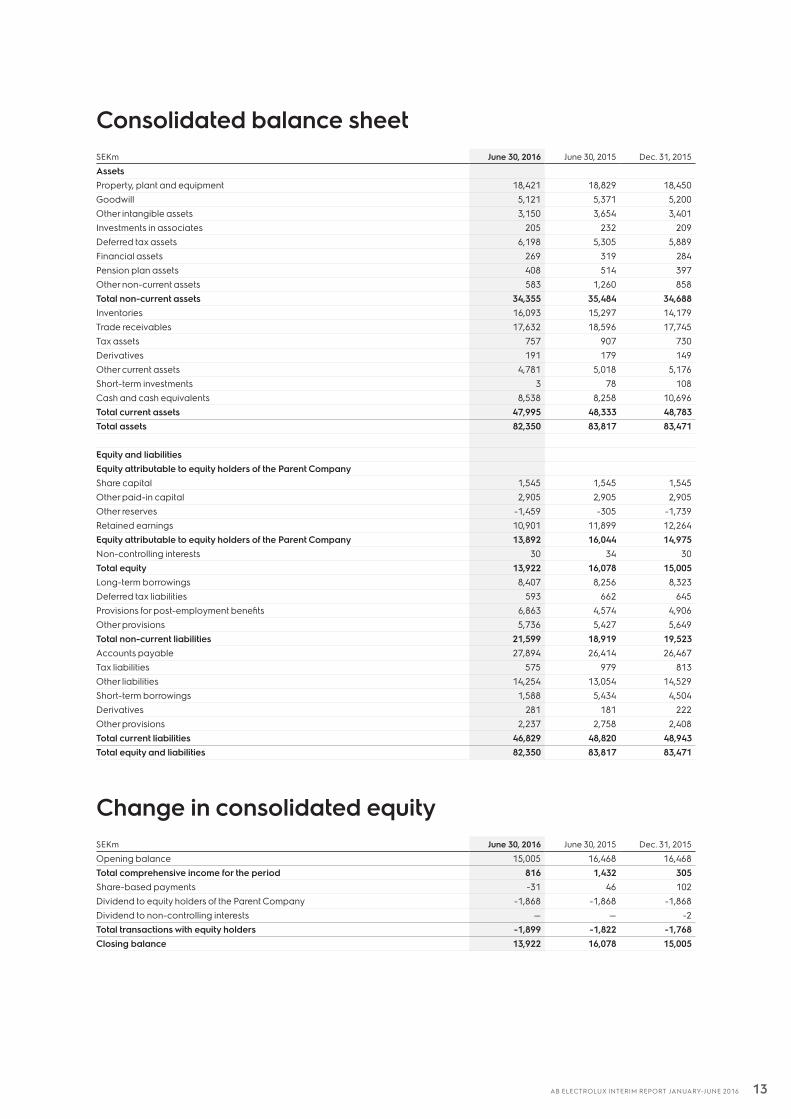
Consolidated balance sheetSEKm June 30, 2016 June 30, 2015 Dec. 31, 2015
AssetsProperty, plant and equipment 18,421 18,829 18,450Goodwill 5,121 5,371 5,200Other intangible assets 3,150 3,654 3,401Investments in associates 205 232 209Deferred tax assets 6,198 5,305 5,889Financial assets 269 319 284Pension plan assets 408 514 397Other non-current assets 583 1,260 858Total non-current assets 34,355 35,484 34,688Inventories 16,093 15,297 14,179Trade receivables 17,632 18,596 17,745Tax assets 757 907 730Derivatives 191 179 149Other current assets 4,781 5,018 5,176Short-term investments 3 78 108Cash and cash equivalents 8,538 8,258 10,696Total current assets 47,995 48,333 48,783Total assets 82,350 83,817 83,471
Equity and liabilitiesEquity attributable to equity holders of the Parent CompanyShare capital 1,545 1,545 1,545Other paid-in capital 2,905 2,905 2,905Other reserves -1,459 -305 -1,739Retained earnings 10,901 11,899 12,264Equity attributable to equity holders of the Parent Company 13,892 16,044 14,975Non-controlling interests 30 34 30Total equity 13,922 16,078 15,005Long-term borrowings 8,407 8,256 8,323Deferred tax liabilities 593 662 645Provisions for post-employment benefits 6,863 4,574 4,906Other provisions 5,736 5,427 5,649Total non-current liabilities 21,599 18,919 19,523Accounts payable 27,894 26,414 26,467Tax liabilities 575 979 813Other liabilities 14,254 13,054 14,529Short-term borrowings 1,588 5,434 4,504Derivatives 281 181 222Other provisions 2,237 2,758 2,408Total current liabilities 46,829 48,820 48,943Total equity and liabilities 82,350 83,817 83,471
Change in consolidated equitySEKm June 30, 2016 June 30, 2015 Dec. 31, 2015
Opening balance 15,005 16,468 16,468Total comprehensive income for the period 816 1,432 305Share-based payments -31 46 102Dividend to equity holders of the Parent Company -1,868 -1,868 -1,868Dividend to non-controlling interests — — -2Total transactions with equity holders -1,899 -1,822 -1,768Closing balance 13,922 16,078 15,005
14AB ELECTROLUX INTERIM REPORT JANUARY-JUNE 2016
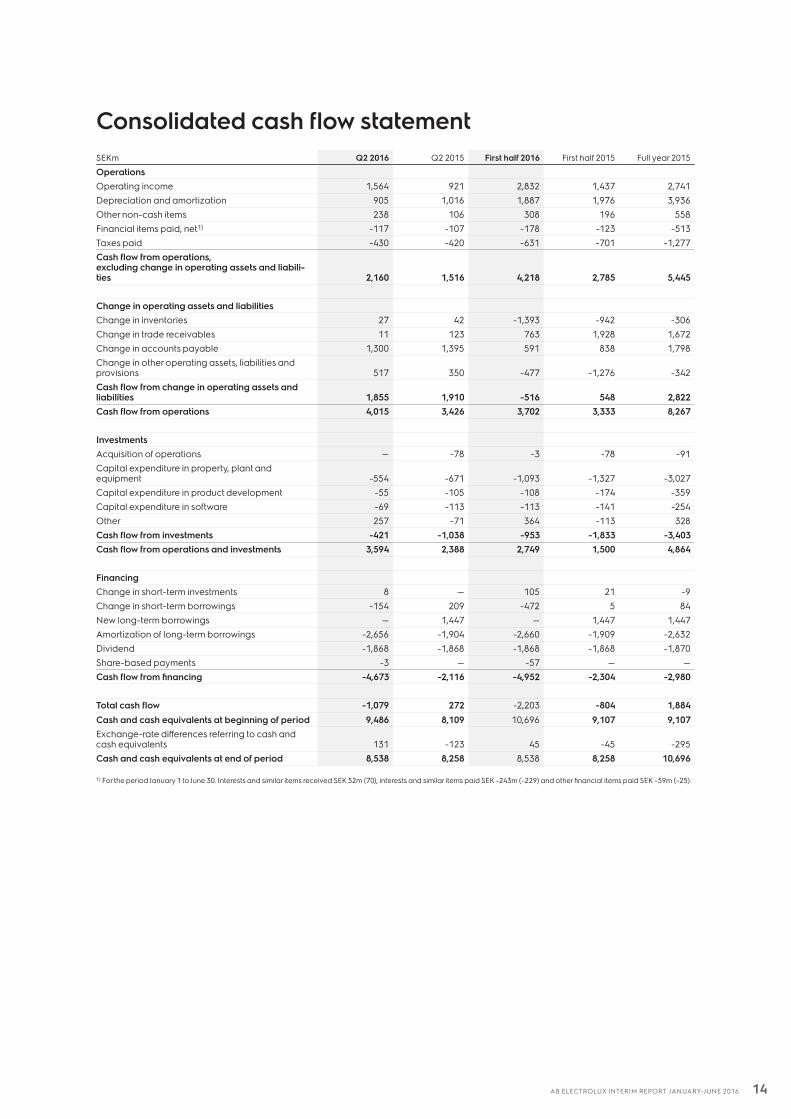
Consolidated cash flow statementSEKm Q2 2016 Q2 2015 First half 2016 First half 2015 Full year 2015
OperationsOperating income 1,564 921 2,832 1,437 2,741Depreciation and amortization 905 1,016 1,887 1,976 3,936Other non-cash items 238 106 308 196 558Financial items paid, net1) -117 -107 -178 -123 -513Taxes paid -430 -420 -631 -701 -1,277Cash flow from operations, excluding change in operating assets and liabili-ties 2,160 1,516 4,218 2,785 5,445
Change in operating assets and liabilitiesChange in inventories 27 42 -1,393 -942 -306Change in trade receivables 11 123 763 1,928 1,672Change in accounts payable 1,300 1,395 591 838 1,798Change in other operating assets, liabilities and provisions 517 350 -477 -1,276 -342Cash flow from change in operating assets and liabilities 1,855 1,910 -516 548 2,822Cash flow from operations 4,015 3,426 3,702 3,333 8,267
InvestmentsAcquisition of operations — -78 -3 -78 -91Capital expenditure in property, plant and equipment -554 -671 -1,093 -1,327 -3,027Capital expenditure in product development -55 -105 -108 -174 -359Capital expenditure in software -69 -113 -113 -141 -254Other 257 -71 364 -113 328Cash flow from investments -421 -1,038 -953 -1,833 -3,403Cash flow from operations and investments 3,594 2,388 2,749 1,500 4,864
FinancingChange in short-term investments 8 — 105 21 -9Change in short-term borrowings -154 209 -472 5 84New long-term borrowings — 1,447 — 1,447 1,447Amortization of long-term borrowings -2,656 -1,904 -2,660 -1,909 -2,632Dividend -1,868 -1,868 -1,868 -1,868 -1,870Share-based payments -3 — -57 — —Cash flow from financing -4,673 -2,116 -4,952 -2,304 -2,980
Total cash flow -1,079 272 -2,203 -804 1,884Cash and cash equivalents at beginning of period 9,486 8,109 10,696 9,107 9,107Exchange-rate differences referring to cash and cash equivalents 131 -123 45 -45 -295Cash and cash equivalents at end of period 8,538 8,258 8,538 8,258 10,696
1) For the period January 1 to June 30. Interests and similar items received SEK 52m (70), interests and similar items paid SEK –243m (–229) and other financial items paid SEK –59m (–25).
15AB ELECTROLUX INTERIM REPORT JANUARY-JUNE 2016
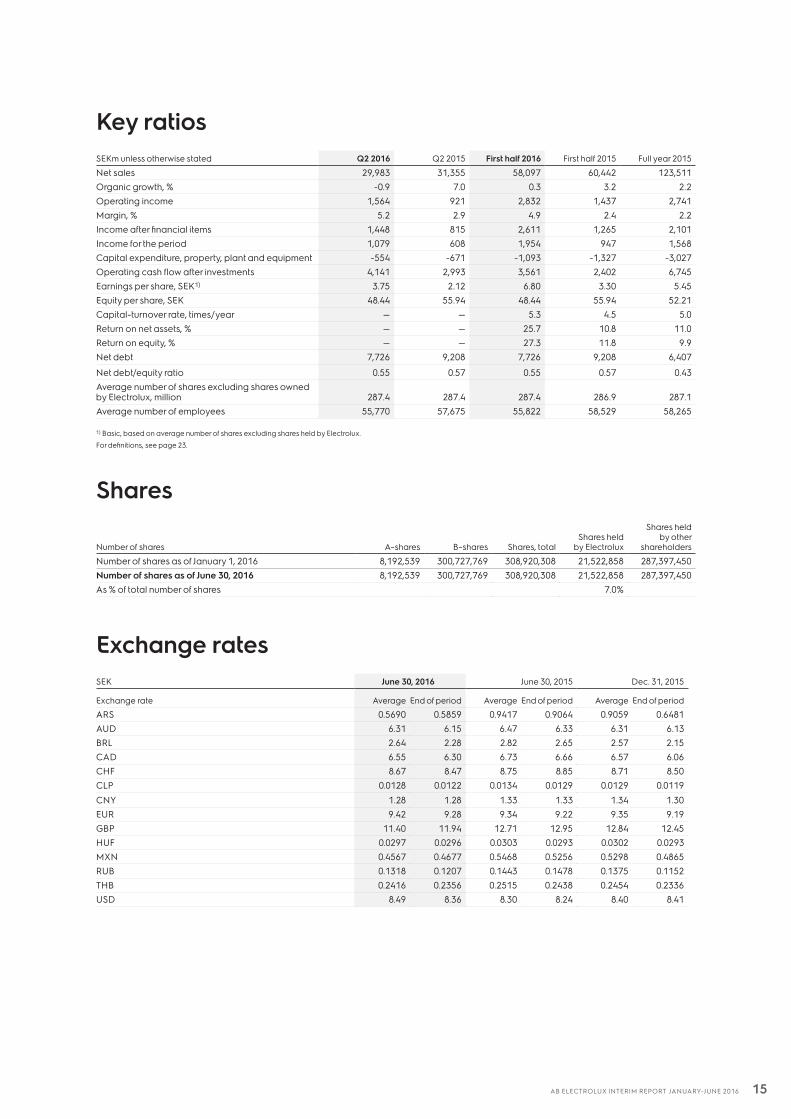
Key ratiosSEKm unless otherwise stated Q2 2016 Q2 2015 First half 2016 First half 2015 Full year 2015
Net sales 29,983 31,355 58,097 60,442 123,511Organic growth, % -0.9 7.0 0.3 3.2 2.2Operating income 1,564 921 2,832 1,437 2,741Margin, % 5.2 2.9 4.9 2.4 2.2Income after financial items 1,448 815 2,611 1,265 2,101Income for the period 1,079 608 1,954 947 1,568Capital expenditure, property, plant and equipment -554 -671 -1,093 -1,327 -3,027Operating cash flow after investments 4,141 2,993 3,561 2,402 6,745Earnings per share, SEK1) 3.75 2.12 6.80 3.30 5.45Equity per share, SEK 48.44 55.94 48.44 55.94 52.21Capital-turnover rate, times/year — — 5.3 4.5 5.0Return on net assets, % — — 25.7 10.8 11.0Return on equity, % — — 27.3 11.8 9.9Net debt 7,726 9,208 7,726 9,208 6,407
Net debt/equity ratio 0.55 0.57 0.55 0.57 0.43Average number of shares excluding shares owned by Electrolux, million 287.4 287.4 287.4 286.9 287.1Average number of employees 55,770 57,675 55,822 58,529 58,265
1) Basic, based on average number of shares excluding shares held by Electrolux.
For definitions, see page 23.
Shares
Number of shares
A–shares
B–shares Shares, totalShares held
by Electrolux
Shares held by other
shareholders
Number of shares as of January 1, 2016 8,192,539 300,727,769 308,920,308 21,522,858 287,397,450Number of shares as of June 30, 2016 8,192,539 300,727,769 308,920,308 21,522,858 287,397,450As % of total number of shares 7.0%
Exchange ratesSEK June 30, 2016 June 30, 2015 Dec. 31, 2015
Exchange rate Average End of period Average End of period Average End of period
ARS 0.5690 0.5859 0.9417 0.9064 0.9059 0.6481AUD 6.31 6.15 6.47 6.33 6.31 6.13BRL 2.64 2.28 2.82 2.65 2.57 2.15CAD 6.55 6.30 6.73 6.66 6.57 6.06CHF 8.67 8.47 8.75 8.85 8.71 8.50CLP 0.0128 0.0122 0.0134 0.0129 0.0129 0.0119CNY 1.28 1.28 1.33 1.33 1.34 1.30EUR 9.42 9.28 9.34 9.22 9.35 9.19GBP 11.40 11.94 12.71 12.95 12.84 12.45HUF 0.0297 0.0296 0.0303 0.0293 0.0302 0.0293MXN 0.4567 0.4677 0.5468 0.5256 0.5298 0.4865RUB 0.1318 0.1207 0.1443 0.1478 0.1375 0.1152THB 0.2416 0.2356 0.2515 0.2438 0.2454 0.2336USD 8.49 8.36 8.30 8.24 8.40 8.41
16AB ELECTROLUX INTERIM REPORT JANUARY-JUNE 2016
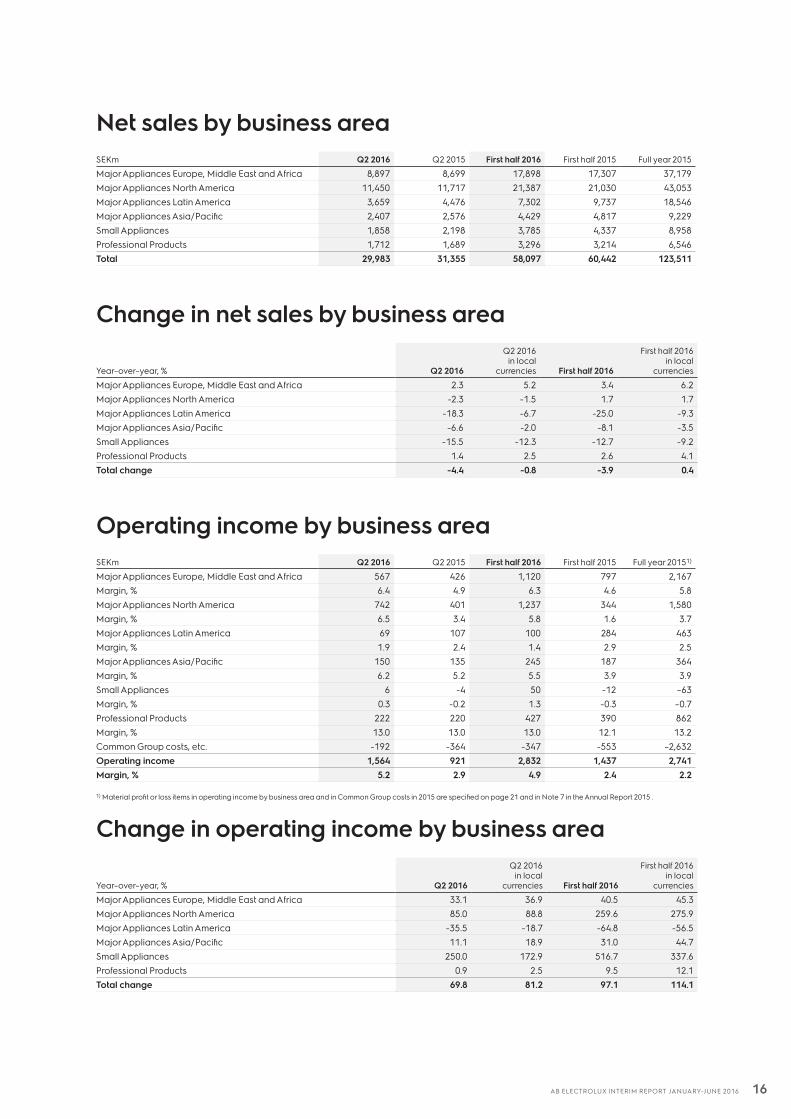
Net sales by business areaSEKm Q2 2016 Q2 2015 First half 2016 First half 2015 Full year 2015
Major Appliances Europe, Middle East and Africa 8,897 8,699 17,898 17,307 37,179Major Appliances North America 11,450 11,717 21,387 21,030 43,053Major Appliances Latin America 3,659 4,476 7,302 9,737 18,546Major Appliances Asia/Pacific 2,407 2,576 4,429 4,817 9,229Small Appliances 1,858 2,198 3,785 4,337 8,958Professional Products 1,712 1,689 3,296 3,214 6,546Total 29,983 31,355 58,097 60,442 123,511
Change in net sales by business area
Year–over–year, % Q2 2016
Q2 2016 in local
currencies First half 2016
First half 2016 in local
currencies
Major Appliances Europe, Middle East and Africa 2.3 5.2 3.4 6.2Major Appliances North America -2.3 -1.5 1.7 1.7Major Appliances Latin America -18.3 -6.7 -25.0 -9.3Major Appliances Asia/Pacific -6.6 -2.0 -8.1 -3.5Small Appliances -15.5 -12.3 -12.7 -9.2Professional Products 1.4 2.5 2.6 4.1Total change -4.4 -0.8 -3.9 0.4
Operating income by business areaSEKm Q2 2016 Q2 2015 First half 2016 First half 2015 Full year 20151)
Major Appliances Europe, Middle East and Africa 567 426 1,120 797 2,167Margin, % 6.4 4.9 6.3 4.6 5.8Major Appliances North America 742 401 1,237 344 1,580Margin, % 6.5 3.4 5.8 1.6 3.7Major Appliances Latin America 69 107 100 284 463Margin, % 1.9 2.4 1.4 2.9 2.5Major Appliances Asia/Pacific 150 135 245 187 364Margin, % 6.2 5.2 5.5 3.9 3.9Small Appliances 6 -4 50 -12 –63Margin, % 0.3 -0.2 1.3 -0.3 –0.7Professional Products 222 220 427 390 862Margin, % 13.0 13.0 13.0 12.1 13.2Common Group costs, etc. -192 -364 -347 -553 –2,632Operating income 1,564 921 2,832 1,437 2,741Margin, % 5.2 2.9 4.9 2.4 2.2
1) Material profit or loss items in operating income by business area and in Common Group costs in 2015 are specified on page 21 and in Note 7 in the Annual Report 2015 .
Change in operating income by business area
Year–over–year, % Q2 2016
Q2 2016 in local
currencies First half 2016
First half 2016 in local
currencies
Major Appliances Europe, Middle East and Africa 33.1 36.9 40.5 45.3Major Appliances North America 85.0 88.8 259.6 275.9Major Appliances Latin America -35.5 -18.7 -64.8 -56.5Major Appliances Asia/Pacific 11.1 18.9 31.0 44.7Small Appliances 250.0 172.9 516.7 337.6Professional Products 0.9 2.5 9.5 12.1Total change 69.8 81.2 97.1 114.1
17AB ELECTROLUX INTERIM REPORT JANUARY-JUNE 2016
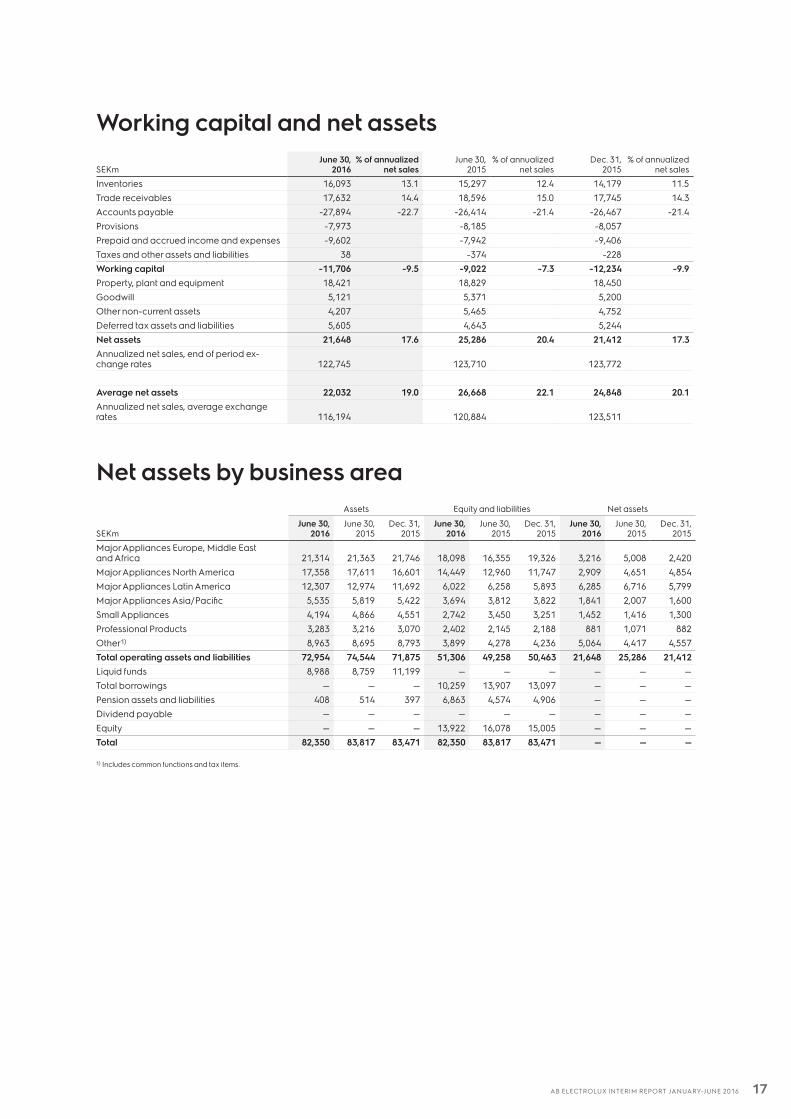
Working capital and net assets
SEKmJune 30,
2016% of annualized
net salesJune 30,
2015% of annualized
net salesDec. 31,
2015% of annualized
net sales
Inventories 16,093 13.1 15,297 12.4 14,179 11.5Trade receivables 17,632 14.4 18,596 15.0 17,745 14.3Accounts payable -27,894 -22.7 -26,414 -21.4 -26,467 -21.4Provisions -7,973 -8,185 -8,057Prepaid and accrued income and expenses -9,602 -7,942 -9,406Taxes and other assets and liabilities 38 -374 -228Working capital -11,706 -9.5 -9,022 -7.3 -12,234 -9.9Property, plant and equipment 18,421 18,829 18,450Goodwill 5,121 5,371 5,200Other non-current assets 4,207 5,465 4,752Deferred tax assets and liabilities 5,605 4,643 5,244Net assets 21,648 17.6 25,286 20.4 21,412 17.3Annualized net sales, end of period ex-change rates 122,745 123,710 123,772
Average net assets 22,032 19.0 26,668 22.1 24,848 20.1Annualized net sales, average exchange rates 116,194 120,884 123,511
Net assets by business area Assets Equity and liabilities Net assets
SEKmJune 30,
2016June 30,
2015Dec. 31,
2015June 30,
2016June 30,
2015Dec. 31,
2015June 30,
2016June 30,
2015Dec. 31,
2015
Major Appliances Europe, Middle East and Africa 21,314 21,363 21,746 18,098 16,355 19,326 3,216 5,008 2,420Major Appliances North America 17,358 17,611 16,601 14,449 12,960 11,747 2,909 4,651 4,854Major Appliances Latin America 12,307 12,974 11,692 6,022 6,258 5,893 6,285 6,716 5,799Major Appliances Asia/Pacific 5,535 5,819 5,422 3,694 3,812 3,822 1,841 2,007 1,600Small Appliances 4,194 4,866 4,551 2,742 3,450 3,251 1,452 1,416 1,300Professional Products 3,283 3,216 3,070 2,402 2,145 2,188 881 1,071 882Other1) 8,963 8,695 8,793 3,899 4,278 4,236 5,064 4,417 4,557Total operating assets and liabilities 72,954 74,544 71,875 51,306 49,258 50,463 21,648 25,286 21,412Liquid funds 8,988 8,759 11,199 — — — — — —Total borrowings — — — 10,259 13,907 13,097 — — —Pension assets and liabilities 408 514 397 6,863 4,574 4,906 — — —Dividend payable — — — — — — — — —Equity — — — 13,922 16,078 15,005 — — —Total 82,350 83,817 83,471 82,350 83,817 83,471 — — —
1) Includes common functions and tax items.
18AB ELECTROLUX INTERIM REPORT JANUARY-JUNE 2016
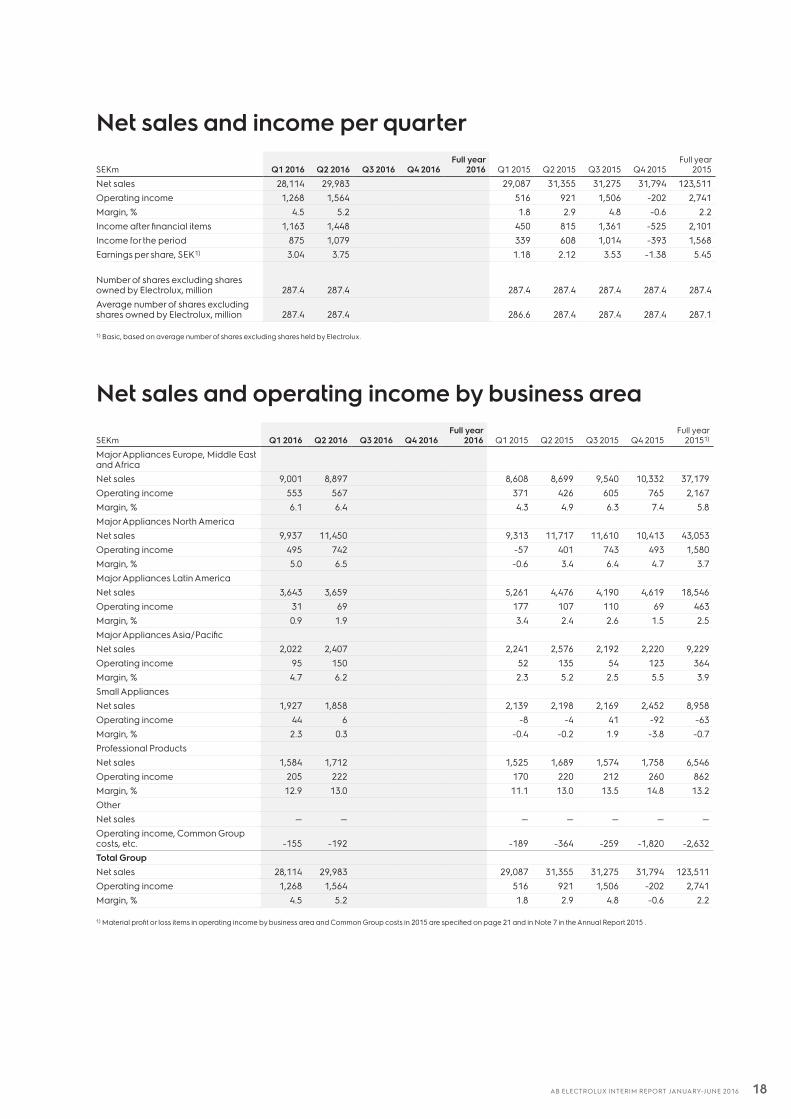
Net sales and income per quarter
SEKm Q1 2016 Q2 2016 Q3 2016 Q4 2016Full year
2016 Q1 2015 Q2 2015 Q3 2015 Q4 2015Full year
2015
Net sales 28,114 29,983 29,087 31,355 31,275 31,794 123,511Operating income 1,268 1,564 516 921 1,506 -202 2,741Margin, % 4.5 5.2 1.8 2.9 4.8 -0.6 2.2Income after financial items 1,163 1,448 450 815 1,361 -525 2,101Income for the period 875 1,079 339 608 1,014 -393 1,568Earnings per share, SEK1) 3.04 3.75 1.18 2.12 3.53 -1.38 5.45
Number of shares excluding shares owned by Electrolux, million 287.4 287.4 287.4 287.4 287.4 287.4 287.4Average number of shares excluding shares owned by Electrolux, million 287.4 287.4 286.6 287.4 287.4 287.4 287.1
1) Basic, based on average number of shares excluding shares held by Electrolux.
Net sales and operating income by business area
SEKm Q1 2016 Q2 2016 Q3 2016 Q4 2016Full year
2016 Q1 2015 Q2 2015 Q3 2015 Q4 2015Full year
20151)
Major Appliances Europe, Middle East and AfricaNet sales 9,001 8,897 8,608 8,699 9,540 10,332 37,179Operating income 553 567 371 426 605 765 2,167Margin, % 6.1 6.4 4.3 4.9 6.3 7.4 5.8Major Appliances North AmericaNet sales 9,937 11,450 9,313 11,717 11,610 10,413 43,053Operating income 495 742 -57 401 743 493 1,580Margin, % 5.0 6.5 -0.6 3.4 6.4 4.7 3.7Major Appliances Latin AmericaNet sales 3,643 3,659 5,261 4,476 4,190 4,619 18,546Operating income 31 69 177 107 110 69 463Margin, % 0.9 1.9 3.4 2.4 2.6 1.5 2.5Major Appliances Asia/PacificNet sales 2,022 2,407 2,241 2,576 2,192 2,220 9,229Operating income 95 150 52 135 54 123 364Margin, % 4.7 6.2 2.3 5.2 2.5 5.5 3.9Small AppliancesNet sales 1,927 1,858 2,139 2,198 2,169 2,452 8,958Operating income 44 6 -8 -4 41 -92 -63Margin, % 2.3 0.3 -0.4 -0.2 1.9 -3.8 -0.7Professional ProductsNet sales 1,584 1,712 1,525 1,689 1,574 1,758 6,546Operating income 205 222 170 220 212 260 862Margin, % 12.9 13.0 11.1 13.0 13.5 14.8 13.2OtherNet sales — — — — — — —Operating income, Common Group costs, etc. -155 -192 -189 -364 -259 -1,820 -2,632Total GroupNet sales 28,114 29,983 29,087 31,355 31,275 31,794 123,511Operating income 1,268 1,564 516 921 1,506 -202 2,741Margin, % 4.5 5.2 1.8 2.9 4.8 -0.6 2.2
1) Material profit or loss items in operating income by business area and Common Group costs in 2015 are specified on page 21 and in Note 7 in the Annual Report 2015 .
19AB ELECTROLUX INTERIM REPORT JANUARY-JUNE 2016
Parent Company income statementSEKm Q2 2016 Q2 2015 First half 2016 First half 2015 Full year 2015
Net sales 7,787 7,766 15,947 15,320 33,179Cost of goods sold -6,457 -6,596 -13,055 -12,928 -28,005Gross operating income 1,330 1,170 2,892 2,392 5,174Selling expenses -784 -885 -1,733 -1,819 -3,855Administrative expenses -389 -361 -706 -734 -1,789Other operating income 1 — 1 — —Other operating expenses — -282 — -282 -519Operating income 158 -358 454 -443 -989Financial income 1,491 1,393 1,714 1,975 3,830Financial expenses 85 -237 -3 -132 -702Financial items, net 1,576 1,156 1,711 1,843 3,128Income after financial items 1,734 798 2,165 1,400 2,139Appropriations 54 65 123 111 156Income before taxes 1,788 863 2,288 1,511 2,295Taxes -140 19 -252 -35 103Income for the period 1,648 882 2,036 1,476 2,398
Parent Company balance sheet
SEKmJune 30,
2016June 30,
2015Dec. 31,
2015
AssetsNon–current assets 35,204 34,965 35,214Current assets 18,819 18,711 24,559Total assets 54,023 53,676 59,773
Equity and liabilitiesRestricted equity 4,652 4,562 4,562Non–restricted equity 13,230 12,244 13,176Total equity 17,882 16,806 17,738Untaxed reserves 433 381 450Provisions 1,356 1,521 1,446Non–current liabilities 7,876 7,823 7,843Current liabilities 26,476 27,145 32,296Total equity and liabilities 54,023 53,676 59,773
20AB ELECTROLUX INTERIM REPORT JANUARY-JUNE 2016
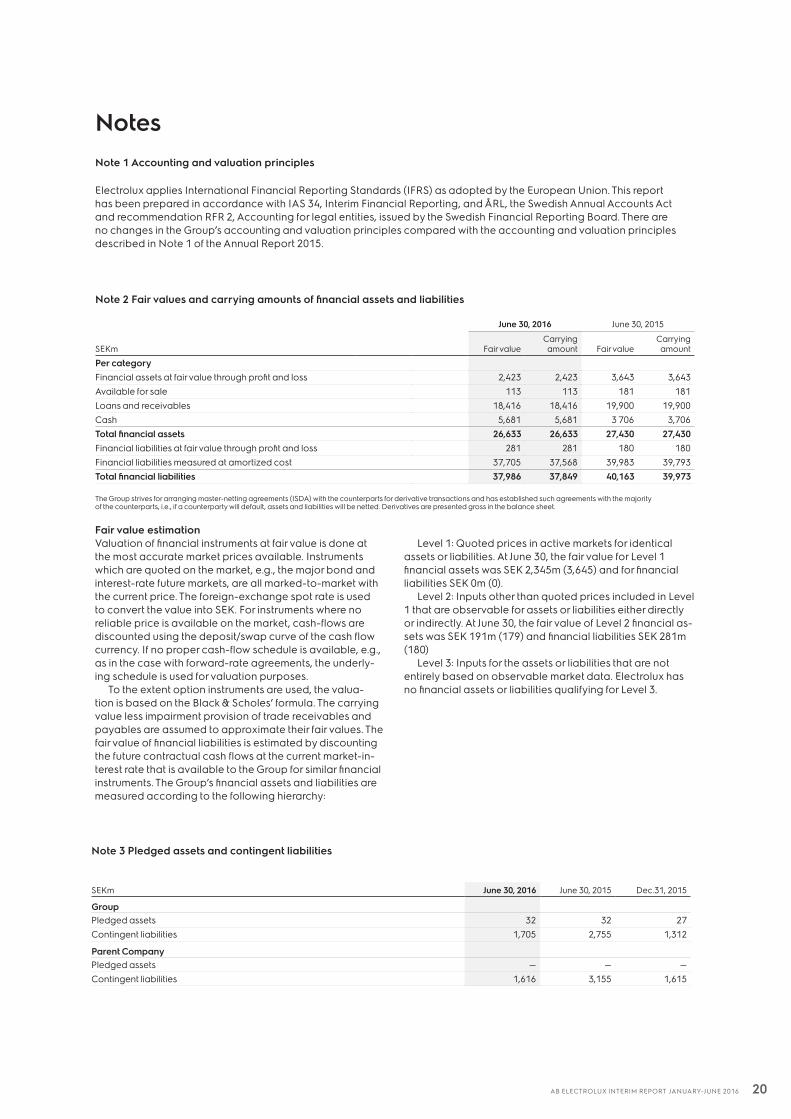
NotesNote 1 Accounting and valuation principles
Electrolux applies International Financial Reporting Standards (IFRS) as adopted by the European Union. This report has been prepared in accordance with IAS 34, Interim Financial Reporting, and ÅRL, the Swedish Annual Accounts Act and recommendation RFR 2, Accounting for legal entities, issued by the Swedish Financial Reporting Board. There are no changes in the Group’s accounting and valuation principles compared with the accounting and valuation principles described in Note 1 of the Annual Report 2015.
Note 2 Fair values and carrying amounts of financial assets and liabilities
June 30, 2016 June 30, 2015
SEKm Fair valueCarrying amount Fair value
Carrying amount
Per categoryFinancial assets at fair value through profit and loss 2,423 2,423 3,643 3,643Available for sale 113 113 181 181Loans and receivables 18,416 18,416 19,900 19,900Cash 5,681 5,681 3 706 3,706Total financial assets 26,633 26,633 27,430 27,430Financial liabilities at fair value through profit and loss 281 281 180 180Financial liabilities measured at amortized cost 37,705 37,568 39,983 39,793Total financial liabilities 37,986 37,849 40,163 39,973
The Group strives for arranging master-netting agreements (ISDA) with the counterparts for derivative transactions and has established such agreements with the majority of the counterparts, i.e., if a counterparty will default, assets and liabilities will be netted. Derivatives are presented gross in the balance sheet.
Fair value estimationValuation of financial instruments at fair value is done at the most accurate market prices available. Instruments which are quoted on the market, e.g., the major bond and interest-rate future markets, are all marked-to-market with the current price. The foreign-exchange spot rate is used to convert the value into SEK. For instruments where no reliable price is available on the market, cash-flows are discounted using the deposit/swap curve of the cash flow currency. If no proper cash-flow schedule is available, e.g., as in the case with forward-rate agreements, the underly-ing schedule is used for valuation purposes.
To the extent option instruments are used, the valua-tion is based on the Black & Scholes’ formula. The carrying value less impairment provision of trade receivables and payables are assumed to approximate their fair values. The fair value of financial liabilities is estimated by discounting the future contractual cash flows at the current market-in-terest rate that is available to the Group for similar financial instruments. The Group’s financial assets and liabilities are measured according to the following hierarchy:
Level 1: Quoted prices in active markets for identical assets or liabilities. At June 30, the fair value for Level 1 financial assets was SEK 2,345m (3,645) and for financial liabilities SEK 0m (0).
Level 2: Inputs other than quoted prices included in Level 1 that are observable for assets or liabilities either directly or indirectly. At June 30, the fair value of Level 2 financial as-sets was SEK 191m (179) and financial liabilities SEK 281m (180)
Level 3: Inputs for the assets or liabilities that are not entirely based on observable market data. Electrolux has no financial assets or liabilities qualifying for Level 3.
Note 3 Pledged assets and contingent liabilities
SEKm June 30, 2016 June 30, 2015 Dec.31, 2015
GroupPledged assets 32 32 27Contingent liabilities 1,705 2,755 1,312
Parent CompanyPledged assets — — —Contingent liabilities 1,616 3,155 1,615
21AB ELECTROLUX INTERIM REPORT JANUARY-JUNE 2016
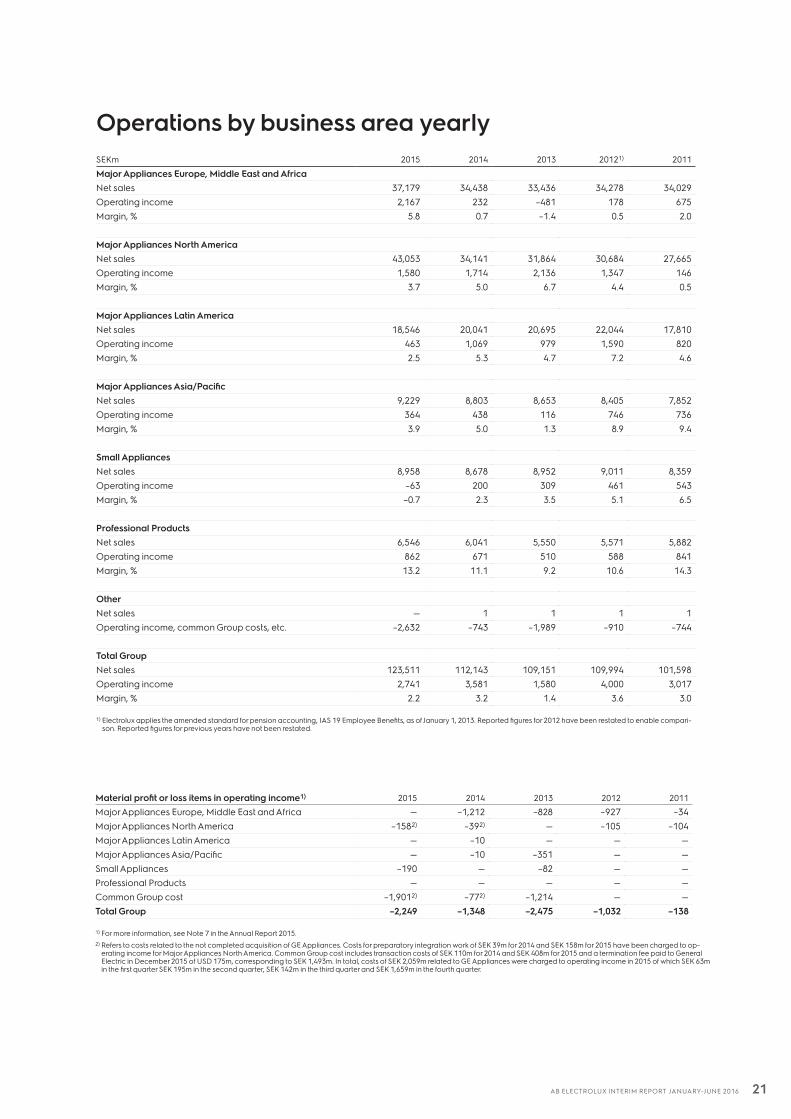
Operations by business area yearlySEKm 2015 2014 2013 20121) 2011
Major Appliances Europe, Middle East and AfricaNet sales 37,179 34,438 33,436 34,278 34,029Operating income 2,167 232 –481 178 675Margin, % 5.8 0.7 –1.4 0.5 2.0
Major Appliances North AmericaNet sales 43,053 34,141 31,864 30,684 27,665Operating income 1,580 1,714 2,136 1,347 146Margin, % 3.7 5.0 6.7 4.4 0.5
Major Appliances Latin AmericaNet sales 18,546 20,041 20,695 22,044 17,810Operating income 463 1,069 979 1,590 820Margin, % 2.5 5.3 4.7 7.2 4.6
Major Appliances Asia/PacificNet sales 9,229 8,803 8,653 8,405 7,852Operating income 364 438 116 746 736Margin, % 3.9 5.0 1.3 8.9 9.4
Small AppliancesNet sales 8,958 8,678 8,952 9,011 8,359Operating income –63 200 309 461 543Margin, % –0.7 2.3 3.5 5.1 6.5
Professional ProductsNet sales 6,546 6,041 5,550 5,571 5,882Operating income 862 671 510 588 841Margin, % 13.2 11.1 9.2 10.6 14.3
OtherNet sales — 1 1 1 1Operating income, common Group costs, etc. –2,632 –743 –1,989 –910 –744
Total GroupNet sales 123,511 112,143 109,151 109,994 101,598Operating income 2,741 3,581 1,580 4,000 3,017Margin, % 2.2 3.2 1.4 3.6 3.0
1) Electrolux applies the amended standard for pension accounting, IAS 19 Employee Benefits, as of January 1, 2013. Reported figures for 2012 have been restated to enable compari-son. Reported figures for previous years have not been restated.
Material profit or loss items in operating income1) 2015 2014 2013 2012 2011
Major Appliances Europe, Middle East and Africa — –1,212 –828 –927 –34Major Appliances North America –1582) –392) — –105 –104Major Appliances Latin America — –10 — — —Major Appliances Asia/Pacific — –10 –351 — —Small Appliances –190 — –82 — —Professional Products — — — — —Common Group cost –1,9012) –772) –1,214 — —Total Group –2,249 –1,348 –2,475 –1,032 –138
1) For more information, see Note 7 in the Annual Report 2015.2) Refers to costs related to the not completed acquisition of GE Appliances. Costs for preparatory integration work of SEK 39m for 2014 and SEK 158m for 2015 have been charged to op-
erating income for Major Appliances North America. Common Group cost includes transaction costs of SEK 110m for 2014 and SEK 408m for 2015 and a termination fee paid to General Electric in December 2015 of USD 175m, corresponding to SEK 1,493m. In total, costs of SEK 2,059m related to GE Appliances were charged to operating income in 2015 of which SEK 63m in the first quarter SEK 195m in the second quarter, SEK 142m in the third quarter and SEK 1,659m in the fourth quarter.
22AB ELECTROLUX INTERIM REPORT JANUARY-JUNE 2016
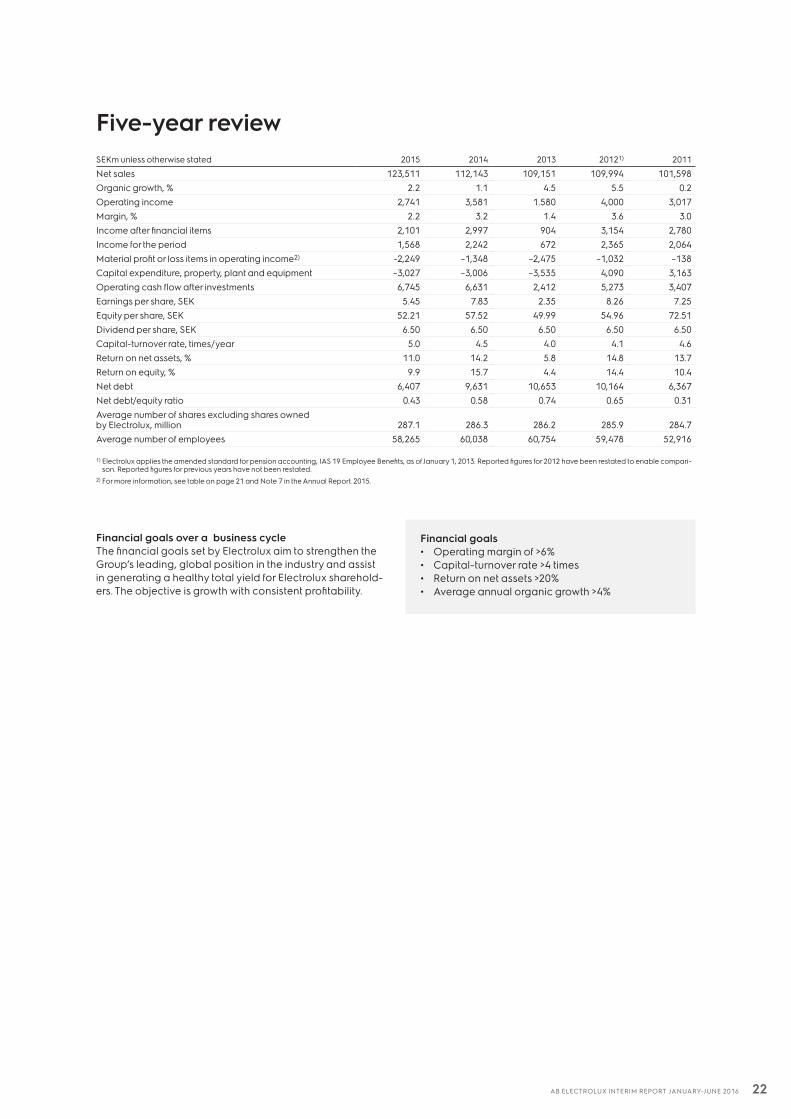
Financial goals over a business cycleThe financial goals set by Electrolux aim to strengthen the Group’s leading, global position in the industry and assist in generating a healthy total yield for Electrolux sharehold-ers. The objective is growth with consistent profitability.
Five-year reviewSEKm unless otherwise stated 2015 2014 2013 20121) 2011
Net sales 123,511 112,143 109,151 109,994 101,598Organic growth, % 2.2 1.1 4.5 5.5 0.2Operating income 2,741 3,581 1.580 4,000 3,017Margin, % 2.2 3.2 1.4 3.6 3.0Income after financial items 2,101 2,997 904 3,154 2,780Income for the period 1,568 2,242 672 2,365 2,064Material profit or loss items in operating income2) -2,249 –1,348 –2,475 –1,032 –138Capital expenditure, property, plant and equipment –3,027 –3,006 –3,535 4,090 3,163Operating cash flow after investments 6,745 6,631 2,412 5,273 3,407Earnings per share, SEK 5.45 7.83 2.35 8.26 7.25Equity per share, SEK 52.21 57.52 49.99 54.96 72.51Dividend per share, SEK 6.50 6.50 6.50 6.50 6.50Capital-turnover rate, times/year 5.0 4.5 4.0 4.1 4.6Return on net assets, % 11.0 14.2 5.8 14.8 13.7Return on equity, % 9.9 15.7 4.4 14.4 10.4Net debt 6,407 9,631 10,653 10,164 6,367Net debt/equity ratio 0.43 0.58 0.74 0.65 0.31Average number of shares excluding shares owned by Electrolux, million 287.1 286.3 286.2 285.9 284.7Average number of employees 58,265 60,038 60,754 59,478 52,916
1) Electrolux applies the amended standard for pension accounting, IAS 19 Employee Benefits, as of January 1, 2013. Reported figures for 2012 have been restated to enable compari-son. Reported figures for previous years have not been restated.
2) For more information, see table on page 21 and Note 7 in the Annual Report. 2015.
Financial goals• Operating margin of >6% • Capital-turnover rate >4 times• Return on net assets >20% • Average annual organic growth >4%
23AB ELECTROLUX INTERIM REPORT JANUARY-JUNE 2016
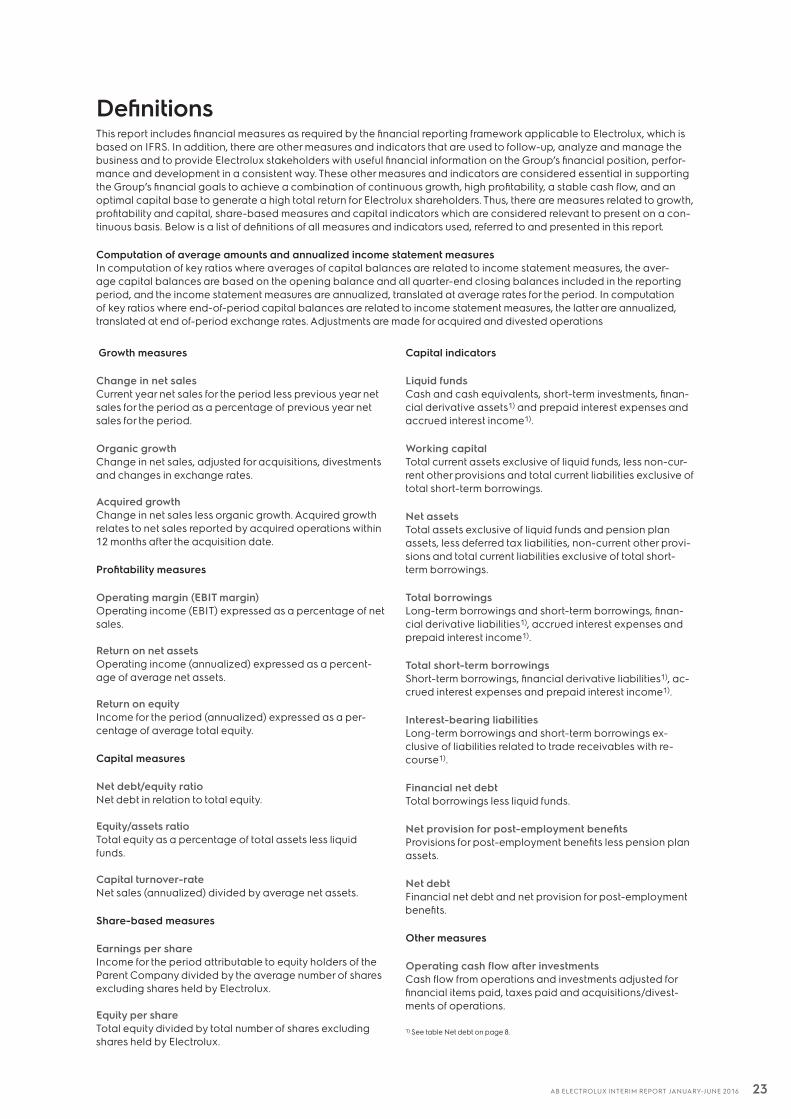
DefinitionsThis report includes financial measures as required by the financial reporting framework applicable to Electrolux, which is based on IFRS. In addition, there are other measures and indicators that are used to follow-up, analyze and manage the business and to provide Electrolux stakeholders with useful financial information on the Group’s financial position, perfor-mance and development in a consistent way. These other measures and indicators are considered essential in supporting the Group’s financial goals to achieve a combination of continuous growth, high profitability, a stable cash flow, and an optimal capital base to generate a high total return for Electrolux shareholders. Thus, there are measures related to growth, profitability and capital, share-based measures and capital indicators which are considered relevant to present on a con-tinuous basis. Below is a list of definitions of all measures and indicators used, referred to and presented in this report.
Computation of average amounts and annualized income statement measuresIn computation of key ratios where averages of capital balances are related to income statement measures, the aver-age capital balances are based on the opening balance and all quarter-end closing balances included in the reporting period, and the income statement measures are annualized, translated at average rates for the period. In computation of key ratios where end-of-period capital balances are related to income statement measures, the latter are annualized, translated at end of-period exchange rates. Adjustments are made for acquired and divested operations
Growth measures
Change in net salesCurrent year net sales for the period less previous year net sales for the period as a percentage of previous year net sales for the period.
Organic growthChange in net sales, adjusted for acquisitions, divestments and changes in exchange rates.
Acquired growthChange in net sales less organic growth. Acquired growth relates to net sales reported by acquired operations within 12 months after the acquisition date.
Profitability measures
Operating margin (EBIT margin)Operating income (EBIT) expressed as a percentage of net sales.
Return on net assetsOperating income (annualized) expressed as a percent-age of average net assets.
Return on equityIncome for the period (annualized) expressed as a per-centage of average total equity.
Capital measures
Net debt/equity ratioNet debt in relation to total equity.
Equity/assets ratioTotal equity as a percentage of total assets less liquid funds.
Capital turnover-rateNet sales (annualized) divided by average net assets.
Share-based measures
Earnings per shareIncome for the period attributable to equity holders of the Parent Company divided by the average number of shares excluding shares held by Electrolux.
Equity per shareTotal equity divided by total number of shares excluding shares held by Electrolux.
Capital indicators
Liquid fundsCash and cash equivalents, short-term investments, finan-cial derivative assets1) and prepaid interest expenses and accrued interest income1).
Working capitalTotal current assets exclusive of liquid funds, less non-cur-rent other provisions and total current liabilities exclusive of total short-term borrowings.
Net assetsTotal assets exclusive of liquid funds and pension plan assets, less deferred tax liabilities, non-current other provi-sions and total current liabilities exclusive of total short-term borrowings.
Total borrowingsLong-term borrowings and short-term borrowings, finan-cial derivative liabilities1), accrued interest expenses and prepaid interest income1).
Total short-term borrowingsShort-term borrowings, financial derivative liabilities1), ac-crued interest expenses and prepaid interest income1).
Interest-bearing liabilitiesLong-term borrowings and short-term borrowings ex-clusive of liabilities related to trade receivables with re-course1).
Financial net debtTotal borrowings less liquid funds.
Net provision for post-employment benefitsProvisions for post-employment benefits less pension plan assets.
Net debtFinancial net debt and net provision for post-employment benefits.
Other measures
Operating cash flow after investmentsCash flow from operations and investments adjusted for financial items paid, taxes paid and acquisitions/divest-ments of operations.
1) See table Net debt on page 8.

24AB ELECTROLUX INTERIM REPORT JANUARY-JUNE 2016
President and CEO Jonas Samuelson’s comments on the second quarter results 2016Today’s press release is available on the Electrolux website www.electroluxgroup.com/ir
Telephone conference 09.00 CET A telephone conference is held at 09.00 CET today, July 20. The conference will be chaired by Jonas Samuelson, President and CEO of Electrolux. Mr. Samuelson will be accompanied by Anna Ohlsson-Leijon, CFO.
Details for participation by telephone are as follows:Participants in Sweden should call +46 8 505 564 74Participants in UK/Europe should call +44 203 364 5374Participants in US should call +1 855 753 2230
Slide presentation for download: www.electroluxgroup.com/ir
Link to webcast: www.electroluxgroup.com/q2-2016
For further information, please contact:Catarina Ihre, Vice President Investor Relations at +46 8 738 60 87
Merton Kaplan, Analyst Investor Relations at+46 8 738 70 06
Website: www.electroluxgroup.com
AB Electrolux (publ) 556009-4178Postal address SE-105 45 Stockholm, Sweden Visiting address S:t Göransgatan 143, StockholmTelephone: +46 (0)8 738 60 00
Shareholders’ information
Calendar 2016Interim report January - June July 20Interim report January - September October 28