Efficiency of hand-rim propulsion: Synchronous vs ... · RIJKSUNIVERSITEIT GRONINGEN Efficiency of...
159
UNIVERSITY OF GRONINGEN Efficiency of hand-rim propulsion: Synchronous vs. Asynchronous push strategies PhD Thesis John Lenton 24/02/2012
Transcript of Efficiency of hand-rim propulsion: Synchronous vs ... · RIJKSUNIVERSITEIT GRONINGEN Efficiency of...
UNIVERSITY OF GRONINGEN
Efficiency of hand-rim propulsion: Synchronous vs. Asynchronous push
strategies PhD Thesis
John Lenton
24/02/2012

RIJKSUNIVERSITEIT GRONINGEN
Efficiency of hand-rim propulsion: Synchronous vs. Asynchronous push strategies
Proefschrift
Ter verkrijging van het doctoraat in de
Medische Wetenschappen
Aan de Rijksuniversiteit Groningen
Op gezag van de
Rector Magnificus, Dr. E. Sterken,
in het openbaar te verdedigen op
[day] [Month] 2012
om [Time] uur
door
John Paul Lenton
geboren op 15 August 1980
te
Promoters: Prof. dr. L.H.V. van der Woude Center for Human Movement Sciences, Center for Rehabilitation, University Medical Center Groningen, University of Groningen, the Netherlands.
Prof. dr. N.E. Fowler Department of Exercise and Sport Science, Institute for Performance Research, Manchester Metropolitan University Cheshire, UK.
Co-promoter: Dr. V.L. Tolfrey Peter Harrison Centre for Disability Sport, School of Sport, Exercise & Health Sciences, Loughborough University, UK.
Committee: Prof. dr. K. Postema Faculty of Medical Sciences, Rehabilitation Department, Center for Rehabilitation, UMCG, University of Groningen, the Netherlands. Prof. dr. Y. Vanlandewijck
Faculty of Kinesiology and Rehabilitation Sciences, Department of Rehabilitation Sciences, Katholieke Universiteit Leuven, Belgium. Prof. dr. H.E.J. Veeger Faculty of Human Movement Sciences, Vrije Universiteit (VU), Amsterdam, the Netherlands.
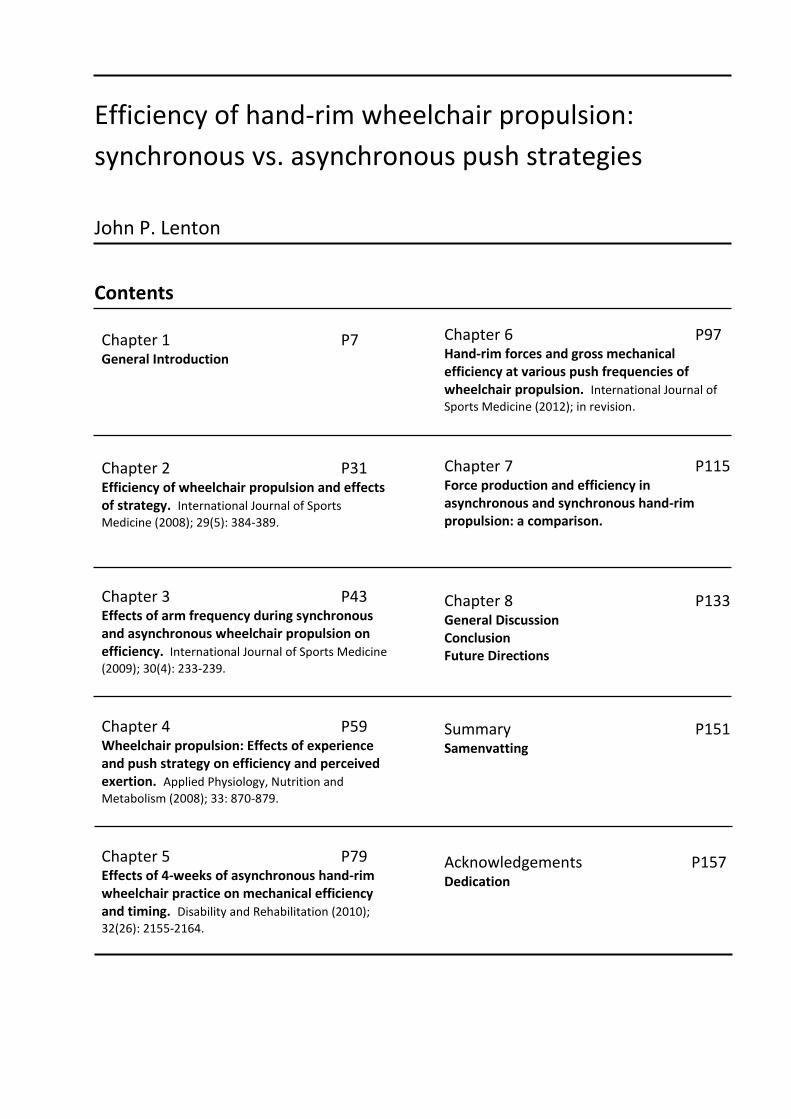
Efficiency of hand-rim wheelchair propulsion:
synchronous vs. asynchronous push strategies
John P. Lenton
Contents
Chapter 1 P7 General Introduction
Chapter 2 P31 Efficiency of wheelchair propulsion and effects of strategy. International Journal of Sports
Medicine (2008); 29(5): 384-389.
Chapter 3 P43 Effects of arm frequency during synchronous and asynchronous wheelchair propulsion on efficiency. International Journal of Sports Medicine
(2009); 30(4): 233-239.
Chapter 4 P59 Wheelchair propulsion: Effects of experience and push strategy on efficiency and perceived exertion. Applied Physiology, Nutrition and
Metabolism (2008); 33: 870-879.
Chapter 5 P79 Effects of 4-weeks of asynchronous hand-rim wheelchair practice on mechanical efficiency and timing. Disability and Rehabilitation (2010);
32(26): 2155-2164.
Chapter 6 P97 Hand-rim forces and gross mechanical efficiency at various push frequencies of wheelchair propulsion. International Journal of
Sports Medicine (2012); in revision.
Chapter 7 P115 Force production and efficiency in asynchronous and synchronous hand-rim propulsion: a comparison.
Chapter 8 P133 General Discussion Conclusion Future Directions
Summary P151 Samenvatting
Acknowledgements P157 Dedication

Synchronous vs. Asynchronous push strategies Chapter 1
7
Chapter 1
General Introduction
Hand-rim wheelchair propulsion
Hand-rim wheelchair propulsion is a necessity in the daily activities of many people with a
spinal cord injury or other lower limb impairment. It is estimated that 1% of the total population
are wheelchair dependent (www.newdisability.com). Hence in 2010 there were in the region of
8.1 million wheelchair users throughout Europe and approximately 68.5 million worldwide.
Despite the low mechanical efficiency associated with hand-rim wheelchair propulsion, it is
estimated that 90% of all wheelchairs are hand-rim propelled and this continues to be used as the
most common mode of propulsion in daily life and wheelchair sports [47]. The last few decades
have seen researchers contribute significantly to the understanding of wheelchair propulsion
during rehabilitation, daily activity and sports performance. Research is becoming increasingly
important in the effort for the optimisation of propulsion to help reduce the physical strain [67],
and mechanical load placed upon the upper extremity [119]. Nevertheless, despite the general
acceptance of the low mechanical efficiency and high mechanical load, relatively few studies have
attempted to explain and understand this low mechanical efficiency and consequently the limited
wheelchair propulsion performance.
Researchers have employed a variety of methods to investigate a wide range of questions.
These questions can be categorised into performance associated issues (e.g. power production,
propulsion technique and mechanical efficiency), disability related issues (e.g. human capacity,
skill and injury risks) and the ergonomics of wheelchair design (e.g. wheel size, seat height). Van
der Woude and colleagues [130, 134] suggested that three basic qualities of the wheelchair-user
combination are crucial to determine the final performance in wheelchair propulsion. First, there
is the user, who produces the energy and work for propulsion; secondly, the design and technical
characteristics of the wheelchair; finally the interaction of the wheelchair and user which
determine the efficiency of the energy transfer from the user to the wheelchair. To fully
Synchronous vs. Asynchronous push strategies Chapter 1
8
understand the low mechanical efficiency of wheelchair propulsion would require studies that
cover a wide range of topics including mechanical, physiological, health related consequences and
biomechanical aspects of wheelchair propulsion.
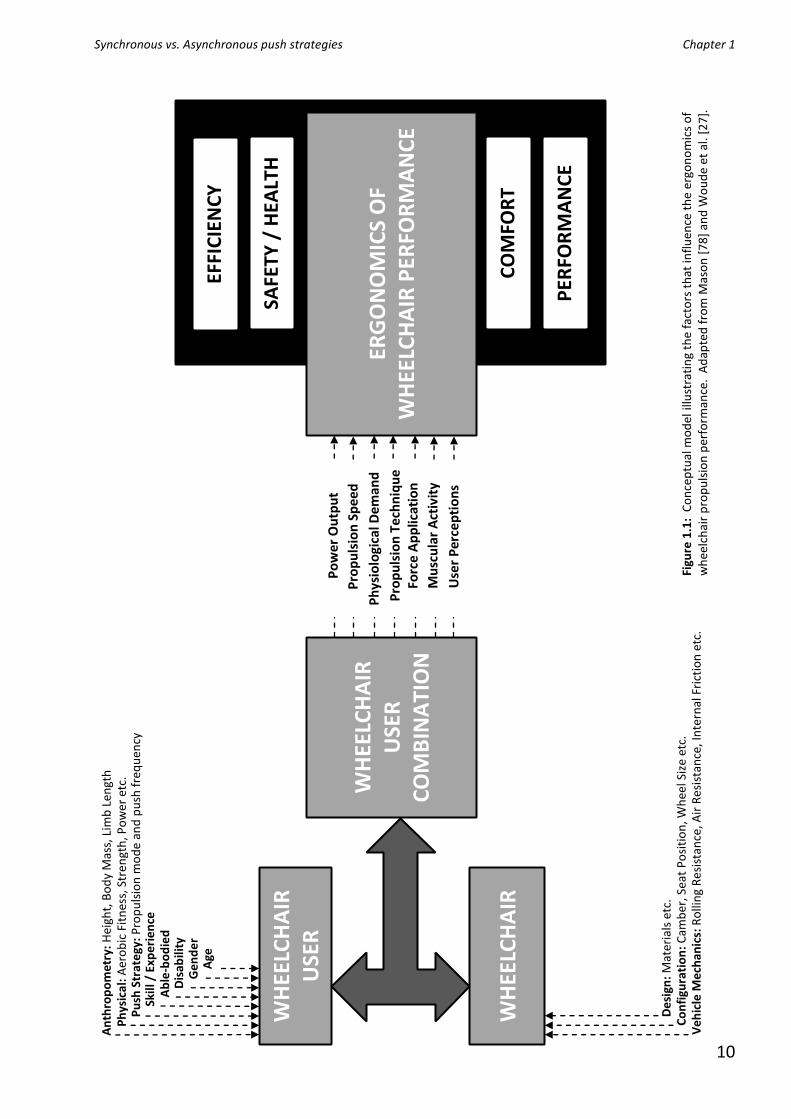
There are numerous factors that can have an effect on wheelchair propulsion performance
and/or efficiency and any conceptual model needs to incorporate these using an interdisciplinary
approach (Figure 1.1). Research into mechanical efficiency and performance needs to include a
focus on the propulsion technique and modes of propulsion; i.e. push strategies adopted by
individuals. Through practice and training, individuals often learn to adopt different push
strategies that meet their needs and the different conditions of their chosen sport or daily activity.
Push strategy is a very general term and can be broken down into two more specific terms. When
using the term ‘push strategy’ in the present thesis, the term comprises of push frequency (the
number of pushes or total number of left and right arm movements performed per minute) and
propulsion mode, i.e. whether the hands contact the hand rim together (synchronous) or
alternately (asynchronous). Synchronous propulsion is the movement pattern most commonly
seen during straight line wheelchair propulsion and is characterised by both hands contacting the
hand-rim at the same time. Whereas in the asynchronous propulsion the hands contact the hand-
rim alternatively with the left and right arm movements approximately 180o out of phase.
Little has been reported on the efficiency of different propulsion modes or mode / push-
frequency combinations (push strategies). The limited evidence available suggests that lower
push frequencies and longer simultaneous push strokes are more efficient and potentially reduce
the risk of injury to the upper extremity [9]. Early studies demonstrate that mechanical efficiency
is affected by changes in push frequency for both able-bodied inexperienced individuals and
experienced wheelchair users [46, 135]. The majority of research has focussed on synchronous
propulsion, with only a few studies investigating the asynchronous mode [43, 48]. The
predominance of studies focused on synchronous propulsion is to be expected as this is the most
common mode of propulsion in most sporting situations and activities of daily living. However,
increased interest and observations in wheelchair sports such as basketball and tennis reveal that
asynchronous propulsion is used extensively in these activities. It is therefore important to
explore this alternative means of propulsion. It would appear that the asynchronous propulsion
mode involves a different range of motion to that of the synchronous mode and thus will present
different performance demands.
Previous research has demonstrated asynchronous force application to be as good as, or
superior to, the synchronous mode in terms of oxygen cost [43]. It was suggested that the greater
continuity of hand-rim force application during asynchronous propulsion reduced fluctuations in
hand-rim velocity, and thereby decreased the acceleration and work requirement of each stroke.
Synchronous vs. Asynchronous push strategies Chapter 1
9
Goosey-Tolfrey & Kirk [48] also indicated that the asynchronous mode was preferred at higher
push frequencies. Research suggests that unilateral movements are advantageous over bilateral
movements as they take advantage of inherent neural pathways for the reciprocal stimulation of
the contralateral muscle groups for improved performance [31]. There is the suggestion that
deficits in bilateral force can be large enough to be functionally important and could well account
for the 20% deficit reported by van Soest and colleagues [103] in two-legged jump height vs. one-
legged jump height. Research by Vandervoort et al. [117] showed that the bilateral deficit
increases with movement velocity, which may explain some of the reduction in gross efficiency
associated with increased push frequency in wheelchair propulsion. Synchronous and
asynchronous research has generated interest in other forms of upper-body exercise, handcycling
[1, 25, 27, 127, 132] and arm-cranking [64, 83]. However, the aforementioned literature presents
conflicting results with the synchronous mode more efficient in handcycling whereas in arm-
cranking the asynchronous is either more efficient or reports no advantage of either mode.
The developing interests in wheelchair sports which utilise an asynchronous movement
pattern make investigation of such a propulsion mode timely. There is a general paucity of
research investigating the mechanics of this propulsion mode and so it is difficult for coaches,
rehabilitation professionals and wheelchair manufacturers to know what is best to adapt, the
technique or chair configuration to achieve optimal results. Since wheelchair users are able to
choose which propulsion strategy they wish to adopt, it is important that any investigation of the
asynchronous propulsion mode compares performance measures with those of the alternative
and predominantly utilised synchronous propulsion mode to allow meaningful evaluation.
Examining of the efficacy of the asynchronous movement pattern may also provide further insight
into the relatively low gross efficiency reported for wheelchair propulsion.
Synchronous vs. Asynchronous push strategies Chapter 1
10
Pro
pu
lsio
n T
ech
niq
ue
Pro
pu
lsio
n S
pe
ed
Ph
ysio
logi
cal D
em
and
Forc
e A
pp
licat
ion
Mu
scu
lar
Act
ivit
y
Use
r P
erce
pti
on
s
Po
we
r O
utp
ut
WH
EELC
HA
IR
USE
R
WH
EELC
HA
IR
WH
EELC
HA
IR
USE
R
CO
MB
INA
TIO
N
ERG
ON
OM
ICS
OF
WH
EELC
HA
IR P
ERFO
RM
AN
CE
EFFI
CIE
NC
Y
SAFE
TY /
HEA
LTH
CO
MFO
RT
PER
FOR
MA
NC
E
Ve
hic
le M
ech
anic
s: R
olli
ng
Re
sist
ance
, Air
Re
sist
ance
, In
tern
al F
rict
ion
etc
. C
on
figu
rati
on
: C
amb
er, S
eat
Po
siti
on
, Wh
eel S
ize
etc.
D
esi
gn:
Mat
eria
ls e
tc.
An
thro
po
met
ry:
Hei
ght,
Bo
dy
Mas
s, L
imb
Len
gth
P
hys
ica
l: A
ero
bic
Fit
nes
s, S
tre
ngt
h, P
ow
er e
tc.
Ge
nd
er
Dis
abili
ty
Skill
/ E
xpe
rie
nce
Age
Ab
le-b
od
ied
Pu
sh S
trat
egy
: P
rop
uls
ion
mo
de
and
pu
sh f
req
uen
cy
Figu
re 1
.1:
Co
nce
ptu
al m
od
el il
lust
rati
ng
the
fact
ors
th
at in
flu
ence
th
e er
gon
om
ics
of
wh
eelc
hai
r p
rop
uls
ion
per
form
ance
. A
dap
ted
fro
m M
aso
n [
78
] an
d W
ou
de
et a
l. [2
7].
Synchronous vs. Asynchronous push strategies Chapter 1
11
Methodology Previous studies have highlighted a number of methodological considerations when designing
investigations that study wheelchair propulsion. There are issues relating to the nature of the task
including the choice of over-ground or ergometer based propulsion, the wheelchair configuration,
and relative or absolute work. In addition there are concerns relating to the sample population to
be used including whether to use habitual wheelchair users, who normally have some form of
musculoskeletal or neuromuscular impairment, or individuals with no disability. Level of
experience in wheelchair propulsion is also worthy of consideration. In addition there are a
number of questions relating to measurement techniques and determination of key performance
variables. The following section will seek to outline critical methodological issues relating to each
of these areas.
Experimental set-up The most ecologically valid way to assess wheelchair propulsion would be to use over-ground
propulsion as this is the task that performers are required to complete in their day-to-day
locomotion and in sport. However, assessing over-ground propulsion presents a range of
challenges to the investigator and is the least standardised. The nature of the floor surface, its
hardness and friction characteristics have a direct impact upon the rolling resistance and thus the
work requirements of the propulsion task. Investigations should control and/or report these
characteristics. At present there is no agreed standard for ‘normal’ floor conditions to allow
comparison between studies. In addition to the rolling resistance, the use of over-ground
propulsion would introduce an element of aerodynamic drag proportional to the relative air speed
and the size and shape of the wheelchair and user. Such factors make the determination and
control of the work associated with over-ground propulsion difficult to standardise, compromising
the ability to make comparisons between experimental conditions.
To address the problems of controlling and determining work in over-ground propulsion,
research has employed the motor driven treadmill with researchers suggesting that this is the
most mechanically realistic simulation of wheelchair propulsion [5, 35, 109, 113, 118, 128].
However, wheelchair ergometers have also been used and there are three types. Firstly, is the
earliest type which is an extension of the popular Monark bicycle ergometer [12, 42, 43, 69].
Secondly are computerised stationary wheelchair simulators in which wheelchair characteristics
are kept equal for all individuals [54-57, 75, 84, 104, 121]. Finally the use of a wheelchair roller
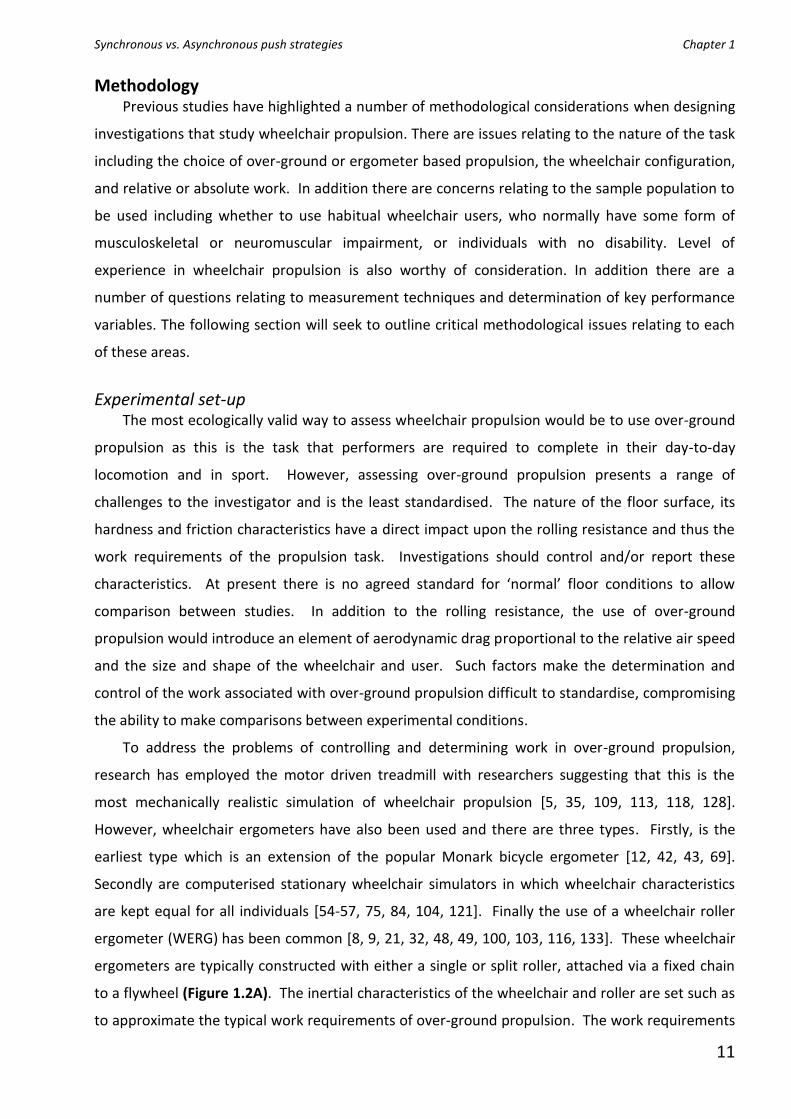
ergometer (WERG) has been common [8, 9, 21, 32, 48, 49, 100, 103, 116, 133]. These wheelchair
ergometers are typically constructed with either a single or split roller, attached via a fixed chain
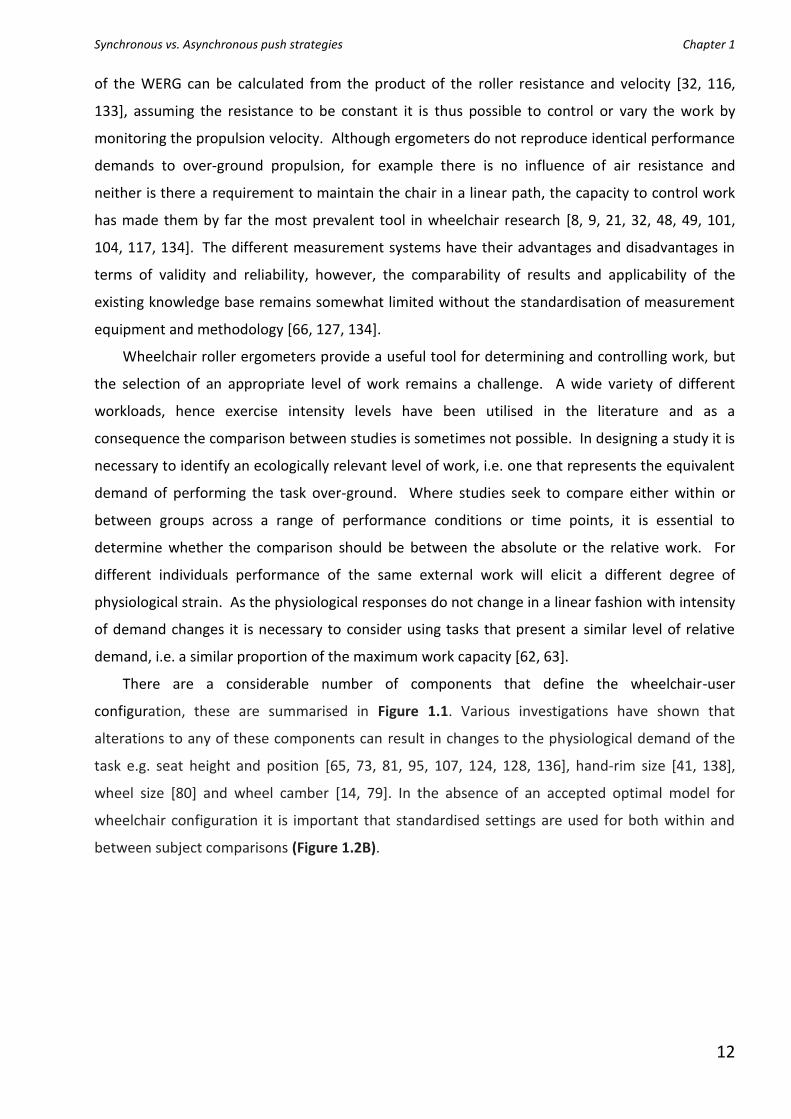
to a flywheel (Figure 1.2A). The inertial characteristics of the wheelchair and roller are set such as
to approximate the typical work requirements of over-ground propulsion. The work requirements
Synchronous vs. Asynchronous push strategies Chapter 1
12
of the WERG can be calculated from the product of the roller resistance and velocity [32, 116,
133], assuming the resistance to be constant it is thus possible to control or vary the work by
monitoring the propulsion velocity. Although ergometers do not reproduce identical performance
demands to over-ground propulsion, for example there is no influence of air resistance and
neither is there a requirement to maintain the chair in a linear path, the capacity to control work
has made them by far the most prevalent tool in wheelchair research [8, 9, 21, 32, 48, 49, 101,
104, 117, 134]. The different measurement systems have their advantages and disadvantages in
terms of validity and reliability, however, the comparability of results and applicability of the
existing knowledge base remains somewhat limited without the standardisation of measurement
equipment and methodology [66, 127, 134].
Wheelchair roller ergometers provide a useful tool for determining and controlling work, but
the selection of an appropriate level of work remains a challenge. A wide variety of different
workloads, hence exercise intensity levels have been utilised in the literature and as a
consequence the comparison between studies is sometimes not possible. In designing a study it is
necessary to identify an ecologically relevant level of work, i.e. one that represents the equivalent
demand of performing the task over-ground. Where studies seek to compare either within or
between groups across a range of performance conditions or time points, it is essential to
determine whether the comparison should be between the absolute or the relative work. For
different individuals performance of the same external work will elicit a different degree of
physiological strain. As the physiological responses do not change in a linear fashion with intensity
of demand changes it is necessary to consider using tasks that present a similar level of relative
demand, i.e. a similar proportion of the maximum work capacity [62, 63].
There are a considerable number of components that define the wheelchair-user
configuration, these are summarised in Figure 1.1. Various investigations have shown that
alterations to any of these components can result in changes to the physiological demand of the
task e.g. seat height and position [65, 73, 81, 95, 107, 124, 128, 136], hand-rim size [41, 138],
wheel size [80] and wheel camber [14, 79]. In the absence of an accepted optimal model for
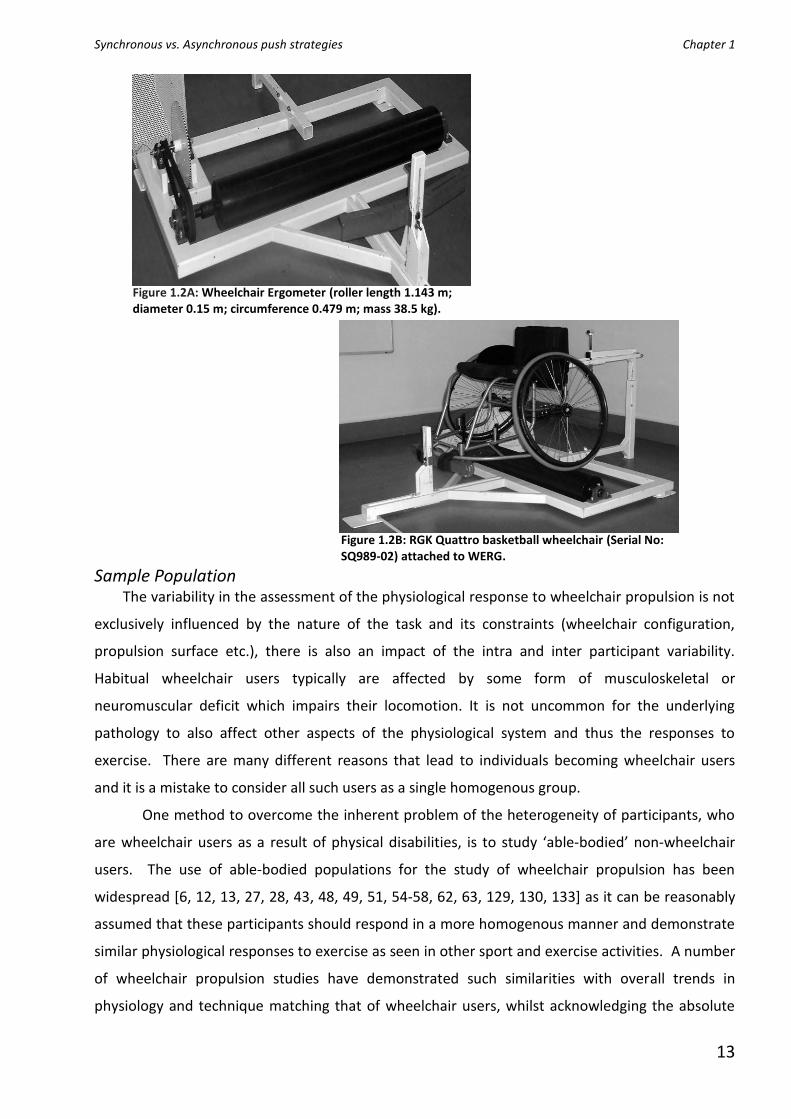
wheelchair configuration it is important that standardised settings are used for both within and
between subject comparisons (Figure 1.2B).
Synchronous vs. Asynchronous push strategies Chapter 1
13
Sample Population The variability in the assessment of the physiological response to wheelchair propulsion is not
exclusively influenced by the nature of the task and its constraints (wheelchair configuration,
propulsion surface etc.), there is also an impact of the intra and inter participant variability.
Habitual wheelchair users typically are affected by some form of musculoskeletal or
neuromuscular deficit which impairs their locomotion. It is not uncommon for the underlying
pathology to also affect other aspects of the physiological system and thus the responses to
exercise. There are many different reasons that lead to individuals becoming wheelchair users
and it is a mistake to consider all such users as a single homogenous group.
One method to overcome the inherent problem of the heterogeneity of participants, who
are wheelchair users as a result of physical disabilities, is to study ‘able-bodied’ non-wheelchair
users. The use of able-bodied populations for the study of wheelchair propulsion has been
widespread [6, 12, 13, 27, 28, 43, 48, 49, 51, 54-58, 62, 63, 129, 130, 133] as it can be reasonably
assumed that these participants should respond in a more homogenous manner and demonstrate
similar physiological responses to exercise as seen in other sport and exercise activities. A number
of wheelchair propulsion studies have demonstrated such similarities with overall trends in
physiology and technique matching that of wheelchair users, whilst acknowledging the absolute
Figure 1.2A: Wheelchair Ergometer (roller length 1.143 m; diameter 0.15 m; circumference 0.479 m; mass 38.5 kg).
Figure 1.2B: RGK Quattro basketball wheelchair (Serial No: SQ989-02) attached to WERG.
Synchronous vs. Asynchronous push strategies Chapter 1
14
differences [28, 63, 89, 129, 130, 135]. Differences identified through manipulation of constraints
can more easily be attributed to such changes in constraint and do not risk conflating aspects of
impairment with task changes.
Where aspects of either the propulsion technique or wheelchair configuration are to be
altered, the employment of experienced users does introduce an element of learning and
habituation that may skew results towards the most familiar, synchronous mode of propulsion
[12, 69, 89, 135]. The employment of relative novice participants, usually able-bodied individuals,
presents an opportunity to manipulate the task constraints without the interference of exposure
bias. Propulsion experience evidently influences energy cost, mechanical efficiency and technique
of wheelchair propulsion [12, 89]. Studies have investigated the differences in mechanical
efficiency between experienced wheelchair dependent individuals and non-experienced able-
bodied individuals [135]. The results suggest that experience produces significantly higher gross
efficiency in comparison to inexperienced users.
Learning studies are limited in the wheelchair propulsion literature [3, 54-57, 72, 94].
However, studies have demonstrated that, through practice and implicit learning; individuals
become more efficient [12, 89, 135]. Sparrow [114] stated that with practice, the movement
pattern will be refined to approximate more closely that pattern which is mechanically and
physiologically optimal within the constraints of the task.
Measurement Techniques Mechanical efficiency
Mechanical efficiency represents the ratio between the energy cost and work done for a task.
This is easy to understand and applied for simple machines but becomes more complex when
related to whole body movement and the interaction of the human user with a mechanical device
such as a wheelchair. Throughout the literature many different approaches to quantifying
efficiency have been employed and these are addressed in some detail by Cavanagh & Kram [17,
18]. The most common definition used for evaluation of wheelchair propulsion is that of gross
efficiency. Gross efficiency is defined as the ratio of the task related external work accomplished
to the metabolic energy expended to perform that work (i.e. Gross efficiency = External Work /
Metabolic cost). Typical gross efficiency values in wheelchair propulsion have been shown to vary
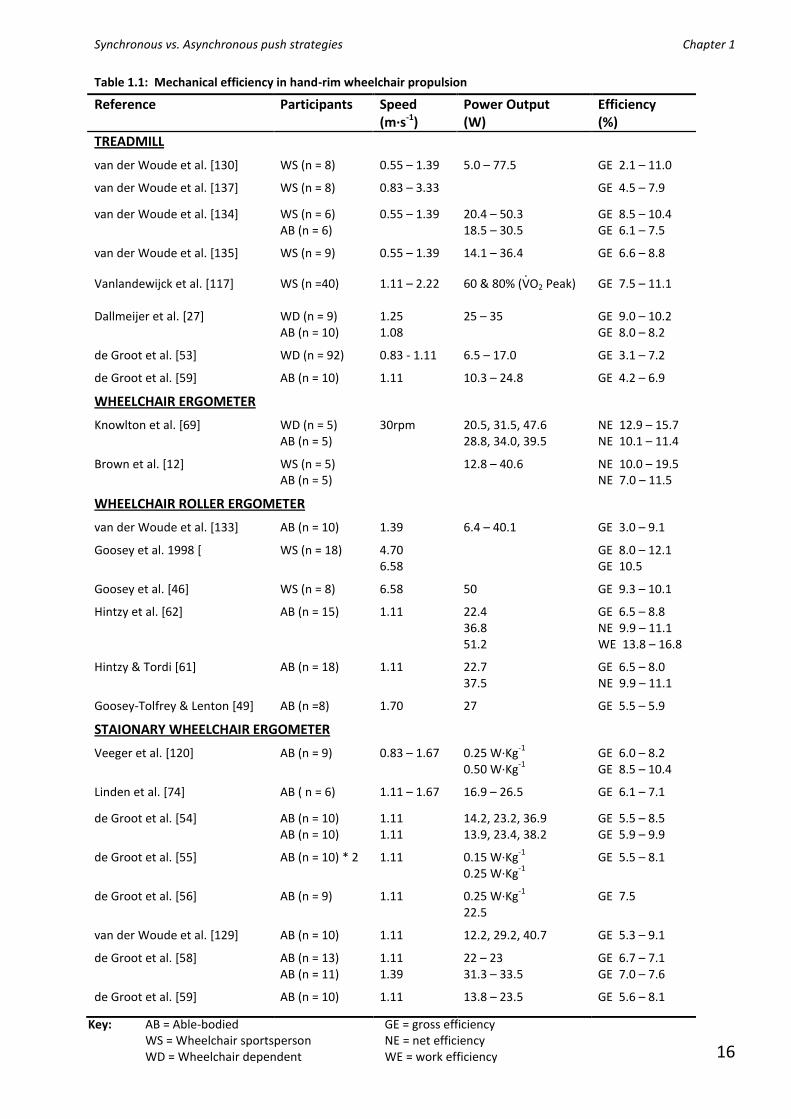
between 2 and 11% under conditions common to every-day activities [62, 63, 121, 131, 135], see
Table 1. However, in sporting situations values can be as high as 12% [45, 118] dependent on the
propulsion velocity and population studied. The range of mechanical efficiency values reported in
the literature reinforces the importance of accurate reporting and control of the experimental
environment to allow the underlying mechanisms for such differences to be explained. It is
essential that the work and metabolic demand can each be accurately determined. On the other
Synchronous vs. Asynchronous push strategies Chapter 1
15
hand the gross efficiency of hand-rim wheelchair propulsion in comparison with alternate forms of
upper body-body exercise remains substantially lower to that of handcycling 12-15% [25, 122, 123,
130] and arm-cranking 14-20% [50, 76, 91, 125] dependent on exercise conditions.
Although the majority of studies in wheelchair propulsion and the other modes of upper body
exercise have focused upon gross efficiency [12, 46, 54-57, 108, 118, 126, 130, 136] there are
other indices which can be used. Net efficiency, work efficiency and delta efficiency all differ in
terms of base-line subtraction from the metabolic energy expenditure [39, 126]. These indices are
considered to be more meaningful estimations of the true muscular efficiency since they account
for the unmeasured internal work done. The use of work efficiency is particularly difficult by the
challenges of creating a representative ‘zero-load’ condition to set as a baseline. Regardless of
definition, all efficiency indices require the determination of the metabolic cost for the work done.
This is most conveniently done by estimating the calorific equivalence from expired air, the
product of ·VO2 and the oxygen energetic equivalent by using the associated measurements of the
respiratory exchange ratio (RER) and standard conversion tables [90]. Utilisation of ·VO2 data to
estimate energy expenditure is predicated on the assumption that the dominant source of
metabolism is aerobic. At higher relative exercise intensities this assumption becomes challenged
as a greater proportion of energy is derived from anaerobic sources. It is therefore essential that,
when determining the efficiency of wheelchair propulsion, the exercise intensity is set at a level
whereby all participants can complete all tasks and maintain a steady state sub-maximal,
predominantly aerobic level of exertion.
Synchronous vs. Asynchronous push strategies Chapter 1
16
Table 1.1: Mechanical efficiency in hand-rim wheelchair propulsion
Reference
Participants Speed (m·s-1)
Power Output (W)
Efficiency (%)
TREADMILL
van der Woude et al. [130] WS (n = 8) 0.55 – 1.39 5.0 – 77.5 GE 2.1 – 11.0
van der Woude et al. [137] WS (n = 8) 0.83 – 3.33 GE 4.5 – 7.9
van der Woude et al. [134]
WS (n = 6) AB (n = 6)
0.55 – 1.39 20.4 – 50.3 18.5 – 30.5
GE 8.5 – 10.4 GE 6.1 – 7.5
van der Woude et al. [135] WS (n = 9) 0.55 – 1.39 14.1 – 36.4 GE 6.6 – 8.8
Vanlandewijck et al. [117] WS (n =40) 1.11 – 2.22 60 & 80% (·VO2 Peak)
GE 7.5 – 11.1
Dallmeijer et al. [27]
WD (n = 9) AB (n = 10)
1.25
1.08 25 – 35
GE 9.0 – 10.2 GE 8.0 – 8.2
de Groot et al. [53] WD (n = 92) 0.83 - 1.11 6.5 – 17.0 GE 3.1 – 7.2
de Groot et al. [59] AB (n = 10) 1.11
10.3 – 24.8 GE 4.2 – 6.9
WHEELCHAIR ERGOMETER
Knowlton et al. [69]
WD (n = 5) AB (n = 5)
30rpm 20.5, 31.5, 47.6 28.8, 34.0, 39.5
NE 12.9 – 15.7 NE 10.1 – 11.4
Brown et al. [12]
WS (n = 5) AB (n = 5)
12.8 – 40.6 NE 10.0 – 19.5 NE 7.0 – 11.5
WHEELCHAIR ROLLER ERGOMETER
van der Woude et al. [133] AB (n = 10) 1.39 6.4 – 40.1 GE 3.0 – 9.1
Goosey et al. 1998 [ WS (n = 18) 4.70 6.58
GE 8.0 – 12.1 GE 10.5
Goosey et al. [46] WS (n = 8) 6.58 50 GE 9.3 – 10.1
Hintzy et al. [62] AB (n = 15) 1.11 22.4 36.8 51.2
GE 6.5 – 8.8 NE 9.9 – 11.1 WE 13.8 – 16.8
Hintzy & Tordi [61] AB (n = 18) 1.11 22.7 37.5
GE 6.5 – 8.0 NE 9.9 – 11.1
Goosey-Tolfrey & Lenton [49] AB (n =8) 1.70 27 GE 5.5 – 5.9
STAIONARY WHEELCHAIR ERGOMETER
Veeger et al. [120]
AB (n = 9) 0.83 – 1.67 0.25 W·Kg-1
0.50 W·Kg-1
GE 6.0 – 8.2 GE 8.5 – 10.4
Linden et al. [74] AB ( n = 6) 1.11 – 1.67 16.9 – 26.5 GE 6.1 – 7.1
de Groot et al. [54] AB (n = 10) 1.11 14.2, 23.2, 36.9 GE 5.5 – 8.5 AB (n = 10) 1.11 13.9, 23.4, 38.2 GE 5.9 – 9.9
de Groot et al. [55] AB (n = 10) * 2 1.11 0.15 W·Kg-1
0.25 W·Kg-1
GE 5.5 – 8.1
de Groot et al. [56]
AB (n = 9) 1.11 0.25 W·Kg-1
22.5 GE 7.5
van der Woude et al. [129] AB (n = 10) 1.11 12.2, 29.2, 40.7 GE 5.3 – 9.1
de Groot et al. [58] AB (n = 13) AB (n = 11)
1.11 1.39
22 – 23 31.3 – 33.5
GE 6.7 – 7.1 GE 7.0 – 7.6
de Groot et al. [59] AB (n = 10) 1.11 13.8 – 23.5 GE 5.6 – 8.1
Key: AB = Able-bodied GE = gross efficiency WS = Wheelchair sportsperson NE = net efficiency WD = Wheelchair dependent WE = work efficiency
Synchronous vs. Asynchronous push strategies Chapter 1
17
Push/cycle frequency The effect of pedal cadence (frequency) and the proposed mechanisms responsible for an
optimal cadence has received widespread attention in the cycling literature [7, 19, 20, 38, 39, 60,
61, 77]. Hand-rim wheelchair propulsion is somewhat similar to cycling, primarily because of the
repetitive and cyclic nature of both activities; the upper-body equivalent to this is handcycling and
arm-cranking which has seen research into cadence as well as mode (synchronous and
asynchronous). However, there is a paucity of research exploring push frequency during
wheelchair propulsion [46, 135]. These studies have shown the existence of an optimal push
frequency in relation to oxygen uptake and mechanical efficiency, at the freely chosen push
frequency in both inexperienced and experienced participants. It has been suggested that, at
higher frequencies, this could be attributed to the faster movement of the arms and increasing the
recruitment of fast twitch fibres [24, 115], which are believed to exhibit lower metabolic
efficiency. At lower frequencies, an increased force/work for each arm stroke may well increase
the oxygen cost as a result of the changes in the force-velocity and length-tension relationships of
the contracting muscles. Intramuscular pressure at low frequencies may well be reduced along
with a reduced oxygen transportation improving efficiency. These suggestions for changes in
efficiency as a consequence of changes in push frequency draw heavily on assumptions about the
application of force to the hand-rim. To be able to properly evaluate these assumptions it is
important that hand-rim forces are investigated under a range of propulsion modes and
frequencies.
To date, studies on push frequency have compared the relative frequency measured as some
percentage of the freely chosen frequency [46, 135]. There has also been examination of the
absolute frequency used for wheelchair propulsion [48, 49]. Studies of the absolute propulsion
have shown that in general athletes or individuals who adopt a lower freely chosen frequency
demonstrate a higher efficiency/better economy [40, 44-46, 68]. It is therefore important to
consider both the absolute and the relative frequency used when seeking to investigate the
effects of push frequency on wheelchair propulsion.
Force Application During wheelchair propulsion the push cycle consists of two distinct phases, the push phase
and the recovery phase. It is in the push phase that the hands make contact with the hand-rims
and forces are applied. Only the component of the force acting tangential to the hand-rim fully
contributes to propulsion [8, 54, 106, 121] although other components may be necessary to create
the contact forces necessary to allow the effective transfer of force between the hand and the rim
[11, 54, 105]. The velocity of the wheelchair is dependent upon the torque impulse (the product of
Synchronous vs. Asynchronous push strategies Chapter 1
18
the tangential force, radius of the hand-rim and contact time) or the work done during hand
contact (the product of the tangential force, radius of the hand-rim and angular displacement).
For a given intensity of exercise, changing the push frequency requires a change in the
amount of work per cycle although this may not be evident by any major changes in the
movement patterns of the arm segments [121]. On the other hand literature has suggested that
improvements in mechanical efficiency are due to modifications in technique that consequently
improve the force generation [105]. A study, based on the provision of feedback to aid the
learning of a more tangential force direction, demonstrated that whilst novice individuals were
able to improve the effectiveness of the force application towards a tangential direction [54] there
was no positive effect on mechanical efficiency. Therefore, the fraction of effective force can be
changed based on feedback up to and beyond 100%, yet is then requiring more energy. Not all
studies have shown the force effectiveness to be trainable; Kotajarvi et al. [72] also recently
demonstrated little utility of feedback in improving the force effectiveness of wheelchair
propulsion in experienced wheelchair users. This could be a result of experienced individuals
having already optimised their stroke in a manner that optimises mechanical efficiency. Other
variables, such as stroke length and frequency may be more amenable to visual biofeedback and
improved efficiency. Richter and colleagues [99] suggest that wheelchair users adapt their stroke
pattern to accommodate their propulsion environment. This area of research requires hand-rim
kinetic information to investigate how individuals orientate forces to the hand-rims with the
changes in push frequency and or propulsion mode. Such studies remain scarce in the literature;
however, significant contributions on force production have been made by groups led by van der
Woude & Veeger in the Netherlands, from the 1980s onwards and Cooper & Boninger in the USA
from the 1990s onwards. More recent studies on force application have been conducted by
researchers such as Goosey-Tolfrey et al. [51], Kotajarvi et al. [72, 73], Koontz et al. [70, 71],
Richter et al. [96, 98, 99] and Rice et al. [94].
Understanding the magnitude and direction of the forces applied and the period of the cycle
for which they act, is an essential element in seeking to understand the mechanical efficiency of
wheelchair propulsion. Tangential forces have been shown to differ between inexperienced and
experienced wheelchair users [100]. Robertson and colleagues [100] stated that the experienced
wheelchair users: 1) had a longer contact period with the hand-rim, 2) reduced peak forces, 3)
peaked later in push phase, and 4) the cycle was maintained for longer time periods. There
remains the debate as to whether magnitudes of forces are related to propulsion experience and
improved skills/technique because of the lack of evidence suggests otherwise. However, more
recently Rozendaal et al. [106] provided a simulation study on force direction, which suggested
that experienced wheelchair users optimise the force pattern by balancing the mechanical effect

Synchronous vs. Asynchronous push strategies Chapter 1
19
as well as musculoskeletal cost. It is clear that in order to offer insight into the adaptive responses
to changes in wheelchair propulsion mode and frequency, knowledge of the hand-rim forces is
essential.
To investigate propulsion forces an instrumented force-sensing hand-rim is required e.g. the
SMARTWheel (Figure 1.3). This has been used extensively to investigate kinetic data during
wheelchair propulsion [2, 8, 21, 22, 70-73, 94, 95, 100, 110]. The SMARTWheel is a modified wheel
that measures three dimensional forces and moments applied to the hand-rim [4, 21].
Measurement of the contact forces in all three dimensions also allows the calculation of the
fraction of effective force. Veeger and colleagues, [121] defined the fraction of effective force as
the ratio between the tangential force and the total force or the fraction of effective force. The
concept of the fraction of effective force has been used on a number of occasions to investigate
wheelchair propulsion [2, 11, 26, 29, 54-57, 59, 70, 73, 92, 121, 128] although there have been
questions raised about its meaningfulness. Particular concern has been expressed about the
assumption that only the tangential force is useful or effective [54, 72]. It can be argued that
some degree of force is necessary in the radial and medio-lateral directions to facilitate the
frictional contact force necessary for the transmission of the tangential component necessary. It is
clear that to properly understand wheelchair propulsion examination of all the force components
is necessary.
Ratings of perceived exertion Psycho-physiological measures have seen rating scales become the most prevalent tool in the
study of perceived exertion and the most widely utilised scale for quantifying the rating of
perceived exertion is the Borg 15-point scale [10]. This scale has been shown to have a high
degree of validity and reliability [33, 36, 102, 111]. The rating of perceived exertion correlates
highly with physical indicators of effort such as heart rate, oxygen consumption, blood lactate and
ventilation rate [87]. Research has studied the physiological determinants of perceived exertion
[15, 16, 82, 85, 86, 101] based on the theory of central and local or peripheral factors [34]. Central
Figure 1.3: SMARTWheel
attached to a wheelchair on the WERG
Synchronous vs. Asynchronous push strategies Chapter 1
20
factors correspond to sensations from the cardio-respiratory system (for example heart rate and
oxygen uptake) whereas local or peripheral factors relate to feelings of strain in the exercising
muscles or joints (for example local muscle fatigue). The dominant influence on perceived
exertion comes from a combination of local sensations [101, 123].
The mechanisms that control the selection of push strategies are not well understood. The
cycling literature suggests that peripheral cues from active muscles are important determinants
for cadence selection [34, 93]. However, this type of subjective reporting of perceived exertion is
an area that has received very little attention in the wheelchair propulsion literature. Of the work
that is available, ratings of perceived exertion has been examined in relation to hand-rim size and
propulsion velocity [41], propulsion strategy-frequency combination [48] and the degree of co-
ordination between breathing and rhythmic arm movements [37]. Extending this work to include
a comparison of the central and peripheral perceived exertion in experienced and in-experienced
wheelchair users may provide a further insight into the mechanisms that control push strategy
selection [86].
Rating of perceived exertion scores have been shown to have a curvilinear relationship with
push frequency [46] and is minimised at the self-selected frequency. The RPE appears to mirror
the trend seen for oxygen uptake and or mechanical efficiency with push frequency. In contrast
Fabre et al. [37] demonstrated an increase in rating of perceived exertion scores with increased
push frequency but no difference with decreased push frequency. Consequently the relationship
of perceived exertion and frequency remains unclear, although literature strongly suggests that
peripheral cues from active muscles are important determinants for cadence selection [34, 88,
93]. It is proposed that the feedback from these cues influences an individual’s rating of perceived
exertion score therefore, perception of effort mediated by the peripheral feedback sources could
well be important in push frequency selection during wheelchair propulsion. The distinct lack of
perceived exertion data in the wheelchair literature does not allow conclusions to be drawn on the
relationships that the rating of perceived exertion scores could have with push frequency and
propulsion mode [37, 46]. Currently findings are taken from cycling and arm-cranking and the
theory applied to wheelchair propulsion. It is presumed that ratings of perceived exertion would
not only be a useful tool in providing information of the relationship with push strategy but
importantly the differentiated scores could offer insight into whether the central or local factors
contribute more so to changes seen in mechanical efficiency. An opportunity exists to
demonstrate the trends and relationships of perceived exertion with push strategy and propulsion
experience in wheelchair propulsion.
Synchronous vs. Asynchronous push strategies Chapter 1
21
Aim of this thesis Our understanding of wheelchair propulsion is constantly evolving as research into
rehabilitation and wheelchair sport develops. Clearly research directed towards an understanding
of the physiological aspects of propulsion and mechanical efficiency would be of both a theoretical
as well as a practical significance in the context of propulsion performance. However, there
remains a need for sustained and systematic research into the relative efficacy of different
propulsion modes and frequencies (push strategies). Such work needs to consider the mechanisms
underpinning such relationships and the theoretical basis for optimal performance.
It is very evident from the literature that wheelchair propulsion is relatively inefficient
physiologically in comparison to other forms of locomotion, i.e. walking, running, cycling and
handcycling/arm-cranking. Accept for handcycling these modalities tend to be asynchronous in
their nature prompting the question as to whether wheelchair propulsion could be better if
performed asynchronously. In light of the interests from daily wheelchair users and wheelchair
sports which are beginning to utilise an asynchronous movement pattern makes investigation of
such a propulsion mode appropriate. Therefore, the thesis main aim seeks to explore if an
asynchronous propulsion mode can be more efficient than the synchronous propulsion mode. To
help answer this question a number of experimental chapters will compare both synchronous and
asynchronous propulsion modes. Mechanical efficiency measures, physiological variables, psycho-
physiological markers propulsion practice and kinetic measures will all be employed to help
address the research question. We hypothesise that asynchronous propulsion will improve the
mechanical efficiency of wheelchair propulsion and be more advantageous to that of the
traditional synchronous propulsion.
Outline of thesis This thesis comprises of six experimental chapters (Chapters 2 - 7) aimed to address the
research aim documented previously. Chapter 2 determines the separate contributions of push
frequency and the mode of propulsion on the internal work during sub-maximal propulsion. The
findings provide information of the different indices of mechanical efficiency that help to
understand and realise the role of internal and external work production with different push
strategies. Chapter 3 focuses on determining the mechanical efficiency of propulsion at different
push frequencies during both synchronous and asynchronous propulsion modes. The findings
provide information about the relationship between mechanical efficiency and the push frequency
of arm movements. Chapter 4 is an extension of chapter 3, examining the role of wheelchair
propulsion experience on mechanical efficiency. The incorporation of differentiated ratings of
perceived exertion (central and peripheral) allows the psycho-physiological relationships to be
investigated for both push frequency and propulsion mode. The findings identify the trends in

Synchronous vs. Asynchronous push strategies Chapter 1
22
physiological responses of experienced wheelchair sportsmen compared with those of able-bodied
individuals. The differentiated ratings of perceived exertion aim to provide support for the
relationships and trends observed in physiological and mechanical efficiency data, as a result of
experience, push frequency and propulsion mode. Chapter 5 investigates the effects of practice
on mechanical efficiency and timing parameters associated with propulsion strategy. Identifying
how both paced and unpaced practice affect mechanical efficiency and the relationship with push
frequency changes. Chapters 6 and 7 investigate force production and effectiveness of force
application at a range of push frequencies for both propulsion modes to help understand the
changes seen in mechanical efficiency. The results provide important information as to the
relationship of force application from both a push strategy and mechanical efficiency perspective.
Chapter 8 discusses the overall findings of this thesis in the context of theoretical, clinical and
practical understanding of cyclic arm work, as well as the limitations of the research approach
taken.
Synchronous vs. Asynchronous push strategies Chapter 1
23
References 1 Abel T, Kroner M, Rojas Vega S, Peters C, Klose C, Platen, P. Energy expenditure in wheelchair racing and handbiking
– a basis for prevention of cardiovascular diseases in those with disabilities. Eur J Cardiovasc Prev Rehabil 2003; 10:
371-376.
2 Ambrosio F, Boninger ML, Souza AL, Fitzgerald SG, Koontz AM, Cooper RA. Biomechanics and strength of manual
wheelchair users. J Spinal Cord Med 2005; 28(5): 407-414.
3 Amazeen PG, Amazeen EL, Beek PJ. Coupling of breathing and movement during manual wheelchair propulsion. J
Exp Psychol Hum Percept Perform 2001; 27: 1243-1259.
4 Asato KT, Cooper RA, Robertson RN, Ster, JF. SMARTWheel
: development and testing of a system for measuring
manual wheelchair propulsion dynamics. IEEE Trans Biomed Eng 1993; 40: 1320-1324.
5 Bennedik K, Engel P, Hildebrandt G. Der Rollstuhl lThe wheelchair]. Internationale Schriftenreihe her
Rehabilitationsforschung 15. Rheinstettten, Schindele Verlag, 1978.
6 van den Berg R, de Groot S, Swart KM, van der Woude LH. Physical capacity after 7 weeks of low-intensity
wheelchair training. Disabil Rehabil 2010; 32(26): 2244-52.
7 Böning D, Gonen Y, Maassen N. Relationship between work load, pedal frequency and physical fitness. Int J Sports
Med 1984; 5: 92-97.
8 Boninger ML, Cooper RA, Robertson RN, Shimada SD. Three dimensional pushrim forces during two speeds of
wheelchair propulsion. Am J Physical Med Rehab 1997; 76(5): 420-426.
9 Boninger ML, Souza AL, Cooper RA, Fitzgerald SG, Koontz AM, Fay BT. Propulsion patterns and pushrim
biomechanics in manual wheelchair propulsion. Am J Phys Med Rehab 2002; 76: 420-426.
10 Borg G. Perceived exertion as an indicator of somatic stress. Scand. J. Rehabil Med 1970; 2: 92-98.
11 Bregman DJJ, van Drongelen S, Veeger HEJ. Is effective force application in handrim wheelchair propulsion also
efficient? Clin Biomech 2009; 24: 13-19.
12 Brown DD, Knowlton RG, Hamill J, Schneider TL, Hetzler RK. Physiological and biomechanical differences between
wheelchair-dependent and able-bodied subjects during wheelchair ergometry. Eur J Appl Physiol 1990; 60: 179–182.
13 Brubaker CE, McClay IS, McLaurin CA. Effect of seat position on wheelchair propulsion efficiency. In Proceedings of
2nd
International Conference on Rehabilitation Engineering 1984; 12-14. Ottawa: Canadian Medical and Biological
Engineering Society.
14 Buckley SM & Bhambhani YN. The effects of wheelchair camber on physiological and perceptual responses in
younger and older men. Adapted Physical Activity Quarterly 1998; 15: 15-24.
15 Cafarelli E. Peripheral and central inputs to the effort sense during cycling exercise. Eur J Appl Physiol 1977; 37:
181-189.
16 Carton RL & Rhodes RC. A critical review of the literature on ratings scales for perceived exertion. Sports Med
1985; 2: 198-222.
17 Cavanagh PR & Kram R. The efficiency of human movement – a statement of the problem. Med Sci Sports Exerc
1985a; 17(3): 304-308.
18 Cavanagh PR & Kram R. Mechanical and muscular factors affecting the efficiency of human movement. Med Sci
Sports Exerc 1985b; 17(3), 326-331.
Synchronous vs. Asynchronous push strategies Chapter 1
24
19 Chavarren J & Calbet JAL. Cycling efficiency and pedalling frequency in road cyclists. Eur J Appl Physiol 1999; 80:
555-563.
20 Coast JR &Welch HG. Linear increase in pedal rate with increased power output in cycle ergometry. Eur J Appl
Physiol 1985; 53: 339-342.
21 Cooper RA, Robertson RN, van Sickle DP, Boninger ML. Methods for determining three-dimensional wheelchair
pushrim forces and moments: a technical note. J Rehab Res Dev 1997; 34: 162-170.
22 Cowan RE, Boninger ML, Sawatzky BJ, Mazoyer BD, Cooper RA. Preliminary outcomes of the SmartWheel Users'
Group database: a proposed framework for clinicians to objectively evaluate manual wheelchair propulsion. Arch
Phys Med Rehabil 2008; 89(2): 260-8.
23 Cowan RE, Nash MS, Collinger JL, Koontz AM, Boninger ML. Impact of surface type, wheelchair weight, and axle
position on wheelchair propulsion by novice older adults. Arch Phys Med Rehabil 2009; 90(7): 1076-83.
24 Coyle EF, Sidossis LS, Horowitz JF, Beltz JD. Cycling efficiency is related to the percentage of Type I muscle fibers.
Med Sci Sports Exerc 1992; 24: 782-788.
25 Dallmeijer AJ, Ottjes L, de Waardt E, van der Woude LHV. A physiological comparison of synchronous and
asynchronous hand cycling. Int J Sports Med 2004a; 25: 1–5.
26 Dallmeijer AJ, Woude LHV van der, Veeger HEJ, Hollander AP. Effectiveness of force application in manual
wheelchair propulsion in persons with spinal cord injuries. Am J Phys Med Rehab 1998; 77: 213-221.
27 Dallmeijer AJ, Zentgraaff ID, Zijp NI, Woude LHV van der. Sub-maximal physical strain and peak performance in
handcycling versus hand-rim wheelchair propulsion. Spinal Cord 2004b; 42: 91–98.
28 Davis GM & Shephard RJ. Strength training for wheelchair users. Br J Sports Med 1990; 24(1): 25-30.
29 Desroches G, Aissaoui R, Bourbonnais D. The effect of resultant force at the pushrim on shoulder kinetics during
manual wheelchair propulsion: a simulation study. IEEE Trans Biomed Eng 2008a; 55(4): 1423-31.
30 Desroches G, Aissaoui R, Bourbonnais D. Relationship between resultant force at the pushrim and the net shoulder
joint moments during manual wheelchair propulsion in elderly persons. Arch Phys Med Rehabil 2008b; 89(6): 1155-
61.
31 Van Dieen JH, Ogita F, de Haan A. Reduced neural drive in bilateral exertions: a performance-limiting factor? Med
Sci Sports Exerc 2003; 35(1), 111-118.
32 DiGiovine CP, Cooper RA, Boninger ML. Dynamic calibration of a wheelchair dynamometer. J Rehabil Res Dev
2001; 38(1): 41-55.
33 Dunbar CC, Robertson RJ, Baun R, Blandin MF, Metz K, Burdett R, Goss FL. The validity of regulating exercise
intensity by ratings of perceived exertion. Med Sci Sports Exerc 1992; 24(1): 94-99.
34 Ekblom B & Goldbarg AN. The influence of physical training and other factors on the subjective rating of perceived
exertion. Acta Physiol Scand 1971; 83: 399–406.
35 Engel P, Neikes M, Bennedik K, Hildebrandt G, Rode FW. Work physiological studies performed to optimate the
lever propulsion and the seat position of a lever propelled wheelchair. Rehabil 1976; 15(4): 217-218.
36 Eston RG & Williams JG. Reliability of ratings of perceived effort regulation of exercise intensity. B J Sports Med
1988; 22(4): 153-155.
Synchronous vs. Asynchronous push strategies Chapter 1
25
37 Fabre N, Perrey S, Arbez L, Ruiz J, Tordi N, Rouillon JD. Degree of coordination between breathing and rhythmic
arm movements during hand rim wheelchair propulsion. Int. J. Sports Med 2006; 27: 67–74.
38 Faria IE. Energy expenditure, aerodynamics and medical problems in cycling. Sports Med 1982; 14: 43-63.
39 Gaesser GA, Brooks GA. Muscular efficiency during steady-rate exercise: effects of speed and work rate. J Appl
Physiol 1975; 38: 1132–1139.
40 Gaines RF, Zomlefer MR, Zhao W. Armstroke patterns of spinal cord injured wheelchair users. Archives of Physical
Medicine Rehabilitation 1984; 65: 618.
41 Gayle GW, Pohlman RL, Glaser RM. Cardiorespiratory and perceptual responses to arm crank and wheelchair
exercise using various hand-rims in male paraplegics. Res Q Exerc Sport 1990; 61(3): 224-232.
42 Glaser RM, Sawka MN, Young RE, Suryaprasad AG. Metabolic and cardiopulmonary responses to wheelchair and
bicycle ergomentry. J Appl Physiol 1979; 46: 1066-1070
43 Glaser RM, Sawka MN, Young RE, Suryaprasad AG. Applied physiology for wheelchair design. J Physiol 1980; 48:
41–44.
44 Goosey VL, Campbell IG. Pushing economy and wheelchair propulsion technique at three speeds. Adapt Phys Activ
Q 1998a; 15: 36–50.
45 Goosey VL, Campbell IG, Fowler NE. The relationship between three-dimensional wheelchair propulsion
techniques and pushing economy. J Appl Biomech 1998b; 14: 412–427.
46 Goosey VL, Campbell IG, Fowler NE. Effect of push frequency on the economy of wheelchair racers. Med Sci Sports
Exerc 2000; 32: 174–181.
47 Goosey-Tolfrey. Wheelchair Sport: A Complete Guide for Athletes, Coaches and Teachers. Leeds: Human Kinetics
2010; preface.
48 Goosey-Tolfrey VL, Kirk JH. Effect of push frequency and strategy variations on economy and perceived exertion
during wheelchair propulsion. Eur J Appl Physiol 2003; 90: 153–158.
49 Goosey-Tolfrey VL, Lenton JP. A comparison between intermittent and constant wheelchair propulsion strategies.
Ergonomics 2006; 49(11): 1111-1120.
50 Goosey-Tolfrey VL & Sindall P. The effects of arm crank strategy on physiological responses and mechanical
efficiency during sub-maximal exercise. J Sports Sci 2007; 25(4): 453-460.
51 Goosey-Tolfrey VL, West M, Lenton JP, Tolfrey K. Influence of varied tempo music on wheelchair mechanical
efficiency following 3-week practice. Int J Sports Med 2011; 32(2): 126-31.
52 de Groot S, de Bruin M, Noomen SP, van der Woude LHV. Mechanical efficiency and propulsion technique after 7
weeks of low-intensity wheelchair training. Clin Biomech 2008; 23: 434-441.
53 de Groot S, Dallmeijer AJ, Kilkens OJ, van Asbeck FW, Nene AV, Angenot EL, Post MW and van der Woude LHV.
Course of gross mechanical efficiency in handrim wheelchair propulsion during rehabilitation of people with spinal
cord injury: a prospective cohort study. Arch Phys Med Rehab 2005; 86(7): 1452-1460.
54 de Groot S, Veeger HEJ, Hollander AP, van der Woude LHV. Consequence of feedback-based learning of an
effective hand rim wheelchair force production on mechanical efficiency. Clin Biomech 2002a; 17: 219-226.
55 de Groot S, Veeger DHEV, Hollander AP, van der Woude LHV. Wheelchair propulsion technique and mechanical
efficiency after 3 wk of practice. Med Sci Sports Exerc 2002b; 34: 756–766.
Synchronous vs. Asynchronous push strategies Chapter 1
26
56 de Groot S, Veeger DHEV, Hollander AP, van der Woude LHV. Adaptations in physiology and propulsion technique
during the initial phase of learning manual wheelchair propulsion. Am J Phys Med Rehab 2003a; 82(7): 504-510.
57 de Groot S, Veeger DHEV, Hollander AP, van der Woude LHV. Short- term adaptations in co-ordination during the
initial phase of learning manual wheelchair propulsion. J. Electromyogr. Kinesiol 2003b; 13: 217–228.
58 de Groot S, Veeger HEJ, Hollander AP, van der Woude LHV. Effect of wheelchair stroke pattern on mechanical
efficiency. Am J Phys Med Rehab 2004; 83: 640-649.
59 de Groot S, Veeger DHEV, Hollander AP, van der Woude LHV. Influence of task complexity on mechanical efficiency
and propulsion technique during learning of hand rim wheelchair propulsion. Med Eng Phys 2005; 27(1): 41-49.
60 Hagberg JM, Mullin JP, Giese MD, Spitznagel E. Effect of pedalling rate on submaximal exercise responses of
competitive cyclists. J Appl Physiol 1981; 51: 447-451.
61 Hansen EA, Andersen JL, Nielsen JS, Sjogaard G. Muscle fibre type, efficiency, and mechanical optima affect freely
chosen pedal rate during cycling. Acta Physiologica Scandinavica 2002; 176(3): 185-194.
62 Hintzy F, Tordi N. Mechanical efficiency during hand-rim wheelchair propulsion: effects of base-line subtraction
and power output. Clin Biomech 2004; 19: 343–349..
63 Hintzy F, Tordi N, Perrey S. Muscular efficiency during arm cranking and wheelchair exercise: A comparison. Int J
Sports Med 2002; 23: 408–414.
64 Hopman MTE, Teeffelen WM, Brouwer J van, Houtman S, Binkhorst RA. Physiological responses to asynchronous
and synchronous arm-cranking exercise. Eur J Appl Physiol 1995; 72: 111–114.
65 Hughes CJ, Weimar WH, Sheth PN, Brubaker CE. Biomechanics of wheelchair propulsion as a function of seat
position and user-to-chair interface. Arch Phys Med Rehab 1992; 73(3): 263-269.
66 Hutzler Y. Anaerobic fitness testing of wheelchair users. Sports Med 1998; 25(2): 101-13.
67 Janssen TW, Oers CA, van der Woude LHV and Hollander AP. Physical strain in daily life of wheelchair users with
spinal cord injuries. Med Sci Sport Exerc 1994; 26(6): 661-670.
68 Jones D, Baldini F, Cooper RA, Robertson R, Widman L. Economical aspects of wheelchair propulsion. Med Sci
Sport Exerc 1992; 24: S32.
69 Knowlton RG, Fitzgerald PI, Sedlock DA. The mechanical efficiency of wheelchair dependent women during
wheelchair ergometry. Can J Appl Sports Sci 1981: 6(4): 187-190.
70 Koontz AM, Cooper RA, Boninger ML, Souza AL, Fay BT. Shoulder kinematics and kinetics during two speeds of
wheelchair propulsion. J Rehabil Res Dev 2002; 39(6): 635-649.
71 Koontz AM, Yang Y, Price R, Tolerico ML, DiGiovine CP, Sisto SA, Cooper RA, Boninger ML. Multisite comparison of
wheelchair propulsion kinetics in persons with paraplegia. J Rehabil Res Dev 2007; 44(3): 449-58.
72 Kotajarvi, BR, Basford JR, An KN, Morrow DA, Kaufman KR. The effect of visual biofeedback on the propulsion
effectiveness of experienced wheelchair users. Arch Phys Med Rehab 2006; 87: 510-515.
73 Kotajarvi BR, Sabick MB, An KN, Zhao KD, Kaufman KR, Basford JR. The effect of seat position on wheelchair
propulsion biomechanics. J Rehab Res Dev 2004; 41(3B): 403-414.
74 Linden ML van der, Valent L, Veeger HEJ, Woude LHV van der. The effect of wheelchair handrim tube diameter on
propulsion efficiency and force application (tube diameter and efficiency in wheelchairs). IEEE Trans Rehab Eng 1996;
4(3): 123 – 132.
Synchronous vs. Asynchronous push strategies Chapter 1
27
75 McLaurin CA, Brubaker CE. Biomechanics and the wheelchair. Prosthetics and Orthotics International 1991; 15(1):
24-37.
76 Marais G, Dupont L, Maillet M, Weisslans T, Vanvelcenaher J, Pelayo P. Cardiorespiratory and efficiency responses
during arm and leg exercises with spontaneously chosen crank and pedal rates. Ergonomics 2002; 45: 631-639.
77 Marsh AP, Martin PE, Foley KO. Effect of cadence, cycling experience, and aerobic power on delta efficiency during
cycling. Med Sci Sports Exerc 2000; 32(9): 1630-1634.
78 Mason B. The ergonomics of wheelchair configuration for optimal sport performance. PhD Thesis, Loughborough
University, Loughborough, Leicestershire, UK, May 2011.
79 Mason B, Woude L van der, Groot S de, Goosey-Tolfrey V. Effects of camber on the ergonomics of propulsion in
wheelchair athletes. Med Sci Sports Exerc 2011a; 43(2): 319-26.
80 Mason B, Woude L van der, Tolfrey K, Lenton J, Goosey-Tolfrey V. Effects of wheel and hand-rim size on
submaximal propulsion in wheelchair athletes. Med Sci Sports Exerc 2011b; Epub ahead of print PMID: 21701409.
81 Masse LC, Lamontagne M, O’Riain MD. Biomechanical analysis of wheelchair propulsion for various seating
positions. J Rehab Res Dev 1992; 29(3): 12-28.
82 Mihevic PM. Sensory cues for perceived exertion: a review Med Sci Sports Exerc 1981; 13(3): 150-163.
83 Mossberg K, Willman C, Topor MA, Crook H, Patak S. Comparison of asynchronous versus synchronous arm crank
ergometry. Spinal Cord 1999; 37: 569–574.
84 Niesing R, Eijskoot F, Kranse R, den Ouden AH, Storm J, Veeger HEJ, van der Woude LHV, Snijders CJ. Computer-
controlled wheelchair ergometer. Med Biol Eng Comp 1990; 28(4): 329-38.
85 Pandolf KB. Influence of local and central factors in dominating rated perceived exertion during physical work.
Perception and Motor Skills 1978; 46: 683-698.
86 Pandolf KB. Differentiated ratings of perceived exertion during physical exercise. Med Sci Sports Exerc 1982; 14:
397–405.
87 Pandolf KB. Advances in the study and application of perceived exertion. In Terlung (Ed.) Exerc Sports Sci Rev
1983; 11: 118-158, Franklin Institute, Philadelphia.
88 Pandolf KB & Noble BJ. The effect of pedaling speed and resistance changes on perceived exertion for equivalent
power outputs on a bicycle ergometer. Med Sci Sports Exerc 1973; 5: 132-136.
89 Patterson P, Draper S. Selected comparisons between experienced and non-experienced individuals during manual
wheelchair propulsion. Biomed Sci Instrum 1997; 33: 477-481.
90 Peronnet F, Massicotte D. Table of non-protein respiratory quotient: an update. Can J Sport Sci 1991; 16: 23–29.
91 Powers SK, Beadle RE, Mangum M. Exercise efficiency during arm ergometry: effects of speed and work rate. J
Appl Physiol Resp Environ Exerc Physiol 1984; 56: 495-499.
92 Rankin JW, Kwarciak AM, Mark Richter W, Neptune RR. The influence of altering push force effectiveness on upper
extremity demand during wheelchair propulsion. J Biomech 2010; 43(14): 2771-2779.
93 Redfield R & Hull ML. On the relation between joint moments and pedalling rates at a constant power in bicycling.
J. Biomech 1986; 19: 317–329.

Synchronous vs. Asynchronous push strategies Chapter 1
28
94 Rice I, Gagnon D, Gallagher J, Boninger M. Hand rim wheelchair propulsion training using biomechanical real-time
visual feedback based on motor learning theory principles. J Spinal Cord Med. 2010; 33(1):33-42.
95 Richter WM. The effect of seat position on manual wheelchair propulsion biomechanics: a quasi-static model-
based approach. Med Eng Phys 2001; 23(10): 707-712
96 Richter WM & Axelson PW. Low-impact wheelchair propulsion: achievable and acceptable. J Rehabil Res Dev
2005; 42(3 Supplement 1): 21-33.
97 Richter WM, Kwarciak AM, Guo L, Turner JT. Effects of single-variable biofeedback on wheelchair handrim
biomechanics. Arch Phys Med Rehabil 2011; 92: 572-577.
98 Richter WM, Rodriguez R, Woods KR, Axelson PW. Consequences of a cross slope on wheelchair handrim
biomechanics. Arch Physical Med Rehab 2007a; 88(1): 76-80.
99 Richter WM, Rodriguez R, Woods KR, Axelson PW. Stroke pattern and handrim biomechanics for level and uphill
wheelchair propulsion at self-selected speeds. Arch Physical Med Rehab 2007b; 88(1): 81-87.
100 Robertson RN, Boninger ML, Cooper RA, Shimada SD. Pushrim forces and joint kinetics during wheelchair
propulsion. Archives of Physical Medicine & Rehabilitation 1996; 77: 856-864.
101 Robertson RJ, Gillespie RL, McCarthy J, Rose KD. Differentiated perceptions of exertion: Part 2. Relationship to
local and central physiological responses. Perceptual and Motor Skills 1979; 49: 691-697.
102 Robertson RJ & Noble BJ. Perception of physical exertion: Methods, mediators and applications. Exerc Sports Sci
Rev 1997; 25: 407-452.
103 Rodgers MN, Gayle GW, Figoni SF, Kobayashi M, Lieh J, Glaser RM. Biomechanics of wheelchair propulsion during
fatigue. Arch Phys Med & Rehab 1994; 75(1): 85-93.
104 Rodgers MM, Keyser RE, Gardner ER, Russell PJ, Gorman PH. Influence of trunk flexion on biomechanics of
wheelchair propulsion. J Rehab Res Devel 2000; 37(3): 283-295.
105 Rozendaal LA & Veeger DE. Force direction in manual wheel chair propulsion: balance between effect and cost.
Clin Biomech 2001; 15: Supplement 1, S39-S41.
106 Rozendaal LA, Veeger HEJ, van der Woude LHV. The push force pattern in manual wheelchair propulsion as a
balance between cost and effect. J Biomech 2000; 36: 239-247.
107 Samuelsson KA, Tropp H, Nylander E, Gerdle B. The effect of rear-wheel position on seating ergonomics and
mobility efficiency in wheelchair users with spinal cord injuries: a pilot study. J Rehab Res Dev 2004; 41(1): 65-74.
108 Sawka, M.N. Physiology of upper body exercise. Exerc Sports Sci Rev 1986; 14: 175-212.
109 van Ingen Schenau GJ. Cycle power: a predictive model. Endeavour 1988; 12(1): 44-47.
110 Shimada SD, Robertson RN, Boninger ML, Cooper RA. Kinematic characterization of wheelchair propulsion. J
Rehab Res Dev 1998; 35(2): 210-218.
111 Skinner JS, Hutsler R, Bergsteinova V, Buskirk ER. Perception of effort during different types of exercise and under
different environmental conditions. Med Sci Sports 1973; 5: 110-115.
112 van Soest AJ, Roebroeck ME, Bobbert MF, Huijing PA, van Ingen Schenau GJ. A comparison of one-legged and
two-legged countermovement jumps. Med Sci Sports Exerc 1985; 17(6): 635-9.
Synchronous vs. Asynchronous push strategies Chapter 1
29
113 Spaepen AJ, Vanlandewijck YC, Lysens RJ. Relationship between energy expenditure and muscular activity
patterns in handrim wheelchair propulsion. J Ind Erg 1996; 17: 163-173.
114 Sparrow WA. The efficiency of skilled performance. J Motor Behaviour 1983; 15(3): 237-261.
115 Suzuki Y. Mechanical efficiency of fast- and slow-twitch fibers in man during cycling. J Appl Physiol 1979; 47: 263-
267.
116 Theisen D, Francaux M, Fayt A, Sturbois X. A new procedure to determine external power output during hand-rim
wheelchair propulsion on a roller ergometer: A reliability study. Int J Sports Med 1996; 17: 564–571.
117 Vandervoort AA, Sale DG, Moroz J. Comparison of motor unit activation during unilateral and bilateral leg
extension. J Appl Physiol 1984; 56(1): 46-51.
118 Vanlandewijck YC, Spaepen AJ, Lysens RJ. Wheelchair propulsion efficiency: movement pattern adaptations to
speed changes. Med Sci Sports Exerc 1994; 26: 1373–1381.
119 Veeger HE, Rozendaal LA, van der Helm FC. Load on the shoulder in low intensity wheelchair propulsion. Clin
Biomech 2002; 17(3): 211-8.
120 Veeger HEJ, van der Woude LHV, Rozendal RH. Within-cycle characteristics of the wheelchair push in sprinting on
a wheelchair ergometer. Med Sci Sports Exerc 1991; 23: 264–271.
121 Veeger HEJ, van der Woude LHV, Rozendal RH. Effect of hand-rim velocity on mechanical efficiency in
wheelchair propulsion. Med Sci Sports Exerc 1992; 24: 100-107.
122 Verellen J, Theisen D, Vanlandewijck Y. Influence of crank rate in handcycling. Med Sci Sports Exerc 2004; 36:
1826–1831.
123 Watt B & Grove R. Perceived exertion: antecedents and applications. Sports Med 1993; 15(4): 225-241.
124 Wei SH, Huang S, Jiang CJ, Chiu JC. Wrist kinematic characterization of wheelchair propulsion in various seating
positions: implication to wrist pain. Clin Biomech 2003; 18(6): S46-S52.
125 Weissland T, Pelayo P, Vanvelcenaher J, Marais G, Lavoie JM, Robin H. Physiological effects of variations in
spontaneously chosen crank rate during incremental upper-body exercise. Eur J Appl Physiol Occup Physiol 1997; 76:
428-433.
126 Whipp BJ, Wasserman K. Efficiency of muscular work. J Appl Physiol 1969; 26: 644–648.
127 van der Woude LHV, Bosmans I, Bervoets B, Veeger HEJ. Handcycling: different modes and gear ratio. J Med Eng
Tech 2000; 24: 242–249.
128 van der Woude LH, Bouw A, van Wegen J, van As H, Veeger D, de Groot S. Seat height: effects on submaximal
hand rim wheelchair performance during spinal cord injury rehabilitation. J Rehab Med 2009; 41: 143-149.
129 van der Woude LHV, Formanoy M, de Groot S. Hand rim configuration: effects on physical strain and technique in
unimpaired subjects? Med Eng Phys 2003; 25: 765–774.
130 van der Woude LHV, de Groot G, Hollander AP, Ingen Schenau GJ van, Rozendal RH. Wheelchair ergonomics and
physiological testing of prototypes. Ergonomics 1986; 29: 1561–1573.
131 van der Woude LHV, Hendrich KMM, Veeger HEJ, van Ingen Schenau GJ, Rozendal RH, de Groot G, Hollander AP.
Manual wheelchair propulsion: effects of power output on physiology and technique. Med Sci Sports Exerc 1988a;
20(1): 70-78.
Synchronous vs. Asynchronous push strategies Chapter 1
30
132 van der Woude LHV, Horstman A, Faas P, Mechielsen S, Bafghi HA, de Koning JJ. Power output and metabolic cost
of synchronous and asynchronous sub-maximal and peak level hand cycling on a motor driven treadmill in able-bodied
male subjects. Med Eng Phys 2008; 30(5): 574-580.
133 van der Woude LHV, Kranen E van, Ariens G, Rozendal RH, Veeger HEJ. Physical strain and mechanical efficiency
in hubcrank and handrim wheelchair propulsion. J Med Eng Tech 1995; 19(4): 123-131.
134 van der Woude LHV, Veeger HEJ, Dallmeijer AJ, Janssen TWJ, Rozendaal LA. Biomechanics and physiology in
active manual wheelchair propulsion. Med Eng Physics 2001; 23: 713–733.
135 van der Woude LHV, Veeger HEJ, Rozendal RH, Sargeant AJ. Optimum cycle frequencies in hand-rim wheelchair
propulsion. Wheelchair propulsion technique. Eur J Appl Physiol 1989a; 58: 625–632.
136 van der Woude LHV, Veeger HEJ, Rozendal RH, Sargeant AJ. Seat height in hand-rim wheelchair propulsion. J
Rehab Res Dev 1989b; 26(4): 31-50.
137 van der Woude LHV, Veeger HEJ, Rozendal RH, Sargeant AJ. Ergonomics of wheelchair design: a prerequisite for
optimum wheeling conditions. Adapted Physical Activity Quarterly 1989c; 6(2): 106-132.
138 Woude LHV van der, Veeger HEJ, Rozendal RH, Schenau GJ van Ingen, Rooth F, Nierop P van. Wheelchair racing:
effects of rim diameter and speed on physiology and technique. Med Sci Sports Exerc 1988b; 20(5): 492-500.
Synchronous vs. Asynchronous push strategies Chapter 2
31
Chapter 2
Efficiency of wheelchair propulsion and effects of strategy International Journal of Sports Medicine (2008); 29(5): 384-389. John P. Lenton1, Neil E. Fowler1, Lucas HV. Van der Woude2, Victoria L. Goosey-Tolfrey1
Abstract
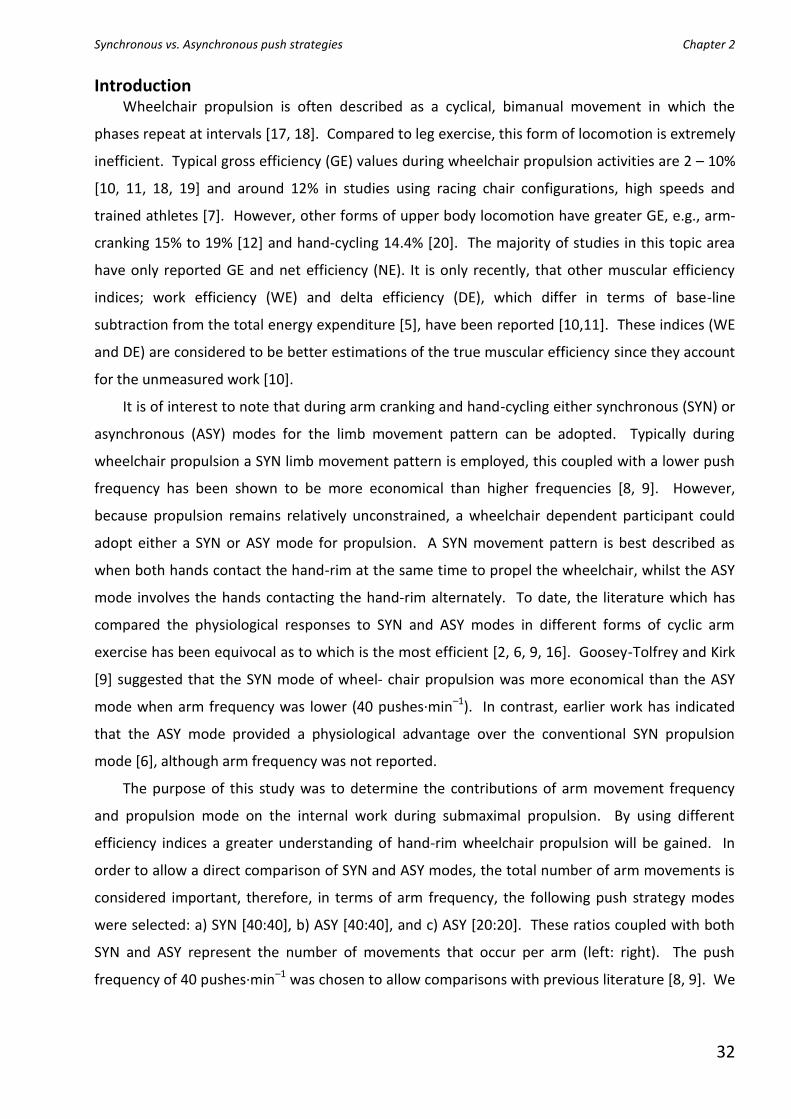
The purpose of this study was to determine the contributions of arm frequency and
propulsion mode on the internal work during submaximal wheelchair propulsion. Twelve able-
bodied participants performed a ·VO2 peak test on a wheelchair ergometer. On a separate occasion,
six (4 min) submaximal exercise conditions employing two modes of propulsion (synchronous, SYN
vs. asynchronous, ASY) at arm frequencies of 40 and 80 rev·min–1 were performed at 1.2m·s–1 and
1.7m·s–1. These conditions resulted in three push strategy combinations (ASY [20:20], SYN [40:40]
& ASY [40:40]) at two speeds. Gross, net, work and delta efficiency were determined. The cost of
unloaded exercise was significantly lower for the ASY [20:20] than both ASY and SYN [40:40] (0.49
vs. 0.58 and 0.57 L ·min–1, respectively). All the efficiency indices decreased as velocity increased
(p < 0.01). ASY [20:20] was the least efficient (gross and work) mode (4.2 ± 0.4% and 6.2 ± 0.8%
respectively). Comparison of equal arm frequencies (ASY [40:40] vs. SYN [40:40]); found the
efficiency to be lower for ASY propulsion (p < 0.05). Under the current testing conditions SYN
propulsion mode offers greater efficiency during wheelchair propulsion.
1 Exercise and Sport Science, The Manchester Metropolitan University, Cheshire, United Kingdom. 2 Institute for Fundamental and Clinical Human Movement Sciences, Vrije Universiteit, Amsterdam, The Netherlands.
Synchronous vs. Asynchronous push strategies Chapter 2
32
Introduction Wheelchair propulsion is often described as a cyclical, bimanual movement in which the
phases repeat at intervals [17, 18]. Compared to leg exercise, this form of locomotion is extremely
inefficient. Typical gross efficiency (GE) values during wheelchair propulsion activities are 2 – 10%
[10, 11, 18, 19] and around 12% in studies using racing chair configurations, high speeds and
trained athletes [7]. However, other forms of upper body locomotion have greater GE, e.g., arm-
cranking 15% to 19% [12] and hand-cycling 14.4% [20]. The majority of studies in this topic area
have only reported GE and net efficiency (NE). It is only recently, that other muscular efficiency
indices; work efficiency (WE) and delta efficiency (DE), which differ in terms of base-line
subtraction from the total energy expenditure [5], have been reported [10,11]. These indices (WE
and DE) are considered to be better estimations of the true muscular efficiency since they account
for the unmeasured work [10].
It is of interest to note that during arm cranking and hand-cycling either synchronous (SYN) or
asynchronous (ASY) modes for the limb movement pattern can be adopted. Typically during
wheelchair propulsion a SYN limb movement pattern is employed, this coupled with a lower push
frequency has been shown to be more economical than higher frequencies [8, 9]. However,
because propulsion remains relatively unconstrained, a wheelchair dependent participant could
adopt either a SYN or ASY mode for propulsion. A SYN movement pattern is best described as
when both hands contact the hand-rim at the same time to propel the wheelchair, whilst the ASY
mode involves the hands contacting the hand-rim alternately. To date, the literature which has
compared the physiological responses to SYN and ASY modes in different forms of cyclic arm
exercise has been equivocal as to which is the most efficient [2, 6, 9, 16]. Goosey-Tolfrey and Kirk
[9] suggested that the SYN mode of wheel- chair propulsion was more economical than the ASY
mode when arm frequency was lower (40 pushes·min–1). In contrast, earlier work has indicated
that the ASY mode provided a physiological advantage over the conventional SYN propulsion
mode [6], although arm frequency was not reported.
The purpose of this study was to determine the contributions of arm movement frequency
and propulsion mode on the internal work during submaximal propulsion. By using different
efficiency indices a greater understanding of hand-rim wheelchair propulsion will be gained. In
order to allow a direct comparison of SYN and ASY modes, the total number of arm movements is
considered important, therefore, in terms of arm frequency, the following push strategy modes
were selected: a) SYN [40:40], b) ASY [40:40], and c) ASY [20:20]. These ratios coupled with both
SYN and ASY represent the number of movements that occur per arm (left: right). The push
frequency of 40 pushes·min–1 was chosen to allow comparisons with previous literature [8, 9]. We
Synchronous vs. Asynchronous push strategies Chapter 2
33
hypothesised: 1) The ASY strategy is the more efficient mode of propulsion at both 1.2 and 1.7
m·s–1, and 2) Higher arm frequencies [40:40] result in the lowest mechanical efficiency.
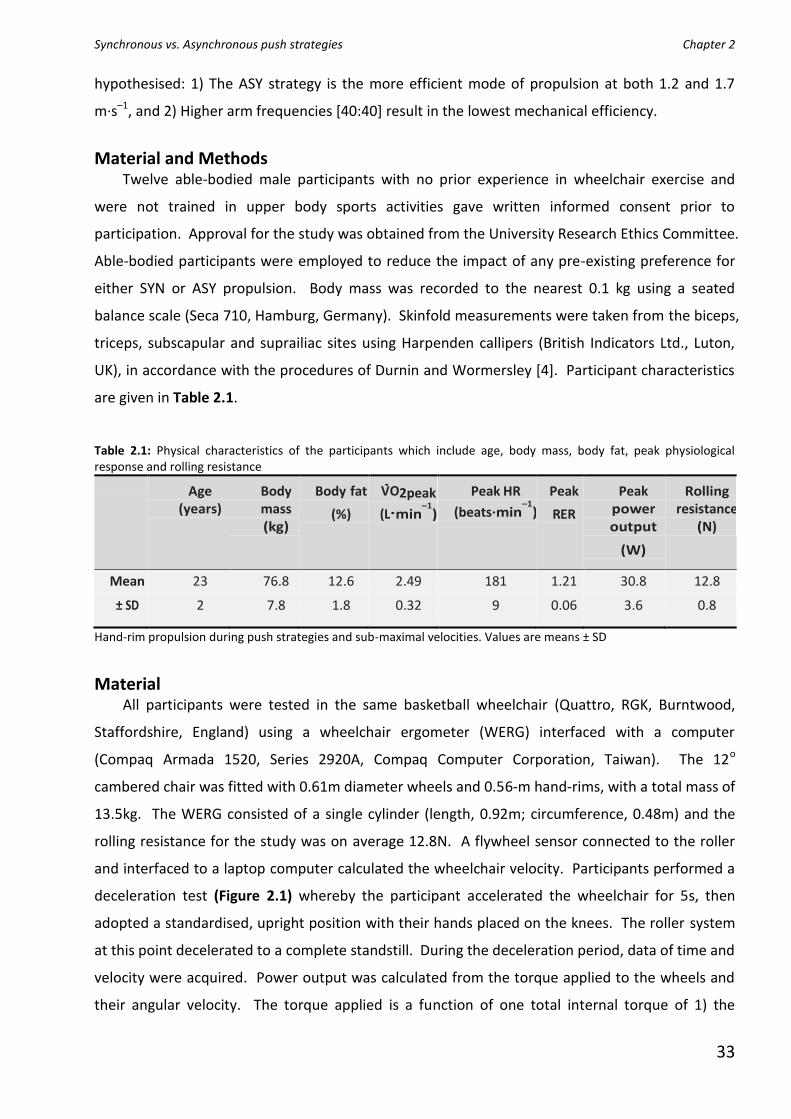
Material and Methods Twelve able-bodied male participants with no prior experience in wheelchair exercise and
were not trained in upper body sports activities gave written informed consent prior to
participation. Approval for the study was obtained from the University Research Ethics Committee.
Able-bodied participants were employed to reduce the impact of any pre-existing preference for
either SYN or ASY propulsion. Body mass was recorded to the nearest 0.1 kg using a seated
balance scale (Seca 710, Hamburg, Germany). Skinfold measurements were taken from the biceps,
triceps, subscapular and suprailiac sites using Harpenden callipers (British Indicators Ltd., Luton,
UK), in accordance with the procedures of Durnin and Wormersley [4]. Participant characteristics
are given in Table 2.1.
Table 2.1: Physical characteristics of the participants which include age, body mass, body fat, peak physiological response and rolling resistance
Age (years)
Body mass (kg)
Body fat
(%)
V̇O2peak
(L·min–1
)
Peak HR
(beats·min–1
)
Peak
RER
Peak power output
(W)
Rolling resistance
(N)
Mean 23 76.8 12.6 2.49 181 1.21 30.8 12.8
± SD 2 7.8 1.8 0.32 9 0.06 3.6 0.8
Hand-rim propulsion during push strategies and sub-maximal velocities. Values are means ± SD
Material All participants were tested in the same basketball wheelchair (Quattro, RGK, Burntwood,
Staffordshire, England) using a wheelchair ergometer (WERG) interfaced with a computer
(Compaq Armada 1520, Series 2920A, Compaq Computer Corporation, Taiwan). The 12o
cambered chair was fitted with 0.61m diameter wheels and 0.56-m hand-rims, with a total mass of
13.5kg. The WERG consisted of a single cylinder (length, 0.92m; circumference, 0.48m) and the
rolling resistance for the study was on average 12.8N. A flywheel sensor connected to the roller
and interfaced to a laptop computer calculated the wheelchair velocity. Participants performed a
deceleration test (Figure 2.1) whereby the participant accelerated the wheelchair for 5s, then
adopted a standardised, upright position with their hands placed on the knees. The roller system
at this point decelerated to a complete standstill. During the deceleration period, data of time and
velocity were acquired. Power output was calculated from the torque applied to the wheels and
their angular velocity. The torque applied is a function of one total internal torque of 1) the
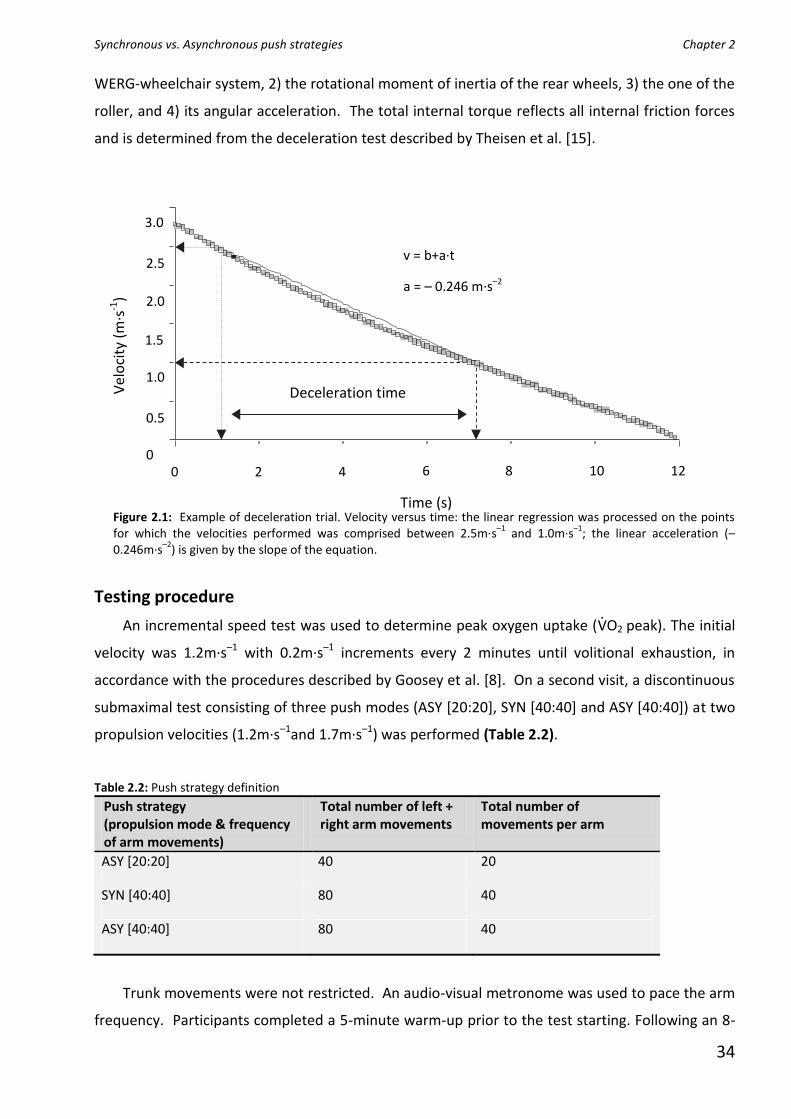
Synchronous vs. Asynchronous push strategies Chapter 2
34
WERG-wheelchair system, 2) the rotational moment of inertia of the rear wheels, 3) the one of the
roller, and 4) its angular acceleration. The total internal torque reflects all internal friction forces
and is determined from the deceleration test described by Theisen et al. [15].
Figure 2.1: Example of deceleration trial. Velocity versus time: the linear regression was processed on the points for which the velocities performed was comprised between 2.5m·s
–1 and 1.0m·s
–1; the linear acceleration (–
0.246m·s–2
) is given by the slope of the equation.
Testing procedure
An incremental speed test was used to determine peak oxygen uptake ( ·VO2 peak). The initial
velocity was 1.2m·s–1 with 0.2m·s–1 increments every 2 minutes until volitional exhaustion, in
accordance with the procedures described by Goosey et al. [8]. On a second visit, a discontinuous
submaximal test consisting of three push modes (ASY [20:20], SYN [40:40] and ASY [40:40]) at two
propulsion velocities (1.2m·s–1and 1.7m·s–1) was performed (Table 2.2).
Table 2.2: Push strategy definition
Push strategy (propulsion mode & frequency of arm movements)
Total number of left + right arm movements
Total number of movements per arm
ASY [20:20] 40 20
SYN [40:40] 80 40
ASY [40:40] 80 40
Trunk movements were not restricted. An audio-visual metronome was used to pace the arm
frequency. Participants completed a 5-minute warm-up prior to the test starting. Following an 8-
Deceleration time Vel
oci
ty (
m·s
-1)
Time (s)
v = b+a·t
a = – 0.246 m·s–2
2 0 4 6 8 10 12
2.0
1.5
1.0
0.5
0
3.0
2.5
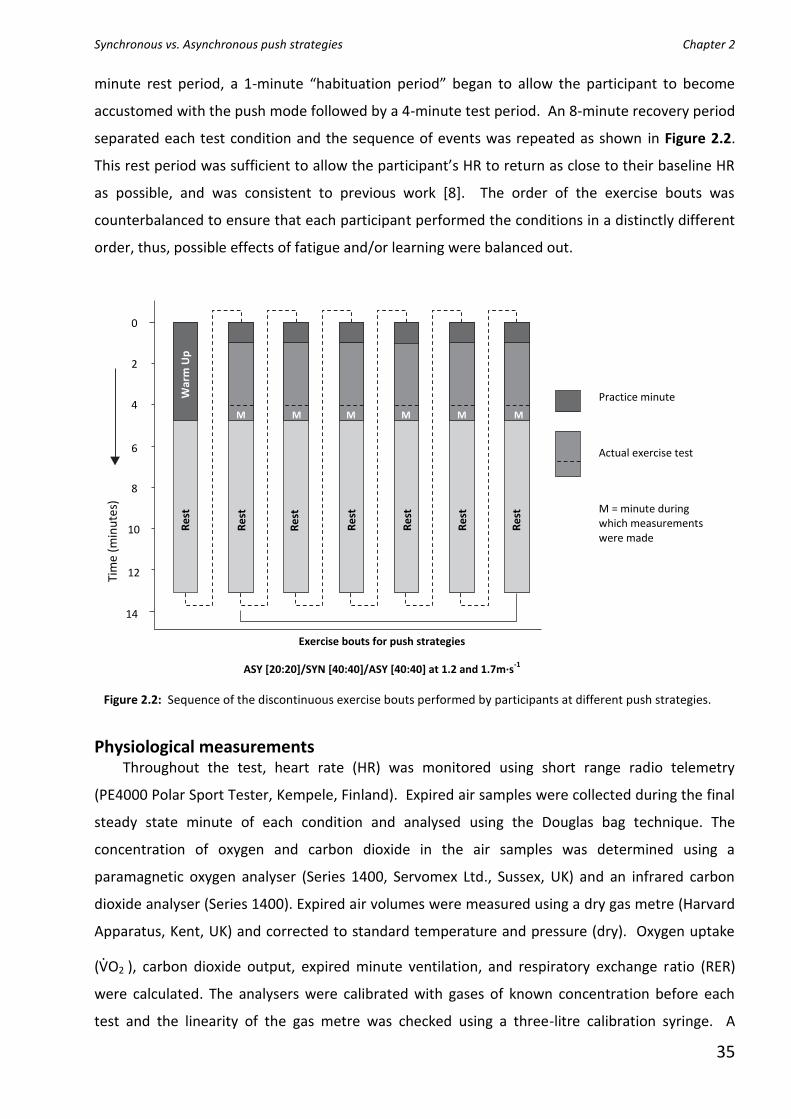
Synchronous vs. Asynchronous push strategies Chapter 2
35
minute rest period, a 1-minute “habituation period” began to allow the participant to become
accustomed with the push mode followed by a 4-minute test period. An 8-minute recovery period
separated each test condition and the sequence of events was repeated as shown in Figure 2.2.
This rest period was sufficient to allow the participant’s HR to return as close to their baseline HR
as possible, and was consistent to previous work [8]. The order of the exercise bouts was
counterbalanced to ensure that each participant performed the conditions in a distinctly different
order, thus, possible effects of fatigue and/or learning were balanced out.
Figure 2.2: Sequence of the discontinuous exercise bouts performed by participants at different push strategies.
Physiological measurements Throughout the test, heart rate (HR) was monitored using short range radio telemetry
(PE4000 Polar Sport Tester, Kempele, Finland). Expired air samples were collected during the final
steady state minute of each condition and analysed using the Douglas bag technique. The
concentration of oxygen and carbon dioxide in the air samples was determined using a
paramagnetic oxygen analyser (Series 1400, Servomex Ltd., Sussex, UK) and an infrared carbon
dioxide analyser (Series 1400). Expired air volumes were measured using a dry gas metre (Harvard
Apparatus, Kent, UK) and corrected to standard temperature and pressure (dry). Oxygen uptake
( ·VO2 ), carbon dioxide output, expired minute ventilation, and respiratory exchange ratio (RER)
were calculated. The analysers were calibrated with gases of known concentration before each
test and the linearity of the gas metre was checked using a three-litre calibration syringe. A
Practice minute
Actual exercise test
M = minute during which measurements were made
M
M
M
M
M
M
W
arm
Up
R
est
R
est
R
est
R
est
R
est
R
est
R
est
0
Ti
me
(min
ute
s)
2
4
6
8
10
12
14
Exercise bouts for push strategies
ASY [20:20]/SYN [40:40]/ASY [40:40] at 1.2 and 1.7m·s-1

Synchronous vs. Asynchronous push strategies Chapter 2
36
capillary blood sample was collected from the earlobe immediately following each condition.
Blood lactate [La]b concentration was determined using an automatic analyser (YSI 1500 sport,
Yellow Springs, Ohio, USA).
Efficiency measurements A resting expired air sample was taken prior to exercise; participants remained seated in the
wheelchair on the WERG. Participants performed three counterbalanced, 4-minute bouts of
unloaded exercise (wheelchair raised above roller) at the three different push modes. Conditions
were separated by a 5-minute recovery period. Expired air samples were taken during the final
minute of each exercise bout to allow ·VO2 rest and
·VO2 unload (
·VO2 corresponding to unloaded
push strategies at 0W) to be calculated.
Mechanical efficiency (ME) was calculated as the ratio of the external work to energy
expended for one minute of exercise. The work done was determined by calculating the external
power output for all push modes. The energy expenditure was obtained from the product of ·VO2
and the oxygen energetic equivalent by using the associated measurements of RER and standard
conversion tables [14]. For the calculation of efficiency indices, the following equations were used
according to Whipp and Wasserman [21], Gaesser and Brooks [5] and Hintzy et al. [10, 11]:
Gross efficiency (GE) = (W/E) · 100 (%)
Net efficiency (NE) = (W/E – ER) · 100 (%)
Work efficiency (WE) = (W/E – EU) · 100 (%)
Delta efficiency (DE) = (DW/DE) · 100 (%)
where W is the external work accomplished; E is the total energy expended; ER is the energy
expended at rest; EU is the energy expended during unloaded exercise; DW is the increment of
work performed above previous work rate; DE is the increment of energy expended above the
previous energy expended.
Statistical analyses The Statistical Package for Social Sciences (SPSS, version 12; Chicago, IL, USA) was used for all the
statistical analyses. Means and standard deviations were computed for all variables. A two-way
analysis of variance (ANOVA) with repeated measurements (three push strategies at two
propulsion velocities) was applied to all physiological data to study any differences. Significance
was assumed at p ≤ 0.05. A Bonferroni post hoc test was applied to further analyse significant
main effects.
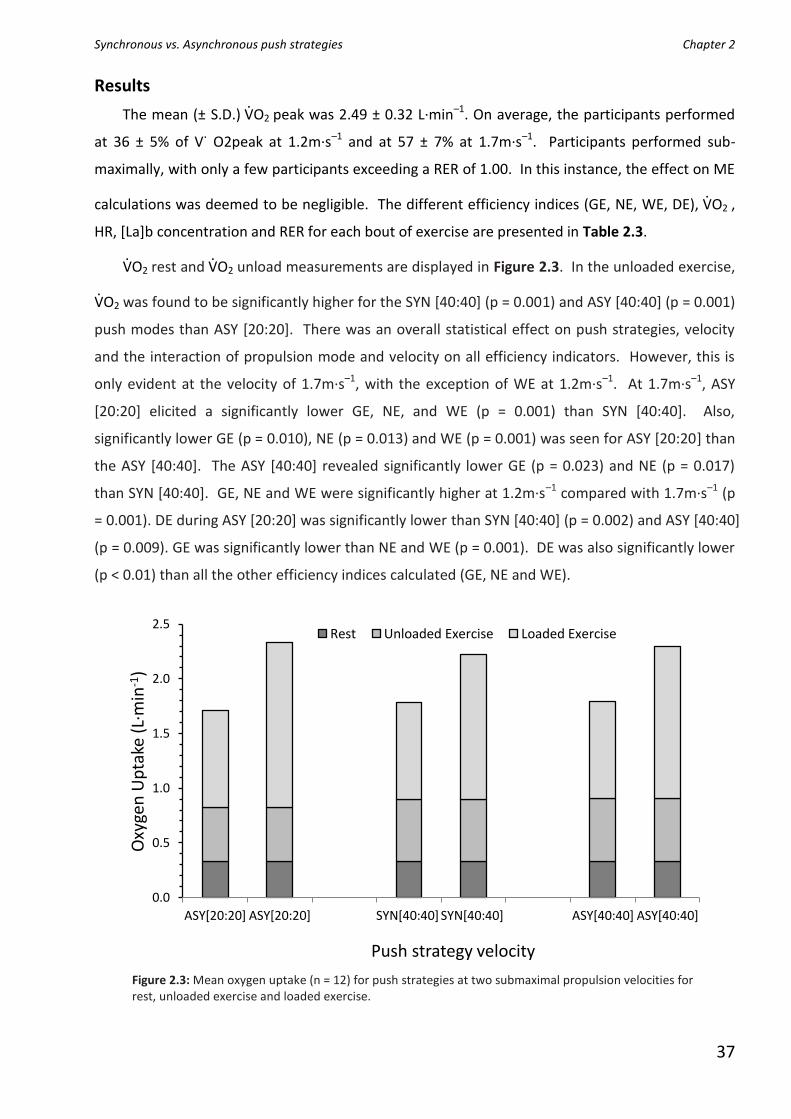
Synchronous vs. Asynchronous push strategies Chapter 2
37
Results
The mean (± S.D.) ·VO2 peak was 2.49 ± 0.32 L·min–1. On average, the participants performed
at 36 ± 5% of V˙ O2peak at 1.2m·s–1 and at 57 ± 7% at 1.7m·s–1. Participants performed sub-
maximally, with only a few participants exceeding a RER of 1.00. In this instance, the effect on ME
calculations was deemed to be negligible. The different efficiency indices (GE, NE, WE, DE), ·VO2 ,
HR, [La]b concentration and RER for each bout of exercise are presented in Table 2.3.
·VO2 rest and ·VO2 unload measurements are displayed in Figure 2.3. In the unloaded exercise,
·VO2 was found to be significantly higher for the SYN [40:40] (p = 0.001) and ASY [40:40] (p = 0.001)
push modes than ASY [20:20]. There was an overall statistical effect on push strategies, velocity
and the interaction of propulsion mode and velocity on all efficiency indicators. However, this is
only evident at the velocity of 1.7m·s–1, with the exception of WE at 1.2m·s–1. At 1.7m·s–1, ASY
[20:20] elicited a significantly lower GE, NE, and WE (p = 0.001) than SYN [40:40]. Also,
significantly lower GE (p = 0.010), NE (p = 0.013) and WE (p = 0.001) was seen for ASY [20:20] than
the ASY [40:40]. The ASY [40:40] revealed significantly lower GE (p = 0.023) and NE (p = 0.017)
than SYN [40:40]. GE, NE and WE were significantly higher at 1.2m·s–1 compared with 1.7m·s–1 (p
= 0.001). DE during ASY [20:20] was significantly lower than SYN [40:40] (p = 0.002) and ASY [40:40]
(p = 0.009). GE was significantly lower than NE and WE (p = 0.001). DE was also significantly lower
(p < 0.01) than all the other efficiency indices calculated (GE, NE and WE).
Figure 2.3: Mean oxygen uptake (n = 12) for push strategies at two submaximal propulsion velocities for rest, unloaded exercise and loaded exercise.
0.0
0.5
1.0
1.5
2.0
2.5
ASY[20:20] ASY[20:20] SYN[40:40] SYN[40:40] ASY[40:40] ASY[40:40]
Oxy
gen
Up
take
(L·
min
-1)
Push strategy velocity
Rest Unloaded Exercise Loaded Exercise
1.2 m·s-1 1.7 m·s-1 1.2 m·s-1 1.7 m·s-1 1.2 m·s-1 1.7 m·s-1
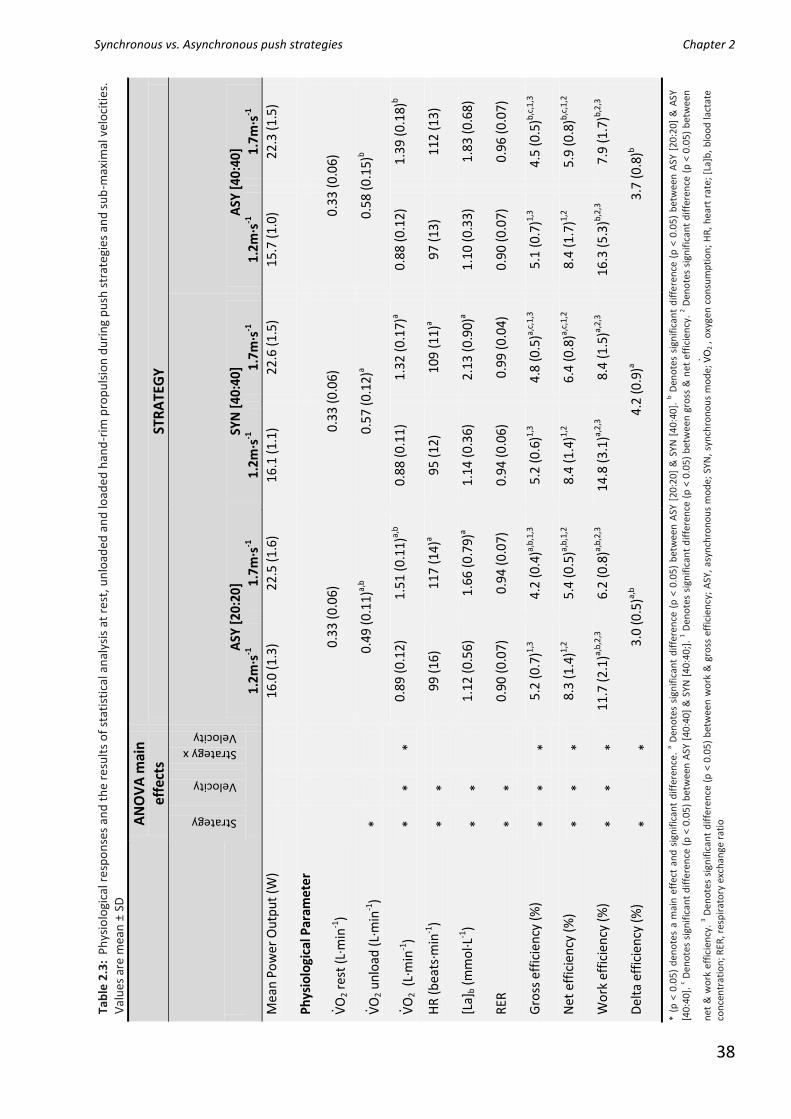
Synchronous vs. Asynchronous push strategies Chapter 2
38
Tab
le 2
.3:
Ph
ysio
logi
cal r
esp
on
ses
and
th
e re
sult
s o
f st
atis
tica
l an
alys
is a
t re
st, u
nlo
aded
an
d lo
aded
han
d-r
im p
rop
uls
ion
du
rin
g p
ush
str
ateg
ies
and
su
b-m
axim
al v
elo
citi
es.
V
alu
es a
re m
ean
± S
D
* (p
< 0
.05
) d
eno
tes
a m
ain
eff
ect
and
sig
nif
ican
t d
iffe
ren
ce.
a Den
ote
s si
gnif
ican
t d
iffe
ren
ce (
p <
0.0
5)
bet
wee
n A
SY [
20:2
0] &
SYN
[4
0:4
0].
b D
eno
tes
sign
ific
ant
dif
fere
nce
(p
< 0
.05
) b
etw
een
ASY
[20
:20]
& A
SY
[40
:40
]. c D
eno
tes
sign
ific
ant
dif
fere
nce
(p
< 0
.05
) b
etw
een
ASY
[4
0:4
0]
& S
YN [
40
:40
;].
1 Den
ote
s si
gnif
ican
t d
iffe
ren
ce (
p <
0.0
5)
bet
wee
n g
ross
& n
et e
ffic
ien
cy.
2 Den
ote
s si
gnif
ican
t d
iffe
ren
ce (
p <
0.0
5)
bet
wee
n
net
& w
ork
eff
icie
ncy
. 3 D
eno
tes
sign
ific
ant
dif
fere
nce
(p
< 0
.05
) b
etw
een
wo
rk &
gro
ss e
ffic
ien
cy;
ASY
, as
ynch
ron
ou
s m
od
e; S
YN,
syn
chro
no
us
mo
de;
· VO
2 ,
oxy
gen
co
nsu
mp
tio
n;
HR
, h
eart
rat
e; [
La]b
, b
loo
d la
ctat
e
con
cen
trat
ion
; RER
, res
pir
ato
ry e
xch
ange
rat
io
AN
OV
A m
ain
ef
fect
s ST
RA
TEG
Y
Strategy
Velocity
Strategy x
Velocity
ASY
[20
:20]
SY
N [
40:4
0]
ASY
[40
:40]
1.2m
·s-1
1.
7m·s
-1
1.2m
·s-1
1.
7m·s
-1
1.2m
·s-1
1.
7m·s
-1
Mea
n P
ow
er O
utp
ut
(W)
16
.0 (
1.3)
22
.5 (
1.6)
16
.1 (
1.1)
22
.6 (
1.5)
15
.7 (
1.0)
22
.3 (
1.5)
Ph
ysio
logi
cal P
aram
eter
· VO
2 re
st (
L·m
in-1
)
0.33
(0.
06)
0.33
(0.
06)
0.33
(0.
06)
· VO
2 u
nlo
ad (
L·m
in-1
) *
0.49
(0.
11)a,
b
0.57
(0.
12)a
0.58
(0.
15)b
· VO
2 (
L·m
in-1
) *
* *
0.89
(0.
12)
1.51
(0.
11)a,
b
0.88
(0.
11)
1.32
(0.
17)a
0.88
(0.
12)
1.39
(0.
18)b
HR
(b
eats
·min
-1)
* *
99
(16
) 11
7 (1
4)a
95 (
12)
109
(11)
a 97
(13
) 11
2 (1
3)
[La]
b (m
mo
l·L-1
) *
*
1.12
(0.
56)
1.66
(0.
79)a
1.14
(0.
36)
2.13
(0.
90)a
1.10
(0.
33)
1.83
(0.
68)
RER
*
*
0.90
(0.
07)
0.94
(0.
07)
0.94
(0.
06)
0.99
(0.
04)
0.90
(0.
07)
0.96
(0.
07)
Gro
ss e
ffic
ien
cy (
%)
* *
* 5.
2 (0
.7)1,
3
4.2
(0.4
)a,b,
1,3
5.2
(0.6
)1,3
4.8
(0.5
)a,c,
1,3
5.1
(0.7
)1,3
4.5
(0.5
)b,c,
1,3
Net
eff
icie
ncy
(%
) *
* *
8.3
(1.4
)1,2
5.4
(0.5
)a,b,
1,2
8.4
(1.4
)1,2
6.4
(0.8
)a,c,
1,2
8.4
(1.7
)1,2
5.9
(0.8
)b,c,
1,2
Wo
rk e
ffic
ien
cy (
%)
* *
* 11
.7 (
2.1)
a,b,
2,3
6.2
(0.8
)a,b,
2,3
14.8
(3.
1)a,
2,3
8.4
(1.5
)a,2,
3
16.3
(5.
3)b,
2,3
7.9
(1.7
)b,2,
3
Del
ta e
ffic
ien
cy (
%)
*
* 3.
0 (0
.5)a,
b
4.2
(0.9
)a 3.
7 (0
.8)b
Synchronous vs. Asynchronous push strategies Chapter 2
39
Discussion Results show a combination of different phenomena: 1) the effect of SYN versus ASY; 2) the
effect of propulsion velocity for all push modes; 3) the shift in overall magnitude for the different
efficiency indices as a consequence of the different correction factors for internal work. These
phenomena are discussed below. For inexperienced, able-bodied participants using a velocity
based protocol at low power output levels, the GE values across conditions averaged 4.2 to 5.2%.
These values are in line with previous studies examining efficiency at similar power outputs [3, 10].
It is evident in the literature that ME is affected by velocity, mode and arm frequency [2, 10, 11, 18,
19].
Gross, net, work and delta efficiency show significant changes with both the frequency [20:20]
vs. [40:40] (Table 3), and propulsion mode (SYN vs. ASY). Table 3 indicates a disadvantage for GE,
NE and WE with a lower arm frequency (ASY [20:20] vs. SYN [40:40] and ASY [40:40]) at 1.7m·s–1.
This is in contrast with ·VO2 unload (internal work) that shows a significantly lower value at [20: 20]
compared to [40:40]. The lower internal work at [20:20] unloaded is overruled by the task
requirements of ASY [20: 20] at 1.7m·s–1, as indicated by the lower GE and WE. Although no
significant differences were found for 1.2m·s–1 for ·VO2 and GE, the change in ·VO2 for ASY [20:20] is
higher than the [40:40] conditions as a consequence of the lower ·VO2 unload in the ASY [20:20]
condition. This is expressed in the significant difference found in the WE. Thus, the lower arm
frequency introduces a higher internal workload, as expressed in the lower GE and WE values. This
seems to be associated to the higher amount of external work per arm per push that needs to be
generated to maintain a constant velocity. Similar findings were seen in van der Woude et al. [18]
for the lower frequency range in submaximal wheelchair propulsion at a constant power output in
both able-bodied and wheelchair dependent individuals and in handcycling at different gear ratios
[16]. The higher work per push introduces a shift in the force-velocity characteristic of the active
muscles and changes in the stabilisation requirement of the trunk. There could also be changes in
the force-length characteristics of the muscle through changes in stroke angle and kinematics due
to the need for greater work per push. When comparing conditions with the same number of arm
movements [40:40], the SYN mode appears preferential. The SYN vs. ASY propulsion mode at the
equal number of arm movements [40:40] at 1.7m·s–1 demonstrated an efficiency advantage with
the SYN mode. Previous literature that has investigated SYN vs. ASY in different forms of cyclic arm
exercise has reported equivocal findings as to which is the most efficient in upper body arm work
[2, 6, 9, 16]. Once again with no significant difference being observed for ·VO2 unload of SYN
[40:40] and ASY [40:40], yet there was a difference in the loaded ·VO2 (p = 0.07, 1.32 vs. 1.39
L·min–1, respectively). This helps explain the differences noted in GE. The implication being that
during the ASY mode there is an increased “active” internal workload, perhaps as a result of the
Synchronous vs. Asynchronous push strategies Chapter 2
40
task complexity, and as such follows the findings in ASY vs. SYN hand cycling [2,16] and lever
propulsion [17]. The different movement pattern and simultaneously stabilising role of the trunk
and its different, more complex involvement in unilateral external force production contribute to
increased energy expenditure at the same propulsion velocity. Mechanical efficiency indices (GE,
NE, WE) were all dependent upon velocity of propulsion, and significant reduction in efficiency
was found at the higher velocity. This may be explained by the internal work involved. The
proportion of unmeasured work in the total energy expenditure changes significantly and cannot
be measured in the unloaded condition. Consequently, the ratio between work done and the
energy expended is increased, decreasing efficiency. Increased velocity increases the demands of,
for example push forces and coupling of the hand-rim [19]. The effect of the velocity increase
could also be attributed to the constraint of arm frequency in the push modes employed. It is
therefore apparent that physiological responses and ME indices are influenced by a combination
of propulsion mode, frequency and velocity.
Important points for discussion relate to methodological considerations. Able-bodied
inexperienced wheelchair participants were employed for two main reasons. Firstly, to avoid any
influence of disability and the probable effects of limited arm or trunk function; secondly, to avoid
the possible effects of training in wheelchair users at given propulsion modes and frequency of
arm movements. Therefore, a homogenous participant group (training, propulsion experience; no
pathology) was created. Although its use is open to debate [13], literature has continually
reported responses in able-bodied non-wheelchair user groups to comply with the overall trends
in physiology as shown by wheelchair users [1, 2, 11, 18]. The counterbalanced order of the six
experimental conditions separated by rest periods allowed us to minimise both the effects of
learning and fatigue. A standardised chair configuration eliminated effects of chair designs/setups
on physiological measurements. The wheelchair ergometer with a fixed chain using a single roller
allowed the wheelchair to be fixed in a stationary position. This allowed the effects of push
strategy to be investigated because there are no effects of coasting direction of the wheelchair,
and thus the external work requirements. More importantly, the power output in both the SYN
and ASY mode is equal during propulsion.
In conclusion, the energy expenditure of unloaded arm movements increases with a lower
arm frequency but is overruled by the task complexity requirements of propulsion at higher arm
frequency. Under the current testing conditions, SYN propulsion mode offers greater efficiency
during wheelchair propulsion.
Acknowledgements The authors would like to acknowledge the support provided by RGK Wheelchairs for the loan
of the Quattro basketball wheelchair. They would also like to thank the participants for their
commitment to the investigation.

Synchronous vs. Asynchronous push strategies Chapter 2
41
References 1 Brown DD, Knowlton RG, Hamill J, Schneider TL, Hetzler RK. Physiological and biomechanical differences between
wheelchair-dependent and able-bodied subjects during wheelchair ergometry. Eur J Appl Physiol 1990; 60: 179–182.
2 Dallmeijer AJ, Zentgraaff ID, Zijp NI, van der Woude LHV. Sub-maximal physical strain and peak performance in
handcycling versus hand-rim wheelchair propulsion. Spinal Cord 2004; 42: 91–98.
3 Groot S de, Veeger DHEV, Hollander AP, van der Woude LHV. Wheelchair propulsion technique and mechanical
efficiency after 3 wk. of practice. Med Sci Sports Exerc 2002; 34: 756–766.
4 Durnin JV, Womersley J. Body fat assessed from total body density and its estimation from skinfold thickness:
measurements on 481 men and women aged from 16 to 72 years. Br J Nutr 1974; 32: 77–97.
5 Gaesser GA, Brooks GA. Muscular efficiency during steady-rate exercise: effects of speed and work rate. J Appl
Physiol 1975; 38: 1132–1139.
6 Glaser RM, Sawka MN, Young RE, Suryaprasad AG. Applied physiology for wheelchair design. J Physiol 1980; 48: 41–
44.
7 Goosey VL, Campbell IG, Fowler NE. The relationship between three-dimensional wheelchair propulsion techniques
and pushing economy. J Appl Biomech 1998; 14: 412–427.
8 Goosey VL, Campbell IG, Fowler NE. Effect of push frequency on the economy of wheelchair racers. Med Sci Sports
Exerc 2000; 32: 174–181.
9 Goosey-Tolfrey VL, Kirk JH. Effect of push frequency and strategy variations on economy and perceived exertion
during wheelchair propulsion. Eur J Appl Physiol 2003; 90: 153–158.
10 Hintzy F, Tordi N. Mechanical efficiency during hand-rim wheelchair propulsion: effects of base-line subtraction and
power output. Clin Biomech 2004; 19: 343–349.
11 Hintzy F, Tordi N, Perrey S. Muscular efficiency during arm cranking and wheelchair exercise: a comparison. Int J
Sports Med 2002; 23: 408–414.
12 Marais G, Dupont L, Maillet M, Weisslans T, Vanvelcenaher J, Pelayo P. Cardiorespiratory and efficiency responses
during arm and leg exercises with spontaneously chosen crank and pedal rates. Ergonomics 2002; 45: 631–639.
13 Patterson P, Draper S. Selected comparisons between experienced and non-experienced individuals during manual
wheelchair propulsion. Biomed Sci Instrum 1997; 33: 477-481.
14 Peronnet F, Massicotte D. Table of non-protein respiratory quotient: an update. Can J Sport Sci 1991; 16: 23–29.
15 Theisen D, Francaux M, Fayt A, Sturbois X. A new procedure to determine external power output during hand-rim
wheelchair propulsion on a roller ergometer: a reliability study. Int J Sports Med 1996; 17: 564–571.
16 van der Woude LHV, Bosmans I, Bervoets B, Veeger HEJ. Handcycling: different modes and gear ratios. J Med Eng
Tech 2000; 24: 242–249.
17 van der Woude LHV, Veeger HEJ, Dallmeijer AJ, Janssen TWJ, Rozendaal LA. Biomechanics and physiology in active
manual wheelchair propulsion. Med Eng Physics 2001; 23: 713–733.
18 van der Woude LHV, Veeger HEJ, Rozendal RH, Sargeant AJ. Optimum cycle frequencies in hand-rim wheelchair
propulsion. Wheelchair propulsion technique. Eur J Appl Physiol 1989; 58: 625–632.
19 Veeger HEJ, van der Woude LHV, Rozendal RH. Effect of hand-rim velocity on mechanical efficiency in wheelchair
propulsion. Med Sci Sports Exerc 1992; 24: 100–107.
Synchronous vs. Asynchronous push strategies Chapter 2
42
20 Verellen J, Theisen D, Vanlandewijck Y. Influence of crank rate in handcycling. Med Sci Sports Exerc 2004; 36: 1826–
1831.
21 Whipp BJ, Wasserman K. Efficiency of muscular work. J Appl Physiol 1969; 26: 644–648.
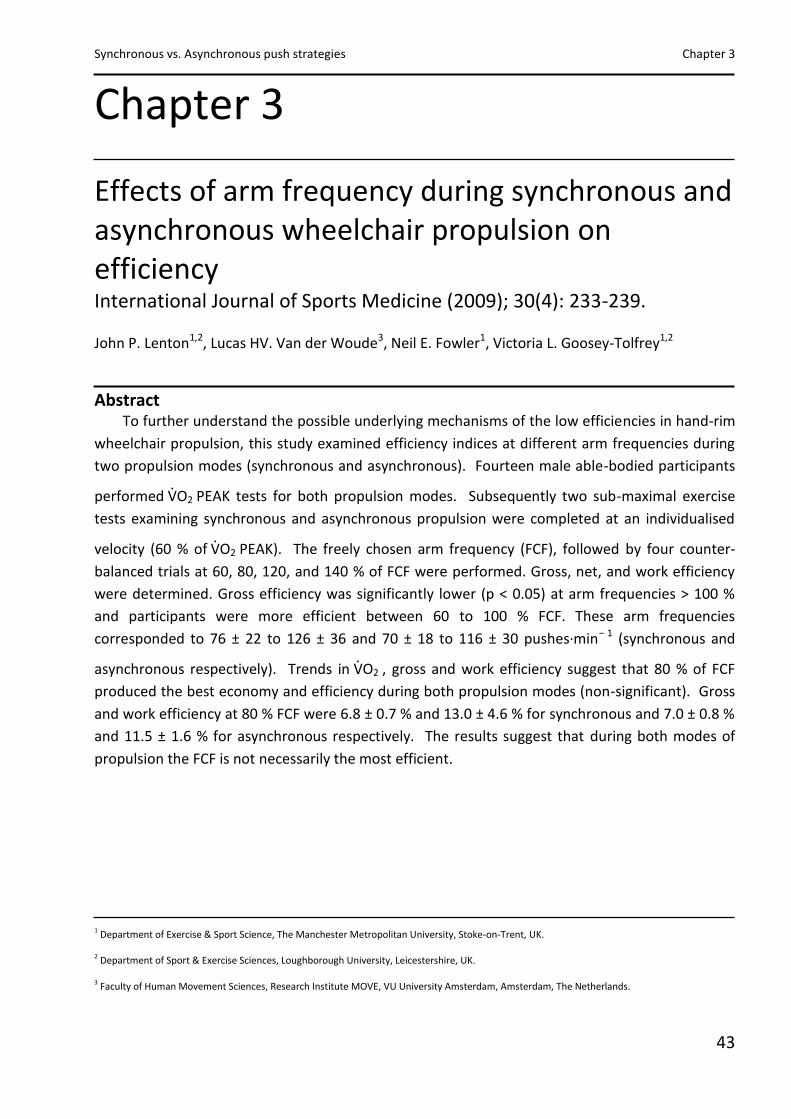
Synchronous vs. Asynchronous push strategies Chapter 3
43
Chapter 3
Effects of arm frequency during synchronous and asynchronous wheelchair propulsion on efficiency International Journal of Sports Medicine (2009); 30(4): 233-239. John P. Lenton1,2, Lucas HV. Van der Woude3, Neil E. Fowler1, Victoria L. Goosey-Tolfrey1,2
Abstract To further understand the possible underlying mechanisms of the low efficiencies in hand-rim
wheelchair propulsion, this study examined efficiency indices at different arm frequencies during
two propulsion modes (synchronous and asynchronous). Fourteen male able-bodied participants
performed ·VO2 PEAK tests for both propulsion modes. Subsequently two sub-maximal exercise
tests examining synchronous and asynchronous propulsion were completed at an individualised
velocity (60 % of ·VO2 PEAK). The freely chosen arm frequency (FCF), followed by four counter-
balanced trials at 60, 80, 120, and 140 % of FCF were performed. Gross, net, and work efficiency
were determined. Gross efficiency was significantly lower (p < 0.05) at arm frequencies > 100 %
and participants were more efficient between 60 to 100 % FCF. These arm frequencies
corresponded to 76 ± 22 to 126 ± 36 and 70 ± 18 to 116 ± 30 pushes·min− 1 (synchronous and
asynchronous respectively). Trends in ·VO2 , gross and work efficiency suggest that 80 % of FCF
produced the best economy and efficiency during both propulsion modes (non-significant). Gross
and work efficiency at 80 % FCF were 6.8 ± 0.7 % and 13.0 ± 4.6 % for synchronous and 7.0 ± 0.8 %
and 11.5 ± 1.6 % for asynchronous respectively. The results suggest that during both modes of
propulsion the FCF is not necessarily the most efficient.
1 Department of Exercise & Sport Science, The Manchester Metropolitan University, Stoke-on-Trent, UK. 2 Department of Sport & Exercise Sciences, Loughborough University, Leicestershire, UK. 3 Faculty of Human Movement Sciences, Research Institute MOVE, VU University Amsterdam, Amsterdam, The Netherlands.
Synchronous vs. Asynchronous push strategies Chapter 3
44
Introduction Previous research investigating the manipulation of arm frequency and or propulsion mode is
limited [7, 8, 10, 14, 25] and the effects of arm frequency are not well understood in terms of
energy cost or efficiency of propulsion. Hand-rim propulsion is a guided movement that is
regulated highly by the rim curvature and its speed and direction of movement. Within these
constraints participants are free to adopt different arm frequencies, propulsion modes or both in
such a way that suits their requirements at a given wheelchair propulsion velocity or task. In
terms of arm frequency, a considerable degree of inter-individual variations is seen at a given
speed and/ or resistance level [8, 25]. Despite this, hand-rim propulsion remains relatively
inefficient with reported gross efficiency values up to 10 % during everyday activities [24, 28] and
12 % in studies using trained wheelchair racing athletes (7).
Typically most studies have employed the synchronous (SYN) mode of propulsion. This arm
movement pattern is best described as when both hands contact the wheels at the same time to
propel the wheelchair. On the other hand an asynchronous (ASY) movement pattern is when the
hands contact the wheel alternately [14]. Recent observations have shown the ASY propulsion
mode to have emerged during everyday use and sporting situations (wheelchair tennis and
basketball). However, for this propulsion mode the question arises as to whether participants can
indeed adopt this strategy, and at what energy cost. The ASY mode appears to require a different
range of motion and stability from the trunk as well as muscle function in comparison to the SYN
mode. Adopting the ASY mode therefore, could require different levels of active and passive work
to stabilise the trunk and accelerate the arms, resulting in changes to energy cost, hence improved
or reduced efficiency of propulsion. Comparing these different propulsion modes could further
help understand the low wheelchair propulsion efficiencies reported. The manipulation of arm
frequency and its role in efficiency of propulsion is also an important factor to be considered in
parallel with propulsion mode.
When considering the physiological responses to SYN and ASY cyclic arm exercise there are
some inconsistent findings with research studies indicating better efficiency in SYN movement
pattern [3, 10, 14, 22] and others the ASY movement pattern [6, 15]. Findings are unclear as to
which is the most efficient in upper body arm work, Goosey-Tolfrey and Kirk [10] suggested that
SYN propulsion was more economical than ASY when the frequency of arm movements were
lower (40 pushes·min−1), however, at 70 pushes·min−1 ASY propulsion was preferred despite no
statistical difference to the SYN propulsion. In contrast, earlier work has indicated that the ASY
technique provided a physiological advantage over the conventional SYN technique [6]. More
recent work from our laboratory has found the SYN mode to offer improved efficiency during
hand-rim propulsion [14].
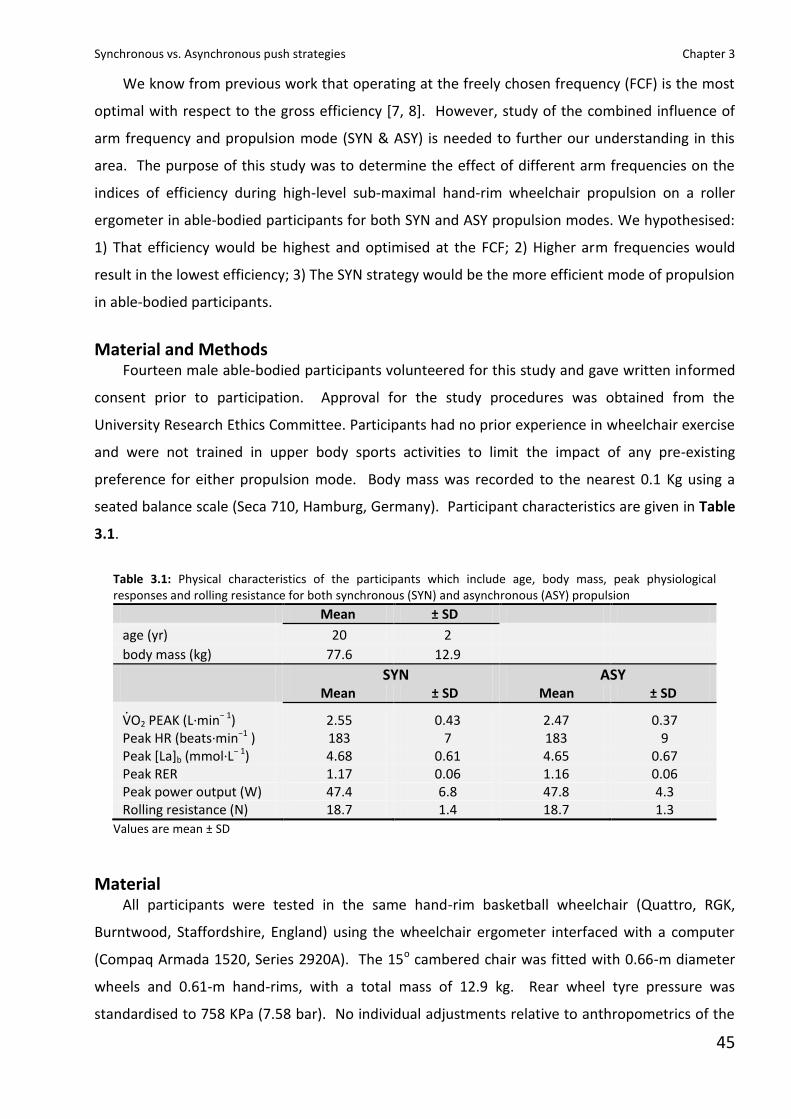
Synchronous vs. Asynchronous push strategies Chapter 3
45
We know from previous work that operating at the freely chosen frequency (FCF) is the most
optimal with respect to the gross efficiency [7, 8]. However, study of the combined influence of
arm frequency and propulsion mode (SYN & ASY) is needed to further our understanding in this
area. The purpose of this study was to determine the effect of different arm frequencies on the
indices of efficiency during high-level sub-maximal hand-rim wheelchair propulsion on a roller
ergometer in able-bodied participants for both SYN and ASY propulsion modes. We hypothesised:
1) That efficiency would be highest and optimised at the FCF; 2) Higher arm frequencies would
result in the lowest efficiency; 3) The SYN strategy would be the more efficient mode of propulsion
in able-bodied participants.
Material and Methods Fourteen male able-bodied participants volunteered for this study and gave written informed
consent prior to participation. Approval for the study procedures was obtained from the
University Research Ethics Committee. Participants had no prior experience in wheelchair exercise
and were not trained in upper body sports activities to limit the impact of any pre-existing
preference for either propulsion mode. Body mass was recorded to the nearest 0.1 Kg using a
seated balance scale (Seca 710, Hamburg, Germany). Participant characteristics are given in Table
3.1.
Table 3.1: Physical characteristics of the participants which include age, body mass, peak physiological responses and rolling resistance for both synchronous (SYN) and asynchronous (ASY) propulsion
Mean ± SD
age (yr) 20 2 body mass (kg) 77.6 12.9
SYN ASY Mean ± SD Mean ± SD
·VO2 PEAK (L·min− 1) 2.55 0.43 2.47 0.37 Peak HR (beats·min−1 ) 183 7 183 9 Peak [La]b (mmol·L− 1) 4.68 0.61 4.65 0.67 Peak RER 1.17 0.06 1.16 0.06 Peak power output (W) 47.4 6.8 47.8 4.3 Rolling resistance (N) 18.7 1.4 18.7 1.3
Values are mean ± SD
Material All participants were tested in the same hand-rim basketball wheelchair (Quattro, RGK,
Burntwood, Staffordshire, England) using the wheelchair ergometer interfaced with a computer
(Compaq Armada 1520, Series 2920A). The 15o cambered chair was fitted with 0.66-m diameter
wheels and 0.61-m hand-rims, with a total mass of 12.9 kg. Rear wheel tyre pressure was
standardised to 758 KPa (7.58 bar). No individual adjustments relative to anthropometrics of the
Synchronous vs. Asynchronous push strategies Chapter 3
46
participants were made. The wheelchair ergometer consisted of a single roller (length, 1.14-m;
circumference, 0.48-m) and the rolling resistance for the study was on average 18.7 N. A flywheel
sensor connected to the roller and interfaced to a laptop computer calculated and displayed the
wheelchair velocity.
Each participant performed a deceleration test and power output was calculated using the
principles described by Theisen et al. [19]. The deceleration test was repeated for both testing
sessions as participants performed SYN and ASY propulsion on two separate test days. For each
deceleration trial the participant was asked to accelerate the roller to the appropriate speed (2.5
m·s−1) and to then stop pushing. During the deceleration they sat stationary in the chair as if in the
position to perform the next push. The velocity was recorded as the chair slowed and the average
acceleration calculated from the slope of this velocity time data, resistance was then calculated
from this acceleration [14, 19]. Power output was calculated from the torque applied to the
wheels and their angular velocity. The torque applied is a function of one total internal torque of
1) the wheelchair ergometer-wheelchair system, 2) the rotational moment of inertia of the rear
wheels, 3) the one of the roller, and 4) its angular acceleration. The total internal torque reflects
all internal friction forces and is determined from the deceleration test. For further details of this
procedure please refer to Theisen et al. [19].
Testing procedure The SYN and ASY tests were performed on separate days in a counter-balanced order. Each
test day was divided into two distinct sessions, separated by a two hour rest period, to allow a full
recovery.
Session one – Peak exercise capacity Prior to exercise participants remained seated quietly in the wheelchair on the wheelchair
ergometer for a period of twenty minutes following which a two minute pre-exercise sample of
expired air ( ·VO2 REST ) was collected. Each participant then completed an incremental sub-
maximal exercise test comprising five or six, four minute stages. The initial speed was determined
following a self-selected warm-up period of five minutes where heart rate (HR) was approximately
100 beats·min−1, subsequently each exercise stage was a 0.2m·s-1 increment of the previous stage.
Following a fifteen minute rest period an incremental speed test was used to determine the peak
oxygen uptake ( ·VO2 PEAK) as previously described by Goosey-Tolfrey et al. [9]. These tests
provided a familiarisation with both propulsion modes; however, its main objective was to
establish participant’s individual velocity at 60 % ·VO2 PEAK.
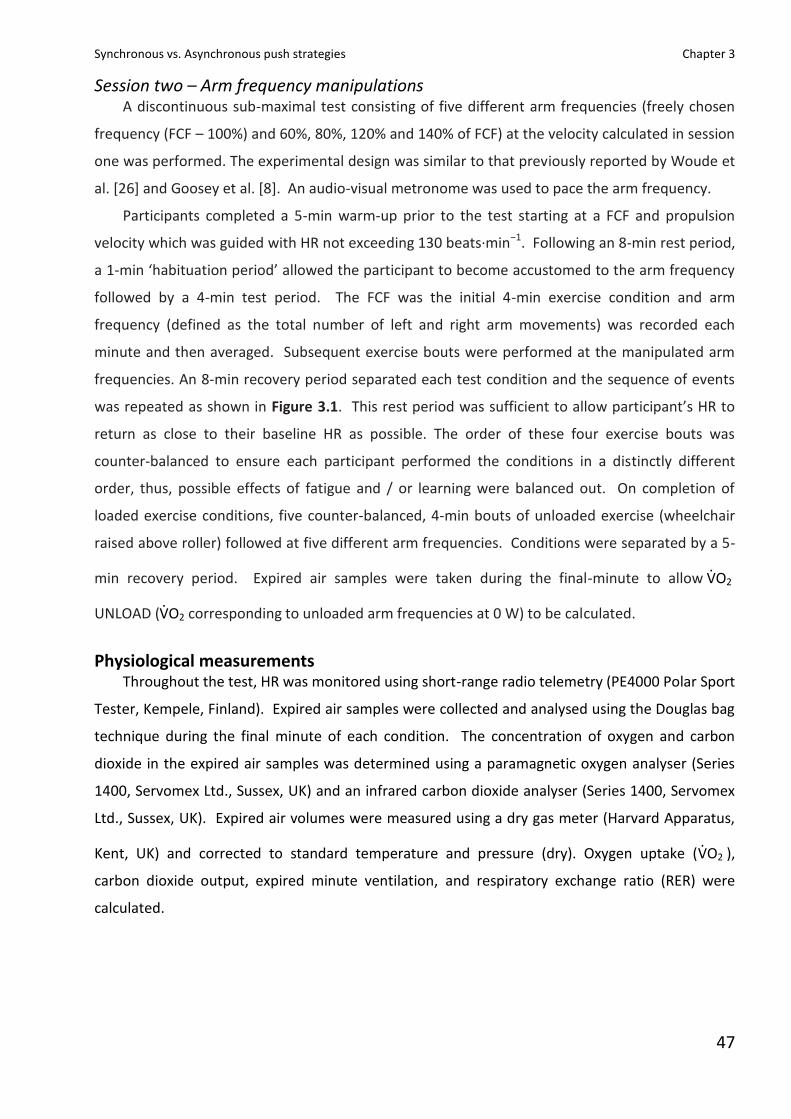
Synchronous vs. Asynchronous push strategies Chapter 3
47
Session two – Arm frequency manipulations A discontinuous sub-maximal test consisting of five different arm frequencies (freely chosen
frequency (FCF – 100%) and 60%, 80%, 120% and 140% of FCF) at the velocity calculated in session
one was performed. The experimental design was similar to that previously reported by Woude et
al. [26] and Goosey et al. [8]. An audio-visual metronome was used to pace the arm frequency.
Participants completed a 5-min warm-up prior to the test starting at a FCF and propulsion
velocity which was guided with HR not exceeding 130 beats·min−1. Following an 8-min rest period,
a 1-min ‘habituation period’ allowed the participant to become accustomed to the arm frequency
followed by a 4-min test period. The FCF was the initial 4-min exercise condition and arm
frequency (defined as the total number of left and right arm movements) was recorded each
minute and then averaged. Subsequent exercise bouts were performed at the manipulated arm
frequencies. An 8-min recovery period separated each test condition and the sequence of events
was repeated as shown in Figure 3.1. This rest period was sufficient to allow participant’s HR to
return as close to their baseline HR as possible. The order of these four exercise bouts was
counter-balanced to ensure each participant performed the conditions in a distinctly different
order, thus, possible effects of fatigue and / or learning were balanced out. On completion of
loaded exercise conditions, five counter-balanced, 4-min bouts of unloaded exercise (wheelchair
raised above roller) followed at five different arm frequencies. Conditions were separated by a 5-
min recovery period. Expired air samples were taken during the final-minute to allow ·VO2
UNLOAD ( ·VO2 corresponding to unloaded arm frequencies at 0 W) to be calculated.
Physiological measurements Throughout the test, HR was monitored using short-range radio telemetry (PE4000 Polar Sport
Tester, Kempele, Finland). Expired air samples were collected and analysed using the Douglas bag
technique during the final minute of each condition. The concentration of oxygen and carbon
dioxide in the expired air samples was determined using a paramagnetic oxygen analyser (Series
1400, Servomex Ltd., Sussex, UK) and an infrared carbon dioxide analyser (Series 1400, Servomex
Ltd., Sussex, UK). Expired air volumes were measured using a dry gas meter (Harvard Apparatus,
Kent, UK) and corrected to standard temperature and pressure (dry). Oxygen uptake ( ·VO2 ),
carbon dioxide output, expired minute ventilation, and respiratory exchange ratio (RER) were
calculated.
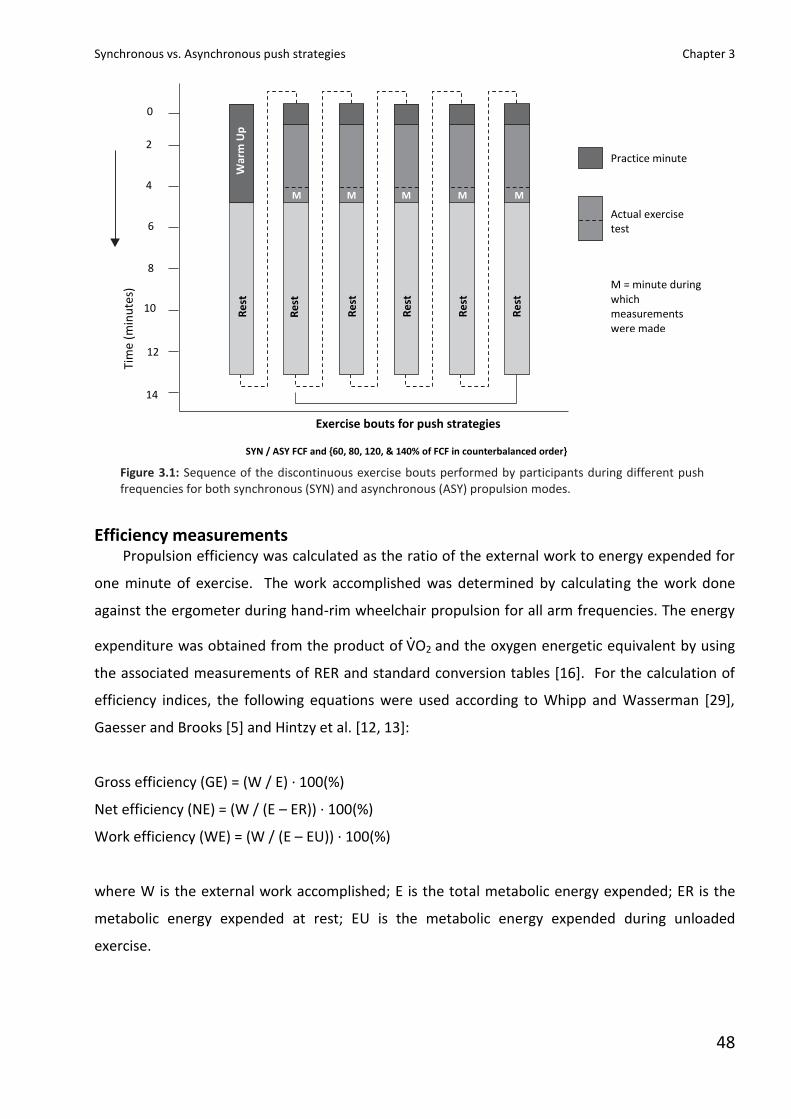
Synchronous vs. Asynchronous push strategies Chapter 3
48
Efficiency measurements Propulsion efficiency was calculated as the ratio of the external work to energy expended for
one minute of exercise. The work accomplished was determined by calculating the work done
against the ergometer during hand-rim wheelchair propulsion for all arm frequencies. The energy
expenditure was obtained from the product of ·VO2 and the oxygen energetic equivalent by using
the associated measurements of RER and standard conversion tables [16]. For the calculation of
efficiency indices, the following equations were used according to Whipp and Wasserman [29],
Gaesser and Brooks [5] and Hintzy et al. [12, 13]:
Gross efficiency (GE) = (W / E) · 100(%)
Net efficiency (NE) = (W / (E – ER)) · 100(%)
Work efficiency (WE) = (W / (E – EU)) · 100(%)
where W is the external work accomplished; E is the total metabolic energy expended; ER is the
metabolic energy expended at rest; EU is the metabolic energy expended during unloaded
exercise.
Practice minute
Actual exercise test
M = minute during which measurements were made
M
M
M
M
M
W
arm
Up
R
est
R
est
R
est
R
est
R
est
R
est
0
Ti
me
(min
ute
s)
2
4
6
8
10
12
14
Exercise bouts for push strategies
SYN / ASY FCF and {60, 80, 120, & 140% of FCF in counterbalanced order}
Figure 3.1: Sequence of the discontinuous exercise bouts performed by participants during different push frequencies for both synchronous (SYN) and asynchronous (ASY) propulsion modes.
Synchronous vs. Asynchronous push strategies Chapter 3
49
Statistical analyses The Statistical Package for Social Sciences (SPSS, version 12.0; Chicago, IL, USA) was used for
all the statistical analyses. Means and standard deviations were computed for all variables.
Separate paired Student’s t-tests were used to analyse the peak physiological responses obtained
during SYN and ASY propulsion modes. A two-way ANOVA with repeated measurements (five arm
frequencies at two propulsion modes) was applied to all physiological data. Significance for all
tests was assumed at p ≤ 0.05. A Bonferroni post hoc test was applied to further analyse
significant main effects.
Results
The mean power output during sub-maximal SYN exercise (at 60 % ·VO2 PEAK ) was 36.1 ± 4.4
W, ranging from 29.6 to 47.1 W and for the ASY mode 35.5 ± 3.4 W, ranging from 29.7 to 43.4 W
(p = 0.319). Participants performed sub-maximally, with only a few participants exceeding a RER of
1.00 at the 140 % FCF exercise condition. In this instance, the effect on efficiency calculations was
deemed to be negligible. Max RER values were only 1.01 and separate analysis revealed that
removal of these data did not alter the outcome. The ·VO2 , HR, RER and arm frequency for each
bout of exercise are presented in Table 3.2. The indices of efficiency (gross, net, work) are
displayed in Figure 3.2. To determine whether the order of conditions would influence the results
an ANOVA was performed. This revealed no order effect [F (2.5, 32.8) = 1.2, P = 0.31 and F (2.2,
28.8) = 1.64, P = 0.21 for SYN and ASY] and any differences can be attributed to arm frequency or
propulsion mode, not test order.
Table 3.1 presents SYN and ASY propulsion for ·VO2 PEAK measurements. The ·VO2 PEAK
values ranged from 1.73 to 3.56 L·min−1, with average values of 2.55 and 2.47 L·min−1 during SYN
and ASY propulsion respectively (P = 0.329). All individual propulsion velocities when calculated as
60 % ·VO2 PEAK were 1.86 ± 0.15m·s−1 (SYN) and 1.87 ± 0.11m·s−1 (ASY). The propulsion of the
wheelchair at the FCF and sub-maximal velocities corresponded to 61 ± 4 % of ·VO2 PEAK for SYN
propulsion and 61 ± 3 % of ·VO2 PEAK for ASY propulsion. However, the differences between the
FCF of the SYN and ASY propulsion modes was non-significant (Table 3.2).
Arm frequency had significant effects on both ·VO2 UNLOAD and loaded ·VO2 which was
particularly evident when the arm frequency was increased beyond the FCF (120% and 140%)
(Table 3.2). In all cases the energy cost of unloaded propulsion rose with the increases in arm
frequency hence an indication of greater metabolic demand. The ·VO2 UNLOAD represented on
average 43.2 % (± 3.4 %) of the loaded ·VO2 , with the proportion remaining more-or-less constant
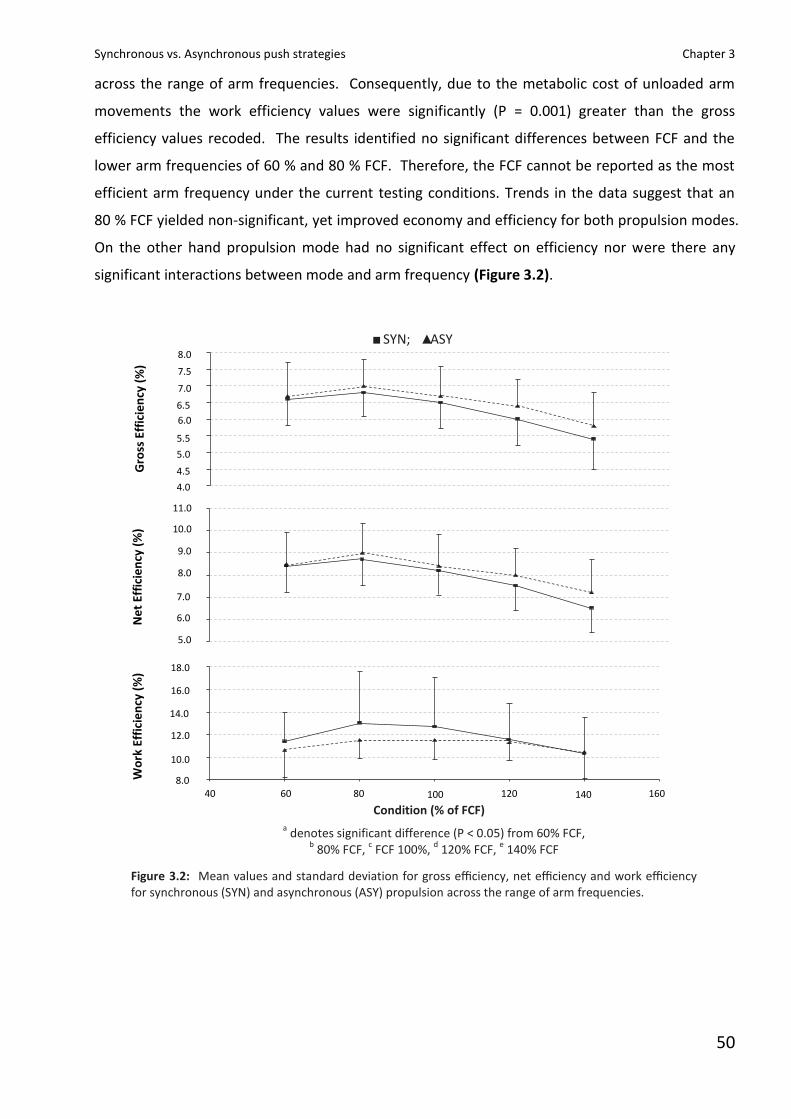
Synchronous vs. Asynchronous push strategies Chapter 3
50
across the range of arm frequencies. Consequently, due to the metabolic cost of unloaded arm
movements the work efficiency values were significantly (P = 0.001) greater than the gross
efficiency values recoded. The results identified no significant differences between FCF and the
lower arm frequencies of 60 % and 80 % FCF. Therefore, the FCF cannot be reported as the most
efficient arm frequency under the current testing conditions. Trends in the data suggest that an
80 % FCF yielded non-significant, yet improved economy and efficiency for both propulsion modes.
On the other hand propulsion mode had no significant effect on efficiency nor were there any
significant interactions between mode and arm frequency (Figure 3.2).
a denotes significant difference (P < 0.05) from 60% FCF,
b 80% FCF,
c FCF 100%,
d 120% FCF,
e 140% FCF
G
ross
Eff
icie
ncy
(%
)
Ne
t Ef
fici
en
cy (
%)
W
ork
Eff
icie
ncy
(%
)
8.0
7.5
7.0
6.5
6.0
5.5
5.0
4.5
4.0
11.0
9.0
8.0
7.0
6.0
5.0
10.0
18.0
14.0
12.0
10.0
8.0
16.0
■ SYN; ▲ ASY
40 60 80 100 120 140 160
Condition (% of FCF)
Figure 3.2: Mean values and standard deviation for gross efficiency, net efficiency and work efficiency for synchronous (SYN) and asynchronous (ASY) propulsion across the range of arm frequencies.
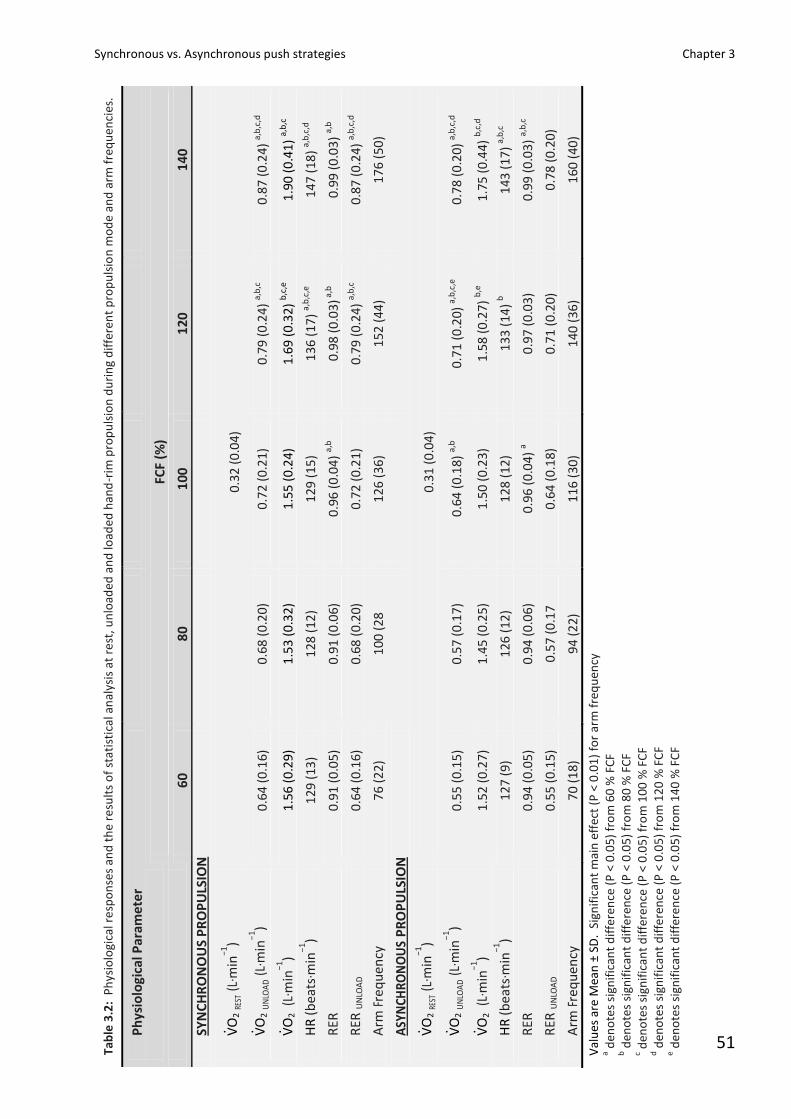
Synchronous vs. Asynchronous push strategies Chapter 3
51
Ph
ysio
logi
cal P
aram
ete
r
FC
F (%
)
60
8
0
10
0
12
0
14
0
SYN
CH
RO
NO
US
PR
OP
ULS
ION
· VO
2 RE
ST (
L·m
in−1
) 0
.32
(0
.04
)
· VO
2 U
NLO
AD (
L·m
in−
1)
0.6
4 (
0.1
6)
0.6
8 (
0.2
0)
0.7
2 (
0.2
1)
0.7
9 (
0.2
4)
a,b
,c
0.8
7 (
0.2
4)
a,b
,c,d
· VO
2 (
L·m
in−1
) 1
.56
(0
.29
) 1
.53
(0
.32
) 1
.55
(0
.24
) 1
.69
(0
.32
) b
,c,e
1
.90
(0
.41
) a,
b,c
HR
(b
eat
s·m
in−
1)
12
9 (
13
) 1
28
(1
2)
12
9 (
15
) 1
36
(1
7)
a,b
,c,e
1
47
(1
8)
a,b
,c,d
RER
0
.91
(0
.05
) 0
.91
(0
.06
) 0
.96
(0
.04
) a,
b
0.9
8 (
0.0
3) a
,b
0.9
9 (
0.0
3)
a,b
RER
UN
LOA
D
0.6
4 (
0.1
6)
0.6
8 (
0.2
0)
0.7
2 (
0.2
1)
0.7
9 (
0.2
4)
a,b
,c
0.8
7 (
0.2
4)
a,b
,c,d
Arm
Fre
qu
en
cy
76
(2
2)
10
0 (
28
1
26
(3
6)
15
2 (
44
) 1
76
(5
0)
ASY
NCH
RO
NO
US
PR
OP
ULS
ION
· VO
2 RE
ST (
L·m
in−1
) 0
.31
(0
.04
)
· VO
2 U
NLO
AD (
L·m
in−
1)
0.5
5 (
0.1
5)
0.5
7 (
0.1
7)
0.6
4 (
0.1
8)
a,b
0.7
1 (
0.2
0)
a,b
,c,e
0
.78
(0
.20
) a,
b,c
,d
· VO
2 (
L·m
in−1
) 1
.52
(0
.27
) 1
.45
(0
.25
) 1
.50
(0
.23
) 1
.58
(0
.27
) b
,e
1.7
5 (
0.4
4)
b,c
,d
HR
(b
eat
s·m
in−
1)
12
7 (
9)
12
6 (
12
) 1
28
(1
2)
13
3 (
14
) b
14
3 (
17
) a,
b,c
RER
0
.94
(0
.05
) 0
.94
(0
.06
) 0
.96
(0
.04
) a
0.9
7 (
0.0
3)
0.9
9 (
0.0
3)
a,b
,c
RER
UN
LOA
D
0.5
5 (
0.1
5)
0.5
7 (
0.1
7
0.6
4 (
0.1
8)
0.7
1 (
0.2
0)
0.7
8 (
0.2
0)
Arm
Fre
qu
en
cy
70
(1
8)
94
(2
2)
11
6 (
30
) 1
40
(3
6)
16
0 (
40
)
Tab
le 3
.2:
Ph
ysio
logi
cal r
esp
on
ses
and
th
e re
sult
s o
f st
atis
tica
l an
alys
is a
t re
st, u
nlo
aded
an
d lo
aded
han
d-r
im p
rop
uls
ion
du
rin
g d
iffe
ren
t p
rop
uls
ion
mo
de
and
arm
fre
qu
enci
es.
Val
ues
are
Mea
n ±
SD
. Si
gnif
ican
t m
ain
eff
ect
(P <
0.0
1)
for
arm
fre
qu
ency
a d
eno
tes
sign
ific
ant
dif
fere
nce
(P
< 0
.05
) fr
om
60
% F
CF
b d
eno
tes
sign
ific
ant
dif
fere
nce
(P
< 0
.05
) fr
om
80
% F
CF
c den
ote
s si
gnif
ican
t d
iffe
ren
ce (
P <
0.0
5)
fro
m 1
00
% F
CF
d d
eno
tes
sign
ific
ant
dif
fere
nce
(P
< 0
.05
) fr
om
12
0 %
FC
F e d
eno
tes
sign
ific
ant
dif
fere
nce
(P
< 0
.05
) fr
om
14
0 %
FC
F
Synchronous vs. Asynchronous push strategies Chapter 3
52
Discussion The efficiency data and other physiological measures show: 1) the significant effect of arm
frequency above FCF; 2) the non-significant effect of arm frequency below FCF; 3) the non-
significant effect of SYN vs. ASY propulsion modes. These are discussed below.
When considering the conditions of the present study the gross efficiency values across the
exercise conditions averaged 5.4 – 7%, which are in agreement with previous studies at similar
power output levels [13, 26]. Reporting gross and work efficiency indices helps us to begin to
understand the role of the different elements of hand-rim propulsion with different push
strategies [14] since the former includes a composite measure of the energy cost of both moving
the arms, stabilising the body and accelerating the wheel and the latter off -sets the cost of the
arm movements and stabilisation associated with unloaded exercise. In the present study, arm
frequency has a significant effect on all these indices when the frequency exceeds the FCF (Figure
3.2).
Effect of arm movement frequency The decrease in gross and work efficiency as arm frequency increases beyond the FCF (120%
and 140%) is in agreement with previous studies of both able-bodied [26] and wheelchair
sportsmen [8, 26] . Interestingly in contrast to previous research examining the effect of arm
frequency manipulation [8, 26], when the arm frequency was reduced (< 100 % FCF) there were no
significant changes in gross efficiency, net efficiency, ·VO2 or HR. An unexpected finding because
both work by Woude and colleagues [26] and Goosey et al. [8] report 100% FCF to be more
efficient and economical.
The paced arm frequencies in the current study affect timing, kinematics, dynamics, and the
work per cycle without affecting the mean external power production, since this is inherently the
same for all frequency conditions. Consequently this will impact the way in which the work is
performed and thus affect energy cost and efficiency. For example cyclic timing changes result in
different magnitudes of de- / accelerations of the different arm segments and trunk, as well as the
different ranges in segment excursion and thus muscle lengths and tension. Different paced arm
frequencies therefore, affect the force-length and length tension of the contracting muscles, thus
influencing the energy required for the contraction and production of work done against the hand-
rim. Differences in energy cost at the different frequencies will be attributable to some
combination of different efficiency of the propulsive element and different efficiency of the arm
movements. These would not contribute to external power output, which is fixed, but to a change
in the metabolic work of the muscles and hence efficiency [22]. Thus the reduction in efficiency
for the frequencies beyond 80 % FCF could be attributed to increased energy expenditure, elicited
Synchronous vs. Asynchronous push strategies Chapter 3
53
from the increased work to move the arms, as seen in both the results of ·VO2 UNLOAD (Table 3.2)
and efficiency indices (Figure 3.2). The result of increases in the loaded energy cost would explain
this because the unloaded energy cost proportion remained more or less constant (% of total
energy cost) across the range of arm frequencies. In turn this would help explain the significantly
higher work efficiency values calculated for both AB and WS. Work efficiency shows a similar
effect for arm frequency, even with the correction for increased energy cost of ·VO2 UNLOAD,
therefore this stresses that the loaded exercise condition brings in factors other than more arm
movements which further increase work done. Coupling and uncoupling of the hand-rim is
inherently complex and associated with short bursts of negative work [25, 28] at the start and end
of the push phase. Higher arm frequencies will increase the number of couplings and un-couplings
hence the negative forces increase and consequently increase energy losses.
Increased arm frequency was accompanied with increasing RER and significant differences
were observed between the arm frequencies, which has also been evident during arm crank
ergometry [19]. There are a number of speculative suggestions that could, in part, contribute to
this observed rise in RER. Firstly, it is possible that increased arm frequency may lead to an
improvement of ventilation and an increased breathing rate at any given exercise intensity, with
an observed link between movement and respiratory frequency previously reported [2]. This
would serve to further reduce efficiency and result in a greater metabolic production of CO2.
Secondly arm movement speed increases and therefore could lead to an earlier and increased
number of activated type II fibres resulting in a greater accumulation of lactate [1]. Finally, the
increases in arm frequency increased the work done due to muscular friction.
The absence of significant differences at the lower range of arm frequencies (60 – 100% FCF)
occurs in spite of the relatively linear change in ·VO2 UNLOAD with increasing arm frequency (Table
2). This may possibly imply the existence of counteracting phenomena between the loaded and
unloaded conditions, whereby lower arm frequencies benefit from factors that reduce the total
amount of work associated with moving the arms at loaded exercise conditions. Lower arm
frequencies will essentially lead to lower hand and segment velocities over the larger part of the
trajectory. This could allow a more secure, effective coupling and the need for a less controlled
transfer of muscle forces through the sequence of contractions, as well as reduced (stabilizing) co-
contractions. A reduction of linear velocity at the same power output indeed improves the
efficiency in hand-rim propulsion [27]. In addition, changes in arm frequency may affect the
suggested coupling between arm motion and breathing pattern [2]. This higher form of co-
ordination may possibly be disturbed at the non-preferred higher arm frequencies and be closer to
the metabolic optimal at the lower range of arm frequencies.
Synchronous vs. Asynchronous push strategies Chapter 3
54
In cycling studies optimal pedalling force-velocity relationships at given power output levels
have demonstrated reductions in ·VO2 , suggesting that they are individual-specific as a result of
differences in muscle fibre composition and recruitment patterns [5, 17]. Consequently the non-
significant differences observed in physiological responses between 60% and 100% arm
frequencies could imply that the muscle mechanics are not changed significantly to affect force-
velocity relationships, however, arm frequencies > 100 % were sufficient to elicit changes great
enough to reduce efficiency. The current results at 60 – 100 % are in contrast to findings of
Woude et al. [26] and Goosey et al. [8], whereby significant changes are reported. An explanation
for this may be as a result of the average FCF. The current FCF reports no differences in average
arm movement frequency for SYN 126 and ASY 116 (P = 0.213). In comparison Woude et al. [26]
reported the FCF to be 106 at comparable power outputs, which is significantly lower (p ≤ 0.05).
As a result the inverted U curvi-linear relationship seen previously [26] indicates a clear optimal
efficient arm frequency at a given workload. The significant difference of freely chosen
frequencies generates a different range of frequencies to those studied here; however, when the
data are combined it exemplifies a shift to the right of this shaped curve. Therefore, arm
frequencies below 100 % FCF in this study fall into a different range not low enough to report a
similar trend and relationship. A consequence of this will be the impact on the position in the
force-velocity relationship of the various muscles involved in the task of propulsion. With
increased arm frequency the forces exerted in each push decrease, whereas the velocities of
contractions increase, increasing the metabolic demand. Alternatively with decreased arm
frequency the forces exerted increase but consequently the velocity of contractions will decrease.
However, the range of arm frequencies between the 60 – 100 % conditions may not have been
sufficient to have significant effect on metabolic costs and efficiency. Therefore, the suggestion is
that the intact human biological system can counteract changes in arm frequency within a range
whereby the metabolic costs are very similar for the same external workload. Through a
combination of changes that may occur (i.e. improved technique at lower arm frequency, amount
of work per push, acceleration / deceleration changes, muscle activity etc.), the energy costs
balance one another to avoid significant changes in efficiency within the specified range.
Effect of propulsion mode (SYN vs. ASY) No significant effect of propulsion mode was statistically evident in the current study although
ASY propulsion displayed lower physiological responses and increased gross and net efficiency.
This is similar to the findings of Glaser et al. [6] whereby ASY propulsion demonstrated reduced
physiological responses and increased efficiency, although it remains unclear as to why. One
suggestion could point towards the FCF being significantly different; however, this was not evident
Synchronous vs. Asynchronous push strategies Chapter 3
55
(Table 3.2). Other explanations could include 1) differences in muscle activity, however, this
remains an unknown requiring further research. 2) ASY propulsion allows greater continuity of the
hand-rim force application, reducing fluctuations in the velocity profile and therefore, the inertial
forces overcome with each stroke are reduced. 3) ASY limb movement patterns are employed in
other more efficient modes of locomotion (e.g. walking, bicycling, rowing) and may take
advantage of inherent neural pathways for the reciprocal stimulation of the contra-lateral muscle
groups [20]. In addition Glaser et al. [6] indicated through subjective evaluation that the ASY
mode provided greater stability as a consequence of the trunk rotation over the forward and back
motion of the SYN mode. This suggests that maybe decreased muscle activity is required for
stability and therefore, a reduced ·VO2 response and improved efficiency. This hypothesis warrants
further evaluation.
Limitations The impact of using able-bodied, inexperienced wheelchair participants with a standardised
chair configuration and the identical wheelchair ergometer have been discussed previously in
Lenton et al. [14] and elsewhere. Whilst this may have influenced the absolute efficiency of
propulsion, due to the participants having a less well developed technique, the aim of this study
was to evaluate the impact of changing arm frequency and propulsion mode and so it was
important to eliminate any bias caused by habitual use. Propulsion velocity was calculated to
correspond with 60% ·VO2 PEAK at the FCF in an attempt to maintain similar exercise intensity for
all participants. In a small number of cases the RER exceeded 1.00 and may imply that the effort
was no longer predominantly aerobic and participants may also have not reached a steady state.
This may have impacted the metabolic cost calculated for these individuals. Removal of these
cases from the analysis did not result in any change in outcome. The imposed arm frequencies (60,
80, 120 and 140% of FCF) ensured that the participant’s FCF was manipulated at the same relative
levels although the absolute arm frequencies were different.
Conclusion
In accordance with existing literature [4, 8, 26] a curvilinear association of efficiency with arm
frequency is observed. A shift in the work required to move the arms at a higher frequency seems
to be responsible. Continued studies combining physiological and biomechanical analyses are
required to draw attention to the relevant biomechanical mechanisms involved, especially for the
absence of any statistical significance in the lower arm frequencies (60 – 100%). In contrast to
previous findings gross efficiency and ·VO2 are not optimised at the FCF. The unloaded work was
similar for both modes under the current task constraints despite different movement patterns.

Synchronous vs. Asynchronous push strategies Chapter 3
56
Acknowledgements The authors would like to greatly acknowledge RGK Wheelchair manufacturers for the loan of
the Quattro basketball wheelchair.
Synchronous vs. Asynchronous push strategies Chapter 3
57
References 1 Ahlquist LE, Bassett DR, Sufi t R, Nagle FJ, Thomas DP. The effect of pedalling frequency on glycogen depletion rates
in type I and type II quadriceps muscle fibers during sub-maximal cycling exercise. Eur J Appl Physiol 1992; 65: 360-
364.
2 Amazeen PG, Amazeen EL, Beek PJ. Coupling of breathing and movement during manual wheelchair propulsion. J
Exp Psychol Hum Percept Perform 2001; 27: 1243-1259.
3 Dallmeijer AJ, Ottjes L, de Waardt E, van der Woude LHV. A physiological comparison of synchronous and
asynchronous hand cycling. Int J Sports Med 2004; 25: 1–5.
4 Fabre N, Perrey S, Arbez L, Ruiz J, Tordi N, Rouillon JD. Degree of coordination between breathing and rhythmic arm
movements during hand rim wheelchair propulsion. Int J Sports Med 2006; 27: 67–74.
5 Gaesser GA, Brooks GA. Muscular efficiency during steady-rate exercise: effects of speed and work rate. J Appl
Physiol 1975; 38: 1132–1139.
6 Glaser RM, Sawka MN, Young RE, Suryaprasad AG. Applied physiology for wheelchair design. J Physiol 1980; 48: 41–
44.
7 Goosey VL, Campbell IG. Pushing economy and wheelchair propulsion technique at three speeds. Adapt Phys Activ
Q 1998; 15: 36–50.
8 Goosey VL, Campbell IG, Fowler NE. Effect of push frequency on the economy of wheelchair racers. Med Sci Sports
Exerc 2000; 32: 174–181.
9 Goosey-Tolfrey VL, Batterham AM, Tolfrey K. Scaling behaviour of peak in trained wheelchair athletes. Med Sci
Sports Exerc 2003; 35: 2106–2211.
10 Goosey-Tolfrey VL, Kirk JH. Effect of push frequency and strategy variations on economy and perceived exertion
during wheelchair propulsion. Eur J Appl Physiol 2003; 90: 153–158.
11 Hopman MTE, Teeffelen WM, Brouwer J van, Houtman S, Binkhorst RA. Physiological responses to asynchronous
and synchronous arm-cranking exercise. Eur J Appl Physiol 1995; 72: 111–114.
12 Hintzy F, Tordi N. Mechanical efficiency during hand-rim wheelchair propulsion: effects of base-line subtraction
and power output. Clin Biomech 2004; 19: 343–349.
13 Hintzy F, Tordi N, Perrey S. Muscular efficiency during arm cranking and wheelchair exercise: A comparison. Int J
Sports Med 2002; 23: 408–414.
14 Lenton JP, Fowler N, Woude L van der, Goosey-Tolfrey VL. Efficiency of wheelchair propulsion and effects of
strategy. Int J Sports Med 2007; 28: 1–6.
15 Mossberg K, Willman C, Topor MA, Crook H, Patak S. Comparison of asynchronous versus synchronous arm crank
ergometry. Spinal Cord 1999; 37: 569–574.
16 Peronnet F, Massicotte D. Table of non-protein respiratory quotient: an update. Can J Sport Sci 1991; 16: 23–29.
17 Seabury JJ, Adams WC, Ramey MR. Influence of pedalling rate and power output on energy expenditure during
bicycle ergometry. Ergonomics 1977; 20: 491–498.
18 Smith PM, Doherty M, Price MJ. The effect of crank rate on physiological responses and exercise efficiency using a
range of submaximal workloads during arm crank ergometry. Int J Sports Med 2006; 27: 199–204.
Synchronous vs. Asynchronous push strategies Chapter 3
58
19 Theisen D, Francaux M, Fayt A, Sturbois X. A new procedure to determine external power output during hand-rim
wheelchair propulsion on a roller ergometer: A reliability study. Int J Sports Med 1996; 17: 564–571.
20 Van Dieen JH, Ogita F, De Haan A. Reduced neural drive in bilateral exertions: a performance-limiting factor? Med
Sci Sports Exerc 2003; 35: 111–118.
21 Vanlandewijck YC, Spaepen AJ, Lysens RJ. Wheelchair propulsion efficiency: movement pattern adaptations to
speed changes. Med Sci Sports Exerc 1994; 26: 1373–1381.
22 Woude LHV van der, Bosmans I, Bervoets B, Veeger HEJ. Handcycling: different modes and gear ratio. J Med Eng
Tech 2000; 24: 242–249.
23 Woude LHV van der, Formanoy M, Groot S de. Hand rim configuration: effects on physical strain and technique in
unimpaired subjects? Med Eng Phys 2003; 25: 765–774.
24 Woude LHV van der, Groot G de, Hollander AP, Ingen Schenau GJ van, Rozendal RH. Wheelchair ergonomics and
physiological testing of prototypes. Ergonomics 1986; 29: 1561–1573.
25 Woude LHV van der , Veeger HEJ , Dallmeijer AJ , Janssen TWJ , Rozendal LA . Biomechanics and physiology in
active manual wheelchair propulsion. Med Eng Phys 2001; 23: 713–733.
26 Woude LHV van der, Veeger HEJ, Rozendal RH, Sargeant AJ. Optimum cycle frequencies in hand-rim wheelchair
propulsion. Wheelchair propulsion technique. Eur J Appl Physiol 1989; 58: 625–632.
27 Veeger HEJ, Woude LHV van der, Rozendal RH. Within-cycle characteristics of the wheelchair push in sprinting on a
wheelchair ergometer. Med Sci Sports Exerc 1991; 23: 264–271.
28 Veeger HEJ, Woude LHV van der, Rozendal RH. Effect of hand-rim velocity on mechanical efficiency in wheelchair
propulsion. Med Sci Sports Exerc 1992; 24: 100–107.
29 Whipp BJ, Wasserman K. Efficiency of muscular work. J Appl Physiol 1969; 26: 644–648.
Synchronous vs. Asynchronous push strategies Chapter 4
59
Chapter 4
Wheelchair propulsion: effects of experience and push strategy on efficiency and perceived exertion Applied Physiology, Nutrition and Metabolism (2008); 33: 870-879. John P. Lenton1, Neil E. Fowler1, Lucas HV. Van der Woude2, Victoria L. Goosey-Tolfrey1
Abstract
The purpose of this study was to examine the role of wheeling experience on efficiency,
metabolic cost, and differentiated ratings of perceived exertion (RPEs) during synchronous and
asynchronous hand-rim propulsion with varying arm frequencies. Fourteen able-bodied (AB) male
participants and 8 male wheelchair sportsmen (WS) performed tests of peak oxygen for both
propulsion modes. Subsequently, 2 series of five, 4-min sub-maximal exercise bouts were
completed at an individualized velocity (60% of peak oxygen consumption). Arm frequencies
consisted of the freely chosen frequency (FCF), followed by 4 counter-balanced paced trials
pushing at 60%, 80%, 120%, and 140% of the FCF. Efficiency indices (gross, GE; work, WE) were
determined and peripheral (RPE-P), central (RPE-C), and overall (RPE-O) RPEs were recorded. The
GE (6.4% vs. 8.4%) and WE (11.3% vs. 15.1%) were significantly higher in WS than in AB (p = 0.001).
Trends in the oxygen consumption, GE, and WE data were similar in both groups, propulsion mode,
and arm frequency. Data suggest that 80% FCF resulted in improved efficiency for both propulsion
mode and group, although the differences between those arm frequencies immediately above and
below were non-significant. Lower RPE scores corresponded with higher efficiency values.
Regardless of group there were significant differences (p = 0.001) between the differentiated RPE
measures, whereby RPE-P was on average always the highest score (13.1) and RPE-C the lowest
(11.1; RPE-O was 12.2). In conclusion, despite the anticipated differences in efficiency between
the WS and AB participants, this study confirmed that psycho- physiological measures produce
similar trends to physiological measures with manipulations of both arm frequency and propulsion
mode.
1 Department of Exercise & Sport Science, The Manchester Metropolitan University, MMU Cheshire, Alsager, England, UK. 2 Faculty of Human Movement Sciences, Institute for Fundamental and Clinical Human Movement Sciences, Vrije Universiteit, Rehabilitation Center, Amsterdam, The Netherlands.

Synchronous vs. Asynchronous push strategies Chapter 4
60
Résumé Le but de cette étude est d’analyser l’effet de l’expérience en fauteuil roulant sur l’efficacité
mécanique, le coût énergétique et la perception de l’effort fourni (RPE) observés au cours de
séances d’exercice comportant une propulsion synchrone ou asynchrone à diverses frequencies
sur le cercle propulseur de roue. Quatorze hommes valides (AB) et 8 sportifs en fauteuil roulant
(WS) participent à des épreuves d’effort pour la determination du consomption d'oxygène de
pointe dans les 2 modalités de propulsion. Par la suite, les sujets participent à 5 séances d’effort
sous-maximal d’une durée chacune de 4 min à une intensité sollicitant 60 % du consomption
d'oxygène de pointe. Les fréquences de mouvement des bras sont comme suit : fréquence
librement choisie (FCF) suivie selon un ordre contrebalancé des fréquences suivantes, soit 60, 80,
120 et 140 % de la FCF. On évalue alors les efficacités brute (GE) et au travail (WE) de même que
l’intensité de l’effort perçu en périphérie (RPE-P), centralement (RPE-C) et globalement (RPE-O). La
GE et la WE sont significativement plus importantes chez les WS que chez les AB : GE, 6,4 %
comparativement à 8,4 % et WE, 11,3 % comparativement à 15,1 % (p = 0,001). L’évolution des
valeurs de consomption d'oxygène, de GE et de WE est semblable chez les 2 groupes selon les 2
modalités de propulsion et les fréquences adoptées. D’après les observations, la fréquence
équivalente à 80 % de la FCF procure la meilleure efficacité chez les 2 groupes et pour les 2
modalités de propulsion, même si les différences avec les valeurs observées aux fréquences
immédiatement supérieure et inférieure ne sont pas significatives. Les valeurs de RPE les plus
faibles sont associées aux valeurs d’efficacité améliorée. Chez les 2 groupes, les valeurs de RPE
ciblée diffèrent significativement (p = 0,001), la valeur de RPE-P étant la plus élevée (13,1) et la
valeur de RPE-C, la plus basse (11,1), l’autre se situant à mi-chemin RPE-O (12,2). En guise de
conclusion, et ce, malgré les hypothèses initiales concernant les valeurs d’efficacité chez WS et AB,
cette étude révèle des tendances similaires des variables psychophysiologiques et des valeurs
physiologiques selon les 2 modalités de propulsion et pour chacune des fréquences adoptées de
mouvement.
Synchronous vs. Asynchronous push strategies Chapter 4
61
Introduction Manual hand-rim wheelchair propulsion is a relatively inefficient form of locomotion. Gross
efficiency (GE) has been reported to range from 2% – 10% under conditions prevalent in normal
daily use [14, 25, 28, 32]. However, experienced wheelchair sportsmen (WS) have achieved values
of around 12% under conditions and wheelchair configurations specific to wheelchair sports [11].
Despite the various methods and experimental designs employed, it is clearly evident that
experienced wheelchair users (particularly WS) exhibit much higher GE values than able-bodied
(AB) participants [26]. Studies that have incorporated both AB non-wheelchair users and WS have
demonstrated similar trends in the physiological responses during wheelchair exercise [2, 3, 9, 14,
25, 26, 29]. The responses in the AB non-wheelchair users fully comply with the overall trends in
physiology shown by both wheelchair users and WS.
In terms of energy cost and mechanical efficiency (ME), previous hand-rim propulsion work
has demonstrated that optimal push frequencies, i.e., those with the lowest energy cost, occur at
an individual’s freely chosen frequency (FCF) for both wheelchair users and AB participants *11,
26]. Despite these findings, the mechanisms that control arm frequency selection are not well
understood. The cycling literature has suggested that peripheral cues from active muscles are
important determinants for cadence selection [6, 20]. It is proposed that the feedback from these
cues influences an individual’s rating of perceived exertion (RPE), thus perception of effort
mediated by the peripheral feedback sources could well be important in arm frequency selection.
It has also been suggested in previously that RPE scores will be lower in individuals for whom it’s
their primary mode of training, while reporting significantly higher values of ME [12]. However,
this type of subjective reporting of RPE is an area that has received very little attention in the
literature on hand-rim propulsion. Of the work that is available, RPE and hand-rim propulsion
have been examined in relation to hand-rim size and propulsion velocity, propulsion strategy –
frequency combination, and the degree of co-ordination between breathing and rhythmic arm
movements [7, 8, 10]. Further research incorporating the comparison of differentiated RPE
(central, cardiopulmonary (RPE-C); peripheral, muscles and (or) joints (RPE-P)) in experienced and
non-experienced wheelchair users may provide an insight into the mechanisms that control arm
frequency selection [18].
Studies exploring arm frequency selection have used a synchronous (SYN) propulsion mode,
as this is typically employed during hand-rim propulsion [11, 26]. However, recent observations in
the sporting arena have shown asynchronous (ASY) propulsion emerging during some sporting
situations such as wheelchair basketball and tennis. A SYN movement pattern can be described as
both hands in contact with the wheel at the same time to propel the wheelchair. An ASY
movement pattern is when the hands contact the wheel alternately (180° out–of phase). Stability
Synchronous vs. Asynchronous push strategies Chapter 4
62
of the upper body and coasting direction with the ASY movement pattern emerge as possible
constraints. The question remains as to whether participants can adopt this mode, and at what
cost, especially specialist wheelchair users. The comparison of SYN and ASY cyclic arm exercise has
been a topic of interest in arm cranking [15, 17] and handcycling [2, 27] studies, yet has received
limited attention within the hand-rim propulsion literature [9, 10, 16]. Goosey-Tolfrey and Kirk [10]
found SYN propulsion to be more economical at lower push frequencies. However, they also
reported a preference for the ASY mode at higher push frequencies. In contrast, Glaser et al. [9]
indicated significantly lower physiological responses for ASY propulsion, suggesting that the ASY
mode provided a physiological advantage over the conventional SYN mode. However, more
recently, Lenton et al. [16] suggested that the SYN mode offers greater efficiency during hand-rim
propulsion.
Therefore, the aim of this study was to examine the role of wheelchair propulsion experience
during push strategies (arm frequency and propulsion mode) on ME and differentiated RPE. It was
hypothesized that (i) wheelchair experience would significantly affect efficiency of propulsion
regardless of arm frequency and mode of propulsion, (ii) similar trends with respect to arm
frequency and propulsion mode are found in both physiological responses of AB and WS, (iii) SYN
propulsion would be more efficient than ASY propulsion, (iv) efficiency, metabolic cost, and RPE
are optimal at FCF, and (v) RPE relationship with frequency would follow the physiological and
efficiency relationship, with the peripheral aspect as the dominant measure in rating of perceived
exertion RPE (RPE-P).
Materials and methods Fourteen AB male participants and 8 male WS volunteered for this study and gave their
written informed consent prior to participation. Approval for the study procedures was obtained
from the University Research Ethics Committee. The AB participants had no prior experience in
wheelchair exercise and were not trained in upper-body sports activities. For this reason, the
impact of any pre-existing preference for either propulsion mode was minimal. Ages ranged from
18 to 25 years. Body mass was recorded to the nearest 0.1 kg using a seated balance scale (Seca
710, seated scales, Hamburg, Germany). The WS descriptive characteristics in relation to sport,
disability, daily wheelchair experience, and the sports wheelchair used are shown in Table 4.1.
Ages ranged from 25 to 46 years. All participants were considered to be trained, having competed
regularly in wheelchair basketball and tennis competitions at a National level.
All participants were tested using the same wheelchair ergometer interfaced with a computer
(Compaq Armada 1520, Series 2920A). The AB participants were tested in a hand-rim wheelchair
designed for basketball (Quattro, RGK, England) consisting of 15° camber and was fitted with 0.66
m diameter wheels and 0.61 m hand-rims, with a total mass of 12.9 kg. The WS were tested in
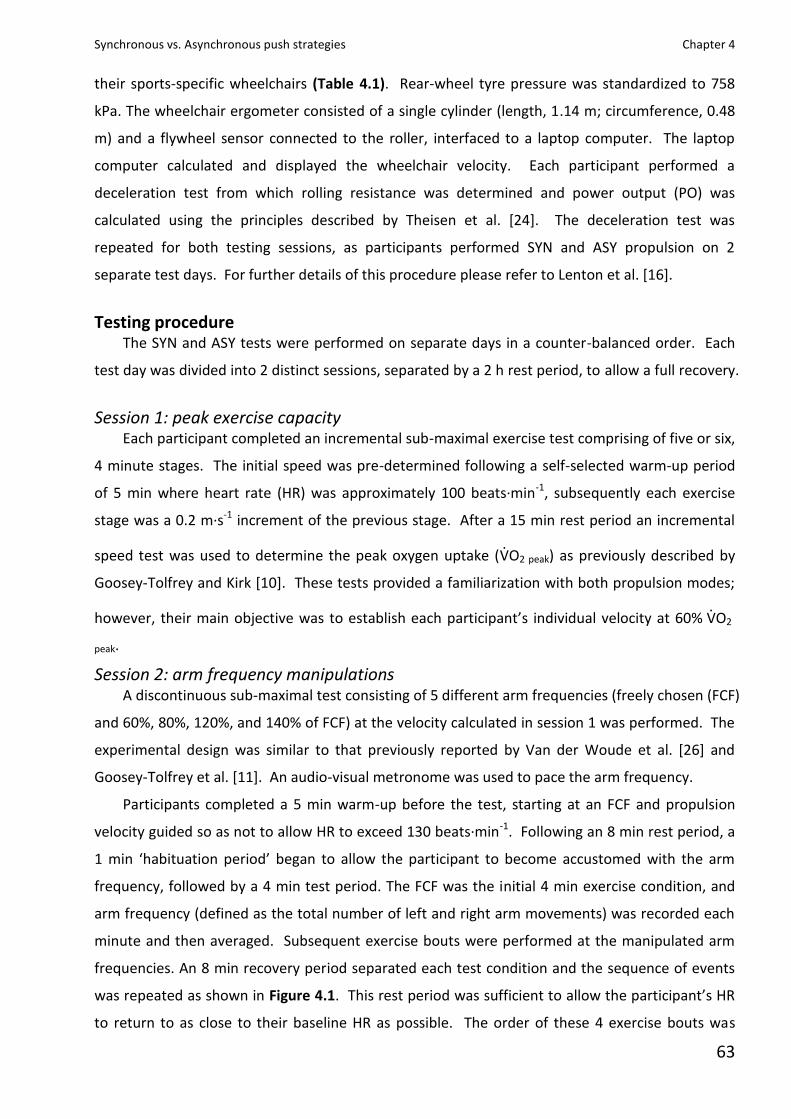
Synchronous vs. Asynchronous push strategies Chapter 4
63
their sports-specific wheelchairs (Table 4.1). Rear-wheel tyre pressure was standardized to 758
kPa. The wheelchair ergometer consisted of a single cylinder (length, 1.14 m; circumference, 0.48
m) and a flywheel sensor connected to the roller, interfaced to a laptop computer. The laptop
computer calculated and displayed the wheelchair velocity. Each participant performed a
deceleration test from which rolling resistance was determined and power output (PO) was
calculated using the principles described by Theisen et al. [24]. The deceleration test was
repeated for both testing sessions, as participants performed SYN and ASY propulsion on 2
separate test days. For further details of this procedure please refer to Lenton et al. [16].
Testing procedure The SYN and ASY tests were performed on separate days in a counter-balanced order. Each
test day was divided into 2 distinct sessions, separated by a 2 h rest period, to allow a full recovery.
Session 1: peak exercise capacity Each participant completed an incremental sub-maximal exercise test comprising of five or six,
4 minute stages. The initial speed was pre-determined following a self-selected warm-up period
of 5 min where heart rate (HR) was approximately 100 beats·min-1, subsequently each exercise
stage was a 0.2 m·s-1 increment of the previous stage. After a 15 min rest period an incremental
speed test was used to determine the peak oxygen uptake ( ·VO2 peak) as previously described by
Goosey-Tolfrey and Kirk [10]. These tests provided a familiarization with both propulsion modes;
however, their main objective was to establish each participant’s individual velocity at 60% ·VO2
peak.
Session 2: arm frequency manipulations A discontinuous sub-maximal test consisting of 5 different arm frequencies (freely chosen (FCF)
and 60%, 80%, 120%, and 140% of FCF) at the velocity calculated in session 1 was performed. The
experimental design was similar to that previously reported by Van der Woude et al. [26] and
Goosey-Tolfrey et al. [11]. An audio-visual metronome was used to pace the arm frequency.
Participants completed a 5 min warm-up before the test, starting at an FCF and propulsion
velocity guided so as not to allow HR to exceed 130 beats·min-1. Following an 8 min rest period, a
1 min ‘habituation period’ began to allow the participant to become accustomed with the arm
frequency, followed by a 4 min test period. The FCF was the initial 4 min exercise condition, and
arm frequency (defined as the total number of left and right arm movements) was recorded each
minute and then averaged. Subsequent exercise bouts were performed at the manipulated arm
frequencies. An 8 min recovery period separated each test condition and the sequence of events
was repeated as shown in Figure 4.1. This rest period was sufficient to allow the participant’s HR
to return to as close to their baseline HR as possible. The order of these 4 exercise bouts was
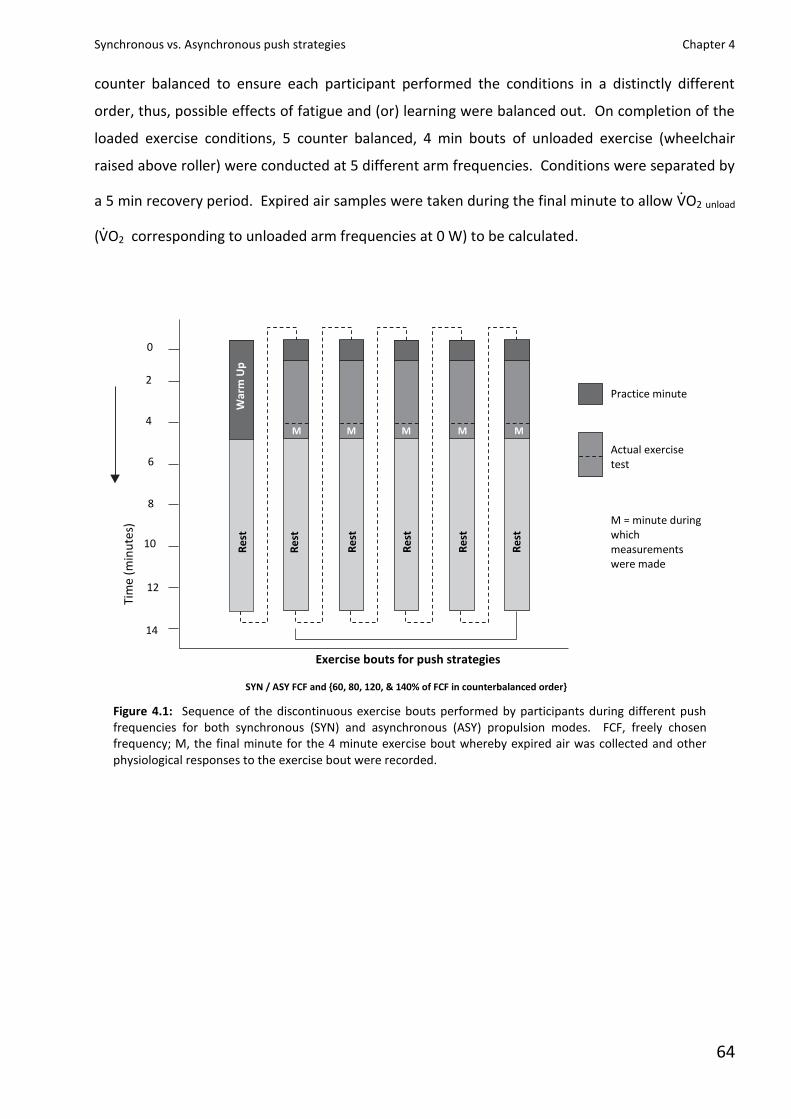
Synchronous vs. Asynchronous push strategies Chapter 4
64
counter balanced to ensure each participant performed the conditions in a distinctly different
order, thus, possible effects of fatigue and (or) learning were balanced out. On completion of the
loaded exercise conditions, 5 counter balanced, 4 min bouts of unloaded exercise (wheelchair
raised above roller) were conducted at 5 different arm frequencies. Conditions were separated by
a 5 min recovery period. Expired air samples were taken during the final minute to allow ·VO2 unload
( ·VO2 corresponding to unloaded arm frequencies at 0 W) to be calculated.
Figure 4.1: Sequence of the discontinuous exercise bouts performed by participants during different push frequencies for both synchronous (SYN) and asynchronous (ASY) propulsion modes. FCF, freely chosen frequency; M, the final minute for the 4 minute exercise bout whereby expired air was collected and other physiological responses to the exercise bout were recorded.
Practice minute
Actual exercise test
M = minute during which measurements were made
M
M
M
M
M
W
arm
Up
R
est
R
est
R
est
R
est
R
est
R
est
0
Ti
me
(min
ute
s)
2
4
6
8
10
12
14
Exercise bouts for push strategies
SYN / ASY FCF and {60, 80, 120, & 140% of FCF in counterbalanced order}
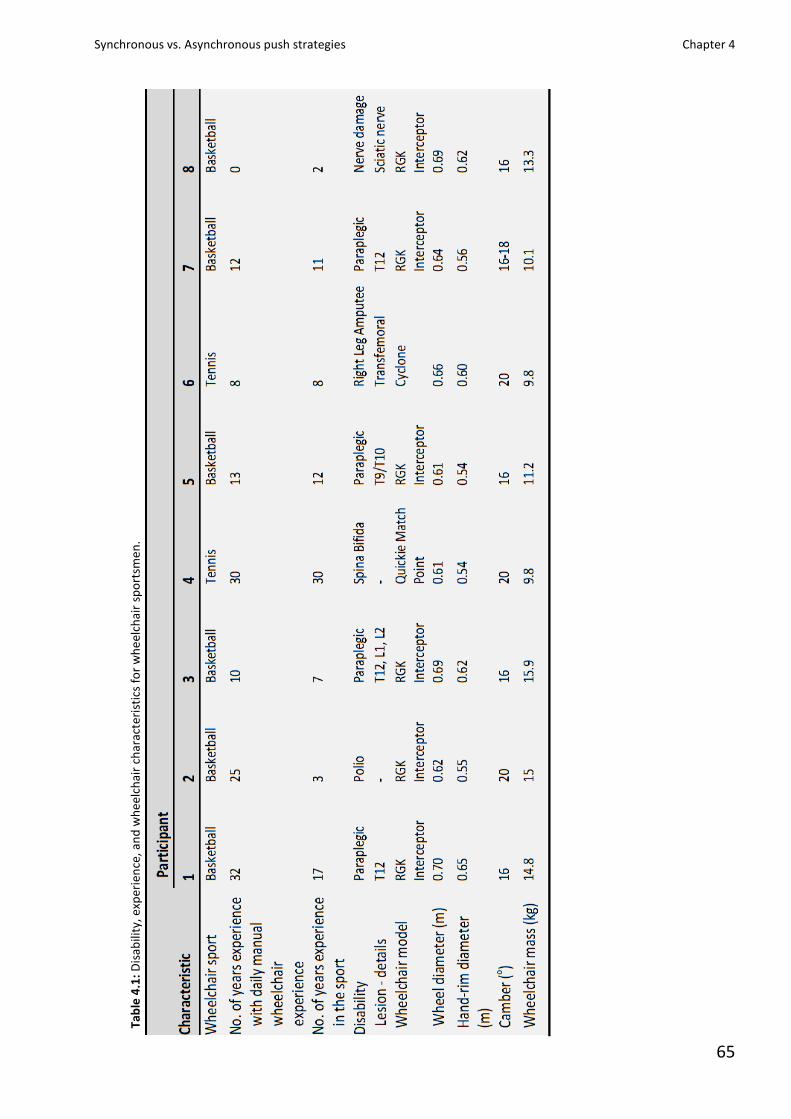
Synchronous vs. Asynchronous push strategies Chapter 4
65
Tab
le 4
.1:
Dis
abili
ty, e
xper
ien
ce, a
nd
wh
eelc
hai
r ch
arac
teri
stic
s fo
r w
he
elch
air
spo
rtsm
en
.
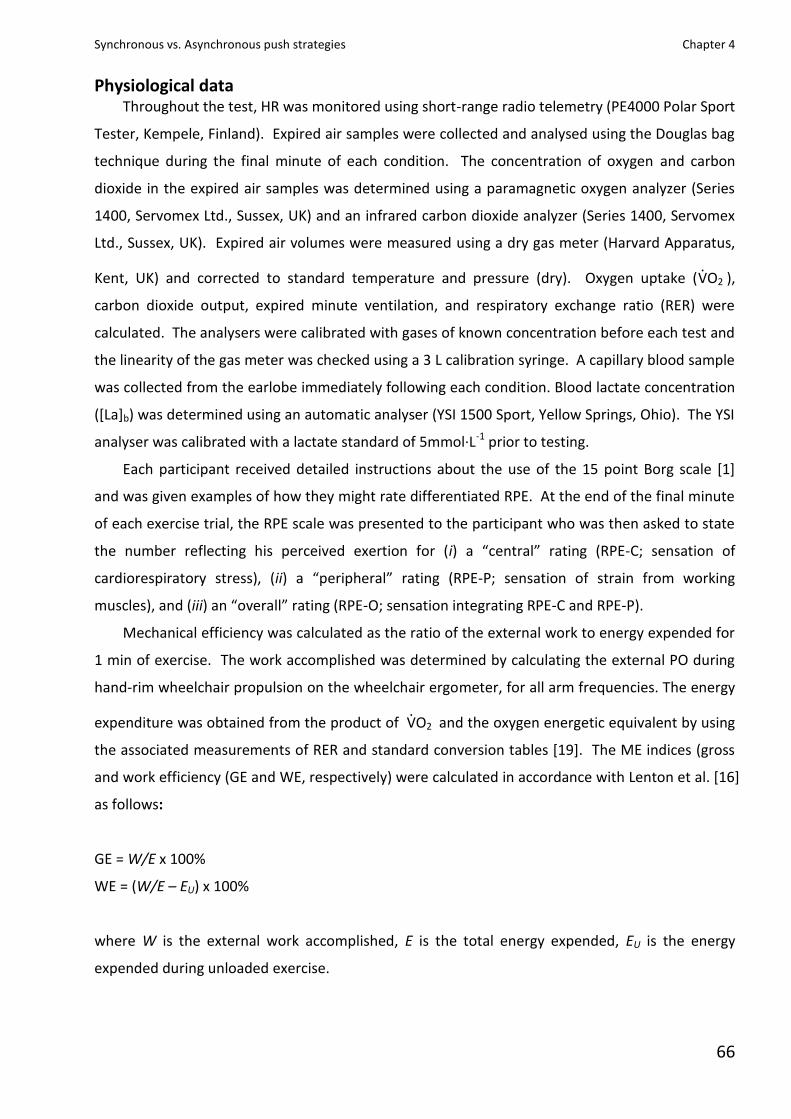
Synchronous vs. Asynchronous push strategies Chapter 4
66
Physiological data Throughout the test, HR was monitored using short-range radio telemetry (PE4000 Polar Sport
Tester, Kempele, Finland). Expired air samples were collected and analysed using the Douglas bag
technique during the final minute of each condition. The concentration of oxygen and carbon
dioxide in the expired air samples was determined using a paramagnetic oxygen analyzer (Series
1400, Servomex Ltd., Sussex, UK) and an infrared carbon dioxide analyzer (Series 1400, Servomex
Ltd., Sussex, UK). Expired air volumes were measured using a dry gas meter (Harvard Apparatus,
Kent, UK) and corrected to standard temperature and pressure (dry). Oxygen uptake ( ·VO2 ),
carbon dioxide output, expired minute ventilation, and respiratory exchange ratio (RER) were
calculated. The analysers were calibrated with gases of known concentration before each test and
the linearity of the gas meter was checked using a 3 L calibration syringe. A capillary blood sample
was collected from the earlobe immediately following each condition. Blood lactate concentration
([La]b) was determined using an automatic analyser (YSI 1500 Sport, Yellow Springs, Ohio). The YSI
analyser was calibrated with a lactate standard of 5mmol·L-1 prior to testing.
Each participant received detailed instructions about the use of the 15 point Borg scale [1]
and was given examples of how they might rate differentiated RPE. At the end of the final minute
of each exercise trial, the RPE scale was presented to the participant who was then asked to state
the number reflecting his perceived exertion for (i) a “central” rating (RPE-C; sensation of
cardiorespiratory stress), (ii) a “peripheral” rating (RPE-P; sensation of strain from working
muscles), and (iii) an “overall” rating (RPE-O; sensation integrating RPE-C and RPE-P).
Mechanical efficiency was calculated as the ratio of the external work to energy expended for
1 min of exercise. The work accomplished was determined by calculating the external PO during
hand-rim wheelchair propulsion on the wheelchair ergometer, for all arm frequencies. The energy
expenditure was obtained from the product of ·VO2 and the oxygen energetic equivalent by using
the associated measurements of RER and standard conversion tables [19]. The ME indices (gross
and work efficiency (GE and WE, respectively) were calculated in accordance with Lenton et al. [16]
as follows:
GE = W/E x 100%
WE = (W/E – EU) x 100%
where W is the external work accomplished, E is the total energy expended, EU is the energy
expended during unloaded exercise.
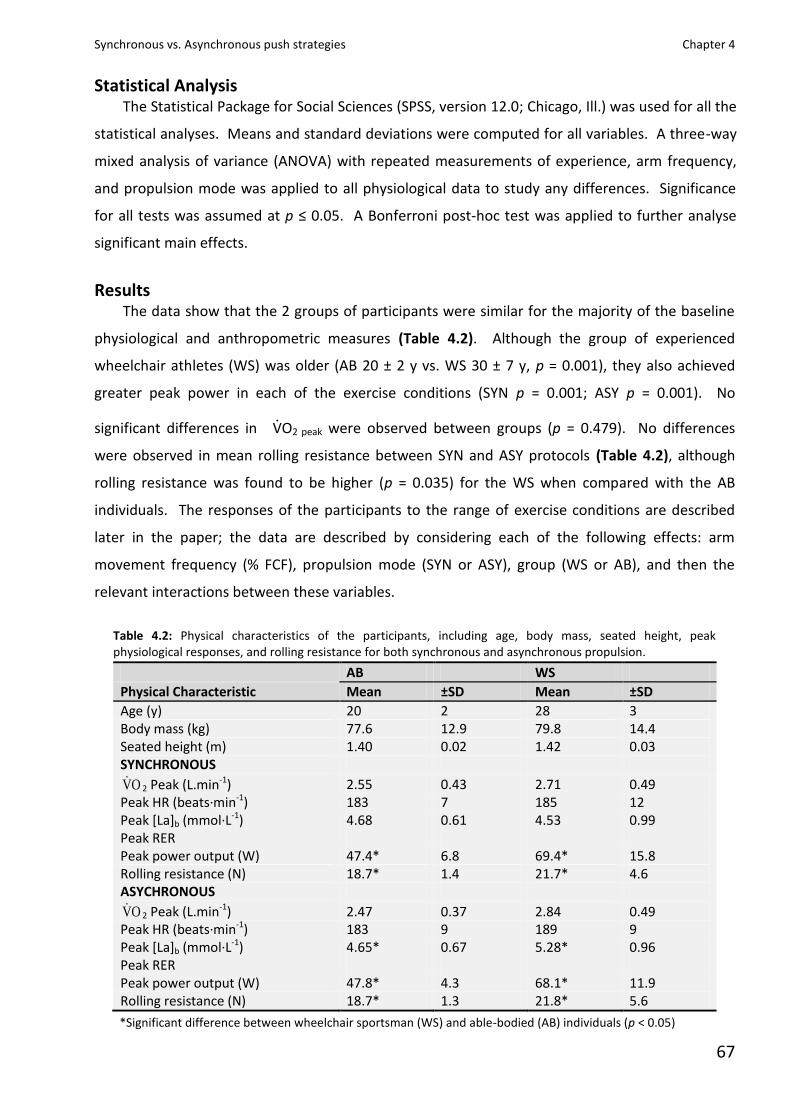
Synchronous vs. Asynchronous push strategies Chapter 4
67
Statistical Analysis The Statistical Package for Social Sciences (SPSS, version 12.0; Chicago, Ill.) was used for all the
statistical analyses. Means and standard deviations were computed for all variables. A three-way
mixed analysis of variance (ANOVA) with repeated measurements of experience, arm frequency,
and propulsion mode was applied to all physiological data to study any differences. Significance
for all tests was assumed at p ≤ 0.05. A Bonferroni post-hoc test was applied to further analyse
significant main effects.
Results The data show that the 2 groups of participants were similar for the majority of the baseline
physiological and anthropometric measures (Table 4.2). Although the group of experienced
wheelchair athletes (WS) was older (AB 20 ± 2 y vs. WS 30 ± 7 y, p = 0.001), they also achieved
greater peak power in each of the exercise conditions (SYN p = 0.001; ASY p = 0.001). No
significant differences in ·VO2 peak were observed between groups (p = 0.479). No differences
were observed in mean rolling resistance between SYN and ASY protocols (Table 4.2), although
rolling resistance was found to be higher (p = 0.035) for the WS when compared with the AB
individuals. The responses of the participants to the range of exercise conditions are described
later in the paper; the data are described by considering each of the following effects: arm
movement frequency (% FCF), propulsion mode (SYN or ASY), group (WS or AB), and then the
relevant interactions between these variables.
Table 4.2: Physical characteristics of the participants, including age, body mass, seated height, peak physiological responses, and rolling resistance for both synchronous and asynchronous propulsion.
AB WS
Physical Characteristic Mean ±SD Mean ±SD
Age (y) 20 2 28 3 Body mass (kg) 77.6 12.9 79.8 14.4 Seated height (m) 1.40 0.02 1.42 0.03 SYNCHRONOUS
OV 2 Peak (L.min-1) 2.55 0.43 2.71 0.49 Peak HR (beats·min-1) 183 7 185 12 Peak [La]b (mmol·L-1) 4.68 0.61 4.53 0.99 Peak RER Peak power output (W) 47.4* 6.8 69.4* 15.8 Rolling resistance (N) 18.7* 1.4 21.7* 4.6 ASYCHRONOUS
OV 2 Peak (L.min-1) 2.47 0.37 2.84 0.49 Peak HR (beats·min-1) 183 9 189 9 Peak [La]b (mmol·L-1) 4.65* 0.67 5.28* 0.96 Peak RER Peak power output (W) 47.8* 4.3 68.1* 11.9 Rolling resistance (N) 18.7* 1.3 21.8* 5.6
*Significant difference between wheelchair sportsman (WS) and able-bodied (AB) individuals (p < 0.05)
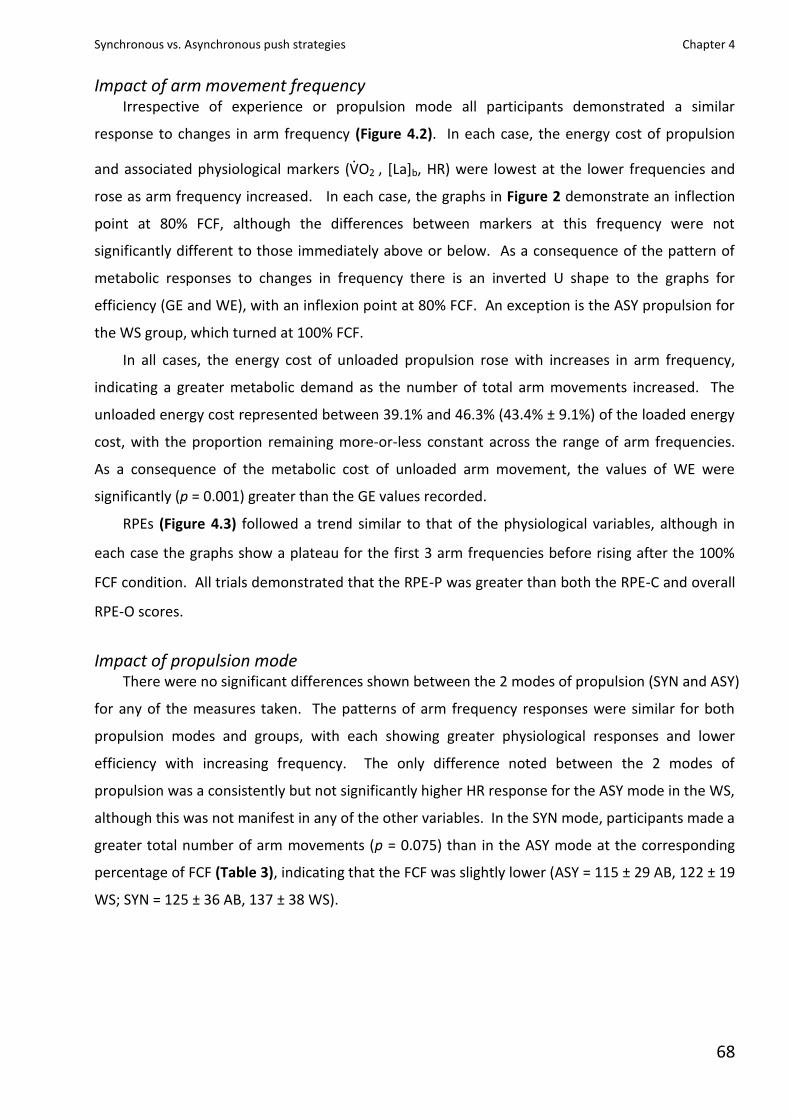
Synchronous vs. Asynchronous push strategies Chapter 4
68
Impact of arm movement frequency Irrespective of experience or propulsion mode all participants demonstrated a similar
response to changes in arm frequency (Figure 4.2). In each case, the energy cost of propulsion
and associated physiological markers ( ·VO2 , [La]b, HR) were lowest at the lower frequencies and
rose as arm frequency increased. In each case, the graphs in Figure 2 demonstrate an inflection
point at 80% FCF, although the differences between markers at this frequency were not
significantly different to those immediately above or below. As a consequence of the pattern of
metabolic responses to changes in frequency there is an inverted U shape to the graphs for
efficiency (GE and WE), with an inflexion point at 80% FCF. An exception is the ASY propulsion for
the WS group, which turned at 100% FCF.
In all cases, the energy cost of unloaded propulsion rose with increases in arm frequency,
indicating a greater metabolic demand as the number of total arm movements increased. The
unloaded energy cost represented between 39.1% and 46.3% (43.4% ± 9.1%) of the loaded energy
cost, with the proportion remaining more-or-less constant across the range of arm frequencies.
As a consequence of the metabolic cost of unloaded arm movement, the values of WE were
significantly (p = 0.001) greater than the GE values recorded.
RPEs (Figure 4.3) followed a trend similar to that of the physiological variables, although in
each case the graphs show a plateau for the first 3 arm frequencies before rising after the 100%
FCF condition. All trials demonstrated that the RPE-P was greater than both the RPE-C and overall
RPE-O scores.
Impact of propulsion mode There were no significant differences shown between the 2 modes of propulsion (SYN and ASY)
for any of the measures taken. The patterns of arm frequency responses were similar for both
propulsion modes and groups, with each showing greater physiological responses and lower
efficiency with increasing frequency. The only difference noted between the 2 modes of
propulsion was a consistently but not significantly higher HR response for the ASY mode in the WS,
although this was not manifest in any of the other variables. In the SYN mode, participants made a
greater total number of arm movements (p = 0.075) than in the ASY mode at the corresponding
percentage of FCF (Table 3), indicating that the FCF was slightly lower (ASY = 115 ± 29 AB, 122 ± 19
WS; SYN = 125 ± 36 AB, 137 ± 38 WS).
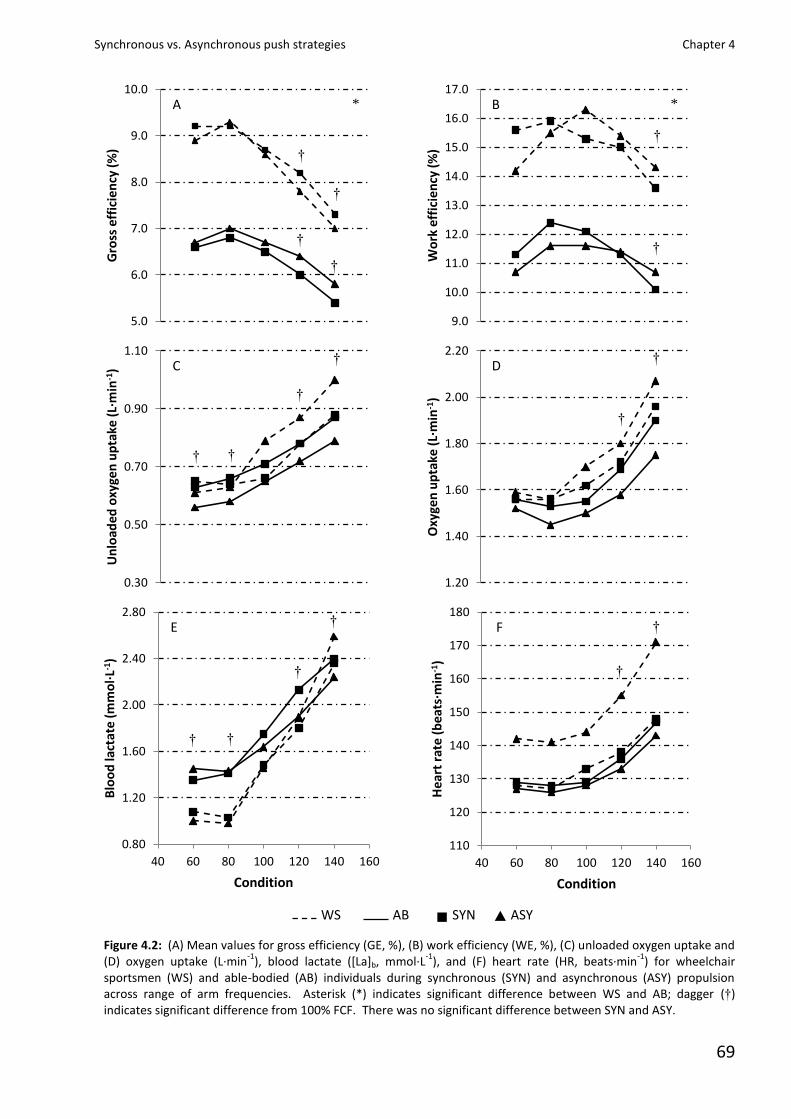
Synchronous vs. Asynchronous push strategies Chapter 4
69
Figure 4.2: (A) Mean values for gross efficiency (GE, %), (B) work efficiency (WE, %), (C) unloaded oxygen uptake and (D) oxygen uptake (L·min
-1), blood lactate ([La]b, mmol·L
-1), and (F) heart rate (HR, beats·min
-1) for wheelchair
sportsmen (WS) and able-bodied (AB) individuals during synchronous (SYN) and asynchronous (ASY) propulsion across range of arm frequencies. Asterisk (*) indicates significant difference between WS and AB; dagger (†) indicates significant difference from 100% FCF. There was no significant difference between SYN and ASY.
5.0
6.0
7.0
8.0
9.0
10.0
Gro
ss e
ffic
ien
cy (
%)
9.0
10.0
11.0
12.0
13.0
14.0
15.0
16.0
17.0
Wo
rk e
ffic
ien
cy (%
)
0.30
0.50
0.70
0.90
1.10
Un
load
ed o
xyge
n u
pta
ke (
L·m
in-1
)
1.20
1.40
1.60
1.80
2.00
2.20
Oxy
gen
up
take
(L·
min
-1)
0.80
1.20
1.60
2.00
2.40
2.80
40 60 80 100 120 140 160
Blo
od
lact
ate
(mm
ol·
L-1)
Condition
110
120
130
140
150
160
170
180
40 60 80 100 120 140 160
Hea
rt r
ate
(bea
ts·m
in-1
)
Condition
ASY SYN AB WS ■ ▲
†
A B
C D
E F
†
†
†
† †
†
†
†
†
†
†
†
†
† †
†
†
* *
Synchronous vs. Asynchronous push strategies Chapter 4
70
Impact of wheelchair propulsion experience As previously described, the patterns of results were similar for both the AB and WS groups.
The most notable finding was the significantly greater efficiency recorded for the WS group under
all conditions (p = 0.001). Wheelchair experience did not result in any differences in the patterns
of response to changes in propulsion mode or arm frequency as previously described. The greater
efficiency of the experienced wheelchair users at the same relative work load must have resulted
from improved coordination, especially in the push phase, and possibly a more effective transfer of
force between the hand and the wheel, as there were no differences in the energy cost of
unloaded propulsion.
Discussion The data on ME and other physiological measures show a combination of different
phenomena: (i) the significant impact of arm frequency above FCF and non-significance below FCF;
(ii) the absence of significant difference between propulsion modes for both groups; (iii) the
significant impact of wheelchair propulsion experience on ME; (iv) the RPE displayed similar trends
to the physiological variables, whereas RPE-P produced the highest perceived exertion scores.
Discussion of these phenomena follows.
Importantly, the reporting of both physiological and RPE indices seeks to help understand the
role of internal and external work production during hand-rim propulsion. As well as the
clarification of relationships with arm frequency, propulsion mode, and efficiency, it could offer
insight to the underlying reasons for significant differences in efficiency resulting from wheelchair
experience and arm frequency.
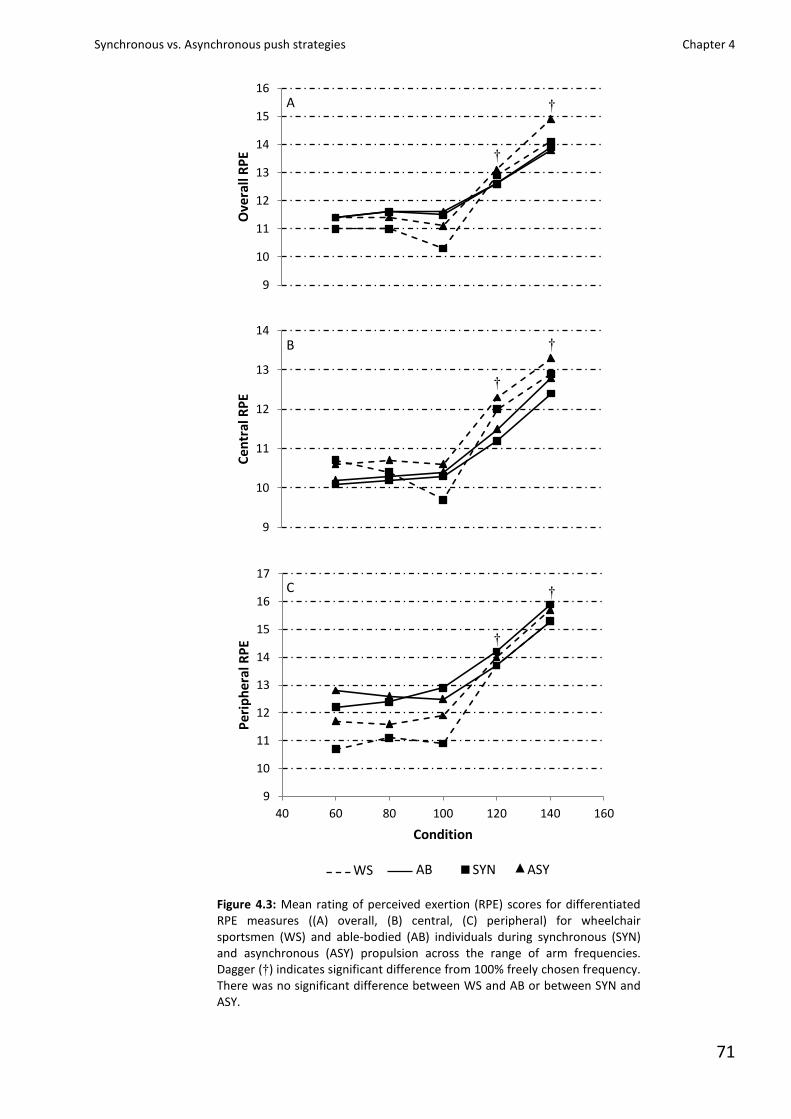
Synchronous vs. Asynchronous push strategies Chapter 4
71
Figure 4.3: Mean rating of perceived exertion (RPE) scores for differentiated RPE measures ((A) overall, (B) central, (C) peripheral) for wheelchair sportsmen (WS) and able-bodied (AB) individuals during synchronous (SYN) and asynchronous (ASY) propulsion across the range of arm frequencies. Dagger (†) indicates significant difference from 100% freely chosen frequency. There was no significant difference between WS and AB or between SYN and ASY.
9
10
11
12
13
14
15
16
Ove
rall
RP
E
9
10
11
12
13
14
Ce
ntr
al R
PE
9
10
11
12
13
14
15
16
17
40 60 80 100 120 140 160
Pe
rip
her
al R
PE
Condition
ASY SYN AB WS ■ ▲
A
C
B
†
†
†
†
†
†
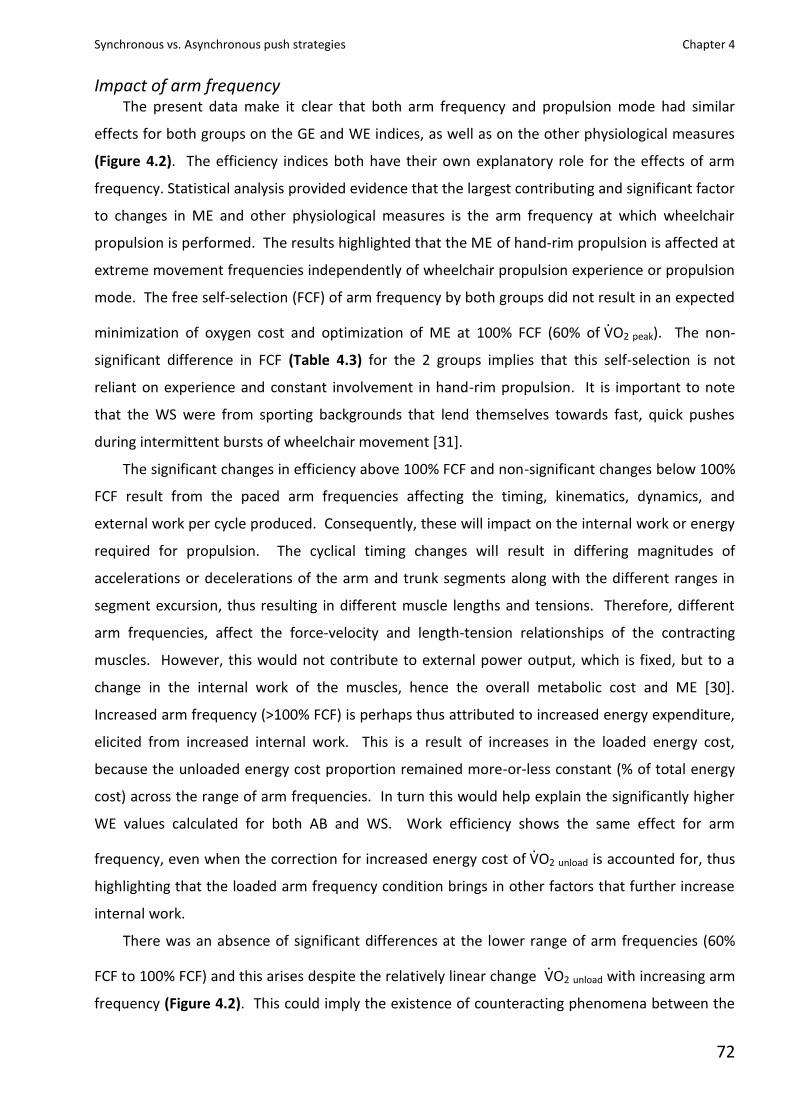
Synchronous vs. Asynchronous push strategies Chapter 4
72
Impact of arm frequency The present data make it clear that both arm frequency and propulsion mode had similar
effects for both groups on the GE and WE indices, as well as on the other physiological measures
(Figure 4.2). The efficiency indices both have their own explanatory role for the effects of arm
frequency. Statistical analysis provided evidence that the largest contributing and significant factor
to changes in ME and other physiological measures is the arm frequency at which wheelchair
propulsion is performed. The results highlighted that the ME of hand-rim propulsion is affected at
extreme movement frequencies independently of wheelchair propulsion experience or propulsion
mode. The free self-selection (FCF) of arm frequency by both groups did not result in an expected
minimization of oxygen cost and optimization of ME at 100% FCF (60% of ·VO2 peak). The non-
significant difference in FCF (Table 4.3) for the 2 groups implies that this self-selection is not
reliant on experience and constant involvement in hand-rim propulsion. It is important to note
that the WS were from sporting backgrounds that lend themselves towards fast, quick pushes
during intermittent bursts of wheelchair movement [31].
The significant changes in efficiency above 100% FCF and non-significant changes below 100%
FCF result from the paced arm frequencies affecting the timing, kinematics, dynamics, and
external work per cycle produced. Consequently, these will impact on the internal work or energy
required for propulsion. The cyclical timing changes will result in differing magnitudes of
accelerations or decelerations of the arm and trunk segments along with the different ranges in
segment excursion, thus resulting in different muscle lengths and tensions. Therefore, different
arm frequencies, affect the force-velocity and length-tension relationships of the contracting
muscles. However, this would not contribute to external power output, which is fixed, but to a
change in the internal work of the muscles, hence the overall metabolic cost and ME [30].
Increased arm frequency (>100% FCF) is perhaps thus attributed to increased energy expenditure,
elicited from increased internal work. This is a result of increases in the loaded energy cost,
because the unloaded energy cost proportion remained more-or-less constant (% of total energy
cost) across the range of arm frequencies. In turn this would help explain the significantly higher
WE values calculated for both AB and WS. Work efficiency shows the same effect for arm
frequency, even when the correction for increased energy cost of ·VO2 unload is accounted for, thus
highlighting that the loaded arm frequency condition brings in other factors that further increase
internal work.
There was an absence of significant differences at the lower range of arm frequencies (60%
FCF to 100% FCF) and this arises despite the relatively linear change ·VO2 unload with increasing arm
frequency (Figure 4.2). This could imply the existence of counteracting phenomena between the
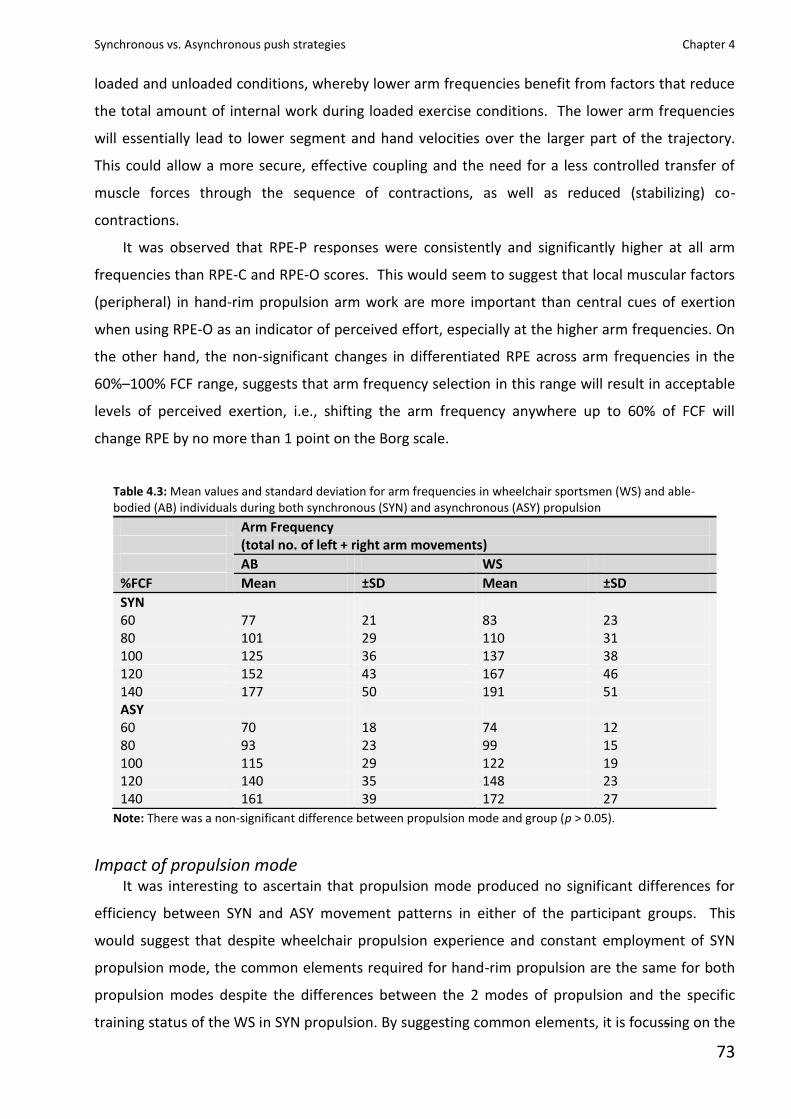
Synchronous vs. Asynchronous push strategies Chapter 4
73
loaded and unloaded conditions, whereby lower arm frequencies benefit from factors that reduce
the total amount of internal work during loaded exercise conditions. The lower arm frequencies
will essentially lead to lower segment and hand velocities over the larger part of the trajectory.
This could allow a more secure, effective coupling and the need for a less controlled transfer of
muscle forces through the sequence of contractions, as well as reduced (stabilizing) co-
contractions.
It was observed that RPE-P responses were consistently and significantly higher at all arm
frequencies than RPE-C and RPE-O scores. This would seem to suggest that local muscular factors
(peripheral) in hand-rim propulsion arm work are more important than central cues of exertion
when using RPE-O as an indicator of perceived effort, especially at the higher arm frequencies. On
the other hand, the non-significant changes in differentiated RPE across arm frequencies in the
60%–100% FCF range, suggests that arm frequency selection in this range will result in acceptable
levels of perceived exertion, i.e., shifting the arm frequency anywhere up to 60% of FCF will
change RPE by no more than 1 point on the Borg scale.
Table 4.3: Mean values and standard deviation for arm frequencies in wheelchair sportsmen (WS) and able-bodied (AB) individuals during both synchronous (SYN) and asynchronous (ASY) propulsion
Note: There was a non-significant difference between propulsion mode and group (p > 0.05).
Impact of propulsion mode It was interesting to ascertain that propulsion mode produced no significant differences for
efficiency between SYN and ASY movement patterns in either of the participant groups. This
would suggest that despite wheelchair propulsion experience and constant employment of SYN
propulsion mode, the common elements required for hand-rim propulsion are the same for both
propulsion modes despite the differences between the 2 modes of propulsion and the specific
training status of the WS in SYN propulsion. By suggesting common elements, it is focussing on the
Arm Frequency (total no. of left + right arm movements)
AB WS
%FCF Mean ±SD Mean ±SD
SYN 60 77 21 83 23 80 101 29 110 31 100 125 36 137 38 120 152 43 167 46 140 177 50 191 51 ASY 60 70 18 74 12 80 93 23 99 15 100 115 29 122 19 120 140 35 148 23 140 161 39 172 27
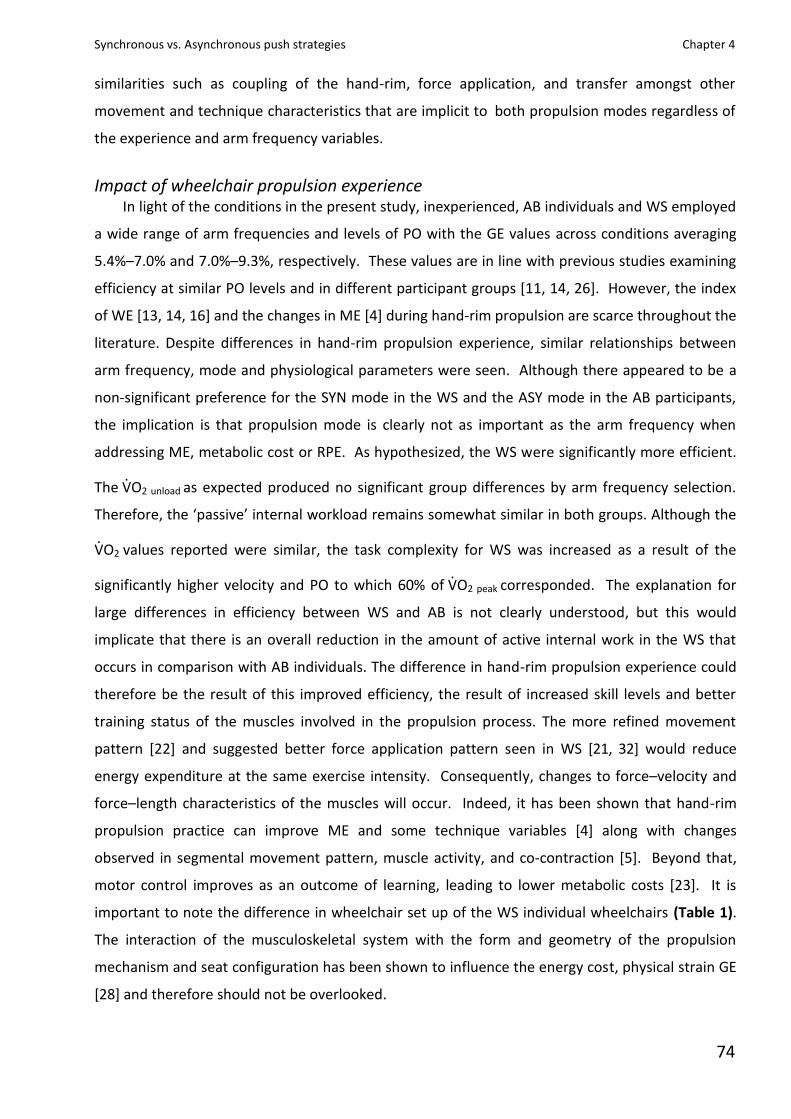
Synchronous vs. Asynchronous push strategies Chapter 4
74
similarities such as coupling of the hand-rim, force application, and transfer amongst other
movement and technique characteristics that are implicit to both propulsion modes regardless of
the experience and arm frequency variables.
Impact of wheelchair propulsion experience In light of the conditions in the present study, inexperienced, AB individuals and WS employed
a wide range of arm frequencies and levels of PO with the GE values across conditions averaging
5.4%–7.0% and 7.0%–9.3%, respectively. These values are in line with previous studies examining
efficiency at similar PO levels and in different participant groups [11, 14, 26]. However, the index
of WE [13, 14, 16] and the changes in ME [4] during hand-rim propulsion are scarce throughout the
literature. Despite differences in hand-rim propulsion experience, similar relationships between
arm frequency, mode and physiological parameters were seen. Although there appeared to be a
non-significant preference for the SYN mode in the WS and the ASY mode in the AB participants,
the implication is that propulsion mode is clearly not as important as the arm frequency when
addressing ME, metabolic cost or RPE. As hypothesized, the WS were significantly more efficient.
The ·VO2 unload as expected produced no significant group differences by arm frequency selection.
Therefore, the ‘passive’ internal workload remains somewhat similar in both groups. Although the
·VO2 values reported were similar, the task complexity for WS was increased as a result of the
significantly higher velocity and PO to which 60% of ·VO2 peak corresponded. The explanation for
large differences in efficiency between WS and AB is not clearly understood, but this would
implicate that there is an overall reduction in the amount of active internal work in the WS that
occurs in comparison with AB individuals. The difference in hand-rim propulsion experience could
therefore be the result of this improved efficiency, the result of increased skill levels and better
training status of the muscles involved in the propulsion process. The more refined movement
pattern [22] and suggested better force application pattern seen in WS [21, 32] would reduce
energy expenditure at the same exercise intensity. Consequently, changes to force–velocity and
force–length characteristics of the muscles will occur. Indeed, it has been shown that hand-rim
propulsion practice can improve ME and some technique variables [4] along with changes
observed in segmental movement pattern, muscle activity, and co-contraction [5]. Beyond that,
motor control improves as an outcome of learning, leading to lower metabolic costs [23]. It is
important to note the difference in wheelchair set up of the WS individual wheelchairs (Table 1).
The interaction of the musculoskeletal system with the form and geometry of the propulsion
mechanism and seat configuration has been shown to influence the energy cost, physical strain GE
[28] and therefore should not be overlooked.

Synchronous vs. Asynchronous push strategies Chapter 4
75
Comparing perceived exertion of WS with AB participants produced no significant group by
arm frequency interaction. This implies that propulsion experience had no different effect on
RPE responses between groups for the differentiated RPE scores, although RPE-P was
approaching significance at (p = 0.061). The WS and AB clearly felt more strain when operating
at high frequencies (>100% FCF) as demonstrated in the RPE scores (Figure 3). Supporting this
was the significant increase in relative exercise intensity significantly beyond the FCF.
Subsequently, to meet the task complexity, there is a greater emphasis placed upon the RPE-P
because propulsion velocity and (or) PO remained constant. This supports the findings of
Ekblom and Goldbarg [6] who stated that peripheral factors are dominant in work with smaller
muscle groups. In terms of experience, the AB participants displayed similar perceptual
responses. This provided further support to the work of Ekblom and Goldbarg [6] who found
differences in RPE to be removed at the same relative exercise intensities.
Methodological considerations Other important discussion points are, firstly, the use of a standardized chair configuration.
Although this may limit the comparisons between AB and WS, it was more valid for the WS to use
their own sports chairs and to opt for a standard chair in the AB group, thus eliminating any effects
of different chair designs or setups on the physiological measurements. Secondly, one should
consider the stationary position of the wheelchair on an ergometer consisting of a single roller
with a fixed chain. This was an important feature of the study, allowing for the effects of push
strategy to be investigated without the additional effects of coasting direction (of the wheelchair)
and external work requirements. More importantly, the PO in both modes remained equal during
propulsion. Thirdly, and finally, it is important to note that the AB participants were younger than
the WS group and, although described as WS, they did in fact display a limited range of
impairments. These limit the generalizability of the results. However, future studies may consider
exploring the effects of disability on push strategy (arm frequency and propulsion mode).
Conclusions Physiological trends did not change as a result of propulsion experience (WS; or AB), despite
the arm frequency and propulsion mode manipulations; however, WS are significantly more
efficient than AB individuals regardless of arm frequency, propulsion mode, or the higher absolute
speed and (or) PO. Reasons for these differences remain unclear and require further investigation.
Despite the higher task complexity for WS, it appears possible that the effect of continuous
practice (training, sport, and daily activities) leads to the development of more optimal
coordination, hence improved propulsion technique, improved ME, and reduced relative
Synchronous vs. Asynchronous push strategies Chapter 4
76
metabolic cost. The refined movement patterns (increased skill) reduced oxygen cost, resulting in
improved ME at much more complex task requirements.
A curvilinear association of ME with arm frequency was observed and a shift in active internal
appeared responsible. Mechanical efficiency and ·VO2 were not optimized at FCF, in contrast to
previous research, despite statistically non-significant differences in the lower arm frequencies (60%
FCF to 100% FCF). Not exceeding the FCF in either group or propulsion mode is beneficial in terms
of reduced metabolic cost and improved efficiency. Propulsion mode (SYN or ASY) produces no
negative metabolic effects in either group under the current test conditions.
The psychophysiological cost adheres to the trends of absolute metabolic cost and not ME,
although a plateau in the perceived exertion responses was observed between 60% FCF and
100% FCF arm frequencies and rose significantly beyond the 100% FCF condition. Changes in
RPE were as a result of arm frequency manipulation and not experience or propulsion mode.
Differentiated RPE can be employed to support physiological findings in hand-rim propulsion
for both WS and AB individuals; however, no differences between perceived ratings for groups
were evident when exercise intensity was maintained. This study also demonstrates the
dominant sensation by which individuals perceive and rate exercise conditions.
Acknowledgements
The authors would like to acknowledge RGK Wheelchair manufacturers for the loan of the
Quattro basketball wheelchair. They would also like to thank the wheelchair basketball and tennis
participants of Great Britain for their commitment to the investigation.

Synchronous vs. Asynchronous push strategies Chapter 4
77
References 1 Borg, G. 1970. Perceived exertion as an indicator of somatic stress. Scand. J. Rehabil. Med. 2: 92-98. PMID: 5523831.
2 Dallmeijer, A.J., Van der Woude, L.H., Ottjes, L., and De Waardt, E. 2004a. A physiological comparison of
synchronous and asynchronous hand cycling. Int. J. Sports Med. 25: 622–626. doi: 10.1055/s-2004-817879. PMID:
15532007.
3 Dallmeijer, A.J., Zentgraaff, I.D., Zijp, N.I., and Van der Woude, L.H.V. 2004b. Sub-maximal physical strain and peak
performance in handcycling versus hand-rim wheelchair propulsion. Spinal Cord, 42: 91–98. doi:
10.1038/sj.sc.3101566. PMID: 14765141.
4 de Groot, S., Veeger, D.H.E.V., Hollander, A.P., and Van der Woude, L.H.V. 2002. Wheelchair propulsion technique
and mechanical efficiency after 3 weeks of practice. Med. Sci. Sports Exerc. 34: 756–766. doi: 10.1097/00005768-
200205000-00005. PMID: 11984291.
5 de Groot, S., Veeger, D.H.E.V., Hollander, A.P., and Van der Woude, L.H.V. 2003. Short- term adaptations in co-
ordination during the initial phase of learning manual wheelchair propulsion. J. Electromyogr. Kinesiol. 13: 217–228.
doi: 10.1016/S1050-6411(03)00018-X. PMID: 12706602.
6 Ekblom, B., and Goldbarg, A.N. 1971. The influence of physical training and other factors on the subjective rating of
perceived exertion. Acta Physiol. Scand. 83: 399–406. PMID: 5134177.
7 Fabre, N., Perrey, S., Arbez, L., Ruiz, J., Tordi, N., and Rouillon, J.D. 2006. Degree of coordination between breathing
and rhythmic arm movements during hand rim wheelchair propulsion. Int. J. Sports Med. 27: 67–74. doi: 10.1055/s-
2005-837486. PMID: 16388445.
8 Gayle, G.W., Pohlman, R.L., and Glaser, R.M. 1990. Cardiorespiratory and perceptual responses to arm crank and
wheelchair exercise using various hand-rims in male paraplegics. Res. Q. Exerc. Sport, 61: 224–232. PMID: 2097677.
9 Glaser, R.M., Sawka, M.N., Young, R.E., and Suryaprasad, A.G. 1980. Applied physiology for wheelchair design. J.
Physiol. 48: 41–44.
10 Goosey-Tolfrey, V.L., and Kirk, J.H. 2003. Effect of push frequency and strategy variations on economy and
perceived exertion during wheelchair propulsion. Eur. J. Appl. Physiol. 90: 154–158. doi: 10.1007/s00421-003-0875-6.
PMID: 14504947.
11 Goosey-Tolfrey, V.L., Campbell, I.G., and Fowler, N.E. 2000. Effect of push frequency on the economy of wheelchair
racers. Med. Sci. Sports Exerc. 32: 174–181. doi: 10.1097/00005768-200001000-00026. PMID: 10647546.
12 Hassmén, P. 1990. Perceptual and physiological responses to cycling and running in groups of trained and
untrained subjects. Eur. J. Appl. Physiol. 60: 445–451. doi: 10.1007/ BF00705035.
13 Hintzy, F., and Tordi, N. 2004. Mechanical efficiency during hand-rim wheelchair propulsion: effects of base-line
subtraction and power output. Clin. Biomech. (Bristol, Avon), 19: 343–349. doi: 10.1016/j.clinbiomech.2004.01.001.
PMID: 15109753.
14 Hintzy, F., Tordi, N., and Perrey, S. 2002. Muscular efficiency during arm cranking and wheelchair exercise: a
comparison. Int. J. Sports Med. 23: 408–414. doi: 10.1055/s-2002-33734. PMID: 12215959.
15 Hopman, M.T.E., Teeffelen, W.M., Van Brouwer, J., Houtman, S., and Binkhorst, R.A. 1995. Physiological responses
to asynchronous and synchronous arm-cranking exercise. Eur. J. Appl. Physiol. 72: 111–114. doi: 10.1007/BF00964124.
16 Lenton, J.P., Fowler, N., Van der Woude, L., and Goosey-Tolfrey, V.L. 2007. Efficiency of wheelchair propulsion and
effects of strategy. Int. J. Sports Med. 28: 1–6. doi: 10.1055/s-2006-924028. PMID: 17133288.
Synchronous vs. Asynchronous push strategies Chapter 4
78
17 Mossberg, K., Willman, C., Topor, M.A., Crook, H., and Patak, S. 1999. Comparison of asynchronous versus
synchronous arm crank ergometry. Spinal Cord, 37: 569–574. doi: 10.1038/sj.sc.3100875. PMID: 10455533.
18 Pandolf, K.B. 1982. Differentiated ratings of perceived exertion during physical exercise. Med. Sci. Sports Exerc. 14:
397–405. PMID: 7154896.
19 Peronnet, F., and Massicotte, D. 1991. Table of non-protein respiratory quotient: an update. Can. J. Sport Sci. 16:
23–29. PMID: 1645211.
20 Redfield, R., and Hull, M.L. 1986. On the relation between joint moments and pedalling rates at a constant power in
bicycling. J. Biomech. 19: 317–329. doi: 10.1016/0021-9290(86)90008-4. PMID: 3711132.
21 Robertson, R.N., Boninger, M.L., Cooper, R.A., and Shimada, S.D. 1996. Pushrim forces and joint kinetics during
wheelchair propulsion. Arch. Phys. Med. Rehabil. 77: 856–864. doi: 10.1016/S0003-9993(96)90270-1. PMID: 8822674.
22 Sanderson, D.J., and Sommer, H.J. 1985. Kinematic features of wheelchair propulsion. J. Biomech. 18(6): 423-429.
23 Sparrow, W.A., and Newell, K.M. 1998. Metabolic energy expenditure and the regulation of movement economy.
Psychon. Bull. Rev. 5: 173–196.
24 Theisen, D., Francaux, M., Fayt, A., and Sturbois, X. 1996. A new procedure to determine external power output
during hand-rim wheelchair propulsion on a roller ergometer: a reliability study. Int. J. Sports Med. 17: 564–571. doi:
10.1055/s-2007-972896. PMID: 8973976.
25 Van der Woude, L.H.V., de Groot, G., Hollander, A.P., Van Ingen Schenau, R.H., and Rozendal, R.H. 1986.
Wheelchair ergonomics and physiological testing of prototypes. Ergonomics, 29: 1561–1573. doi:
10.1080/00140138608967269. PMID: 3102225.
26 Van der Woude, L.H.V., Veeger, H.E.J., Rozendal, R.H., and Sargeant, A.J. 1989. Optimum cycle frequencies in hand-
rim wheelchair propulsion. Wheelchair propulsion technique. Eur. J. Appl. Physiol. Occup. Physiol. 58: 625–632. doi:
10.1007/BF00418509. PMID: 2731532.
27 Van der Woude, L.H.V., Bosmans, I., Bervoets, B., and Veeger, H.E.J. 2000. Handcycling: different modes and gear
ratios. J. Med. Eng. Technol. 24: 242–249. doi: 10.1080/030919000300037168. PMID: 11315650.
28 Van der Woude, L.H.V., Veeger, H.E.J., Dallmeijer, A.J., Janssen, T.W.J., and Rozendal, R.H. 2001. Biomechanics and
physiology in active manual wheelchair propulsion. Med. Eng. Phys. 23: 713–733. doi: 10.1016/S1350-4533(01)00083-
2. PMID: 11801413.
29 Van der Woude, L.H.V., Formanoy, M., and de Groot, S. 2003. Hand rim configuration: effects on physical strain and
technique in unimpaired subjects? Med. Eng. Phys. 25: 765–774. doi: 10.1016/S1350-4533(03)00102-4. PMID:
14519349.
30 Vanlandewijck, Y.C., Spaepen, A.J., and Lysens, R.J. 1994. Wheelchair propulsion efficiency: movement pattern
adaptations to speed changes. Med. Sci. Sports Exerc. 26: 1373–1381. PMID: 7837958.
31 Vanlandewijck, Y.C., Theisen, D., and Daly, D. 2001. Wheelchair propulsion biomechanics: implications for
wheelchair sports. Sports Med. 31: 339–367. doi: 10.2165/00007256-200131050-00005. PMID: 11347685.
32 Veeger, H.E.J., Van der Woude, L.H.V., and Rozendal, R.H. 1992. Effect of hand-rim velocity on mechanical
efficiency in wheelchair propulsion. Med. Sci. Sports Exerc. 24: 100–107. PMID: 1548983.
Synchronous vs. Asynchronous push strategies Chapter 5
79
Chapter 5
Effects of 4 weeks asynchronous hand-rim wheelchair practice on mechanical efficiency and timing Disability and Rehabilitation (2010); 32(26): 2155-2164. John P. Lenton1,3, Lucas HV. Van der Woude2, Neil E. Fowler1, Victoria L. Goosey-Tolfrey1,3
Abstract
To investigate the consequence on gross mechanical efficiency (GE), arm frequency and sub-
maximal performance, of paced and unpaced practice during asynchronous hand-rim wheelchair
propulsion. Twenty five able-bodied participants performed five, 4-minute exercise bouts at 1.7
m·s-1, at the freely chosen frequency (FCF) and 4 paced arm frequencies of 60, 80, 120, and 140%
FCF. GE, arm frequency and measures of sub-maximal performance were determined.
Participants were assigned to an unpaced (FCF, N = 9), paced (80% FCF, N = 8) or control (CON, N =
8) no practice group. The FCF and 80%FCF groups received 4-weeks (unpaced and paced
respectively) propulsion practice (3 sessions·wk-1, 4 · 4min/trials; 33-35W) at 1.7 m·s-1 on a
wheelchair ergometer. Following practice, the pre-testing protocol was repeated. Mean GE
showed a relative increase in both experimental groups (21% & 17%; FCF and 80% FCF
respectively; P = 0.001) compared to no change in CON (-1.5%). The FCF arm frequency decreased
in both experimental groups (P = 0.001), with larger changes evident following FCF practice. Four
weeks of unpaced or paced practice had a beneficial effect on GE. This improvement seems to be
associated with a reduction in arm frequency.
1Peter Harrison Centre for Disability Sport, School of Sport, Exercise & Health Sciences, Loughborough University, Loughborough, UK. 2Center for Human Movement Sciences, University Medical Center Groningen, University of Groningen, Groningen, The Netherlands. 3Exercise & Sport Science, Manchester Metropolitan University, Alsager, UK.
Synchronous vs. Asynchronous push strategies Chapter 5
80
Introduction The learning and training of manual hand-rim wheelchair propulsion is deemed an essential
part of the rehabilitation process for people who become wheelchair-dependent, such as those
with a spinal cord injury [1, 2, 3, 4]. That said, the skills required for hand-rim propulsion are more
than often learned during rehabilitation as a completely novel task. In light of this, there have
been important advances in the study of this learning process/practice period by the Dutch group
over the last decade [3, 5, 6, 7, 8, 9, 10].
It is clearly evident that 2yrs and upwards of wheelchair sports experience significantly
improves the efficiency of hand-rim propulsion [11]. On the other hand, familiarisation of manual
hand-rim propulsion over a practice period of just 3-weeks consisting of only nine trials, has
resulted in gross efficiency improvements of 0.33 % and 0.66 % at 0.15 and 0.25 W·kg-1
respectively (mean power output of 11.6 vs. 19.3 W) [5]. Moreover, the suggestion by de Groot
and colleagues [12], that the pumping stroke pattern is an energetically more efficient stroke
pattern when compared to other stroke techniques in a very early learning phase, demonstrated
strong evidence that technical practice may improve efficiency. Consequently, this work has led to
studies examining the adaptations of wheelchair propulsion at set time intervals during the
rehabilitation period [13], and the changes in physical capacity after the rehabilitation period [14].
It has been suggested that the improvements in gross efficiency are the result of the changes in
the temporal parameters of the propulsion technique [12]. We know from previous work that
temporal parameters are paramount, and that operating at the freely chosen frequency (FCF)
provides for the greatest gross efficiency [15, 16]. More recently, however, when the combined
influence of arm frequency and propulsion mode (asynchronous and synchronous) was studied it
was suggested that operating at 60-80% of the FCF is less physiologically demanding [17]. Such
findings suggest that there may be a physiological advantage in practicing with a lower push
frequency and are also supportive to the notion that this may reduce the likelihood of overuse
injuries during wheelchair propulsion [18]. Thus, the adaptations of wheelchair propulsion to slow
paced frequency practice versus unpaced practice may be more favourable in terms of mechanical
efficiency.
In terms of propulsion strategy, early work suggested that asynchronous propulsion and high
drive ratio resulted in less wasted movements [19]. Nevertheless, the work of Lenton and
colleagues [20] have challenged these findings, and under their experimental conditions found the
synchronous mode offered greater efficiency during wheelchair propulsion at equal arm
frequencies. However, further work has demonstrated in able-bodied, inexperienced individuals
that there is no significant difference in the efficiency during synchronous and asynchronous
propulsion [17]. Since, theories relating to the learning process of the more conventional style of
Synchronous vs. Asynchronous push strategies Chapter 5
81
manual wheelchair propulsion are emerging; it is of interest to determine whether gross efficiency
could be refined through an asynchronous practice strategy. It is important to note, that the term
push rate/push frequency during asynchronous propulsion has often been used inter-changeably
with the term arm movement [20]. However, to clarify, from here on push rate/push frequency
will be described as the total number of arm movements and the term arm frequency used, this is
consequently the addition of the left and right side to account for the alternate arm pushing style
of the asynchronous strategy.
There are several studies that have focused on the learning process of manual wheelchair
propulsion [6, 11, 16, 21, 22, 23, 24]. Of these studies, it has been suggested that visual feedback
can help participants to achieve a more effective hand-rim wheelchair force production [6] and
help to regulate the pace of trials (e.g., to slow a participant’s arm frequency) which under certain
conditions have been found to improve gross efficiency [11, 17]. We wish to extend this work by:
1) verifying the effects of hand rim wheelchair learning in a unpaced vs. paced frequency condition
and 2) to examine whether a different mode (asynchronous) propulsion will follow a similar and
consistent pattern of adaptation as is seen in synchronous propulsion.
Therefore, the purpose of this study was to investigate the consequence of unpaced and
paced practice during asynchronous hand-rim wheelchair propulsion training on gross mechanical
efficiency (GE), timing and sub-maximal performance. Based on previous work [11, 17] it was
hypothesised that practice at 80% of FCF (paced) will achieve larger improvements in mechanical
efficiency in relation to an equivalent period of unpaced practice or no practice.
Method Participants
Twenty five healthy, male, able-bodied participants (22 ± 4 years; body mass 81.4 ± 10.8kg)
volunteered and gave written informed consent prior to participation for this study. Approval for
the study procedures was obtained from the University Research Ethics Committee. Prerequisite
for participation was no prior experience in wheelchair propulsion or training in upper body sports
activities. For this reason, the risk of any previously acquired preference of arm movement
frequency or strategy was minimal. Body mass was recorded to the nearest 0.1 kg using a seated
balance scale (Seca 710, Hamburg, Germany).
Wheelchair ergometer
All participants were tested in the same hand-rim basketball wheelchair (Quattro, RGK,
Burntwood, Staffordshire, England) using the wheelchair ergometer interfaced with a computer
(Compaq Armada 1520, Series 2920A). A 15o cambered chair was fitted with 0.66 m diameter
wheels and 0.61 m hand-rims, with a total mass of 12.9 kg. Rear wheel tyre pressure was
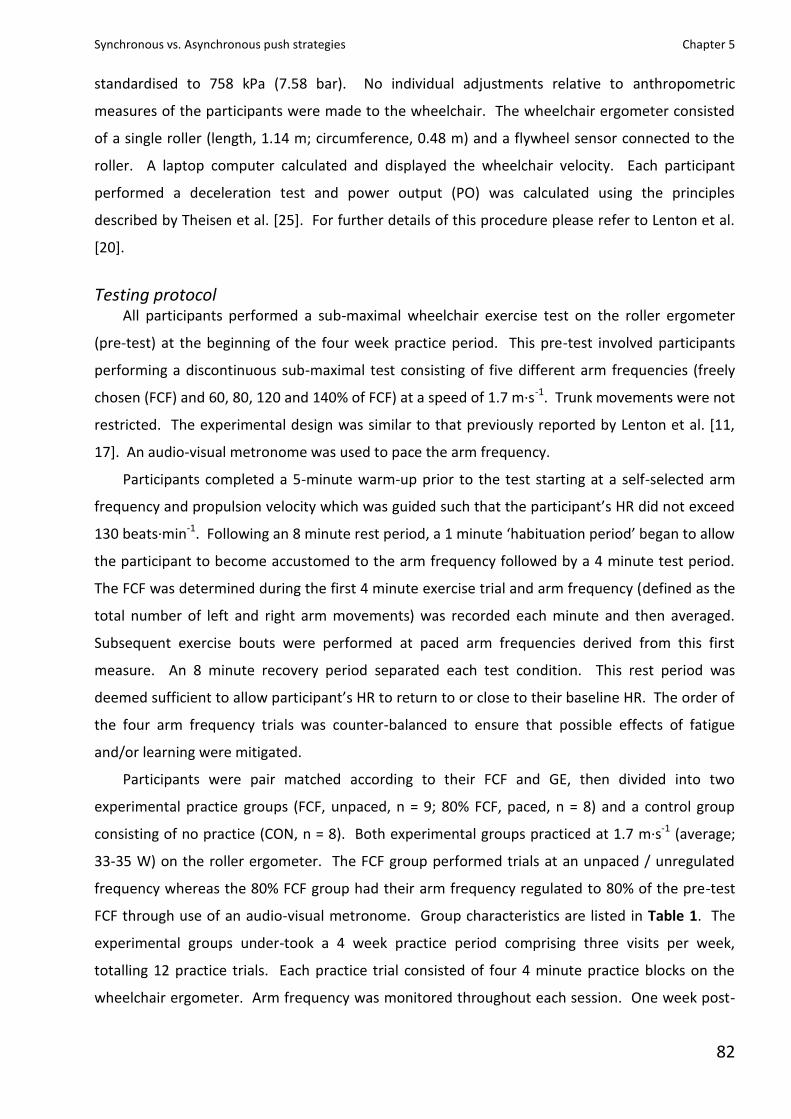
Synchronous vs. Asynchronous push strategies Chapter 5
82
standardised to 758 kPa (7.58 bar). No individual adjustments relative to anthropometric
measures of the participants were made to the wheelchair. The wheelchair ergometer consisted
of a single roller (length, 1.14 m; circumference, 0.48 m) and a flywheel sensor connected to the
roller. A laptop computer calculated and displayed the wheelchair velocity. Each participant
performed a deceleration test and power output (PO) was calculated using the principles
described by Theisen et al. [25]. For further details of this procedure please refer to Lenton et al.
[20].
Testing protocol All participants performed a sub-maximal wheelchair exercise test on the roller ergometer
(pre-test) at the beginning of the four week practice period. This pre-test involved participants
performing a discontinuous sub-maximal test consisting of five different arm frequencies (freely
chosen (FCF) and 60, 80, 120 and 140% of FCF) at a speed of 1.7 m·s-1. Trunk movements were not
restricted. The experimental design was similar to that previously reported by Lenton et al. [11,
17]. An audio-visual metronome was used to pace the arm frequency.
Participants completed a 5-minute warm-up prior to the test starting at a self-selected arm
frequency and propulsion velocity which was guided such that the participant’s HR did not exceed
130 beats·min-1. Following an 8 minute rest period, a 1 minute ‘habituation period’ began to allow
the participant to become accustomed to the arm frequency followed by a 4 minute test period.
The FCF was determined during the first 4 minute exercise trial and arm frequency (defined as the
total number of left and right arm movements) was recorded each minute and then averaged.
Subsequent exercise bouts were performed at paced arm frequencies derived from this first
measure. An 8 minute recovery period separated each test condition. This rest period was
deemed sufficient to allow participant’s HR to return to or close to their baseline HR. The order of
the four arm frequency trials was counter-balanced to ensure that possible effects of fatigue
and/or learning were mitigated.
Participants were pair matched according to their FCF and GE, then divided into two
experimental practice groups (FCF, unpaced, n = 9; 80% FCF, paced, n = 8) and a control group
consisting of no practice (CON, n = 8). Both experimental groups practiced at 1.7 m·s-1 (average;
33-35 W) on the roller ergometer. The FCF group performed trials at an unpaced / unregulated
frequency whereas the 80% FCF group had their arm frequency regulated to 80% of the pre-test
FCF through use of an audio-visual metronome. Group characteristics are listed in Table 1. The
experimental groups under-took a 4 week practice period comprising three visits per week,
totalling 12 practice trials. Each practice trial consisted of four 4 minute practice blocks on the
wheelchair ergometer. Arm frequency was monitored throughout each session. One week post-
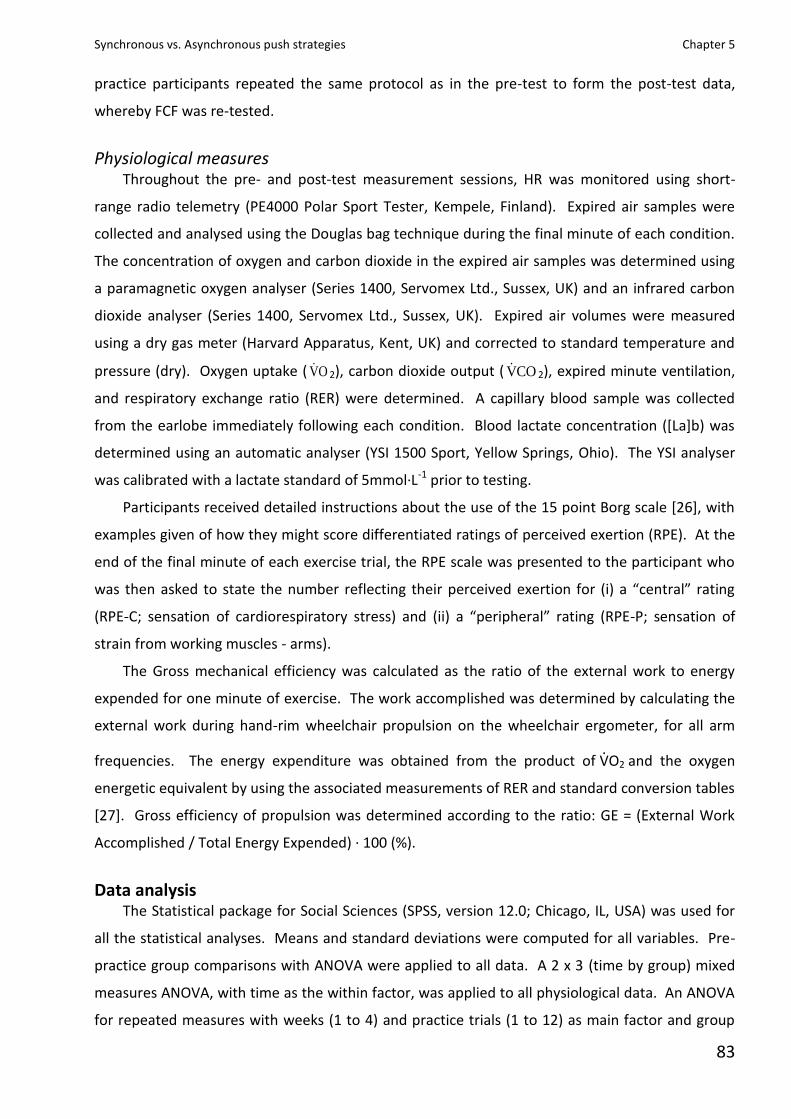
Synchronous vs. Asynchronous push strategies Chapter 5
83
practice participants repeated the same protocol as in the pre-test to form the post-test data,
whereby FCF was re-tested.
Physiological measures Throughout the pre- and post-test measurement sessions, HR was monitored using short-
range radio telemetry (PE4000 Polar Sport Tester, Kempele, Finland). Expired air samples were
collected and analysed using the Douglas bag technique during the final minute of each condition.
The concentration of oxygen and carbon dioxide in the expired air samples was determined using
a paramagnetic oxygen analyser (Series 1400, Servomex Ltd., Sussex, UK) and an infrared carbon
dioxide analyser (Series 1400, Servomex Ltd., Sussex, UK). Expired air volumes were measured
using a dry gas meter (Harvard Apparatus, Kent, UK) and corrected to standard temperature and
pressure (dry). Oxygen uptake ( OV 2), carbon dioxide output ( COV 2), expired minute ventilation,
and respiratory exchange ratio (RER) were determined. A capillary blood sample was collected
from the earlobe immediately following each condition. Blood lactate concentration ([La]b) was
determined using an automatic analyser (YSI 1500 Sport, Yellow Springs, Ohio). The YSI analyser
was calibrated with a lactate standard of 5mmol·L-1 prior to testing.
Participants received detailed instructions about the use of the 15 point Borg scale [26], with
examples given of how they might score differentiated ratings of perceived exertion (RPE). At the
end of the final minute of each exercise trial, the RPE scale was presented to the participant who
was then asked to state the number reflecting their perceived exertion for (i) a “central” rating
(RPE-C; sensation of cardiorespiratory stress) and (ii) a “peripheral” rating (RPE-P; sensation of
strain from working muscles - arms).
The Gross mechanical efficiency was calculated as the ratio of the external work to energy
expended for one minute of exercise. The work accomplished was determined by calculating the
external work during hand-rim wheelchair propulsion on the wheelchair ergometer, for all arm
frequencies. The energy expenditure was obtained from the product of ·VO2 and the oxygen
energetic equivalent by using the associated measurements of RER and standard conversion tables
[27]. Gross efficiency of propulsion was determined according to the ratio: GE = (External Work
Accomplished / Total Energy Expended) · 100 (%).
Data analysis The Statistical package for Social Sciences (SPSS, version 12.0; Chicago, IL, USA) was used for
all the statistical analyses. Means and standard deviations were computed for all variables. Pre-
practice group comparisons with ANOVA were applied to all data. A 2 x 3 (time by group) mixed
measures ANOVA, with time as the within factor, was applied to all physiological data. An ANOVA
for repeated measures with weeks (1 to 4) and practice trials (1 to 12) as main factor and group
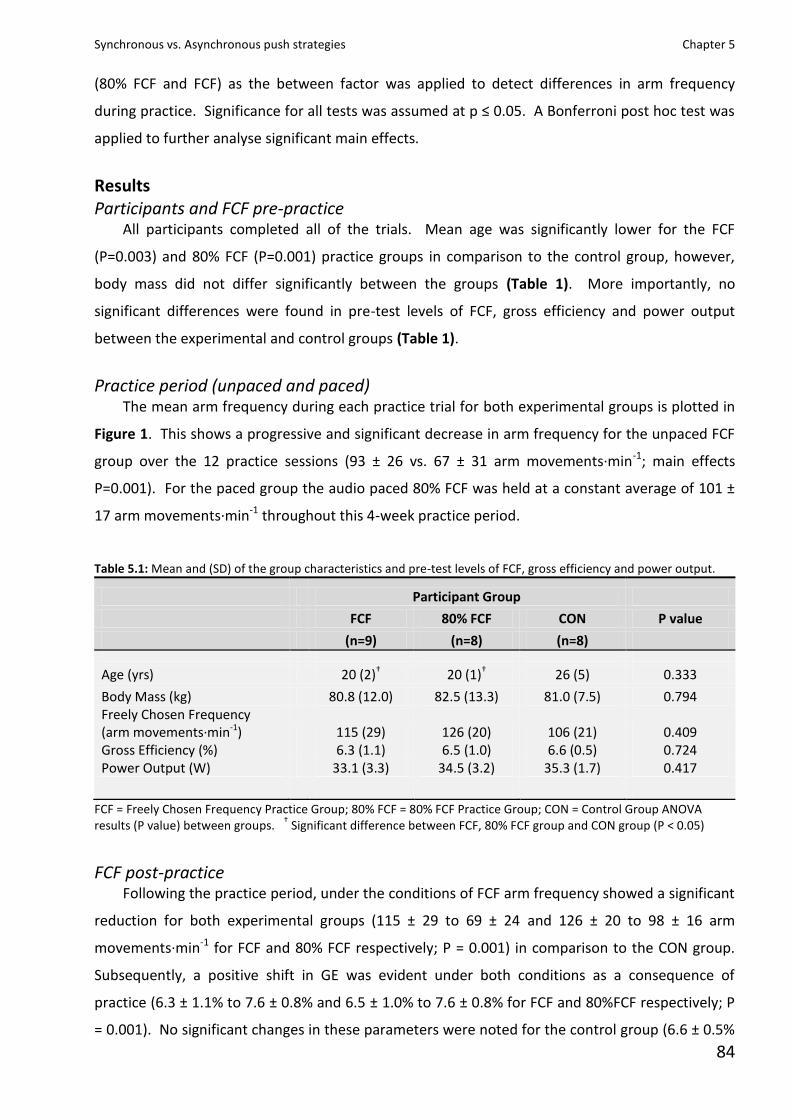
Synchronous vs. Asynchronous push strategies Chapter 5
84
(80% FCF and FCF) as the between factor was applied to detect differences in arm frequency
during practice. Significance for all tests was assumed at p ≤ 0.05. A Bonferroni post hoc test was
applied to further analyse significant main effects.
Results Participants and FCF pre-practice
All participants completed all of the trials. Mean age was significantly lower for the FCF
(P=0.003) and 80% FCF (P=0.001) practice groups in comparison to the control group, however,
body mass did not differ significantly between the groups (Table 1). More importantly, no
significant differences were found in pre-test levels of FCF, gross efficiency and power output
between the experimental and control groups (Table 1).
Practice period (unpaced and paced) The mean arm frequency during each practice trial for both experimental groups is plotted in
Figure 1. This shows a progressive and significant decrease in arm frequency for the unpaced FCF
group over the 12 practice sessions (93 ± 26 vs. 67 ± 31 arm movements·min-1; main effects
P=0.001). For the paced group the audio paced 80% FCF was held at a constant average of 101 ±
17 arm movements·min-1 throughout this 4-week practice period.
Table 5.1: Mean and (SD) of the group characteristics and pre-test levels of FCF, gross efficiency and power output.
FCF = Freely Chosen Frequency Practice Group; 80% FCF = 80% FCF Practice Group; CON = Control Group ANOVA results (P value) between groups.
† Significant difference between FCF, 80% FCF group and CON group (P < 0.05)
FCF post-practice Following the practice period, under the conditions of FCF arm frequency showed a significant
reduction for both experimental groups (115 ± 29 to 69 ± 24 and 126 ± 20 to 98 ± 16 arm
movements·min-1 for FCF and 80% FCF respectively; P = 0.001) in comparison to the CON group.
Subsequently, a positive shift in GE was evident under both conditions as a consequence of
practice (6.3 ± 1.1% to 7.6 ± 0.8% and 6.5 ± 1.0% to 7.6 ± 0.8% for FCF and 80%FCF respectively; P
= 0.001). No significant changes in these parameters were noted for the control group (6.6 ± 0.5%
Participant Group
FCF 80% FCF CON P value
(n=9) (n=8) (n=8)
Age (yrs) 20 (2)† 20 (1)† 26 (5) 0.333
Body Mass (kg) 80.8 (12.0) 82.5 (13.3) 81.0 (7.5) 0.794 Freely Chosen Frequency (arm movements·min-1) 115 (29) 126 (20) 106 (21) 0.409 Gross Efficiency (%) 6.3 (1.1) 6.5 (1.0) 6.6 (0.5) 0.724 Power Output (W) 33.1 (3.3) 34.5 (3.2) 35.3 (1.7) 0.417
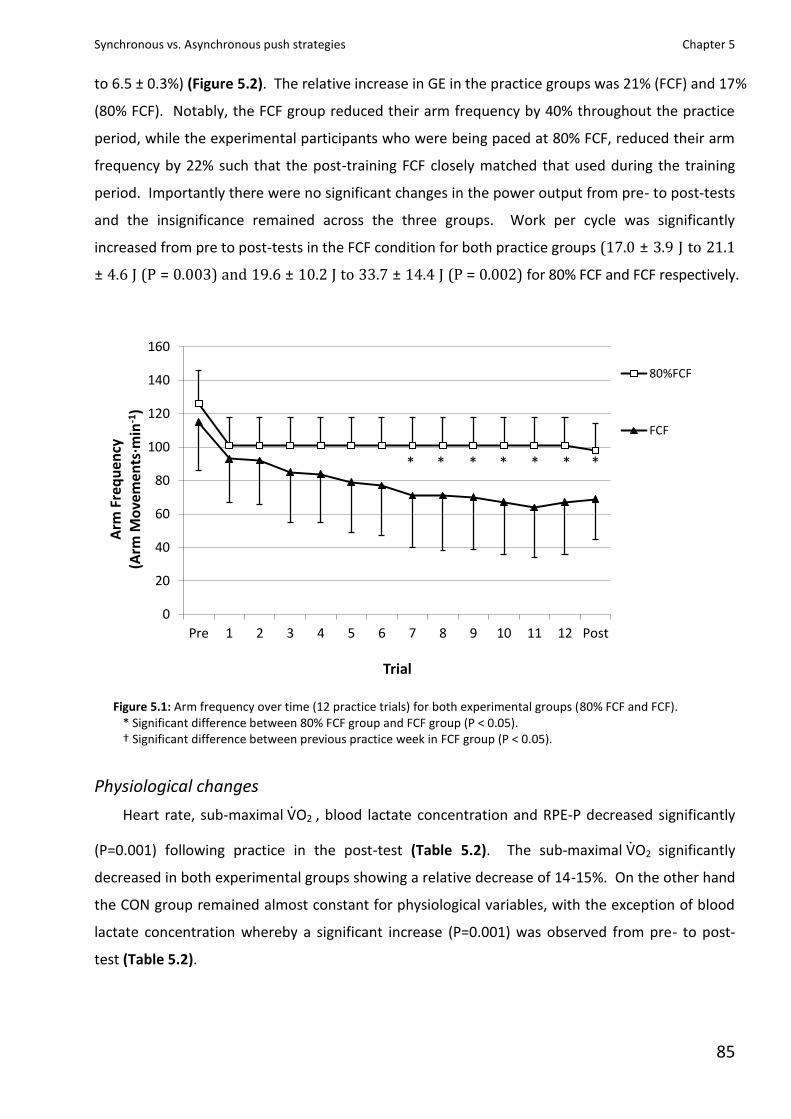
Synchronous vs. Asynchronous push strategies Chapter 5
85
to 6.5 ± 0.3%) (Figure 5.2). The relative increase in GE in the practice groups was 21% (FCF) and 17%
(80% FCF). Notably, the FCF group reduced their arm frequency by 40% throughout the practice
period, while the experimental participants who were being paced at 80% FCF, reduced their arm
frequency by 22% such that the post-training FCF closely matched that used during the training
period. Importantly there were no significant changes in the power output from pre- to post-tests
and the insignificance remained across the three groups. Work per cycle was significantly
increased from pre to post-tests in the FCF condition for both practice groups (17.0 ± 3.9 J to 21.1
± 4.6 J (P = 0.003) and 19.6 ± 10.2 J to 33.7 ± 14.4 J (P = 0.002) for 80% FCF and FCF respectively.
Figure 5.1: Arm frequency over time (12 practice trials) for both experimental groups (80% FCF and FCF).
* Significant difference between 80% FCF group and FCF group (P < 0.05). † Significant difference between previous practice week in FCF group (P < 0.05).
Physiological changes
Heart rate, sub-maximal ·VO2 , blood lactate concentration and RPE-P decreased significantly
(P=0.001) following practice in the post-test (Table 5.2). The sub-maximal ·VO2 significantly
decreased in both experimental groups showing a relative decrease of 14-15%. On the other hand
the CON group remained almost constant for physiological variables, with the exception of blood
lactate concentration whereby a significant increase (P=0.001) was observed from pre- to post-
test (Table 5.2).
0
20
40
60
80
100
120
140
160
Pre 1 2 3 4 5 6 7 8 9 10 11 12 Post
Arm
Fre
qu
ency
(A
rm M
ove
men
ts·m
in-1
)
Trial
80%FCF
FCF
* * * * * * *
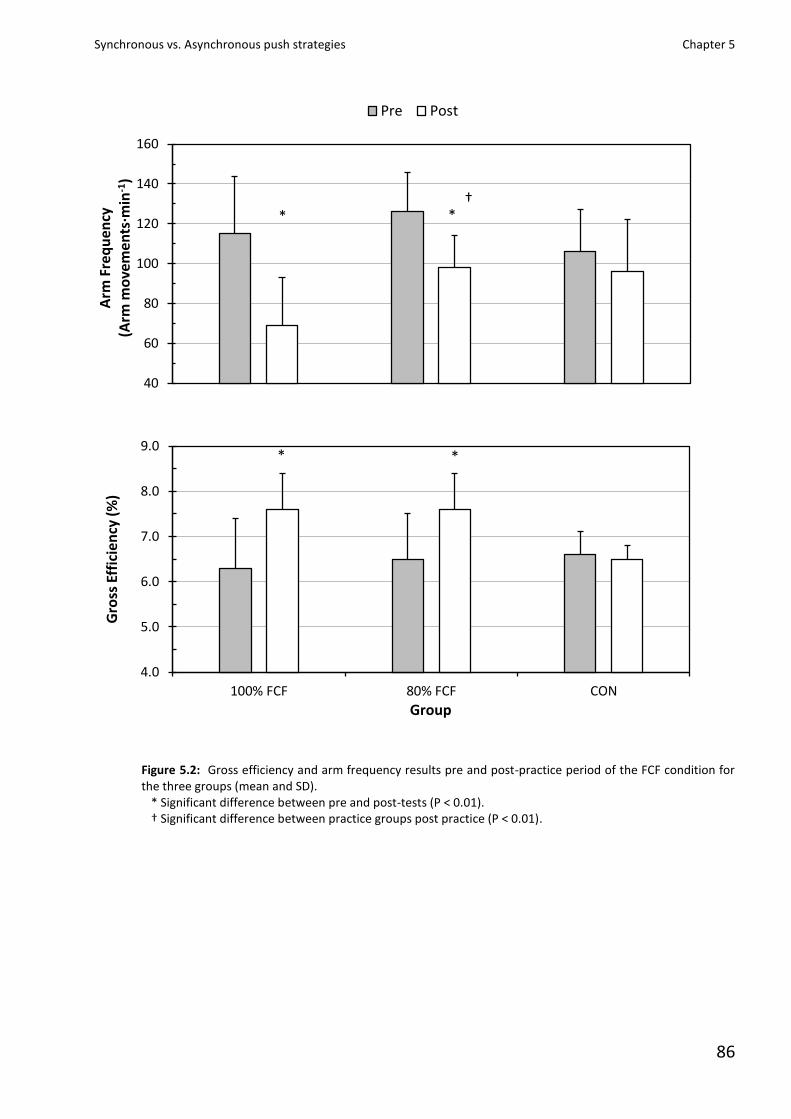
Synchronous vs. Asynchronous push strategies Chapter 5
86
Figure 5.2: Gross efficiency and arm frequency results pre and post-practice period of the FCF condition for the three groups (mean and SD).
* Significant difference between pre and post-tests (P < 0.01). † Significant difference between practice groups post practice (P < 0.01).
40
60
80
100
120
140
160
Arm
Fre
qu
ency
(A
rm m
ove
men
ts·m
in-1
) Pre Post
* †
*
4.0
5.0
6.0
7.0
8.0
9.0
100% FCF 80% FCF CON
Gro
ss E
ffic
ien
cy (
%)
Group
* *
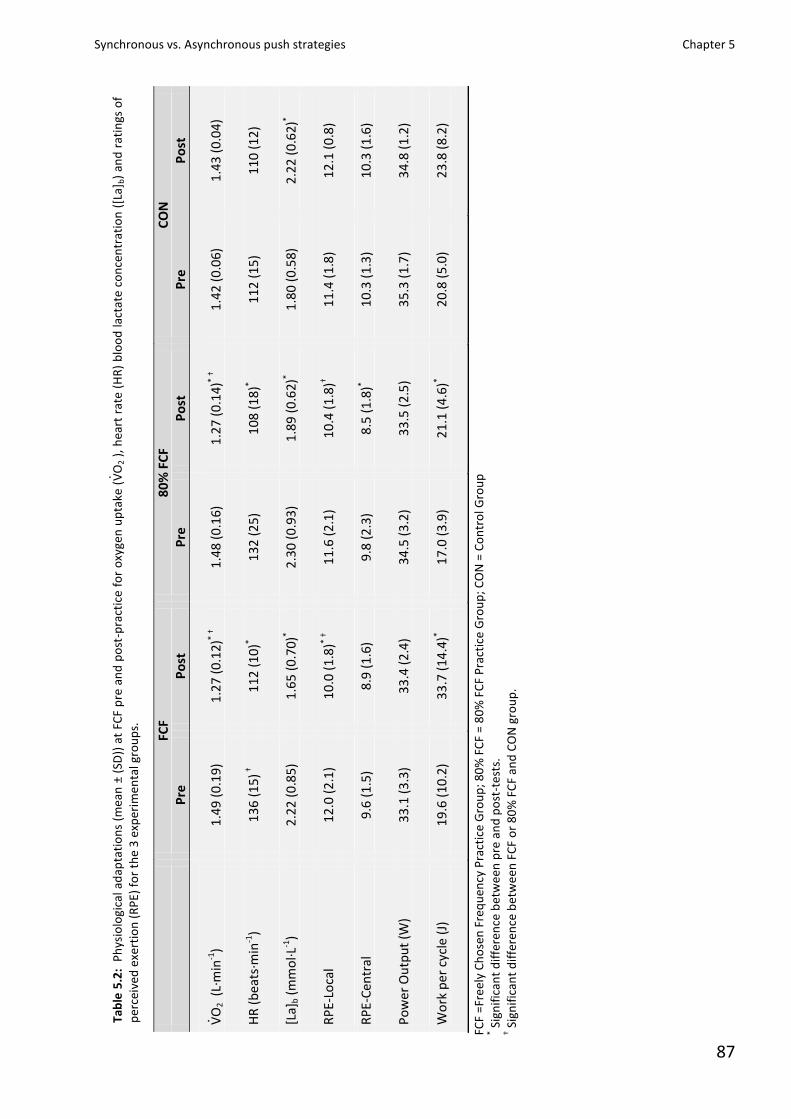
Synchronous vs. Asynchronous push strategies Chapter 5
87
Tab
le 5
.2:
Ph
ysio
logi
cal a
dap
tati
on
s (m
ean
± (
SD))
at
FCF
pre
an
d p
ost
-pra
ctic
e fo
r o
xyge
n u
pta
ke (
· VO
2 ),
hea
rt r
ate
(HR
) b
loo
d la
ctat
e co
nce
ntr
atio
n (
[La]
b)
and
rat
ings
of
per
ceiv
ed e
xert
ion
(R
PE)
fo
r th
e 3
exp
erim
enta
l gro
up
s.
FCF
=Fr
eel
y C
ho
sen
Fre
qu
ency
Pra
ctic
e G
rou
p; 8
0%
FC
F =
80
% F
CF
Pra
ctic
e G
rou
p; C
ON
= C
on
tro
l Gro
up
* S
ign
ific
ant
dif
fere
nce
bet
we
en p
re a
nd
po
st-t
ests
. † S
ign
ific
ant
dif
fere
nce
bet
we
en F
CF
or
80
% F
CF
and
CO
N g
rou
p.
FC
F 8
0%
FC
F C
ON
Pre
P
ost
P
re
Po
st
Pre
P
ost
· VO
2 (
L·m
in-1
)
1.4
9 (
0.1
9)
1.2
7 (
0.1
2)*
†
1.4
8 (
0.1
6)
1.2
7 (
0.1
4)*
†
1.4
2 (
0.0
6)
1.4
3 (
0.0
4)
HR
(b
eats
·min
-1)
13
6 (
15
) †
11
2 (
10
)* 1
32
(2
5)
10
8 (
18
)* 1
12
(1
5)
11
0 (
12
)
[La]
b (
mm
ol·L
-1)
2.2
2 (
0.8
5)
1.6
5 (
0.7
0)*
2.3
0 (
0.9
3)
1.8
9 (
0.6
2)*
1.8
0 (
0.5
8)
2.2
2 (
0.6
2)*
RP
E-Lo
cal
12
.0 (
2.1
) 1
0.0
(1
.8)*
† 1
1.6
(2
.1)
10
.4 (
1.8
)† 1
1.4
(1
.8)
12
.1 (
0.8
)
RP
E-C
entr
al
9.6
(1
.5)
8.9
(1
.6)
9.8
(2
.3)
8.5
(1
.8)*
1
0.3
(1
.3)
10
.3 (
1.6
)
Po
we
r O
utp
ut
(W)
33
.1 (
3.3
) 3
3.4
(2
.4)
34
.5 (
3.2
) 3
3.5
(2
.5)
35
.3 (
1.7
) 3
4.8
(1
.2)
Wo
rk p
er c
ycle
(J)
1
9.6
(1
0.2
) 3
3.7
(1
4.4
)* 1
7.0
(3
.9)
21
.1 (
4.6
)* 2
0.8
(5
.0)
23
.8 (
8.2
)
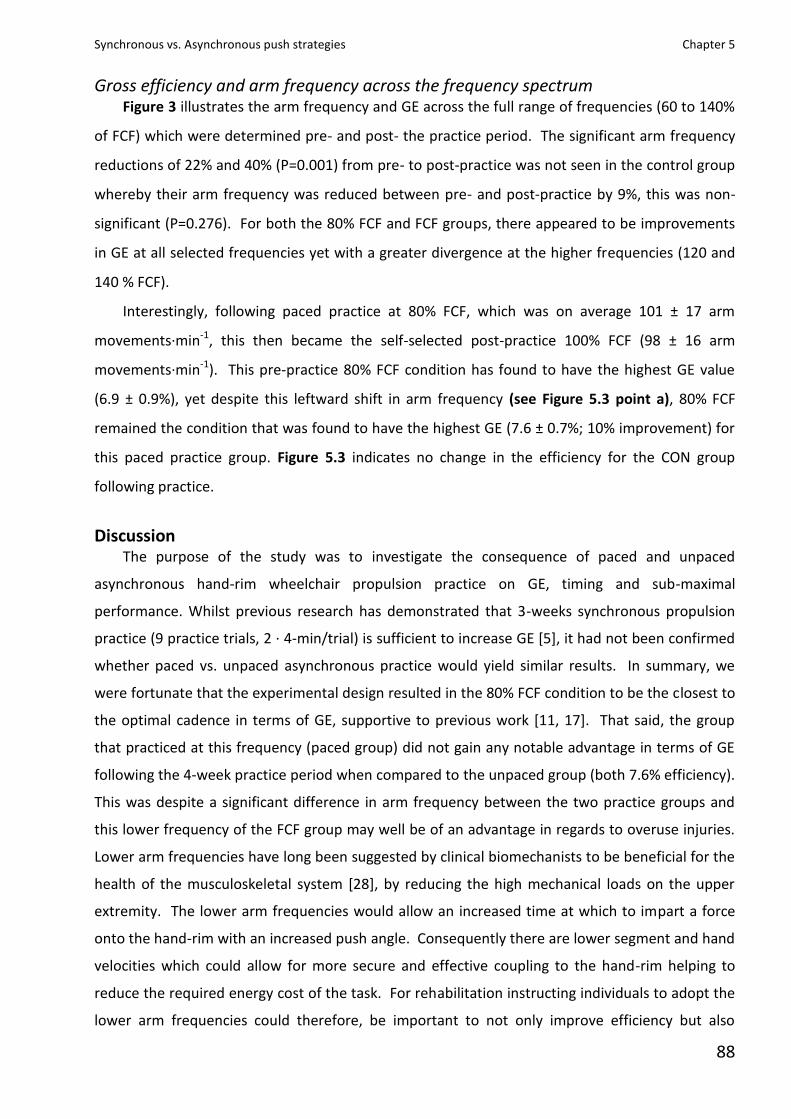
Synchronous vs. Asynchronous push strategies Chapter 5
88
Gross efficiency and arm frequency across the frequency spectrum Figure 3 illustrates the arm frequency and GE across the full range of frequencies (60 to 140%
of FCF) which were determined pre- and post- the practice period. The significant arm frequency
reductions of 22% and 40% (P=0.001) from pre- to post-practice was not seen in the control group
whereby their arm frequency was reduced between pre- and post-practice by 9%, this was non-
significant (P=0.276). For both the 80% FCF and FCF groups, there appeared to be improvements
in GE at all selected frequencies yet with a greater divergence at the higher frequencies (120 and
140 % FCF).
Interestingly, following paced practice at 80% FCF, which was on average 101 ± 17 arm
movements·min-1, this then became the self-selected post-practice 100% FCF (98 ± 16 arm
movements·min-1). This pre-practice 80% FCF condition has found to have the highest GE value
(6.9 ± 0.9%), yet despite this leftward shift in arm frequency (see Figure 5.3 point a), 80% FCF
remained the condition that was found to have the highest GE (7.6 ± 0.7%; 10% improvement) for
this paced practice group. Figure 5.3 indicates no change in the efficiency for the CON group
following practice.
Discussion The purpose of the study was to investigate the consequence of paced and unpaced
asynchronous hand-rim wheelchair propulsion practice on GE, timing and sub-maximal
performance. Whilst previous research has demonstrated that 3-weeks synchronous propulsion
practice (9 practice trials, 2 · 4-min/trial) is sufficient to increase GE [5], it had not been confirmed
whether paced vs. unpaced asynchronous practice would yield similar results. In summary, we
were fortunate that the experimental design resulted in the 80% FCF condition to be the closest to
the optimal cadence in terms of GE, supportive to previous work [11, 17]. That said, the group
that practiced at this frequency (paced group) did not gain any notable advantage in terms of GE
following the 4-week practice period when compared to the unpaced group (both 7.6% efficiency).
This was despite a significant difference in arm frequency between the two practice groups and
this lower frequency of the FCF group may well be of an advantage in regards to overuse injuries.
Lower arm frequencies have long been suggested by clinical biomechanists to be beneficial for the
health of the musculoskeletal system [28], by reducing the high mechanical loads on the upper
extremity. The lower arm frequencies would allow an increased time at which to impart a force
onto the hand-rim with an increased push angle. Consequently there are lower segment and hand
velocities which could allow for more secure and effective coupling to the hand-rim helping to
reduce the required energy cost of the task. For rehabilitation instructing individuals to adopt the
lower arm frequencies could therefore, be important to not only improve efficiency but also
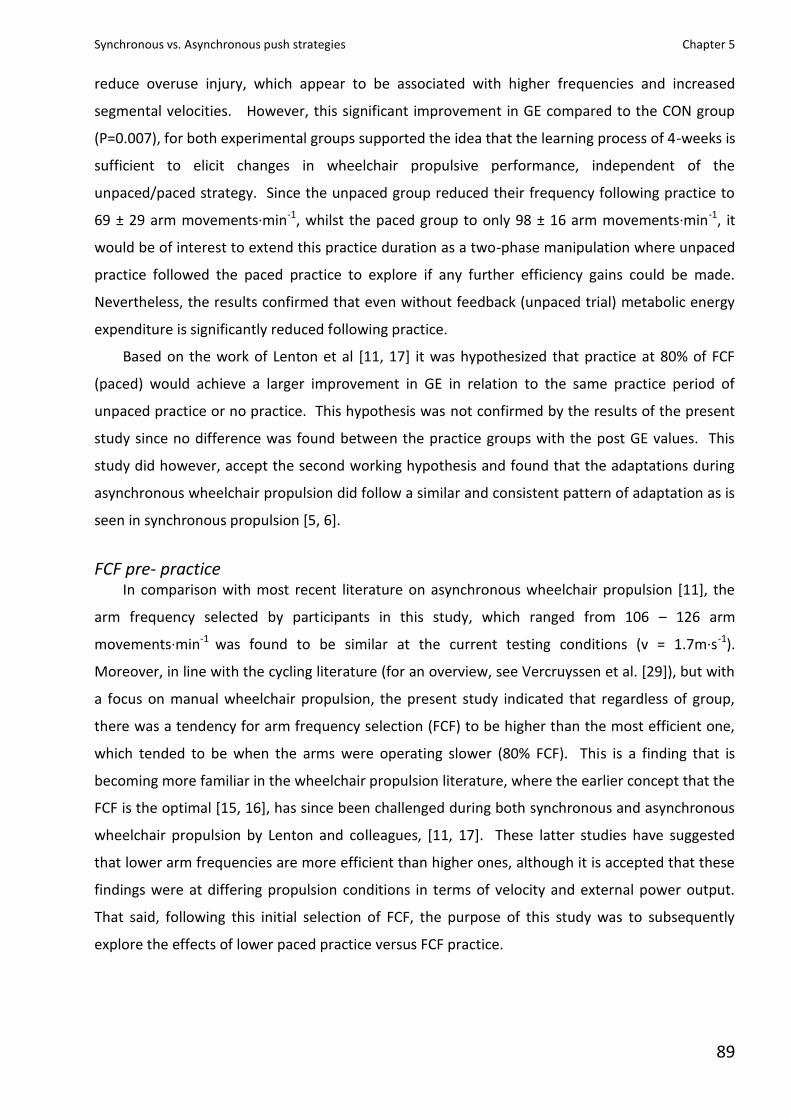
Synchronous vs. Asynchronous push strategies Chapter 5
89
reduce overuse injury, which appear to be associated with higher frequencies and increased
segmental velocities. However, this significant improvement in GE compared to the CON group
(P=0.007), for both experimental groups supported the idea that the learning process of 4-weeks is
sufficient to elicit changes in wheelchair propulsive performance, independent of the
unpaced/paced strategy. Since the unpaced group reduced their frequency following practice to
69 ± 29 arm movements·min-1, whilst the paced group to only 98 ± 16 arm movements·min-1, it
would be of interest to extend this practice duration as a two-phase manipulation where unpaced
practice followed the paced practice to explore if any further efficiency gains could be made.
Nevertheless, the results confirmed that even without feedback (unpaced trial) metabolic energy
expenditure is significantly reduced following practice.
Based on the work of Lenton et al [11, 17] it was hypothesized that practice at 80% of FCF
(paced) would achieve a larger improvement in GE in relation to the same practice period of
unpaced practice or no practice. This hypothesis was not confirmed by the results of the present
study since no difference was found between the practice groups with the post GE values. This
study did however, accept the second working hypothesis and found that the adaptations during
asynchronous wheelchair propulsion did follow a similar and consistent pattern of adaptation as is
seen in synchronous propulsion [5, 6].
FCF pre- practice In comparison with most recent literature on asynchronous wheelchair propulsion [11], the
arm frequency selected by participants in this study, which ranged from 106 – 126 arm
movements·min-1 was found to be similar at the current testing conditions (v = 1.7m·s-1).
Moreover, in line with the cycling literature (for an overview, see Vercruyssen et al. [29]), but with
a focus on manual wheelchair propulsion, the present study indicated that regardless of group,
there was a tendency for arm frequency selection (FCF) to be higher than the most efficient one,
which tended to be when the arms were operating slower (80% FCF). This is a finding that is
becoming more familiar in the wheelchair propulsion literature, where the earlier concept that the
FCF is the optimal [15, 16], has since been challenged during both synchronous and asynchronous
wheelchair propulsion by Lenton and colleagues, [11, 17]. These latter studies have suggested
that lower arm frequencies are more efficient than higher ones, although it is accepted that these
findings were at differing propulsion conditions in terms of velocity and external power output.
That said, following this initial selection of FCF, the purpose of this study was to subsequently
explore the effects of lower paced practice versus FCF practice.
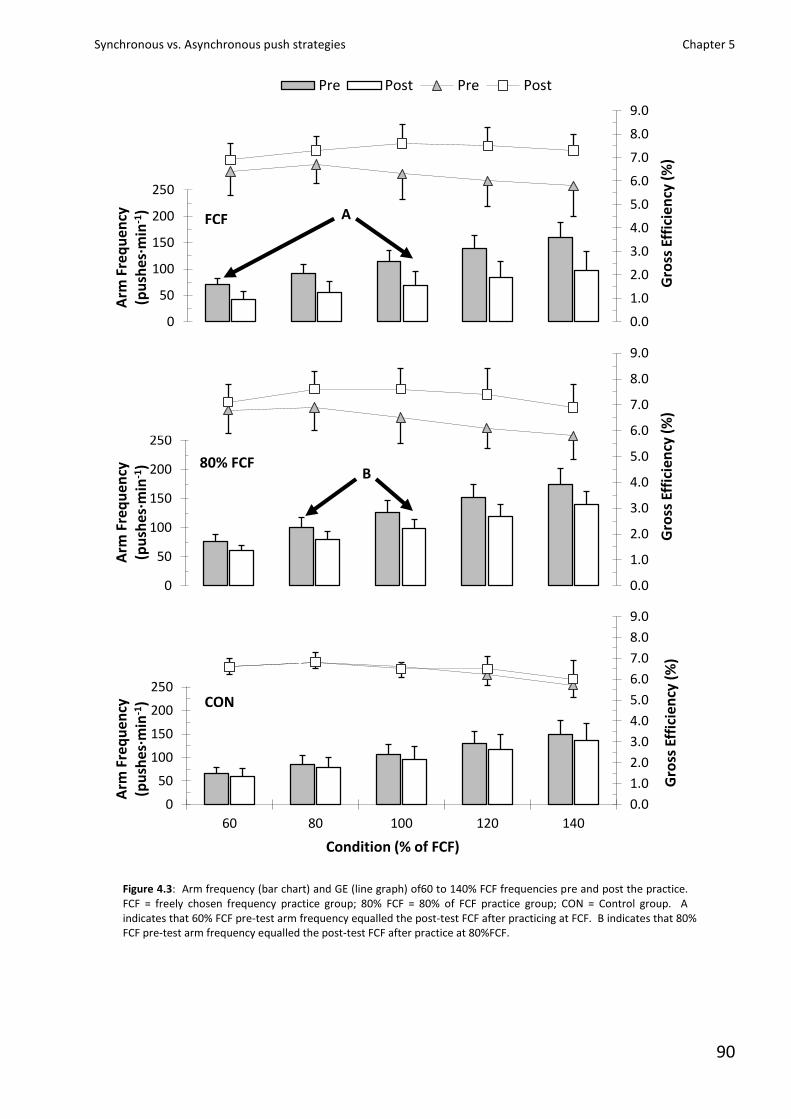
Synchronous vs. Asynchronous push strategies Chapter 5
90
Figure 4.3: Arm frequency (bar chart) and GE (line graph) of60 to 140% FCF frequencies pre and post the practice. FCF = freely chosen frequency practice group; 80% FCF = 80% of FCF practice group; CON = Control group. A indicates that 60% FCF pre-test arm frequency equalled the post-test FCF after practicing at FCF. B indicates that 80% FCF pre-test arm frequency equalled the post-test FCF after practice at 80%FCF.
0.0
1.0
2.0
3.0
4.0
5.0
6.0
7.0
8.0
9.0
0
50
100
150
200
250
300
350
400
Gro
ss E
ffic
ien
cy (
%)
Arm
Fre
qu
ency
(p
ush
es·m
in-1
)
Pre Post Pre Post
0.0
1.0
2.0
3.0
4.0
5.0
6.0
7.0
8.0
9.0
0
50
100
150
200
250
300
350
400
Gro
ss E
ffic
ien
cy (
%)
Arm
Fre
qu
ency
(p
ush
es·m
in-1
)
0.0
1.0
2.0
3.0
4.0
5.0
6.0
7.0
8.0
9.0
0
50
100
150
200
250
300
350
400
60 80 100 120 140
Gro
ss E
ffic
ien
cy (
%)
Arm
Fre
qu
ency
(p
ush
es·m
in-1
)
Condition (% of FCF)
CON
80% FCF
FCF A
B
Synchronous vs. Asynchronous push strategies Chapter 5
91
Practice (unpaced and paced) Of great interest is the fact that the two experimental groups gained similar improvements in
GE despite considerable differences in paced/unpaced practice and subsequent differences in FCF
(up to 29 arm movements·min-1). This improvement equated to GE increases of on average 1.1-
1.3%, which may appear to be only a small change, but from a clinical perspective would result in
the reduction of physical strain during daily activity tasks. However, this GE improvement is
greater when compared to a 3 week learning study, in which a maximum increase of 0.6% resulted
from low-intensity wheelchair propulsion practice (three times a week, two 4-min exercise blocks
of 0.15 W·kg-1 and 0.25 W·kg-1, respectively) [5]. More recently de Groot et al. [10] showed
increases of 1.3 - 1.9% following 7 weeks (three times a week, 70min) of low intensity wheelchair
training (30% of Heart Rate Reserve) at an average power output of 20W throughout the training.
The pre- and post- tests involved two exercise blocks were which were on average 13 and 26 W.
The power output of the present study remained constant throughout practice at ~34 W and thus
was higher than in the former two studies. Despite differences in power output and duration of
practice between these studies, it would appear that this study supports the notion that in order
to change the efficiency of propulsion, the duration of the practice/training seems important, i.e.
more practice/training leads to more improvement in gross efficiency [10, 11].
There is certainly evidence of a habitual learning effect which is likely to have a neural / co-
ordination effect [30] – evidenced by the fact that post training both groups had adapted to a FCF
which reflected that used in the practice period. Since both groups had similar GE post practice it
is likely that the FCF at this stage was indicative of their habituated preference rather than a
physiologic reason. Supportive to previous work, it would appear that skill learning of wheelchair
propulsion involves the search for a ‘body scheme’ that requires minimal energy expenditure *31+.
This study was limited to timing parameters that is discussed in more detail in the next section,
however, with the possible coupling features of breathing and movement [32]; we speculate that
the metabolic cost is not the only factor that is involved in this choice.
FCF post practice and other physiological parameters Timing is a leading parameter in cyclic motor learning and our findings relating to the
reduction of arm frequency confirms not only previous work on manual wheelchair propulsion [5,
6, 10], but the suggestion that the learning of repetitive gross-motor tasks might be characterized
by a ‘longer-slow’ control mode, i.e., a decreased arm frequency because of the larger stroke
angle/longer push time [33]. The key timing parameter of arm frequency changed significantly
over a relatively short period of time and the timing associated with this change appear to be
related to the improved GE. The mean power output did not change with practice, yet there were
notable reductions in arm frequency after practice, which resulted in an increase in work per cycle
Synchronous vs. Asynchronous push strategies Chapter 5
92
(Table 2). This notion would appear to be supported by de Groot and colleagues who reported an
increase in work per cycle following 3 weeks of low intensity practice [5] and within only 12
minutes of short term propulsion practice [7], attributed to the reduction in arm frequency. On
the other hand, contrary to this aforementioned work [10] found that during a 7 week low
intensity training no significant changes were observed in peak torque or peak power output
during propulsion despite significant changes in arm frequency. However, it is suggested that this
could well be the result of the large standard deviation found in the experimental group. If indeed
the work per cycle is increased with reduced arm frequency then this could point to a possible
explanation for greater reductions in RPE-P over RPE-C which is an area that warrants further
attention. The fact that the blood lactate concentration was significantly reduced following
practice is supportive to previous work which found that decreased lactate production is related
to a decreased cadence [16, 34, 35]. That said, we have no explanation as to why the CON group
were found to have increased blood lactate concentration during their post-test following no
practice. As expected, practice had favourable effects on oxygen cost and heart rate.
Gross efficiency and arm frequency across the frequency spectrum Despite, Groot et al., [12] stating that novice subjects seem to find the efficiency optimum at
the start of practice there was a tendency to suggest that the 80% FCF was more favourable in
terms of GE, which supported the work of Lenton et al.[11, 17]. Nevertheless, following both
practice conditions, participants appeared to work considerably more efficiently at the higher arm
frequencies (120 and 140% FCF; Figure 3). Interestingly, when participants practiced at a 20%
slower frequency (80% FCF) the GE optimum reset following the practice period by shifting to the
right. Consequently the practiced arm frequency became the FCF in the post-test and this
remained the most efficient condition. On the other hand, following FCF practice the participants
conformed to de Groot and co-workers [5] assumption that they found the efficiency optimum
and the FCF (post-practice) was more favourable when compared to the other frequency
conditions. This was not the case during the pre-test before practice and without the controlled
practice arm frequency, the arm frequency decreased by 40% at FCF post-test. This decrease
showed that after practice the pre-test 60% FCF condition was now the participants FCF in the
post-test.
Finally, it has been suggested that GE increases significantly across the time course of unpaced
practice [5], this combined with the reduction in FCF during practice as noted under the unpaced
practice generates a question of great interest. This being, whether participants (a) became more
economical because they reduced the arm frequency; or (b) if they were able to drop the
frequency because they were more economical.
Synchronous vs. Asynchronous push strategies Chapter 5
93
Limitations and implications Since very little is known regarding the effect of wheelchair propulsion practice the present
study employed able-bodied, inexperienced participants in one standardised chair configuration
condition, eliminating the effects of chair designs/setups on physiological measurements.
Importantly they reflect as closely as possible novice wheelchair users in the early stages of
rehabilitation. Their use is prevalent in the literature, and is essential to gain theoretical concepts
of the learning process of manual wheelchair propulsion in the first instance. Whilst it is
acknowledged this will have an influence on the absolute efficiency of propulsion [11], we
reiterate that, the purpose of the study was to evaluate the impact of propulsion practice and thus
it was important to eliminate any bias caused by habitual use. Our data clearly demonstrate the
power that habituation has on the critical variables in terms of GE improvements and reductions
HR and local RPE. This is important as currently the only longitudinal data on mechanical
efficiency during initial rehabilitation in persons with spinal cord injury is de Groot et al. [36].
The chosen propulsion velocity was selected from previous research to ensure that
participants were working sub-maximally throughout the exercise trials and practice conditions
[11, 17, 20]. However, we are unable to confirm whether the improvement in GE was
independent of physiological condition since an aerobic capacity test was not performed pre- and
post- the practice period. It is likely that the participants’ fitness could have improved slightly, yet
we hoped to have kept this to the minimum with the exercise intensity corresponding to around
57% ± 7% ·VO2 peak [11, 17] and exercise duration kept to only 16 minutes (4 · 4min blocks) of
propulsion during each practice session.
Of practical relevance is the feedback mechanism of pacing via the use of audio cues and its
application to assist recently spinal cord injured individuals in a rehabilitation centre towards
learning the complex task of wheelchair propulsion. Furthermore, music at different tempos may
assist this process by encouraging the individual to meet the requirements for the exercise
duration and intensity whilst maintaining a suitable cadence for optimum GE [37].
Conclusion Under the current experimental conditions, 4-weeks of asynchronous hand-rim wheelchair
propulsion practice had a beneficial effect on GE, timing and sub-maximal performance in novices.
The GE profile showed a shift towards the most efficient frequency being that most closely
matching the frequency adopted in training and in all cases this being lower in the post-test than
the initial FCF. Improvements in efficiency were clearly associated with a reduction in arm
frequency. This effect was demonstrated most clearly by the comparison between the final FCF
which for the paced group became the same as their paced practice frequency whilst for the
unpaced group this fell to the lower level achieved in the final weeks of practice. Further detailed

Synchronous vs. Asynchronous push strategies Chapter 5
94
analysis of the kinematics and muscle activation of this unconventional propulsion strategy would
help to further understand the mechanisms involved with the efficiency of wheelchair propulsion
and adaptations as a consequence of practice.
Acknowledgements The authors would like to acknowledge RGK Wheelchair manufacturers for the loan of the
Quattro basketball wheelchair. They would also like to thank all the participants for their time and
commitment to the testing.
Synchronous vs. Asynchronous push strategies Chapter 5
95
References 1 Jacobs PL, Nash MS. Exercise recommendations for individuals with spinal cord injury. Sports Med 2004; 34(11):
727-751.
2 Kilkens OJ, Dallmeijer AJ, Nene AV, Post MW, van der Woude LHV. The longitudinal relation between physical
capacity and wheelchair skill performance during inpatient rehabilitation of people with spinal cord injury. Arch Phsy
Med Rehabil 2005; 86(8): 1575-1581.
3 de Groot S. Course of gross mechanical efficiency in handrim wheelchair propulsion during rehabilitation of people
with spinal cord injury: a prospective cohort study. Arch Phys Med Rehabil 2005; 86(7): 1452-1460.
4 van der Woude LHV, de Groot S, Janssen TWJ. Manual wheelchairs: Research and innovation in rehabilitation, sports,
daily life and health. Med Eng Phys 2006; 28: 905-915.
5 de Groot S, Veeger DHEV, Hollander AP, van der Woude LHV. Wheelchair propulsion technique and mechanical
efficiency after 3 wk of practice. Med Sci Sports and Exerc 2002; 34(5): 756-766.
6 de Groot S, Veeger DHEV, Hollander AP, van der Woude LHV. Consequence of feedback based learning of an
effective hand rim wheelchair propulsion force production on mechanical efficiency. Clin Biomech 2002; 17(3); 219-
226.
7 de Groot S, Veeger DHEV, Hollander AP, van der Woude LHV. Adaptations in physiology and propulsion technique
during the initial phase of learning manual wheelchair propulsion. Am J Phys Med Rehab 2003; 82(7): 504-510.
8 de Groot S, Veeger DHEV, Hollander AP, van der Woude LHV. Short term adaptations in co-ordination during the
initial phase of learning manual wheelchair propulsion. J Electromyogr Kinesiol 2003; 13(3): 217-228.
9 de Groot S, Veeger DHEV, Hollander AP, van der Woude LHV. Influence of task complexity on mechanical efficiency
and propulsion technique during learning of hand rim wheelchair propulsion. Med Eng Phys 2005; 27(1): 41-49.
10 de Groot S, de Bruin M, Noomen SP, van der Woude LHV. Mechanical efficiency and propulsion technique after 7
weeks of low-intensity wheelchair training. Clin Biomech 2008; 23: 434-441.
11 Lenton JP, Fowler NE, van der Woude LHV, Goosey-Tolfrey VL. Wheelchair propulsion: Effects of experience and
push strategy on efficiency and perceived exertion. Appl Physiol Nutr Metab 2008; 33: 870-879.
12 de Groot S, Veeger DHEV, Hollander AP, van der Woude LHV. Effect of wheelchair stroke pattern on mechanical
efficiency. Am J Phys Med Rehab 2004; 83(3): 640-649.
13 Dallmeijer AJ. Hand-rim wheelchair propulsion capacity during rehabilitation of persons with spinal cord injury. J
Rehabil Res Dev 2005; 42(3 suppl 1): 65-73.
14 Haisma JA, Bussmann JB, Stam HJ, Sluis TA, Bergen MP, Dallmeijer AJ, de Groot S, van der Woude LHV. Changes in
physical capacity during and after inpatient rehabilitation in subjects with a spinal cord injury. Arch Phys Med Rehabil
2006; 87(6): 741-748.
15 van der Woude LHV, Veeger HEJ, Rozendal RH, Sargeant AJ. Optimum cycle frequencies in hand-rim wheelchair
propulsion. Wheelchair propulsion technique. Eur J Appl Physiol Occup Physiol 1989; 58: 625-632.
16 Goosey VL, Campbell IG, Fowler NE. Effect of push frequency on the economy of wheelchair racers. Med Sci Sports
Exerc 2000; 32(1): 174-181.
17 Lenton JP, van der Woude LHV, Fowler NE, Goosey-Tolfrey VL. Effects of arm frequency during synchronous and
asynchronous wheelchair propulsion on efficiency. Int J Sports Med 2009; 30: 233-239.
Synchronous vs. Asynchronous push strategies Chapter 5
96
18 Boninger ML, Koontz AM, Sisto SA, Dyson-Hydson TA, Chang M, Price R, Cooper RA. Pushrim biomechanics and
injury prevention in spinal cord injury: recommendations based on CULP-SCI investigations. J Rehabil Res Dev 2005;
42(3 suppl 1): 9-19.
19 Glaser RM, Sawka MN, Young RE, Suryaprasad AG. Applied physiology for wheelchair design. J Physiol 1980; 48:
41-44.
20 Lenton JP, Fowler NE, van der Woude LHV, Goosey-Tolfrey VL. Efficiency of wheelchair propulsion and effects of
strategy. Int J Sports Med 2008; 29: 384-389.
21 Veeger HE, van der Woude LHV, Rozendal RH. A computerized wheelchair ergometer: Results of a comparison
study. Scan J Rehabil Med 1992; 24(1): 17-23.
22 Kotajarvi BR, Basford JR, An K, Morrow DA, Kaufman KR. The effect of visual biofeedback on the propulsion
effectiveness of experienced wheelchair users. Arch Phys Med Rehabil 2006; 87: 510-515.
23 Cooper RA. SmartWheel: From concept to clinical practice. Prosthet Orthot Int 2009; 33(3): 198-209.
24 Cowan RE, Boninger ML, Sawatzky BJ, Mazoyer BD, Cooper RA. Preliminary outcomes of the SmartWheel users’
group database: A proposed framework for clinicians to objectively evaluate manual wheelchair propulsion. Arch
Phys Med Rehabil 2008; 89: 260-268.
25 Theisen D, Francaux M, Fayt A, Sturbois X. A new procedure to determine external power output during hand-rim
propulsion on a roller ergometer: A reliability study. Int J Sports Med 1996; 17: 564-571.
26 Borg G. Perceived exertion as an indicator of somatic stress. Scan J Rehab Med 1970; 2(2): 92-98.
27 Perronet F, Massicote D. Table of non-protein respiratory quotient: an update. Can J Sport Sci 1991; 16: 23-29.
28 Boninger ML, Baldwin M, Cooper RA, Koontz A, Chan L. Manual wheelchair pushrim biomechanics and axle
position. Arch Phys Med Rehabil 2000; 81(5); 608-613.
29 Vercruyssen F, Hausswirth C, Smith D, Brisswalter J. Effect of exercise duration on optimal pedalling rate choice in
triathletes. Can J Appl Physiol 2001; 26(1): 44-54.
30 Sparrow WA, Irizarry-Lopez VM. Mechanical efficiency and metabolic cost as measures of learning a novel gross
motor task. J Mot Behav 1987; 19(2): 240-264.
31 Almåsbakk B, Whiting HTA, Helgerud, J. The efficient learner. Biol Cybern 2001; 84: 75-83.
32 Amazeen PG, Amazeen EL, Beek PJ. Coupling of breathing and movement during manual wheelchair propulsion. J
Exper Psychol. Hum Percept Perform 2001; 27(5): 1243-1259.
33 Sparrow WA, Newell KM. Metabolic energy expenditure and the regulation of movement economy. Psychonomic
Bulletin & Review 1998; 5(2): 173-196.
34 Cox MH, Miles DS, Verde TJ, Nessenthaler G. Influence of pedal frequency on the lactate threshold of elite cyclists.
Med. Sci. Sports Exerc 1994; 26:S67.
35 Goosey-Tolfrey VL, Kirk JH. Effect of push frequency and strategy variations on economy and perceived exertion
during wheelchair propulsion. Eur J Appl Physiol 2002; 90: 154-158.
36 de Groot S, Dallmeijer AJ, van Asbeck FWA, Post MWN, Bussmann JBJ, van der Woude LHV. Mechanical efficiency
and wheelchair performance during and after spinal cord injury rehabilitation. Int J Sports Med 2007; 28: 880-886.
37 Waterhouse J, Hudson P, Edwards B. Effects of music tempo upon sub-maximal cycling performance. Scand J Med
Sci Sports 2010; 20(4): 662 – 669.
Synchronous vs. Asynchronous push strategies Chapter 6
97
Chapter 6
Hand-rim forces and gross mechanical efficiency at various frequencies of wheelchair propulsion International Journal of Sports Medicine (2012); in revision. John P. Lenton1,3, Lucas HV. Van der Woude2, Neil E. Fowler3, Graham Nicholson4, Keith Tolfrey1, Victoria L. Goosey-Tolfrey1,3
Abstract To determine the effects of push frequency changes on force application, fraction of effective
force (FEF) and gross efficiency (GE) during hand-rim propulsion. Eight male able-bodied
participants performed five 4-minute sub-maximal exercise bouts at 1.8 m·s-1; the freely chosen
frequency (FCF), followed by four counter-balanced trials at 60, 80, 120 and 140% FCF. Kinetic
data was obtained using a SMARTWheel, measuring forces and moments. The GE was determined
as the ratio of external work done and the total energy expended. Increased push frequency led
to reductions in peak resultant force (P < 0.05), ranging from 167 to 117N and peak tangential
force (P < 0.05), ranging from 117 to 77N. However, FEF only demonstrated a significant
difference between 60% and 140% FCF (69 ± 9% and 63 ± 7 respectively; P < 0.05). Work per cycle
decreased significantly (P < 0.05) and rate of force development increased significantly (P < 0.05)
with increased push frequency. GE values were significantly lower at 60%, 120% and 140% FCF
than 80% and 100% FCF (P < 0.05). No meaningful associations were present between FEF and GE.
Under the current testing conditions, changes in push frequency are accompanied with changes in
the absolute force values, albeit without changes in either the gross pattern/trend of force
application or FEF. Changes in GE are not explained by different levels of force effectiveness.
1Peter Harrison Centre for Disability Sport, School of Sport, Exercise & Health Sciences, Loughborough University, Loughborough, UK. 2Center for Human Movement Sciences, University Medical Center Groningen, University of Groningen, Groningen, Netherlands. 3Department of Exercise & Sport Science, Manchester Metropolitan University, MMU Cheshire, Crewe, England, UK. 4ASPIRE Centre for Disability Sciences, Institute of Orthopaedics and Musculoskeletal Science, University College, London, England, UK.
Synchronous vs. Asynchronous push strategies Chapter 6
98
Introduction
A large majority of individuals with spinal cord injuries or lower limb disabilities are
dependent upon the use of a manual wheelchair for both daily living and sporting activities.
However, the gross efficiency (GE), this being the ratio of the external work done and the total
energy expended, of hand-rim propulsion remains somewhat low. Reported GE values range
anywhere from 2 to 11% for studies involving able-bodied individuals as well as inexperienced and
experienced wheelchair users [13, 17, 30, 34]. In contrast, other forms of upper body locomotion,
such as arm cranking [19] and hand-cycling [31] report much greater GE with values commonly
ranging from 14 to 19%. The underlying reasons for this remain a topic of interest for research in
both rehabilitation and sports environments.
Previous literature has reported GE to be highly influenced by propulsion conditions, such as
hand-rim velocity and rolling resistance [30, 34, 37], wheelchair configuration including propulsion
mechanism [35], seat height [33], wheel camber [20], wheel size [21] and differences in motor
skills or expertise [10, 11, 17]. Propulsion technique in particular has been shown to be influenced
by the push strategy employed; propulsion mode and/or push frequency [8, 17, 18, 38]. These
latter studies have found lower arm frequencies to be associated with increased GE yet not always
optimised at an individual’s self-selected push frequency.
It has been suggested by clinical biomechanists that lower push frequencies are more
beneficial than higher frequencies for the health of the musculoskeletal system [3]. The rationale
behind this is that lower push frequencies allow for increased push time and a longer push stroke,
reducing the number of pushes required per unit of time. Consequently the number of coupling
and uncoupling actions of the hand to the hand-rim (as well as the idle recovery phases) is lower
as will be the overall segmental (thus muscle) accelerations. There is debate in the literature
whether larger forces and moments increase the probability of the risk of injury in wheelchair
users [4, 22, 28]. Despite this it would be reasonable to suggest that although the magnitude of
force required at lower push frequencies is greater, the rate of rise of these forces may be reduced
as a result of the increase in push time. It has been reported that the rate of force development in
wheelchair propulsion is related to the risk of injury [5]. Hence it appears to be beneficial for
wheelchair users to: (a) reduce peak hand-rim forces and or push frequency; as well as (b) reduce
the rate of rise of force during the push phase of the propulsion cycle to reduce the loading on the
joints of the upper body (shoulder, elbow and wrist) involved during propulsion.
When considering the force exerted on the hand-rim it is best described in terms of the radial,
axial and tangential components of the resultant (total) force. The radial and axial components
create friction between the hand and the hand-rim simultaneously to ensure a tangential force
component is applied to the hand-rim [29]. In guided movements, the forces that are applied by
Synchronous vs. Asynchronous push strategies Chapter 6
99
the hands do not directly influence the trajectory of the hands. The ratio of the tangential force
and the resultant force at the hand-rim gives an indication to what is known in the literature as
fraction of effective force (FEF) [30]. The theory of improved FEF from more tangentially directed
forces has, however, been disputed [2, 9, 33]. Efficiency is reduced slightly as a consequence of a
learned higher FEF [9]. The concept of FEF and its possible relationship with push frequency and
efficiency remains interesting. When mean external work remains constant and push frequency is
manipulated then reciprocal changes in the resultant and tangential forces would be anticipated.
However, increased push frequencies, above the self-selected frequency, could lead to
misdirected tangential forces to a larger extent hence we would report lower FEF at greater
frequencies. It is unclear how the ratio of the tangential and resultant forces is affected by push
frequency manipulation and whether or not there is an association with push frequency and/or
GE.
To our knowledge there is very little literature that has investigated the hand-rim forces
during wheelchair hand-rim propulsion under varying conditions of push frequency. Gaining an
insight into this type of information should assist our understanding of the relationship of
efficiency with push frequency and, extend what is already known in the area. Therefore, the
purpose of this study was twofold; 1) describe the force application profiles of hand-rim
propulsion at a range of push frequencies, 2) describe the relationship between force application
and GE. We hypothesise that: 1) an increased push frequency reduces absolute force application
parameters and FEF; 2) The rate of rise of force increases reciprocally with push frequency and 3)
GE decreases with push frequencies that exceed the freely chosen frequency (FCF).
Material and Methods Eight able-bodied male participants (22 ± 4 years) volunteered for this study and gave written
informed consent prior to participation following a detailed explanation of all testing procedures.
Body mass was recorded to the nearest 0.1 kg using a seated balance scale (Seca 710, Hamburg,
Germany) and seated height in the wheelchair was measured to the nearest 0.01m using a
portable height stadiometer. Participant physical characteristics are given in Table 6.1. Approval
for the study procedures was obtained from the University Research Ethics Committee and was
conducted in accordance with the Declaration of Helsinki and Ethical Standards in Sport and
Exercise Science Research [12]. Participants had prior experimental experience in wheelchair
exercise, but were not specifically trained in upper body sports activities or hand-rim wheelchair
propulsion.
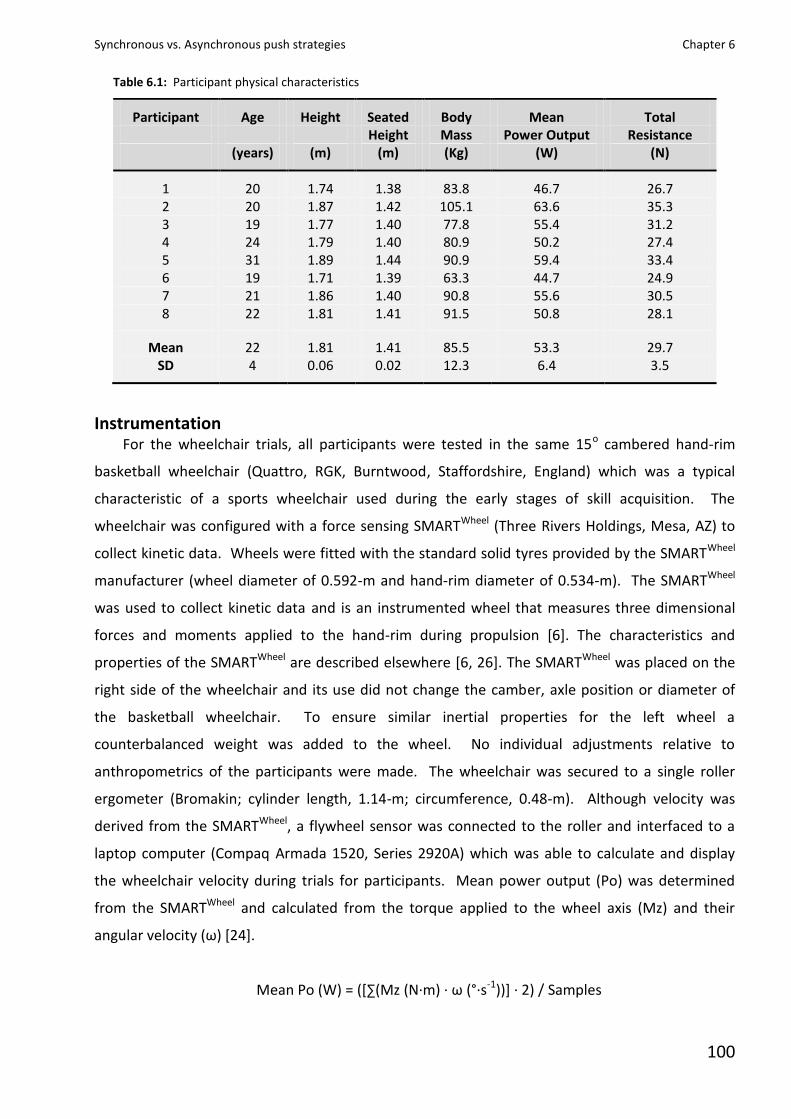
Synchronous vs. Asynchronous push strategies Chapter 6
100
Table 6.1: Participant physical characteristics
Participant Age Height Seated Body Mean Total Height Mass Power Output Resistance (years) (m) (m) (Kg) (W) (N)
1 20 1.74 1.38 83.8 46.7 26.7 2 20 1.87 1.42 105.1 63.6 35.3 3 19 1.77 1.40 77.8 55.4 31.2 4 24 1.79 1.40 80.9 50.2 27.4 5 31 1.89 1.44 90.9 59.4 33.4 6 19 1.71 1.39 63.3 44.7 24.9 7 21 1.86 1.40 90.8 55.6 30.5 8 22 1.81 1.41 91.5 50.8 28.1
Mean 22 1.81 1.41 85.5 53.3 29.7 SD 4 0.06 0.02 12.3 6.4 3.5
Instrumentation
For the wheelchair trials, all participants were tested in the same 15o cambered hand-rim
basketball wheelchair (Quattro, RGK, Burntwood, Staffordshire, England) which was a typical
characteristic of a sports wheelchair used during the early stages of skill acquisition. The
wheelchair was configured with a force sensing SMARTWheel (Three Rivers Holdings, Mesa, AZ) to
collect kinetic data. Wheels were fitted with the standard solid tyres provided by the SMARTWheel
manufacturer (wheel diameter of 0.592-m and hand-rim diameter of 0.534-m). The SMARTWheel
was used to collect kinetic data and is an instrumented wheel that measures three dimensional
forces and moments applied to the hand-rim during propulsion [6]. The characteristics and
properties of the SMARTWheel are described elsewhere [6, 26]. The SMARTWheel was placed on the
right side of the wheelchair and its use did not change the camber, axle position or diameter of
the basketball wheelchair. To ensure similar inertial properties for the left wheel a
counterbalanced weight was added to the wheel. No individual adjustments relative to
anthropometrics of the participants were made. The wheelchair was secured to a single roller
ergometer (Bromakin; cylinder length, 1.14-m; circumference, 0.48-m). Although velocity was
derived from the SMARTWheel, a flywheel sensor was connected to the roller and interfaced to a
laptop computer (Compaq Armada 1520, Series 2920A) which was able to calculate and display
the wheelchair velocity during trials for participants. Mean power output (Po) was determined
from the SMARTWheel and calculated from the torque applied to the wheel axis (Mz) and their
angular velocity (ω) *24+.
Mean Po (W) = (*∑(Mz (N·m) · ω (°·s-1))] · 2) / Samples
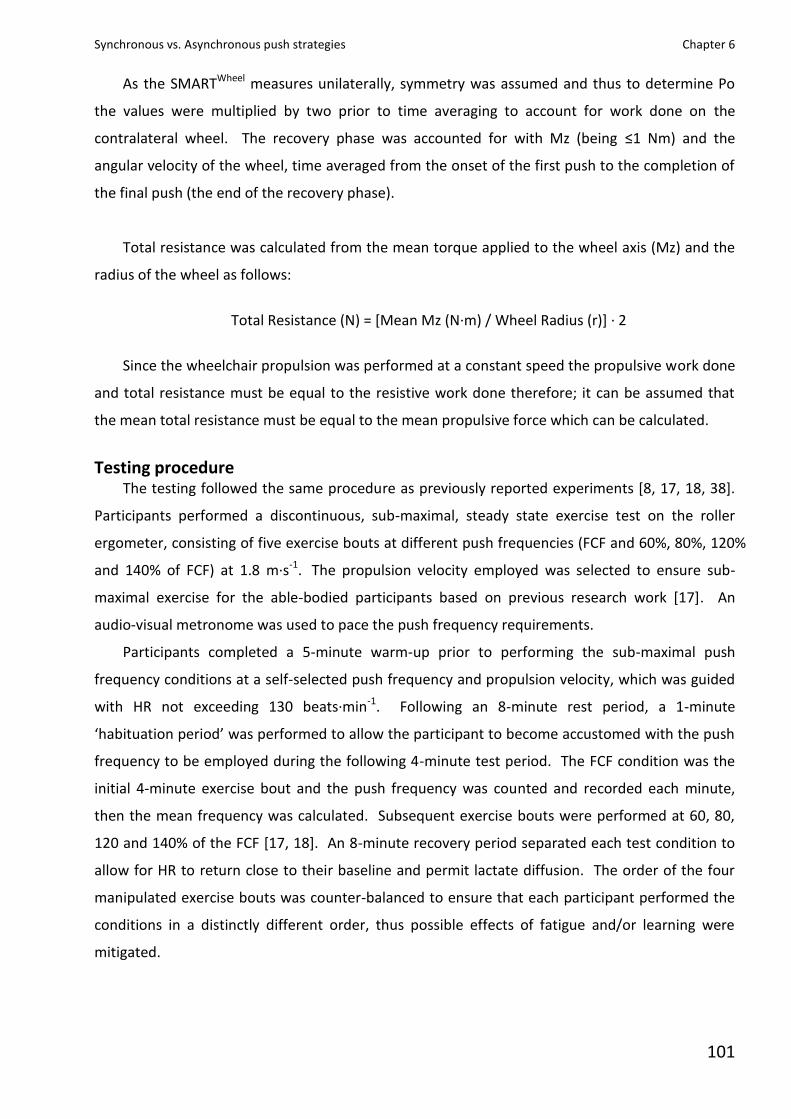
Synchronous vs. Asynchronous push strategies Chapter 6
101
As the SMARTWheel measures unilaterally, symmetry was assumed and thus to determine Po
the values were multiplied by two prior to time averaging to account for work done on the
contralateral wheel. The recovery phase was accounted for with Mz (being ≤1 Nm) and the
angular velocity of the wheel, time averaged from the onset of the first push to the completion of
the final push (the end of the recovery phase).
Total resistance was calculated from the mean torque applied to the wheel axis (Mz) and the
radius of the wheel as follows:
Total Resistance (N) = [Mean Mz (N·m) / Wheel Radius (r)] · 2
Since the wheelchair propulsion was performed at a constant speed the propulsive work done
and total resistance must be equal to the resistive work done therefore; it can be assumed that
the mean total resistance must be equal to the mean propulsive force which can be calculated.
Testing procedure The testing followed the same procedure as previously reported experiments [8, 17, 18, 38].
Participants performed a discontinuous, sub-maximal, steady state exercise test on the roller
ergometer, consisting of five exercise bouts at different push frequencies (FCF and 60%, 80%, 120%
and 140% of FCF) at 1.8 m·s-1. The propulsion velocity employed was selected to ensure sub-
maximal exercise for the able-bodied participants based on previous research work [17]. An
audio-visual metronome was used to pace the push frequency requirements.
Participants completed a 5-minute warm-up prior to performing the sub-maximal push
frequency conditions at a self-selected push frequency and propulsion velocity, which was guided
with HR not exceeding 130 beats·min-1. Following an 8-minute rest period, a 1-minute
‘habituation period’ was performed to allow the participant to become accustomed with the push
frequency to be employed during the following 4-minute test period. The FCF condition was the
initial 4-minute exercise bout and the push frequency was counted and recorded each minute,
then the mean frequency was calculated. Subsequent exercise bouts were performed at 60, 80,
120 and 140% of the FCF [17, 18]. An 8-minute recovery period separated each test condition to
allow for HR to return close to their baseline and permit lactate diffusion. The order of the four
manipulated exercise bouts was counter-balanced to ensure that each participant performed the
conditions in a distinctly different order, thus possible effects of fatigue and/or learning were
mitigated.
Synchronous vs. Asynchronous push strategies Chapter 6
102
Kinetic measures The forces and moments applied to the hand-rim were recorded for 30 seconds during the
final minute of each exercise bout. These kinetic data were obtained via an infrared wireless
transmitter at 240 Hz using the SMARTWheel in the research mode setting. All kinetic data were
filtered using the SMARTWheel manufacturer’s 32-tap finite impulse response (FIR) low pass digital
filter with a cut-off frequency of 20Hz. This process allowed for filtered forces and moments
applied for each push frequency to be determined.
For each push phase of the propulsion cycle, the SMARTWheel provided the unilateral forces (F)
and moments (M) in the three wheel-based reference planes, Fx – horizontally forward; Fy –
vertically downward; Fz – horizontally inwards; and Mz - referred to the moment produced around
the hub in the plane of the wheel [1, 6]. The beginning and end of the pushes were derived from
the Mz and was identified from the absolute value of 1Nm. The push starts when Mz was >1 Nm
and the end of the push was ≤1 Nm. The criteria for the push identification was written into a
custom excel spread sheet used for processing and analysis of all SW data.
The resultant force (FRES), which is the total force applied to the hand-rim, was calculated by
vector addition of Fx, Fy and Fz:
2z
2y
2x FFFFRES
(N) [6]
The tangential force (FTAN) which is the force directed tangential to the hand-rim, was
calculated from torque (Mz) and the hand-rim radius (Rr) and is defined as the ratio between the
two values, according to:
FTAN = Mz / Rr (N) [26]
The FEF on the hand-rims, by definition the ratio between the magnitude of the resultant
force applied and the tangential component was calculated for each push frequency and
expressed as a percentage.
FEF (%) = (FTAN / FRES) · 100 (%) [6]
The FEF was expressed as the Mean FEF; the continuous FEF of each individual push
throughout the duration. This was calculated for all complete pushes in each frequency condition
of the 30 second data collection period. In addition the rate of force development was calculated
as the ratio between the changes in FRES from the initial contact to the Peak FRES and the changes in
time between these two events [4]. All forces and moments were expressed as peak and mean
Synchronous vs. Asynchronous push strategies Chapter 6
103
values per push which were then averaged over the total number of pushes produced in the 30
second collection period.
Timing The temporal parameters associated with propulsion were calculated from the kinetic data.
Push times (PT) were defined as the amount of time that the hand exerted a positive torque
around the wheel axis. Recovery times (RT) were defined as the period of time between the end
of a push and the start of the next push. Consequently the cycle time (CT) is the summation of PT
and RT. The push angles (PA) were also derived and defined as the relative angle over which the
push occurs on the hand-rim.
Physiological measures Throughout the test, heart rate (HR) was monitored using short-range radio telemetry
(PE4000 Polar Sport Tester, Kempele, Finland). Expired air samples were collected and analysed
using the Douglas bag technique during the final minute of each condition. The concentrations of
oxygen and carbon dioxide in the expired air samples were determined using a paramagnetic
oxygen analyser (Series 1400, Servomex Ltd., Sussex, UK) and an infrared carbon dioxide analyser
(Series 1400, Servomex Ltd., Sussex, UK). Expired air volumes were measured using a dry gas
meter (Harvard Apparatus, Kent, UK) and corrected to standard temperature and pressure (dry).
Oxygen uptake ( ·VO2 ) and respiratory exchange ratio (RER) were calculated.
Efficiency Gross mechanical efficiency was calculated as the ratio of the external work to energy
expended during exercise. External work done (W) was determined from the power output (Po)
values derived from the SMARTWheel during the hand-rim wheelchair propulsion for all push
frequencies. The metabolic energy expenditure (E) was obtained from the product of ·VO2 and the
oxygen energetic equivalent derived from the RER and standard conversion tables [24]. The
following equation was used to calculate GE in accordance with previous literature [32]:
(%)100E
WGE
where W is the external work done; E is the total metabolic energy expended.
Statistical analysis The data were stored and analysed using the Predictive Analytics Software (PASW SPSS for
Windows Version 18; SPSS Inc., Chicago, USA). Data normality and homogeneity of variance were
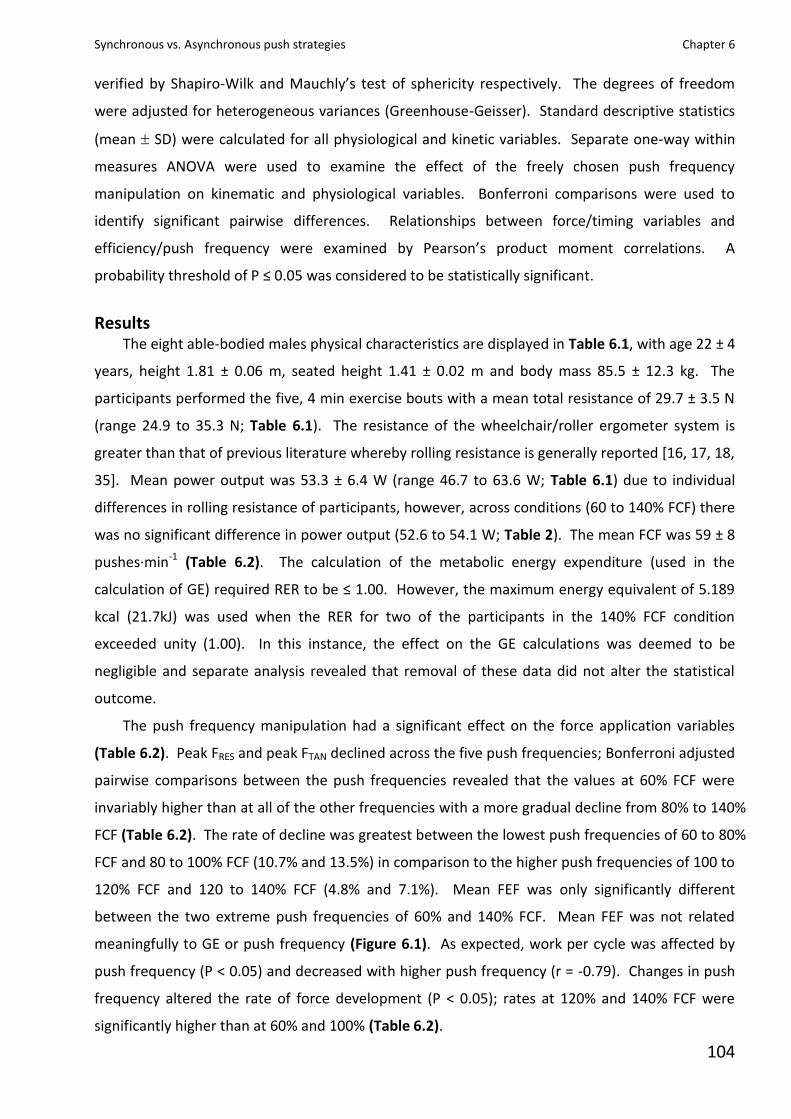
Synchronous vs. Asynchronous push strategies Chapter 6
104
verified by Shapiro-Wilk and Mauchly’s test of sphericity respectively. The degrees of freedom
were adjusted for heterogeneous variances (Greenhouse-Geisser). Standard descriptive statistics
(mean SD) were calculated for all physiological and kinetic variables. Separate one-way within
measures ANOVA were used to examine the effect of the freely chosen push frequency
manipulation on kinematic and physiological variables. Bonferroni comparisons were used to
identify significant pairwise differences. Relationships between force/timing variables and
efficiency/push frequency were examined by Pearson’s product moment correlations. A
probability threshold of P ≤ 0.05 was considered to be statistically significant.
Results The eight able-bodied males physical characteristics are displayed in Table 6.1, with age 22 ± 4
years, height 1.81 ± 0.06 m, seated height 1.41 ± 0.02 m and body mass 85.5 ± 12.3 kg. The
participants performed the five, 4 min exercise bouts with a mean total resistance of 29.7 ± 3.5 N
(range 24.9 to 35.3 N; Table 6.1). The resistance of the wheelchair/roller ergometer system is
greater than that of previous literature whereby rolling resistance is generally reported [16, 17, 18,
35]. Mean power output was 53.3 ± 6.4 W (range 46.7 to 63.6 W; Table 6.1) due to individual
differences in rolling resistance of participants, however, across conditions (60 to 140% FCF) there
was no significant difference in power output (52.6 to 54.1 W; Table 2). The mean FCF was 59 ± 8
pushes·min-1 (Table 6.2). The calculation of the metabolic energy expenditure (used in the
calculation of GE) required RER to be ≤ 1.00. However, the maximum energy equivalent of 5.189
kcal (21.7kJ) was used when the RER for two of the participants in the 140% FCF condition
exceeded unity (1.00). In this instance, the effect on the GE calculations was deemed to be
negligible and separate analysis revealed that removal of these data did not alter the statistical
outcome.
The push frequency manipulation had a significant effect on the force application variables
(Table 6.2). Peak FRES and peak FTAN declined across the five push frequencies; Bonferroni adjusted
pairwise comparisons between the push frequencies revealed that the values at 60% FCF were
invariably higher than at all of the other frequencies with a more gradual decline from 80% to 140%
FCF (Table 6.2). The rate of decline was greatest between the lowest push frequencies of 60 to 80%
FCF and 80 to 100% FCF (10.7% and 13.5%) in comparison to the higher push frequencies of 100 to
120% FCF and 120 to 140% FCF (4.8% and 7.1%). Mean FEF was only significantly different
between the two extreme push frequencies of 60% and 140% FCF. Mean FEF was not related
meaningfully to GE or push frequency (Figure 6.1). As expected, work per cycle was affected by
push frequency (P < 0.05) and decreased with higher push frequency (r = -0.79). Changes in push
frequency altered the rate of force development (P < 0.05); rates at 120% and 140% FCF were
significantly higher than at 60% and 100% (Table 6.2).
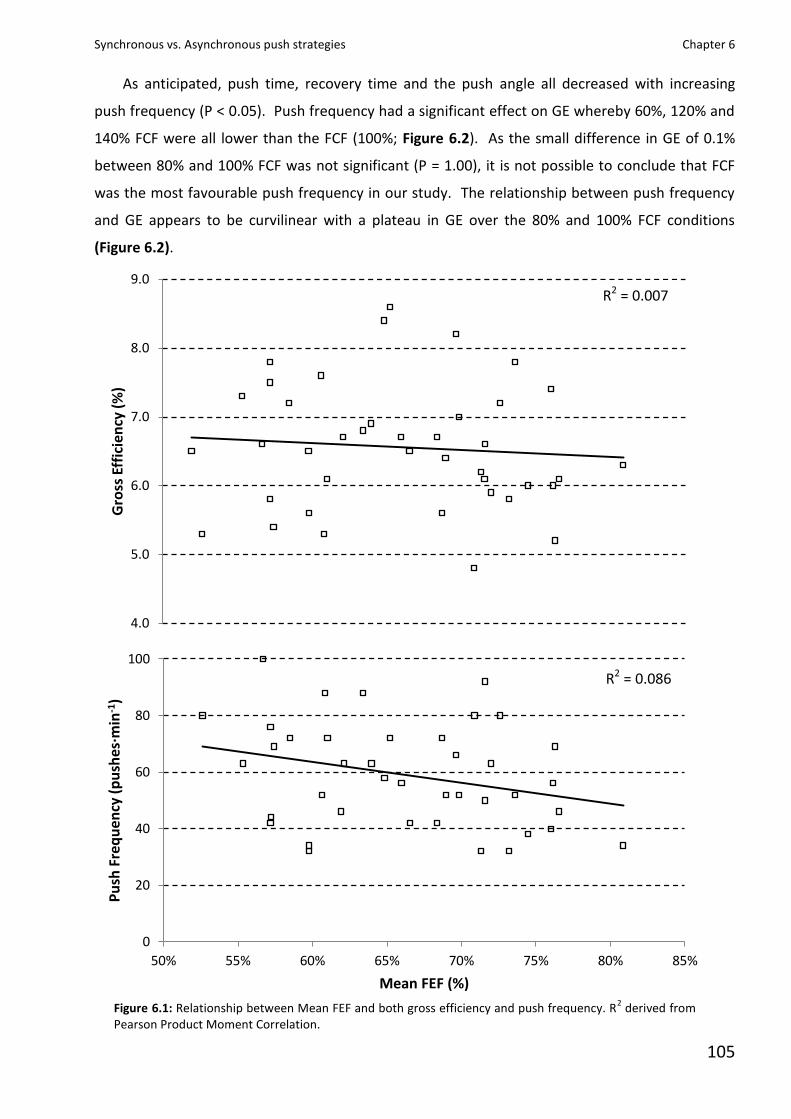
Synchronous vs. Asynchronous push strategies Chapter 6
105
As anticipated, push time, recovery time and the push angle all decreased with increasing
push frequency (P < 0.05). Push frequency had a significant effect on GE whereby 60%, 120% and
140% FCF were all lower than the FCF (100%; Figure 6.2). As the small difference in GE of 0.1%
between 80% and 100% FCF was not significant (P = 1.00), it is not possible to conclude that FCF
was the most favourable push frequency in our study. The relationship between push frequency
and GE appears to be curvilinear with a plateau in GE over the 80% and 100% FCF conditions
(Figure 6.2).
4.0
5.0
6.0
7.0
8.0
9.0
Gro
ss E
ffic
ien
cy (
%)
0
20
40
60
80
100
50% 55% 60% 65% 70% 75% 80% 85%
Pu
sh F
req
uen
cy (
pu
shes
·min
-1)
Mean FEF (%)
R2 = 0.007
R2 = 0.086
Figure 6.1: Relationship between Mean FEF and both gross efficiency and push frequency. R2 derived from
Pearson Product Moment Correlation.
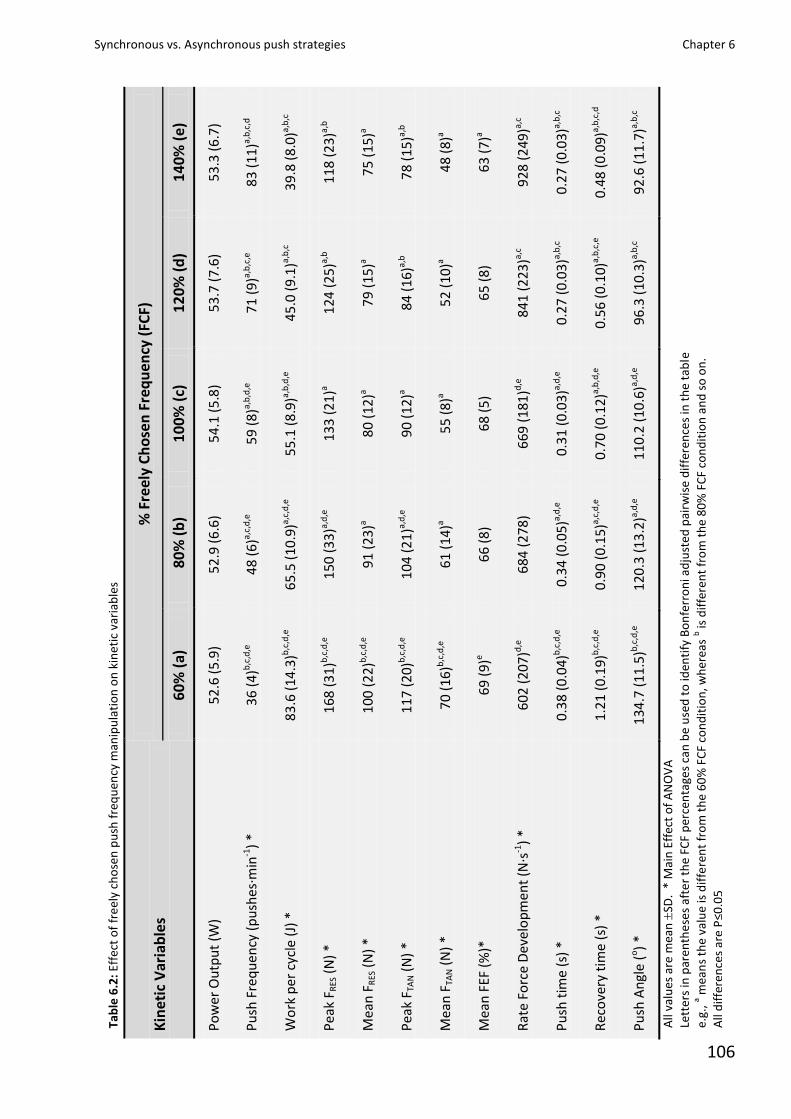
Synchronous vs. Asynchronous push strategies Chapter 6
106
Kin
etic
Var
iab
les
% F
reel
y C
ho
sen
Fre
qu
ency
(FC
F)
60
% (
a)
80
% (
b)
10
0%
(c)
1
20
% (
d)
14
0%
(e)
Po
we
r O
utp
ut
(W)
52
.6 (
5.9
) 5
2.9
(6
.6)
54
.1 (
5.8
) 5
3.7
(7
.6)
53
.3 (
6.7
)
Pu
sh F
req
uen
cy (
pu
shes
·min
-1)
* 3
6 (
4)b
,c,d
,e
48
(6
)a,c,
d,e
5
9 (
8)a,
b,d
,e
71
(9
)a,b
,c,e
8
3 (
11
)a,b
,c,d
Wo
rk p
er c
ycle
(J)
*
83
.6 (
14.3
)b,c
,d,e
6
5.5
(10
.9)a,
c,d
,e
55
.1 (
8.9
)a,b
,d,e
4
5.0
(9
.1)a,
b,c
39
.8 (
8.0
)a,b
,c
Pea
k F R
ES (
N)
* 1
68 (
31
)b,c
,d,e
1
50 (
33
)a,d
,e
133
(2
1)a
124
(2
5)a,
b
118
(2
3)a,
b
Mea
n F
RES
(N
) *
100
(2
2)b
,c,d
,e
91
(2
3)a
80
(1
2)a
79
(1
5)a
75
(1
5)a
Pea
k F T
AN (
N)
* 1
17 (
20
)b,c
,d,e
1
04 (
21
)a,d
,e
90
(1
2)a
84
(1
6)a,
b
78
(1
5)a,
b
Mea
n F
TAN (
N)
* 7
0 (
16
)b,c
,d,e
6
1 (
14
)a 5
5 (
8)a
52
(1
0)a
48
(8
)a
Mea
n F
EF (
%)*
6
9 (
9)e
66
(8
) 6
8 (
5)
65
(8
) 6
3 (
7)a
Rat
e F
orc
e D
evel
op
men
t (N
·s-1
) *
602
(2
07)d
,e
684
(2
78)
669
(1
81)d
,e
841
(2
23)a,
c 9
28 (
249
)a,c
Pu
sh t
ime
(s)
* 0
.38
(0
.04)
b,c
,d,e
0
.34
(0
.05)
a,d
,e
0.3
1 (
0.0
3)a,
d,e
0
.27
(0
.03)
a,b
,c
0.2
7 (
0.0
3)a,
b,c
Rec
ove
ry t
ime
(s)
* 1
.21
(0
.19)
b,c
,d,e
0
.90
(0
.15)
a,c,
d,e
0
.70
(0
.12)
a,b
,d,e
0
.56
(0
.10)
a,b
,c,e
0
.48
(0
.09)
a,b
,c,d
Pu
sh A
ngl
e (o
) *
134
.7 (
11.5
)b,c
,d,e
1
20.3
(13
.2)a,
d,e
1
10.2
(10
.6)a,
d,e
9
6.3
(10
.3)a,
b,c
92
.6 (
11.7
)a,b
,c
A
ll va
lues
are
mea
n
SD.
* M
ain
Eff
ect
of
AN
OV
A
Lett
ers
in p
aren
the
ses
afte
r th
e FC
F p
erce
nta
ges
can
be
use
d t
o id
enti
fy B
on
ferr
on
i ad
just
ed p
airw
ise
dif
fere
nce
s in
th
e ta
ble
e.g.
, a mea
ns
the
valu
e is
dif
fere
nt
fro
m t
he
60
% F
CF
con
dit
ion
, wh
erea
s b is
dif
fere
nt
fro
m t
he
80
% F
CF
con
dit
ion
an
d s
o o
n.
All
dif
fere
nce
s ar
e P
≤0.0
5
Tab
le 6
.2:
Effe
ct o
f fr
eel
y ch
ose
n p
ush
fre
qu
ency
man
ipu
lati
on
on
kin
etic
var
iab
les
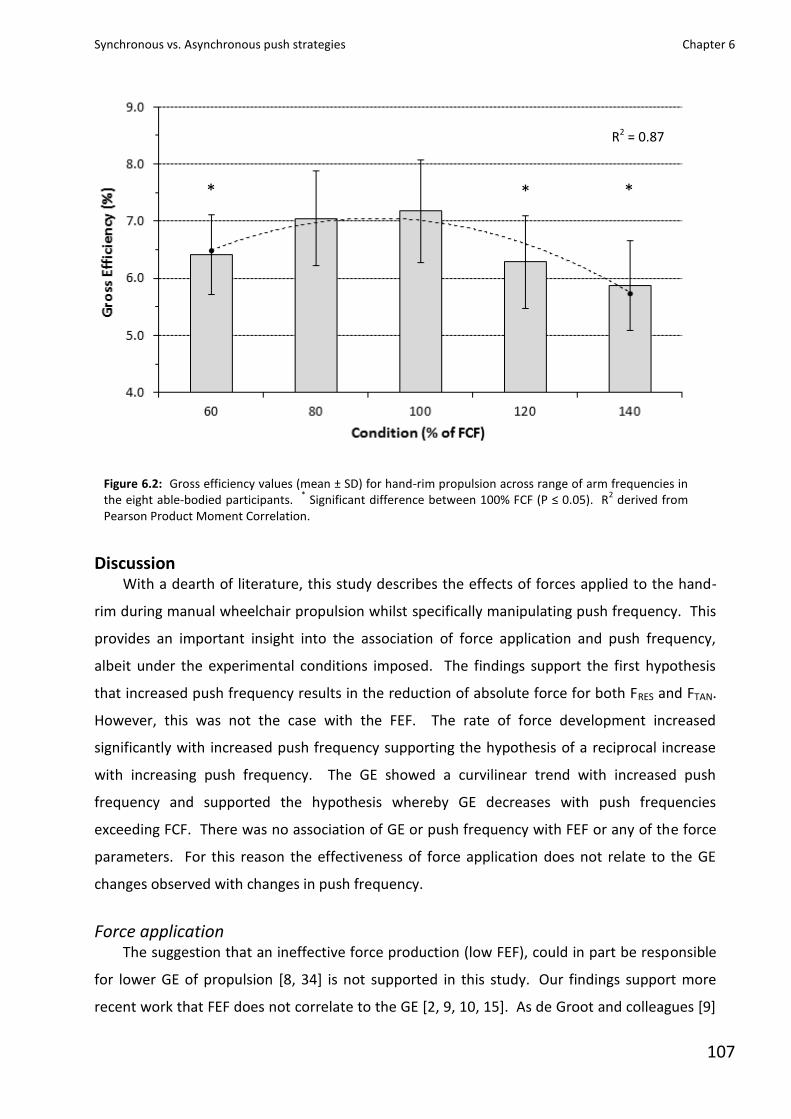
Synchronous vs. Asynchronous push strategies Chapter 6
107
Figure 6.2: Gross efficiency values (mean ± SD) for hand-rim propulsion across range of arm frequencies in the eight able-bodied participants.
* Significant difference between 100% FCF (P ≤ 0.05). R
2 derived from
Pearson Product Moment Correlation.
Discussion With a dearth of literature, this study describes the effects of forces applied to the hand-
rim during manual wheelchair propulsion whilst specifically manipulating push frequency. This
provides an important insight into the association of force application and push frequency,
albeit under the experimental conditions imposed. The findings support the first hypothesis
that increased push frequency results in the reduction of absolute force for both FRES and FTAN.
However, this was not the case with the FEF. The rate of force development increased
significantly with increased push frequency supporting the hypothesis of a reciprocal increase
with increasing push frequency. The GE showed a curvilinear trend with increased push
frequency and supported the hypothesis whereby GE decreases with push frequencies
exceeding FCF. There was no association of GE or push frequency with FEF or any of the force
parameters. For this reason the effectiveness of force application does not relate to the GE
changes observed with changes in push frequency.
Force application The suggestion that an ineffective force production (low FEF), could in part be responsible
for lower GE of propulsion [8, 34] is not supported in this study. Our findings support more
recent work that FEF does not correlate to the GE [2, 9, 10, 15]. As de Groot and colleagues [9]
R2 = 0.87
* * *
Synchronous vs. Asynchronous push strategies Chapter 6
108
have demonstrated, efficiency was lower with a forcefully induced higher FEF compared to a
lower FEF. The use of FEF as an indicator of efficient propulsion cannot be supported with the
current findings whereby push frequency was manipulated. It is clear that the most effective
propulsion technique from a kinetic / dynamic viewpoint (FEF) is not necessarily the most
efficient one. Bregman et al. [2] observed that the force direction during propulsion is a
compromise between efficiency and the constraints imposed by the wheelchair-user system.
They implied that training should not be aimed at the optimisation of the propulsion force
because this may be less efficient and more straining for the musculoskeletal system. Similarly
in a recent study on seat height [33] it was reported that simply improving mechanical
efficiency through seat height changes does not necessarily optimise the force application
characteristics and FEF.
Fraction of effective force across the push frequencies was not reflective of the efficiency.
The extreme ends of the push frequency scale (60% and 140% FCF) produced a significant
difference in FEF without significant changes in GE. The values of Mean FEF ranged from 63 ± 7%
at 140% FCF to 69 ± 9% at 60% FCF. These values of FEF are comparable with those found in
the literature for hand-rim propulsion in both able-bodied and spinal cord injured participants
[2, 7, 33], but slightly lower than the values found by Kotajarvi et al. [15] albeit under different
testing conditions. This relatively small and insignificant change in FEF across push frequency
may be the direct result of the fact that hand-rim propulsion is a guided movement. Increasing
push frequency resulted in lower resultant forces being applied to the hand-rim during
propulsion. Interestingly the reductions in peak resultant force were only significant when
comparing the 100%, 120% and 140% FCF conditions to the 60% and 80% FCF conditions. This
finding was despite the significant changes in push angle and push time throughout the
frequency conditions, therefore investigating the rate of force development would appear to
be important to help explain the relationship of force with push frequency. As push frequency
is manipulated, participants can be seen to adopt a consistent and stable model to satisfy the
movement requirements under the given task boundaries of each condition [27]. In each of the
different push frequency conditions, the general geometric orientation and co-ordination of the
overall upper body remains constant and the arms adapt to the altered frequency by regulating
the force magnitude but not its overall effectiveness, i.e. ratio of component forces. The
present study indicates that the rate of force development is significantly increased at the
higher frequencies. Boninger and colleagues [3, 4] associated increases in cadence, force
magnitude and rate of force development with an increased risk of injury. In the context of
push frequency it is important to know how this rate of force development is affected and its
associated risks. Reduction in push frequency results in a decreased rate of force development
Synchronous vs. Asynchronous push strategies Chapter 6
109
although the consequence of that are increased peak forces during each push. On the other
hand, higher push frequencies demonstrate smaller peak forces but subsequently higher rates
of force development more frequently. Therefore, the question remains as to which is better
for hand-rim wheelchair propulsion, as results show that the physiological efficiency is not
linked to the effectiveness of force application.
Push frequency manipulation results in changes to the cyclical timing and the push angles,
indicating a reduced push angle with higher push frequencies. Both of these variables are
assumed to be responsible for the changes seen in the resultant force applied because of the
requirement to maintain the same external workload and thus the production of more or less
work per push with a lower or higher push frequency (Table 2). Hence, at lower arm
frequencies there are higher resultant forces and as push frequency increases the resultant
force decreases, however, this resultant force is not significantly reduced statistically within the
arm frequency range of 100% to 140% FCF, although there is a trend for this to continue to
decrease and could be clinically significant. The results for peak resultant force and push angle
appear to be supported by similar findings in a population of wheelchair users, albeit using a
different methodological approach [25]. Richter and colleagues report a self-selected mean
cadence of 52 pushes·min-1 along with a decreased cadence (-10%) which are comparable to
the push frequencies of the current FCF and 80% FCF conditions. Importantly they revealed the
associated changes in peak resultant force and push angle were of a similar magnitude,
although the absolute peak resultant force was much lower [25]. Interestingly this study
reports the same relationship and changes in the tangential force; as a result FEF is not affected
significantly. Bregman et al. [2] suggested that propulsion technique is mainly determined by
the geometrical boundaries of the musculoskeletal system. In that context FEF is suggested to
be an invariant characteristic of the biological system, that only changes with extreme
geometric changes (i.e. seat height) or with continued learning and training where detailed fine
tuning is critical and will lead to (ultra) small long term shifts in FEF. Results of previous studies
indeed provide evidence for these notions [2, 9, 10, 15]. Our data support the notion that
adaptation to frequency involves a regulation of the force magnitude and movement velocity
but does not involve a fundamental shift in co-ordination strategy in this cyclic movement.
Gross efficiency The present study supports the findings of previous research into the effects of push
frequency on GE [8, 17, 18, 38], whereby it has been shown that higher push frequencies (>100%
FCF) reduce the GE of propulsion significantly. Unlike previous findings by Lenton et al. [17, 18]
the 60% FCF conditions GE was significantly lower, however, it was not possible to identify any
significant difference between the 80% and 100% FCF conditions. It is apparent that changes in
Synchronous vs. Asynchronous push strategies Chapter 6
110
GE with changes in push frequency are not a direct result of an altered FEF. It seems to be that
they must be associated with the different magnitude and frequency of de- / accelerations of
the arm segments and trunk, as well as the different ranges in segment excursion and thus
muscle contraction velocities, ranges and tension. Different push frequencies result in changes
in push angle, thus in the range of motion of the muscles, changes in the force-length/velocity
and length tension of the contracting muscles, thus influencing the energy required for the
contraction and production of work done against the hand-rim. The increased number of
recovery phases, couplings and un-couplings (and the associated small negative braking force
increases) increases energy expenditure, elicited from the increased work to move the arms.
The role that movement of the trunk and head segment plays during propulsion could offer
additional explanation as differences caused by push frequency manipulations may well affect
energy cost of the movements. Results of the current study suggest that in the current
experimental set-up, push frequencies in untrained subjects at or below FCF are close to
optimal energy cost.
Experimental considerations Able-bodied participants, with limited wheelchair experience, provided a relatively
homogenous participant group, not highly trained in any of the push frequencies. Importantly
they would be able to perform the exercise conditions sub-maximally, despite the larger power
output requirements as a result of the SMARTWheel use (smaller wheel and increased rolling
resistance with solid tyres). Able-bodied participants were used to negate the influence of
disability and the probable effects of limited arm or trunk function along with possible effects
of habituation and training at given arm frequencies. Use of a standardised basketball
wheelchair configuration eliminated any effects of different chair designs/setups, however, it is
accepted that this would have an effect on the relative geometry of the chair/user interface for
individuals, influencing the physiological demands, force production and propulsion mechanics
to that in a conventional daily wheelchair. Nevertheless it is felt that the trends and
relationships of the data would not alter significantly. Another consideration was the use of a
stationary wheelchair ergometer consisting of a single roller and fixed chain. This was an
important feature of the study allowing for the effects of force application in relation to arm
frequency manipulation to be investigated without the additional effects of coasting direction
(of the wheelchair), and thus the external work requirements. Importantly, the power output
across the arm frequencies is equal within each participant. The resistance of the
wheelchair/roller ergometer system is greater than previous published literature. The
increased resistance could be attributed to a number of factors: Firstly the camber of 15o is
significantly greater in the standardised basketball wheelchair than in propulsion studies using
Synchronous vs. Asynchronous push strategies Chapter 6
111
everyday wheelchairs. Secondly there is the use of the standard solid tyres provided by the
SMARTWheel manufacturer, which have a considerable higher rolling resistance than pneumatic
tyres [14, 16]. The third factor is the difference in roller ergometers whereby this study used a
single roller ergometer with a much smaller roller circumference than that of the split roller
ergometer with significantly greater roller circumference, hence greater resistance. The
combination of these factors will have contributed to the higher rolling resistance values
reported. The results of this study could be different under different testing conditions, for
example; reduced rolling resistance and in different populations of wheelchair users.
Conclusions In conclusion, increased push frequency generally resulted in a reduction in the absolute
values of the force parameters measured and consequently reduced push angle and decreased
work/cycle. The exception to this was the rate of force development which increased and FEF
remained somewhat unchanged. The FEF and force parameters studied did not reflect the
trend in GE of propulsion at different push frequencies, thus supporting current views on FEF
suggesting that FEF is invariant under the current testing conditions. Push frequency merely
affects the force components in such a way that the ratio of the tangential force to the
resultant force remains somewhat proportional to one another despite changes in push angle
and push time. Despite the GE of propulsion not being able to be linked directly with FEF it is
important to acknowledge the important relationship of force application with push frequency.
Results of the current study support previous findings that push frequencies in untrained
participants at or below FCF are close to optimal energy cost and efficiency. The practical
implications of these results are very important for wheelchair users, coaches or rehabilitation
practitioners because it demonstrates the effects that changes in push frequency have on the
push forces. Understanding the force changes that occur with changing frequency can support
wheelchair users in their choice of push frequency to adopt during daily activities and or sports.
Coaches and rehabilitation practitioners may well pay particular attention to the magnitude of
the forces and rate of force development for prescription purposes when working with a
wheelchair user with respect to the physical capacity of an individual.
Acknowledgements We are grateful to Prof. Martin Ferguson-Pell for the loan of the SMARTWheel (formerly ASPIRE
Chair University College London) and for the support and technical assistance of Dr. Graham
Nicholson whom we dedicate this work to. Graham was tragically killed in a motorcycle
accident in August 2006, a dear friend and work colleague.
Synchronous vs. Asynchronous push strategies Chapter 6
112
References 1 Asato KT, Cooper RA, Robertson RN, Ster, JF. SMART
Wheel: development and testing of a system for measuring
manual wheelchair propulsion dynamics. IEEE Trans Biomed Eng 1993; 40: 1320-1324.
2 Bregman DJJ, van Drongelen S, Veeger HEJ. Is effective force application in handrim wheelchair propulsion also
efficient? Clin Biomech 2009; 24: 13-19.
3 Boninger ML, Baldwin M, Cooper RA, Koontz A, Chan L. Manual wheelchair pushrim biomechanics and axle
position. Arch Phys Med Rehab 2000; 81: 608-613.
4 Boninger ML, Cooper RA, Baldwin MA, Shimada SD, Koontz A. Wheelchair pushrim kinetics: body weight and
median nerve function. Arch Phys Med Rehab 1999; 80: 910-915.
5 Boninger ML, Souza AL, Cooper RA, Fitzgerald SG, Koontz AM, Fay BT. Propulsion patterns and pushrim
biomechanics in manual wheelchair propulsion. Am J Phys Med Rehab 2002; 76: 420-426.
6 Cooper RA, Robertson RN, van Sickle DP, Boninger ML. Methods for determining three-dimensional wheelchair
pushrim forces and moments: a technical note. J Rehab Res Dev 1997; 34: 162-170.
7 Dallmeijer AJ, van der Woude LHV, Veeger HEJ, Hollander AP. Effectiveness of force application in manual
wheelchair propulsion in persons with spinal cord injuries. Am J Phys Med Rehab 1998; 77: 213-221.
8 Goosey VL, Campbell IG, Fowler NE. Effect of push frequency on the economy of wheelchair racers. Med Sci
Sports Exerc 2000; 32: 174-181.
9 de Groot S, Veeger HEJ, Hollander AP, van der Woude LHV. Consequence of feedback-based learning of an
effective hand rim wheelchair force production on mechanical efficiency. Clin Biomech 2002a; 17: 219-226.
10 de Groot S, Veeger HEJ, Hollander AP, van der Woude LHV. Wheelchair propulsion technique and mechanical
efficiency after 3 wk of practice. Med Sci Sports Exerc 2002b; 34: 756-766.
11 de Groot S, Veeger HEJ, Hollander AP, van der Woude LHV. Effect of wheelchair stroke pattern on mechanical
efficiency. Am J Phys Med Rehab 2004; 83: 640-649.
12 Harriss DJ, Atkinson G. International Journal of Sports Medicine – Ethical Standards in Sport and Exercise
Science Research. Int J Sports Med 2009; 30: 701 – 702.
13 Hintzy F, Tordi N. Mechanical efficiency during hand-rim wheelchair propulsion: effects of base-line subtraction
and power output. Clin Biomech 2004; 19: 343–349.
14 Kauzlarich JJ, van der Woude LHV, Hopman MTE, van Kemenade CH (eds). Biomedical aspects of manual
wheelchair propulsion: The state of the Art II, IOS Press, Amsterdam: Washington DC, 1999: 158-170.
15 Kotajarvi, BR, Basford JR, An KN, Morrow DA, Kaufman KR. The effect of visual biofeedback on the propulsion
effectiveness of experienced wheelchair users. Arch Phys Med Rehab 2006; 87: 510-515.
16 Kwarciak AM, Yarossi M, Ramanujan A, Dyson-Hidson TA, Sisto SA. Evaluation of wheelchair tire rolling
resistance using dynamometer-based coast down tests. J Rehab Res Dev 2009; 46(7): 931-938.
17 Lenton JP, Fowler NE, van der Woude LHV, Goosey-Tolfrey VL. Wheelchair propulsion: effects of experience
and push strategy on efficiency and perceived exertion. Appl Physiol Nutr Metab 2008; 33: 870-879.
18 Lenton JP, van der Woude LHV, Fowler NE, Goosey-Tolfrey VL. Effects of arm frequency during synchronous
and asynchronous wheelchair propulsion on efficiency. Int J Sports Med 2009; 30: 233-239.
Synchronous vs. Asynchronous push strategies Chapter 6
113
19 Marais G, Dupont L, Maillet M, Weisslans T, Vanvelcenaher J, Pelayo P. Cardiorespiratory and efficiency
responses during arm and leg exercises with spontaneously chosen crank and pedal rates. Ergonomics 2002; 45:
631-639.
20 Mason B, van der Woude LHV, de Groot S, Goosey-Tolfrey VL. The effects of camber on the ergonomics of
propulsion in wheelchair athletes. Med Sci Sports Exerc 2011; 43: 319-26.
21 Mason B, van der Woude LHV, Lenton JP, Goosey-Tolfrey VL. Effects of wheel and hand-rim diameter on sub-
maximal wheeling performance in elite wheelchair athletes. Med Sci Sports Exerc 2011; Jun 22: [Epub ahead of
print]. PMID: 21701409.
22 Mercer JL, Boninger M, Koontz A, Ren D, Dyson-Hudson T, Cooper R. Shoulder joint kinetics and pathology in
manual wheelchair users. Clin Biomech 2006; 21: 781-789.
23 Niesing R, Eijskoot F, Kranse R, den Ouden AH, Storm J, Veeger HJ, van der Woude LHV, Snijders CJ. Computer-
controlled wheelchair ergometer. Med Biol Eng Comput 1990; 28: 23-29.
24 Peronnet F, Massicotte D. Table of non-protein respiratory quotient: an update. Can J Sport Sci 1991; 16: 23-29.
25 Richter WM, Kwarciak AM, Guo L, Turner JT. Effects of single-variable biofeedback on wheelchair handrim
biomechanics. Arch Phys Med Rehabil 2011; 92: 572-577.
26 Robertson RN, Boninger ML, Cooper RA, Shimada SD. Pushrim forces and joint kinetics during wheelchair
propulsion. Arch Phys Med Rehab 1996; 77: 856-864.
27 Rozendaal LA, Veeger HEJ, van der Woude LHV. The push force pattern in manual wheelchair propulsion as a
balance between cost and effect. J Biomech 2000; 36: 239-247.
28 Subbarao JV, Klopfstein J, Turpin R. Prevalence and impact of wrist and shoulder pain in patients with spinal
cord injury. J Spinal Cord Med 1995; 18: 9-13.
29 Vanlandewijck Y, Theisen D, Daly D. Wheelchair propulsion biomechanics: implications for wheelchair sports.
Sports Med 2001; 31: 339-367.
30 Veeger HEJ, van der Woude LHV, Rozendal RH. Effect of hand-rim velocity on mechanical efficiency in
wheelchair propulsion. Med Sci Sports Exerc 1992; 24: 100-107.
31 Verellen J, Theisen D, Vanlandewijck Y. Influence of crank rate in hand cycling. Med Sci Sports Exerc 2004; 36:
1826-1831.
32 Whipp BJ, Wasserman K. Efficiency of muscular work. J Appl Physiol 1969; 26: 644-648.
33 van der Woude LH, Bouw A, van Wegen J, van As H, Veeger D, de Groot S. Seat height: effects on submaximal
hand rim wheelchair performance during spinal cord injury rehabilitation. J Rehab Med 2009; 41: 143-149.
34 van der Woude LHV, van der Hendrich KMM, Veeger HEJ, van Ingen Schenau GJ, Rozendal RH, de Groot G,
Hollander AP. Manual wheelchair propulsion: effects of power output on physiology and technique. Med Sci
Sports Exerc 1988a; 20: 70-78.
35 van der Woude LH, van Kranen E, Ariëns G, Rozendal RH, Veeger HE. Physical strain and mechanical efficiency
in hubcrank and handrim wheelchair propulsion. J Med Eng Tech 1995; 19: 123-131.
36 van der Woude LHV, Veeger HEJ, Dallmeijer AJ, Janssen TWJ, Rozendal LA. Biomechanics and physiology in
active manual wheelchair propulsion. Med Eng Phys 2001; 23: 713-733

Synchronous vs. Asynchronous push strategies Chapter 6
114
37 van der Woude LH, Veeger HE, Rozendal RH, van Ingen Schenau GJ, Rooth F, van Nierop P. Wheelchair racing:
effects of rim diameter and speed on physiology and technique. Med Sci Sports Exerc 1988b; 20: 492-500.
38 van der Woude LHV, Veeger HEJ, Rozendal RH, Sargeant AJ. Optimum cycle frequencies in hand-rim wheelchair
propulsion. Wheelchair propulsion technique. Eur J Appl Physiol Occup Physiol 1989; 58: 625-632.
Synchronous vs. Asynchronous push strategies Chapter 7
115
Chapter 7
Hand-rim forces and gross mechanical efficiency in asynchronous and synchronous wheelchair propulsion: a comparison John P. Lenton1,3, Lucas HV. Van der Woude2, Neil E. Fowler3, Graham Nicholson4, Keith Tolfrey1, Victoria L. Goosey-Tolfrey1,3
Abstract To describe and compare the force application characteristics of asynchronous (ASY) hand-rim
propulsion under different frequency conditions to that of synchronous (SYN) hand-rim propulsion
in able-bodied participants. Eight able-bodied participants performed two-sub-maximal exercise
tests using both propulsion modes on a wheelchair roller ergometer. Each test consisted of a
series of five, 4-minute exercise blocks at 1.8 m·s-1; initially at their freely chosen frequency (FCF),
followed by four counter-balanced trials at 60, 80, 120 and 140% FCF. Kinetic data was obtained
using a SMARTWheel, measuring forces and moments. The gross efficiency (GE) was determined as
the ratio of external work done and the total energy expended. The ASY propulsion produced
significantly higher force measures (P ≤ 0.05) and FEF (P = 0.016) compared to SYN push
frequencies, although no significant effect on GE. This trend continues with pair-matched push
frequencies (ASY80:SYN60, ASY100:SYN80, ASY120:SYN100 and ASY140:SYN120) as ASY propulsion resulted
in significantly higher FRES and FTAN values, as well as higher rates of force development (P ≤ 0.05),
whilst no significant differences in GE values. The ASY propulsion mode followed the same trend
with respect to push frequency as the SYN mode, with changes in push frequency accompanied by
changes in absolute force values. Changes in absolute force were achieved without alteration in
either the gross pattern of force application or FEF or GE for both ASY and SYN propulsion.
Matched push frequencies demonstrated significant differences in force parameters and non-
significant differences in GE, highlighting the effect of propulsion mode. ASY propulsion offers no
kinetic or physiological advantage during hand-rim wheelchair propulsion under current testing
conditions.
1Peter Harrison Centre for Disability Sport, School of Sport, Exercise & Health Sciences, Loughborough University, Loughborough, UK. 2Center for Human Movement Sciences, University Medical Center Groningen, University of Groningen, Groningen, The Netherlands. 3Department of Exercise & Sport Science, Manchester Metropolitan University, MMU Cheshire, Crewe, England, UK.
4ASPIRE Centre for Disability Sciences, Institute of Orthopaedics and Musculoskeletal Science, University College, London, England, UK.
Synchronous vs. Asynchronous push strategies Chapter 7
116
Introduction
It has been shown that the efficiency of alternate, asynchronous (ASY) and simultaneous,
synchronous (SYN) arm movements in hand-rim wheelchair propulsion are not significantly
different, at least in inexperienced able-bodied individuals [19] although Glaser and colleagues did
report a preference towards the ASY propulsion when examining the ratings of perceived exertion
[10]. Whilst the SYN mode is the more traditional method adopted by wheelchair users for
activities of daily living, the ASY mode is used by a substantial number of experienced wheelchair
sportsmen [19].
It has been suggested that the ASY mode of propulsion may be advantageous as it allows
greater continuity of the hand-rim force application, reducing fluctuations in the velocity profile
and therefore, the acceleration with each stroke is reduced [10]. Interestingly, ASY limb
movement patterns are employed in other, more efficient, modes of locomotion (e.g. walking,
bicycling, and rowing) and may take advantage of inherent neural pathways for the reciprocal
stimulation of the contra-lateral muscle groups [9]. Despite there being no clear benefit reported
in terms of gross efficiency (GE) with ASY propulsion, this technique continues to be adopted in
everyday use and more so in sporting environments of wheelchair tennis and basketball. The ASY
mode requires a different range of motion and stability from the trunk in hand-rim wheelchair
propulsion [19, 20] and during handcycling [1]. The greater postural stability associated with ASY
propulsion has been noted to be seemingly due to trunk rotation over the pelvis during reciprocal
arm swing allowing easier maintenance of balance than the forward and back trunk motion used
during SYN propulsion in able-bodied individuals [9].
Both arm-cranking and handcycling have also investigated the physiological responses to SYN
and ASY cyclic arm exercise and there are some inconsistent findings. Research studies in
handcycling indicate better efficiency in SYN movement pattern [1, 8, 31], whereas in arm-
cranking it is the ASY movement pattern [12, 22). The conflicting findings could well be the
consequence of the combined effects of individual participant groups and different experimental
set-ups. In particular the difference between the two modalities, whereby hand-cycling
performance incorporates a steering element and arm-cranking is a stationary set-up.
Early research suggested that the low mechanical efficiency reported for wheelchair
propulsion could be attributed to what can be described as ineffective propulsion technique
whereby the direction of the propulsive force is non-optimal. This gave rise to the concept of the
fraction of effective force (FEF), the ratio between the magnitude of the tangentially directed
force and the total force applied to the handrim [29]. The hypothesis that increasing FEF would
improve efficiency has however, been disputed [6, 13, 32]. Previous research comparing
propulsion modes has predominantly focussed on manipulating the freely chosen frequency when
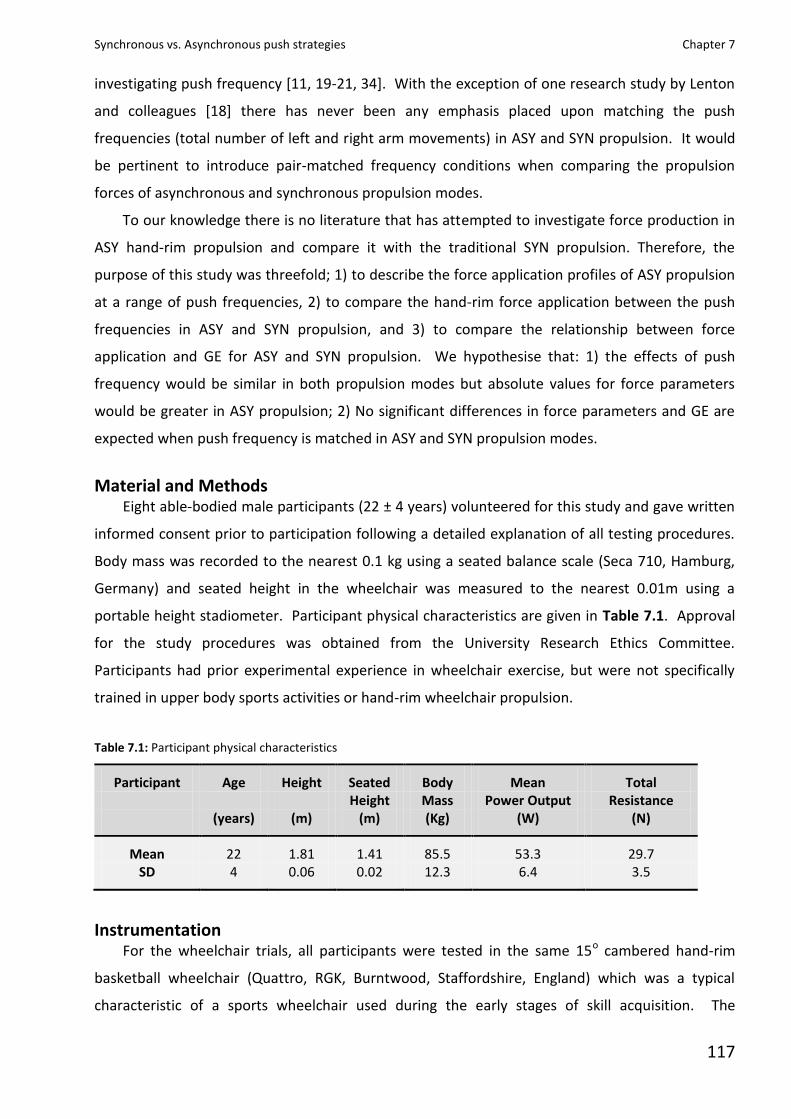
Synchronous vs. Asynchronous push strategies Chapter 7
117
investigating push frequency [11, 19-21, 34]. With the exception of one research study by Lenton
and colleagues [18] there has never been any emphasis placed upon matching the push
frequencies (total number of left and right arm movements) in ASY and SYN propulsion. It would
be pertinent to introduce pair-matched frequency conditions when comparing the propulsion
forces of asynchronous and synchronous propulsion modes.
To our knowledge there is no literature that has attempted to investigate force production in
ASY hand-rim propulsion and compare it with the traditional SYN propulsion. Therefore, the
purpose of this study was threefold; 1) to describe the force application profiles of ASY propulsion
at a range of push frequencies, 2) to compare the hand-rim force application between the push
frequencies in ASY and SYN propulsion, and 3) to compare the relationship between force
application and GE for ASY and SYN propulsion. We hypothesise that: 1) the effects of push
frequency would be similar in both propulsion modes but absolute values for force parameters
would be greater in ASY propulsion; 2) No significant differences in force parameters and GE are
expected when push frequency is matched in ASY and SYN propulsion modes.
Material and Methods Eight able-bodied male participants (22 ± 4 years) volunteered for this study and gave written
informed consent prior to participation following a detailed explanation of all testing procedures.
Body mass was recorded to the nearest 0.1 kg using a seated balance scale (Seca 710, Hamburg,
Germany) and seated height in the wheelchair was measured to the nearest 0.01m using a
portable height stadiometer. Participant physical characteristics are given in Table 7.1. Approval
for the study procedures was obtained from the University Research Ethics Committee.
Participants had prior experimental experience in wheelchair exercise, but were not specifically
trained in upper body sports activities or hand-rim wheelchair propulsion.
Table 7.1: Participant physical characteristics
Participant Age Height Seated Body Mean Total Height Mass Power Output Resistance (years) (m) (m) (Kg) (W) (N)
Mean 22 1.81 1.41 85.5 53.3 29.7 SD 4 0.06 0.02 12.3 6.4 3.5
Instrumentation For the wheelchair trials, all participants were tested in the same 15o cambered hand-rim
basketball wheelchair (Quattro, RGK, Burntwood, Staffordshire, England) which was a typical
characteristic of a sports wheelchair used during the early stages of skill acquisition. The
Synchronous vs. Asynchronous push strategies Chapter 7
118
wheelchair was configured with a force sensing SMARTWheel (Three Rivers Holdings, Mesa, AZ) to
collect kinetic data. Wheels were fitted with the standard solid tyres provided by the SMARTWheel
manufacturer (wheel diameter of 0.592-m and hand-rim diameter of 0.534-m). The SMARTWheel
was used to collect kinetic data and is an instrumented wheel that measures three dimensional
forces and moments applied to the hand-rim during propulsion [2, 7]. The characteristics and
properties of the SMARTWheel are described elsewhere [7, 26]. The SMARTWheel was placed on the
right side of the wheelchair and its use did not change the camber, axle position or diameter of
the basketball wheelchair. To ensure similar inertial properties for the left wheel a
counterbalanced weight was added to the wheel. No individual adjustments relative to
anthropometrics of the participants were made. The wheelchair was secured to a single roller
ergometer (Bromakin; cylinder length, 1.14-m; circumference, 0.48-m). Although velocity was
derived from the SMARTWheel, a flywheel sensor was connected to the roller and interfaced to a
laptop computer (Compaq Armada 1520, Series 2920A) which was able to calculate and display
the wheelchair velocity during trials for participants. Mean power output (Po) was determined
from the SMARTWheel and calculated from the torque applied to the wheel axis (Mz) and their
angular velocity (ω) *23].
Mean Po (W) = (*∑ (Mz (N·m) · ω (°·s-1))] · 2) / Samples
As the SMARTWheel measures unilaterally, symmetry was assumed and thus to determine Po
the values were multiplied by two prior to time averaging to account for work done on the
contralateral wheel. The recovery phase was accounted for with Mz (being zero throughout) and
the angular velocity of the wheel, time averaged from the onset of the first push to the completion
of the final push (the end of the recovery phase).
Total resistance was calculated from the mean torque applied to the wheel axis (Mz) and the
radius of the wheel as follows:
Total Resistance (N) = [Mean Mz (N·m) / Wheel Radius (r)] · 2
Since the wheelchair propulsion was performed at a constant speed the propulsive work done
and total resistance must be equal to the resistive work done therefore; it can be assumed that
the mean total resistance must be equal to the mean propulsive force which can be calculated.
Testing procedure The testing followed the same procedure as previously reported experiments [11, 19, 20, 34].
Participants performed a discontinuous, sub-maximal, steady state exercise test on the roller
Synchronous vs. Asynchronous push strategies Chapter 7
119
ergometer, consisting of five exercise bouts at different push frequencies (FCF and 60%, 80%, 120%
and 140% of FCF) at 1.8 m·s-1. The propulsion velocity employed was selected to ensure sub-
maximal exercise for the able-bodied participants based on previous research work [19-21]. An
audio-visual metronome was used to pace the push frequency requirements.
Participants completed a 5-minute warm-up prior to performing the sub-maximal push
frequency conditions at a self-selected push frequency and propulsion velocity, which was guided
with HR not exceeding 130 beats·min-1. Following an 8-minute rest period, a 1-minute
‘habituation period’ was performed to allow the participant to become accustomed with the push
frequency to be employed during the following 4-minute test period. The FCF condition was the
initial 4-minute exercise bout and the push frequency was counted and recorded each minute,
then the mean frequency was calculated. Subsequent exercise bouts were performed at 60, 80,
120 and 140% of the FCF [19-21]. An 8-minute recovery period separated each test condition to
allow for HR to return close to their baseline and permit lactate diffusion. The order of the four
manipulated exercise bouts was counter-balanced to ensure that each participant performed the
conditions in a distinctly different order, thus possible effects of fatigue and/or learning were
mitigated.
Kinetic measures The forces and moments applied to the hand-rim were recorded for 30 seconds during the
final minute of each exercise bout. These kinetic data were obtained via an infrared wireless
transmitter at 240 Hz using the SMARTWheel in the research mode setting. All kinetic data were
filtered using the SMARTWheel manufacturer’s 32-tap finite impulse response (FIR) low pass digital
filter with a cut-off frequency of 20Hz. This process allowed for filtered forces and moments
applied for each push frequency to be determined.
For each push phase of the propulsion cycle, the SMARTWheel provided the unilateral forces (F)
and moments (M) in the three wheel-based reference planes, Fx – horizontally forward; Fy –
vertically downward; Fz – horizontally inwards; and Mz - referred to the moment produced around
the hub in the plane of the wheel [2, 7]. The beginning and end of the pushes were derived from
the Mz and was identified from the absolute value of 1Nm. The push starts when Mz was >1 Nm
and the end of the push was ≤1 Nm. The criteria for the push identification was written into a
custom excel spread sheet used for processing and analysis of all SW data.
The resultant force (FRES), which is the total force applied to the hand-rim, was calculated by
vector addition of Fx, Fy and Fz:
2z
2y
2x FFFFRES
(N) [7]
Synchronous vs. Asynchronous push strategies Chapter 7
120
The tangential force (FTAN) which is the force directed tangential to the hand-rim, was
calculated from torque (Mz) and the hand-rim radius (Rr) and is defined as the ratio between the
two values, according to:
FTAN = Mz / Rr (N) [26]
The FEF on the hand-rims, by definition the ratio between the magnitude of the resultant
force applied and the tangential component was calculated for each push frequency and
expressed as a percentage.
FEF (%) = (FTAN / FRES) · 100 (%) [7]
The FEF was expressed as the Mean FEF; the continuous FEF of each individual push
throughout the duration. This was calculated for all complete pushes in each frequency condition
of the 30 second data collection period. In addition the rate of force development was calculated
as the ratio between the changes in FRES from the initial contact to the Peak FRES and the changes in
time between these two events [4]. All forces and moments were expressed as peak and mean
values per push which were then averaged over the total number of pushes produced in the 30
second collection period.
Timing The temporal parameters associated with propulsion were calculated from the kinetic data.
Push times (PT) were defined as the amount of time that the hand exerted a positive torque
around the wheel axis. Recovery times (RT) were defined as the period of time between the end
of a push and the start of the next push. Consequently the cycle time (CT) is the summation of PT
and RT. The push angles (PA) were also derived and defined as the relative angle over which the
push occurs on the hand-rim.
Physiological measures Throughout the test, heart rate (HR) was monitored using short-range radio telemetry
(PE4000 Polar Sport Tester, Kempele, Finland). Expired air samples were collected and analysed
using the Douglas bag technique during the final minute of each condition. The concentrations of
oxygen and carbon dioxide in the expired air samples were determined using a paramagnetic
oxygen analyser (Series 1400, Servomex Ltd., Sussex, UK) and an infrared carbon dioxide analyser
(Series 1400, Servomex Ltd., Sussex, UK). Expired air volumes were measured using a dry gas
meter (Harvard Apparatus, Kent, UK) and corrected to standard temperature and pressure (dry).
Oxygen uptake ( ·VO2 ) and respiratory exchange ratio (RER) were calculated.
Synchronous vs. Asynchronous push strategies Chapter 7
121
Efficiency Gross mechanical efficiency was calculated as the ratio of the external work to energy
expended during exercise. External work done (W) was determined from the power output (Po)
values derived from the SMARTWheel during the hand-rim wheelchair propulsion for all push
frequencies. The metabolic energy expenditure (E) was obtained from the product of ·VO2 and the
oxygen energetic equivalent derived from the RER and standard conversion tables [24]. The
following equation was used to calculate GE in accordance with previous literature [30]:
(%)100E
WGE
where W is the external work done; E is the total metabolic energy expended.
Statistical analysis
The data were stored and analysed using the Predictive Analytics Software (PASW SPSS for
Windows Version 18; SPSS Inc., Chicago, USA). Data normality and homogeneity of variance were
verified by Shapiro-Wilk and Mauchly’s test of sphericity respectively. The degrees of freedom
were adjusted for heterogeneous variances (Greenhouse-Geisser). Standard descriptive statistics
(mean SD) were calculated for all physiological and kinetic variables. For analysis unmatched
push frequencies are ASY60:SYN60, ASY80:SYN80, ASY100:SYN100, ASY120:SYN120, ASY140:SYN140 and
matched push frequencies obtained from matching the absolute push frequencies in the
propulsion modes are ASY80:SYN60, ASY100:SYN80, ASY120:SYN100, ASY140:SYN120.
Separate one-way within measures ANOVA were used to examine the effect of the freely
chosen push frequency manipulation on kinematic and physiological variables for both ASY and
SYN propulsion. Subsequently separate one-way within 2-factor repeated measures ANOVA was
used to compare the unmatched and matched push frequency conditions of ASY and SYN
propulsion modes. Bonferroni comparisons were used to identify significant pairwise differences.
A probability threshold of P ≤ 0.05 was considered to be statistically significant.
Results At the propulsion velocity of 1.8m·s-1, the mean power output during ASY propulsion was 53.9
± 5.9. W (range 43.5 to 61.6 W) and rolling resistance on average was 30.2 ± 3.4 N. Similarly, the
SYN propulsion power output was 53.3 ± 6.4 W (range 44.7 to 63.6 W) and rolling resistance was
29.7 ± 3.5 N, were slightly lower but not significantly different. Participants performed all exercise
bouts sub-maximally (RER below 1.00), with the exception of two participants during the SYN 140%
FCF exercise condition producing an RER of 1.01 and 1.02 respectively. In this instance, the effect
Synchronous vs. Asynchronous push strategies Chapter 7
122
on the GE calculations was deemed to be negligible and separate analysis revealed that removal of
these data did not alter the outcome.
ASY vs. SYN propulsion mode
The main effects of propulsion mode, push frequency and interaction of propulsion mode and
frequency on force parameters are shown in Figure 7.1 (A-F), GE, work per cycle, push frequency
and kinematic parameters are shown in Figure 7.2 (A-F). Propulsion modes demonstrate the same
trends with respect to push frequency for FRES, FTAN (both peak and mean values), FEF and rate of
force development, whereas there is no significant interaction of push frequency and propulsion
mode. There is a significant effect for propulsion mode whereby all the measured force variables
were significantly higher in ASY than SYN propulsion. The trend in FEF for both ASY and SYN
propulsion was for it to decrease with increasing push frequency (74.2 – 71.1%, 69.1 – 62.6%;
respectively) with the ASY propulsion FEF consistently higher (Figure 7.1E). The mean FEF for ASY
propulsion (72.9 ± 5.2%) was significantly higher than in the SYN mode (66.3 ± 7.2%), P = 0.016.
The work per cycle was significantly affected by push frequency (P=0.001), demonstrating a linear
relationship in both propulsion modes. However, ASY values were significantly greater than SYN
values (P = 0.044) resulting in increased work done per propulsion cycle throughout the push
frequency manipulations. As expected, PT, RT and PA all decreased significantly with increasing
push frequency (P = 0.001) for both propulsion modes. Pairwise comparisons demonstrated
significantly lower (P = 0.001) GE for push frequency conditions below the FCF in ASY propulsion
and the highest push frequency of 140% FCF, whereas it was above the FCF in SYN propulsion and
the lower extreme push frequency of 60% FCF (P < 0.05).
Matched push frequency
The experimental protocol allowed for the comparison of propulsion modes whereby the
unilateral push frequency was more or less equal, see Figure 7.2E. Analysis of the matched push
frequencies resulted in non-significant differences in push frequency; ASY80:SYN60 (P = 0.317),
ASY100:SYN80 (P = 0.935), ASY120:SYN100 (P = 0.746) and ASY140:SYN120 (P = 0.315). Significantly
greater force parameters of Peak FRES, Mean FRES, Peak FTAN, Mean FTAN, FEF and Rate of force
development (P < 0.05) were found for the ASY propulsion mode. However, no significant
differences were seen in GE, work per cycle or recovery time (Figure 7.3) between the propulsion
mode combinations. Optimal efficiency was found in the range of SYN80:ASY100 and
SYN100:ASY120 (Figure 2C). Both these SYN:ASY combinations have an average push frequency of
between 48 and 59 pushes·min-1 at the propulsion velocity of 1.8m·s-1.
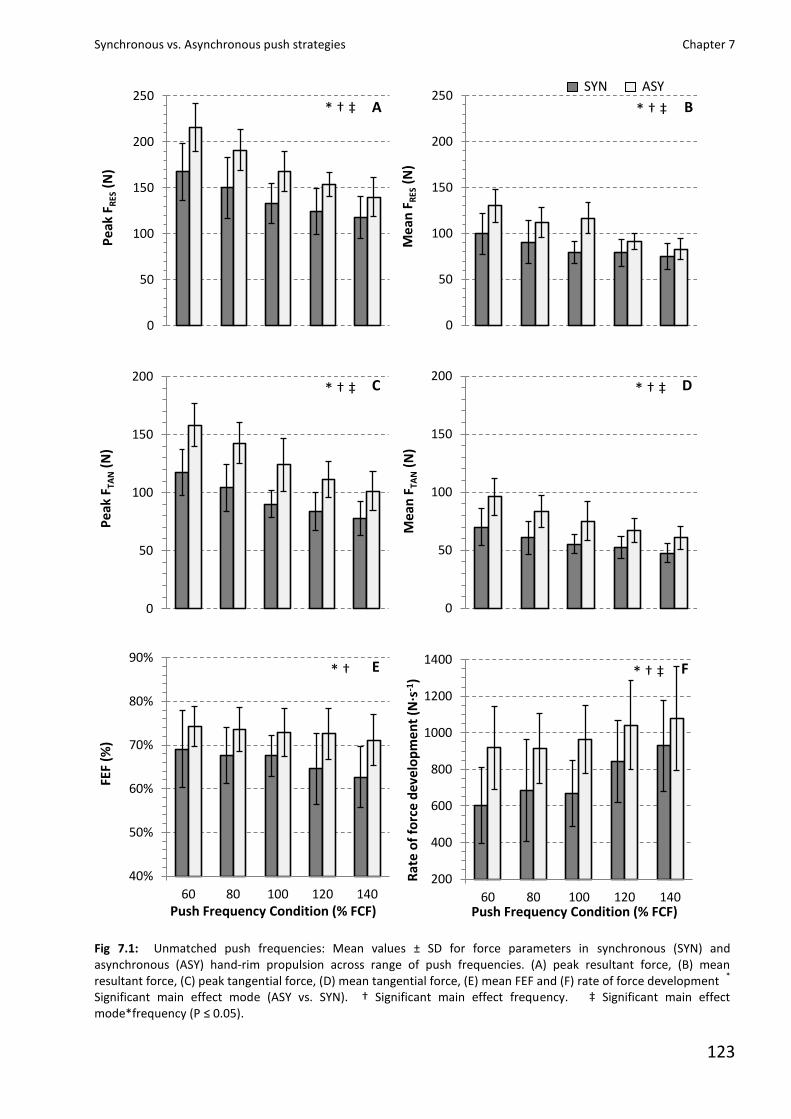
Synchronous vs. Asynchronous push strategies Chapter 7
123
Fig 7.1: Unmatched push frequencies: Mean values ± SD for force parameters in synchronous (SYN) and asynchronous (ASY) hand-rim propulsion across range of push frequencies. (A) peak resultant force, (B) mean resultant force, (C) peak tangential force, (D) mean tangential force, (E) mean FEF and (F) rate of force development
*
Significant main effect mode (ASY vs. SYN). † Significant main effect frequency. ‡ Significant main effect mode*frequency (P ≤ 0.05).
0
50
100
150
200
250P
eak
FR
ES (
N)
0
50
100
150
200
250
Mea
n F
RES
(N
)
0
50
100
150
200
Pe
ak F
TAN (
N)
0
50
100
150
200
Me
an F
TAN (
N)
40%
50%
60%
70%
80%
90%
60 80 100 120 140
FEF
(%)
Push Frequency Condition (% FCF)
200
400
600
800
1000
1200
1400
60 80 100 120 140
Rat
e o
f fo
rce
dev
elo
pm
en
t (N
·s-1
)
Push Frequency Condition (% FCF)
SYN ASY
A
C D
E F
B * † ‡ * † ‡
* † ‡ * † ‡
* † * † ‡
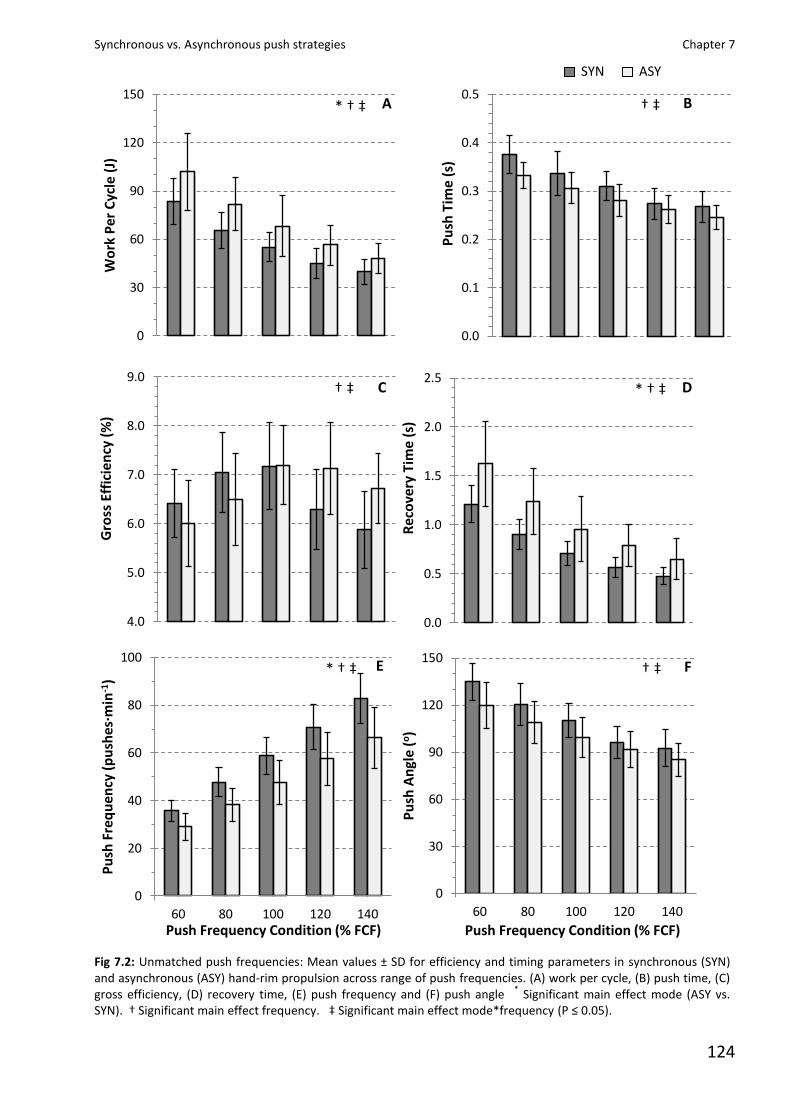
Synchronous vs. Asynchronous push strategies Chapter 7
124
Fig 7.2: Unmatched push frequencies: Mean values ± SD for efficiency and timing parameters in synchronous (SYN) and asynchronous (ASY) hand-rim propulsion across range of push frequencies. (A) work per cycle, (B) push time, (C) gross efficiency, (D) recovery time, (E) push frequency and (F) push angle
* Significant main effect mode (ASY vs.
SYN). † Significant main effect frequency. ‡ Significant main effect mode*frequency (P ≤ 0.05).
0
30
60
90
120
150W
ork
Per
Cyc
le (
J)
0.0
0.1
0.2
0.3
0.4
0.5
Pu
sh T
ime
(s)
4.0
5.0
6.0
7.0
8.0
9.0
Gro
ss E
ffic
ien
cy (
%)
0.0
0.5
1.0
1.5
2.0
2.5
Rec
ove
ry T
ime
(s)
0
20
40
60
80
100
60 80 100 120 140
Pu
sh F
req
uen
cy (
pu
shes
·min
-1)
Push Frequency Condition (% FCF)
0
30
60
90
120
150
60 80 100 120 140
Pu
sh A
ngl
e (o
)
Push Frequency Condition (% FCF)
SYN ASY
A * † ‡ B † ‡
D * † ‡ C † ‡
F † ‡ * † ‡ E
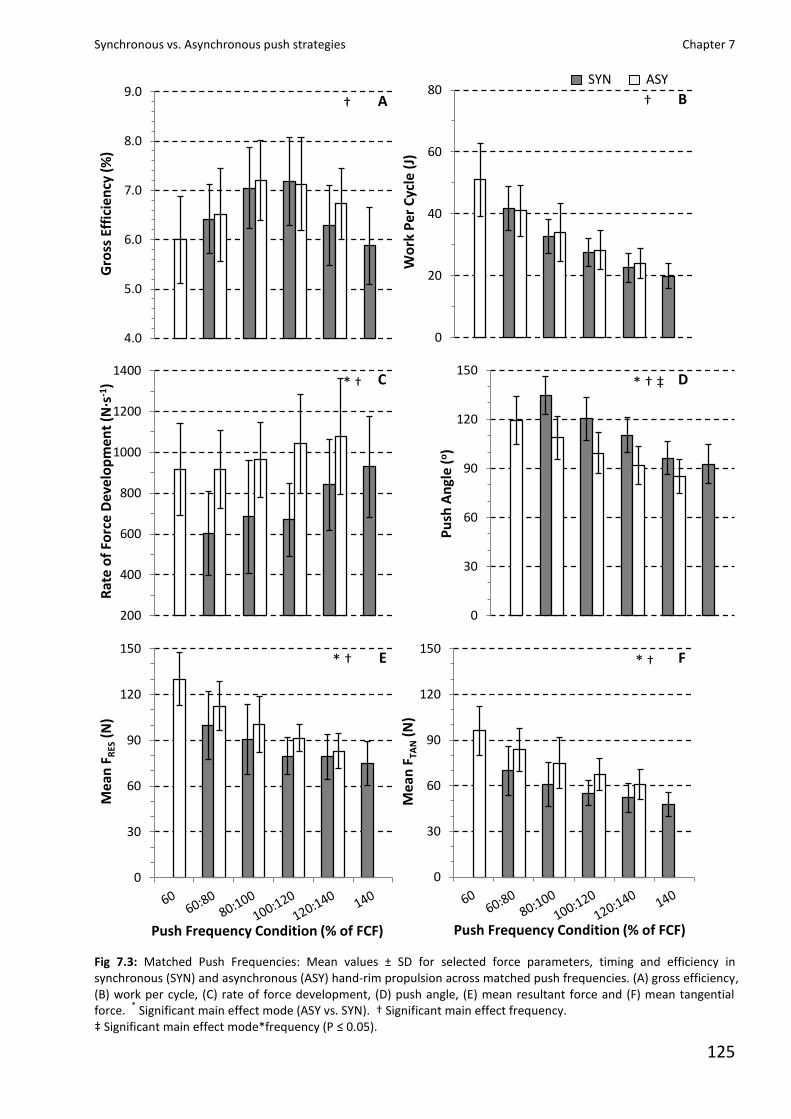
Synchronous vs. Asynchronous push strategies Chapter 7
125
Fig 7.3: Matched Push Frequencies: Mean values ± SD for selected force parameters, timing and efficiency in synchronous (SYN) and asynchronous (ASY) hand-rim propulsion across matched push frequencies. (A) gross efficiency, (B) work per cycle, (C) rate of force development, (D) push angle, (E) mean resultant force and (F) mean tangential force.
* Significant main effect mode (ASY vs. SYN). † Significant main effect frequency.
‡ Significant main effect mode*frequency (P ≤ 0.05).
4.0
5.0
6.0
7.0
8.0
9.0G
ross
Eff
icie
ncy
(%
)
0
20
40
60
80
Wo
rk P
er C
ycle
(J)
200
400
600
800
1000
1200
1400
Rat
e o
f Fo
rce
Dev
elo
pm
ent
(N·s
-1)
0
30
60
90
120
150
Pu
sh A
ngl
e (o
)
0
30
60
90
120
150
Me
an F
RES
(N
)
Push Frequency Condition (% of FCF)
0
30
60
90
120
150
Me
an F
TAN (
N)
Push Frequency Condition (% of FCF)
SYN ASY
A
C D
F
B † †
* † ‡ * †
* † * † E
Synchronous vs. Asynchronous push strategies Chapter 7
126
Discussion
To the authors’ knowledge, this study is the first to describe the forces applied during ASY
hand-rim wheelchair propulsion. In summary the data show: 1) a significant effect of push
frequency on force parameters in both ASY and SYN propulsion modes; 2) significantly greater
forces in the ASY propulsion mode; 3) no significant interaction (propulsion mode*push frequency)
for force parameters when absolute push frequency is pair matched in ASY and SYN propulsion
modes. In light of these findings we were able to accept both hypotheses 1) the effects of push
frequency are similar in both propulsion modes but absolute values for force parameters are
greater in ASY propulsion; 2) No significant differences in force parameters and GE are expected
when push frequency is matched in ASY and SYN propulsion modes.
ASY vs. SYN propulsion mode The Peak/Mean FRES and FTAN displayed identical trends with respect to push frequency for
both modes of propulsion. As push frequency increased (60% to 140% FCF), both the FRES and FTAN
decreased, although ASY propulsion produced significantly higher values at each push frequency.
This finding is the result of increased push frequency (60% to 140% FCF) and the requirement for
participants to maintain a constant velocity, hence work during each condition. With an increased
number of hand contacts it was possible to reduce the force per push necessary to achieve the
required work. The greater absolute values of ASY propulsion are a consequence of the lower
absolute frequencies used.
FEF remained more or less constant across push frequencies with reciprocal changes in FRES
and FTAN; however, there was a tendency for FEF to be slightly lower as the push frequency
increased although significant differences were only observed at the extreme push frequencies (60%
and 140% FCF). On the other hand the ASY propulsion mode showed a significantly superior FTAN
to FRES ratio, although despite the difference in FEF between modes, the FEF had no significant
association with trends in GE. This is supportive to recent work in the area suggesting that the
most efficient propulsion technique from a kinetic viewpoint is not necessarily the most efficient
from the physiological perspective [6, 13, 16, 28]. The relatively stable nature of FEF may be the
result of the push phase being a guided movement and no geometric changes to the
wheelchair/user interface, the magnitude of the resultant and tangential forces simply altered
without the ratio of the two changing. The magnitude of the required force is being controlled by
the push frequency, and the work required per stroke under the condition of a constant power
output.
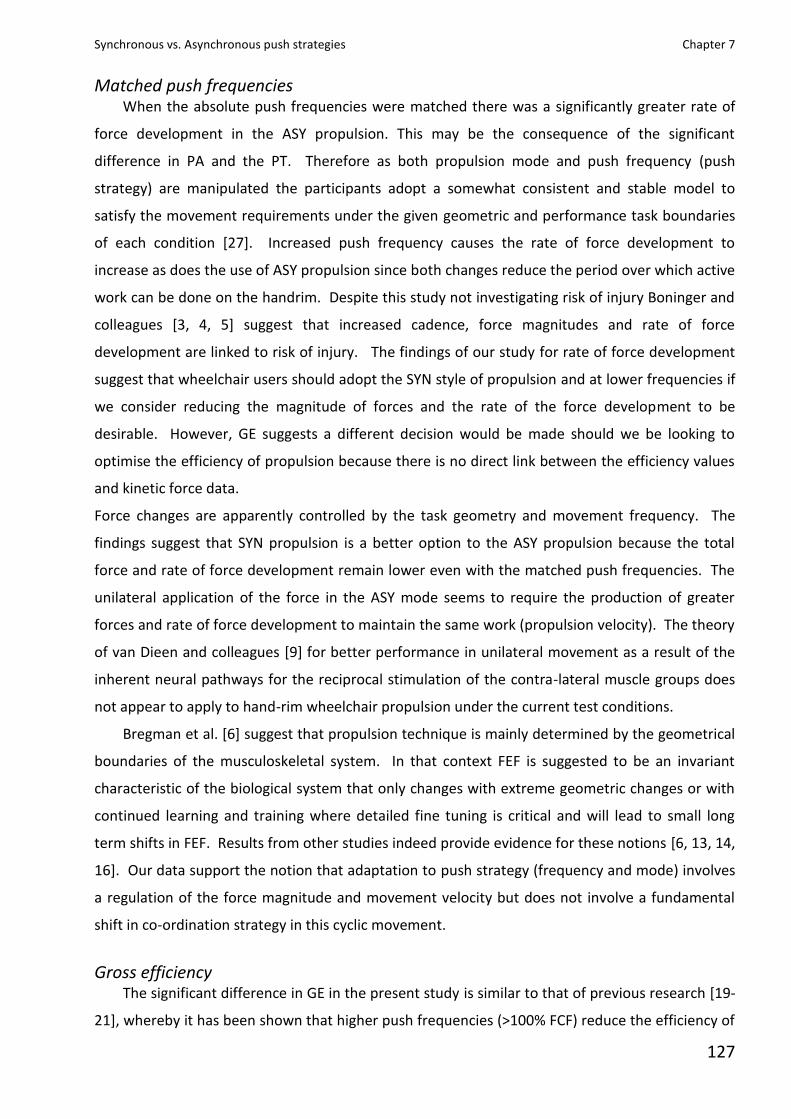
Synchronous vs. Asynchronous push strategies Chapter 7
127
Matched push frequencies When the absolute push frequencies were matched there was a significantly greater rate of
force development in the ASY propulsion. This may be the consequence of the significant
difference in PA and the PT. Therefore as both propulsion mode and push frequency (push
strategy) are manipulated the participants adopt a somewhat consistent and stable model to
satisfy the movement requirements under the given geometric and performance task boundaries
of each condition [27]. Increased push frequency causes the rate of force development to
increase as does the use of ASY propulsion since both changes reduce the period over which active
work can be done on the handrim. Despite this study not investigating risk of injury Boninger and
colleagues [3, 4, 5] suggest that increased cadence, force magnitudes and rate of force
development are linked to risk of injury. The findings of our study for rate of force development
suggest that wheelchair users should adopt the SYN style of propulsion and at lower frequencies if
we consider reducing the magnitude of forces and the rate of the force development to be
desirable. However, GE suggests a different decision would be made should we be looking to
optimise the efficiency of propulsion because there is no direct link between the efficiency values
and kinetic force data.
Force changes are apparently controlled by the task geometry and movement frequency. The
findings suggest that SYN propulsion is a better option to the ASY propulsion because the total
force and rate of force development remain lower even with the matched push frequencies. The
unilateral application of the force in the ASY mode seems to require the production of greater
forces and rate of force development to maintain the same work (propulsion velocity). The theory
of van Dieen and colleagues [9] for better performance in unilateral movement as a result of the
inherent neural pathways for the reciprocal stimulation of the contra-lateral muscle groups does
not appear to apply to hand-rim wheelchair propulsion under the current test conditions.
Bregman et al. [6] suggest that propulsion technique is mainly determined by the geometrical
boundaries of the musculoskeletal system. In that context FEF is suggested to be an invariant
characteristic of the biological system that only changes with extreme geometric changes or with
continued learning and training where detailed fine tuning is critical and will lead to small long
term shifts in FEF. Results from other studies indeed provide evidence for these notions [6, 13, 14,
16]. Our data support the notion that adaptation to push strategy (frequency and mode) involves
a regulation of the force magnitude and movement velocity but does not involve a fundamental
shift in co-ordination strategy in this cyclic movement.
Gross efficiency The significant difference in GE in the present study is similar to that of previous research [19-
21], whereby it has been shown that higher push frequencies (>100% FCF) reduce the efficiency of
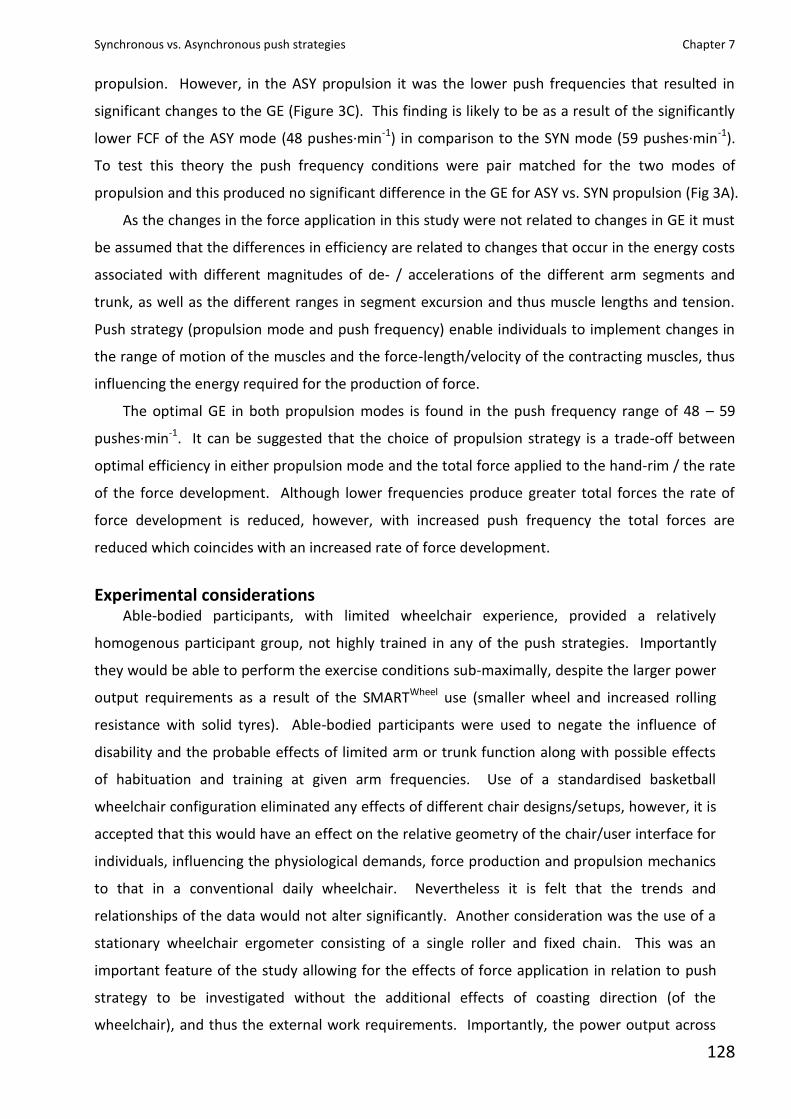
Synchronous vs. Asynchronous push strategies Chapter 7
128
propulsion. However, in the ASY propulsion it was the lower push frequencies that resulted in
significant changes to the GE (Figure 3C). This finding is likely to be as a result of the significantly
lower FCF of the ASY mode (48 pushes·min-1) in comparison to the SYN mode (59 pushes·min-1).
To test this theory the push frequency conditions were pair matched for the two modes of
propulsion and this produced no significant difference in the GE for ASY vs. SYN propulsion (Fig 3A).
As the changes in the force application in this study were not related to changes in GE it must
be assumed that the differences in efficiency are related to changes that occur in the energy costs
associated with different magnitudes of de- / accelerations of the different arm segments and
trunk, as well as the different ranges in segment excursion and thus muscle lengths and tension.
Push strategy (propulsion mode and push frequency) enable individuals to implement changes in
the range of motion of the muscles and the force-length/velocity of the contracting muscles, thus
influencing the energy required for the production of force.
The optimal GE in both propulsion modes is found in the push frequency range of 48 – 59
pushes·min-1. It can be suggested that the choice of propulsion strategy is a trade-off between
optimal efficiency in either propulsion mode and the total force applied to the hand-rim / the rate
of the force development. Although lower frequencies produce greater total forces the rate of
force development is reduced, however, with increased push frequency the total forces are
reduced which coincides with an increased rate of force development.
Experimental considerations Able-bodied participants, with limited wheelchair experience, provided a relatively
homogenous participant group, not highly trained in any of the push strategies. Importantly
they would be able to perform the exercise conditions sub-maximally, despite the larger power
output requirements as a result of the SMARTWheel use (smaller wheel and increased rolling
resistance with solid tyres). Able-bodied participants were used to negate the influence of
disability and the probable effects of limited arm or trunk function along with possible effects
of habituation and training at given arm frequencies. Use of a standardised basketball
wheelchair configuration eliminated any effects of different chair designs/setups, however, it is
accepted that this would have an effect on the relative geometry of the chair/user interface for
individuals, influencing the physiological demands, force production and propulsion mechanics
to that in a conventional daily wheelchair. Nevertheless it is felt that the trends and
relationships of the data would not alter significantly. Another consideration was the use of a
stationary wheelchair ergometer consisting of a single roller and fixed chain. This was an
important feature of the study allowing for the effects of force application in relation to push
strategy to be investigated without the additional effects of coasting direction (of the
wheelchair), and thus the external work requirements. Importantly, the power output across
Synchronous vs. Asynchronous push strategies Chapter 7
129
the push strategies is equal within each participant. The resistance of the wheelchair/roller
ergometer system is greater than previous published literature. The increased resistance could
be attributed to a number of factors: Firstly the camber of 15o is significantly greater in the
standardised wheelchair than in propulsion studies using everyday wheelchairs. Secondly there
is the use of the standard solid tyres provided by the SMARTWheel manufacturer, which have a
considerable higher rolling resistance than pneumatic tyres [15, 17]. Thirdly is difference in
roller ergometers whereby this study used a single roller ergometer with a much smaller roller
circumference than that of the split roller ergometer with significantly greater roller
circumference, hence greater resistance. The combination of these factors will have
contributed to the higher rolling resistance values reported. The results of this study could be
different under different testing conditions, for example; reduced rolling resistance and in
different populations of wheelchair users.
Conclusions In conclusion, the effect of push frequency in SYN and ASY propulsion modes displayed the
same relationship with force parameters. Increased push frequency resulted in decreased
absolute force and increased rate of force development. The FEF was unrelated to GE, thus
supporting the view that FEF is overwhelmingly governed by the user/chair geometry. The ASY
propulsion mode consistently required significantly greater absolute forces than the SYN mode.
With matched push frequencies (in propulsion modes) the interaction of mode and frequency
reported no significant differences, although propulsion mode in isolation continued to
demonstrate significantly greater force values in the ASY propulsion. The rate of force
development remained significantly higher in ASY propulsion which could be important in relation
to the risk of injury. The FEF remained consistently higher in ASY propulsion although without any
effect on GE.
Understanding how individuals apply forces to the hand-rim together with the effects of
propulsion mode and push frequency is important for determining intervention strategies.
Particularly if findings can help contribute to perhaps help reduce the levels of force exerted on
the upper extremity joints and limit the risk of injury whilst maintaining optimal levels of efficiency.
Future research is needed to investigate the relationship of push strategies under various
propulsion velocity and power output conditions aiming to optimise efficiency but minimise the
risk of injury.
Synchronous vs. Asynchronous push strategies Chapter 7
130
Acknowledgements We are grateful to Prof. Martin Ferguson-Pell for the loan of the SMARTWheel (formerly
ASPIRE Chair University College London) and for the support and technical assistance of Dr.
Graham Nicholson whom we dedicate this work to. Graham was tragically killed in a
motorcycle accident in August 2006, a dear friend and work colleague.
Synchronous vs. Asynchronous push strategies Chapter 7
131
References 1 Abel T, Kroner M, Rojas Vega S, Peters C, Klose C, Platen, P. Energy expenditure in wheelchair racing and
handbiking – a basis for prevention of cardiovascular diseases in those with disabilities. Eur J Cardiovasc Prev
Rehabil 2003; 10: 371-376.
2 Asato KT, Cooper RA, Robertson RN, Ster, JF. SMARTWheel
: development and testing of a system for measuring
manual wheelchair propulsion dynamics. IEEE Trans Biomed Eng 1993; 40: 1320-1324.
3 Boninger ML, Baldwin M, Cooper RA, Koontz A, Chan L. Manual wheelchair pushrim biomechanics and axle
position. Arch Phys Med Rehab 2000; 81: 608-613.
4 Boninger ML, Cooper RA, Baldwin MA, Shimada SD, Koontz A. Wheelchair pushrim kinetics: body weight and
median nerve function. Arch Phys Med Rehab 1999; 80: 910-915.
5 Boninger ML, Souza AL, Cooper RA, Fitzgerald SG, Koontz AM, Fay BT. Propulsion patterns and pushrim
biomechanics in manual wheelchair propulsion. Am J Phys Med Rehab 2002; 76: 420-426.
6 Bregman DJJ, van Drongelen S, Veeger HEJ. Is effective force application in handrim wheelchair propulsion also
efficient? Clin Biomech 2009; 24: 13-19.
7 Cooper RA, Robertson RN, van Sickle DP, Boninger ML. Methods for determining three-dimensional wheelchair
pushrim forces and moments: a technical note. J Rehab Res Dev 1997; 34: 162-170.
8 Dallmeijer AJ, van der Woude LHV, Veeger HEJ, Hollander AP. Effectiveness of force application in manual
wheelchair propulsion in persons with spinal cord injuries. Am J Phys Med Rehab 1998; 77: 213-221.
9 van Dieen JH, Ogita F, de Haan A. Reduced neural drive in bilateral exertions: a performance-limiting factor?
Med Sci Sports Exerc 2003; 35(1), 111-118.
10 Glaser RM, Sawka MN, Young RE, Suryaprasad AG. Applied physiology for wheelchair design. J Physiol 1980; 48:
41-44.
11 Goosey VL, Campbell IG, Fowler NE. Effect of push frequency on the economy of wheelchair racers. Med Sci
Sports Exerc 2000; 32: 174-181.
12 Goosey-Tolfrey VL, Sindall P. The effects of arm crank strategy on physiological responses and mechanical
efficiency during sub-maximal exercise. J Sports Sci 2007; 25(4): 453-460.
13 de Groot S, Veeger HEJ, Hollander AP, van der Woude LHV. Consequence of feedback-based learning of an
effective hand rim wheelchair force production on mechanical efficiency. Clin Biomech 2002a; 17: 219-226.
14 de Groot S, Veeger HEJ, Hollander AP, van der Woude LHV. Wheelchair propulsion technique and mechanical
efficiency after 3 wk of practice. Med Sci Sports Exerc 2002b; 34: 756-766.
15 Kauzlarich JJ, van der Woude LHV, Hopman MTE, van Kemenade CH (eds). Biomedical aspects of manual
wheelchair propulsion: The state of the Art II, IOS Press, Amsterdam: Washington DC, 1999: 158-170.
16 Kotajarvi, BR, Basford JR, An KN, Morrow DA, Kaufman KR. The effect of visual biofeedback on the propulsion
effectiveness of experienced wheelchair users. Arch Phys Med Rehab 2006; 87: 510-515.
17 Kwarciak AM, Yarossi M, Ramanujan A, Dyson-Hidson TA, Sisto SA. Evaluation of wheelchair tire rolling
resistance using dynamometer-based coast down tests. J Rehab Res Dev 2009; 46(7): 931-938.
18 Lenton JP, Fowler N, Woude L van der, Goosey-Tolfrey VL. Efficiency of wheelchair propulsion and effects of
strategy. Int J Sports Med 2007; 28: 1–6.
Synchronous vs. Asynchronous push strategies Chapter 7
132
19 Lenton JP, Fowler NE, van der Woude LHV, Goosey-Tolfrey VL. Wheelchair propulsion: effects of experience
and push strategy on efficiency and perceived exertion. Appl Physiol Nutr Metab 2008; 33: 870-879.
20 Lenton JP, van der Woude LHV, Fowler NE, Goosey-Tolfrey VL. Effects of arm frequency during synchronous
and asynchronous wheelchair propulsion on efficiency. Int J Sports Med 2009; 30: 233-239.
21 Lenton JP, van der Woude LHV, Fowler NE, Goosey-Tolfrey VL. Effects of 4 weeks asynchronous hand-rim
wheelchair practice on mechanical efficiency and timing
Disability and Rehabilitation 2010; 32(26): 2155-2164.
22 Mossberg K, Willman C, Topor MA, Crook H, Patak S. Comparison of asynchronous versus synchronous arm
crank ergometry. Spinal Cord 1999; 37: 569–574.
23 Niesing R, Eijskoot F, Kranse R, den Ouden AH, Storm J, Veeger HJ, van der Woude LHV, Snijders CJ. Computer-
controlled wheelchair ergometer. Med Biol Eng Comput 1990; 28: 23-29.
24 Peronnet F, Massicotte D. Table of non-protein respiratory quotient: an update. Can J Sport Sci 1991; 16: 23-29.
25 Rankin JW, Kwarciak AM, Mark Richter W, Neptune RR. The influence of altering push force effectiveness on upper
extremity demand during wheelchair propulsion. J Biomech 2010; 43(14): 2771-2779.
26 Robertson RN, Boninger ML, Cooper RA, Shimada SD. Pushrim forces and joint kinetics during wheelchair
propulsion. Arch Phys Med Rehab 1996; 77: 856-864.
27 Rozendaal LA, Veeger HEJ, van der Woude LHV. The push force pattern in manual wheelchair propulsion as a
balance between cost and effect. J Biomech 2000; 36: 239-247.
28 Vanlandewijck Y, Theisen D, Daly D. Wheelchair propulsion biomechanics: implications for wheelchair sports.
Sports Med 2001; 31: 339-367.
29 Veeger HEJ, van der Woude LHV, Rozendal RH. Effect of hand-rim velocity on mechanical efficiency in
wheelchair propulsion. Med Sci Sports Exerc 1992; 24: 100-107.
30 Whipp BJ, Wasserman K. Efficiency of muscular work. J Appl Physiol 1969; 26: 644-648.
31 van der Woude LHV, Bosmans I, Bervoets B, Veeger HEJ. Handcycling: different modes and gear ratio. J Med
Eng Tech 2000; 24: 242–249.
32 van der Woude LH, Bouw A, van Wegen J, van As H, Veeger D, de Groot S. Seat height: effects on submaximal
hand rim wheelchair performance during spinal cord injury rehabilitation. J Rehab Med 2009; 41: 143-149.
33 van der Woude LHV, Veeger HEJ, Dallmeijer AJ, Janssen TWJ, Rozendal LA. Biomechanics and physiology in
active manual wheelchair propulsion. Med Eng Phys 2001; 23: 713-733
34 van der Woude LHV, Veeger HEJ, Rozendal RH, Sargeant AJ. Optimum cycle frequencies in hand-rim wheelchair
propulsion. Wheelchair propulsion technique. Eur J Appl Physiol Occup Physiol 1989; 58: 625-632.
Synchronous vs. Asynchronous push strategies Chapter 8
133
Chapter 8
General Discussion
General Discussion
The aim of the present thesis was to further understand the physiological, psycho-
physiological and biomechanical differences between different push strategies in hand-rim
propulsion. Investigating mechanical efficiency, the associated (psycho-) physiological strain and
the underlying (biomechanical) factors of push strategy in novices and trained athletes and the
process of implicit learning of hand-rim wheelchair propulsion in novices were deemed to be
critical elements in wheeling performance. To help investigate if an asynchronous propulsion
mode can be more efficient than the synchronous propulsion mode the early experimental studies
(chapters 2-4) sought to determine the influence of propulsion mode and or push frequency,
identifying the influence of propulsion experience whilst also ascertaining any relationships with
ratings of perceived exertion. The later experimental studies (chapters 5-7) progressed to
determine the effect of wheelchair practice on mechanical efficiency and identify the relationships
of force application characteristics.
The current chapter focuses on the combined outcomes of the experimental chapters,
integrating the findings in the context of the overall research aim. Figure 8.1 is modified from the
initial conceptual model presented in chapter 1 (Figure 1.1), illustrating the factors that influence
wheelchair propulsion performance, in particular highlighting those that have been investigated
throughout the experimental chapters.
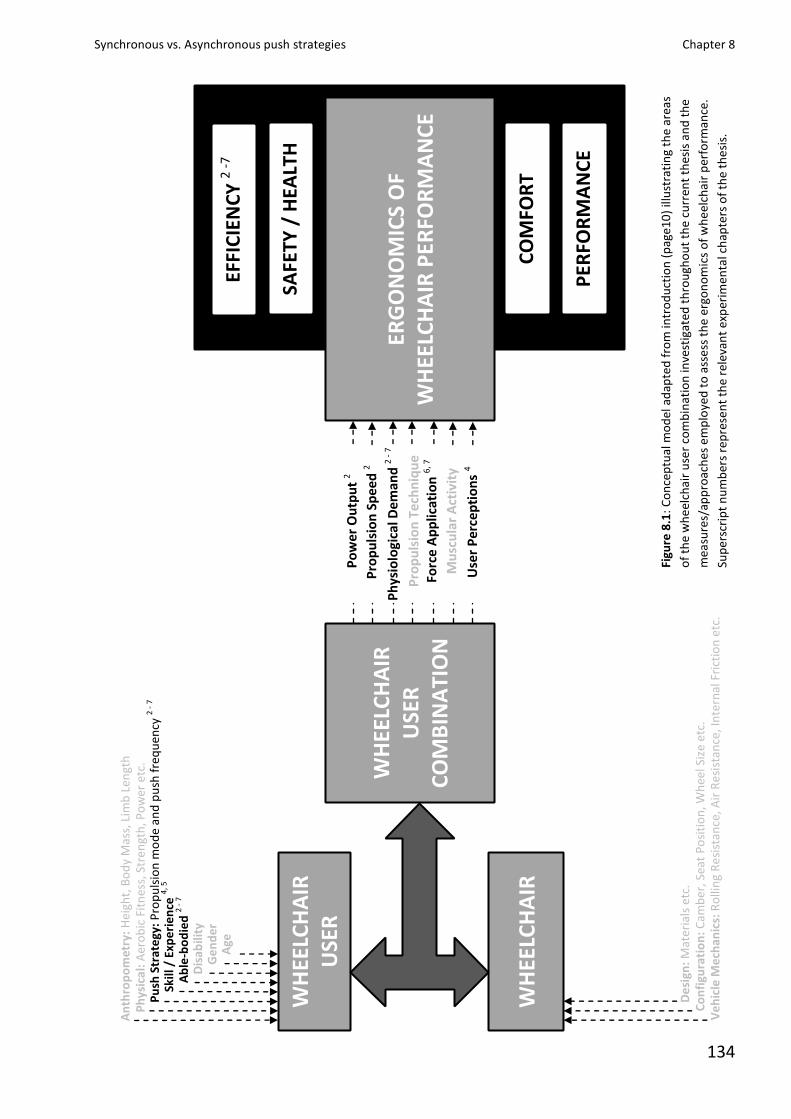
Synchronous vs. Asynchronous push strategies Chapter 8
134
Pro
pu
lsio
n T
ech
niq
ue
Pro
pu
lsio
n S
pe
ed
2
Ph
ysio
logi
cal D
em
and
2 -
7
Forc
e A
pp
licat
ion
6, 7
Mu
scu
lar
Act
ivit
y
Use
r P
erce
pti
on
s 4
Po
we
r O
utp
ut
2
WH
EELC
HA
IR
USE
R
WH
EELC
HA
IR
WH
EELC
HA
IR
USE
R
CO
MB
INA
TIO
N
ERG
ON
OM
ICS
OF
WH
EELC
HA
IR P
ERFO
RM
AN
CE
EFFI
CIE
NC
Y 2
-7
SAFE
TY /
HEA
LTH
CO
MFO
RT
PER
FOR
MA
NC
E
Ve
hic
le M
ech
anic
s: R
olli
ng
Re
sist
ance
, Air
Re
sist
ance
, In
tern
al F
rict
ion
etc
. C
on
figu
rati
on
: C
amb
er, S
eat
Po
siti
on
, Wh
eel S
ize
etc.
D
esi
gn:
Mat
eria
ls e
tc.
An
thro
po
met
ry:
Hei
ght,
Bo
dy
Mas
s, L
imb
Len
gth
P
hys
ica
l: A
ero
bic
Fit
nes
s, S
tre
ngt
h, P
ow
er e
tc.
Ge
nd
er
Dis
abili
ty
Skill
/ E
xpe
rie
nce
4, 5
Age
Ab
le-b
od
ied
2 -
7
Pu
sh S
trat
egy
: P
rop
uls
ion
mo
de
and
pu
sh f
req
uen
cy 2
- 7
Figu
re 8
.1:
Co
nce
ptu
al m
od
el a
dap
ted
fro
m in
tro
du
ctio
n (
pag
e10
) ill
ust
rati
ng
the
area
s
of
the
wh
eel
chai
r u
ser
com
bin
atio
n in
vest
igat
ed t
hro
ugh
ou
t th
e cu
rren
t th
esis
an
d t
he
mea
sure
s/ap
pro
ach
es e
mp
loye
d t
o a
sse
ss t
he
ergo
no
mic
s o
f w
he
elch
air
per
form
ance
.
Sup
ersc
rip
t n
um
ber
s re
pre
sen
t th
e re
leva
nt
exp
erim
enta
l ch
apte
rs o
f th
e th
esi
s.
Synchronous vs. Asynchronous push strategies Chapter 8
135
The discussion will focus on the subsequent sub-sections:
Indices of mechanical efficiency
Synchronous vs. asynchronous propulsion modes
Push (Arm) frequency
Hand-rim propulsion practice
Force Application
Indices of mechanical efficiency The first three experimental chapters reported gross, net and work efficiency. The rationale
for this was that each separate index of efficiency would help understand the efficiency associated
with hand-rim propulsion and explain the effects of push strategy. The most frequently cited
efficiency index used throughout the literature is gross efficiency, hence provided opportunities
for comparisons with previous work. Hintzy & Tordi [32] suggested that both gross and net
efficiency better reflected the actual efficiency of hand-rim propulsion whereas work efficiency
investigated the efficiency of the muscular contraction during this movement. Reporting gross
and work efficiency indices helped to begin to understand the role of the different elements of
hand-rim propulsion with different push strategies; since the gross efficiency includes a composite
measure of the energy cost (based on metabolic costs) for example of moving the arms, stabilising
the body and accelerating the wheel and while work efficiency off-sets the cost of the arm
movements and stabilisation associated with unloaded exercise.
Depending upon the base-line used, each efficiency index provided different values (Gross 4.2
– 9.3%; Net 5.4 – 11.2%; Work 6.2 – 16.3%) throughout the experimental chapters. In light of the
conditions in the current thesis the gross efficiency values are in line with previous studies at
similar levels of work done (power output) and in different participant groups, (Chapter 1, Table 1)
[18, 32, 33, 56]. Despite the obvious absolute differences in the efficiency indices the trends with
push frequency were identical (Chapter 3 & 4).
Mechanical efficiency indices are all dependent upon velocity of propulsion and push (arm)
frequency. It is suggested that increased internal work is responsible for this as the proportion of
unmeasured work in the total energy expenditure changes significantly and cannot be measured
in the unloaded condition. Consequently, the ratio between work done and the energy expended
is increased, decreasing efficiency. Physiological responses and mechanical efficiency indices are
influenced by a combination of propulsion mode, frequency and velocity, supported by findings in
the experimental chapters.
Synchronous vs. Asynchronous push strategies Chapter 8
136
Push Strategy Propulsion mode
It is evident in chapters three to seven that in terms of mechanical efficiency there is no
significant advantage of the traditional synchronous mode over the alternative asynchronous
mode, in contrast to the initial assumptions of the thesis, earlier work of Glaser et al [17] and
significant advantage of synchronous handcycling [9, 50, 54]. It is important here to acknowledge
the findings could be attributed to the eliminated steering component by using a wheelchair roller
ergometer for the wheelchair hand-rim propulsion. Whereas the alternative findings in the hand-
cycling literature incorporate the steering component in the task requirement which could
influence metabolic costs associated to the asynchronous mode. Despite the lack of statistical
significance the asynchronous propulsion mode generally displayed lower physiological responses
and increased efficiency throughout the experimental chapters, excluding in the experienced
wheelchair sportsmen. Interestingly when adopting either propulsion mode the self-selected
frequency is almost identical in relation to the total number of left and right arm movements
employed to fulfil the task requirements. Despite the lack of significant differences some
suggestions are offered to the explanation and understanding of the findings includes; 1)
differences in muscle activity, however, this remains an unknown requiring further research. 2)
asynchronous propulsion allows greater continuity of the hand-rim force application, reducing
fluctuations in the velocity profile and therefore, the inertial forces overcome with each stroke are
reduced. 3) asynchronous limb movement patterns are employed in other more efficient modes of
locomotion (e.g. walking, bicycling, rowing) and may take advantage of inherent neural pathways
for the reciprocal stimulation of the contra-lateral muscle groups [13]. In addition Glaser et al. [17]
indicated through subjective evaluation that the asynchronous mode provides greater stability as
a consequence of the trunk rotation over the forward and back motion of the synchronous mode.
This suggests that maybe decreased muscle activity is required for stability and therefore, a
reduced ·VO2 response and improved efficiency under the current testing conditions on the roller
ergometer. This hypothesis warrants further evaluation and prolonged exposure to the
asynchronous mode to further investigate any optimisation and benefits to that of synchronous
propulsion.
Alternatively the lack of significant differences between synchronous and asynchronous
movement patterns in either of the participant groups suggests that despite wheelchair propulsion
experience and constant employment of synchronous propulsion mode, the common elements
required for hand-rim propulsion are the same for both propulsion modes despite the differences
between the two modes of propulsion and the specific training status of the experienced
wheelchair sportsmen in synchronous propulsion. By suggesting common elements, it is focussing
Synchronous vs. Asynchronous push strategies Chapter 8
137
on the similarities such as coupling of the hand-rim, force application, and transfer amongst other
movement and technique characteristics that are implicit to both propulsion modes regardless of
the experience and push (arm) frequency variables.
Push (arm) frequency
In accordance with existing literature [15, 18, 56] there is a curvilinear association of efficiency
with arm frequency (synchronous and asynchronous). The previous research demonstrated that
the most optimal gross efficiency is achieved when operating at the self-selected frequency [18,
56]. However, the current thesis challenges these findings as it was not possible to ascertain an
optimal frequency condition in either propulsion mode albeit under the testing conditions on a
roller ergometer. Push (arm) frequency demonstrates significant effects on mechanical efficiency
values when performing at sub-maximal propulsion speeds that correspond to approximately 60%
·VO2 peak. Mechanical efficiency values in both propulsion modes are significantly lowered at
higher push frequencies (beyond the self-selected frequency), supporting previous findings.
However, unlike the aforementioned research the data was unable to elicit significant differences
in mechanical efficiency with reductions in push frequency, up to 60% of the self-selected. This
absence of a significant difference occurs in spite of the relatively linear change in the absolute
·VO2 with increasing push frequency and the different movement patterns of synchronous and
asynchronous modes. However, ·VO2 unload (internal work) demonstrated somewhat similar
proportions of the absolute ·VO2 (43% +/- 3%) across push frequency hence the task requirements
of the loaded condition would appear to be responsible for any differences in efficiency and can
be reflected in the similar trends of gross and work efficiency. This may possibly imply the
existence of counteracting phenomena between the loaded and unloaded conditions, whereby
lower arm frequencies benefit from factors that reduce the total amount of work associated with
moving the arms at loaded exercise conditions. Through a combination of changes that may occur
(i.e. improved technique at lower arm frequency, amount of work per push, acceleration /
deceleration changes, muscle activity etc.), the energy costs balance one another to avoid
significant changes in efficiency within the specified range for the same external workload.
Suggestions for the significant and non-significant differences focus around muscle mechanics
and the force-velocity relationship of the various muscles involved in the task of propulsion i.e.
muscle fibre composition and recruitment patterns [16, 44]. A reduction of linear velocity at the
same power output indeed improves the efficiency in hand-rim propulsion [49] as the energy
demands are reduced because of the lower hand and segment velocities are apparent over a
larger part of the propulsion trajectory. Hence this could allow for more secure, effective coupling
and the need for a less controlled transfer of muscle forces through the sequence of contractions.
Synchronous vs. Asynchronous push strategies Chapter 8
138
In addition, changes in frequency may affect the suggested coupling between arm motion and
breathing pattern [2]. This higher form of co-ordination may possibly be disturbed at the non-
preferred higher arm frequencies and be closer to the metabolic optimal at the lower range of arm
frequencies. At the higher frequencies there is a shift in the ‘active’ internal work required to
move the arms and the force application coupled with movement velocity increases the metabolic
demand. The increased number of recovery phases, couplings and un-couplings (and the
associated small negative braking force increases) will contribute to the increased energy
expenditure.
Propulsion experience and motor learning Chapter 4 findings demonstrated how propulsion experience significantly improves the
efficiency of hand-rim propulsion, supporting all previous research whereby experienced
wheelchair users are significantly more efficient than able-bodied or novice wheelchair users. The
impact of propulsion experience clearly demonstrates that significantly greater mechanical
efficiency is associated with experienced users (chapter 4) as was shown in previous research [18,
32, 56]. The values reported for gross efficiency (AB ~7.0%; WS ~9.0%) are in line with previous
literature and despite this significant difference there are similar relationships with push (arm)
frequency, propulsion mode and other physiological parameters.
The ‘passive’ internal workload remains somewhat similar as expressed in the ·VO2 unload results
throughout push (arm) frequency conditions. Importantly it should be noted that the task
complexity in experienced users was increased as a result of the significantly higher velocity and
power output to which 60% of ·VO2 peak corresponded in the experimental conditions. However,
the explanation for large differences in efficiency is not clearly understood, but implications are
that with experience comes practice and refinement of propulsion technique (increased skill and
co-ordination levels) and physiological adaptation whereby perhaps the better training status of
the muscles employed in propulsion hence there is an overall reduction in the amount of active
internal work done. The more refined movement pattern [43] and suggestion of better force
application pattern seen in wheelchair users [41, 49] is suggested to reduce energy expenditure.
Interestingly self-selection of push frequency is not reliant on experience and constant
involvement in hand-rim propulsion. It is important to note that the wheelchair sportsmen were
from sporting backgrounds that lend themselves towards fast, quick pushes during intermittent
bursts of wheelchair movement [47].
The psychophysiological cost (rating of perceived exertion) adhered to the trends of
absolute metabolic cost and not mechanical efficiency regardless of experience with more
strain being felt when operating at push (arm) frequencies greater than the self-selected
Synchronous vs. Asynchronous push strategies Chapter 8
139
frequency. Greater emphasis is placed upon the peripheral rating of perceived exertion
supporting the suggestion that peripheral factors are dominant in work with smaller muscle
groups [14]. Our data clearly demonstrate the power that habituation has on the critical
variables in terms of mechanical efficiency improvements and reductions in physiological and
psychophysiological variables.
Experienced wheelchair users throughout the literature and the wheelchair sportsmen
studied in this thesis demonstrate significantly higher efficiency for hand-rim propulsion. As
mentioned earlier learning, practice and training are deemed an essential part of the rehabilitation
process for people who become wheelchair-dependent in terms of skill and wheelchair capacity
[26, 29, 30, 35-37]. Indeed, it has been shown that hand-rim propulsion practice can improve
mechanical efficiency and some technique variables [21-24] along with changes observed in
segmental movement pattern, muscle activity, and co-contraction [23, 24]. Beyond that, motor
control improves as an outcome of learning, leading to lower metabolic costs [46]. Experimental
chapters 3 and 4 offer an insight into the physiological advantage to be gained from practicing
hand-rim propulsion at lower frequencies, supported by the notion that this may reduce the
likelihood of overuse injuries during wheelchair propulsion [6]. Thus, the adaptations of
wheelchair propulsion to slow paced frequency practice versus unpaced practice may be more
favourable. Four weeks of asynchronous hand-rim propulsion practice (chapter 5) at either paced
or unpaced frequencies led to improvements of between 1.1-1.3% in gross efficiency in novices,
which are clearly associated to the reduction in push and or arm frequency. This effect was
demonstrated most clearly by the comparison between the final freely chosen frequencies which
for the paced group became the same as their paced practice frequency whilst for the unpaced
group this fell to the lower level achieved in the final weeks of practice. Further detailed analysis
of the kinematics and muscle activation of this unconventional propulsion strategy – also on a
longer time scale - would help to further understand the mechanisms involved with the efficiency
of wheelchair propulsion and adaptations as a consequence of practice. Having seen only four-
weeks of propulsion practice significantly improve efficiency by on average 1.0 - 1.3%, the
question remains as to why the rate of change is much slower with the long term effect of practice
(propulsion experience on average of 16 years daily wheelchair and 11 years sports wheelchair –
chapter 4)? This experience equates to a large percentage of practice/wheelchair use yet we only
see differences in efficiency on average of approximately 2.5% (chapter 4) between novice able-
bodied individuals and wheelchair sportsmen. There would appear to be a need for the study of
long term practice on mechanical efficiency of hand-rim wheelchair propulsion to help answer this
question accurately and perhaps establish a timeline for the optimisation of mechanical efficiency.
Synchronous vs. Asynchronous push strategies Chapter 8
140
It would also help contribute to the underlying question surrounding the relatively low mechanical
efficiency associated with this upper-body exercise modality.
There is certainly evidence of a habitual learning effect which is likely to have a neural / co-
ordination effect [45] – evidenced by the fact that post training both groups had adapted to a
freely chosen frequency which reflected that used in the practice period. Since both groups had
similar gross efficiency post practice it is likely that the freely chosen frequency at this stage was
indicative of their habituated preference rather than a physiologic reason. Supportive to previous
work, it would appear that skill learning of wheelchair propulsion involves the search for a ‘body
scheme’ that requires minimal energy expenditure [1]. Timing is a leading parameter in cyclic
motor learning and our findings relating to the reduction of arm frequency confirms not only
previous work on manual wheelchair propulsion by de Groot and colleagues [21-26], but the
suggestion that the learning of repetitive gross-motor tasks might be characterized by a ‘longer-
slow’ control mode, i.e., a decreased arm frequency because of the larger stroke angle/longer
push time [46]. However, the question remains in light of the findings from practice as to whether
participants become more economical because of the reduction in push (arm) frequency or if they
have the ability to reduce the frequency of movement because they are more economical?
Force application To the authors’ knowledge, the force application data presented in the thesis is the first to
describe the effects of forces applied to the hand-rim during manual wheelchair propulsion for
push strategies, more specifically the relationship with propulsion mode and push frequency. The
experimental chapters 6 and 7 have facilitated findings that demonstrate: 1) the significant effect
of push frequency; 2) the significant differences of forces applied in synchronous and
asynchronous modes; 3) with matched push frequency the insignificant interaction effect for
asynchronous vs. synchronous modes.
The values of Mean fraction of effective force ranged from 63 – 74% and were comparable
with those found in the literature for hand-rim propulsion in both able-bodied and spinal cord
injured participants [7, 10, 51]. Increased push frequency results in the reduction of absolute
force for both resultant and tangential force whereas the rate of force development increased
significantly with increased push frequency. Identical trends were seen in both propulsion modes
although asynchronous propulsion produced significantly higher values throughout conditions. It
is suggested that this is the combined effect of the significantly lower self-selected frequency
condition, and the unilateral nature of the force application to the hand-rim as opposed to the
bilateral nature of the synchronous propulsion mode. With the reciprocal changes in resultant
and tangential force across push frequencies the fraction of effective force ratio remained
insignificantly different; however, mode comparison indicated a significant increase in the
Synchronous vs. Asynchronous push strategies Chapter 8
141
asynchronous propulsion mode, the result of a superior tangential to resultant ratio. Despite this
finding the fraction of effective force had no significant association with trends in gross efficiency
for either propulsion mode and or push frequency. As the fraction of effective force does not
correlate to the mechanical efficiency it is in support of previous research [7, 21, 38, 40].
Therefore, the use of the fraction of effective force as an indicator of efficient propulsion cannot
be supported with the current findings. The higher fraction of effective force during asynchronous
propulsion strategies and subsequent gross efficiency did not significantly differ to that in
synchronous propulsion strategies. The differences in the fraction of effective force of propulsion
modes in our data were not in the same magnitude as those in a higher forcefully induced fraction
of effective force [21]. However, it would appear to support that the most effective propulsion
technique from a mechanical viewpoint (i.e. in terms of the fraction of effective force), is not
necessarily the most efficient from the physiological perspective.
The rate of force development is significantly increased at the higher frequencies and in the
asynchronous mode. Boninger and colleagues [4, 5] associated increases in cadence, force
magnitude and rate of force development with an increased risk of injury. In the context of push
strategy it is important to know how this rate of force development is affected and its associated
risks. The difference in the rate of force development is significant and very important as findings
report effects of propulsion frequency and propulsion mode, and the increased push frequency
causes the rate of force development to increase along with the asynchronous mode, hence could
contribute to an increased risk of injury. Therefore, the initial findings of our study imply
wheelchair users should adopt the synchronous style of propulsion if we consider the magnitude
of forces and the rate of the force development. As for push frequency lower frequencies lead to
increased peak forces during each push, whereas higher push frequencies produce smaller peak
forces but subsequently higher rates of force development more frequently. It remains to be seen
as to which is better for hand-rim wheelchair propulsion, as results show that the physiological
efficiency is not linked to the trends in effectiveness of force application.
Critical Reflections The current thesis elucidates methodological considerations important in hand-rim propulsion
research to which attention was drawn in the general introduction (Pages 7-11). Previous
research has seen a vast array of participant groups, protocols and equipment used for the
collection and analysis of data from hand-rim propulsion studies, which precludes direct
comparisons being made between research studies [55]. Although the findings of this thesis add
to the body of knowledge in hand-rim wheelchair propulsion, limitations are re-addressed with
discussion in the subsequent sub-sections.
Synchronous vs. Asynchronous push strategies Chapter 8
142
Able-bodied participants
Studies into hand-rim propulsion will continue to employ both able-bodied (non-wheelchair
participants) and wheelchair-dependent individuals but clearly, differences exist which need to be
considered when evaluating the findings. The study of wheelchair dependent users introduces
unknown effects of disability into the outcome parameters, which may be considerable since it is
very difficult to generate a homogeneous population. Wheelchair dependent populations lead to
large inter-individual differences due to numerous factors, such as disability, injury specificity,
training status and level of physical training on the upper body musculature, and disability, i.e.
level and completeness of the lesion of those with a spinal cord lesion, age and familiarity with
wheelchair use (experience). The selection of able-bodied individuals addresses these issues by
permitting the following:
1. A constant level of expertise and training status of all participants in the different testing
conditions, a homogenous participant group with controlled bands of error;
2. An understanding of upper-body arm work in a healthy upper-body as any pathological
differences can be excluded;
3. The wheelchair configuration remains constant throughout testing conditions removing the
subsequent effect that different chair configurations would bring to the analysis.
The use of able-bodied individuals has primarily been to ensure that any differences in
variables measured are not biased by the effect of disability in wheelchair population groups along
with the ability. Consequently this appears to allow experimental effects to be attributed to
changes or adaptations of the intact human system. However, it is crucial that some level of
caution must be used when applying data to general hand-rim propulsion. Previous research
adheres to the same philosophy and the use of able-bodied participants [3, 8, 11, 12, 15, 19-25, 32,
33, 39, 52, 53, 56].
Experimental set-up Different measurement systems have their advantages and disadvantages in terms of validity
and reliability, however, the comparability of results and applicability of existing knowledge base
remains somewhat limited without the standardisation of measurement equipment (roller
ergometers) and methodology. Whilst it is acknowledged that field based testing conditions
would have presented the most ecologically valid conditions in which to investigate push strategy
it would have been the least standardised in terms of velocity and power output. Standardisation
was deemed very important in establishing initial research of push strategy, in particular the
control of external work requirements achieved through the use of a standardised wheelchair
Synchronous vs. Asynchronous push strategies Chapter 8
143
configuration (limiting known effects of chair design and set-up) and the wheelchair roller
ergometer.
Protocols – speed vs. resistance Hand-rim propulsion research continues to implement a wide range of propulsion speeds and
rolling resistance for the manipulation of external power output. The vast majority are limited to
slower propulsion speeds unless studying wheelchair sports athletes (Chapter 1, Table 1). This
results in highly variable exercise intensities amongst individuals tested, which could be attributed
to a number of variables for example; testing conditions (i.e. wheelchair ergometer vs. treadmill)
or differing levels of physical capacity. To control and elicit, a specific exercise intensity individuals
are required to perform at different propulsion speeds. Researchers continue to change power
output through increased resistance; however, in everyday and/or sports activities the floor
surface in the majority of tasks does not change for that task, hence increased power output is
only attainable through increased propulsion speeds. It is important to realise that a speed based
protocol is somewhat more realistic to conditions associated with hand-rim wheelchair propulsion,
particularly in sporting environments whereby surfaces and slopes remain constant. It is
acknowledged that in daily activities the different surfaces and slopes encountered would also
contribute to the resistance of propulsion, hence research would benefit from conducting the
manipulation of push strategy throughout a range of propulsion speeds.
Conclusions Based on the collective studies presented in this thesis it has been possible to determine the
mechanical efficiency of push strategies and compare asynchronous propulsion to the more
traditional synchronous propulsion mode. Consequently a number of conclusions can be drawn
with respect to push strategy.
To begin with, the different indices of mechanical efficiency appear to allow for the suggestion
that the low efficiency is related to both internal and external work components of the task. It is
clear to see that there is no evidence to suggest a rationale for any physiological advantage of
employing the asynchronous propulsion mode as opposed to the synchronous propulsion mode.
Whilst manipulating the freely chosen frequency (chapters 3-7) neither propulsion mode
presented significant advantages over the other in terms of mechanical efficiency under the
current testing conditions. The only exception to this was in chapter 2 whereby the synchronous
propulsion offered a significant advantage over the asynchronous mode; however, this is likely to
be the combined effect of the increased propulsion speed (power output) and the significant
difference in total number of arm movements in the push frequency conditions of SYN(40:40) and
ASY(20:20) used to perform the same amount of work.
Synchronous vs. Asynchronous push strategies Chapter 8
144
The push frequency plays a major role on the mechanical efficiency particularly above freely
chosen push frequencies whereby efficiency is significantly reduced. On the other hand push
frequencies ranging from 60 – 100% of the freely chosen push frequency do not have any negative
effect on the mechanical efficiency indicating that the human system is somehow able to find a
balance between the cost and effect of arm frequency manipulation.
Experience presented the same trends albeit with significantly greater values of mechanical
efficiency. The strong association of the peripheral ratings of perceived exertion with gross
efficiency suggests that experienced users have learnt to be more efficient.
The practice of hand-rim propulsion supports this suggestion presenting improved efficiency
following practice and the link appears to be with reduced frequencies, suggesting that individuals
push frequency is linked to habitual practice and a natural lowering. These lower frequencies
require higher forces; however, there is no link between forces or the fraction of effective force
and gross efficiency which consequently points to a much more complex relationship than simply
the force application. Even though the fraction of effective force does not help understand the
relatively low mechanical efficiency of hand-rim propulsion it along with along with the rate of rise
of force and changes in total and tangential force does present valuable information for push
strategy intervention.
Although physiological data could not offer any significant advantage for the asynchronous
propulsion mode, the significantly greater forces and rate of force development differences could
be clinically important when used to assist wheelchair users in intervention strategies for the
learning and practice of hand-rim propulsion. The manipulation of push strategy is a variable that
can be changed more easily in the framework of the wheelchair-user combination (Figure 8.1 –
conceptual model), hence individuals, coaches and rehabilitation practitioners can utilise the
knowledge to seek improvements in the efficiency of performance for activities of daily life or
sporting situations. Reducing the levels of force exerted on the upper extremity joints and
attempts to limit the risk of injury whilst at the same time maintaining optimal levels of efficiency
look are important.
Implications Until further research is conducted the findings in this thesis have the following implications:
Push (arm) frequency is the predominant component of push strategy selection for
individuals in hand-rim wheelchair propulsion and can help reduce the physiological
demands. Changes in frequency are easy to manipulate and implement.
Practice is a key element to improved mechanical efficiency and is particularly advantageous
at unpaced (freely chosen frequency) and paced (80% of the freely chosen frequency).
Synchronous vs. Asynchronous push strategies Chapter 8
145
Psychophysiological measures follow the trends in physiological outcomes and may be used
in practice to guide intensity of exercise and effort?
The feedback mechanism of pacing via the use of audio cues can assist with the practice and
learning of the complex task of hand-rim wheelchair propulsion. This would assist the
process by encouraging individuals to meet requirements for a more optimum mechanical
efficiency.
Awareness of the rate of rise in forces applied to the hand-rim as push strategy is
manipulated and the potential link with risk of injury should be stimulated.
Propulsion practice should not be aimed at feedback based optimisation of the propulsion
force (i.e. the fraction of effective force) because this may be less efficient and more
straining for individuals.
Future Directions It is apparent that the results of this thesis create a framework for further research to explore
different interventions for push strategy and continue to develop the understanding of factors
associated with the relatively low efficiency. Explanations for both the relatively low efficiency
and large differences between wheelchair sportsmen (experienced wheelchair users) and able-
bodied (non-wheelchair users) are paramount if we are to seek improvements in the performance
and efficiency of propulsion in manual hand-rim wheelchairs. Manual hand-rim wheelchair
propulsion will continue to dominate wheelchair sports and provide the most widespread method
of wheeled mobility during daily activity. In the context of general mobility, the hand-rim
wheelchair has become a task-specific, functional and versatile device that contributes to
performance in activities of daily living and wheelchair sports hence is the mechanism that
interacts closely with the human system. The investigation of push strategy is a particularly novel
concept throughout the current thesis and it is clearly evident from Figure 8.1 that there are a
number of unknowns for the optimisation of push strategy and efficiency of hand-rim propulsion.
Therefore, other key areas of study that future investigations could seek to address and further
the knowledge into manual hand-rim wheelchair propulsion are discussed in the sub-sections:
1. Optimal push frequency
2. Force Application
3. Muscle activity
4. Adaptations in physiology and propulsion technique(s)
5. Segmental energy flow
Optimal push frequency Activities of daily life and wheelchair sports require the user to perform at different
propulsion speeds (power outputs) whilst propelling a hand-rim wheelchair. Although the data
Synchronous vs. Asynchronous push strategies Chapter 8
146
presented in this thesis demonstrated the most optimal mechanical efficiency was found to be
within the range of 60% - 100% of freely chosen push frequency, it is important to extend this to
investigate the relationship that exists at a range of propulsion speeds. The extension would
provide useful information as to the oxygen costs and mechanical efficiency trends to ensure a
better understanding when considering push strategy selection. Extending the research further
incorporating a range of propulsion speeds would allow the relationship observed in this thesis
between push (arm) frequency and mechanical efficiency to be identified. This extension is logical
particularly as in sport the amount of work done is affected predominantly by the speed of
propulsion performed whereby rolling resistance is a more or less constant variable.
Force Application The presented force application data does not correlate with mechanical efficiency and was
unable to provide an explanation to the relatively low mechanical efficiency, although it did
provide an important perspective of the biomechanics of the task. The trends/relationships
demonstrated with push frequency/propulsion mode appear important to push strategy selection
in relation to the levels of force exerted on the upper extremity and any clinical significance to
wheelchair users, as opposed to the reduced energy costs and optimisation of mechanical
efficiency. Experienced wheelchair users are more efficient and investigation into the force
profiles with respect to push frequency and or propulsion mode in that population could offer
some insight to the significant differences and trends reported. Rozendaal and colleagues [42]
provided a simulation study on force direction, which suggested that experienced wheelchair
users optimise the force pattern by balancing the mechanical effect as well as musculoskeletal
cost. In addition the investigation into the braking torques at the start and end of push phase [48,
49] a variable associated with the term ineffective propulsion technique characteristics could also
be valuable.
Muscle activity and adaptations in physiology/propulsion technique(s) Electromyography analyses could be invaluable particularly the muscular activity and changes
that occur when push strategy is manipulated may provide a more detailed assessment and
understanding of the efficiency. Subsequent relationships with force application parameters could
be considerably important. Clearly the efficiency of propulsion is affected significantly by push
frequency and given the number of muscles involved in the upper extremity; movements can be
conducted with different sets of active muscles. Examining the premise of co-contraction amongst
muscles is essential, as in theory the more efficient arm/push frequency would presumably consist
of lower levels of co-activity. Is there an optimisation of muscle synergies? Since muscle activity
and kinematics in a laboratory environment could easily be measured, this would be very useful
Synchronous vs. Asynchronous push strategies Chapter 8
147
information. Any link between electromyography (muscle activity patterns), force production and
mechanical efficiency would provide a valuable insight to help understand and explain the relative
inefficiency. The inclusion of asynchronous propulsion alongside synchronous propulsion would
be a novel approach and the electromyography data collected would add to the knowledge base
that exists in the hand-rim propulsion literature.
Chapter 4 highlighted that wheelchair experience significantly improves the gross efficiency of
hand-rim propulsion. Previous research and observations point to experienced individuals
differing substantially in their propulsion techniques and these differences are the suggested to be
responsible for improved efficiency. It would appear that there is a necessity for research into
long term learning studies investigating the changes in movement/timing patterns coupled with
muscle activity, which may offer valuable insight to the inefficiency and non-significant difference
in efficiency of propulsion mode. The shoulder-arm muscle complex can offer a wide range of
movements and may well result in a greater variability in repetitive movements of the upper
extremity. Identifying the technical aspects of hand-rim propulsion related to efficiency would be
important on a theoretical and practical level for both daily activities and sports utilising hand-rim
wheelchairs.
Segmental energy flow The comparison of synchronous and asynchronous propulsion did not discover any significant
differences in what remain relatively low efficiency values, particularly in relation to the efficiency
reported in handcycling and arm-cranking literature. The fundamental cause of this remains
unclear despite the suggestions in this thesis and other researchers. The energy costs of
propulsion have been quantified providing an insight into inefficiency; however, the causes remain
undetermined. Hence, the investigation of segmental energy flow and the use of energetic
analysis techniques could perhaps be pivotal to a better understanding. Studying how and where
the energy is transferred during the movement cycle in the two distinct phases of propulsion
(propulsion and recovery) could provide the information required to best answer the question of
hand-rim propulsion inefficiency. The study of mechanical energy flow in hand-rim propulsion is
very limited. The only studies to-date having investigated this are van der Helm & Veeger [31], by
Guo and colleagues [27, 28] with the later study manipulating hand-rim diameter and more
recently Huang et al. [34] manipulating camber. However, and crucially, the variable push (arm)
frequency had not been taken into consideration. As this has been shown in the current thesis to
be a major contributing factor to the relatively low efficiency of a push strategy, investigating
segmental energy flow could well help evaluate and further understand changes in oxygen cost
and efficiency.
Synchronous vs. Asynchronous push strategies Chapter 8
148
References 1 Almåsbakk B, Whiting HTA, Helgerud, J. The efficient learner. Biol Cybern 2001; 84: 75-83.
2 Amazeen PG, Amazeen EL, Beek PJ. Coupling of breathing and movement during manual wheelchair propulsion. J
Exp Psychol Hum Percept Perform 2001; 27: 1243-1259.
3 van den Berg R, de Groot S, Swart KM, van der Woude LH. Physical capacity after 7 weeks of low-intensity
wheelchair training. Disabil Rehabil 2010; 32(26): 2244-52.
4 Boninger ML, Baldwin M, Cooper RA, Koontz A, Chan L. Manual wheelchair pushrim biomechanics and axle position.
Arch Phys Med Rehab 2000; 81: 608-613.
5 Boninger ML, Cooper RA, Baldwin MA, Shimada SD, Koontz A. Wheelchair pushrim kinetics: body weight and
median nerve function. Arch Phys Med Rehab 1999; 80: 910-915.
6 Boninger ML, Koontz AM, Sisto SA, Dyson-Hydson TA, Chang M, Price R, Cooper RA. Pushrim biomechanics and
injury prevention in spinal cord injury: recommendations based on CULP-SCI investigations. J Rehabil Res Dev 2005;
42(3 suppl 1): 9-19.
7 Bregman DJJ, van Drongelen S, Veeger HEJ. Is effective force application in handrim wheelchair propulsion also
efficient? Clin Biomech 2009; 24: 13-19.
8 Brubaker CE, McClay IS, McLaurin CA. Effect of seat position on wheelchair propulsion efficiency. In Proceedings of
2nd
International Conference on Rehabilitation Engineering 1984; 12-14. Ottawa: Canadian Medical and Biological
Engineering Society.
9 Dallmeijer AJ, Ottjes L, de Waardt E, van der Woude LHV. A physiological comparison of synchronous and
asynchronous hand cycling. Int J Sports Med 2004a; 25: 1–5.
10 Dallmeijer AJ, Woude LHV van der, Veeger HEJ, Hollander AP. Effectiveness of force application in manual
wheelchair propulsion in persons with spinal cord injuries. Am J Phys Med Rehab 1998; 77: 213-221.
11 Dallmeijer AJ, Zentgraaff ID, Zijp NI, Woude LHV van der. Sub-maximal physical strain and peak performance in
handcycling versus hand-rim wheelchair propulsion. Spinal Cord 2004b; 42: 91–98.
12 Davis GM & Shephard RJ. Strength training for wheelchair users. Br J Sports Med 1990; 24(1): 25-30.
13 Van Dieen JH, Ogita F, de Haan A. Reduced neural drive in bilateral exertions: a performance-limiting factor? Med
Sci Sports Exerc 2003; 35(1), 111-118.
14 Ekblom B & Goldbarg AN. The influence of physical training and other factors on the subjective rating of perceived
exertion. Acta Physiol Scand 1971; 83: 399–406.
15 Fabre N, Perrey S, Arbez L, Ruiz J, Tordi N, Rouillon JD. Degree of coordination between breathing and rhythmic
arm movements during hand rim wheelchair propulsion. Int. J. Sports Med 2006; 27: 67–74.
16 Gaesser GA, Brooks GA. Muscular efficiency during steady-rate exercise: effects of speed and work rate. J Appl
Physiol 1975; 38: 1132–1139.
17 Glaser RM, Sawka MN, Young RE, Suryaprasad AG. Applied physiology for wheelchair design. J Physiol 1980; 48:
41–44.
18 Goosey VL, Campbell IG, Fowler NE. Effect of push frequency on the economy of wheelchair racers. Med Sci Sports
Exerc 2000; 32: 174–181.
19 Goosey-Tolfrey VL, Kirk JH. Effect of push frequency and strategy variations on economy and perceived exertion
during wheelchair propulsion. Eur J Appl Physiol 2003; 90: 153–158.
Synchronous vs. Asynchronous push strategies Chapter 8
149
20 Goosey-Tolfrey VL, West M, Lenton JP, Tolfrey K. Influence of varied tempo music on wheelchair mechanical
efficiency following 3-week practice. Int J Sports Med 2011; 32(2): 126-31.
21 de Groot S, Veeger HEJ, Hollander AP, van der Woude LHV. Consequence of feedback-based learning of an
effective hand rim wheelchair force production on mechanical efficiency. Clin Biomech 2002a; 17: 219-226.
22 de Groot S, Veeger DHEV, Hollander AP, van der Woude LHV. Wheelchair propulsion technique and mechanical
efficiency after 3 wk of practice. Med Sci Sports Exerc 2002b; 34: 756–766.
23 de Groot S, Veeger DHEV, Hollander AP, van der Woude LHV. Adaptations in physiology and propulsion technique
during the initial phase of learning manual wheelchair propulsion. Am J Phys Med Rehab 2003a; 82(7): 504-510.
24 de Groot S, Veeger DHEV, Hollander AP, van der Woude LHV. Short- term adaptations in co-ordination during the
initial phase of learning manual wheelchair propulsion. J. Electromyogr. Kinesiol 2003b; 13: 217–228.
25 de Groot S, Veeger HEJ, Hollander AP, van der Woude LHV. Effect of wheelchair stroke pattern on mechanical
efficiency. Am J Phys Med Rehab 2004; 83: 640-649.
26 de Groot S, Veeger DHEV, Hollander AP, van der Woude LHV. Influence of task complexity on mechanical efficiency
and propulsion technique during learning of hand rim wheelchair propulsion. Med Eng Phys 2005; 27(1): 41-49.
27 Guo LY, Su FC, An KN. Effect of handrim diameter on manual wheelchair propulsion: mechanical energy and power
flow analysis. Clin Biomech 2006; 21(2): 107-15.
28 Guo LY, Su FC, Wu HW, An KN. Mechanical energy and power flow of the upper extremity in manual wheelchair
propulsion. Clin Biomech 2003; 18(2): 106-14.
29 Haisma JA, Bussmann JB, Stam HJ, Sluis TA, Bergen MP, Dallmeijer AJ, de Groot S, van der Woude LHV. Changes in
physical capacity during and after inpatient rehabilitation in subjects with a spinal cord injury. Arch Phys Med Rehab
2006; 87(6): 741-748.
30 Haisma JA, van der Woude LH, Stam HJ, Bergen MP, Sluis TA, Bussmann JB. Physical capacity in wheelchair-
dependent persons with a spinal cord injury: a critical review of the literature. Spinal Cord 2006; 44(11): 642-52.
31 van der Helm TC, Veeger HEJ. Shoulder modelling in rehabilitation: The power balance during wheelchair
propulsion. In: van der Woude LHV, Hopman MTE, van Kememade CH (Eds.), Biomedical Aspects of Manual
Wheelchair Propulsion: The State of the Art II. IOS Press, Amsterdam, Netherlands 1999; pp. 96–103.
32 Hintzy F, Tordi N. Mechanical efficiency during hand-rim wheelchair propulsion: effects of base-line subtraction
and power output. Clin Biomech 2004; 19: 343–349..
33 Hintzy F, Tordi N, Perrey S. Muscular efficiency during arm cranking and wheelchair exercise: A comparison. Int J
Sports Med 2002; 23: 408–414.
34 Huang YC, Guo LY, Tsai CY, Su FC. Mechanical energy and power flow analysis of wheelchair use with different
camber settings. Comput Methods Biomech Biomed Engin 2011; [Epub ahead of print] PMID: 22148959
35 Jacobs PL, Nash MS. Exercise recommendations for individuals with spinal cord injury. Sports Med 2004; 34(11):
727-751.
36 Kilkens OJ, Dallmeijer AJ, Nene AV, Post MW, van der Woude LHV. The longitudinal relation between physical
capacity and wheelchair skill performance during inpatient rehabilitation of people with spinal cord injury. Arch Phsy
Med Rehabil 2005; 86(8): 1575-1581.
37 Kilkens OJ, Post MW, Dallmeijer AJ, van Asbeck FW, van der Woude LH. Relationship between manual wheelchair
skill performance and participation of persons with spinal cord injuries 1 year after discharge from inpatient
rehabilitation. J Rehabil Res Dev 2005; 42(3 Suppl 1): 65-73.
Synchronous vs. Asynchronous push strategies Chapter 8
150
38 Kotajarvi, BR, Basford JR, An KN, Morrow DA, Kaufman KR. The effect of visual biofeedback on the propulsion
effectiveness of experienced wheelchair users. Arch Phys Med Rehab 2006; 87: 510-515.
39 Patterson P, Draper S. Selected comparisons between experienced and non-experienced individuals during manual
wheelchair propulsion. Biomed Sci Instrum 1997; 33: 477-481
40 Rankin JW, Kwarciak AM, Mark Richter W, Neptune RR. The influence of altering push force effectiveness on upper
extremity demand during wheelchair propulsion. J Biomech 2010; 43(14): 2771-2779.
41 Robertson RN, Boninger ML, Cooper RA, Shimada SD. Pushrim forces and joint kinetics during wheelchair
propulsion. Arch Phys Med Rehab 1996; 77: 856-864.
42 Rozendaal LA, Veeger HEJ, van der Woude LHV. The push force pattern in manual wheelchair propulsion as a
balance between cost and effect. J Biomech 2000; 36: 239-247.
43 Sanderson, D.J., and Sommer, H.J. 1985. Kinematic features of wheelchair propulsion. J. Biomech. 18(6): 423-429.
44 Seabury JJ, Adams WC, Ramey MR. Influence of pedalling rate and power output on energy expenditure during
bicycle ergometry. Ergonomics 1977; 20: 491–498.
45 Sparrow WA, Irizarry-Lopez VM. Mechanical efficiency and metabolic cost as measures of learning a novel gross
motor task. J Mot Behav 1987; 19(2): 240-264.
46 Sparrow WA, Newell KM. Metabolic energy expenditure and the regulation of movement economy. Psychonomic
Bulletin & Review 1998; 5(2): 173-196.
47 Vanlandewijck Y, Theisen D, Daly D. Wheelchair propulsion biomechanics: implications for wheelchair sports.
Sports Med 2001; 31: 339-367.
48 Veeger HEJ, van der Woude LHV, Rozendal RH. Within-cycle characteristics of the wheelchair push in sprinting on a
wheelchair ergometer. Med Sci Sports Exerc 1991; 23: 264–271.
49 Veeger HEJ, van der Woude LHV, Rozendal RH. Effect of hand-rim velocity on mechanical efficiency in
wheelchair propulsion. Med Sci Sports Exerc 1992; 24: 100-107.
50 van der Woude LHV, Bosmans I, Bervoets B, Veeger HEJ. Handcycling: different modes and gear ratio. J Med Eng
Tech 2000; 24: 242–249.
51 van der Woude LH, Bouw A, van Wegen J, van As H, Veeger D, de Groot S. Seat height: effects on submaximal hand
rim wheelchair performance during spinal cord injury rehabilitation. J Rehab Med 2009; 41: 143-149.
52 van der Woude LHV, Formanoy M, de Groot S. Hand rim configuration: effects on physical strain and technique in
unimpaired subjects? Med Eng Phys 2003; 25: 765–774.
53 van der Woude LHV, de Groot G, Hollander AP, Ingen Schenau GJ van, Rozendal RH. Wheelchair ergonomics and
physiological testing of prototypes. Ergonomics 1986; 29: 1561–1573.
54 van der Woude LHV, Horstman A, Faas P, Mechielsen S, Bafghi HA, de Koning JJ. Power output and metabolic cost
of synchronous and asynchronous sub-maximal and peak level hand cycling on a motor driven treadmill in able-bodied
male subjects. Med Eng Phys 2008; 30(5): 574-580.
55 van der Woude LHV, Veeger HEJ, Dallmeijer AJ, Janssen TWJ, Rozendaal LA. Biomechanics and physiology in active
manual wheelchair propulsion. Med Eng Physics 2001; 23: 713–733.
56 van der Woude LHV, Veeger HEJ, Rozendal RH, Sargeant AJ. Optimum cycle frequencies in hand-rim wheelchair
propulsion. Wheelchair propulsion technique. Eur J Appl Physiol 1989a; 58: 625–632.
Synchronous vs. Asynchronous push strategies Summary
151
Summary
Summary
The present thesis investigates the efficiency of synchronous and asynchronous hand-rim
wheelchair propulsion. Numerous factors make up the wheelchair-user combination and are
suggested to contribute to wheelchair propulsion performance. Factors that can be easily
manipulated by individuals are important starting points into the understanding of hand-rim
wheelchair propulsion, in particular the physiological aspects and mechanical efficiency. This
provides a platform for the both theoretical as well as practical significance in the context of
propulsion. Generating information on optimum conditions for cyclic arm work in rehabilitation
and wheelchair sports is important for the wheelchair performance and efficiency.
Chapter 1 presented an outline of hand-rim wheelchair propulsion introducing the area of
investigation. The use of the conceptual model highlights numerous factors that can influence the
performance/efficiency of wheelchair propulsion and reiterates the requirement for an
interdisciplinary approach. The model is based upon the three basic qualities of the wheelchair-
user combination that are crucial in determining performance in hand-rim wheelchair use [2, 3].
First, there is the user, who produces the energy and power for propulsion; second, the mechanics
and technical status of the wheelchair; finally the interaction of the wheelchair and user which
essentially will determine the efficiency of the power transfer from the user to the wheelchair.
The chapter concludes with the research aims and thesis outline.
Chapter 2 provided information on mechanical efficiency determining the separate
contributions of push (arm) frequency and propulsion mode on the internal work during hand-rim
propulsion. By studying the different indices of efficiency it was possible to assist in the
understanding and recognition of the roles that internal and external work production has in
hand-rim wheelchair propulsion push strategies. Results of the study exemplified this with
Synchronous vs. Asynchronous push strategies Summary
152
significant changes in mechanical efficiency indices as the result of both push (arm) frequency and
propulsion mode. Each of the different indices of efficiency has their own explanatory role for the
effects of push strategy and is not necessarily redundant in understanding the efficiency and
internal work. Effects of different push strategies are critical to the level of external work (velocity
and power output) production. The energy cost of unloaded arm movements increased with a
lower number of arm movements, however, the complex task requirements of active hand-rim
propulsion at both 1.2 m·s-1 and 1.7 m·s-1 was overruled for the benefit of a higher push (arm)
frequency. Employing paced frequencies significantly affects metabolic and efficiency parameters;
however, the asynchronous propulsion mode produced negative metabolic effects whereas the
synchronous propulsion offered improved efficiency. It is important to note that this was only
evident with a reduction in the total number of arm movements in the asynchronous mode and
increased propulsion speed (power output), when comparing ASY(20:20) and SYN(40:40) and not
ASY(40:40) to SYN(40:40). The physiological responses and mechanical efficiency indices in this
study make it apparent that they are influenced by a combination of propulsion mode, push (arm)
frequency, velocity and power output.
Chapter 3 was designed to focus on and determine the relationship of mechanical efficiency
indices and different Push (arm) frequencies during synchronous and asynchronous hand-rim
wheelchair propulsion. With limited research on push frequency and the results of chapter one
this progression was an important development to begin to further investigate the relationship of
mechanical efficiency in both propulsion modes. In accordance to previous literature a curvilinear
association of mechanical efficiency and push frequency was observed and the suggestion that a
shift in ‘active’ internal work is responsible. However, in contrast the mechanical efficiency and
·VO2 are not optimised at the freely chosen push frequency (100%) due to the absence of any
statistically significant differences in the lower push (arm) frequency range of 60 to 100% of the
freely chosen push frequency. No significant difference was observed between propulsion modes
under the testing conditions demonstrating the greater importance of push frequency. Push
frequencies at or below those self-selected are advantageous in relation to oxygen cost and
mechanical efficiency. It could be concluded that the ‘active’ internal work was similar for both
modes under the task constraints of the study despite the different underlying task components.
Chapter 4 was an extension to chapter 3 whereby the investigation introduced hand-rim
wheelchair propulsion experience to the relationship of mechanical efficiency with push frequency
and propulsion mode. Psycho-physiological measures were also introduced with the use of
differentiated ratings of perceived exertion (Peripheral, Central and Overall). Physiological trends
did not change as a result of propulsion experience despite the manipulation of push strategy
(propulsion mode and push frequency). However, experience resulted in significantly greater
Synchronous vs. Asynchronous push strategies Summary
153
mechanical efficiency across the push frequency conditions (% of freely chosen push frequency),
propulsion mode and at higher absolute speed/power output. With the exception of hand-rim
wheelchair propulsion experience the underlying mechanisms for the differences remain unclear,
although it could well be the result of continued practice through training and daily wheelchair
propulsion activity. The experience of hand-rim propulsion has allowed for the development of
more optimal coordination, which results in improved propulsion technique, hence efficiency and
a reduced relative metabolic cost.
The rating of perceived exertion scores followed the trend of absolute metabolic cost and not
the mechanical efficiency. The refined movement patterns reduce the oxygen cost resulting in
improved efficiency in comparison to unskilled able-bodied individuals. However, it was clear that
the sensations experienced from the resulting manipulation of push (arm) frequency were what
influenced the ratings of perceived exertion. Previous experience had no influence because of the
non-significant difference between wheelchair sportsmen (experienced users) and able-bodied
(novices) perceived exertion. The study also outlined that differentiated ratings of perceived
exertion could be employed to support physiological findings in hand-rim propulsion in both
participant groups. The differentiated ratings indicated that the peripheral exertion was the
dominant sensation by which individuals perceive the exercise conditions in this task.
Chapter 5 developed from the findings in chapter 3 and 4 and extended the hand-rim
propulsion practice work of de Groot and colleagues [1]. Thus the consequence of unpaced and
paced practice during asynchronous hand-rim wheelchair propulsion training on the gross
efficiency, timing and sub-maximal performance was investigated. The concept of asynchronous
propulsion practice was a novel concept and the practice element would support the theories
suggesting propulsion experience to be a factor in the efficiency of hand-rim wheelchair
propulsion. By including paced and unpaced frequency conditions for practice it was possible to
investigate which method was more optimal. Hand-rim propulsion practice improved the
mechanical efficiency and the profile demonstrated a shift towards a push (arm) frequency being
that most closely to the frequency adopted during practice. Improvements were clearly
associated with reductions in arm frequency and the freely chosen push frequency of both paced
and unpaced groups following practice became the same as that at which they practiced. Despite
the significant differences in push (arm) frequency of the paced and unpaced groups post practice
the mechanical efficiency demonstrated no significant differences. Thus as in chapters 3 and 4
there remains a range of frequencies whereby mechanical efficiency continues to be optimal given
the task constraints.
Chapter 6 and 7 investigated force production and the fraction of effective force as a result of
changes in push strategy (both propulsion mode and push frequency) to help understand the
Synchronous vs. Asynchronous push strategies Summary
154
changes seen in mechanical efficiency. The results aimed to provide important information as to
the relationship of force application from both a push strategy and mechanical efficiency
perspective. In conclusion, increased push frequency generally resulted in a reduction in the
absolute values of the force parameters, with the exception of rate of force development which
increased. These findings could be useful in the link with overuse injuries. The fraction of
effective force remained somewhat unchanged and along with the force parameters studied did
not reflect the trend in gross efficiency. Push frequency merely affects the force components in
such a way that the ratio of the tangential force to the resultant force remains somewhat
proportional to one another despite changes in push angle and push time. Despite the gross
efficiency of propulsion not being able to be linked directly with the fraction of effective force it is
important to acknowledge the important relationship of force application with push frequency.
Results continued to support previous findings that push frequencies in untrained participants at
or below the freely chosen push frequency are close to optimal energy cost and efficiency. At
identical push frequencies the asynchronous propulsion mode produced significantly greater
forces and rate of force development, which could be of importance in relation to the risk of injury.
Force application differences appear to be attributable to the mode of propulsion whereas gross
efficiency is a combination of both propulsion mode and push frequency under given conditions of
power output and speed. Understanding how individuals apply force to the hand-rim in push
strategies provides important information for determining interventions to perhaps reduce the
levels of force exerted on the upper extremity joints and limiting the risk of injury whilst at the
same time maintaining optimal levels of efficiency.
Chapter 8 is the general discussion and concluded that the use of mechanical efficiency
indices can help to better explain and understand the roles of internal and external work and
importantly any conclusions about mechanical efficiency could well be misinterpreted if the
indices definitions are not taken into account. With the comparison of the indices it is possible to
produce a more complete description of efficiency and begin to focus on developing further
research for the explanation of the relatively low efficiency associated with hand-rim wheelchair
propulsion. Under the constraints of the studies presented in the thesis it is apparent that the
mode of propulsion does not have as important a role to play in the changes in mechanical
efficiency. Push (arm) frequency is a key contributor, whilst demonstrating a need for frequencies
to remain at the freely chosen push frequency or lower for any the optimisation of mechanical
efficiency. It is acknowledged, however, that further verification of the relationships observed
would need to progress at different velocities and levels of power output. Experience of
propulsion is also important with practice at paced and unpaced arm frequencies having led to
improvements in mechanical efficiency. The patterns of force application across push frequency
Synchronous vs. Asynchronous push strategies Summary
155
provide important information for users in terms of absolute forces and importantly the rate of
force development which is suggested in the literature to be linked to the risk of injury. This
information could help in push strategy selection. The limitations of the thesis are discussed in the
critical reflections section under sub-headings of able-bodied participants, experimental set-up
and protocol – speed vs. resistance. Finally conclusions, implications of the research and future
directions are outlined.
Synchronous vs. Asynchronous push strategies Summary
156
References 1 de Groot S, Veeger DHEV, Hollander AP, van der Woude LHV. Wheelchair propulsion technique and mechanical
efficiency after 3 wk of practice. Med Sci Sports Exerc 2002b; 34: 756–766.
2 van der Woude LHV, de Groot G, Hollander AP, Ingen Schenau GJ van, Rozendal RH. Wheelchair ergonomics and
physiological testing of prototypes. Ergonomics 1986; 29: 1561–1573.
3 van der Woude LHV, Veeger HEJ, Dallmeijer AJ, Janssen TWJ, Rozendaal LA. Biomechanics and physiology in active
manual wheelchair propulsion. Med Eng Physics 2001; 23: 713–733.
Synchronous vs. Asynchronous push strategies Acknowledgements
157
Acknowledgements
Acknowledgements Dedication
Acknowledgements There have been many ‘challenging’ times during my research work and there are many
people who have played a part in the completion of this thesis. Firstly I would like to thank
my Dad for his love, support and belief in me throughout and always being on hand to give
advice during the difficult times. Special thanks also go to Debbie my wonderful fiancée for
having to put up with me; “I know I’ve not been the easiest person to get along with during
periods of my research work but without your love and belief in me, I don’t know what I
would have done”.
I am most grateful to the members of my supervisory team who have helped me along
this journey. Prof. Lucas van der Woude for providing me with the opportunity to undertake
and complete my PhD, Lucas has not only been a mentor to me and my research but
importantly a friend from whom I have learnt so much from as he has shared his vast depth
of knowledge into hand-rim wheelchair propulsion. I can only hope to continue to work with
Lucas in the future on research projects and benefit from his expertise. Dr. Vicky Tolfrey for
her continued support throughout the process as I continue to learn under her leadership at
Peter Harrison Centre for Disability Sport, School of Sport, Exercise & Health Sciences,
Loughborough University and involvement in research projects into disability sport. I would
also like to thank Prof. Neil Fowler for his support and advice throughout.
The research studies in this thesis were supported financially by the Manchester
Metropolitan University for which I am most appreciative alongside the technical support
which was made possible by the time and efforts of Tom Mckee, Garry Pheasey and Rob
Perkins. Particular thanks go to Tom for his continuous support and technical expertise in
the development of the wheelchair ergometer software. Many thanks go to RGK

Synchronous vs. Asynchronous push strategies Acknowledgements
158
Wheelchairs, in particular Russ Simmons for loan of the wheelchairs and Bromakin
Wheelchairs for the wheelchair roller ergometer used throughout the research.
Finally, a sincere ‘thank you’ to all the participants and athletes who gave up their time
to partake in the studies, my friends both past and present, that have helped on my PhD
journey and shared my experiences.

Synchronous vs. Asynchronous push strategies Acknowledgements
159
Dedication This thesis is dedicated to the memory of two very special people. Firstly, my mum
Lorraine Lenton who passed away in October 1992 after losing her battle with breast cancer.
“Mum I miss you so very much, I will love you always and hope that you’re proud of me. It’s
been a difficult journey but I have developed as a person both professionally and personally
with new skills and learnt so much throughout my journey”. Secondly is Dr. Graham
Nicholson who was tragically killed in a motorcycle accident, August 2006. Graham was an
exceptional individual who I was fortunate to have known and worked alongside. In doing so
I gained a special friend who is dearly missed but not forgotten, so if you’re listening Graham
“thanks for everything”.
I would like to share with everyone a reading that has helped me through the most
difficult time in my life when coping with the passing of mum, Lorraine – “Remembered
Tenderly, Loved Completely.”
Death is nothing at all, I have only slipped away into the next room.
I am I and you are you. Whatever we were to each other,
That we are still! Call me by my old familiar name.
Speak to me in the easy way you always used. Put no difference into your tone,
Wear no forced air of solemnity or sorrow. Laugh as we always laughed,
At the little jokes we always enjoyed together. Play, smile, and think of me. Pray for me.
Let my name be ever the household word that it always was. Let it be spoken without effort,
Without the ghost of a shadow in it. Life means all that it ever meant.
It is the same as it ever was, There is absolute unbroken continuity.
What is death but a negligible accident? Why should I be out of mind?
Because I am out of sight! I am waiting for you for an interval,
Somewhere very near, Just around the corner….
All is well. Nothing is past; nothing is lost
One brief moment and all will be as it was before. How we shall laugh at the trouble of parting when we meet again!
Canon Henry Scott-Holland, 1847-1918, Canon of St Paul's Cathedral.