
Cross-Border M&A: Does Culture Matter?
29
Cross-Border M&A: Does Culture Matter? Rajesh Chakrabarti Narayanan Jayaraman Swastika Mukherjee DuPree College of Management, Georgia Institute of Technology, 800 West Peachtree Street, Atlanta, GA 30332 Chakrabarti Jayaraman Mukherjee Tel: (404) 894-5109 (404) 894-4389 (404) 385-2413 E-mail: rajesh.chakrabarti@ mgt.gatech.edu narayanan.jayaraman@ mgt.gatech.edu swastika.mukherjee@ mgt.gatech.edu Abstract We study whether cross-border acquisitions between firms from culturally disparate countries perform differently than those between firms from culturally proximate nations. We use the Hofstede measure of cultural dimensions to define cultural distance. Using a sample of close to 400 cross-border acquisitions from 1990s, we find that while cross- border acquisitions are detrimental to the stock return performance of the acquirer in general, acquirers do better when the acquisitions are between countries with greater cultural distance. We use alternative measures of socio-legal and cultural distance and find that in most cases such distance helps improve the stock performance of the acquirer. Linguistic difference, which is highly correlated to the Hofstede cultural distance, actually perform slightly better as an explanatory variable for the post-merger stock performance. December 2003
Transcript of Cross-Border M&A: Does Culture Matter?
Cross-Border M&A: Does Culture Matter?
Rajesh Chakrabarti
Narayanan Jayaraman
Swastika Mukherjee
DuPree College of Management, Georgia Institute of Technology,
800 West Peachtree Street, Atlanta, GA 30332
Chakrabarti Jayaraman Mukherjee Tel: (404) 894-5109 (404) 894-4389 (404) 385-2413
E-mail: rajesh.chakrabarti@ mgt.gatech.edu
narayanan.jayaraman@ mgt.gatech.edu
Abstract
We study whether cross-border acquisitions between firms from culturally disparate countries perform differently than those between firms from culturally proximate nations. We use the Hofstede measure of cultural dimensions to define cultural distance. Using a sample of close to 400 cross-border acquisitions from 1990s, we find that while cross-border acquisitions are detrimental to the stock return performance of the acquirer in general, acquirers do better when the acquisitions are between countries with greater cultural distance. We use alternative measures of socio-legal and cultural distance and find that in most cases such distance helps improve the stock performance of the acquirer. Linguistic difference, which is highly correlated to the Hofstede cultural distance, actually perform slightly better as an explanatory variable for the post-merger stock performance.
December 2003

4/9/2004 4:13 PM
Cross-Border M&A: Does Culture Matter?
1. Introduction
The key role that cultural differences play in the success of mergers and
acquisitions, particularly in the case of transnational M&A, is well known among
practitioners. Pautler (2003), in a survey of recent studies of transnational M&A by
consultants, lists managing cultural difference between organizations as central to the
success of a deal. In this paper we investigate the effect that differences in national
culture have on the performance of transnational acquisitions.
Culture is a relatively new entrant in the finance literature. In a series of papers, La
Porta et al (1997, 1999, 2000) have demonstrated the importance of investor protection in
the law on ownership, external finance as well as corporate governance. More recently,
Stulz and Williamson (2003) argue that the culture of a country, as reflected in its
religion and language, have a greater role to play in determining creditor rights than
several variables including the origin of its legal system. Our approach is slightly
different. Instead of looking at religion and language as proxies for culture, we adopt the
measures that are most established in the international business literature – the measures
of different dimensions of culture developed by Hofstede in his seminal work in 1980.
We are not aware of any academic research in the finance area probing the effect of
culture on the performance of mergers and acquisitions. It is only recently that some
researchers in the finance area have begun to use Hofstede measures (see Licht et al
2002a, 2002b) of cultural dimensions. The issue of cultural distance and M&A
performance have been studied somewhat in the international business literature with no
unanimity on the outcome. There are theories and empirics on both sides of the debate on
1

4/9/2004 4:13 PM
whether cultural distance is conducive or detrimental to the post-merger performance of
acquiring firms. Many of these studies, however, suffer from methodological limitations.
We study the performance of 420 transnational mergers and acquisitions between
1991 and 2000 involving acquirers from 34 countries and targets from 37 countries.
Using an event-study methodology, we study the effect of cultural distance on the stock
market performance of the acquiring firms over different horizons extending up to three
years after the deal. We use the Hofstede measures to determine “cultural difference”
between the different countries involved. We find that while on an average acquirers
perform worse than their respective country market indices in the three years following
the acquisition, the long term performance of acquirers is positively related to the
“cultural distance” between them. In other words, mergers between firms from countries
with dissimilar cultures do better than those between firms from countries with similar
cultures. Thus we
Transnational mergers have remained a relatively less explored field in finance,
though they are increasing in frequency and value over time. The SDC database
documents over 1800 international acquisitions in the 1990s. Multi-billion dollar deals
like that of Chrysler Daimler have industry effects implications at a global level. Apart
from documenting the effect of cultural differences on the success of transnational
acquisitions, our paper also contributes to the literature by formally documenting the
performance of such transnational acquisitions.
The rest of the paper is organized as follows. Section 2 discusses the related
literature. Section 3 describes the data. Section 4 reports the results of three-year post-
2

4/9/2004 4:13 PM
merger performance. Section 5 presents some robustness tests. Section 6 provides the
conclusion.
2. Related Literature
This paper stands at the confluence of at least two distinct branches of literature –
that on mergers and acquisitions, particularly transnational M&As and that on culture, or
more specifically the literature on cross-national cultural differences. In this section, we
briefly review the two branches and describe how the present paper relates to the extant
literature.
Cross-national cultural differences – the Hofstede measures
Cross-national differences in culture comprise an important topic in the
International Business area. Such differences affect almost every aspect of international
business particularly the strategic and organizational aspects. Geert Hofstede in his
landmark book on international management, Culture’s Consequences: International
Differences in Work Related Values, divided culture into four dimensions –
individualism, power distance, uncertainty avoidance and masculinity – to which a fifth,
long term orientation, was later added and developed scores for several countries on
these different dimensions. Since then researchers have used the Hofstede measures to
calibrate the different dimensions of a society’s culture and used the difference in the
measures to capture the idea the “cultural distance” in a vast and growing literature in
international business.
3

4/9/2004 4:13 PM
Kirkman et al (2003) provide an exhaustive survey of the literature that has
emerged since the publication of Hofstede’s book. Hofstede measures have not been free
from criticism and are definitely not exact or perfect measures of culture. However, it is
fair to say that they have become the mainstay of “formal” analysis of culture and cross-
cultural differences.
Empirical evidence on long-term acquirer returns
Takeovers are one of the most important and increasingly common events in
corporate finance. Nearly $4 trillion worth of mergers were done in the US alone
between 1998 and 2000 – greater than that in the previous 30 years put together1. The
value of annual global M&A transactions exceeded $ 2.2 trillion in 19992. Consequently,
there is a large body of literature investigating both the short-term stock market
performance of the acquirers and targets and the long-term stock market performance of
the acquirers – primarily focusing on the U.S. acquirers. In a recent survey article, Bruner
(2001) summarizes the findings of 130 studies conducted from 1971 to 2001. The results
of the studies that focused on short-term returns suggest that target shareholders earn
significant positive abnormal returns and that bidders earn zero risk-adjusted returns.
The combined returns of bidders and targets together are positive.
Though the shareholders of the bidding firms earn zero abnormal returns, a wide
cross-sectional variation exists among these returns. As Hietala, Kaplan, and Robinson
(2000) argue, it is often difficult to interpret the evidence on bidder returns because they
would exhibit the combined effect of synergies, the stand-alone value of bidders and
1 Business Week (2002). 2 KPMG (1999)
4
4/9/2004 4:13 PM
target firms, and the potential overpayment by the bidder. Magenheim and Mueller
(1988) find underperformance by the acquiring firms. But, using the same sample with a
different methodology, Bradley and Jarrell (1988) do not report any significant
underperformance in the three-year period following the acquisitions. Agrawal, Jaffe, and
Mandelker (1992), using a methodology that adjusts for firm size and beta, report
significant underperformance of acquiring firms for mergers and insignificant
performance for tender offers. Loughran and Vijh (1997) report similar results. Franks,
Harris, and Titman (1991) find significant underperformance of the acquiring firms in the
post-merger period when using equally weighted index, significant positive performance
when using value weighted index, and insignificant results when using ten-factor or
eight-portfolio benchmarks. Mitchell and Stafford (2000) show significant negative
abnormal returns for the acquiring firms in the post-merger period when using the Fama-
French three-factor model as the benchmark with all observations equally weighted.
However, they report insignificant results when using 25 size and book-to-market
reference portfolios or the Fama-French three-factor model with all observations value
weighted. It appears that the measurement of the acquiring firms’ long-term performance
is sensitive to the measurement methodology employed. In summary, the findings of
previous studies indicate that acquiring firms earn zero or negative abnormal returns in
both the announcement period and the post-merger period. None of these studies focus
on a sample of acquirers that acquire foreign targets.
To date, there has been very limited empirical evidence long-term performance of
acquirers who acquire firms from a foreign country. A successful integration of the target
5
4/9/2004 4:13 PM
firm and the acquiring firm is often key to the success of the combined firm.3 However,
the issue related to integration to a large extent has remained unexplored by studies
investigating the post-merger performance of the acquiring firms.
Culture and Cross-border acquisitions
There are two conflicting views in the management literature on the effect of
culture on long-term performance of cross-border acquisitions: one arguing for improved
long-term performance of cross-border acquisitions and the other arguing for reduced
post-acquisition performance due to culture clashes.
The theory in support of enhanced performance argues that the national cultural
distance enhances cross-border acquisition performance by providing access to target’s
and the acquirer’s diverse set of routines embedded in national culture (Shane, 1992;
Hofstede, 1980; Kogut and Singh, 1988; Barney, 1986). The opposite camp contends
that the relatively larger cultural distance between firms tend to unavoidable cultural
“collisions” during the post-acquisition period. (Jemison and Sitkin, 1986; Buono et al.,
1985)). Jemison and Sitkin (1986) argue that higher level of cultural distance between
firms have been associated with a higher degree of conflict during post-acquisition
period.
The scanty empirical research in the area is equally divided on this issue. Datta
and Puia (1995) analyze completed US cross-border acquisitions between 1978 and 1990
and find that as the overall cultural distance between countries increases, shareholder
wealth in those firms making cross-border acquisitions decreases as a result of the
3 See Kay and Shelton (2000).
6
4/9/2004 4:13 PM
acquisition. On the other hand Morosini, Shane and Singh (1998) provide evidence that
the national cultural distance enhances cross-border acquisition performance.
Both of these studies, in spite of their contribution to the literature, have some
limitations. Datta and Puia (1995) look at windows of up to 30 trading days from the first
press report of the cross-border acquisition in the Wall Street Journal – an approach that
is evidently susceptible with dating errors, and which at best only captures
“announcement effects” and not the log-term performance of the acquiring firm.
Morosini et al (1998) on the other hand, conduct a survey of 400 companies that engaged
in cross-border acquisition activity in Italy between 1987 and 1992. Their usable sample
for empirical analysis consists of only 52 observations. As the authors themselves
acknowledge, their study suffers from some serious limitations. First, by design their
sample consists acquisition in which one of the partners is an Italian firm. The
performance proxy used by them is the percentage sales growth for the two years
following the acquisition and is not a stock market based performance measure.
The present paper
Our study focuses on the effect of cross-national cultural differences on the long-
term stock performance of cross-border acquisitions. We look at over 400 acquisitions
with acquirers from 37 countries and targets from 40 countries. Our horizon for stock
performance ranges up to three years from the effective date of the acquisition. This
study therefore seeks to answer the following question raised in the management
literature. Which of the two opposite effects of acquisition involving firms from
7

4/9/2004 4:13 PM
culturally disparate countries is stronger – the performance enhancing synergy effect or
the dampening integration effect?
3. Data and Variables
Our empirical tests are based on a sample of cross-border acquisitions that
occurred in the ten-year period 1991 to 2002. The data on acquisitions is obtained from
the SDC Platinum Mergers & Acquisitions database. There are well over 1800 cross-
border mergers in this period in the SDC database. We use the announcement date of the
acquisition in constructing the sample and choose acquirers with public status and deal
size over $100 million. The acquirer firms are then matched with available stock market
returns data from DataStream. Monthly stock market returns of acquiring firms as well as
total market index returns for the country of the acquiring firm are obtained from
DataStream. In order to have uniformity across the countries, we use the Datastream
market indices. The matching exercise reduces the number of observations to slightly
over 1200. Next, in order to avoid contamination of the stock returns in our horizon from
multiple events, we drop acquirers conducting multiple cross-border acquisitions within a
three-year period. Finally, we exclude observations from Bermuda, Bahamas, British
Virgin Islands and Puerto Rico, to avoid including “shell” operations. Our final sample
consists of 409 unique acquisitions with 34 different acquirer countries and 37 different
target nations from Asia, Europe, North America, South America, Africa and Australia.
The SDC database also provides us with certain important characteristics of the
different acquisitions. We note whether the acquisitions were friendly or hostile, whether
there was a cash purchase of shares and whether there was a tender offer for shares –
8
4/9/2004 4:13 PM
variables that have been identified in prior research as affecting the success of the
acquisitions. We construct dummy variables based on these characteristics. We also note
if the acquisitions are related or not by comparing the SIC code of the two firms
involved, whether they are completely different, equal at the 3-digit level or equal at the
4-digit level.
Our primary measure of cultural distance, the Hofstede measure, is obtained from
data available on the ITIM website <http://www.itim.org/4aba.html>. The distances are
calculated from the numerical values of the four Hofstede dimension, namely,
Individualism (IDV), Uncertainty Avoidance Index (UAI), Power Distance Index (PDI)
and Masculinity (MAS). It is computed as follows:
Hofstede_distance = 4
)(4
1
2,,∑
=
−i
iTiA SS
where SA,i = Acquirer Score on Dimension i ; ST,i = Target Score on Dimension i
Power Distance Index (PDI) focuses on the degree of equality, or inequality,
between people in the country’s society. Individualism (IDV) focuses on the degree the
society reinforces individual or collective, achievement and interpersonal relationships.
Masculinity (MAS) focuses on the degree the society reinforces, or does not reinforce,
the traditional masculine work role model of male achievement, control, and power.
Uncertainty Avoidance Index (UAI) focuses on the level of tolerance for uncertainty
and ambiguity within the society i.e., unstructured situations.
We also use three other cultural proxies – Language, Religion and Legal Origin.
We follow Stulz & Williamson (2003) for the Language and Religion proxies. The Legal
Origin proxy is obtained from La Porta et al (1998). We use the broad categories of
9
4/9/2004 4:13 PM
common and civil law in our regression analyses and do not differentiate between French,
Scandinavian and German civil law. Dummy variables based on these three
characteristics are used to measure the cultural match between the acquirer and the target
countries. We assign a value of 1 if the proxies are an exact match and a value of 0
otherwise.
Our main aim is to use these values of cultural proxies, which can be easily
measured, to test whether they can explain the variation in long-run performances of
cross-border acquisitions as well as robustness checks. We show that some of the cultural
proxies have a significant effect on the long-run performance of the acquisitions while
other proxies are not significant. We justify the use of Hofstede distance as our primary
measure of cultural distance because language, religion and legal origin are all found to
be highly correlated with the Hofstede measure.
4. Analysis of post-merger performance
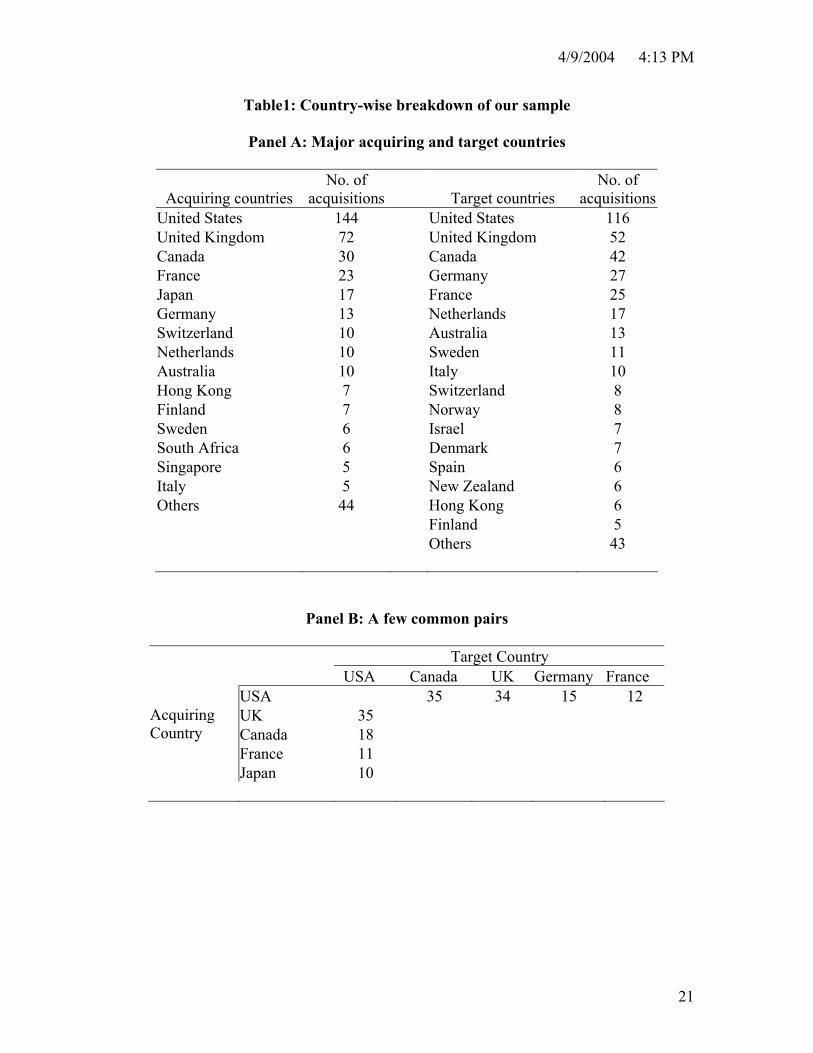
We begin by presenting the chief features of our data. In Table 1 we present a
partial country-wise breakdown of the data. Clearly the United States dominates our
dataset as the host country with both the most acquiring firms as well as the most target
firms. UK is a distant second followed by Canada in both categories. Much of the cross-
border M&A activity appears to be restricted to the developed countries with South
Africa, Hong Kong and Singapore being the only emerging markets involved. As for the
most frequent pairs in our data, the US-Canada and US-UK combinations are the most
common ones. While we have excluded multiple cross-border acquirers to arrive at our
10

4/9/2004 4:13 PM
sample, this pattern may still be indicative of the distribution of overall cross-border
M&A activity in the world.
Table 2 presents a summary of the characteristics of deals covered in our dataset.
We note that all but 3% of cross-border acquisitions in our sample are friendly. Cash
purchase of shares is the likely method of acquisition in close to two-thirds of the cases
while a tender offer is made in only about 20% of cases. While a majority of the
acquisitions are related, a large number (about 40%) are unrelated acquisitions. Thus we
find considerable variation in the mode of acquisitions as well as the relatedness of the
parties involved in the deal. We therefore consider the effects of these variables, in
addition to that of “cultural distance” in explaining the long-term post-merger
performance of the acquiring firms.
The measure we use to capture the long-run performance of the acquiring firm is
the buy-and-hold abnormal return (BHAR). Essentially this indicates the excess return
over the market that an investor buying the shares of the acquiring company will be
enjoying if he made the purchase on the month of the acquisition. Because our focus is on
the actual post-merger performance rather than the “announcement effect” on the stock,
we construct our windows for event-study analysis beginning from the month of the
effective date of the merger rather than the announcement date. We look at five different
window lengths of 12, 18, 24, 30 and 36 months. The BHAR over a relevant window is
then computed in the following manner. The cumulative return over the window is
computed by compounding the monthly returns on the acquiring company’s stock over
the window. The cumulative market return for the country of the acquirer is computed in
an analogous way. The difference between the two returns is the BHAR for the acquiring
11
4/9/2004 4:13 PM
company over the window. The BHAR methodology is standard in studies of long-term
stock performance (see Mitchell and Stafford (2000) for instance). In terms of computing
abnormal returns, there are two standard methods – the simple excess of stock returns
over market returns and the risk-adjusted abnormal returns. The latter takes into account
the beta of the stock in computing the abnormal returns. We use the first method here.
Table 3 presents the summary statistics for the BHARs of the acquiring company
over different windows. Since data is not available for every acquiring company for the
entire 36-month post-merger period, the number of observations decline as the length of
the window increases. One thing that is evident from table 3 is the negative performance
of the average acquirer vis-à-vis its country index. The mean BHAR is negative in every
single window and starts becoming significantly negative as the time passes – for the 30-
month and the 36-month windows. Clearly then cross-border acquisitions do not seem to
work out to the advantage of the average acquirer. This is similar to the consensus view
of the effect of domestic acquisitions on stock returns for US companies.
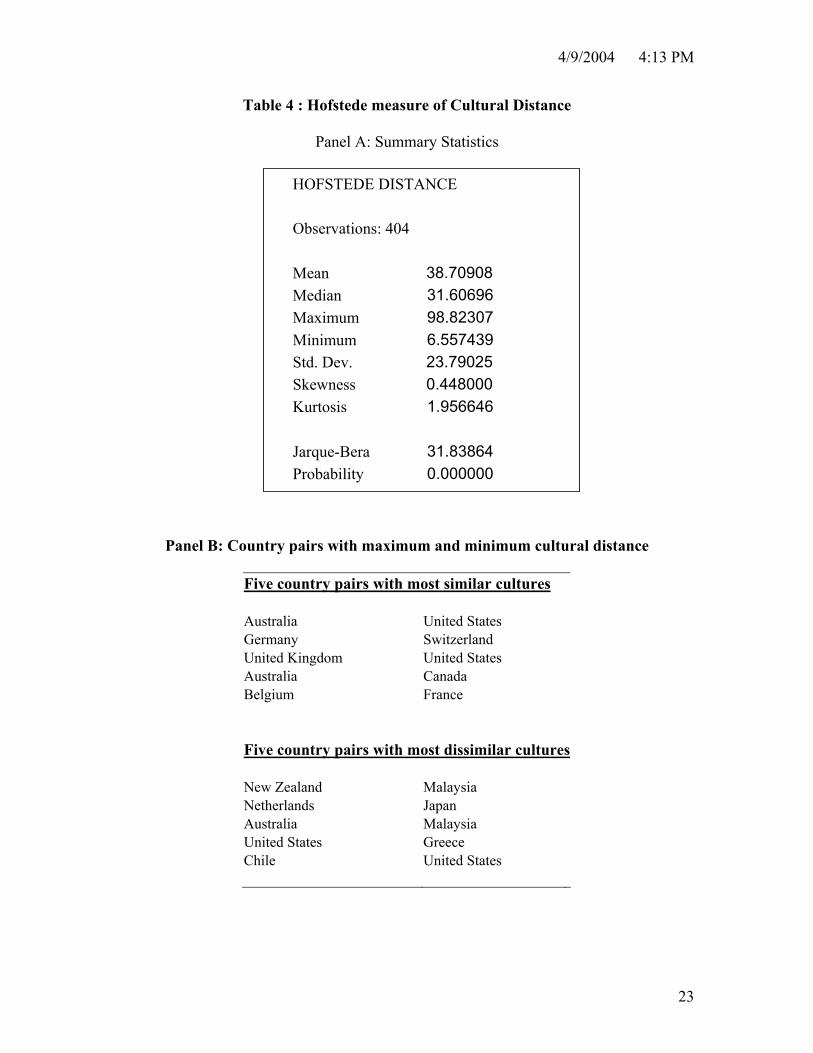
In Table 4 panel A, we present the summary statistics for the key explanatory
variable of our study, the Hofstede measure of cultural distance. Table 4 panel B shows
the five country pairs with maximum similarity in culture and the five pairs with most
dissimilar cultures.
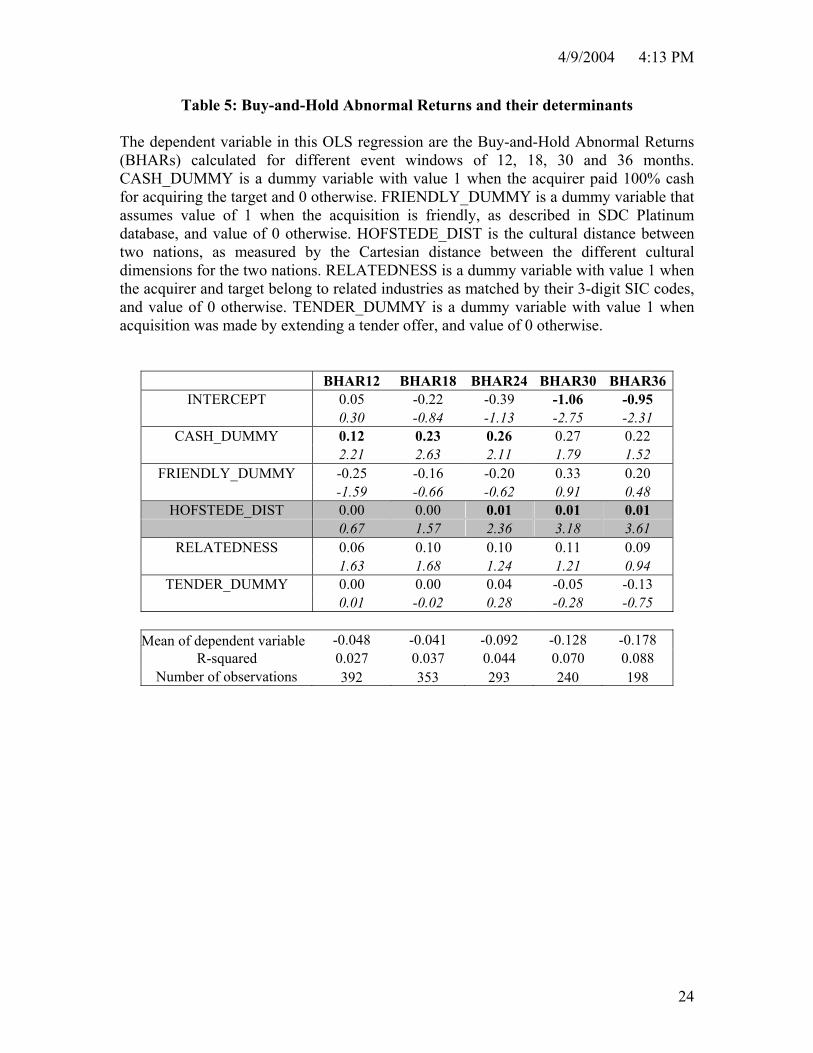
In Table 5, we present the results of our first regression. The dependent variables
are the BHARs of acquiring companies over different event-windows. The independent
variables are the various deal characteristics as well as the Hofstede measure of cultural
distance. As the regressions show, the only variable that turns out to be significant in the
regression is the Hofstede cultural distance. Also it is positively significant, indicating
12
4/9/2004 4:13 PM
that as cultural distance increases, so does the BHAR of the acquiring firm. Also the
effect of cultural distance becomes uniformly more pronounced and significant with the
passage of time, suggesting that this effect is coming from actual operational effects of
the combined firm rather than any anticipatory stock market reaction.
Another notable feature of these regressions is the increase in the R2 with increase
in window length. Clearly, in the short horizon after the event, there is a lot of dispersion
on the stock price effects and the explanatory variables do not explain much of this rather
random dispersion. As time passes however, the overall negative effect of the acquisition
as well as the positive effect of Hofstede’s cultural distance measure becomes more
pronounced (all the regressions are significant at 5% level). We see this in the negative
significance of the intercept term and the positive significance of the cultural distance
variable. We also note that the “cash” dummy is significant in the short and medium run,
i.e. up to two years but its effects disappear in the longer term.
Next we look at the performance of US firms making cross-border acquisitions.
As over a third of our total sample falls in this category, it is important to ascertain their
performance separately. Table 6 shows the regression results for this sub-sample. The
Hofstede measure is once again significantly positive, particularly in the long run. Clearly
then, US acquisitions too work well when the targets are from lands whose culture is
different from American culture. As before cash purchases appear to do better in the short
to medium term.
In view of the fact that the financial press is often agog with corporate culture
clash ruining mergers (e.g. Daimler Chrysler and AOL Time Warner), our finding that
companies from countries with disparate cultures actually lead to better mergers, is
13

4/9/2004 4:13 PM
perhaps a bit intriguing. However, as we mentioned earlier, this opposite possibility has
also been theorized in the international business literature. As Morosini et al (1998) point
out, the acquisition of diversified “routines and repertoires” helps a company functioning
in the global marketplace. Cultural distance enhances the difference of the “routines and
repertoires” embedded in the target firm from that of the acquiring company and thus
helps the combined entity to perform better. Of course, this benefit has to be measured
against the possible “collision” effects of firms from completely different cultures in the
post-merger integration process. Our results suggest that in the cross-border M & A
setting, the former effect seems to outweigh the latter risk.
A caveat in interpreting these results is in place here. We would like to draw a
distinction between national culture and corporate culture in this context. It is quite
possible that two firms from the same country may have very different corporate cultures
providing them with benefits and challenges in a merger. National cultures are likely to
influence corporate cultures but the two remain distinct notions. It is quite possible that
while the benefits of having varied “routines and repertoires” may be limited in a
domestic merger, differences in corporate cultures may actually make the union unviable
in the integration process. Our results therefore should not be interpreted as an
unqualified “different is compatible” recommendation.
5. Alternative measures of socio-legal distance and performance
The Hofstede measure of cultural distance that we use in our analysis is one of
several measures of the degree of dissonance between socio-legal characteristics of
different countries. Other recent studies in finance (Stulz and Williamson (2003)) have
14

4/9/2004 4:13 PM
used differences in religion and language to capture cultural differences while La Porta et
al (1998, 1999, 2000) have used origin of legal system as another important feature that
determines the financial structure in the country. We study the relationship between the
different measures of socio-legal differences in table 7. Our dummy variables for
religion, language and legal origin take the value 0 when two countries have the same
feature and 1 when they are different. As table 7 shows, the Hofstede measures are highly
correlated with the religion and legal origin variables suggesting that the differences in
the different aspects go together.
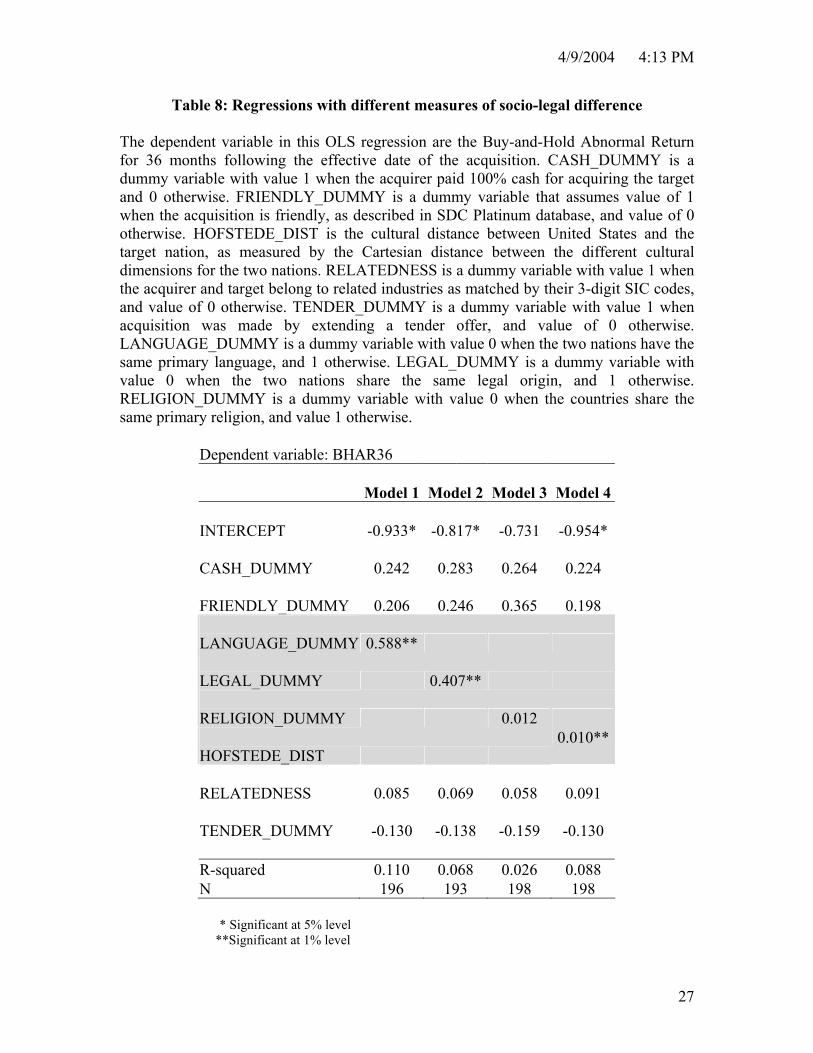
It is difficult to establish which of these alternative measures explain post-merger
success in cross-border M&As. However, we conduct a simple “horse-race” of the four
alternative measures in Table 8. Here we use one measure at a time in a regression with
the other variables in our previous regressions in the four different models. It turns out
that the language dummy performs even better than the Hofstede measure, which
dominates the other two in explaining the variation on the three year buy and hold returns
for firms making international acquisitions. While these regressions do not prove the
superiority of one measure over another in capturing socio-legal differences that affect
finance in general (clearly the results disagree with Stulz and Williamson (2003) for one
thing), they do provide preliminary indication that lingual differences and cultural
differences make for the best recipes of success in the case of cross-border M&As.
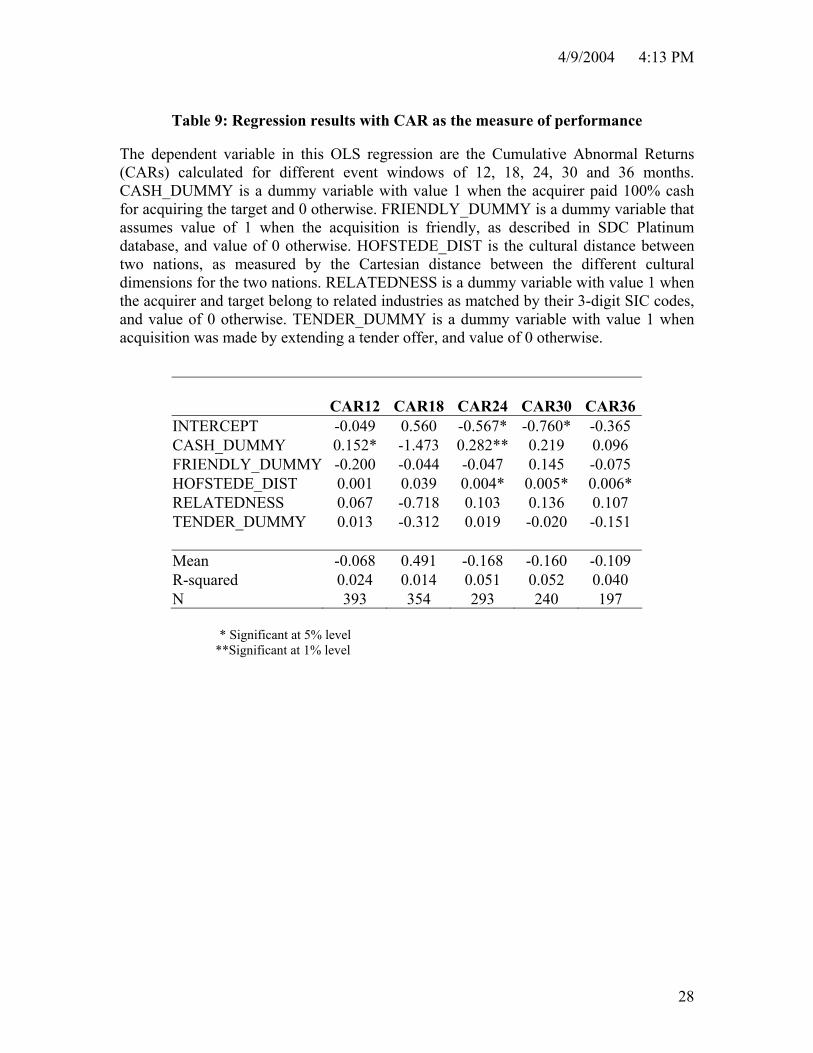
Finally we investigate if the culture effects that we detected using buy-and-hold
returns are robust to an alternative measurement of performance – the cumulative
abnormal returns (CAR). The CARs are computed as the sum of monthly abnormal
returns of the acquiring firms over the returns on the relevant national index. Thus the
15
4/9/2004 4:13 PM
chief difference between BHARs and CARs comes from compounding. BHARs take into
account the compounding while CARs do not. While BHARs are more frequently used in
long-term studies, CARs are also used quite often in event studies. Table 9 shows the
regression results with the CARs for different horizons as the dependent variables.
Qualitatively, these results are indistinguishable from those in Table 5. Thus our results
are robust to the specification of the performance metric.
6. Conclusion
Several recent papers have underlined the influence of culture on finance. Stulz
and Williamson (2003) have demonstrated the effect of national culture on protection of
creditor rights, which in turn determine the nature of financial markets around the world.
We investigate the effect of culture on finance in a more restricted setting, a situation
when two cultures meet – that of a merger or acquisition. Analyzing the long-term post-
merger stock performance of over 400 cross-border acquisitions in the 90’s and using the
measures of cultural distance developed by Geert Hofstede and used widely in the
international business literature, we find that while cross-border acquisitions in general
have been detrimental to the acquirer’s stock prices in the long-run, companies coming
from countries with greater disparity in culture have actually done better in a merger than
those from countries that are culturally more akin to one another.
While differences in culture may lead to problems in post-merger
integration, mergers between firms from culturally disparate countries arm the acquirer
with a diverse set of “routines and repertoires” that help in their functioning in the global
marketplace. This effect appears to be stronger than integration problems stemming from
16

4/9/2004 4:13 PM
cultural differences. It is also possible that for mergers between firms from completely
different cultures may lead to lesser integration problems since the target firm may be
allowed to function with greater autonomy.
Clearly the effects of culture on finance and even cross-border M&A are
multi-faceted. The channels through which they enter the M&A, the exact nature of the
diversity of routines and strategies and how they help the acquirer’s performance, as well
as the challenges cultural dissonance pose in the integration process are all important
questions in corporate finance. The relationship between corporate cultures and national
cultures is also an area that needs further investigation. We leave the exploration of these
topics to future research.
17

4/9/2004 4:13 PM
References
Agrawal, Anup, Jeffrey F. Jaffe, and Gershon N. Mandelker, 1992, The post-merger performance of acquiring firms: a re-examination of an anomaly, Journal of Finance 47: 1605-1621 Agrawal, Anup and Jeffrey F. Jaffe, 1999, The post-merger performance puzzle, Working Paper, University of Alabama. Barber, Brad M. and John D. Lyon, 1997, Detecting long-run abnormal stock returns: the empirical power and specification of test statistics, Journal of Financial Economics 43: 341-372 Barney, Jay B. 1986, Organizational Culture: Can it be a source of sustained competitive advantage? Academy of Management Review, 11(3), 656-665. Bradley, Michael, Anand Desai, and E. Han Kim, 1988, Synergistic gains from corporate acquisitions and their division between the stockholders of target and acquiring firms, Journal of Financial Economics 21: 3-40 Bradley, Michael, and Gregg Jarrell, Comment, Chapter 15 in John Coffee, Jr., Louis Lowenstein, and Susan Rose-Ackerman, eds., Knights, Raiders and Targets, Oxford, England: Oxford University Press, 1988, pp.253-259 Brown, Stephen J., Jerold B. Warner, 1980, Measuring security price performance, Journal of Financial Economics 8: 205-258 Brown, Stephen J., Jerold B. Warner, 1985, Using daily stock returns-the case of event studies, Journal of Financial Economics 14: 3-31 Bruner, R.F., 2001, Does M&A Pay? A survey of evidence for the decision-maker, Darden Graduate School of Business Administration, University of Virginia, Working Paper. Datta, D. K., 1991, Organizational fit and acquisition performance; effects of post-acquisition integration, Strategic Management Journal 12: 281-297. Fama, Eugene F., 1998, Market efficiency, long-term returns, and behavioral finance, Journal of Financial Economics 49: 283-306 Franks, Julian, Robert Harris, and Sheridan Titman, 1991, The post-merger share-price performance of acquiring firms, Journal of Financial Economics 29: 81-96
18
4/9/2004 4:13 PM
Hansen R., and J. Lott, 1996, Externalities and corporate objectives in a world with diversified shareholders/consumers, Journal of Financial Quantitative Analysis 31: 43-68. Healy, Paul M., Krishna G. Palepu and Richard S. Ruback, 1992, Does corporate performance improve after mergers? Journal of Financial Economics 31: 135-175 Hietala, Pekka, Steven Kaplan, and David Robinson, 2000, What is the price of hubris? using takeover battles to infer overpayments and synergies, Working Paper, University of Chicago. Hofstede, Geert 1980. Culture’s consequences: International differences in work-related values. Beverly Hills: Sage Publications. Hofstede, G., Bram Neuijen, Denise D. Ohayv & Geert Sanders, 1990. Measuring Organizational cultures: A qualitative and quantitative study across twenty cases, Administrative Science Quarterly, 35: 286-316. Jaffe, Jeffrey F., 1974, Special information and insider trading, Journal of Business 47(3): 410-428 Jarrell, Gregg A., James A. Brickley, and Jeffrey M. Netter, 1988, The market for corporate control: the empirical evidence since 1980, Journal of Economic Perspectives 2(1): 49-68. Jemison, David B. and S. B. Sitkin, 1986, Corporate Acquisitions: A process perspective, Academy of Management Review, 11(1), 145-163. Kay, Ira T. and Mike Shelton, 2000, The people problem in mergers, The McKinsey quarterly 2000(4): 27-37 Kogut, B and Harbir Singh, 1988, The effect of national culture on the choice of entry mode, Journal of International Business Studies, 19(3): 411-432. Loughran, Tim and Anand M. Vijh, 1997, Do long-term shareholders benefit from corporate acquisitions? Journal of Finance 52: 1765-1790 Lyon, John D., Brad M. Barber, and Chih-Ling Tsai, 1999, Improved methods for tests of long-run abnormal stock returns, Journal of Finance 54: 165-201 Magenheim, Ellen B., and Dennis C. Muller, Are acquiring firm shareholders better off after an acquisition? Chapter 11 in John Coffee, Jr., Louis Lowenstein, and Susan Rose-Ackerman, eds., Knights, raiders and Targets, Oxford, England: Oxford University press, 1988, pp. 171-193
19
4/9/2004 4:13 PM
Mitchell, Mark L. and Erik Stafford, 2000, Managerial decisions and long-term stock price performance, Journal of Business 73(3): 287-329 Morck, Randall, Andrei Shleifer, and Robert W. Vishny, 1990, Do managerial objectives drive bad acquisitions? Journal of Finance 45(1): 31-48. Morosini, P., S. Shane, and H. Singh, 1998, National Cultural Distance and Cross-Border Acquisition Performance, Journal of International Business Studies, 29, 1 (First Quarter 1998): 137-156. Rau, P. Raghavendra and Theo Vermaelen, 1998, Glamour, value, and the post-acquisition performance of acquiring firms, Journal of Financial Economics 49: 223-253 Roll, Richard, 1986, The hubris hypothesis of corporate takeovers, Journal of Business 59(2): 197-216 Shane, 1992
20
4/9/2004 4:13 PM
Table1: Country-wise breakdown of our sample
Panel A: Major acquiring and target countries
Acquiring countries No. of
acquisitions
Target countries No. of
acquisitionsUnited States 144 United States 116 United Kingdom 72 United Kingdom 52 Canada 30 Canada 42 France 23 Germany 27 Japan 17 France 25 Germany 13 Netherlands 17 Switzerland 10 Australia 13 Netherlands 10 Sweden 11 Australia 10 Italy 10 Hong Kong 7 Switzerland 8 Finland 7 Norway 8 Sweden 6 Israel 7 South Africa 6 Denmark 7 Singapore 5 Spain 6 Italy 5 New Zealand 6 Others 44 Hong Kong 6 Finland 5 Others 43
Panel B: A few common pairs
Target Country USA Canada UK Germany France USA 35 34 15 12 UK 35 Canada 18 France 11
Acquiring Country
Japan 10
21

4/9/2004 4:13 PM
Table 2: Summary description of data
Cash vs. Non-cash, Friendly vs. Hostile, Tender Offer vs. Non-tender offer, Unrelated vs. Related (matched with 3-digit SIC code, or 4-digitSIC code) are the characteristics we use to categorize the acquisitions.
Number Percent Total number of acquisitions 409 100 Cash 254 62 Non-cash 154 38 Friendly 397 97 Hostile 12 3 Tender offer 82 20 No tender offer 327 80 Unrelated 165 40 Related at 3-digit SIC level 181 44 Related at 4-digit SIC level 63 15
Table 3: Summary statistics for the Buy-and-Hold Abnormal Returns (BHAR)
BHAR12, BHAR18, BHAR30, BHAR36 are the Buy-and-Hold Abnormal Returns for twelve, eighteen, twenty-four, thirty and thirty-six months respectively
BHAR12
BHAR18
BHAR24
BHAR30 BHAR36 Observations 399 359 296 243 201
Mean -0.05 -0.05 -0.10 -0.14 -0.20
t-stat for Mean -1.88 -1.09 -1.74 -1.98 -2.77 Median -0.08 -0.14 -0.24 -0.30 -0.32
Maximum 3.05 5.00 6.17 7.37 3.88 Minimum -1.15 -1.89 -3.10 -2.12 -3.58 Std. Dev. 0.52 0.79 1.00 1.08 1.01 Skewness 1.14 2.21 2.87 2.79 0.95 Kurtosis 7.26 12.07 17.58 16.85 6.01
Jarque-Bera statistic
(test of normality) 388.59 1523.24 3028.17 2258.79 105.85 Probability 0.00 0.00 0.00 0.00 0.00
22
4/9/2004 4:13 PM
Table 4 : Hofstede measure of Cultural Distance
Panel A: Summary Statistics
0.000000Probability31.83864Jarque-Bera
1.956646Kurtosis 0.448000Skewness 23.79025Std. Dev. 6.557439Minimum 98.82307Maximum 31.60696Median
38.70908Mean
HOFSTEDE DISTANCE
Observations: 404
Panel B: Country pairs with maximum and minimum cultural distance
Five country pairs with most similar cultures Australia United States Germany Switzerland United Kingdom United States Australia Canada Belgium France Five country pairs with most dissimilar cultures New Zealand Malaysia Netherlands Japan Australia Malaysia United States Greece Chile United States
23
4/9/2004 4:13 PM
Table 5: Buy-and-Hold Abnormal Returns and their determinants
The dependent variable in this OLS regression are the Buy-and-Hold Abnormal Returns (BHARs) calculated for different event windows of 12, 18, 30 and 36 months. CASH_DUMMY is a dummy variable with value 1 when the acquirer paid 100% cash for acquiring the target and 0 otherwise. FRIENDLY_DUMMY is a dummy variable that assumes value of 1 when the acquisition is friendly, as described in SDC Platinum database, and value of 0 otherwise. HOFSTEDE_DIST is the cultural distance between two nations, as measured by the Cartesian distance between the different cultural dimensions for the two nations. RELATEDNESS is a dummy variable with value 1 when the acquirer and target belong to related industries as matched by their 3-digit SIC codes, and value of 0 otherwise. TENDER_DUMMY is a dummy variable with value 1 when acquisition was made by extending a tender offer, and value of 0 otherwise.
BHAR12 BHAR18 BHAR24 BHAR30 BHAR36INTERCEPT 0.05 -0.22 -0.39 -1.06 -0.95
0.30 -0.84 -1.13 -2.75 -2.31 CASH_DUMMY 0.12 0.23 0.26 0.27 0.22
2.21 2.63 2.11 1.79 1.52 FRIENDLY_DUMMY -0.25 -0.16 -0.20 0.33 0.20
-1.59 -0.66 -0.62 0.91 0.48 HOFSTEDE_DIST 0.00 0.00 0.01 0.01 0.01
0.67 1.57 2.36 3.18 3.61 RELATEDNESS 0.06 0.10 0.10 0.11 0.09
1.63 1.68 1.24 1.21 0.94 TENDER_DUMMY 0.00 0.00 0.04 -0.05 -0.13
0.01 -0.02 0.28 -0.28 -0.75 Mean of dependent variable . -0.048 -0.041 -0.092 -0.128 -0.178
R-squared 0.027 0.037 0.044 0.070 0.088 Number of observations 392 353 293 240 198
24

4/9/2004 4:13 PM
Table 6: Performance of US acquisitions
The dependent variable in this OLS regression are the Buy-and-Hold Abnormal Returns (BHARs) calculated for different event windows of 12, 18, 24, 30 and 36 months. The BHAR is the average BHAR across all US acquirers. CASH_DUMMY is a dummy variable with value 1 when the acquirer paid 100% cash for acquiring the target and 0 otherwise. FRIENDLY_DUMMY is a dummy variable that assumes value of 1 when the acquisition is friendly, as described in SDC Platinum database, and value of 0 otherwise. HOFSTEDE_DIST is the cultural distance between United States and the target nation, as measured by the Cartesian distance between the different cultural dimensions for the two nations. RELATEDNESS is a dummy variable with value 1 when the acquirer and target belong to related industries as matched by their 3-digit SIC codes, and value of 0 otherwise. TENDER_DUMMY is a dummy variable with value 1 when acquisition was made by extending a tender offer, and value of 0 otherwise.
BHAR12
BHAR18
BHAR24
BHAR30
BHAR36
INTERCEPT -0.271 -0.443 -1.012 -1.328 -1.358 CASH_DUMMY 0.241* 0.466* 0.550* 0.680* 0.524
FRIENDLY_DUMMY -0.075 -0.043 0.277 0.151 0.090 HOFSTEDE_DIST 0.000 0.003 0.010* 0.018** 0.019** RELATEDNESS 0.050 0.061 0.054 0.177 0.210
TENDER_DUMMY -0.039 -0.197 -0.276 -0.452 -0.378
Mean of BHAR -0.148 -0.069 -0.030 -0.065 -0.228 R-squared 0.055 0.069 0.100 0.172 0.194
Number of observations 140 131 116 96 82 * Significant at 5% level **Significant at 1% level
25

4/9/2004 4:13 PM
Table 7: Correlation matrix of different measures of cultural distance
HOFSTEDE_DIST is the cultural distance between two nations, as measured by the Cartesian distance between the different cultural dimensions for the two nations. LANGUAGE_DUMMY is a dummy variable with value 1 when the two nations have the same primary language, and 0 otherwise. LEGAL_DUMMY is a dummy variable with value 1 when the two nations share the same legal origin, and 0 otherwise. RELIGION_DUMMY is a dummy variable with value 1 when the countries share the same primary religion, and value 0 otherwise.
LANGUAGE_DUMMY
LEGAL_DUMMY
RELIGION_DUMMY
HOFSTEDE_DIST
0.79 0.51 0.38
LANGUAGE_DUMMY
0.69 0.23
LEGAL_DUMMY
0.17
26
4/9/2004 4:13 PM
Table 8: Regressions with different measures of socio-legal difference
The dependent variable in this OLS regression are the Buy-and-Hold Abnormal Return for 36 months following the effective date of the acquisition. CASH_DUMMY is a dummy variable with value 1 when the acquirer paid 100% cash for acquiring the target and 0 otherwise. FRIENDLY_DUMMY is a dummy variable that assumes value of 1 when the acquisition is friendly, as described in SDC Platinum database, and value of 0 otherwise. HOFSTEDE_DIST is the cultural distance between United States and the target nation, as measured by the Cartesian distance between the different cultural dimensions for the two nations. RELATEDNESS is a dummy variable with value 1 when the acquirer and target belong to related industries as matched by their 3-digit SIC codes, and value of 0 otherwise. TENDER_DUMMY is a dummy variable with value 1 when acquisition was made by extending a tender offer, and value of 0 otherwise. LANGUAGE_DUMMY is a dummy variable with value 0 when the two nations have the same primary language, and 1 otherwise. LEGAL_DUMMY is a dummy variable with value 0 when the two nations share the same legal origin, and 1 otherwise. RELIGION_DUMMY is a dummy variable with value 0 when the countries share the same primary religion, and value 1 otherwise.
Dependent variable: BHAR36 Model 1 Model 2 Model 3 Model 4 INTERCEPT -0.933* -0.817* -0.731 -0.954* CASH_DUMMY 0.242 0.283 0.264 0.224 FRIENDLY_DUMMY 0.206 0.246 0.365 0.198 LANGUAGE_DUMMY 0.588** LEGAL_DUMMY 0.407** RELIGION_DUMMY 0.012 HOFSTEDE_DIST
0.010**
RELATEDNESS 0.085 0.069 0.058
0.091
TENDER_DUMMY -0.130 -0.138 -0.159
-0.130
R-squared 0.110 0.068 0.026 0.088 N 196 193 198 198
* Significant at 5% level **Significant at 1% level
27
4/9/2004 4:13 PM
28
Table 9: Regression results with CAR as the measure of performance
The dependent variable in this OLS regression are the Cumulative Abnormal Returns (CARs) calculated for different event windows of 12, 18, 24, 30 and 36 months. CASH_DUMMY is a dummy variable with value 1 when the acquirer paid 100% cash for acquiring the target and 0 otherwise. FRIENDLY_DUMMY is a dummy variable that assumes value of 1 when the acquisition is friendly, as described in SDC Platinum database, and value of 0 otherwise. HOFSTEDE_DIST is the cultural distance between two nations, as measured by the Cartesian distance between the different cultural dimensions for the two nations. RELATEDNESS is a dummy variable with value 1 when the acquirer and target belong to related industries as matched by their 3-digit SIC codes, and value of 0 otherwise. TENDER_DUMMY is a dummy variable with value 1 when acquisition was made by extending a tender offer, and value of 0 otherwise.
CAR12 CAR18 CAR24 CAR30 CAR36 INTERCEPT -0.049 0.560 -0.567* -0.760* -0.365 CASH_DUMMY 0.152* -1.473 0.282** 0.219 0.096 FRIENDLY_DUMMY -0.200 -0.044 -0.047 0.145 -0.075 HOFSTEDE_DIST 0.001 0.039 0.004* 0.005* 0.006* RELATEDNESS 0.067 -0.718 0.103 0.136 0.107 TENDER_DUMMY 0.013 -0.312 0.019 -0.020 -0.151 Mean -0.068 0.491 -0.168 -0.160 -0.109 R-squared 0.024 0.014 0.051 0.052 0.040 N 393 354 293 240 197
* Significant at 5% level **Significant at 1% level