County Profile 2013 - Pulaski County - CP60 · PULASKI COUNTY PROFILE 2013 Wayne Miller, Professor...
39
Pulaski County CP60
Transcript of County Profile 2013 - Pulaski County - CP60 · PULASKI COUNTY PROFILE 2013 Wayne Miller, Professor...

Pulaski County
CP60
PULASKI COUNTY PROFILE2013
Wayne Miller, ProfessorThai Nguyen, Intern
Arkansas
Ashley
BaxterBenton Boone
BradleyCalhoun
Carroll
Chicot
Clark
Clay
Cleburne
Cleveland
Columbia
Conway
Craighead
Crawford
Crittenden
Cross
Dallas
Desha
Drew
Faulkner
Franklin
Fulton
Garland
Grant
Greene
Hempstead
Hot Spring
Howard
Independence
Izard
Jackson
Jefferson
Johnson
Lafayette
Lawrence
Lee
Lincoln
Little River
Logan
Lonoke
Madison
Marion
Miller
Mississippi
MonroeMontgomery
Nevada
Newton
Ouachita
Perry
Phillips
Pike
Poinsett
Polk
Pope
PrairiePulaski
Randolph
St. Francis
Saline
Scott
Searcy
Sebastian
Sevier
Sharp
Stone
Union
Van Buren
Washington
WhiteWoodruff
Yell
Foreword & Acknowledgments
The University of Arkansas System Division of Agriculture Cooperative Extension Service is pleased to release these updated county profiles in hopes that these publications may serve as a useful tool for local officials, community leaders and economic development professionals. This publication provides a comparison and overview of the demographic, economic and social trends in Arkansas counties. The information is presented in graphs and maps to allow the reader to quickly grasp current trends and conditions and gain insight into local and regional contexts. We encourage leaders and decision makers to use this publication in conjunction with their knowledge of the local geography, culture and political environment to make wise decisions for Arkansas’ future. The state agencies providing data and assistance for this publication include the State Data Center at the University of Arkansas at Little Rock, the Arkansas Department of Workforce Services, the Arkansas Department of Education, and the Arkansas Department of Health and Human Services. We thank the many individuals at these departments and organizations for their quick response to our requests for information. Several departments and individuals of the University of Arkansas worked in collaboration to publish these county profiles. Wayne Miller, Community and Economic Development, coordinated the project. Thai Nguyen compiled the data and developed graphs and charts. Vuko Karov developed the maps and checked the data for accuracy. Chris Meux designed the cover, and Donna Rinke published the profiles on the Cooperative Extension website. Their many hours of effort are greatly appreciated. We hope you find this publication useful as you plan for the future of your communities. Tony E. Windham, Ph.D. Associate Vice President for Agriculture-Extension and Director, Cooperative Extension Service
II
II
III
IV
VI
1
6
8
12
17
18
21
22
23
26
28
28
29
Population………………………….……
Education………………………………
Table of Contents
Table of Contents………………………
List of Figures……………………………
Forward & Acknowledgments…….. ………………………………………………………
………………………………………………………
………………………………………………………
Internet Sources of Information…………………………………………………………………
Employment…………………………..
Income………………………………….
Retail………………………………….
Forestry……………………………...……
Poverty……………………………………
Household……………………………..
Agriculture………………………………
Health…………………………………
………………………………………………………
………………………………………………………
………………………………………………………
………………………………………………………
Glossary………………………………..
(For Local Staff Chair See Inside Backcover)
County Roads…………………………..
Property Assessment……………………
………………………………………………………
…………………………………………………………
………………………….……………………………
………………………………………………………
………………………………………………………
…………………………...……………………………
………………………………………………………
………………………………………………………
………………………………………………………
III
Figure 1 1Figure 2 1Figure 3 2Figure 4 2Figure 5 3Figure 6 3Figure 7 4Figure 8 4Figure 9 5Figure 10 5
Figure 11 6Figure 12 6Figure 13 7Figure 14 7
Figure 15 8Figure 16 8Figure 17 9Figure 18 9Figure 19 10Figure 20 10Figure 21 11Figure 22 11
Figure 23 12Figure 24 12Figure 25 13Figure 26 13Figure 27 14Figure 28 14Figure 29 15Figure 30 15Figure 31 16Figure 32 16
Employment
FiguresPage
Labor Force………………………………………….……………………
Description Figure
Population
Education
Population of Hispanic Origin…………………..……………………..…
Change in Employment…………………………..……………….………Unemployment Rates………………………………..…………….………Unemployment Rates, State………………………………………….……Jobs by Sector……..……………………………….………………………
Total Personal Income……………………………………...……..………Income by Source…………………………………………….……………
Workforce by Occupation…………………………….……………………Changes in Jobs by Sector……………………...…………………..…….Jobs in Top Ten Manufacturing Sectors…………………………………
Population……………………………………..…………………...………Population Change……………………………………….………………
Migration of People………………………….……………………………
Population by Age Pyramid…………………………………………..……Population by Age …………………………...……………………………Population 65 and Older………………….………………………………Population Change of People 65 and Older……………..……………….
Public School Enrollment………………………...………………………Educational Attainment………………...…………………………………Expenditure Per Child……………………………………………..……..Revenue by Source…………………………………..……………………
Population by Household Type……………….………………………….Population by Race……………………………………...……………….
Income
Personal Income by Source………………………………….……………Median Household Income………………………………………………Per Capita Income, County………………………………………………Per Capita Income, State……………………………………..……………Earnings by Sector………….………………………...……………………Per Capita Unemployment Insurance Benefits…………………………..Value Added of Manufacturing Sectors……………...…………………..Earnings of Manufacturing Sector, State……………………...………...
IV
Figure 33 17Figure 34 17
Figure 35 18Figure 36 18Figure 37 19Figure 38 19Figure 39
20Figure 40 20
Figure 41 21Figure 42 21
Figure 43 22Figure 44 22
Figure 45 23Figure 46 23Figure 47 24Figure 48 24Figure 49 25Figure 50 25Figure 51 26
Figure 52 26Figure 53 27Figure 54 27
Figure 55 28
Figure 56 28
Proportion of Population Medicaid Eligible………………………...……
HealthInfant Mortality Rate…………………………………………………….…
Miles of County Roads Per Person…………………………………
Source of Farm Income, County & State…………………...……………Farm Income, County………………………………………….…………
Assessments Per Person………………………………………………….
Transportation
Percent of Land in Forest by County……………….……………………Area of Timberland by Ownership Class…………………..…………….
ForestryTimber Output……………………………………………………………
Property Assessments
Source of Farm Income, County………………………………...…………Number of Farms, County……………………………………...…………
Single Head of Family…………………………………………………Female Headed Families…………………………………………….……
AgricultureMarket Value of Agricultural Products Sold, County………...…………Market Value of Agricultural Products Sold, State……….…..…………Farms & Percent of Sales by Size………………………………...………
Households
Description Figure
Retail
FiguresPage
Total Retail Sales, County…………………………………………………Retail Sales Per Capita, State………………………………………………
Age Groups & Poverty……………………………………………………
Persons Below Poverty Level, County……………………………………Persons Below Poverty Level, State………………………………………
Poverty
Proportion of Students Receiving Free or Reduced Lunch………………Proportion of Population Participating in the Supplemented Nutrition Assistance
Teen Fertility Rate……………………………………………….………
V
Internet Sources of Information
Population Bureau of Census – 2010 Census .......................................http://2010.census.gov/2010census/data/ Bureau of Census ................................................................www.census.gov Bureau of Economic Analysis .............................................www.bea.gov/bea/regional/data.htm U.S. Census Bureau, American Community Survey ...........http://factfinder2.census.gov/
Education Arkansas Department of Education, ADE Data Center ......http://adedata.arkansas.gov/ Arkansas Public School Computer Network .......................http://www.apscn.org/reports/reports.htm U.S. Census Bureau, American Community Survey ...........http://factfinder2.census.gov/
Employment Arkansas Department of Workforce Services .....................www.arkansas.gov/esd/ Discover Arkansas, Labor Market Information ..................www.discoverarkansas.net/cgi/dataanalysis/ Bureau of Economic Analysis .............................................www.bea.doc.gov/bea/regional/data.htm U.S. Census Bureau, American Community Survey ...........http://factfinder2.census.gov/ Minnesota IMPLAN Group, Inc ......................................... www.implan.com
Income Bureau of Economic Analysis .............................................www.bea.gov/bea/regional/data.htm U.S. Census Bureau, American Community Survey ...........http://factfinder2.census.gov/ Discover Arkansas, Labor Market Information ..................www.discoverarkansas.net/cgi/dataanalysis/ Minnesota IMPLAN Group, Inc. ........................................ www.implan.com
Retail Sales Woods & Poole, 2011 ........................................................ www.woodsandpoole.com
Poverty Arkansas Department of Education, ADE Data Center ......http://adedata.arkansas.gov/ U.S. Census Bureau, American Community Survey ...........http://factfinder2.census.gov/ Arkansas Department of Human Services ..........................http://humanservices.arkansas.gov/
Health Arkansas Department of Health ..........................................www.healthyarkansas.com/data/data.html Arkansas Advocates for Children & Families .....................http://datacenter.kidscount.org/data/
Households U.S. Census Bureau, American Community Survey ...........http://factfinder2.census.gov/
Agriculture National Agricultural Statistical Service (NASS) ...............www.agcensus.usda.gov/Publications/2007/ Bureau of Economic Analysis .............................................www.bea.gov/bea/regional/data.htm
Forestry U.S. Forest Service .....................................................................http://srsfia2.fs.fed.us/php/tpo_2009/tpo_rpa_int1.php U.S. Forest Service, Southern Forest Inventory & Analysis ......http://www.srs.fs.usda.gov/
Property Assessments Arkansas Assessment Coordination Department ................www.arkansas.gov/acd/
Transportation Arkansas Highway & Transportation Department ..............www.arkansashighways.com
VI
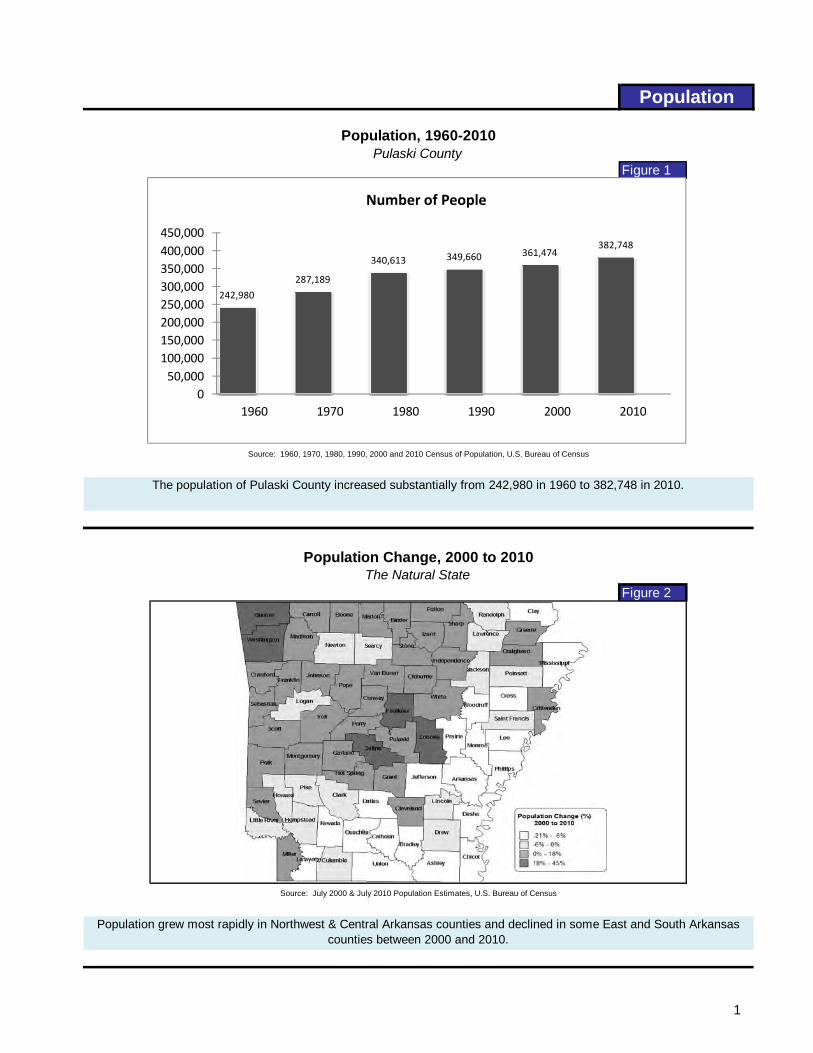
Figure 1
Figure 2
Population
Source: July 2000 & July 2010 Population Estimates, U.S. Bureau of Census
Population, 1960-2010Pulaski County
Population grew most rapidly in Northwest & Central Arkansas counties and declined in some East and South Arkansas counties between 2000 and 2010.
Source: 1960, 1970, 1980, 1990, 2000 and 2010 Census of Population, U.S. Bureau of Census
The population of Pulaski County increased substantially from 242,980 in 1960 to 382,748 in 2010.
The Natural StatePopulation Change, 2000 to 2010
242,980
287,189
340,613 349,660 361,474382,748
050,000100,000150,000200,000250,000300,000350,000400,000450,000
1960 1970 1980 1990 2000 2010
Number of People
1
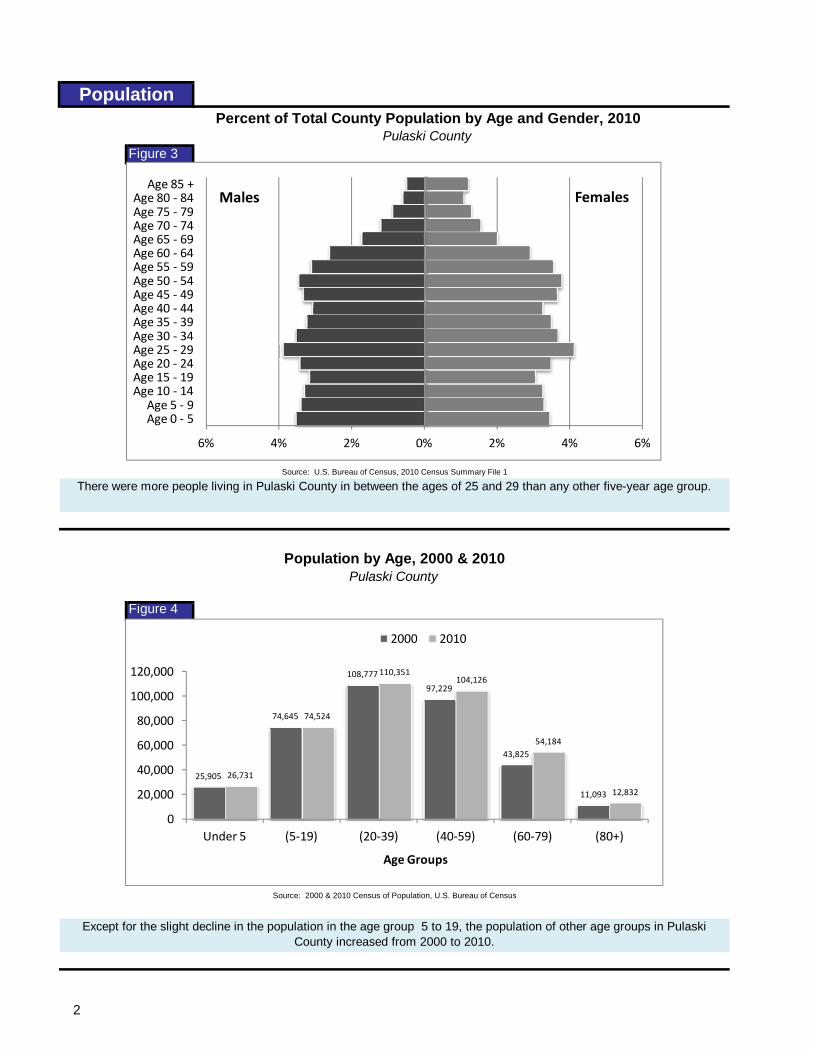
Figure 3
Figure 4
There were more people living in Pulaski County in between the ages of 25 and 29 than any other five-year age group.
Except for the slight decline in the population in the age group 5 to 19, the population of other age groups in Pulaski County increased from 2000 to 2010.
Population
Pulaski County
Source: 2000 & 2010 Census of Population, U.S. Bureau of Census
Population by Age, 2000 & 2010
Source: U.S. Bureau of Census, 2010 Census Summary File 1
Pulaski CountyPercent of Total County Population by Age and Gender, 2010
25,905
74,645
108,777
97,229
43,825
11,093
26,731
74,524
110,351104,126
54,184
12,832
0
20,000
40,000
60,000
80,000
100,000
120,000
Under 5 (5‐19) (20‐39) (40‐59) (60‐79) (80+)
Age Groups
2000 2010
6%4%2%0%2%4%6%
Age 0 ‐ 5Age 5 ‐ 9
Age 10 ‐ 14Age 15 ‐ 19Age 20 ‐ 24Age 25 ‐ 29Age 30 ‐ 34Age 35 ‐ 39Age 40 ‐ 44Age 45 ‐ 49Age 50 ‐ 54Age 55 ‐ 59Age 60 ‐ 64Age 65 ‐ 69Age 70 ‐ 74Age 75 ‐ 79Age 80 ‐ 84
Age 85 +Males Females
2
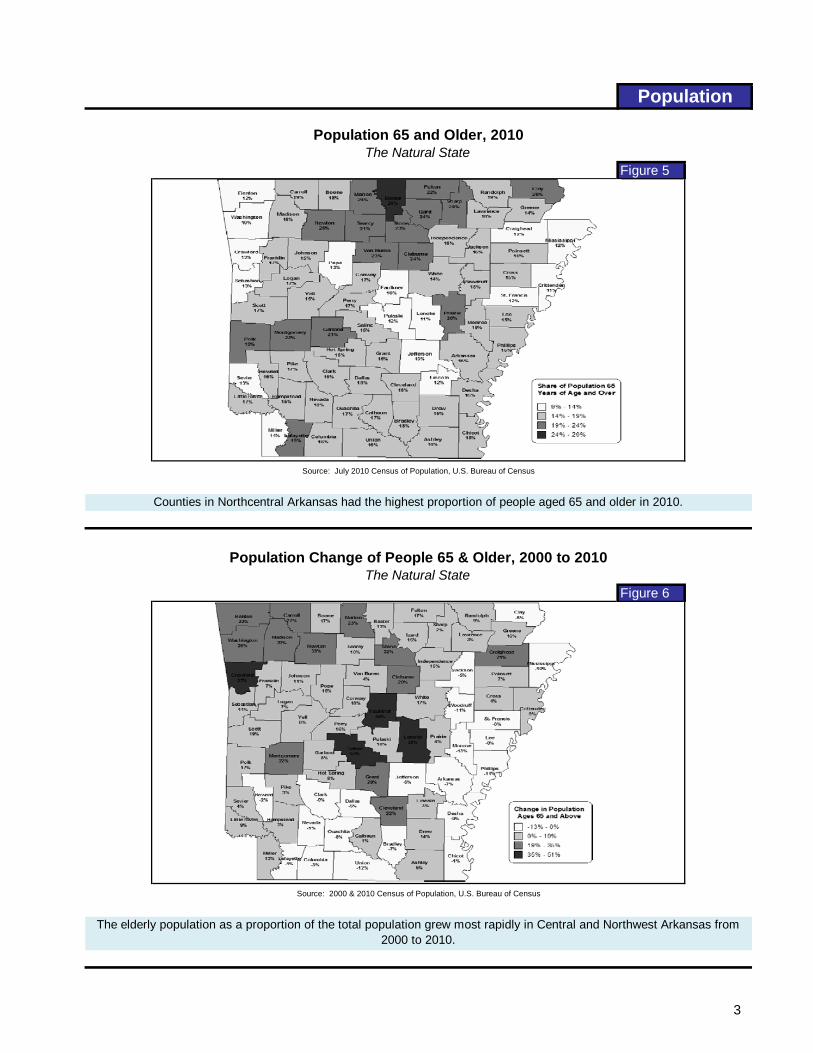
Figure 5
Figure 6
Source: 2000 & 2010 Census of Population, U.S. Bureau of Census
Counties in Northcentral Arkansas had the highest proportion of people aged 65 and older in 2010.
The elderly population as a proportion of the total population grew most rapidly in Central and Northwest Arkansas from 2000 to 2010.
Population
Source: July 2010 Census of Population, U.S. Bureau of Census
The Natural State
Population 65 and Older, 2010The Natural State
Population Change of People 65 & Older, 2000 to 2010
3
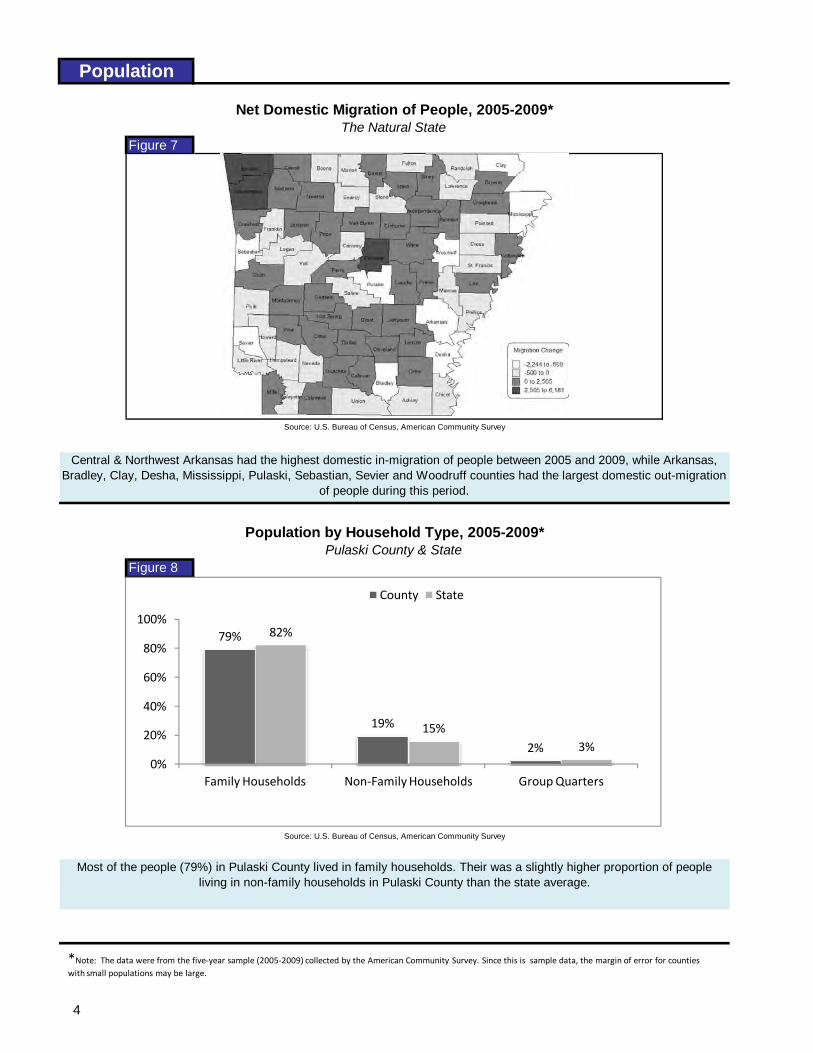
Figure 7
Figure 8
Source: U.S. Bureau of Census, American Community Survey
Central & Northwest Arkansas had the highest domestic in-migration of people between 2005 and 2009, while Arkansas, Bradley, Clay, Desha, Mississippi, Pulaski, Sebastian, Sevier and Woodruff counties had the largest domestic out-migration
of people during this period.
Most of the people (79%) in Pulaski County lived in family households. Their was a slightly higher proportion of people living in non-family households in Pulaski County than the state average.
Population
Pulaski County & State
Net Domestic Migration of People, 2005-2009*The Natural State
Population by Household Type, 2005-2009*
Source: U.S. Bureau of Census, American Community Survey
79%
19%
2%
82%
15%3%
0%
20%
40%
60%
80%
100%
Family Households Non‐Family Households Group Quarters
County State
*Note: The data were from the five‐year sample (2005‐2009) collected by the American Community Survey. Since this is sample data, the margin of error for counties with small populations may be large.
4
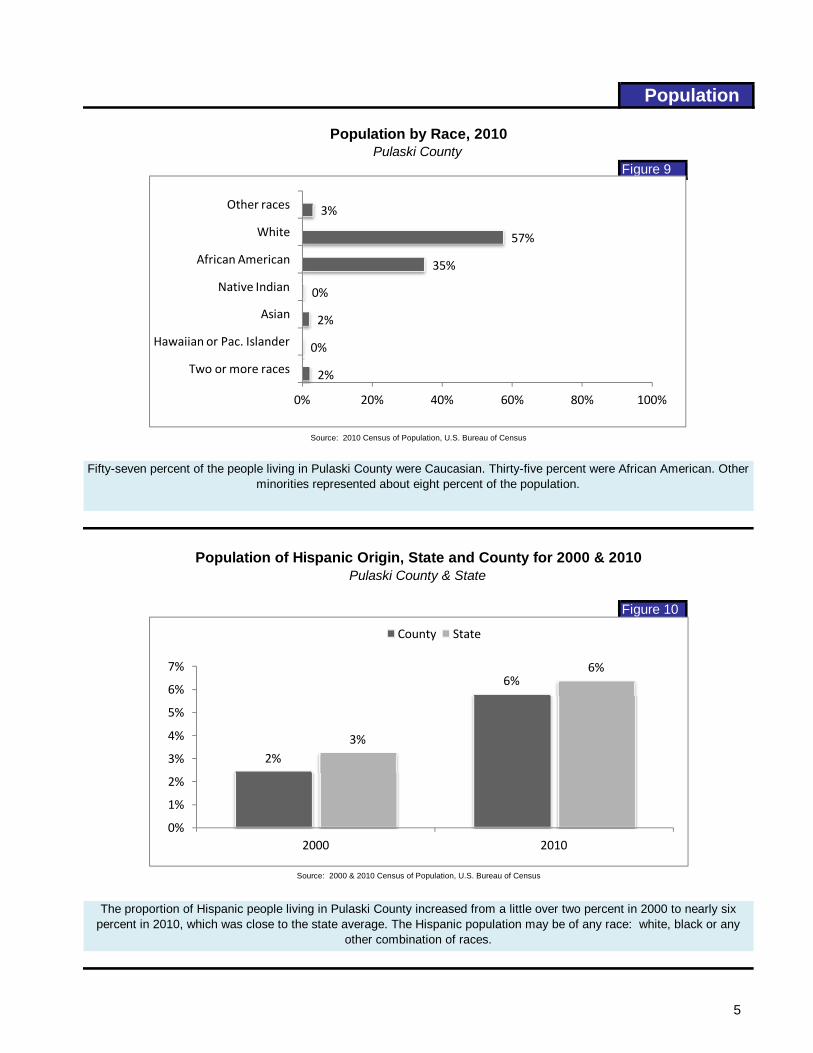
Figure 9
Figure 10
Population
Pulaski County & State
Population by Race, 2010Pulaski County
Population of Hispanic Origin, State and County for 2000 & 2010
The proportion of Hispanic people living in Pulaski County increased from a little over two percent in 2000 to nearly six percent in 2010, which was close to the state average. The Hispanic population may be of any race: white, black or any
other combination of races.
Source: 2010 Census of Population, U.S. Bureau of Census
Fifty-seven percent of the people living in Pulaski County were Caucasian. Thirty-five percent were African American. Other minorities represented about eight percent of the population.
Source: 2000 & 2010 Census of Population, U.S. Bureau of Census
2%
6%
3%
6%
0%
1%
2%
3%
4%
5%
6%
7%
2000 2010
County State
2%
0%
2%
0%
35%
57%
3%
0% 20% 40% 60% 80% 100%
Two or more races
Hawaiian or Pac. Islander
Asian
Native Indian
African American
White
Other races
5
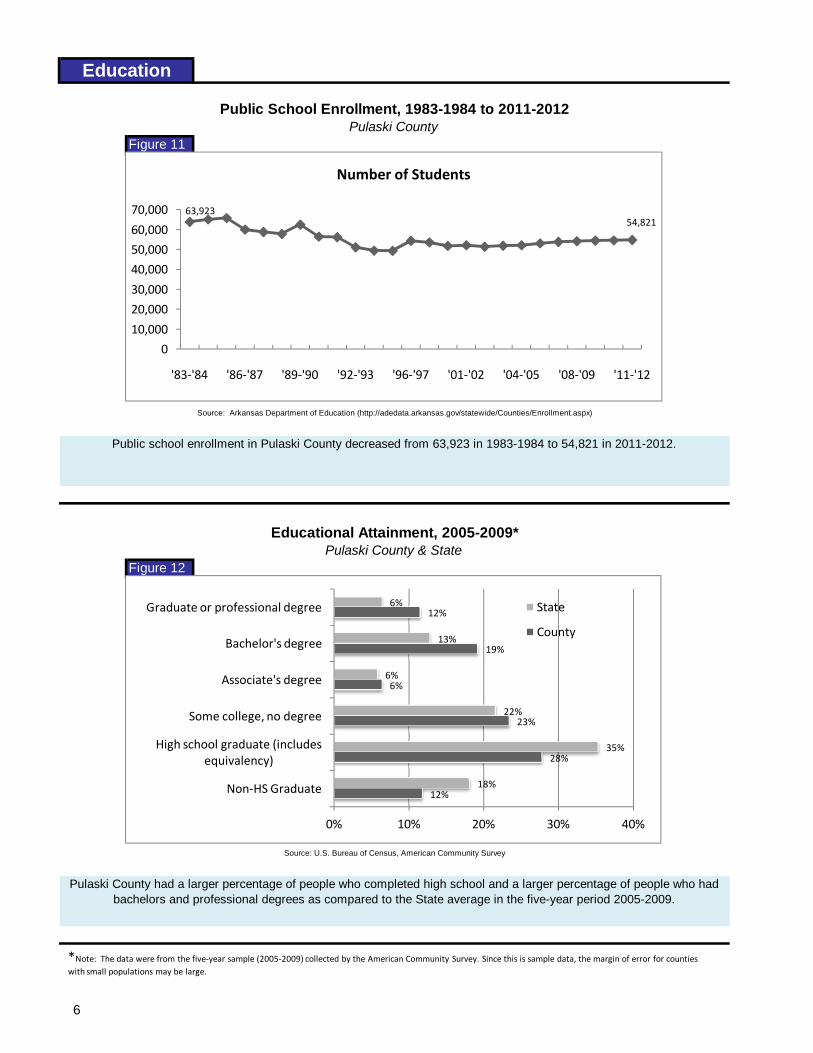
Figure 11
Figure 12
Source: U.S. Bureau of Census, American Community Survey
Source: Arkansas Department of Education (http://adedata.arkansas.gov/statewide/Counties/Enrollment.aspx)
Pulaski County had a larger percentage of people who completed high school and a larger percentage of people who had bachelors and professional degrees as compared to the State average in the five-year period 2005-2009.
Education
Public school enrollment in Pulaski County decreased from 63,923 in 1983-1984 to 54,821 in 2011-2012.
Pulaski County & State
Public School Enrollment, 1983-1984 to 2011-2012Pulaski County
Educational Attainment, 2005-2009*
63,92354,821
0
10,000
20,000
30,000
40,000
50,000
60,000
70,000
'83‐'84 '86‐'87 '89‐'90 '92‐'93 '96‐'97 '01‐'02 '04‐'05 '08‐'09 '11‐'12
Number of Students
12%
28%
23%
6%
19%
12%
18%
35%
22%
6%
13%
6%
0% 10% 20% 30% 40%
Non‐HS Graduate
High school graduate (includes equivalency)
Some college, no degree
Associate's degree
Bachelor's degree
Graduate or professional degree State
County
*Note: The data were from the five‐year sample (2005‐2009) collected by the American Community Survey. Since this is sample data, the margin of error for counties with small populations may be large.
6
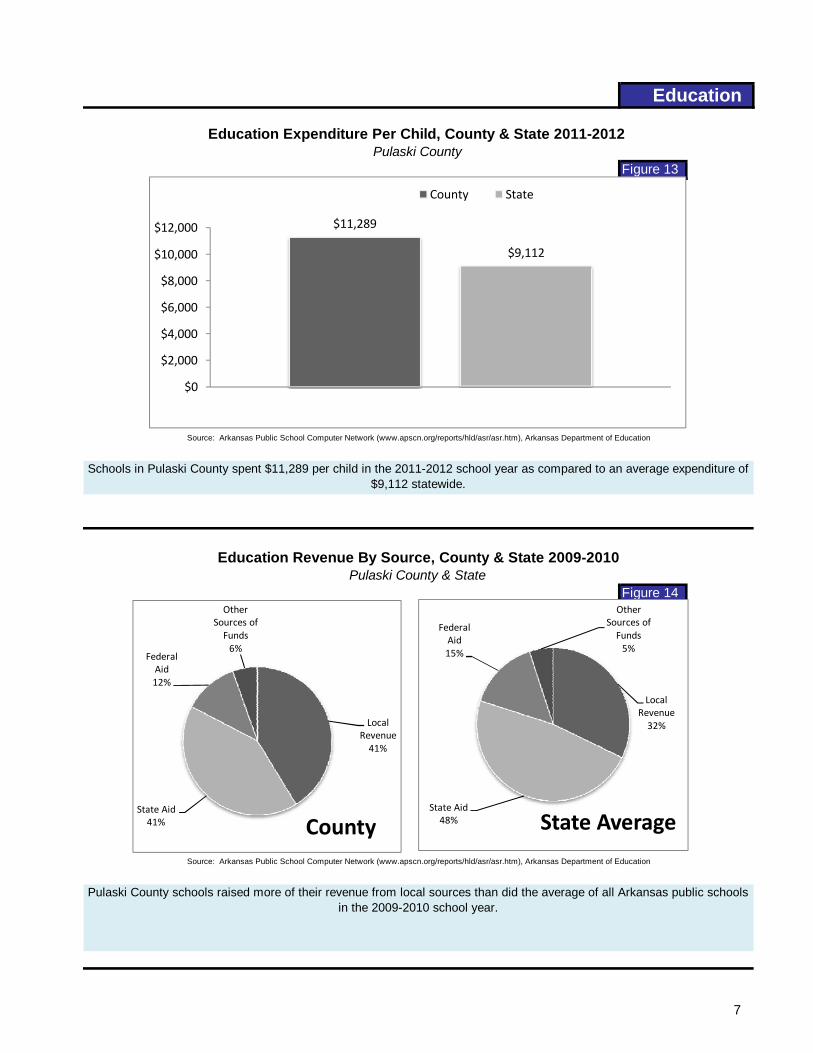
Figure 13
Figure 14
Pulaski County schools raised more of their revenue from local sources than did the average of all Arkansas public schools in the 2009-2010 school year.
Source: Arkansas Public School Computer Network (www.apscn.org/reports/hld/asr/asr.htm), Arkansas Department of Education
Schools in Pulaski County spent $11,289 per child in the 2011-2012 school year as compared to an average expenditure of $9,112 statewide.
Education
Pulaski County & State
Education Expenditure Per Child, County & State 2011-2012 Pulaski County
Education Revenue By Source, County & State 2009-2010
Source: Arkansas Public School Computer Network (www.apscn.org/reports/hld/asr/asr.htm), Arkansas Department of Education
$11,289
$9,112
$0
$2,000
$4,000
$6,000
$8,000
$10,000
$12,000
County State
Local Revenue41%
State Aid41%
Federal Aid12%
Other Sources of Funds6%
County
Local Revenue32%
State Aid48%
Federal Aid15%
Other Sources of Funds5%
State Average
7
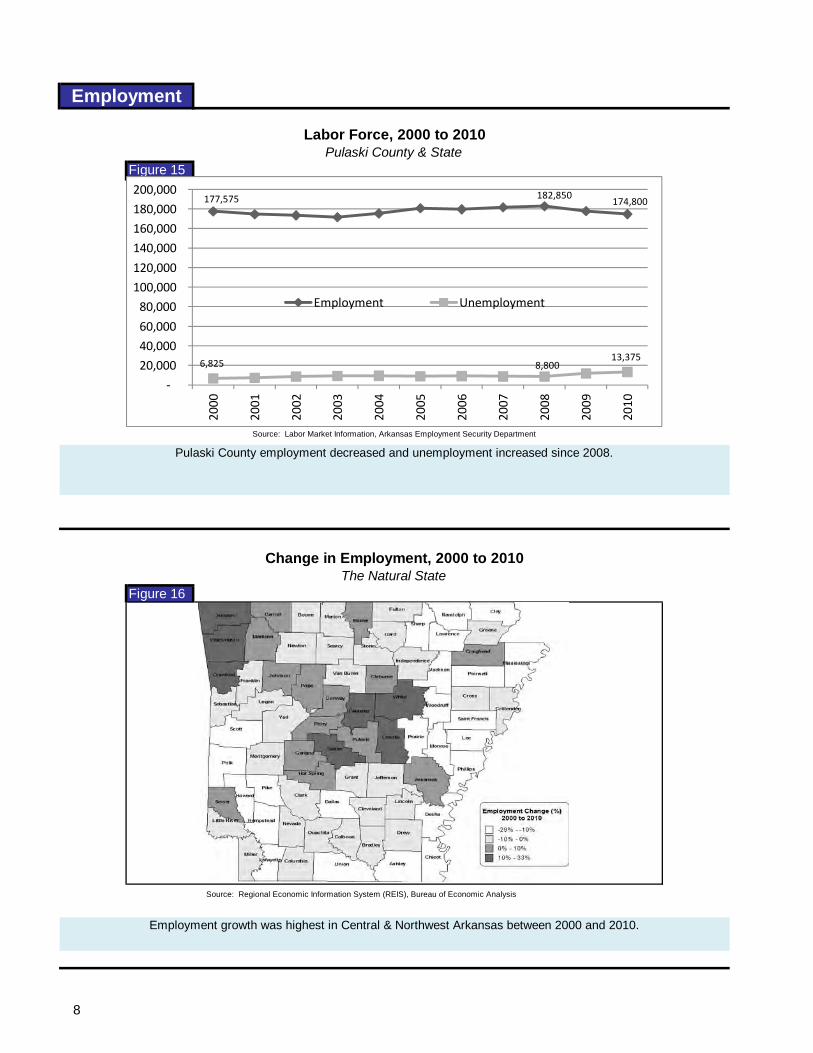
Figure 15
Figure 16
Employment
Labor Force, 2000 to 2010Pulaski County & State
Pulaski County employment decreased and unemployment increased since 2008.Source: Labor Market Information, Arkansas Employment Security Department
Employment growth was highest in Central & Northwest Arkansas between 2000 and 2010.
Change in Employment, 2000 to 2010The Natural State
Source: Regional Economic Information System (REIS), Bureau of Economic Analysis
177,575 182,850 174,800
6,825 8,800 13,375
‐
20,000
40,000
60,000
80,000
100,000
120,000
140,000
160,000
180,000
200,000
2000
2001
2002
2003
2004
2005
2006
2007
2008
2009
2010
Employment Unemployment
8
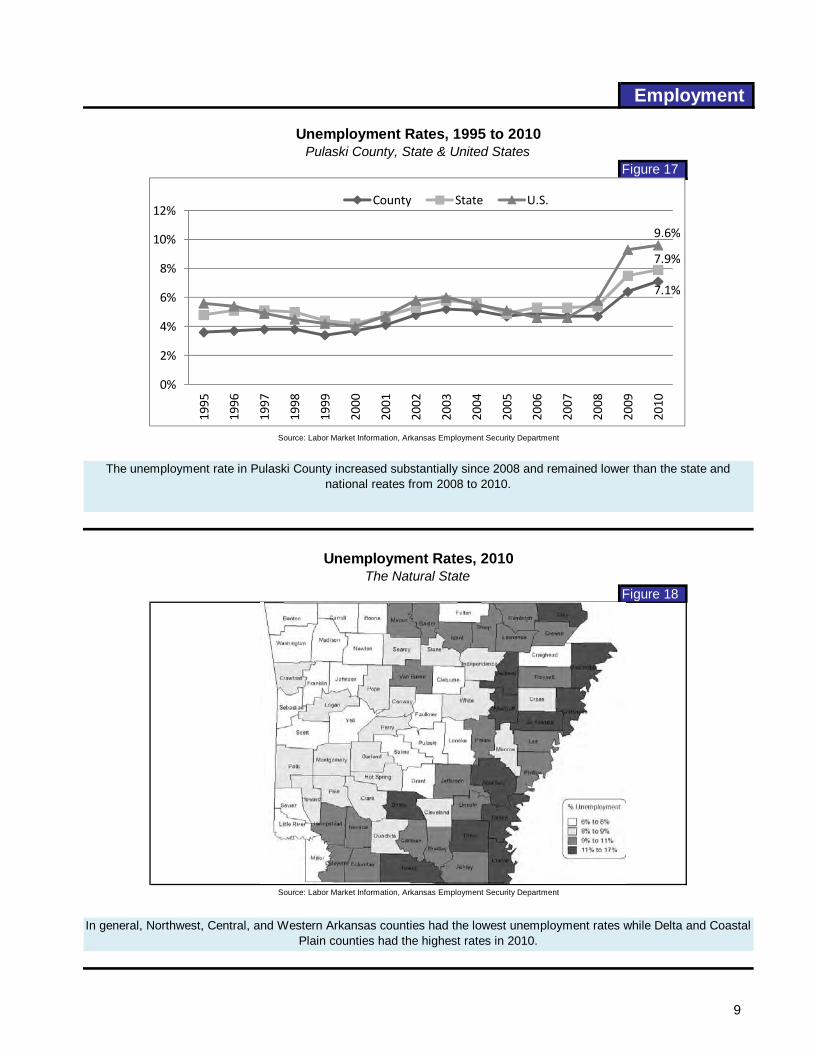
Figure 17
Figure 18
Employment
Unemployment Rates, 1995 to 2010Pulaski County, State & United States
In general, Northwest, Central, and Western Arkansas counties had the lowest unemployment rates while Delta and Coastal Plain counties had the highest rates in 2010.
Source: Labor Market Information, Arkansas Employment Security Department
The unemployment rate in Pulaski County increased substantially since 2008 and remained lower than the state and national reates from 2008 to 2010.
The Natural StateUnemployment Rates, 2010
Source: Labor Market Information, Arkansas Employment Security Department
7.1%
7.9%
9.6%
0%
2%
4%
6%
8%
10%
12%1995
1996
1997
1998
1999
2000
2001
2002
2003
2004
2005
2006
2007
2008
2009
2010
County State U.S.
9
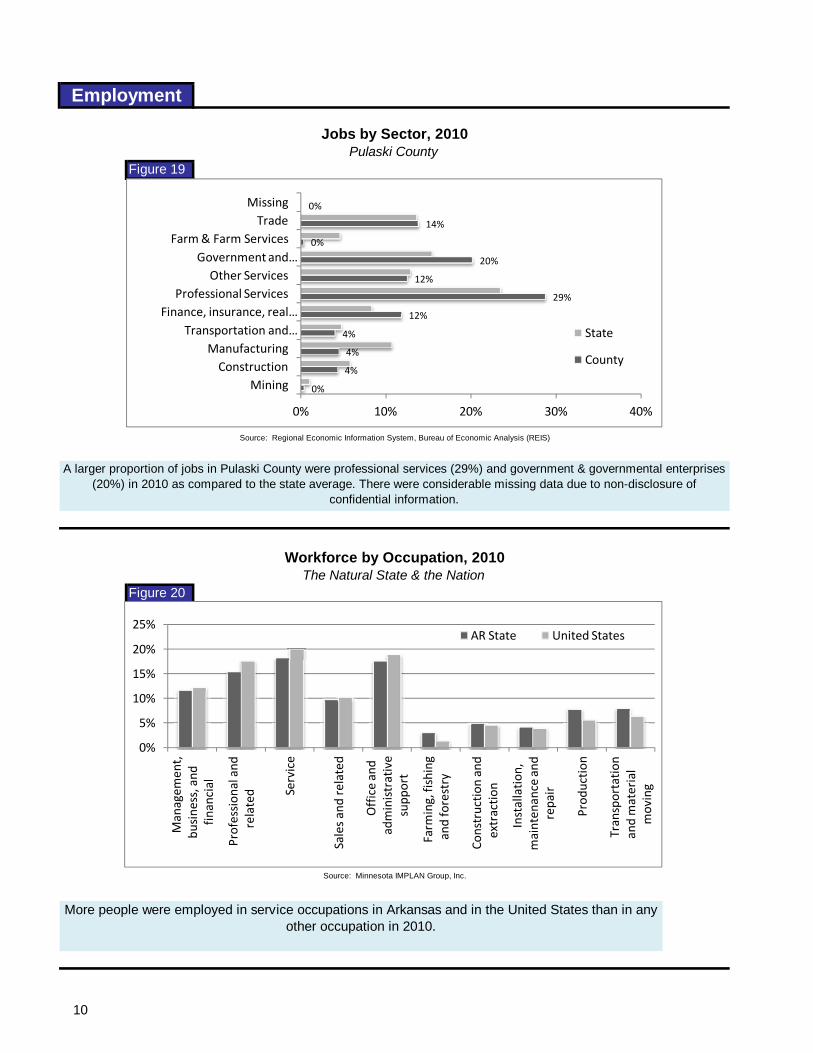
Figure 19
Figure 20
More people were employed in service occupations in Arkansas and in the United States than in any other occupation in 2010.
Source: Minnesota IMPLAN Group, Inc.
A larger proportion of jobs in Pulaski County were professional services (29%) and government & governmental enterprises (20%) in 2010 as compared to the state average. There were considerable missing data due to non-disclosure of
confidential information.
Employment
The Natural State & the Nation
Jobs by Sector, 2010Pulaski County
Workforce by Occupation, 2010
Source: Regional Economic Information System, Bureau of Economic Analysis (REIS)
0%
5%
10%
15%
20%
25%
Managem
ent,
busine
ss, and
fin
ancial
Profession
al and
related Service
Sales and related
Office and
administrative
supp
ort
Farm
ing, fishing
and forestry
Constructio
n and
extractio
n
Installatio
n,
mainten
ance and
repair
Prod
uctio
n
Transportatio
n and material
moving
AR State United States
0%
4%
4%
4%
12%
29%
12%
20%
0%
14%
0%
0% 10% 20% 30% 40%
MiningConstruction
ManufacturingTransportation and …
Finance, insurance, real …Professional Services
Other ServicesGovernment and …
Farm & Farm ServicesTrade
Missing
State
County
10
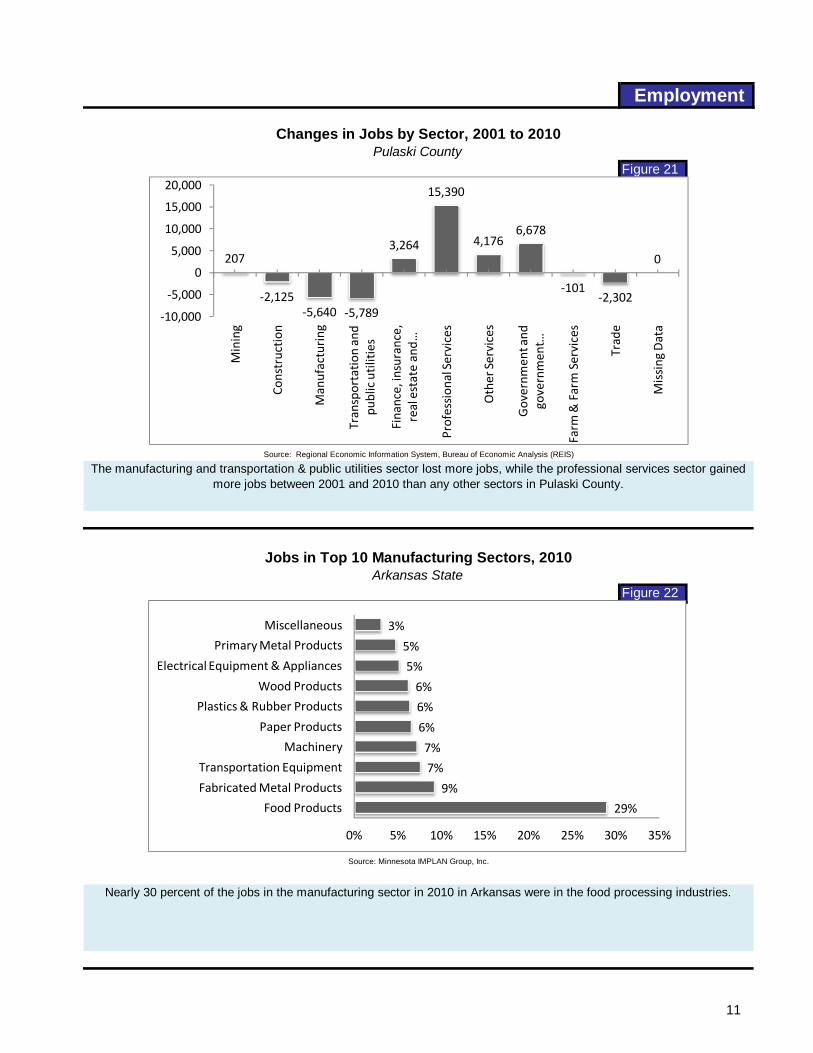
Figure 21
Figure 22
Source: Minnesota IMPLAN Group, Inc.
Arkansas State
Nearly 30 percent of the jobs in the manufacturing sector in 2010 in Arkansas were in the food processing industries.
Jobs in Top 10 Manufacturing Sectors, 2010
The manufacturing and transportation & public utilities sector lost more jobs, while the professional services sector gained more jobs between 2001 and 2010 than any other sectors in Pulaski County.
Source: Regional Economic Information System, Bureau of Economic Analysis (REIS)
Employment
Changes in Jobs by Sector, 2001 to 2010Pulaski County
207
‐2,125‐5,640 ‐5,789
3,264
15,390
4,1766,678
‐101‐2,302
0
‐10,000
‐5,000
0
5,000
10,000
15,000
20,000
Mining
Constructio
n
Manufacturing
Transportatio
n and
public utilities
Finance, insurance,
real estate and …
Profession
al Services
Other Services
Governm
ent and
governmen
t …
Farm
& Farm Services
Trade
Missing
Data
29%
9%
7%
7%
6%
6%
6%
5%
5%
3%
0% 5% 10% 15% 20% 25% 30% 35%
Food Products
Fabricated Metal Products
Transportation Equipment
Machinery
Paper Products
Plastics & Rubber Products
Wood Products
Electrical Equipment & Appliances
Primary Metal Products
Miscellaneous
11
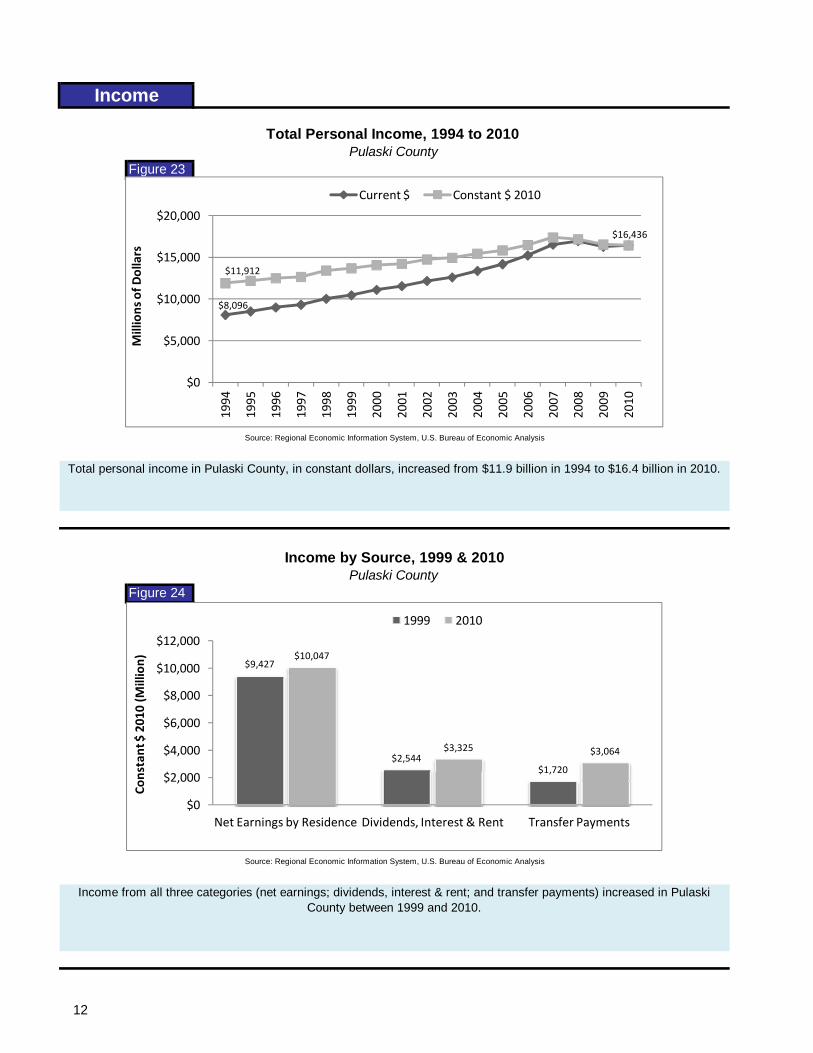
Figure 23
Figure 24
Income from all three categories (net earnings; dividends, interest & rent; and transfer payments) increased in Pulaski County between 1999 and 2010.
Source: Regional Economic Information System, U.S. Bureau of Economic Analysis
Income
Pulaski County
Total Personal Income, 1994 to 2010 Pulaski County
Income by Source, 1999 & 2010
Source: Regional Economic Information System, U.S. Bureau of Economic Analysis
Total personal income in Pulaski County, in constant dollars, increased from $11.9 billion in 1994 to $16.4 billion in 2010.
$8,096
$11,912
$16,436
$0
$5,000
$10,000
$15,000
$20,0001994
1995
1996
1997
1998
1999
2000
2001
2002
2003
2004
2005
2006
2007
2008
2009
2010
Millions of D
ollars
Current $ Constant $ 2010
$9,427
$2,544$1,720
$10,047
$3,325 $3,064
$0
$2,000
$4,000
$6,000
$8,000
$10,000
$12,000
Net Earnings by Residence Dividends, Interest & Rent Transfer Payments
Constant $ 2010 (M
illion)
1999 2010
12
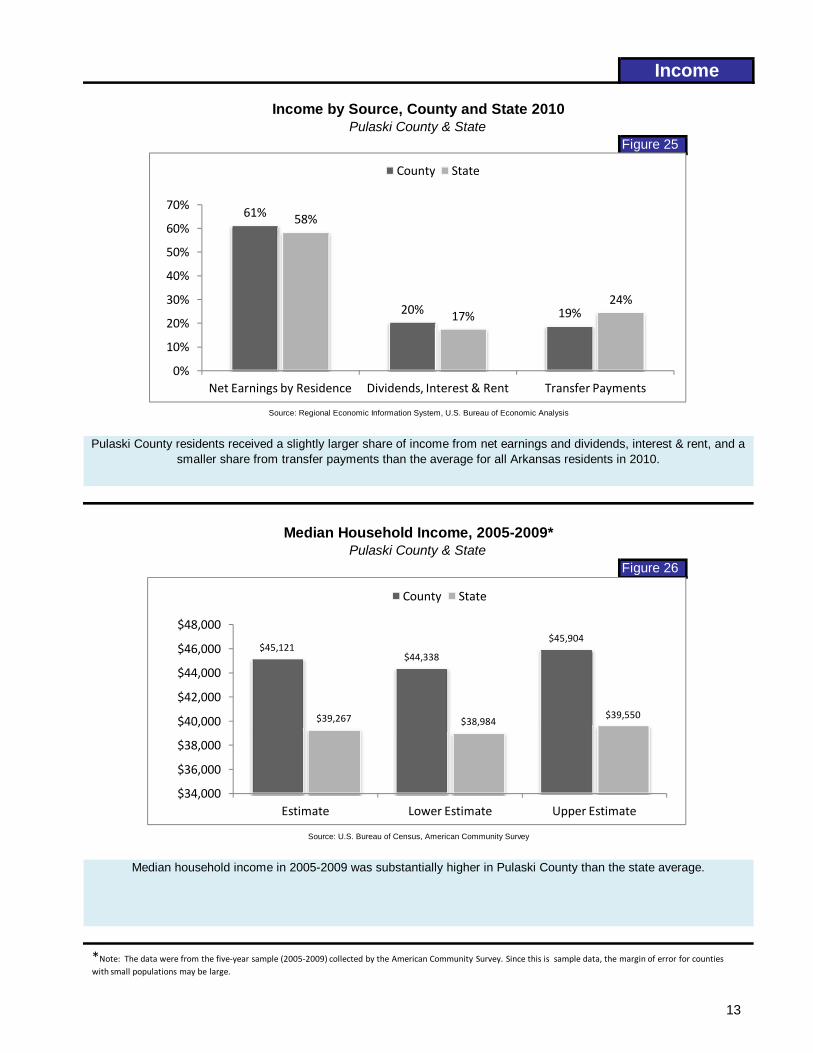
Figure 25
Figure 26
Pulaski County residents received a slightly larger share of income from net earnings and dividends, interest & rent, and a smaller share from transfer payments than the average for all Arkansas residents in 2010.
Median household income in 2005-2009 was substantially higher in Pulaski County than the state average.
Source: U.S. Bureau of Census, American Community Survey
Income
Pulaski County & State
Income by Source, County and State 2010Pulaski County & State
Median Household Income, 2005-2009*
Source: Regional Economic Information System, U.S. Bureau of Economic Analysis
61%
20% 19%
58%
17%24%
0%
10%
20%
30%
40%
50%
60%
70%
Net Earnings by Residence Dividends, Interest & Rent Transfer Payments
County State
$45,121$44,338
$45,904
$39,267 $38,984$39,550
$34,000
$36,000
$38,000
$40,000
$42,000
$44,000
$46,000
$48,000
Estimate Lower Estimate Upper Estimate
County State
*Note: The data were from the five‐year sample (2005‐2009) collected by the American Community Survey. Since this is sample data, the margin of error for counties with small populations may be large.
13
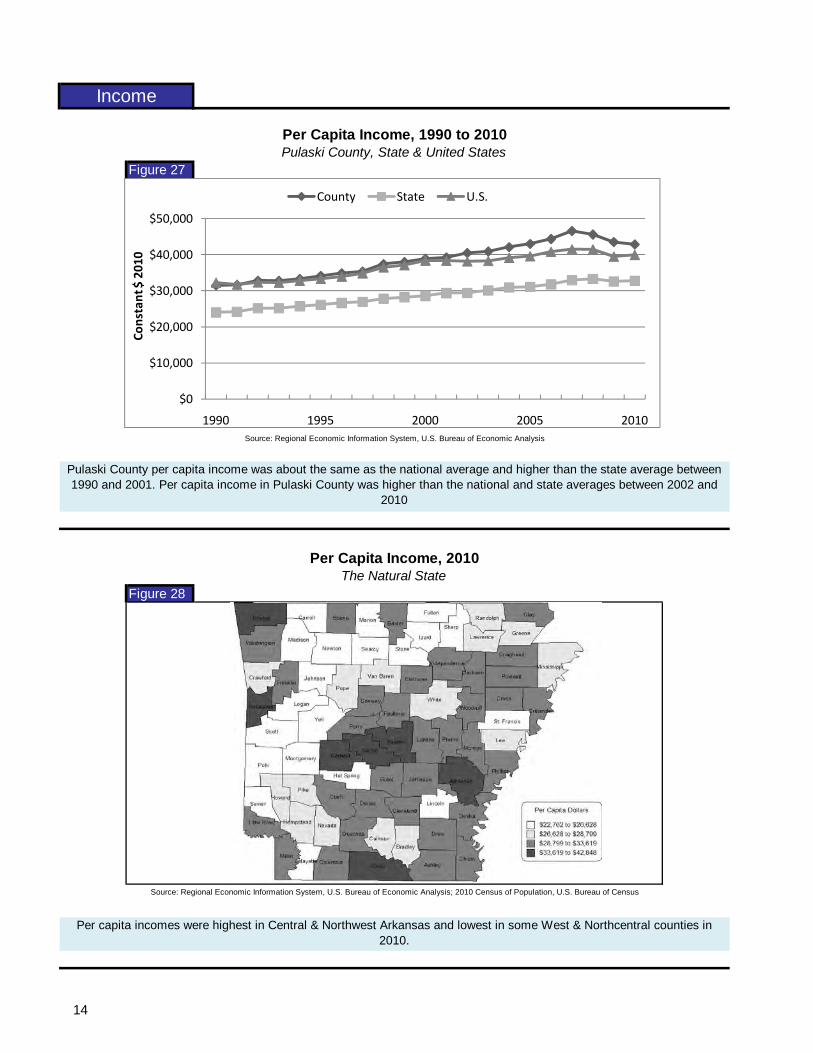
Figure 27
Figure 28
Per capita incomes were highest in Central & Northwest Arkansas and lowest in some West & Northcentral counties in 2010.
Income
The Natural State
Per Capita Income, 1990 to 2010Pulaski County, State & United States
Per Capita Income, 2010
Source: Regional Economic Information System, U.S. Bureau of Economic Analysis
Pulaski County per capita income was about the same as the national average and higher than the state average between 1990 and 2001. Per capita income in Pulaski County was higher than the national and state averages between 2002 and
2010
Source: Regional Economic Information System, U.S. Bureau of Economic Analysis; 2010 Census of Population, U.S. Bureau of Census
$0
$10,000
$20,000
$30,000
$40,000
$50,000
1990 1995 2000 2005 2010
Constant $ 2010
County State U.S.
14
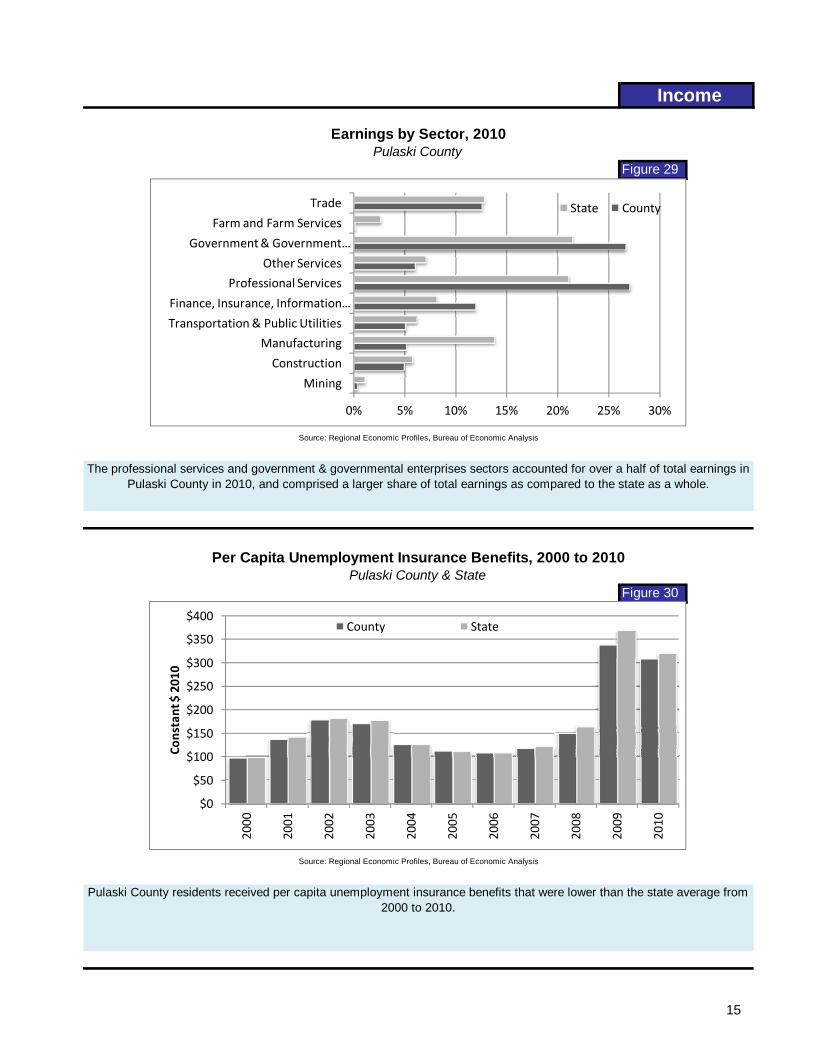
Figure 29
Figure 30
Pulaski County residents received per capita unemployment insurance benefits that were lower than the state average from 2000 to 2010.
Source: Regional Economic Profiles, Bureau of Economic Analysis
Income
Pulaski County & State
Earnings by Sector, 2010Pulaski County
Per Capita Unemployment Insurance Benefits, 2000 to 2010
Source: Regional Economic Profiles, Bureau of Economic Analysis
The professional services and government & governmental enterprises sectors accounted for over a half of total earnings in Pulaski County in 2010, and comprised a larger share of total earnings as compared to the state as a whole.
$0
$50
$100
$150
$200
$250
$300
$350
$400
2000
2001
2002
2003
2004
2005
2006
2007
2008
2009
2010
Constant $ 2010
County State
0% 5% 10% 15% 20% 25% 30%
Mining
Construction
Manufacturing
Transportation & Public Utilities
Finance, Insurance, Information …
Professional Services
Other Services
Government & Government …
Farm and Farm Services
Trade State County
15
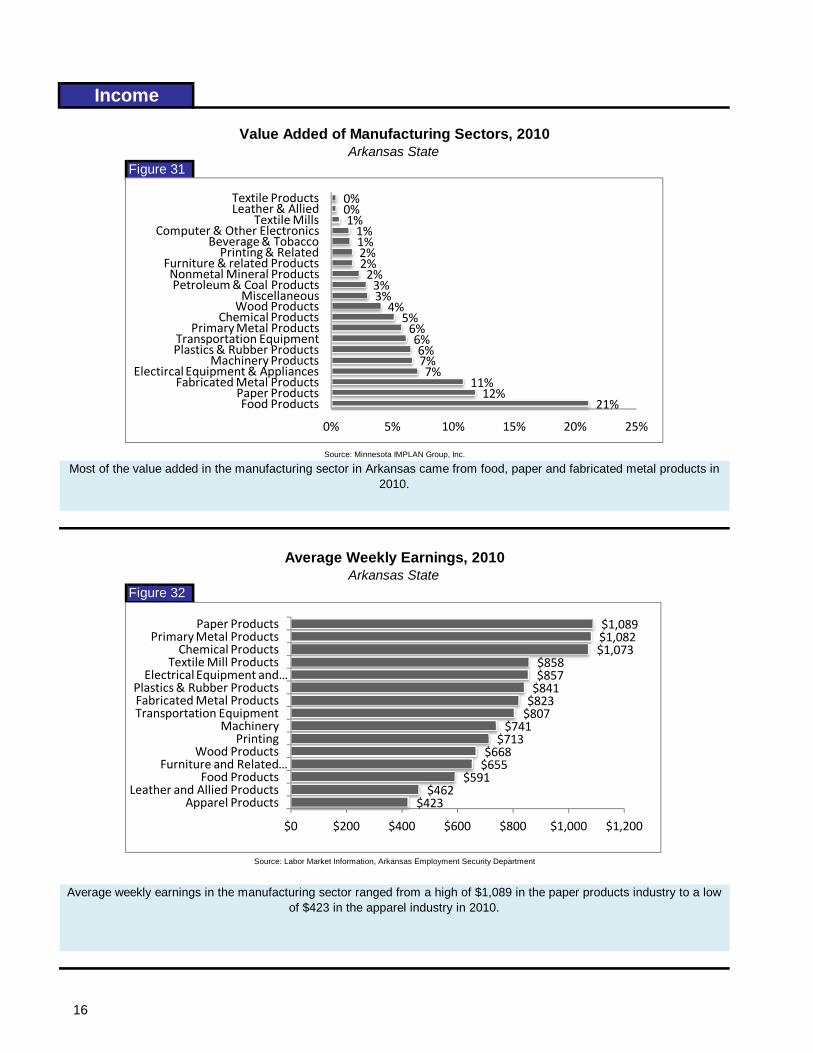
Figure 31
Figure 32
Average weekly earnings in the manufacturing sector ranged from a high of $1,089 in the paper products industry to a low of $423 in the apparel industry in 2010.
Source: Labor Market Information, Arkansas Employment Security Department
Income
Arkansas State
Value Added of Manufacturing Sectors, 2010Arkansas State
Average Weekly Earnings, 2010
Source: Minnesota IMPLAN Group, Inc.
Most of the value added in the manufacturing sector in Arkansas came from food, paper and fabricated metal products in 2010.
$423$462
$591$655$668$713$741
$807$823$841$857$858
$1,073$1,082$1,089
$0 $200 $400 $600 $800 $1,000 $1,200
Apparel ProductsLeather and Allied Products
Food ProductsFurniture and Related …
Wood ProductsPrinting
MachineryTransportation EquipmentFabricated Metal ProductsPlastics & Rubber ProductsElectrical Equipment and …
Textile Mill ProductsChemical Products
Primary Metal ProductsPaper Products
21%12%
11%7%7%6%6%6%
5%4%
3%3%2%2%2%1%1%
1%0%0%
0% 5% 10% 15% 20% 25%
Food ProductsPaper Products
Fabricated Metal ProductsElectircal Equipment & Appliances
Machinery ProductsPlastics & Rubber ProductsTransportation Equipment
Primary Metal ProductsChemical Products
Wood ProductsMiscellaneous
Petroleum & Coal ProductsNonmetal Mineral ProductsFurniture & related Products
Printing & RelatedBeverage & Tobacco
Computer & Other ElectronicsTextile Mills
Leather & AlliedTextile Products
16
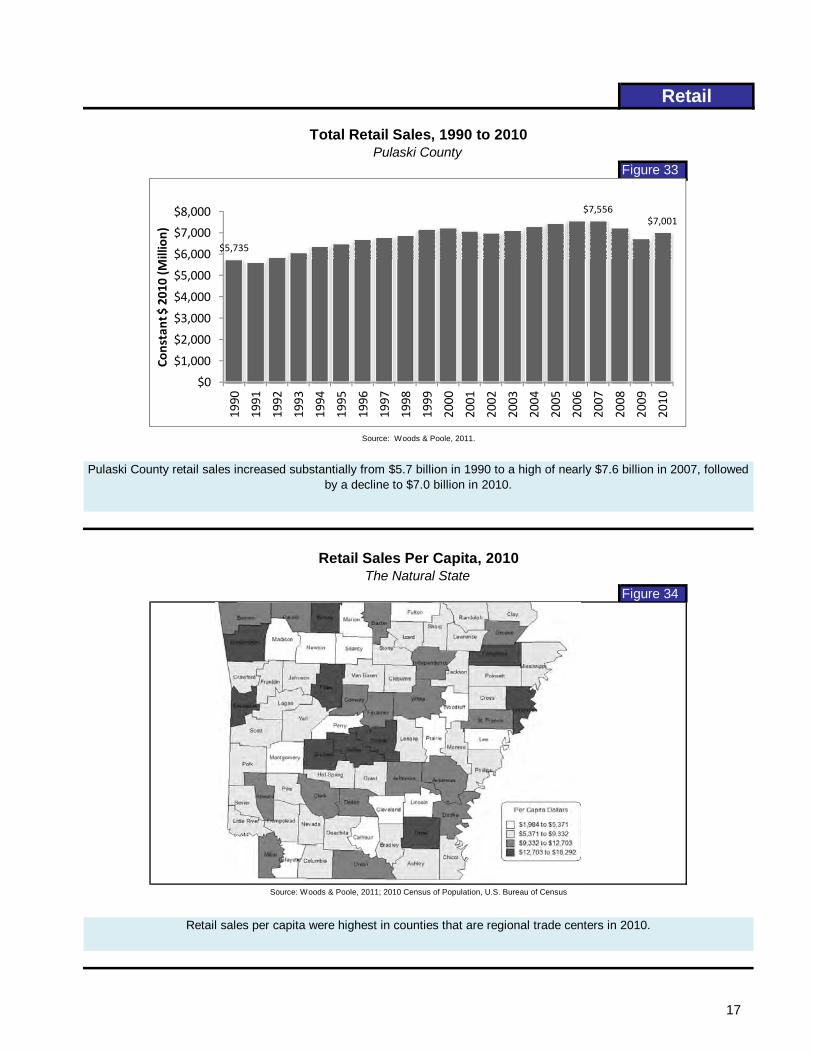
Figure 33
Figure 34
Pulaski County retail sales increased substantially from $5.7 billion in 1990 to a high of nearly $7.6 billion in 2007, followed by a decline to $7.0 billion in 2010.
Retail sales per capita were highest in counties that are regional trade centers in 2010.
Retail
The Natural State
Total Retail Sales, 1990 to 2010Pulaski County
Retail Sales Per Capita, 2010
Source: Woods & Poole, 2011.
Source: Woods & Poole, 2011; 2010 Census of Population, U.S. Bureau of Census
$5,735
$7,556$7,001
$0
$1,000
$2,000
$3,000
$4,000
$5,000
$6,000
$7,000
$8,000
1990
1991
1992
1993
1994
1995
1996
1997
1998
1999
2000
2001
2002
2003
2004
2005
2006
2007
2008
2009
2010
Constant $ 2010 (M
illion)
17
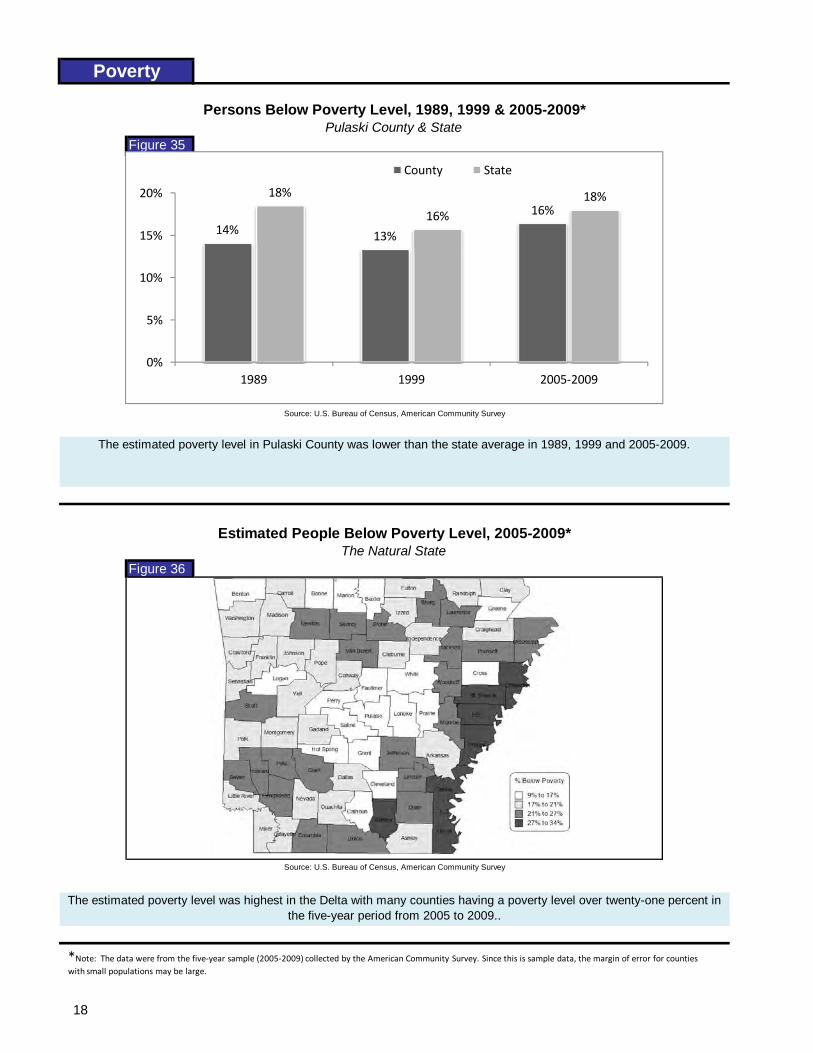
Figure 35
Figure 36
The estimated poverty level was highest in the Delta with many counties having a poverty level over twenty-one percent in the five-year period from 2005 to 2009..
Poverty
The Natural State
Persons Below Poverty Level, 1989, 1999 & 2005-2009*Pulaski County & State
Estimated People Below Poverty Level, 2005-2009*
Source: U.S. Bureau of Census, American Community Survey
The estimated poverty level in Pulaski County was lower than the state average in 1989, 1999 and 2005-2009.
Source: U.S. Bureau of Census, American Community Survey
14% 13%
16%18%
16%
18%
0%
5%
10%
15%
20%
1989 1999 2005‐2009
County State
*Note: The data were from the five‐year sample (2005‐2009) collected by the American Community Survey. Since this is sample data, the margin of error for counties with small populations may be large.
18
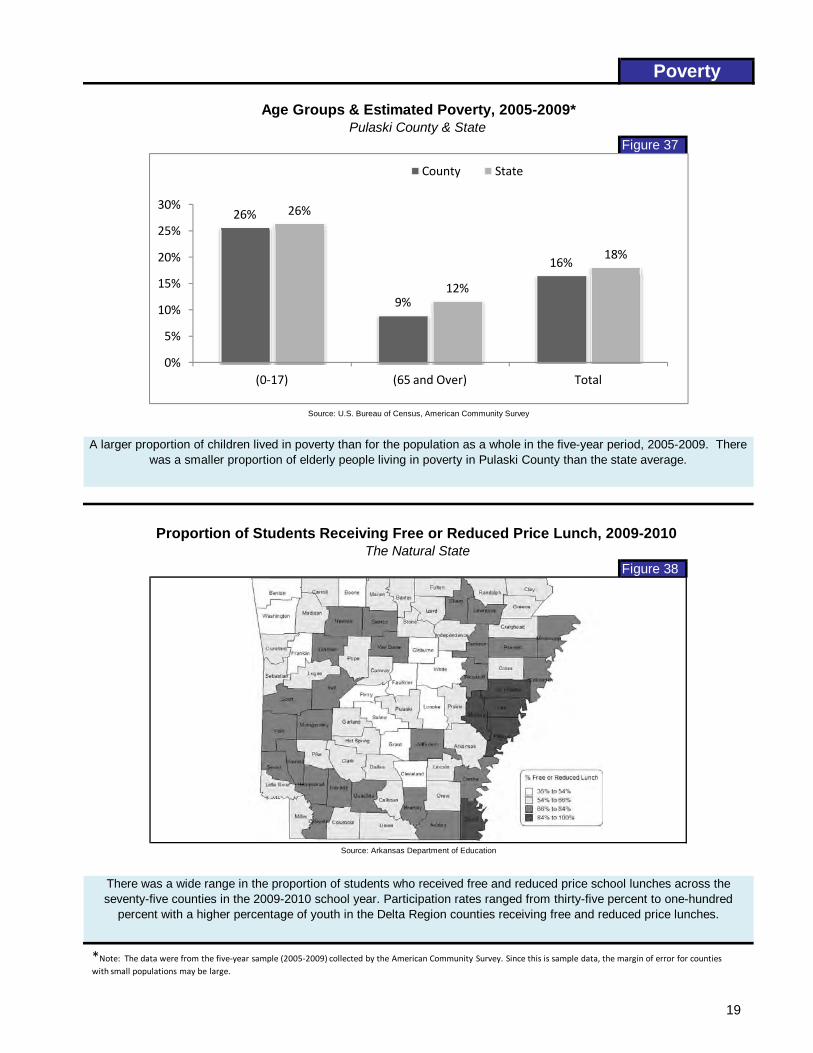
Figure 37
Figure 38
There was a wide range in the proportion of students who received free and reduced price school lunches across the seventy-five counties in the 2009-2010 school year. Participation rates ranged from thirty-five percent to one-hundred
percent with a higher percentage of youth in the Delta Region counties receiving free and reduced price lunches.
Poverty
The Natural State
Age Groups & Estimated Poverty, 2005-2009*Pulaski County & State
Proportion of Students Receiving Free or Reduced Price Lunch, 2009-2010
Source: U.S. Bureau of Census, American Community Survey
A larger proportion of children lived in poverty than for the population as a whole in the five-year period, 2005-2009. There was a smaller proportion of elderly people living in poverty in Pulaski County than the state average.
Source: Arkansas Department of Education
26%
9%
16%
26%
12%
18%
0%
5%
10%
15%
20%
25%
30%
(0‐17) (65 and Over) Total
County State
*Note: The data were from the five‐year sample (2005‐2009) collected by the American Community Survey. Since this is sample data, the margin of error for counties with small populations may be large.
19
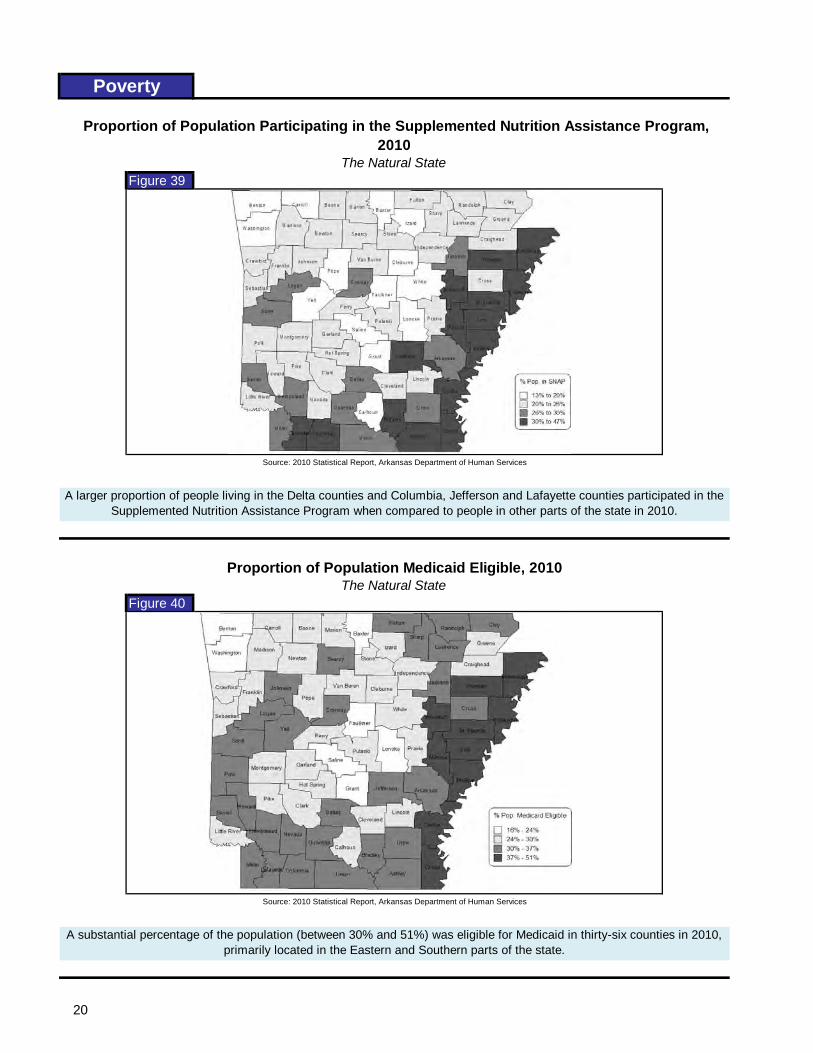
Figure 39
Figure 40
A substantial percentage of the population (between 30% and 51%) was eligible for Medicaid in thirty-six counties in 2010, primarily located in the Eastern and Southern parts of the state.
A larger proportion of people living in the Delta counties and Columbia, Jefferson and Lafayette counties participated in the Supplemented Nutrition Assistance Program when compared to people in other parts of the state in 2010.
Poverty
The Natural State
Proportion of Population Participating in the Supplemented Nutrition Assistance Program, 2010
The Natural State
Proportion of Population Medicaid Eligible, 2010
Source: 2010 Statistical Report, Arkansas Department of Human Services
Source: 2010 Statistical Report, Arkansas Department of Human Services
20
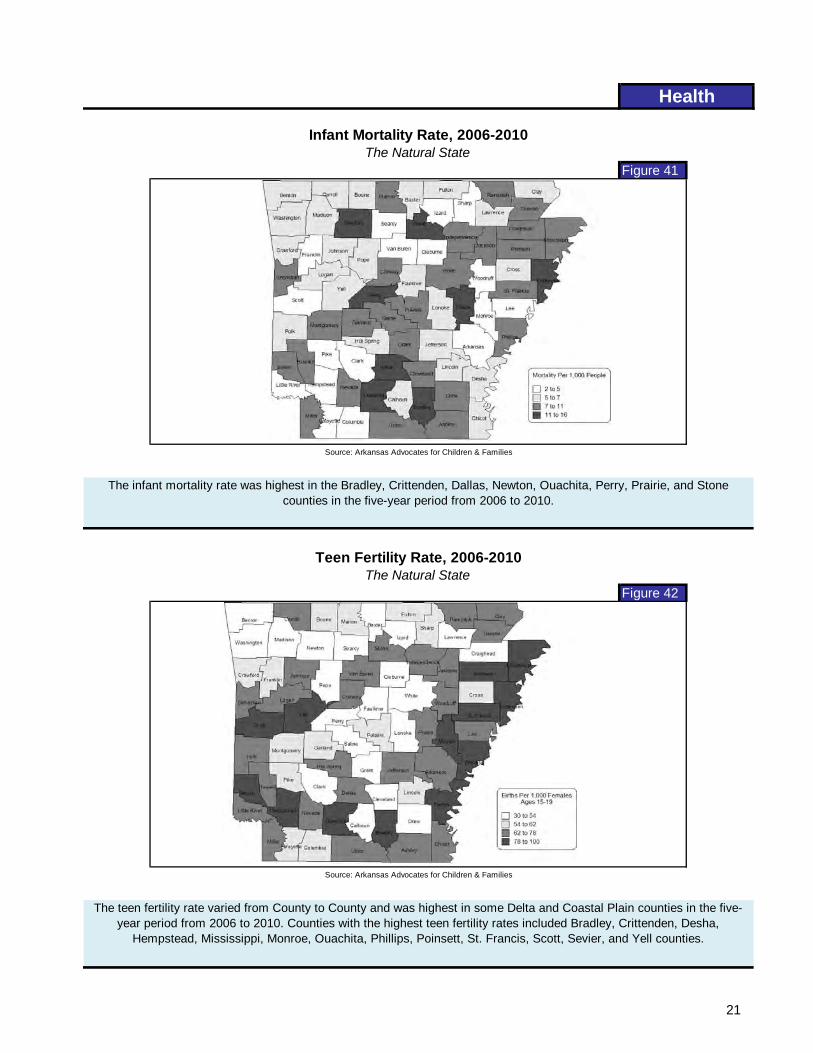
Figure 41
Figure 42
Source: Arkansas Advocates for Children & Families
The teen fertility rate varied from County to County and was highest in some Delta and Coastal Plain counties in the five-year period from 2006 to 2010. Counties with the highest teen fertility rates included Bradley, Crittenden, Desha,
Hempstead, Mississippi, Monroe, Ouachita, Phillips, Poinsett, St. Francis, Scott, Sevier, and Yell counties.
Health
The Natural State
Infant Mortality Rate, 2006-2010The Natural State
Teen Fertility Rate, 2006-2010
The infant mortality rate was highest in the Bradley, Crittenden, Dallas, Newton, Ouachita, Perry, Prairie, and Stone counties in the five-year period from 2006 to 2010.
Source: Arkansas Advocates for Children & Families
21
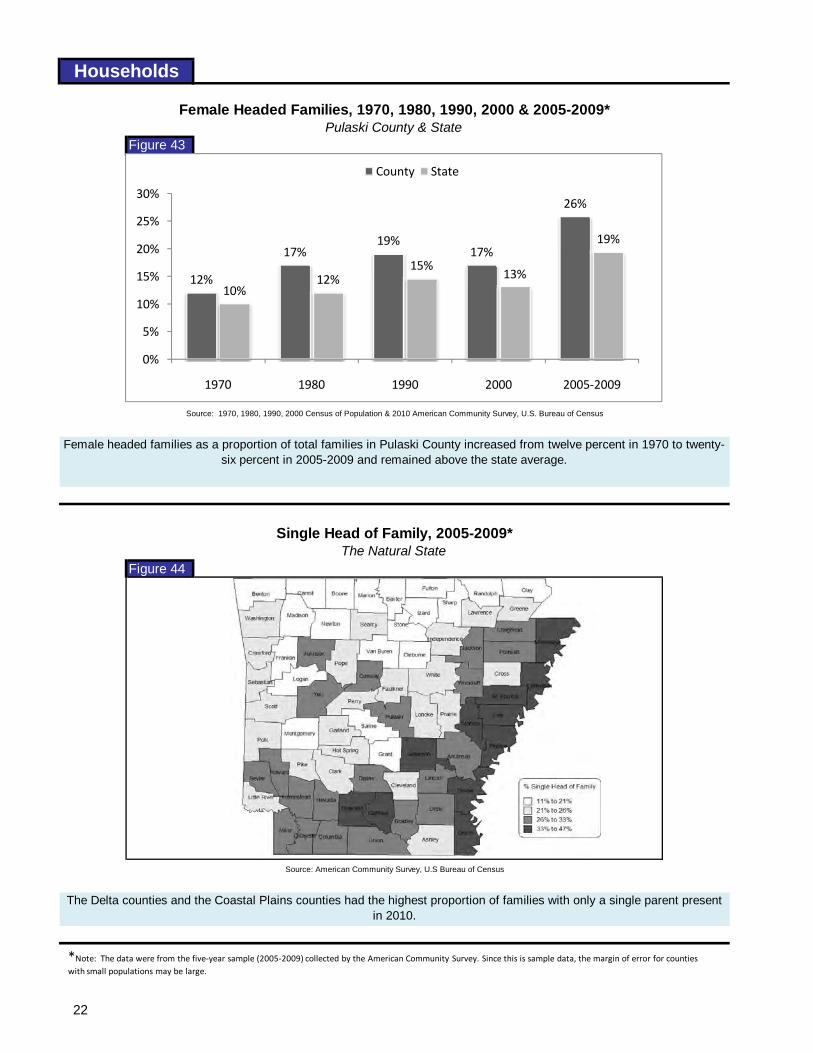
Figure 43
Figure 44
Households
Female headed families as a proportion of total families in Pulaski County increased from twelve percent in 1970 to twenty-six percent in 2005-2009 and remained above the state average.
The Delta counties and the Coastal Plains counties had the highest proportion of families with only a single parent present in 2010.
The Natural State
Female Headed Families, 1970, 1980, 1990, 2000 & 2005-2009*Pulaski County & State
Single Head of Family, 2005-2009*
Source: 1970, 1980, 1990, 2000 Census of Population & 2010 American Community Survey, U.S. Bureau of Census
Source: American Community Survey, U.S Bureau of Census
12%
17%19%
17%
26%
10%12%
15%13%
19%
0%
5%
10%
15%
20%
25%
30%
1970 1980 1990 2000 2005‐2009
County State
*Note: The data were from the five‐year sample (2005‐2009) collected by the American Community Survey. Since this is sample data, the margin of error for counties with small populations may be large.
22
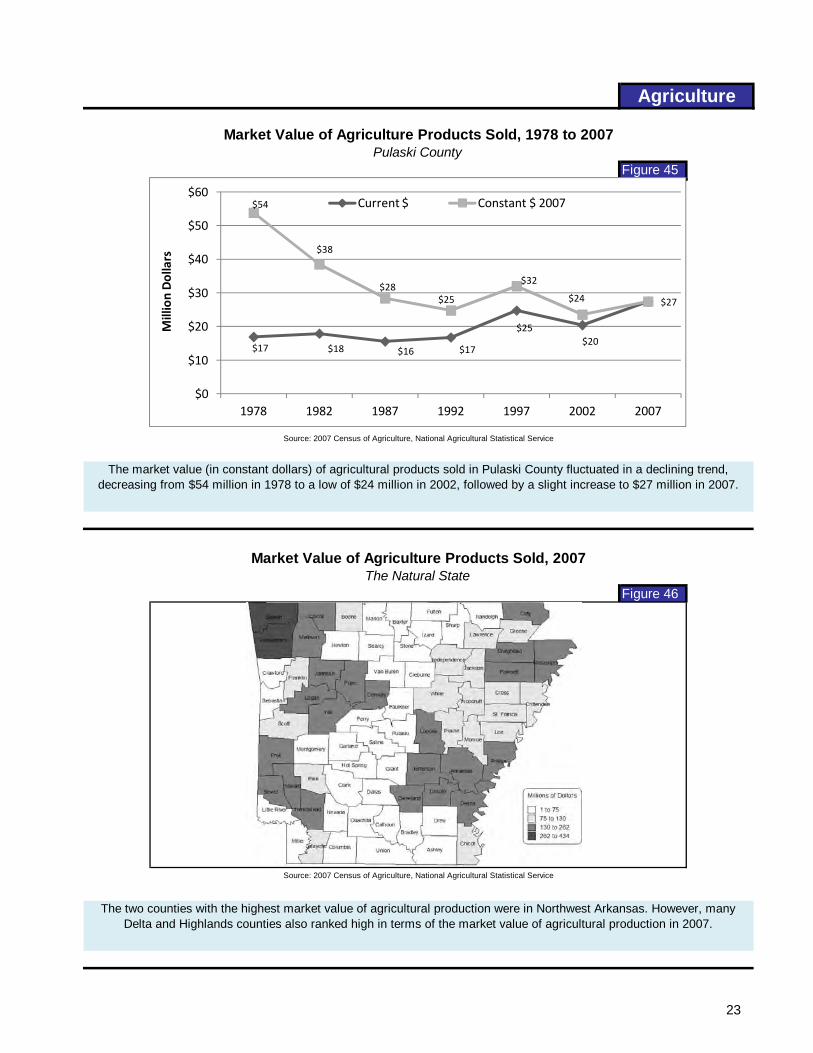
Figure 45
Figure 46
Agriculture
The market value (in constant dollars) of agricultural products sold in Pulaski County fluctuated in a declining trend, decreasing from $54 million in 1978 to a low of $24 million in 2002, followed by a slight increase to $27 million in 2007.
The two counties with the highest market value of agricultural production were in Northwest Arkansas. However, many Delta and Highlands counties also ranked high in terms of the market value of agricultural production in 2007.
The Natural State
Market Value of Agriculture Products Sold, 1978 to 2007Pulaski County
Market Value of Agriculture Products Sold, 2007
Source: 2007 Census of Agriculture, National Agricultural Statistical Service
Source: 2007 Census of Agriculture, National Agricultural Statistical Service
$17 $18 $16 $17
$25$20
$54
$38
$28$25
$32
$24 $27
$0
$10
$20
$30
$40
$50
$60
1978 1982 1987 1992 1997 2002 2007
Million Dollars
Current $ Constant $ 2007
23
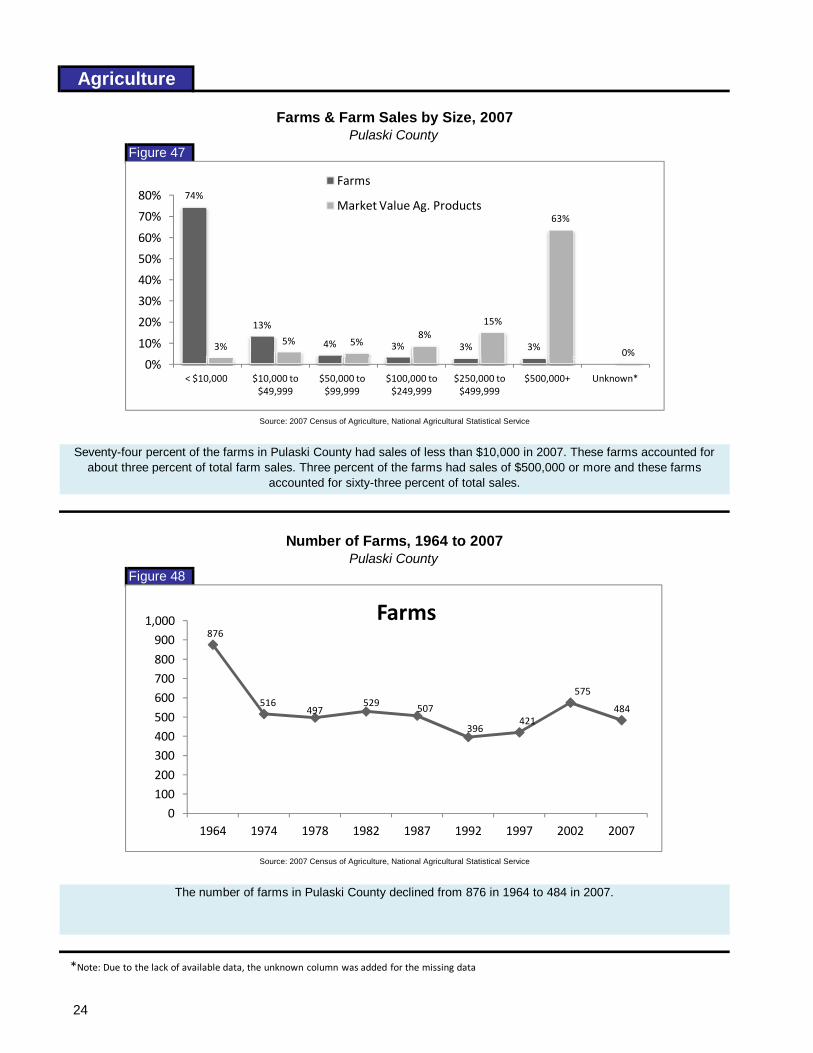
Figure 47
Figure 48
Agriculture
Seventy-four percent of the farms in Pulaski County had sales of less than $10,000 in 2007. These farms accounted for about three percent of total farm sales. Three percent of the farms had sales of $500,000 or more and these farms
accounted for sixty-three percent of total sales.
Source: 2007 Census of Agriculture, National Agricultural Statistical Service
The number of farms in Pulaski County declined from 876 in 1964 to 484 in 2007.
Pulaski County
Farms & Farm Sales by Size, 2007Pulaski County
Number of Farms, 1964 to 2007
Source: 2007 Census of Agriculture, National Agricultural Statistical Service
876
516497
529 507
396421
575
484
0100200
300400500
600700800
9001,000
1964 1974 1978 1982 1987 1992 1997 2002 2007
Farms
74%
13%
4% 3% 3% 3%3% 5% 5%8%
15%
63%
0%0%
10%
20%
30%
40%
50%
60%
70%
80%
< $10,000 $10,000 to $49,999
$50,000 to $99,999
$100,000 to $249,999
$250,000 to $499,999
$500,000+ Unknown*
Farms
Market Value Ag. Products
*Note: Due to the lack of available data, the unknown column was added for the missing data
24
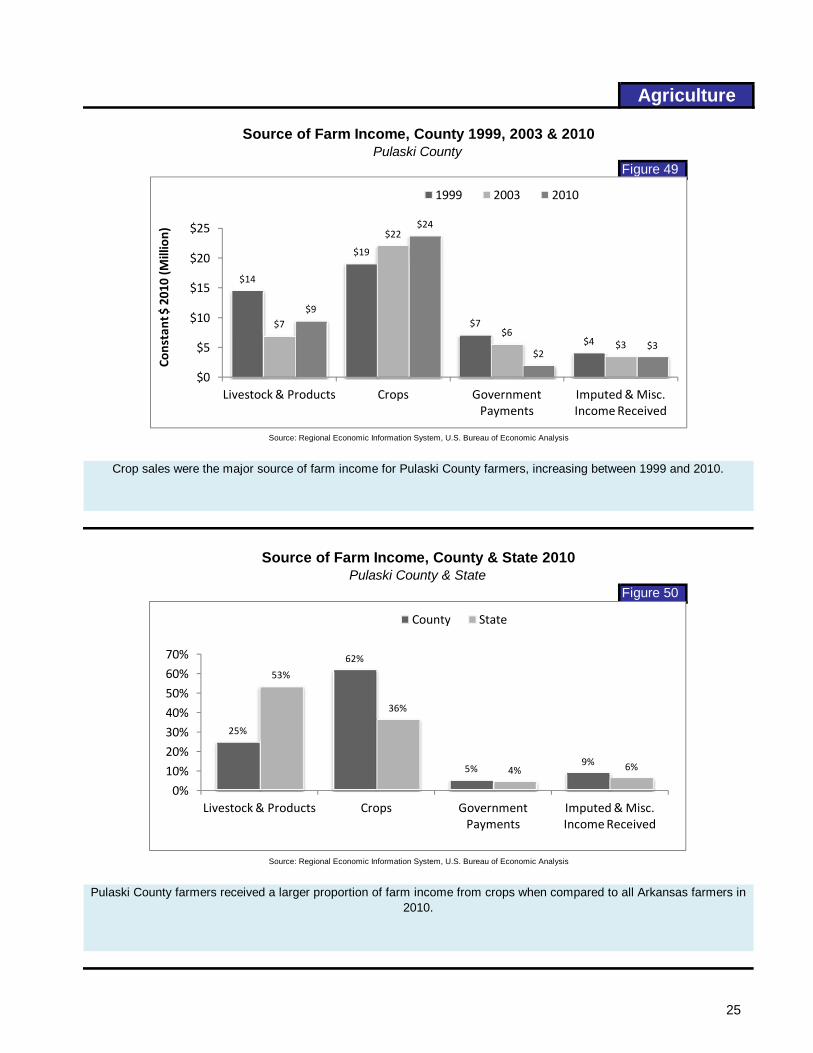
Figure 49
Figure 50
Crop sales were the major source of farm income for Pulaski County farmers, increasing between 1999 and 2010.
Pulaski County farmers received a larger proportion of farm income from crops when compared to all Arkansas farmers in 2010.
Source: Regional Economic Information System, U.S. Bureau of Economic Analysis
Agriculture
Source: Regional Economic Information System, U.S. Bureau of Economic Analysis
Pulaski County & State
Source of Farm Income, County 1999, 2003 & 2010Pulaski County
Source of Farm Income, County & State 2010
25%
62%
5%9%
53%
36%
4% 6%
0%
10%
20%
30%
40%
50%
60%
70%
Livestock & Products Crops Government Payments
Imputed & Misc. Income Received
County State
$14
$19
$7
$4
$7
$22
$6$3
$9
$24
$2$3
$0
$5
$10
$15
$20
$25
Livestock & Products Crops Government Payments
Imputed & Misc. Income Received
Constant $ 2010 (M
illion)
1999 2003 2010
25
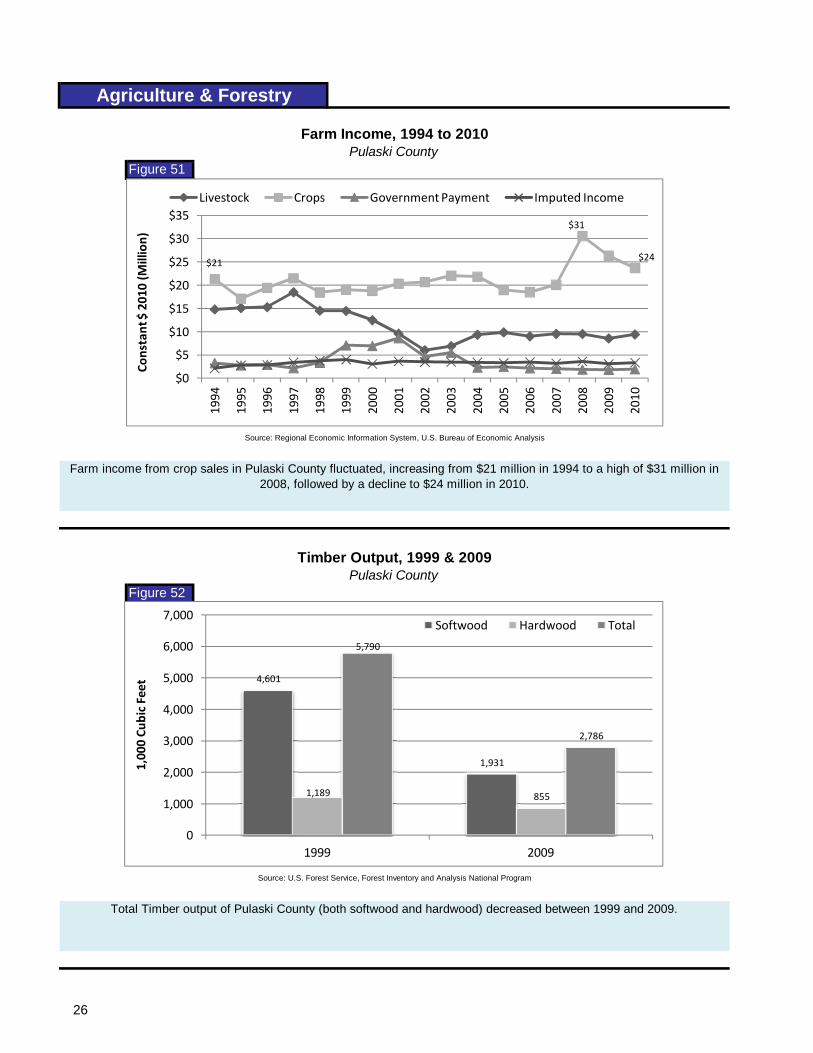
Figure 51
Figure 52
Source: U.S. Forest Service, Forest Inventory and Analysis National Program
Total Timber output of Pulaski County (both softwood and hardwood) decreased between 1999 and 2009.
Agriculture & Forestry
Pulaski County
Farm Income, 1994 to 2010Pulaski County
Timber Output, 1999 & 2009
Source: Regional Economic Information System, U.S. Bureau of Economic Analysis
Farm income from crop sales in Pulaski County fluctuated, increasing from $21 million in 1994 to a high of $31 million in 2008, followed by a decline to $24 million in 2010.
$21
$31
$24
$0
$5
$10
$15
$20
$25
$30
$351994
1995
1996
1997
1998
1999
2000
2001
2002
2003
2004
2005
2006
2007
2008
2009
2010
Constant $ 2010 (M
illion)
Livestock Crops Government Payment Imputed Income
4,601
1,931
1,189 855
5,790
2,786
0
1,000
2,000
3,000
4,000
5,000
6,000
7,000
1999 2009
1,000 Cu
bic Feet
Softwood Hardwood Total
26
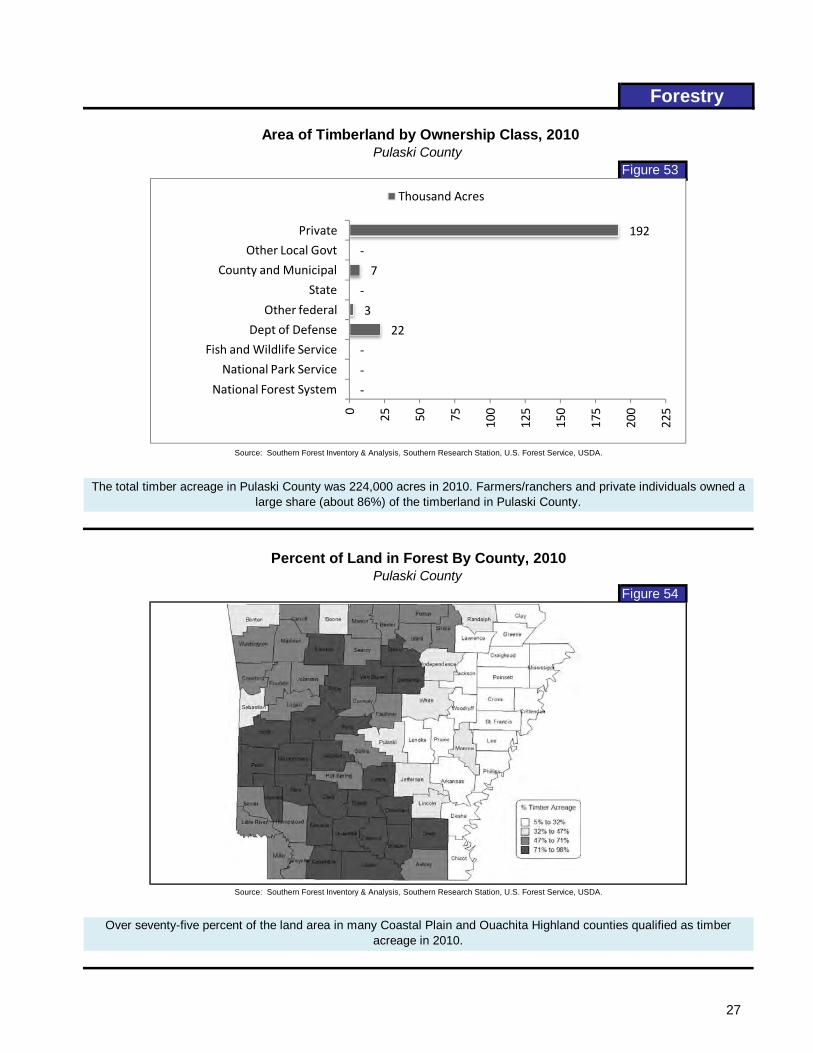
Figure 53
Figure 54
Over seventy-five percent of the land area in many Coastal Plain and Ouachita Highland counties qualified as timber acreage in 2010.
Source: Southern Forest Inventory & Analysis, Southern Research Station, U.S. Forest Service, USDA.
The total timber acreage in Pulaski County was 224,000 acres in 2010. Farmers/ranchers and private individuals owned a large share (about 86%) of the timberland in Pulaski County.
Forestry
Pulaski County
Area of Timberland by Ownership Class, 2010Pulaski County
Percent of Land in Forest By County, 2010
Source: Southern Forest Inventory & Analysis, Southern Research Station, U.S. Forest Service, USDA.
‐
‐
‐
22
3
‐
7
‐
192
0 25 50 75 100
125
150
175
200
225
National Forest System
National Park Service
Fish and Wildlife Service
Dept of Defense
Other federal
State
County and Municipal
Other Local Govt
Private
Thousand Acres
27
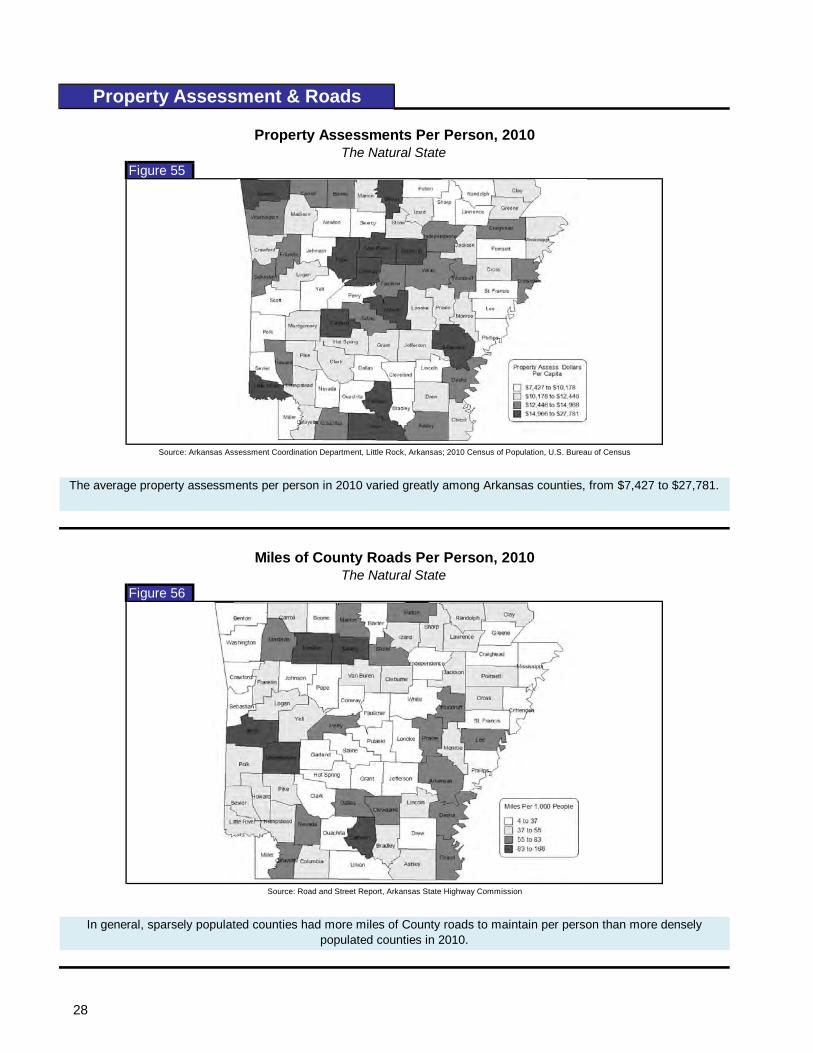
Figure 55
Figure 56
Property Assessment & Roads
In general, sparsely populated counties had more miles of County roads to maintain per person than more densely populated counties in 2010.
The average property assessments per person in 2010 varied greatly among Arkansas counties, from $7,427 to $27,781.
The Natural State
Property Assessments Per Person, 2010The Natural State
Miles of County Roads Per Person, 2010
Source: Arkansas Assessment Coordination Department, Little Rock, Arkansas; 2010 Census of Population, U.S. Bureau of Census
Source: Road and Street Report, Arkansas State Highway Commission
28
GlossaryAGRICULTURAL SERVICES Includes establishments primarily engaged in performing soil preparation services, crop services, veterinary and other animal services, farm labor and management services, and landscape and horticultural services, for others on a contract or fee basis. CIVILIAN LABOR FORCE The sum of all employed and unemployed persons 16 years of age or older. Members of the Armed Forces are excluded. "CONSTANT $" Figures adjusted for inflation using the Consumer Price Index, 1982-1984 = 100. “CURRENT $” Figures not adjusted for inflation. CONSTRUCTION Includes general building contractors (residential, operative, and nonresidential); heavy construction contractors (highway, street, etc.); and special trade contractors (plumbing, heating, air conditioning, painting, paper hanging, electrical, masonry, stonework, roofing, sheet metal, concrete, and miscellaneous special trade contractors). DELIVERED VALUE OF HARVESTED TIMBER The value of harvested timber delivered to the first processing point. The value includes the value of the timber (stumpage value), the cost of harvesting, and the cost of transporting the timber to thefirst processing point. EARNINGS Earnings include wages and salaries, other labor income, and proprietors' income by place of work. EMPLOYMENT An estimate of the number of persons, on a place-of-residence basis, who worked anytime for pay or profit or worked 15 hours or more as an unpaid family worker during the week of reference (the week including the 12th of the month). Also included are those who, although not working, had some job attachment and were not looking for work, and persons involved in labor-management disputes. FAMILY HOUSEHOLDS Includes a householder and one or more other persons living in the same household who are related to the householder by birth, marriage, or adoption. The number of family households always equals the number of families; however, a family household may also include non-relatives living with the family. Families are classified by type as either a married-couple family or other family which is further classified into "male householder" (a family with a male householder and no wife present) or "female householder" (a family with a female householder and no husband present). FARMING Includes businesses whose primary source of revenue is from crop and livestock production. FEMALE HEADED FAMILIES A family with a female householder and no husband present. FINANCIAL SERVICES Financial, insurance, and real estate services. GOVERNMENT Employees of city, county, state and federal governments. IMPUTED & MISC. INCOME RECEIVED Consists of imputed income, such as gross rental value of dwellings and value of home consumption, and other farm related income components, such as machine hire and custom work income, rental income, and income from forest products. INCOME Total income is the algebraic sum of the amount reported separately for wage or salary income; non-farm net self-employment income; farm net self-employment income; interest, dividend, net royalty or rental income; social security or railroad retirement income; public assistance or welfare income and all other income. INFANT MORTALITY RATE The number of infant deaths (under one year of age) per 1,000 live births. JOBS The number of full-time and part-time jobs in a geographic area. MANUFACTURING Includes manufacturing industries dealing with food and kindred products; textile mill products; apparel products; lumber and wood products; furniture and fixtures; paper and allied products; printing and publishing; chemicals; petroleum and coal; rubber and miscellaneous plastics; leather; stone, clay and glass; primary metal industries; fabricated metal products; machinery; electrical and electronic equipment; transportation equipment; instruments; and miscellaneous industries.
29
Glossary
MARKET VALUE OF AGRICULTURAL PRODUCTS SOLD The gross market value before taxes and production expenses of all agricultural products sold or removed from place regardless of who received payment. It includes sales by the operator as well as the value of any shares received by partners, landlords, contractors, or others associated with the operation. It does not include payment received for participation in federal farm programs nor does it include income from farm-related sources such as agricultural services, or income from non-farm sources. MINING Includes extraction of oil and gas, non-metallic minerals, sand and gravel. NET DOMESTIC MIGRATION The difference between domestic in-migration to an area and domestic out-migration from the area during the period. PER CAPITA INCOME The per capita income is the total personal income divided by the total population of the area studied. The per capita income measure should be used with care. In the short run, it may temporarily vary from the result of unusual conditions (bumper crops, a major construction project or a catastrophe). In the long run, it may misrepresent the economic well-being of the general population because of the presence of a large institutional population (college, prison). While per capita income reflects average income per person, it does not accurately reflect family unit spendable income. PERSONAL INCOME The total income received by residents of an area, including earnings, transfer payments, and interest, dividends and rent. POVERTY LEVEL An individual or household is considered to be living below the poverty level when their income is below an income threshold established by the Bureau of Census. The income cutoffs used by the Bureau of Census to determine the poverty status of families and unrelated individuals consist of a set of 48 thresholds arranged in a two-dimensional matrix consisting of family size cross-classified by presence and number of family members under 18 years old. RETAIL SALES Includes sales from general merchandise stores; department stores; variety stores; food, bakery and dairy stores; automotive dealers; gasoline stations; eating and drinking establishments; and other retail trade establishments. SINGLE HEAD OF FAMILY Single head of a family with no spouse present. SERVICES Includes a variety of items ranging from hotels to attorneys. Included in this category are hotels and other lodging places; personal services (laundry, photographic studios, beauty shops, shoe repair, funeral services); business services (advertising, mailing, news syndicates, personnel supply services, computer services); auto repair services and garages (retail, parking, repair); miscellaneous repair services (electrical, etc.); amusement and recreation services (orchestra, dance halls, etc.); health services (physicians, dentists, nursing care facilities, hospitals, medical labs, outpatient care); legal services; educational services; social services (job training, individual and family services, day care); membership organizations (business, professional, labor, civic, social, etc.); engineering and architectural services; and other similar services. STUMPAGE VALUE OF HARVESTED TIMBER The value of timber harvested going to the landowner. TEEN FERTILITY RATE is the birth rate for women 15 to 19 years of age. It is the number of live births per 1000 women 15-19 years of age. TRADE Includes wholesale and retail trade. TRANSPORTATION Includes railroads; trucking service and warehousing; other transportation services (bus, air, and U.S. postal service); communication systems (radio, T.V., etc.); and utilities and sanitary services. UNEMPLOYMENT An estimate of the number of persons who, for the entire week of reference (the week including the 12th of the month), did not work at all, were able to work, and available for work, and (1) were looking for work, or (2) would have looked for work except that (a) they were waiting to return to a job from which they had been laid off, or (b) they were waiting to report to a new job. UNEMPLOYMENT RATE The number of unemployed workers as a percentage of the civilian labor force.
30
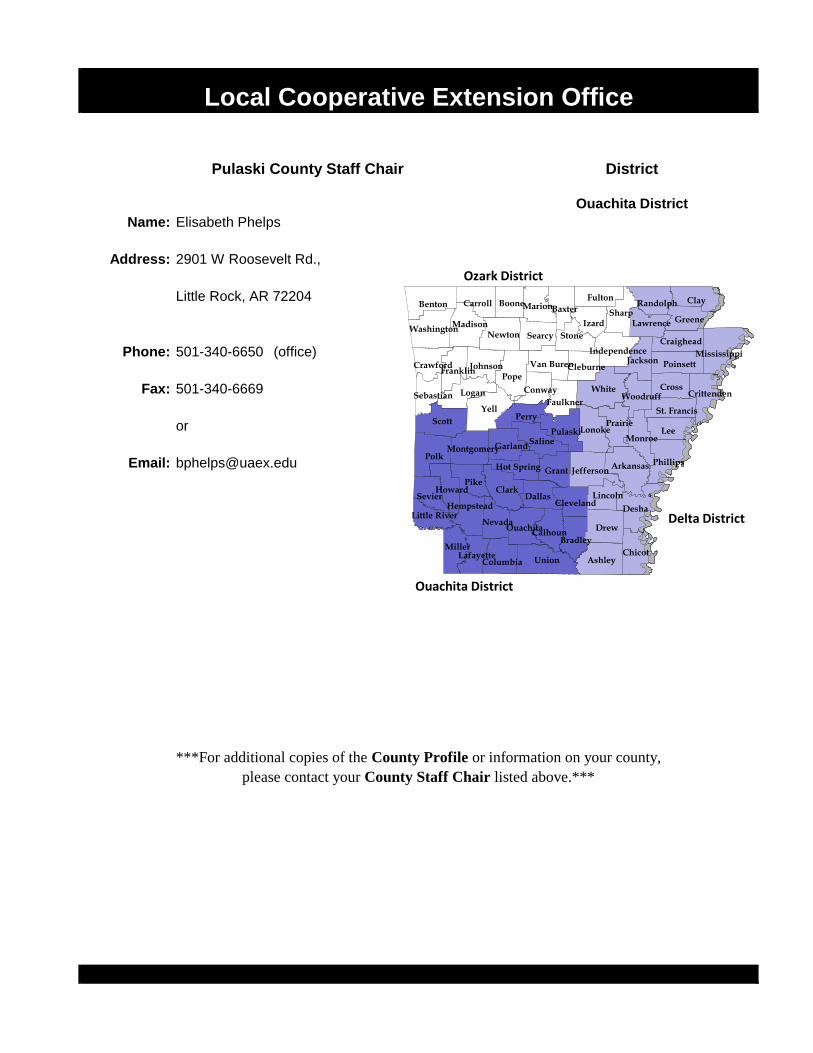
Name: Elisabeth Phelps
Address: 2901 W Roosevelt Rd.,
Phone: (office)
Fax:
or
Email:
Local Cooperative Extension Office
Pulaski County Staff Chair District
Ouachita District
501-340-6669
501-340-6650
Little Rock, AR 72204
***For additional copies of the County Profile or information on your county,
please contact your County Staff Chair listed above.***
Ouachita District
Delta District
Ozark District
Arkansas
Ashley
Baxter Benton Boone
Bradley Calhoun
Carroll
Chicot
Clark
Clay
Cleburne
Cleveland
Columbia
Conway
Craighead
Crawford
Crittenden Cross
Dallas
Desha
Drew
Faulkner
Franklin
Fulton
Garland
Grant
Greene
Hempstead
Hot Spring
Howard
Independence
Izard
Jackson
Jefferson
Johnson
Lafayette
Lawrence
Lee
Lincoln
Little River
Logan
Lonoke
Madison
Marion
Miller
Mississippi
Monroe Montgomery
Nevada
Newton
Ouachita
Perry
Phillips
Pike
Poinsett
Polk
Pope
Prairie Pulaski
Randolph
St. Francis
Saline
Scott
Searcy
Sebastian
Sevier
Sharp
Stone
Union
Van Buren
Washington
White Woodruff
Yell
The Arkansas Cooperative Extension Service offers its programs to all eligible persons regardless of race, color, national
origin, religion, gender, age, disability, marital or veteran status, or any other legally protected status, and is
an Affirmative Action/Equal Opportunity Employer.
A r k a n s a s I s O u r C a m p u s
University of Arkansas, United States Department of Agriculture, and County Governments Cooperating
Printed by University of Arkansas Cooperative Extension Service Printing Services, Little Rock
Visit our web sites at:
http://uaex.edu
http://www.arcommunities.org/
http://www.facebook.com/UACommunityDevelopment