Comparative Genome Analysis and Genome Evolution · Comparative Genome Analysis and Genome...
110
Comparative Genome Analysis and Genome Evolution Vergelijkende Genoom Analyse en Genoom Evolutie (met een samenvatting in het Nederlands) Proefschrift ter verkrijging van de graad van doctor aan de Universiteit Utrecht op gezag van de Rector Magnificus, Prof. dr. W. H. Gispen, ingevolge het besluit van het College voor Promoties in het openbaar te verdedigen op dinsdag 17 september 2002, des middags te 2:30 uur door Berend Snel geboren op 20 juli 1975 te Zevenhuizen (ZH)
Transcript of Comparative Genome Analysis and Genome Evolution · Comparative Genome Analysis and Genome...
Comparative Genome Analysis and Genome Evolution
Vergelijkende Genoom Analyse en Genoom Evolutie (met een samenvatting in het Nederlands)
Proefschrift
ter verkrijging van de graad van doctor aan de Universiteit Utrecht op gezag van de Rector Magnificus, Prof. dr. W. H. Gispen,
ingevolge het besluit van het College voor Promoties in het openbaar te verdedigen op
dinsdag 17 september 2002, des middags te 2:30 uur
door
Berend Snel
geboren op 20 juli 1975 te Zevenhuizen (ZH)
Promotores: Prof Dr. P. Hogeweg Faculteit Biologie Universiteit Utrecht Prof. Dr. M. A. Huynen Faculteit der Medische Wetenschappen Katholieke Universiteit Nijmegen The studies described in this thesis were performed at the Computational Biology Program of the European Molecular Biology Laboratory in Heidelberg, Germany.
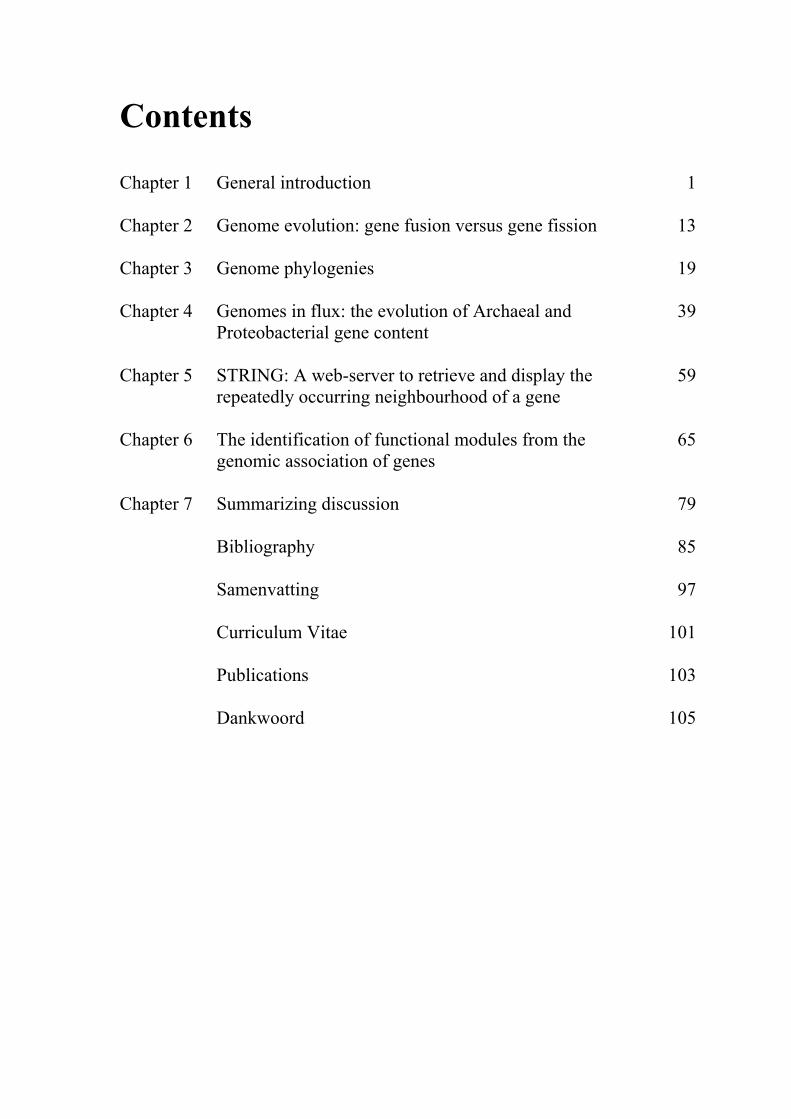
Contents Chapter 1 Chapter 2 Chapter 3 Chapter 4 Chapter 5 Chapter 6 Chapter 7
General introduction Genome evolution: gene fusion versus gene fission Genome phylogenies Genomes in flux: the evolution of Archaeal and Proteobacterial gene content STRING: A web-server to retrieve and display the repeatedly occurring neighbourhood of a gene The identification of functional modules from the genomic association of genes Summarizing discussion Bibliography Samenvatting Curriculum Vitae Publications Dankwoord
1
13
19
39
59
65
79
85
97
101
103
105

1
1 General introduction
Over the past seven years we have witnessed a revolution in (molecular) biology, namely the sequencing of complete genomes of cellular organisms, starting with the simple parasitic bacterium Haemophilus influenzae (Fleischmann et al. 1995) and culminating in the draft of the human genome sequence (Venter et al. 2001, Lander et al. 2001). Complete genome sequences, which are mainly obtained through (whole) genome shotgun sequencing, are a unique type of data, because they represent in principle everything that together makes an organism. In a way one could say that we now have a complete list of the pieces that in still largely unknown ways, together and in interaction with the environment, constitute the puzzle of life. It is however not immediately clear what we concretely can do with all these genomes. Obviously they should function as bench for "wet biologist" allowing for example the rapid identification of proteins by their mass spectrometry signature (Gavin et al. 2002), but what, if anything, can we learn based 'solely' on this data. For one thing, their availability presents us with an unprecedented wealth of data to study evolution. Since genome data is relatively new and our picture of genome evolution is still very incomplete, such studies entail 'blind' pattern analysis to search for the basic concepts in which we can describe and understand genomes as well as their evolution. Comparative genome analysis thereby provides us with some idea of how genomes came to be. Apart from its intrinsic interest, this understanding is necessary for the efficient usage of complete genomes, for example to evaluate whether the presence of a certain gene is surprising. In general, complete genome sequences allow the study of protein function within the framework of the complete cellular and genomic context. This thesis will deal with a set of bioinformatic analyses that cover different levels of comparative genome analysis (Bork et al. 1998). In this introduction I will (1) make the case for studying complete genome sequence data through integrated evolutionary and bioinformatic analysis, (2) introduce comparative sequence analysis, (3) introduce comparative genome analysis, and (4) describe major results from comparative genome analysis that will provide a background for the work described in the main body of this thesis.
Complete genome sequences, bioinformatic analysis, and evolution
Complete genome sequences
Complete genome sequencing projects provide us with huge amounts of data. These data obviously need computer or informatics analyses to create and maintain them. What is probably more important is the subsequent data analysis to create new biological knowledge from the (complete genome) sequences. Large scale databases of
Chapter 1
2
DNA/protein sequences and protein structures were studied extensively already before complete genomes, because they were already available and because they are very suitable for formal analysis (Bork and Koonin 1998). As such a substantial body of tools and concepts have already been developed to analyze them (Thompson et al. 1994, Felsenstein 1989, Smith and Waterman1981, Altschul et al. 1990). Presently, many other types of data are being generated by large scale biological experiments such as gene expression (by microarrays, or SAGE (Hughes et al. 2000, Cho et al. 1998)), genomic mutations screens (Winzeler et al. 1999, Tong et al. 2001), proteomics 2D gels (Fey and Larson 2001), peptide/protein chips (Houseman et al. 2002), mass spectrometry (Gavin et al. 2002, Ho et al. 2002), i.e. the whole batch of other 'omic' data. Complete genome sequence data (more so than other sources of sequence data such as EST's) are noise free compared to newer 'omic' large scale biological data. Moreover genome data are inherently of a discrete nature and their formalization is well established. These intrinsic features of genome sequence data and the aforementioned existing body of sequence analysis tools, is probably why complete genome sequence are analyzed more frequently and more successfully than other types of large scale biological data.
Evolution and bioinformatic analysis The intimate relationship between evolution and bioinformatic analysis is nicely illustrated by the fact that one of the first computational analyses on sequences has been phylogenetic analysis, i.e. molecular evolution (Fitch and Margoliash 1967). Based on these bioinformatic studies of sequences many important and intrinsically relevant results for the study of evolution have been obtained. It has revolutionized taxonomy and our understanding of the interplay between phenotype and genotype (Olsen et al. 1994, Clarke et al. 1989). On the other hand, as much as bioinformatic tools are used for the analysis of molecular evolution, they are also based upon it. This is apparent from the lowest levels of analysis such as gene prediction where homology based gene prediction is the most successful computational gene prediction method (Guigo et al. 2000), to higher levels such as the ability to delineate functional modules of interacting proteins through the analysis of evolutionary conserved genomic fingerprints (chapter 6). The relationship between evolutionary and bioinformatic analysis is evidently reciprocal and synergistic. We therefore, to paraphrase Dobzhansky, study genome evolution not only for the sake of evolution itself but also because nothing in genomic biology makes sense except in the light of (genome) evolution. As such evolution and its study, are one of the keys to "unlock nature's warehouses” which complete genomes hold. Not only do bioinformatic and evolutionary analysis support each other, their combined effort feeds back results into the larger molecular biological community. Among these results are many concrete findings for individual proteins. For example a gene reported as causing breast cancer but without a known molecular function, was subsequently by independent bioinformatic research convincingly predicted to be nuclear signaling receptor (Koonin et al. 1996). On a larger scale, important general biological findings are obtained by integrated bioinformatic and evolutionary analysis. For example, the large scale analysis of the number of known alternative splice variants corrected for the sizes of existing EST databases argue that the perceived increase in human complexity relative to fly or worm cannot be explained by an increase in alternative splicing (Brett et al. 2002) as was hypothesized earlier. Moreover the ability and knowledge of how to digest large scale biological databases, can be formalized in the form of (web) tools and distilled into
General introduction
3
higher level information in the form of databases, making them available to the community (Tatusov et al. 1997, Kanehisa and Goto 2000).
Comparative sequence analysis
Comparative sequence analysis and comparative genome analysis Comparative genome analysis is relatively new. As such it tries to define the basic concepts in which to describe and understand genome evolution. However these attempts do not start from scratch: its most important tools by and large stem from the realm of classical sequence analysis. In fact, many insightful comparative genome analyses are in effect uncomplicated comparisons that apply sequence analysis tools on a genome wide scale. The analysis of complete genomes has not only benefited from existing sequence analysis tools. Rather, the wealth of data generated by genome sequencing projects stimulates the improvement of existing tools and creation of new sequence analysis tools. The development of new and improved conventional sequence analysis tools is (i) needed to deal with the sheer amount of data (e.g. DbClustal, Thompson et al. 2000), and (ii) to exploit the new possibilities that this data offers (e.g. PSI-BLAST Altschul et al. 1997).
Pairwise homology searches Arguably the most important task in sequence analysis is establishing whether two sequences are homologous, i.e. if they stem from the same ancestral sequence. One of the most widespread applications of establishing homology is function prediction, because homologous sequences tend to have similar functions (Bork and Koonin 1998). The extent of homology roughly corresponds to different levels of conservation of molecular properties. Very similar sequences are likely to have the same substrate specificity, while proteins with intermediate levels of sequence similarity tend to catalyze the same reaction, albeit on related but different substrates. When two sequences are distant homologs, only the most general characteristics of the protein such as its 3D structure, i.e. 'fold', can be assigned because this is the most conserved property of a protein. Note that the type of function that one predicts this way is the molecular/enzymatic function of a protein. Other dimensions of protein function are cellular and biological process in which a protein plays a role, or its localization in the cell. Currently there are systematic formalized vocabularies, i.e. ontologies, being constructed that attempt to deal with this challenge such as the Gene Ontology project (The Gene Ontology Consortium 2001). Moreover, detecting homology is also the first step in the complicated task of determining what can be considered to be the corresponding gene between two genomes (Fitch 1970; see below). In practice establishing whether two sequences are homologous is performed in the context of a search of a query sequences against a database of many other sequences. Different tools (using different heuristics) align the query sequence consecutively to each query sequence from the whole database. Based on our condensed knowledge of sequence evolution in the form of amino acid substitution matrices and gap opening/extension penalties, a score is computed for each alignment. Taking into account
Chapter 1
4
database size and composition, the score is used to compute a expected chance of similarity. This allows a statistically sound assessment of whether two sequences are homologous or whether the observed similarity could be due to chance alone (Altschul 1990). However we cannot assess the absence of homology. Moreover note that two genes are not necessarily homologous across their full length. Different modules can be attached to the N- terminus, C-terminus, or even in the middle of a protein. These modules that form evolutionary, functionally and structurally independent units, are referred to as protein domains (Schultz et al. 1998).
Multiple sequence alignments, trees, and profiles When comparing sequences one has to find out which positions in the sequences at hand are equivalent. This is called a sequence alignment. Aligning two sequences (pairwise sequence alignment) is necessary to determine whether they are homologous. Hence this is crucial for the homology searches described above. Comparing more than two sequences, i.e. making multiple sequence alignment, gives more information, thereby opening new possibilities. Multiple sequence alignment poses a big algorithmic and computational challenge, but adequate programs do exist, such as CLUSTALW (Thompson et al. 1994) and T_COFFEE (Notredame et al. 2000). In general, a multiple alignment is useful so see which positions, or combinations of positions (i.e. motifs), are conserved, and thus important for the function of that protein. Multiple sequences alignments form the necessary prerequisite for reconstructing reliable phylogenetic trees of genes, because they allow the detection of their evolutionary differences at the equivalent positions. Moreover phylogenenetic trees themselves albeit it based only on pairwise alignments are used as so called ‘guide trees’ by programs such as CLUSTALW and T_COFFEE to make reliable multiple sequence alignments. In any case, phylogenetic trees from these alignments can be used to determine the relationships between species (molecular systematics). Most notably, the systematic collection and subsequent phylogenetic analysis of ribosomal RNA sequences (well conserved and essential genes present in all living organisms), have established the current view of life on earth as being divided in three kingdoms (Olsen et al. 1994). Tree building of single genes also allows the study of protein evolution and its relation to function (Copley and Bork 2000). Lastly, because multiple alignments allow us to evaluate the amino acid conservation at certain positions, they open up the possibility to use this information for searching divergent homologs. This is done by constructing profiles (or patterns). Profiles can be either based (i) on an ad hoc alignment of the sequences that are found during the search of the database anchored to the single initial query sequence (PSI-BLAST, Altschhul et al. 1997), or (ii) on a (manually curated) explicitly reconstructed multiple alignment (HMMER Eddy 2000, SearchWise, Birney 1996).
Comparative genome analysis
When one considers genomes as bags of marbles, what are the marbles? Comparative genome analysis obviously is much younger than sequence analysis. As with sequence analysis, we need to establish equivalency among the components we
General introduction
5
compare (i.e. homology among sequences). Unlike sequence analysis however, comparative genome analysis is on a more fundamental level first faced with the question of which components in the genome we want to compare. Similar problems are encountered in classical comparative studies like comparative zoology or morphology. This question actually is central in comparative genome analysis, namely: what are the components or characters for which we would like to establish equivalency? If we see genomes as bags of marbles, what are the marbles? Nucleotides, gene functions, intergenic sequences, proteins, regulatory elements, protein-protein interactions, metabolic pathways, and of course genes, are all possible characters. Note that we can already here encounter big technical problems in identifying 'the marbles' within the genome due to the multi-level nature of the data. For example, when we want to compare genomes at the level of genes, as we do here in chapter 4, identifying the coding regions in the genome, i.e. the genes, is a non-trivial task. These severe problems in gene prediction thus seriously influence any analysis that wants to compare genomes as bags of genes. Similarly, when comparing the metabolic pathways in two species, one is primarily interested in the presence and absence of certain enzymatic functions. Compiling such a list of which enzymes are present in a genome is difficult, because even for the best studied organisms this involves reliable function prediction for all genes in the genome, which is difficult to attain (Huynen et al. 1999). Technical difficulties in obtaining these characters aside, the question of which character to study, probably depends on the research inquiry and tools at hand. In the aforementioned study of metabolic pathways the primary interest in the presence and absence of enzymatic functions makes the question whether the enzymes that code for these activities are homologous of less relevance. Thus the multi level nature of genomes is reflected in different levels of functional analysis (Bork et al. 1998). This thesis mainly deals with genomes as bags of genes and their relations. However to offer a general perspective, some lower levels of genome comparison are discussed first.
Genomes as bags of nucleotides and amino acids On a most basic level, one can see the genomes as bags of nucleotides or encoded amino acids. When one leaves out the strict evolutionary requirement of common ancestry, i.e. homology, and instead opts for simple equivalency, the classification is trivial. For example one can make an analysis of genomes by taking its complete DNA or all its ORF sequences, and considering them as bags of nucleotides and amino acids to obtain average statistics. The most obvious example is Guanine-Cytosine (GC) content, which is a classic taxonomic indicator of microbial genomes. Complete genome sequences have confirmed the previously found biases for certain species that were determined with isopycnic centrifugation in CsCl (Enea and Zinder 1975). Using complete genome sequences more complicated analyses that search for genomes as bags of short nucleotide words, have shown that there is unique fingerprints for all genomes even to the extent that one can differentiate strains of the same species (Sandberg et al. 2001). What furthermore has become possible is to find regions within the genome that significantly differ in GC content (Lawrence and Ochman 1998). Detecting such regions has been a fruitful approach to find regions in the genome that might have arrived there through horizontal gene transfer. Since a GC bond is stronger than an Adenine-Thymine bond, thermophilic organisms might be expected to have a bias in their GC content to stabilize their genomic DNA. This
Chapter 1
6
is however not the case. Instead they seem to use reverse gyrase to stabilize their genomic DNA by supercoiling (Forterre 2002). They do however need more GC bonds in their RNA genes to maintain their functionality. This observation has allowed the finding of new RNA genes in the genomes by searching of regions with significantly higher GC content (Omer et al. 2000), similar to the finding of putative horizontally transferred genes based on different signatures (see above). Not only do genomes have distinct GC contents, there is also a difference in usage of amino acids for the proteins. Comparison of global genome statistics that treat all ORFs as one big pool of amino acids, have found two significant trends: the first is that the GC content correlates strongly with the Arginine content, while having a strong anti correlation with the lysine content (Kreil and Ouzounis 2001; Cambillau and Claverie 2000). This is an almost purely mechanistic result of the underlying GC bias. The second finding from complete genomes with regard to amino acid content has been that hyperthermophily is characterized by a sharp increase of charged residues, notably Lysine and Glutamate, at the expense of polar non charged residues, mainly Glutamine. We thus find effects of a feature of the highest level of organismal phenotype, i.e. the temperature at which it lives, onto the lowest levels of molecular observation, the amino acid content of its proteins and the nucleic acid contents of its RNA genes. On the other hand, there are pure statistical (seemingly random) biases on the DNA level that also affect the amino acid content. These deviating amino acid or nucleic acid compositions provide us with examples of the relation between the habitat and its composing parts, which stand at the core of genome function and evolution. These biases in the sequence composition probably affect homology detection and phylogenetic inference, however in practice they are not (yet?) taken into account.
Comparing genomes as bags of genes means establishing equivalency among the genes: homology and orthology Since genomes are basically very long sequences, one might be tempted to align them just as normal sequences. Thereby one would obtain at the lowest possible level a strict evolutionary equivalency for each nucleotide to each other nucleotide. However, this is only possible with very closely related genomes because of the fast rate of genome shuffling (Suyama and Bork 2001). Hence the need for a higher level, more modular, analysis: at the level of genes. In general comparative genomics mostly operates at this bag of genes level (Huynen and Bork 1998). Having established what the characters are, in order to perform comparative genome analysis, we now must establish which is gene is equivalent to which other gene. The starting point for this is finding homologous genes. Applying the sequence analysis tools described above on completely sequenced genomes thus yields the basic data for performing comparative genome analysis. However the evolutionary dynamics of genes relative to the evolutionary dynamics of the species wherein they reside, has given rise to the insight that homology as a definition for 'the same gene' in different species is conceptually insufficient due to gene loss, and ancient as well as recent gene duplications The concept that seems to offer the best solution for these complications is orthology (Fitch 1970). Two genes in two organisms are defined as being orthologs when they are homologous and they diverged from each other at the same time as the two species diverged from each other, i.e. they are related by speciation rather than by gene
General introduction
7
duplication. The simplest operational definition for orthology when comparing two species that has been put forward, is the bidirectional best hit (Tatusov et al. 1996). This approach has proven to be very useful for such comparisons (Huynen and Bork 1998, Overbeek et al. 1999, Tamames 2001) and we also employ it in chapters 2, 3, and 5. However, operational orthology definition becomes more complicated when we compare more than two genomes. As orthology is defined with respect to speciation, when we compare multiple species, then it is the last common ancestor of all these genomes, and we obtain an orthologous group of genes which does not necessarily includes a single gene per genome. In the case that the comparison spans all completely sequences genomes, the relevant ancestor is the last common ancestor of all extant life. An orthologous groups in that case includes all genes that stem from one single gene in the last common ancestor of all extant life. Obviously many gene evolution events (most notably gene duplication, gene loss, and horizontal gene transfer) can have occurred to an orthologous group of genes since this ancestor. This principle of group orthology is what underlies the methods we use in chapter 4 and 6, and also the COG (clusters of ortholgous groups) database (Tatusov et al. 1997).
Comparing genomes on the level of genes: gene content evolution
Gene family evolution within genomes Whether two genes, or the proteins domains they are composed of, belong to the same gene family is an operationally relatively well defined question, thanks to tools from sequence analysis. The study of gene family dynamics within the genome, is therefore a fertile and successful example of applying conventional sequence analysis tools to genes on a genome wide scale. There are various levels of relatedness in defining gene families: three levels on which gene family dynamics within the genome has been studied are recent gene duplications (since the speciation from intermediately close relatives)(Jordan et al. 2001), conventional homology by sequences similarity based gene families (Huynen and Nimwegen 1998), and the fold level (Qian et al. 2001). Note that only for a few genes within a genome the 3D structure is known. Therefore an important spin-off from approaches studying the number of different genes in a genome that are of a certain fold, is fold prediction through sensitive distant homology searches (Huynen et al. 1998, Teichman et al. 1998). There are also different approaches to detect these families: either bottom up by all against all sequence comparisons, or top down by scanning a genome with profiles. Top down searches seem to be more powerful and easier, but are only made possible in the first place by manually curated bottom up searches that are used to create their profiles. Irrespective of the conceptual or heuristic approach, the results all point to the same thing: the frequency distribution of gene families in all genomes follows a power law. This distribution can be explained by a deletion/duplication model in which related genes have a similar chance of being deleted or duplicated. This is probably due to related genes having similar function, and are thus under a similar selection regime as first shown and proposed by Huynen and Nimwegen (1998) and more recently by Qian and co-workers (2001). An analysis of recent gene duplications (Jordan et al. 2001), shows similar
Chapter 1
8
patterns despite the fact that the duplications that gave rise to fold or gene families by and large have occurred much longer ago. The result thus holds for different time scales.
Gene evolution versus genome evolution Obviously an organism obtains most of its gene from its direct ancestors. One would therefore expect that phylogeny is the major determinant in gene content similarity. Initially it was shown that when comparing shared gene content of complete genomes with some measure of evolutionary time (like protein sequence evolution), it correlates with the evolutionary proximity (Huynen and Bork 1998). However other types of analysis, which do not focus on the presence and absence of genes, but rather compare trees of genes with those of the presumed organismal tree, suggest that many gene trees are inconsistent with organismal tree (Doolittle and Logsdon 1998). This has prompted the notion that horizontal gene transfer (HGT) is a substantial or, maybe even, dominating force in determining gene content. Similar estimates for the dominance of HGT come from studies that use deviating GC content or codon usage to determine which genes have recently been transferred (Lawrence and Ochman 1998). The apparent ubiquity of HGT has resulted in a number of publications that cast doubt on the very notion of an organismal phylogeny (Doolittle 1999). Still, as will be discussed in this thesis and shown by Tekaia and coworkers (1999) and Fitz-Gibbon and House (1999), the gene content contains a quantitatively dominant phylogenetic signal. From all this emerges a picture where for one the most fundamental properties of genomes, its gene content, we struggle to reach an understanding of how it comes to be. This in contrast to sequences and their multiple alignment, for which heuristics do exist in the form of substitution matrices. Although these substitution matrices are not a perfect model for sequence evolution, they have provided us with useful tools for studying sequence evolution. The lack of insight in the gene content evolution of complete genomes as a fundamental evolutionary process, presents us with no basic or neutral expectation for behavior of genes. Among other effects this also limits the assessment of how surprising the absence or presence of a gene is. It thereby illustrates the need for strategies such as the one outlined in chapter 4 that explicitly reconstruct which transformations have occurred over the course of genome evolution.
Genome evolution beyond a bag of genes
Evolution of gene order In all analyses described above the only information from the genome that is used, is that it consists of a certain bag set of genes. And even that information is only used to increase for example the number of observations of genes that show a characteristic x (such as being shared with another genome, or having a TIM-barrel fold). Naturally there are approaches that do exploit the unique additional information from complete genomes. When doing that, the same tools and concepts as described above are used, while at the same time operating at a higher level of genome description. One of the most immediate analyses beyond a bag of genes that uses tools from conventional sequence analysis, is the most simple link between genes, namely their order on the chromosome. Gene order
General introduction
9
as a step beyond gene content has been studied in mitochondrial genome analysis with the aim of recovering phylogenies (Boore andBrown 1998). Actually in many ways mitchondrial genomes have provided pilot studies for analyzing larger nuclear genomes. Hence gene order is studied quite extensively insofar as genomes are available. Based on the first available prokaryotic genomes it was concluded that gene order is not, or only very poorly, conserved (Mushegian and Koonin 1996). More quantitative approaches similar to shared gene content over evolutionary time, show that the amount gene order conservation decreases more rapidly than other measures of evolutionary time like protein sequence identity, but that even over large evolutionary distances some conservation can be observed (Huynen and Bork 1998). Interestingly, those gene pairs that (Galperin and Koonin 1996) are conserved seem to be functionally interacting genes. Studies on gene order in the complete genomes of eukaryotes show that here it evolves faster than in prokaryotes, with hardly any shared gene order left, at distances where prokaryotes still share a substantial number of gene pairs (Huynen et al. 2001).
Predicting interactions between proteins using complete genomes As has been done for gene order, we can study the evolution of a diverse set of genomic relations between genes. Many of these relations tend to evolve relatively quickly as is observed for gene order (Huynen and Bork 1998). Therefore when these genomic links are conserved, selection is probably operating to keep them intact. As mentioned above, this for example has already been suggested to be the case for conserved gene order because the gene pairs tended have some functional link (Galperin and Koonin 1996). Subsequent in depth analysis various types of relations between genes have found some genomic associations that were shown to reflect functional associations (reviewed in Huynen et al. 2000). These genomic associations are the result of evolutionary pressure and thus reflect the traces left in genomes by the selection on functionally interacting proteins. Until now three different types of genomic associations have been introduced. Firstly, the most general type of genomic association is the tendency for genes to be absent and present together from the genome (Huynen and Bork 1998, Pellegrini et al. 1999, Tatusov et al .2001). This co-occurrence of genes in genomes (phylogenetic profiles) indicates that they have been lost and gained together, which in turn has been shown to be indicative of a functional interaction. Secondly, as mentioned above, one can observe that gene pairs whose order is conserved seem to be functionally interacting genes (Galperin and Koonin 1996). This in turn has stimulated more systematic large scale complete genome comparisons that have systematized and established conserved gene order as a very powerful tool for the prediction of functional interactions based on this 'conserved local genomic context' (Dandekar et al. 1998, Overbeek et al. 1998, Huynen et al. 2000). Note that the conservation of the gene order is more important than the presence of two genes in the same operon, because (i) there are cases known where the gene order is conserved but the gene cluster consists of different transcriptional units in different organisms (Suh et al. 1996), and (ii) genes in the same operon but only in one species do not necessary necessarily have a functional association (Salgado et al. 2000). Finally the most intimate form of genomic association is the fusion of two genes into one polypeptide. This type of associations has been shown to be a very strong predictor that the two genes have a functional interaction, albeit with relatively low coverage (Enright et al. 1999, Marcotte et al. 1999, Yanai et al. 2001)
Chapter 1
10
These genomic context, or genomic association, approaches go beyond comparative genome analysis as a bag of genes, because they actually look at the relations between the genes. Since they predict functional interactions between genes rather than molecular functions of genes themselves, they are orthogonal to conventional function prediction by means of homology searches (see above).
This thesis This thesis deals with a set of bioinformatic analyses that cover different types of comparative genome analysis on the level of genes and their relations (Bork et al. 1998). The chapters follow the build up from defining the equivalency among genes across genomes (orthology), to the basic evolutionary pattern in gene content evolution, to gene order evolution, and large scale analysis of the genomic associations between genes. In chapter 2 we study the occurrence of gene fusion and gene fission on a genome wide scale. Fusion and fission (e.g. the fragmentation or splitting of genes) are two principal processes in molecular evolution. However they are also complicating factors in defining orthology (Huynen and Bork 1998). These processes so far had mainly been recognized and described in individual cases (although they have been studied for large scale function prediction Enright et al.1999, Marcotte et al.1999). The estimates of the frequency of occurrence of gene fission and gene fusion that we obtain are compared to each other and across the various genomes. The quantitative analysis shows a prevalence of fusion, which can be expected because there is a benefit to fusion in that it allows for the physical coupling of functions that are biologically coupled. We separate fission into cases that look more like frameshift sequencing errors or very recent frameshift mutations on the one hand, and cases of established 'genuine' fissions on the other. Interestingly a correlation of the genuine fissions with a thermophilic lifestyle is found. We here argue that this correlation is observed because a split organization actually offers an adaptation to thermophilic lifestyle. In chapter 3 we introduce and discuss genome phylogenies. The apparent ubiquity of HGT suggests that the correspondence between the evolution of gene content and of the species might be low or non existent (Doolittle 1999). On the other hand, quantitative studies suggest that the number of shared genes correlates with evolutionary closeness (Huynen and Bork 1998). We here explicitly probe shared gene content for a phylogenetic signal, by constructing a genome tree based on shared genes. We thereby find a good correspondence between the obtained tree and known phylogenies from other sources. Subsequently we discuss the relevance of this work for defining the tree of life, and even for answering whether such a thing as a species phylogeny is feasible. Finally we introduce a web server, SHOT, that makes the construction of genome trees with a diverse set of parameters and species, available to the general community for which such computationally intensive research otherwise would not be possible. The usefulness of the web server is demonstrated by discussing genome trees obtained from a recent comprehensive set of species. In chapter 4 we present an integrated approach to reconstruct which genes were present in the Archaeal and Proteobacterial ancestral genomes and how ancestral and present day genomes have been shaped by the processes of gene loss, gene duplication, horizontal
General introduction
11
gene transfer (HGT), gene fusion/fission, and gene genesis. In chapter 3 we present a classification of complete genomes. Here we use the thereby obtained tree to actually interpret the presence and absence patterns in terms of genome evolutionary events. The reconstruction suggests that the ancestor of the Proteobacteria contained around 2500 genes, and the ancestor of the Archaea around 2050 genes. Although it is necessary to invoke horizontal gene transfer to explain the content of present day genomes, gene loss, gene genesis, and simple vertical inheritance are quantitatively the most dominant processes in shaping the genome. Together they result in a turnover of gene content such that even the lineage leading from the ancestor of the Proteobacteria to the relatively large genome of Escherichia coli has lost at least 950 genes. Gene loss, unlike the other processes, correlates fairly well with time. This clock like behavior suggests that gene loss is under negative selection, while the processes that add genes are under positive selection. The repeated occurrence of genes in each others neighbourhood on genomes has been shown to indicate a functional association between the proteins they encode. Since we have been heavily participating in finding the basic patterns of genomic associations, and benchmarking these for function prediction (Huynen and Snel 2000), as well as co-pioneering the use of conserved gene order for function prediction, we introduce in chapter 5 STRING, a Search Tool for Recurring Instances of Neighbouring Genes. STRING is a web server that allows the retrieval and display of the genes a query gene repeatedly occurs with in clusters on the genome. It performs iterative searches and visualizes the results in their genomic context. By finding the genomically associated genes for a query, it delineates a set of potentially functionally associated genes. The usefulness of STRING is illustrated with an example that suggests a functional context for an RNA methylase with unknown specificity. In chapter 6, we present an analysis of the complete network of genomic associations derived from conserved gene order with the aim of delineating functional modules: sets of proteins that functionally interact. Associations obtained from conserved co-occurrence of two genes within operons indicate a functional interaction between their products. However many genes end up being indirectly linked to each other. This trend is likely to only get worse with more genomes. We therefore study the properties of the network. Analysis of the giant component reveals that it is a scale free, small world network with a high degree of local clustering. It consists of locally highly connected subclusters that are connected to each other by linker proteins. By splitting up the giant component at these linker proteins we identify subclusters that tend to have a homogeneous functional composition. It is thereby shown that comparative genome analysis allows the identification of a natural classification of proteins that is complementary to those based on molecular function. Finally in chapter 7, we provide a summarizing and synthesizing discussion of the chapters presented in this thesis. We moreover describe and summarize a few new and parallel developments that provide the arising context for our results. Partly, these developments are also described because they solve some of the issues that are raised here, or present promising approaches in comparative genome analysis in general.

13
2 Genome evolution: gene fusion
versus gene fission
Berend Snel, Peer Bork and Martijn A. Huynen
Trends in Genetics 16 (2000) 9-11
Chapter 2
14
Introduction With the advent of complete genome sequencing, it has become possible to study gene evolution on a genome-wide scale (for an overview of sequenced genomes see http://www.tigr.org). Here, we present a systematic analysis of two principal processes in molecular evolution: the fusion and fission of genes, events that have so far mainly been recognized and described in individual cases (Leffers et al 1989 and Zakharova et al 1999). We quantify fusion and fission of orthologous genes (Fitch 1970) in completely sequenced prokaryotic genomes. As fission and fusion events of orthologous genes are unlikely to reflect a change in their function, genome-wide, rather than gene-specific, trends can be observed. The estimates of the occurrence of gene fission and gene fusion that we obtain are subsequently compared with each other and across the various genomes.
Methods To obtain a candidate set of orthologous genes that underwent fission or fusion, we began our analysis with Smith-Waterman sequence comparisons (Smith and Waterman 1981, Pearson 1998) of all open reading frames (ORFs) from 17 completely sequenced genomes (see Table 1). For each pair of genomes we determined pairs of genes with highest, significant (e < 0.01, where e is the expected number of false positives in homology detection), bidirectional levels of identity, which we considered potential orthologs. We allowed a gene from a genome A to have more than one ortholog in a genome B if the alignments of the genes of B with the gene of A did not overlap with each other (Huynen and Bork 1998), providing the candidates for fission and/or fusion. Subsequently, families of orthologous proteins of these candidates were collected from the genomes. To ensure that our families consisted only of orthologous genes, we used additional information from relative levels of similarities to other genes, conservation of gene order (synteny) and, if necessary, genes in species that were not originally included in the analysis (Huynen and Bork 1998). Phylogenetic trees of these families were made and the distribution of the different gene organizations, either present as separate genes or as one gene, was mapped to the respective leaves. Considering scenarios with one single protein, as well as two split proteins, as the ancestral state, we determined the explanation of the distribution of organizations over the tree that required the smallest number of fission and/or fusion events (see Fig. 2.1 for an example). In determining this, we took into account only the reliable parts of the tree (high bootstrap values) and constructed trees for the parts as well as for the complete protein. In addition, we analysed the DNA sequence of adjacent split genes that are present in only one species. Using the frameshift program of the (http://shag.embl-heidelberg.de:8000/Bic/; http://www.cgen.com), we tested if those split genes underwent a fission event that was generated by a single nucleotide frameshift deletion or insertion. These fissions then are either frameshift sequencing errors, or result from recent frameshift mutations. For example, the resequencing of a region of the Mycoplasma pneumoniae genome that contains three ORFs encoding fragments of the R subunit of the restriction modification system, which were generated by frameshifts that we also detected, has shown that the split organization is the actual organization (Himmelreich et
Genome evolution: gene fusion versus gene fission
15
al. 1997). In general, one cannot distinguish between the two possibilities based only on sequence data. Therefore, we put those putative fissions in a separate category, hereafter referred to as `frameshift'. The fissions for which we are certain that they occurred as such, we refer to as `genuine'.
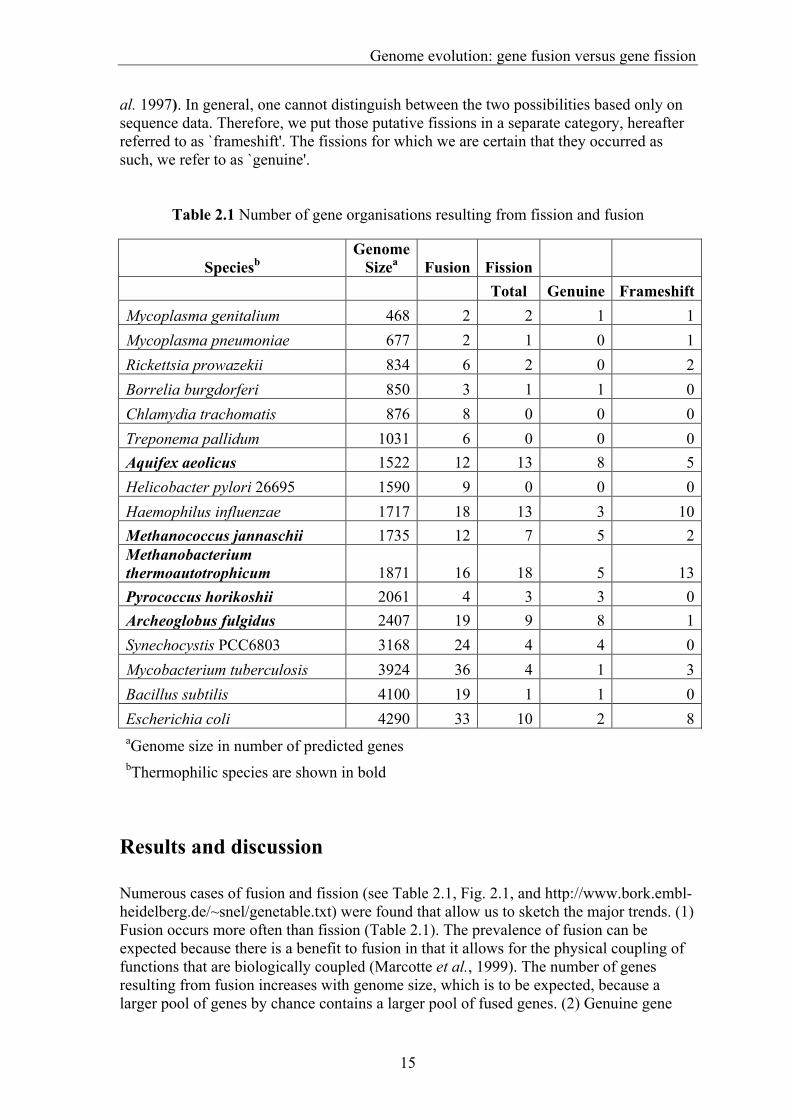
Table 2.1 Number of gene organisations resulting from fission and fusion
Speciesb Genome
Sizea Fusion Fission Total Genuine Frameshift
Mycoplasma genitalium 468 2 2 1 1Mycoplasma pneumoniae 677 2 1 0 1Rickettsia prowazekii 834 6 2 0 2Borrelia burgdorferi 850 3 1 1 0Chlamydia trachomatis 876 8 0 0 0Treponema pallidum 1031 6 0 0 0Aquifex aeolicus 1522 12 13 8 5Helicobacter pylori 26695 1590 9 0 0 0Haemophilus influenzae 1717 18 13 3 10Methanococcus jannaschii 1735 12 7 5 2Methanobacterium thermoautotrophicum 1871 16 18 5 13Pyrococcus horikoshii 2061 4 3 3 0Archeoglobus fulgidus 2407 19 9 8 1Synechocystis PCC6803 3168 24 4 4 0Mycobacterium tuberculosis 3924 36 4 1 3Bacillus subtilis 4100 19 1 1 0Escherichia coli 4290 33 10 2 8aGenome size in number of predicted genes bThermophilic species are shown in bold
Results and discussion Numerous cases of fusion and fission (see Table 2.1, Fig. 2.1, and http://www.bork.embl-heidelberg.de/~snel/genetable.txt) were found that allow us to sketch the major trends. (1) Fusion occurs more often than fission (Table 2.1). The prevalence of fusion can be expected because there is a benefit to fusion in that it allows for the physical coupling of functions that are biologically coupled (Marcotte et al., 1999). The number of genes resulting from fusion increases with genome size, which is to be expected, because a larger pool of genes by chance contains a larger pool of fused genes. (2) Genuine gene
Chapter 2
16
fission is mainly observed in Aquifex aeolicus and the four archaeal species. All these species are thermophiles, and they contain significantly more split genes resulting from a genuine fission than non-thermophiles (p < 0.01 using the Mann¯Whitney test, see Table 2.1). This suggests that, at high temperatures, there is an increase in mutations leading to split genes, because larger thermal fluctuations lead to an increased error rate in replication. Alternatively, split genes might reflect an adaptation to high temperatures. If we assume that the number of errors that occur in the process of creating a functional protein from DNA (e.g. errors in transcription, translation or folding) is proportional to the sequence length, then, with for example a 10% error rate per 300 base pairs, 81% of one protein of 200 amino acids will be functional (90% × 90%). However, when two separate proteins code for two units of 100 amino acids each, 90% of the proteins will be functional [(90% + 90%)/2]. At higher temperatures, the error rate increases owing to larger thermal fluctuations (Jaenicke and Boehm 1998), and therefore this difference becomes more important. The increased impact of this process will then result in an increased advantage of having separate subunits coding for a certain protein complex. Frameshift fissions appear not to be restricted to a specific type of organism (Table 2.1), but some genomes contain considerably more than others. This could mean that these genomes might contain more sequencing errors. Alternatively, if these fissions are recent frameshift mutations that render genes biologically inactive, this might mean that in these organisms there is a reduced selection for the functionality of certain genes, because these strains live under rich and constant conditions (see Burns et al (1995) for an example). Recently, Marcotte et al.(1999) showed that proteins with homologs fused together in one protein are likely to interact. However, this prediction method has a high proportion of false positives (82%). We observe that the vast majority of pairs of genes whose orthologs are fused are either part of the same complex, or function in the same pathway. Thus, by considering only orthologs, the fraction of false positives can be substantially decreased, albeit at a price of reducing the number of proteins to which the method applies. No general pattern was found in the functions of the genes that underwent a fission event. Genes resulting from a fission event are often annotated as hypothetical, because the split forms a problem in annotation of function (Bork and Koonin 1998). The reverse, fusion proteins being annotated as having only one of two functions, has also been observed. Here for the first time, we have systematically and comprehensively surveyed the occurrence of gene fission and fusion. We find a correlation of fission with thermophily and argue that this lifestyle results in a selective pressure for the split organization of genes. As such, it is an example of the relation between phenotype and its composing parts. Cross-level relations like this stand at the core of genome function and evolution, and we expect that our understanding of them will eventually allow us to elucidate the principles that govern the dynamics of genome evolution.
Genome evolution: gene fusion versus gene fission
17
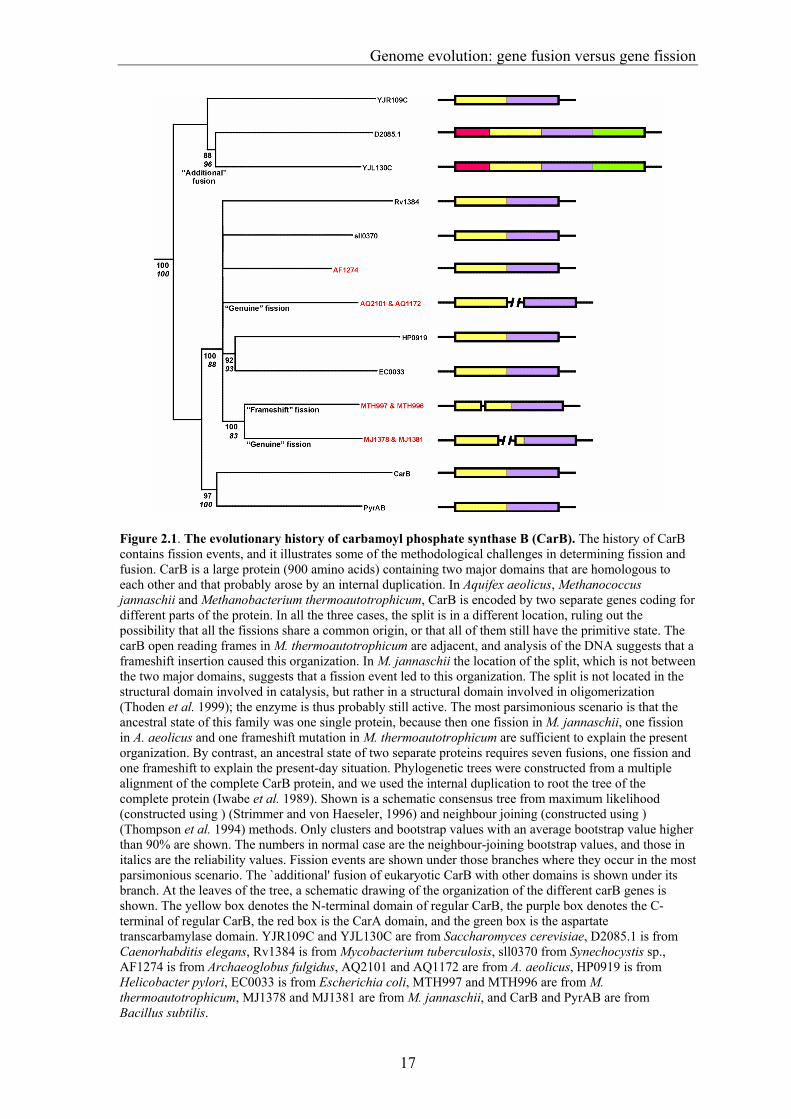
Figure 2.1. The evolutionary history of carbamoyl phosphate synthase B (CarB). The history of CarB contains fission events, and it illustrates some of the methodological challenges in determining fission and fusion. CarB is a large protein (900 amino acids) containing two major domains that are homologous to each other and that probably arose by an internal duplication. In Aquifex aeolicus, Methanococcus jannaschii and Methanobacterium thermoautotrophicum, CarB is encoded by two separate genes coding for different parts of the protein. In all the three cases, the split is in a different location, ruling out the possibility that all the fissions share a common origin, or that all of them still have the primitive state. The carB open reading frames in M. thermoautotrophicum are adjacent, and analysis of the DNA suggests that a frameshift insertion caused this organization. In M. jannaschii the location of the split, which is not between the two major domains, suggests that a fission event led to this organization. The split is not located in the structural domain involved in catalysis, but rather in a structural domain involved in oligomerization (Thoden et al. 1999); the enzyme is thus probably still active. The most parsimonious scenario is that the ancestral state of this family was one single protein, because then one fission in M. jannaschii, one fission in A. aeolicus and one frameshift mutation in M. thermoautotrophicum are sufficient to explain the present organization. By contrast, an ancestral state of two separate proteins requires seven fusions, one fission and one frameshift to explain the present-day situation. Phylogenetic trees were constructed from a multiple alignment of the complete CarB protein, and we used the internal duplication to root the tree of the complete protein (Iwabe et al. 1989). Shown is a schematic consensus tree from maximum likelihood (constructed using ) (Strimmer and von Haeseler, 1996) and neighbour joining (constructed using ) (Thompson et al. 1994) methods. Only clusters and bootstrap values with an average bootstrap value higher than 90% are shown. The numbers in normal case are the neighbour-joining bootstrap values, and those in italics are the reliability values. Fission events are shown under those branches where they occur in the most parsimonious scenario. The `additional' fusion of eukaryotic CarB with other domains is shown under its branch. At the leaves of the tree, a schematic drawing of the organization of the different carB genes is shown. The yellow box denotes the N-terminal domain of regular CarB, the purple box denotes the C-terminal of regular CarB, the red box is the CarA domain, and the green box is the aspartate transcarbamylase domain. YJR109C and YJL130C are from Saccharomyces cerevisiae, D2085.1 is from Caenorhabditis elegans, Rv1384 is from Mycobacterium tuberculosis, sll0370 from Synechocystis sp., AF1274 is from Archaeoglobus fulgidus, AQ2101 and AQ1172 are from A. aeolicus, HP0919 is from Helicobacter pylori, EC0033 is from Escherichia coli, MTH997 and MTH996 are from M. thermoautotrophicum, MJ1378 and MJ1381 are from M. jannaschii, and CarB and PyrAB are from Bacillus subtilis.

19
3 Genome phylogenies
3.1 Introduction Species phylogenies derived from comparisons of single genes are rarely consistent with each other. This is caused by biological issues in gene evolution such as horizontal gene transfer, unrecognized paralogy and highly variable rates of evolution, but also by methodological problems. The advent of completely sequenced genomes potentially provides us with a wealth of data to bypass these problems. Since it has been shown that shared gene content and shared gene order correlate with divergence time (Huynen and Bork 1998, Tamames 2001), these two genomic measures might provide one way of capturing the phylogenetic signals in complete genomes. This chapter extensively describes different aspects of so called genome phylogenies. The results and implications of genome trees are illustrated with trees that incorporate the increasing number of complete genomes that have become available (see below: Chapter 3.2, Chapter 3.3 and Chapter 3.4). First the original method for reconstructing trees for complete genomes based on shared gene content is introduced. The method is explained in detail and the results are compared to conventional phylogenies. Given the results, we discuss the question whether shared gene content is quantitatively largely determined by phylogeny, phenotype, or horizontal gene transfer. Secondly the results are discussed in the light of the assertion that a (prokaryotic) species phylogney might not exist, and that therefore to construct phylogenies of species they should be regarded as either less or more than the sum of their genes (Doolittle 1999). Because we have found a strong signal in shared gene content, we argue that genome phylogenies might help in finding a solution to this problem. Moreover in a literal way genome trees reside in the middle between Doolittle’s “more or less than the sum of its (i.e. of the genome) genes”, because they are based upon this sum of the genes. Finally we present a web server for the construction of genome phylogenies, SHOT and discuss how using different options yields insights in genome evolution as well as general phylogeny.
20
3.2 Genome phylogeny based on gene content
Berend Snel, Peer Bork, and Martijn A. Huynen,
Nature Genetics 21 (1999) 108-110
Abstract Species phylogenies derived from comparisons of single genes are rarely consistent with each other, due to horizontal gene transfer (Doolittle and Logsdon 1998), unrecognized paralogy and highly variable rates of evolution (Huynen and Bork 1998). The advent of completely sequenced genomes allows the construction of a phylogeny that is less sensitive to such inconsistencies and more representative of whole-genomes than are single-gene trees. Here, we present a distance-based phylogeny (Saitou and Nei 1987) constructed on the basis of gene content, rather than on sequence identity, of 13 completely sequenced genomes of unicellular species. The similarity between two species is defined as the number of genes that they have in common divided by their total number of genes. In this type of phylogenetic analysis, evolutionary distance can be interpreted in terms of evolutionary events such as the acquisition and loss of genes, whereas the underlying properties (the gene content) can be interpreted in terms of function. As such, it takes a position intermediate to phylogenies based on single genes and phylogenies based on phenotypic characteristics. Although our comprehensive genome phylogeny is independent of phylogenies based on the level of sequence identity of individual genes, it correlates with the standard reference of prokarytic phylogeny based on sequence similarity of 16s rRNA (Olsen et al. 1994). Thus, shared gene content between genomes is quantitatively determined by phylogeny, rather than by phenotype, and horizontal gene transfer has only a limited role in determining the gene content of genomes.
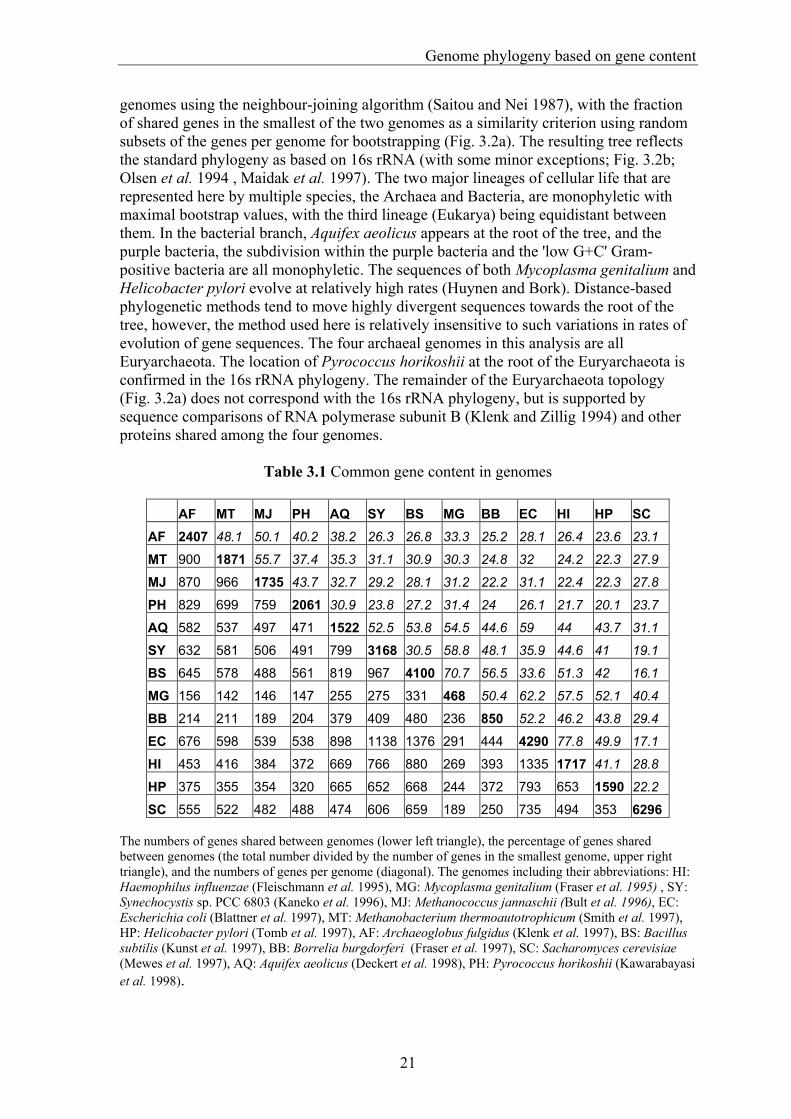
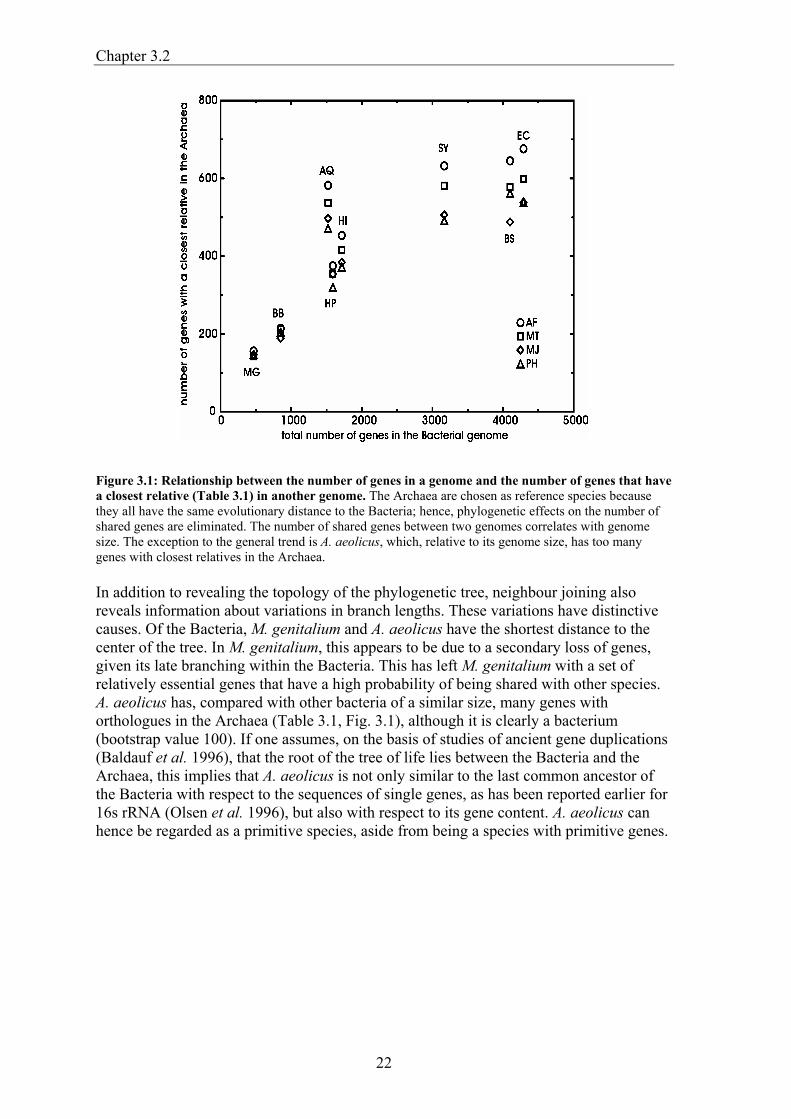
Results and discussion When we compared the protein sequences encoded by 13 completely sequenced genomes with each other and recorded the number of genes shared between the genomes using an operational definition of orthology (Fitch 1970), two patterns emerged (Table 3.1). Not unexpectedly, the first one is that large genomes have many genes in common; for example, the highest number of shared genes can be observed between Escherichia coli and Bacillus subtilis, which have the largest genomes among the Bacteria. This effect of size is reflected in the numbers of genes that the four archaeal genomes share with bacteria of various sizes (Fig. 3.1). The second emerging pattern is a phylogenetic one: the number of genes two genomes have in common depends on their evolutionary distance (Huynen and Bork 1998). Haemophilus influenzae for example shares more genes with its close relative E. coli than with B. subtilis. We created a phylogeny of the
Genome phylogeny based on gene content
21
genomes using the neighbour-joining algorithm (Saitou and Nei 1987), with the fraction of shared genes in the smallest of the two genomes as a similarity criterion using random subsets of the genes per genome for bootstrapping (Fig. 3.2a). The resulting tree reflects the standard phylogeny as based on 16s rRNA (with some minor exceptions; Fig. 3.2b; Olsen et al. 1994 , Maidak et al. 1997). The two major lineages of cellular life that are represented here by multiple species, the Archaea and Bacteria, are monophyletic with maximal bootstrap values, with the third lineage (Eukarya) being equidistant between them. In the bacterial branch, Aquifex aeolicus appears at the root of the tree, and the purple bacteria, the subdivision within the purple bacteria and the 'low G+C' Gram-positive bacteria are all monophyletic. The sequences of both Mycoplasma genitalium and Helicobacter pylori evolve at relatively high rates (Huynen and Bork). Distance-based phylogenetic methods tend to move highly divergent sequences towards the root of the tree, however, the method used here is relatively insensitive to such variations in rates of evolution of gene sequences. The four archaeal genomes in this analysis are all Euryarchaeota. The location of Pyrococcus horikoshii at the root of the Euryarchaeota is confirmed in the 16s rRNA phylogeny. The remainder of the Euryarchaeota topology (Fig. 3.2a) does not correspond with the 16s rRNA phylogeny, but is supported by sequence comparisons of RNA polymerase subunit B (Klenk and Zillig 1994) and other proteins shared among the four genomes.
Table 3.1 Common gene content in genomes
AF MT MJ PH AQ SY BS MG BB EC HI HP SC AF 2407 48.1 50.1 40.2 38.2 26.3 26.8 33.3 25.2 28.1 26.4 23.6 23.1
MT 900 1871 55.7 37.4 35.3 31.1 30.9 30.3 24.8 32 24.2 22.3 27.9
MJ 870 966 1735 43.7 32.7 29.2 28.1 31.2 22.2 31.1 22.4 22.3 27.8
PH 829 699 759 2061 30.9 23.8 27.2 31.4 24 26.1 21.7 20.1 23.7
AQ 582 537 497 471 1522 52.5 53.8 54.5 44.6 59 44 43.7 31.1
SY 632 581 506 491 799 3168 30.5 58.8 48.1 35.9 44.6 41 19.1
BS 645 578 488 561 819 967 4100 70.7 56.5 33.6 51.3 42 16.1
MG 156 142 146 147 255 275 331 468 50.4 62.2 57.5 52.1 40.4
BB 214 211 189 204 379 409 480 236 850 52.2 46.2 43.8 29.4
EC 676 598 539 538 898 1138 1376 291 444 4290 77.8 49.9 17.1
HI 453 416 384 372 669 766 880 269 393 1335 1717 41.1 28.8
HP 375 355 354 320 665 652 668 244 372 793 653 1590 22.2
SC 555 522 482 488 474 606 659 189 250 735 494 353 6296 The numbers of genes shared between genomes (lower left triangle), the percentage of genes shared between genomes (the total number divided by the number of genes in the smallest genome, upper right triangle), and the numbers of genes per genome (diagonal). The genomes including their abbreviations: HI: Haemophilus influenzae (Fleischmann et al. 1995), MG: Mycoplasma genitalium (Fraser et al. 1995) , SY: Synechocystis sp. PCC 6803 (Kaneko et al. 1996), MJ: Methanococcus jannaschii (Bult et al. 1996), EC: Escherichia coli (Blattner et al. 1997), MT: Methanobacterium thermoautotrophicum (Smith et al. 1997), HP: Helicobacter pylori (Tomb et al. 1997), AF: Archaeoglobus fulgidus (Klenk et al. 1997), BS: Bacillus subtilis (Kunst et al. 1997), BB: Borrelia burgdorferi (Fraser et al. 1997), SC: Sacharomyces cerevisiae (Mewes et al. 1997), AQ: Aquifex aeolicus (Deckert et al. 1998), PH: Pyrococcus horikoshii (Kawarabayasi et al. 1998).
Chapter 3.2
22
Figure 3.1: Relationship between the number of genes in a genome and the number of genes that have a closest relative (Table 3.1) in another genome. The Archaea are chosen as reference species because they all have the same evolutionary distance to the Bacteria; hence, phylogenetic effects on the number of shared genes are eliminated. The number of shared genes between two genomes correlates with genome size. The exception to the general trend is A. aeolicus, which, relative to its genome size, has too many genes with closest relatives in the Archaea. In addition to revealing the topology of the phylogenetic tree, neighbour joining also reveals information about variations in branch lengths. These variations have distinctive causes. Of the Bacteria, M. genitalium and A. aeolicus have the shortest distance to the center of the tree. In M. genitalium, this appears to be due to a secondary loss of genes, given its late branching within the Bacteria. This has left M. genitalium with a set of relatively essential genes that have a high probability of being shared with other species. A. aeolicus has, compared with other bacteria of a similar size, many genes with orthologues in the Archaea (Table 3.1, Fig. 3.1), although it is clearly a bacterium (bootstrap value 100). If one assumes, on the basis of studies of ancient gene duplications (Baldauf et al. 1996), that the root of the tree of life lies between the Bacteria and the Archaea, this implies that A. aeolicus is not only similar to the last common ancestor of the Bacteria with respect to the sequences of single genes, as has been reported earlier for 16s rRNA (Olsen et al. 1996), but also with respect to its gene content. A. aeolicus can hence be regarded as a primitive species, aside from being a species with primitive genes.
Genome phylogeny based on gene content
23
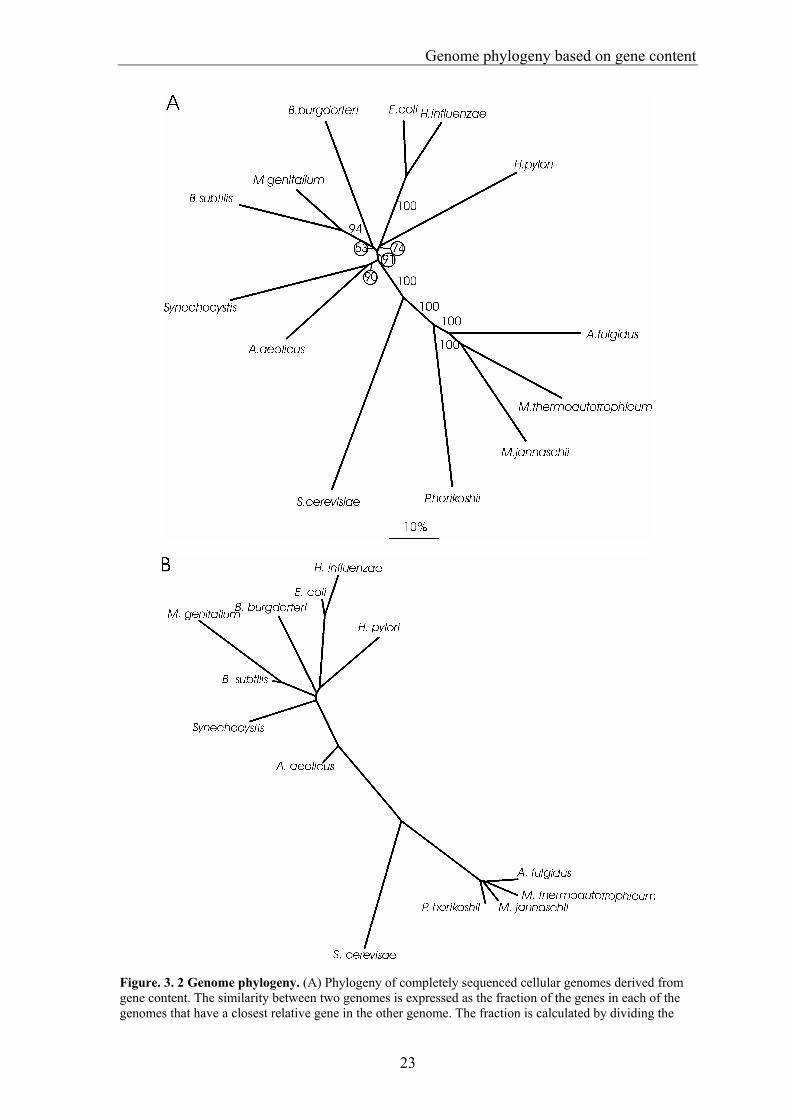
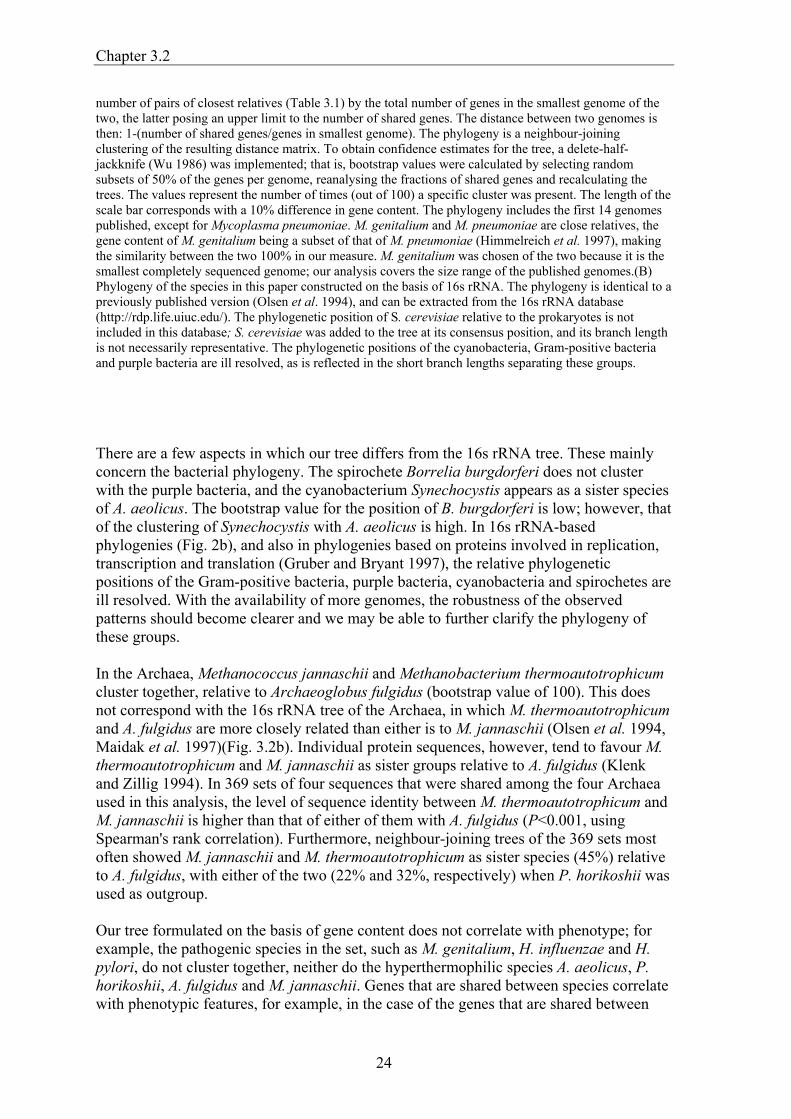
Figure. 3. 2 Genome phylogeny. (A) Phylogeny of completely sequenced cellular genomes derived from gene content. The similarity between two genomes is expressed as the fraction of the genes in each of the genomes that have a closest relative gene in the other genome. The fraction is calculated by dividing the
Chapter 3.2
24
number of pairs of closest relatives (Table 3.1) by the total number of genes in the smallest genome of the two, the latter posing an upper limit to the number of shared genes. The distance between two genomes is then: 1-(number of shared genes/genes in smallest genome). The phylogeny is a neighbour-joining clustering of the resulting distance matrix. To obtain confidence estimates for the tree, a delete-half-jackknife (Wu 1986) was implemented; that is, bootstrap values were calculated by selecting random subsets of 50% of the genes per genome, reanalysing the fractions of shared genes and recalculating the trees. The values represent the number of times (out of 100) a specific cluster was present. The length of the scale bar corresponds with a 10% difference in gene content. The phylogeny includes the first 14 genomes published, except for Mycoplasma pneumoniae. M. genitalium and M. pneumoniae are close relatives, the gene content of M. genitalium being a subset of that of M. pneumoniae (Himmelreich et al. 1997), making the similarity between the two 100% in our measure. M. genitalium was chosen of the two because it is the smallest completely sequenced genome; our analysis covers the size range of the published genomes.(B) Phylogeny of the species in this paper constructed on the basis of 16s rRNA. The phylogeny is identical to a previously published version (Olsen et al. 1994), and can be extracted from the 16s rRNA database (http://rdp.life.uiuc.edu/). The phylogenetic position of S. cerevisiae relative to the prokaryotes is not included in this database; S. cerevisiae was added to the tree at its consensus position, and its branch length is not necessarily representative. The phylogenetic positions of the cyanobacteria, Gram-positive bacteria and purple bacteria are ill resolved, as is reflected in the short branch lengths separating these groups. There are a few aspects in which our tree differs from the 16s rRNA tree. These mainly concern the bacterial phylogeny. The spirochete Borrelia burgdorferi does not cluster with the purple bacteria, and the cyanobacterium Synechocystis appears as a sister species of A. aeolicus. The bootstrap value for the position of B. burgdorferi is low; however, that of the clustering of Synechocystis with A. aeolicus is high. In 16s rRNA-based phylogenies (Fig. 2b), and also in phylogenies based on proteins involved in replication, transcription and translation (Gruber and Bryant 1997), the relative phylogenetic positions of the Gram-positive bacteria, purple bacteria, cyanobacteria and spirochetes are ill resolved. With the availability of more genomes, the robustness of the observed patterns should become clearer and we may be able to further clarify the phylogeny of these groups. In the Archaea, Methanococcus jannaschii and Methanobacterium thermoautotrophicum cluster together, relative to Archaeoglobus fulgidus (bootstrap value of 100). This does not correspond with the 16s rRNA tree of the Archaea, in which M. thermoautotrophicum and A. fulgidus are more closely related than either is to M. jannaschii (Olsen et al. 1994, Maidak et al. 1997)(Fig. 3.2b). Individual protein sequences, however, tend to favour M. thermoautotrophicum and M. jannaschii as sister groups relative to A. fulgidus (Klenk and Zillig 1994). In 369 sets of four sequences that were shared among the four Archaea used in this analysis, the level of sequence identity between M. thermoautotrophicum and M. jannaschii is higher than that of either of them with A. fulgidus (P<0.001, using Spearman's rank correlation). Furthermore, neighbour-joining trees of the 369 sets most often showed M. jannaschii and M. thermoautotrophicum as sister species (45%) relative to A. fulgidus, with either of the two (22% and 32%, respectively) when P. horikoshii was used as outgroup. Our tree formulated on the basis of gene content does not correlate with phenotype; for example, the pathogenic species in the set, such as M. genitalium, H. influenzae and H. pylori, do not cluster together, neither do the hyperthermophilic species A. aeolicus, P. horikoshii, A. fulgidus and M. jannaschii. Genes that are shared between species correlate with phenotypic features, for example, in the case of the genes that are shared between
Genome phylogeny based on gene content
25
the pathogens H. influenzae and H. pylori but that are absent in the relatively benign E. coli. Of these genes, 70% are involved in the interaction with the host. This set of genes, however, is only small (17 genes) compared with the set that is shared between H. influenzae and E. coli, but absent in H. pylori (Huynen et al. 1998) (508 genes). Thus, although the gene content shared between species qualitatively reflects correlations in phenotype, gene content shared quantitatively depends on genome size and phylogenetic position. A phenotypic feature such as hyperthermophily is, of course, also at least partly due to adaptations in the genes themselves rather than in gene content. Reports of the horizontal transfer of large sets of genes, for example, into the E. coli genome (Lawrence and Ochman 1998), and from Bacteria to Archaea and Eukarya (Doolittle and Logsdon 1998), have led to the view that horizontal gene transfer is a "major force" (Doolittle and Logsdon 1998), rather than an interesting but anecdotal event. The correspondence of the genome tree with the 16s rRNA tree and the generally high bootstrap values show that gene content still carries a strong phylogenetic signature. Such a phylogenetic pattern is the result of the differential acquisition and loss of genes along the various evolutionary lineages, for example by expansion and shrinkage of gene families. The fact that gene content carries a strong phylogenetic signature implies that either there are relatively few horizontal transfer events, or the events occur mainly between closely related species or affect closely related species in the same manner (for example, when they predate their radiation), or the genes that are transferred generally replace an orthologous gene that is already present in the genome. Given the small number of sequenced genomes, a complete, quantitative model of genome evolution that includes probabilities of horizontal gene transfer, gene duplication and gene loss cannot at present be parameterized.
Methods Genes shared between two genomes were determined using an operational definition of orthology. After a Smith-Waterman comparison (Smith and Waterman 1981, Pearson 1998) of all the genes between two genomes, compared at the amino-acid level using a parallel Biocellerator computer (http://www.cgen.com), pairs of homologous sequences were selected using a cutoff value (E=0.01). E values in Smith-Waterman comparisons are reliable indicators of the ratio of false positives to true positives in homology detection (Brenner et al. 1998). From the resulting lists, we selected pairs of genes that are each other's 'closest relative' in their respective genomes: that is, the level of identity between the two genes is the highest when compared with the level of identity of each of the two genes with all the other genes in the other's genome. To include the possibility of fusion and splitting of genes, multiple genes from one genome can have the same single closest relative in another genome, as long as the alignments with this single gene do not overlap. The closest relative is an operational definition of 'orthology' (Fitch 1970), a concept introduced for genes whose independent evolution reflects a speciation event, rather than a gene duplication event, and who probably perform the same function. Orthology, however, is not an absolute, as it is a statement about the history of genes. The original concept does not include the possibility of horizontal gene transfer, and more elaborate criteria have been proposed for finding orthologous genes (Huynen and Bork 1998, Tatusov et al. 1997). Such criteria lead to systematic biases in the number of orthologues that can be identified between species, the size of the bias depending on the evolutionary distance between the species (Huynen and Bork 1998). Hence, they can not be used to construct a phylogenetic tree on the basis of gene content. Variations in the
Chapter 3.2
26
rate of sequence evolution only affect the results when they affect the detection of homology. Decreasing the E-value threshold to E=0.001 led to small changes in the fraction of genes with closest relatives between species (<3%), and did not change the topology of the clustering.
27
3.3 Lateral gene transfer, genome surveys, and the phylogeny of
prokaryotes
Martijn A. Huynen, Berend Snel and Peer Bork
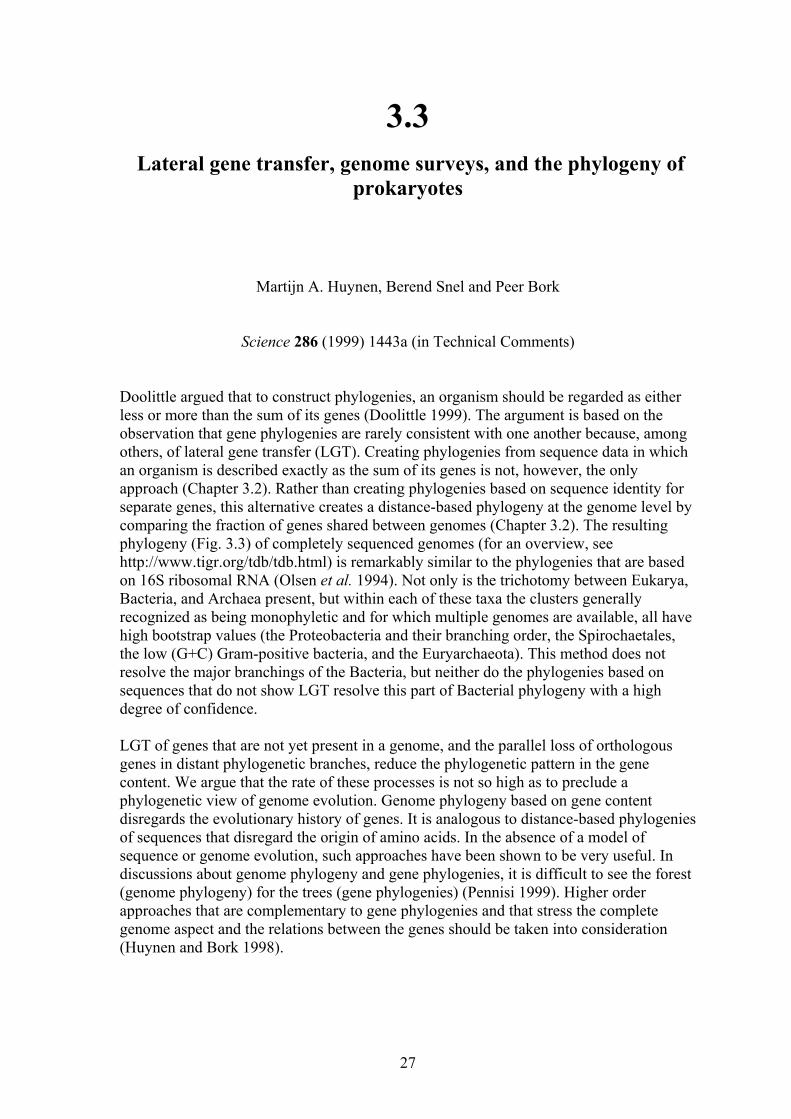
Science 286 (1999) 1443a (in Technical Comments) Doolittle argued that to construct phylogenies, an organism should be regarded as either less or more than the sum of its genes (Doolittle 1999). The argument is based on the observation that gene phylogenies are rarely consistent with one another because, among others, of lateral gene transfer (LGT). Creating phylogenies from sequence data in which an organism is described exactly as the sum of its genes is not, however, the only approach (Chapter 3.2). Rather than creating phylogenies based on sequence identity for separate genes, this alternative creates a distance-based phylogeny at the genome level by comparing the fraction of genes shared between genomes (Chapter 3.2). The resulting phylogeny (Fig. 3.3) of completely sequenced genomes (for an overview, see http://www.tigr.org/tdb/tdb.html) is remarkably similar to the phylogenies that are based on 16S ribosomal RNA (Olsen et al. 1994). Not only is the trichotomy between Eukarya, Bacteria, and Archaea present, but within each of these taxa the clusters generally recognized as being monophyletic and for which multiple genomes are available, all have high bootstrap values (the Proteobacteria and their branching order, the Spirochaetales, the low (G+C) Gram-positive bacteria, and the Euryarchaeota). This method does not resolve the major branchings of the Bacteria, but neither do the phylogenies based on sequences that do not show LGT resolve this part of Bacterial phylogeny with a high degree of confidence. LGT of genes that are not yet present in a genome, and the parallel loss of orthologous genes in distant phylogenetic branches, reduce the phylogenetic pattern in the gene content. We argue that the rate of these processes is not so high as to preclude a phylogenetic view of genome evolution. Genome phylogeny based on gene content disregards the evolutionary history of genes. It is analogous to distance-based phylogenies of sequences that disregard the origin of amino acids. In the absence of a model of sequence or genome evolution, such approaches have been shown to be very useful. In discussions about genome phylogeny and gene phylogenies, it is difficult to see the forest (genome phylogeny) for the trees (gene phylogenies) (Pennisi 1999). Higher order approaches that are complementary to gene phylogenies and that stress the complete genome aspect and the relations between the genes should be taken into consideration (Huynen and Bork 1998).
Chapter 3.3
28
Figure 3.3. Genome phylogeny based on gene content. A Fitch-Margoliash (Fitch and Margoliash 1967) tree was made from a genome distance matrix. Distances were calculated based on the number of genes shared between two genomes divided by the number of genes in the smallest genome. The number of shared genes between two genomes is calculated using an operational definition of orthology. Two genes from two genomes are considered orthologous when they have the highest significant level of pairwise similarity to each other compared to their similarity to the other genes in each other's genome. Two genes can be orthologous to a single gene from another genome when their alignments do not overlap (see Chapter 3.2).
29
3.4 SHOT: A web server for the construction of genome
phylogenies
Jan O. Korbel+, Berend Snel+, Martijn A. Huynen and Peer Bork + These authors contributed equally.
Trends in Genetics 18 (2002). 158-162
Abstract With the increasing availability of genome sequences, new methods are being proposed that exploit information from complete genomes to classify species in a phylogeny. Here we present SHOT, a web server for the classification of genomes on the basis of shared gene content or the conservation of gene order that reflects the dominant, phylogenetic signal in these genomic properties. In general, the genome trees are consistent with classical gene-based phylogenies, although some interesting exceptions indicate massive horizontal gene transfer. SHOT is a useful tool for analysing the tree of life from a genomic point of view. It is available at http://www.Bork.EMBL-Heidelberg.de/SHOT.
Introduction The sequencing of genomes from cellular species has led to the development of methods that exploit the information from complete genomes to reconstruct phylogenies (Chapter 3.2, Fitz-Gibbon and House 1999, Tekeia et al. 1999). These methods use the number of shared orthologous genes or shared gene families between genomes as a similarity measure, rather than levels of sequence identity within a single gene family as has been done extensively; for instance, for small subunit ribosomal RNA (Olsen et al. 1994, Maidak et al. 1997). Genome-based phylogenies are a welcome addition to gene-based phylogenies, because an unambiguous universal phylogeny based solely on comparisons within a single gene family seems unlikely (Boore and Brown 1998). Furthermore, complete genome trees are less affected by unrecognized horizontal gene transfer, unrecognized paralogy, highly variable rates of gene evolution, or misalignment than phylogenies based on single genes (Chapter 3.2, Fitz-Gibbon and House 1999). The construction of genome trees is not possible for everyone, as the comparison of complete genomes requires complex data processing and considerable CPU power. Thus, we have developed SHOT (for `Shared Orthologue and gene-order Tree'), a construction tool that allows the generation of distance-based genome phylogenies on the web. Time-limiting genome comparisons are pre-computed and stored, allowing rapid online tree construction.
Chapter 3.4
30
SHOT provides two independent strategies to construct trees:
1. The gene content approach, in which the similarity between two genomes is the fraction of shared orthologous genes (Chapter 3.2). This method was refined by the incorporation of various options for calculation of the dissimilarity between genomes from the fraction of shared genes, including a new strategy for genome size normalization. 2. SHOT also allows the generation of trees on the basis of gene-order conservation. Gene-order trees can be constructed only for prokaryotic genomes, as the order of genes in currently sequenced eukaryotes is too poorly conserved to contain a phylogenetic signal (Huynen et al. 2001). For both approaches, several parameter sets are available that can be selected depending on the type of question to be answered.
Methodology, input and output We use an operational definition of orthology to predict genes shared between genomes (for details, see Chapter 3.2), namely considering non-overlapping bi-directional best hits in Smith-Waterman (Smith and Waterman 1981) protein sequence comparisons (E-value 10-2). For gene content phylogenies, the similarity between two species is defined as the ratio of the number of shared orthologues and a normalization value that reflects varying genome sizes. The normalization value is dominated by the number of genes in the smaller of the two compared genomes, because that is the number that determines the maximum number of genes two genomes can share. Independent, large-scale loss of genes, as is often observed in parasites, does therefore not lead to a clustering of such small genomes into one branch of the tree, because these small genomes still share more genes with their large, closest relatives (see results presented here and in Chapter 3.2 for examples), than with the other small genomes. Note that such co-clustering of small, distantly related genomes is indeed apparent in gene-content-based genome trees that do not normalize genome sizes in the manner implemented in SHOT and that also include the absence of genes to calculate genome similarity (Fitz-Gibbon and House 1999, Tekeia et al. 1999). For gene-order phylogenies, similarities are derived from the number of orthologous gene pairs conserved. We define a `conserved gene pair' as orthologous genes that in two genomes form an adjacent pair of genes with the same conserved relative directions of transcription. SHOT uses tools from the PHYLIP package (Felsenstein 1989) to construct phylogenetic trees. As input of SHOT, a set of species is selected. The default output is an image of an unrooted tree with the option to download the tree as a postscript file or in Newick format that is compatible with various phylogeny software packages. Among several adjustable parameters (see Box 1), the calculation of bootstrap values can be selected.
SHOT: A web server for the construction of genome phylogenies
31
Box 1. Input parameters of SHOT Gene-content phylogenies Normalization to obtain the fraction of shared genes from the number of shared genes 1. Division by the size of the smallest of the two genomes (theoretical maximum of shared orthologues). 2. Division by the weighted average genome size (default selection). The weighted average is computed using a fit to the number of orthologues shared between archaeal and bacterial genomes as function of the bacterial genome sizes (a and b are the sizes of both genomes; see Fig. 3.4 of Chapter 3.2). This formula represents the data better than the genome size of the smaller genome, as the number of orthologues between Archaea and Bacteria also increases for large genomes ¯ albeit slower. Genome size definition 1. Genome size is defined as the number of annotated protein coding open reading frames (ORFs). 2. Genome size is the number of ORFs with at least one homologue in other genomes completed so far (default selection). Disregarding orphan ORFs eliminates considerable variation in gene prediction. It is therefore probably a better estimate of the maximum number of orthologues. 3. Genome size is the number of ORFs with at least one orthologue in other completed genomes. This stringent option particularly affects genomes that experienced a high number of recent duplications. We recommend its use for investigating unexpected topologies, rather than as a standard option. Distance measure The evolutionary distance, d, is computed from the estimated similarity, s [b] 1. d = -ln(s) 2. d = 1-s The default selection is function (1) because function (2) is less supported by models of evolution (Swofford and Olson 1990), hence providing a poorer estimate of evolutionary distances for weak similarities. However, function (2) can be applied for testing the robustness of clusters. Clustering algorithm 1. Neighbour-joining (Saitou and Nei 1987) (default selection). 2. Fitch¯Margoliash (Fitch and Margoliash 1967) ( slower) can be applied instead. Gene-order phylogenies Genes considered for defining gene pairs 1. ORFs annotated as genes are analysed for the presence of conserved gene pairs (default selection). 2. Only genes shared between both genomes (ignoring genes without orthologues) are considered when defining gene pairs. Events that only affect the genomic gene content are ignored. Normalization Numbers of conserved gene pairs are normalized according to the genome size of the smaller genome (the maximum possible number of conserved gene pairs). Genome size can be defined as follows: 1. number of ORFs annotated as genes; 2. number of ORFs with at least one homologue in other complete genomes (default selection); 3. number of ORFs with at least one orthologue in other complete genomes; 4. In addition, the number of orthologues shared between two complete genomes can be used for normalization. We recommend applying this option when only shared orthologues are used for defining gene pairs. Distance measure and clustering algorithm Selectable parameters are identical to that of gene-content trees.
Chapter 3.4
32
Comparison of SHOT trees with a small subunit rRNA tree We discuss here some features of SHOT trees that have been constructed using all currently sequenced genomes of cellular species. In Fig. 3.4, Fig. 3.5 and Fig. 3.6, we present genome trees constructed using the two methods available in SHOT, along with a small subunit ribosomal RNA (SSU rRNA) tree generated using the RDP website (Maidak et al 1997). Both the gene-content tree and the gene-order tree show a remarkable similarity with the SSU rRNA tree. Whereas a phylogenetic signal in gene content has been demonstrated previously (Chapter 3.2, Fitz-Gibbon and House 199, Tekeia et al. 1999), the results indicate that the conservation of gene order also reflects the evolutionary distances of the respective species. Both types of genome trees reveal clustering of several known clades of the tree of life with high bootstrap values ¯ such as the metazoans and fungi, chlamydiae, spirochetes, low G+C Gram-positive bacteria, high G+C Gram-positives, and the - and -proteobacteria. Of the trees presented here, only the gene-order tree separates the - and -proteobacteria and reveals a monophyly of Gram-positive bacteria. Whether Gram-positive bacteria form a single monophyletic clade is still a matter of discussion (Brown et al. 2001). SHOT should provide a helpful tool to shed new light on disputed points of the universal species phylogeny. For instance, the gene-content tree reveals Homo sapiens, and not C. elegans, as the closest sequenced metazoan relative of Drosophila melanogaster. This topology resembles the traditional animal phylogeny based on morphology and embryology, as well as newer phylogenies based on combined protein data (Brown et al. 2001, Graham 2000), but not phylogenies based on SSU rRNA sequence identity, which reveal a clustering of D. melanogaster with C. elegans (see Graham (2000) and references therein). The branching observed for the methanogenic Archaea, the pyrococci, and Archaeoglobus fulgidus differs significantly from a topology derived from rRNA, as previously discussed in detail (Chapter 3.2). The topology revealed earlier on a smaller set of genomes proved robust against the addition of new taxa, and is moreover supported by gene-order trees.
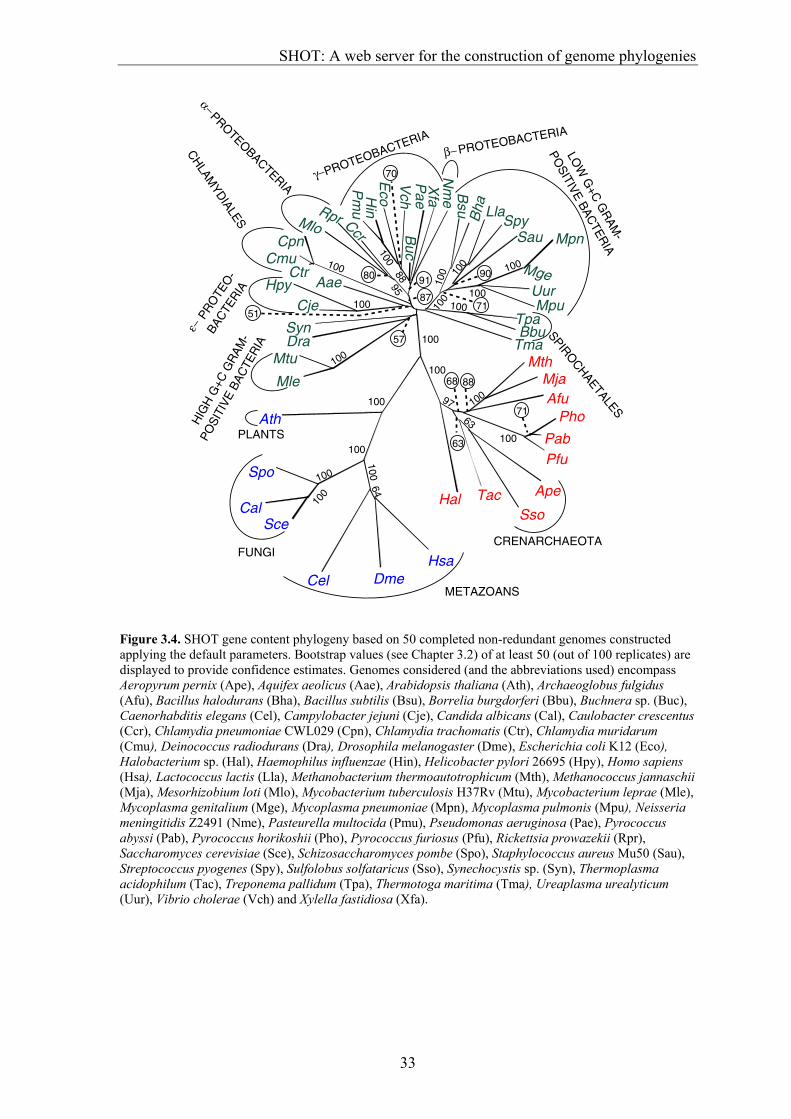
SHOT: A web server for the construction of genome phylogenies
33
TmaBbu
TpaMpu
Uur
Mge
MpnSauSpy
LlaBha
Bsu
Nm
eX
faP
aeB
ucV
chE
coHinRpr Ccr
MloCpn
CmuCtr
AaeHpyCje
SynDra
Mtu
Mle
Ath
Spo
CalSce
Cel DmeHsa
Hal TacSso
Ape
PfuPab
PhoAfu
MjaMth
Pm
u
100
100
100
100
10064
100
97
100
100
100
6310
0 100 100
90
100
70
100
SPIROCHAETALES
PR
OTE
O-
BAC
TER
IA
ε−
CRENARCHAEOTAFUNGI
METAZOANS
PLANTS
CH
LAMYD
IALES
PROTEOBACTERIA
α−
LOW
G+C
GR
AM-
POSITIVE BAC
TERIA
H
IGH
G+C
GR
AM-
POSI
TIVE
BAC
TER
IA
PROTEOBACTERIA
γ−
PROTEOBACTERIA
β−
57
80
10088
95
100
100
100
100
5171
87
91
71
8868
63
Figure 3.4. SHOT gene content phylogeny based on 50 completed non-redundant genomes constructed applying the default parameters. Bootstrap values (see Chapter 3.2) of at least 50 (out of 100 replicates) are displayed to provide confidence estimates. Genomes considered (and the abbreviations used) encompass Aeropyrum pernix (Ape), Aquifex aeolicus (Aae), Arabidopsis thaliana (Ath), Archaeoglobus fulgidus (Afu), Bacillus halodurans (Bha), Bacillus subtilis (Bsu), Borrelia burgdorferi (Bbu), Buchnera sp. (Buc), Caenorhabditis elegans (Cel), Campylobacter jejuni (Cje), Candida albicans (Cal), Caulobacter crescentus (Ccr), Chlamydia pneumoniae CWL029 (Cpn), Chlamydia trachomatis (Ctr), Chlamydia muridarum (Cmu), Deinococcus radiodurans (Dra), Drosophila melanogaster (Dme), Escherichia coli K12 (Eco), Halobacterium sp. (Hal), Haemophilus influenzae (Hin), Helicobacter pylori 26695 (Hpy), Homo sapiens (Hsa), Lactococcus lactis (Lla), Methanobacterium thermoautotrophicum (Mth), Methanococcus jannaschii (Mja), Mesorhizobium loti (Mlo), Mycobacterium tuberculosis H37Rv (Mtu), Mycobacterium leprae (Mle), Mycoplasma genitalium (Mge), Mycoplasma pneumoniae (Mpn), Mycoplasma pulmonis (Mpu), Neisseria meningitidis Z2491 (Nme), Pasteurella multocida (Pmu), Pseudomonas aeruginosa (Pae), Pyrococcus abyssi (Pab), Pyrococcus horikoshii (Pho), Pyrococcus furiosus (Pfu), Rickettsia prowazekii (Rpr), Saccharomyces cerevisiae (Sce), Schizosaccharomyces pombe (Spo), Staphylococcus aureus Mu50 (Sau), Streptococcus pyogenes (Spy), Sulfolobus solfataricus (Sso), Synechocystis sp. (Syn), Thermoplasma acidophilum (Tac), Treponema pallidum (Tpa), Thermotoga maritima (Tma), Ureaplasma urealyticum (Uur), Vibrio cholerae (Vch) and Xylella fastidiosa (Xfa).
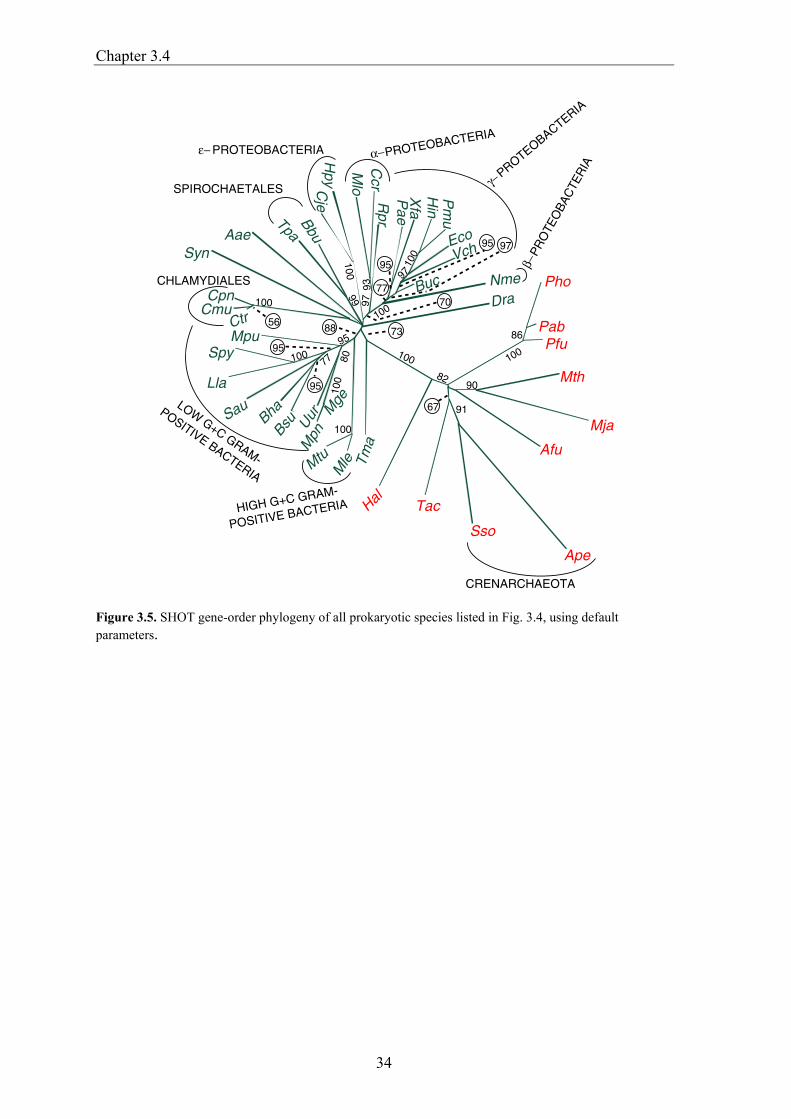
Chapter 3.4
34
LOW G+C GRAM-
POSITIVE BACTERIA
MpuSpy
Lla
SauBha
Bsu Uur M
ge
Mpn
Mtu
Mle Tm
a
Hal Tac
Sso
Ape
Afu
Mja
Mth
PfuPab
PhoDraNme
Buc
VchEco
Hin
Pm
u
Xfa
Pae
Rpr
Ccr
Mlo
Hpy
Cje
Bbu
TpaAaeSyn
CpnCmu
Ctr
100
9082
91
100
100
100
100
100
97
100
100
9793
99
9580
100
77
86
PR
OTE
OB
AC
TER
IA
β− HIGH G+C GRAM-
POSITIVE BACTERIA
CRENARCHAEOTA
PROTEOBACTERIA
α−
PROTEOBACTERIA
γ−
PROTEOBACTERIAε−
SPIROCHAETALES
CHLAMYDIALES
73
67
8856
95
95
70
95 97
77
95
Figure 3.5. SHOT gene-order phylogeny of all prokaryotic species listed in Fig. 3.4, using default parameters.
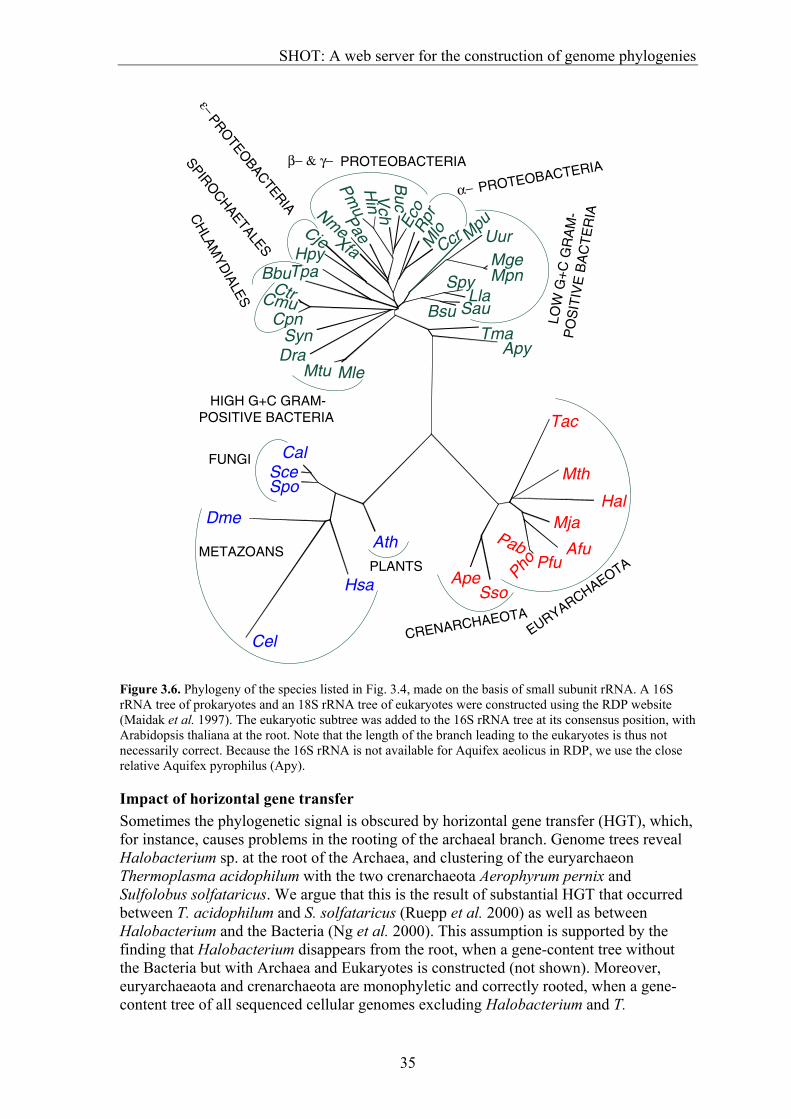
SHOT: A web server for the construction of genome phylogenies
35
Tac
Mth
HalMja
AfuPfu
PhoPab
SsoApe
Ath
Hsa
Cel
Dme
SpoSce
Cal
Mle
Xfa
Pae Eco
Mlo
Sau
TmaApy
MtuDraSyn
CpnCmu
CtrBbuTpa
Hpy
Cje
Nme
Pmu
Hin Vch
Buc
Rpr
Ccr MpuUurMgeMpnSpy
LlaBsu
PROTEOBACTERIAβ− & γ−
LO
W G
+C G
RA
M-
PO
SIT
IVE
BA
CT
ER
IA
HIGH G+C GRAM-POSITIVE BACTERIA
CRENARCHAEOTA
PROTEOBACTERIA
α−
PROTEO
BACTERIA
ε−SPIRO
CHAETALES
CH
LAMYD
IALES
EURYARCHAEOTA
FUNGI
METAZOANSPLANTS
Figure 3.6. Phylogeny of the species listed in Fig. 3.4, made on the basis of small subunit rRNA. A 16S rRNA tree of prokaryotes and an 18S rRNA tree of eukaryotes were constructed using the RDP website (Maidak et al. 1997). The eukaryotic subtree was added to the 16S rRNA tree at its consensus position, with Arabidopsis thaliana at the root. Note that the length of the branch leading to the eukaryotes is thus not necessarily correct. Because the 16S rRNA is not available for Aquifex aeolicus in RDP, we use the close relative Aquifex pyrophilus (Apy).
Impact of horizontal gene transfer Sometimes the phylogenetic signal is obscured by horizontal gene transfer (HGT), which, for instance, causes problems in the rooting of the archaeal branch. Genome trees reveal Halobacterium sp. at the root of the Archaea, and clustering of the euryarchaeon Thermoplasma acidophilum with the two crenarchaeota Aerophyrum pernix and Sulfolobus solfataricus. We argue that this is the result of substantial HGT that occurred between T. acidophilum and S. solfataricus (Ruepp et al. 2000) as well as between Halobacterium and the Bacteria (Ng et al. 2000). This assumption is supported by the finding that Halobacterium disappears from the root, when a gene-content tree without the Bacteria but with Archaea and Eukaryotes is constructed (not shown). Moreover, euryarchaeaota and crenarchaeota are monophyletic and correctly rooted, when a gene-content tree of all sequenced cellular genomes excluding Halobacterium and T.
Chapter 3.4
36
acidophilum is constructed (not shown). In our opinion, such findings do not decrease the relevance of genome trees generated by SHOT. A main feature of genome phylogenies is that, rather than disclosing the history of single genes, they reflect the evolutionary history of complete genomes. Large numbers of horizontally transferred genes considerably affect the organisms' evolution and phenotype. Similarly, lifestyles might influence the gene content. Constructing genome-based phylogenies along with phylogenies produced by traditional tree reconstruction techniques is therefore relevant, as it could be very helpful to visualize such peculiarities of genome evolution.
When should options of SHOT be applied? Gene order evolves faster than gene content (Huynen and Snel 2000). Hence, gene order phylogenies perform particularly well for short evolutionary distances. For instance, in contrast to gene-content trees, gene-order trees reveal Staphylococcus aureus at its consensus position within the low G+C Gram-positives as a sister species of Bacillus subtilis. For larger evolutionary distances, we recommend gene-content phylogenies. Generally, we suggest starting with the default parameters. However, as there is no accepted relevant model for genome evolution, alternative parameter selections can also result in meaningful phylogenies (see Box 1 for parameter effects). Bootstrapping and parameter changes can be applied to study the robustness of clusters, or the phylogeny of species for which signals provided by genomic gene content and gene order are other than phylogenetic. For instance, the gene-order tree reveals elongated branch lengths for species such as Synechocystis sp. or A. pernix. Synechocystis has an extensively shuffled genome (Huynen and Snel 2000), whereas the genome of A. pernix appears to include a number of open reading frames that are incorrectly annotated as genes (Cambillau and Claverie 2000). The branch length of the latter species significantly decreases, if genes not shared between two species are ignored when defining gene pairs (option `shared orthologues' selected in the field `Genes considered for defining gene pairs'). The results obtained for the thermophilic bacteria Thermotoga maritima and Aquifex aeolicus, both placed at the root of the Bacteria in SSU rRNA trees, provide examples of how to evaluate phylogenetic information obtained from changing parameters in SHOT. Using the default parameters, A. aeolicus clusters with the -proteobacteria in gene content trees. When the input parameters of gene content and gene order tree construction methods are varied, A. aeolicus clusters with the proteobacteria or appears close to the root of the Bacteria. T. maritima appears at the root of the Bacteria for many parameter selections in gene-order trees, but tends to cluster rather with the low G+C Gram-positives in gene-content trees. The placement of thermophiles at the bacterial root in single-gene trees might be an artefact owing to varying evolutionary rates in thermophiles compared with mesophiles (Cambillau and Claverie 2000, Forterre 1998), whereas in genome trees this is caused by massive HGT from Archaea to thermophilic Bacteria (Nelson et al. 1999). Thus, the recurring clustering of A. aeolicus with the -proteobacteria and T. maritima with the low G+C Gram-positives might reflect their true phylogeny.
SHOT: A web server for the construction of genome phylogenies
37
Conclusion SHOT is a web server for the reconstruction of genome trees that calculates evolutionary distance from gene acquisition and loss, or from genome rearrangement, depending on which method is selected. Several groups have constructed phylogenetic trees from conserved gene orders of animal mitochondria (see Boore and Brown (1998) and references therein) and for particular clusters of bacterial genes (Tamames 2001, Tamames et al 2001). However, as far as we know, we are the first to exploit gene-order conservation of whole genomes to construct trees of prokaryotes. SHOT is updated constantly to include new genomes. The addition of more genomes should improve the robustness of results from SHOT and help to resolve disputed issues, in particular the clustering of species that still lack a sequenced close relative. We expect that instead of the complete set of available taxa, future studies will rather focus on selected subsets of species, allowing the study of phylogenies at different levels of resolution. Finally, SHOT should be useful not only for resolving conflicts on the basis of single-gene phylogenies, but also, by comparing genome-based phylogenies with single-gene phylogenies, for acquiring an overview of the evolution of basic genomic features, namely gene content and gene order.

39
4
Genomes in flux: the evolution of Archaeal and Proteobacterial gene
content
Berend Snel, Peer Bork and Martijn A. Huynen
Genome Research 12 (2002) 17-25
Chapter 4
40
Abstract In the course of evolution, genomes are shaped by processes like gene loss, gene duplication, horizontal gene transfer, and gene genesis (the de novo origin of genes). Here we reconstruct the gene content of ancestral Archaea and Proteobacteria and quantify the processes connecting them to their present day representatives based on the distribution of genes in completely sequenced genomes. We estimate that the ancestor of the Proteobacteria contained around 2500 genes, and the ancestor of the Archaea around 2050 genes. Although it is necessary to invoke horizontal gene transfer to explain the content of present day genomes, gene loss, gene genesis, and simple vertical inheritance are quantitatively the most dominant processes in shaping the genome. Together they result in a turnover of gene content such that even the lineage leading from the ancestor of the Proteobacteria to the relatively large genome of Escherichia coli has lost at least 950 genes. Gene loss, unlike the other processes, correlates fairly well with time. This clock-like behavior suggests that gene loss is under negative selection, while the processes that add genes are under positive selection.
Introduction How the gene content of a genome evolves is an important, complicated, and still largely open question. The evolution of the gene content has been studied with regard to both large-scale trends as well as specific processes. Many studies have focused on specific aspects of genome evolution or have tried to reconstruct a specific ancestral genome (Bruccoleri et al. 1998; de Rosa and Labedan 1998; Huynen and Bork 1998; Kyrpides et al. 1999; Makarova et al. 1999; Aravind et al. 2000; Ochman and Jones 2000; Jordan et al. 2001). Large-scale studies on the presence and absence of genes have shown that the number of shared genes between genomes depends on the size of genomes (Chapter 3.2), and their evolutionary distance (Gaasterland and Ragan 1998; Huynen and Bork 1998; Fitz-Gibbon and House 1999; Chapter 3.2; Tekaia et al. 1999). Correlation in the presence of genes has been used to predict functional interactions between genes (Pellegrini et al. 1999; Huynen and Snel 2000). These observations suggest that evolutionary history, genome size, and functional selection together determine gene content. The role of the specific processes involved in the evolution of gene content of specific genomes has also been emphasized. Massive gene duplication was postulated in the ancestor of Vibrio cholerae (Heidelberg et al. 2000), massive gene loss in the ancestor of Buchnera (Shigenobu et al. 2000), and massive horizontal gene transfer (HGT) to the ancestors of E.coli 0157:H7 and E.coli K12 (Perna et al. 2001). Such observations can however be rather species-specific, as indicated, for example, by the observation by Perna et al. 2001 that the amount of horizontal transfer into E.coli genomes appears to be much higher than that into Helicobacter or Chlamydia genomes. They therefore cannot be safely assumed to be representative for a large set of genomes. Estimation of various aspects of gene content evolution such as the size of ancestral genomes and the amount of gene duplication are of course not independent. We therefore seek a general integrated approach to reconstruct explicitly which genes were present in the ancestral genomes and how the gene content of ancestral and present day genomes has been shaped by the processes of gene loss, gene duplication, HGT, gene fusion/fission,
Genomes in flux: the evolution of Archaeal and Proteobacterial gene content
41
and gene genesis. By gene genesis we mean the de novo origin of a gene. We define it as occurring in the lineage leading to the most recent common ancestor of the species in which the orthologous genes are present. For reasons regarding certainty of the phylogeny, doubts on the existence of a single last common ancestor (Doolittle 2000), and unreliable automated orthology determination at large evolutionary distances, we focus on two taxa for which multiple genomes are available at informative intermediate evolutionary distances: the Archaea and the Proteobacteria. Our reconstruction of the evolution of gene content is based on the presence and absence of genes in these two taxa and in the other complete genomes. The latter are used as outgroup to assess whether a gene potentially originated outside the taxon. The processes that shape gene content can also be studied by detailed sequence-based phylogenies. Such approaches do not scale up well among others because long branch attraction tends to draw fast-evolving sequences like the mycoplasmas (Teichmann and Mitchison 1999) or Buchnera (see below) towards the root of the tree. To correct for those effects and to create reliable sequence alignments, gene trees often require manual input. We therefore chose this complementary large-scale approach based on presence and absence of genes alone. The notion of a single common ancestor for a group of genomes might be a simplification; alternatives in the form of a community have been proposed (Woese 1998; Doolittle 2000). In such a scenario, our estimates for the gene content of early genomes represent rather that of a community of genomes.
Results
The processes that shape gene content Horizontal Gene Transfer Versus Parallel Gene Loss The central question is whether to explain patchy, nonphylogenetic gene distributions by multiple gene loss or by HGT (Fig. 4.1). We answer this by reconstructing the same gene distribution by the most parsimonious scenario without HGT (the non-HGT scenario, Fig. 4.1A), and with HGT (the HGT scenario, Fig. 4.1B). By comparing the two scenarios, we obtain the number of gene losses that become necessary when we explain the same distribution without HGT instead of with it. If this number of losses is lower than a variable "HGT penalty" we explain the distribution of these genes by including HGT; otherwise we explain it using only losses. By varying this HGT penalty we can differentiate between gene distributions that are to different degrees nonphylogenetic and that are thus more or less likely to be caused by horizontal transfer (Fig. 4.1B). In the final step, the presence pattern in the ancestral nodes from the most parsimonious scenario at each HGT penalty is used to determine the remaining processes: gene duplication (the number of genes within an orthologous group increases), gene fusion/fission (two orthologous groups fuse into one open reading frame (ORF), or the reverse one orthologous group splits into two ORFs), and gene genesis (a group of orthologous genes appears for the first time). Note that a patchy gene distribution does not necessarily imply HGT. Numerous cases can be retrieved in which such a distribution of genes is best explained by multiple gene losses based on independent evidence (see Fig. 4.2 for an example).
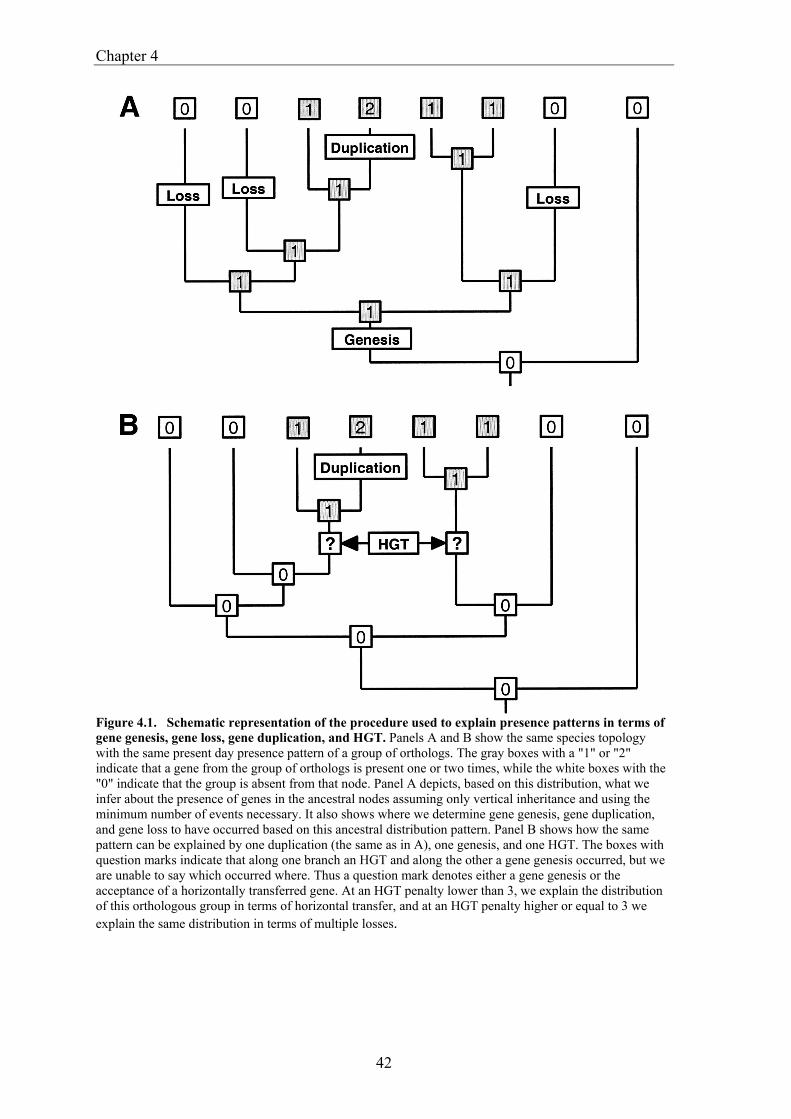
Chapter 4
42
Figure 4.1. Schematic representation of the procedure used to explain presence patterns in terms of gene genesis, gene loss, gene duplication, and HGT. Panels A and B show the same species topology with the same present day presence pattern of a group of orthologs. The gray boxes with a "1" or "2" indicate that a gene from the group of orthologs is present one or two times, while the white boxes with the "0" indicate that the group is absent from that node. Panel A depicts, based on this distribution, what we infer about the presence of genes in the ancestral nodes assuming only vertical inheritance and using the minimum number of events necessary. It also shows where we determine gene genesis, gene duplication, and gene loss to have occurred based on this ancestral distribution pattern. Panel B shows how the same pattern can be explained by one duplication (the same as in A), one genesis, and one HGT. The boxes with question marks indicate that along one branch an HGT and along the other a gene genesis occurred, but we are unable to say which occurred where. Thus a question mark denotes either a gene genesis or the acceptance of a horizontally transferred gene. At an HGT penalty lower than 3, we explain the distribution of this orthologous group in terms of horizontal transfer, and at an HGT penalty higher or equal to 3 we explain the same distribution in terms of multiple losses.
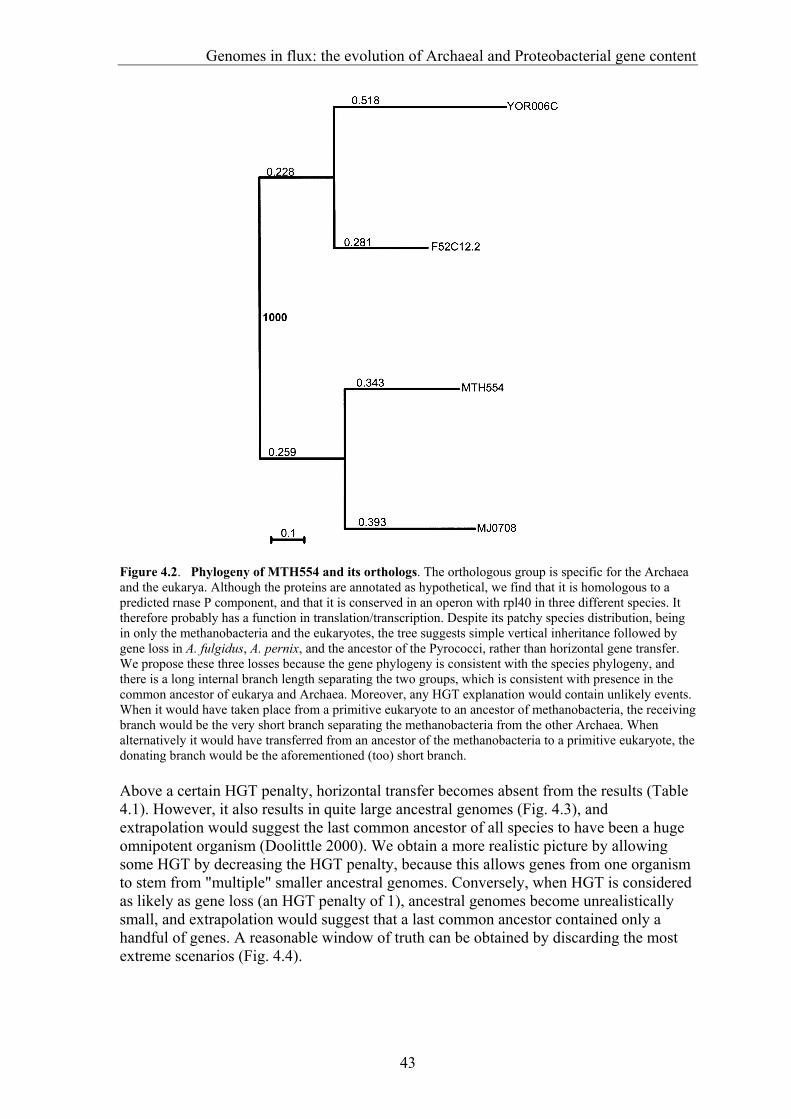
Genomes in flux: the evolution of Archaeal and Proteobacterial gene content
43
Figure 4.2. Phylogeny of MTH554 and its orthologs. The orthologous group is specific for the Archaea and the eukarya. Although the proteins are annotated as hypothetical, we find that it is homologous to a predicted rnase P component, and that it is conserved in an operon with rpl40 in three different species. It therefore probably has a function in translation/transcription. Despite its patchy species distribution, being in only the methanobacteria and the eukaryotes, the tree suggests simple vertical inheritance followed by gene loss in A. fulgidus, A. pernix, and the ancestor of the Pyrococci, rather than horizontal gene transfer. We propose these three losses because the gene phylogeny is consistent with the species phylogeny, and there is a long internal branch length separating the two groups, which is consistent with presence in the common ancestor of eukarya and Archaea. Moreover, any HGT explanation would contain unlikely events. When it would have taken place from a primitive eukaryote to an ancestor of methanobacteria, the receiving branch would be the very short branch separating the methanobacteria from the other Archaea. When alternatively it would have transferred from an ancestor of the methanobacteria to a primitive eukaryote, the donating branch would be the aforementioned (too) short branch. Above a certain HGT penalty, horizontal transfer becomes absent from the results (Table 4.1). However, it also results in quite large ancestral genomes (Fig. 4.3), and extrapolation would suggest the last common ancestor of all species to have been a huge omnipotent organism (Doolittle 2000). We obtain a more realistic picture by allowing some HGT by decreasing the HGT penalty, because this allows genes from one organism to stem from "multiple" smaller ancestral genomes. Conversely, when HGT is considered as likely as gene loss (an HGT penalty of 1), ancestral genomes become unrealistically small, and extrapolation would suggest that a last common ancestor contained only a handful of genes. A reasonable window of truth can be obtained by discarding the most extreme scenarios (Fig. 4.4).
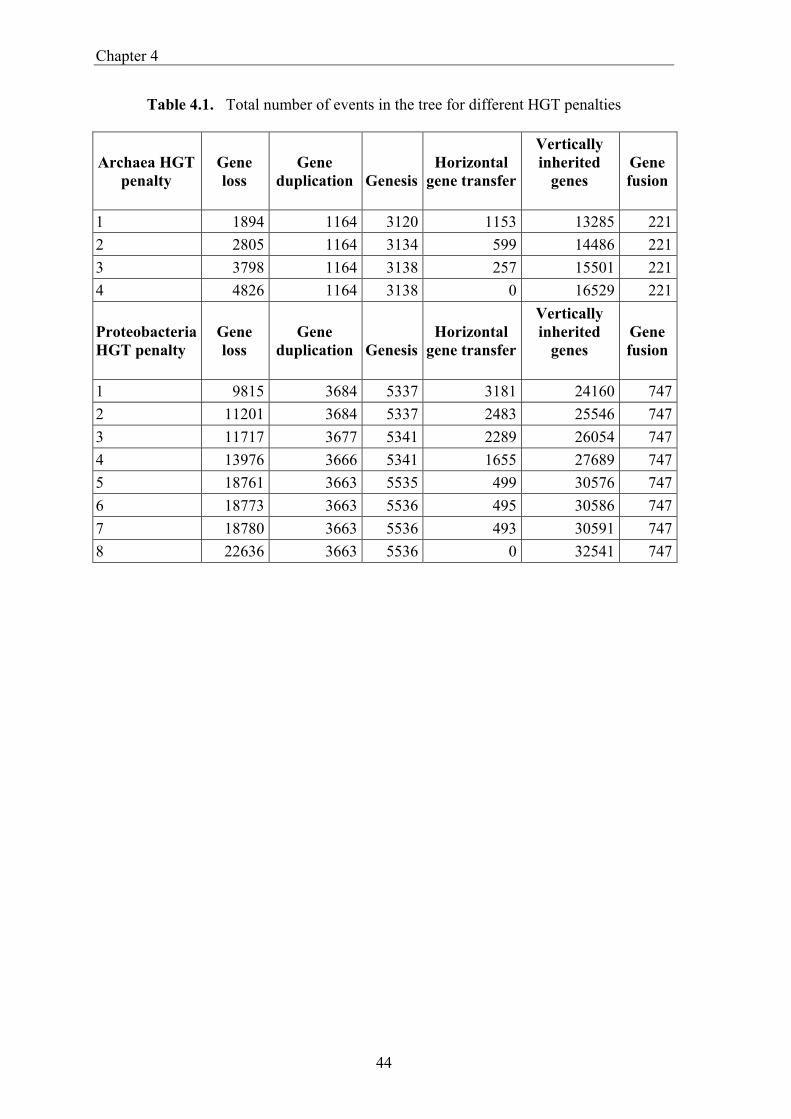
Chapter 4
44
Table 4.1. Total number of events in the tree for different HGT penalties
Archaea HGT
penalty
Gene loss
Gene
duplication
Genesis
Horizontal
gene transfer
Vertically inherited
genes
Gene fusion
1 1894 1164 3120 1153 13285 2212 2805 1164 3134 599 14486 2213 3798 1164 3138 257 15501 2214 4826 1164 3138 0 16529 221 Proteobacteria HGT penalty
Gene loss
Gene
duplication
Genesis
Horizontal
gene transfer
Vertically inherited
genes
Gene fusion
1 9815 3684 5337 3181 24160 7472 11201 3684 5337 2483 25546 7473 11717 3677 5341 2289 26054 7474 13976 3666 5341 1655 27689 7475 18761 3663 5535 499 30576 7476 18773 3663 5536 495 30586 7477 18780 3663 5536 493 30591 7478 22636 3663 5536 0 32541 747
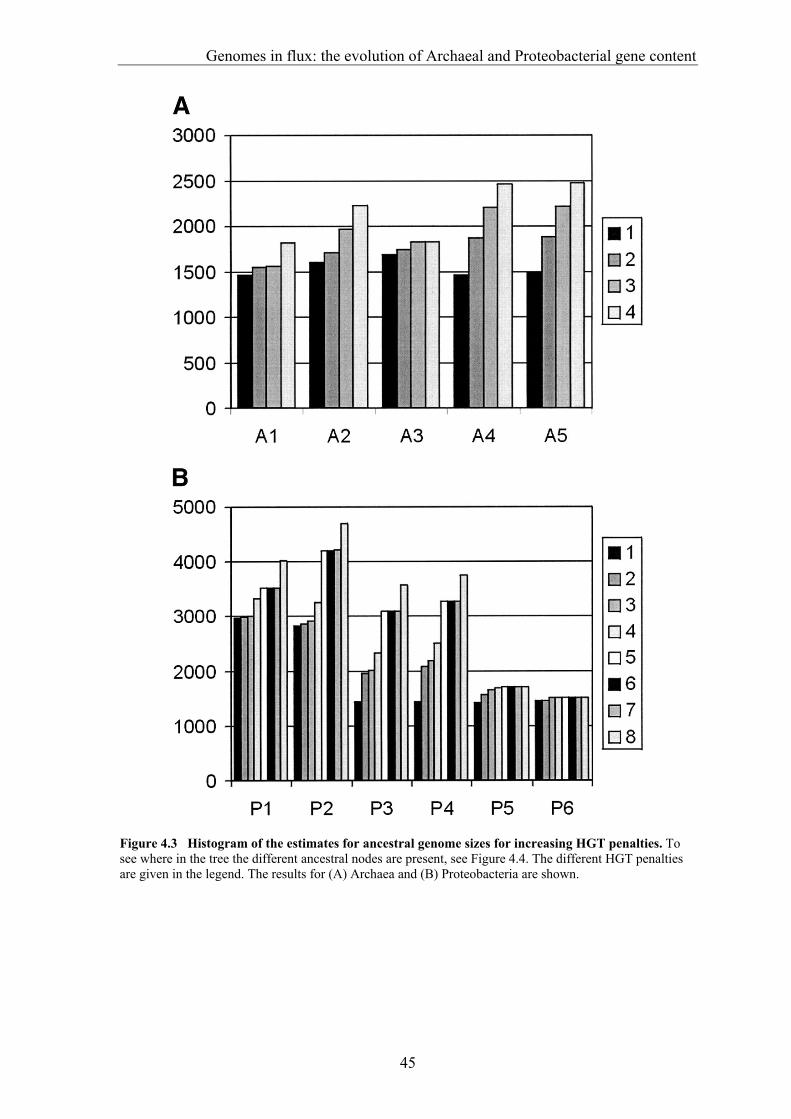
Genomes in flux: the evolution of Archaeal and Proteobacterial gene content
45
Figure 4.3 Histogram of the estimates for ancestral genome sizes for increasing HGT penalties. To see where in the tree the different ancestral nodes are present, see Figure 4.4. The different HGT penalties are given in the legend. The results for (A) Archaea and (B) Proteobacteria are shown.
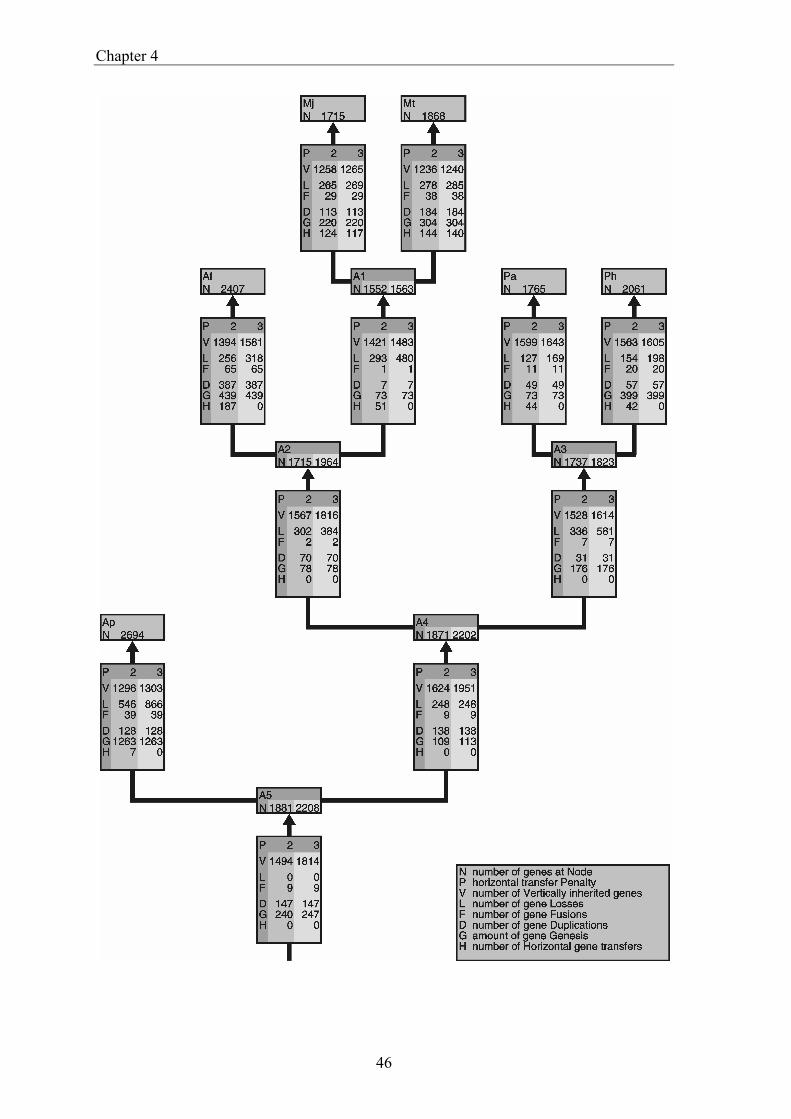
Chapter 4
46
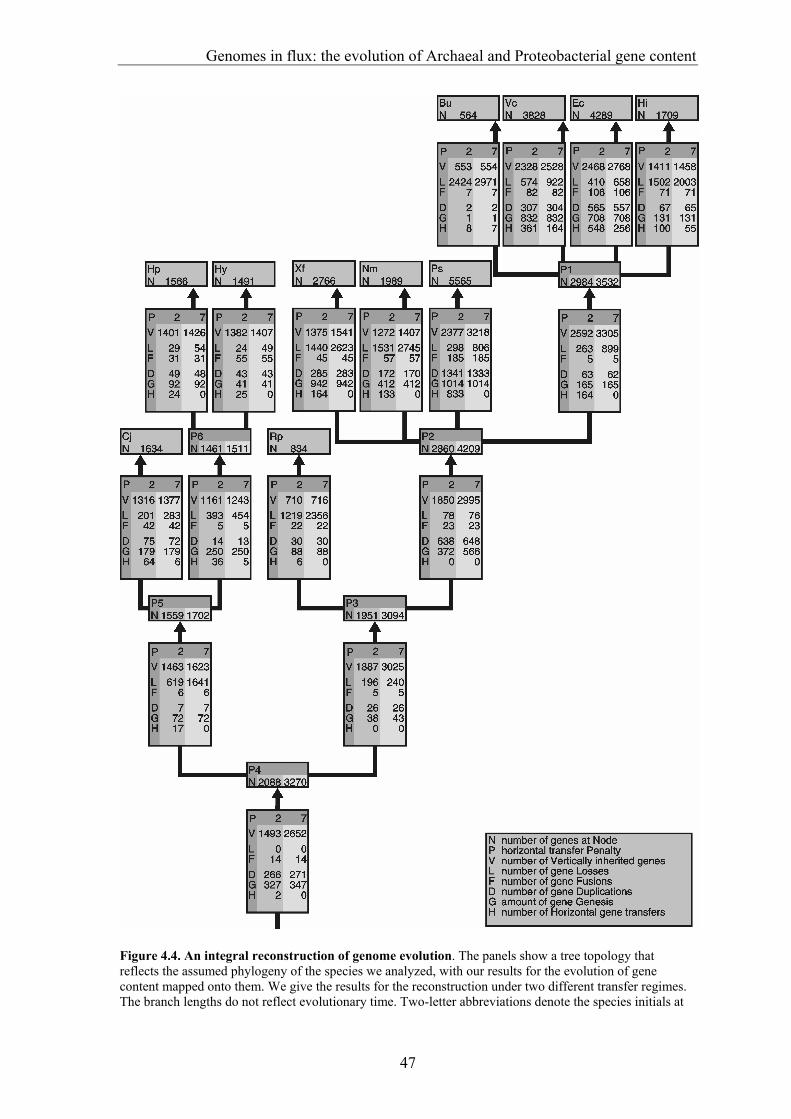
Genomes in flux: the evolution of Archaeal and Proteobacterial gene content
47
Figure 4.4. An integral reconstruction of genome evolution. The panels show a tree topology that reflects the assumed phylogeny of the species we analyzed, with our results for the evolution of gene content mapped onto them. We give the results for the reconstruction under two different transfer regimes. The branch lengths do not reflect evolutionary time. Two-letter abbreviations denote the species initials at
Chapter 4
48
the leaves. The ancestral nodes have names that consist of one character to denote their taxon (`A' for Archaea and `P' for Proteobacteria) and a number to distinguish them from each other. At each node is indicated how many genes we propose to have been present in that ancestor under two different HGT penalties. On the branches, all the processes are enumerated by their character code followed by how often that event occurred under two different scenarios. The meaning of the character codes is shown in the insets. (A) The results for the Archaea. The two-letter codes for the Archaeal species are as follows: Af, Archaeoglobus fulgidus; Ap, Aeropyrum pernix; Mj, Methanococcus jannaschii; Mt, Methanobacterium thermoautotrophicum; Pa, Pyrococcus abbysii; and Ph Pyrococcus horikoshi. The first number for the processes and the ancestral genome sizes is at an HGT penalty of 2, and the second at an HGT penalty of 3. (B) shows the results for the Proteobacteria. Bu, Buchnera sp. APS; Cj, Campylobacter jejuni NCTC 11168; Ec, Escherichia coli; Hi, Haemophilus influenzae; Hp, Helicobacter pylori 26695; Hy, Helicobacter pylori J99; Nm, Neisseria meningitidis MC58; Ps, Pseudomonas aeruginosa PA01; Rp, Rickettsia prowazekii; Vc, Vibrio cholerae; and Xf, Xylella fastidiosa. The first number for the processes and the ancestral genome sizes is at an HGT penalty of 2, and the second at an HGT penalty of 7. Duplication, fusion, and vertical inheritance The occurrence of gene duplication and gene fusion is almost completely independent from the amount of horizontal gene transfer (Table 4.1). Note that our estimates for the number of recent duplications, which are the duplications along terminal branches in Figure 4.4, are similar, albeit slightly lower, to those found by Jordan et al. (2001). Since the estimate of the amount of losses is directly coupled to the amount of HGT, the total number of losses decreases with increasing frequencies of HGT (Table 4.1). This effect is most prominent in the primitive branches (Fig. 4.4). Most genes on a given branch are present in its starting node, and in the node to which it leads; that is, they are vertically inherited (Table 4.1, Fig. 4.4). On all but the most early branches, the number of vertically inherited genes is relatively independent of the HGT penalty (Fig. 4.4). There are less vertically inherited genes with more HGT, because this number depends strongly on how many genes are available in the node they start from as well as how many of these are lost, and both of these factors decrease with increasing levels of HGT. Paradoxically, the fraction of vertically inherited genes (the number of vertically inherited genes divided by the number of genes in the node from which a branch stems) increases with increasing levels of HGT. This is because the number of lost genes decreases faster than the number of genes in the ancestral node with increasing levels of HGT. Thus with more HGT the vertical component becomes more important in genome evolution. Gene duplication versus HGT We here compare the effects of gene loss and HGT using a penalty for transfer. However we cannot do that for duplication versus HGT, because one transfer origin of a gene in an organism with multiple copies of that gene is equivalent to one duplication event; that is, one duplication can be replaced by one HGT to obtain the same present day distribution. We therefore compiled a test set of orthologous groups, namely those groups for which only one of the species contains multiple copies of a gene. This is a suitable test set because otherwise we would need to explicitly reconstruct many different processes simultaneously. Phylogenetic analysis of these groups reveals that 65% of the duplicated genes clearly fall into one cluster within the trees. The origin of the rest of the genes is unclear. These can be explained by transfer, but as easily by problems in phylogenetic inference as well as nonparsimonious older duplication and independent loss scenarios (see page 24). Using relative sequence similarities to distinguish these cases, we find that an upper limit of 20% of the genes might actually be of xenelogous origin. A reclassification of 20% of the duplications as HGT would, except for the smallest HGT penalty scenario, not affect the relative order of importance of the various processes (Table 1).
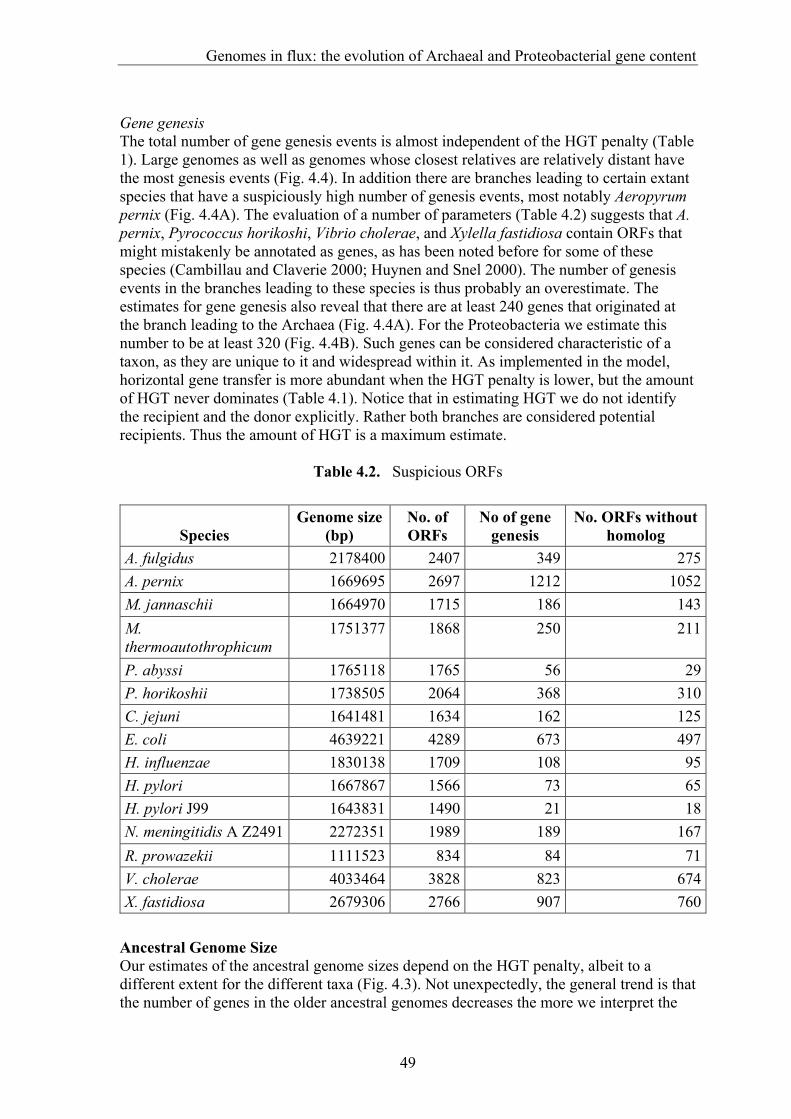
Genomes in flux: the evolution of Archaeal and Proteobacterial gene content
49
Gene genesis The total number of gene genesis events is almost independent of the HGT penalty (Table 1). Large genomes as well as genomes whose closest relatives are relatively distant have the most genesis events (Fig. 4.4). In addition there are branches leading to certain extant species that have a suspiciously high number of genesis events, most notably Aeropyrum pernix (Fig. 4.4A). The evaluation of a number of parameters (Table 4.2) suggests that A. pernix, Pyrococcus horikoshi, Vibrio cholerae, and Xylella fastidiosa contain ORFs that might mistakenly be annotated as genes, as has been noted before for some of these species (Cambillau and Claverie 2000; Huynen and Snel 2000). The number of genesis events in the branches leading to these species is thus probably an overestimate. The estimates for gene genesis also reveal that there are at least 240 genes that originated at the branch leading to the Archaea (Fig. 4.4A). For the Proteobacteria we estimate this number to be at least 320 (Fig. 4.4B). Such genes can be considered characteristic of a taxon, as they are unique to it and widespread within it. As implemented in the model, horizontal gene transfer is more abundant when the HGT penalty is lower, but the amount of HGT never dominates (Table 4.1). Notice that in estimating HGT we do not identify the recipient and the donor explicitly. Rather both branches are considered potential recipients. Thus the amount of HGT is a maximum estimate.
Table 4.2. Suspicious ORFs
Species Genome size
(bp) No. of ORFs
No of gene genesis
No. ORFs without homolog
A. fulgidus 2178400 2407 349 275A. pernix 1669695 2697 1212 1052M. jannaschii 1664970 1715 186 143M. thermoautothrophicum
1751377 1868 250 211
P. abyssi 1765118 1765 56 29P. horikoshii 1738505 2064 368 310C. jejuni 1641481 1634 162 125E. coli 4639221 4289 673 497H. influenzae 1830138 1709 108 95H. pylori 1667867 1566 73 65H. pylori J99 1643831 1490 21 18N. meningitidis A Z2491 2272351 1989 189 167R. prowazekii 1111523 834 84 71V. cholerae 4033464 3828 823 674X. fastidiosa 2679306 2766 907 760
Ancestral Genome Size Our estimates of the ancestral genome sizes depend on the HGT penalty, albeit to a different extent for the different taxa (Fig. 4.3). Not unexpectedly, the general trend is that the number of genes in the older ancestral genomes decreases the more we interpret the
Chapter 4
50
patchy presence patterns as horizontal gene transfer. In the following, we will use A(1-5) for denoting the ancestral Archaeal nodes and P(1-6) for denoting the ancestral Proteobacterial nodes (Figs. 4.3,4.4). The estimates for some ancestral genomes show almost no variation (e.g., the nodes A1, A3, P5, P6, and P1 in Fig. 4.3), which suggests that these are reasonable estimates for their number of genes. Other genomes show intermediate (e.g., A2, A4, and A5) through large (e.g., P2, P3, and P4) variation. In both clades, the primitive nodes are the most uncertain, in the Proteobacteria more so than in the Archaea. The reasonable amount of variation allows us to give, for the first time, explicit estimates for the genome size of ancestral genomes. Discarding the extremes we arrive at upper and lower boundaries for the ancestor of all Archaea (A5) between 1881 and 2208 genes, and for the Proteobacterial ancestor (P4) between 2088 and 3270 genes. Under the last common population model (Woese 1998; Doolittle 2000), the lower estimates represent the genes that were present in each organism in the ancestral population, while the higher estimates represent the genes that were present in at least one organism of that population.
Core genes Under the model we use to interpret the presence patterns, the number of genes that are present in all nodes is independent from assumptions about horizontal gene transfer. For the Proteobacteria, that set consists of 252 genes, and for the Archaea of 480 genes. We find less genes in this Archaeal "stable core" than did Makarova et al. (1999). We therefore repeated our procedure with the same species they used, and we obtained 539 genes, closely approximating their number of 542. The difference between our stable core (480 genes) based on the species used here, and the core (540 genes) based on a limited set of genomes, is largely due to the addition of the crenarchaeum A. pernix. Obviously such a "core" group of genes is not independent of the number of genomes used to define it. The core, defined as those genes that are present in all organisms, has an opposite in the gene pool, the genes which are present in any of the organisms. Counting all orthologous groups, excluding single genes that do not have homologs (potentially dubious singletons), we estimate that the gene pool contains 6411 genes for the Proteobacteria, and 3496 genes for the Archaea.
Genome dynamics The turnover of genes The independence of certain processes and of the size of certain nodes to the amount of HGT allows a reconstruction of the dynamics of genome evolution (Figs. 4.4,4.5). Lineage-specific differences can be relatively safely inferred for branches that are invariant to the HGT penalty. For example, it can be concluded that Haemophilus influenzae has lost at least 1500 genes since its common ancestor with V. cholerae and E. coli (P1), while E. coli and V. cholerae each lost at least 400-500 genes (Fig. 4.4B). This means that gene loss is a major factor in explaining the difference in genome size between these organisms, as has been previously suggested for H. influenzae and E. coli (de Rosa and Labedan 1998). Figure 4.5B, which traces the history of a single genome in terms of how many ancestral genes from each ancestor survive, reveals that there was even a substantial increase in genome size leading to P1, followed by a substantial decrease leading to H. influenzae. Because H. influenzae and E. coli have the same genome history up to P1, Figure 5B also reveals that substantial loss occurred throughout
Genomes in flux: the evolution of Archaeal and Proteobacterial gene content
51
the history of E. coli. In total, the lineage leading to E. coli from P4, the common ancestor of the Proteobacteria, lost between 950 and 1500 genes (Figs. 4.4B, 4.5B). Furthermore, it also is not the case that the two large genomes, E. coli and V. cholerae simply inherited their size. Rather they independently underwent substantial amounts of gene genesis and gene duplications (Fig. 5.4B). Thus, the general trend is that there is gain and loss on each branch, including loss of genes that previously have been gained; that is, a turnover of the gene content (Fig. 5.5). From numbers to rates Further insights into genome evolution can be gained by evaluating the relationship of the number of events with the evolutionary time of the branches. As a measure of evolutionary time for the branches, we use the consensus from the consistent protein phylogenies of the core genes (see Methods). We can use this analysis to assess our results, because although we assumed a certain topology for our inferences, we did not assume specific branch lengths: that is, we did not require the processes to correlate with time. We normalize the events using fractions of genes for each process that we obtain by dividing the number of events on a branch by the genome size from which it stems. Although the fraction of lost genes on a branch correlates fairly well with the length of that branch (Table 4.3), there are lineage-specific differences such as the high number of losses in the branch leading to H. influenzae. HGT does not show significant correlation with time. Duplication and gene genesis only correlate with time in the Archaea. Whereas the relatively low correlation of gene genesis might be partly caused by wrongly annotated genes in certain species (Table 4.2), the amount of duplication has a low correlation with time (Table 4.3), and it shows a large variation among branches (Fig. 4.4). Specifically, large genomes and the branches leading to P4 and A4 contain relatively many duplications, suggesting an important role for duplication in genome size expansion and early genome evolution (Fig. 4.4). In general, the estimates of the correlation indicate to what extent a process is clock-like; that is, to what extent it has a constant rate in time. This in turn might reflect the type of selection a process is under. Processes that show a weak correlation with time could be under (strong) positive selection. On the other hand, the relatively clock-like behavior of gene loss likely reflects negative selection (Gillespie 1998).
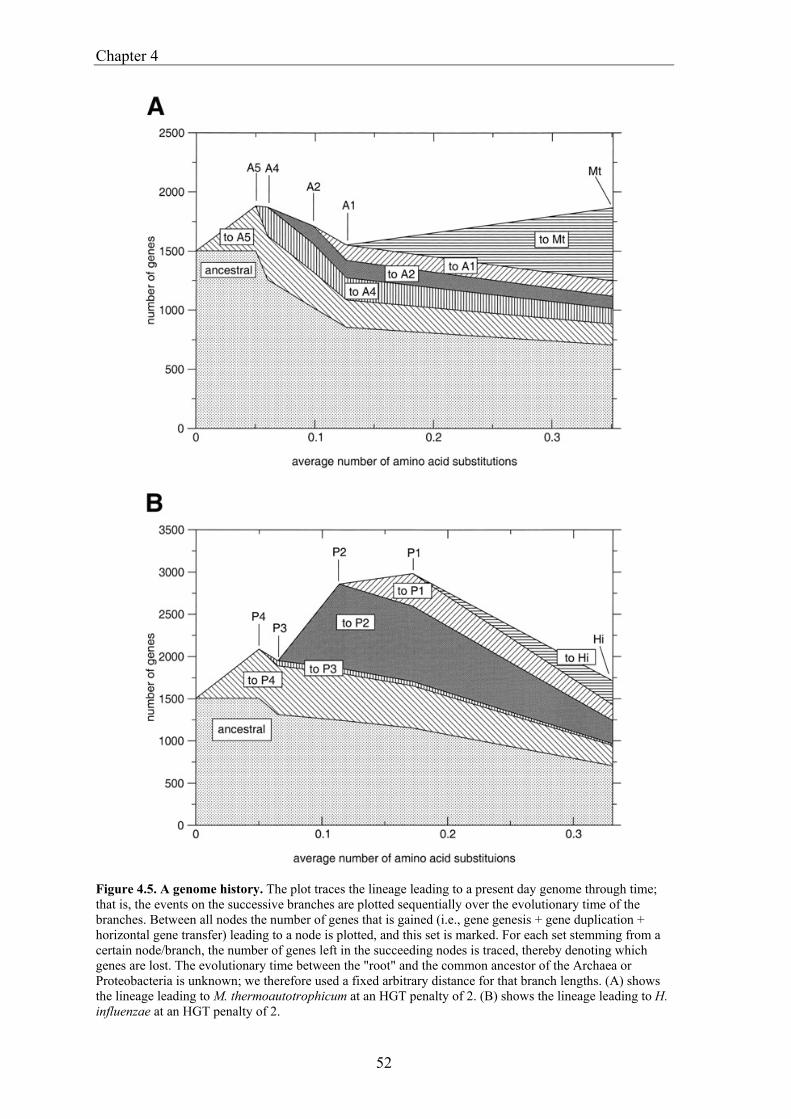
Chapter 4
52
Figure 4.5. A genome history. The plot traces the lineage leading to a present day genome through time; that is, the events on the successive branches are plotted sequentially over the evolutionary time of the branches. Between all nodes the number of genes that is gained (i.e., gene genesis + gene duplication + horizontal gene transfer) leading to a node is plotted, and this set is marked. For each set stemming from a certain node/branch, the number of genes left in the succeeding nodes is traced, thereby denoting which genes are lost. The evolutionary time between the "root" and the common ancestor of the Archaea or Proteobacteria is unknown; we therefore used a fixed arbitrary distance for that branch lengths. (A) shows the lineage leading to M. thermoautotrophicum at an HGT penalty of 2. (B) shows the lineage leading to H. influenzae at an HGT penalty of 2.
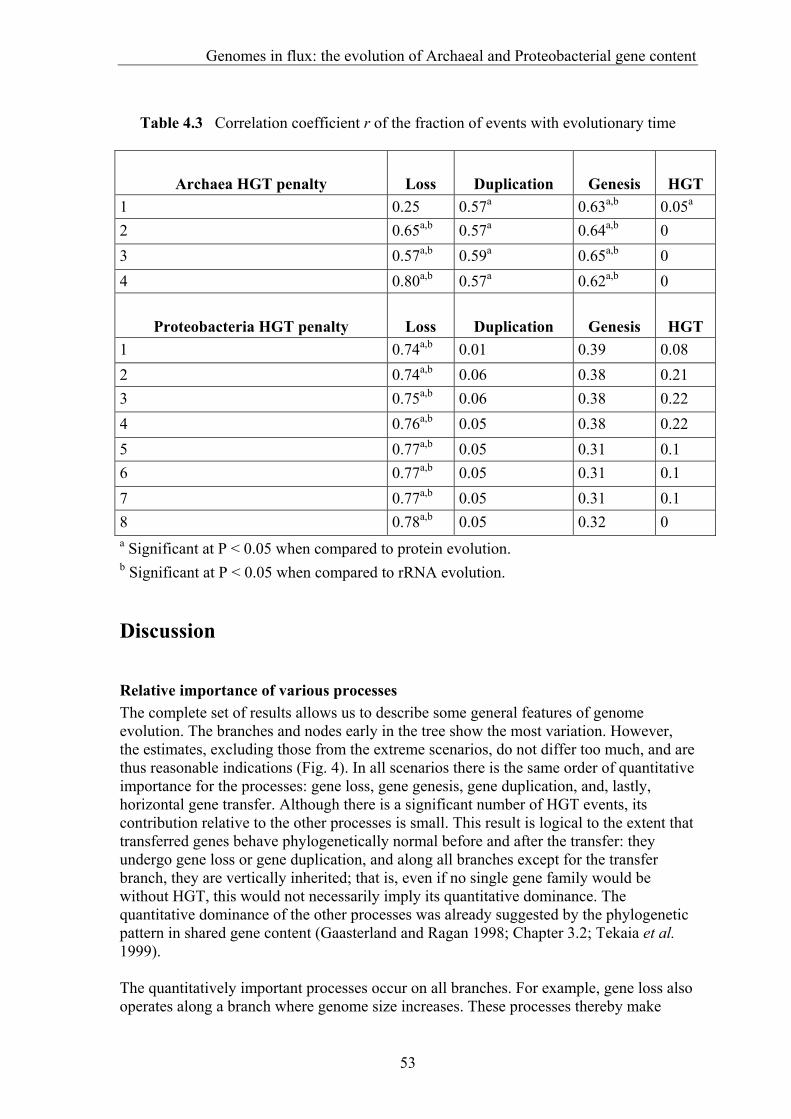
Genomes in flux: the evolution of Archaeal and Proteobacterial gene content
53
Table 4.3 Correlation coefficient r of the fraction of events with evolutionary time
Archaea HGT penalty Loss Duplication Genesis HGT 1 0.25 0.57a 0.63a,b 0.05a 2 0.65a,b 0.57a 0.64a,b 0 3 0.57a,b 0.59a 0.65a,b 0 4 0.80a,b 0.57a 0.62a,b 0
Proteobacteria HGT penalty Loss Duplication Genesis HGT 1 0.74a,b 0.01 0.39 0.08 2 0.74a,b 0.06 0.38 0.21 3 0.75a,b 0.06 0.38 0.22 4 0.76a,b 0.05 0.38 0.22 5 0.77a,b 0.05 0.31 0.1 6 0.77a,b 0.05 0.31 0.1 7 0.77a,b 0.05 0.31 0.1 8 0.78a,b 0.05 0.32 0 a Significant at P < 0.05 when compared to protein evolution. b Significant at P < 0.05 when compared to rRNA evolution.
Discussion
Relative importance of various processes The complete set of results allows us to describe some general features of genome evolution. The branches and nodes early in the tree show the most variation. However, the estimates, excluding those from the extreme scenarios, do not differ too much, and are thus reasonable indications (Fig. 4). In all scenarios there is the same order of quantitative importance for the processes: gene loss, gene genesis, gene duplication, and, lastly, horizontal gene transfer. Although there is a significant number of HGT events, its contribution relative to the other processes is small. This result is logical to the extent that transferred genes behave phylogenetically normal before and after the transfer: they undergo gene loss or gene duplication, and along all branches except for the transfer branch, they are vertically inherited; that is, even if no single gene family would be without HGT, this would not necessarily imply its quantitative dominance. The quantitative dominance of the other processes was already suggested by the phylogenetic pattern in shared gene content (Gaasterland and Ragan 1998; Chapter 3.2; Tekaia et al. 1999). The quantitatively important processes occur on all branches. For example, gene loss also operates along a branch where genome size increases. These processes thereby make
Chapter 4
54
genome evolution very fluid, with a turnover of the gene content throughout the tree. Nevertheless on almost all branches these dynamic processes contribute less than the genes that are simply inherited from the ancestor. Surprisingly, the relative contribution of these vertically inherited genes increases with increased amounts of HGT, because the size of the ancestors decreases less drastically than gene loss with increased HGT. The estimates for evolutionary recent ancestral genome sizes are relatively invariant. For the early genomes we estimate the ancestor of the Archaea to have had between 1881 and 2208 genes, and for the ancestor of the Proteobacteria to have had between 2088 and 3270 genes.
Genome clock Evaluation of the fraction of events over time per branch reveals their different modes of (genome) evolution: loss correlates fairly well with time, gene genesis correlates less well, and horizontal transfer as well as duplication hardly correlate at all. The clock-like behavior of gene loss suggests that it is under negative selection, while the processes resulting in the addition of a gene have a more adaptive character (Gillespie 1998). An explanation might be that there is a constant pressure to lose genes by gene deletion mutations, whereas the appearance of new genes only occurs as an adaptation to a new lifestyle. Note that we do not imply that gene loss is without functional interpretation as in the co-elimination of functionally interacting sets of proteins (Aravind et al. 2000), but only that it is under a different type of selection.
Nonparsimonious events We reconstruct the evolution of genome content by explaining the present day species distribution of genes using the minimum number of events. However, evolution also proceeds nonparsimoniously. For example, we do not detect the transfer of genes to organisms where they replace an existing orthologous copy, that is, orthologous gene displacement (Huynen et al. 1999). Such displacement would lead us to miss one HGT event and one gene loss event. However, on average, only 24% of the trees in our core set of genes are inconsistent with the consensus species phylogeny, inconsistencies that to a large extent are due to unequal rates of evolution. Similarly, it would be impossible to detect a gene that originated early in evolution but that was subsequently lost from all following genomes. Thus, because of our parsimony methods our estimates are probably minimum estimates, except for gene genesis, which is probably a maximum estimate (see also Table 2).
Outlook We provide here, based on an integrated approach and given explicit assumptions, estimates for the processes governing genome evolution and for the ancestral genomes. By including more species the result should converge, although it will probably be necessary to correct the HGT penalty for the numbers of species that are included in the analysis. Approaches such as the one presented here are required to move from distance-based genome phylogenies (Chapter 3.2) to genome trees that explicitly take ancestral nodes and the events connecting them into account. This avenue seems especially promising given the quantitative importance of processes that retain the phylogenetic signal such as vertical inheritance or gene genesis under all scenarios. In addition, approaches like this should improve the use of co-occurrence of genes for the prediction
Genomes in flux: the evolution of Archaeal and Proteobacterial gene content
55
of functional association (Huynen and Bork 1998; Pellegrini et al. 1999), because the information that genes were gained and lost together can be explicitly included.
Methods
Groups of orthologous genes We constructed groups of orthologous genes starting from our set of pairwise orthologous genes (Huynen and Bork 1998), which are based on an all-against-all comparison of the complete set of proteins from each genome using smith-waterman searches (Smith and Waterman 1981, see http://www.tigr.org/tdb/mdb/mdbcomplete.html for an overview of currently available genomes). The Archaeal and Proteobacterial genomes we analyzed here are given in the caption of Figure 4. The other (outgroup) genomes we used are Aquifex aeolicus, Bacillus subtilis, Borellia burgdorferi, Caenorhabditis elegans, Chlamydia pneumoniae, Chlamydia pneumoniae AR39; Chlamydia trachomatis D/UW-3/CX, Deinococcus radiodurans, Mycobacterium tuberculosis Rv, Mycoplasma genitalium G37, Mycoplasma pneumoniae M129; Saccharomyces cerevisiae, Synechocystis PCC6803, Thermotoga maritima, Treponema pallidum, and Ureaplasma urealyticum. We mark the genes that have nonoverlapping orthologous hits with different genes as fused (Chapter 2). In order to find genes that have been duplicated since the first speciation event in the taxon, we first determine, for every gene, with which of its orthologs it has the lowest similarity to obtain a threshold. Subsequently we determine for each gene the homologs in its genome that are more similar than this threshold, and denominate these as "duplicates within the genome." Then we start from a seed gene, which is not allowed to be fused, and keep adding orthologs as well as duplicates, and, if they are not fused, use them as seeds, until no new genes are added. All genes hereby retrieved are considered an orthologous group of genes. This approach is conceptually similar to the COGs (Tatusov et al. 1997), GeneRAGE (Enright and Ouzounis 2000) or GEANFAMMER (Park and Teichmann 1998), where the latter two approaches, however, focus on homologs instead of groups of orthologous genes. Conceptually our approach assembles genes that have a single representative in the last common ancestor of the compared species into one orthologous group. Note that pairwise orthology, unlike homology, in principle is nontransitive; that is, when A is orthologous to B and B is orthologous to C, then A is not necessarily orthologous to C in the case of duplication events after the speciation event separating A, B, and C (Tatusov et al. 1996, 1997, Chapter 3.2). Sensu stricto our groups thus contains also paralogous relations. The group orthology concept as described here and as also implemented in COGs (Tatusov et al. 1997) is therefore the only approach that allows a quantification of the processes in which we are interested.
Phylogeny and divergence time The phylogeny that we use here is based on the construction of 23S rRNA trees, the construction of gene order trees (Blanchette et al. 1999), and the construction of genome trees (Chapter 3.2). The tree partitions that consist of the same species in the trees from all three methods are implemented in the consensus phylogeny that we used for our analysis. To obtain evolutionary time for the branches, we used the orthologous groups that are present in all species. We constructed multiple sequence alignments using
Chapter 4
56
CLUSTAL W (Thompson et al. 1994) and neighbor joining trees (Saitou and Nei 1987) based on these alignments with default parameters as implemented in CLUSTAL W (Thompson et al. 1994). Subsequently we took the trees that are consistent with the consensus phylogeny of these species, averaged their branch lengths, and used this as the measure of the evolutionary time for a branch. Although the individual phylogenies that we selected are decidedly not clock-like, the procedure gave a surprisingly clock-like average phylogeny for the species considered, to the extent that the distance of all end nodes to the root is very similar (available from http://www.bork.embl-heidelberg.de/~snel/flux/). The rRNA-based branch lengths that we used as an additional measure for computing the correlation of the different processes with evolutionary time was obtained from 23S RNA. After constructing an alignment of the 23S RNA sequences from the species analyzed in this study, we constructed a phylogeny that corresponds to the consensus using TREE-PUZZLE (Strimmer and von Haeseler 1996) and parsed the branch lengths from the tree for use in computing the correlation. We found that 85% and 66% of the phylogenies of the core Archaeal and Proteobacterial genes, respectively, are consistent with the species phylogeny that we inferred. These inconsistencies could be the result of, among others, orthologous gene displacement or of gene duplication followed by differential loss. However, the higher fraction of inconsistent Proteobacterial trees relative to the Archaea is probably the result of another complication in constructing reliable phylogenies: unequal rates of sequence evolution, because more than half of the Proteobacterial inconsistent trees are classified as such due to Buchnera falling out of its grouping with E. coli, H. influenzae, and V. cholerae. Small genomes typically have higher rates of sequence evolution, which in combination with long branch attraction moves them towards the root of the tree.
Only vertical inheritance (the non-HGT-scenario) Using perl scripts, we first determined the most parsimonious scenario without horizontal gene transfer: that is, we determined, given the presence/absence pattern of an orthologous group of genes, given the phylogeny of the species, and assuming only vertical inheritance, which ancestors of the genomes contained this gene (see Fig. 4.1A). The branch where a gene appears for the first time is the branch were the gene started (gene genesis). Because of our operational definition of gene genesis, we cannot explicitly determine whether they truly (1) represent genuine de novo gene origins (i.e., from noncoding DNA), (2) resulted from a gene duplication followed by such rapid sequence divergence that the original orthology/paralogy situation became unclear, or (3) resulted from an HGT followed by very rapid sequence divergence. Therefore, for the genes that resulted from a genesis, we performed an additional search to find homologs that are not members of their orthologous group, using PSI-BLAST (Altschul et al. 1997) to increase the sensitivity. These searches revealed that only 12% of the Archaeal and 14% of the Proteobacterial orthologous groups resulting from genesis have homologs that are not a member of the group. The exact origin of the remaining genes remains undetectable, and these percentages are thus a lower limit for the amount of an origin other than genuine de novo gene origins. A branch where the number of members from an orthologous group increases is considered to have undergone gene duplication. A branch where the number of members from an orthologous group decreases is considered to have undergone gene loss.
Genomes in flux: the evolution of Archaeal and Proteobacterial gene content
57
Horizontal gene transfer To include horizontal gene transfer we introduced a relative-to-gene-loss variable penalty for a transfer event. Transfer events are treated as independent gene genesis events, where each additional genesis event costs the penalty of horizontal gene transfer (see Fig. 4.1B). If then there is a scenario with independent genesis events that cost less than a scenario with only loss, that scenario is used to score events for the group. We take penalties for horizontal transfer of 1, 2, 3, 4, 5, 6, 7, and 8. Although mechanism and selection are tightly intertwined, we thus do not allow HGT to be easier than gene loss, because purely mechanistically, before selection, gene loss is "easier" than HGT (Brown 1999). One can interpret the HGT penalty as an "expected relative frequency" of HGT versus gene loss per group of orthologous genes.
Gene fusion and fission When a gene is present in two or more groups of orthologous genes, it is thought to be a fusion gene. A specific fusion, that is, a group of orthologous genes consisting of the same set of domains (i.e., orthologous gene groups), is assumed to have occurred only once. Hence the fused genes are treated like their own group of orthologous genes. The groups of orthologous genes that gave rise to this fusion are then treated like a normal group, except that at the branch where the fusion occurred they both lose a member to the fused group. The result of this approach is that before the fusion event the components of the fused genes are treated like two or more separate genes, whereas after the fusion they are counted as one gene. We do not make a distinction between gene fusion and gene fission. In general, gene fusion is much more frequent than gene fission. A detailed gene tree-based analysis revealed that 85% of the nonoverlapping homology cases is caused by fusion rather than fission (Chapter 2). Our fusion category therefore contains a small fraction of fissions.
Acknowledgements We thank J. Castresana, P. Hogeweg, and the members of the Bork group for discussion and comments.

59
5
STRING: A web-server to retrieve and display the repeatedly
occurring neighbourhood of a gene
Berend Snel, Gerrit Lehmann, Peer Bork and Martijn A. Huynen
Nucleic Acids Research 28 (2000) 3442-3444
Chapter 5
60
Abstract The repeated occurrence of genes in each other’s neighbourhood on genomes has been shown to indicate a functional association between the proteins they encode. Here we introduce STRING (search tool for recurring instances of neighbouring genes), a tool to retrieve and display the genes a query gene repeatedly occurs with in clusters on the genome. The tool performs iterative searches and visualises the results in their genomic context. By finding the genomically associated genes for a query, it delineates a set of potentially functionally associated genes. The usefulness of STRING is illustrated with an example that suggests a functional context for an RNA methylase with unknown specificity. STRING is available at http://www.bork.embl-heidelberg.de/STRING
Introduction The availability of complete genome sequences has stimulated the development of new methods for protein function prediction (Dandekar et al. 1998, Overbeek et al. 1998, Overbeek et al. 1999, Marcotte et al. 1999, Enright et al. 1999, Pellgrini et al. 1999). In contrast to classical, homology-based function assignment, these methods do not predict the function of proteins, but rather the functional association between proteins, based on the genomic association of their genes. One approach is based on the observation that genes that repeatedly occur in each other’s proximity on genomes (in potential operons) tend to encode functionally interacting proteins, e.g. the proteins are part of the same protein complex or metabolic pathway (Dandekar et al. 1998, Overbeek et al. 1998, Overbeek et al. 1999, Mushegian and Koonin 1996, Tamames et al. 1997, Watanabe et al. 1997). Here we introduce a web-server that retrieves for a given query gene all the genes that repeatedly occur within potential operons. The server is named STRING (search tool for recurring instances of neighbouring genes). It also retrieves, by an iterative approach, the genes that are indirectly (via other genes) associated with the query gene. The web-interface (http://www.bork.embl-heidelberg.de/STRING ) visualises the results in their genomic context (Fig. 5.1).
Methodology The tool starts with a single seed gene. In the zero iteration it retrieves and displays the genes that repeatedly occur with this gene in clusters on the genome in multiple, phylogenetically distant species (for a definition see Huynen and Snel 2000). We define gene clusters here as introduced by Overbeek et al. with the concept of a ‘run’, a stretch of genes on the same strand not interrupted by >300 bp (Overbeek et al. 1999). In addition we count two genes that are actually fused into one gene as being in the same run. In subsequent iterations the tool repeats this process using as seeds all the new genes retrieved in the previous iteration, thereby uncovering the set of genes that are indirectly linked to the seed gene. The iterations continue until the number of iterations set by the user is reached, or until no new genes are found (convergence). Normally the query gene is used as seed. If the query gene is not part of a conserved gene cluster itself, the tool uses orthologues of the query gene that are in conserved gene clusters as seed. When a protein sequence is submitted as query, the tool performs a blast search against the
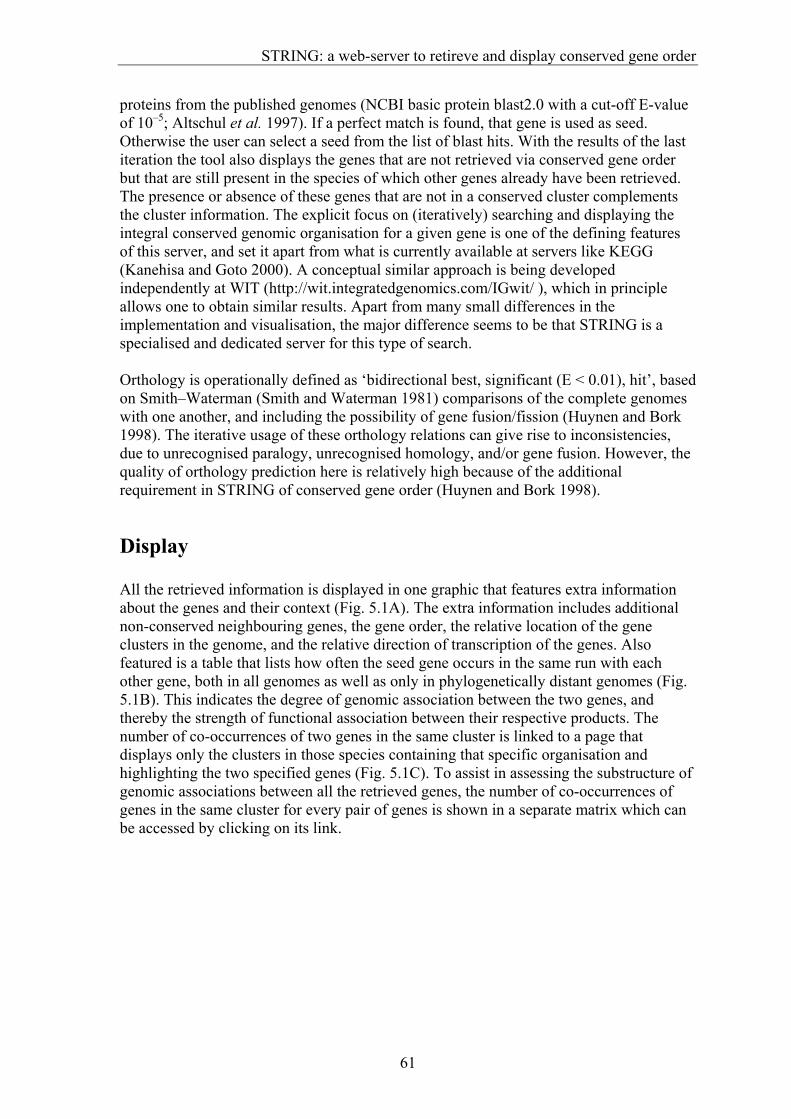
STRING: a web-server to retireve and display conserved gene order
61
proteins from the published genomes (NCBI basic protein blast2.0 with a cut-off E-value of 10–5; Altschul et al. 1997). If a perfect match is found, that gene is used as seed. Otherwise the user can select a seed from the list of blast hits. With the results of the last iteration the tool also displays the genes that are not retrieved via conserved gene order but that are still present in the species of which other genes already have been retrieved. The presence or absence of these genes that are not in a conserved cluster complements the cluster information. The explicit focus on (iteratively) searching and displaying the integral conserved genomic organisation for a given gene is one of the defining features of this server, and set it apart from what is currently available at servers like KEGG (Kanehisa and Goto 2000). A conceptual similar approach is being developed independently at WIT (http://wit.integratedgenomics.com/IGwit/ ), which in principle allows one to obtain similar results. Apart from many small differences in the implementation and visualisation, the major difference seems to be that STRING is a specialised and dedicated server for this type of search. Orthology is operationally defined as ‘bidirectional best, significant (E < 0.01), hit’, based on Smith–Waterman (Smith and Waterman 1981) comparisons of the complete genomes with one another, and including the possibility of gene fusion/fission (Huynen and Bork 1998). The iterative usage of these orthology relations can give rise to inconsistencies, due to unrecognised paralogy, unrecognised homology, and/or gene fusion. However, the quality of orthology prediction here is relatively high because of the additional requirement in STRING of conserved gene order (Huynen and Bork 1998).
Display All the retrieved information is displayed in one graphic that features extra information about the genes and their context (Fig. 5.1A). The extra information includes additional non-conserved neighbouring genes, the gene order, the relative location of the gene clusters in the genome, and the relative direction of transcription of the genes. Also featured is a table that lists how often the seed gene occurs in the same run with each other gene, both in all genomes as well as only in phylogenetically distant genomes (Fig. 5.1B). This indicates the degree of genomic association between the two genes, and thereby the strength of functional association between their respective products. The number of co-occurrences of two genes in the same cluster is linked to a page that displays only the clusters in those species containing that specific organisation and highlighting the two specified genes (Fig. 5.1C). To assist in assessing the substructure of genomic associations between all the retrieved genes, the number of co-occurrences of genes in the same cluster for every pair of genes is shown in a separate matrix which can be accessed by clicking on its link.
Chapter 5
62
Figure 5.1. Different parts of the result of an example search performed using STRING that detects a potential new functional interaction. The search was started with a gene from Mycoplasma genitalium that codes for a hypothetical tRNA/rRNA methylating enzyme (MG252) as query. The main graphic of the result (A) shows, after the iterations have converged, that the query (the red genes) occur repeatedly in the same gene cluster with cystenyl transfer RNA synthase (the green genes). The table of co-occurences in clusters (B) shows that this organisation is present in six species, twice in closely related species. It recently has been shown that, at least in some species, the cys-tRNA is modified (Hamann et al. 1999, Lipman and Hou 199815,16). Based on the pattern of conserved gene clusters, we propose that MG252 plays a role in the reported modification of the cys-tRNA. The other retrieved genes co-occurring with each other and with our query gene are less frequently connected to MG252 and cys-tRNA synthase, and are absent from the Mycoplasmas. Although this pattern suggests a less intimate involvement with the proposed interaction, the molecular functions still support some sort of functional link: the gene family in light green is homologous to a ribonuclease, and the family in purple is homologous to sugar nucleotidyl transferase. In this example, the iterations provide us with insight into the conserved genomic organisation of the associated genes. The ribonuclease only repeatedly occurs with the query, while the sugar nucleotidyl transferase has itself a very tight association with an hypothetical protein (the blue genes). When one, in the table of co-occurences, clicks on the number of times our query and the cys-tRNA co-occur in the same cluster in distantly related species, the diagram that only displays these organisations is shown (C). The query gene family is in red, while the cys-tRNA is assigned black. These two colours are reserved to denote the genes that this diagram focuses on. Genes from the same orthologous family have the same colour. The red gene symbols aligned above and below MG252 are its orthologues in the other species. The truncated small white gene-like symbols are genes that are located between the genes retrieved via the conserved gene clusters, but that are
STRING: a web-server to retireve and display conserved gene order
63
themselves not conserved in that position. The gene symbols with two colours are assigned to different gene families because they are the result of fusions. An interruption symbol, such as between yacN and cysS, means that the two displayed stretches of the genome are not in the same gene cluster. The lines between the genes symbolise the stretches of DNA in between the genes, and are linked to the DNA sequence of that stretch, while the gene symbols are linked to their GenBank entries.
Coverage STRING finds results for 24 768 out of the 59 416 genes in the presently included set of completely sequenced genomes. Although there is little operon structure in eukaryotes, to the extent that orthologues of their genes are present in prokaryotes, it is possible to predict functional associations for these genes. In this way we found results for 637 genes out of the 1681 yeast genes that have orthologues in the prokaryotes.
Selectivity We tested the probability that two genes repeatedly occur in one cluster by chance. In randomly shuffled genomes the probability that a given gene occurs with the same other gene in one cluster in two species is 0.02. For three species this probability is <0.002, and for four species or more it is <0.0005. The accuracy in terms of predicted functional relations is difficult to determine because of the broad definition of functional association, which includes a spectrum of possible protein relations ranging from direct ones such as physical interactions to more vague ones like the proteins being active in the same cellular process. Notice, however, that the functional link tends to be stronger when the conservation is stronger (Pellegrini et al. 1999). Furthermore, the interpretation of the type of association is facilitated by what is known about the putative molecular functions of the proteins, that can be inferred from conventional homology (see the example of cys-tRNA in Fig. 5.1). In general, only the user can interpret the nature of the association by knowledge of the genes and organisms involved.
Concluding remarks STRING provides a platform for searching and interpreting conserved patterns in genome organisation with the aim of finding functional associations for a given gene. The iterations and visualisation of the thereby retrieved genes allow the analysis and delineation of the set of potential interaction partners. Acknowledgements The authors wish to thank the members of the Bork group for helpful discussion and feedback. This work was supported by the DFG and the BMBF.

65
6
The identification of functional modules from the genomic
association of genes
Berend Snel, Peer Bork, and Martijn A. Huynen
Proceedings of the National Academy of Sciences of the United States of America 99 (2002) 5890-5895
Chapter 6
66
Abstract By combining the pairwise interactions between proteins, as predicted by the conserved co-occurrence of their genes in operons, we obtain protein interaction networks. Here we study the properties of such networks to identify functional modules: sets of proteins that together are involved in a biological process. The complete network contains 3033 orthologous groups of proteins in 38 genomes. It consists of one giant component, containing 1611 orthologous groups and of 516 small disjoint clusters that on average contain only 2.7 orthologous groups. These small clusters have a homogeneous functional composition and thus represent functional modules in themselves. Analysis of the giant component reveals that it is a scale free, small world network with a high degree of local clustering (C=0.6). It consists of locally highly connected subclusters that are connected to each other by linker proteins. The linker proteins tend to have multiple functions or are involved in multiple processes and have an above average probability of being essential. By splitting up the giant component at these linker proteins we identify 265 subclusters that tend to have a homogeneous functional composition. The rare functional inhomogeneities in our subclusters reflect the mixing of different types of (molecular) functions in a single cellular process, exemplified by subclusters containing both metabolic enzymes as well as the transcription factors that regulate them. Comparative genome analysis allows thus to identify a level of functional interaction intermediate between that of pairwise interactions and of the complete genome.
Introduction Genomic associations between genes reflect functional associations between their proteins (Dandekar et al. 1998, Overbeek et al. 1998, Overbeek et al. 1999, Enright et al. 1999, Marcotte et al. 1999, Pellegrini et al. 1999, Huynen et al. 2000, Yania et al. 20001). Furthermore, the strength of the genomic associations correlates with the strength of the functional associations: genes that frequently co-occur in the same operon in a diverse set of species are more likely to physically interact than genes that only occur together in an operon in two species (Huynen et al. 2000) and proteins linked via gene fusion or conservation of gene order are more likely to be subunits of a complex than proteins that are merely encoded in the same genomes (Enright et al. 1999, Huynen et al. 2000). Other types of associations have been used for network studies, but these focus on certain specific types of functional interactions, like subsequent enzymatic steps in metabolic pathways (Jeong et al. 2000), or physical interactions (Ito et al. 2001, Schwikowski et al. 2000, Wagner et al. 2001, Lappe et al. 2001). In contrast, genomic associations cover a relatively wide range of functional associations between proteins (Enright et al. 1999, Huynen et al. 2000). They reflect what selection regards as functionally interacting proteins, and can therefore be regarded as an alternative measure of functional interaction. Different types of genomic association have been introduced: gene fusion (Enright et al. 1999, Marcotte et al. 1999), conservation of gene order (Overbeek et al. 1998, Overbeek et al. 1999, Chapter 5, Wolf et al. 2001), in silico recognition of shared regulatory elements (McGuire and Church 2000, Terai et al. 2001), and co-occurrence of genes (phylogenetic profiles) (Huynen and Bok 1998, Pellegrini et al. 1999, Tatusov et al. 2001). Of these, we here focus on conserved gene order, which currently in prokaryotes is the most powerful type, having both a large coverage and a
The identification of functional modules from the genomic association of genes
67
high selectivity (Huynen et al. 2000, Chapter 5, McGuire and Church 2000). When we iteratively connect genes via this type of genomic association (Chapter 5), a network of associations appears (Fig. 6.1). In this network the nodes are orthologous groups of genes, and the edges are the genomic assocations between these groups. It has been suggested before that by such iterative approaches would be able to obtain all the proteins involved in a biological process (Overbeek et al. 1999, Chapter 5, Lathe et al. 2000). All the proteins from a pathway like the purine biosynthesis could thus be extracted with only one potential "false positive", a hypothetical protein (Overbeek et al. 1999). However, with more and more genomes becoming available, such iterative linking tends to connect nearly all proteins either directly or indirectly to each other, and indeed, in our analysis the orthologous groups involved in purine biosynthesis become part of a "giant component" containing 1611 orthologous groups. As manual, expert curation to separate clusters from each other (Overbeek et al. 1999) may not be feasible in the long run we seek here an automatic procedure to separate the giant component into sub-networks that would correspond to functional modules. Our analysis of the global and local properties of the giant component reveals that it consists of locally highly connected sub-networks that are connected to each other with linkers. By splitting up the network at these linkers, we identify a level of organization of proteins that lies between pairwise interactions and the complete network, and that can be regarded as a functional module: a set of proteins involved in the same biological process.
Methods
Orthologous groups To define conserved gene order through comparative genomics, we must determine the equivalent genes across genomes (Huynen and Bork 1998): i.e. which genes are orthologous to each other (Fitch 1970). For 38 genomes (for which species, see Fig. I at http://www.bork.embl-heidelberg.de/Docu/Modules/webfig.html) we construct orthologous groups by iterative clustering of genes that (i) are significant (Smith-Waterman, E<0.01) homologs, (ii) are best bi-directional hits, and (iii) have conserved gene order (Chapter 5). When genes in an orthologous group contain non-overlapping hits to other genes in that group, the group is split in two to reflect the domain nature of its composition. Subsequently any two orthologous groups A and B are merged into one group A-B if at least two independent best bidirectional hits exist between genes from group A and group B. Finally, genes that do not belong to any group are added to a group if and only if a strong triangular pairwise orthology relation exists between the gene and the genes from that group. Due to the combined requirement of best bi-directional hits and conservation of gene order, the iterative usage of the pairwise orthology relations is expected to give reliable results (Chapter 5). Although we use the COG functionally categories (see below), we did not use the COG orthologous groups themselves, allowing us to (i) use conserved neighborhood as an additional criterion for orthology prediction, and (ii) to include orthologous groups that only occur in two species. As a result of this the average size of our orthologous groups is smaller and hence probably functionally more uniform than that of the COGs. Note that orthology is evolutionary defined, meaning that one orthologous group can (and often does) contain different functions. The conflict of function versus orthology is one of the reasons that the network arises in the first place. We therefore try to tackle this using linkers (see below). Other approaches explicitly try to assemble genes with one function
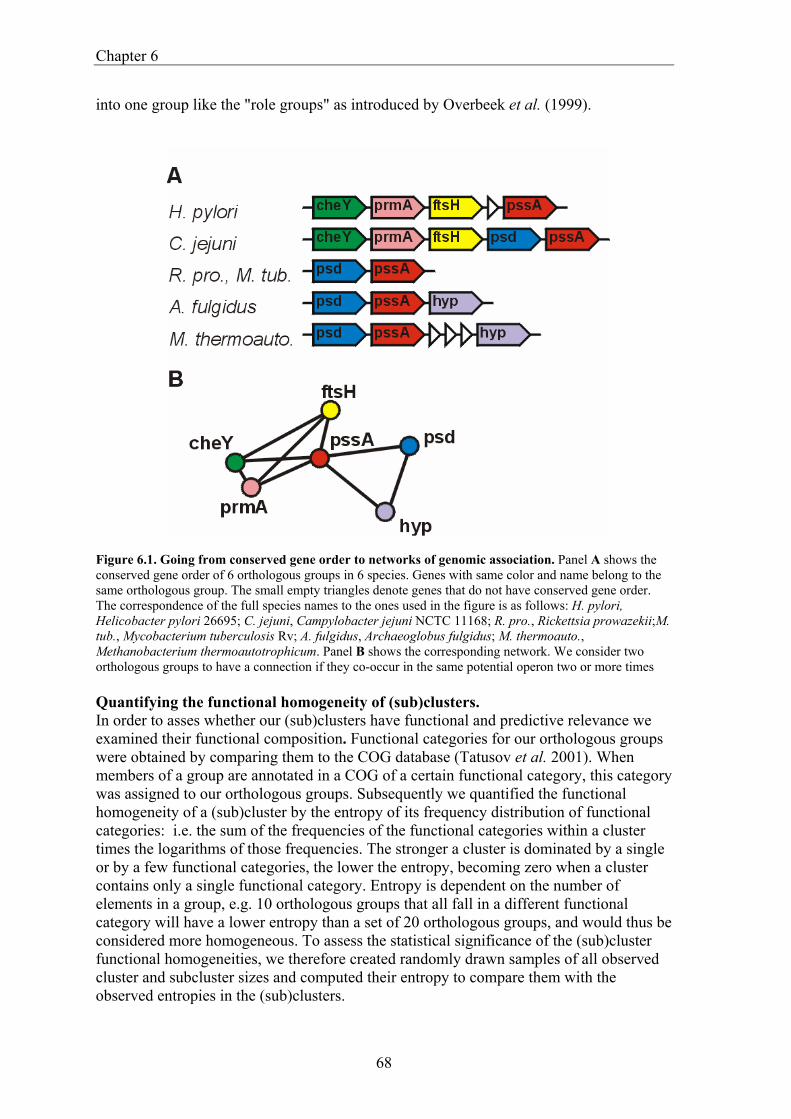
Chapter 6
68
into one group like the "role groups" as introduced by Overbeek et al. (1999).
Figure 6.1. Going from conserved gene order to networks of genomic association. Panel A shows the conserved gene order of 6 orthologous groups in 6 species. Genes with same color and name belong to the same orthologous group. The small empty triangles denote genes that do not have conserved gene order. The correspondence of the full species names to the ones used in the figure is as follows: H. pylori, Helicobacter pylori 26695; C. jejuni, Campylobacter jejuni NCTC 11168; R. pro., Rickettsia prowazekii;M. tub., Mycobacterium tuberculosis Rv; A. fulgidus, Archaeoglobus fulgidus; M. thermoauto., Methanobacterium thermoautotrophicum. Panel B shows the corresponding network. We consider two orthologous groups to have a connection if they co-occur in the same potential operon two or more times Quantifying the functional homogeneity of (sub)clusters. In order to asses whether our (sub)clusters have functional and predictive relevance we examined their functional composition. Functional categories for our orthologous groups were obtained by comparing them to the COG database (Tatusov et al. 2001). When members of a group are annotated in a COG of a certain functional category, this category was assigned to our orthologous groups. Subsequently we quantified the functional homogeneity of a (sub)cluster by the entropy of its frequency distribution of functional categories: i.e. the sum of the frequencies of the functional categories within a cluster times the logarithms of those frequencies. The stronger a cluster is dominated by a single or by a few functional categories, the lower the entropy, becoming zero when a cluster contains only a single functional category. Entropy is dependent on the number of elements in a group, e.g. 10 orthologous groups that all fall in a different functional category will have a lower entropy than a set of 20 orthologous groups, and would thus be considered more homogeneous. To assess the statistical significance of the (sub)cluster functional homogeneities, we therefore created randomly drawn samples of all observed cluster and subcluster sizes and computed their entropy to compare them with the observed entropies in the (sub)clusters.
The identification of functional modules from the genomic association of genes
69
Measuring the local connectivity, C, and average path length, L In order to assess whether it is at all feasible to separate our network, consisting of orthologous groups (the nodes) and genomic associations (the edges), into subclusters, we examined two important parameters that describe its topology: C and L. C is the local connectivity or degree of local clusteredness, it is computed by first counting all pairs of associations (cases where orthologous group A is linked to group B and to group C), subsequently counting how often these pairs are closed (B is linked to C), and then divide the second count by the first count (Watts and Strogatz 1998). L is the average shortest path length between orthologous groups. To obtain L we compute the shortest path between all pairs of orthologous groups, and subsequently compute the average (Watts and Strogatz 1998).
Defining linkers and delineating subclusters using linkers To split our giant component into subclusters we exploit the existence of linkers. Linkers are here defined as orthologous groups with mutually exclusive associations. First we mark them by clustering for each orthologous group (A) all the orthologous groups (N) it is connected to by the conservation of gene order. If, in the absence of A, these orthologous groups N fall into two or more subsets, then A is considered a linker. Subsequently we perform single linkage for all the orthologous groups, except that now the orthologous groups marked as linkers are not allowed to bring in new members: i.e. the single linkage clustering is not allowed to run through linkers. As a final step we connect orthologous groups that are not allocated into a group to all the subclusters they hit, but without subsequently linking those subclusters to each other. By this procedure most linkers end up in multiple clusters. The exceptions arise when (i) linkers link to other linkers, in which case the clusters are split between the linkers instead of "at the linkers", and (ii) two sets of orthologous groups can locally only be linked by the linker, but at a larger distance (via a detour) also be linked in a dense grid by other orthologous group. In the latter case the cluster would not be split up and the linker would only be member of one cluster.
Signifiance of the overrepresentation of multiple EC numbers in linkers using a binned chi-square test Genes are assigned EC numbers based on their annotation in the swissprot proteomes (Apweiler et al. 2001). To estimate the significance of the fact that orthologous groups classified as linkers contain more genes but also contain more EC numbers we perform a binned chi-square test (Kendall and Stuart 1977) instead of a normal chi-square test. This means that instead of testing the significance of the overrepresentation of multiple EC numbers for the total data set, we perform it for bins containing restricted set of orthologous groups with similar number of members. The summed chi-square test value is then compared to the expected value with a number of degrees of freedom (v) equal to the number of bins.
Results
Global properties The primary object of study, the nodes in our network, are orthologous groups of genes,
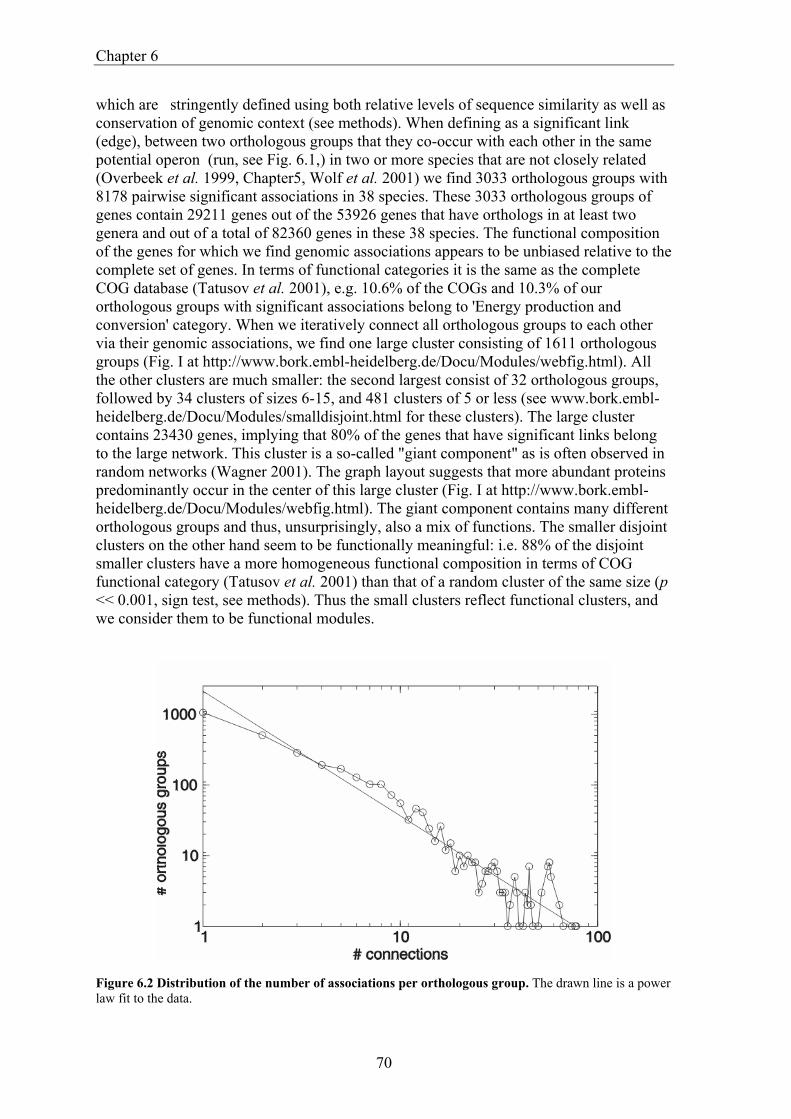
Chapter 6
70
which are stringently defined using both relative levels of sequence similarity as well as conservation of genomic context (see methods). When defining as a significant link (edge), between two orthologous groups that they co-occur with each other in the same potential operon (run, see Fig. 6.1,) in two or more species that are not closely related (Overbeek et al. 1999, Chapter5, Wolf et al. 2001) we find 3033 orthologous groups with 8178 pairwise significant associations in 38 species. These 3033 orthologous groups of genes contain 29211 genes out of the 53926 genes that have orthologs in at least two genera and out of a total of 82360 genes in these 38 species. The functional composition of the genes for which we find genomic associations appears to be unbiased relative to the complete set of genes. In terms of functional categories it is the same as the complete COG database (Tatusov et al. 2001), e.g. 10.6% of the COGs and 10.3% of our orthologous groups with significant associations belong to 'Energy production and conversion' category. When we iteratively connect all orthologous groups to each other via their genomic associations, we find one large cluster consisting of 1611 orthologous groups (Fig. I at http://www.bork.embl-heidelberg.de/Docu/Modules/webfig.html). All the other clusters are much smaller: the second largest consist of 32 orthologous groups, followed by 34 clusters of sizes 6-15, and 481 clusters of 5 or less (see www.bork.embl-heidelberg.de/Docu/Modules/smalldisjoint.html for these clusters). The large cluster contains 23430 genes, implying that 80% of the genes that have significant links belong to the large network. This cluster is a so-called "giant component" as is often observed in random networks (Wagner 2001). The graph layout suggests that more abundant proteins predominantly occur in the center of this large cluster (Fig. I at http://www.bork.embl-heidelberg.de/Docu/Modules/webfig.html). The giant component contains many different orthologous groups and thus, unsurprisingly, also a mix of functions. The smaller disjoint clusters on the other hand seem to be functionally meaningful: i.e. 88% of the disjoint smaller clusters have a more homogeneous functional composition in terms of COG functional category (Tatusov et al. 2001) than that of a random cluster of the same size (p << 0.001, sign test, see methods). Thus the small clusters reflect functional clusters, and we consider them to be functional modules.
Figure 6.2 Distribution of the number of associations per orthologous group. The drawn line is a power law fit to the data.
The identification of functional modules from the genomic association of genes
71
With more genomes becoming available we expect that smaller clusters will merge with each other and with the giant component. Thus there is an ever increasing need to identify subclusters within the giant component. A first step is to probe whether the giant component contains a substructure. We do this by measuring the standard connectivity parameter C (Watts and Strogatz 1998), which is the observed fraction of cases where, if node (i.e. orthologous group) a is connected to node b as well as node c, node b and c are also connected to each other. We find its C to be 0.60. This suggests that the large disjoint set is locally highly clustered, as a simulated, random network with the same number of nodes and the same number of connections has a C of only 0.005 (see methods). Moreover this C suggests that there are (sub-)modules in the large cluster, which might be retrievable (see below). The local connectivity (C) is actually close to that of a regular network -for example a regular ring lattice- which is 0.75 (Watts and Strogatz 1998). However unlike in such a regular network, we here find that L, the shortest path in terms of the number of links between all pairs of two orthologous groups, is 5.15: i.e. by following on average 5.15 genomic assocations one can go from a orthologous group to any other. This is just slightly higher than the 3.75 steps that we on average find in randomly created networks with the same number of nodes and the same number of connections. This combination of L being somewhat higher than Lrandom, and C >> Crandom , indicates that our network of genomic associations is a "small world network" (Watts and Strogatz 1998). This type of network is characterized as between random and completely regular, as it contains properties of both: it is random to the extent that the L is low, while at the same time it is regular because of a relatively high C. The distribution of the number associations of each orthologous group follows a power law: i.e. many orthologous groups have only one or two connections, and only a very few have many connections (Fig. 6.2). Aside from being a small world network, this is therefore also a scale free network: there is no characteristic number of connections per node (Barabasi and Albert 1999).
Linkers The high local connectivity parameter C indicates that there are potentially subclusters in the network. In order to separate these subclusters from each other, we identify orthologous groups with a specific type of local network topology: linkers. A linker is an orthologous groups with local mutually exclusive associations (see methods). In other words, a linker connects two (or more) sets of orthologous groups that, at least locally in the network around the linker, are only connected via that linker (6.3a). All together (i.e. in the large cluster and the disjoint clusters), we find 425 linkers that locally connect at least two different sets. Linkers are expected to have multiple functions and/or to play a role in different processes. To test if they indeed have multiple functions, we determined which orthologous groups are annotated in the swissprot proteomes (Apweiler et al. 2001) as having multiple EC numbers. This analysis reveals that linkers contain a significant overrepresentation of orthologous groups with multiple EC numbers, even when correcting for greater average size of the groups (2.3 times as many, p < 0.05, see methods). Thus, also the local network topology of linkers indeed reflects their (multi)functionality. It should be noted that a linker does represent a group of orthologous proteins. The multi-functionality of a linker does therefore not necessarily reside in the
Chapter 6
72
individual members of the group. The concept of orthology and its operational implementations have relevance to the evolutionary history of a group of genes, and do not necessarily imply that the proteins within an orthologous group have identical functions. The different functions in a linker can therefore also be distributed over the different members. Without huge experimental efforts it is impossible to derive the precise molecular function of every protein, and therewith to solve the question to what extent the individual proteins in a linker node are all multifunctional. We have therefore developed an operational approach that overcomes the complications that arise from the multifunctionality of orthologous groups in predicting functional modules form genome data. The proteins in linkers can be shown to be more essential than those in non-linkers in an individual organism: Mutations in Saccharomyces cerevisiae genes that reside in linkers have a significantly higher to be lethal (p < 0.05; Winzeler et al. 1999) than mutations in genes that do not reside in linkers.
Delineating functional modules using linkers The presence of substructure suggests it should be possible to delineate subclusters in the large cluster. Since linkers reflect their affiliation to multiple processes in their local network topology, they provide a straightforward way to split this giant component. We thus split the large cluster by performing single linkage for all orthologous groups, except that linkers are not allowed to bring in new members (see methods). With this approach the large cluster is split into 265 smaller subclusters (see www.bork.embl-heidelberg.de/Docu/Modules/subclus.html for a listing of these subclusters). The size distribution of the clusters (Fig. 6.4) reveals that the sizes are distributed better, albeit that the two largest subclusters of size 146 and 189 seem to be outliers. These might reflect imperfect delineation. Still 27.4% and 18.3% of the 189 orthologous groups belong respectively to the 'cell motility and secretion' and 'cell envelope biogenesis, outer membrane' category, indicating some recurring theme in this largest subcluster. In general of the derived subclusters, 70% have a more homogeneous functional composition in terms of COG functional category than that of a random cluster of the same size (p << 0.001, sign test). Moreover, nearly all are more homogeneous than the large cluster they stem from. Since 271 ortholgous groups in the giant component have an EC number, we explicitly looked at another measure of cellular process: metabolic pathway. Checking how often pairs of enzymes in the same subcluster are also in the same pathway as defined by KEGG (Kanehisa and Goto 2000), as compared to pairs of enzymes that are in different subclusters, we find 50% of the within subcluster enzyme pairs to be in the same pathway versus 9% of the between subclusters pairs. Among the subclusters are well known cases such as the tryptophan biosynthesis genes. Our approach successfully delineates this subcluster despite multiple tryptophan biosynthesis genes being linked to other genes and thereby to the large cluster (Fig. 6.3b).
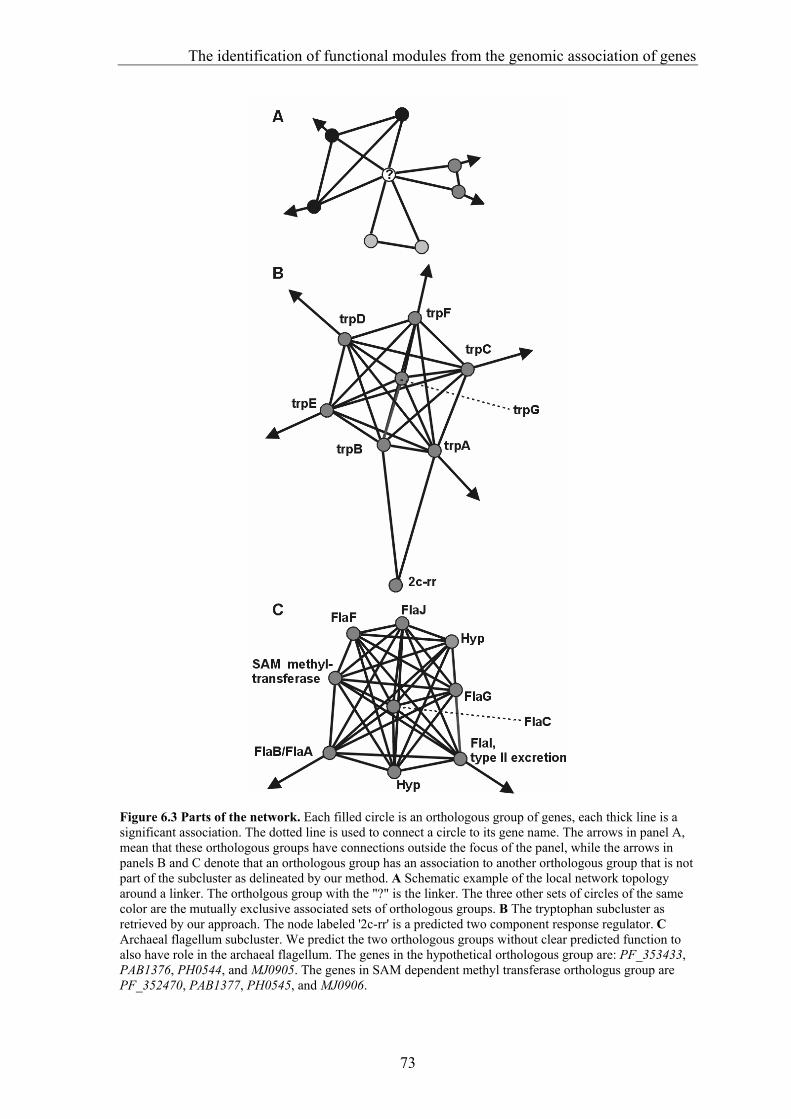
The identification of functional modules from the genomic association of genes
73
Figure 6.3 Parts of the network. Each filled circle is an orthologous group of genes, each thick line is a significant association. The dotted line is used to connect a circle to its gene name. The arrows in panel A, mean that these orthologous groups have connections outside the focus of the panel, while the arrows in panels B and C denote that an orthologous group has an association to another orthologous group that is not part of the subcluster as delineated by our method. A Schematic example of the local network topology around a linker. The ortholgous group with the "?" is the linker. The three other sets of circles of the same color are the mutually exclusive associated sets of orthologous groups. B The tryptophan subcluster as retrieved by our approach. The node labeled '2c-rr' is a predicted two component response regulator. C Archaeal flagellum subcluster. We predict the two orthologous groups without clear predicted function to also have role in the archaeal flagellum. The genes in the hypothetical orthologous group are: PF_353433, PAB1376, PH0544, and MJ0905. The genes in SAM dependent methyl transferase orthologus group are PF_352470, PAB1377, PH0545, and MJ0906.
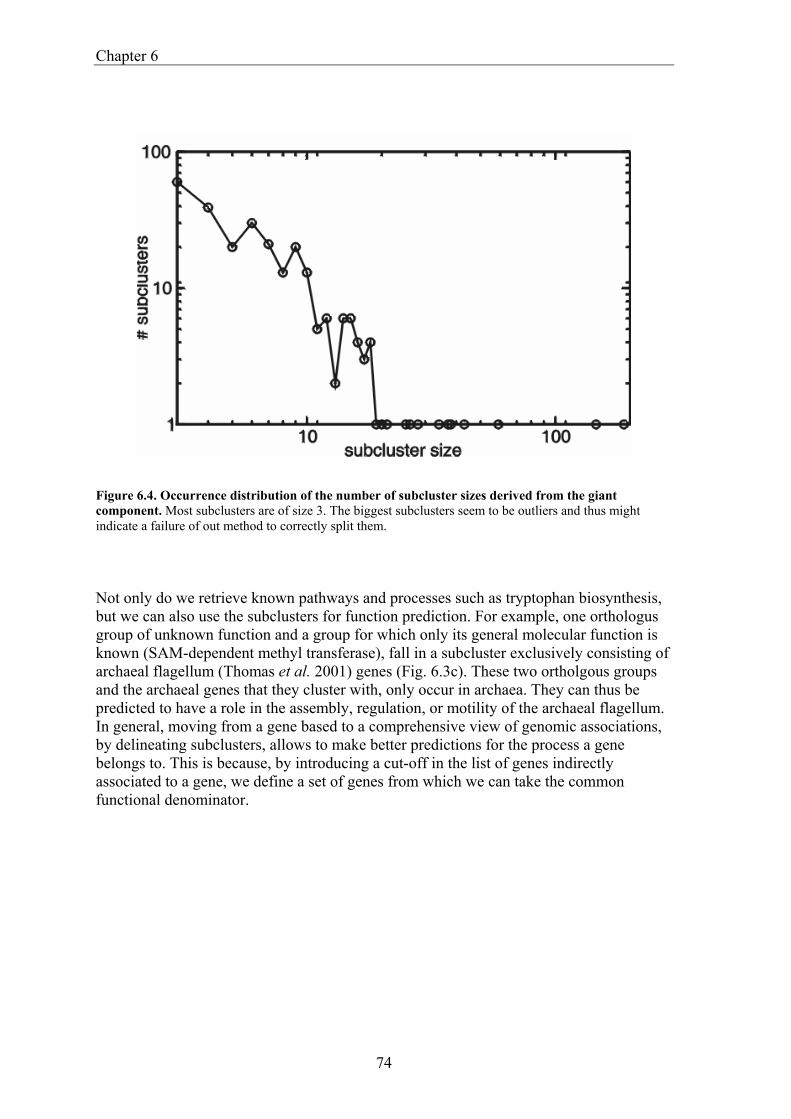
Chapter 6
74
Figure 6.4. Occurrence distribution of the number of subcluster sizes derived from the giant component. Most subclusters are of size 3. The biggest subclusters seem to be outliers and thus might indicate a failure of out method to correctly split them. Not only do we retrieve known pathways and processes such as tryptophan biosynthesis, but we can also use the subclusters for function prediction. For example, one orthologus group of unknown function and a group for which only its general molecular function is known (SAM-dependent methyl transferase), fall in a subcluster exclusively consisting of archaeal flagellum (Thomas et al. 2001) genes (Fig. 6.3c). These two ortholgous groups and the archaeal genes that they cluster with, only occur in archaea. They can thus be predicted to have a role in the assembly, regulation, or motility of the archaeal flagellum. In general, moving from a gene based to a comprehensive view of genomic associations, by delineating subclusters, allows to make better predictions for the process a gene belongs to. This is because, by introducing a cut-off in the list of genes indirectly associated to a gene, we define a set of genes from which we can take the common functional denominator.
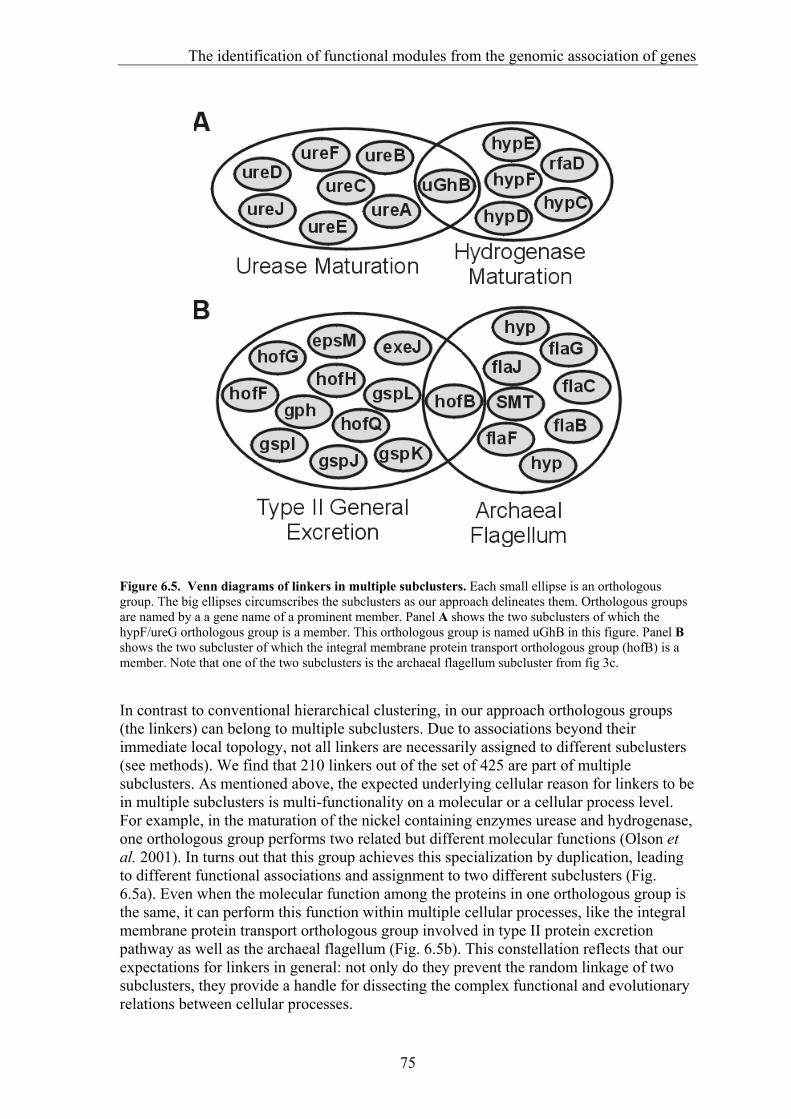
The identification of functional modules from the genomic association of genes
75
Figure 6.5. Venn diagrams of linkers in multiple subclusters. Each small ellipse is an orthologous group. The big ellipses circumscribes the subclusters as our approach delineates them. Orthologous groups are named by a a gene name of a prominent member. Panel A shows the two subclusters of which the hypF/ureG orthologous group is a member. This orthologous group is named uGhB in this figure. Panel B shows the two subcluster of which the integral membrane protein transport orthologous group (hofB) is a member. Note that one of the two subclusters is the archaeal flagellum subcluster from fig 3c. In contrast to conventional hierarchical clustering, in our approach orthologous groups (the linkers) can belong to multiple subclusters. Due to associations beyond their immediate local topology, not all linkers are necessarily assigned to different subclusters (see methods). We find that 210 linkers out of the set of 425 are part of multiple subclusters. As mentioned above, the expected underlying cellular reason for linkers to be in multiple subclusters is multi-functionality on a molecular or a cellular process level. For example, in the maturation of the nickel containing enzymes urease and hydrogenase, one orthologous group performs two related but different molecular functions (Olson et al. 2001). In turns out that this group achieves this specialization by duplication, leading to different functional associations and assignment to two different subclusters (Fig. 6.5a). Even when the molecular function among the proteins in one orthologous group is the same, it can perform this function within multiple cellular processes, like the integral membrane protein transport orthologous group involved in type II protein excretion pathway as well as the archaeal flagellum (Fig. 6.5b). This constellation reflects that our expectations for linkers in general: not only do they prevent the random linkage of two subclusters, they provide a handle for dissecting the complex functional and evolutionary relations between cellular processes.
Chapter 6
76
Just as gene function prediction by genomic context methods is complementary to that by homology determination (Overbeek et al. 2001), a functional classification based on genomic context is complementary to one that is based on molecular function. Hence come differences that we observe between classification systems that are (largely) based on homology relations (e.g. domain databases like SMART (Schultz et al 1998), or an orthology/domain database like COGs (Tatusov et al. 2001)), and a system that is based on genomic context. Such conflicting classifications should not be interpreted as errors in either one of the systems, but rather in terms of the difference in conceptual approach. For example, we find one subcluster that contains 3 enzymes from amino sugar metabolism catalyzing subsequent steps, together with a transcriptional regulator of hitherto unknown specificity. Based on this finding, we expect this regulatory orthologous group (consisting of PA3757, yvoA, XF1461, and DRA0211), to regulate the enzymes. In the COG category scheme this is an inhomogeneity, as the regulator belongs to the "transcription" category, while the enzymes are "carbohydrate transport and metabolism". More generally we see that, whereas in the COG classification scheme transcription falls into one functional class, in our classification they are spread out over 78 subclusters. And in only 4 (1.6%) of the subclusters they are the largest group within that cluster. This illustrates the complementarity of a genomic context based classification scheme as well as the potential of this approach to assign proteins to cellular processes for which the molecular functions are known.
Discussion
General network properties The network of pairwise genomic associations derived from conserved gene order exhibits interesting network features that can be interpreted in terms of the functional relations between the genes. There is large dominant cluster that spans most of the genes. The values of C and L in the network have important implications for the identification of functional modules and for the connectedness of the processes in a cell respectively: Although the low L, i.e. the low number of associations to get from one orthologous group to any other group, suggests that the functions of all proteins are intimately connected, the high local connectivity (C) indicates that one can still identify functional modules, and thus draw boundaries between the various processes. The power law in the number of connections indicates that it is also a scale free network (Barabasi and Albert 1999). Such a network is thought to emerge when a network has grown by preferentially attaching new genes/nodes to already existing highly connected, genes/nodes (Barabasi and Albert 1999). This evolutionary scenario is also supported by the predominance of widespread, and thus presumably older, orthologous groups in the 'center' of the large cluster (see Fig. I at http://www.bork.embl-heidelberg.de/Docu/Modules/webfig.html). The global network properties that we find have recently also been described for other complex large scale biological interaction networks (Jeong et al. 2000, Ito et al. 2001, Schwikowski et al. 2000, Wagner et al. 2001, Lappe et al. 2001), and protein domain evolutionary networks (Wuchty 2001). We thus conclude that the small world and scale free properties are general for biological networks.
The identification of functional modules from the genomic association of genes
77
Local network We analyze orthologous groups in terms of the specific network topology that surrounds them. Orthologous groups with locally mutually exclusive network associations, so-called linkers, reflect their different genomic associations by having significant overrepresentation of genes with multiple EC numbers. In addition they contain more lethal mutations, probably because they link various processes and/or have roles in multiple processes. They are crucial points both in the functional as well as the genomic association network, making them promising targets for anti microbial drugs. In general, the local association network around orthologous groups reflect their functional embedding. It should be noted that our linkers are not comparable to the "hubs", introduced by Jeong et al. (2000). The discrepancy not only lies in the fact that hubs are substrates (including ATP, NAD, H2O etc.) as opposed to our linkers which are orthologous groups of genes, but, more importantly, in that linkers link different processes (i.e. different sets of orthologosu groups), while hubs merely link a large number of entities.
Subclusters and functional classification That one could obtain all the proteins involved in a biological process by an iterative search for conserved gene order has been suggested before (Overbeek et al. 1999, Chapter 5, Lathe et al. 2000). Actually, it is not so straightforward, as such an iterative search tends to connect "everything with everything". This trend is likely to only get worse with more genomes becoming available. However, the topology of these genomic association networks suggests a natural way of splitting it up into meaningful subclusters, in a manner that also allows certain genes to belong to different modules. The thereby retrieved subclusters reflect known processes. More importantly these subclusters improve function predictions for hypothetical genes and assign genes with a known molecular function to a biological process. The clusters and subclusters can serve as the basis for a new concept for functional classification that is in defined by comparative genome analysis and that is complementary to one that is based on molecular function. Ultimately this work should contribute to an integration of the different levels of functional description (Bork et al. 1998) with the aim of obtaining a natural classification scheme for proteins and cellular processes (Benner and Gaucher 2001).

79
7
Summarizing discussion
The main body of this thesis consists of 5 chapters that represent a set of bioinformatic papers that cover different levels of comparative genome analysis. The levels that are discussed range from issues in defining orthology to the study of higher level structure in the network of protein protein associations. After or concurrent with the original publications of these chapters, other work has been published that has had great impact on our research questions. Here we summarize the work of this thesis in the framework of parallel developments and recurring themes within this and other work. We conclude with an outlook on how the field together with the work presented here might develop in the future.
Gene fusion and fission: implications for biology and orthology Throughout this thesis orthology is used as the main operational concept to establish equivalency of genes across genomes. Like others, we encountered many pitfalls associated with assigning orthology (Fitch 1970, Tatusov et al. 1997). Our study of these pitfalls resulted in a survey of one particular aspect, namely gene fusion and gene fission (one gene splitting into multiple ORFs), which in themselves are important as molecular evolutionary phenomena (Leffers et al. 1989, Zakharova 1999). The results of the survey (chapter 2) reveal that some genomes contain more frameshift fissions than others, but it might well be that those are results of differing standards in genome sequencing or gene assignment. Note that we encountered a similar situation in chapter 4, where certain species seemingly invent genes at a higher rate than other species, yet this actually reflects more relaxed gene assignments. These two cases reflect a general experience in this field: we ask a biological question to some data and subsequently are confronted with results that tell us more about the data than about the biology. Apart from such data issues, a more interesting and important finding is that theremophilic species contain significantly more genuine fission events. This is probably as adaptation to their lifestyle. As described in the introduction, thermophily also strongly influences the amino acid content of the whole proteome (Cambillau and Claverie 2000, Kreil and Ouzounis 2001). In effect there is thus a percolation of selection due to lifestyle into these two molecular evolutionary phenomena (gene structure and amino acid content). Other tools have been or were already developed that greatly improve our tool kit to deal with gene fusion and gene fission. Top down sequence similarity searches via curated databases of hidden markov models have increased their coverage such that they often discern the constituting elements in confusing, non-overlapping, or inconsistent
Chapter 7
80
homology situations that are the result of one or more gene fusion events (Ponting et al. 2000). When trying to discern fission, there are specialized PFAM fragment searches available that will successfully identify hits to proteins that only have a part of a domain and to which part of the domain they are homologous (Bateman et al. 2002). The manually curated database of Clusters of Orthologous Groups (Tatusov et al. 1997, Tatusov et al. 2001) provide an alternative solution, albeit that fission (split) proteins tend to not be explicitly annotated. However with the advent of eukaryotic genome sequencing the whole issue is being complicated due to a substantial increase in duplication and domain shuffling in eukaryotes (Ponting et al. 2000). Eukaryotic orthology is therefore pragmatically still 'unsolved', i.e. there is no good database. The problems are technical as well as conceptual. Thus, extensions of, or variations on the COGs, combined with detailed phylogenetic analysis of the gene trees (degrees of orthology) will just have to be implemented.
Genome trees and the "Tree of Life" From the comparison of complete genome sequences it has been suggested that many gene trees are inconsistent with the assumed species phylogeny (Doolittle 1999). However subsequent analysis has shown that there is still a strong phylogenetic signal in the gene content of a genome (Chapter 3, Fitz-Gibbon and House 1999, Tekaia et al. 1999). Given also the results on the quantitative importance of HGT in genome evolution presented in chapter 4, we here conclude that the gene content of genomes is largely shaped by their descent. We feel this bears relevance for discussing the tree of life/prokaryotic phylogeny in general despite worries that the occurrence of HGT refutes the very existence of a species phylogeny (Doolittle 1999). In fact, recently there have been many independent efforts, pooling different (genomic) methods, or using new genome scale methods to elucidate the tree of life (chapter 3, Fitz-Gibbon and House 1999, Tekaia et al. 1999, Brown et al. 2001, Wolf et al. 2001, Daubin and Gouy 2001). All in all, there seems to be a feeling that we can safely move forward to reconstruct something that will reflect the behavior of the majority of genes during the largest part of the history of an organism. Actually one can now already find certain groupings that are consistently re-occurring in the following recent independent attempts that presents us with a treasure trove of possible phylogenies: (i) the most recent genome trees from SHOT using different parameters and species selections (chapter 3); (ii) a systematic analysis of concatenated protein sequences that rigidly excludes suspicious gene families, i.e. they use traditional sequences based phylogenetic methods on an alignment which is a fusion of the alignment of many protein families (Brown et al. 2001); (iii) integrating and reanalyzing the different data sources of gene content, gene order, mean sequence identity, concatenated protein sequences, and comparison of gene trees constructed for multiple protein families (an impressive attempt by Wolf et al. 2001, albeit that their application of some of the methods is crude); (iv) a method that makes all trees for all (i.e. also the non-ubiquitous) protein families, and subsequently compiles a multiple alignment of zeroes, ones, and question marks based on all partitions in all trees. This is the so called "Supertree" method (Daubin and Gouy 2001); and (v) a tree based on the similarity among the occurrence of fingerprints of amino acid n-mers in the complete set of proteins from each genome (Hao personal communicaton). Among the most consistent result is the polyphily of the Gram Postives (they are never monophyletic) with a split between the
Summarizing discussion
81
high and low GC gram positives. Rather the high GC gram positives seem to form a new bacterial clade together with the Cyanobacteria and Deinococci. One other interesting finding which pops up in all the studies except the purely sequence tree based ones, is the clustering of the Aquifex with the Proteobacteria. That bacterial thermophily is derived has become increasingly clear (Forterre 1998, Nelson et al. 1999, Forterre 2002), but its phylogenetic status within the bacteria has remained that of a primitive or early branching clade. However the sequence based findings could depend on convergence in sequence evolution. This has been described for rRNA evolution (Forterre 1998, Brochier and Philippe 2002), and might actually also occur in protein based trees given the huge bias in the average amino acid content of proteins from thermophilic genomes (Cambillau and Claverie 2000, Kreil and Ouzounis 2001). Although this remains all speculation, I think it suggests that integrating all these methods might completely resolve the prokaryotic phylogeny.
Towards a detailed understanding of genome evolution The strong phylogenetic signal apparently present in the gene content of genomes, allows, as we described here in chapter 4, to use the presence and absence of genes, to explicitly reconstruct the gene content of ancestral genomes and the processes that shaped their offspring, the present day genomes whose sequence we study. This kind of integrated approach is relatively new. As such there is a substantial uncertainty in this line of work. Still the heuristic overview of the processes that shape genomes, allows us to for example map the correlation of gene loss with evolutionary time. This line of work allows us to find genomic evolutionary rates for gene duplication, gene loss, horizontal gene transfer and gene genesis. Although we have only described a quantitative analysis of the gene content of ancestral genomes, a qualitative analysis of the gene content of ancestral genomes should yield insights into the lifestyle of long extinct ancestral genomes. Moreover we think that these findings might be applied for constructing better genome trees, by moving it from a phenetic to a more cladistic analysis. Comparative genome analysis thus has allowed a revolutionary increase in our understanding of the importance of the different evolutionary operators for genome evolution. Specifically gene and genome duplications can only now be appropriately studied. The importance of gene duplications for genome evolution has now been undeniably shown (Huynen and van Nimwegen 1998, Qian et al. 2001, Jordan et al. 2001). Even the less trivial genome duplications are now more and more convincingly demonstrated through these comparisons (Ohno 1970, McLysaght et al. 2002). Especially the availability of large data sets of homologous proteins for trees, and the smart use of synteny, makes comparative analysis for studying genome duplications so powerful (Wolfe personal communication). In addition to the increased attention for the actual detailed description of the evolutionary behavior of individual genes within the context of the complete genome, our understanding of gene evolution versus genome evolution is further improved by adjusting the species phylogeny (see above). Together this results in a relatively well resolved picture of the gene content and genome evolution.
Chapter 7
82
Dealing with a growing web of genomic (and experimental) associations Through comparison of genomes the fluid nature of operon evolution has been elucidated (Mushegian and Koonin 1996, Lathe et al. 2000). At the same time these observations on the evolution of gene order allow the use of the conservation of gene order that is left, for the prediction of functional interaction between the proteins (Chapter 6, Overbeek et al. 1998, Dandekar et al. 1998, Overbeek et al. 1999). We thereby can study genomes as more than bags of genes, because we can look at the functional relations between the genes and their protein products. We have thus found a way to find functional relations through comparative genome analysis, by the detection of traces in the genome left by interacting proteins. We call these traces genomic associations (Huynen et al. 2000). Concurrent high profile studies have pioneered other forms of genomic associations for the prediction of protein-protein interactions such as the co-occurrence of two proteins in one polypepitde, i.e. gene fusion (Enright et al. 1999, Marcotte et al. 1999), and the co-occurrence of genes in genomes, i.e. phylogenetic profiles (Huynen and Bork 1998, Pellegrini et al. 1999, Tatusov et al. 2001). These comparisons thus map the evolution of genomic traits and apply them to predict protein-protein interactions. Moreover, comparing the predicted functions of all ORFs in all genomes has greatly expanded our view of metabolic pathway function and evolution (Huynen et al. 1999, Dandekar et al. 1999). Through the wide scope offered to us by these genomes, metabolic pathways as well as individual gene functions have been shown to be very fluid (Huynen et al. 1999, Copley and Bork 2000, Teichmann et al. 2001). At the same time this realization together with the protein interactions as predicted through genome comparisons, have given us improved tools for the annotation of these pathways and proteins in newly sequenced genomes (Huynen and Snel 2000). In this thesis we have described a web server (STRING) for finding one of the genomic associations, the conserved gene neighborhood of genes (chapter 5). The results show that conserved gene order is a powerful tool for finding functional associations between genes in prokaryotes because it has a relatively high coverage and few false positives. Independently other web sites have started to offer very similar services: The predictome database presents the results from three different genomic association methods (fusion, gene order, and phlogenetic profiles) as well as experimental data for a given query gene (Mellor et al. 2002). The general genome analysis tool ERGO (Overbeek et al. 2000) shows the gene order around homologous of the query gene (this tool was formally known as (IG)WIT) and note that it unfortunately is not freely available anymore). Finally the genome context button that is hidden on the page of every COG entry, similarly shows the gene order surrounding the COG members in the different species (Tatusov et al 2001). Not only are these in silico interactions increasingly applied, large-scale experimental approaches also are predicting many novel protein interactions in yeast. These approaches include yeast 2two hybrid systems (Schwikowski et al. 2000, Ito et al. 2001), complex purification techniques using mass-spectrometry (Gavin et al.2002, Ho et al. 2002), synthetic lethal genetic interaction data (Tong et al. 2001), in addition to already existing large scale "interaction" data such as correlated mRNA expression profiles (Cho et al. 1998, Hughes et al. 2000). With all the computationally and experimentally derived functional associations, we find
Summarizing discussion
83
that with more experiments and more genomes, every protein tends to get linked to every other protein. It therefore becomes important to study the arising network, and analyze its properties such that we can handle it. In chapter 6 we present an approach to split the network into subclusters that to a large extent reflect functional modules. Such higher level analysis of functional association can also be applied to the increasing amount of experimental data on protein-protein interactions. Moreover such a module world view fits nicely with newest batch of experiments that directly try to extract protein complexes from the cell (Gavin et al. 2002), rather than extracting pairwise protein-protein interactions.
Outlook Comparative genome analysis thus already has allowed to make many interesting discoveries. More will hopefully follow with all the ongoing sequencing projects. Especially the availability of enough eukaryotes to perform interesting comparative analyses, provides new opportunities. However this ever increasing amount of data from ongoing sequencing projects does not only open up new possibilities, it also creates the need to just be able to handle it. For example, comparing every single ORF from each genome to every single other ORF of all other genomes, might become computationally too demanding, and even when it is feasible, how does one digest all this information. Similarly the evolutionary analysis of one single orthologous group will be hampered by the fact that a tree with 500 genes is difficult to look at. On top of all this come the new types of data, which deal with higher order genomic characteristic such as protein-protein interactions (Ito et al. 2001, Gavin et al. 2002). These new types of data allow comparative genome analysis on higher levels, but come with there own set of problems. All in all, I think that a lot of work will remain focused on basic questions in comparative genomics or even in basic sequence analysis, because many of them are not yet adequately resolved. Still with these arguably imperfect concepts and tools, we already have discovered many things, amongst them this very same imperfection. Part of the solution will thus be to now change our concepts in which we view the world. In the study of orthologous relations, it was basically assumed that a neat set of one to one relationships could be obtained. However the new view is that of degrees of orthology, i.e. depending on how far back one takes the ancestor two genes, can be considered orthologous or not. Similarly depending on the choice of the ancestor, many to many relationships need to be proposed. Effectively there will not be a nice table. Rather there will be a gene tree and a (still to be constructed, yet another old but standing challenge) species tree, accompanied by their overlay in terms of duplication, loss and horizontal transfer (Page 1998). Hopefully such a mapping can be complemented by relevant information for each gene at the leaves of the tree, such as experimentally determined gene function or its surrounding gene neighborhood. The entire collection of these gene trees effectively constitutes the genome tree and should provide us with a complete picture. Of course, only by continuing our analysis of the data will we iteratively improve our concepts in which to perform comparative genome analysis.

85
Bibliography
Altschul, S. F., Gish, W., Miller, W., Myers, E. W. and Lipman, D. J. (1990) Basic local alignment search tool. J Mol Biol 215, 403-410
Altschul, S. F., Madden, T. L., Schaffer, A. A., Zhang, J., Zhang, Z., Miller, W., and Lipman D. J. (1997) Gapped BLAST and PSI-BLAST: a new generation of protein database search programs. Nucleic Acids Res. 25, 3389-3402
Apweiler, R., Biswas, M., Fleischmann, W., Kanapin, A., Karavidopoulou, Y., Kersey, P., Kriventseva, E. V., Mittard, V., Mulder, N., Phan, I., and Zdobnov, E. (2001) Proteome Analysis Database: online application of InterPro and CluSTr for the functional classification of proteins in whole genomes. Nucleic Acids Res. 29, 44-48
Aravind, L., Watanabe, H., Lipman, D. J., and Koonin, E. V. (2000) Lineage-specific loss and divergence of functionally linked genes in eukaryotes. Proc. Natl. Acad. Sci. U. S. A . 97, 11319-11324
Baldauf, S. L., Palmer, J. D. and Doolittle, W. F. (1996) The root of the universal tree and the origin of eukaryotes based on elongation factor phylogeny. Proc Natl Acad Sci U S A, 93, 7749-7754
Baldauf, S.L., Roger, A. J., Wenk-Siefert, I., and Doolittle, W. F.(2000) A kingdom-level phylogeny of eukaryotes based on combined protein data. Science 290, 972-977.
Barabasi, A.L., and Albert, R. (1999) Emergence of scaling in random networks. Science 286, 509-512
Bateman, A., Birney, E., Cerruti, L., Durbin, R., Etwiller, L., Eddy, S. R., Griffiths-Jones, S., Howe, K. L., Marshall, M. and Sonnhammer, E. L. (2002) The Pfam protein families database. Nucleic Acids Res 30, 276-80
Benner. S.A., and Gaucher, E.A. (2001) Evolution, language and analogy in functional genomics. Trends Genet. 17, 414-418
Birney, E. (1996) PairWise and SearchWise: finding the optimal alignment in a simultaneous comparison of a protein profile against all DNA translation frames. Nucleic Acids Res 24, 2730-2739
Blanchette, M., Kunisawa, T., and Sankoff, D. (1999) Gene order breakpoint evidence in animal mitochondrial phylogeny. J. Mol. Evol. 49, 193-203
Blattner, F. R., Plunkett, G. 3rd, Bloch, C. A., Perna, N. T., Burland, V., Riley, M., Collado-Vides, J., Glasner, J. D., Rode, C. K., Mayhew, G. F., Gregor, J., Davis, N. W., Kirkpatrick, H. A., Goeden, M. A., Rose, D. J., Mau, B. and Shao, Y.. (1997) The complete genome sequence of Escherichia coli K-12. Science 277, 1453-1474
Boore, J.L., and Brown, W.M. (1998) Big trees from little genomes: mitochondrial gene
Bibliography
86
order as a phylogenetic tool. Curr. Opin. Genet. Dev. 8, 668-674.
Bork, P., Dandekar, T., Diaz-Lazcoz, Y., Eisenhaber, F., Huynen, M., and Yuan, Y. (1998) Predicting function: from genes to genomes and back. J. Mol. Biol. 283, 707-725
Bork, P. and Koonin, E. V.(1998) Predicting functions from protein sequences ¯ where are the bottlenecks?. Nat. Genet. 18, 313¯318.
Brenner, S. E., Chothia, C. and Hubbard, T. J. (1998) Assessing sequence comparison methods with reliable structurally identified distant evolutionary relationships. Proc Natl Acad Sci U S A 95, 6073-6078
Brett, D., Pospisil, H., Valcarcel, J., Reich, J. and Bork, P. (2002) Alternative splicing and genome complexity. Nat Genet 30, 29-30
Brochier, C. and Philippe, H. (2002) Phylogeny: A non-hyperthermophilic ancestor for Bacteria. Nature 417, 244
Brown, J.R., Douady, C. J., Italia, M. J., Marshall, W. E., and Stanhope, M. J. (2001) Universal trees based on large combined protein sequence data sets. Nat. Genet. 28, 281-285.
Brown, T. A. 1999. The Molecular Basis of Genome Evolution. In Genomes. pp. 329-366. John Wiley & sons Inc. New York.
Bruccoleri, R. E., Dougherty, T. J., and Davison, D. B. (1998) Concordance analysis of microbial genomes. Nucleic Acids Res. 26, 4482-4486
Bult, C. J., White, O., Olsen, G. J., Zhou, L., Fleischmann, R. D., Sutton, G. G., Blake, J. A., FitzGerald, L. M., Clayton, R. A., Gocayne, J. D., Kerlavage, A. R., Dougherty, B. A., Tomb, J. F., Adams, M. D., Reich, C. I., Overbeek, R., Kirkness, E. F., Weinstock, K. G., Merrick, J. M., Glodek, A., Scott, J. L., Geoghagen, N. S. and Venter, J. C. (1996) Complete genome sequence of the methanogenic archaeon, Methanococcus jannaschii. Science 273, 1058-1073
Burns, D. M., Burger, M. J. and Beacham, I. R. (1995) Silent genes in bacteria: the previously designated `cryptic' ilvHI locus of `Salmonella typhorium LT2' is active in natural isolates. FEMS Microbial. Lett. 131, 167¯172.
Cambillau, C., and Claverie, J. M. (2000) Structural and genomic correlates of hyperthermostability. J. Biol. Chem. 275, 32383-32386
Cho, R. J., Campbell, M. J., Winzeler, E. A., Steinmetz, L., Conway, A., Wodicka, L., Wolfsberg, T. G., Gabrielian, A. E., Landsman, D., Lockhart, D. J. and Davis, R. W. (1998) A genome-wide transcriptional analysis of the mitotic cell cycle. Mol Cell 2, 65-73
Clarke, A. R., Atkinson, T. and Holbrook, J.J. (1989) From analysis to synthesis: new ligand binding sites on the lactate dehydrogenase framework. Part II. Trends Biochem Sci 14, 145-148
Copley, R. R. and Bork, P. (2000) Homology among (betaalpha)(8) barrels: implications for the evolution of metabolic pathways. J Mol Biol 303, 627-641
Dandekar, T., Snel, B., Huynen, M., and Bork, P. (1998) Conservation of gene order: a fingerprint of proteins that physically interact. Trends Biochem. Sci. 23, 324-328
Dandekar, T., Schuster, S., Snel, B., Huynen, M. A. and Bork, P. (1999). Pathway
Bibliography
87
alignment: application to the comparative analysis of glycolytic enzymes. Biochem J. 343, 115-124
Daubin, V. and Gouy, M. (2001) Bacterial molecular phylogeny using supertree approach. Genome Inform Ser Workshop Genome Inform 12, 155-164
Deckert, G., Warren, P. V., Gaasterland, T., Young, W. G., Lenox, A. L., Graham, D. E., Overbeek, R., Snead, M. A., Keller, M., Aujay, M., Huber, R., Feldman, R. A., Short, J. M., Olsen, G. J. and Swanson, R. V.(1998) The complete genome of the hyperthermophilic bacterium Aquifex aeolicus. Nature 392, 353-358
Doolittle, W. F. and Logsdon, J. M. (1998) Archaeal genomics: do archaea have a mixed heritage? Curr. Biol. 8, R209-211
Doolittle W. F. (1999) Phylogenetic classification and the universal tree. Science, 284, 2124-2129
Eddy, S. R.(2000) Profile hidden Markov models. Bioinformatics 14, 755-763
Enea, V. and Zinder, N. D. (1975) Guanidinium-CsCl density gradients for isopycnic analysis of nucleic acids. Science 190, 584-586
Enright, A. J., Iliopoulos, I., Kyrpides, N. C., and Ouzounis C. A.. (1999) Protein interaction maps for complete genomes based on gene fusion events. Nature 402, 86-90
Enright, A. J., and Ouzounis, C. A. (2000) GeneRAGE: a robust algorithm for sequence clustering and domain detection. Bioinformatics 16, 451-457
Felsenstein, J. (1981) Evolutionary trees from DNA sequences: A maximum likelihood approach. J. Mol. Evol. 17, 368-376.
Felsenstein, J. (1989) PHYLIP-phylogeny inference package (Version 3.2) Cladistics 5, 164-166
Fey, S. J. and Larsen, P. M. (2001) 2D or not 2D. Two-dimensional gel electrophoresis. Curr Opin Chem Biol 5, 26-33
Fitch, W. M. and Margoliash, E. (1967) Construction of phylogenetic trees. Science 155, 279-284
Fitch W. M. (1970) Distinguishing homologous from analogous proteins. Syst. Zool. 19, 99-113
Fitz-Gibbon, S. T., and House, C. H. (1999) Whole genome-based phylogenetic analysis of free-living microorganisms. Nucleic Acids Res. 27, 4218-4222
Fleischmann, R. D., Adams, M. D., White, O., Clayton,R. A., Kirkness, E. F., Kerlavage, A. R., Bult, C. J., Tomb, J. F., Dougherty, B. A., Merrick, J. M., et al. (1995) Whole-genome random sequencing and assembly of Haemophilus influenzae Rd. Science. 269, 496-512.
Forterre, P. (1998) Were our ancestors actually hyperthermophiles? Viewpoint of a devil's advocate. In Thermophiles: The keys to molecular evolution and the origin of life? (Wiegel, J. and Adams, M.W.W, eds), pp. 137-146, Taylor & Francis Inc.
Forterre, P. (2002) A hot story from comparative genomics: reverse gyrase is the only hyperthermophile-specific protein. Trends in Genet 18, 236-237
Fraser, C. M., Gocayne, J. D., White, O., Adams, M. D., Clayton, R. A., Fleischmann,
Bibliography
88
R. D., Bult, C. J., Kerlavage, A. R., Sutton, G., Kelley, J. M., et al. (1995)The minimal gene complement of Mycoplasma genitalium. Science 270, 397-403
Fraser, C. M., Casjens, S., Huang, W. M., Sutton, G. G., Clayton, R., Lathigra, R., White, O., Ketchum, K. A., Dodson, R., Hickey, E. K., Gwinn, M., Dougherty, B., Tomb, J. F., Fleischmann, R. D., Richardson, D., Peterson, J., Kerlavage, A. R., Quackenbush, J., Salzberg, S., Hanson, M., van Vugt, R., Palmer, N., Adams, M. D., Gocayne, J., Venter, J. C. et al. (1997) enomic sequence of a Lyme disease spirochaete, Borrelia burgdorferi. Nature 390, 580-58
Gaasterland, T., and Ragan, M. A. (1998) Microbial genescapes: phyletic and functional patterns of ORF distribution among prokaryotes. Microb. Comp. Genomics 3, 199-217
Gavin, A. C., Bosche, M., Krause, R., Grandi, P., Marzioch, M., Bauer, A., Schultz, J., Rick, J. M., Michon, A. M., Cruciat, C. M., Remor, M., Hofert, C., Schelder, M., Brajenovic, M., Ruffner, H., Merino, A., Klein, K., Hudak, M., Dickson, D., Rudi, T., Gnau, V., Bauch, A., Bastuck, S., Huhse, B., Leutwein, C., Heurtier, M. A., Copley, R. R., Edelmann, A., Querfurth, E., Rybin, V., Drewes, G., Raida, M., Bouwmeester, T., Bork, P., Seraphin, B., Kuster, B., Neubauer, G. and Superti-Furga, G. (2002) Functional organization of the yeast proteome by systematic analysis of protein complexes. Nature 415, 141-147.
The Gene Ontology Consortium. (2001) Creating the gene ontology resource: design and implementation. Genome Res. 11, 1425-1433.
Gillespie, J. H. (1998) Population genetics: a concise guide. Johns Hopkins University Press, Baltimore
Graham, A. (2000) Animal phylogeny: root and branch surgery. Current Biol. 10, R36-38.
Gruber, T. M. and Bryant, D. A. (1997) Molecular systematic studies of eubacteria, using sigma70-type sigma factors of group 1 and group 2. J Bacteriol 179, 1734-1747
Guigo, R., Agarwal, P., Abril, J. F., Burset, M. and Fickett, J. W. (200) An assessment of gene prediction accuracy in large DNA sequences. Genome Res 10, 1631-1642
Hamann, C. S., Sowers, K. R., Lipman, R. S. and Hou, Y. M. (1999) An archaeal aminoacyl-tRNA missing from genomic analysis. J. Bacteriol. 181, 5580-5884
Heidelberg, J. F., Eisen, J. A., Nelson, W. C., Clayton, R. A., Gwinn, M. L., Dodson, R. J., Haft, D. H., Hickey, E. K., Peterson, J. D., Umayam, L., Gill, S. R., Nelson, K. E., Read, T. D., Tettelin , H., Richardson, D., Ermolaeva, M. D., Vamathevan, J., Bass, S., Qin, H., Dragoi, I., Sellers, P., McDonald, L., Utterback, T., Fleishmann, R. D., Nierman, W. C., and White, O. (2000) DNA sequence of both chromosomes of the cholera pathogen Vibrio cholerae. Nature. 406, 477-483
Himmelreich, R.; Plagens, H.; Hilbert, H.; Reiner, B. and Herrmann, R. (1997) Comparative analysis of the genomes of the bacteria Mycoplasma pneumoniae and Mycoplasma genitalium. Nucleic Acids Res. 25, 701¯712.
Ho, Y., Gruhler, A., Heilbut, A., Bader, G. D., Moore, L., Adams, S. L., Millar, A., Taylor, P., Bennett, K., Boutilier, K., Yang, L., Wolting, C., Donaldson, I., Schandorff, S., Shewnarane, J., Vo, M., Taggart, J., Goudreault, M., Muskat, B., Alfarano, C., Dewar, D., Lin, Z., Michalickova, K., Willems, A. R., Sassi, H.,
Bibliography
89
Nielsen, P.A., Rasmussen, K. J., Andersen, J. R., Johansen, L. E., Hansen, L. H., Jespersen, H., Podtelejnikov, A., Nielsen, E., Crawford, J., Poulsen, V., Sorensen, B. D., Matthiesen, J., Hendrickson, R. C., Gleeson, F., Pawson, T., Moran, M. F., Durocher, D., Mann, M., Hogue, C. W., Figeys, D. and Tyers, M.. (2002) Systematic identification of protein complexes in Saccharomyces cerevisiae by mass spectrometry. Nature 415, 180-183
Houseman, B. T., Huh, J. H., Kron, S. J. and Mrksich, M. (2002) Peptide chips for the quantitative evaluation of protein kinase activity. Nat Biotechnol 20, 270-274
Hughes, T. R., Marton, M. J., Jones, A. R., Roberts, C. J., Stoughton, R., Armour, C. D., Bennett, H. A., Coffey, E., Dai, H., He, Y. D., Kidd, M. J., King, A. M., Meyer, M. R., Slade, D., Lum, P. Y., Stepaniants, S. B., Shoemaker, D. D., Gachotte, D., Chakraburtty, K., Simon, J., Bard, M. and Friend, S. H.(2000) Functional discovery via a compendium of expression profiles. Cell 102, 109-126
Huynen, M. A. and Bork, P. (1998) Measuring genome evolution. Proc. Natl. Acad. Sci. U. S. A. 95, 5849-5856
Huynen, M., Doerks, T., Eisenhaber, F., Orengo, C., Sunyaev, S., Yuan, Y., and Bork P. (1998) Homology-based fold predictions for Mycoplasma genitalium proteins. J Mol Biol. 280, 323-326.
Huynen, M. A., Dandekar, T., and Bork, P (1998) Differential genome analysis applied to the species-specific features of Helicobacter pylori. FEBS Lett. 246, 1-5
Huynen, M. A. and van Nimwegen, E. (1998) The frequency distribution of gene family sizes in complete genomes. Mol Biol Evol 15, 583-589
Huynen, M. A., Dandekar, T., and Bork, P. (1999) Variation and evolution of the citric acid cycle: a genomic approach. Trends Microbiol., 7, 281-291
Huynen, M. A., and Snel, B. (2000) Gene and context: integrative approaches to genome analysis Adv. Prot. Chem. 54, 345-379
Huynen, M., Snel, B., Lathe III, W., and Bork, P. (2000) Predicting protein function by genomic context: quantitative evaluation and qualitative inferences. Genome Res. 10, 1204-1210
Huynen, M.A., Snel, B., and Bork, P. (2001) Inversions and the dynamics of eukaryotic gene order. Trends Genet. 17, 304-306.
Ito, T., Chiba, T., Ozawa, R., Yoshida, M., Hattori, M., and Sakaki, Y. (2001) A comprehensive two-hybrid analysis to explore the yeast protein interactome. Proc. Natl. Acad. Sci. U. S. A. 98, 4569-4574
Iwabe, N., Kuma, K., Hasegawa, M., Osawa, S and Miyata, T. (1989) Evolutionary relationship of archaebacteria, eubacteria, and eukaryotes inferred from phylogenetic trees of duplicated genes . Proc. Natl. Acad. Sci. U. S. A 23, 9355-9359
Jaenicke, R. and Boehm, G. (1998) The stability of proteins in extreme environments. Curr. Opin. Struct. Biol. 8, 738¯748
Jeong, H., Tombor, B., Albert, R., Oltvai, Z. N., and Barabasi, A. L. (2000) The large-scale organization of metabolic networks. Nature 407, 651-654
Jordan, I. K., Makarova, K. S., Spouge, J. L., Wolf, Y. I., and Koonin, E. V. (2001) Lineage-specific gene expansions in bacterial and archaeal genomes. Genome Res.
Bibliography
90
11, 555-565
Kanehisa, M., and Goto, S. (2000) KEGG: kyoto encyclopedia of genes and genomes. Nucleic Acids Res. 28, 27-30
Kaneko, T., Sato, S., Kotani, H., Tanaka, A., Asamizu, E., Nakamura, Y., Miyajima, N., Hirosawa, M., Sugiura, M., Sasamoto, S., Kimura, T., Hosouchi, T., Matsuno, A., Muraki, A., Nakazaki, N., Naruo, K., Okumura, S., Shimpo, S., Takeuchi, C., Wada, T., Watanabe, A., Yamada, M., Yasuda, M. and Tabata, S. (1996) Sequence analysis of the genome of the unicellular cyanobacterium Synechocystis sp. strain PCC6803. II. Sequence determination of the entire genome and assignment of potential protein-coding regions. DNA Res 3, 109-136
Kawarabayasi, Y., Sawada, M., Horikawa, H., Haikawa, Y., Hino, Y., Yamamoto, S., Sekine, M., Baba, S., Kosugi, H., Hosoyama, A., Nagai, Y., Sakai, M., Ogura, K., Otsuka, R., Nakazawa, H., Takamiya, M., Ohfuku, Y., Funahashi, T., Tanaka, T., Kudoh, Y., Yamazaki, J., Kushida, N., Oguchi, A., Aoki, K., Kikuchi, H.. (1998) Complete sequence and gene organization of the genome of a hyper-thermophilic archaebacterium, Pyrococcus horikoshii OT3. DNA Res 5, 55-76
Kendall, M., and Stuart, A. 1977. Tests of hypotheses and significance. In The advanced theory of statistics, Volume 1, Distribtuion theory. pp. 2-2. Charles Griffin & Company Ltd. London.
Klenk, H. P. and Zillig, W. (1994) DNA-dependent RNA polymerase subunit B as a tool for phylogenetic reconstructions: branching topology of the archaeal domain. J Mol Evol 38, 420-432
Klenk, H. P., Clayton, R. A., Tomb, J. F., White, O., Nelson, K. E., Ketchum, K. A., Dodson, R. J., Gwinn, M., Hickey, E. K., Peterson, J. D., Richardson, D. L., Kerlavage, A. R., Graham, D. E., Kyrpides, N. C., Fleischmann, R. D., Quackenbush, J., Lee, N. H., Sutton, G. G., Gill, S., Kirkness, E. F., Dougherty, B. A., McKenney, K., Adams, M. D., Loftus, B., Venter, J. C., et al. (1997) The complete genome sequence of the hyperthermophilic, sulphate-reducing archaeon Archaeoglobus fulgidus. Nature 390, 364-370
Koonin, E. V., Altschul, S. F. and Bork, P. (1996) BRCA1 protein products ... Functional motifs... Nat Genet 13, 266-268
Kreil, D. P. and Ouzounis, C. A. (2001) Identification of thermophilic species by the amino acid compositions deduced from their genomes. Nucleic Acids Res 29, 1608-1615
Kunst, F., Ogasawara, N., Moszer, I., Albertini, A. M., Alloni, G., Azevedo, V., Bertero, M. G., Bessieres, P., Bolotin, A., Borchert, S., Borriss, R., Boursier, L., Brans, A., Braun, M., Brignell, S. C., Bron, S., Brouillet, S., Bruschi, C. V., Caldwell, B., Capuano, V., Carter, N. M., Choi, S. K., Codani, J. J., Connerton, I. F., Danchin, A. et al. (1997) The complete genome sequence of the gram-positive bacterium Bacillus subtilis. Nature 390, 249-256
Kyrpides, N., Overbeek, R., and Ouzounis, C. (1999) Universal protein families and the functional content of the last universal common ancestor. J. Mol. Evol. 49, 413-423
Lander, E. S. et al. (2001) Initial sequencing and analysis of the human genome. Nature 409, 860-921
Bibliography
91
Lappe, M., Park, J., Niggemann, O., and Holm, L. (2001) Generating protein interaction maps from incomplete data: application to fold assignment. Bioinformatics 17, S149-S156
Lathe III, W. C., Snel, B., and Bork, P. (2000) Gene context conservation of a higher order than operons. Trends. Biochem. Sci. 25, 474-479
Lawrence, J. G. and Ochman, H. (1998) Molecular archaeology of Escherichia coli genome. Proc. Natl. Acad. Sci. U. S. A. 95, 9413-9417
Leffers, H., Gropp, F.; Lottspeich, F.; Zillig, W. and Garrett, R. A. (1989) Sequence, organization, transcription and evolution of RNA polymerase subunit genes from the archaeabacterial extreme halophiles Halobacterium halobium andHalococcus morrhuae. J. Mol. Biol. 206, 1-17
Lipman, S. A., and Hou, Y. M. (1998) Aminoacylation of tRNA in the evolution of an aminoacyl-tRNA synthase. Proc. Natl. Acad. Sci. U. S. A. 95, 13495-13500
Maidak, B. L., Olsen, G. J., Larsen, N., Overbeek, R., McCaughey, M. J. and Woese, C. R. (1997) The RDP (Ribosomal Database Project). Nucleic Acids Res 25, 109-111
Makarova, K. S., Aravind, L., Galperin, M. Y., Grishin, N. V., Tatusov, R. L., Wolf, Y. I., and Koonin, E. V. (1999) Comparative genomics of the Archaea (Euryarchaeota): evolution of conserved protein families, the stable core, and the variable shell. Genome Res. 9, 608-628
Marcotte, E. M. Pellegrini, M., Ng H. L., Rice, D. W., Yeates, T., O., and Eisenberg D. (1999) Detecting protein function and protein-protein interactions from genome sequences. Science 285, 751-753
McGuire, A. M., Hughes, J. D., and Church, G. M. (2000) Conservation of DNA regulatory motifs and discovery of new motifs in microbial genomes. Genome Res. 10, 744-757
McGuire, A., M., and Church, G. M. (2000) Predicting regulons and their cis-regulatory motifs by comparative genomics. Nucleic Acids Res. 28(22):4523-30
McLysaght, A., Hokamp, K., and Wolfe, K. H. (2002) Extensive genomic duplication during early chordate evolution. Nat Genet, 31, 200-204
Mushegian, A. R., and Koonin, E.V. (1996) Gene order is not conserved in bacterial evolution. Trends Genet. 12, 289-290
Mewes, H. W., Albermann, K., Bahr, M., Frishman, D., Gleissner, A., Hani, J., Heumann, K., Kleine, K., Maierl, A., Oliver, S. G., Pfeiffer, F. and Zollner, A..(1997) Overview of the yeast genome. Nature 387, 7-65
Nelson, K.E., Clayton, R. A., Gill, S. R., Gwinn, M. L., Dodson, R. J., Haft, D. H., Hickey, E. K., Peterson, J. D., Nelson, W. C., Ketchum, K. A., McDonald, L., Utterback, T. R., Malek, J. A., Linher, K. D., Garrett, M. M., Stewart, A. M., Cotton, M. D., Pratt, M. S., Phillips, C. A., Richardson, D., Heidelberg, J., Sutton, G. G., Fleischmann, R. D., Eisen, J. A., Fraser, C. M., et al. (1999) Evidence for lateral gene transfer between Archaea and bacteria from genome sequence of Thermotoga maritima. Nature 399, 323-329.
Ng, W.V., Kennedy, S. P., Mahairas, G. G., Berquist, B., Pan, M., Shukla, H. D., Lasky, S. R., Baliga, N. S., Thorsson, V., Sbrogna, J., Swartzell, S., Weir, D., Hall, J., Dahl, T. A., Welti, R., Goo, Y. A., Leithauser, B., Keller, K., Cruz, R.,
Bibliography
92
Danson, M. J., Hough, D. W., Maddocks, D. G., Jablonski, P. E., Krebs, M. P., Angevine, C. M., Dale, H., Isenbarger, T. A., Peck, R. F., Pohlschroder, M., Spudich, J. L., Jung, K. W., Alam, M., Freitas, T., Hou, S., Daniels, C. J., Dennis, P. P., Omer, A. D., Ebhardt, H., Lowe, T. M., Liang, P., Riley, M., Hood, L., and DasSarma, S. (2000) Genome sequence of Halobacterium species NRC-1. Proc. Natl. Acad. Sci. USA 97, 12176-12181.
Notredame, C., Higgins, D. G. and Heringa, J. (2000) T-Coffee: A novel method for fast and accurate multiple sequence alignment. J Mol Biol 302, 205-217
Ochman, H., Lawrence, J. G., and Groisman, E. A. (2000) Lateral gene transfer and the nature of bacterial innovation. Nature 405, 299-304
Ochman, H. and Jones, I.B. (2000) Evolutionary dynamics of full genome content in Escherichia coli. EMBO J. 19, 6637-6643
Ohno, S. (1970) Evolution by gene duplication. Springer, New York
Olsen, G. J., Woese, C. R., Overbeek, R. (1994) The winds of (evolutionary) change: breathing new life into microbiology. J. Bacteriol. 176, 1-6
Omer, A. D., Lowe, T. M., Russell, A. G., Ebhardt, H., Eddy, S. R. and Dennis, P. P. (2000) Homologs of small nucleolar RNAs in Archaea. Science 288, 517-522
Overbeek, R., Fonstein, M., D'Souza, M., Pusch, G. D., and Maltsev, N. (1998) Use of Contiguity on the Chromosome to Predict Functional Coupling. In Silico Biol. 1, 0009 (http://www.bioinfo.de/isb/1998/01/0009).
Overbeek, R., Fonstein, M., D'Souza, M., Pusch, G. D., and Maltsev, N.(1999) The use of gene clusters to infer functional coupling. Proc. Natl. Acad. Sci. U. S. A. 96, 2896-2901
Overbeek, R., Larsen, N., Pusch, G. D., D'Souza, M., Selkov Jr., E., Kyrpides, N., Fonstein, M., Maltsev, N., and Selkov, E. (2000) WIT: an integrated system for high-throughput genome sequence analysis and metabolic reconstruction. Nucleic Acids Res. 28, 123-125
Page, R. D. (1998) GeneTree: comparing gene and species phylogenies using reconciled trees. Bioinformatics 14, 819-820
Paitan, Y., Boulton, N., Ron, E. Z., Rosenberg, E., and Orr, E. (1998) Molecular analysis of the DNA gyrB gene from Myxococcus xanthus. Microbiology 144, 1641-1647
Park, J., and Teichmann, S. A. (1998) DIVCLUS: an automatic method in the GEANFAMMER package that finds homologous domains in single- and multi-domain proteins. Bioinformatics 4, 144-150
Pearson,W. (1998) Empirical statistical estimates for sequence similarity searches. J. Mol. Biol. 276, 71¯84.
Pellegrini, M., Marcotte, E. M., Thompson, M.J., Eisenberg, D., and Yeates T. O. (1999) Assigning protein functions by comparative genome analysis: protein phylogenetic profiles. Proc. Natl. Acad. Sci. U. S. A. 96, 4285-4288
Pennisi, E. (1999) Is it time to uproot the tree of life? Science 284, 1305-1307
Perna, N. T., Plunkett, G. 3rd, Burland, V., Mau, B., Glasner, J. D., Rose, D. J., Mayhew, G. F., Evans, P. S., Gregor, J., Kirkpatrick, H. A., Posfai, G., Hackett, J.,
Bibliography
93
Klink, S., Boutin, A., Shao, Y., Miller, L., Grotbeck, E. J., Davis, N. W., Lim, A., Dimalanta, E.T., Potamousis, K. D., Apodaca, J., Anantharaman, T. S., Lin, J., Yen, G., Schwartz, D. C., Welch, R. A., and Blattner, F. R. (2001) Genome sequence of enterohaemorrhagic Escherichia coli O157:H7. Nature. 409, 529-533
Ponting, C. P., Schultz, J., Copley, R. R., Andrade, M. A., Bork, P.. (200) Evolution of domain families. Adv Protein Chem 54, 185-244
Qian, J., Luscombe, N. M. and Gerstein, M.(2001) Protein family and fold occurrence in genomes: power-law behaviour and evolutionary model. J Mol Biol 313, 673-681
de Rosa, R., and Labedan, B. (1998) The evolutionary relationships between the two bacteria Escherichia coli and Haemophilus influenzae and their putative last common ancestor. Mol. Biol. Evol. 15, 17-27
Ruepp, A., Graml, W., Santos-Martinez, M. L., Koretke, K. K., Volker, C., Mewes, H. W., Frishman, D., Stocker, S., Lupas, A. N., and Baumeister, W. (2000) The genome sequence of the thermoacidophilic scavenger Thermoplasma acidophilum. Nature 407, 508-513.
Saitou, N., and Nei, M. (1987) The neighbor-joining method: a new method for reconstructing phylogenetic trees. Mol. Biol. Evol. 4, 406-425
Salgado, H., Moreno-Hagelsieb, G., Smith, T. F. and Collado-Vides, J. (2000) Operons in Escherichia coli: genomic analyses and predictions. Proc Natl Acad Sci U S A 97, 6652-6657
Sandberg, R., Winberg, G., Branden, C. I., Kaske, A., Ernberg, I., and Coster, J. (2001) Capturing whole-genome characteristics in short sequences using a naive Bayesian classifier. Genome Res. 11, 1404-1409.
Schultz, J., Milpetz, F., Bork, P., Ponting, C. P. (1998) SMART, a simple modular architecture research tool: identification of signaling domains. Proc. Natl. Acad. Sci. USA 95, 5857-5864
Schwikowski, B., Uetz, P., and Fields, S. (2000) A network of protein-protein interactions in yeast. Nat. Biotechnol. 18, 1257-1261
Shigenobu, S., Watanabe, H., Hattori, M., Sakaki, Y., and Ishikawa, H. (2000) Genome sequence of the endocellular bacterial symbiont of aphids Buchnera sp. APS. Nature. 407, 81-86
Smith, D. R., Doucette-Stamm, L. A., Deloughery, C., Lee, H., Dubois, J., Aldredge, T., Bashirzadeh, R., Blakely, D., Cook, R., Gilbert, K., Harrison, D., Hoang, L., Keagle, P., Lumm, W., Pothier, B., Qiu, D., Spadafora, R., Vicaire, R., Wang, Y., Wierzbowski, J., Gibson, R., Jiwani, N., Caruso, A., Bush, D., Reeve, J. N., et al. (1997) Complete genome sequence of Methanobacterium thermoautotrophicum deltaH: functional analysis and comparative genomics. J Bacteriol 179, 7135-7155
Smith, T. F., and Waterman, M. S. (1981) Identification of common molecular subsequences. J. Mol. Biol. 25, 195-197
Snel, B., Bork, P., and Huynen, M. A. (1999) Genome phylogeny based on gene content. Nat. Genet. 21, 108-110
Snel, B., Bork, P., and Huynen, M. (2000) Genome evolution. Gene fusion versus gene fission. Trends Genet. 6, 9-11
Bibliography
94
Snel, B., Lehmann, G., Bork, P., and Huynen, M. A. (2000) STRING: a web-server to retrieve and display the repeatedly occurring neighbourhood of a gene. Nucleic Acids Res. 28, 3442-3444
Strimmer, K., and A. von Haeseler. 1996. Quartet puzzling: A quartet maximum likelihood method for reconstructing tree topologies. Mol. Biol. Evol. 13, 964-969.
Suh, J. W.; Boylan, S. A.; Oh, S. H. and Price, C. W. (1996) Genetic and transcriptional organization of the Bacillus subtilis spc¯alpha region. Gene 169, 17¯23.
Suyama, M, and Bork, P. (2001) Evolution of prokaryotic gene order: genome rearrangements in closely related species. Trends Genet 17, 10-13
Swayne, D., Buja, A.and, Littman, M., (in press) XGvis: Interactive data visualization with multidimensional scaling. Journal of Computational and Graphical Statistics.
Swofford, D. L. and Olsen, G. J. (1990) Phylogeny construction. In Molecular Systematics(Hillis, D. M. and Moritz, C. eds.), pp. 411-501, Sinauer Associates Inc.
Tamames, J., Casari, G., Ouzounis, C., and Valencia, A. (1997) Conserved clusters of functionally related genes in two bacterial genomes. J. Mol. Evol. 44, 66-73
Tamames, J. Gonzalez-Moreno, M., Mingorance, J., Valencia, A., and Vicente, M. (2001) Bringing gene order into bacterial shape. Trends Genet. 17, 124-126.
Tamames, J. (2001) Evolution of gene order conservation in prokaryotes. Genome Biol. 2, 0020.1-0020.11.
Terai, G., Takagi, T., and Nakai, K. (2001) Prediction of co-regulated genes in Bacillus subtilis on the basis of upstream elements conserved across three closely related species Genome Biol. 2, research0048
Tatusov, R. L., Koonin, E. V., and Lipman, D. J. (1997) A genomic perspective on protein families. Science 278, 631-637
Tatusov, R. L., Mushegian, A. R., Bork P., Brown, N. P., Hayes, W. S., Borodovsky, M., Rudd, K. E., and Koonin, E. V. (1996) Metabolism and evolution of Haemophilus influenzae deduced from a whole-genome comparison with Escherichia coli. Curr. Biol. 6, 279-291
Tatusov, R. L., Natale, D. A., Garkavtsev, I. V., Tatusova, T. A., Shankavaram, U. T., Rao, B. S., Kiryutin, B., Galperin, M. Y., Fedorova, N. D., and Koonin, E.V. (2001) The COG database: new developments in phylogenetic classification of proteins from complete genomes. Nucleic Acids Res. 29, 22-28
Teichmann, S. A., Park, J. and Chothia, C. (1998) Structural assignments to the Mycoplasma genitalium proteins show extensive gene duplications and domain rearrangements. Proc Natl Acad Sci U S A 95, 14658-14663
Teichmann, S. A., and Mitchison, G. (1999) Is there a phylogenetic signal in prokaryote proteins? J. Mol. Evol. 49, 98-107
Teichmann, S. A., Rison, S. C., Thornton, J. M., Riley, M., Gough, J. and Chothia, C. (2001) Small-molecule metabolism: an enzyme mosaic. Trends Biotechnol 19, 482-486
Tekaia, F., Lazcano, A., and Dujon, B. (1999) The genomic tree as revealed from whole
Bibliography
95
proteome comparisons. Genome Res. 9, 550-557
Thoden, J. B.; Raushel, F. M.; Benning, M. M.; Rayment, I. and Holden, H. M. (1999) The structure of carbamoyl phosphate synthetase determined to 2.1 A resolution Acta Crystallogr. D Biol. Crystallogr. 55, 8¯24
Thomas, N. A., Bardy, S. L., and Jarrell, K. F. (2001) The archaeal flagellum: a different kind of prokaryotic motility structure. FEMS Microbiol Rev. 25, 147-174
Thompson, J. D., Higgins, D. G., and Gibson, T. J. (1994) CLUSTAL W: improving the sensitivity of progressive multiple sequence alignment through sequence weighting, position-specific gap penalties and weight matrix choice. Nucleic Acids Res. 22, 4673-4680.
Thompson, J. D., Plewniak, F., Thierry, J., and Poch, O. (2000) DbClustal: rapid and reliable global multiple alignments of protein sequences detected by database searches. Nucleic Acids Res. 28, 2919-2926
Tomb, J. F., White, O., Kerlavage, A. R., Clayton, R. A., Sutton, G. G., Fleischmann, R. D., Ketchum, K. A., Klenk, H. P., Gill, S., Dougherty, B. A., Nelson, K., Quackenbush, J., Zhou, L., Kirkness, E. F., Peterson, S., Loftus, B., Richardson, D., Dodson, R., Khalak, H. G., Glodek, A., McKenney, K., Fitzegerald, L. M., Lee, N., Adams, M. D., Venter, J. C. et al. (1997) The complete genome sequence of the gastric pathogen Helicobacter pylori. Nature 388, 539-547
Tong, A. H., Evangelista, M., Parsons, A. B., Xu, H., Bader, G. D., Page, N., Robison, M., Raghibizadeh, S., Hogue, C. W., Bussey, H., Andrews, B., Tyers, M. and Boone, C. (2001) Systematic genetic analysis with ordered arrays of yeast deletion mutants. Science 294, 2364-2368
Venter, J. C. et al. (2001) The sequence of the human genome. Science 291, 1304-51
Wagner, A. (2001) The yeast protein interaction network evolves rapidly and contains few redundant duplicate genes. Mol. Biol. Evol. 18, 1283-1292
Watanabe, H., Mori, H., Itoh, T., and Gojobori, T. (1997) Genome plasticity as a paradigm of eubacterial evolution. J. Mol. Evol. 44, S57-S64
Watts, D. J., and Strogatz, S. H. (1998) Collective dynamics of 'small-world' networks. Nature 393, 440-442
Winzeler, E. A., Shoemaker, D. D., Astromoff, A., Liang, H., Anderson, K., Andre, B., Bangham, R., Benito, R., Boeke, J. D., Bussey, H., Chu, A. M., Connelly, C., Davis, K., Dietrich, F., Dow, S. W., El Bakkoury, M., Foury, F., Friend, S. H., Gentalen, E., Giaever, G., Hegemann, J. H., Jones, T., Laub, M., Liao, H., Davis, R. W., et al. (1999) Functional characterization of the S. cerevisiae genome by gene deletion and parallel analysis. Science 285, 901-906
Woese, C. (1998) The universal ancestor. Proc. Natl. Acad. Sci. U. S. A. 95, 6854-6859
Wolf, Y. I., Rogozin, I. B., Grishin, N. V., Tatusov, R. L. and Koonin, E.V. (2001) Genome trees constructed using five different approaches suggest new major bacterial clades. BMC Evol Biol 20, 1-8
Wolf, Y. I., Rogozin, I. B., Kondrashov, A. S., and Koonin, E.V. (2001) Genome alignment, evolution of prokaryotic genome organization, and prediction of gene function using genomic context. Genome Res. 11, 356-372
Wu, C. F. J. (1986) Jackknife, bootstrap and other resampling methods in regression
Bibliography
96
analysis. Ann. Stat. 14, 1261-1295
Wuchty, S. (2001) Scale-free behavior in protein domain networks. Mol. Biol. Evol. 18, 1694-1702
Yanai, I., Derti, A., and DeLisi, C. (2001) Genes linked by fusion events are generally of the same functional category: a systematic analysis of 30 microbial genomes. Proc. Natl. Acad. Sci. U. S. A. 98, 7940-7945
Zakharova, N.; Paster, B. J.; Wesley, I.; Dewhirst, F. E.; Berg, D. E. and Severinov, K. V.,(1999) Fused and overlapping rpoB and rpoC genes in helicobacters, campylobacters, and related bacteria. J. Bacteriol. 181, 3857-3859
97
Samenvatting Genen zijn stukjes DNA waarop staat hoe een bepaald eiwit moet worden gemaakt. Elk gen codeert voor een ander eiwit. Al deze eiwitten vormen op hun beurt 95% van de werkzame onderdelen in een levende cel. Niet al het DNA codeert voor een eiwit. Er zijn ook stukken DNA die bijvoorbeeld aangeven hoe het gen moet worden afgelezen, en wanneer. Lange tijd is het technisch slechts haalbaar geweest om, per langdurig onderzoeksproject, het DNA van een enkel gen te achterhalen. Sinds een jaar of zeven is het mogelijk om het complete DNA, en dus alle genen, van een organisme, in kaart te brengen. Het complete DNA van een organisme heet het genoom. Door deze ontwikkeling komt er een uniek soort data beschikbaar. Uniek, omdat het genoom in principe alles in zich heeft wat nodig is om een organisme te bouwen. Men zou zelfs kunnen zeggen dat we nu een complete lijst hebben van de stukjes die op een nog grotendeels ondoorgronde wijze, tezamen en in interactie met de omgeving, de puzzel van het leven vormen. De genoomdata dient in eerste aanleg als een referentiekader voor verder experimenteel moleculair biologisch onderzoek, bijvoorbeeld als een lijst van genen wiens functie nog bepaald moet worden. Maar kunnen we überhaupt iets puur en alleen met genoomdata en indien ja, wat? Om te beginnen, hebben we met die genomen een ongekende hoeveelheid data tot onze beschikking waarmee we de evolutie kunnen bestuderen. Aangezien dit type data relatief nieuw is en er nog erg weinig over genoom evolutie bekend is, betekent dat het in kaart brengen van basis patronen en soms zelfs het ontdekken van de grootheden waarin we genoom evolutie het best kunnen beschrijven. Door het vergelijken van genomen kunnen we iets te weten komen over hoe ze ontstaan zijn. Naast de intrinsieke waarde van deze kennis, creëert dat mede de voorwaarde om complete genoom data effectief te gebruiken. Bijvoorbeeld om de significantie van de afwezigheid van een gen in een bacterie of dier te evalueren. In het algemeen staat de genoomdata ons dus toe om de functies van genen te begrijpen in de context van het genoom en dus alle andere onderdelen van een cel. Biologische processen, en daarom ook hun analyses, vinden op verschillende niveaus plaats. Zelfs het moleculair/genetisch evolutionair niveau is gelaagd. In dit proefschrift beschrijven we de resultaten van uiteenlopende vergelijkende analyses van complete genomen op verschillende van zulke moleculair/genetisch niveaus. We beginnen met een specifieke studie naar een belangrijk probleem in het vergelijken van individuele genen tussen soorten en de biologische significantie die eraan ten grondslag ligt. In de twee daaropvolgende hoofdstukken bestuderen we hoe de verzameling van genen in een genoom evolueert en wat het ons tegelijkertijd vertelt over de evolutie van soorten. In de laatste twee hoofdstukken vergelijken we het genoom als meer dan een verzameling genen zonder onderlinge verbanden, doordat we de interacties tussen genen in een genoom bestuderen. Het experimenteel bepalen van het complete genoom is nu weliswaar haalbaar, maar het is nog steeds niet makkelijk. Daarom zijn in eerste instantie vooral de genomen van kleinere (en dus meestal bacteriële) soorten bepaald. Bovendien zijn genen in het genoom van simpelere organismen (bacteriën) makkelijker te detecteren dan genen in het genoom van hoger ontwikkelde organismen (dieren, planten). Zelfs nu we het genoom van de mens hebben beschreven, is de lijst met menselijke genen nog verre van correct en
Samenvatting
98
compleet. Er zijn momenteel een substantieel aantal genomen van ingewikkeldere organismen beschikbaar, maar historisch en vanwege het gendetectie probleem, houdt het grootste deel van het hier beschreven onderzoek zich bezig met bacteriële genomen. Om genomen goed te kunnen vergelijken moet je bepalen wat dezelfde genen (de orthologen) in een set van genomen zijn. Tijdens ons onderzoek zijn we daar dus veel mee bezig geweest. Een van de problemen daarbij is dat genen nog wel eens willen samensmelten tot een fusie gen (gen fusie) of het omgekeerde dat een gen uiteen valt in twee verschillende genen (gen splitsing). In hoofdstuk 2 worden deze twee evolutionaire processen die al individueel beschreven waren, nu systematisch voor complete genomen in kaart gebracht. Uit onze bestudering blijkt dat gen fusie vaker voorkomt dan gen splitsing. Waarschijnlijk is dit zo omdat het voor een organisme zin heeft om genen die samen functioneren samen te smelten tot één gen. Verder blijkt dat uitééngevallen genen vaker voorkomen bij bacteriën die bij zeer hoge temperaturen leven, zogenaamde thermofiele bacteriën. Gegeven dat bij hogere temperaturen er meer fout gaat per onderdeeltje van een eiwit in het maken van een eiwit, kan de totale opbrengst nog op een redelijk niveau gehouden worden door een eiwit op te splitsen in onderdelen. Wanneer er dan iets fout gaat, hoeft slechts een onderdeel van het eiwit te worden weggegooid in plaats van het geheel. Het gebruik van opgesplitste genen lijkt dus een aanpassing aan de levenswijze bij zeer hoge temperaturen. Het is fascinerend dat de levenswijze van een organisme kennelijk een invloed kan uitoefenen op de evolutie op moleculair niveau. Één van de basis vragen in de bestudering van genomen is wat bepaalt of een gen aanwezig of afwezig is in de genomen van verschillende soorten dieren, planten en bacteriën. Reconstructies van de evolutionaire geschiedenis van individuele genen (de stamboom van het gen), suggereerden dat hun geschiedenis afwijkt van de evolutionaire geschiedenis van de soort uit wiens genoom ze afkomstig zijn (de soortstamboom). Zulk afwijkend gedrag is een indicatie voor genen die in plaats van, van ouders aan nakomelingen overgegeven worden (verticaal), van soort naar soort springen, zogenaamde horizontale gen overdracht. Dit type overdracht van genen speelt bijvoorbeeld een grote rol bij de verspreiding van antibiotica resistentie. De verassende hoeveelheid horizontale gen overdracht suggereerde dat de stamboom van veel genomen niet meer achterhaalbaar zou zijn. In hoofdstuk 3, laten wij echter zien dat het aantal gedeelde genen tussen twee soorten een zeer goede maat is voor hun verwantschap. De stamboom van genomen die we daarbij verkrijgen, vat als het ware de verwantschapsinformatie van een soort samen en die samenvatting lijkt sterk op traditionele stambomen. Één van de bepalende factoren in de genen samenstelling van een soort blijkt dus simpelweg zijn afstamming te zijn, zelfs als lange tijd evolutie heeft kunnen plaatsvinden. Dit verband is zo sterk dat deze zogenaamde “genoom bomen” wellicht kunnen helpen om licht te werpen op betwiste vertakkingen in de stamboom van het leven. De bovengenoemde observatie dat er zoveel genen horizontaal overgedragen worden tussen soorten, heeft er toe geleid dat er is voorgesteld dat er überhaupt niet van een stamboom van soorten gesproken kan worden, maar veeleer van een netwerk. Alleen door middel van het kiezen van een enkel gen als stamboom voor de soort (pars pro toto), of met een nog te definiëren meer dan som van de delen, zouden we nog verwantschappen kunnen definiëren. Ons resultaat suggereert dat daartussen in, namelijk de som der delen, een verdedigbaar concept voor een stamboom is. We besluiten dit hoofdstuk met de beschrijving van een web server die allerlei wetenschappers (en dus niet alleen degenen met voldoende computer capaciteit en adequate kennis van zaken) in staat stelt voor een selectie van soorten naar keuze en op basis van verschillende
Samenvatting
99
vooronderstellingen over genoom evolutie, een genoom stamboom te maken. Het feit dat de aanwezigheid van genen zich evolutionair redelijk aan de soortstamboom houdt, zoals we in hoofdstuk 3 beschrijven, biedt ons in hoofdstuk 4 de mogelijkheid om de aanwezigheid van genen in huidige organismen te gebruiken om voorouderlijke genomen te reconstrueren. Daarbij bepalen we tegelijkertijd de processen die in de evolutie van voorouderlijke naar hedendaagse genomen plaatsvonden. We bestuderen de volgende genoom muterende processen: het verlies van genen, de duplicatie van genen, het ontstaan van nieuwe genen, het fuseren of uiteenvallen van genen, en het springen van een gen van een soort naar een andere soort (horizontale gen overdracht). Het is voor het eerst dat er met een integrale benadering naar genoom evolutie is gekeken. Zo vinden we bijvoorbeeld dat de voorouder van de proteobacteriën (een veel voorkomende en geneeskundig zowel als economisch belangrijke bacteriële orde) waarschijnlijk rond de 2500 genen bevatte. Ook blijkt dat alhoewel horizontale gen overdracht nodig is om de gen inhoud van hedendaagse genomen op een redelijke manier te verklaren, al de andere processen kwantitatief belangrijker zijn geweest. Het verlies van genen heeft van alle processen die de gen inhoud beïnvloeden, het vaakst plaats gevonden. Gen verlies is zo wijdverspreid (zowel over tijd als over soorten) dat zelfs grotere genomen zoals bijvoorbeeld die van Escherichia coli (een proteobacterie en één van de werkpaarden van de moleculaire biologie), meer dan 950 genen is kwijtgeraakt in zijn geschiedenis vanaf de oer-proteobacterie. Als we genomen willen bestuderen op een hoger niveau, zeg maar als meer dan alleen een “zak van genen” zonder enige samenhang, moeten we verbanden tussen genen analyseren. Een van de meest basale verbanden tussen genen is hun volgorde op de DNA ketting. Die volgorde blijkt zeer snel te evolueren. Dat wil zeggen dat na evolutionair relatief korte tijden er slechts nog zeer weinig van de oorspronkelijke volgorde van de genen intact is. Interessant genoeg blijkt dat die genen wiens volgorde naast elkaar behouden blijft, een zeer goede voorspeller te zijn voor een functioneel verband tussen beide genen: de eiwitten die beide genen produceren hebben een interactie met elkaar. De reden hiervoor is dat naast elkaar liggen iets betekent voor de cel omdat veel bacteriën operons hebben. Operons zijn naast elkaar liggende genen, wiens activiteit als een geheel aangestuurd wordt. Voor veel genen is het niet, of slechts ten dele, bekend wat hun functie is. Aanwijzingen voor de functie van genen zijn dus zeer welkom. Het bestuderen van de conservering van de genen volgorde is een belangrijk instrument aan het worden om de functionele relaties tussen genen en daarmee de bijbehorende eiwitten te voorspellen. Daarom beschrijven wij in hoofdstuk 5 een web-server om de geconserveerde volgorde van genen te bepalen. In de beschreven versie zijn we in staat om voor ±40% van de genen een functionele relatie door middel van geconserveerde genen volgorde te vinden. We illustreren het gebruik aan de hand van een enzym waarvan wel bekend is wat voor een soort reactie het katalyseert maar niet wat zijn substraat is. Door middel van de conservering met andere genen kunnen we nu een goed gefundeerde voorspelling maken over wat het substraat van het enzym is. Met de exponentieel toenemende hoeveelheid genomen, en de met gelijke tred toenemende hoeveelheid functionele relaties tussen genen, ontstaat de situatie dat alle eiwitten indirect iets met alle andere eiwitten te maken hebben. We krijgen dus te maken met biologische netwerken met als knooppunten genen, en als verbindingen functionele verbanden tussen genen. In hoofdstuk 6 bestuderen we daarom een eiwit-eiwit interactie netwerk zoals we het verkrijgen uit onze voorspellingen van functionele relaties door
Samenvatting
100
middel van geconserveerde gen volgorde. Het netwerk blijkt lokaal een hoge clusteringgraad te bezitten. Om ook daadwerkelijk clusters in het netwerk te herkennen, knippen we het netwerk stuk. Er wordt geknipt langs genen die, als je ze weg zou halen, het netwerk lokaal in twee of meer stukken zou laten vallen. Uit het vergelijken van de uitgeknipte clusters van genen met een databank van functies, blijkt dat de genen, waarvan de functie reeds bekend is, in zo’n cluster met elkaar een functie uitoefenen, zoals bijvoorbeeld een metabolisch route, of een cellulaire bouwsteen als een zweepstaartje. We kunnen dus nu door middel van genoom vergelijkingen, groepjes van genen onderscheiden die op een hoger niveau een functionele eenheid in de cel vormen, een zogenaamde “functionele module”. Tenslotte, kunnen we dus concluderen dat we veel kennis hebben vergaard door middel van de vergelijkende analyse van genomen. Ten eerste hebben we nu een basis idee van hoe genomen evolueren wat betreft hun samenstelling aan genen en de volgorde van die genen. Bovendien begint het er, na aanvankelijk pessimisme, op te lijken dat de genoomdata ons inzicht in de stamboom en oorsprong van het leven zal vergroten. Ten tweede, stelt dit begrip van de evolutie van genomen ons in staat om betere voorspellingen te doen over de functies van genen en de functionele relaties tussen genen. De methodes zoals we die hier toepassen op het netwerk van functionele relaties verkregen uit gen volgorde, kunnen ook toegepast worden op een nieuwe golf van data. Veel nieuwe grootschalige moleculair biologische experimenten zijn namelijk speciaal ontwikkeld om allerhande functionele relaties tussen genen te meten. Een deel van de verkregen vaardigheden en vergaarde kennis is ook nog eens omgezet in web-servers die het wetenschapsproces in het algemeen helpen en hopelijk versnellen.
101
Curriculum Vitae Berend Snel werd geboren op 20 juli 1975 te Zevenhuizen (ZH). Vanaf augustus 1987 was hij leerling aan het Gymnasium Haganum te Den Haag, waar hij in juni 1993 het Gymnasium diploma bepaalde. In September van datzelfde jaar begon hij aan de studie biologie. Het propedeutisch examen werd in juli 1994 gehaald met het predikaat cum laude. Hij verrichtte afstudeer onderzoek bij achtereenvolgens Dr. R. Verlinde en Prof. Dr. Ir. W.A. van de Grind van de vakgroep vergelijkende fysiologie, Universiteit Utrecht; Dr. R. J. de Boer en Prof. Dr. P. Hogeweg van de vakgroep theoretische biologie en bioinformatica, Universiteit Utrecht; en bij Dr. M. A. Huynen en Dr. P. Bork van de biocomputing unit in het European Molecular Biology Laboratory, Heidelberg. In augustus 1998 slaagde hij voor het doctoraal examen biologie. In september 1998 begon bij als promotie onderzoeker in de groep van Peer Bork op het European Molecular Biology Laboratory. Onder begeleiding van Martijn Huynen, Peer Bork en Paulien Hogeweg, verrichtte hij daar onderzoek waarvan de belangrijkste resultaten staan beschreven in dit proefschrift. Sinds 1 mei is hij werkzaam als postdoc bij het Nijmegen Center for Life Sciences en het Centre for Moleculair and Biomoleculair Informatics.

103
Publications von Mering, C., Krause, R., Snel, B., Cornell, M., Oliver, S. G., Fields, S. & Bork, P. (2002). Comparative assessment of large-scale data sets of protein-protein interactions. Nature, 417, 399-403 Snel, B., Bork, P. & Huynen, M. A. (2002). The identification of functional modules from the genomic association of genes. Proc. Natl. Acad. Sci. USA, 99, 5890-5895 Korbel, J.O.+, Snel, B.+, Huynen, M. A. & Bork, P. (2002). SHOT: a web server for the construction of genome phylogenies. Trends Genet., 18, 158-162 + These authors contributed equally. Snel, B., Bork, P. & Huynen, M. A. (2002). Genomes in Flux: The Evolution of Archaeal and Proteobacterial Gene Content Genome Res., 12, 17-25 Huynen, M. A., Snel, B., Bork, P. & Gibson, T. J. (2001). The phylogenetic distribution of frataxin indicates a role in iron-sulfur cluster protein assembly. Hum. Mol. Genet., 10, 2463-2468 Huynen, M. A., Snel, B. & Bork, P. (2001). Inversions and the dynamics of eukaryotic gene order. Trends Genet., 17, 304-306 Lathe III, W. C., Snel, B. & Bork, P. (2000). Gene context conservation of a higher order than operons. Trends Biochem. Sci., 25, 469-474 Bork, P., Snel, B., Lehmann, G., Suyama, M., Dandekar, T., Lathe III, W. & Huynen, M. A. (2000). Comparative genome analysis: exploiting the context of genes to infer evolution and predict function. In: Comparative Genomics, emprical and analytical approaches to gene order dynamics, map alignment and the evolution of gene families, Computational biology series volume 1. 281-294 (Editors: Sankoff, D., & Nadeau, J. H.) Kluwer academic publishers Snel, B., Lehmann, G., Bork, P. & Huynen, M. A. (2000). STRING: A web-server to retrieve and display the repeatedly occurring neighbourhood of a gene. Nucleic Acids Res., 28, 3442-3444 Dandekar, T., Huynen, M., Regula, J. T., Ueberle, B., Zimmermann, C. U., Andrade, M. A., Doerks, T., Sanchez-Pulido, L., Snel, B., Suyama, M., Yuan, Y. P., Herrmann, R. & Bork, P. (2000). Re-annotating the Mycoplasma pneumoniae genome sequence: adding value, function and reading frames. Nucleic Acids Res., 28, 3278-3288 Huynen, M. A., Snel, B., Lathe III, W. & Bork, P. (2000). Predicting protein function by genomic context: quantative evaluation and qualitative inferences Genome Res., 10, 1204-1210 Huynen, M. A., Snel, B., Lathe III, W. & Bork, P. (2000). Exploitation of gene context. Curr. Opin. Struct. Biol., 10, 366-370
104
Huynen, M. A. & Snel, B. (2000). Gene and context: integrative approaches to genome analysis. Adv. Prot. Chem., 54, 345-380 Snel, B., Bork, P. & Huynen, M. A. (2000). Genome evolution: gene fusion versus gene fission. Trends Genet., 16, 9-11 Huynen, M. A., Snel, B. & Bork, P. (1999). Lateral Gene Transfer, Genome Surveys, and the Phylogeny of Prokaryotes Science, 286, 1443a (in Technical Comments) Dandekar, T., Schuster, S., Snel, B., Huynen, M. A. & Bork, P. (1999). Pathway alignment: application to the comparative analysis of glycolytic enzymes. Biochem J., 343, 115-124 Bork, P., Doerks, T., Springer, T.A. & Snel,B. (1999). Domains in plexins: links to integrins and transcription factors. Trends Biochem. Sci, 24, 261-263 Bork, P., Dandekar, T., Snel, B. & Huynen, M. A. (1999Genome Comparsions to Monitor Molecular Evolution. In: Microbial Evolution and Infection. 80-92 (Goebel, U.B., Ruf, B.R.) Einhorn-Presse Verlag Reinbek Snel, B., Bork, P. & Huynen, M. A. (1999). Genome phylogeny based on gene content. Nature Genet., 21, 108-110 Dandekar, T., Snel, B., Huynen, M. A. & Bork, P. (1998). Conservation of gene order: a fingerprint of proteins that physically interact. Trends Biochem. Sci., 23, 324-328
105
Dankwoord In de eerste plaats wil ik Peer, Martijn en Paulien bedanken, omdat zij mij aan een stage hebben geholpen waardoor ik überhaupt aan een promotie ben gaan denken. Daarna hebben Peer en Martijn mij ook nog eens een unieke promotie plek aangeboden waarvan het resultaat hier dus voor u ligt. Ik wil Paulien bedanken voor de begeleiding op afstand en het direct al willen optreden als promotor. I want to thank Peer for his relentless enthusiasm, competitiveness, salesmanship and persistency. En Martijn natuurlijk bedankt in zijn rol, als kamergenoot, als wetenschappelijke mentor, als mede-nederlander in het buitenland met dezelfde (sport)nieuws verslaving, als begeleider en dus nu als één van de twee promotoren. I want to thank all the people from the Bork group for being there, playing Quake, and in general creating a very exiting, diverse and critical scientific atmosphere. I enjoyed sharing room V102 at one time or another with Jan, Ivica, Steffen and Thomas. I want to thank Jens, Johnny, Christine and Sean, with whom I, despite their opinion of members of the Bork group, still had fun. Ik wil alle vrienden bedanken voor het niet van de aardbodem verdwijnen terwijl ik dat wel deed. Alle familie bedankt voor morele en andersoortige steun: Betty, Henk, en Harmen bedankt voor een gezellige Haagse thuisbasis; Dick en Anneke voor het regelmatige bezoek en het zes keer rijden voor verhuizen; Gerard, Ria en Arno voor het helpen met verhuizen en de Zeeuwse bevoorrading. Tenslotte wil ik Gitty bedanken: door eerst samen met mij naar Duitsland te emigreren, daarna vrijwel elk weekend 11 elf uur te treinen, en nog vele andere zaken, heb jij mij zeer veel steun en liefde gegeven.

"All the work was performed by using ad hoc PERL scripts (13)." Uit: Salgado, H. et al. (2000) Proc. Natl. Acad. Sci. USA 97, 6652-6657.