CNOOC (00883 HK) (25) · important level of US$60/bbl in the short-to-medium term. Meanwhile, we...
6
See the last page for disclaimer Page 1 of 6 Equity Research Equity Research Report Company Report 股 票 研 究 公 司 报 告 证 券 研 究 报 告 石 化 行 业 Petrochemicals Sector 中 国 海 洋 石 油 CNOOC (00883 HK) Company Report: CNOOC (00883 HK) Peter Shao 邵俊樨 (852) 2509 5464 公司报告:中国海洋石油 (00883 HK) [email protected] 21 November 2019 Growth Story Reinforced, Maintain "Buy" 增长剧情得以强化,维持“买入” Recently, concerns on crude oil demand due to rising protectionism have compounded by growing fears over supply surges amid a wave of new projects set to come online in 2020 in Norway and Brazil, but we maintain our view that Brent crude will remain resilient near the psychologically important level of US$60/bbl in the short-to-medium term. Meanwhile, we argue that the market could potentially underestimate the supply risks in the Middle East. CNOOC continued to deliver on-track operational results in 3Q19. During 3Q19, total O&G production increased by 9.7% yoy to 124.8 mmboe, in part aided by more favourable weather conditions; Capex increased by 27.9% yoy to RMB19.5 billion, and 1-9M19 capex reached 71% of the mid-point of the FY19 budget range. Given the current momentum, FY19 production could exceed the upper end of the management’s guidance range. The Company also has promising green-field projects, both domestically and overseas, to support its 3-year production growth strategy. We adjust our 2019-2021 earnings estimates by 3.6%/ -0.5%/ -1.4% to RMB60,934 million/ RMB68,202 million/ RMB76,481 million, respectively. Our adjustments reflect 1) higher production estimates and 2) updated FX assumptions. Our oil price and all-in cost assumptions remain unchanged. We maintain our investment rating of "Buy" and our TP of HK$14.00. Our TP corresponds to 2019-2021 P/E of 9.2x/ 8.2x/ 7.4x, respectively, representing a 25.7% discount to our DCF-derived NAV of HK$18.84/share. 近期随着挪威和巴西一系列新项目将于 2020 年投产,市场不仅对贸易保护主义抬头形势 下的原油需求存在担忧,还愈发担心供给激增问题,但我们仍维持此前对油价的看法,即 中短期内布油在 60 美元每桶的重要心理关口价位附近具有一定韧性。同时,我们认为中 东供应风险或存在被市场低估的潜在可能。 中海油于 2019 年第 3 季度再度实现如期运营业绩。季度内油气总产量同比增长 9.7%至 1.248 亿桶油当量,一定程度上受益于较好天气环境;资本开支同比增长 27.9%至人民币 195 亿元,而前 9 个月资本开支则达到全年预算中间值的 71%。基于目前趋势,2019 财年 产量有望超越管理层指引上限。此外,公司在国内及海外亦有许多颇具前景的新项目来支 持其 3 年增产计划。 我们分别调整 2019-2021 年盈利预测 3.6%/-0.5%/-1.4%至人民币 609.34 亿元/人民币 682.02 亿元/人民币 764.81 亿元。此次调整反映了我们对产量更乐观的估计以及更新后的 外汇假设。我们对油价和桶油成本的假设维持不变。 我们维持“买入”的投资评级以及 14.00 港元的目标价。 我们的目标价分别对应 9.2 倍/8.2 倍/7.4 倍 2019-2021 年市盈率,且较我们用折现现金流方法得出的 18.84 港元每股的估值 有 25.7%的折让。 Rating: Buy Maintained 评级: 买入 (维持) 6-18m TP 目标价: HK$14.00 Revised from 原目标价: HK$14.00 Share price 股价: HK$11.680 Stock performance 股价表现 [Table_PriceChange] Change in Share Price 股价变动 1 M 1 个月 3 M 3 个月 1 Y 1 年 Abs. % 绝对变动 % (2.7) 0.7 (8.2) Rel. % to HS Index 相对恒指变动 % (1.7) (0.1) (10.1) Avg. share price(HK$) 平均股价(港元) 12.1 11.9 12.4 Source: Bloomberg, Guotai Junan International. [Table_ Year End Turnover Net Profit EPS EPS PER BPS PBR DPS Yield ROE 年结 收入 股东净利 每股净利 每股净利变动 市盈率 每股净资产 市净率 每股股息 股息率 净资产收益率 12/31 (RMB m) (RMB m) (RMB) (△ %) (x) (RMB) (x) (RMB) (%) (%) 2017A 186,390 24,677 0.550 3,828.6 19.6 8.510 1.3 0.368 3.1 6.5 2018A 226,963 52,688 1.180 114.5 9.1 9.346 1.2 0.527 4.4 13.2 2019F 237,017 60,934 1.365 15.7 7.9 10.180 1.1 0.531 4.4 14.0 2020F 255,705 68,202 1.528 11.9 7.0 11.093 1.0 0.614 5.1 14.4 2021F 282,123 76,481 1.713 12.1 6.3 12.118 0.9 0.687 5.7 14.8 Shares in issue (m) 总股数 (m) 44,647.5 Major shareholder 大股东 CNOOC 64.4% Market cap. (HK$ m) 市值 (HK$ m) 521,482.3 Free float (%) 自由流通比率 (%) 35.6 3 month average vol. 3 个月平均成交股数 (‘000) 50,181.5 FY19 Net gearing (%) FY19 净负债/股东资金 (%) 28.9 52 Weeks high/low (HK$) 52 周高/低 (HK$) 15.140 / 10.740 FY19 Est. NAV (HK$) FY19 每股估值(港元) 18.8 Source: the Company, Guotai Junan International. (25) (20) (15) (10) (5) 0 5 10 15 20 25 % change HSI CNOOC
Transcript of CNOOC (00883 HK) (25) · important level of US$60/bbl in the short-to-medium term. Meanwhile, we...
See the last page for disclaimer Page 1 of 6
Eq
uit
y R
ese
arc
h
Eq
uit
y R
ese
arc
h R
ep
ort
证 券
研 究
报 告
Co
mp
an
y R
ep
ort
股
票
研
究
公
司
报
告
证
券
研
究
报
告
[Tab
le_I
nfo1
]
石
化
行
业
Pe
tro
ch
em
ica
ls S
ec
tor
[Tab
le_I
nfo2
] 中
国
海
洋
石
油
CN
OO
C (
00
88
3 H
K)
[Table_Title] Company Report: CNOOC (00883 HK)
Peter Shao 邵俊樨
(852) 2509 5464
公司报告: 中国海洋石油 (00883 HK) [email protected]
21 November 2019
[Table_Summary] Growth Story Reinforced, Maintain "Buy"
增长剧情得以强化,维持“买入” Recently, concerns on crude oil demand due to rising protectionism have
compounded by growing fears over supply surges amid a wave of new
projects set to come online in 2020 in Norway and Brazil, but we maintain
our view that Brent crude will remain resilient near the psychologically
important level of US$60/bbl in the short-to-medium term. Meanwhile, we
argue that the market could potentially underestimate the supply risks in the
Middle East.
CNOOC continued to deliver on-track operational results in 3Q19. During
3Q19, total O&G production increased by 9.7% yoy to 124.8 mmboe, in part
aided by more favourable weather conditions; Capex increased by 27.9% yoy
to RMB19.5 billion, and 1-9M19 capex reached 71% of the mid-point of the
FY19 budget range. Given the current momentum, FY19 production
could exceed the upper end of the management’s guidance range. The
Company also has promising green-field projects, both domestically and
overseas, to support its 3-year production growth strategy.
We adjust our 2019-2021 earnings estimates by 3.6%/ -0.5%/ -1.4% to
RMB60,934 million/ RMB68,202 million/ RMB76,481 million, respectively.
Our adjustments reflect 1) higher production estimates and 2) updated FX
assumptions. Our oil price and all-in cost assumptions remain unchanged.
We maintain our investment rating of "Buy" and our TP of HK$14.00.
Our TP corresponds to 2019-2021 P/E of 9.2x/ 8.2x/ 7.4x, respectively,
representing a 25.7% discount to our DCF-derived NAV of HK$18.84/share.
近期随着挪威和巴西一系列新项目将于 2020 年投产,市场不仅对贸易保护主义抬头形势
下的原油需求存在担忧,还愈发担心供给激增问题,但我们仍维持此前对油价的看法,即
中短期内布油在 60 美元每桶的重要心理关口价位附近具有一定韧性。同时,我们认为中
东供应风险或存在被市场低估的潜在可能。
中海油于 2019 年第 3 季度再度实现如期运营业绩。季度内油气总产量同比增长 9.7%至
1.248 亿桶油当量,一定程度上受益于较好天气环境;资本开支同比增长 27.9%至人民币
195 亿元,而前 9 个月资本开支则达到全年预算中间值的 71%。基于目前趋势,2019 财年
产量有望超越管理层指引上限。此外,公司在国内及海外亦有许多颇具前景的新项目来支
持其 3 年增产计划。
我们分别调整 2019-2021 年盈利预测 3.6%/-0.5%/-1.4%至人民币 609.34 亿元/人民币
682.02 亿元/人民币 764.81 亿元。此次调整反映了我们对产量更乐观的估计以及更新后的
外汇假设。我们对油价和桶油成本的假设维持不变。
我们维持“买入”的投资评级以及 14.00 港元的目标价。我们的目标价分别对应 9.2 倍/8.2
倍/7.4 倍 2019-2021 年市盈率,且较我们用折现现金流方法得出的 18.84 港元每股的估值
有 25.7%的折让。
[Table_Rank] Rating: Buy
Maintained
评级: 买入 (维持)
[Table_Price] 6-18m TP 目标价: HK$14.00
Revised from 原目标价: HK$14.00
Share price 股价: HK$11.680
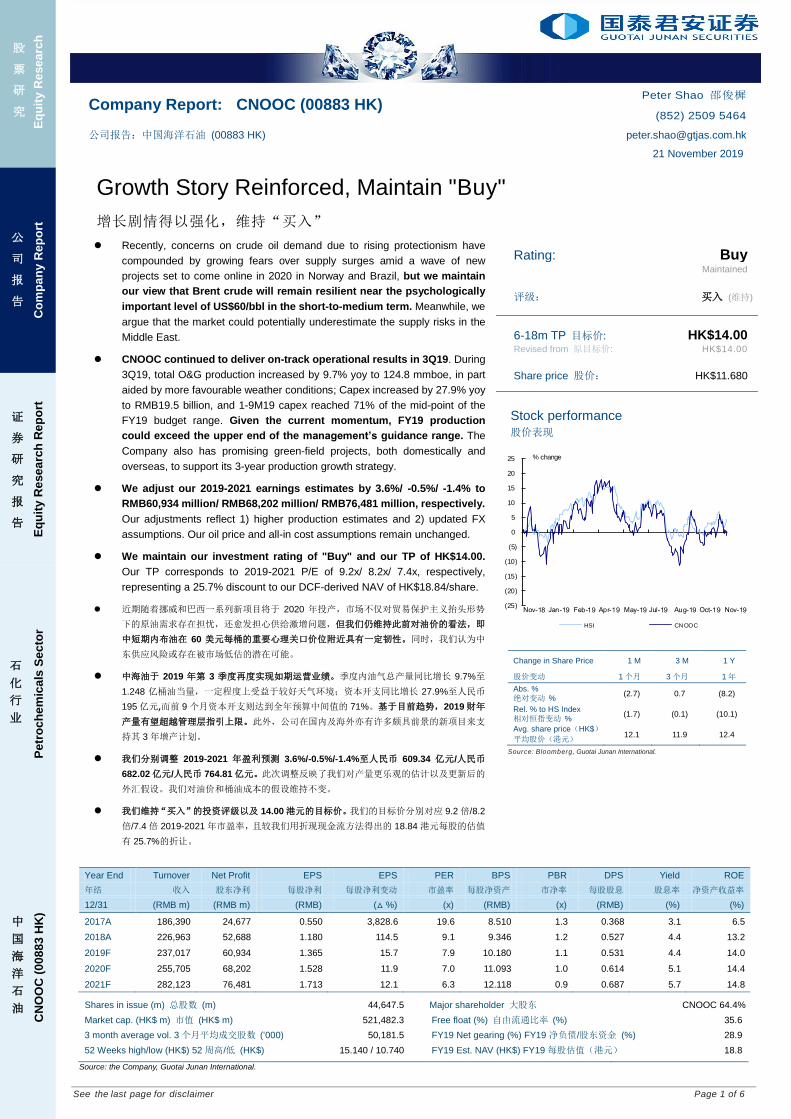
Stock performance
股价表现
[Table_QuotePic]
[Table_PriceChange] Change in Share Price
股价变动
1 M
1 个月
3 M
3 个月
1 Y
1 年
Abs. %
绝对变动 % (2.7) 0.7 (8.2)
Rel. % to HS Index
相对恒指变动 % (1.7) (0.1) (10.1)
Avg. share price(HK$)
平均股价(港元) 12.1 11.9 12.4
Source: Bloomberg, Guotai Junan International.
[Table_Profit] Year End Turnover Net Profit EPS EPS PER BPS PBR DPS Yield ROE
年结 收入 股东净利 每股净利 每股净利变动 市盈率 每股净资产 市净率 每股股息 股息率 净资产收益率
12/31 (RMB m) (RMB m) (RMB) (△ %) (x) (RMB) (x) (RMB) (%) (%)
2017A 186,390 24,677 0.550 3,828.6 19.6 8.510 1.3 0.368 3.1 6.5
2018A 226,963 52,688 1.180 114.5 9.1 9.346 1.2 0.527 4.4 13.2
2019F 237,017 60,934 1.365 15.7 7.9 10.180 1.1 0.531 4.4 14.0
2020F 255,705 68,202 1.528 11.9 7.0 11.093 1.0 0.614 5.1 14.4
2021F 282,123 76,481 1.713 12.1 6.3 12.118 0.9 0.687 5.7 14.8
[Table_BaseData] Shares in issue (m) 总股数 (m) 44,647.5 Major shareholder 大股东 CNOOC 64.4%
Market cap. (HK$ m) 市值 (HK$ m) 521,482.3 Free float (%) 自由流通比率 (%) 35.6
3 month average vol. 3 个月平均成交股数 (‘000) 50,181.5 FY19 Net gearing (%) FY19 净负债/股东资金 (%) 28.9
52 Weeks high/low (HK$) 52 周高/低 (HK$) 15.140 / 10.740 FY19 Est. NAV (HK$) FY19 每股估值(港元) 18.8
Source: the Company, Guotai Junan International.
(25)
(20)
(15)
(10)
(5)
0
5
10
15
20
25 % change
HSI CNOOC

Co
mp
an
y R
ep
ort
See the last page for disclaimer Page 2 of 6
[Table_RightMar1]
21
No
ve
mb
er
20
19
[Table_RightMar2]
CN
OO
C 中
国海
洋石
油 (0
08
83
HK
)
[Table_PageHeader] CNOOC (00883 HK)
Oil Market Review
While the major trends in global oil markets as identified in our last Company Report on 9th Oct. remain relevant, some
emerging conditions are worth discussing. Recently, concerns over crude oil demand due to rising protectionism have been
compounded by growing fears over supply surge amid a wave of new projects set to come online in 2020 in Norway and Brazil.
To tackle economic slowdown, global central banks continue their rate-cutting frenzy, but ultimately low interest rates are no
panacea for bad trade decisions. Currently, the US and China are working to finalise the phase one deal, but optimism that an
agreement can be reached soon has faded in recent days as US President Trump dismissed Beijing’s claim that the US is ready
to roll back tariffs. We expect continued uncertainties in the US-China trade dispute despite recent progress, since both countries
remain divided on several key issues, which are beyond the scope of the phase one deal. Meanwhile, we expect global oil
markets to continue to experience turbulence amid uncertainties and fears, and the root cause is more of a political nature rather
than an economic one.
The recent domestic turmoil in Iran and pro-Iran countries in the wake of the US’s "maximum pressure campaign" could
potentially drive up supply risk in the Middle East. The recent protest in Iran, triggered by the government’s decision to cut
fuel subsidy, may prove that the US’s ‘toughest ever sanctions’ have stretched the Iranian economy to its limit. But the side
effects could be severe too. Iran could opt to resume its aggressive campaign, which undermines regional energy safety, to
obtain leverage for negotiation with the US. Despite a series of tension-heightening events in the Middle East, there is an
absence of sustaining geopolitical premium over oil prices. We argue that the lack of a sustaining premium could merely reflect
the market’s incompetency and overconfidence in assessing black swan events, to which most people have limited information or
knowledge. Therefore, we are cautious about the supply disruption risk in the Middle East.
We maintain our view that there is support for Brent crude at near US$60/bbl in the short-to-medium term. Brent crude oil
prices averaged US$64.1/bbl YTD, and averaged US$61.0/bbl since our last Company Report on 9th Oct. We do not expect
Brent crude oil prices to plunge significantly below the psychologically important level of US$60/bbl in the short-to-medium term,
based on 1) strong OPEC compliance and the cartel’s intention to further sustain and deepen the cut; 2) a loosening monetary
and fiscal policy environment in major economies to battle economic slowdown; 3) more upside in the current US-China trade
scenario despite uncertainties; and 4) potentially underestimated supply risk in the Middle East. The major downside risks to oil
prices include worse-than-expected outcomes in the US-China trade dispute and Brexit, and faster-than-expected supply growth
from non-OPEC countries, particularly in Norway and Brazil.
Figure-1: Brent vs. WTI Prices and Spread Figure-2: Non-OPEC Oil Supply Growth, yoy
Source: Bloomberg. Source: IEA.
3Q19 Operational Results Review
CNOOC (the "Company") delivered another quarter of on-track operational results. In 3Q19, the Company achieved total
oil and gas (O&G) production of 124.8 mmboe, up 9.7% yoy, benefiting from more favourable weather conditions during the
quarter. With 1-3Q19 O&G production reaching 75.8% of the mid-point of the Company’s FY19 production target range, the
Company’s management is confident that full-year production can reach or even exceed the target range’s upper boundary (490
(10)
(5)
0
5
10
15
20
20
40
60
80
100
2016 2017 2018 2019
Brent-WTI Spread (RHS) Brent WTI
US$/bbl US$/bbl
-0.5
0.0
0.5
1.0
1.5
2.0
2.5
3.0
2018 2019 2020
mb/d
US Canada Brazil Norway Others Net

Co
mp
an
y R
ep
ort
See the last page for disclaimer Page 3 of 6
[Table_RightMar1]
21
No
ve
mb
er
20
19
[Table_RightMar2]
CN
OO
C 中
国海
洋石
油 (0
08
83
HK
)
[Table_PageHeader] CNOOC (00883 HK)
mmboe). 3Q19 total O&G sales was RMB4,834 mn, up 0.8% yoy, thanks to increased O&G production but largely offset by
lower average realised O&G prices. During the quarter, average realised oil price was down 14.9% yoy to US$60.89/bbl, while
average realised gas prices decreased 8.8% yoy to US$5.70/mcf. All-in cost per boe during 3Q19 was kept at the same level as
in 1H19, according to CNOOC’s management during the results conference call.
3Q19 capex was up 27.9% to RMB19.5 billion, as the Company continued to execute its growth strategy. 1-3Q19 capex
was up 46.8% yoy to RMB53.2 billion, reaching 71% of the mid-point of the FY19 budget. The Company’s management expects
FY19 capex to reach the guidance range of RMB70-80 billion. Our model implies 2019 net cash from operating activities of
RMB136.2 billion for CNOOC, sufficient to support the Company’s FY19 capex budget. In addition, during the results
conference call, CNOOC’s management stated that the recently completed acquisition of CUCBM, which was valued at
approximately RMB5.335 billion, should be viewed separately from the Company’s FY19 capex guidance.
Table-1: CNOOC’s Operational Statistics
3Q19 Δ yoy (%) 1-3Q2019 Δ yoy (%)
Oil and gas sales (RMB mn) 48,336 0.8 142,619 3.2
Oil and gas production (mmboe) 124.8 9.7 367.8 4.5
- Crude and liquids (mmbbls) 100.3 10.1 299.3 4.9
- Natural gas (bcf) 142.5 8.2 397.0 2.2
Capex (RMB bn) 19.5 27.9 53.2 46.8
Average realised oil price (US$/bbl) 60.89 -14.9 63.32 -7.8
Average realised gas price (US$/mcf) 5.70 -8.8 6.19 -2.7
Source: the Company, Guotai Junan International
Table-2: CNOOC’s New Projects in 2019
Project Location Status Expected
Startup
Peak Production
(boe/d)
Working
Interests
Egina oil field Nigeria Commenced
production 1H19 200,000 45%
Huizhou 32-5 oil field comprehensive
adjustment/Huizhou 33-1 oil field joint
development project
Eastern South
China Sea
Commenced
production 1H19 19,200 100%
Bozhong 34-9 oil field Bohai Offshore
commissioning 1H19 22,500 100%
Appomattox project US GoM Commenced
production 2H19 175,000 21%
Caofeidian 11-1/11-6 comprehensive
adjustment project Bohai
Offshore
commissioning 2H19 28,700 51%~60%
Wenchang 13-2 comprehensive
adjustment project
Western South
China Sea
Offshore
commissioning 2H19 11,500 100%
Source: the Company.
CNOOC is likely to beat its FY19 production target, given its current momentum. If assuming a moderate 4Q19 production
growth rate of 2.1%, the same speed achieved in 1H19 without the help of favourable weather conditions, the Company’s
full-year production will exceed the upper boundary of the management’s target range by around 3mmboe. In the beginning of
2019, CNOOC announced its strategic plan to increase production by a CAGR of 4.4% over the next three years. The Company
has since made its growth story more convincing by delivering yoy production growth of 4.5% during the past three quarters.
Meanwhile, the Company also has promising green-field projects, notably in Norway (Liza), Brazil (Libra) and China’s Bohai
(Bozhong 19-6/29-6), to support its 3-year growth plan. Yet, we argue that as CNOOC is still in the early stage of its 3-year growth
plan, a considerable gap between the Company’s true upside and market expectations could still exist.
Forecast Revisions and Valuation
We adjust our 2019-2021 earnings estimates by 3.6%/ -0.5%/ -1.4% to RMB60,934 mn/ RMB68,202 mn/ RMB76,481 mn,
respectively. Our adjustments reflect 1) a more optimistic assumption that the Company will slightly exceed the upper boundary
Co
mp
an
y R
ep
ort
See the last page for disclaimer Page 4 of 6
[Table_RightMar1]
21
No
ve
mb
er
20
19
[Table_RightMar2]
CN
OO
C 中
国海
洋石
油 (0
08
83
HK
)
[Table_PageHeader] CNOOC (00883 HK)
of its current production targets for FY19-21, and 2) changed FX assumptions (a more resilient RMB against the USD between
2019 and 2021). We maintain our assumptions for the Company’s 2019-2021 average realised oil prices at US$62/bbl,
US$64/bbl and US$67/bbl, respectively. Our 2019-2021 all-in cost assumptions remain unchanged at around US$31-US$32 per
boe
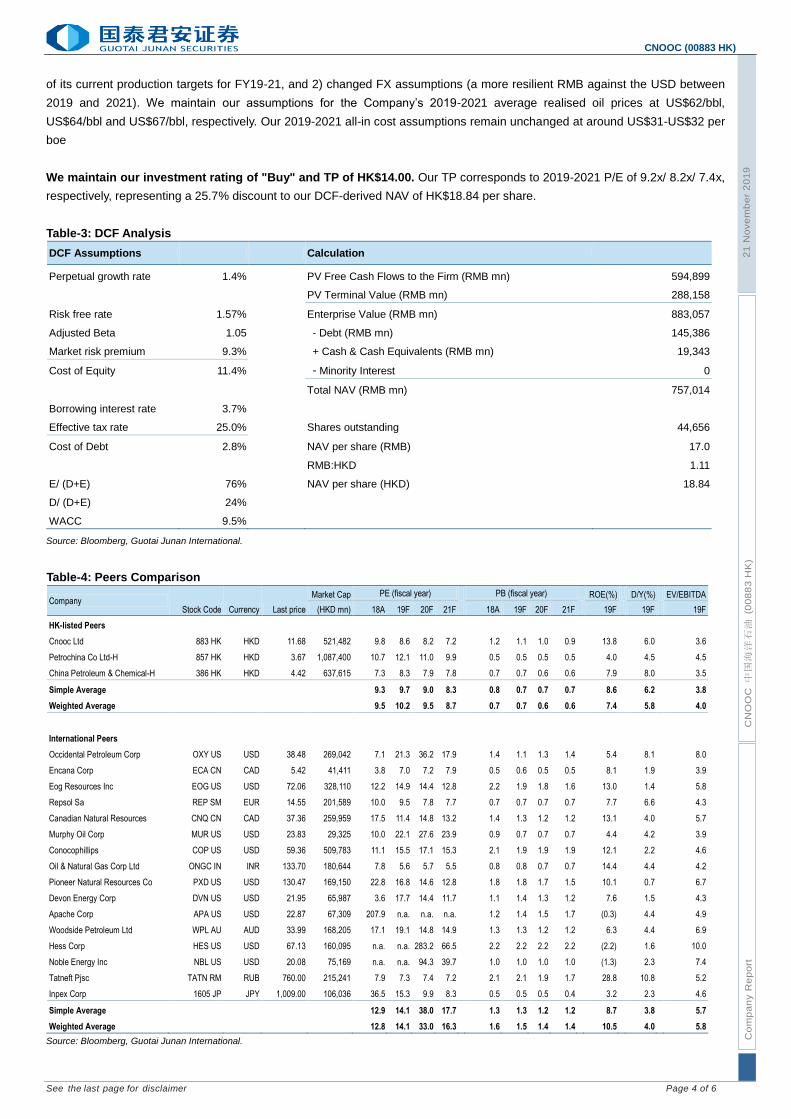
We maintain our investment rating of "Buy" and TP of HK$14.00. Our TP corresponds to 2019-2021 P/E of 9.2x/ 8.2x/ 7.4x,
respectively, representing a 25.7% discount to our DCF-derived NAV of HK$18.84 per share.
Table-3: DCF Analysis
DCF Assumptions Calculation
Perpetual growth rate 1.4% PV Free Cash Flows to the Firm (RMB mn) 594,899
PV Terminal Value (RMB mn) 288,158
Risk free rate 1.57% Enterprise Value (RMB mn) 883,057
Adjusted Beta 1.05 - Debt (RMB mn) 145,386
Market risk premium 9.3% + Cash & Cash Equivalents (RMB mn) 19,343
Cost of Equity 11.4% - Minority Interest 0
Total NAV (RMB mn) 757,014
Borrowing interest rate 3.7%
Effective tax rate 25.0% Shares outstanding 44,656
Cost of Debt 2.8% NAV per share (RMB) 17.0
RMB:HKD 1.11
E/ (D+E) 76% NAV per share (HKD) 18.84
D/ (D+E) 24%
WACC 9.5%
Source: Bloomberg, Guotai Junan International.
Table-4: Peers Comparison
Company Stock Code Currency Last price
Market Cap PE (fiscal year) PB (fiscal year) ROE(%) D/Y(%) EV/EBITDA
(HKD mn) 18A 19F 20F 21F 18A 19F 20F 21F 19F 19F 19F
HK-listed Peers
Cnooc Ltd 883 HK HKD 11.68 521,482 9.8 8.6 8.2 7.2
1.2 1.1 1.0 0.9
13.8
6.0
3.6
Petrochina Co Ltd-H 857 HK HKD 3.67 1,087,400 10.7 12.1 11.0 9.9
0.5 0.5 0.5 0.5
4.0
4.5
4.5
China Petroleum & Chemical-H 386 HK HKD 4.42 637,615 7.3 8.3 7.9 7.8
0.7 0.7 0.6 0.6
7.9
8.0
3.5
Simple Average 9.3 9.7 9.0 8.3 0.8 0.7 0.7 0.7 8.6 6.2 3.8
Weighted Average 9.5 10.2 9.5 8.7 0.7 0.7 0.6 0.6 7.4 5.8 4.0
International Peers
Occidental Petroleum Corp OXY US USD 38.48 269,042 7.1 21.3 36.2 17.9
1.4 1.1 1.3 1.4
5.4
8.1
8.0
Encana Corp ECA CN CAD 5.42 41,411 3.8 7.0 7.2 7.9
0.5 0.6 0.5 0.5
8.1
1.9
3.9
Eog Resources Inc EOG US USD 72.06 328,110 12.2 14.9 14.4 12.8
2.2 1.9 1.8 1.6
13.0
1.4
5.8
Repsol Sa REP SM EUR 14.55 201,589 10.0 9.5 7.8 7.7
0.7 0.7 0.7 0.7
7.7
6.6
4.3
Canadian Natural Resources CNQ CN CAD 37.36 259,959 17.5 11.4 14.8 13.2
1.4 1.3 1.2 1.2
13.1
4.0
5.7
Murphy Oil Corp MUR US USD 23.83 29,325 10.0 22.1 27.6 23.9
0.9 0.7 0.7 0.7
4.4
4.2
3.9
Conocophillips COP US USD 59.36 509,783 11.1 15.5 17.1 15.3
2.1 1.9 1.9 1.9
12.1
2.2
4.6
Oil & Natural Gas Corp Ltd ONGC IN INR 133.70 180,644 7.8 5.6 5.7 5.5
0.8 0.8 0.7 0.7
14.4
4.4
4.2
Pioneer Natural Resources Co PXD US USD 130.47 169,150 22.8 16.8 14.6 12.8
1.8 1.8 1.7 1.5
10.1
0.7
6.7
Devon Energy Corp DVN US USD 21.95 65,987 3.6 17.7 14.4 11.7
1.1 1.4 1.3 1.2
7.6
1.5
4.3
Apache Corp APA US USD 22.87 67,309 207.9 n.a. n.a. n.a.
1.2 1.4 1.5 1.7
(0.3)
4.4
4.9
Woodside Petroleum Ltd WPL AU AUD 33.99 168,205 17.1 19.1 14.8 14.9
1.3 1.3 1.2 1.2
6.3
4.4
6.9
Hess Corp HES US USD 67.13 160,095 n.a. n.a. 283.2 66.5
2.2 2.2 2.2 2.2
(2.2)
1.6
10.0
Noble Energy Inc NBL US USD 20.08 75,169 n.a. n.a. 94.3 39.7
1.0 1.0 1.0 1.0
(1.3)
2.3
7.4
Tatneft Pjsc TATN RM RUB 760.00 215,241 7.9 7.3 7.4 7.2
2.1 2.1 1.9 1.7
28.8
10.8
5.2
Inpex Corp 1605 JP JPY 1,009.00 106,036 36.5 15.3 9.9 8.3
0.5 0.5 0.5 0.4
3.2
2.3
4.6
Simple Average 12.9 14.1 38.0 17.7 1.3 1.3 1.2 1.2 8.7 3.8 5.7
Weighted Average 12.8 14.1 33.0 16.3 1.6 1.5 1.4 1.4 10.5 4.0 5.8
Source: Bloomberg, Guotai Junan International.
Co
mp
an
y R
ep
ort
See the last page for disclaimer Page 5 of 6
[Table_RightMar1]
21
No
ve
mb
er
20
19
[Table_RightMar2]
CN
OO
C 中
国海
洋石
油 (0
08
83
HK
)
[Table_PageHeader] CNOOC (00883 HK)
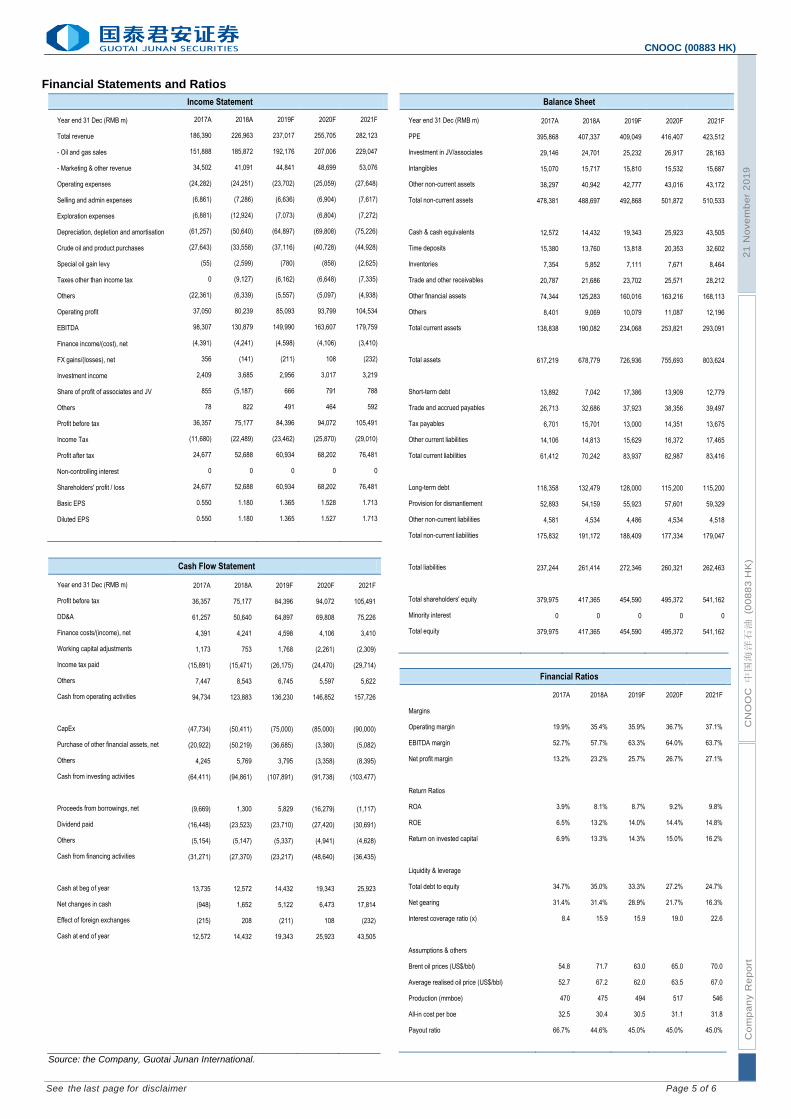
Financial Statements and Ratios
[Table_CompanyRatingDefinition]
[Table_IncomeStatement] Income Statement
Year end 31 Dec (RMB m) 2017A 2018A 2019F 2020F 2021F
Total revenue 186,390 226,963 237,017 255,705 282,123
- Oil and gas sales 151,888 185,872 192,176 207,006 229,047
- Marketing & other revenue 34,502 41,091 44,841 48,699 53,076
Operating expenses (24,282) (24,251) (23,702) (25,059) (27,648)
Selling and admin expenses (6,861) (7,286) (6,636) (6,904) (7,617)
Exploration expenses (6,881) (12,924) (7,073) (6,804) (7,272)
Depreciation, depletion and amortisation (61,257) (50,640) (64,897) (69,808) (75,226)
Crude oil and product purchases (27,643) (33,558) (37,116) (40,728) (44,928)
Special oil gain levy (55) (2,599) (780) (858) (2,625)
Taxes other than income tax 0 (9,127) (6,162) (6,648) (7,335)
Others (22,361) (6,339) (5,557) (5,097) (4,938)
Operating profit 37,050 80,239 85,093 93,799 104,534
EBITDA 98,307 130,879 149,990 163,607 179,759
Finance income/(cost), net (4,391) (4,241) (4,598) (4,106) (3,410)
FX gains/(losses), net 356 (141) (211) 108 (232)
Investment income 2,409 3,685 2,956 3,017 3,219
Share of profit of associates and JV 855 (5,187) 666 791 788
Others 78 822 491 464 592
Profit before tax 36,357 75,177 84,396 94,072 105,491
Income Tax (11,680) (22,489) (23,462) (25,870) (29,010)
Profit after tax 24,677 52,688 60,934 68,202 76,481
Non-controlling interest 0 0 0 0 0
Shareholders' profit / loss 24,677 52,688 60,934 68,202 76,481
Basic EPS 0.550 1.180 1.365 1.528 1.713
Diluted EPS 0.550 1.180 1.365 1.527 1.713
[Table_CashFlowStatement] Cash Flow Statement
Year end 31 Dec (RMB m) 2017A 2018A 2019F 2020F 2021F
Profit before tax 36,357 75,177 84,396 94,072 105,491
DD&A 61,257 50,640 64,897 69,808 75,226
Finance costs/(income), net 4,391 4,241 4,598 4,106 3,410
Working capital adjustments 1,173 753 1,768 (2,261) (2,309)
Income tax paid (15,891) (15,471) (26,175) (24,470) (29,714)
Others 7,447 8,543 6,745 5,597 5,622
Cash from operating activities 94,734 123,883 136,230 146,852 157,726
CapEx (47,734) (50,411) (75,000) (85,000) (90,000)
Purchase of other financial assets, net (20,922) (50,219) (36,685) (3,380) (5,082)
Others 4,245 5,769 3,795 (3,358) (8,395)
Cash from investing activities (64,411) (94,861) (107,891) (91,738) (103,477)
Proceeds from borrowings, net (9,669) 1,300 5,829 (16,279) (1,117)
Dividend paid (16,448) (23,523) (23,710) (27,420) (30,691)
Others (5,154) (5,147) (5,337) (4,941) (4,628)
Cash from financing activities (31,271) (27,370) (23,217) (48,640) (36,435)
Cash at beg of year 13,735 12,572 14,432 19,343 25,923
Net changes in cash (948) 1,652 5,122 6,473 17,814
Effect of foreign exchanges (215) 208 (211) 108 (232)
Cash at end of year 12,572 14,432 19,343 25,923 43,505
Source: the Company, Guotai Junan International.
[Table_BalanceSheet] Balance Sheet
Year end 31 Dec (RMB m) 2017A 2018A 2019F 2020F 2021F
PPE 395,868 407,337 409,049 416,407 423,512
Investment in JV/associates 29,146 24,701 25,232 26,917 28,163
Intangibles 15,070 15,717 15,810 15,532 15,687
Other non-current assets 38,297 40,942 42,777 43,016 43,172
Total non-current assets 478,381 488,697 492,868 501,872 510,533
Cash & cash equivalents 12,572 14,432 19,343 25,923 43,505
Time deposits 15,380 13,760 13,818 20,353 32,602
Inventories 7,354 5,852 7,111 7,671 8,464
Trade and other receivables 20,787 21,686 23,702 25,571 28,212
Other financial assets 74,344 125,283 160,016 163,216 168,113
Others 8,401 9,069 10,079 11,087 12,196
Total current assets 138,838 190,082 234,068 253,821 293,091
Total assets 617,219 678,779 726,936 755,693 803,624
Short-term debt 13,892 7,042 17,386 13,909 12,779
Trade and accrued payables 26,713 32,686 37,923 38,356 39,497
Tax payables 6,701 15,701 13,000 14,351 13,675
Other current liabilities 14,106 14,813 15,629 16,372 17,465
Total current liabilities 61,412 70,242 83,937 82,987 83,416
Long-term debt 118,358 132,479 128,000 115,200 115,200
Provision for dismantlement 52,893 54,159 55,923 57,601 59,329
Other non-current liabilities 4,581 4,534 4,486 4,534 4,518
Total non-current liabilities 175,832 191,172 188,409 177,334 179,047
Total liabilities 237,244 261,414 272,346 260,321 262,463
Total shareholders' equity 379,975 417,365 454,590 495,372 541,162
Minority interest 0 0 0 0 0
Total equity 379,975 417,365 454,590 495,372 541,162
[Table_FinancialRatio] Financial Ratios
2017A 2018A 2019F 2020F 2021F
Margins
Operating margin 19.9% 35.4% 35.9% 36.7% 37.1%
EBITDA margin 52.7% 57.7% 63.3% 64.0% 63.7%
Net profit margin 13.2% 23.2% 25.7% 26.7% 27.1%
Return Ratios
ROA 3.9% 8.1% 8.7% 9.2% 9.8%
ROE 6.5% 13.2% 14.0% 14.4% 14.8%
Return on invested capital 6.9% 13.3% 14.3% 15.0% 16.2%
Liquidity & leverage
Total debt to equity 34.7% 35.0% 33.3% 27.2% 24.7%
Net gearing 31.4% 31.4% 28.9% 21.7% 16.3%
Interest coverage ratio (x) 8.4 15.9 15.9 19.0 22.6
Assumptions & others
Brent oil prices (US$/bbl) 54.8 71.7 63.0 65.0 70.0
Average realised oil price (US$/bbl) 52.7 67.2 62.0 63.5 67.0
Production (mmboe) 470 475 494 517 546
All-in cost per boe 32.5 30.4 30.5 31.1 31.8
Payout ratio 66.7% 44.6% 45.0% 45.0% 45.0%
Co
mp
an
y R
ep
ort
See the last page for disclaimer Page 6 of 6
[Table_RightMar1]
21
No
ve
mb
er
20
19
[Table_RightMar2]
CN
OO
C 中
国海
洋石
油 (0
08
83
HK
)
[Table_PageHeader] CNOOC (00883 HK)
Company Rating Definition
The Benchmark: Hong Kong Hang Seng Index
Time Horizon: 6 to 18 months
Rating Definition
Buy 买入 Relative Performance>15%; or the fundamental outlook of the company or sector is favorable.
Accumulate 收集 Relative Performance is 5% to 15%; or the fundamental outlook of the company or sector is favorable.
Neutral 中性 Relative Performance is -5% to 5%; or the fundamental outlook of the company or sector is neutral.
Reduce 减持 Relative Performance is -5% to -15%; or the fundamental outlook of the company or sector is unfavorable.
Sell 卖出 Relative Performance <-15%; or the fundamental outlook of the company or sector is unfavorable.
[Table_IndustryRatingDefinition] Sector Rating Definition
The Benchmark: Hong Kong Hang Seng Index
Time Horizon: 6 to 18 months
Rating Definition
Outperform 跑赢大市 Relative Performance>5%; or the fundamental outlook of the sector is favorable.
Neutral 中性 Relative Performance is -5% to 5%; or the fundamental outlook of the sector is neutral.
Underperform 跑输大市 Relative Performance<-5%; Or the fundamental outlook of the sector is unfavorable.
[Table_DISCLOSUREOFINTERESTS] DISCLOSURE OF INTERESTS
(1) The Analysts and their associates do not serve as an officer of the issuer mentioned in this Research Report. (2) The Analysts and their associates do not have any financial interests in relation to the issuer mentioned in this Research Report. (3) Except for CH TIANBAO GP (01427 HK), KAISA GROUP (01638 HK), GUOTAI JUNAN I (01788 HK), JXR (01951 HK), BANK OF
GANSU (02139 HK), JINSHANG BANK (02558 HK), ZHONGLIANG HLDG (02772 HK), BINHAI INVESTMENT (02886 HK), CAM SCSMALLCAP (03157 HK), HAITIAN ANTENNA (08227 HK), Guotai Junan and its group companies do not hold equal to or more than 1% of the market capitalization of the issuer mentioned in this Research Report.
(4) Guotai Junan and its group companies have not had investment banking relationships with the issuer mentioned in this Research Report within the preceding 12 months.
(5) Guotai Junan and its group companies are not making a market in the securities in respect of the issuer mentioned in this Research Report.
(6) Guotai Junan and its group companies have not employed an individual serving as an officer of the issuer mentioned in this Research Report. There is no officer of the issuer mentioned in this Research Report associated with Guotai Junan and its group companies.
DISCLAIMER This Research Report does not constitute an invitation or offer to acquire, purchase or subscribe for securities by Guotai Junan Securities (Hong Kong) Limited ("Guotai Junan"). Guotai Junan and its group companies may do business that relates to companies covered in research reports, including investment banking, investment services, etc. (for example, the placing agent, lead manager, sponsor, underwriter or invest proprietarily). Any opinions expressed in this report may differ or be contrary to opinions or investment strategies expressed orally or in written form by sales persons, dealers and other professional executives of Guotai Junan group of companies. Any opinions expressed in this report may differ or be contrary to opinions or investment decisions made by the asset management and investment banking groups of Guotai Junan. Though best effort has been made to ensure the accuracy of the information and data contained in this Research Report, Guotai Junan does not guarantee the accuracy and completeness of the information and data herein. This Research Report may contain some forward-looking estimates and forecasts derived from the assumptions of the future political and economic conditions with inherently unpredictable and mutable situation, so uncertainty may contain. Investors should understand and comprehend the investment objectives and its related risks, and where necessary consult their own financial advisers prior to any investment decision. This Research Report is not directed at, or intended for distribution to or use by, any person or entity who is a citizen or resident of or located in any jurisdiction where such distribution, publication, availability or use would be contrary to applicable law or regulation or which would subject Guotai Junan and its group companies to any registration or licensing requirement within such jurisdiction. © 2019 Guotai Junan Securities (Hong Kong) Limited. All Rights Reserved. 27/F., Low Block, Grand Millennium Plaza, 181 Queen’s Road Central, Hong Kong. Tel.: (852) 2509-9118 Fax: (852) 2509-7793 Website: www.gtja.com.hk