Characterization of pulsed dc magnetron sputtering plasmas
17
Characterization of pulsed dc magnetron sputtering plasmas This article has been downloaded from IOPscience. Please scroll down to see the full text article. 2005 New J. Phys. 7 90 (http://iopscience.iop.org/1367-2630/7/1/090) Download details: IP Address: 128.230.234.162 The article was downloaded on 23/04/2013 at 15:39 Please note that terms and conditions apply. View the table of contents for this issue, or go to the journal homepage for more Home Search Collections Journals About Contact us My IOPscience
Transcript of Characterization of pulsed dc magnetron sputtering plasmas
Characterization of pulsed dc magnetron sputtering plasmas
This article has been downloaded from IOPscience. Please scroll down to see the full text article.
2005 New J. Phys. 7 90
(http://iopscience.iop.org/1367-2630/7/1/090)
Download details:
IP Address: 128.230.234.162
The article was downloaded on 23/04/2013 at 15:39
Please note that terms and conditions apply.
View the table of contents for this issue, or go to the journal homepage for more
Home Search Collections Journals About Contact us My IOPscience

Characterization of pulsed dc magnetronsputtering plasmas
A Belkind1, A Freilich1, J Lopez1, Z Zhao2, W Zhu1
and K Becker1,3,4
1 Department of Physics and Engineering Physics, Stevens Institute ofTechnology, Hoboken, NJ 07030, USA2 Albany NanoTech, State University of New York (SUNY) at Albany, Albany,NY12203, USA3 Center for Environmental Systems, Stevens Institute of Technology, Hoboken,NJ 07030, USAE-mail: [email protected]
New Journal of Physics 7 (2005) 90Received 12 January 2005Published 6 April 2005Online at http://www.njp.org/doi:10.1088/1367-2630/7/1/090
Abstract. Pulsed dc magnetron reactive sputtering of dielectrics provides adeposition process without arcing. The deposition process is usually carried outwith pulsing frequencies in the range 10–350 kHz and duty cycles in the range50–90%. The operating conditions are typically optimized empirically and arecritically dependent on the properties of the pulsed plasma in the immediatevicinity of the magnetron.We show how a combination of time-resolved Langmuirprobe measurements and time-resolved optical emission spectroscopy can be usedto characterize the pulsed magnetron plasma and gain insights that can only beobtained conclusively by correlating the results obtained by both techniques. Thepulsed dc sputtering of Al and Ti targets and the reactive sputtering of their oxideswere used as examples in our experiments. Our experiments were carried out attotal pressures in the range 0.4–1.3 Pa in either pure Ar (‘metallic’ mode) or inAr–O2 mixtures (‘oxide’ or ‘reactive’ mode) with mixing ratios from 1 : 1 to 1 : 4.
4 Author to whom any correspondance should be addressed.
New Journal of Physics 7 (2005) 90 PII: S1367-2630(05)92917-01367-2630/05/010090+16$30.00 © IOP Publishing Ltd and Deutsche Physikalische Gesellschaft
2 DEUTSCHE PHYSIKALISCHE GESELLSCHAFT
Contents
1. Introduction 22. Experimental techniques 33. Results and discussion 5
3.1. Results of measurements during the ‘reverse time’ . . . . . . . . . . . . . . . . 83.2. Results of measurements during the ‘on-time’ . . . . . . . . . . . . . . . . . . 12
4. Conclusions 14Acknowledgments 15References 15
1. Introduction
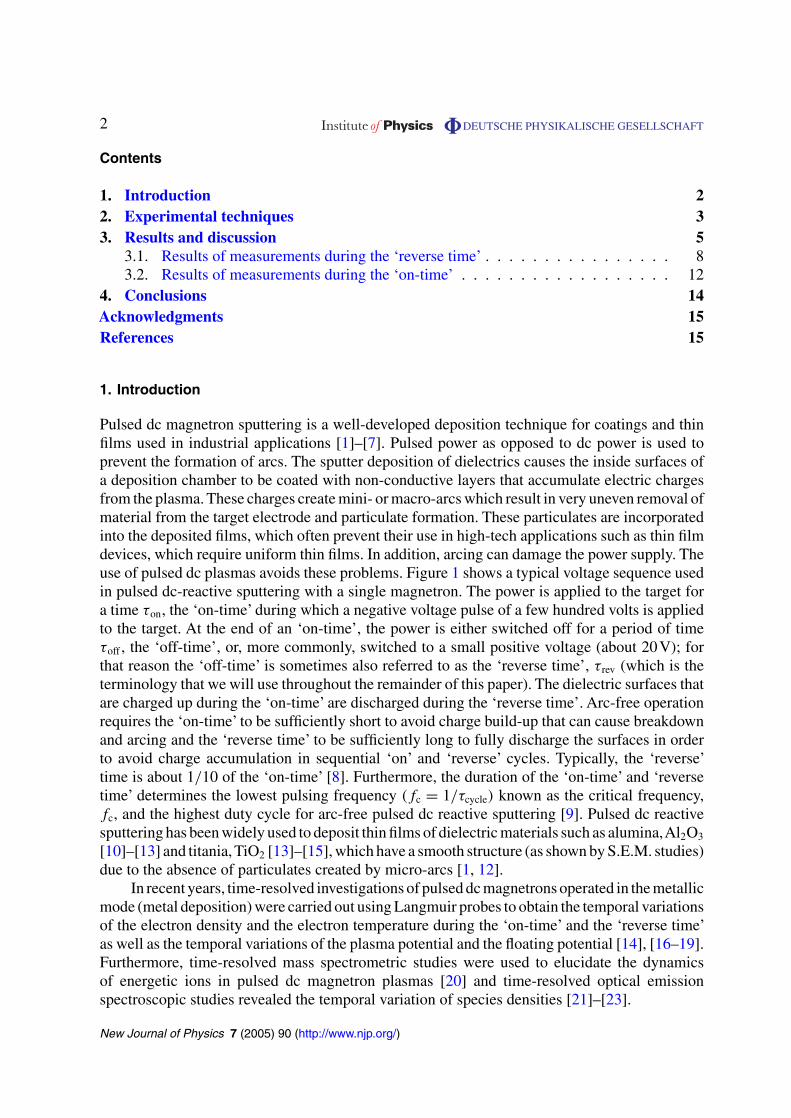
Pulsed dc magnetron sputtering is a well-developed deposition technique for coatings and thinfilms used in industrial applications [1]–[7]. Pulsed power as opposed to dc power is used toprevent the formation of arcs. The sputter deposition of dielectrics causes the inside surfaces ofa deposition chamber to be coated with non-conductive layers that accumulate electric chargesfrom the plasma. These charges create mini- or macro-arcs which result in very uneven removal ofmaterial from the target electrode and particulate formation. These particulates are incorporatedinto the deposited films, which often prevent their use in high-tech applications such as thin filmdevices, which require uniform thin films. In addition, arcing can damage the power supply. Theuse of pulsed dc plasmas avoids these problems. Figure 1 shows a typical voltage sequence usedin pulsed dc-reactive sputtering with a single magnetron. The power is applied to the target fora time τon, the ‘on-time’ during which a negative voltage pulse of a few hundred volts is appliedto the target. At the end of an ‘on-time’, the power is either switched off for a period of timeτoff , the ‘off-time’, or, more commonly, switched to a small positive voltage (about 20V); forthat reason the ‘off-time’ is sometimes also referred to as the ‘reverse time’, τrev (which is theterminology that we will use throughout the remainder of this paper). The dielectric surfaces thatare charged up during the ‘on-time’ are discharged during the ‘reverse time’. Arc-free operationrequires the ‘on-time’ to be sufficiently short to avoid charge build-up that can cause breakdownand arcing and the ‘reverse time’ to be sufficiently long to fully discharge the surfaces in orderto avoid charge accumulation in sequential ‘on’ and ‘reverse’ cycles. Typically, the ‘reverse’time is about 1/10 of the ‘on-time’ [8]. Furthermore, the duration of the ‘on-time’ and ‘reversetime’ determines the lowest pulsing frequency (fc = 1/τcycle) known as the critical frequency,fc, and the highest duty cycle for arc-free pulsed dc reactive sputtering [9]. Pulsed dc reactivesputtering has been widely used to deposit thin films of dielectric materials such as alumina,Al2O3
[10]–[13] and titania, TiO2 [13]–[15], which have a smooth structure (as shown by S.E.M. studies)due to the absence of particulates created by micro-arcs [1, 12].
In recent years, time-resolved investigations of pulsed dc magnetrons operated in the metallicmode (metal deposition) were carried out using Langmuir probes to obtain the temporal variationsof the electron density and the electron temperature during the ‘on-time’ and the ‘reverse time’as well as the temporal variations of the plasma potential and the floating potential [14], [16–19].Furthermore, time-resolved mass spectrometric studies were used to elucidate the dynamicsof energetic ions in pulsed dc magnetron plasmas [20] and time-resolved optical emissionspectroscopic studies revealed the temporal variation of species densities [21]–[23].
New Journal of Physics 7 (2005) 90 (http://www.njp.org/)
3 DEUTSCHE PHYSIKALISCHE GESELLSCHAFT
- -
0+
-
Time
τon
τrev
Vol
tage
τcycle
+ +
Sputter-deposition of dielectric layers,charging up dielectric surfaces
Discharging the dielectric surfaces
Figure 1. Ideal voltage sequence applied to asymmetrical bi-polar pulsed dcsputtering of dielectrics.
In this paper, we show how a combination of time-resolved Langmuir probe measurementsand time-resolved optical emission studies of pulsed dc magnetron plasmas can be used to extractmore detailed information regarding the temporal variations of the critical plasma parametersand plasma species that can be obtained only from probe or optical measurements. Studies werecarried out for the pulsed dc magnetron sputtering of aluminum and titanium in pure argon andin argon/oxygen mixtures.
2. Experimental techniques
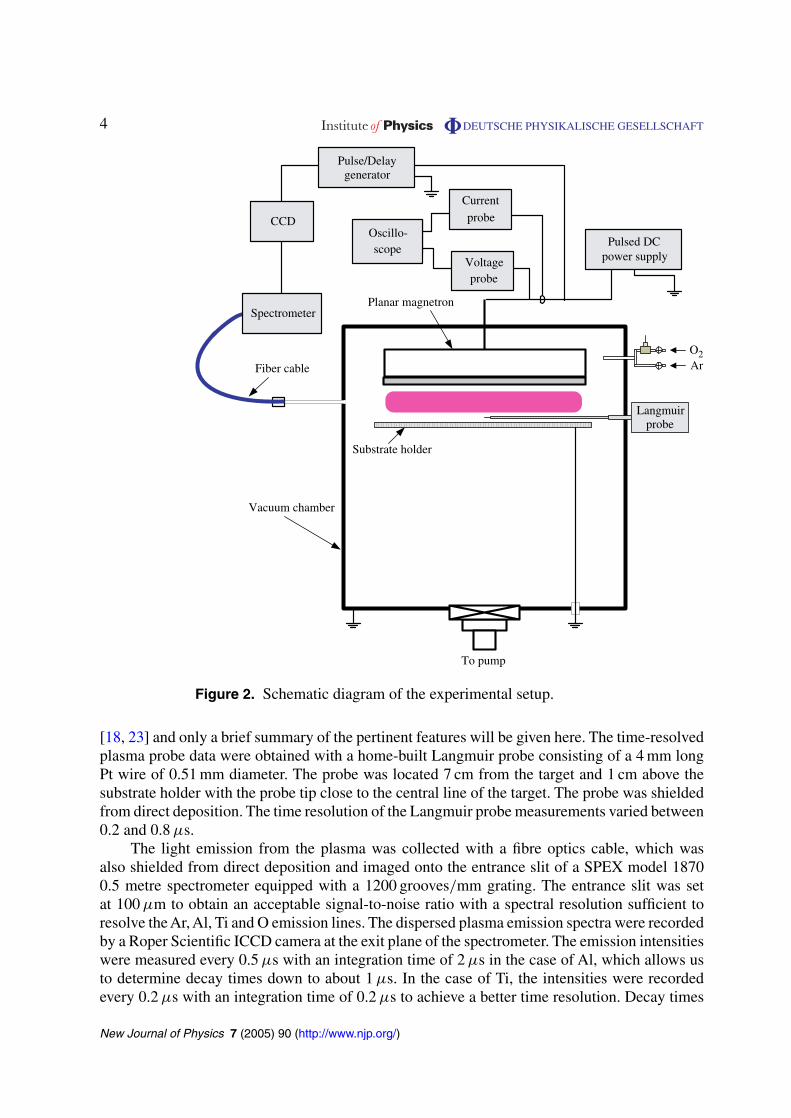
Our experiments were performed in a cubic reaction chamber (‘box coater’) with planarrectangular magnetrons HRC-373 or HRC-817 (BOC Coating Technology) as shown in figure 2.The magnetron was modified by replacing the centre magnets with soft iron and the sidemagnets with magnets that were 2.5 times stronger than the original magnets, which results in anunbalanced magnetron. The tangential component of the magnetic field above the racetrack of theunbalanced magnetron is about 40% stronger than that of a balanced magnetron. Sputtering wascarried out using an aluminium target (5′′ × 17′′) or a titanium target (3.5′′ × 8′′) of a purity of99.999%. The base pressure in the system was in the range of 3–6 × 10⁻⁶ Torr (4–8 × 10⁻⁴ Pa).The pressure during sputtering (0.4–1.3 Pa) was measured by a capacitance manometer andcontrolled by a throttle valve. Sputtering of Al and Ti (metallic mode) was carried out in pureargon, while reactive sputtering of Al2O3 and TiO2 (oxide mode) was carried out in an Ar–O2
mixture with a mixing ratio ranging from 1 : 1 (Ar : O2) to 1 : 4.The pulsed dc power was applied using a combination of an Advanced Energy MDX-10
dc power supply and an Advanced Energy Sparc-le V® pulsed generator. The dc power supplywas operated in the constant current mode at currents of about 4A. The Sparc-le V® was operatedeither at 20 kHz with reverse pulse widths of up to 10 µs or at 60 kHz and reverse pulse times of3–6 µs. These operating parameters resulted in stable, arc-free plasmas. The current and voltagepulse forms were recorded with a Tektronix P5100 voltage probe and a Tektronix A6303 currentprobe connected to a Tektronix TDS 340 oscilloscope. The time window was chosen to recordthe reverse peak (‘reverse time’) and the subsequent re-establishment of the plasma.
Details of the time-resolved Langmuir probe measurements and emission spectroscopicstudies and the respective data extraction procedures were discussed in greater detail elsewhere
New Journal of Physics 7 (2005) 90 (http://www.njp.org/)
4 DEUTSCHE PHYSIKALISCHE GESELLSCHAFT
CCD
Fiber cable
Langmuirprobe
Planar magnetron
Voltageprobe
Current
probeOscillo-scope
Pulsed DCpower supply
Pulse/Delaygenerator
Spectrometer
Substrate holder
To pump
ArO2
Vacuum chamber
Figure 2. Schematic diagram of the experimental setup.
[18, 23] and only a brief summary of the pertinent features will be given here. The time-resolvedplasma probe data were obtained with a home-built Langmuir probe consisting of a 4 mm longPt wire of 0.51 mm diameter. The probe was located 7 cm from the target and 1 cm above thesubstrate holder with the probe tip close to the central line of the target. The probe was shieldedfrom direct deposition. The time resolution of the Langmuir probe measurements varied between0.2 and 0.8 µs.
The light emission from the plasma was collected with a fibre optics cable, which wasalso shielded from direct deposition and imaged onto the entrance slit of a SPEX model 18700.5 metre spectrometer equipped with a 1200 grooves/mm grating. The entrance slit was setat 100 µm to obtain an acceptable signal-to-noise ratio with a spectral resolution sufficient toresolve the Ar, Al, Ti and O emission lines. The dispersed plasma emission spectra were recordedby a Roper Scientific ICCD camera at the exit plane of the spectrometer. The emission intensitieswere measured every 0.5 µs with an integration time of 2 µs in the case of Al, which allows usto determine decay times down to about 1 µs. In the case of Ti, the intensities were recordedevery 0.2 µs with an integration time of 0.2 µs to achieve a better time resolution. Decay times
New Journal of Physics 7 (2005) 90 (http://www.njp.org/)

5 DEUTSCHE PHYSIKALISCHE GESELLSCHAFT
Table 1. Summary of the Ar, O, Al and Ti emission lines and their energy levels([37] and http://physics.nist.gov/cgi-bin/AtData/lines_form).
Species Wavelength (nm) Energy levels (Ei–Ek) Transition
Argon I 404.44 14.69–11.62 3p5 (2P1/2) 5p → 3p5 (2P3/2) 4sArgon I 750.39 13.48–11.83 3p5 (2P◦
1/2) 4s → 3p5 (2P◦1/2) 4p
Argon I 751.47 13.27–11.62 3p5 (2P◦3/2) 4s → 3p5 (2P◦
3/2) 4pArgon I 763.51 13.17–11.55 3p5 (2P◦
3/2) 4s → 3p5 (2P◦3/2) 4p
Argon I 772.38 13.15–11.55 3p5 (2P◦3/2) 4s → 3p5 (2P◦
3/2) 4pOxygen I 777.19 10.74–9.15 2p3 (4S◦) 3s → 2p3 (4S◦) 3pOxygen I 777.42 10.74–9.15 2p3 (4S◦) 3s → 2p3 (4S) 3pAluminum I 394.40 3.14–0.000 3s2 (1S) 4s → 3s2(1S◦) 3pAluminum I 396.15 3.14–0.014 3s2 (1S) 4s → 3s2 (1S) 3pTitanium I 398.17 3.11–0.00 3d2 (3F) 4s2 → 3d2(3F) 4s4pTitanium I 398.98 3.13–0.02 3d2 (3F) 4s2 → 3d2 (3F) 4s4pTitanium I 399.86 3.15–0.05 3d2 (3F) 4s2 → 3d2 (3F) 4s4p
were obtained by fitting an exponential function to the recorded intensity. In some cases, adouble-exponential fit was required to properly describe the data. The accuracy with whichthe decay times could be determined in the case of Ti sputtering ranged from < ±0.1 µs forintense emission lines to about ±0.3 µs for the very weak emission lines. Two spectral regionswere selected for the time-resolved emission spectroscopic studies, 390–410 nm which containsemission lines of Al, Ti, and Ar and 750–780 nm which contains Ar and O emission lines. Theemission lines studied here are summarized in table 1 (see also [24]). As can be seen from table 1,the minimum excitation energies for argon and oxygen are comparatively high, >13.15 eV forAr and >10.74 eV for O, whereas the excitation of the Al and Ti lines requires only minimumenergies of slightly more than 3 eV for aluminium and titanium. This indicates that the emissionof argon and oxygen lines depends on the presence of fast electrons in the plasma.
The optical detection system was set up in such a way [23] that most of the light reachingthe detector originated from a section of the densest part of the plasma from the racetrack regionnearest to the fibre optics cable. The shape of the plasma area that was viewed by the opticaldetection system was that of a truncated cone, 4 cm in length with top and bottom diametersof 1.7 and 2.3 cm, respectively. As discussed above, the tip of the Langmuir probe was placedslightly below the plasma region that is imaged onto the optical detector and places in betweenthe two regions of highest plasma density. Thus, the Langmuir probe analyses a plasma with alower electron density than the plasma that is optically analysed. However, the main focus ofthis study was an investigation of the temporal behaviour of the plasma parameters and emissionintensities during both the ‘on-time’ and ‘reverse time’ rather than their absolute values. Thus,the comparison of the electrical and optical data obtained from different, but adjacent regions ofthe plasma is still meaningful.
3. Results and discussion
We will present and discuss the results of time-resolved Langmuir probe and optical emissionspectroscopy studies separately for the ‘reverse time’ and for the ‘on-time’ and separately forthe operation of the magnetron in the metallic and oxide modes. Figure 3 shows the temporal
New Journal of Physics 7 (2005) 90 (http://www.njp.org/)

6 DEUTSCHE PHYSIKALISCHE GESELLSCHAFT
-40
-20
0
20
40
0
Plas
ma
pote
ntia
l (V
) Metallic modeOxide mode
0
1E+16
2E+16
3E+16
4E+16
Plas
ma
dens
ity (
m-3
)
MetallicOxide
0
10
20
30
40
Time (µs)
Ele
ctro
n te
mpe
ratu
re (
eV)
OxideMetallic
-400
-200
0
200
0 10 20 30 40 50C
atho
de v
olta
ge (
V)
-4
-2
0
2
Cat
hode
cur
rent
(A
)
Vc, metallic modeIc, metallic modeIc. oxide mode
60
0 10 20 30 40 50 60
Figure 3. Temporal variations of the cathode voltage and current, plasmapotential, plasma density and electron temperature during reactive sputtering ofAl2O3 using 20 kHz pulsed dc power with a 10 µs off-time in the metallic mode(green symbols) and in the oxide mode (pink symbols).
New Journal of Physics 7 (2005) 90 (http://www.njp.org/)

7 DEUTSCHE PHYSIKALISCHE GESELLSCHAFT
-2
0
2
4
6
8
-5 0 10 15 20 25 30
Time (µs)
Em
issi
on in
tens
ity (
arb.
un.)
-2
0
2
4
6
8
Cur
rent
(A
)
Ar, 750 nmAr, 764 nmAl, 396 nmCurrent
-2
0
2
4
6
8
-5 0 10 15 20 25 30
Time (µs)
Em
issi
on in
tens
ity (
arb.
un.)
-2
0
2
4
6
8
Cur
rent
(A
)
Ar, 750 nmAr, 764 nmO, 777 nmCurrent
5
5
Figure 4. Time-resolved emission intensities of the Ar 750 and 764 nm lines, theAl 396 nm line and the O 777 nm line measured during sputtering of an Al targetin the metallic mode (upper graph) and in the oxide mode (lower graph) using apower of 1 kW, a frequency of 20 kHz, a reverse time of 10 µs and a pressure ofabout 0.5 Pa.
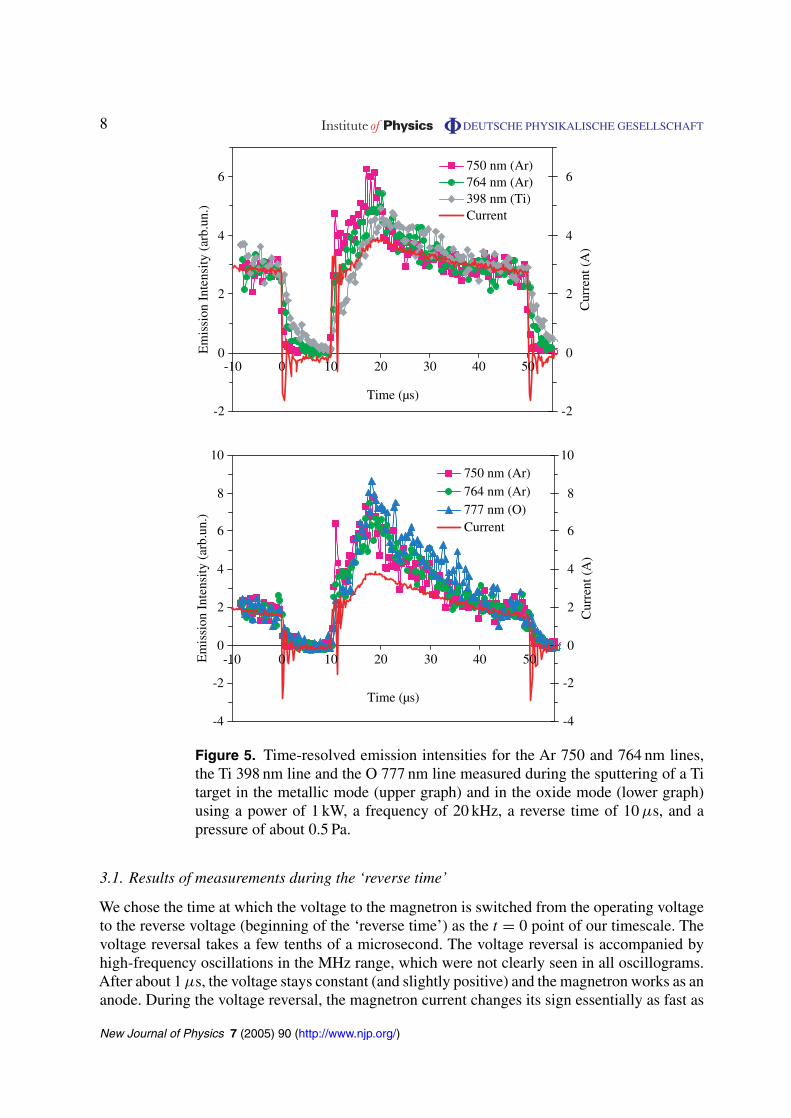
variations of the recorded magnetron voltage and current and of the plasma parameters obtainedfrom the Langmuir probe measurements (plasma potential, electron density and electrontemperature) obtained at 20 kHz and a reverse time of 10 µs with an Al target in both the metallicand the oxide mode. The power was 1 kW and the pressure was about 0.5 Pa. Figure 4 shows theemission intensities of the Ar lines at 750 and 764 nm line together with the Al line at 396 nmobtained in the metallic mode. The same two Ar lines and the O line at 777 nm were recordedin the oxide mode. The operating conditions were the same as those used in the Langmuir probemeasurements. Similar time-resolved optical data in the metallic and oxide modes were obtainedfor a Ti target, but with a better time resolution (figure 5). We note that the intensities of theemission lines were normalized to each other at t = 0 (the time when the magnetron power isreversed) for clarity of presentation. The intensities of Al and Ti lines in the oxide modes weretoo low for a meaningful analysis.
New Journal of Physics 7 (2005) 90 (http://www.njp.org/)
8 DEUTSCHE PHYSIKALISCHE GESELLSCHAFT
-2
0
2
4
6
-10 10 20 30 40 50
Time (µs)
Em
issi
on I
nten
sity
(ar
b.un
.)
-2
0
2
4
6
Cur
rent
(A
)
750 nm (Ar)764 nm (Ar)398 nm (Ti)Current
-4
-2
0
2
4
6
8
10
-10 10 20 30 40 50
Time (µs)
Em
issi
on I
nten
sity
(ar
b.un
.)
-4
-2
0
2
4
6
8
10
Cur
rent
(A
)
750 nm (Ar)764 nm (Ar)777 nm (O)Current
0
0
Figure 5. Time-resolved emission intensities for the Ar 750 and 764 nm lines,the Ti 398 nm line and the O 777 nm line measured during the sputtering of a Titarget in the metallic mode (upper graph) and in the oxide mode (lower graph)using a power of 1 kW, a frequency of 20 kHz, a reverse time of 10 µs, and apressure of about 0.5 Pa.
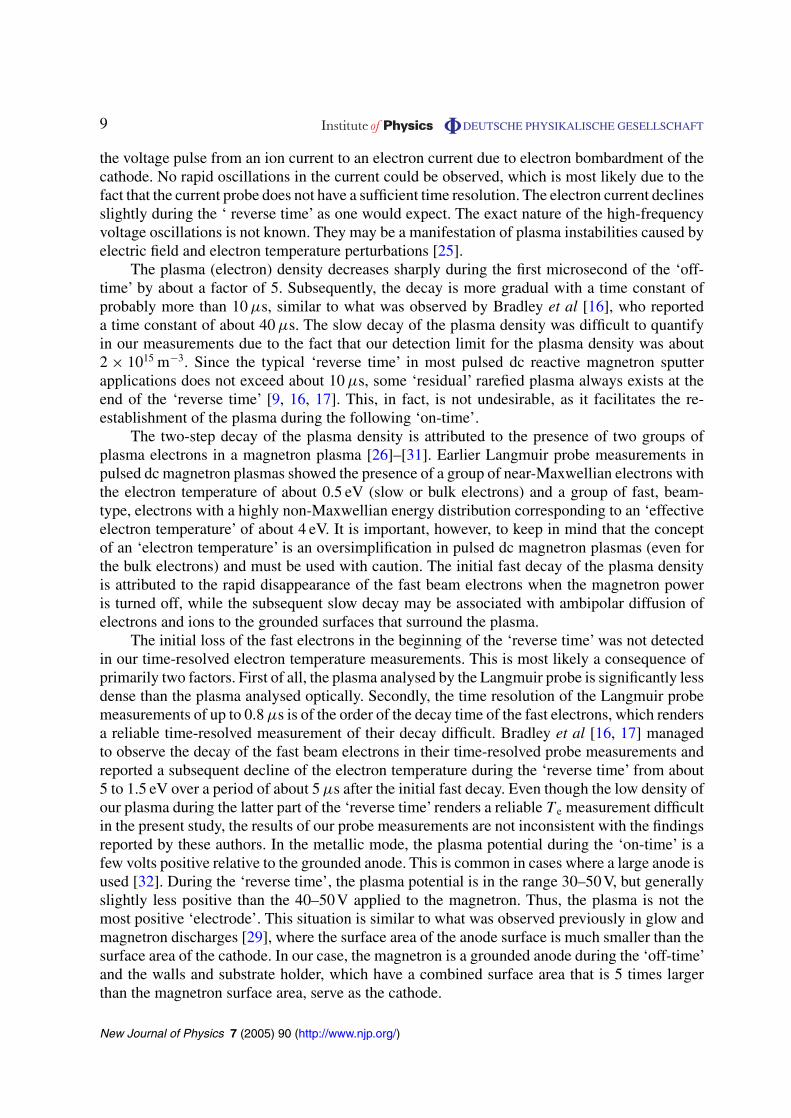
3.1. Results of measurements during the ‘reverse time’
We chose the time at which the voltage to the magnetron is switched from the operating voltageto the reverse voltage (beginning of the ‘reverse time’) as the t = 0 point of our timescale. Thevoltage reversal takes a few tenths of a microsecond. The voltage reversal is accompanied byhigh-frequency oscillations in the MHz range, which were not clearly seen in all oscillograms.After about 1 µs, the voltage stays constant (and slightly positive) and the magnetron works as ananode. During the voltage reversal, the magnetron current changes its sign essentially as fast as
New Journal of Physics 7 (2005) 90 (http://www.njp.org/)
9 DEUTSCHE PHYSIKALISCHE GESELLSCHAFT
the voltage pulse from an ion current to an electron current due to electron bombardment of thecathode. No rapid oscillations in the current could be observed, which is most likely due to thefact that the current probe does not have a sufficient time resolution. The electron current declinesslightly during the ‘ reverse time’ as one would expect. The exact nature of the high-frequencyvoltage oscillations is not known. They may be a manifestation of plasma instabilities caused byelectric field and electron temperature perturbations [25].
The plasma (electron) density decreases sharply during the first microsecond of the ‘off-time’ by about a factor of 5. Subsequently, the decay is more gradual with a time constant ofprobably more than 10 µs, similar to what was observed by Bradley et al [16], who reporteda time constant of about 40 µs. The slow decay of the plasma density was difficult to quantifyin our measurements due to the fact that our detection limit for the plasma density was about2 × 1015 m−3. Since the typical ‘reverse time’ in most pulsed dc reactive magnetron sputterapplications does not exceed about 10 µs, some ‘residual’ rarefied plasma always exists at theend of the ‘reverse time’ [9, 16, 17]. This, in fact, is not undesirable, as it facilitates the re-establishment of the plasma during the following ‘on-time’.
The two-step decay of the plasma density is attributed to the presence of two groups ofplasma electrons in a magnetron plasma [26]–[31]. Earlier Langmuir probe measurements inpulsed dc magnetron plasmas showed the presence of a group of near-Maxwellian electrons withthe electron temperature of about 0.5 eV (slow or bulk electrons) and a group of fast, beam-type, electrons with a highly non-Maxwellian energy distribution corresponding to an ‘effectiveelectron temperature’ of about 4 eV. It is important, however, to keep in mind that the conceptof an ‘electron temperature’ is an oversimplification in pulsed dc magnetron plasmas (even forthe bulk electrons) and must be used with caution. The initial fast decay of the plasma densityis attributed to the rapid disappearance of the fast beam electrons when the magnetron poweris turned off, while the subsequent slow decay may be associated with ambipolar diffusion ofelectrons and ions to the grounded surfaces that surround the plasma.
The initial loss of the fast electrons in the beginning of the ‘reverse time’ was not detectedin our time-resolved electron temperature measurements. This is most likely a consequence ofprimarily two factors. First of all, the plasma analysed by the Langmuir probe is significantly lessdense than the plasma analysed optically. Secondly, the time resolution of the Langmuir probemeasurements of up to 0.8 µs is of the order of the decay time of the fast electrons, which rendersa reliable time-resolved measurement of their decay difficult. Bradley et al [16, 17] managedto observe the decay of the fast beam electrons in their time-resolved probe measurements andreported a subsequent decline of the electron temperature during the ‘reverse time’ from about5 to 1.5 eV over a period of about 5 µs after the initial fast decay. Even though the low density ofour plasma during the latter part of the ‘reverse time’ renders a reliable T e measurement difficultin the present study, the results of our probe measurements are not inconsistent with the findingsreported by these authors. In the metallic mode, the plasma potential during the ‘on-time’ is afew volts positive relative to the grounded anode. This is common in cases where a large anode isused [32]. During the ‘reverse time’, the plasma potential is in the range 30–50V, but generallyslightly less positive than the 40–50V applied to the magnetron. Thus, the plasma is not themost positive ‘electrode’. This situation is similar to what was observed previously in glow andmagnetron discharges [29], where the surface area of the anode surface is much smaller than thesurface area of the cathode. In our case, the magnetron is a grounded anode during the ‘off-time’and the walls and substrate holder, which have a combined surface area that is 5 times largerthan the magnetron surface area, serve as the cathode.
New Journal of Physics 7 (2005) 90 (http://www.njp.org/)
10 DEUTSCHE PHYSIKALISCHE GESELLSCHAFT
0
1
2
3
4
5
0
Inte
nsity
(ar
b.un
.)
750 nm (Ar)764 nm (Ar)400 nm (Ti)
0
1
2
-2 0 4 8Time (µs)
Inte
nsity
(ar
b.un
.)
750 nm (Ar)
764 nm (Ar)
777 nm (O)
6 102
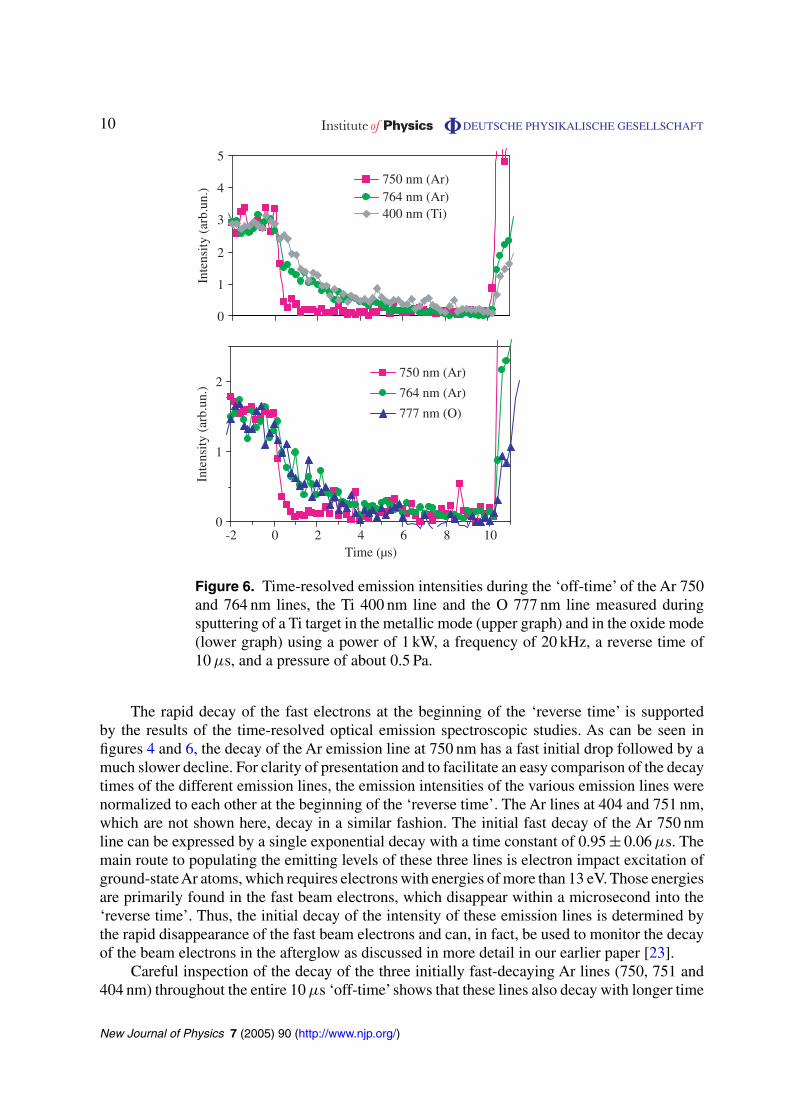
Figure 6. Time-resolved emission intensities during the ‘off-time’ of the Ar 750and 764 nm lines, the Ti 400 nm line and the O 777 nm line measured duringsputtering of a Ti target in the metallic mode (upper graph) and in the oxide mode(lower graph) using a power of 1 kW, a frequency of 20 kHz, a reverse time of10 µs, and a pressure of about 0.5 Pa.
The rapid decay of the fast electrons at the beginning of the ‘reverse time’ is supportedby the results of the time-resolved optical emission spectroscopic studies. As can be seen infigures 4 and 6, the decay of the Ar emission line at 750 nm has a fast initial drop followed by amuch slower decline. For clarity of presentation and to facilitate an easy comparison of the decaytimes of the different emission lines, the emission intensities of the various emission lines werenormalized to each other at the beginning of the ‘reverse time’. The Ar lines at 404 and 751 nm,which are not shown here, decay in a similar fashion. The initial fast decay of the Ar 750 nmline can be expressed by a single exponential decay with a time constant of 0.95 ± 0.06 µs. Themain route to populating the emitting levels of these three lines is electron impact excitation ofground-stateAr atoms, which requires electrons with energies of more than 13 eV. Those energiesare primarily found in the fast beam electrons, which disappear within a microsecond into the‘reverse time’. Thus, the initial decay of the intensity of these emission lines is determined bythe rapid disappearance of the fast beam electrons and can, in fact, be used to monitor the decayof the beam electrons in the afterglow as discussed in more detail in our earlier paper [23].
Careful inspection of the decay of the three initially fast-decaying Ar lines (750, 751 and404 nm) throughout the entire 10 µs ‘off-time’ shows that these lines also decay with longer time
New Journal of Physics 7 (2005) 90 (http://www.njp.org/)
11 DEUTSCHE PHYSIKALISCHE GESELLSCHAFT
constants of about 3–5 µs or even longer at later times (which are difficult to determine accuratelybecause of the low signal levels) after the rapid initial decay (figures 4 and 6). Since this decaytime is much shorter than the decay time of the slow bulk electrons, we attribute the observeddecay to the decline of the Ar metastable density. Thus, the emission intensity of these lines canbe used to monitor the decay of the Ar metastable density (see also the discussion below).
The production of Al (or Ti) stops abruptly at the beginning of the ‘reverse time’.Nevertheless, Al (and Ti) emission lines are recorded during the entire duration of the ‘reversetime’. The 396 and 394 nm Al emission lines decay with a time constant of about 4 µs as seenin figures 4 and 6. In the case of the Ti emissions at 398, 399 and 400 nm, which were recordedwith a better time resolution, the decay constant was about 4 µs. The initial fast decay of the Tiemission lines is again related to the rapid disappearance of fast electrons at the beginning ofthe ‘reverse time’. As the excitation of Al and Ti lines requires only a minimum electron energyof slightly more than 3 eV, the slow decay constants of both the Al and the Ti emissions areassociated with a combination of two factors, the decrease of electron temperature of the slowbulk electrons and the decay in the density of Al and Ti atoms in the afterglow. The diffusion of Aland Ti atoms out of the viewing region of our optical detection system takes a few microsecondsdepending on the kinetic energy of the atoms, which can range from a few tenths of an eV to afew eV.
The Ar lines at 764 and 772 nm (which is not shown here) decay more slowly than the750 nm line with time constants of about 4 µs, similar to the slow decay constant of the Al andTi lines. The lower level of the Ar lines at 764 and 772 nm lines is metastable. The emittinglevels of these lines can be excited directly from the Ar ground state, which requires electronenergies that are only found in the fast beam electrons. This production route terminates quicklyat the beginning of the ‘reverse time’. The levels can also be excited by electron impact from theAr metastable levels, which requires only energies of <3 eV. However, the excitation of the Armetastable levels from the Ar ground state by electron impact also requires comparatively highelectron energies of at least about 12 eV and thus also terminates rapidly at the beginning of the‘reverse time’. As discussed in detail earlier [23], a careful analysis of the processes populatingthe emitting level of the Ar 764 nm line during the ‘reverse time’and of the temporal behaviour ofthe Ar metastable density during that time in terms of the pertinent cross-sections for excitationand ionization of Ar atoms in the ground state and in the metastable state yielded an estimatefor the decay time of the Ar 764 nm intensity during the ‘reverse time’ that was comparable tothe 4 µs measured decay time. Therefore, we correlate the decay of the Ar 764 and 772 nm linesto the decay of the Ar metastable density. Other processes contributing to the decay of the Armetastable density may be collisions with Ti or Al atoms or electron excitation to higher-lyingstates. Super-elastic electron collisions are also possible, but we do not have enough data toascertain the relevance of this process. However, we have established from our analysis that thedecay of the Ar 764 and 772 nm lines can be used to monitor the decay of the metastable Ar atomdensity in the remote plasma.
The temporal behaviour of the plasma density and the electron temperature in the oxidemode is similar to that in the metallic mode with a rapid decrease at the beginning of the ‘reversetime’ and fast increase at the beginning of the ‘on-time’. Some minor differences during the‘on-time’ will be discussed later.
The optical emission spectroscopic studies in the oxide mode focused on the same emissionlines that were studied in the metallic mode, but also included the O 777 nm line, which is notpresent in the metallic mode. The Ar 750 and 764 nm lines as well as the Al and Ti lines exhibit
New Journal of Physics 7 (2005) 90 (http://www.njp.org/)

12 DEUTSCHE PHYSIKALISCHE GESELLSCHAFT
a temporal behaviour in the oxide mode that is similar to their behaviour in the metallic mode(figures 4 and 6). The O 777 nm line appears to decay in a fashion similar to the Ar 750 nm line.However, a detailed analysis shows that the decay of this line is rather complex and requiresa double exponential fit yielding two decay times of about 1 and 4 µs, respectively. The firstdecay constant is consistent with the approximately 1 µs decay constant obtained for the fastdecayingAr emission lines and can thus be attributed to the decay of the fast beam electrons in theplasma afterglow. The emitting O atoms can in principle be produced in a single-step dissociativeexcitation process from ground-state O2 molecules as well as via a two-step process, in whichthe O2 molecule is first dissociated by electron impact into two ground-state O atoms and theO atoms are subsequently excited in a second electron collision process. The first process requiresa minimum electron energy of more than 16 eV. The O2 neutral dissociation proceeds primarilythrough the A 3�+
u and B 3�−u states which requires minimum energies of about 6 and 8.4 eV,
respectively [33]. The subsequent excitation of the O atoms requires more than 10 eV. Thus, bothpathways to the formation of excited O atoms require electrons of comparatively high energyand it is not surprising that the temporal decay of the O emission line initially follows that of thedisappearance of the fast beam electrons. The second decay constant of about 4 µs is close to thedecay constant obtained for the Ar 764 and 772 nm emission lines. Therefore, it is reasonableto attribute the slow decay of the oxygen line either to the decay of the Ar metastable densityassuming, e.g., Penning excitation of oxygen by Ar metastables, or to O diffusion out of theviewing region of our optical detection system. We note that O atoms which are produced withsignificant access to kinetic energy in the O2 dissociation (more than 1.2 eV) have a residencetime in the viewing area of our optical detection system that is comparable or even shorter thanthe observed 4 µs decay time. However, the bulk of the O atoms have access to kinetic energiesbelow about 1.2 eV [34] and residence times ranging from about 6 to 20 µs. It is difficult to assessquantitatively to what extent, if at all, these residence times impact on the measured decay timeof the oxygen line.
3.2. Results of measurements during the ‘on-time’
The negative voltage pulse that is applied to the magnetron at the beginning of the ‘on-time’shows a very narrow voltage overshoot followed by an oscillatory behaviour before stabilizing(figures 3 and 4). The oscillations have a much lower frequency than the oscillations observedat the beginning of the ‘reverse time’. The voltage overshoot is most likely caused by the pulsedpower supply and was seen even when the deposition system was replaced in the circuit by apurely ohmic resistor. The current, which becomes an ion current, does not show an overshoot,but also shows some oscillations similar to the voltage oscillations. These voltage and currentoscillations may be related to plasma instabilities.
The current at the beginning of the ‘on-time’ is a combination of a displacement current andconduction current. The displacement current is related to the formation of the plasma sheathas discussed below. The plasma sheath is formed in a few microseconds and the displacementcurrent disappears. During the remainder of the ‘on-time’, the cathode current is determined byion bombardment of the cathode and is essentially constant.
The plasma density increases rapidly at the beginning of the ‘on-time’(figures 3 and 4). Thisrapid increase is followed by a much slower increase throughout the remainder of the ‘on-time’.The electron temperature increases sharply showing a very narrow peak of more than 15 eV witha temporal fwhm (full width at half maximum) of less than a microsecond that appears to mimic
New Journal of Physics 7 (2005) 90 (http://www.njp.org/)
13 DEUTSCHE PHYSIKALISCHE GESELLSCHAFT
the voltage overshoot [17] and then declines very gradually to a value in the range 4–5 eV. Theinitial increase in both the plasma density and the electron temperature and, especially the sharppeak in the electron temperature, are related to both the voltage overshoot and to the sheathformation.
The sheath formation proceeds in a few steps [35]. Since the plasma density does not go tozero at the end of the ‘reverse time’, there is a residual rarified plasma present at the beginning ofthe ‘on-time’. The electrons near the cathode are rapidly accelerated away from it by the electricfield and an ion matrix sheath is formed. This occurs at a time that is determined by the electronplasma frequency, i.e. by the residual low plasma density at the end of the previous ‘reversetime’ and is of the order of a few nanoseconds to several tens of nanoseconds. The magneticfield of the magnetron redirects the accelerated electrons in a direction that is parallel to thesurface of the target, which increases the time required for the formation of the matrix sheath.These accelerated electrons are most likely the reason for the observed spike in the electrontemperature. Further development of the sheath involves a rearrangement of the ion density,which occurs on a timescale that is approximately five times the inverse ion plasma frequency[35], about a microsecond in the present case. Experiments show that the stabilization of theplasma in the vicinity of the substrate takes much longer by comparison. The reason for the slowplasma re-establishment near the substrate is not understood.
The plasma potential in the oxide mode is more negative by about 5–20V than in the metallicmode and is negative with respect to the ground potential. This is most likely caused by the thinoxide layer that is eventually deposited on the anode and on the walls of the reaction chamber.
The temporal behaviour of the Ar 750, Ar 764, Al 396 and Ti 398 nm line emissions are verydifferent when the plasma is re-established at the beginning of the ‘on-time’. The Ar 750 nm linerises rapidly and overshoots the steady-state level of the emission intensity, which is reachedafter about 10 µs. The Ar 764 nm line exhibits a much less pronounced overshoot and reachesits steady-state intensity level after about 5 µs. By contrast, the intensities of the Al and Ti linesincrease much more slowly. There is no overshoot in the emission intensity and the lines do notreach their steady-state intensity level until more than 10 µs after the voltage pulse has beenapplied. This different behaviour of the lines can be understood on the basis of the temporalbehaviour of the voltage and discharge current when the plasma is re-established (figure 4).The initial voltage overshoot produces a significant amount of energetic beam electrons, whichin turn, leads to a significant population of the emitting level of the Ar 750 nm line duringthat period. Since the emitting level of the Ar 764 nm line is not as efficiently excited fromthe Ar ground state as that of the 750 nm line, the overshoot in the emission intensity of the764 nm line is less pronounced. The gradual increase of the emission intensities of the Al 396 nmand Ti 398 nm lines, on the other hand, is due to the slowly increasing number density of Aland Ti atoms, which is largely determined by the slow increase of the discharge conductioncurrent.
The temporal behaviour of the plasma density and the electron temperature during the‘on-time’ show some minor differences in the oxide mode (with the Al target) compared tothe metallic mode. While the respective decrease (at the beginning of the ‘reverse time’) andincrease (at the beginning of the ‘on-time’) are similar, the plasma density during the ‘on-time’in the oxide mode is higher than in metallic mode as is the average electron temperature. Thehigher plasma density is due to the higher cathode current. The cathode current in the oxide modeis also higher compared to the metallic mode (at the same power) due to the higher secondaryelectron emission from the oxidized target [36].
New Journal of Physics 7 (2005) 90 (http://www.njp.org/)

14 DEUTSCHE PHYSIKALISCHE GESELLSCHAFT
The optical emission spectroscopic studies in the oxide mode show results that are similarto those in the metallic mode. At the beginning of the ‘on-time’, the Ar 750 nm line recorded withTi as a target has a narrow peak at the beginning of the ‘on-time’ that corresponds to the voltageovershoot (figure 6). By contrast, the O 777 nm line does not exhibit a pronounced overshoot.Subsequently, for a period of few microseconds, the optical emissions of all Ar lines and ofthe O line increase faster than the current. This indicates the important role of the fast beamelectrons, whose density in the plasma decreases as the sheath is formed. Thus, the early part ofthe ‘on-time’ is more favourable for the generation of radicals than for sputtering.
4. Conclusions
We used time-resolved Langmuir probe measurements in conjunction with time-resolved opticalemission spectroscopic studies to characterize the properties of pulsed dc magnetron plasmas.We show how a combination of time-resolved Langmuir probe measurements and time-resolvedoptical emission studies of pulsed dc magnetron plasmas can be used to extract more detailedinformation regarding the temporal variations of the critical plasma parameters and plasmaspecies that can be obtained from only probe studies or from only optical measurements. Themeasurements were carried out using Al and Ti targets in Ar (metallic mode) or in Ar/O2
(oxide mode). Cathode voltage and cathode current were recorded during the ‘reverse time’ and‘on-time’ of the pulsed dc and correlated with data extracted from Langmuir probe studies(plasma potential, plasma density and electron temperature) and optical emission spectroscopicstudies using several Ar lines as well as Al and Ti lines in the metallic mode or the O 777 nmline in the oxide mode.
When the plasma power is turned off at the beginning of the ‘reverse time’, the plasmadensity near the substrate decays initially very fast with a decay time of about 1 µs or less,which is attributed to the loss of the fast beam electrons in the plasma. This notion is supportedby the initial decay of the Ar 750 nm line and the O 777 nm line, which have about the samedecay constant. Subsequently, the plasma density and the intensity of all emission lines decaymuch more slowly with time constants around 4 µs. Since the bi-polar diffusion of the slow bulkelectrons and the ions to the walls of the reaction chamber has a time constant in the range ofa few tens of microseconds, other processes must be responsible for the 4 µs decay constants.Since the generation of Al and Ti atoms stops abruptly at the beginning of the ‘reverse time’,we attribute the observed 4 µs decay time to the diffusion of metastable Ar atoms and Al and Tiatoms in the metallic mode or O atoms in the oxide mode out of the viewing range of our opticaldetection system. In addition, Penning excitation of atomic oxygen by metastable Ar states andthe electron-impact excitation out of metastable Ar states are likely to occur. Penning excitationof Al and Ti by Ar metastable states cannot be excluded, even though the energy difference iscomparatively large, which renders it as a rather inefficient process.
When the negative voltage is abruptly turned on at the beginning of the ‘on-time’, apronounced voltage overshoot is observed accompanied by a rapid increase in the plasma densityin a fraction of a microsecond and a narrow peak in the electron temperature. Subsequently, theplasma density increases more slowly during plasma re-establishment and the formation of thesheath, which requires a few microseconds depending to a large extent on the residual density ofthe rarefied plasma that is still present at the end of the ‘reverse time’. The intensities of the Arand O lines show a more or less pronounced overshoot at the beginning of the ‘on-time’, which
New Journal of Physics 7 (2005) 90 (http://www.njp.org/)
15 DEUTSCHE PHYSIKALISCHE GESELLSCHAFT
is not found in the cathode current and the plasma density. By contrast, the emission intensitiesof Al and Ti lines follow the rise in the discharge conduction current.
Acknowledgments
This work was supported in part by the US National Science Foundation (NSF), by the US ArmyTACOM/ARDEC under contract DAAE30-00-D-1011 DO#20-1 (Picatinny Arsenal), and byAdvanced Energy Industries, Inc. Partial financial support of this work by the NSF through anAGEP grant to JL is also gratefully acknowledged. JL was also a recipient of a MAC DoctoralFellowship from the State of New Jersey.
References
[1] Schiller S, Goedicke K, Reschke J, Kirchhoff V, Schneider S and Milde F 1993 Surf. Coat. Technol. 61 331[2] Scholl R 1993 36th Annual Technical Conf. Proc. (Dallas) (Society of Vacuum Coaters) p 405[3] Westwood W D 1990 Handbook of Plasma Processing Technology ed S M Rossnagel, J J Cuomo and W D
Westwood (Park Ridge, NJ: Noyes Publications) p 233[4] Frach P, Heisig U, Gottfied C and Walde H 1993 Surf. Coat. Technol. 59 177[5] Schneider J M and Sproul W D 1997 40th Annual Technical Conf. Proc. (New Orleans, LA) (Society of Vacuum
Coaters) p 301[6] Kelly P J and Arnell R D 1998 J. Vac. Sci. Technol. A 16 2858[7] Kelly P J and Arnell R D 1999 J. Vac. Sci. Technol. A 17 945[8] Este G O and Westwood W D 1998 98/1 Reactive Sputtering ed W D Westwood (Bristol: Institute of Physics
Publishing) pp A5.2:1–A5.2:9[9] Belkind A, Freilich A and Scholl R 1998 Surf. Coat. Technol. 108–109 558
[10] Glocker D A 1993 J. Vac. Sci. Technol. A 11 2989[11] Mahoney L J, McDonough G W, Carter D C, Roche G A and Valde H V 1999 Substrate and plasma heating
within high frequency bi-polar pulsed magnetron sputtering applications Proc. 46th Int. AVS Symp. (Seattle,WA, 25–29 October)
[12] Kelly P J, Hall R, O’Brein J, Bradley J W, Roche G and Arnell R D 2001 Surf. Coat. Technol. 142–144 635[13] Bradley J W, Backer H, Aranda-Gonzalvo Y, Kelly P J and Arnell R D 2002 Plasma Sources Sci. Technol. 11,
165–74[14] Backer H, Henderson P S, Bradley J W and Kelly P J 2003 Surf. Coat. Technol. 174–175 909–13[15] Miyagi T, Kamei M, Ogawa T, Mitsuhashi T, Yamazaki A and Sato T 2003 Thin Solid Films 442 32–5[16] Bradley J W, Backer U H, Kelly P J and Arnell R D 2001 Surf. Coat. Technol. 135 221–8[17] Bradley J W, Backer U H, Kelly P J and Arnell R D 2001 Surf. Coat. Technol. 142–144 337–41[18] Belkind A, Zhao Z, Carter D, McDonough G, Roche G and Scholl R 2001 Time-resolved investigation of
pulsed dc magnetron plasma Proc. Int. Conf. on Metallurgical Coatings and Thin Films, ICMCTF 2001(April 30–May 4, San Diego, CA)
[19] Bradley J W, Karkari S K and Vetushka A 2004 Plasma Sources Sci. Technol. 13 189–98[20] Misina M, Bradley J W, Backer H, Aranda-Gonzalvo Y, Karkari S K and Forder D 2003 Vacuum 68 171–81[21] Cornett M, George M, Walde H, Casson L and Pini R 2002 SVC 45th Annu. Technol. Conf. Proc. pp 335–40[22] Pajdarová A D, Vlcek J, Belshy P and Musil J 2003 Proc. XXVI Int. Conf. on Phenomena in Ionized Gases
(ICPIG) (Greifswald) vol 1, pp 139–40[23] Lopez J, Zhu W, Freilich A, Belkind A and Becker K 2005 J. Phys. D: Appl. Phys. 38 at press[24] Dony M F Richard A, Dauchot J P, Hecq M and Wautelet M 1995 Surf. Coat. Technol. 74–75 479–84[25] Raizer Y P 1997 Gas Discharge Physics (Berlin: Springer)[26] Rossnagel S M and Kaufman H R 1986 J. Vac. Sci. Technol. A 4 1822
New Journal of Physics 7 (2005) 90 (http://www.njp.org/)
16 DEUTSCHE PHYSIKALISCHE GESELLSCHAFT
[27] Goeckner M J, Goree J and Sheridan T E 1991 IEEE Trans. Plasma Sci. 19 301[28] Bingsen H and Zhou C 1992 Surf. Coat. Technol. 50 111[29] Belkind A and Orban Z 1993 J. Vac. Sci. Technol. A 11 642[30] Sheridan T E, Goeckner M J and Goree J 1998 J. Vac. Sci. Technol. A 16 2173[31] Shon C H and Lee J K 2002 Appl. Surf. Sci. 192 256–69[32] Belkind A and Jansen F 1998 Surf. Coat. Technol. 99 52[33] Becker K, Schmidt M, Viggiano A A, Dressler R and Williams S 2005 Non-Equilibrium Air Plasmas at
Atmospheric Pressure ed K Becker, U Kogelschatz, K H Schoenbach and R J Barker (Bristol: Institute ofPhysics Publishing) pp 124–82
[34] Cosby P C 1993 J. Chem. Phys. 98 9560–9[35] Anders A 2004 Surf. Coat. Technol. 183 301–11[36] Chapman B 1980 Glow Discharge Processes (New York: Wiley)[37] Griem H R 1997 Principles of Plasma Spectroscopy (Cambridge: Cambridge University Press)
New Journal of Physics 7 (2005) 90 (http://www.njp.org/)