Characterization of copolymers by gradient polymer … of Copolymers by Gradient Polymer Elution...
139
Characterization of copolymers by gradient polymer elution chromatography Cools, P.J.C.H. DOI: 10.6100/IR522345 Published: 01/01/1999 Document Version Publisher’s PDF, also known as Version of Record (includes final page, issue and volume numbers) Please check the document version of this publication: • A submitted manuscript is the author's version of the article upon submission and before peer-review. There can be important differences between the submitted version and the official published version of record. People interested in the research are advised to contact the author for the final version of the publication, or visit the DOI to the publisher's website. • The final author version and the galley proof are versions of the publication after peer review. • The final published version features the final layout of the paper including the volume, issue and page numbers. Link to publication Citation for published version (APA): Cools, P. J. C. H. (1999). Characterization of copolymers by gradient polymer elution chromatography Eindhoven: Technische Universiteit Eindhoven DOI: 10.6100/IR522345 General rights Copyright and moral rights for the publications made accessible in the public portal are retained by the authors and/or other copyright owners and it is a condition of accessing publications that users recognise and abide by the legal requirements associated with these rights. • Users may download and print one copy of any publication from the public portal for the purpose of private study or research. • You may not further distribute the material or use it for any profit-making activity or commercial gain • You may freely distribute the URL identifying the publication in the public portal ? Take down policy If you believe that this document breaches copyright please contact us providing details, and we will remove access to the work immediately and investigate your claim. Download date: 17. Jun. 2018
Transcript of Characterization of copolymers by gradient polymer … of Copolymers by Gradient Polymer Elution...
Characterization of copolymers by gradient polymerelution chromatographyCools, P.J.C.H.
DOI:10.6100/IR522345
Published: 01/01/1999
Document VersionPublisher’s PDF, also known as Version of Record (includes final page, issue and volume numbers)
Please check the document version of this publication:
• A submitted manuscript is the author's version of the article upon submission and before peer-review. There can be important differencesbetween the submitted version and the official published version of record. People interested in the research are advised to contact theauthor for the final version of the publication, or visit the DOI to the publisher's website.• The final author version and the galley proof are versions of the publication after peer review.• The final published version features the final layout of the paper including the volume, issue and page numbers.
Link to publication
Citation for published version (APA):Cools, P. J. C. H. (1999). Characterization of copolymers by gradient polymer elution chromatographyEindhoven: Technische Universiteit Eindhoven DOI: 10.6100/IR522345
General rightsCopyright and moral rights for the publications made accessible in the public portal are retained by the authors and/or other copyright ownersand it is a condition of accessing publications that users recognise and abide by the legal requirements associated with these rights.
• Users may download and print one copy of any publication from the public portal for the purpose of private study or research. • You may not further distribute the material or use it for any profit-making activity or commercial gain • You may freely distribute the URL identifying the publication in the public portal ?
Take down policyIf you believe that this document breaches copyright please contact us providing details, and we will remove access to the work immediatelyand investigate your claim.
Download date: 17. Jun. 2018


ÜIARACTERIZA.TION OF CO POL YMERS BY GRADIENT
POLYMER El.UTION ÛIROMATOGRAPHY

OP-DATA UBRARY TEOINISOIE UNIVERSITEIT EINDHOVEN
Cools, Paul J.C.H.
Characterization of copolymers by gradient polymer elution chromatography 1 by
Paul].C.H. Cools. - Eindhoven: Technische Universiteit Eindhoven, 1999.
Proefschrift. - ISBN 90-386-0970-1
NUGI 813
Trefvvoorden: copolymeren 1 polymeren; chromatografie 1 polymeren; chemische
analyse I vloeistofchromatografie
Subject headings: copolymers I polymers; chromatography I elution
chromatography
©Copyright 1999, P.J.C.H. Cools
Omslagontwerp: Ben Mobach
Druk: Universiteitsdrukkerij Technische Universiteit Eindhoven
Characterization of Copolymers by Gradient Polymer Elution Chromatography
PROEFSCHRIFT
ter verlaijging van de graad van doctor aan de Technische Universiteit Eindhoven, op gezag van de Rector Magnificus, prof.dr. M. Rem, voor een commissie aangewezen door het College voor Promoties in het openbaar te verdedigen op donderdag 27 mei 1999 om 16.00 uur
door
Paulus josephus Christiaan Henricus Cools
geboren te Tilburg

Dit proefschrift is goedgekeurd door de promotoren:
prof.dr.ir. A.L. German
en
prof.dr.ir. P.J. Schoenmakers
Copromotor:
dr.ir. B. Klumperman
Akzo Nobel financially supported the work described in this thesis.

"Everybody's looking 4 the ladder
Everybody wants salvation ofthe soul
The steps U take are no easy road
But the reward is great 4 those whowant to go
Everybody's looking 4 the answers
How the story started and how it willend
Wh a t's the use in half a story, half a dream
U have 2 climb all ofthe steps in between"
From The ladder
Lyrics by john L. Nelson & Prince R. Nelson
<1:! Controver>y MUS!C A.S.C.JIP.
Aan mijn ouders
Table of Contents
TABLE OF CONTENTS
Chapter 1
Introduetion
1.1 Introduetion
1.2 Outline ofthe Thesis
1.3 References
Chapter 2
Various Aspects of Gradient Polymer Elution Chromatography
2.1 Introduetion
2.2 GPEC Conditions
2.3 lsoeratic Mechanisms
2.3.1 ExclusionfDepletion
2.3.2 Sorption
2.3.3 Critica! Conditions
2.4 Gradient Mechanism
2.4.1 PrecipitationfRedissolution Mechanism
2.4.2 Column Interactions
2.5 Reversed Phase GPEC and Normal Phase GPEC
2.6 Retention ofPolymers ofHigh MolarMass
2. 7 Applications of GPEC
2.8 GPEC in Combination withOther Analytica! Techniques
2.9 Conclusions
2.10 References
1
1
2
3
5
6
6
7
8
9
11
14
14
18
19
20
21
23
24
24
ü Table of Contents
Chapter 3
Other Analytica! Tecbniques Applied to Characterize Copolymers
3.1 Introduetion
3.2 Size Exclusion Chromatography
3.3 Introduetion to Mass Speetrometry ofPolymers
3.3.1 Electrospray lonization Mass Speetrometry
3.3.2 Matrix Assisted Laser Desorption lonization Mass Speetrometry
3.3 References
Chapter 4
The Microstructural Analysis of Homopolyesters ofNeopentyl Glycol with
Isophthalic Acid and Terephthalic Acid
4.1 Introduetion
4.2 Experimental
42.1 Synthesis of Polyesters
4.22 Size Exclusion Chromatography
4.2.3 Gradient Polymer Elution Chromatography
4.2.4 Electrospray-lonization Mass Speetrometry
4.2.5 Matrix-Assisted-Laser-Desorption-Ionization Mass Spectroscopy
4.3 Results and Discussion
4.3.1 Size Exclusion Chromatography
4.3.2 Reversed-Phase-Gradient Polymer Elution Chromatography
4.3.3 Gradient Elution Mechanism ofRP-GPEC
4.3.4 Reversed Phase Chromatogram with Hexafluoro lsopropanol
4.3.5 Separation According to Functionality by NP-GPEC
4.4 Conclusions
4.5 References
27
28
28
29
30
32
33
35
36
38
38
38
39
41
41
42
44
45
55
57
58
61
62

Table of Contents
Chapter 5
Gradient Polymer Elution Chromatography of Ciystalline Polyesters
5.1 Introduetion
5.2 Crystallinity
5.3 Expertmental
5.3.1 Polyester Samples
5.32 Determination ofCrystalline Phase
5.3.3 Gradient Polymer Elution Chromatography
5.4 Results and Discussion
5.4.1 Gradient Polymer Elution Chromatography
5.4.1.1 Water and Tetrahydrofuran
5.4.1.2 Water and Hexafluoro Isopropanol
5.4.1.3 Acetonitrile and Tetrahydrofuran
5.4.1.4 Acetonitrile and Hexafluoro lsopropanol
5.4.1.5. Water, Acetonitrile and Tetrahydrofuran Gradient
5.5 Conclusions
5.6 References
Chapter 6
Tbe Microstructural Analysis of Copolyesters
6.1 Introduetion
6.2 Experimental
6.2.1 Synthesis of Copolyesters
6.2.2 Analytica! Techniques
6.3 Results and Discussion
6.3.1 Size Exclusion Chromatography
6.3.2 Separation of Copolyesters by GPEC
6.3.3 Trans-Esterfication of Homopolyesters
6.3.4 Commercial Samples
6.4 Conclusions
6.5 References
iü
65
66
66
68
68
69
69
70
72
72
75
75
76
77
79
80
81
82
82
82
83
84
84
85
94
95
97
97

iv
Chapter 7
Characterization ofBlock Copolymers by Gradient Polymer
Elution Chromatography (GPEC)
7.1 Introduetion to Block Copolymers
7.2 Characterization ofBlock Copolymers
7.3 Characterization ofBlock Copolymers by GPEC
7.4 Strategy
7.5 Experimental
7.5.1 Block Copolymer Samples
7.5.2 Free-Radically Prepared Block Copolymers
7.5.3 Anionically Prepared Block Copolymers
7.5.4 Homopolymer Standards
7.5.5 Size Exclusion Chromatography
7.5.6 Reversed Phase GPEC
7.5.7 Normal Phase GPEC
7.6 Results and Discussion
7.6.1 Size Exclusion Chromatography
7.6.1.1 Free-Radically Prepared Block Copolymers
7.6.1.2 Anionically Prepared Block Copolymers
7.62 Reversed Phase GPEC
7.6.2.1 Free-Radically Prepared Block Copolymers
7.62.2 Anionically Prepared Block Copolymers
7.6.3 Normal Phase GPEC
7.6.3.1 Free-Radically Prepared Block Copolymers
7.6.3.2 Anionically Prepared Block Copolymers
7.7 Conclusions
7.8 References
Epilogue
List ofSymbols and Abbreviations
summary
Samenvatting
Dankwoord
Curriculum Vitae
Table ofContents
99
100
101
103
103
105
105
105
106
106
107
107
107
108
108
108
110
111
112
116
117
117
119
120
120
123
125
127
129
131
133

Introduetion 1
Chapter 1
Introduetion
11._ INTRODUeTION
Due to the increasing complexity and variability of polymer architectures, analytica!
techniques for the determination (or verification) of their chemica! composition have become
increasingly important. This sterns from the application of different types of monomers, the
development of novel polymer architectures, and new polymerization techniques (e.g.
controlled 'living'). In the specific case of copolymers, the properties of these materials are
governed by their microstructure, which is defmed by the rnalar mass distribution (MMD),
functional end groups, chemica! structure and chemica! composition distribution (CCD). The
microstructure of copolymers can be investigated by several techniques: size exclusion
chromatography (SEC) can be applied to determine the molar mass distribution (MMD),
titration can be used to obtain information on functional end groups, and spectroscopie
techniques, such as Nuclear Magnetic Resonance (NMR) and Infrared (IR) spectroscopy, reveal
information on the average chemica! composition of copolymers. However, the properties of
a copolymer do not only depend on the molar mass distribution (MMD) and the average
chemica! composition, but also on the chemica! composition distribution (CCD). For example,
during batch copolymerizations, composition drift is likely to occur, which may result in a
chemically heterogeneaus copolymer mixture with inferior mechanica! properties [1). Thus,
knowledge about the chemica! composition distribution is crudal when copolymers are
considered.
Formerly, thin layer chromatography (TLC) was applied to determine the CCD of
copolymers [2,3,4] . However, TLC is time-consuming and the reproducibility is poor compared

2 Chapterl
to gradient elution high performance liquid chromatography (HPLQ [5]. Gradient elution
HPLC applied to synthetic homopolymers was already described by Van der Maeden et al. [6) in
1978. The authors described the separation of homopolymers, such as poly(ethylene
terephthalate) and poly(ethylene oxide), according to molar mass and functionality. The
application of gradient HPLC for the separation of copolymers was introduced in 1978 by
Teramachi et al. [7]. They reported the separation of styrenefmethyl methacrylate copolymers,
and later publisbed additional workin the field of copolymer analysis [8,9,10]. Glöckner et al.
[5,11-20] and Moriet al. [21-24] also described the separation of several types of copolymers by
gradient elution HPLC.
A general name for the analysis of polymers by gradient elution HPLC was introduced by
Staal [25]; gradient-polymer-elution-chromatography (GPEQ. The application of GPEC already
has been described for different polymers [26-28]. In this thesis, some applications of GPEC to
synthetic polymers will be described. The separation mechanism of GPEC is based on a
combination of a precipitationfredissolution mechanism and a mechanism controlled by
column interactions (sorption and steric exclusion). The name GPEC does not refer to a
specific mechanism, but solely describes the technique (Gradient Elution Chromatography)
and the application (Polymers).
GPEC can primarily be applied todetermine the CCD [7-10], and the end group distribution
(also known as the functional type distribution FTD [29]). Within certain limitations GPEC can
also be used for the determination ofthe MMD (29].
In this thesis the application of GPEC for the characterization of copolymers will be
discussed. Separation according to molar mass. chemica! composition, functional type, and
block structures will be presented. The general objective of this study is to investigate and
broaden the applicability of GPEC for the analysis of synthetic polymers.
In Chapter 2 important aspects of the GPEC separation are descri bed. The GPEC prindples
will be discussed based on data from literature and on new experimental data. Examples of
the separation of polymers according to the molar mass, functionality, and chemica!
composition ofhomopolymers and copolymers will be discussed.
In addition to GPEC, other techniques, such as SEC and mass spectrometric techniques
have been used for characterization of the polymers described in this thesis. In Chapter 3 the
principles of SEC, electraspray ionization mass speetrometry (ESI-MS) and matrix-assisted
laser-desorption-ionization mass speetrometry (MALDI-MS) will be briefly described.
The GPEC separation of polyesters of neopentyl glycol (NPG) with isophthalic acid (IA) and
with terephthalic acid (TA) will be discussed in Chapter 4. Homopolyesters (consisting of one
type of acid and NPG) were synthesized as model components. ESI-MS and MALDI-MS were
applied to identify the peaks obtained with the GPEC separation, and SEC was used to
determine the MMD of the homopolyesters.

Introduetion 3
The influence of the crystallinity of the homopolyesters on the retention behavior with
various solvent/non-solvent combinations is discussed in Chapter 5. Additionally, the (semi-)
crystalline behavior of the homopolyesters was investigated by differentlal scanning
calcrimetry (DSQ. polarized light microscopy and X-ray diffraction.
In Chapter 6 the microstructural analysis of copolyesters by GPEC and ESI-MS is descri bed.
Copolyesters with different IA/TA ratios have been synthesized as model polymers. The
experimental chemkal composition distribution (CCD} of the different copalyester samples
bas been compared to the CCD calculated from the statistics ofthe esterfications. Commercial
samples containing IA/TA/NPG monoroers with similar overall chemica! compositions were
compared using GPEC.
In Chapter 7 the application of GPEC to block copolymers is described. When block
copolymers are synthesized, the blocks can be chemically bonded or when side reactions
occur, can be present in the polymer sample as individual homopolymers. The question to
what extent the blocks are chemically bonded can be answered by applying GPEC.
Spectroscopie techniques only give the average chemica! composition of block copolymer
samples. GPEC will be used to characterize block copolymers of styrenefbutadiene and
styrenejisoprene.
Finally, in the epilogue, the status of analytica! techniques, and especially GPEC, in
modern analytica! polymer research will be discussed. The major advantages and drawbacks
of GPEC and future possibilities of using GPEC in combination with other analytica!
techniques will be points of discussion.
1.3 REPERENCES
1. H.A.S. Schoonbrood, "Emulsion Co- and Terpolymerization", Ph.D. thesis, Eindhoven University of Technology, 1994.
2. H. Inagaki, M. Matsuda and F. Kamiyand, Macromolerules, 1, 520 {1968). 3. J.CJ.F. Tacx, J.L. Ammerdorffer and A.L. German, Polymer, 29, 2087·2094 {1988). 4. J.CJ.F. Tacx and A.L. German, Polymer, 30, 918-927 {1989) . 5. G. Glöckner, "Gradient HPLC of Copolymers and Chromatographic Cross Fractionation", Springer
Verlag Berlin Heidelberg. 1991. 6. F.P.B. van der Maeden, M.E.F. Biemond and P.C.G.M.Janssen,j. Chromatogr., 149,539-552 {1978). 7. S. Teramachi, A. Hasegawa, Y. Shima, M. Akatsuka and M. Nakajima, Macromolerules, 12 (5), 992-
996 {1979). 8. S. Teramachi, A. Hasegawa, Y. Shigekuni and S. Natunaga, Polymer ].. 21 (10), 803-808 {1989). 9. S. Teramachi, A. Hasegawa and K. Motoyama, Polymer ]. , 22 (6), 489-496 {1990). 10. S. Teramachi, A. Hasegawa, Y. Shigekuni, K. Zenta and M. Hashimoto,]. Appl. Polym. Sd.: Appl.
Polym, Symp., 45,87-102 {1990). 11. G. Glöckner, Chromatographia, 23 (7), 517-524 {1987) . 12. G. Glöckner, Pure & Appl. Chem., 55 (10), 1553-1562 {1983). 13. G. Glöckner and D. llchmann, Acta Polym., 35 (11), 68().683 {1984) . 14. G. Glöckner and J.H.M. van den Berg,]. Chromatogr. , 384, 135-144 {1987). 15. G. Glöckner, M. Stickierand W. Wunderlich, Fresenius Z. Anal. Chem., 328, 76-81 {1987). 16. G. Glöckner,j. Chromatogr., 403, 28().384 {1987).

4 Chaptert
17. G. Glöckner, M. Stickierand W. Wunderlich, Fresenius Z. Anal. Chem., 330, 4649 {1988}. 18. G. Glöckner, M. Stielder and W. Wunderlich,J. Appl. Polym. Sd., 37,3147-3161 {1989}. 19. G. Glöckner and H. G. Barth,J. Chromatogr., 499, 645-654 {1990). 20. G. Glöckner.]. Appl. Polm. Sd.: Appl. Polym. Symp., 52,45-54 {1992). 21. S. Mori, J. Appl. Polym. Sci.: Appl. Polym. Sci., 43, 65-84 (1989). 22. S. MorÎ.]. Liq. Chromatogr., 13 (15), 3039-3052 {1990}. 23. S. Mori,J. Chromatogr., 503, 411-419 {1990}. 24. S. Mori and H. Taziri,J. Liq. Chromatogr., 17 (14&15), 3055-3068 {1994). 25. W.J. Staal, "Gradient Polymer Elutton Chromatography", Ph.D. Thesis, Eindhoven University of
Technology, Eindhoven, The Netherlands, 1996. 26. B. Klumperman, P. Cools, H. Philipsen and W. Staal, Macromol. Symp., 110, 1-13 {1996). 27. H.J.A. Philipsen, B. Klumperman and A.L. German,J. Chromatogr. A., 746, 211-224 {1996). 28. H.J.A. Philipsen, M.R. de Cooker, H.A. daessens, B. Klumperman and A.L. Germán,J. Chromatogr.
A, 761, 147-162 {1997). 29. Philipsen H.J.A., "Mechanisms of Gradient Polymer Elution Chromatography and its Application
to (Co)Polyesters", Ph.D. Thesis, Eindhoven University ofTechnology, Eindhoven, The Netherlands, 1998.

Various Aspects ofGradient Polymer Elution Chromatography 5
Chapter 2
Various Aspects ofGradient Polymer Blution Chromatography
In this chapter the separation technique gradient polymer elution chromatography (GPEC} is discussed. Different mechanisms that detennine the separation in GPEC, such as the precipitationjredissolution mechanism and the sorption mechanism, will be explained. In addition some applications of GPEC will be given.
6 Chapter2
2.1 lNTRODUCTION
Since the introduetion of gradient elution high-performance-liquid-chromatography [1,2],
this technique has been applied to separate polymer blends [3], random copolymers [4-24]
and block copolymers [25-28]. More recently, GPEC has been applied to determine the
functional type distribution (FID), e.g. end group distribution, of polyesters [29].
In general the working principle of GPEC can be described as follows. A polymer sample is
dissolved in a good solvent. The polymer solution is injected into a non-solvent or a
combination of solvent/non-solvent. The initia! conditions are poor (in solubility terms) for
the polymer molecules and phase separation will occur. Two phases are formed: a polymer
rich phase and a highly diluted solvent phase. After phase separation the polymer molecules
are retained in the system. After injection a gradient from the initia! conditions to the good
solvent is applied and during this gradient redissolution of the polymer molecules occurs.
The redissolution point (expressed in volume fraction solvent or non-solvent) highly depends
on the molar mass and the chemica! composition ofthe polymer molecule. When the polymer
molecule is redissolved, interactions with the stationary phase (column interactions) will
further control the separation.
Different polymer chromatographic mechanisms are involved, which can be divided into
two groups: precipitation{redissolution mechanisms, and mechanisms dominated by column
interactions. The column interactions occurring in GPEC are similar to the interactions of the
isoeratic mechanisms. Unlike in isoeratic chromatography in GPEC the conditions (eluent
composition) change gradually in time.
Similar to HPLC, different types of chromatography can be applied viz. normal-phase mode
(NP-GPEC) and reversed-phase mode (RP-GPEC). RP-GPEC is applied with a non-polar column in
combination with an eluent decreasing in polarity, e.g. a waterftetrahydrofuran gradient on a
Silica C18 column. NP-GPEC is performed with a combination of an eluent increasing in
polarity and a polar column, e.g. a dichloro methane{tetrahydrofuran gradient on a silica
column.
In this chapter different aspects of GPEC will be discussed. The isoeratic retention
mechanisms will be used to describe the GPEC retention mechanism. At the end of this
chapter the GPEC separation based on molar mass and chemica! composition will be
illustrated by some applications of RP-GPEC and NP-GPEC. However, before the GPEC
separation mechanism is described, different GPEC parameters will be briefly explained.
2.2 GPEC CoNDmONS
The separation achieved by GPEC depends on a number of factors. namely the applied
solvent system (solvent and non-solvent), the type of column, the column temperature. the
applied gradients (gradient curve, flow, initia! conditions and end (or final) conditions). and

Various Aspects of Gradient Polymer Elution Chromatography 7
injection conditions (volume, concentration, and sample solvent). Philipsen studied the
influence of GPEC conditions on the separation of polyesters in more detail [29]. The
contribution ofthe factors mentioned above will be briefly discussed.
The role of the solvent/non-solvent system is apparent. The solvent has to be a good
solvent of high elution strength for the polymer molecules. The non-solvent should have a
low solvent strength andfor a low eluent strength. The choice of the column is as important
as that of the solvents. In some cases column interactions (sorption and exclusion) are
necessary, in other cases column interactions are preferably avoided (16]. Column
interactions and the precipitationfredissolution depend highly on the temperature, therefore
temperature control is one ofthe conditions for reproducible polymer separations.
The curve and steepness of the gradient determine the separation. A steep gradient can
cause reproducibility and resolution problems. A shallow gradient may cause dereetion
problems (the concentration of the analyte decreases due to sample distribution) and
equipment limitation problems (e.g. switching of eluent selection valves becomes visible).
From previous research it has been found that linear gradients with a steepness of 1 vol% at
a flow rate of 0.5 mi/min are the optima! conditions with respect to analysis time and
(obtained) resolution [30). Shallower gradients do not improve the resolution [29). In genera!,
GPEC separations have a total analysis times of 60 minutes (including the back-to-initial step
in order to perform a subsequent injection).
The initia! conditions of the gradient should be poor enough in terms of solubility or
eluent strength to retain the polymer molecules. This condition can sometimes not be met
and the polymer 'elutes' simultaneously with injected solvent molecules. This phenomenon,
is called breakthrough [31) and occurs when improper initia! conditions are applied or too
large an injection volume is injected. Breakthrough at injection can be avoided by decreasing
the injection volume, increasing the concentration or by applying poorer initia! conditions
with respect to solventand eluent conditions [31] .
The injection volume, the sample concentration and the sample solvent have a large
influence on the final separation re sult. The sample load of polymer should not be too high in
order to avoid viscosity effects and column blocking [16). To avoid solvent effects, the
injection volume should not be too high. The type of sample solvent can be very important,
especially when crystalline polymers are analyzed (see chapter 5). The sample solvent can
either be a good solvent or a combination of the non-solvent/solvent. Injection of a polymer
dispersion can be used to avoid breakthrough ofthe polymer molecules [31].
2.3 lSOCRATIC MECHANISMS
Polymers show completely different chromatographic behavior from small molecules. (In
some cases) The isoeratic retention mechanisms are based on the same principles, but
eventually the effects are totally different. Column interactions of polymers can be divided
into two groups: entropy interactions and enthalpy interactions. Small molecules are mainly

8 Chapter2
subjected to enthalpy interactions. Additional entropy effects are caused by the exclusion or
conformation restrictions ofthe polymer inside the pores and near the walls ofthe column.
The total column volume can be divided into three volumes: the interstitial volume V;. the
pore volume VP and the volume of the stationary phase (V,). The retentien behavior of a
polymer molecule can bedescribed by the retentien equation (Equation 2-1) [16]. An enthalpy
contribution (V,·K. • .J and an entropy contribution (VP·K.ntrl can be distinguished.
Equation 2·1, Retendon equation, where V,... [miJ is the retendon volume, V, [miJ is the interstidal column volume,
v, [miJ is the pore volume, V, [miJ is the volume ofthe stadonary phase, K...,. H is the distribution coejJident basedon
entropy effects, and K..,." H is the distn1lUdon coejJident based on enthalpy e.ffects.
The entropy interactions are exdusion and depletion. They will cause an acceleration of
the polymer molecules (O<K'"" < 1) in comparison to the eluent molecules (K,ncr= 1). The
enthalpy contributions are sorption (adsorption and partitioning), resulting in retentien of
the polymer molecules (K'"m>O). Different types of mutual interactions between polymer,
solvents and stationary phase, such as polymer/solvent and solvent/stationary phase.
determine the overall interaction of polymers.
2.3.1 EXCLUSION/DEPLETION
Entropy effects arebasedon the difference in molar mass (or hydrodynamic volume) ofthe
polymer and the eluent, and are based on steric exclusion of the polymer molecules. Where
the eluent molecules are small and can enter the pores of the column, the polymer molecules
are bigger and can only partly enter the pores. This results in a retentien difference between
the solvent molecules and the polymer molecules, thus, separation according to molecular
size (hydrodynamic volume) is achieved. The HPLC technique that separates polymers
according to this principle is size-exclusion-chromatography (SEQ.
Another entropy effect that occurs in the case of polymers is depletion. A polymer
molecule has fewer conformational possibilities near the surface, which results in depletion
of polymer molecules. Due to the depletion at the surf ace, there is less volume available for
the polymer molecule than for the solvent and separation occurs according to molecular size.
Since more volume is available for the solvent than for the polymer molecules, the solvent
will elute later than the polymer molecule. In genera!. depletion and steric elution are
considered to be identical, therefore entropy effects will be referred to as steric exclusion.
When no enthalpy effects and solely steric exclusion occur during the separation (K •• th=O)
the retentien volume (described in Equation 2-1) reduces to;

Various Aspects of eradient Polymer Elution Chromatography
Equation 2·2, Retendon equation for sterlc exclusion, where V,.. [miJ is the retendon volume, v, [miJ is the
interstitial volume, v, [miJ is the pore volume, and K...,[·J is the distributton coe.tficient based on entropy.
9
The available pore volume, represented by VP·K •• tr' depends on the molecular size. Small
molecules can enter the pores completely (K..tr is equal to 1), and elute at the permeation
limit ofthe column (VP•=~Ni+Vp). Large molecules are totally excluded from the pores !K.ntr is equal to 0) and elute at the exclusion limit ofthe column (Ve:xc1::::VJ. Molecules that can partly
enter the pores are separated according to molecular size. In exclusion mode, i.e. in entropy
driven separations, the dependenee of the molecular size on the retentien volume yields a
curve as depicted in Figure 2-1.
LogM
Figure 2·1, A schematic representation of the dependency of molar mass {M} on the retendon volume (V...} in
exclusion mode. The total exclusion and total permeation volumescan be seen.
Independent of additional column interactions, exclusion and depletion always occur.
Additionally, exclusion influences the amount of surface that is available for sorption of the
polymer molecules. Most of the active surface available for enthalpy interactions in an
analytica! column is present inside the pores, therefore exclusion wil! have a large influence
on the sorption of the polymer.
2.3.2 SORPTION
Sorption [32] is a general name for enthalpy effects, and it depends on the applied column
material and eluent combination. Similar enthalpy interactions are found for polymers and
smal! molecules, but in contrast to low rnalar mass analytes, a polymer molecule consists of
many groups that can interact with the column material, thus 'irreversible adsorption' ofthe
polymer on the column can occur. Adsorption and partitioning are the most common
enthalpy interactions. Adsorption is defined as an interaction of a chemica! group of the
analyte with a chemica! group of the column packing, e.g. hydragen bonding. Adsorption is
mainly based on polar interactions, whereas, partitioning (e.g. between a polar mobile phase
10 Chapter2
and non-polar stationary phase, such as C18 chains) is an interaction that is based on
interactions, such as Van der Waals-interactions. In genera!, adsorption interactions are
much stronger than partitioning interactions.
Polymer molecules can interact via 'multiple attachments' (16]. Different numbers of
segments of the polymer molecules can be attached, which results in a decrease of the
number of possible conformations (decrease in entropy). When only a few segments are
involved, the polymer molecules will be partly in salution and partly attached to the column
material by trains, loops or single point segments. The attachments of different segments do
not occur at the same time. The sorption and desorption of the different segments occur
simultaneously, which results in a dynamic process. The type of attachment will depend on
the type of polyrner (homopolymer, copolymer or block copolymer). However, the exact
nature ofthe attachments is still unlmown [16] .
When only one segment is attached to the column, the total polymer molecule will be
retained and thus elution will only occur when all the segments are desorped [16). The
capacity factor (k), defined as the probability ratio of sorptionfdesorption, depends on the
capacity factor of one single segment.
Jn k = P' D.gsegm + f1g fun<l
pot RT RT
Equation 2-3, The capadty factor, a measure for the probabatry of sorption, where .6&"...,.. U/mol} is the change in
Gibbs free energy of a segment ofthe polymer, .ög.fü"" Dfmol} is the change in Gibbs free energy ofthe .functional
groups, k,., [-} is the capadty factor of a polymer molecule, k,'~"" f-1 is the capadty factor of a single segment, k""" is
capadty factor ofthe end groups and p [-} is the degree of polymerization {33}.
Glöckner (16) calculated that a polyrner molecule with p::::; 100 will be irreversibly attached
when the k,"'" is relatively low (k,tgm::::;2). Values for the capacity factor of2 are normal for low
rnalar mass analytes. Consequently, when the adsorption of a single segment is weak. the
polymer can still be irreversibly attached.
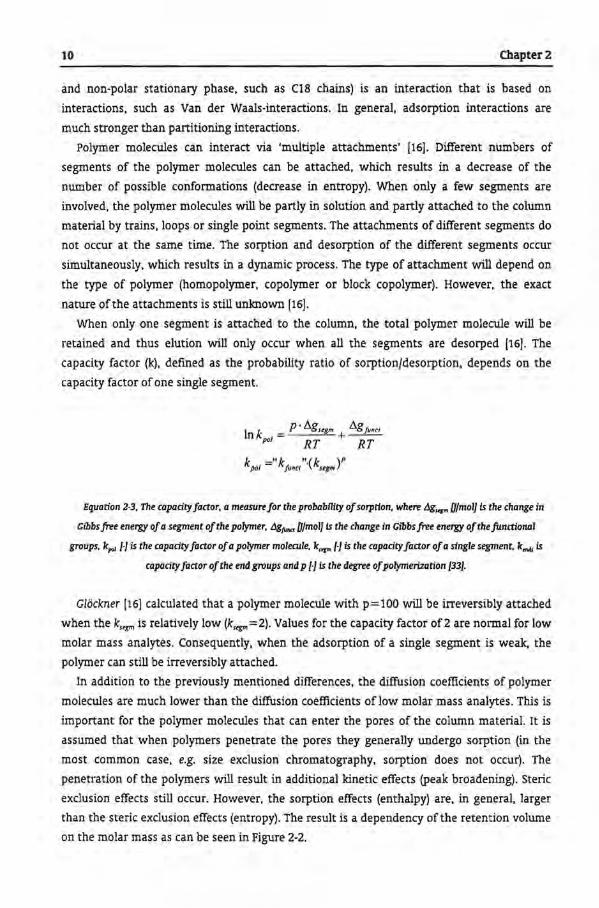
In addition to the previously mentioned differences, the ditfusion coefficients of polymer
molecules are much lower than the ditfusion coefficients of low molar mass analytes. This is
important for the polymer molecules that can enter the pores of the column materiaL It is
assumed that when polymers penetrate the pores they generally undergo sorption (in the
most common case, e.g. size exclusion chromatography, sorption does not occur). The
penetratien of the polymers will result in additional kinetic effects (peak broadening). Steric
exclusion effects still occur. However, the sorption effects (enthalpy) are, in genera!, larger
than the steric exclusion effects (entropy). The result is a dependency ofthe retention volume
on the molar mass as can be seen in Figure 2-2.
Various Aspects ofGradient Polymer Elution Chromatography 11
LogM
Figure 2-2. Schematic representation of the dependency of the molar mass (M) on the reiention volume (V...) in the
sorption mode.
Temperature has a large influence on the sorption of the polymer. The temperature effect
is more pronounced for polar interactions and relatively small for non-polar interactions. The
separation of polystyrenes with a temperature gradient was publisbed by Lee et a/_ [34,35],
who performed temperature-gradient-interaction-chromatography (TGiq under reversed
phase conditions [34] and normal-phase conditions [35] -
2.3.3 CRITICAL CONDIDONS
In isoeratic chromatography of polymers a cancellation of the exclusion mechanism and
the sorption mechanism is possible: the critica) conditions [36-45]. At the critica) conditions
the separation is independent of the molar mass of the polymer and is solely based on the
interaction of the functional end groups of the polymer chains with the column. As can be
expected the critica! conditions depend highly on the temperature [45].
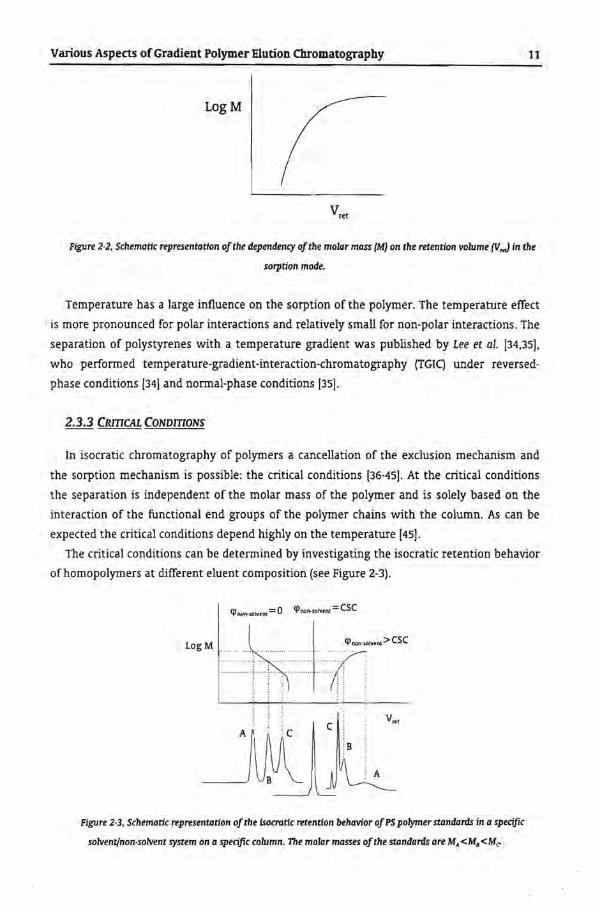
The critica! conditions can be determined by investigating the isoeratic retention behavior
ofhomopolymers at different eluent composition (see Figure 2-3).
<pi'\On-solvtnt = Q <4>non-solv~nt = CSC
LogM · ···· ········~··· ······· · T .. ····.i·~: .. "''"'>CSC ~ i i
Figure 2-3, Schematic representation of the tsoeratic retendon behavior of PS polymer standards. in a spedjic
solvent/non-solvent system on a spedfic column. 111e molar masses ofthe standards are M. <M1 <Me-

12 Chapter 2
The sequence of elution changes by changing the eluent composition. The non-solvent
concentration at which the curve is vertical is the so-called critica! solvent composition (CSC),
i.e. this is the non-solvent concentration at which all molar masses elute simultaneously [44].
An example is the isoeratic retention behavior of polymethyl methacrylate (PMMA) in
waterjacetonitrilefTHF (see Figure 2-4). The PMMA standards show similar behavior as
schematically shown in Figure 2-3. The retention sequence of the PMMA standards changes
with changing ratio of waterjacetonitrile (ACN). The three separation modes can be seen, at
the top the sorption mode, at the bottorn the exclusion mode and in the middle the
approximate critica! mode. The deterrnination and the pro Iongation of the critica! conditions
are difficult.
--PMMA9200 •• • •· PMMA 5720
··· · PMMA 1580
- •···•· PMMA 625 /\ ·· ... I '·. /' I ' ·. ,
25% H,Oi 25% ACN/50% THF
•/ _\ .. J •.
--------------~~~~-~=---------
22.5% H,0/ 22.5% ACN/ 55% THF
:' 15% H10 / 15% ACN/70% THF ' ', _.··
,' ... ·.,
_j['j:_/_\ 1.5 2.0 2.5 3.0 3.5 4.0 4.5 5.0
Relention Time (RT)
Figure 2-4. Isoeratic retennon behavior polymethyl methacrylate standards (625, 1580, 5720 and 9200 Gjmol} in the
solvent system wacerjacetonitrile(THF on a symmetry CIS column {35"C}. The chramatograms at the top are obtained in
sorprion mode, che chromatagmms at the boctam are obtained in the exclusion mode, and the middle chromatograms
are obtained under appraximately critica! conditions.
At isoeratic retention, the Gibbs free energy of a polymer molecule present in the mobile
phase and the stationary phase, is described by Equation 2-4.
Equation 2·4, The Gibbs free ene'ID' {L1G) Ufmol} of a molecule with a polymer backbone ofidentical segments and
with difJerentjimcrional end groups at equilibrium conditions, where L1H .. ,. Ufmol} is the enthalpy change ofthe
backbone, L1Sb"k U/K·mol} is the entropy change ofthe backbone. L1H"'"" U/mol} is the enthalpy change ofthe.funcrional
group, L1S"'"" UfK·mol} is the entropy change ofthejimcrional group and T [KJ is the absolute cemperature.

Various Aspects of eradient Polymer Elution Chromatography 13
The entropy and the enthalpy can be divided in a contribution from the backbene and
from the functional end groups of the polymer chain. The entropy contribution of the
functional end groups ASJuncr is negligible (~Sfunct < <~Sb,cJ. For the different isoeratic
retentien modes the following conditions can be defined:
Exclusion:
Critica! conditions:
Sorption: L1G>O
In exclusion mode the enthalpy contributions of the backbene and the functional end
groups (~Hback=O, ~H~unct=O) are zero. In sorption mode, however, the enthalpy contributions
are much higher than the entropy contribution ofthe backbone. At the critica! conditions the
contribution of the backbene to the separation is zero. The separation is governed solely by
the contributions of the functional groups. The dependenee of the rnalar mass on the
retentien times can be seen in Figure 2-5.
LogM
Figure 2·5. The effect of molar mass on the retendon volume for different isoeratic retendon modes.
The critica! conditions can be used to separate homopolymers with identical chemica!
composition of the backbone, but with different end groups. Consequently, a functional type
distri bution (FTD) of polymers is obtained [42,43]. Also block copolymers can be characterized
with liquid chromatography under critica! conditions (LCCC) (37-41]. The critica! conditions
are applied for one block, and the other block will be separated according to block length by
sorption or exclusion (41].
LCCC has many drawbacks. The critica! point is experimentally difficult to find and
practically hard to maintain. The metbod is very sensitive to impurities in the polymer chain.
Another problem of LCCC is the solubility of polymers. In general high rnalar mass polymers
do not dissolve at the CSC. All these drawbacks reduce the applicability ofLCCC significantly.
14 Chapter2
2.4 GRADIENT MECHANISM
In GPEC, separation is based on column interactions alone or on a combination of
precipitationfredissolution mechanisms and column interaction mechanisms. The
precipitationfredissolution mechanism is directly related to the solubility of polymers, and
the column interaction can be described by the isoeratic retentien mechanisms (see previous
section).
2.4.1 PRECIPITATION/REDISSOLUTION MECHANISM
When a poor solvent is used at the start of the gradient (initia! conditions)
precipitationfredissolution mechanism will occur. When a polymer salution is injected into
an eluent with low solvent strength, phase separation will occur. When a gradient is applied
from a poor solvent to a good solvent, the injected polymer molecules will redissolve at a
certain solvent composition. The solvent composition at redissolution depends on the rnalar
mass and the chemica! composition of the polymer molecules, and this can result in
separation ofthe polymer molecules.
The precipitationfredissolution mechanism is based on the solubility properties of the
polymer in the solvent gradient [16,46]. The solubility of polymers is determined by the
mutual interactions of the polymer, solvents and the stationary phase. When kinetic effects
are neglected, the Gibbs free energy on mixing of a polymer and a solvent can be described
by Equation 2-5 [47].
Equation 2·5, Cibbsfree energy of mixing, where liG""" Ufmol] Is the Cibbsfree energy of mixing, Mmo. Ufmol] Is the
enthalpy of mixing, T [KJ Is the temperature and L1S""" UfK·mol] Is the entropy of mixing.
To dissolve the polymer into the solvent the gain in enthalpy (~Haux) should be smaller
than the lossin entropy (T~Saux) or should be negative. Due to this limitation polymers have a
restricted number of solvents in which they dissolve. For the change in Gibbs free energy of a
binary polymerfsolvent mixture Equation 2-6 can be derived, which is known as the Flory
Huggins relation (47]. The first two parts ofEquation 2-6 (c:p5lnc:p5 + c:pplnc:ppfmp) are the entropy
contributions and the last part (Xp15c:p5c:pp) is the enthalpy contribution.

Various Aspects ofGradient Polymer Elution Chromatography 15
Equation 2-6, Flory-Huggins relation, where L\Cm,. UfmoF] is the Ci'bbs free energy of mixing, R Ufmoi·K} ]is the gas
constant, n"' is the total number oflattice places to be jilled {mol], ({Is is the volume fraction of solvent{-], ({1, is the
volume fraction of polymer {-], m, {-] is the relative number oflattice places taken by the polymer molecule (relative
chatn length), and x".{-] is the Flory-Huggins interaction parameter [47].
The Flory-Huggins equation shows that the solubility (mixing) of the polymer is dependent
on the concentration (<p), the degree of polymerization (mp is a function of the degree of
polymerization p), the temperature and the interaction parameter of the polymer with the
solvent (XP15). This interaction parameter for a polymer solvent mixture can be expressed as
follows [48].
Vp s: s: 2 XPtS :><0.34+ - (up-us)
RT
Equation 2-7, Interaction parameter fx.J equation, where V po1 is the molar volume ofthe polymer, R is the gas
constant, T is the temperature, and 8, and 8, are the Hilifebrand solubility parameters of the polymer and the solvent
{48}.
The Rildebrand parameters are difficult to determine experimentally or to calculate
theoretically.
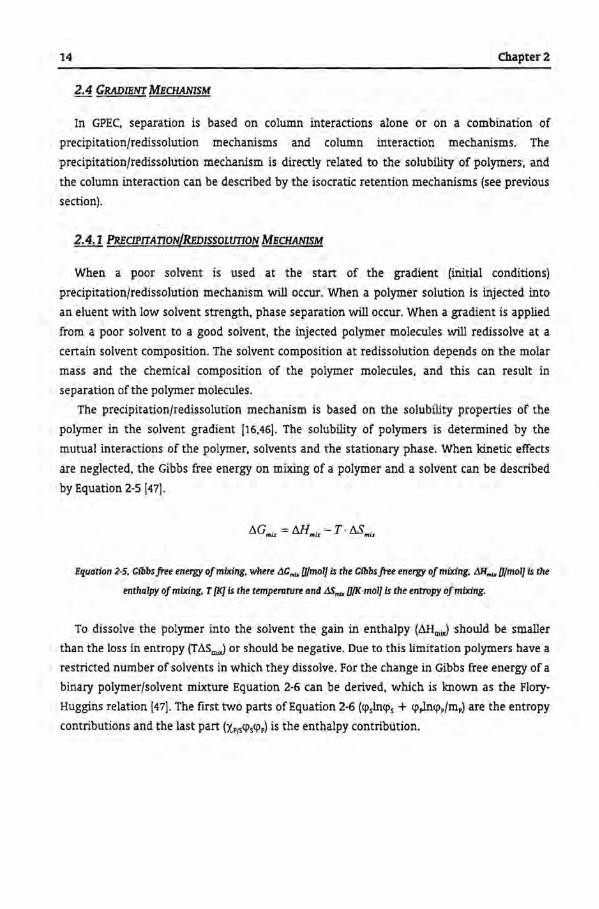
From the Flory-Huggins relation, the upper critica! solvent temperature {UCST) can be
determined. The typical UCST behavior of a polymerfsolvent mixtures can be found in Figure
2-6.
Besides UCST also LCST (lower critica! solvent temperature) behavior exists, however,
UCST behavior is most common for polymerfsolvent mixtures. Two areas can be
distinguished: an area where the mixture is homogeneaus and an area where the mixture is
heterogeneous. For example, the polymerfsolvent mixture at T0 and <p0 will separate into two
phases when T is decreased to T1: a polymer rich phase with a polymer volume fraction (<pa)
and a solvent rich phase with a polymer volume fraction (<p.J. Figure 2-6 shows that the
mixing properties ofthe polymer and the solvent depend on the temperature.
16
Homogeneaus
1.0
T l I I
Chapter2
Flgure 2-6, T vs. rp phase-diagram of a typical polymerfsolvent system with UCST behavtor. rp, Is the fraction of
polymer in the system and T Is the temperature.
The critica! interaction parameter Xcr• calculated from the critica! conditions (Ter and <Jlcrl• of
a binary polymerfsolvent mixture (for polymers with high degree of polymerization p) can be
derived from Equation 2-6 [16].
I X er "" 0.5 + r:::,
"1/mP
Equat:ion 2-8, Critica! interaction parameter of a binary system, where Xa Is the crit:ical interaction parameter and
m, is the relat:ive chain length ofthe polymer {16].
In GPEC, the thermadynamie system is mostly a ternary system, and sametimes
quaternary systems are applied. This makes the de-mixing behavior complex and not simple
to describe, which means that the theoretica! description of the precipitationfredissolution
mechanism is very complicated.
Redissolution of polymers in ternary systems can be studied experirnentally by
turbidimetric titration [46]. By turbidimetry the cloud point of the polymer is determined by
adding {via titration) non-solvent to a polymer solution. The cloud point is the volume
fraction of non-solvent {NS) necessary for the salution to become cloudy. At the cloud point,
phase separation occurs and two phases are formed: a polymer rich phase and a solvent rich
phase {comparable to a binary system). After phase separation, solvent can be added to the
polymer dispersion. The solvent/non-solvent composition where the phase separation
disappears is the redissolution point. Staal [3] showed that the redissolution point and the
cloud point can be assumed to be equal. The de-mixing point {cloud point) of a ternary
polymerfsolventfnon-solvent system at infinite dilution can be approximated by Equation 2-9,
which is based on several assumptions [46]. The interaction parameters of polymerfnon
solvent (x.,Nsl and polymer solvent (X.,sl arebasedon Equation 2-7, which is strictly valid for
binary systems.
Various Aspects of Gradient Polymer Elution Chromatography 17
Equation 2-9, Cloud point of a temary system, where lf>Hs is the volume fraction of non-solvent, X•!Hs is the
interaction parameter of polymerfnon-solvent, 'XPfS is the interaction parameter of polymerfsolvent and m, is the relative
chain length ofthe polymer [46].
Turbidimetric titration experiments of polycarbonate in methanolfchloroform and
isopropanol/methyl chloride solvent/non-solvent systems were performed by Glöckner [46].
The interaction parameters of polycarbonate and the solvents/non-solvents were calculated
by using Equation 2-9 and showed reasonably correct values.
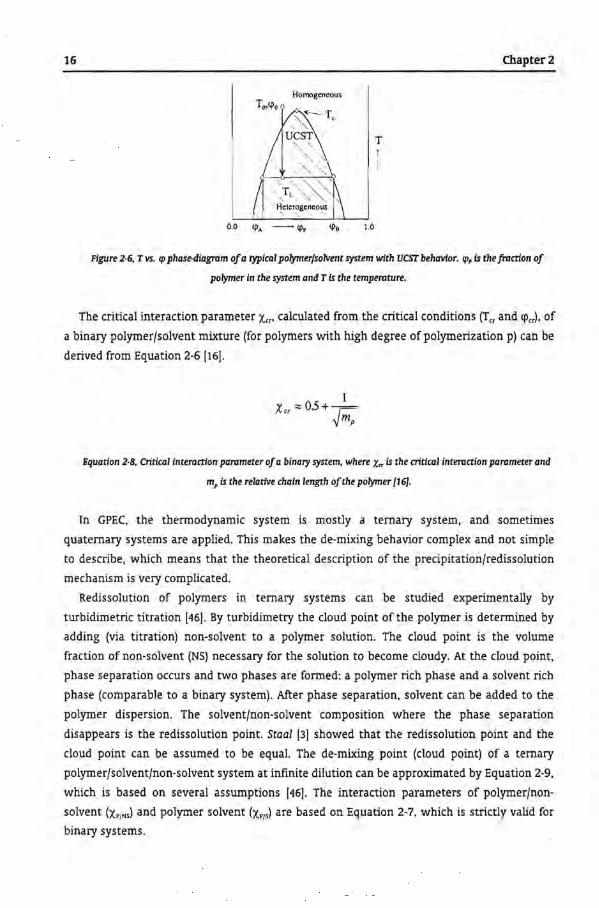
However, as can be derived from the Flory-Huggins relation (see Equation 2-6) the cloud
point is concentratien and rnalar mass dependent. The concentratien dependenee can be
described by the empirica! Equation 2-10 [16].
Equadon 2-10, Concentradon dependency of cl oud point, where rp5 is the cloud point in volume fraction solvent, c is
the concentradon ofpolymers, and c, and c, are constants. rp5 and care the values at the point ofpredpitadon.
10
60
(j)"" so
30
20
···•·· ····
O.Ot
o-/
0.1
Concentratien [mgJmiJ
0 500
• 18000 ll. 102000
• 1090000
JO 100
Figure 2·7, Plot of fPm, versus polymer concentradon at the cloud points oflow polydispersity polystyrene standards
(0 500 gfmol, • 18,000 gfmoL él102,000 gfmol, •1.090,000 gfmol} obtained by turbidimetry in the system
waterftetrahydrofuran.
To illustrate the concentratien dependence, the cloud points of low polydispersity
polystyrene standards (SEq were determined in the non-solvent/solvent system
waterftetrahydrofuran (THF) at different concentrations (see Figure 2-7) [49). The data shown
in Figure 2-7 can also be presented in another way, as shown in Figure 2-8.

18 Chapter2
90
80
70
50 lf. -•- s mg/ml --·!:>.·- · 0.8 mgfml
.. c{ ... o.. 0.08 mg/ml
1000 10000 100000 1000000
Molar mass [g/mol)
Figure 2-8. The molar mass dependenee ofthe cloud points at different concentrations t• 8 mgjmt Ll 0.8 mgjml
and 0 0.08 mgjml).
From the plots it can be seen that the concentratien dependenee is more pronounced for
the low molar mass polystyrenes, whereas for the high molar mass polymers the
concentratien dependency is negligible.
The precipitationjredissolution mechanism is kinetically limited. If solely the
precipitationjredissolution mechanism would be present and no column interactions would
exist, the kinetics of redissolution would affect the (reproducibility of the) separation [50). In
combination with column interactions, the kinetic effects of redissolution may be negligible.
However, when the polymer molecules can form a crystalline phase, the redissolution
mechanism is affected drastically [51] . The application of GPEC to crystalline polyesters is
further discussed in Chapter 5.
Glöckner [16] and Schultz, and Engelhardt [52] have described a precipitationjredissolution
mechanism and found empirica! relations for the retentien of homopolymers in reversed
phase systems.
2.4.2 COLUMN INTERAaiONS
During a chromatographic separation of polymers, column interactions always occur.
However, depending on the eluent strength, these column interactions will be different. For
polymers, column interactions often result in large k factors. Therefore, it is difficult to
separate polymers with isoeratic chromatography (16]. In order to separate polymer
molecules, gradients from poor eluent conditions to good eluent conditions have to be
applied. The interaction of a molecule depends on the functional end groups and on the
number ofrepeating segments that can interact with the column materiaL
Different roodels to describe the sorption mechanism in GPEC have been described in the
literature by various authors. The roodels have been used to predict the retention of
polymers. ]andera et al. have described a mechanism where the contribution of the end group

Various Aspects of Gradient Polymer Elution Chromatography 19
and the repeating unit are separately discussed [53,54). The mechanism described by ]andera
et al. is valid for both on isoeratic and gradient elution. Snyder et al. [32,55,56] and
Schoenmakers et al. [57,58] related the retention behavior in gradient elution to the volume
fraction solvent (<p5} using different theoretical approaches.
All the models have restrictions with respecttotheir applicability. All models arebasedon
low rnalar mass components the retention of high rnalar mass polymers is not included in
the models. The determination ofthe theoretica! parameters used in the models occasionally
requires a large number of experiments (29], and insome cases these parameters do nothave
a clear physical meaning. In addition, the applicability ofthe modelsis restricted toa specific
polymerfsolventfnon-solventfcolumn system and for each new system the models have to be
checked and modified. The possible combinations of polymerfsolventfnon-solventfcolumn are
numerous and thus, the general applicability of these models as prediction tools is severely
limited.
2.5 REVERSED PHASE GPEC AND NORMAL PHASE GPEC
In genera!, RP-GPEC is performed on C18 modified silica columns. Although RP-mode is
commonly applied, the contribution of column interactions during RP separations with a C18
modified silica columns of polymer molecules, is difficult to determine. A polymer molecule
can exhibit two different kinds of interactions with the column: polar interaction as a result
of the presence of silica functionalities (silanol, hydroxyl groups}, and non-polar partitioning
due to C18 tails and the solvent near the surface. This combination makes it hard to generally
describe the column characteristics.
The initia! conditions in RP-GPEC are in most cases poor in terms of solvent strength.
Consequently, the mechanism is a combination of the precipitationfredissolution and column
interactions.
RP-GPEC can be used to determine the chemica! composition distribution. Several
copolymer systems have been studied over the years j16]. Polymer molecules with different
chemica! compositions will elute at different eluent compositions. The copolymer molecules
are separated based on the ratio of the monoroers (overall composition}. Thus, a chemica!
composition distribution is obtained. Although RP-GPEC is widely used, the exact mechanism
of copolymer separation is still a matter of discussion, especially the effect of the molar mass
ofthe copolymer molecules on the separation (16]. Nevertheless, the effect ofthe molar mass
on the retention is negligible for copolymers with molar masses higher than 50,000 gfmol.
The lack of well-defined copolymer standards is aften the constraint for a good investigation
of the molar mass effect on the retention.
NP-GPEC separation of copolymers was intensively studied by Mori et al. [18-21]. They
performed chloroformfethanol gradients to separate acrylate based polymers. In comparison
with RP-GPEC a reversed elution order with respect to chemica! composition is found.
However, a molar mass dependency can be found as described for RP-GPEC. The reversed
20 Chapter2
elution order can easily be explained by polarity differences of the polymer molecules
involved, since RP-GPEC is the reversed technique compares to NP-GPEC with respect to
polarity. NP-GPEC provides additional and in some cases essential information [29] about
polymer samples.
The separation mechanism of NP-GPEC is based on po lar interactions. Therefore, NP-GPEC
can be applied to separate polymer molecules according to small chemical differences, e.g.
functional end groups.
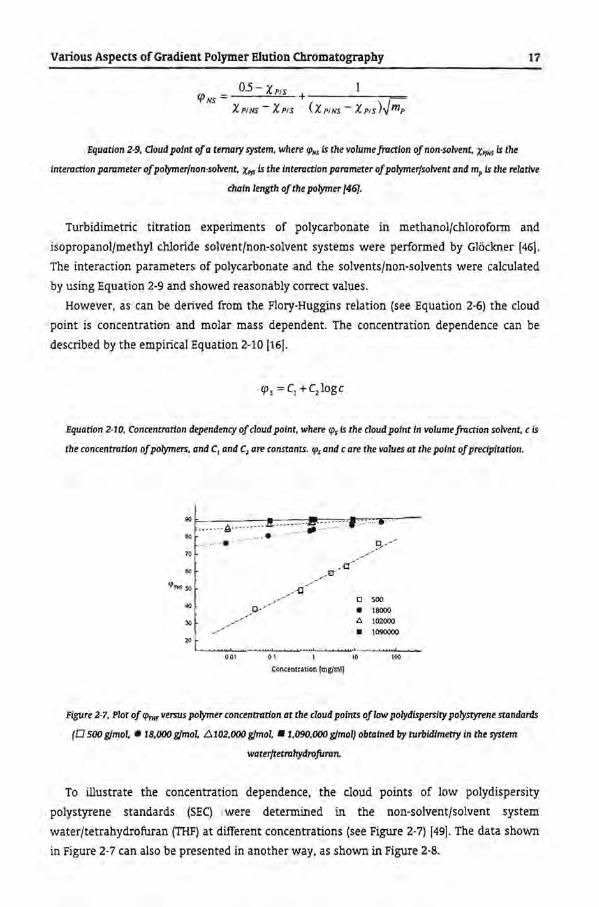
2.6 RETENTION OF POLYMERS OF HICH MOI.AR MASS
The separation of polystyrene by reversed-phase GPEC (RP-GPEq has. been studied
extensively (29,31,59-70], although the studies have mainly been performed with low rnalar
mass polystyrene standards.
The comparison of the cloud points obtained with turbidimetry with the retention
compositions obtained with RP-GPEC of polystyrene standards is shown in Figure 2-9 [71].
The retention composition in these figures is related to the retention time according to the
following equation.
Equation 2·11, The relation between the retention composition (cpJ and the retention time (tJ, where r" 8'"4 is the
gradient dead time, r""" is the dead time ofthe column, cp,.....m is the gradient program infraction solvent per minute,
and cp,.,""' is the initia! composition ofthe solvent at injection.
.. . 17-GPEC .. ~--~- 0 001.1dpoint
00 ... ,. .. 70 ·--...
'1'"" .. --1!!1 • .. ···-. .. .. ..
:·1 , -•- RP-GPEC ~ r' -•-Ooud point :v-
M 1 ____ .---:::-~ ---- --------- : . ------- ·-·· : . --·- :
0 00 ooo . ., 0.00 . .. 0.06 ." ,. " .. ISCX ..
M"'"
Figure 2·9, Comparison ofthe effects ofthe molar mass (M) ofpolystyrene In the system water(THF on the cloud
points (turbidimetry, •J and RP·GPEC elution composition (1 %fmin, Symmetry C18 column, 0) (cpJ. Left: M vs. cp"";
Right: fPnu vs. M'12•
Various Aspects of Gradient Polymer Elution Chromatography 21
For the lower molar masses, the RP-GPEC elution composition was ticher in solvent than
the cloud point. According to the redissolution mechanism the standards should elute at
elution compositions containing less solvent. However, due to sorption additional retentien
occurred.
The difference between <prnP from RP-GPEC and the cloud points decreases with increasing
rnalar mass. This is due to the increase in elution strength. As long as the polymer dissolves
in the sorption mode, normal retentien behavier is found.
For the higher rnalar mass, RP-GPEC retentien compositions were higher in solvent
content than the cloud points. The high rnalar mass polystyrene dissolved at a higher solvent
fraction than the critica! conditions (specific for the used system
solventsfcolumnftemperature). Since relatively little sorption will take place, the polymer
molecules will dissolve and exclusion will occur. Less column volume is available for the
polymer molecules. Therefore the polymer molecules will elute faster through the column
than the eluent in which they initially redissolved. Eventually phase separation will occur,
when the molecules reach the eluent composition that has the composition of their cloud
point [16]. The formation of a molecular gel results in strange peak farms and even splitting
of the peaks [16]. The signa! of the Ultraviolet (UV) detector can detect the de-mixing of high
rnalar mass molecules. When s polymer dispersion passes through the detector, the light
scattering of the polymer dispersion wil! give an increase in the signa!. Due to this light
scattering the UV detector cao detect polymers without any UV absorbance, such as
polymethyl methacrylate. Note that in this case the UV detector cannot be used
quantitatively.
2. 7 APPUCATIONS OF CPEC
GPEC can be used to separate a polymer sample into monomers, additives, oligomers and
polymer molecules [72]. Additionally polymer moleculescan be separated according to rnalar
mass, chemica! composition and functional end group.
The separation of polymer blends can be performed easily by GPEC [3]. The differences in
solubility and specific column interactions of polymers with different chemica! composition
can be used to separate polymer blends into the separate homopolymers andfor copolymers.
RP-GPEC, as wel! as NP-GPEC, can be applied. The separation of polystyrene (PS) and
polyisoprene (PiP) as described in Chapter 7 will be used to illustrate separation based on
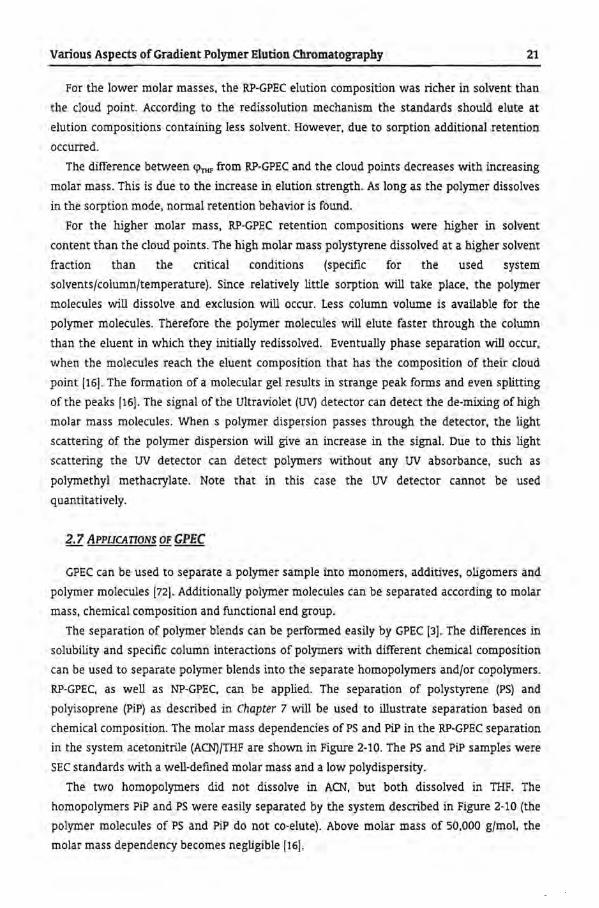
chemica! composition. The molar mass dependendes of PS and PiP in the RP-GPEC separation
in the system acetonitrile (ACN)/THF are shown in Figure 2-10. The PS and PiP samples were
SEC standards with a well-defined molar mass and a low polydispersity.
The two homopolymers did nat dissolve in ACN, but both dissolved in THF. The
homopolymers PiP and PS were easily separated by the system described in Figure 2-10 (the
polymer molecules of PS and PiP do nat co-elute). Above rnalar mass of 50,000 gfmol, the
rnalar mass dependency becomes negligible [16].
22 Chapter2
-a-PiP -•-PS 0
IE? I 0
I \ 1000000 0 6 I I • 0 I
100000 I • M
l • I • 10000 I
-------/ ----/ 1000 •
0
0.1 0.2 0.3 0.4 0.5 0.6 0.7
Figure 2·10, The molar mass dependendes ofpolystyrene (PS, •. 500, 2450, 5050, 92k, 6ólc, 1561c, 5701c, 1075k,
7100k, and 20000k gJmol) and polytsoprene (PIP,D. 1350, 3200, Bic, 27k. 64k, 115k, 295k, 12001c, and 3310ic gJmol)
homopolymers on the retendon composidon (CI'n,,J in the RP·CPliC system acetonttrllefTHF on a Si-C1B column.
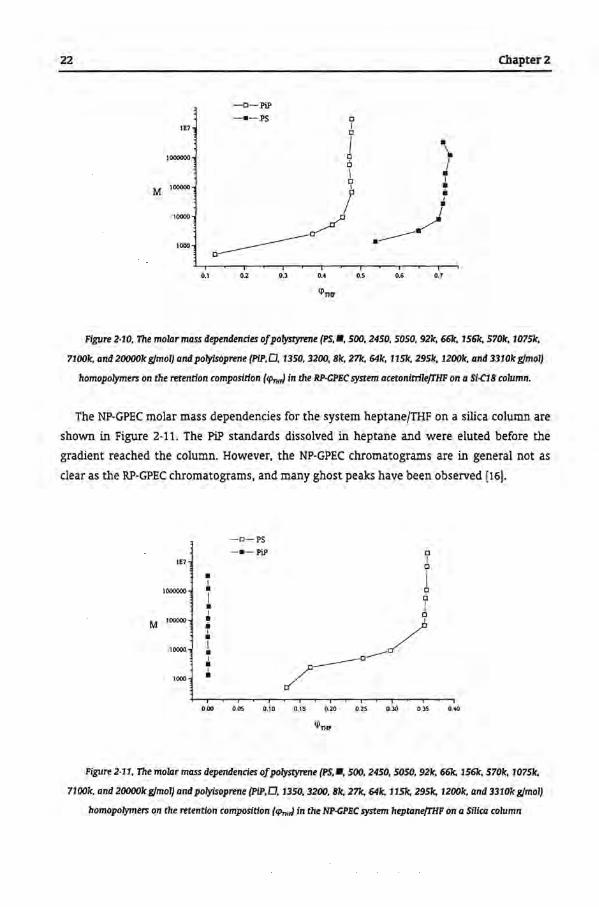
The NP-GPEC molar mass dependendes for the system heptane/THF on a silica column are
shown in Figure 2-11 . The PiP standards dissolved in heptane and were eluted befare the
gradient reached the column. However, the NP-GPEC chromatograms are in general not as
clear as the RP-GPEC chromatograms, and many ghost peaks have been observed [16].
-o-ps -•- PiP 0
IE7 I 0
• I I 1000000 • 0
I ó • I I 0
M 100000 1!1 I • __ / I • 10000 I • I -----0 • I / 1000 •
0.00 0.05 0 .10 0.15 0.20 0.25 0.30 0.35 0.40
(j)THP
Figure 2-11, The molar mass dependendes ofpolystyrene (PS.•, 500, 2450, 5050, 92k, 66k, 156k, 570k, 10751c,
7100k, and 20000k gJmol) and polytsoprene (PIP,D, 1350, 3200, Bic, 27k. 641c, 1151c, 2951c, 1200k, and 3310k gJmol)
homopolymers on the retendon composidon (CI'n,,J in the NP-CPEC system heptanefTHF on a Sl1tca column

Various Aspects ofGradient Polymer Elution Chromatography 23
The separation of copolymers is a well-known application of GPEC. The most extensively
studied copolymer systems are styrenefacrylonitrile and styrenefacrylate copolymers [16).
Similar to SEC, GPEC is a relative method. By using copolymer standards, the retentien in
GPEC has to be related to the chemica! composition. This relation is called the GPEC
calibration curve. With the GPEC calibration curve the chemica! composition distribution of
similar copolymers can be calculated on the basis of a chromatagram [22-24). The effect ofthe
chemica! composition on the retentien composition of random copolymers is found to be
linear. This means that the separation is based on the ratio of rnanamers in the molecule and
not on the number of monomer segments in the polymer chain. However, the effect of the
molar mass of the copolymer on the separation has to be studied in more detail. As
mentioned before, the Jack of copolymer standards often limits the application and the
understanding of the mechanism. Not many copolymer standards are commercially available.
Thus, the effect of the chemica! composition on the separation of copolymers is often not
known. Nevertheless, it is possible to apply on-line infrared analyses to determine the
chemica! composition of separated components.
Unfortunately, for the system PS and PiP, no copolymer standards are available. Still, the
RP-GPEC conditions ofFigure 2-10 can be successfully used to achieve a separation according
to chemica! composition. Nevertheless, only qualitative rather than quantitative results can
be obtained with respect to the chemica! composition.
Besides random copolymers, also block copolymers can be separated by GPEC. In contrast
to random copolymers, the re lation of the elution volume versus the chemica! composition is
not linear [16). The solubility and sorption behavior of block copolymers will differ from
random copolymers. Also in this case, the Jack of acceptable standards prevents reliable
studies on the retentien mechanism and on applications. However, the development of new
polymerization techniques, such as atom transfer radical polymerization [73], will provide
well-defined block copolymers, which can be used to calibrate the GPEC separation.
2.8 GPEC IN COMBINATION WITH OTIIER ANALYTICA! TECHNIQUES
HPLC techniques, such as GPEC, can be hyphenated with other analytica! techniques, such
as infrared spectroscopy or mass spectrometry. With the introduetion of new coupling
techniques, additional information about the microstructure of polymer molecules can be
obtained. This has, for instance, been shown by the coupling ofHPLC with Fourier-Transform
Infrared (FTIR) [74) . Even the coupling of HPLC with NMR has already been achieved [75).
However, the applications ofLC-NMR are still very limited.
Frorn the coupling of two HPLC techniques additional information can be obtained. The
term used for the coupling ofHPLC techniques is cross-fractionation [16,76-79] or orthogonal
chromatography [42,80]. The different HPLC techniques that can be coupled are GPEC (for the
separation according to chemica! composition and functional type), SEC (separation on
molecular size), and LCCC (for the separation according to functional type). The couplings

24 Chapter2
SEC-GPEC [76,79,29], LCCC-SEC [42], and NP-GPEC-RP-GPEC [29] have been successfully
applied and the results can be presented in three dimensional (30) graphs or contour plots.
For SEC-GPEC a molar-mass-chemical composition-distribution (MMCCD) is obtained [79,29]
and molar-mass-functional-type-distributions (MMFID) can be obtained when SEC is coupled
with LCCC or GPEC [29].
In the last decade the application of mass spectroscopy (MS) for polymers has increased
intensively. GPEC hyphenated with MS will be discussed in detail in Chapter 4 and Chapter 6.
2.9 CoNausmNs
GPEC can be applied to separate polymers according to chemica! composition and
functional end group. Depending on the type of GPEC (reversed-phase or normal-phase),
different types of interactions can lead to separation. The mechanism is highly dependent on
the conditions used and on the applied polymer. Therefore, the development of a universa!
model or theory is difficult. The conditions have to be optimized for every new GPEC
separation. This makes GPEC a time consuming methad with an art-like character. Despite
this drawback, GPEC in many cases reveals differences between samples that cannot be
obtained by any spectroscopie technique.
The most important application of GPEC is the separation of the polymer molecules
according to chemica! composition. Although the separation is seldom based on chemica!
composition differences only, the information obtained with GPEC can be conclusive, crudal
and in some cases critica!.
2.10 REFERENCES
1. F.P.B. van der Maeden, M.E.F. Biemond and P.C.G.M. janssen,J. Chromatogr., 149,539-552 {1978}. 2. S. Teramachi. A. Hasegawa, Y. Shima, M. Akatsuka and M. Nakajima, Macromolecules, 12 (5), 992·
996 {1979}. 3. W.J. Staal, "Gradient Polymer Blution Chromatography", Ph.D. Thesis, Eindhoven University of
Technology, Eindhoven, The Netherlands, 1996. 4. S. Teramachi, A. Hasegawa, Y. Shigekuni and S. Natunaga, Polymer ]., 21 (10), 803·808 (1989). 5. S. Teramachi, A. Hasegawa and K. Motoyama, Polymer ]., 22 (6), 489-496 {1990). 6. S. Teramachi, A. Hasegawa, Y. Shigekuni, K. Zenta and M. Hashimoto, ]. Appl. Polym. Sci.: Appl.
Polym, Symp., 45, 87·102 (1990}. 7. G. Glöckner, Chromatographia, 23 (7), 517·524 (1987}. 8. G. Glöckner, Pure & Appl. Chem., SS (10), 1553-1562 (1983). 9. G. Glöckner and D. Ilchmann, Acta Polym., 35 (11), 68~683 (1984). 10. G. Glöckner and J.H.M. van den Berg,]. Chromatogr., 384, 135-144 (1987). 11. G. Glöckner, M. Stielder and W. Wunderlich, Fresenius Z. Anal. Chem., 328, 76-81 (1987). 12. G. Glöckner,J. Chromatogr., 403,280-384 (1987). 13. G. Glöckner, M. Stielder and W. Wunderlich, Fresenius Z. Anal. Chem., 330, 46-49 (1988). 14. G. Glöckner, M. Stielder and W. Wunderlich,J. Appl. Polym. Sci., 37,3147-3161 (1989).
Various Aspects ofGradient Polymer Elution Chromatography 25
15. G. Glöckner and H. G. Barth,]. Chromatogr .• 499, 645-654 (1990). 16. G. Glöckner, "Gradient HPLC of Copolymers and Chromatographic Cross Fractionation", Springer-
Verlag Berlin Heidelberg, 1991. 17. G. Glöckner,J. Appl. Polm. Sci.: Appl. Polym. Symp., 52, 45-54 (1992). 18. S. Mori,]. Appl. Polym. Sci.: Appl. Polym. Sci., 43,65-84 (1989). 19. S. Mori.]. Liq. Chromatogr .• 13 (15), 3039-3052 (1990}. 20. S. Mori,]. Chromatogr .• 503, 411-419 (1990}. 21. s. Mori and H. Taziri.]. Liq. Chromatogr., 17 (14&15), 3055-3068 (1994}. 22. P.J.C.H. Cools, F. Maesen, B. Klumperman, A.M. van Herk and A.L. German,]. Chromatogr. A, 736,
125-130 (1996}. 23. R.W. Sparidans, H.A. Claessens, G.H.J. van Doremaele and A.M. van Herk,]. Chromatogr .• 508,319-
331 (1990}. 24. H.A.S. Schoonbrood, "Emu/sion Co- and Terpolymerization", Ph.D. Thesis, Eindhoven University of
Technology, Eindhoven, The Netherlands, 1994. 25. T. Tanaka, M. Omoto, N. Donkai and H. Inagaki,]. Macro mol. Sci.-Phys .• B17(2), 211-228 (1980}. 26. M. Augenstein and M.A. Müiler. Makromol. Chem., 191,2151-2172 (1990}. 27. G. Glöckner and ].H.M. van den Berg.]. Chromatogr .• 550, 629-638 (1991). 28. G. Glöckner and A.H.E. Müiler.]. Appl. Polym. Sci., 38, 1761-1774 {1989}. 29. Philipsen H.J.A., "Mechanisms of Gradient Polymer Elution Chromatography and its Application to
(Co}Polyesters", Ph.D. Thesis, Eindhoven University of Technology, Eindhoven, The Netherlands, 1998.
30. P.J.C.H. Cools unpublished results. 31. T.L.J. Willems, M.Sc. Thesis, Eindhoven University of Technology, Eindhoven, The Netherlands
(1993). 32. M.A. Quarry, M.A. Stadalius, T.H. Mourey, and L.R. Snyder,]. Chromatogr .• 358, 1-16 {1986). 33. P.J. Schoenmakers, Personaf conversation. 34. H.C. Lee and T. Chang. Polymer, 37(25), 5747-5749 (1996}. 35. H.C. Lee and T. Chang, Macromol. Symp .. 118,261-265 {1997) . 36. A.M. Skvortsov and A.A. Gorbunov,]. Chromatogr .• 507, 487-496 {1990}. 37. I .M. Zimina. Y.Y. Kever, Y.Y. Melenevskaya. V.N. Zgonnik and B.G. Belen'kii, Polym. Sci., 33(6),
12050..1254 {1991}. 38. I.M. Zimina, J.J. Kever, E.Y. Melenevskaya and A.F. Feil,]. Chromatogr., 593, 233-241 (1992). 39. H. Pash. H. Much and G. Schulz.]. Appl. Polym. Sci: Appl. Polym. Symp., 52, 79-90 (1993). 40. T.M. Zimina, A.F. Feil and J.B. Castledine,J. Chromatogr. Sci., 31, 455-460 {1993}. 41. H. Pasch, C. Brinkmann and T. Gailot, Polymer, 34 (19), 4100-4104 {1993}. 42. R.P. Krüger, H. Much and G. Schulz.]. Liq. Chromatogr., 17 (14&15). 3069-3090 {1994} . 43. A.V. Gorshkov, T.N. Prudskova, V.V. Gur'yanova and V.V. Evreinov, Polym. Bulletin, 15, 465-468
(1986}. 44. P.J.C.H. Cools, A.M. van Herk, A.L. German and W. Staal,]. Liq. Chromatogr .• 17(14&15), 3133-3143
{1994}. 45. H.J.A. Philipsen. B. Klumperman, A.M. van Herk and A.L. German,]. Chromatogr. A, 727, 13-25
(1996}. 46. G. Glöckner, Z. Phys. Chem., 229, 98-109 (1965}. 47. P. Flory, "Principles ofPolymer Chemistry", Corneil University Pre ss, Ithaca, New York, 1953. 48. D.W. van Krevelen, "Properties ofPolymers", 3rd Ectition, Elsevier, Amsterdam, 1990. 49. P.J.C.H. Cools unpublished results. 50. H.J.A. Philipsen, M.R. de Cooker, H.A. Claessens, B. Klamperman and A.L. German,J. Chromatogr.
A, 761, 147-162 (1997). 51. H.j.A. Philipsen, M. Oestreich, B. Klamperman and A.L. German,]. Chromatogr. A, 775, 157-177
(1997). 52. R. Schultz and H. Engelhardt, Chromatographia, 29(5/6), 205-213 (1990}. 53. P. jandera and J. Rozkosá,J. Chromatogr., 362, 325-343 {1986} . 54. P. jandera, Chromatographia. 26,417-422 {1988}. 55. L.R. Snyder, M.A. Stadallus and M.A. Quarry, Anal. Chem., 55(14), 1414A-1430A {1983}.

26 Chapter2
56. MA. Stadalius, MA. Quarry, Th. Mourey and L.R. Snyder,J. Chromatogr., 358, 17-37 {1986). 57. P.J. Schoenmakers, HA.H. Billiet, R. Tijssen and L. De Galan,J. Chromatogr., 149, 519-537 {1978). 58. PJ. Schoenmakers, HA.H. Billiet, R. Tijssen and L. De Galan,J. Chromatogr., 185, 179-195 {1979). 59. S.T. Lai and O.C. Locke,J. Chromatogr., 252, 325-330 (1982). 60. J.J. Lewis, L.B. Rogers and R.E. Pauls,J. Chromatogr., 264, 339-356 {1983). 61. C.H. Lochmüller and M.B. McGranaghan, Anal. Chem., 61, 2449-2455 {1989). 62. RA. Shalliker, P.E. Kavanagh. I.M. Russell and O.G. Hawthorne, Chromatographia, 33(9/10), 427-
433 {1992). 63. G. Glöckner, Chromatographia, 25(10), 854-860{1988). 64. RA. Shalliker, P.E. Kavanagh and I.M. Russell,J. Chromatogr., 543, 157-169 {1991). 65. D.M. Northrop, D.E. Martire and R.P.W. Scott, Anal. Chem., 64, 16-21 (1992). 66. RA. Shalliker, P.E. Kavanagh and I.M. Russell,J. Chromatogr. A, 664, 221-228 {1994). 67. RA. Shalliker, P.E. Kavanagh and I.M. Russell,J. Chromatogr., 558, 440-445 {1991). 68. P. Jandera,J. Chromatogr., 449, 361-389 {1988). 69. J.P. Lannann, J.J. DeStefano, AP. Goldberg, R.W. Stout, L.R. Snyder and MA. Stadalius, ].
Chromatogr., 255, 163-189 {1983) . 70. S.T. Lai, L. Sangennano and D. C. Locke,J. Chromatogr., 312, 313-326 {1984). 71. P.J.C.H. Cools unpublished results. 72. W.J. Staal, P.J.C.H. Cools, A.M. van Herk and A.L. Gennan, Chromatographia, 37(3/4), 218-220 {1993). 73. K. Matyjaszewski, T.E. Patten and J. Xia,J. Am. Chem. Soc., 119, 674 {1997). 74. L.M. Wheelerand J.N. Willis, Appl. Spectrosc., 47, 1128 {1993). 75. H. Buskens. Chemisch-2-Weekblad, 1, 18 {1999). 76. G. Glöckner, J.H.M. van den Berg, N.L.J. Meijerink, Th.G. Scholte and R. Koningsveld, ].
Chromatography, 317,615-624 (1984). 77. G. Glöckner and J.H.M. van den Berg,]. Chromatography, 381, 135-144 {1987). 78. G. Glöckner, J. Stejskal and P. Kratochvil, Makromol. Chem .• 190, 427-435 {1989). 79. G.H.J. van Doremaele, F.H.j.M. Geerts, L.J. aan de Meuten and A.L. Gennan, Polymer, 33(7). 1512-
1518 {1992) . 80. G. Schulz, H. Much, H. Krüger and C. Wehrstedt,]. Liq. Chromatogr .• 13(9), 1745-1763 {1990).
Other Analytica! Techniques Applied to Characterize Copolymers 27
Chapter 3
Other Analytical Techniques Applied to Characterize Copolymers
In this chapter, the applied analytica! techniques, beside gradient polymer elution chromatography {GPEC), are described. Size exclusion chromatography {SEC) using the universa! calibration method is described. Additionally, electrospray-ionization mass speetrometry {ESI-MS) and matrix-assisted-laserdesorption-ionization time-of-jlight mass speetrometry {MALDI-TOF-MS) are described.

28 Chapter3
3.1 lNTRODUcrlON
Analytica! techniques such as gradient polymer elution chromatography. size exclusion
chromatography, electrospray ionization mass speetrometry and matrix assisted laser
desorption ionization mass speetrometry have been applied in order to characterize the
polymers described in this thesis. The various aspects of GPEC have already been described in
Chapter 2. and in this chapter the relevant principles of SEC, ESI-MS and MALDI-MS will be
described briefly.
3.2 SIZE EXCLUSION CHROMATOGRAPHY {1}
The separation in size exclusion chromatography (SEQ is based on the steric exclusion.
The principle of steric exclusion is already discussed in Chapter 2 (pages 8/9).
The combination of SEC with molecular weight sensitive detectors. such as the viscosity
detector. can be used to detect small differences in molar mass or in chemica! structure (block
structures and branching can be detected).
The viscosity detector measures a pressure difference over a specific capillary. The intrinsic
viscosity [TJ] of an eluting component can be calculated from this pressure difference. The
effect of molar mass on the intrinsic viscosity [TJ] can be described by the Mark-Houwink
relation [1].
Equation 3·1, Mark-Houwink relation, where {rl} is the intrinsic viscosity {dl/g], K~ {dl·mol/g'] and aH are Mark
Houwink constants, M is the molar mass [gjmol].
The Mark-Houwink constants are specific for the polymerfeluent combination. The intrinsic
viscosity [TJ] can be detennined by the viscosity signa! (DP or Äp). The intrinsic viscosity (TJ]
can be calculated (via the specific viscosity ll.p) from the DP signa! according to Equation 3-2.
[7J] = Lim 1Jsp o::: 1Jsp = J(llp} c->0 C C C
Equation 3-2, Intrinsic viscosity [TJ] relation, where .1p = the pressure difference. c = concentranon [gjl]. and 7J17 is
the spedfic viscosity H which can be directly calculated from the measured differenttal pressure .1p.
When the separation in SEC solely depends on entropy effects, the separation is based on
the hydrodynamic volume (VJ. According to Einstein's viscosity law [2], Vb can be expressed
as;
Other Analytica! Techniques Applied to Characterize Copolymers 29
Equation 3-3, Hydrodynamic volume {I/mol].
By the universa! calibration method (UC) the rnalar mass of polymers can be determined
when log [TJ]M versus retention volume of the system is known and (TJ] is measured (3]. The
following equation can be used to calculate the rnalar mass for a specific retention volume.
i.e. a specific vh_
Equation 3-4, Universa! calibration relation, where {T)], is the intrinsic viscosity ofpolymer i and M1 is the molar
mass ofpolymer i.
With the experimental data of an arbitrary polymer (polymer '1') (log(T]]M vs. retention
volume, the universa! calibration curve), the rnalar mass (M) of the polymer of interest
(polymer '2') can be calculated by measuring ('1] or by using known Mark-Houwink
parameters ofpolymer '2' (see Equation 4-1) [2]. Thus, SEC in combination with a viscometry
detector allows the use ofthe UC method. In the following chapters UC-SEC will be applied to
characterize polyesters_
3.3 lNTRODUCTION TO MASS SP ECTROMETRY OF POLYMERS
Mass spectroscopy (MS) is an analytica! technique that has already been used for many
years_ The applications of MS we re mainly the analyses of low rnalar ma ss chemicals_ Lately,
the emphasis has been put more and more on the identification of macromolecules [4-7]. and
especially on the identification of bio-polymers. In this and the following paragraphs the
applications ofMS in the field ofpolymer analysis will be briefly discussed.
MS techniques can be divided into four parts: the sample introduction, the ionization, the
analysis, and the detection. The sample introduetion can, for example, be liquid
chromatography or a syringe. In the ionization step, molecules of the sample are ionized, and
the analyzer separates the polymer molecules according to mass number (m) over charge
number (z), mfz. After separation the molecules are detected.
The ionization step is the most crucial part of MS. The sample can be fragmented by a
destructive ionization method. such as for example electron impact ionization or fast atom
bombardment [7). Fragmentation MS provides information about the overall chemica!
composition (presence of specific groups) of the sample. However, this technique offers no
information on the rnalar mass or the distribution of certain groups over the polymer chain.
Thus. ionization techniques invalving fragmentation are applicable for polymers, but little
additional information is obtained as compared to e.g. NMR.

30 Chapterl
Since the introduetion of the so-called soft ionization techniques, such as electrospray
ionization (ESI) and matrix-assisted-laser-desorption-ionization (MALDI), the number of
applications ofMS in th~ field ofpolymer characterizatiön has increased enormously [3,4,8,9].
These soft ionization techniques are characterized by no or little fragmentation, i.e. the
polymer molecules become charged but remain intact.
The most commonly used analyzers for MS are quadrupele, ion trap, and time-af-tlight
(TOF) analyzers. Each analyzer has its specific advantages and drawbacks. For instance, the
TOF analyzer can only be used in combination with pulsed ionization techniques, such as
MALDI, where charged samples are introduced via laser pulses [10]. Different type of
detectors can be used. The photographic plate and the Faraday cup measure the ions directly.
Electron or pboton multipliers amplify the signa! ofthe analyte [10].
3.3.1 ELECIROSPRAY [ONIZATION MASS SPECIROMETRY
ESI-MS is a soft ionization technique, resulting in no or little fragmentation of the polymer
molecules during ionization. The principle of ESI-MS will be discussed briefly [10]. The
polymer sample is dissolved, and sprayed through a capillary (see Figure 3-1). The polymer
salution flows with a constant flow (1-10,ulfmin) through the capillary, and is nebulized by
the nebulizing gas. The formed aerosol is charged by the potential difference (LW=3-6 kV)
between the capillary and the electrode (see Figure 3-1). The electrode is a thick metal plate
with a small orifice (5).lm). The analytes are transported through this orifice due to the
pressure ditTerenee between the two sides ofthe plate.
Figure 3·1, A schematic representation of the principle of electrospray tonization (ESI).
The solvent is evaporated and the charge (either anionic or cationic) is transferred to the
polymer molecule. Cationic ionization of a polymer molecule is shown Figure 3-2. During
spraying draplets are formed, which contain multiple polymer molecules. The droplet will
have a high charge. The solvent will evaparate until the repelling coulombic forces (the
droplet surface decreases as the solvent evaporates) will equal the cohesion forces of the

Other Analytical Techniques Applied to Cbaracterize Copolymers 31
droplet, and the initia! droplet wil! explode into smaller droplets. These smaller draplets wil!
have Ie ss charge, and eventually, after total evaparatien of the solvent, charged molecules,
such as (M-NH4t or (M-Agt adducts, wil! be the result. A sirnplified scherne of this process
can be found in Figure 3-2. This description of the ionization is one of several possible
rnechanisrns. The exact rnechanisrn ofionization is nat fully known [10].
)
)
Figure 3·2. Simplijied scheme ofthe cationic ionization of a polymer molecule by electraspray ionization.
Specific groups, such as the repeating units of the polyrner molecule or a functional end
group wil! be charged. Therefore, the polyrner molecule can have multiple charges. After
ionization it is introduced into the vacuurn of the MS and wiJl be accelerated to the analyzer
by electric lenses.
In genera!, and also in this study described in Chapters 4 and 6, ESI-MS is used in
combination with a quadrupale analyzer. A major drawback of the quadrupale analyzer is the
relatively srnall m over z detection window (rn/z<4000 g/rnol) [10). Since with ES! the
analytes can be rnultiply charged, the highest rnalar rnass that can be analyzed by a
quadrupale analyzer is higher. One of the latest developrnents in ESI-MS is the use of a TOF
analyzer for the analysis of polyrners. The TOF analyzer can separate high rnalar rnass
molecules, which makes the applicability ofESI-MS for higher rnalar mass polymers accessible
[11].
Beside the above advantage, multiple charged analytes also result in a disadvantage. Each
oligorner with rnass m will occur in MS spectra as a distribution of peaks with different rn/z
values, and nat as one single rn/z peak. Algorithrns have been developed to interpret the
rnass spectra obtained with ESI-MS. Nevertheless, when a polymer with a braad distribution
of oligorners is analyzed directly, the interpretation of the MS spectrum is very difficult.
ESI-MScan be coupled on-line with liquid chrornatography [8,9,12,13]. LC can easily provide
the constant flow required for ESI-MS. The flow required for ESI-MS (approximately 1 ,uljmin
depending on the electraspray rnethod) is much lower than the conventional LC flow (0.5-1.0
rnlfmin), therefore, flow splitters are commonly used [8).

32 Chapter3
3.3.2 MATRIX ASSISTED LASER DE SORPTION lONIZAnON MASS SPEerROMETRY
Another soft ionization methad is matrix-assisted-laser-desorption-ionization (MALDI). In
Figure 3-3 the ionization principle ofMALDI MS is shown.
Laser light
.. ·· (' ..........
··· Matrix + sample
·· ...
ionized polymer
molecules
Figure 3·3,Ionization prtndple ofMALDI.
The sample preparation is more crudal for MALDI-MS than for ESI-MS. A polymer salution
is mixed with a specific matrix. This matrix can be a salt andfor an acid and has to be able to
absorb the laser light, which in general has a wavelength of337 nm. In addition, the type of
the matrix is very important, since different matrices have to be used for different types of
polymers [4] . During the evaporation of the solvent the matrix crystallizes, and the polymer
molecules are, in the ideal case, incorporated in the crystalline matrix as isolated coils. Also
the matrix will need to transfer a charge to the polymer, which generally is not easily
ionized. The probe, containing sample and matrix, will be pulsed by laser-light, the matrix
absorbs the laser-light, and the polymer molecules desorb. The exact ionization process is not
lmown, but the polymer molecules get ionized. In genera!, the polymer molecules will be
charged by one single proton or cation from the matrix.
By applying electricallenses, the charged molecules (matrix and polymer) are transported
to the analyzer. The ionization step of MALDI is not as soft as that of ESI, because the high
energy laser light can still fragment the polymer molecules. The most common analyzer used
in combination with MALDI is the time-of-flight (TOF) analyzer. Since low molar masses will
be accelerated to a higher speed than the higher molar masses, the TOF analyzer separates
the analyte from low to high rnalar masses. The TOF analyzer has a specific length, each ion
will have a characteristic time of flight, depending on the length of the analyzer and on the
mfz of the ion. The TOF analyzer analyzes plugs or pulses of the sample according to the
speed (time of flight) of the analyte. The TOF determination of one pulse/plug of the sample
takes a fraction of a microsecond [10).
There are certain drawbacks associated with MALDI-TOF MS. MALDI-TOF MS is more
sensitive for low molar mass molecules [9), resulting in an overestimation of low rnalar mass
molecules compared to the high molar mass molecules. Desorption of higher rnalar masses
from the matrix is more difficult than that of low molar masses. Consequently, when a

Other Analytica! Techniques Applied to Characterize Copolymers 33
polymer sample with a broad molar mass distribution (high polydispersity) is analyzed with
MALDI MS, the low molar mass part will dominate the spectra and the high molar mass
species will not be detected. Only polymers with a low polydispersity ( < ± 1.2) can be
correctly identified with MALDI-MS (9] and since commercial polymers rarely have
polydispersities lower than 1.2, MALDI-MS is not directly useful for commercial polymers.
However, SEC or GPEC can be applied to obtain low polydispersity fractions. The separated
SEC or GPEC fractions can thereafter be analyzed off-line with MALDI-MS. Since the sample
has to be incorporated into the matrix, MALDI-MS cannot easily be used on-line. Nevertheless,
recent developments in the field of on-line interfaces will probably make on-line MALDI-MS
practicabie in the near future.
3.4 REPERENCES
1. B.J. Huntand S.R. Holding, "Size Exclusion Chromatography", Blackie and San Ltd., Landan, 1989. 2. G. Glöckner, "Gradient HPLC of Copolymers and Chromatographic Cross Fractionation", Springer-
Verlag Berlin Heidelberg, 1991. 3. Z. Grubisii:, P. Remmp and H. Beniat,j. Polym. Sci. B, Polym. Letters 5, 753 (1967). 4. G. Mantauda, Trends Polym. Sci., 4, 81-86 (1996). 5. A.L. Burlingame, R.K. Bayd, and S.j. Gaskell, Anal. Chem., 70, 647R-715R {1998). 6. R. Saft, C. Mirt! and K. Hummel, Acta Polymer, 48,513-526 (1979). 7. J. Thrack Watsan, "Introduction to Mass Spectrometry", third editian, Lippincart-Raven Publishers,
Philidelphia, 1997. 8. M.W.F. Nielen, Rapid Commun. Mass Spectrom., 10, 1652-1660(1996). 9. M.W.F. Nielen and S. Malucha, Rapid Commun. Mass Spectrom., 11, 1194-1204 (1997). 10. E. De Haffman,]. Charette and V. Straabant, "Mass Spectrometry, Principles and Applications', Jahn
Wiley & Sans, New Yark, 1996. 11. M.W.F. Nielen and F.A. Buijtenhuijs, Anal. Chem., in press. 12. W.M.A. Niessen and A.P. Tinke.j. Chromatogr. A, 703,37-57 (1995). 13. R.P Kriiger, H. Much and G. Schultz, Macromol. Symp., 110, 155-176 (1996).

Tbe Microstructural Analysis of Homopolyesters 35
Chapter4
The Microstructural Analysis of Homopolyesters ofNeopentyl Glycol with
Isophthalic Add and Terephthalic Add
Various analytica! tools have been used to identify the microstructure of homopolyester samples consisting of neopentyl glycol with isophthalic acid, or terephthalic acid. Size exclusion chromatography {SEC) was coupled with a viscometry detector to allow the application of universa! calibration method. Thus, the molar mass distribution (MMD) of the polyester samples was determined. Gradient polymer elution chromatography (GPEC) was used to separate the polyesters according to chemica! composition and functional end groups. Reversed-phase gradients of water, acetonitrile, and tetrahydrofuran were applied to obtain an optima! separation. Electrospray-ionization mass speetrometry and matrix-assisted-laser-desorption-ionization mass speetrometry were successfully applied for the identijication of the polyester oligomers. The combination of analytica! techniques provides unique and crudal information on the structure ofthe polymer.
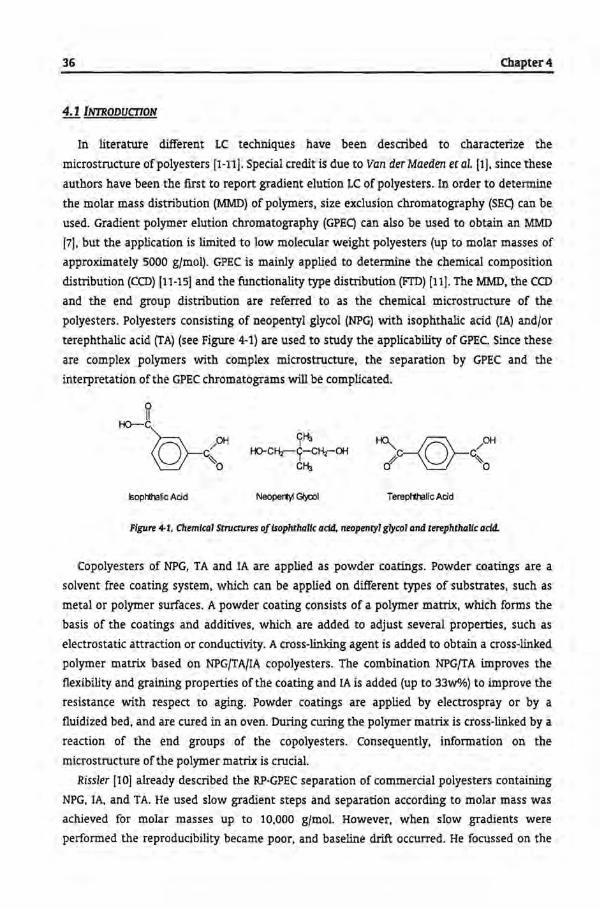
36 Chapter4
4.1 lNTRODUCTION
In literature different LC techniques have been described to cnaracterize the
microstructure of polyesters [1-11]. Special credit is due to Van der Maeden et al. [1], since these
authors have been the frrst to report gradient elution LC of polyesters. In order to determine
the molar mass distribution (MMD) of polymers, size exclusion chromatography (SEQ can be
used. Gradient polymer elution chromatography (GPEQ can also be used to obtain an MMD
[7], but the application is limited to low molecular weight polyesters (up to molar masses of
approximately 5000 gjmol). GPEC is mainly applied to determine the chemica! composition
distribution (CCD) [11-15] and the functionality type distribution (FI'D) [11]. The MMD, the CCD
and the end group distribution are referred to as the chemica} microstructure of the
polyesters. Polyesters consisting of neopentyl glycol (NPG) with isophthalic acid (IA) andjor
terephthalic acid (TA) (see Figure 4-1) are used to study the applicability of GPEC. Since these
are complex polymers with complex microstructure, the separation by GPEC and the
interpretation ofthe GPEC chromatograms will be complicated.
sopt-tralie Acid Neope~ Gl}rol Tereplthalic Acid
Figure 4-1, Chemica! Stnlctures ofisophthalic acid, neapentyl glycol and terephthalic acid.
Copolyesters of NPG, TA and IA are applied as powder coatings. Powder coatings are a
solvent free coating system, which can be applied on different types of substrates, such as
metal or polymer surfaces. A powder coating consists of a polymer matrix, which forms the
basis of the coatings and additives, which are added to adjust several properties, such as
electrostatle attraction or conductivity. A cross-linking agent is added to obtain a cross-linked
polymer matrix based on NPG/TA/IA copolyesters. The combination NPG/TA impraves the
flexibility and graining properties ofthe coating and IA is added (up to 33WOAl) to improve the
resistance with respect to aging. Powder coatings are applied by electraspray or by a
fluidized bed, and are cured in an oven. During curing the polymer matrix is cross-linked by a
reaction of the end groups of the copolyesters. Consequently, information on the
microstructure of the polymer matrix is crucial.
Rissier [10] already described the RP-GPEC separation of commercial polyesters containing
NPG, IA. and TA. He used slow gradient steps and separation according to molar mass was
achieved for molar masses up to 10,000 gjmol. However, when slow gradients were
performed the reproducibility became poor, and baseline drift occurred. He focussed on the

The Microstructural Analysis of Homopolyesters 37
separation of the eligomers according to rnalar mass, especially of the high molar mass
oligomers, and not on the separation according to the chemica! composition. He did not
identify the peaks and therefore detailed information a bout the separation and the polyesters
was not obtained.
The application of GPEC for polyesters containing di-propoxylated bisphenol-A, isophthalic
acid, adipic acid and rnalek acid, has been studied by Philipsen [11]. He studied the RP-GPEC
re tention mechanisms of the polyesters and applied RP-GPEC and NP-GPEC to determine the
CCD and FTD ofthe copolyesters.
Polyesters are synthesized by a polycondensation reaction, defined as a step reaction,
where the functional groups of the monomers, allgomers and polymers react. The polyesters
used in this study are formed from a di-alcohol monoroer (D) and a di-acid monoroer (A). A
functional acid group of A reacts with a functional alcohol group of D, re leasing water, giving
rise to the name polycondensation. The condensation reaction is schematically shown in
Figure 4-2.
Figure 4-2, Scheme of {poly)condensatton reaction.
The reaction of an acid group with an alcohol group is also known as esterfication. The
side product, water, is ellminated by distillation. This means that the equilibrium, as shown
in Figure 4-2, is forced to the right hand side. Esterfication can occur with monoroers as well
as with already formed ollgomers. Therefore, the ~ and ltz groups can be a monomer or an
oligomer. Consequently, the polymer molecules grow by combination of the eligomers and
monomers, in contrast to a chain polymerization, where solely the monomer units are added
to the active site of a growing polymer chain.
Depending on the monoroer unit at both ends of the chain, the end groups of the
polyesters can either be diol (D-D), acid-hydroxy (A-D), or di-acid {A-A). Also, cyclic
species can be fonned. These cyclic eligomers have no functional group with respect to the
hydroxy and acid end groups. The number and type of end groups play an important role in
the processing of the polyesters. Thus, information about the end group distribution is
essential for a proper understanding of the properties. Besides the differences in functional
end groups, the polyester will also contain allgomers with varying chemica! composition
(ratio and sequence of IA and TA).
In this chapter the separation of the homopolyesters by GPEC will be discussed. In order to
separate the copolyesters by GPEC (see Chapter 6), the retentien behavior of the
homopolyesters is studied. GPEC is solely a separation technique, and in general other
analytica! techniques have to be applied to identify the separated components. Therefore
mass speetrometry techniques, such as electrospray-ionization-mass-spectroscopy (ESI-MS)

38 Chapter4
and matrix-assisted-laser-desorption-ionization-mass-spectrometry (MALDI-MS) were applied
to determine the molar mass of the separated components (oligomers with different molar
mass and functional groups). ESI-MS was used on-line for the identification in reversed-phase
GPEC. MALDI-MS was applied off-line for the normal-phase GPEC experiments. Size exclusion
chromatography (SEC) was applied todetermine the MMDs ofthe homopolyesters.
4.2 EXPERIMENTAL
4.2.1 SYNTHESIS OF POLYESTERS
In order to study the separation of polyesters by GPEC, homopolyesters were synthesized
in bulk. The applied monoroers were neo-pentyl-glycol (NPG), isophthalic acid (IA), and
terephthalic acid (TA). Three different homopolyesters were synthesized: a polyester
containing IA and NPG (sample 14), a polyester containing TA and NPG (sample 15) and the
alkylated polyesters (sample 15M) of the TA/NPG homopolyester. The homopolyesters were
synthesized under melting conditions using the following procedure.
Initially, 50g of water and 500g NPG were mixed in a two liter reactor and heated to a
temperature of 80°C (water was added to melt the NPG at a lower temperature). Dibutyl tin
oxide was added (l.Sg) as a catalyst for the esterfkation reaction. When the NPG was melted,
900g of acid monomer, either IA or TA was added to the reactor, and the reactor was purged
with nitrogen and slowly heated to a temperature of 240°C in order to melt the acid
monomer. The water formed during the esterfkation was distilled off. After an acid value
(A V), determined by titration, of approx. 35 [mg KOH/g) was reached, the reactor was cooled
to 180°C. The total reaction times were not the same for the two homopolymers (see Table
4-1).
The homopolyester obtained with NPG and TA (sample 15) was also alkylated with
diazomethane using standard procedures and was coded sample 15M [16). The compositions
of the homopolyester samples used are shown in Table 4-1.
Table 4-1, Polyester Samples wlth different molfractions IA and TA. The used molfraction add (0.47 )was not changed
Sample Mol Fraction Reaction Time Code NPG IA TA Hours 14 0.47 0.53 0.0 9 15 0.47 0.0 0.53 17
15M 0.47 0.0 0.53 -
4.2.2 SIZE EXCLUSION CHROMATOGRAPHY
The SEC experiments were performed with a Spectraflow 400 solvent delivery system, a
Gaston GT-103 on-line degassing device, an ABI 757 multiple wavelength UV detector (À.=275
The Microstructural A'o.alysis of Homopolyesters 39
run), a Waters 410 DRI detector, a Viscotek model 502 DP detector, and a Separations
Triathlon automatic sample injector with a calibrated 50 JLL sample loop. The established
flow was 0.4 mlfmin of hexafluoro iso-propanol (HFIP, Matco N.V.) with 0.02 M potassium
trifluoro acetate (KTFA was added to avoid repelling and adsorption effects). The columns
used were two silica diol columns (Alltech, lOOÄ and lOOOÄ, 300x8mm, temperature 30°Q.
The polymer samples were dissolved in HFIP + 0.02 M KTFA at different concentrations {± 1
mgfml). The concentration of the injected samples had to be determined accurately in order
to apply the universa! calibration method. The columns were calibrated in tetrahydrofuran
with polystyrene SEC standards from Polymer Laboratories. The silica diol columns could be
calibrated with a different solvent system since the column packing was not polymer based
and, therefore, does not shrink or swell when different solvents were used. The molar masses
were detennined with the conventional method (polystyrene equivalent) and with the
universa! calibration method. The SEC data were acquired and processed with the Viscotek
Trisec software (version 3.0).
4.2.3 CRADIENT POLYMER BLUTION CHROMATOGRAPHY
The reversed phase GPEC experiments were performed with a Waters 616 Gradient Pump,
a Waters 490 multiple wavelength UV detector (260nm, 275nm, and 305nm), an Hewlett
Packard 1010 photodiode array detector (DAD), a Gaston GT-103 on-line degassing device, a
Separations Mistral column oven and a Waters 717 WISP Autosampler with variabie injection
volume. All the experiments were performed using a Waters 490 multiple UV detector
(275nm), except in the explicitly mentioned experimentsin which the HP 1010 DAD detector
was used. The applied solvents were acetonitrile (ACN, gradient grade, Merck), THF (HPLC
grade, unstabilized, Merck), H20 (MilliQ system, Millipore) and HFIP (UV quality, Matco BV).
Acetic acid (1 vol%) was added to the eluents in order to protonate the acid end groups ofthe
polyesters, thus avoiding repelling and sorption effects. The applied gradients are described
in Table 4-2 and Table 4-3, and schematically represented in Figure 4-3. The column applied
for the RP-GPEC experiments, was a Waters Symmetry Si-C18. The flow was 0.5 mlfmin. The
concentration was 10 mgfml and the injection volume 25JLL The column temperature was
established at 55 °C. Gradient A was also applied with HFIP instead ofTHF (see Table 4-2). The
optimization ofthe gradient A was performed by trial and error.
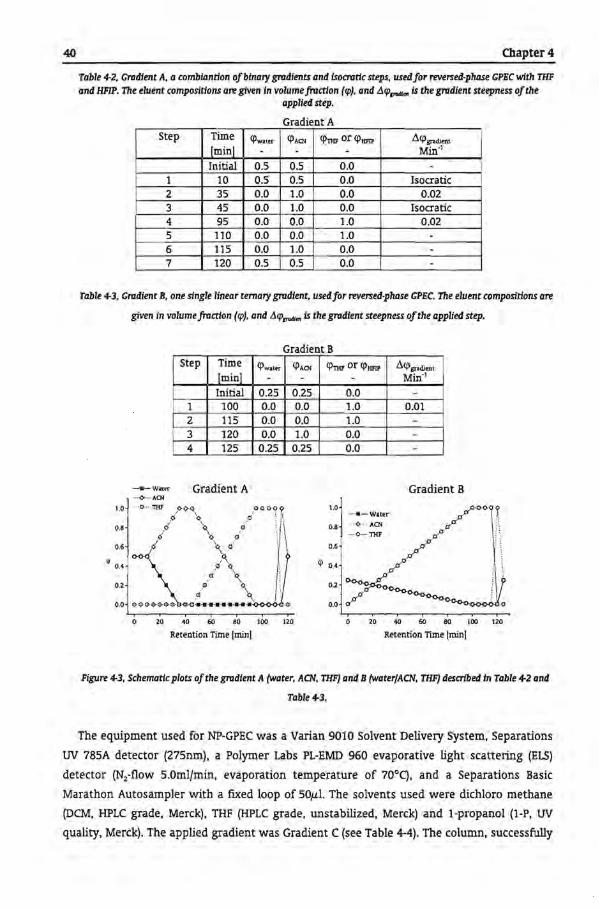
40 Chapter4
Table 4-2. Gradient A, a combiantion ofbinary gradients and lsoeratic steps, usedfor reversed-phase GPEC with THF and HFIP. The eluent compositions are given In volume fraction (<p), and L1<p,_.,. is the gradient steepness ofthe
applied step.
GradientA Step Time <l>waur GJACN G'THF or G'HFIP Ll.q>gndiont
[mini - - - Min"1
Initia! 0.5 0.5 0.0 -1 10 0.5 0.5 0.0 Isoeratic 2 35 0.0 1.0 0.0 0.02 3 45 0.0 1.0 0.0 Isoeratic 4 95 0.0 0.0 1.0 0.02 5 110 0.0 0.0 1.0 -6 115 0.0 1.0 0.0 -7 120 0.5 0.5 0.0 -
Table 4-3, Gradient B, one single linear temary gradient, usedfor reversed·phase GPEC. The eluent compostdons are
given in volumefraction (<p), and L11pJnldi,. is the gradient steepness ofthe applied step.
Gradient B Step Time
<vwi.UC GJACN
[minl - -Initia! 0.25 0.25
1 100 0.0 0.0 2 115 0.0 0.0 3 120 0.0 1.0 4 125 0.25 0.25
-•-wmr Gradient A ·-·<>-··· A.Of
1.0 ····0 ---rnF f><>-~\ o-0-0·Q~
0.8 ~/ ~\ /d i\ o.6 6 \ o : 1
:.: ~' ... \ 1/i <!J '\ I •
0.0 o-e e &oe -D-d·•---•-•-•·• ·•·•·•..()-0..()-()-à-o
0 zo 40 60 80 100 120
Recention Time I min!
<pTHF or G'HFIP -
0.0 1.0 1.0 0.0 0.0
1.0 -•-Water
0.8 ···· <> ···AOI
0.6
Ll.q>gradieot Min.1
-0.01 ---
Gradient B
0 20 40 60 80 100 120
Retention Time !min!
Figure 4-3, Schematic plots of the gradient A (water, ACN, THF) and B (waterfACN, THF) descn"bed In Table 4-2 and
Table 4-3.
The equipment used for NP-GPEC was a Varian 9010 Solvent Delivery System, Separations
tN 785A detector (275nm), a Polymer Labs PL-EMD 960 evaporative light scattering (ELS)
detector (N2-flow S.Omlfmin, evaporation temperature of 70°Q, and a Separations Basic
Marathon Autosampler with a fixed loop of SO,ul. The solvents used were dichloro methane
(DCM, HPLC grade, Merck), THF (HPLC grade, unstabilized, Merck) and I-propanol (1-P, tN
quality, Merck). The applied gradient was Gradient C (see Table 4-4). The column, successfully

The Microstructural Analysis of Homopolyesters 41
applied for the NP·GPEC experimer..ts, was an Alltech Si-diol column (lOO.Ä, 300x3.6mm). The
established flow was 0.5 mi/min, and the concentration used for NP·GPEC was 10 mgfml and
the injection volume SO,ul. The applied column temperature was 30°C.
Table 4-4, Gmdtent C used for NP-GPEC experiments.
Step Time DCM THF 1-P LminJ % % % Initial 100 0 0
1 5 99 1 0 2 10 99 1 0 3 15 0 95 5 4 20 0 100 0 5 30 0 100 0 6 35 100 0 0
The working principle of the evaporative light scattering (ELS) detector is as follows. The
eluent with the sample is nebulized and heated. The eluent wil1 evaporate and a polymer sol
is formed. The analyte wil1 then pass a light bream, and scattering of the light by the sol is
detected. The detector can easily be used as a qualitative detector. The quantification with an
ELS detector is still a point of discussion, especially the non-linear re lation between the signa!
response and the concentration ofthe analyte. Additionally, depending on the nebulizing and
evaporating technique of the ELS detector the signa! depends on the molar mass, chemica!
composition, and eluent composition. However, the quantification with modem ELS detectors
has improved over the years [17].
4.2.4 ELEITROSPRAY·lONIZATION MA ss SPEITROMETRY
The ESI·MS experiments were performed on a Micromass (Altrincham, UK) model
VG/Piatform mass spectrometer, equipped with an API source, a coaxial probe for
pneumatically-assisted ES! combined with a flow of sheath liquid. The drying and nebulizing
gas was nitrogen. Negative ESI·MS spectra were acquired from 250 to 2000 gfmol at a
scanning rate of 3 seconds per scan. The ESI-MS was calibrated in the positive-ion ESI mode
using a mixture of polyethylene glycol-ammonium adducts. The souree temperature was set
at 85°C and the cone voltage was set (in both ionization modes) at 120 V. For more details
about the conditions and the equipment ofthe ESI·MS experiments see reference [18].
4.2.5 MATRIX·ASSlSTED-l.ASER·DE SORPTION·lONIZATION MASS SPEITROSCOPY
The MALDI experiments were performed on a Broker (Bremen, Germany) model Billex
MALDI time-of-flight mass spectrometer equipped with a 337 nm nitrogen laser, a delayed
extraction Scout ion source, a sensitive high-dynamic range detector (Himass) in the linear
mode, a high resolution MCP detector in reileetton mode, and a 1 GHz digitizer. The system

42 Chapter4
was calibrated by extrapolated external multipoint calibration, based on polystyrene 7500
(gfmol). The scan range was in linear mode 1-100 kgfmol and in reflector mode 1000-8000
gfmol. The matrix used for the ionization is indoleacrylic acid (IAA) (20 mgfml THF). For more
details a bout the conditions and the equipment of the MALDI-MS experiments see reference
[19].
4.3 RESULTS AND DISCUSSION
During the polymerization reaction of a di-alcohol monoroer (D) and a di-acid monoroer (A)
four different types of oligomers with the same degree of polymerization or number of
repeating units (p) can be formed. The repeating unit of the oligomers is defined as AD.
Oligomers with two acid end groups (AD)P·A, with one acid and one hydroxy end group (AD)P,
and with two hydroxy end groups D-(AD)p can be formed. In addition cyclic oligomers can be
formed (AD)/"'u'. The cyclic oligomers are thought to greatly affect the properties of the
polyester. When the polyester is further processed, these oligomers will not take part in
reactions involving functional end groups, e.g. cross-linking.
The repeating unit of the polyester is the combination of the two monoroers A and D. In
Table 4-5, all possible oligomers with degree ofpolymerization (p) from 0 to 3 are shown. The
molar mass of each unit is calculated from the equations shownat the bottorn ofTable 4-5 (at
degree ofpolymerization p). IA and TA are isoroers and, therefore, have the same molar mass
(166 gfmol). NPG has a molar mass of 104 gfmol.
Table 4-5, Oligomeric serles of polyesters formed from a dl-acid A and a dl-alcohol D. The oligomers wfll have different end groups and different degrees of polymerizatlon (p).
Degree of Formula End group MolarMass Polymerization [g/mol]
0 A A-A 166 D D-D 104
(AD) A-D 252
1 (AD)-A A-A 400 D-(AD) D-D 338 (AD), A-D 487
2 (AD)2-A A-A 635 D·(AD)z D-D 573
{AD}zcyclic Cyclic 468 lAD), A-D 721
3 (AD),-A A-A 869 D-(AD)3 D-D 807 (AD)3cyclic Cyclic 702
(AD)0 A-D (M + M -M,..,.,)•p-M,.,,.;(p-1) p lADJo·A A-A (M +M6-M,.,,.,)*p+M -M.,.,.;p
D-f_AD)0 D-D (MA+ Ma·M,.,,.,)*p+ Ma-Mwoter0P (AD)ncyldc Cyclic (M, + M -M.,,,.r)*p-M.,,,..,*p

The Microstructural Analysis of Homopolyesters 43
Polycondensation implies the formation of a low molar mass side product (water in this
case). Consequently, the molar masses in Table 4-5 are calculated by the addition ofthe molar
masses ofthe acid/alcohol (number ofrepeating units) and the subtraction ofthe molar mass
of water. Depending on the type of end group, a di-acid monoroer (A) or a di-alcohol
monoroer (D) is added. The statistica! end group distribution of di-acidfdi-ol polyesterfication
are shown in Table 4-6. The cyclic allgomers are not included since the kinetics of the
cyclization reaction are not lmown. Probably the cyclic allgomers are formed by
intermolecular transesterfication ('backbiting') ofthe polyester ebains (23).
Table 4-6, Molfractlon ofthe different end groups basedon the probabr1ittes with molfractlon ofNPC of0.47.
Oligomers Calculation Mol fraction
D-(AD)" 0.47.0.47 0.22
(AD)" 2.0.47.0.53 0.50 (AD )n-A 0.53.0.53 0.28
The numbers are based on equal reactivities of the different end groups. Whenever the
reactivities ofthe acid end group and the alcohol end group differ, the end group distribution
calculated in Table 4-6 wou1d not langer be correct. The mol fraction of NPG used during the
synthesis is 0.47.
The oligomers, described in Table 4-5, are the oligomers to be found with MS. MS wil1 be
used to determine the molar mass of each oligomer. From the information on the molar mass,
the degree of polymerization (p) and the functionality of each oligomer can be determined.
With the peak position in the GPEC separation and Ultraviolet (UV) spectroscopy the ratio
IA/TA of each oligomer can be determined. The most commonly used detector in HPLC is the
UV absorbance detector. When the separated components have UV extinction, the
components can be detected by a UV absorbance detector. The UV spectra of the
homopolyesters IA and TA in hexafluoro iso-propanol (HFIP) are different (see Figure 4-4). NPG
cannot be detected, since it does not have any UV extinction.
2l c:
.e 1.000 0 f/)
~
250 300
Figure 4-4, Ultraviolet spectra ofhomopolymers ofneopentyl glycol {NPC} with isophthalic acid (IA)(-··} and NPC
with terephthalic add {TA} ( -1 in hexafluoro iso-propanol with (0.02M I<TFA).
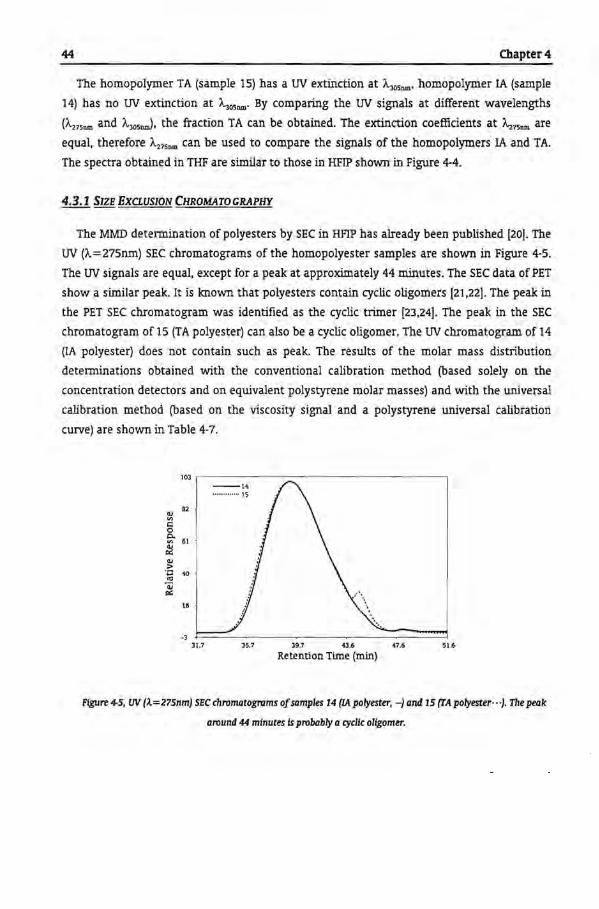
44 Chapter4
The homopolymer TA (sample 15) has a UV extinction at À.30snm• homopolymer IA (sample
14) has no UV extinction at À.3osnm· By camparing the UV signals at different wavelengths
(À.275nm and À.305nmJ, the fraction TA can be obtained. The extinction coefficients at ~7snm are
equal, therefore ~7snm can be used to campare the signals of the homopolymers IA and TA.
The spectra obtained in THF are similar to those in HFIP shown in Figure 4-4.
4.3.1 SIZE EXCLUSION CHROMATO GRAPHY
The MMD determination of polyesters by SEC in HFIP has already been published [20]. The
UV (À.=275nm) SEC chromatograms of the homopolyester samples are shown in Figure 4-5.
The UV signals are equal, except for a peak at approximately 44 minutes. The SEC data of PET
show a similar peak. It is known that polyesters contain cyclic eligomers (21,22]. The peak in
the PET SEC chromatagram was identified as the cyclic triroer [23,24). The peak in the SEC
chromatagram of 15 (TA polyester) can also be a cyclic oligomer. The UV chromatagram of 14
(IA polyester) does not contain such as peak. The results of the molar mass distribution
detenninations obtained with the conventional calibration method (based solely on the
concentratien detectors and on equivalent polystyrene molar masses) and with the universa!
calibration method (based on the viscosity signa! and a polystyrene universa! calibration
curve) are shown in Table 4-7.
82 ... "' t: 0
"" "' 61 ~ ~ ·o 40
"' ~ IS
·3 31.7
--14 .............. IS
· .. )5.7 39.7 4).6 47.6 5 1.6
Retention Time (min)
Ftgure 4-5, UV (À=275nm) SEC chromatagmms of samples 14 {IA polyester, -) and 15 {TA polyester···). The pealc
around 44 minutes is probably a cyclic oligomer.
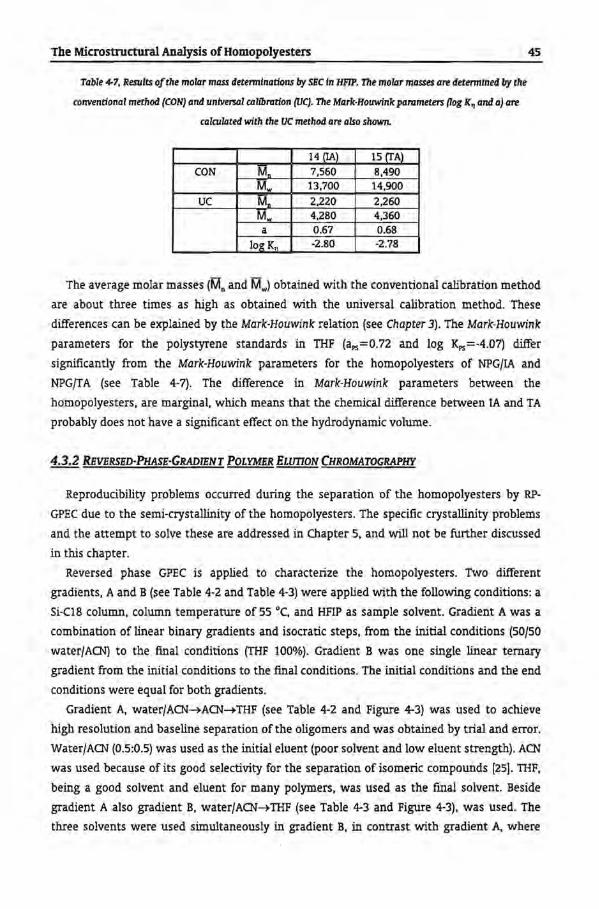
The Microstructural Analysis of Homopolyesters
Table 4-7, Results ofthe molar mass determinations by SBC In HFIP. The molar masses are determined by the
conventional method {CON) and unlvmal eaUbration (UC). The Mark·Houwink parameters (log K~ and a) are
calculated with the UC methad are a lso shown.
14 (IA) 15 (rA) CON M. 7,560 8,490
Mw 13,700 14,900 uc M. 2,220 2,260
Mw 4,280 4,360 a 0.67 0.68
logKn -2.80 -2.78
45
The average rnalar rnasses (M. and Mwl obtained with the conventional calibration methad
are about three tirnes as high as obtained with the universa! calibration rnethod. These
differences can be explained by the Mark-Houwink relation (see Chapter 3). The Mark-Houwink
parameters for the polystyrene standards in THF (aP$=0.72 and log KPS=-4.07) differ
significantly from the Mark-Houwink parameters for the homopolyesters of NPG/IA and
NPG/TA (see Table 4-7). The difference in Mark-Houwink parameters between the
homopolyesters, are rnarginal, which means that the chemica! difference between IA and TA
probably does nat have a significant effect on the hydrodynamic volume.
4.3.2 REVERSED-PHASE-GRADIENT POLYMER BLUTION CHROMATOGRAPHY
Reproducibility problerns occurred during the separation of the homopolyesters by RP
GPEC due to the semi-crystallinity of the hornopolyesters. The specific crystallinity problems
and the attempt to solve these are addressed in Chapter 5, and wil! not be further discussed
in this chapter.
Reversed phase GPEC is applied to characterize the homopolyesters. Two different
gradients, A and B (~ee Table 4-2 and Table 4-3) were applied with the following conditions: a
Si-C18 column, column temperature of 55 °(, and HFIP as sample solvent. Gradient A was a
combination of linear binary gradients and isoeratic steps, from the initial conditions (50/50
water/ACN) to the final conditions (THF 100%). Gradient B was one single linear temary
gradient from the initia! conditions to the final conditions. The initia! conditions and the end
conditions were equal for both gradients.
Gradient A, water/ACN~ACN~THF (see Table 4-2 and Figure 4-3) was used to achleve
high resolution and baseline separation ofthe allgomers and was obtained by trial and error.
Water/ACN (0.5:0.5) was used as the initia! eluent (poor solvent and low eluent strength). ACN
was used because ofits good selectivity for the separation of isomerie compounds (25]. TilF,
being a good solvent and eluent for many polymers, was used as the fmal solvent. Beside
gradient A also gradient B, water/ACN~THF (see Table 4-3 and Figure 4-3), was used. The
three solvents were used simultaneously in gradient B, in contrast with gradient A, where
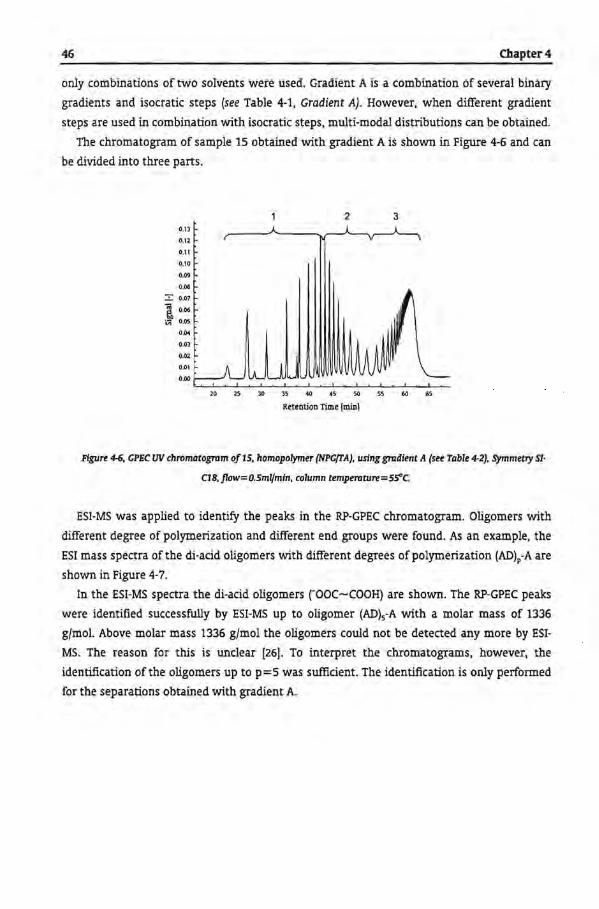
46 Chapter4
only combinations of two solvents we re used. Gradient A is a combination of several binary
gradients and isoeratic steps (see Table 4-1, Gradient A). However, when different gradient
steps are used in combination with isoeratic steps, multi-madal distributions can be obtained.
The chromatagram of sample 15 obtained with gradient A is shown in Figure 4-6 and can
be divided into three parts.
0.13
0.12
0.11
0.10
0.09
0.08
:::!: 0.07
1 0.06
V) 0.05
0.04
O.Ol
0.02
0.01
0.00
2 3
N B ~ ~ ~ ~ ~ ~ ~ ~
Retentien Time (min)
Figure 4-6, CPEC UV chromatogram of15, homopolymer (NPC(rA), using gradient A (see Table 4-2), Symmetl}' SI·
C18,JIC1W=0.5mlfmln, column temperature=SS"C.
ESI-MS was applied to identify the peaks in the RP-GPEC chromatogram. Oligomers with
different degree of polymerization and different end groups were found. As an example, the
ESI mass spectra ofthe di-acid oligomers with different degrees ofpolymerization (AD)P-A are
shown in Figure 4-7.
In the ESI-MS spectra the di-acid oligomers rooC-COOH) are shown. The RP-GPEC peaks
were identified successfully by ESI-MS up to oligomer (AD)s-A with a molar mass of 1336
gfmol. Above molar mass 1336 gfmol the oligomers could not be detected any more by ESI
MS. The reason for this is unclear [26). To interpret the chromatograms, however, the
identification ofthe oligomers up to p=S was sufficient. The identification is only performed
for the separations obtained with gradient A.
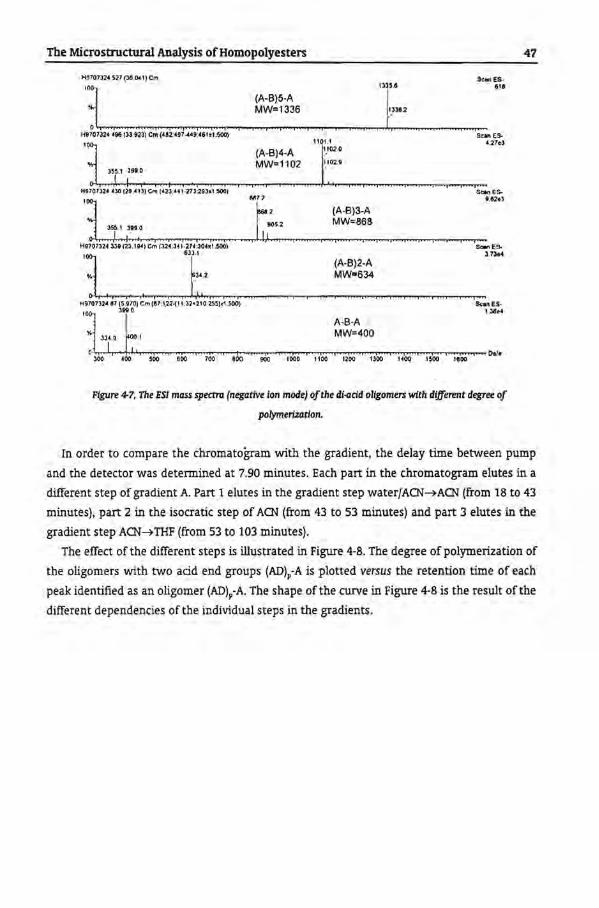
The Microstructural Analysis of Homopolyesters
1-49707324 521 (36.tu 1) Cm Sc., ES-618 'j ~~2;;~. "]::.
o~,~.~.~~·~· ~·~·~·~~.~.~~~--~r-~~~~~~~~~~--~~~~·--H9707J2< 496(33 923) Cm (482:497-4<9:46ht.500) 9eon ES-
IOj 1101 .1 4.27e3 (A-8)4-A ~~-to2.o MW=1102 11n•
)55.1 399.0
i ! I ,, ' I ' i ' ' ',,,
Figure 4-7, The ESI mass spectra (negative ion mode) ofthe di-<1dd oligomers with different degree of
polymerization,
47
In order to compare the chromatagram with the gradient, the delay time between pump
and the detector was determined at 7,90 minutes. Each part in the chromatagram elutes in a
different step of gradient A. Part 1 elutes in the gradient step waterjACN~ACN (from 18 to 43
minutes), part 2 in the isoeratic step of ACN (from 43 to 53 minutes) and part 3 elutes in the
gradient step ACN~THF (from 53 to 103 minutes).
The effect of the different steps is illustrated in Figure 4-8_ The degree of polymerization of
the oligomers with two acid end groups (AD)P-A is plotted versus the retention time of each
peak identified as an oligomer (AD)p-A- The shape of the curve in Figure 4-8 is the result ofthe
different dependencies ofthe individual steps in the gradients,
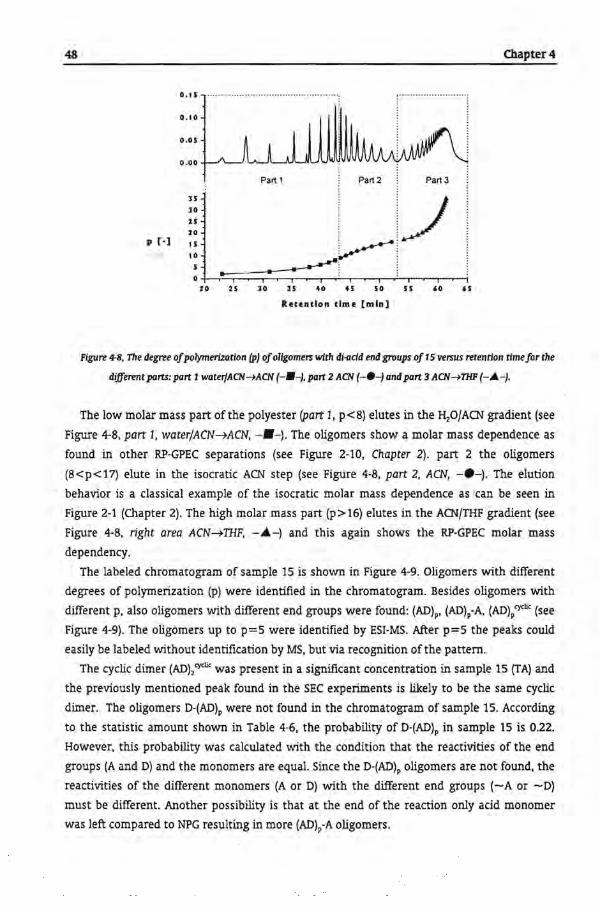
48
p [-]
O.t 5 ....... .. .. .... . . . .. . ... . . ....... . .... .. .. . .... .
o.to
0.05
JS
JO
25 20
tS
to
Part 1
20 25 JO J5 40 45 50 55 60 65
Retentlon time [mln]
Chapter4
Figure 4-8, The degree of polymerlzation (p) of oligomers with di-Gdd end groups of 15 versus retendon time for the
different parts: part 1 waterfACN~ACN (---).part 2 ACN (-·-) and part 3 ACN~THF (-Ä.-).
The low molar mass part ofthe polyester (part 1, p<8) elutes in the ~0/ACN gradient (see
Figure 4-8, part 1, waterfACN-+ACN, -•-). The oligomers show a molar mass dependenee as
found in other RP-GPEC separations (see Figure 2-10, Chapter 2). part 2 the oligomers
(8<p<17) elute in the isoeratic ACN step (see Figure 4-8, part 2, ACN, -e-). The elution
behavior is a classica! example of the isoeratic molar mass dependenee as !can be seen in
Figure 2-1 (Chapter 2). The high molar mass part (p> 16) elutes in the ACN/THF gradient (see
Figure 4-8, right area ACN-+THF, -Al-) and this again shows the RP-GPEC molar mass
dependency.
The labelect chromatagram of sample 15 is shown in Figure 4-9. Oligomers with different
degrees of polymerization (p) were identified in the chromatogram. Besides oligomers with
different p, also oligomers with different end groups were found: (AD)p, (AD)p·A, (AD)/yctic (see
Figure 4-9). The eligomers up to p=5 were identified by ESI-MS. After p=5 the peaks could
easily be labeled without identification by MS, but via recognition ofthe pattem.
The cyclic dimer (AD)2cyclic was present in a significant concentration in sample 15 (TA) and
the previously mentioned peak found in the SEC experiments is likely to be the same cyclic
dimer. The oligomers D-(AD)P were not found in the chromatagram of sample 15. According
to the statistic amount shown in Table 4-6, the probability of D-(AD)P in sample 15 is 0.22.
However, this probability was calculated with the condition that the reactivities of the end
groups (A and D) and the monoroers are equal. Since the D-(AD)P oligomers are not found, the
reactivities of the different monomers (A or D) with the different end groups (-A or -D)
must be different. Another possibility is that at the end of the reaction only acid monomer
was left compared to NPG resulting in more (AD)P-A oligomers.
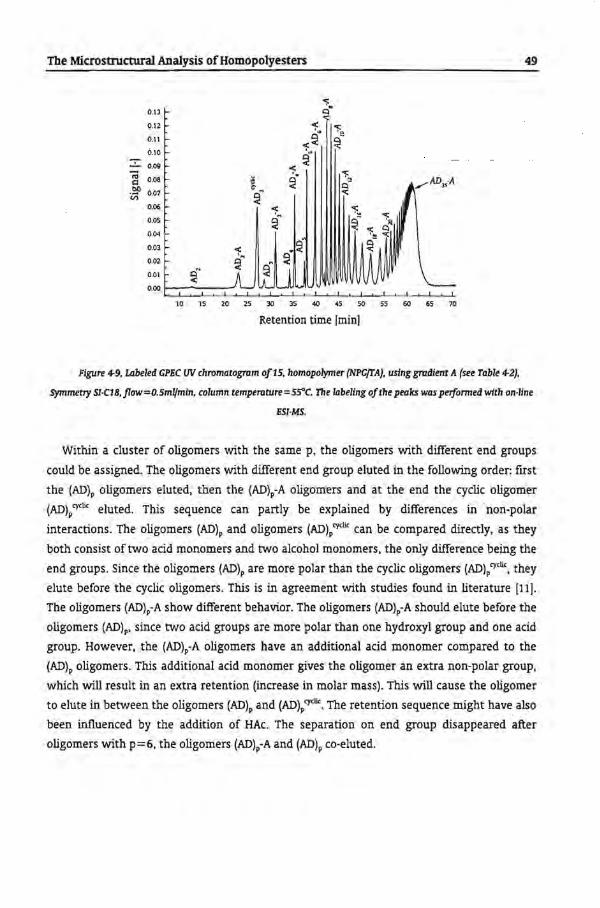
The Microstructural Analysis of Homopolyesters 49
~ 0.13
0.12 < ,:0 ·~ 0.11 ~~ ~-0.10 ~~
:::!: 0.09 ;;;
0.08 c:l bO 0.07 ·v;
0.06
0 .05
0.04
0.03
O.Q2
O.ot ~N
0.00
10 IS 20 25 30 35 40 45 50 55 60 65 70
Retention time [min)
Figure 4-9, Labeled CPEC UV chromatagram of15, homopolymer {NPC/TA). using gradient A (see Table 4-2),
5ymmeoy Sl·C18, flow=O.Sml{mtn, column temperoture=SS"C. The labeling ofthe pealcs was peiformed with on-line
ESl·MS.
Within a cluster of eligomers with the same p, the eligomers with different end groups
could be assigned. The eligomers with different end group eluted in the following order: flrst
the (AD)P eligomers eluted, then the (AD)P-A eligomers and at the end the cyclic oligomer
(AD)P cyclic eluted. This sequence can partly be explained by differences in · non-polar
interactions. The eligomers (AD)p and eligomers (AD)Pcyclic can be compared directly, as they
both consist of two acid monoroers and two alcohol monomers, the only difference being the
end groups. Since the eligomers (AD)P are more polar than the cyclic eligomers (AD)Pcycuc, they
elute before the cyclic oligomers. This is in agreement with studies found in literature [11] .
The eligomers (AD)P-A show different behavior. The eligomers (AD)P-A should elute befere the
eligomers (AD)P. since two acid groups are more polar than one hydroxyl group and one acid
group. However, the (AD)P-A eligomers have an additional acid monoroer compared to the
(AD)P oligomers. This additional acid monoroer gives the oligomer an extra non-polar group,
which will result in an extra retentien (increase in molar mass). This will cause the oligomer
to elute in between the oligomers (AD)P and (AD)Pcycuc. The retention sequence might have also
been influenced by the actdition of HAc. The separation on end group disappeared after
eligomers with p=6, the oligomers (AD)p-A and (AD)P co-eluted.

50
0.10
0.08
> So.o6 (Ij c C)
i:i5 0.04
0.02
AD4-A
--14
AD cyclic 2 AD -A ADS-A
4
AD -A 3
AD-A 3
--15
AD-A 2
18 20 22 24 26 28 30 32
Ratention time [min] AD cyclic
3
Chapter4
Figure 4-10, OVerlay ofthe chromatagmms and the identlficatlon ofthe pealcs ofthe homopolyerters 14 (black llne}
and 15 {red lîne} obtained with gradient A. Wîth at the top thefuU chromatagram and at the bottorn the detaUed
overlay ofthe labeled chromatograms.
In Figure 4-10 an overlay of the chromatograms of the two homopolymers 14 and 15
obtained with Gradient A is shown. The full overlay of the chromatograms is shown at the
top of the tigure and the detailed overlay at the bottom. The two chromatograms at the top
show crystallinity problems. The homopolyesters of NPG/IA and NPG/TA form a crystalline
phase during precipitation step, which results in a poor reproducibilitj of the chromatogram,
especially at the end of the chromatagram (around 80 minutes). The problems concerning
crystallinity will be further discussed in Chapter 5.
The two chromatograms show many differences. First of all, all the oligomers ADP·A, ADP
and (AD)p cyclic with equal p were separated according to the nature of the acids. The oligomers
containing IA eluted befare the oligomers containing TA, irrespective of their end groups.
Consequently, the TA group shows more retention. The separation on the isomer content
IA/TA resembles the separation of polystyrene isomers described by Lewis et al. [25] , who also
used gradients with ACN as the poor solvent. Consequently, this separation on chemica!
composition can be used to separate copolyesters of !A and TA.
The cyclic oligomers (AD)pcyclic are more pronounced in sample 14 (IA polyester) than in
sample 15 (TA polyester). More (AD)pcyclic oligomers are found (up to (AD)5cycli') in sample 14,

The Microstructural Analysis of Homopolyesters 51
however, the cyclic oligomer (AD)2cyclk is prominently present in sample 15 and not in sample
14. With TA the formation of the dimer was preferentlal to the formation of the other cyclic
oligomers, since the other cyclic eligomers were found only in small amounts. This can be
explained by the fact that the formation of cyclic oligomers with higher p is less probable
than that of the cyclic dimer. In addition, the formation of the cyclic oligomer (AD)1cyctic is
unlikely because of steric hindrance. In sample 14 a distribution of cyclic oligomers was
found, and no cyclic oligomer was preferentially present. The cyclic oligomers are probably
forrned by 'backbiting' ofthe polyester chains [23].
In Figure 4-11 the degree of polymerization (p) of the di-acid oligomers ADP-A of the
homopolyesters 14 (IA) and 15 (TA) is plotted versus the retention time.
4S 40
~ 40 35 ---------- ·
' ' = ' '
30 ' ' 0 3S ' ' 'tl : ' .. N 30 25 ·c ., ]. 2S 20
0 cr-IC'
"" 20 15 .... 56 58 60 62 0 ., IS
~ 10 ~ -•-14
•-o- ... -0-15
20 25 30 35 40 4S so ss 60 65
lletention time [min]
Figure 4-ll, Plot of degree of polymerization versus retendon time [min] of pealcs of the di-acid oltgomers {AD);A
of homopolyesters 14 {IA ..... } and J5 (IA, ···o·· ·} ustng the binary grudient A.
When gradient B is applied, a different chromatagram is obtained. The chromatogram
shows one continuous distribution (see Figure 4-13), unlike the chromatogram obtained with
gradient A, and shows also a higher resolution. In Figure 4-12 the comparison is shown ofRP
GPEC UV chromatograms of homopolyester 15 (TA) obtained by applying the binary gradient
A and the ternary gradient B.
The chromatograms of the homopolymers obtained by the gradients A and B are
comparable, especially during the fust 40 minutes. With the identification of the
chromatagram obtained with the binary gradient (gradient A), the chromatagram obtained
with the ternary gradient can easily be interpreted.
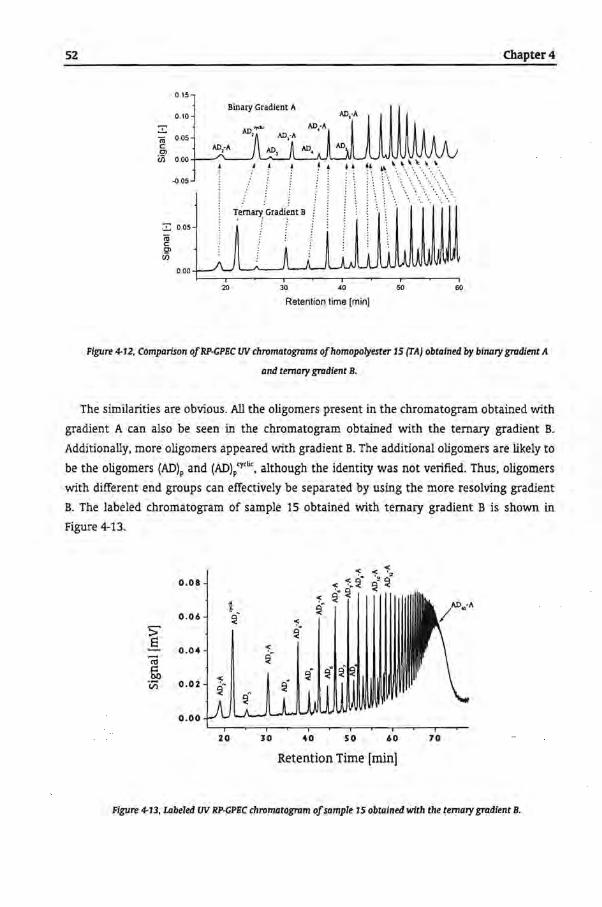
52
0.15
0.10
n; 0 .05 c Cl ü5 0.00
-<>.05
:::!: 0.05 n; c Cl ü5
0.00
Chapter4
Binary Gradient A
20 30 40 50 60
Relention time [min]
Figure 4-12, Comparison ofRP·GPEC UV chromatograms of homopolyester 15 (fA) obtalned by binary gradient A
and temary gradient B.
The similarities are obvious. All the eligomers present in the chromatogram obtained with
gradient A can also be seen in the chromatogram obtained with the ternary gradient B.
Additionally, more eligomers appeared with gradient B. The additional eligomers are likely to
be the eligomers (AD)P and (AD)Pcycuc. although the identity was not verified. Thus, eligomers
with different end groups can effectively be separated by using the more resolving gradient
B. The labeled chromatogram of sample 15 obtained with ternary gradient B is shown in
Figure 4-13.
0.08
0.06
> .§.
0.04 ëii ~
V) 0.02
o.oo
20 30 40 50 60 70
Retentien Time [min]
Figure 4-13, Labeled UV RP·GPEC chromatagram of sample 15 obtained with the temary gradlent B.
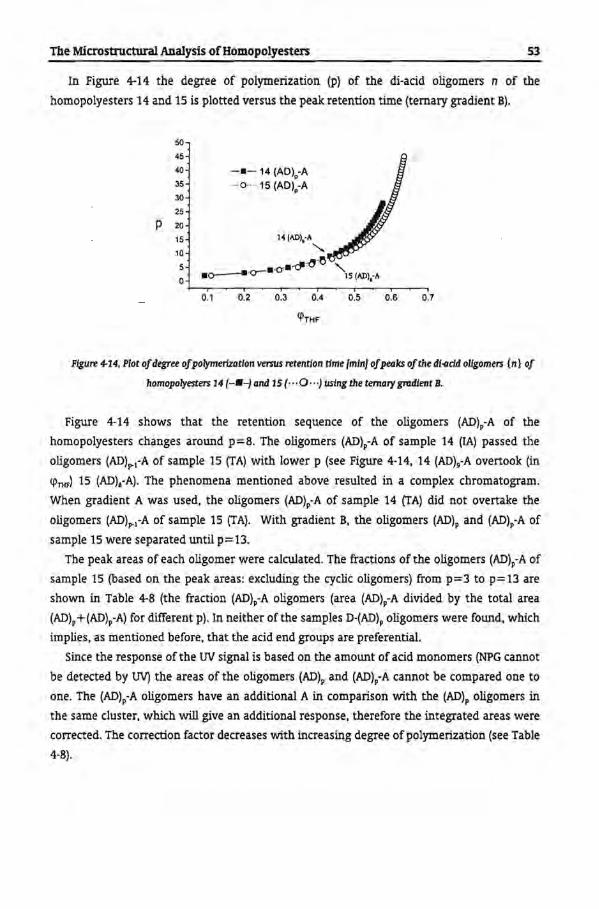
The Microstructural Analysis of Homopolyesters 53
In Figure 4-14 the degree of polymerization (p) of the di-acid eligomers n of the
homopolyesters 14 and 15 is plotted versus the peak retentien time (temary gradient B).
50
45
40
35
30
25
p 20
15
10
5
0
-•- 14 (AD)0-A o 15 (AD)0-A
14(AD),-A
""' -~~-15 " •o---•-o-•-0' IS (AD),·A
~,-~-,--~,-~-.--~.-~----~~
0.1 0.2 0.3 0.4
q>THF
0.5 0.6 0.7
Figure 4-14. Plot ofdegree ofpolymerization versus retendon time [min} ofpea'ks ofthe di-add altgomers {n} of
homopolyesters 14 (-•-J and 15 {-··0 .. ·) using the temary gradient B.
Figure 4-14 shows that the retentien sequence of the eligomers (AD)P-A of the
homopolyesters changes around p=8. The eligomers {AD)P-A of sample 14 (IA) passed the
eligomers (AD)p-1-A of sample 15 {TA) with lower p (see Figure 4-14, 14 {AD)g-A overtook (in
q>ntF) 15 (AD}a-A). The phenomena mentioned above resulted in a complex chromatogram.
When gradient A was used, the oligomers (AD)p-A of sample 14 {TA) did not overtake the
eligomers {AD)p-1-A of sample 15 {TA). With gradient B, the oligomers {AD)p and {AD)p-A of
sample 15 were separateduntil p=13.
The peak areas of each oligomer were calculated. The fractions of the oligomers {AD)p·A of
sample 15 (based on the peak areas: excluding the cyclic oligomers) from p=3 to p=13 are
shown in Table 4-8 (the fraction {AD)p-A eligomers (area (AD)p·A divided by the total area
(AD)p +(AD)P·A) for different p). In neither ofthe samples D·{AD)p eligomers were found, which
implies, as mentioned before, that the acid end groups are preferential.
Since the response ofthe UV signalis basedon the amount of acid monomers {NPG cannot
be detected by UV) the areas of the eligomers (AD)P and {AD)P·A cannot be compared one to
one. The (AD)p-A eligomers have an additional A in comparison with the {AD)P eligomers in
the same cluster, which will give an additional response, therefore the integrated areas were
corrected. The correction factor decreases with increasing degree ofpolymerization (see Table
4-8).

54 Chapter4
Table 4-8, The fractlon oligomer AD,·A basedon the corrected integmted areas ofthe peaks ofthe oligomers with
equal degree ofpolymerization p (from 2 to 13) of sample 15 (TA). The areas ofthe cyclic allgomers AD,"""' are
excludedfram the total area. The correctton factor for the UV signa! is used to correct the areas for the additional add
monomerpresent in the AD, ·A ol!gomers.
p Mol fraction Correction Factor p Mol fraction Correction Factor AD,·A UV signa! AD,-A UV signa!
2 0.57 0.67 8 0.70 0.89 3 0.63 0.75 9 0.67 0.90 4 0.63 0.80 10 0.75 0.91 5 0.67 0.83 11 0.74 0.92 6 0.69 0.86 12 0.76 0.92 7 0.70 0.88 13 0.79 0.93
The relation of the mol fraction ADP-A (q>AD_,) versus the degree of polymerization (p) is
shown in Figure 4-15.
0.80
0 .75
0 .70
q>AD·A
0 .65
0.60 .·· •
0.55
• --·
.. • •
p
• ... .... .. ·
•
10 12 14
Figure 4-15, The dependency ofthefractlon ollgomer (q~AJ>") on the degree ofpolymerization (p).
Figure 4-15 clearly shows that <i> AD-A is dependent on the degree of polymerization of the
oligomers. The fact that the end group can differ with increasing degree of polymerization
was recently established with NP-GPEC by Philipsen [11). However, the dependency has never
been shown with RP-GPEC so far. The dependency of the CJlAO-A on p appears to be
approximately linear. However, only a small range of p is plotted, therefore the dependency
might also be curved. Nevertheless, the dependency of p on CJlAD-A shows unmistakable that
the reactivities of the end groups/monomers are not equal. This dissimilarity in reactivities
was also noticed when the ADP-A fractions obtained with GPEC were compared with the
statistically calculated fractions. For the samples 14 (IA) and 15 (TA) the statistically expected
(AD)P-A fraction is 0.50 (see Table 4-6). The fractions CJlAD-A obtained by RP-GPEC are all higher

The Microstructural Analysis of Homopolyesters 55
than the fraction based on statistica! considerations. The allgomers (AD)p were not found in
sample 14 (IA), except for some low p eligomers (p==3.4). consequently the fraction q>Al).A for
sample 14 is approximately equal to 1. As mentioned before, the statistica! data arebasedon
the assumption that the reactivities of the end groups for the esterfication are equal. The
lower fraction obtained by GPEC compared to the statistically expected fractions can be
explained by the differences in the reactivities of the end groups. The reactivities of the
hydroxy end groups of the oligomers can be much higher than the reactivities of the acid end
groups. However, a more likely explanation is that the reactivities of the acid monoroers (IA
and TA) are much higher than the reactivity of the glycol monoroer (NPG). Also, the
reactivities of the two acid monoroers are thought to be different. IA is more reactive than
TA. since the mol fraction of (AD)p-A of sample 14 (IA) is higher than the mole fraction of
(AD)P-A of sample 15 (TA).
4.3.3 GRADIENT ELUTION MECHA NISM OF RP-GPEC
The empirica! relation for the cloud point (volume fraction of solvent. <i>sl introduced by
Glöclmer [27) will be used to discuss the RP-GPEC separation mechanism. This equation (see
also Equation 2-8 described in Chapter 2) is originally used for binary solvent systems.
However, the empirica! re lation can also be used for temary solvent systems.
liquatlon 4-1, The empirica! relatlon of the cloud point (in volume fractlon solvent) versus the molar mass (M),
where, C, and C1 are constants, and MIs the molar mass.
This equation can also be used to describe the elution composition of RP-GPEC versus M"
[28). Since the binary gradient shows discontinuities in the distribution, only the experiments
obtained with temary gradient will be discussed with respect to Equation 4-1. Philipsen [11)
studied the re lation of Equation 4-1 for different types of oligomers. For the different types of
polymers (polystyrene, polyesters, and polydimethyl siloxane) curves with different shapes
and slopes were obtained. The slope and intercept depended on the experimental conditions
(temperature, solvent/non-solvent).
The elution compositions (q>TIIF) of the eligomers ADP-A of the samples 14 (IA) and 15 (TA)
are plotted versus M"· (see Figure 4-16). The plots show linear curves (with some deviation at
higher molar mass) described by Equation 4-1.

56
0.7
0.6
0.5
(j)THI' 0.4
0.3
0.2
0.1
0.0
--<>-14 (AD)P·A
-•- 15 (AD)P·A
0.005 0.010 0.015 0.020 0.025 0.030 0.035 0.040 0.045 0.050
M·'f2
Chapter4
Flgure 4-16, Plot ofelution composition (q>y",J versus M" ofthe allgomers AD,-A ofthe samples 14 (-0-) and 15
(---).
It is remarkable that the slopes of the curves for (AD)P·A oligomers of the different
homopolymers are similar. The only difference is found in the intercept of the curves. Since
the only difference is the (geometrie) structure of the acid monomer, IA is 1,3-benzene
dicarboxylic acid and TA is 1,4-benzene dicarboxylic add, the difference in configuration is
thought to be the cause of the difference between the intercepts. This implies that Equation
4·1 is applicable to describe the separation of the polyesters and that the parameters C1 and
~ described in Equation 4-1 could be related to a physical effect.
0.7
0.6
0 .5
(j)THI' 0.4
0.3
0.2
0.1
0.0
'··r;
0.005 0.010 0 .015 0.020 0.025 0.030 0.035 0.040 0.045 0.050 M·l/2
Figure 4-17, Plot of rpy", versus M ·» for the di-add altgomers {AD),-A of sample 15 (-•-). dl-methyl ester oligomers
{AD)1·A of sample 15m {alkylated) (-'V-), and mono-add allgomers (AD), of sample 15 (- .6.-).
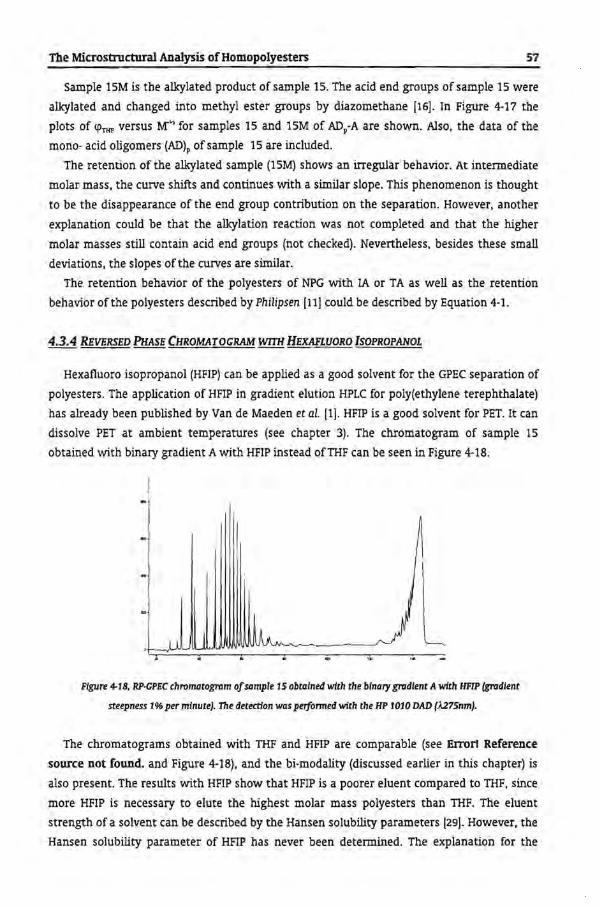
The Microstructural Analysis of Homopolyesters 57
Sample 15M is the alkylated product of sample 15. The acid end groups of sample 15 were
alkylated and changed into methyl ester groups by diazomethane [16]. In Figure 4-17 the
plots of cpTHP versus M"' for samples 15 and 15M of ADP-A are shown. Also, the data of the
mono- acid allgomers (AD)P of sample 15 are included.
The retention of the alkylated sample (15M) shows an irregular behavior. At intermediate
rnalar mass, the curve shifts and continues with a similar slope. This phenomenon is thought
to be the disappearance of the end group contribution on the separation. However, another
explanation could be that the alkylation reaction was not completed and that the higher
rnalar masses still contain acid end groups (nat checked). Nevertheless, besides these small
deviations, the slopes ofthe curves are similar.
The retention behavior of the polyesters of NPG with IA ar TA as well as the retention
behavior ofthe polyesters described by Philipsen [11] could bedescribed by Equation 4-1.
4.3.4 REVERSED PHASE CHROMATOGRAM WITH HEXAFLUORO lSOPROPANOL
Hexafluoro isopropanol (HFIP) can be applied as a good solvent for the GPEC separation of
polyesters. The application of HFIP in gradient elution HPLC for poly(ethylene terephthalate)
has already been publisbed by Van de Maeden et al. [1]. HFIP is a good solvent for PET. It can
dissolve PET at ambient temperatures (see chapter 3). The chromatagram of sample 15
obtained with binary gradient A with HFIP instead ofTHF can beseen in Figure 4-18.
Figure 4-18, RP·GPEC chromatagram of sample 15 obtained with the btnary gradient A with HFIP (gradient
steepness 1% per minute). The detection was per:(ormed with the HP 1010 DAD (À275nm).
The chromatograms obtained with THF and HFIP are camparabie (see Error! Reference
souree not found. and Figure 4-18), and the bi-modality (discussed earlier in this chapter) is
also present. The results with HFlP show that HFIP is a poorer eluent compared to THF, since
more HFIP is necessary to elute the highest rnalar mass polyesters than THF. The eluent
strength of a solvent can be described by the Hansen solubility parameters [29). However, the
Hansen solubility parameter of HFIP has never been determined. The explanation for the
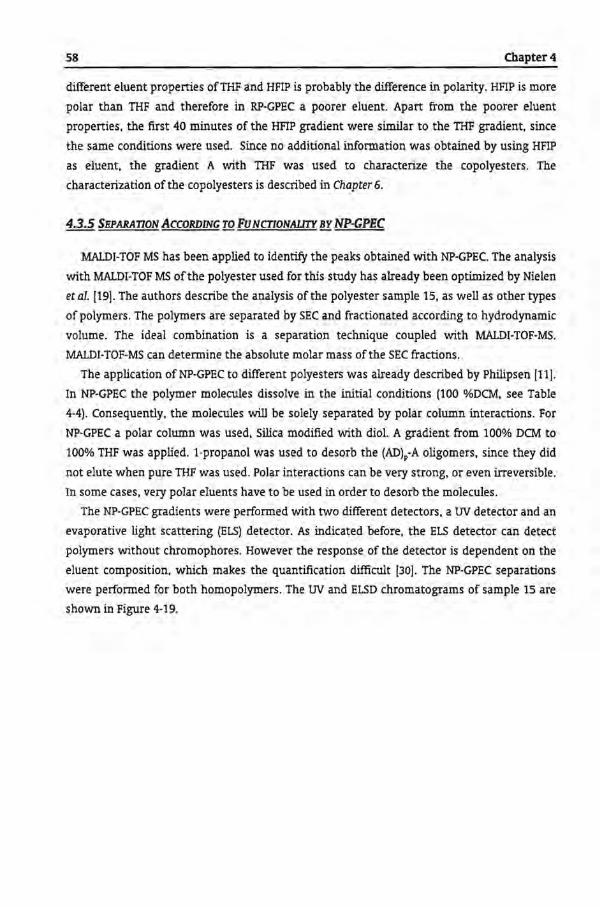
58 Chapter4
different eluent properties ofTHF and HFIP is probably the difference in polarity. HFIP is more
polar than THF and therefore in RP-GPEC a poorer eluent. Apart from the poorer eluent
properties. the first 40 minutes of the HFIP gradient were similar to the THF gradient, since
the same conditions were used. Since no additional information was obtained by using HFIP
as eluent, the gradient A with THF was used to characterize the copolyesters. The
characterization of the copolyesters is described in Chapter 6.
4.3.5 SEPARATION ACCORDING TOFu NCTIONAIJTY BY NP-GPEC
MALDI-TOF MS has been applied to identify the peaks obtained with NP-GPEC. The analysis
with MALDI-TOF MS ofthe polyester used for this study has already been opti.mized by Nielen
et al. [19]. The authors describe the analysis ofthe polyester sample 15, as wellas other types
of polymers. The polymers are separated by SEC and fractionated according to hydrodynamic
volume. The ideal combination is a separation technique coupled with MALDI-TOF-MS.
MALDI-TOF-MS can determine the absolute molar mass ofthe SEC fractions.
The application of NP-GPEC to different polyesters was already described by Philipsen [11] .
In NP-GPEC the polymer molecules dissolve in the initia! conditions (100 %DCM, see Table
4-4). Consequently, the molecules will be solely separated by polar column interactions. For
NP-GPEC a polar column was used, Silica modified with diol. A gradient from 100% DCM to
100% THF was applied. I-propanol was used to desorb the (AD)p-A oligomers, since they did
not elute when pure THF was used. Polar interactions can be very strong, or even irreversible.
In some cases, very polar eluents have to be used in order to desorb the molecules.
The NP-GPEC gradients were performed with two different detectors, a UV detector and an
evaporative light scattering (ELS) detector. As indicated before, the ELS detector can detect
polymers without chromophores. However the response of the detector is dependent on the
eluent composition, which makes the quantification difficult [30]. The NP-GPEC separations
were performed for both homopolymers. The UV and ELSD chromatograms of sample 15 are
shown in Figure 4-19.
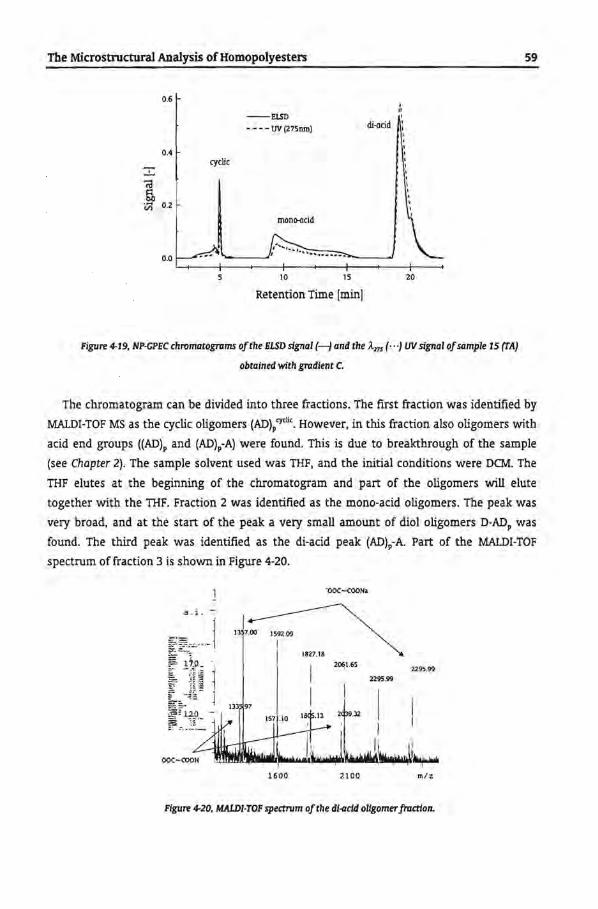
The Microstructural Analysis of Homopolyesters
0.6
--!!LSD
- - - - UV (275nm) di-add
0.4 cyclic
ra ~ v; 0.2
mono-acid
0.0
10 15 20
Retention Time [min]
Figure 4-19, NP-GPEC chromatograms ofthe ELSD signa! (---J and the Àm (···}UV signa! of sample 15 (rA}
obtalned with gradlent C.
59
The chromatagram can be divided into three fractions . The first fraction was identified by
MALDI-TOF MS as the cyclic oligomers (AD)p'ydic. However, in this fraction also oligomers with
acid end groups ((AD)P and (AD)p-A) were found. This is due to breakthrough of the sample
(see Chapter 2). The sample solvent used was THF, and the initia! conditions were DCM. The
THF elutes at the beginning of the chromatagram and part of the oligomers will elute
tagether with the THF. Fraction 2 was identified as the mono-acid oligomers. The peak was
very broad, and at the start of the peak a very small amount of diol oligomers D-ADP was
found. The third peak was identified as the di-acid peak (AD)P-A. Part of the MALDI-TOF
spectrum of fraction 3 is shown in Figure 4-20.
·ooc-cooNa
13 7.00 1592.09
I
I 11127.18
2~1.65 2295.99 2295.99
1600 2100 m/z
Figure 4-20, MALDI-TOF spectrum ofthe dl-{lctd ollgomer fraction.
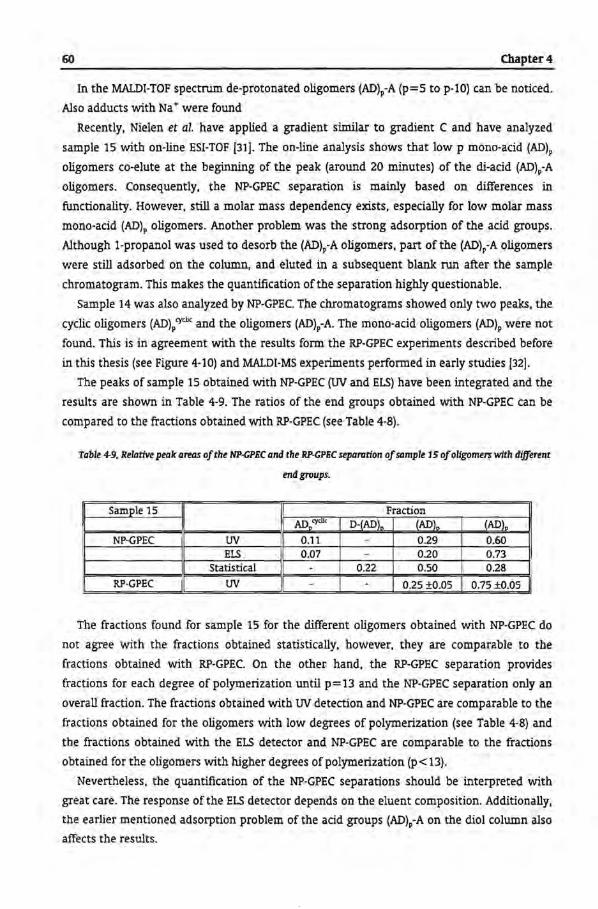
60 Chapter4
In the MALDI-TOF spectrum de-protonated eligomers (AD)p-A (p=5 to p-10) can be noticed.
Also adducts with Na+ were found
Recently, Nielen et al. have applied a gradient similar to gradient C and have analyzed
sample 15 with on-line ESI-TOF (31]. The on-line analysis shows that low p mono-acid (AD)p
oligomers co-elute at the beginning of the peak (around 20 minutes) of the di-acid (AD)P-A
oligomers. Consequently, the NP-GPEC separation is mainly based on differences in
functionality. However, still a molar mass dependency exists, especially for low molar mass
mono-acid (AD}P oligomers. Another problem was the strong adsorption of the acid groups.
Although 1-propanol was used to desorb the (AD)p-A oligomers, part ofthe (AD)p-A oligomers
were still adsorbed on the column, and eluted in a subsequent blank run after the sample
chromatogram. This makes the quantification ofthe separation highly questionable.
Sample 14 was also analyzed by NP-GPEC. The chromatograms showed only two peaks, the
cyclic eligomers (AD)/ydic and the oligomers (AD)P·A. The mono-acid oligomers (AD)P were not
found. This is in agreement with the results form the RP-GPEC experiments described before
in this thesis (see Figure 4-10) and MALDI-MS experiments performed in early studies (32].
The peaks of sample 15 obtained with NP-GPEC (Wand ELS) have been integrated and the
results are shown in Table 4-9. The ratios of the end groups obtained with NP-GPEC can he
compared to the fractions obtained with RP-GPEC (see Table 4-8).
Table 4-9, Relative peak areas ofthe NP.CPEC and the RP-GPEC separation of sample 15 of oligomers with different
endgroups.
Sam_ple 15 Fraction AD"cycJic D-(AD)" (AD)" (AD)"
NP-GPEC uv 0.11 - 0.29 0.60 ELS 0.07 . 0.20 0.73
Statistica! - 0.22 0.50 0.28 RP-GPEC uv - - 0.25 ±0.05 0.75 ±0.05
The fractions found for sample 15 for the different oligomers obtained with NP-GPEC do
not agree with the fractions obtained statistically, however, they are comparable to the
fractions obtained with RP-GPEC. On the other hand, the RP-GPEC separation provides
fractions for each degree of polymerization until p = 13 and the NP-GPEC separation only an
overall fraction. The fractions obtained with UV detection and NP-GPEC are comparable to the
fractions obtained for the oligomers with low degrees of polymerization (see Table 4-8) and
the fractions obtained with the ELS detector and NP-GPEC are camparabie to the fractions
obtained for the oligomers with higher degrees ofpolymerization (p<13).
Nevertheless, the quantification of the NP-GPEC separations should be interpreted with
great care. The response ofthe ELS detector depends on the eluent composition. Additionally,
the earlier mentioned adsorption problem of the acid groups (AD )p-A on the diol column also
affects the results.
The Microstructural Analysis of Homopolyesters 61
The NP-GPEC separations were promising. However, the sorption of the di-acid oligomers
and the overlap of the oligomers with different end groups makes the application of NP-GPEC
still questionable. In addition, NP-GPEC is more sensitive to the purity of the solvent [28),
which makes it less robust than RP-GPEC. Probably with a good optimization of the
conditions, NP-GPEC can be a very useful technique to separate polymers according to end
groups and chemica! composition [11).
4.4 CONCWSIONS
With SECfviscosity the homopolyesters of NPG/IA and NPG/TA showed similar MMDs and
no significant ditTerences were found in the Mark-Houwink parameters of the different
polyesters.
Reversed phase GPEC and normal phase GPEC were successfully applied to separate the
homopolymers. DitTerences in retention behavior between the homopolymers were found,
which offers the possibility to separate according to chemica! composition. This will be used
for the characterization of copolyesters of NPG, IA and TA that will be discussed in Chapter 6.
Different types of gradients were applied to separate the polyesters: gradient A
(waterfACN~ACN~THF) and gradient B (water/ACN~THF). Also HFIP was used as good
solvent for the homopolyesters. Due to the lower eluent strength of HFIP, and similarity of
the applied gradient, the chromatograms did not contain additional information compared to
the two THF gradients. With the THF gradients, se pa ration of the homopolyesters according
to chemica! composition (IA or TA), rnalar mass (repeating unit) and end groups (acid end
group or hydroxy end group) was achieved. The results showed that the end group
distribution varles with the degree of polymerization, and the obtained dis tribution deviates
from the statistically calculated end group distribution. This deviation is thought to arise
from a ditTerenee in reactivity of the morromers and the hydroxy end groups.
The mechanism of RP-GPEC of polyesters was studied. For this study well-defmed
polyesters were synthesized and MS was applied to identify the separated oligomers. The
separation of the homopolyesters of NPG/IA and NPG/TA was dominated by the molar mass
(repeating unit) of the oligomers. Within the peak clusters with a given degree of
polymerization the allgomers were separated according to end groups. The eligomers with
different end groups were separated according to ditTerences in chemica! composition (IA/TA).
However, the resolution between the eligomers with different chemica! composition was lost
after polymerization degrees (p) exceeding 6. The resolution between the allgomers with
different end groups was lost above p=13, and finally the resolution between allgomers with
different p vanished above p=35. It was found that the molar mass dependenee of the RP
GPEC separation could well be described by an empirica! equation introduced by Glöckner
[33).
Besides RP-GPEC, also NP-GPEC was applied to separate the homopolyesters according to
end groups. Three peaks were found with NP-GPEC. The three fractions are oligomers with

62 Chapter4
different end groups: cyclic oligomers, acidjhydroxy eligomers and di-acid oligomers. The
three different fractions were identified with MALDI-TOF MS. The sorption of the di-acid
eligomers was difficult to control. Consequently, additional research has to be done to
optimize the NP-GPEC separation.
The combination of mass speetrometry with GPEC proved to be highly effective for the
characterization of the polyesters. MALDI-TOF MS and ESI-MS were successfully applied for
the identification of the GPEC fractions. On the other hand, GPEC was successfully applied to
pre-separate polymer samples for the analysis by MALDI-TOF MS or ESI-MS.
4.5 REPERENCES
1. F.P.B. van der Maeden, M.E.F. Biemond and P.C.G.M. janssen,j. Chromatogr., 149, 539-552 {1978). 2. G. Wiek and H. Zeitler, Angew. Makromol. Chem., 112, 59-94 {1983}. 3. M. Szesztay, ZS. László-Hedvig and F. Tüdös, ]. Appl. Polym. Sci.: Appl. Polym. Symp., 48, 227-232
{1991}. 4. A.M. Robertson, D. Farnan, D. Iittlejohn, M. Brown, q . Dowle and E. Goodwin, Anal. Proc., JO,
268·271 {1993). 5. $. Podzimek andJ. Hers!, J. Appl. Polym. Sci., 53, 1351-1356 (1994). 6. R.P. Kriiger, H. Much and G. Schultz,J. Liq. Chromatogr., 17 (148r15), 3069-3090 {1994). 7. H.J.A. Philipsen, B. Klumperman and A.L German,j. Chromatogr. A, 746,211-224 {1997}. 8. H.J.A. Philipsen, M. Oestreich, B. Klumperman and A.L. German,]. Chromatogr. A, 775, 157-177
{1997}. 9. H.J.A. Philipsen, M.R. de Cooker, H.A. daessens, B. Klumperman and A.L. German,j. Chromatogr.
A, 761, 147-162 {1997}. 10. K. Rissler,j. Chromatogr. A, 786, 85-98 {1997}. 11. Philipsen H.J.A., "Mechanisms of Gradient Polymer Elution Chromatography and its Application
to (Co)Polyesters", Ph.D. thesis, Eindhoven University ofTechnology, Eindhoven, 1998. 12. S. Teramachi. A. Hasegawa, Y. Shima, M. Akatsuka and M. Nakajima, Macromolecules, 12 (5), 992·
996 {1979}. 13. S. Teramachi, A. Hasegawa, Y. Shigekuni and S. Natunaga, Polymer ]. , 21 (10), 803-808 {1989}. 14. S. Teramachi, A. Hasegawa and K. Motoyama, Polymer ]., 22 (6), 489-496 {1990}. 15. P.J.C.H. Cools, F. Maesen, B. Klumperman, A.M. van Herk and A.L. German, j. Chromatogr. A, 736,
1.25-130 (1996). 16. Akzo Nobel internal sample. 17. T. Willems, "Evaporative Light Scattering Detectors". Internal report, Eindhoven University of
Technology, 1997. 18. M.W.F. Nielen, Rapid Commun. Mass Spectron., 10, 1652·1660 {1996}. 19. M.W.F. Nielen and S. Malucha, Rapid Commun. Mass Spectrom., 11, 1194-1204 {1997) . 20. F.A. Buijtenhuijs and A.M.C. van de Riet, to be published. 21. L.H. Pee bles, JR., M. W. HulTman and C.T. Ablett,j. Polym. Sd.: part A-1, 7, 479-496 {1969). 22. G. Wiek and H. Zeitler, Angew. Makromol. Chem., 112,59-94 {1983). 23. I. Goodman and B.F. Nesbitt,j. Polym. Sd., 48, 423-433 {1960). 24. F.A. Buijtenhuijs, AKZO NOBEL Intemal report. 25. J.J. Lewis, L.B. Rogers and R.E. Pauls,j. Chromatogr., 264,339-356 {1983). 26. H.J.M van de Ven,AKZO NOBEL intern al report (1996). 27. G. Glöckner, Z. Phys. Chem., 229,98 {1965}. 28. G. Glöckner, "Gradient HPLC of Copolymers and Chromatographic Cross Fractionation", Springer
Verlag Berlin Heidelberg, 1991. 29. P.J. Schoenmakers, H.A.H. Billiet, R. Tijssen and L. De Galan.j. Chromatogr., 149, 519-537 {1978}.
The Microstructural Analysis of Homopolyesters 63
30. T. Willems, "Evaporative Light Scattering Detectors". Intemal report, Eindhoven University of Technotogy, 1997.
31. M.W.F. Nieten and F.A. Buijtenhuijs, Ana/. Chem., in press. 32. M.W.F. Nieten, Akzo Nobel in tema/ report (1996). 33. G. Glöckner, z. Phys. Chem., 229,98 (1965).
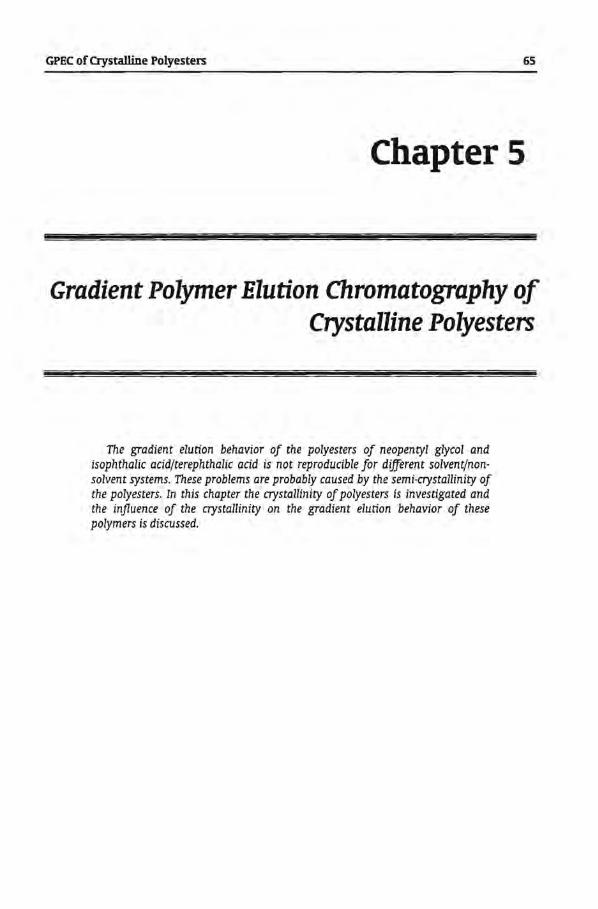
GPEC of Crystalline Polyesters 65
Chapter 5
Gradient Polymer Elution Chromatography of Crystalline Polyesters
The gradient elution behavior of the polyesters of neopentyl glycol and isophthalic acidfterephthalic acid is not reproducible for different solvent/nonsolvent systems. These problems are probably caused by the semi-crystallinity of the polyesters. In this chapter the crystallinity of polyesters is investigated and the injiuence of the crystallinity on the gradient elution behavior of these polymers is discussed.

66 Chapters
5.1 lNTRODUCTION
The application of HPLC in the field of crystalline (or semi-crystalline) polymers is very
restricted. The problem of crystalline polymers is their low solubility into the frequently used
eluents, such as water, methanol, acetonitrile, tetrahydrofuran, and chloroform. Therefore,
the determination of the molar mass distribution (MMD) of these polymers with size
exclusion chromatography (SEQ usually requires 'exotic' conditions. The best know example
is the MMD determination of polyolefins, e.g. the MMD of polyethene is determined by SEC in
trichloro benzene at high temperatures (T>100°Q [1]. However, not always exotic conditions
have to be used. In some cases the crystalline polymer can be dissolved in the exotic solvent
and can be diluted with eluent of choice without the precipitation of a crystalline phase [2].
The crystallinity of polymers can also be used for separation according to chemica!
composition. For instance, temperature rising elution fractionation (TREF) can be applied to
separate polyolefins according to rnalar mass and chain conformation based on differences in
melting point (TJ [3].
Philipsen [4] studied the GPEC retention behavior of crystalline polyesters. The polyesters
described by this author showed irregular retention behavior at a column temperature of
25°C. The elution behavior changes gradually with increasing column temperature, and at
35°C, which is above the Tm (melting trajectory) of the polyester, the elution behavior
becomes normaL During the experiments described in Chapter 4, similar problems
conceming the reproducibility were observed, which will be described in this Chapter.
5.2 CRYSTAUJNITY
The Gibbs free energy of a binary polymer{solvent system is described by the Flory
Huggins relation [5].
liquation 5·1, Flory·Huggins relation, where L1Cmlx mis the Cfbbsfree enf1XY of mixing, R Ufmoi·K} is the gas
constant, n., is the total number oflattice ploces to bejiUed [mol}, rp, is the volumeftuction afsolvent [-}. rp, [-J is the
volume ftuction of polymer, m, [-J is the relative chain length, and 'XPfS [-J is the Flory·Huggins interaction parameter
(see Equation 2·6} {5}.
When the polymer can crystallize, the Gibbs free energy for the crystalline{amorphous
phase transition can be defmed as follows.
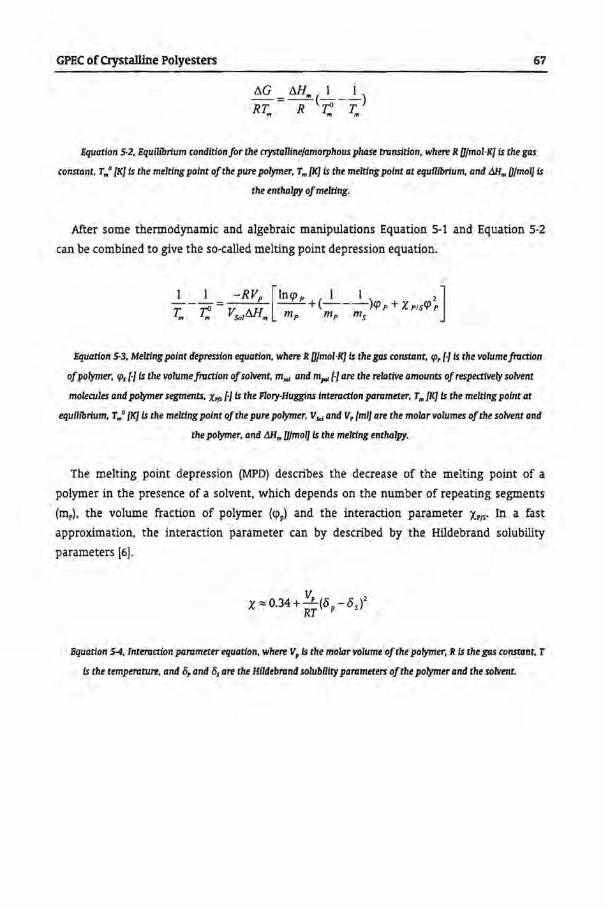
GPEC of Crystalline Polyesters 67
!!.G =MI .. (__!.__ _ _}__) RT", R ~ T",
Equation 5-2, Equ11ibrlum condltionfor the crystaUinejamorphous philse transition, where R Ofmol·K} Is the gcis
constant, r .. • (KJ Is the melting point ofthe pure polymer, r .. (KJ Is the melting point at equillörtum, and Llll .. Ofmol) Is
the enthalpy ofmelting.
After some thermadynamie and algebrak manipulations Equation 5-1 and Equation 5-2
can be combined to give the so-called melting point depression equation.
1 1 -RVP [!nep p ( 1 I ) 2 ] ---- --+ --- cp +x cp T", ~ - VSoltilim mP mp ms P Pts P
Equatlon 5-3, Melting point depression equation, where R Ofmol·K} Is the gas constant, tp, H Is the volume ftuction
of polymer, IPs H Is the volume fraction of solvent, m.., and m,., Hare the relative amounts of respectlvely solvent
molecules and polymer segments, XPfS H Is the Flory·Hugglns interaction parameter, T .. (KJ Is the melting point at
equillörlum, r .. • (KJ Is the melting point ofthe pure polymer, V .. , and v. [miJ are the rnalar volumes ofthe solventand
the polymer, and MI .. Ofmol) Is the melting enthalpy.
The melting point depression (MPD) describes the decrease of the melting point of a
polymer in the presence of a solvent, which depends on the number of repeating segments
(mp). the volume fraction of polymer (cpp) and the interaction parameter XPJS· In a fast
approximation, the interaction parameter can by described by the Hildebrand solubility
parameters [6].
Equation 5-4, Interaction parameter equation, where v, Is the rnalar volume ofthe polymer, R Is the gas constant. r
is the temperature, and ö, and Ös are the Hl1debrand solubUity parameters ofthe polymer and the solvent.

68 Chapters
c
L L
T
L+S, A
.l~-'-·~-E-"'-----s~~~s_, ___ J. S,+S,
0.0 -"'- 1.0
Figure 5·1, Phase diagrams of a binary polymerfsolvent system wlth crystaUinity. Left: no de-mixing occurs. Right:
de-mixing of polymer and solvent tn liquid phase occurs. Where L, L, and L2 are llqutd phases, Ss (solvent) and s, (polymer) are the solid states, and T,.' and r.: are the melting points ofthe solventand polymer.
The T versus <ppo1 phase diagrams oftwo binary systems are shown schematically in Figure
5-1. On the left side ofFigure 5-1 is the T vs. <ppo1 phase diagram of a binary system that shows
no de-mixing behavior in the liquid phase. The T vs. <ppo1 phase diagram of a system where de
mixing occurs in the liquid phase is depicted on the right. In the left T vs. <ppo1 phase diagram
four regions can be distinguished: one 'one phase' systems (L). two 'three phase' systems
(S5 +L and Sp+L) and one 'three phase' (S5+Sp). A eutectic point (E) can beseen where all three
phases L, Ss and Sp co-exist. The melting points of the polymer and the solvent, TmP and Tms•
nonnally differ to a large extend (and, to be correct, a gas phase of the solvent should be
added to the phase diagram). The line from Tmp toE, the eutectic point, describes the melting
point depression (see Equation 5-3).
In the T vs. <ppo1 phase diagram of a L-L de-mixing solventfpolymer system an additional
area exists where two liquid phases are present one solvent rich phase L, and a polymer rich
phase LJ Three ' three phase' lines can be seen where three phases exist simultaneously (A, B
and q. Also a L-L critica! point (q is found, with a critica! temperature (Tel and volume
fraction (<p,_poJ-
The phase diagrams shown in Figure 5-1 are for binary systems. In GPEC ternary systems
and even quaternary systems are applied. The theoretica! approach of ternary systems is
possible, but difficult [7].
5.3 EXPERJMENTAL
5.3.1 POLYESTER SAMPLES
The homopolyesters ofNPG with IA (sample 14) and NGP with TA (sample 15) were used to
investigate the crystallization behavior. The synthesis of the samples is described in Chapter
4. The samples 14 and 15 were the reaction products of bulk polymerizations in the molten

GPEC of Crystalline Polyesters 69
state. In order to investigate the precipitates of the polyesters in waterfTHF, the samples
were precipitated as follows. The samples 14 and 15 were dissolved in tetrahydrofuran (THF,
Fluka, HPLC-grade, Germany) with a concentratien of 30 mgfml at ambient temperature.
Sample 14 precipitated after a certain amount of time, although initially the sample was
dissolved in 100% THF. Aft er sedimentation the precipitate of sample 14 was partly separated
(sample 14A). To the remaining solution, water was added (ratio THFfwater 1:1) which
resulted in a further precipitation. This secend precipitate was named 14B. Sample 15B was
obtained by adding water to the initia! polymer solution in THF (ratio THFfwater 1:1).
Table 5-1, Samples usedfor the crystantnity study.
Sample Ratio IA:TA Remarks
14 1.0 Direct reaction productfrommelt 14A 1:0 Sample 14 precipitated in THF 14B 1:0 Sample 14A precipitated in water/THF (1:1) 15 0:1 Direct reaction productfrom melt
15B 0:1 Sample 15 Jil"eci_Qitated in water(THF (1:1)
5.3.2 DETERMINATION OF CRYSTALUNE PHASE
In order to prove the formation of a crystalline phase during precipitation differential
scanning calcrimetry (DSC, Perkin-Elmer TEA systems, sample weight 4 mg, scanning rate
20°Cfmin. Light microscopy with crossed polarizers (Universal, Zeiss) with a 'hot stage'
heating capability was also used. In addition, X-ray-measurements (A Philips X'Pert SR 5068
instrument operating with CuKa radiation and a 5°/min scan rate were used for X-ray
reflection (XRD) analyses (2q =0.5- 30 °)) were carried out.
5.3.3 GRADIENT POLYMER BLUTION CHROMATOGRAPHY
The following equipment is used: a Waters 616 Gradient Pump, a Waters 490 multiple
wavelength UV detector (À.=275nm), a Hewlett Packard 1010 photodiode array detector
(DAD, À.==275nm), a Gaston GT-103 on-line degassing device, a Separations Mistral column
oven and a Waters 717 WISP Autosampler with variabie injection volume. Different
solvent/non-solvent (S/NS) systems were studied. The solvents were THF (HPLC-grade Fluka,
Germany) and hexafluoro isopropanol HIFP (UV quality, Matco). When THF gradients were
used acetic acid (1 vol%) was added. Trifluoro acetate (0.002 M) was used in the case of the
HFIP gradients. Acetic acid and trifluoro acetate were added to avoid strong polar
interactions. The non-solvents were water (MilliQ, Millipore), acetonitrile (ACN), methanol
and isopropanol (UV quality, Merck). The column, applied for the RP-GPEC experiments, was a
Symmetry Si-C18. The flow rate was 0.5 mlfmin. The column temperature was established at
55 °C. The injection volume was varied between 10 and 100p.l. The samples were all dissolved
in HFIP (concentration 10 mgfml) in order to prevent crystallization in the sample salution

70 Chapters
(see next paragraph). The applied gradients were all from 100% non-solvent to 100% solvent
with a gradient steepness of 2%/min. Most of the experi.ments were performed using the
Waters 490 multiple uv detector. When the experi.ments were performed with the HP 1010
DAD, this is explicitly mentioned.
5.4 RESULTS AND DISCUSSION
Crystallization ofpolymers can occur from the melt or from salution (8). Cystallalization is
dependent on the mobility and the concentratien of the polymer molecules, low
concentrations and high mobilites advances cystallization. In the melt, the mobility of the
molecules is lower than in solution. Additonationally, the concentratien in the melt is higher
than in solution. Due to the higher mobility and the lowere concentration, crystallization of
the polymer molecules is easier from salution than from the melt [8). Samples 14 (IA) and 15
(TA) were obtained from the melt, whereas the samples 14A, 14B, and 15B are obtained from
solution.
In order to study the crystallinity, the frrst heating run DSC·results were used. The DSC·
plots of the precipitated samples (14A, 14B and 15 B) were difficult to interpret due to a
decrease in weight of the sample as determined by thermogravimetrie analysis (TGA).
Although the samples 14A, 14B and 15B were dried, they still contained a significant amount
of solvent (water andfor THF), especially the samples precipitated in water. The evaporation
of the solvents caused a decrease in weight and a disturbance in the DSC signa!, which was
more pronounced for sample 15B. Normally, the solvents evaparate during the fust DSC run
(open pan), and the thermal properties of the polymer can be measured in a second run
without disturbance ofthe evaparatien ofthe solvent.
The first run DSC-plots ofthe samples 14, 14A and 14B are shown in Figure 5-2. Sample 14
showed a glass transition, which also showed the relaxation peak [9], no melt transition was
observed for this sample. Sample 14A showed a clear melt transition at Tm=150°C. In the case
of sample 14B two melt transitions were observed, a melt transition corresponding to that of
sample 14A at Tm=150°C and a secend melt peak at a lower Tm of 130°C. The difference
between the two melt transitions of the precipitate in THF and in waterfTHF could be the
molar mass dependency, a different crystal structure or a difference in perfection of the
crystalls.
Sample 15 (not shown) showed similar behavier as sample 14, only a glass transition and a
relaxation peak could be observed. Additionally, sample 15A showed a melt transition.
However the DSC plots were difficult to interpret due to the decrease in weight of the sample
already discussed before.
When second DSC runs were performed, the melt transitions were not noticed for all
samples, only a glass transition at 75°C was observed. Apparently, the polyester did not fonn
a crystalline phase from the melt.
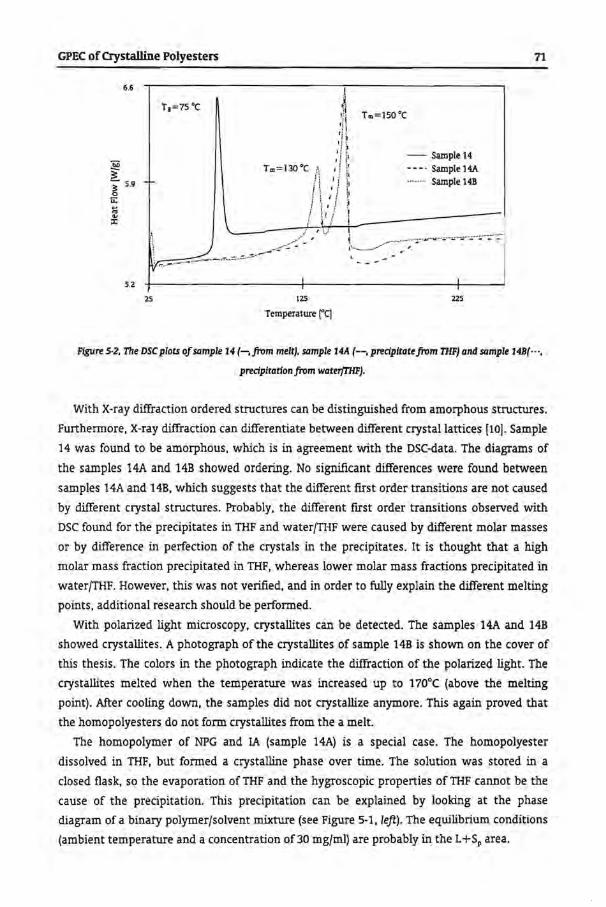
GPEC of Crystalline Polyesters
6.6
Ta=75 •c
5.2
25
Tm=no•c ,,
I I .'f I \:)
125
Temperature ["C]
71
Tm=tso•c
- Sample14 --- · Sample 14A -·········· Sample 148
-.. ..., .......... :.:.····~··· ::.: ·· · ::.··- - -
.~ .. .. :.. ..........
I
225
Ftgure 5·2, The DSCplots of sample 14 (-,frommelt}, sample 14A (--,predpttatefrom THF} and sample 14B(· ··,
predpitatlonfrom waterfiHF}.
With X-ray diffraction ordered structures can be distinguished from amorphous structures.
Furthermore, X-ray diffraction can differentiate between different crystallattices [10]. Sample
14 was found to be amorphous, which is in agreement with the DSC-data. The diagrams of
the samples 14A and 14B showed ordering. No significant differences were found between
samples 14A and 14B, which suggests that the different fust order transitions are not caused
by different crystal structures. Probably, the different frrst order transitions observed with
DSC found for the precipitates in THF and water/THF were caused by different molar masses
or by difference in perfection of the crystals in the precipitates. It is thought that a high
molar mass fraction precipitated in THF, whereas lower molar mass fractions precipitated in
waterfTHF. However, this was not verified, and in order to fully explain the different melting
points, additional research should be performed.
With polarized light microscopy, crystallites can be detected. The samples 14A and 14B
showed crystallites. A photograph of the crystallites of sample 14B is shown on the cover of
this thesis. The colors in the photograph indicate the diffraction of the polarized light. The
crystallites melted when the temperature was increased up to 170°C (above the melting
point). After cooling down, the samples did not crystallize anymore. This again proved that
the homopolyesters do not form crystallites from the a melt.
The homopolymer of NPG and IA (sample 14A) is a special case. The homopolyester
dissolved in THF, but formed a crystalline phase over time. The solution was stored in a
closed flask, so the eva po ration of THF and the hygroscopic properties of THF cannot be the
cause of the precipitation. This precipitation can be explained by looking at the phase
diagram of a binary polymerfsolvent mixture (see Figure 5-l,le.ft). The equilibrium conditions
(ambient temperature and a concentration of30 mgfml) are probably in the L+SP area.

72 Chapter 5
Since the precipitate was proven to be crystalline, the reproducibility problems
encountered in GPEC are likely due to the kinetics of the redissolution of a crystalline phase
(4]. In GPEC separations, the precipitation step and the redissolution step are crucial. Thus,
the redissolution must be reproducible. At the precipitation stage, an equilibrium according
to the phase diagram will be established. When the solvent and non-solvent are miscible, the
phase diagram of the polymerjsolventjnon-solvent system willlook like the one described in
Figure 5-1 on the right. Depending on the system polymerjsolventjnon-solvent two situactons
can exist. In the fust situation the system separates in two liquid phases (area L1 and I.J. In
the second situation the polymer will form a crystalline phase in combination with one liquid
phase. The phase of the solute at redissolution is assumed to be the determining factor in
GPEC separation. If the solute is in a (semi-) crystalline solid state, the redissolution will
become highly irregular, resulting in poorly reproducible GPEC separations (see next paragraphs). If the solute is in a liquid phase (separated from the solvent phase) the
redissolution becomes reproducible and so does the GPEC separation. Therefore, the
formation of a crystalline phase is not desirabie when GPEC is applied.
5.4.1 GRADIENT POLYMER ELUTION CHROMATOGRAPHY
Tetrahydrofuran (THF), and hexafluoro iso-propanol (HFIP) are both good solvents for the
polyesters 14 and 15. Size exclusion chromatography can be performed using both solvents.
Water, methanol, acetonitrile, and iso-propanol can be used as non-solvent for the gradient
separations. Water is a non-solvent, the others are poor solvents (the polyester dissolves
partly). Since sample 14 (IA homopolyester) precipitates from a salution in THF aftera certain
time, the sample solvent for all the GPEC experiments was HFIP. The initia! conditions of the
gradient play an important role in the GPEC retention behavior of homopolyesters, especially
when they are crystalline. The GPEC retention behavior of the polyesters in different
combinations ofthe above solvents will be discussed in this section.
The chromatograms of samples 14 and 15 for the water/THF gradient are shown in Figure
5-3 and Figure 5-4. The chromatograms can be divided into two regions. The fust region
shows the low molar mass eligomers (region I: 10-40 minutes) and the second region displays
huge broad peaks which are due to crystallinity effects. Philipsen bas found similar
chromatograms (4].
The chromatograms are not reproducible, especially in the second region. In addition, they
show a strong dependenee of the injection volume on the separation. The dependenee of the
injection volume implies that the initia! conditions are crudal for the separation.
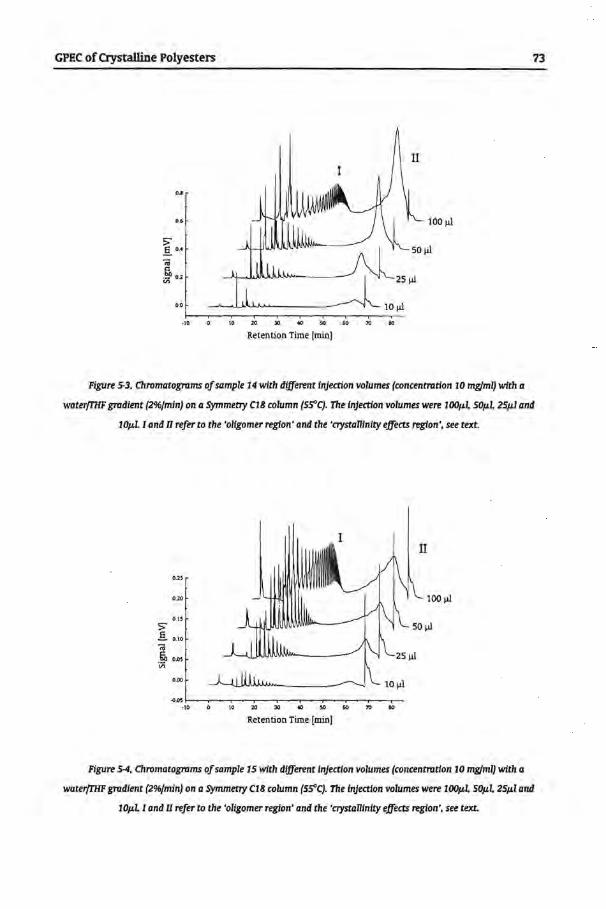
GPEC of Crystalline Polyesters
OA
0.0
> .§. 0.4
-;;;
~02
0.0
·10 10 ~ ~ ~ ~ ~ ~ ~
Retention Time [min]
73
Figure 5-3, Chromatagmms of sample 14 with different injection volumes (concentrotion 10 mgfml) with a
waterfTHF gmdient (2%fmin) on a Symmetry C18 column (Ss"C). The injection volumes were JOOp.L 50p.L 25p.l and
10p.L I and II refer to the 'oligomer region' and the 'aystaRinity effects region', see text.
02S
020
0.15
> .§... 0.10
-;;; .§> 0.0> Vl
0.00
100 ,.u
Reten !ion Time [min]
Figure 5-4, Chromatagmms of sample 15 with different injection volumes (concentrotion 10 mgfml) with a
water/THf gmdtent (2%/min) on a Symmetry C18 column (Ss"C). The lnjection volumes were 100p.L 50p.L 25p.l and
10p.L I and II refer to the 'oligomer region' and the 'aystaRinity effects region', see text.
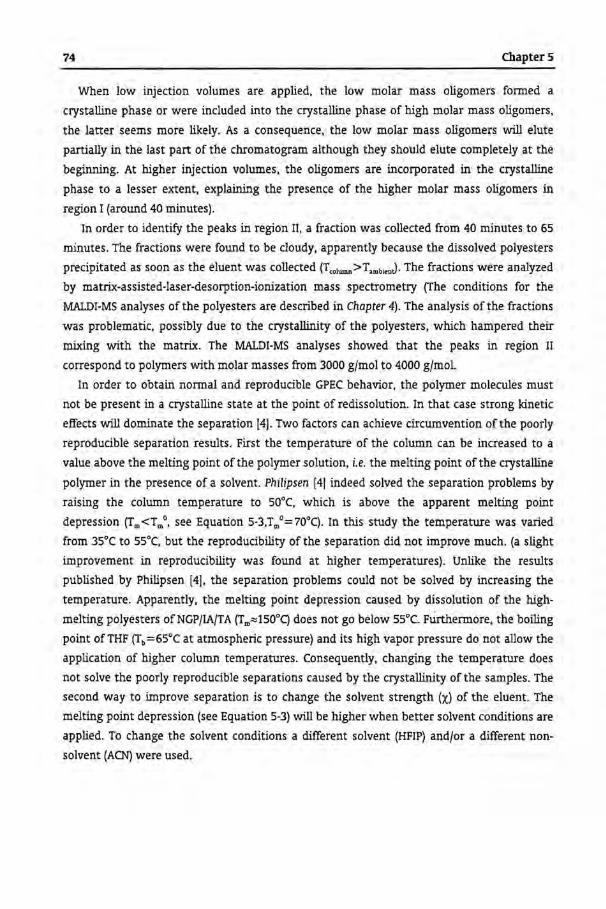
74 Chapter 5
When low injection volumes are applied, the low molar mass eligomers formed a
crystalline phase or were included into the crystalline phase of high molar mass oligomers,
the latter seems more likely. As a consequence, the low molar mass eligomers will elute
partially in the last part of the chromatagram although they should elute completely at the
beginning. At higher injection volumes, the eligomers are incorporated in: the crystalline
phase to a lesser extent, explaining the presence of the higher molar mass oligomers in
region I (around 40 minutes).
In order to identify the peaks in region II, a fraction was collected from 40 minutes to 65
minutes. The fractions were found to be cloudy, apparently because the dissolved polyesters
precipitated as soon as the eluent was collected (T,01umn>TambienJ· The fractions were analyzed
by matrix-assisted-laser-desorption-ionization mass speetrometry (The conditions for the
MALDI-MS analyses of the polyesters are described in Chapter 4). The analysis of the fractions
was problematic, possibly due to the crystallinity of the polyesters, which hampered their
mixing with the matrix. The MALDI-MS analyses showed that the peaks in region II
correspond to polymers with molar masses from 3000 gfmol to 4000 gfmol.
In order to obtain normal and reproducible GPEC behavior, the polymer molecules must
not be present in a crystalline state at the point of redissolution. In that case strong kinetic
effects will domina te the separation !4). Two factors can achleve circumvention of the poorly
reproducible separation results. First the temperature of the column can be increased to a
value above the melting point ofthe polymer solution, i.e. the melting point ofthe crystalline
polymer in the presence of a solvent. Philipsen !4] indeed solved the separation problems by
raising the column temperature to 50°C, which is above the apparent melting point
depression (Tm<Tm0 , see Equation 5-3,Tm0=70°q. In this study the temperature was varled
from 35°C to 55°C, but the reproducibility of the separation did not imprave much. (a slight
impravement in reproducibility was found at higher temperatures). Unlike the results
publisbed by Philipsen [4], the separation problems could not be solved by increasing the
temperature. Apparently, the melting point depression caused by dissalution of the high
melting polyesters ofNGP/IA/TA (Tm:.::150°Q does not go below 55°C. Furthermore, the boiling
point ofTHF (Tb=65°C at atmospheric pressure) and its high vapor pressure do not allow the
application of higher column temperatures. Consequently, changing the temperature does
not solve the poorly reproducible separations caused by the crystallinity of the samples. The
second way to imprave separation is to change the solvent strength (X) of the eluent. The
melting point depression (see Equation 5-3) will be higher when better solvent conditions are
applied. To change the solvent conditions a different solvent (HFIP) andfor a different non
solvent (ACN) were used.

GPEC of Crystalline Polyesters 75
5.4.1.2 WATER AND HExAFI.UORO lsOPROPANOL
The chromatagram of sample 14 obtained with the waterjHFIP gradient is shown in
Figure 5-5. The sample was dissolved in HFIP (concentration 10 mgjml) and injected in 100%
water (injection volume 25 ~1).
Figure 5·5, Chromatagram of sample 14 obtalned wtth the waterfHFIP gradient (2%/mln} on a symmeny C1B
column {5~C}. lnjection volume 25p.L.The HP 1010 DAD was applled ().. 275nm}.
The chromatograms obtained with the waterjHFIP gradient were found to be fairly
reproducible. However, the high molar mass peak showed again reproducibility problems,
although the reproducibility had improved when compared to that observed for the
waterjTHF gradients. The application of HFIP as solvent solved the crystallinity problems for
the low molar mass polymers, but did not solve the problems over the whole range of the
molar mass. HFIP was not only used as eluent but also as sample solvent. Consequently, at
injection, the phase separation occurred in the presence of HFIP, which was thought to
prevent the incorporation of the low molar mass oligomers. resulting in a better
reproducibility.
5.4.1.3 ACHTONITRIIJ! AND TlrrRAHYDROPURAN
The chromatagram of sample 14 obtained with the ACN/THF gradient is shown in Figure
5-6. The sample was dissolved in THF (concentration 10 mgfml) and injected in 100% ACN
(injection volume 25!-11).
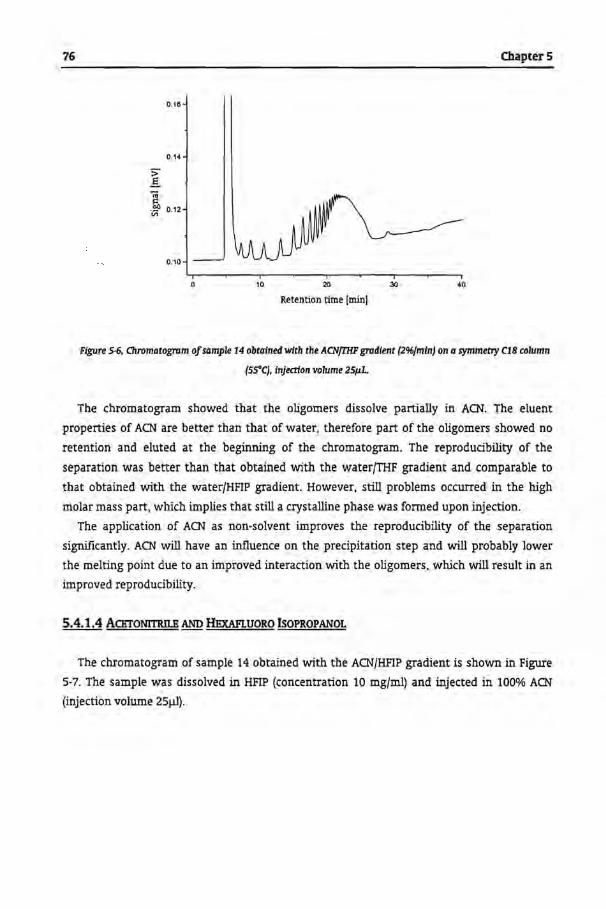
76
0.16
0.14
;;; Sa ·v; 0.12
0.10
10 20
Retention time [min)
30
Chapters
40
Figure 5-6, Chromarogram of sample 14 obtalned wlth the ACNfTHF gradlent {2%/min} on a symmeny C18 column
{5S'C), lnjectlon volume 25fLL.
The chromatagram showed that the oligomers dissolve partially in ACN. The eluent
properties of ACN are better than that of water, therefore part of the oligomers showed no
retention and eluted at the beginning of the chromatogram. The reproducibility of the
separation was better than that obtained with the waterfTHF gradient and camparabie to
that obtained with the water/HFIP gradient. However, still probieros occurred in the high
rnalar ma ss part, which implies that still a crystalline phase was formed u pon injection.
The application of ACN as non-solvent impraves the reproducibility of the separation
significantly. ACN will have an influence on the precipitation step and will probably lower
the melting point due to an improved interaction with the oligomers, which will result in an
improved reproducibility.
5.4.1.4 ACETONITRD.E AND HExAFI.UORO lsOPROPANOL
The chromatagram of sample 14 obtained with the ACN/HFIP gradient is shown in Figure
5-7. The sample was dissolved in HFIP (concentration 10 mgfml) and injected in 100% ACN
(injection volume 25111).
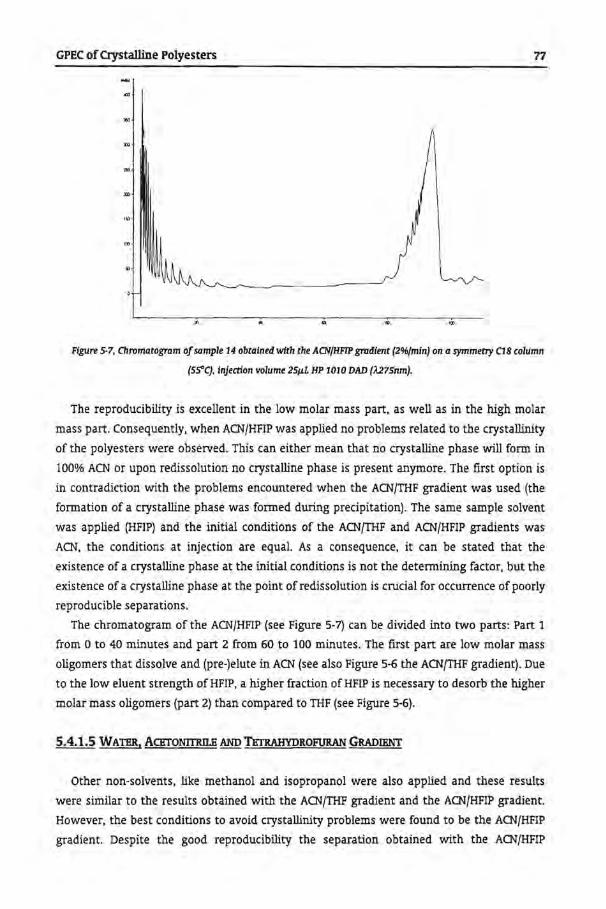
GPEC of Crystalline Polyesters 77
"
Figure 5-7, Chromatagram of sample 14 obtatned with the ACN/HFTP gradtent {2%/mtn) on a symmet7y C18 column
{SSOC), injection volume 251-LL HP 1010 DAD {U75nm).
The reproducibility is excellent in the low molar mass part, as well as in the high molar
mass part. Consequently, when ACN/HFIP was applied no probieros related to the crystallinity
of the polyesters were observed. This can either mean that no crystalline phase will form in
100% ACN or upon redissolution no crystalline phase is present anymore. The first option is
in contradiction with the probieros encountered when the ACN/THF gradient was used (the
formation of a crystalline phase was formed during precipitation). The same sample solvent
was applied (HFIP) and the initia! conditions of the ACN/THF and ACN/HFIP gradients was
ACN, the conditions at injection are equal. As a consequence, it can be stated that the
existence of a crystalline phase at the initia! conditions is not the determining factor, but the
existence of a crystalline phase at the point of redissolution is crudal for occurrence of poorly
reproducible separations.
The chromatagram of the ACN/HFIP (see Figure 5-7) can be divided into two parts: Part 1
from 0 to 40 minutes and part 2 from 60 to 100 minutes. The first part are low molar mass
oligomers that dissolve and (pre-)elute in ACN (see also Figure 5-6 the ACN/THF gradient). Due
to the low eluent strength ofHFIP, a higher fraction ofHFIP is necessary to desorb the higher
molar mass oligomers (part 2) than compared to THF (see Figure 5-6).
5.4.1.5 WATER, ACBTONITRILE AND Tlmwm>ROFURAN GRADIBNT
Other non-solvents, like methanol and isopropanol were also applied and these results
were similar to the results obtained with the ACN/THF gradient and the ACN/HFIP gradient.
However, the best conditions to avoid crystallinity probieros were found to be the ACN/HFIP
gradient. Despite the good reproducibility the separation obtained with the ACN/HFIP

78 ChapterS
gradient was not suitable to characterize the copolymers adequately. The selectivity in the
ACN/HFIP gradient was not sufficient to obtain a separation. In contrast, the application of
water as non-solvent gave a high selectivity (see Figure 5-3). With this observation,
water/ACN non-solvent was tested and found to bethebest solution for the s~paration ofthe
copolyesters. In addition, the random copolyesters did not show any poor reproducibility
behavior as can beseen in Figure 5-8, where the chromatograms ofthe samples 14. 15 and
the 1:1 ratioIA/TAcopolyesters obtained with gradient from 50:50% waterfACN to 100% THF
are shown.
..
0.10
0.08
0.06
0.04
0.02
0.00
0.10
0.08
Q. ~ 0.04
Vl 0.02
0.00
0.06
0.05
0.04 .... -.. 0.03 Q. 8 "' Vl
0.02
0.01
0.00
.0.01
·20 0 20 40 60 80 100 120 140
Retention time (mini
Figure 5-8, Chromatagmms of sample 14, 15 and the copolymer IA:TA 1:1 obtained wlth a grudlent from
waterfACH {50:50} to THF on a Symmetry C18 column {55"}, lnjection volume 25J.Jl. concentratlon 10 mg/mL
Therefore THF as eluent could be used as eluent to obtain reproducible chromatograms for
the copolyesters. In order to avoid crystallization (see sample 14A), HFIP was used as the
sample solvent for the separation of the homopolymers and the copolymers. The
characterization ofthe copolymers is described in Chapter 6.
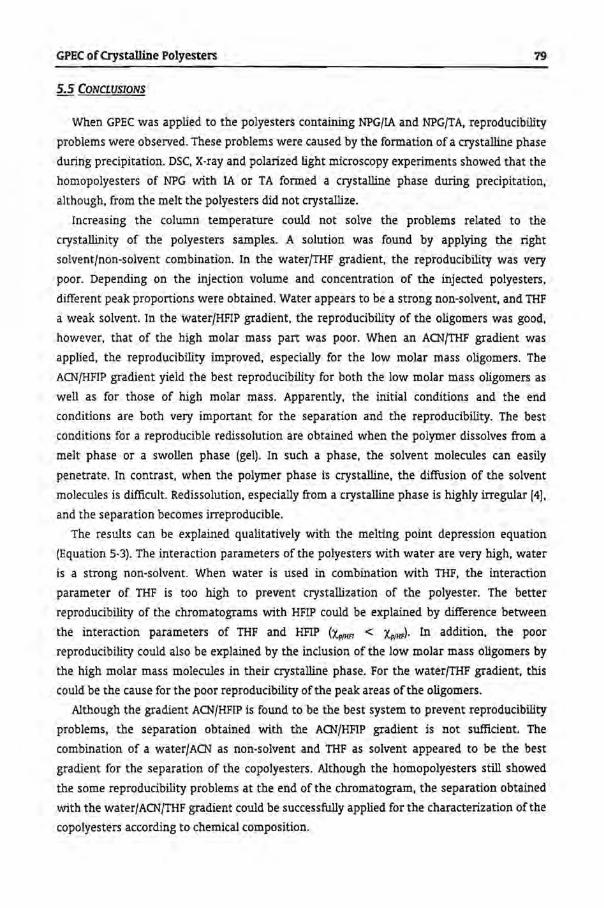
GPEC of Crystalline Polyesters 79
5.5 CONCLUSIONS
When GPEC was applied to the polyesters containing NPG/IA and NPG/TA, reproducibility
problems were observed. These problems were caused by the formation of a crystalline phase
during precipitation. DSC, X-ray and polarized light microscopy experiments showed that the
homopolyesters of NPG with IA or TA formed a crystalline phase during precipitation,
although, from the melt the polyesters did not crystallize.
Increasing the column temperature could not solve the problems related to the
crystallinity of the polyesters samples. A salution was found by applying the right
solvent/non-solvent combination. In the water{THF gradient, the reproducibility was very
poor. Depending on the injection volume and concentratien of the injected polyesters,
different peak proportions were obtained. Water appears to be a strong non-solvent, and THF
a weak solvent. In the water{HFIP gradient, the reproducibility of the eligomers was good,
however, that of the high molar mass part was poor. When an ACN{THF gradient was
applied, the reproducibility improved, especially for the low molar mass oligomers. The
ACN/HFIP gradient yield the best reproducibility for bath the low rnalar mass allgomers as
well as for those of high rnalar mass. Apparently, the initia! conditions and the end
conditions are both very important for the separation and the reproducibility. The best
conditions for a reproducible redissolution are obtained when the polymer dissolves from a
melt phase or a swollen phase (gel). In such a phase, the solvent molecules can easily
penetrate. In contrast, when the polymer phase is crystalline, the ditfusion of the solvent
molecules is difficult. Redissolution, especially from a crystalline phase is highly irregular [4),
and the separation becomes irreproducible.
The results can be explained qualitatively with the melting point depression equation
(Equation 5-3). The interaction parameters of the polyesters with water are very high, water
is a strong non-solvent. When water is used in combination with THF, the interaction
parameter of THF is too high to prevent crystallization of the polyester. The better
reproducibility of the chromatograms with HFIP could be explained by difference between
the interaction parameters of THF and HFIP (Xp/Hf! < x.9flf1). In addition, the poor
reproducibility could also be explained by the inclusion of the low molar mass eligomers by
the high molar mass molecules in their crystalline phase. For the water{THF gradient, this
could be the cause for the poor reproducibility ofthe peak areas ofthe oligomers.
Although the gradient ACN/HFIP is found to be the best system to prevent reproducibility
problems, the separation obtained with the ACN/HFIP gradient is not sufficient. The
combination of a water{ACN as non-solvent and THF as solvent appeared to be the best
gradient for the separation of the copolyesters. Although the homopolyesters still showed
the some reproducibility problems at the end of the chromatogram, the separation obtained
with the water{ACN/THF gradient could be successfully applied for the characterization ofthe
copolyesters according to chemica! composition.

80 Cbapter 5
5.6 REPERENCES
1. W.W. Yau, J.J. Kirkland and D.D. Bly. "Modem Size Exclusion Liqutd Chromatography", WileyInterscience, New York, 1979.
2. F.A. Buijtenhuijs. Personal conversation. 3. G. Glöckner, G. Glöckner, "Gradient HPLC ofCopolymers and Chromatographic Cross Fractionation",
Springer-Verlag Berlin Heidelberg, 1991. 4. Philipsen H.J.A., "Mechanisms of Gradient Polymer Elution Chromatography and lts Application to
{Co)Polyesters", Ph.D. Thesis, Eindhoven University of Technology, Eindhoven, The Netherlands, 1998.
5. P. Flory, "Principles ofPolymer Chemistry", Comell University Pre ss, Ithaca, New York, 1953. 6. O.W. van Krevelen, "Properties ofPolymers", 3rd Edition, Elsevier, Amsterdam, 1990. 7. W.J. Staal, "Gradient Polymer Elution Chromatography", Ph.D. Thesis, Eindhoven University of
Technology, Eindhoven, The Netherlands, 1996. 8. B. Wunderlich, "Macromolecular Physics", VoL 3 "Crystal Melting", Academie Press, New York. 1980. 9. S.M. Vleeshouwers, "Modeling and Prediering Properties ofPolymers in the Amorphous Glassy state",
Ph.D. Thesis, Eindhoven University ofTechnology, Eindhoven, The Netherlands, 1993. 10. Hans-Georg Elias, Makromoleküle, Bd. 1, Grondlagen, S.Auflage, Hüthig & Wepf Verlag, Base!
1990.

The Microstructural Analysis of Co polyesters 81
Chapter 6
The Microstructural A na lysis of Co polyesters
For the characteTization of co polyesters of neopentyl glycol with isophthalic acid {IA) and terephthalic acid {TA) copolymers with different ratio IA/TA were synthesized. The separation conditions described in Chapter 4, were used to separate the copolymers on chemica/ composition. The chemica! composition distributions (CCDs) of the copolymers with different overall ratio of IA/TA were calculated and compared to a CCD based on statistics. Besides random copolyesters also a transesterfication sample of the two homopolymers and commercial copolyesters were characteTized. By applying GPEC in combination with ESI-MS and UV spectroscopy di.fferences in microstructure (molar mass, chemica/ composition, end groups) among the commercial samples could be revealed.

82 Chapter6
6.1 lNTRODUCTION
The properties of the copolymers of neopentyl glycol (NPG), isophthalic acid (IA) and
terephthalic acid (TA) depend on microstructure (molar mass, chemica! composition and end
groups), especially on the functional end groups. The acid mol fraction of TA affects the
flexibility of the polymer matrix, and the acid mol fraction IA directly affects the chemica!
and physical resistance. Consequently the information on the chemica! composition
distribution is essential for the understanding of these properties. The copolymers will be
separated by reversed-phase gradient-polymer-elution-chromatography GPEC (RP-GPEQ. The
cyclic allgomers present in the polyesters play an important role for the properties, since
they do not take part in the cross-linking reaction during curing of the polymer rnatruc
Additionally the cyclic dimer of TA and NPG does not dissolve in the polymer matrix,
resulting in phase separation of polymer matrix and the cyclic dimer. The cyclic dimer will
migrate to the surface causing imperfections in the gloss properties of the coating. These
imperfections are also called 'the blooming effect' and, consequently, the cyclic dimer is
called the 'blooming' molecule [1].
In order to study the GPEC retention behavior of the copolyesters, random copolyesters
with different acid mol fraction of TA were synthesized. With these well-defined copolymers,
the separation according to chemica! composition was studied. A transesterfication
copolymer was synthesized from the initia! homopolymer samples with a TA mol fraction of
0.50. This transesterfication copalyester could be compared with the random copalyester
with similar chemica! composition. Besides the copalyester samples, commercial copalyester
samples (one of the components of powder coatings) were characterized. The experimental
conditions of the analysis were similar to the analysis of the homopolyesters described in
Chapter4.
6.2 EXPERIMENTAL
6.2.1 SYNTHESIS OF COPOLYESTERS
Copalyester samples of neopentyl glycol (NPG), isophthalic acid (IA) and terephthalic acid
(TA) with different ratios IA/TA were synthesized. The two acid monomers are not miscible,
consequently the copolymerizations were performed in two steps. In the fust step TA was
polymerized with NPG, and in step 2, IA was added to the reaction mixture. Apart from the
second step the synthesis of the copolyesters is camparabie to the synthesis of the
homopolyesters described in Chapter 4. The synthesis of the copolymer with an acid mol
fraction TA ofO.SO will bedescribed in detail.
Initially, SOg of water and SOOg NPG (=4.8 mol) were mixed in a two liter reactor and
heated to a temperature of 80°C (water was added to melt the NPG at a lower temperature).

The Microstructural Analysis of Copolyesters 83
The reactor was purged with nitrogen. In addition, 1.5g dibutyl tin oxide was added as
catalyst for theesterfkation reaction. When the NPG was melted, 450 g of TA (2.7 mol), was
added to the reactor, and the reactor was slowly heated to a temperature of 240°C in order to
melt the acid monomer. The water formed during the esterfkation was distilled off. After an
acid value {A V), determined by titration, of approx. 5 [rog KOH/g] was reached, the reactor
was cooled down to 180°C. Then 450 g of IA (2.7) was added to the reactor and the
temperature was increased to 240°C. The reaction was stopped when an AV of35 [mg KOH/g]
was reached. The copolymer samples with different IA/TA ratio are listed in Table 6-1.
Copolymers with different acid mol fraction ofTA are obtained by changing the ratio of acid
monomers. Depending on the acid mol fraction of TA different reaction times were used. The
reactions were stopped when an acid value ofapproximately 35 [mg KOH/g].
In addition, a transesterfication of the homopolymer samples 14 {IA) and 15 (TA) was
perforrned. The two homopolymers were mixed one to one in the reactor and no additional
catalyst was used. The transesterfication was performed at 240°C and the reaction was
stopped after 5 hours. The trans-esterfication reaction is sample 24.
Except from the acid mol fraction TA of 0.75 and the incorporation of a small fraction of
tri-functional alcohol (trimethylol propane {TMP)), detailed information about the reaction
conditions of the commercial samples is not known. TMP is a tri-functional monoroer and is
added to obtain multi-functional oligomers instead of bi-functional as obtained with NPG.
Presumably, the amount ofTMP added is low (less than 1%vol). The four different commercial
samples are called Cl, C2, C3 and C4.
Table 6-1, The random copalyester samples wlth different chemica! compositlon.
Sample Acid mol fraction Acid mol fraction Addition of IA at Total Reaction Time Code IA TA Hours Hours 16 0.50 0.50 5 10 17 0.20 0.75 10 20 18 0.75 025 4 12 24 0.50 0.50 - 5
6.2.2 ANALYTICAL TECHNIQUES
The applied SEC conditions and equipment were simtlar to those for the homopolymers.
Also the RP-GPEC conditions and the conditions used for the ESI-MS identifications were
comparable to the conditions used for the homopolyesters. The de scription of the conditions
and equipment used for the analysis of the homopolyesters can be found in Chapter 4.
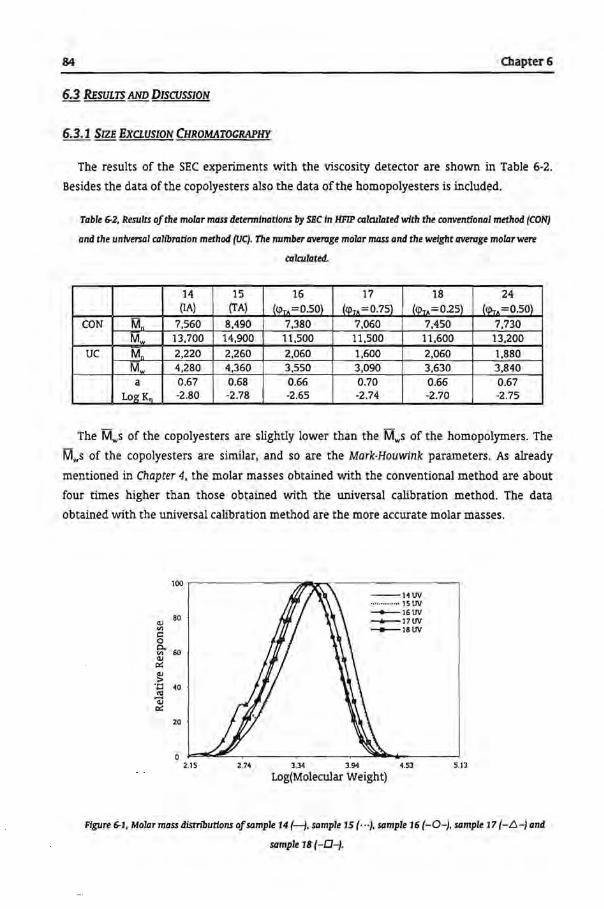
84 Chapter6
6.3 RESULTS AND DISCUSSION
6.3.1 SIZE EXCLUSION CHROMATOGRAPHY
The results of the SEC experiments with the viscosity detector are shown in Table 6-2.
Besides the data ofthe copolyesters also the data ofthe homopolyesters is included.
Table 6-2, Results of the molar mass determtnations by SiC In HFIP culculated wlth the conventional method {CON}
and the universa I calibmdon method (UC}. The number avemge molar mass and the weight avemge molar were
calculated.
14 15 16 17 18 24 (IA) (TA) (q>TA=O.SO) (q>TA=0.75) (q>TA=025) (~.=0.50)
CON M_n 7,560 8,490 7,380 7,060 7,450 7,730 M., 13,700 14,900 11 ,500 11,500 11,600 13,200
uc Ma 2,220 2,260 2,060 1,600 2,060 1,880
Mw 4,280 4,360 3,550 3,090 3,630 3,840 a 0.67 0.68 0.66 0.70 0.66 0.67
LogKn -2.80 -2.78 -2.65 -2.74 -2.70 -2.75
The Mws of the copolyesters are slightly lower than the Mws of the homopolymers. The
Mws of the copolyesters are similar, and so are the Mark·Houwink parameters. As already
mentioned in Chapter 4, the molar masses obtained with the conventional me.thod are a bout
four times higher than those obtained with the universa! calibration method. The data
obtained with the universa! calibration metbod are the more accurate molar masses.
100
Q) 80
V)
r:: 0 P.
60 V) Q) p::: Q)
> ·o "'
40
Q) p:::
20
0 2.15 2.74
--14UV .............. 15UV -16UV __,..__17UV --18UV
3.34 3.94 4.53
Log(Molecular Weight) 5.13
Figure 6-1, Molar mass dlstributions of sample 14 (~.sample 15 (" ·},sample 16 (-0-), sample 1'1 (-.6.-} and
sample 18 (-0-}.
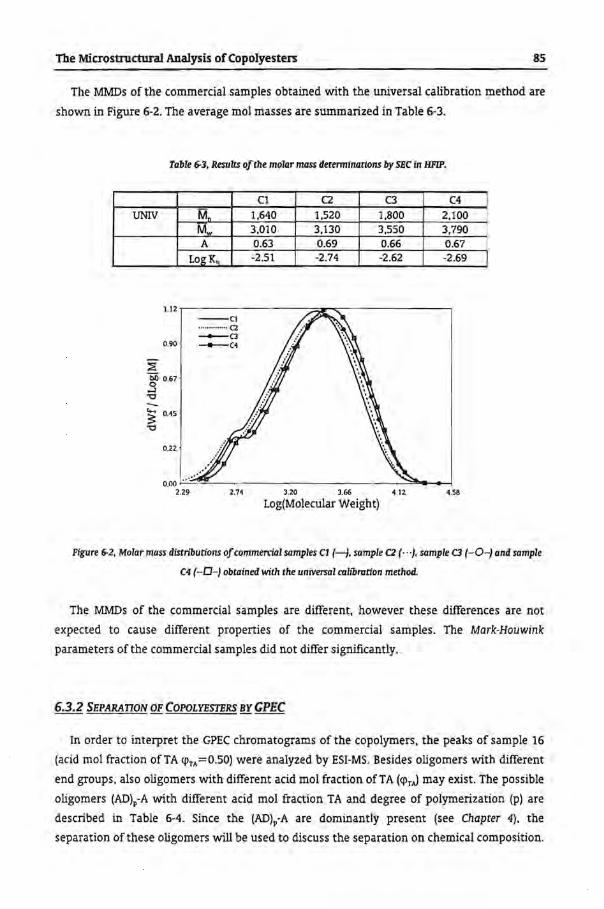
The Microstructural Analysis of Copolyesters 85
The MMDs of the commercial samples obtained with the universa! calibration methad are
shown in Figure 6-2. The average mol masses are summarized in Table 6-3.
Table 6-3, Results ofthe moklr mass detennlnattons by SEC in HFIP.
Cl C2 C3 C4 UNIV M. 1,640 1,520 1,800 2,100
Mw 3,010 3,130 3,550 3,790 A 0.63 0.69 0.66 0.67
LogKn -2.51 -2.74 -2.62 -2.69
--Cl .........•.•.• C2
-a 0.90 --C4
~ s 0.67
-o -~ 0.45
-o
022
0.00 t:--=='---~---~---~---~-"""-...... -1 2.29 2.74 3.20 3.66 4.12 4.58
Log(Molecular Weight)
Figure 6-2, Molar mass distnöutions of commercial samples C1 (-}, sample C2 ( · · -}. sample C3 (-0-} and sample
C4 (-0-} obtalned with the universa! cahöration method.
The MMDs of the commercial samples are different, however these differences are not
expected to cause different properties of the commercial samples. The Mark-Houwink
parameters ofthe commercial samples did not differ significantly.
6.3.2 SEPARATION OF COPOLYESTERS BY GPEC
In order to interpret the GPEC chromatograms of the copolymers, the peaks of sample 16
(acid mol fraction ofTA <JlrA=O.SO) were analyzed by ESI-MS. Besides oligomers with different
end groups, also oligomers with different acid mol fraction of TA (<JlrJ may exist. The possible
oligomers (AD)P-A with different acid mol fraction TA and degree of polymerization (p) are
described in Table 6-4. Since the (AD)P-A are dominantly present (see Chapter 4), the
separation of these oligomers will be used to discuss the separation on chemica! composition.

86 Chapter6
Since the two acid monomers have the same mass, the eligomers with different chemica!
composition with respect to the ratio IA/TA wil! have the same molar mass. Therefore, MS
wil! not be able todetermine the chemica! composition (ratio of IA/TA) of each oligomer. The
ratio IA/TA can be determined in combination with GPEC.
Two different gradients were applied to separate the copolyesters. The two gradients
were already applied to separate the homopolyesters. Gradient B was found to be the optima!
gradient for the homopolyesters (see Chapter 4), however, since the copalyester are more
complex in microstructure, also oligomers with different chemica! composition wil! be
present. The chromatograms of sample 16 (<pTA =0.50) obtained with gradient A and gradient
B can beseen in Figure 6-3.
> .ê. -;;; c
"" ·v;
> E
0.10
0.05
0 .00
0.14
:;; 0.07 c "" .:;;
0 .00
Gradient B
15 20 25 30 35 40 45 50 ss 60 65 70
Retention Time !mini
Figure 6-3, Comparison ofthe chromatograms of sample 16(cpr, =0.50) obtained with gradient A (bottom) and
gradient B (top). For more detailed information about gradients A and B see Chopter 4.
Gradient B shows more resolution within a cluster with equal p. However, the peaks start
to overlap early in the chromatagram ((AD),-A). resulting in a baseline drift and a loss of
quantitative information. Gradient A shows a better resolution between the cluster with
different p. Although gradient B showed the highest density of information, the separation in
the chromatagram obtained with gradient A the peaks can be quantified better due to the
baseline separation. Consequently, gradient A will be used to characterize the copolymers.

The Microstructural Analysis of Copolyesters 87
Table 6-4, The oligomers (AD)iA with different add molftuctlon TA (Cf>r.J with different degree ofpolymerlzat1on
(p). The probabilit1es ofthe different oligomers are calculated with the number of add groups (#IA and #TA) In the
oligomer and the number ofpossible spedes with the same add molfractlon TA but different sequence ofTA (#). The
probabr1it1es depend on the overaU add molfractlon TA (Cf>r.J.
Oligomer Composition Probability Probability Probability Sample 18 Sample 16 Sample 17
<llrA #IA #TA # <pR0.25 <!lrA =0.50 <!lrA=0.75 P=2 0.00 3 0 1 0.4219 0.1250 0.0156
(AD)2·A 0.33 2 1 3 0.4219 0.3750 0.1406 0.60 1 2 3 0.1406 0.3750 0.4219 1.00 0 3 1 0.0156 0.1250 0.4219
P=3 0.00 4 0 1 0.3164 0.0625 0.0039 (AD kA 025 3 1 4 0.4219 0.2500 0.0469
0.50 2 2 6 0.2109 0.3750 0.2109 0.75 1 3 4 0.0469 0.2500 0.4219 1.00 0 4 1 0.0039 0.0625 0.3164
P=4 0.00 5 0 1 0.2373 0.0313 0.0010 (AD)4·A 0.20 4 1 5 0.3955 0.1563 0.0146
0.40 3 2 10 0.2637 0.3125 0.0879 0.60 2 3 10 0.0879 0.3125 0.2637 0.80 1 4 5 0.0146 0.1563 0.3955 1.00 0 5 1 0.0010 0.0313 0.2373
p=5 0.00 6 0 1 0.1780 0.0156 0.0002 (AD )s-A 0.17 5 1 6 0.3560 0.0938 0.0044
0.33 4 2 15 0.2966 0.2344 0.0330 0.50 3 3 20 0.1318 0.3125 0.1318 0.66 2 4 15 0.0330 0.2344 0.2966 0.83 1 5 6 0.0044 0.0938 0.3560 1.00 0 6 1 0.0002 0.0156 0.1780
The numbers in Table 6-4 are calculated with the assumption of equal reactivities of TA
and IA. From Table 6·4 the chemical composition distributions (CCD) for allgomers ADP·A with
different degree of polymerization (p) can be calculated based on statistics. These statistically
calculated CCDs will be discussed in more detail further on in this chapter.
From the overlay of the complete chromatograms no di.fferences can be noticed, however,
when the first part of the chromatograms are studied in more detail, small di.fferences are
found. The first part of the chromatograms (fust 40 minutes) of the co polyester samples (16,
17 and 18) and the homopolyesters (14 and 15) obtained with gradient A are shown in Figure
6-4. The allgomers with equal degree of polymerization (p) of the copolymers elute in
between the allgomers with equal p of the homopolyesters. hence, separation on chemica!
composition was obtained. Nevertheless, besides separation on chemica} composition also
separation of the allgomers with equal p based on different acid end groups can occur. This
hypothesis can be checked by loolàng at the number of peaks present in a cluster of
allgomers with equal p and the number of possible allgomers described in Table 6-4.
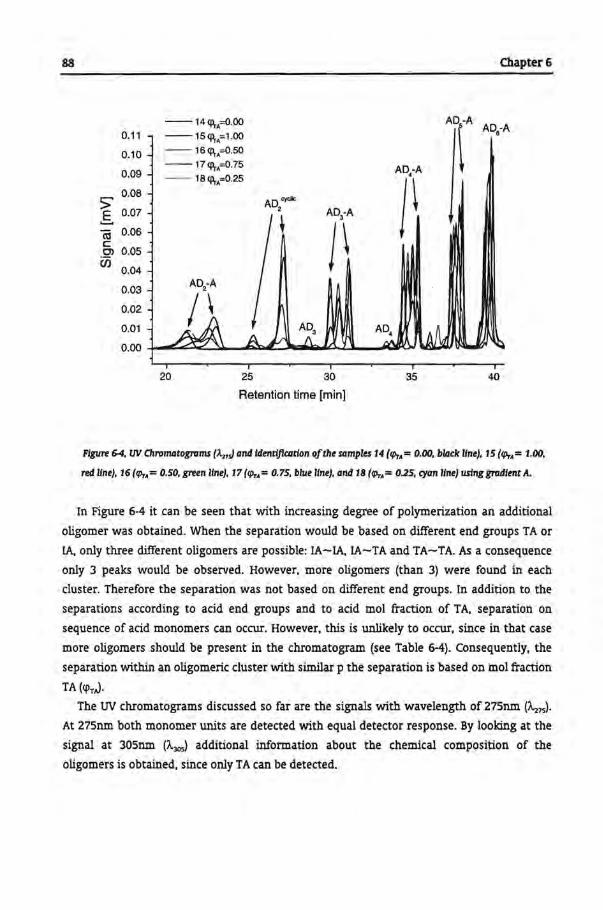
88
0.11
0.10
0.09
0.08 > .s 0.07
cu o.os c C) 0.05
ëj) 0.04
0.03
0.02
0.01
--14 cp,..=O.OO
--15 cp,..=1.00 -- 16 cp,..=0.50 --17cp,..=0.75 -- 18 c:p,..-=0.25
AD c:ydC 2
0.00 -+-.-,...:;;..>..:::._~-~:o.o!E..-JIIIIIali-U-<:....-...-~IK>'
20 25 30 35
Retention time [min]
Chapter6
40
Flgure 64, UV Chromatograms (À17j an4 t4enriflcarion oftht samples 14 (rp,.= 0.00, black Une), 15 (rp,.= 1.00,
red Une}, 16 (rp,.= 0.50, green llne), 17 (rp,.= 0.75, blue llne), and 18 (rp,.= 0.25, cyan line} using gradlent A.
In Figure 6-4 it can be seen that with increasing degree of polymerization an additional
oligomer was obtained. When the separation would be basedon different end groups TA or
IA, only three different eligomers are possible: IA-IA, IA-TA and TA-TA. As a consequence
only 3 peaks would be observed. However, more eligomers (than 3) were found in each
cluster. Therefore the separation was not based on different end groups. In addition to the
separations according to acid end groups and to acid mol fraction of TA, separation on
sequence of acid monomers can occur. However, this is unlikely to occur, since in that case
more eligomers should be present in the chromatogram (see Table 6-4). Consequently, the
separation within an oligomeric cluster with similar p the separation is based on mol fraction
TA (cpTJ.
The UV chromatograms discussed so far are the signals with wavelength of 275nm (1..275).
At 275nm both monomer units are detected with equal detector response. By looking at the
signal at 305nm (À.305) additional information about the chemica! composition of the
eligomers is obtained, since only TA can be detected.

The Microstructural Analysis of Co polyesters
0.016
î 0.012
(ij
5 0.008
Cii
0.004
-14<P,,:O.OO -15<P,,•1.00 - 16<P,,=0.50 -17<P,,=0.75 - 18<P,,:0.25 <p,.,=0.33
19 21 22
Relention Time [min]
89
8 ~ 0 0
11 11
J. J -17cp,...,=0.76 ~ - 18'1\, .0.251.,_
0.000
îo~ (ij a, 0.001
üi
Relention Time (mln]
Figure 6-5, Detal1ed UV RP-GPHC chromatagram ofthe aligamerlc clusterwlth degree ofpolymerlzatian (p} of2.
Left: À275 samples 14 (rp.,=O.OO, black}, 15 (rp.,=1.00, red}, 16 (rp.,=0.50, green), 17 (rp.,=0.75. blue), and
18(rp.,=0.25, cyan). Right: comparlson of sample 17 (rp.,=0.75, ÀJ<Jso blue} and sample 18 (rp.,=0.25, )..,.., cyan).lbe
arrows indicate the altgomers wlth different acid molfraction (rp..J described in Table 6-4.
The first oligomeric cluster that can be seen is (ADkA around 22 minutes. Four oligomers
(ADkA were found with different acid mol fraction of TA (<pTJ as can be seen in Figure 6-5.
This was in agreement with the amount of oligomers described in Table 6-4. Two oligomers
eluted simultaneously with the oligomers of the homopolyesters, and two oligomers eluted
in between the two homopolymers .
0.06
0.04
> §.
0.03 (ij
" .!2' (/) 0.02
0.01
0.00
. 'Pr.=0.75 .'llr.=1.00
<p,.,=0.25 ,<p,.,=0.50 :
<p,.r<JOO : \ -14<A-A"•O.OO
(AD)-A a
-ts~ .... ,_oo -16fl:\ .• •0.50 -17Q\ .. •0.75 - 18f4\..._..0.26
28 29 31 32
Re1en1ion Urne (mln)
0.008 q>,.=O.OO q>,.=0.75 q>,....= l.OO
..... q>,.=O.SO
> .ê.. 0.004
~··~ Cii
29.5 30.0 30.5 3 1.0
Relention Time [mln[
Ftgure 6-6, Detal1ed UV RP-GPHC chromatagram ofthe aligomerlc clusterwlth degree ofpalymerlzatian (p) of3.
Left: À275 samples 14 (rpr,=O.OO, black), 15 (rp.,=1.00, red). 16 (rp.,=O.SO, green), 17 (rpr,=0.75. blue), and
18{rp.,=0.25, cyan). Right: camparlsan af sample 17 (rp.,=0.75, )..,.., blue) and sample 18 (rp., =0.25, ÀJ<Jso cyan).lbe
arrows lndicate the oltgome~:S wlth different add molfraction (rp..J descn'bed in Table 6-4.
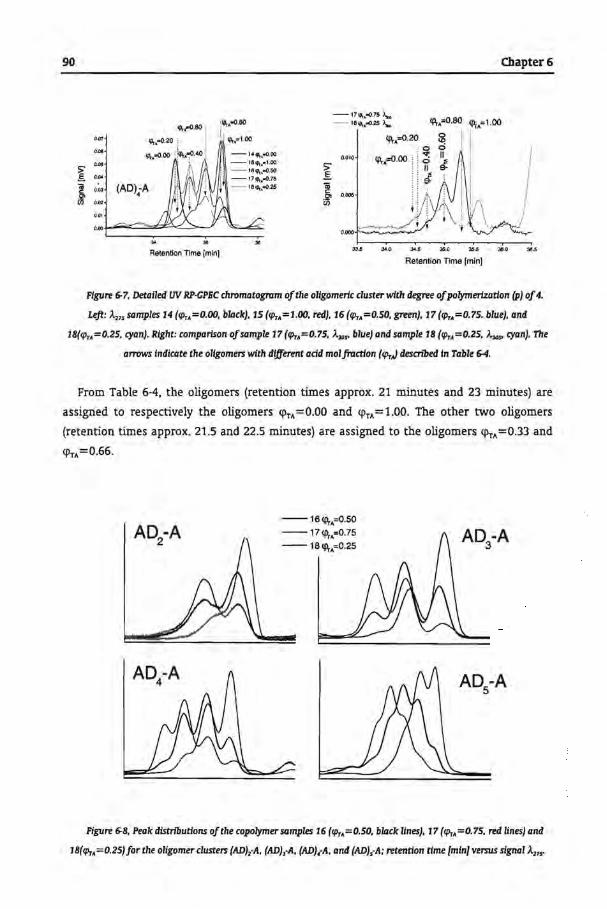
90
> .s 1! .2' <IJ
,.,
"'' 0.00
,..,. 0.03
0"'
0.0,
"''
q>,,.0.60
'1',,..0.20 i
q>,,-ooo i fq>,,~.40
(AD)4-A
" Retentien Time [mln]
!q>,,•0.60
1: 'Pu•1.00
-14fA,,...O.OO -15~.·1.00
1~ ==:~::~:~ ~ - 18q!,_..0.26
> §.
~ .2' en
Chapter6
-17111.-<>.nl,.. cp,.,=0.80 - 18q>,,-<>.25l,.. cp,.,=1.00
0.010
0.000
0.000
33~ 34.0 "'·' 35.0 35~ 35.0 3U
Relention nme [mln)
Figure 6-7, DetaUed lW RP-CPHC chromatagrum ofthe oligomerlc clusterwlth degree ofpolymerlzation (p) of 4.
Lejt: ).,,5 samples 14 (~~>T.=O.OO, black), 15 (~~>T.=1.00, red). 16 (~~>T.=0.50, green), 17 (~~>T.=0.75. blue), and
18{!h. =0.25, cyan). Rlght: comparison of sample 17 (!h. =0.75, J..,,,. blue) and sample 18 (!h. =0.25, 1",. cyan). The
arTOws indicate the allgomers wlth different add molfraction (~~>T,) descn'bed In Table 6-4.
From Table 6-4, the allgomers (retention times approx. 21 minutes and 23 minutes) are
assigned to respectively the allgomers q>TA=O.OO and q>TA=l.OO. The other two oligomers
(retention times approx. 21.5 and 22.5 minutes) are assigned to the allgomers ~A=0.33 and
Cj)TA=Q.66.
AD-A 2
--16 cp,.,=0.50
--17cp,..=0.75
-- 16 (j\,=0.25 AD-A
3
AD-A 4 AD-A
5
Figure 6-8, Peak distributtons of the copolymer samples 16 (rp.. =0.50, black lines), 17 (rp.. =0. 75, red llnes) and
18(~~>T.=0.25)forthe oligomerclusters (AD}2·A, (AD),·A, (ADJ.-A, and (AD)5·A: retendon time (min] verrus signa! J..2,,.

The Microstructural Analysis of Copolyesters 91
In Figure 6-5 (right) the chromatograms of sample 17 (cprA=O.SO, À.305) and sample 18
(cprA = 0.25, À.305) are shown. The other three eligomers (cprA = 0.33, cprA = 0.66 and cprA = 1.00)
show an increase in the À.305 signa!, consequently the oligomers must contain at least one TA
group. Therefore, the À.305 signals ofthe samples 17 (cprA =0.50) and sample 18 (cprA =0.25) were
used to elucidate cprA of each oligomer.
In Figure 6-6 the eligomers (ADkA with different cprA are shown. The oligomer cluster
(AD kA must contain an additional oligomer (total of 5) compared to cluster (AD kA as can be
seen in Table 6-4. In the oligomer cluster (ADkA 5 peaks were found (see Figure 6-6) which
could be labeled cprA=O.OO, cprA=0.25, cprA=0.50, cprA=0.75 and cprA=l.OO. The À.305 signa! of
sample 17 clearly showed the different eligomers containing TA.
The oligomer cluster (ADkA, see Figure 6-7, has also a distribution of oligomers as
described in Table 6-4. The eligomers with low TA and low IA content were difficult to
observe, since they co-eluted. However, by looking at chromatograms obtained at À.305, the
oligomers with different acid mol fraction ofTA could be labeled (see on the right). In the ~75
signa! the peak was noticed and in À.305 signa! the peak was absent, therefore the peak must
contain solely IA (see also Chapter 4). Similar results are found for the oligomer cluster ADçA
(not shown). Again the eligomers with low TA content were difficult to be observed.
The overlays of all the oligomer clusters ADP-A with different p of the different
copolyesters are shown in Figure 6-8. The distributions of the oligomers clearly follow
pattems from which CCDs can be translated.
For the calculation ofthe CCDs the dependency ofthe retention time (at top ofthe peak) of
the eligomers (AD)P-A with different acid mol fraction TA on the chemica! composition (cprJ of
each peak was used (see Figure 6-9).
.~· :::j o_..--o
/ :· / ·~ / AD,-A ,.,j / AD,-A ';;"li-S JU\ ·~ • ».~~ o-o Cl lUl 2U '---,.,-.,---"--.,--,---::-,.:---0 0.0 0.\ O.l 0.) O.A U U lU 0~ o.t UI OJI 0 .1 O.J CUI 0 -4 O.S o.l 0.1 lU U UI
·~ liUI cr--o
:1 D' /.--· :: /
• 0/0 . / AD,·A /
/ JU 0/ AD1-A ,. .. --·_...,r )1.4 /
)u • n.sL.o_-_o ______ _
OD O.t U O.l G.' U U D.7 0... o.t UI U ll.l o.J O.S 0A O..S 0.6 0.7 o.JI O.t 1.0
Figure 6-9, The chemica! composition dependency ofthe retendon compositton ofthe oligomers AD,-A with
different degree ofpolymerizatton (p} on thefractton ofTA ofthe RP-GPEC separatton obtalned with gradient A (see
Chapter4}.
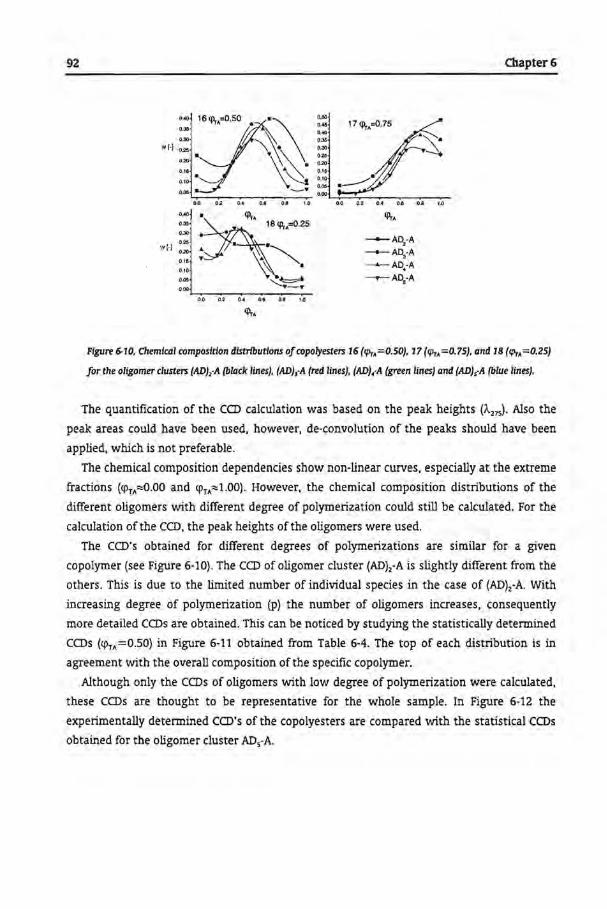
92 Chapter6
0.0 0..2 OA 0.0 0.8 1.0 o.o 0.2 o.A o.e o.s t.o
0-'0
·~~··'~ 0.00
0.30 . w(-(
0.2$
0.20 : ~. 0.16
0.10
0.00 '-~· MO ·-·
-AD2-A
-+-AD,-A --4--AD,-A
----?--- AD,-A
0.0 0.2 OA o .• a• 1.0
cp,..
Flgure 6-10, Chemica! compostdon distrtbutlons ofcopolyesters 16 (rp,..=O.SO), 17 (rp,-.=0.75), and 18 (rp,-.=0.25}
for the oligomer clusters {AD},-A (black lines), (AD},·A (red lines), (ADJ.-A (green !i nes) and {AD }s-A (blue llnes).
The quantification of the CCD calculation was based on the peak heights (À275). A!so the
peak areas could have been used, however, de-convolution of the peaks should have been
applled, which is not preferable.
The chemica! composition dependendes show non-llnear curves, especially at the extreme
fractions (<pTA::::O.OO and <llTA"'l.OO). However, the chemica! composition distributions of the
different allgomers with different degree of polymerization could still be calculated. For the
calculation of the CCD, the peak heights of the allgomers we re used.
The CCD's obtained for different degrees of polymerizations are similar for a given
copolymer (see Figure 6-10). The CCD of ollgomer cluster (AD)z-A is sllghtly different from the
others. This is due to the llmited number of individual species in the case of (AD)z-A. With
increasing degree of polymerization (p) the number of allgomers increases, consequently
more detailed CCDs are obtained. This can be noticed by studying the statistically determined
CCDs (<pTA =0.50) in Figure 6-11 obtained from Table 6-4. The top of each distri bution is in
agreement with the overall composition ofthe specific copolymer.
A!though only the CCDs of allgomers with low degree of polymerization were calculated,
these CCDs are thought to be representative for the whole sample. In Figure 6-12 the
experimentally determined CCD's of the copolyesters are compared with the statistica! CCDs
obtained for the ollgomer cluster AD5-A.
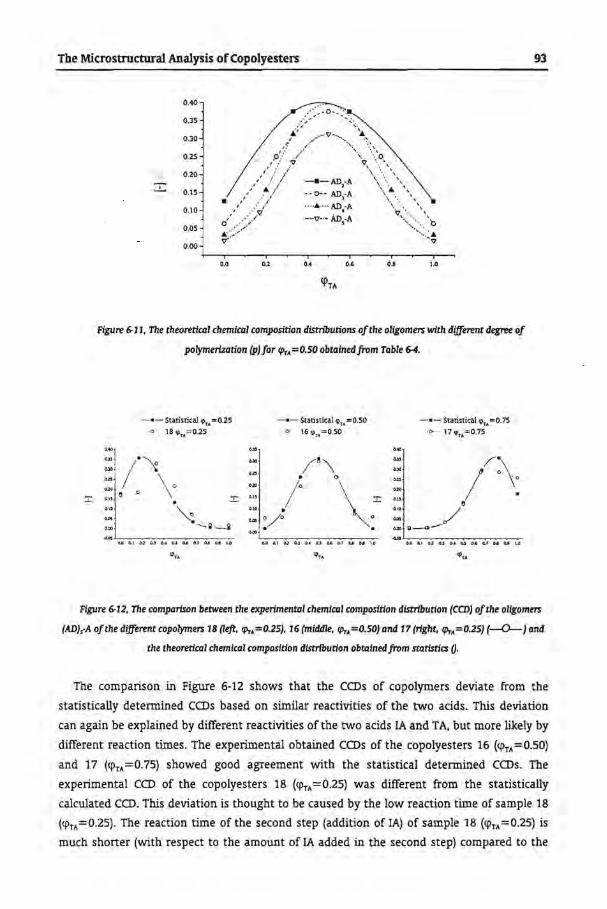
The Microstructural Analysis of Co polyesters
0.40
0.35
0.30
0.25
0.20
...!.... 0.15
0.10
0.05
0.00
0.0 02 0.6 o.e 1.0
<!>rA
Figure 6-11, The theoretica! chemica! composition distributtons ofthe oligomm with different degree of
polymerization (p)for fP..=o.so obtainedfrom Table 64.
-•-Statistica! ~1 ... =0.25 . 0 18 Cf', ... =0.25
. :J "'-~~g=-~
d.O 11.1 O.l Q.) O.t O.S 44 G.? 4U O.t 1.0
<~>,.
-•-Statistkal q~u. =0.50 ·· ·e> · 16q~u.=O.SO
0.0 0.1 0J: G.J U O.S o.6 0.1 4U OJ UI
-•- Statistica! <p111 =0. 75
0. ··· 17q>T.t.=0.75
93
Figure 6-12, The comparison between the expertmental chemica! composition distributton (CCD) ofthe oligomm
(AD}s-A ofthe different copolymers 18 (lejt. cp,..=0.25), 16 (middle, cp,..=O.SO) and 17 (right, cp,..=0.25) (--0-) and
the theoretica! chemica! composition distributton obtainedfrom statistles 0.
The comparison in Figure 6-12 shows that the CCDs of copolymers deviate from the
statistically determined CCDs based on similar reactivities of the two acids. This deviation
can again be explained by different reactivities ofthe two acids IA and TA, but more likely by
different reaction times. The experimental obtained CCDs of the copolyesters 16 (<p1"=0.50)
and 17 (<pr"=0.75) showed good agreement with the statistica! determined CCDs. The
experimental CCD of the copolyesters 18 (<t>r .. =0.25) was different from the statistically
calculated CCD. This deviation is thought to be caused by the low reaction time of sample 18
(<pr._=0.25). The reaction time of the second step (addition of IA) of sample 18 (<!>rA=0.25) is
rnuch shorter (with respect to the amount of IA added in the second step) cornpared to the
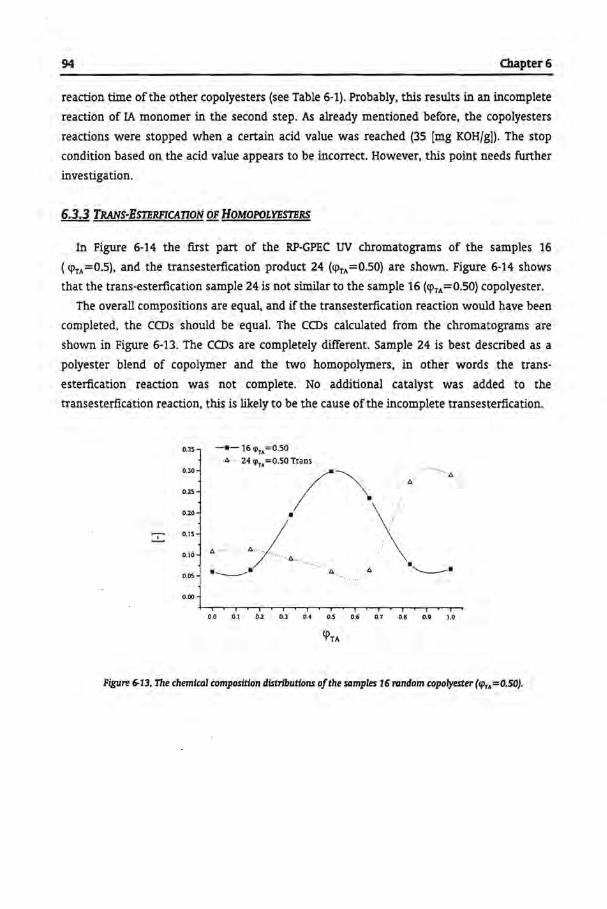
94 Chapter6
reaction time ofthe other copolyesters (see Table 6-1). Probably, this results in an incomplete
reaction of IA monomer in the second step. As already mentioned before, the copolyesters
reactions were stopped when a certain acid value was reached (35 [mg KOH/g]). The stop
condition based on the acid value appears to be incorrect. However, this point needs further
investigation.
6.3.3 TRANS-ESTERFICATION OF HOMOPOLYESTERS
In Figure 6-14 the fust part of the RP-GPEC W chromatograms of the samples 16
( q>rA=O.S), and the transesterfication product 24 (q>rA=O.SO) are shown. Figure 6-14 shows
that the trans-esterfkation sample 24 is notsimtlar to the sample 16 (q>rA=O.SO) copolyester.
The overall compositions are equal, and ifthe transesterfication reaction would have been
completed, the CCDs should be equal. The CCDs calculated from the chromatograms are
shown in Figure 6-13. The CCDs are completely different. Sample 24 is best described as a
polyester blend of copolymer and the two homopolymers, in other words the trans
esterfication reaction was not complete. No additional catalyst was added to the
transesterfication reaction, this is likely to be the cause ofthe incomplete transesterfication.
0.35 -·- 16 "'" =0.50
0.30
0.25
0.20
:I: 0.15
0.10
0.05
· • ,.,,.-oso/~ •/ • /;. ········ "'!·· ..... · \ ........... ..
·· ·· ···6...... _: • ·-------· ···· ........ "' . ·"' '-.__.......-•
0.00
<j)TA
Figure 6-13, The chemica! compositlon distributtons ofthe samples 16 rundom copalyester (rp.,. =0.50).
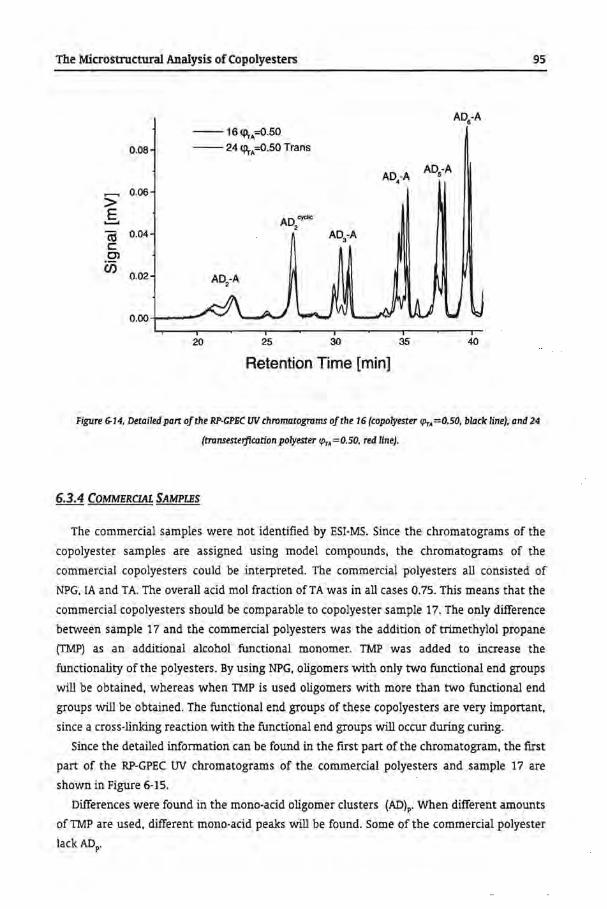
The Microstructural Analysis of Copolyesters 95
AD6-A --16(j),.A=Û.5Û
0.08 --24 <p,.A=0.50 Trans
AD4A AD5-A
> 0.06
E ADcycllc .......... 2
a3 0.04 AD3-A c 0)
èi5 0.02
0.00
20 25 30 35 40
Retention Time [min]
Figure 6-14, Detailed palt ofthe RP-CPEC UV chromatagmms ofthe 16 (copolyester cp,.. =0.50, black line), and 24
(transesterficotion polyester cp,.. =0.50, red line).
6.3.4 COMMERCIAL SAMPLES
The commercial samples were not identified by ESI·MS. Since the chromatograms of the
copalyester samples are assigned using model compounds, the chromatograms of the
commercial copolyesters could be interpreted. The commercial polyesters all consisted of
NPG, IA and TA. The overall acid mol fraction of TA was in all cases 0.75. This means that the
commercial copolyesters should be camparabie to copalyester sample 17. The only difference
between sample 17 and the commercial polyesters was the addition of trimethylol propane
(TMP) as an additional alcohol functional monomer. TMP was added to increase the
functionality ofthe polyesters. By using NPG, oligomers with only two functional end groups
will be obtained, whereas when TMP is used oligomers with more than two functional end
groups will be o btained. The functional end groups of these copolyesters are very important,
since a cross-linking reaction with the functional end groups will occur during curing.
Since the detailed information can be found in the first part of the chromatogram, the frrst
part of the RP-GPEC UV chromatograms of the commercial polyesters and sample 17 are
shown in Figure 6-15.
Differences were found in the mono-acid oligomer clusters (AD)p- When different amounts
of TMP are used, different mono-acid peaks will be found. Some of the commercial polyester
lackADP.
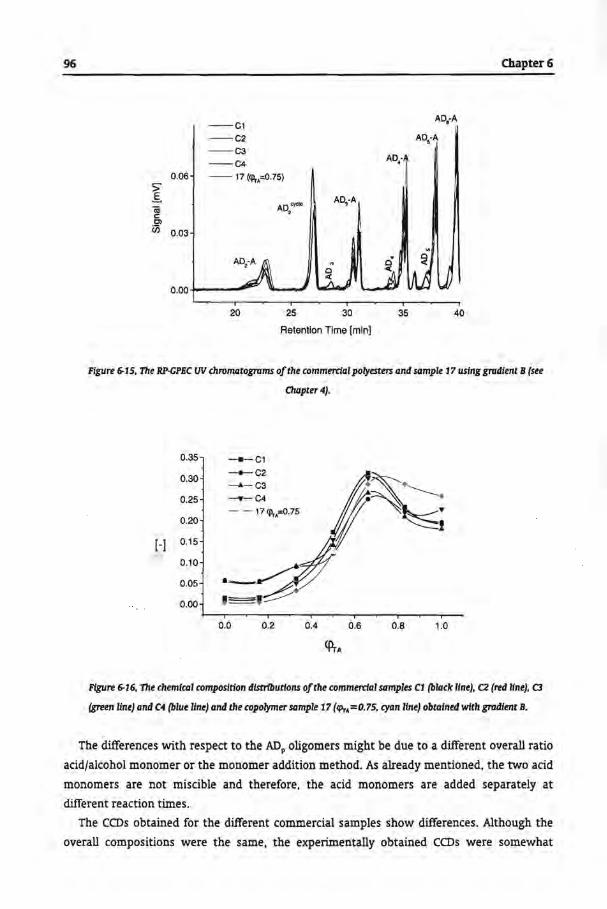
96
--C1 --C2 --C3 --C4
0.06 - - 17 (<p,.=0.75)
~ (ij c: •.
AD,"""' AO,-A
C)
Ü) 0.03
20 25 30
Retentien Time [min]
AD.-
35
AD,-A
AD,·A
40
Chapter6
Figure 6-15, The RP·CPEC UV chromatagmms ofthe cammerdal polyesters and sample 17 uslng grudlent B (see
Chapter4}.
0.35 --c1
0.30 - •-C2
~~ -.&- C3
0.25 -'f'-C4
0.20 - - 17 <p,.=0.75
[-] 0.15
0.10
0.05 • 0.00 '==='-::::::::--
0.0 0.2 0.4 0.6 0.8 1.0
Cj\.A
Ftgure 6-16, The chemica! composltion distributtons ofthe commercial samples Cl (blaclc llne), C2 (red llne), C3
(green line} and C4 (blue llne} and the copolymer sample 17 (~p,. = 0. 75, cyan llne} obtalned with grudlent B.
The differences with respect to the ADP oligomers might be due to a different overall ratio
acid/alcohol monomer or the monomer addition method. As already mentioned, the two add
monomers are not miscible and therefore, the acid monomers are added separately at
different reaction times.
The CCDs obtained for the different commercial samples show differences. Although the
overall compositions were the same, the experimentally obtained CCDs were somewhat
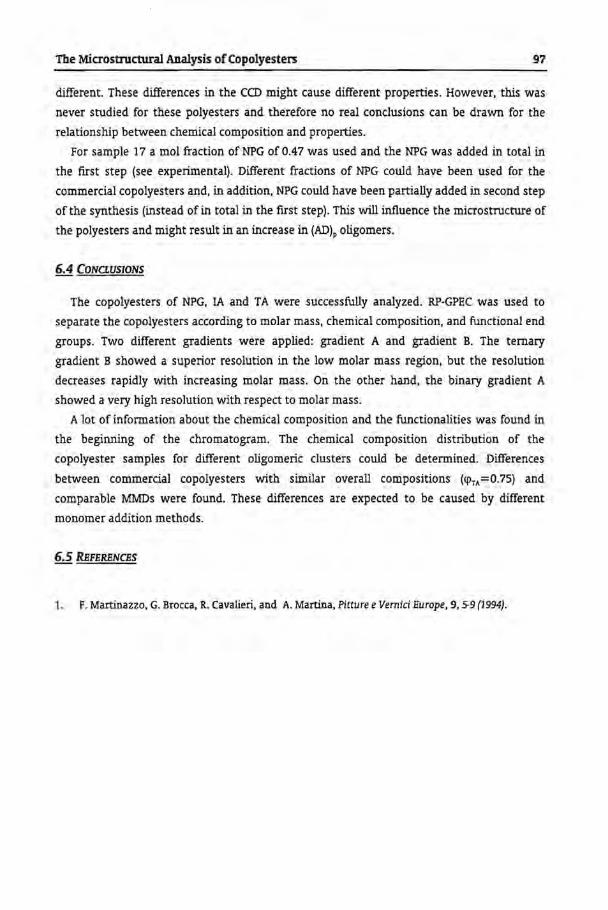
The Microstructural Analysis of Copolyesters 97
different. These ditierences in the CCD might cause different properties. However, this was
never studied for these polyesters and therefore no real conclusions can be drawn for the
relationship between chemica! composition and properties.
For sample 17 a mol fraction of NPG of 0.47 was used and the NPG was added in total in
the first step (see experimental). Different fractions of NPG could have been used for the
commercial copolyesters and, in addition, NPG could have been partially added in second step
of the synthesis (instead of in total in the f!Ist step). This will influence the microstructure of
the polyesters and might result in an increase in (AD)p oligomers.
6.4 CONCLUSIONS
The copolyesters of NPG, IA and TA were successfully analyzed. RP·GPEC was used to
separate the copolyesters according to molar mass, chemica! composition, and functional end
groups. Two different gradients were applied: gradient A and gradient B. The temary
gradient B showed a superior resolution in the low molar mass region, but the resolution
decreases rapidly with increasing molar mass. On the other hand, the binary gradient A
showed a very high resolution with respect to molar mass.
A lot of information a bout the chemica! composition and the functionalities was found in
the beginning of the chromatogram. The chemica! composition distribution of the
copalyester samples for different oligomeric clusters could be determined. Ditierences
between commercial copolyesters with similar overall compositions (q>TA=0.75) and
comparable MMDs were found. These ditierences are expected to be caused by different
monoroer addition methods.
6.5 RiFERENCES
1. F. Martinazzo, G. Brocca, R. Cavalieri, and A. Martina, Pitture e Vemici Europe, 9, 5-9 (1994).

Characterization ofBlock Copolymers by GPEC 99
Chapter 7
Characterization ofBlock Copolymers by Gradient Polymer Blution Chromatography
(GPEC)
The characterization of different types ofblock copolymers is described in this chapter. The block copolymers studied were obtained by anionic polymerization and by two step free radical polymerization. Gradient polymer elution chromatography (GPEC) was applied to characterize the block copolymers. Two gradients were applied, a reversed phase gradient and a normal phase gradient. By using the two gradients, quantitative information on the amount of homopolymer present in the block copolymer sample was obtained.

100 Chapter7
7.1 INTRODUITION TO BLOCK COPOLYMERS
Block copolymers can consist of two or more blocks, each consisting of a different type of
monomer. The block copolymers described in this chapter, all consist of two monomers. They
are synthesized by multi step copolymerizations: 1) the synthesis of functional precursor of
monomer A molecules, and 2) the formation of a bleek copolymer A-B [1]. In the fust step, a
precursor molecule is formed consisting only of monomer A. This precursor molecule has
functional groups, on which, in the second synthesis step, the other block can grow. The
precursor molecule can have one or more functional groups depending on the· desired type of
block copolymer.
1'1 Step:
2"d Step:
Initiator + Monomer A
A. + Monomer B
__ __..., A.
---111>• A.-Bm
Figure 7· J. Reaction scheme of a two step block copolymerlzation.
In the second step the functional groups can be 'initiated' in different ways depending on
the functional group(s). The functional groups have to be activated by thermal initiatien or
initiatien by UV light in order to obtain chemically bonded blocks. By adding monomer B, the
block copolymer A-B is formed.
The functional group can also be a 'living' species. For instance, in anionic polymerization
it might be the anionic initiator (2,3], which is still active, in atom transfer radkal
polymerization (ATRP) the 'functional' group is a halide which can be reversibly homolytically
split of the chain via metal catalysis (4,5,6], and with controlled radkal polymerization (CRP)
the polymer molecules are reversibly trapped with nitroxides [7,8,9]. The latter
polymerization techniques (anionic, ATRP, and CRP) are called living polymerization
techniques, which means that the polymer molecules are 'alive' and all the polymer
molecules are active during the polymerization. The monomers are added gradual in time,
and the polymer molecules will grow further until the monoroer is consumed completely or
until the living species are deactivated. When living polymerization techniques are used, the
second step starts when monomer A is consumed completely. The block copolymer is formed
by adding monomer B.
nepending on the functional group of the precursor, different types of block copolymers
occur (see Figure 7-2): di-block, tri-block, branched, star, etc. The block copolymers studied in
this chapter are of the types di-block and tri-block.
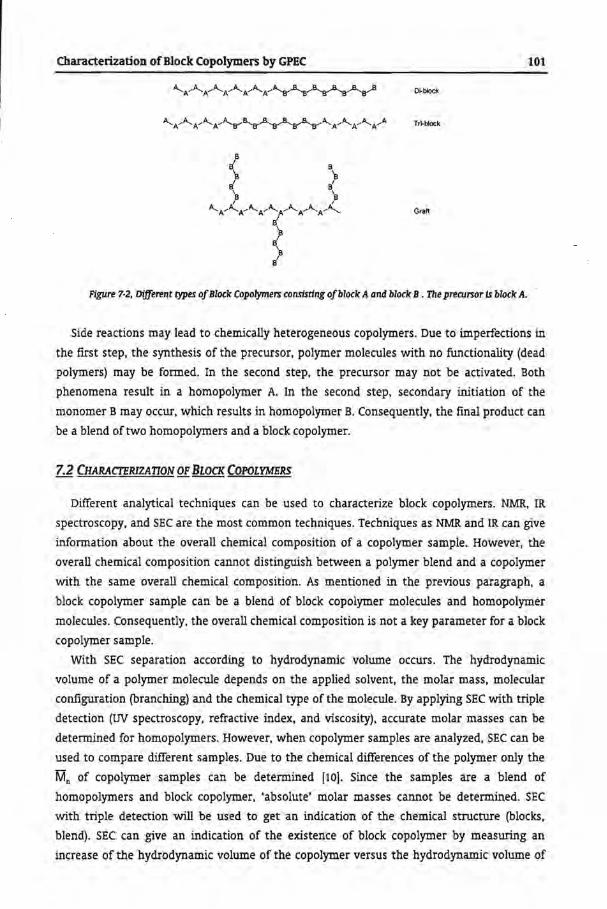
Characterization ofBlock Copolymers by GPEC 101
Di-blad<
Trl-block
Graft
Figure 7-2, Different types ofBlock Copolymers consisring ofblock A and block B. The precursor Is block A.
Side reactions may lead to chemically heterogeneaus copolymers. Due to imperfections in
the first step, the synthesis of the precursor, polymer molecules with no functionality (dead
polymers) may be formed. In the secend step, the precursor may net be activated. Both
phenomena result in a homopolymer A. In the secend step, secondary initiatien of the
monoroer B may occur, which results in homopolymer B. Consequently, the fmal product can
be a blend of two homopolymers and a block copolymer.
7.2 CHARAITERIZATION OF BLOCK COPOLYMERS
Different analytica! techniques can be used to characterize block copolymers. NMR, IR
spectroscopy, and SEC are the most common techniques. Techniques as NMR and IR can give
information about the overall chemica! composition of a copolymer sample. However, the
overall chemica! composition cannot distinguish between a polymer blend and a copolymer
with the same overall chemica! composition. As mentioned in the previous paragraph, a
block copolymer sample can be a blend of bleek copolymer molecules and homopolymer
molecules. Consequently, the overall chemica! composition is net a key parameter for a block
copolymer sample.
With SEC separation according to hydrodynamic volume occurs. The hydrodynamic
volume of a polymer molecule depends on the applied solvent, the molar mass, molecular
contiguration (branching) and the chemica! type of the molecule. By applying SEC with triple
detection (W spectroscopy, refractive index, and viscosity). accurate molar masses can be
determined for homopolymers. However, when copolymer samples are analyzed, SEC can be
used to cernpare different samples. Due to the chemica! differences of the polymer only the
Mn of copolymer samples can be determined [10). Since the samples are a blend of
homopolymers and bleek copolymer, 'absolute' molar masses cannot be determined. SEC
with triple detection will be used to get an indication of the chemica! structure (bleeks,
blend). SEC can give an indication of the existence of bleek copolymer by measuring an
increase of the hydrodynamic volume of the copolymer versus the hydrodynamic volume of

102 Chapter 7
the precursor. When the second monomer is polymerized on the precursor, the
hydrodynamic volume of the precursor molecules will increase, and therefore the
hydrodynamic volume of the final product will increase. This increase must be visible in the
SEC chromatograms. However, also homopolymer B can be formed in the second step (see
Figure 7-1). This additional homopolymer can also cause an increase in hydrodynamic volume
of the final product. SEC can, therefore, not be used to give proof for the existence of block
copolymer. By using two concentratien detectors, such as a UV detector and a differentlal
refractive index detector, a better indication can be obtained. As an example, in Figure 7-3,
the SEC chromatograms are shown of a polystyrenefpolymethyl metllacrylate block
copolymer and its polystyrene precursor [11]. The block copolymer was synthesized via a two
step free radkal copolymerization with di(methoxy-xanthogen) disulfide [12).
In the RI signa! the contribution of the two segments, polystyrene and polymethyl
methacrylate, can be seen. Homopolymer methyl methacrylate (PMMA) is only detected by
the RI detector (3, blue line). The polymer blend (4, black line) shows two peaks in the RI
signa! and only one in the UV, since PMMA is not detectable by UV. The comparison ofthe UV
chromatograms of the precursor and the block copolymer shows that a shoulder appears on
the precursor peak (compare 1 and 2). The UV signa! only shows the styrene segments. So, if
a shoulder appears in the UV chromatogram, this shoulder must contain styrene units.
Hence, the shoulder in Figure 7-3 (2) must be block copolymer. Since no styrene monoroer
was present any longer, block copolymer molecules must be formed. The shoulder can also be
seen in the RI chromatograms ofthe block copolymer. In this case, SEC can be used to obtain
an verification of the presence of block copolymer. But when solely non-chromophoric
components are applied, SEC is not applicable as reliable characterization method.
uv
3
Figure 7·3, UV (À2..} and RI SEC chromatograms of precursor polystyrene (1, red lines), block copolymer
styrenefmethyl methacrylate (2, green lines), homopolymer methyl methacrylate (3, blue lines), and a polymer blend of
the precursor polystyrene and the homopolymer methyl methacrylate (4. black lines) [11}.

Characterization ofBlock Copolymers by GPEC 103
7.3 CHARACTERIZATION OF BLOCK COPOLYMERS BY GPEC
In the literature the characterization of block copolymers by gradient elution HPLC is
seldom descri bed. Glöckner et al. (13,14) compared the elution behavier of random copolymers
and block copolymers. Augenstein et al. (15) described the separation of decyl methacrylate/
methyl methacrylate block copolymers obtained with group transfer polymerization. The
experiments described in this chapter are based on the experiments described by Augenstein
et al ..
With GPEC, polymers can be separated according to chemica! composition. Reversed phase
(polar solvent/non-polar column) and normal phase (non-polar solvent/ polar column) GPEC
can be applied to obtain two independent separatieris according to polarityjchemical
composition.
For the characterization of polymers by HPLC, well-defmed standards have to be used to
describe, verify, and validate the separation. Other analytica! techniques, such as mass
spectroscopy, can be used to identify the separated components. However, no other
analytica! method than GPEC can distinguish between a blend of two homopolymers and a
block copolymer with similar overall chemica! composition.
The defmition of a standard is very difficult, since no other techniques can prove existence
of block copolymer or verify the value of the standard. However, the block copolymer
samples obtained by 'controlled' block copolymerizations could be considered as standards.
Polymerization methods, such as anionic polymerization (3] and atom transfer radical
polymerization (ATRP) [6] thus could be applied to obtain block copolymers suitable for
standardization. Anionic polymerization and ATRP are 'living' techniques, which can be
applied to synthesize polymers with a specific molar mass. By using controlled
polymerization techniques, homopolymers with a narrow MMD (4], and copolymers with
narrow MMD and narrow CCD can be obtained.
7.4 STRATEGY
Based on the fact that block copolymers can be separated from the respective
homopolymers [15], the following strategy has been developed in order to characterize block
copolymers. Two separate gradients will be used to separate the homopolymers from the
block copolymer. The separation of homopolymer and block copolymer is shown
schematically in Figure 7-4.
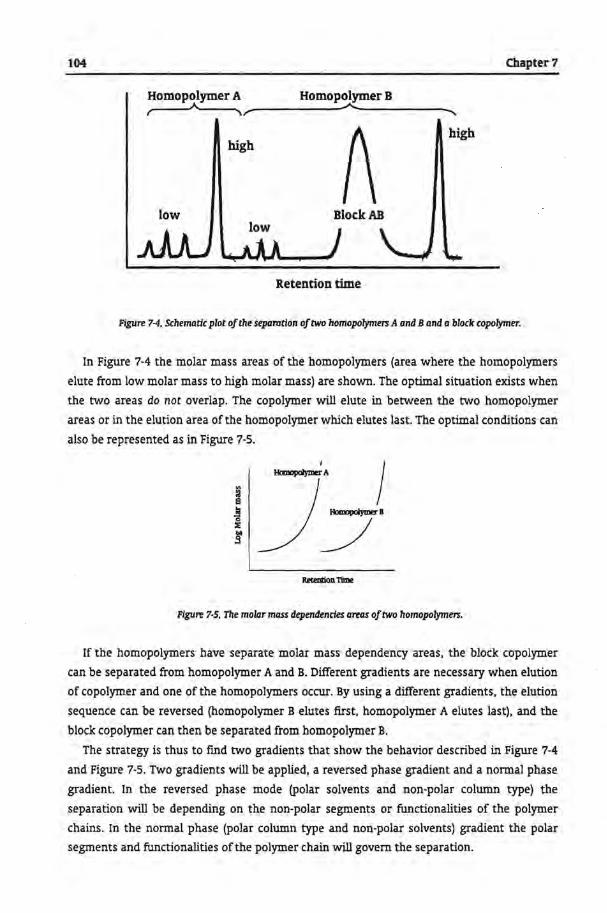
104 Chapter7
Homopolymer A Homopolymer B r A ,,_-----------'·~----------~
high {\ high
low BlockAB
Retention time
Figure 7-4, Schematic plot ofthe separation oftwo homopolymers A and Band a block copolymer.
In Figure 7-4 the molar mass areas of the homopolymers (area where the homopolymers
elute from low molar mass to high molar mass) are shown. The optimal situation exists when
the two areas do not overlap. The copolymer will elute in between the two homopolymer
are as or in the elution area of the homopolymer which elutes last. The optima! conditions can
also be represented as in Figure 7-5.
~DTime
Figure 7·5. The molar mass dependendes areas oftwo homopolymen.
If the homopolymers have separate molar mass dependency areas, the block copolymer
can be separated from homopolymer A and B. Different gradients are necessary when elution
of copolyrner and one of the homopolymers occur. By using a different gradients, the elution
sequence can be reversed (homopolymer B elutes first, homopolymer A elutes last), and the
block copolymer canthen be separated from homopolymer B.
The strategy is thus to fmd two gradients that show the behavior described in Figure 7-4
and Figure 7-5. Two gradients will be applied, a reversed phase gradient and a normal phase
gradient. In the reversed phase mode (polar solvents and non-polar column type) the
separation will be depending on the non-polar segments or functionalities of the polymer
chains. In the normal phase (polar column type and non-polar solvents) gradient the polar
segments and functionalities ofthe polymer chain will govem the separation.

Characterization ofBlock Copolymers by GPEC 105
GradientA GradientB
Retention time Retention time
Flgure 7-6, Schematic plot ofthe separation ofblock copolymer and homopalymer.
The separations of the two gradients are shown schematically in Figure 7-6. In gradient A,
homopolymer A is separated from homopolymer B and the block copolymer. In gradient B,
homopolymer B is separated from homopolymer A and the block copolymer. Consequently,
quantitative information about the ratio homopolymer A/B and block copolymer can be
obtained by applying the two gradients.
7.5 EXPERIMENTAL
7.5.1 BLOCK COPOLYMER SAMPLES
Different block copolymer samples were used: block copolymers synthesized by a two step
anionic polymerization, and block copolymers produced by a two step radical polymerization.
In the first step of the block copolymerizations, a precursor polymer A was synthesized, and
in the second step, a new block B was formed. In order to find the optima! conditions, and to
validate the separation, the homopolymers of the block copolymers were used. The
homopolymers were SEC standards, and were well defined.
7.5.2 FREE·RADICALLY l'REPARED BLOCK COPOLYMERS
The samples used in this study can be found in Table 7-L
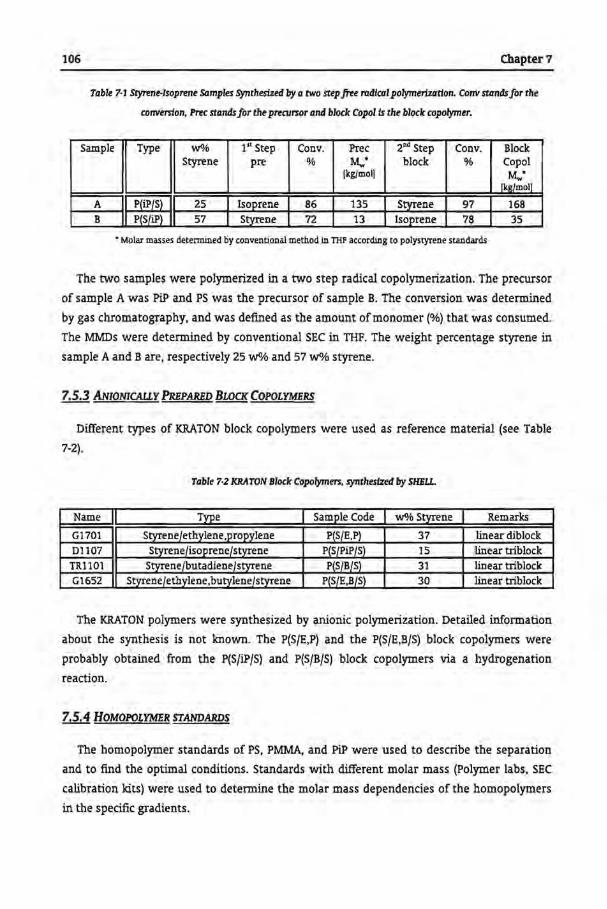
106 Chapter7
Table 7-l Styrene-Isoprene Samples Synthestzed by a two step .{ree radtwl polymertzatlon. Conv stands for the
converston, Pree stands for the precursor and block Copolts the block copolymer.
Sample Type w% 1" Step Conv. Pree 2"d Step Conv. Block Styrene pre % M/ block % Copol
(kg/mol] Mw. (kg/mol]
A P(iP/S) 25 Isoprene 86 135 Styrene 97 168 B P(S/iP) 57 Styrene 72 13 Isoprene 7~ 35
• Molar masses detennined by conventional method in THP according to polystyrene standards
The two samples were polymerized in a two step radkal copolymerization. The precursor
of sample A was PiP and PS was the precursor of sample B. The conversion was determined
by gas chromatography, and was defined as the amount ofmonomer (%) that was consumed.
The MMDs were determined by conventional SEC in THF. The weight percentage styrene in
sample A and B are, respectively 25 WOA> and 57 w% styrene.
7.5.3 ANIONICALLY PREPARED BLOCK COPOLYMERS
Different types of KRATON block copolymers were used as reference material (see Table
7-2).
Table 7·2 KRATON Block Copolymers. syntheslzed by SHEIJ..
Name Typ_e Sam_ple Code w%Styrene Rem_arks
G1701 Styrenejethylene,propylene P(S/E,P) 37 linear diblock 01107 Styrenejisoprenejstyrene P(S/PiP/S) 15 i!inear triblock TR1101 Styrenejbutadienejstyrene P(S/B/S) 31 linear triblock G1652 SD'renefethylene,butylenejstyrene P(S/E,B/S) 30 linear triblock
The KRATON polymers were synthesized by anionic polymerization. Detailed information
about the synthesis is not known. The P(S/E,P) and the P(S/E,B/S) block copolymers were
probably obtained from the P(S/iP/S) and P(S/B/S) block copolymers via a hydragenation
reaction.
7.5.4 HOMOPOLYMER STANDARDS
The homopolymer standards of PS, PMMA, and PiP were used to describe the separation
and to find the optima! conditions. Standards with different molar mass {Polymer labs, SEC
calibration kits) were used to determine the molar mass dependendes of the homopolymers
in the specific gradients.

Characterization of Block Copolymers by GPEC 107
7.5.5 SIZE EXCLUSION CHROMATOGRAPHY
The SEC experiments were performed with a Kratos Spectraflow 400n solvent delivery
system, a Separations UV detector (254nm), a Waters 410 DRI detector, a Viscotek Model 100
DP detector, and a Separation Marathon autosampler. The flow was 0.8 miJmin of
tetrahydrofuran (THF) with 0.02 v% acetic acid (HAc). The column used was a Polymer Labs
mixed-D 50 cm (temperature 30°Q. The polymer samples were dissolved in THF + 0.02 VOA:l
HAc at different concentrations (± 1 mgjml). The system was calibrated by polystyrene SEC
standards of Polymer Labs (SEC calibration kit).
7.5.6 REVERSED PHAsE GPEC
The gradient commonly used for RP-GPEC is shown in Table 7-3. The initial conditions
were waterfACN (50: 50 vol%) pre-mixed in order to prevent mixing problems of the water
and ACN in the pump.
Table 7-3 RP-GPHC Gradient.
Step Time o/o water/ACN (1:1) o/o ACN o/o THF Flowmi/min
1 Initia! 100 0 0 0.5 2 5 0 100 0 0.5 3 10 0 70 30 0.5 4 80 0 0 100 0.5
5 83 0 0 100 0.5 6 85 100 0 0 0.5
In the different experiments the steps 2 and 3 of the gradient might vary in time and
solvent compositions. However, the gradient speed was kept constant in step 4 (at 1 % per
minute). Also the initia! conditions, the end conditions and the condition steps (2, 3 and 5)
were not varied. The additional conditions for RP-GPEC were a Symmetry C18 15cm (Waters)
column at 30°C, THF (not stabilized, Merck, HPLC grade), ACN (Merck), Water (MilliQ,
Millipore), Varian 9010 solvent delivery system, UV 785A Separations detector (260nm), ELSD
(Polymer Labs PL-EMD 960, N2-flow 5.0mlfmin, temp 70°Q, autosampler (Separations, Basic
Marathon).
In Table 7-4 the gradient used for NP-GPEC is shown.
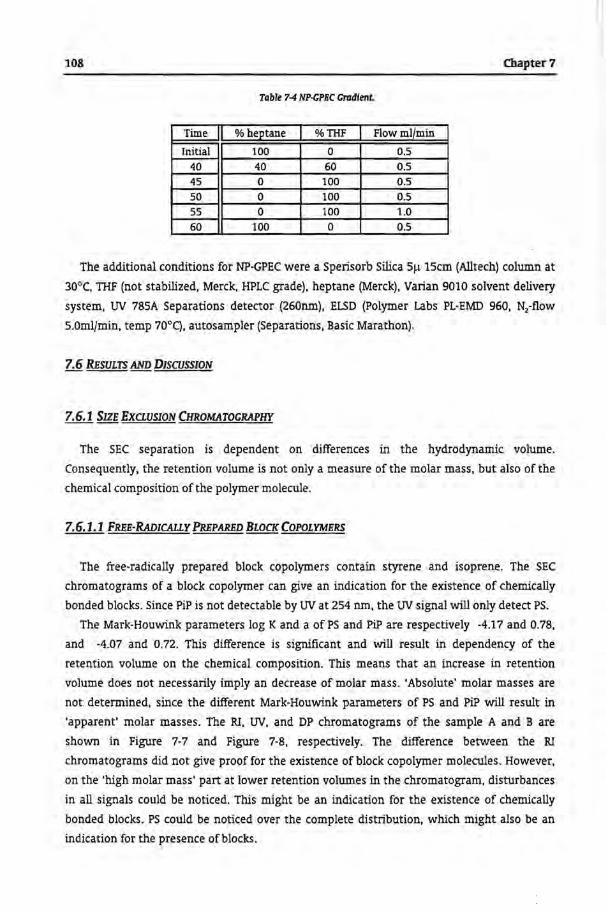
108 Chapter7
Table 7-4 NP·GPEC Grrrdient.
Time % h~tane %THF FlowmiJmin
Initia! 100 0 0.5 40 40 60 0.5 45 0 100 0.5 50 0 100 0.5 55 0 100 1.0 60 100 0 0.5
The additional conditions for NP-GPEC were a Sperisorb Silica SJ-i 1Scm (Alltech) column at
30°C, THF (not stabilized, Merck, HPLC grade), heptane (Merck), Varian 9010 solvent delivery
system, UV 78SA Separations detector (260nm), ELSD (Polymer Labs PL-EMD 960, N2-flow
S.Omlfmin, temp 70°C), autosampler (Separations, Basic Marathon).
7.6 RESULTS AND DISCUSSION
7.6.1 SIZE EXCI.USION CHROMATOGRAPHY
The SEC separation is dependent on differences in the hydrodynamic volume.
Consequently, the retention volume is not only a measure of the molar mass, but also of the
chemica! composition ofthe polymer molecule.
7.6.1.1 FREE·RADICALLY PREPARED BLOCK COPOLYMERS
The free-radically prepared block copolymers contain styrene and isoprene. The SEC
chromatograms of a block copolymer can give an indication for the existence of chemically
bonded blocks. Since PiP is not detectable by UV at 254 nm, the UV signal will only detect PS.
The Mark-Houwink parameters log K and a of PS and PiP are respectively -4.17 and 0.78,
and -4.07 and 0.72. This difference is significant and will result in dependency of the
retention volume on the chemica! composition. This means that an increase in retention
volume does not necessarily imply an decrease of molar mass. 'Absolute' molar masses are
not determined, since the different Mark-Houwink parameters of PS and PiP will result in
'apparent' molar masses. The RI, UV, and DP chromatograms of the sample A and B are
shown in Figure 7-7 and Figure 7-8, respectively. The difference between the RI
chromatograms did not give proof for the existence of block copolymer molecules. However,
on the 'high molar mass' part at lower retention volumes in the chromatogram, disturbances
in all signals could be noticed. This might be an indication for the existence of chemically
bonded blocks. PS could be noticed over the complete distribution, which might also be an
indication for the presence ofblocks.

Characterization of Block Copolymers by GPEC 109
The UV chromatagram of sample B revealed most of the information. When the two
chromatograms of the precursor PS and the block copolymer sample are identical, no
chemically bonded block exists. If chemically bonded blocks of PS and PiP exist, two different
chromatograms should be obtained. The UV chromatograms showed that at lower retention
(larger hydrodynamic volume) PS eluted. Since the precursor cannot react any further with
styrene, this indicates the presence of block copolymer. The shift, which can be seen in the
UV chromatograms, can also be noticed in the other chromatograms {DP and RI). However,
Figure 7-8 is more informative than Figure 7-7 .. The precursor PS was still present in the
block copolymer. Apparently, nat all of the precursor molecules have reacted. With GPEC the
presence of free PS can be confirmed. The calculated data from the SEC measurements are
shown in Table 7-5. The data are calculated via the universa! calibration metbod (UQ.
-Prt-cunorPU'W ······!locktopolymn-A uv
./\ j \ ' '. / \
.i \ 'I
r'' ·... ! ~ ; V f '"-._! . .
- PrtcunorPiP W ·· ··· · llodtmpolymtrA RI
i lU
i "··.
DP
~ltntiODYCIUJ:Defml)
Figure 7-7 SHC chromarogmms (UV, RI, and DP) of sample A precursor PiP{-) and block copolymer A PiP/PS(-).
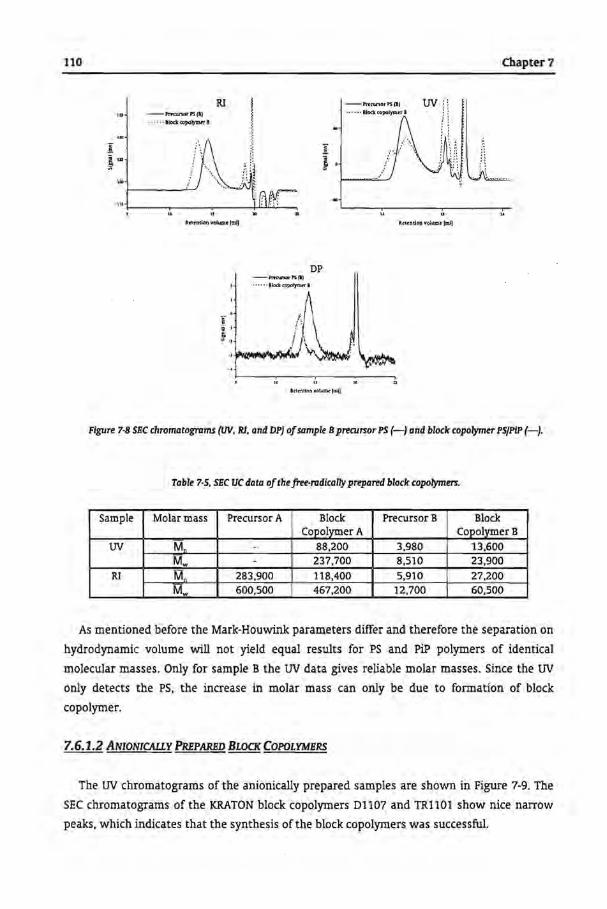
110
--PS(I)
· · · ···llodt oopolymff a
RI
lrttntion volume (miJ
DP -~rPS(J)
• · •••· llodr:: ccpotym.T I
RtltnltOD YOiumt (mij
- PROlMOr PS (I)
······ Biodr: copolymnl
~eundoa voh.1m•lmll
Chapter7
Figure 7-8 SEC chromatograms {UV, RJ, and DP) of sample B precursor PS (-) and block copolymer PSJPIP (-).
Table 7-5, SEC UC data ofthefree·rudically prepared block copolymers.
Sample Molar mass Precursor A Block Precursor B Block Copolymer A CopolymerB
uv Mn - 88,200 3,980 13,600
Mw - 237,700 8 ,510 23,900 RI Mn 283,900 118,400 5,910 27,200
Mw 600,500 467,200 12,700 60,500
As mentioned before the Mark-Houwink parameters differ and therefore the separation on
hydrodynamic volume will not yield equal results for PS and PiP polymers of identical
molecular masses. Only for sample B the UV data gives reliable molar masses. Since the UV
only detects the PS, the increase in molar mass can only be due to formation of block
copolymer.
7.6.1.2 ANIONICAll.Y PREPARED BLOCK COPOLYMERS
The UV chromatograms of the anionically prepared samples are shown in Figure 7-9. The
SEC chromatograms of the KRATON block copolym.ers 01107 and TR1101 show nice narrow
peaks, which indicates that the synthesis ofthe block copolymers was successful.
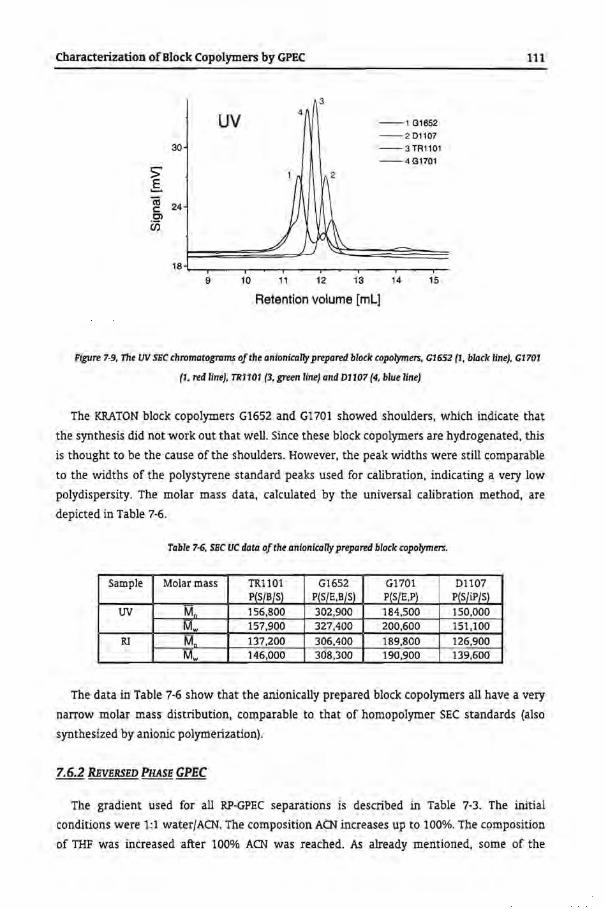
Characterization ofBlock Copolymers by GPEC
> .s
30
~ 24 Cl
ëï5
9
uv
10 11
3
--1 G1652 --201107 --3TR1101
--4G1701
12 13 14 15
Ratention volume [mL]
111
Figure 7-9, The UV SEC chromatagmms ofthe anionically prepared block copolymers, G1652 (1, black llne), G1701
(1, red line), TR1101 (3, green line) and D1107 (4, blue line)
The KRATON bleek copolymers G1652 and G1701 showed shoulders, which indicate that
the synthesis did notworkout that well. Since these bleek copolymers are hydrogenated, this
is thought to be the cause of the shoulders. However, the peak widths were still camparabie
to the widths of the polystyrene standard peaks used for calibration, indicating a very low
polydispersity. The molar mass data, calculated by the universa! calibration method, are
depicted in Table 7-6.
Table 7·6, SEC UC data of the anionlcally prepared block copolymers.
Sample Molar mass TR1101 G1652 G1701 01107 P(S/B/S) P(S/E,B/S) P(S/E,P) P(S/iP/S)
uv M. 156,800 302,900 184,500 150,000
Mw 157,900 327,400 200,600 151,100
Rl M. 137,200 306,400 189,800 126,900
Mw 146,000 308,300 190,900 139,600
The data in Table 7-6 show that the anionically prepared block copolymers all have a very
narrow molar mass distribution, camparabie to that of homopolymer SEC standards (also
synthesized by anionic polymerization).
7.6.2 REVERSED PHASE GPEC
The gradient used for all RP-GPEC separations is described in Table 7-3. The initia!
conditions were 1:1 waterfACN. The composition ACN increases up to 100%. The composition
of THF was increased after 100% ACN was reached. As already mentioned, some of the

112 Chapter7
experiments were carried out with different gradient steps. As a consequence the
chromatograms cannot be compared directly, therefore, the retentien times of the
chromatograms were all converted to percentage THF at the time of elution. For the
calculation from retentien time to volume fraction of THF (q>Tl!f in percent) Equation 2-11
(Chapter 2) was used.
7.6.2.1 FREE-RADICALLY PREPARBD BLOCK (OPOLYMERS
With RP-GPEC the homopolymer PS can be separated from the homopolymer PiP and the
block copolymer. The molar mass dependendes of PS and PiP in the RP-GPEC gradient are
shown in Figure 7-10. The symbols represent the elution composition ofthe p~aks of different
PS SEC standards.
-o-Pil' •• -•-PS • 7D I • u I
J 6.0 • oi •• I
::E 5D } .. !l u
4D
.____---/ ,. lD ,.
10 .. ]0 .. .. .. .. .. .. 100
%Tl!f
Pigure 7·10, Molar mass dependency of PS(· .. ) and PIP(-o-)for rhe RP·CPEC sepamrton in waterfACNfTHP gradienr
and symmmy C1B column.
From Figure 7-10, it can beseen that the molar mass dependendes of PS and PiP standards
did not overlap in the RP-GPEC system. Nevertheless, the eligomers of PiP (Mw < 1,000 gfmol)
eluted simultaneously with the high molar masses of PS. Since the block copolymers P(S/iP)
have higher molar masses, this overlap will not cause problems (see Table 7-5). The RP
gradient (see Table 7-3) is suitable for the separation of PS/PiP copolymers. An elution
difference of THF of about 25% was obtained, which is appropriate to characterize
copolymers. After 50% THF no PS molecules will elute anymore, unless the segments are
chemically bonded, like in a copolymer. Copolymer molecules elute in between the two
elution limits ofthe homopolymers.
With the RP-GPEC gradient the block copolymer will be separated from the homopolymer
PS, however, the block copolymer will elute simultaneously with the PiP homopolymer, if
present. Styrene segments are detected by the UV detector (J...=254nm) and the ELSD.
Isoprene segments will only be detected by the ELSD. Consequently, if the UV signa! shows
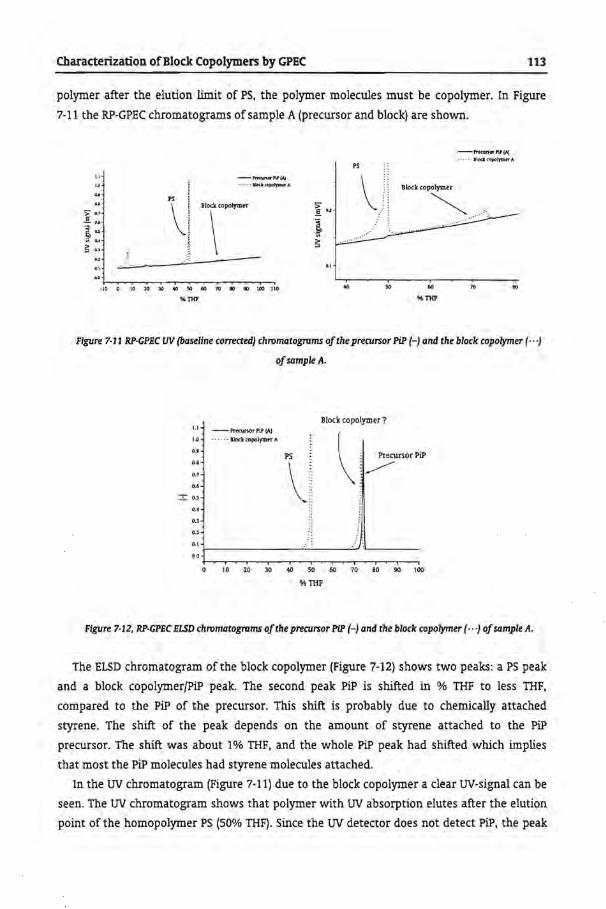
Characterization of Block Copolymers by GPEC 113
polymer after the elution limit of PS, the polymer molecules must be copolymer. In Figure
7-11 the RP-GPEC chromatograms of sample A (precursor and block) are shown.
' PS ~ \_I Block copo~or
i \ ~~----~:: ________ _
·10 0 10 20 lO 40 50 60 70 10 90 100 110
%TIIF
.. 50 60
%THP
70 ..
Ftgure 7·11 RP·CPEC UV (baseline corrected) chromatogroms ofthe precursor PiP {-) and the block copolymer ( · · ·)
of sample A.
1.\ -Pr«\ln()r PîPW
1.0 • · · · · l lock copolym~tr A
0.9
0.1
0.7
0.6
:::!: os
0.4
Block copolymer 7
l : Precursor PiP
\ ~~
: ! ~ j ' r-------------~----~~------
0 10 20 30 40 50 60 70 80 90 100
%THF
Ftgure 7·12, RP·CPEC ELSD chromatogroms ofthe precursor PiP (-) and the block copolymer ( · · ·} of sample A.
The ELSD chromatagram ofthe block copolymer (Figure 7-12) shows two peaks: a PS peak
and a block copolymerfPiP peak. The second peak PiP is shifted in % THF to less THF,
compared to the PiP of the precursor. This shift is probably due to chemically attached
styrene. The shift of the peak depends on the amount of styrene attached to the PiP
precursor. The shift was about 1% THF, and the whole PiP peak had shifted which implies
that most the PiP molecules had styrene molecules attached.
In the UV chromatagram (Figure 7-11) due to the block copolymer a clear UV-signa! can be
seen. The UV chromatagram shows that polymer with UV absorption elutes after the elution
point of the homopolymer PS (50% THF). Since the UV detector does not detect PiP, the peak

114 Chapter7
can only be styrene units attached to PiP. This together with the shift of the PiP peak gives
the proof ofthe existence ofblock copolymer.
Although block copolymer molecules exist in sample A, a large amount of free PS can be
observed. The UV area ofthe PS peak is 90% and the UV area ofthe bounded styrene in block
copolymer is 10%. Consequently, in the second step (frrst step precursor PiP) 90% of the
reacted styrene is present as free homopolymer PS and only 10 o/o ofthe consumed styrene is
attached to the precursor PiP.
In Figure 7-13 the RP-GPEC UV (baseline corrected) and ELSD chromatograms of sample B
are shown. The chromatograms show two peaks: a PS peak from the precursor and a block
copolymerfPiP peak. The chromatograms ofthe precursor are not shown, since they show the
PS peak (same position but different height) as can be seen in the block copolymer.
0.05
0.04
0.03
--;; 0.02
.~ V>
0.01
0.00
.0.01
. .. ..... ELSD
--uv . [; PiP + Block ;:
.. . .
.......... -............... -
0.125
0.120
0.115
0.110
0.105
0.100
0.095
+-~,.---,....u,~--,-~-..~-r-~.....-~,......,--.~--,-~-1 0.090 w ~ ~ w ~ w ~ ~ ~ ~
%THF
Figure 7·13. RP-GPliC UV (baseline corncted} and liLSD chromatagrum of sample B P{SfiP).
The UV chromatogram shows that isoprene had reacted with the PS precursor. The ratio of
the PS peak and the block copolymer peak in the UV signa! are approximately equal. This
implies, that approximately 50% of the precursor reacted with isoprene. The ELSD
chromatogram showed a small PS peak and a large block copolymerfPiP peak. Although the
response ofthe ELSD was are not equal for PS, PiP, and the block copolymer, the areas ofthe
peaks gave some indication ofthe amounts. From Figure 7-13, no reliable information can be
obtained a bout the amount of PiP that bas been formed in the second step. NP-GPEC had to
be applied in order to give proof of homopolymer PiP in the block copolymer. The peak are as
of sample A and Bare shown in Table 7-7.

Characterization of Block Copolymers by GPEC 115
Table 7-7, Peak areas afthe RP-GPliC lW and llLSD chromatagmms af sample A and B.
Sample UV(% area) ELSD (% area) PS Bleek PS BlockjPiP
A 90 10 50 50 B 50 50 5 95
The area percentage of the ELS detector signal has to be treated with care. The ELS
detector response is not equal for different types of polymers [16]. Also the molar mass and
the eluent composition can have a large influence on the ELS detector response and the
signa! does not vary linearly with the analyte concentration. Consequently, the ELS detector
signals and areas cannot be compared accurately. However, the trend of the areas obtained
with ELS detector can give an indication. The quality and selectivity of modern ELS detectors
have improved significantly. In spite of the poor quantification, the ELS detector areas are
still used for the characterization, since the ELS detector is the only detector that can detect
PiP (polyolefms) in GPEC.
In Figure 7-14 the three RP·GPEC ELSD chromatograms of sample A and B and KRATON
01107 are shown.
1.1
1.0 --01107 (15 w% Styrene)
0.9 - - - - Sample A (25 w<'-i> Styrene)
> · · · · · · · Sample B (57 w% Styrene) 0.8
" Ë.. 0.7 " " lil lo
0.6 " ' c: " 11
bO 0.5 " .:' \ ' Vi " I
0.4 " : . " Q
0.3 " (/') 11
.....l 11 ,, l:l.l 0.2 11 I ; . I '.
0.1 ·· · · · ···-~ I I
.• 0.0
%THF
Figure 7·14 RP-GPEC EISD chromatagmms af sample A(--), sample B (- .. ), and KRATON D1107 (-).
The three samples are PS/PiP block copolymers with different ratio Styrenefisoprene. The
peak of the KRATON 01107 was narrower in comparison to the peaks of samples A and B.
This implies that the KRATON 01107 had a much narrower chemica! composition
distribution, i.e. a narrower block length distribution. In samples A and B (see Figure 7-14) PS
homopolymer is present. In KRATON 01107 no PS homopolymer could be noticed. PiP might
be present in the block copolymer since PiP co-elutes with the block copolymer. NP·GPEC will
provide additional information on the presence of PiP.

116 Chapter7
7.6.2.2 ANIONICALLY PREPARED BLOCK COPOLYMERS
The ELSO chromatograms of the anionically prepared block copolymers are shown in
Figure 7·15.
0.4
> .ê. 0.3
! Vi 0 0.2
~ 1>1
4
A i i jÎ i i 3 ;i i i ;! i i ,, i i •• i i ,, i i :: i i ,.._. i i ,., .• i i .. , ., ! ! .... ·· : ~ ! \.·· 2 ,' ·;· ..
--1 G1652, 30 w% S
·· ·· · · ·2G1701,37w%S
---- 3 01107, 15 w% s -·-·-·· 41ll1101, 31 w% s
······ ··· .! . . . · . ~ ' .. 0.11--'-'-:..:.:.;;:.:..:..;..;_-J._~_...;_.._.:..:.:..c::::
60 70 80
%THF
Figure 7-15 RP-GPEC ELSD Chromatogrums ofthe anionically prepared block copolymers, C165Z P{SfE,B/S -}.
D1107 P{SfiPfS --), C1701 hydrogenated P(SfE,P .. ·), and TR1101 P{SfBIS - ·- ·).
There is a big difference between the hydrogenated block copolymers G1652 and G1701,
and the block copolymers 01107 and TR1101. 01107 and TR1101 show only one small peak,
and the hydrogenated block copolymers show a broad peaks. The broadening and the
separation into multiple peaks are caused by chemica! inhomogeneities. The hydragenation
step (incomplete hydrogenation) probably caused these chemica! differences.
The separation according to chemica! composition (WO/oS) is significant. The elution
behavior ofpolybutadiene (PB) is camparabie to the elution behavior ofpolyisoprene (PiP). see
Figure 7-16.
TR1101 has a higher styrene content (31 WO/o) than 01107 (15 w%). TR1101 elutes at a
lower % THF than 01107 due to the difference in styrene content. The copolymer with the
highest styrene content will elute at lower% THF.

Characterization of Block Copolymers by GPEC 117
7.0
6.5 \ 6.0 -o-pjp ! 55 -e- PB
5.0 ::s ~~~ bO 4.5 0 ...l • r 4.0
3.5 .~ 3.0
2.5
0 10 20 30 40 50 60 70 80 90 100
o/o THF
Figure 7-16, Molar mass dependendes of PIP (·•) and PB (·er) in the RP-GPliC gradient (see Table 7-3).
7.6.3 NORMAL PilAsE GPEC
7. 6.3.1 FREE-RADICALLY PREPARED BLOCK COPOLYMERS
The NP-GPEC chromatograms were all performed with the gradient in Table 7-4. The molar
mass dependency intervals ofthe two homopolymers can beseen in Figure 7-17 .
• tE7 I
-•-PS • D I I -o-pjp
1000000 D • "' I • "' I "' D 8 I • .... 100000 I? I
"' D
___ / "ö I
::E D
I 10000 D I --· D I / 1000
D
10 15 20 25 30 35
o/ornF
Figure 7-17, Molar mass dependencyofPS (•) and PIP (0) in the system heptonefTHF on a silica column (35"C).

118 Chapter7
As can be observed in Figure 7-17, the NP-PGEC gradient can be used to separate the block
copolymers. The NP-GPEC chromatograms of samples A and B are shown in Figure 7-18.
--Sample A PS
··· ··· ·····Sample B
\ 0.071 \ > B!ock copolymer ..ê.
\ 'iil PiP So ·;;; 0.070
Q .,/"--.............-.--........ ~ _ ..... _,......-....;·- ·· .... I.LI
0.063
10 15 20 25 JO 35 40
Retention time [min]
figure 7-18, NP-GPHC HLSD chroiiUltograms of sample A(-) and B (-· ·).
The chromatograms show broad irregular peaks, representing polymer eluted between
the homopolymers (PS and PiP) . The peaks were fractionated, and · pyrolysis gas
chromatography mass speetrometry (pyrolysis GC-MS) was applied to identify the fractions.
In the frrst peak and the broad peak styrene and isoprene were found, indicating that the NP
GPEC separation is not optima!. This pre-elution of styrene can be explained by breakthrough
[17). The polymer molecules co-elute with the injected THF.
'iil 6b
0.20
·v; 0.15
~
Breakthrough 11 PS
Block / 10 20 JO 50 60
Retention time !min]
figure 7-19, NP-GPHC UV chroiiUltograms of sample A(-) and B (-··).

Characterization of Block Copolymers by GPEC 119
The NP-GPEC UV chromatograms showed a slight increase of the UV signal. The UV signals
of the NP-GPEC separations were not satisfying. The response was very low. This low
response was probably due to the broadening of the peaks caused by the molar mass
dependency (see Figure 7-17).
7.6.3.2 ANIONICAU.Y PREPARED BLOCK COPOLYMERS
The NP-GPEC chromatograms ofthe KRATONS are shown in Figure 7-20.
The anionically prepared block copolymers show highly reproducible chromatographic
peaks in comparison with the chromatograms obtained from the free-radically prepared
block copolymers (see Figure 7-18). G1652 (hydrogenated block copolymer) overlaps with
01107 (styrenefisoprenefstyrene tri-block copolymer). The peaks of G1701 were fractionated
and also identified with pyrolysis GC-MS. The first peak (±2.5 minutes) was identified as PS
and is caused by breakthrough (described in Chapter 2). In the second peak (±4 minutes) no
polymer was found and is regarded as the solvent peak. Consequently, no PiP homopolymer
was present in the sample G1701. Since the solvent peak of other KRATON block copolymers
are of comparable heights, the KRATON are thought to have no PiP present.
0.26
0.24
0.22
0.20
~ 0.18
v; 0.16
0 !:3 0.14 tzJ
0.12
0.10
0.08
::
:·.
10
--G\652 P(S/E,B/5)30 w% S
······ G1701 P(S/E,P)37w%S
---- 01107 P(S/iP/S) 15 w% S
-·-·-· TRilOl P(S/B/S) 31 w% S
15 20 25
Retention time (mini
30
Figure 7·20, NP·CPEC ELSD Chromatagram of KRATONS C1652 P{SfE,B/S -), D1107 P{S/iPJS- -), C1701
hydrogenated P(SjE,P ·· -), and TR1101 P{S/B/S -·-·) ••
The NP-GPEC separation on a silica column appears to have a lot of possibilities. The
results of the KRATON block copolymers are useful and different information is obtained in
comparison with the results of the RP-GPEC. Nevertheless, the results obtained for the free
radically prepared block copolymers were not suitable. The NP-GPEC measurements were not
optima! and additional research is necessary.
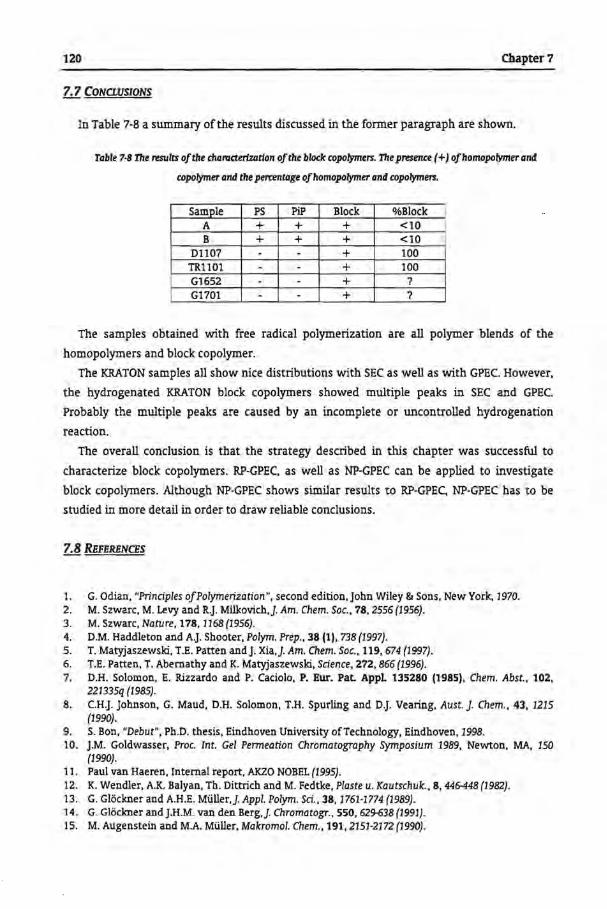
120 Chapter7
7. 7 CONCWSIONS
In Table 7-8 a summary ofthe results discussed in the former paragraphare shown.
Table 7-8111e results ofthe charaáertzation ofthe bloclc copolymers. The presence (+} ofhomopolymer and
copolymer and the percentage ofhomopolymer and copolymers.
Sample PS PiP Bleek o/oBlock A + + + <10 B + + + <10
01107 - - + 100 TR1101 - - + 100 G1652 - - + ? G1701 - - + ?
The samples obtained with free radkal polymerization are all polymer blends of the
homopolymers and block copolymer.
The KRATON samples all show nice distributions with SEC as well as with GPEC. However,
the hydrogenated KRATON block copolymers showed multiple peaks in SEC and GPEC.
Probably the multiple peaks are caused by an incomplete or uncontrolled hydragenation
reaction.
The overall condusion is that the strategy described in this chapter was successful to
characterize block copolymers. RP-GPEC, as well as NP-GPEC can be applied to investigate
block copolymers. Although NP-GPEC shows similar results to RP-GPEC, NP-GPEC has to be
studied in more detail in order to draw reliable conclusions.
7.8 REFERENCES
1. G. Odian, "Principles ofPolymerization", second edition, John Wiley & Sans, New York, 1970. 2. M. Szwarc, M. Levy and R.J. Milkovich,J. Am. Chem. Soc., 78, 2556 {1956) . 3. M. Szwarc, Nature, 178, 1168 {1956). 4. O.M. Haddieton and A.J. Shooter, Polym. Prep., 38 (1), 738 {1997). 5. T. Matyjaszewski, T.E. Patten and j. Xia,J. Am. Chem. Soc., 119, 674 {1997). 6. T.E. Patten, T. Abemathy and K. Matyjaszewski, Science, 272, 866 {1996) . 7. D.H. Salomon, E. Rizzardo and P. Caciolo, P. Eur. Pat. Appl 135280 (1985), Chem. Abst., 102,
221335q {1985}. 8. C.H.J. Johnson, G. Maud, D.H. Salomon, T.H. Spurling and D.J. Vearing, Aust.]. Chem .• 43, 1215
{1990). 9. S. Bon, "Debut", Ph.D. thesis, Eindhoven University ofTechnology, Eindhoven, 1998. 10. J.M. Goldwasser, Proc. Int. Gel Permeation Chromatography Symposium 1989, Newton, MA. 150
(1990). 11 . Paul van Haeren, In tema! report, AKZO NOBEL {1995). 12. K. Wendler, A.K. Balyan, Th. Dittrich and M. Fedtke, Plaste u. Kautschuk., 8, 446-448 (1982). 13. G. Glöckner and A.H.E. Müller,J. Appl. Polym. Sci., 38, 1761·1774 {1989). 14. G. Glöclmer and J.H.M. van den Berg,]. Chromatogr., 550, 62%38 {1991). 15. M. Augenstein and M.A. Müller, Makromol. Chem., 191,2151-2172 {1990).
Characterization of Block Copolymers by GPEC 121
16. T. Willems, "Evaporative Light Scatteling Detectors". Intemal report, Eindhoven University of Technology, 1997.
17. T.L.j. Wille ms. M.Sc. Thesis, Eindhoven University of Technology, Eindhoven, The Netherlands {1993).

Epilogue 123
Epilogue
As new polymer architectures with novel properties will be explored and investigated,
their microstructure becomes more complex. With increasing complexity of the
microstructure, the need for separation techniques, such as HPLC, is an absolute necessity.
However, when a new polymer is developed, the (complete) microstructural analysis is
seldom taken into account. Unfortunately, this phenomenon is frequently observed in the
polymer industry, and the copolyesters described in this thesis are a good example. Although
they have been applied for many years in coatings, they have never been studied to the same
extent as described in this thesis.
GPEC can be applied to characterize the copolyesters in detail. However, various peaks
could never have been assigned without the identification by mass speetrometry (MS). The
combination HPLC-MS was shown to be a powerful tooi.
Whether the strategy or (less likely) the conditions described in this thesis can be applied
to characterize other copalyester systems remains to be proven. The relevant copalyester
system seems to be among the most difficult polymer structures to separate, since
isophthalic acid and terephthalic acid are isomers. However, by using well-defmed
homopolyester and copalyester standards, the separation of copolyesters could be achieved.
Unfortunately, GPEC is not universally applicable. For each type of polymer, different
optima! conditions have to be detennined which can make GPEC a time-consuming method.
As long as the polarity difference between the polymers to be separated is large enough to
obtain selectively, separation between the specific polymers can be achieved. However, ifthe
polarity difference is very small, separation ofthe specific polymers might be impossible with
the equipment available nowadays.
For proper characterization of polymers, an understanding of the physical-chemical
characteristics of polymers is needed for the correct interpretation of the data. Nevertheless,
it will still be very difficult to obtain a relationship between the microstructure of the
polymer and the (mechanica!) properties, which is beyond the scope ofthis thesis.
Despite all the difficulties encountered when applying HPLC and MS to polymers, the need
for separation techniques will never become obsolete.

List ofSymbols and Abbreviations 125
A a ACN (AD)p {AD)pcytic
(AD)p·A c CCD csc D DRI DSC OP ELS ES! FTD GPEC HAc HFIP HPLC IA IR
Kn K.nth I<. nu
kn..ct ~I k,.gm KTFA LC LCCC LCST M mP m, MALDI MMCCD MMFTD MMO MS
~ NMR NP NPG NS p PS PiP R
List ofSymbols and Abbreviations
di-add monomer Mark-Houwink parameter 1·1 acetonimie oligomers with an add end group and a hydroxy end with degree ofpolymerization p cyclic oligomers with degree ofpolymerization p oligomers with two add end groups with degree of polymerization p concentration (mg/ml] chemica! composition distribution critica! solvent composition di-alcohol monomer differential refractive index differentlal scanning calorimetry d.ifferential pressure (viscosity detector) evaporative light scattering electraspray ionization functional type distri bution gradient polymer elution chromatography acetic add hexafluoro isopropanol high performance liquid chromatography isophthalic add infrared Mark·Houwink parameter (d.J.molfgl] distri bution coeffident based on enthalpy effects 1-J distri bution coeffident based on entropy effects 1-1 capadty factor of a functional group of a polymer H capadty factor of a polymer H capadty factor of a segment of a polymer H potassium trifluoro acetate liquid chromatography liquid chromatography under critica! conditions lower critica! solvent temperature molar mass (gfmol] relative chain length ofthe polymer molecule H relative chain length of the solvent molecule 1-1 matrix assisted laser desorption ionization molar mass chemica! composition distribution molar mass functional type distribution molar mass distribution mass speetrometry total number oflattice places to be tilled by the solventand polymer (mol] nuclear magnetic resonance normal phase neopentyl glycol non solvent degree of polymerization H polystyrene polyisoprene gas constant !Jfmol·KI

126
RI RP s SEC T Ta T., ro., tr tognd
to~ol TA TGIC THF TLC TOF UCST tN v,.d vh V; vp Vporm
v .. , V,
V sol
'X.P(NS
'XP/S
Xa ~G
~gfunct
~Gmix
~g .. gm
ÄHI»ck
~Hfuna
~Hm
~Hmix ~p
~Sback
~seun" ~Smix
1111 Tlsp
<jlprogram
q>inltW
Cjls
Cjlp
<jlTA
A.
refracti ve index reversed phase solvent size exdusion chromatography temperature [KJ aitical temperature [KJ melting point of a polymer [KJ melting point ofthe pure polymer [KJ retentien time [min] dead time ofthe gradient [min] dead time ofthe column [mini terephthalic aád temperature gradient interaction chromatography tetrahydrofuran thin layer chromatography time of flight upper aitical solvent temperature ultraviolet exclusion limit expressed in volume [mi] hydrodynamic volume [I/mol] interstitial volume [mi] pore volume [miJ permeation limit expressed in volume [miJ retentien volume [miJ volume of stationary phase [mi] volume ofthe solvent [miJ
List ofSymbols and Abbreviations
Flory-Huggins interaction parameter ofthe non solventand the polymer [-] Flory-Huggins interaction parameter ofthe solventand the polymer [-] critica! interaction parameter[-] change in Gibbs free energy U/mol] change in Gibbs free energy of the functional groups U/mol] change in Gibbs free energy on mixing of a solventand a polymer U/mol] change in Gibbs free energy of a segment ofthe polymer U/mol] change in enthalpy ofthe polymer backbone U/mol] change in enthalpy ofthe functional groups U/mol] change in enthalpy on melting a polymer U/mol] change in enthalpy on mixing of a solvent and a polymer U/mol] pressure difference (bar] change in entropy ofthe polymer backbene U/mol· KJ change in entropy ofthe functional groups Ufmol·K) change in entropy on mixing of a solventand a polymer Ufmol·K) intrinsic viscosity (d.l/g] specific viscosity [-] programmed gradient speed [-/min] initia! solvent fraction of the gradient [-] volume fraction of solvent[-] volume fraction of polymer [-] mole fraction of terephthalic aád based on the total amount of aád (TA + IA) [-] wavelength [nm)

Summary 127
Summary
The objective of this study was to investigate the broad applicability of gradient polymer
elution chromatography (GPEQ to various types of copolymers.
Copolyesters consisting of neopentyl glycol (NPG), isophthalic acid (IA) and terephthalic
acid (TA) have been characterized according to molar mass, chemica! composition, and
functional end groups. In order to characterize the copolyesters, the GPEC retentien behavier
of the homopolyesters of NPG/IA and NPG/TA was frrst studied. During the optimization of
the separation of the homopolyesters, problems concerning the reproducibility of the
separation were encountered. These problems were attributed to the crystallization of the
homopolyesters from solution during the GPEC analysis. Using differential scanning
calcrimetry (DSQ it was shown that although the homopolyester samples did not form a
crystalline phase from the melt, they did from solution.
The optima! gradient for the separation of the homopolyesters was found to be that
starting from waterjacetonitrile (50:50 vol%) and proceeding via acetonitrile (100%) to
tetrahydrofuran (100%) on a C18 modified silica column. Approximately 100 peaks could be
observed in the GPEC chromatograms and the identification of the molar mass of the peaks
was carried out using on-line electrospray-ionization mass speetrometry (ESI-MS). After
identification, the structure of the homopolyesters could be completely elucidated.
Copolyesters of NPG, IA and TA were separated using the same optima! gradient used for
the homopolymers. The functional end groups, the chemica! composition and the molar mass
were elucidated by the combination of GPEC with ESI-MS. With this knowledge it became
possible to characterize commercial copalyester samples.
Block copolymers consisting of styrenejisoprene and styrenejbutadiene were also
investigated by GPEC. A method was developed to determine the amount of free polystyrene
and polyisoprene present in the block copolymers, and consequently valuable information on
the block copolymerization process was obtained. Similarly, various commercial block
copolymers were characterized by GPEC.
The work described in this thesis shows the broad and powerful applicability of GPEC to
the characterization of copolymers. In combination with MS-detection, unique information
a bout the microstructure of polymers is obtajned, which cannot be achieved with any other
technique.
Samenvatting 129
Samenvatting
In dit proefschrift wordt de toepassing van gradiënt-polymeer-elutie-chromatografie
(GPEQ voor de karakterisering van verschillende typen co-polymeren beschreven. Het
algemene doel van de studie was het onderzoeken van de brede toepasbaarheid van GPEC
Voor een goede karakterisering van de co-polyesters bestaande uit neopentylglycol (NPG},
isophtaalzuur (IA}, en terephtaalzuur werd het GPEC retentiegedrag van de homopolyesters
bestudeerd. Tijdens het onderzoek bleek de reproduceerbaarbeid van de scheiding van de
homopolyesters niet voldoende te zijn. Deze problemen werden veroorzaakt door de
kristallizatie van de homopolyesters vanuit oplossing tijdens de GPEC analyse. Nadere
bestudering met differential scanning calcrimetry (DSQ wees uit dat vanuit de smelt géén,
maar vanuit de oplossing wèl een semi-kristallijne structuur gevormd wordt.
De optimale condities voor de scheiding van de homopolyesters bestonden uit een
gradiënt die begint bij water/acetonitril (50:50 vol%) en verloopt via acetonitril (100%) naar
tetrahydrofuran (100%} op een C18 gemodificeerde silicakolom. In de GPEC
chromatagrammen van de homopolyesters kunnen meer dan 100 pieken worden
onderscheiden. De gescheiden pieken werden vervolgens geïdentificeerd met on-line
electraspray-ionisatie massa spectrometrie (ESI-MS} en zodoende kon de structuur van de
homopolyesters volledig worden ontrafeld.
Co-polyesters van NPG, IA en TA werden onder de geoptimaliseerde scheidingscondities
gekarakteriseerd. De eindgroepen, chemische samenstelling en molecuulmassa konden
worden bepaald (met behulp van de combinatie GPEC en ESI-MS}. Op grond van deze kennis
was het mogelijk commerciële co-polyesters te karakteriseren.
Naast co-polyesters werden ook blok co-polymeren bestaande uit styreen/isapreen en
styreenfbutadieen bestudeerd met behulp van GPEC. Er werd een methode ontwikkeld voor
het bepalen van vrij polystyreen en polyisopreen in blok co-polymeren en daarmee kon
waardevolle informatie over het blok co-polymerisatie proces verkregen worden. Op analoge
wijze werden verschillende typen (commerciële) blok co-polymeren gekarakteriseerd.
Uit dit onderzoek blijkt dat GPEC een lcrachtige en breed toepasbare methode is om co
polymeren (mengsels) te karakteriseren. In combinatie met on-line MS-detectie wordt unieke
informatie over de microstructuur van polymeren verkregen die met geen enkele andere
techniek gevonden kan worden.

Dankwoord 131
Dankwoord
Bij het tot stand komen van dit proefschrift zijn velen betrokken geweest en bij deze wil ik
ieder die op de een of andere manier een bijdrage heeft geleverd bedanken.
Ten eerste wil ik de directie van de voormalige Central Research van Akzo Nobel bedanken
voor het sponsoren van het project en Cees Groenenboom voor zijn ondersteuning van het
project binnen de organisatie. In het bijzonder wil ik mijn eerste promotor Ton German
bedanken voor de mogelijkheid om te promoveren en zijn vertrouwen. Ik wil mijn tweede
promotor Peter Schoenmakers bedanken voor de nuttige discussies en het grondig nakijken
van mijn proefschrift. Tevens wil ik mijn copromotor Bert Klumperman bedanken voor zijn
begeleiding en zijn nuttige weerwoord. Mijn dank gaat uit naar de leden van de
leescommissie, Eric Nies en Care! Cramers voor het doorlezen van mijn proefschrift en hun
waardevol commentaar.
Speciale dank gaat uit naar Ab Buijtenhuijs. Ab jouw bezielende begeleiding, maar vooral
de discussies over uiteenlopende onderwerpen waren zeer nuttig, interessant, leerzaam en
aangenaam, en ik hoop dan ook dat we de discussies de komende jaren kunnen blijven
voortzetten. Ab's kamer- en lotgenoot, Michel Nieten, wil ik danken voor de leuke en
vruchtbare samenwerking op het gebied van MS. Henk, Amaia, Tonnie en Harry wil ik graag
bedanken voor het doorlezen van de verschillende versies van mijn proefschrift, voor het
geven van nuttig commentaar en het voeren van wetenschappelijke discussies.
Het grootste gedeelte van het praktisch werk heb ik verricht op het analytische lab van de
toenmalige Central Research van Akzo Nobel in Arnhem en ik wil daar de volgende (ex-)
medewerkers bedanken: Mathijs, Bert, Evelien, Paul, Mieke, Henk, Monique, Peter en Remie
en alle anderen die ik vergeten ben te noemen. In het bijzonder wil ik Leo, Luc, Andre en
Marco bedanken voor hun inhoudelijke bijdrage in de vorm van onderwerpen, discussies en
monsters.
Verder wil ik alle AIO's waar ik de afgelopen jaren met samengewerkt heb in de groep
'Polymeerchemie' op de TUE (teveel om op te noemen) bedanken voor een fijne tijd. Mijn
speciale dank en medeleven gaat uit naar mijn ex-kamergenoten Eugene, john (deK), Henno,
Harry, Tijs, Hans, Mike, WiJfred en Tonnie. Wieb en Alfons wil ik van harte bedanken voor de
plezierige samenwerking en Wieb bedankt voor het gewillige oor. Greg, bedankt voor de vele
bakjes koffie tijdens het roddelen en voor de sportieve afleiding. De discussies met Piet Piet
zal ik nooit meer vergeten, en Helly, Carolien, Steven (voor het rekruteren van interessante
post-docs), Alex, Peter, en Ruud wil ik bedanken voor alles wat ze voor mij gedaan hebben. I

132 Dankwoord
would like to thank Michael for reading and correcting some parts of my thesis and joseph
for the scanner. Ook wil ik Joost bedanken voor zijn MS-inbreng. Ik heb tijdens mijn AIO
schap verschillende afstudeerders enjof stagiaires begeleid: Mike, Frans, Franc, Mark en
Tasmara bedankt voor jullie bijdrage. Anne en Pauline wil ik bedanken voor het aanleveren
van zeer mooie foto 's en mijn ex-huisgenoten jan en Henk wil ik bedanken voor hun
emotionele bijdrage.
Mijn speciale dank gaat uit naar Wim. jouw enthousiasme is met geen pen te beschrijven
en ik ben blij dat je me zo'n 10 jaar geleden met het HPLC virus hebt geïnfecteerd. Ik wil mijn
huidige collega's bij TNO bedanken voor het geduld en de verkregen ruimte tijdens het
afronden van mijn proefschrift.
Ik wil mijn ouders bedanken voor hun steun en vertrouwen and last but not least I want
to thank Amaia for the love and support over the last (two) crucial years . . ... ez zaitez kezkatu,
ez bait za i tut utziko .....

Curriculum Vitae 133
Curriculum Vitae
Paul Cools is geboren op 9 april 1968 te Tilburg. In 1986 behaalde hij het Atheneum B
diploma aan het Odulphus Lyceum te Tilburg en begon hij de studie scheikundige technologie
aan de Technische Universiteit Eindhoven. In juni 1992 studeerde hij af op de Technische
Universiteit Eindhoven in de vakgroep Polymeerchemie en Kunststoftechnologie op het
onderwerp "Isocratic Retention Behavior of Homopolymers", waarna hij in juli 1992 startte
met de twee jarige ontwerpersopleiding Proces- en Productontwerp. De ontwerpopdracht
"On-line Monitoring of an Emulsion Polymerization" werd eveneens uitgevoerd in de
vakgroep Polymeerchemie en Kunststoftechnologie. Na het behalen van het
ontwerpersdiploma begon hij in juli 1995 zijn promotieonderzoek in dezelfde vakgroep
(huidige naam Capaciteitsgroep Polymeerchemie en Coatingstechnologie) onder leiding van
prof.dr.ir. A.L. German. Het promotieonderzoek werd volledig gesponsord door Central
Research van Akzo Nobel te Arnhem. In februari 1999 is hij in dienst getreden van de afdeling
verpakking van TNO Voeding in Zeist.

Stellingen
behorende bij het proefschrift
Characterization of Copolymers by Gradient Polymer Elution Chromatography
van
Paul Cools
1. "Nonna/ phase chromatography" van polymeren is niet zo nonnaai als de naam wel
doet vermoeden.
Hoofdstukken 4 en 7 van dit proefschrift
2. Het feit dat polymeermoleculen geëxcludeerd worden uit de poriën van een gepakte
kolom en dat daardoor het bereikbare actieve oppervlak vermindert neemt niet weg dat
de polymeermoleculen aan sterke adsorptieverschijnselen onderhevig kunnen zijn, dit
in tegenstelling tot de bewering van Schultz et al.
Schultz Rand Engelhardt H., Chromatographia, 29 {5/6), 205-213 {1990}.
3. Vloeistofchromatografie onder kritische condities (liquid chromatography at critica!
conditions LCCC) is laitischer dan superlaitische vloeistofchromatografie (supercritical
fluid chromatography SFC).
Met dank aan Peter Schoenmakers
4. In gradiënt elutie HPLC van polymeren wordt exclusie zelden of nooit in acht genomen,
ook niet in dit proefschrift.
Dit proefschrift
5. Er kan een duidelijkebimodaliteit geobserveerd worden tijdens het "baywatchen".

6. Veel chemici en vooral polymeerchemici gaan voorbij aan het feit dat chemie in het
Nederlands ook wel bekend staat als scheikunde.
7. Op de suggestie dat door "on-line" koppeling LC-NMR op eenvoudige en goedkope wijze
betrouwbare informatie kan worden verkregen is het volgende citaat van Dolly Parton
van toepassing: "It takes an awfu/lot of money to make this pers on look so cheap."
Citaat: http:ffwww.gold-eagle.comfasian _corner _98fdines013098.html
8. De hoogte van salarissen in de topsport zijn veelal niet in overeenstemming met de
geleverde prestaties.
9. Ondanks de vele winstpartijen en behaalde punten laat Feijenoord ook dit jaar (1999)
toch maar weer eens blijken de kampioen van de armoede te zijn.
Harold Schoonbrood "Emu/sion Co- and Terpolymerization", proefschrift Eindhoven 1994,
Stelling 15.
10. "Gerrari ohitu zintezke, baina gerra egon badago."
'je kunt wel wennen aan oorlog, maar daarmee gaat de oorlog nog niet voorbij."
Vrij vertaalde Baskische uitspraak van de groep Hertzainak
11. Minds are like parachutes, they only function when opened.
Auto sticker
Eindhoven, 27 mei 1999