Chapter 7: The Asset Market, Money, and Pricesyluo/teaching/Econ2220_2017/lecture7a.pdf · for...
52
Chapter 7: The Asset Market, Money, and Prices Yulei Luo Economics, HKU November 2, 2017 Luo, Y. (Economics, HKU) ECON2220: Intermediate Macro November 2, 2017 1 / 42
Transcript of Chapter 7: The Asset Market, Money, and Pricesyluo/teaching/Econ2220_2017/lecture7a.pdf · for...
Chapter 7: The Asset Market, Money, and Prices
Yulei Luo
Economics, HKU
November 2, 2017
Luo, Y. (Economics, HKU) ECON2220: Intermediate Macro November 2, 2017 1 / 42
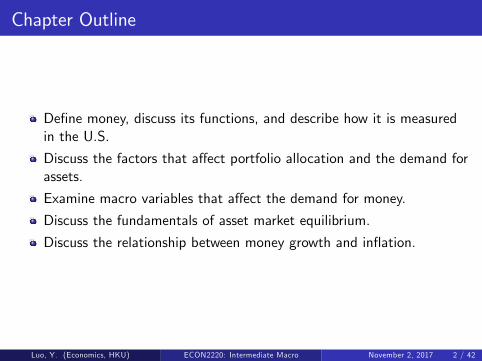
Chapter Outline
De�ne money, discuss its functions, and describe how it is measuredin the U.S.
Discuss the factors that a¤ect portfolio allocation and the demand forassets.
Examine macro variables that a¤ect the demand for money.
Discuss the fundamentals of asset market equilibrium.
Discuss the relationship between money growth and in�ation.
Luo, Y. (Economics, HKU) ECON2220: Intermediate Macro November 2, 2017 2 / 42
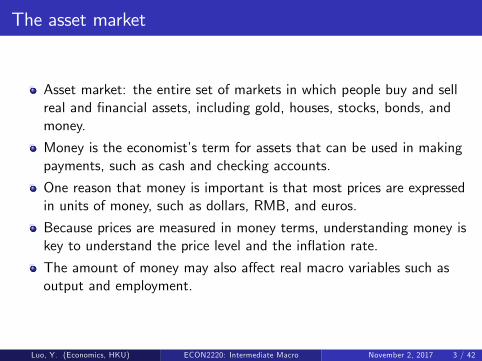
The asset market
Asset market: the entire set of markets in which people buy and sellreal and �nancial assets, including gold, houses, stocks, bonds, andmoney.
Money is the economist�s term for assets that can be used in makingpayments, such as cash and checking accounts.
One reason that money is important is that most prices are expressedin units of money, such as dollars, RMB, and euros.
Because prices are measured in money terms, understanding money iskey to understand the price level and the in�ation rate.
The amount of money may also a¤ect real macro variables such asoutput and employment.
Luo, Y. (Economics, HKU) ECON2220: Intermediate Macro November 2, 2017 3 / 42
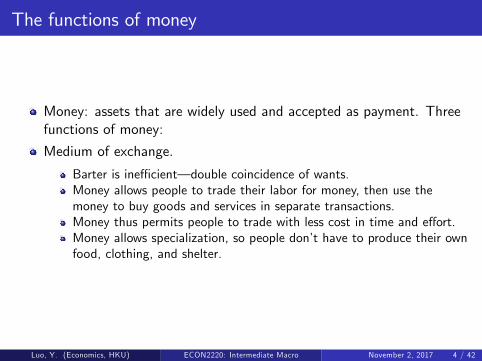
The functions of money
Money: assets that are widely used and accepted as payment. Threefunctions of money:
Medium of exchange.
Barter is ine¢ cient� double coincidence of wants.Money allows people to trade their labor for money, then use themoney to buy goods and services in separate transactions.Money thus permits people to trade with less cost in time and e¤ort.Money allows specialization, so people don�t have to produce their ownfood, clothing, and shelter.
Luo, Y. (Economics, HKU) ECON2220: Intermediate Macro November 2, 2017 4 / 42
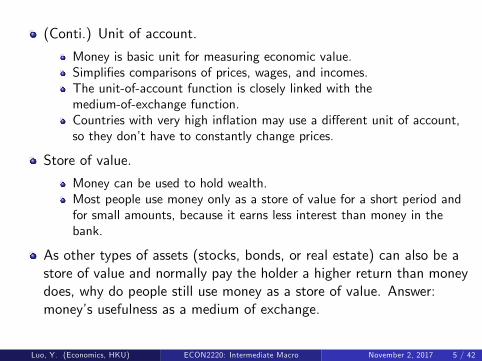
(Conti.) Unit of account.
Money is basic unit for measuring economic value.Simpli�es comparisons of prices, wages, and incomes.The unit-of-account function is closely linked with themedium-of-exchange function.Countries with very high in�ation may use a di¤erent unit of account,so they don�t have to constantly change prices.
Store of value.
Money can be used to hold wealth.Most people use money only as a store of value for a short period andfor small amounts, because it earns less interest than money in thebank.
As other types of assets (stocks, bonds, or real estate) can also be astore of value and normally pay the holder a higher return than moneydoes, why do people still use money as a store of value. Answer:money�s usefulness as a medium of exchange.
Luo, Y. (Economics, HKU) ECON2220: Intermediate Macro November 2, 2017 5 / 42
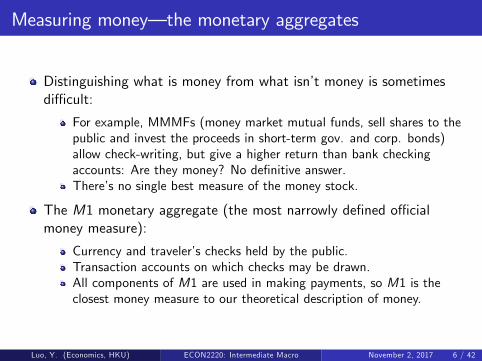
Measuring money� the monetary aggregates
Distinguishing what is money from what isn�t money is sometimesdi¢ cult:
For example, MMMFs (money market mutual funds, sell shares to thepublic and invest the proceeds in short-term gov. and corp. bonds)allow check-writing, but give a higher return than bank checkingaccounts: Are they money? No de�nitive answer.There�s no single best measure of the money stock.
The M1 monetary aggregate (the most narrowly de�ned o¢ cialmoney measure):
Currency and traveler�s checks held by the public.Transaction accounts on which checks may be drawn.All components of M1 are used in making payments, so M1 is theclosest money measure to our theoretical description of money.
Luo, Y. (Economics, HKU) ECON2220: Intermediate Macro November 2, 2017 6 / 42
(Conti.) The M2 monetary aggregate
M2 = M1 + less moneylike assets
Additional assets in M2:
savings deposits.small (< $100, 000) time deposits. Time deposits bear interest andhave a �xed term (substantial penalty for early withdrawal).noninstitutional MMMF balances. They invest in very short-termsecurities and allow limited checkwriting.money-market deposit accounts (MMDAs) are o¤ered by banks as acompetitor to MMMFs.
Luo, Y. (Economics, HKU) ECON2220: Intermediate Macro November 2, 2017 7 / 42
Copyright ©2014 Pearson Education, Inc. All rights reserved. 7-11
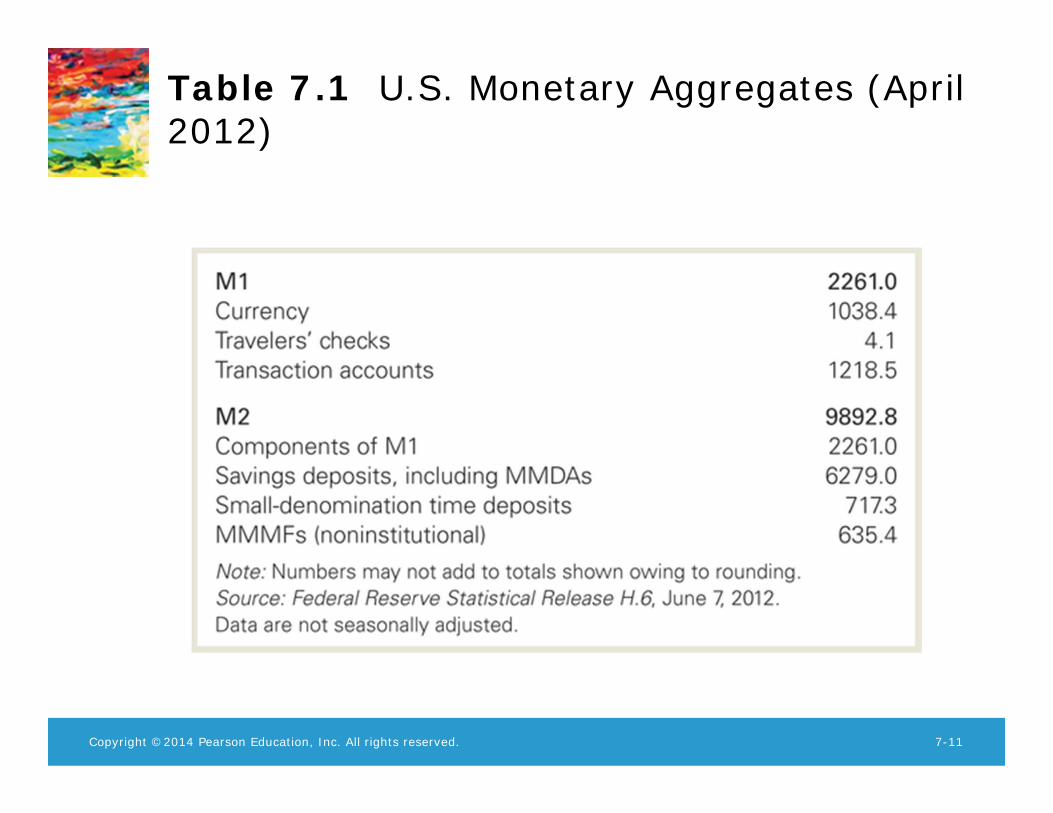
Table 7.1 U.S. Monetary Aggregates (April 2012)
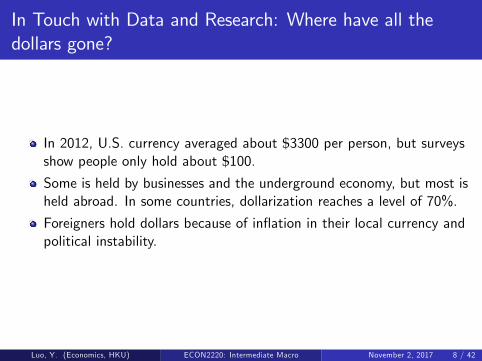
In Touch with Data and Research: Where have all thedollars gone?
In 2012, U.S. currency averaged about $3300 per person, but surveysshow people only hold about $100.Some is held by businesses and the underground economy, but most isheld abroad. In some countries, dollarization reaches a level of 70%.
Foreigners hold dollars because of in�ation in their local currency andpolitical instability.
Luo, Y. (Economics, HKU) ECON2220: Intermediate Macro November 2, 2017 8 / 42
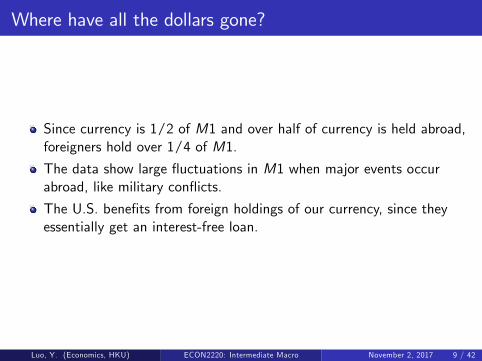
Where have all the dollars gone?
Since currency is 1/2 of M1 and over half of currency is held abroad,foreigners hold over 1/4 of M1.The data show large �uctuations in M1 when major events occurabroad, like military con�icts.
The U.S. bene�ts from foreign holdings of our currency, since theyessentially get an interest-free loan.
Luo, Y. (Economics, HKU) ECON2220: Intermediate Macro November 2, 2017 9 / 42
The money supply
The money supply
Money supply = money stock = amount of money available in theeconomy.
How does the central bank of a country increase the money supply?
Use newly printed money to buy �nancial assets from the public� anopen-market purchase.To reduce the money supply, sell �nancial assets to the public toremove money from circulation� an open-market sale.Open-market purchases and sales are called open-market operations.Could also buy newly issued government bonds directly from thegovernment (i.e., the Treasury).This is the same as the government �nancing its expenditures directlyby printing money.This happens frequently in some countries (though is forbidden by lawin the U.S.).
Luo, Y. (Economics, HKU) ECON2220: Intermediate Macro November 2, 2017 10 / 42
How do people allocate their wealth among various assets?Expected return
How people determine the amount of money they choose to hold?We begin by considering a broader question: How do people allocatetheir wealth among various assets?
Rate of return = an asset�s increase in value per unit of time.
Bank account: Rate of return = interest rate.Corporate stock: Rate of return = dividend yield + percent increase instock price.
Investors want assets with the highest expected return (other thingsequal).
Returns not known in advance, so people estimate their expectedreturn.
Luo, Y. (Economics, HKU) ECON2220: Intermediate Macro November 2, 2017 11 / 42
Risk
Risk is the degree of uncertainty in an asset�s return.
People don�t like risk, so they prefer assets with low risk (other thingsequal).
Risk premium: the amount by which the expected return on a riskyasset exceeds the return on an otherwise comparable safe asset.
Luo, Y. (Economics, HKU) ECON2220: Intermediate Macro November 2, 2017 12 / 42
Liquidity
Liquidity: the ease and quickness with which an asset can be traded.
Money is very liquid.
Assets like automobiles and houses are very illiquid� long time andlarge transaction costs to trade them.
Stocks and bonds are fairly liquid.
Investors prefer liquid assets (other things equal).
Luo, Y. (Economics, HKU) ECON2220: Intermediate Macro November 2, 2017 13 / 42
Time to maturity
Time to maturity: the amount of time until a �nancial securitymatures and the investor is repaid the principal.
Expectations theory of the term structure of interest rates: Investorscompare the returns on bonds with di¤ering times to maturity to seewhich is expected to give them the highest return.
"Term structure" refers to the fact that the theory explains whybonds that are similar in all respects except their terms to maturityhave di¤erent rates of return.
The idea that investors compare returns on bonds with di¤ering timesto maturity.
In equilibrium, holding di¤erent types of bonds over the same periodyields the same expected return.
Because long-term interest rates usually exceed short-term interestrates, a risk premium exists: the compensation to an investor forbearing the risk of holding a long-term bond.
Luo, Y. (Economics, HKU) ECON2220: Intermediate Macro November 2, 2017 14 / 42
Types of assets and their characteristics
People hold many di¤erent assets, including money, bonds, stocks,houses, and consumer durable goods:
Money has a low return, but low risk and high liquidity.Bonds have a higher return than money, but have more risk and lessliquidity.Stocks pay dividends and can have capital gains and losses, and aremuch more risky than money.Ownership of a small business is very risky and not liquid at all, butmay pay a very high return.Housing provides housing services and the potential for capital gains,but is quite illiquid.
Luo, Y. (Economics, HKU) ECON2220: Intermediate Macro November 2, 2017 15 / 42
(Conti.) Households must consider what mix of assets they wish toown.
Table 7.2 shows the mix in 2006, 2009, and 2012.
The table illustrates the large declines in the value of stocks andhousing in the �nancial crisis:
The value of housing has remained low.The value of stocks has rebounded from 2009 to 2012.
Luo, Y. (Economics, HKU) ECON2220: Intermediate Macro November 2, 2017 16 / 42

Copyright ©2014 Pearson Education, Inc. All rights reserved. 7-27
Table 7.2 Household Assets, 2006, 2009, and 2012
In touch with data and research: the housing crisis thatbegan in 2007
People gained tremendous wealth in their houses in the 2000s.
As house prices rose, houses became increasingly una¤ordable, leadingmortgage lenders to create subprime loans for people who wouldn�tnormally qualify to buy houses.
Most subprime loans had adjustable interest rates, with a low initialinterest rate that would later rise in a process known as mortgagereset.
Luo, Y. (Economics, HKU) ECON2220: Intermediate Macro November 2, 2017 17 / 42
(Conti.) The housing crisis that began in 2007:
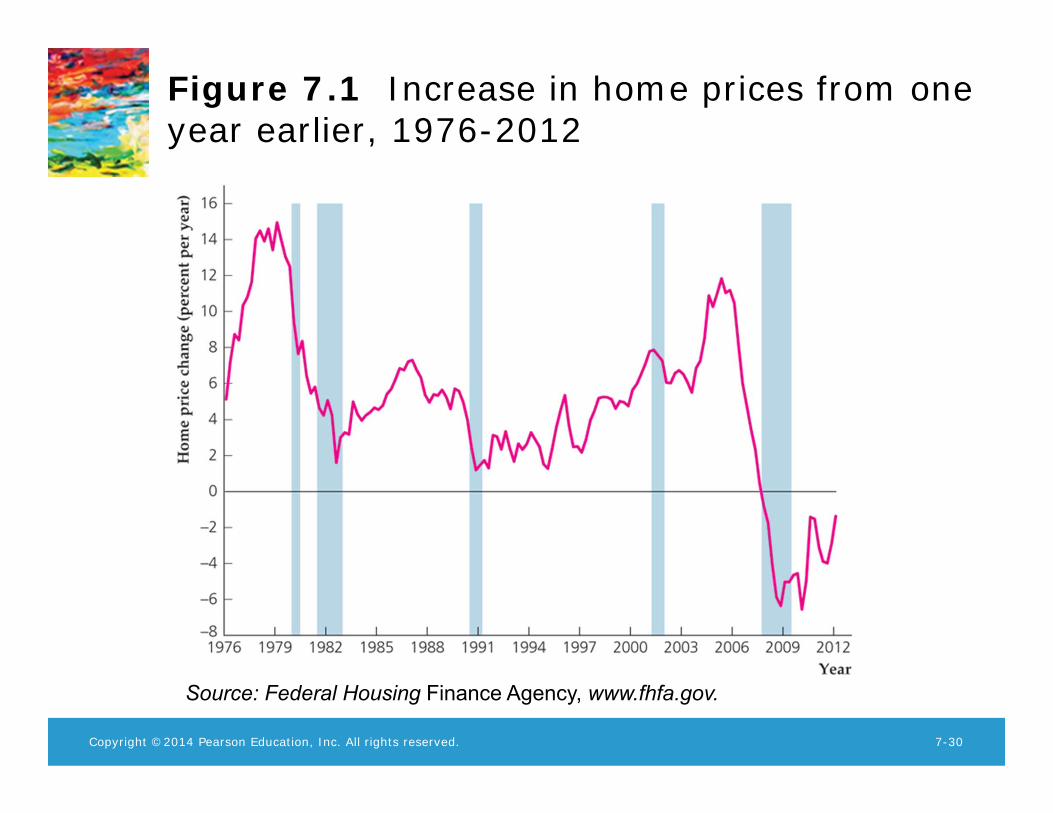
As long as housing prices kept rising, both lenders and borrowersthought the subprime loans would work out, as the borrowers couldalways sell their houses to pay o¤ the loans.But housing prices stopped rising as much, leading more subprimeborrowers to default, so banks began to tighten their lending standards,reducing the demand for housing and leading housing prices to startfalling (Fig. 7.1).Many homeowners lost their homes and �nancial institutions losthundreds of billions of dollars because of mortgage loan defaults.Because many mortgage loans had been securitized and were parts ofmortgage-backed securities, the increased default rate on mortgages ledto a �nancial crisis in Fall 2008, as many investors simultaneously triedto sell risky assets, including mortgage-backed securities and stocks.
Luo, Y. (Economics, HKU) ECON2220: Intermediate Macro November 2, 2017 18 / 42
Copyright ©2014 Pearson Education, Inc. All rights reserved. 7-30
Figure 7.1 Increase in home prices from one year earlier, 1976-2012
Source: Federal Housing Finance Agency, www.fhfa.gov.
Asset Demands
Trade-o¤ among expected return, risk, liquidity, and time to maturity.
Assets with low risk and high liquidity, like checking accounts, havelow expected returns.
Investors consider diversi�cation: spreading out investments indi¤erent assets to reduce risk.
The amount a wealth holder wants of an asset is his or her demandfor that asset.
The sum of asset demands equals total wealth.
Luo, Y. (Economics, HKU) ECON2220: Intermediate Macro November 2, 2017 19 / 42
The Demand for Money
The demand for money is the quantity of monetary assets peoplewant to hold in their portfolios:
Money demand depends on expected return, risk, and liquidity.Money is the most liquid asset.Money pays a low return.
People�s money-holding decisions depend on how much they valueliquidity against the low return on money.
Luo, Y. (Economics, HKU) ECON2220: Intermediate Macro November 2, 2017 20 / 42
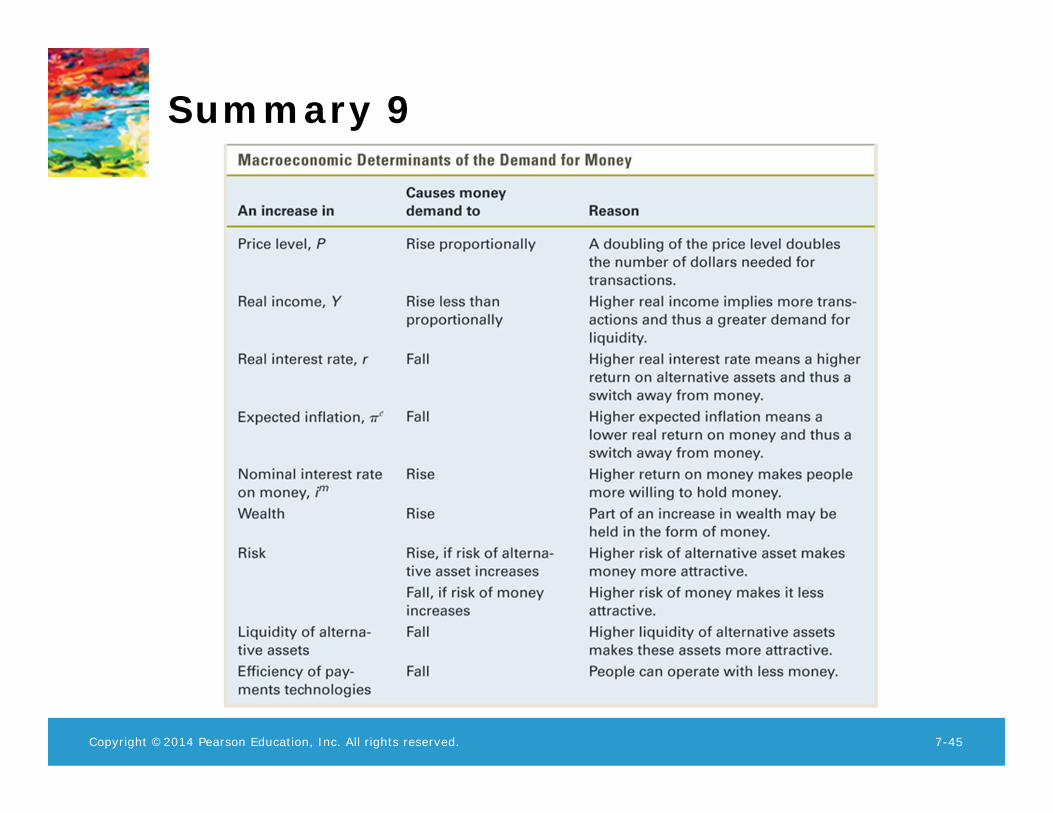
Key macroeconomic variables that a¤ect money demand
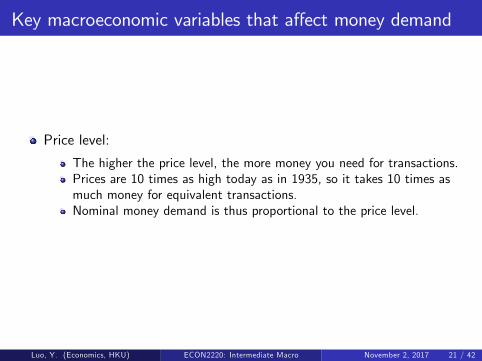
Price level:
The higher the price level, the more money you need for transactions.Prices are 10 times as high today as in 1935, so it takes 10 times asmuch money for equivalent transactions.Nominal money demand is thus proportional to the price level.
Luo, Y. (Economics, HKU) ECON2220: Intermediate Macro November 2, 2017 21 / 42
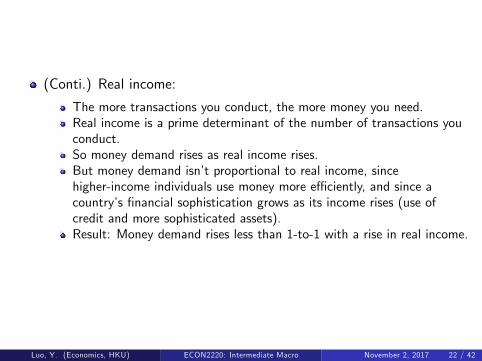
(Conti.) Real income:
The more transactions you conduct, the more money you need.Real income is a prime determinant of the number of transactions youconduct.So money demand rises as real income rises.But money demand isn�t proportional to real income, sincehigher-income individuals use money more e¢ ciently, and since acountry�s �nancial sophistication grows as its income rises (use ofcredit and more sophisticated assets).Result: Money demand rises less than 1-to-1 with a rise in real income.
Luo, Y. (Economics, HKU) ECON2220: Intermediate Macro November 2, 2017 22 / 42

(Conti.) Interest rates:
An increase in the interest rate or return on nonmonetary assetsdecreases the demand for money.An increase in the interest rate on money increases money demand.This occurs as people trade o¤ liquidity for return.Though there are many nonmonetary assets with many di¤erentinterest rates, because they often move together we assume that fornonmonetary assets there�s just one nominal interest rate, i .
Luo, Y. (Economics, HKU) ECON2220: Intermediate Macro November 2, 2017 23 / 42
The money demand function
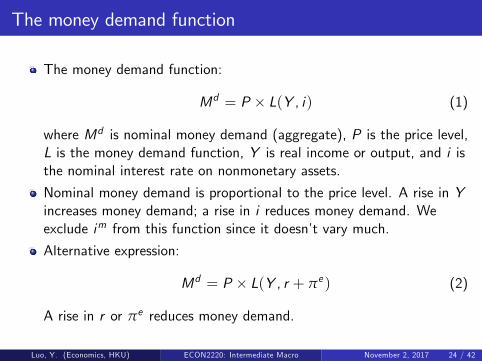
The money demand function:
Md = P � L(Y , i) (1)
where Md is nominal money demand (aggregate), P is the price level,L is the money demand function, Y is real income or output, and i isthe nominal interest rate on nonmonetary assets.
Nominal money demand is proportional to the price level. A rise in Yincreases money demand; a rise in i reduces money demand. Weexclude im from this function since it doesn�t vary much.
Alternative expression:
Md = P � L(Y , r + πe ) (2)
A rise in r or πe reduces money demand.
Luo, Y. (Economics, HKU) ECON2220: Intermediate Macro November 2, 2017 24 / 42
Other factors a¤ecting money demand
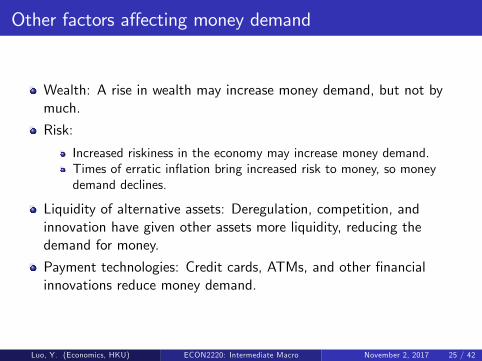
Wealth: A rise in wealth may increase money demand, but not bymuch.
Risk:
Increased riskiness in the economy may increase money demand.Times of erratic in�ation bring increased risk to money, so moneydemand declines.
Liquidity of alternative assets: Deregulation, competition, andinnovation have given other assets more liquidity, reducing thedemand for money.
Payment technologies: Credit cards, ATMs, and other �nancialinnovations reduce money demand.
Luo, Y. (Economics, HKU) ECON2220: Intermediate Macro November 2, 2017 25 / 42
Copyright ©2014 Pearson Education, Inc. All rights reserved. 7-45
Summary 9
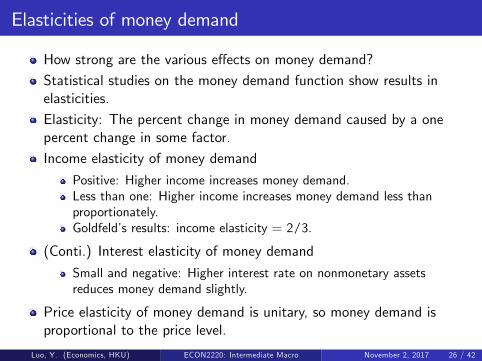
Elasticities of money demand
How strong are the various e¤ects on money demand?
Statistical studies on the money demand function show results inelasticities.
Elasticity: The percent change in money demand caused by a onepercent change in some factor.
Income elasticity of money demand
Positive: Higher income increases money demand.Less than one: Higher income increases money demand less thanproportionately.Goldfeld�s results: income elasticity = 2/3.
(Conti.) Interest elasticity of money demand
Small and negative: Higher interest rate on nonmonetary assetsreduces money demand slightly.
Price elasticity of money demand is unitary, so money demand isproportional to the price level.
Luo, Y. (Economics, HKU) ECON2220: Intermediate Macro November 2, 2017 26 / 42
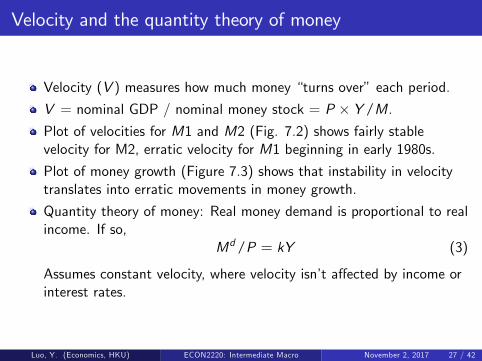
Velocity and the quantity theory of money
Velocity (V ) measures how much money �turns over� each period.
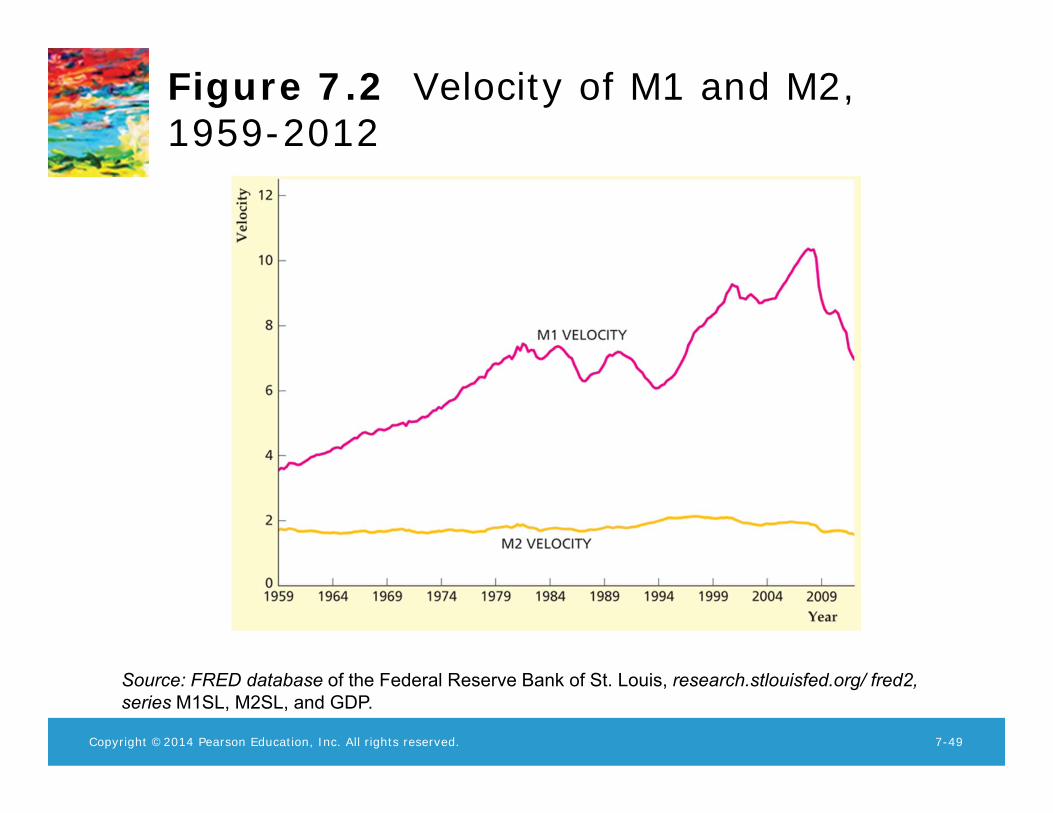
V = nominal GDP / nominal money stock = P � Y /M.Plot of velocities for M1 and M2 (Fig. 7.2) shows fairly stablevelocity for M2, erratic velocity for M1 beginning in early 1980s.
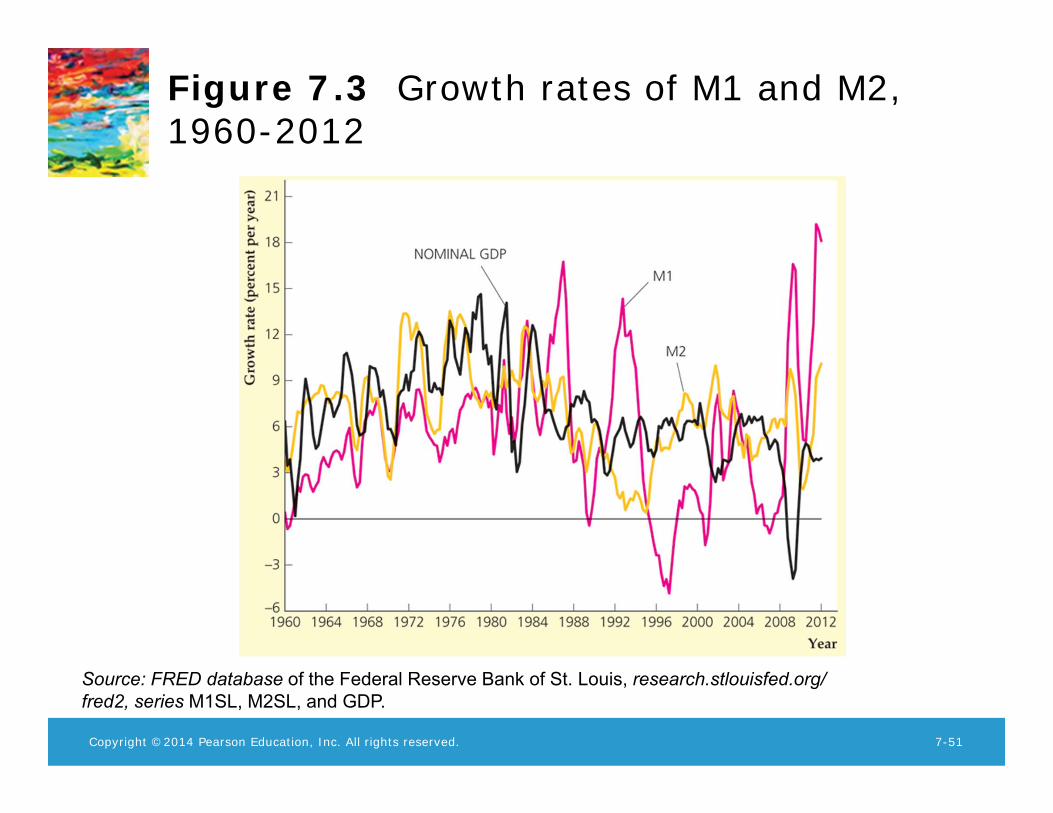
Plot of money growth (Figure 7.3) shows that instability in velocitytranslates into erratic movements in money growth.
Quantity theory of money: Real money demand is proportional to realincome. If so,
Md/P = kY (3)
Assumes constant velocity, where velocity isn�t a¤ected by income orinterest rates.
Luo, Y. (Economics, HKU) ECON2220: Intermediate Macro November 2, 2017 27 / 42
Copyright ©2014 Pearson Education, Inc. All rights reserved. 7-49
Figure 7.2 Velocity of M1 and M2, 1959-2012
Source: FRED database of the Federal Reserve Bank of St. Louis, research.stlouisfed.org/ fred2, series M1SL, M2SL, and GDP.
Copyright ©2014 Pearson Education, Inc. All rights reserved. 7-51
Figure 7.3 Growth rates of M1 and M2, 1960-2012
Source: FRED database of the Federal Reserve Bank of St. Louis, research.stlouisfed.org/ fred2, series M1SL, M2SL, and GDP.
(Conti.) But velocity of M1 is not constant; it rose steadily from1960 to 1980 and has been erratic since then.
Part of the change in velocity is due to changes in interest rates in the1980s.Financial innovations also played a role in velocity�s decline in the early1980s.
M2 velocity is closer to being a constant, but not over short periods.
Luo, Y. (Economics, HKU) ECON2220: Intermediate Macro November 2, 2017 28 / 42
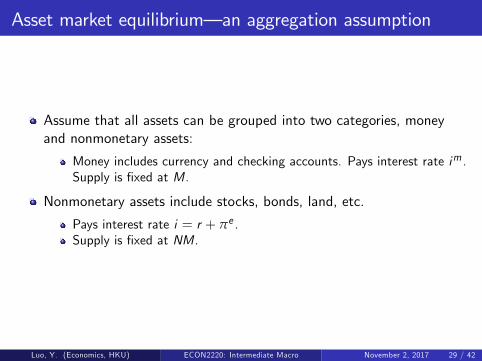
Asset market equilibrium� an aggregation assumption
Assume that all assets can be grouped into two categories, moneyand nonmonetary assets:
Money includes currency and checking accounts. Pays interest rate im .Supply is �xed at M.
Nonmonetary assets include stocks, bonds, land, etc.
Pays interest rate i = r + πe .Supply is �xed at NM.
Luo, Y. (Economics, HKU) ECON2220: Intermediate Macro November 2, 2017 29 / 42

(Conti.) Asset market equilibrium occurs when quantity of moneysupplied equals quantity of money demanded:
md + nmd = total nominal wealth of an individual.Md +NMd = aggregate nominal wealth. (from adding up individualwealth).
M +NM = aggregate nominal wealth (supply of assets).
Combining the two equations gives:
(Md �M) + (NMd �NM) = 0, (4)
which means that excess demand for money (Md �M) plus excessdemand for nonmonetary assets (NMd �NM) equals 0.So if money supply equals money demand, nonmonetary asset supplymust equal nonmonetary asset demand; then entire asset market is inequilibrium.
Luo, Y. (Economics, HKU) ECON2220: Intermediate Macro November 2, 2017 30 / 42
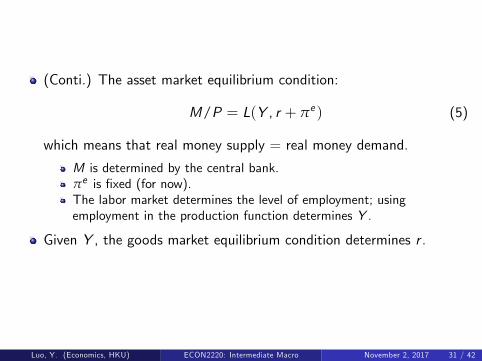
(Conti.) The asset market equilibrium condition:
M/P = L(Y , r + πe ) (5)
which means that real money supply = real money demand.
M is determined by the central bank.πe is �xed (for now).The labor market determines the level of employment; usingemployment in the production function determines Y .
Given Y , the goods market equilibrium condition determines r .
Luo, Y. (Economics, HKU) ECON2220: Intermediate Macro November 2, 2017 31 / 42
(Conti.) With all the other variables in the last equation determined,the asset market equilibrium condition determines the price level:
P = M/L(Y , r + πe ) (6)
where the price level is the ratio of nominal money supply to realmoney demand.
For example, doubling the money supply would double the price level.
Luo, Y. (Economics, HKU) ECON2220: Intermediate Macro November 2, 2017 32 / 42
Money Growth and In�ation
The in�ation rate is closely related to the growth rate of the moneysupply.
Rewrite the last equation in growth-rate terms:
∆P/P = ∆M/M � ∆L(Y , r + πe )/L(Y , r + πe ). (7)
If the asset market is in equilibrium, the in�ation rate equals thegrowth rate of the nominal money supply minus the growth rate ofreal money demand.
Luo, Y. (Economics, HKU) ECON2220: Intermediate Macro November 2, 2017 33 / 42
(Conti.) To predict in�ation we must forecast both money supplygrowth and real money demand growth:
In long-run equilibrium, we will have i constant, so let�s look just atgrowth in Y .Let Y be the elasticity of money demand with respect to income. Thenfrom the last equation,
π = ∆M/M � ηY ∆Y /Y . (8)
Example: ∆Y /Y = 3%, Y = 2/3, ∆M/M = 10%, then π = 8%.
Luo, Y. (Economics, HKU) ECON2220: Intermediate Macro November 2, 2017 34 / 42
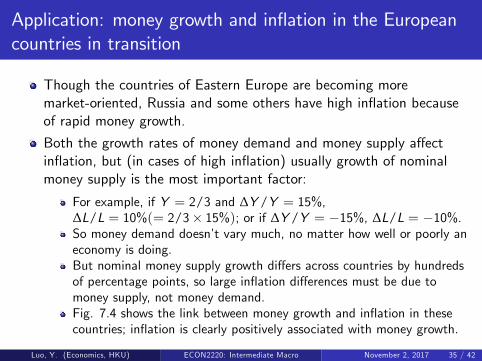
Application: money growth and in�ation in the Europeancountries in transition
Though the countries of Eastern Europe are becoming moremarket-oriented, Russia and some others have high in�ation becauseof rapid money growth.
Both the growth rates of money demand and money supply a¤ectin�ation, but (in cases of high in�ation) usually growth of nominalmoney supply is the most important factor:
For example, if Y = 2/3 and ∆Y /Y = 15%,∆L/L = 10%(= 2/3� 15%); or if ∆Y /Y = �15%, ∆L/L = �10%.So money demand doesn�t vary much, no matter how well or poorly aneconomy is doing.But nominal money supply growth di¤ers across countries by hundredsof percentage points, so large in�ation di¤erences must be due tomoney supply, not money demand.Fig. 7.4 shows the link between money growth and in�ation in thesecountries; in�ation is clearly positively associated with money growth.
Luo, Y. (Economics, HKU) ECON2220: Intermediate Macro November 2, 2017 35 / 42
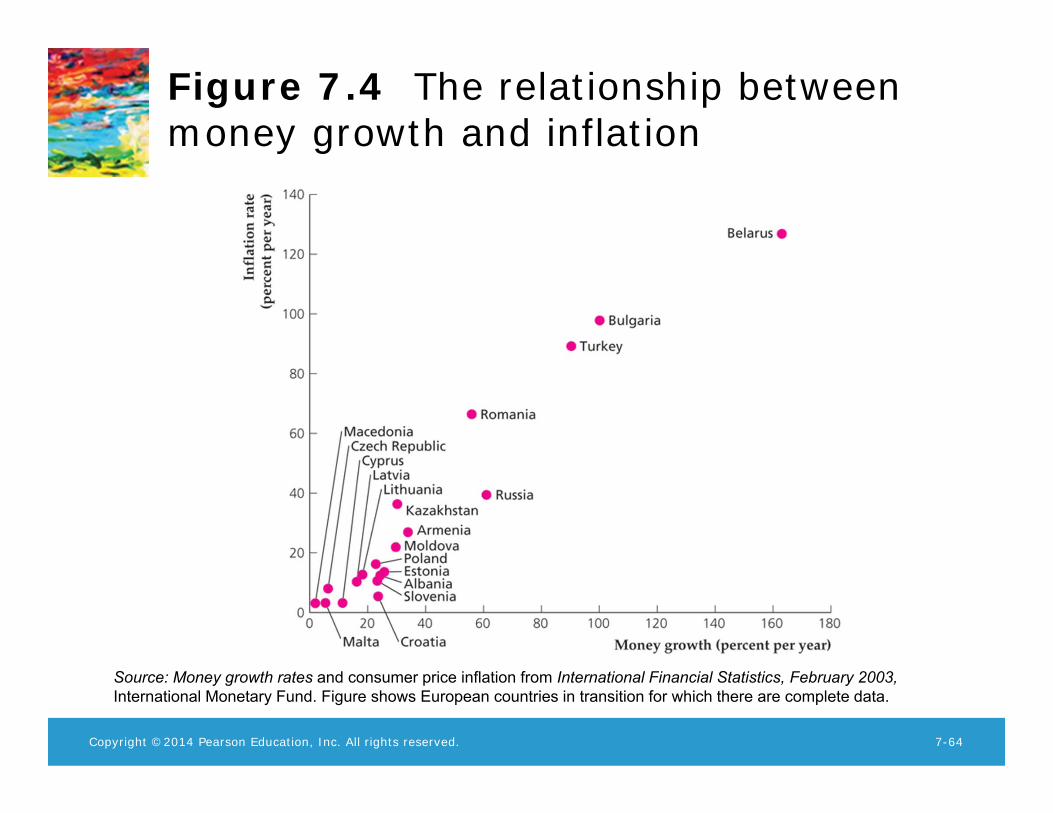
Copyright ©2014 Pearson Education, Inc. All rights reserved. 7-64
Figure 7.4 The relationship between money growth and inflation
Source: Money growth rates and consumer price inflation from International Financial Statistics, February 2003, International Monetary Fund. Figure shows European countries in transition for which there are complete data.

(Conti.) So why do countries allow money supplies to grow quickly, ifthey know it will cause in�ation?
They sometimes �nd that printing money is the only way to �nancegovernment expenditures.This is especially true for very poor countries, or countries in politicalcrisis.
Luo, Y. (Economics, HKU) ECON2220: Intermediate Macro November 2, 2017 36 / 42
The expected in�ation rate and the nominal interest rate
For a given real interest rate (r), expected in�ation (πe ) determinesthe nominal interest rate (i = r+ πe ).
What factors determine expected in�ation?
People could use the last equation, relating in�ation to the growthrates of the nominal money supply and real incomeIf people expect an increase in money growth, they would then expecta commensurate increase in the in�ation rate.The expected in�ation rate would equal the current in�ation rate ifmoney growth and income growth were stable
Luo, Y. (Economics, HKU) ECON2220: Intermediate Macro November 2, 2017 37 / 42
(Conti.) Expectations can�t be observed directly
They can be measured roughly by surveys.If real interest rates are stable, expected in�ation can be inferred fromnominal interest rates.Policy actions that cause expected in�ation to rise should causenominal interest rates to rise.
Luo, Y. (Economics, HKU) ECON2220: Intermediate Macro November 2, 2017 38 / 42
(Conti.) Fig. 7.5 plots U.S. in�ation and nominal interest rates:
In�ation and nominal interest rates have tended to move together.But the real interest rate is clearly not constant.The real interest rate was negative in the mid-1970s, then becamemuch higher and positive in the late-1970s to early-1980s.The real interest rate turned negative again following the �nancialcrisis that began in 2008.
Luo, Y. (Economics, HKU) ECON2220: Intermediate Macro November 2, 2017 39 / 42
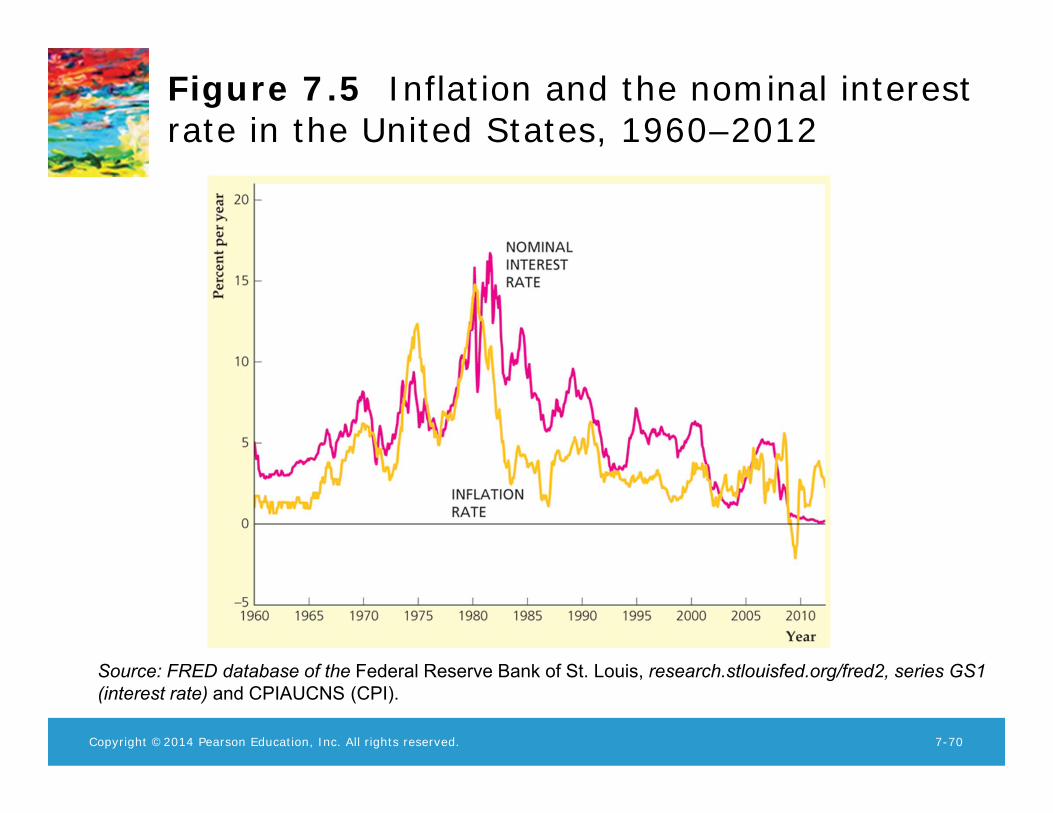
Copyright ©2014 Pearson Education, Inc. All rights reserved. 7-70
Figure 7.5 Inflation and the nominal interest rate in the United States, 1960–2012
Source: FRED database of the Federal Reserve Bank of St. Louis, research.stlouisfed.org/fred2, series GS1 (interest rate) and CPIAUCNS (CPI).
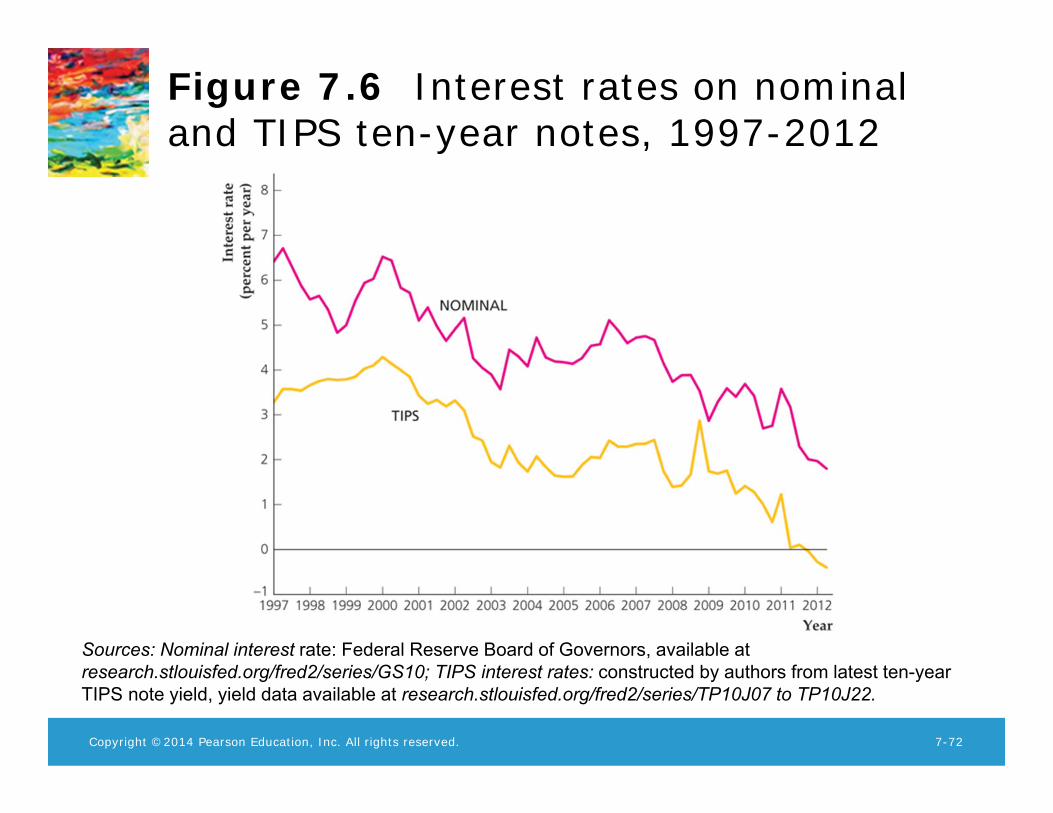
Application: measuring in�ation expectations
How do we �nd out people�s expectations of in�ation?
We could look at surveys.But a better way is to observe implicit expectations from bond interestrates.
The U.S. government issues nominal bonds and Treasury In�ationProtected Securities (TIPS)
TIPS bonds make real interest payments by adjusting interest andprincipal for in�ation.Compare nominal interest rate with real interest rate (Fig. 7.6).
Luo, Y. (Economics, HKU) ECON2220: Intermediate Macro November 2, 2017 40 / 42
Copyright ©2014 Pearson Education, Inc. All rights reserved. 7-72
Figure 7.6 Interest rates on nominal and TIPS ten-year notes, 1997-2012
Sources: Nominal interest rate: Federal Reserve Board of Governors, available at research.stlouisfed.org/fred2/series/GS10; TIPS interest rates: constructed by authors from latest ten-year TIPS note yield, yield data available at research.stlouisfed.org/fred2/series/TP10J07 to TP10J22.
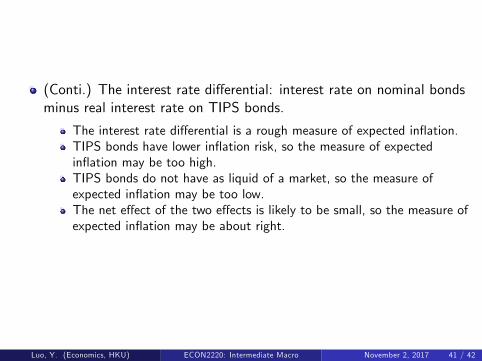
(Conti.) The interest rate di¤erential: interest rate on nominal bondsminus real interest rate on TIPS bonds.
The interest rate di¤erential is a rough measure of expected in�ation.TIPS bonds have lower in�ation risk, so the measure of expectedin�ation may be too high.TIPS bonds do not have as liquid of a market, so the measure ofexpected in�ation may be too low.The net e¤ect of the two e¤ects is likely to be small, so the measure ofexpected in�ation may be about right.
Luo, Y. (Economics, HKU) ECON2220: Intermediate Macro November 2, 2017 41 / 42
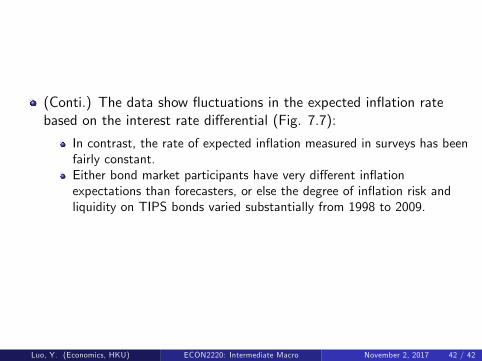
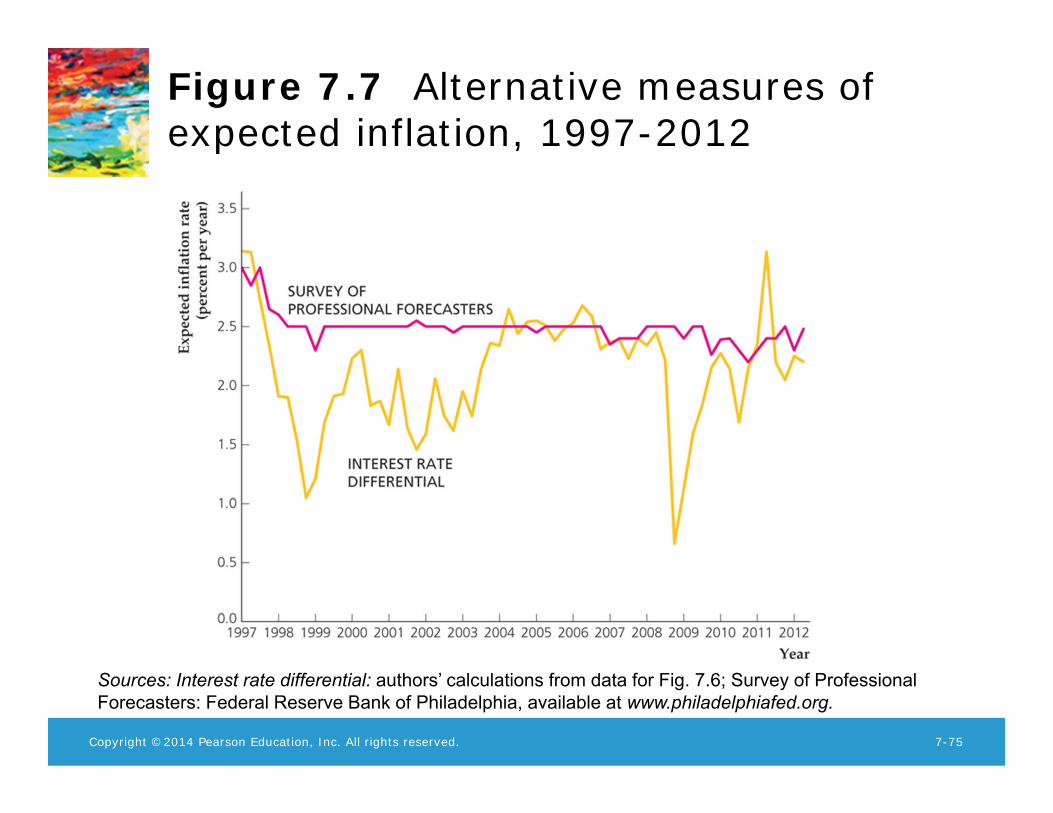
(Conti.) The data show �uctuations in the expected in�ation ratebased on the interest rate di¤erential (Fig. 7.7):
In contrast, the rate of expected in�ation measured in surveys has beenfairly constant.Either bond market participants have very di¤erent in�ationexpectations than forecasters, or else the degree of in�ation risk andliquidity on TIPS bonds varied substantially from 1998 to 2009.
Luo, Y. (Economics, HKU) ECON2220: Intermediate Macro November 2, 2017 42 / 42
Copyright ©2014 Pearson Education, Inc. All rights reserved. 7-75
Figure 7.7 Alternative measures of expected inflation, 1997-2012
Sources: Interest rate differential: authors’ calculations from data for Fig. 7.6; Survey of Professional Forecasters: Federal Reserve Bank of Philadelphia, available at www.philadelphiafed.org.