MEIS Jurnal Middle East and Islamic Studies, Volume 6 No ...
KATHOLIEKE UNIVERSITEIT LEUVEN
FACULTEIT WETENSCHAPPEN LABORATORIUM VOOR ONTWIKKELINGSFYSIOLOGIE,
GENOMICS EN PROTEOMICS
Breeding for resistance to Radopholus similis in
East African highland bananas (Musa spp.)
Promotoren: Prof. A. De Loof Prof. D. De Waele
Proefschrift voorgedragen tot het behalen van de graad van Doctor in de Wetenschappen Door Carine Dochez
November 2004
Proefschrift voorgedragen tot het behalen van de graad van Doctor in de Wetenschappen door Carine Dochez
Promotoren: Prof. A. De Loof, K.U.Leuven Prof. D. De Waele, K.U.Leuven Leden van de jury: Prof. R. Swennen, K.U. Leuven Prof. J. Coosemans, K.U. Leuven Prof. R. Huybrechts, K.U. Leuven Prof. J. Vandenbroeck, K.U. Leuven Prof. L. Tirry, R.U.G.
November 2004
Breeding for resistance to Radopholus similis in East African highland bananas (Musa spp.)
KATHOLIEKE UNIVERSITEIT LEUVEN FACULTEIT WETENSCHAPPEN
LABORATORIUM VOOR ONTWIKKELINGSFYSIOLOGIE, GENOMICS EN PROTEOMICS
I
Acknowledgements First of all, I would like to thank Prof. Dirk De Waele and Prof. Arnold De Loof for giving me the opportunity to start this PhD research and for their continuous guidance and support. Thanks Dirk, for your encouragement and regular visits to Uganda, during which I learned a lot. I also like to thank the members of the jury for their critical comments and suggestions. I like to extend my appreciation to Prof. De Langhe for reading the very first draft, and to Annemie Elsen and Nathalie Wuyts, for all the help over the e-mail and when visiting K.U.Leuven.
Financial support by the Flemish Association for Development Co-operation and Technical Assistance (VVOB) and the Directorate General for Development Co-operation (DGDC) are gratefully acknowledged. I would like to thank my colleagues at the International Institute of Tropical Agriculture who have guided me throughout the years of this research. A special thank you goes to Dr. Jim Whyte for his continuous support, guidance, encouragement and friendship. I very much appreciate the guidance of Dr. Rodomiro Ortiz, Dr. Abdou Tenkouano and Dr. Michael Pillay. I would also like to thank Philip Ragama for help with the statistical analysis, and Frances Onyango for all the administrative support. I am grateful to Dr. Asuman Sengooba and his research team from the laboratory of histology, Faculty of Veterinary Science at Makerere University in Kampala. Their help with the histological work and use of their laboratory facilities is highly appreciated. Most of all I like to thank the staff in the nematology laboratory in Sendusu. Their dedication to the work and friendship has been a great help in completing this PhD. My special thanks go to Jolly Dusabe, Moses Kiberango and Margareth Nakawunde. Thank you to all my friends in different parts of the world for the encouragement during those years. A special thank you to Mieke and Kathelyne. Finally, I like to thank my parents for their support and understanding that I like to work in the tropics.
Carine
III
Table of Contents Acknowledgements Table of contents List of tables List of figures Summary Samenvatting
I III VI
XIII XIX
XXIII Chapter 1: General introduction
1.1. Musa 1.1.1. Classification, origin, pests and diseases of Musa 1.1.2. Importance of Musa in the East African Great Lakes
Region 1.2. The root system of Musa 1.3. Nematoda
1.3.1. Biology and life cycle 1.3.2. Damage and crop losses 1.3.3. Radopholus similis (Cobb, 1893) Thorne, 1949 1.3.4. Host plant resistance to nematodes
1.4. East African highland bananas and nematodes 1.5. Aims of the study
1 1 1
4 8
10 10 11 13 14 21 25
Chapter 2: Materials and methods 2.1. Site description 2.2. Planting material
2.2.1. Sword sucker-derived plants 2.2.2. Tissue culture-derived plants
2.3. Culturing of Radopholus similis on carrot discs 2.4. Inoculation of plants with Radopholus similis
2.4.1. Individual root inoculation 2.4.2. Root system inoculation
2.5. Analysis of experiments 2.5.1. General Linear Model 2.5.2. Mixed Linear Model 2.5.3. Gompertz equation
27 27 27 27 28 28 30 30 30 31 32 32 33
IV
Chapter 3: Development of a method for screening Musa germplasm for resistance to Radopholus similis
3.1. Background and objectives 3.2. Experimental set-up 3.3. Results 3.4. Discussion
35 35 37 41 43
Chapter 4: Identifying sources of resistance and breeding for resistance to Radopholus similis
4.1. Background 4.2. The Musa breeding program of IITA 4.3. Objectives 4.4. Screening for resistance to Radopholus similis
4.4.1. Screening of East African highland bananas 4.4.2. Screening of tetraploid hybrids 4.4.3. Screening of diploids hybrids 4.4.4. Screening of secondary triploids 4.4.5. Screening of wild bananas and landraces
4.5. General discussion and conclusion
45 45 47 53 54 54 58 61 68 72 78
Chapter 5: Variability in reproductive fitness and virulence of four Radopholus similis populations from Uganda
5.1. Background and objectives 5.2. Reproductive fitness of Radopholus similis on carrot discs
5.2.1. Reproduction as a function of inoculum level 5.2.2. Reproduction as a function of time 5.2.3. Conclusion
5.3. Pathogenic variability of Radopholus similis populations from Uganda on Musa germplasm
5.3.1. Pathogenicity on IMTP genotypes 5.3.1.1. Nematode reproduction 5.3.1.2. Nematode damage 5.3.1.3. Conclusion
5.3.2. Pathogenicity on IITA Musa hybrids 5.3.2.1. Nematode reproduction 5.3.2.2. Nematode damage 5.3.2.3. Conclusion
5.4. General discussion and conclusion
83 83 85 86 87 91
92 92 93 95 98 99
100 101 104 105
V
Chapter 6: Genetic analysis of segregation for resistance to Radopholus similis in a diploid banana hybrid population
6.1. Background and objectives 6.2. Description of the diploid banana hybrid population and
experimental set-up 6.3. Results
6.3.1. Screening of parents and grandparents of a diploid banana hybrid population for resistance to Radopholus similis
6.3.2. Screening of a diploid banana hybrid population for resistance to Radopholus similis
6.4. Discussion and conclusion
109 109
111 112
112
114 124
Chapter 7: Studies on mechanisms of resistance to Radopholus similis in Musa germplasm
7.1. Background and objectives 7.2. Chemotaxis experiments 7.3. Penetration experiments 7.4. Histochemical experiments
7.4.1. Experimental set-up 7.4.2. Experiment 1: preliminary experiment 7.4.3. Experiment 2: lignin and phenolic compounds in
function of time of nematode infection 7.4.4. Experiment 3: relation between of cells with
phenolic compounds and lignin, and two different Radopholus similis populations
7.5. General discussion and conclusion
127 127 130 133 137 137 139
147
151 154
Chapter 8: Conclusions and recommendations
161
References
167
Annexes Annex 1: List of publications Annex 2: List of abstracts Annex 3: Guidance to undergraduate students
193 193 193 195
VI
List of Tables Table 1.1: Production, consumption, area harvested and yield of
cooking and beer bananas in the East African Great Lakes Region.
Table 1.2: Relative importance of cooking and beer bananas in
Uganda compared with other staple food crops. Table 1.3: List of Musa genotypes with resistance to Radopholus
similis.
5
6
19
Table 2.1: Identification of the host response to Radopholus similis of Musa hybrids based on a comparison with the host response of a susceptible (Valery) and a resistant (Yangambi km5) reference cultivar.
32
Table 3.1: Nematode reproduction and percentage root necrosis in primary root segments of Musa genotypes, 8 weeks after inoculation with 50 Radopholus similis females (Pi) per primary root segment.
42
Table 4.1: Evaluation steps of IITA’s Musa breeding materials in sub-Saharan Africa.
Table 4.2: Seed set by clone sets of East African highland bananas
pollinated with Calcutta 4 (AA). Table 4.3: East African highland bananas included in the
Radopholus similis screening experiments. Table 4.4: Nematode reproduction and percentage root necrosis
on East African highland bananas, 8 weeks after individual root inoculation with 50 Radopholus similis females (Pi).
Table 4.5: Nematode reproduction and percentage root necrosis
on East African highland bananas and Calcutta 4, 8 weeks after individual root inoculation with 50 Radopholus similis females (Pi).
51
52
55
56
56
VII
Table 4.6: Nematode reproduction and percentage root necrosis on East African highland bananas, 8 weeks after individual root inoculation with 50 Radopholus similis females (Pi).
Table 4.7: Nematode reproduction and percentage root necrosis
on tetraploid hybrids, 8 weeks after individual root inoculation with 50 Radopholus similis females (Pi).
Table 4.8: Nematode reproduction and percentage root necrosis
on tetraploid hybrids, 8 weeks after individual root inoculation with 50 Radopholus similis females (Pi).
Table 4.9: Nematode reproduction and percentage root necrosis
on East African highland bananas and tetraploid hybrids, 12 weeks after root system inoculation with 1000 Radopholus similis.
Table 4.10: Nematode reproduction and percentage root necrosis
on diploid hybrids, 8 weeks after individual root inoculation with 50 Radopholus similis females (Pi).
Table 4.11: Nematode reproduction and percentage root necrosis
on diploid hybrids, 8 weeks after individual root inoculation with 50 Radopholus similis females (Pi).
Table 4.12: Nematode reproduction and percentage root necrosis
on diploid hybrids, 12 weeks after root system inoculation with 1000 Radopholus similis.
Table 4.13: Nematode reproduction and percentage root necrosis
on diploid hybrids, 8 weeks after individual root inoculation with 50 Radopholus similis females (Pi).
Table 4.14: Nematode reproduction and percentage root necrosis
on secondary triploids, 8 weeks after individual root inoculation with 50 Radopholus similis females (Pi).
Table 4.15: Nematode reproduction and percentage root necrosis
on secondary triploids, 8 weeks after individual root inoculation with 50 Radopholus similis females (Pi).
57
59
59
61
63
63
65
67
69
70
VIII
Table 4.16: Nematode reproduction and percentage root necrosis on secondary triploids, 8 weeks after individual root inoculation with 50 Radopholus similis females (Pi).
Table 4.17: Characteristics of wild bananas and landraces
screened for resistance to Radopholus similis. Table 4.18: Nematode reproduction and percentage root necrosis
on germplasm of Papua New Guinea, 8 weeks after individual root inoculation with 50 Radopholus similis females (Pi).
Table 4.19: Nematode reproduction and percentage root necrosis
on wild bananas and landraces, 8 weeks after individual root inoculation with 50 Radopholus similis females (Pi).
Table 4.20: Nematode reproduction and percentage root necrosis
on wild bananas and landraces, 8 weeks after individual root inoculation with 50 Radopholus similis females (Pi).
Table 4.21: Nematode reproduction and percentage root necrosis
on wild bananas and landraces, 8 weeks after individual root inoculation with 50 Radopholus similis females (Pi).
Table 4.22: Overview of host responses of landraces, wild bananas
and IITA’s breeding materials to Radopholus similis based on the individual root inoculation method.
71
74
75
76
76
77
80
Table 5.1: Effect of inoculum level (Pi) on the reproduction of four Radopholus similis populations from Uganda on carrot discs, 6 weeks after inoculation.
Table 5.2: Effect of time on the reproduction of four Radopholus
similis populations from Uganda on carrot discs, 3 to 7 weeks (W) after inoculation with 25 Radopholus similis females (Pi).
87
89
IX
Table 5.3: Lag phase, maximum growth rate and asymptotic value describing the growth of four Radopholus similis populations from Uganda on carrot discs, after inoculation with 25 females (Pi).
Table 5.4: List of selected IMTP genotypes included in the
pathogenicity testing of three Radopholus similis populations from Uganda.
Table 5.5: Nematode reproduction of three Radopholus similis
populations from Uganda on nine IMTP genotypes, 8 weeks after inoculation with 1000 nematodes.
Table 5.6: Fresh root weight (g) of nine IMTP genotypes inoculated
with three Radopholus similis populations from Uganda, 8 weeks after inoculation with 1000 nematodes.
Table 5.7: Percentage root necrosis of nine IMTP genotypes
inoculated with three Radopholus similis populations from Uganda, 8 weeks after inoculation with 1000 nematodes.
Table 5.8: List of selected IITA hybrids included in pathogenicity
testing of four Radopholus similis populations from Uganda. Table 5.9: Reproduction of four Radopholus similis populations
from Uganda on five Musa genotypes, 12 weeks after inoculation with 1000 nematodes.
Table 5.10: Fresh root weight (g) of five Musa genotypes
inoculated with four Radopholus similis populations from Uganda, 12 weeks after inoculation with 1000 nematodes.
Table 5.11: Percentage root necrosis of five Musa genotypes
inoculated with four Radopholus similis populations from Uganda, 12 weeks after inoculation with 1000 nematodes.
91
93
94
95
97
99
100
102
103
Table 6.1: Nematode reproduction and percentage root necrosis on parents and grandparents of a diploid banana hybrid population, 8 weeks after individual root inoculation with 50 Radopholus similis females (Pi).
113
X
Table 6.2: Nematode reproduction and percentage root necrosis on a diploid banana hybrid population, 8 weeks after individual root inoculation with 50 Radopholus similis females (Pi).
Table 6.3: Nematode reproduction and percentage root necrosis
on a diploid banana hybrid population, 8 weeks after individual root inoculation with 50 Radopholus similis females (Pi).
Table 6.4: Nematode reproduction and percentage root necrosis
on a diploid banana hybrid population, 8 weeks after individual root inoculation with 50 Radopholus similis females (Pi).
Table 6.5: Nematode reproduction and percentage root necrosis
on a diploid banana hybrid population, 8 weeks after individual root inoculation with 50 Radopholus similis females (Pi).
Table 6.6: Nematode reproduction and percentage root necrosis
on a diploid banana hybrid population, 8 weeks after individual root inoculation with 50 Radopholus similis females (Pi).
Table 6.7: Nematode reproduction and percentage root necrosis
on a diploid banana hybrid population, 8 weeks after individual root inoculation with 50 Radopholus similis females (Pi).
Table 6.8: Nematode reproduction and percentage root necrosis
on a diploid banana hybrid population, 8 weeks after individual root inoculation with 50 Radopholus similis females (Pi).
Table 6.9: Nematode reproduction and percentage root necrosis
on a diploid banana hybrid population, 8 weeks after individual root inoculation with 50 Radopholus similis females (Pi).
115
115
116
116
117
117
118
118
XI
Table 6.10: Nematode reproduction and percentage root necrosis on a diploid banana hybrid population, 8 weeks after individual root inoculation with 50 Radopholus similis females (Pi).
Table 6.11: Nematode reproduction and percentage root necrosis
on a diploid banana hybrid population, 8 weeks after individual root inoculation with 50 Radopholus similis females (Pi).
Table 6.12: Nematode reproduction and percentage root necrosis
on a diploid banana hybrid population, 8 weeks after individual root inoculation with 50 Radopholus similis females (Pi).
Table 6.13: Nematode reproduction and percentage root necrosis
on a diploid banana hybrid population, 8 weeks after individual root inoculation with 50 Radopholus similis females (Pi).
Table 6.14: Nematode reproduction and percentage root necrosis
on a diploid banana hybrid population, 8 weeks after individual root inoculation with 50 Radopholus similis females (Pi).
Table 6.15: Identification of the host response to Radopholus
similis of a diploid banana hybrid population based on a comparison with the host response of a susceptible (Valery) and a resistant (Yangambi km5) reference cultivar.
Table 6.16: Gametic and zygotic configurations in a diploid banana
hybrid population. Table 6.17: Observed and expected segregation ratios for
nematode resistance in a diploid banana population derived from TMB2x 6142-1 x TMB2x 8075-7.
119
119
120
120
121
121
123
123
Table 7.1: Scoring of cells containing phenolic compounds.
139
XII
Table 7.2: Presence or absence of lignified cells in the endodermis and root cortex of uninfected (C) and infected Musa cultivars (X, Y, Z), 4 months after inoculation with 1000 Radopholus similis.
Table 7.3: Presence or absence of lignified cells in the endodermis
of uninfected and Radopholus similis infected Musa cultivars in function of time (weeks after inoculation).
Table 7.4: Presence or absence of lignin in the endodermis of
Radopholus similis infected roots.
143
147
153
XIII
List of Figures Figure 1.1: Major banana growing areas in Uganda. Figure 1.2: Banana market in Kampala, Uganda. Figure 1.3: A banana field in Central Uganda with toppled plants
due to nematode infection. Figure 1.4: Research outline of the study.
4
6
12
26
Figure 2.1: Paring of a banana corm. Figure 2.2: Hot water treatment of pared banana corms. Figure 2.3: Map of Uganda showing the origin of the Radopholus
similis populations studied. 1: Ikulwe; 2: Mukono; 3: Namulonge; 4: Mbarara.
Figure 2.4: Biological parameters of a growth curve.
28
28
29
34
Figure 3.1: Selection of primary banana roots for individual inoculation with Radopholus similis.
Figure 3.2: Individual root inoculation of a primary banana root
with 50 Radopholus similis females. Figure 3.3: Excavated cup with root segment, 8 weeks after
inoculation with Radopholus similis.
39
40
40
Figure 4.1: IITA’s Musa breeding scheme. Figure 4.2: Kikundi Figure 4.3: Merik
49
73
73
Figure 5.1: Radopholus similis males expressed in percentage of the total adult (males + females) Radopholus similis population produced during the duration (7 weeks) of the experiment.
89
XIV
Figure 5.2: Growth of four Radopholus similis populations from Uganda on carrot discs at 28°C, after inoculation with 25 females, based on the Gompertz equation.
Figure 5.3: Nematode reproduction of three Radopholus similis
populations from Uganda on nine IMTP genotypes, 8 weeks after inoculation with 1000 nematodes.
Figure 5.4: Percentage reduction in fresh root weight of nine IMTP
genotypes inoculated with three Radopholus similis populations from Uganda, 8 weeks after inoculation with 1000 nematodes.
Figure 5.5: Percentage root necrosis of nine IMTP genotypes
inoculated with three Radopholus similis populations from Uganda, 8 weeks after inoculation with 1000 nematodes.
Figure 5.6: Nematode population densities on five Musa genotypes
inoculated with four Radopholus similis populations from Uganda, 12 weeks after inoculation with 1000 nematodes.
Figure 5.7: Percentage reduction in fresh root weight of five Musa
genotypes inoculated with four Radopholus similis populations from Uganda, 12 weeks after inoculation with 1000 nematodes.
Figure 5.8: Percentage root necrosis on five Musa genotypes
inoculated with four Radopholus similis populations from Uganda, 12 weeks after inoculation with 1000 nematodes.
90
94
96
98
101
102
104
Figure 6.1: Pedigree of the diploid banana hybrid population used in the segregating study.
111
Figure 7.1: Petri dish divided in nine equal zones; banana root segment placed in zone 1 and 25 Radopholus similis females placed in zone 5.
Figure 7.2: Zonal distribution of Radopholus similis towards roots
from either Valery or Yangambi km5, 4 hours after inoculation with 25 Radopholus similis females in zone 5.
130
XV
Root placed in zone 1. Control without roots. Figure 7.3: Zonal distribution of Radopholus similis towards roots
from either Valery or Yangambi km5, 24 hours after inoculation with 25 Radopholus similis females in zone 5. Root placed in zone 1. Control without roots.
Figure 7.4: Zonal distribution of Radopholus similis towards roots
from Valery (zone 1) and Yangambi km5 (zone 9) simultaneously, 4 and 24 hours after inoculation with 50 Radopholus similis females in zone 5.
Figure 7.5: Percentage penetration of Radopholus similis at
different time intervals after inoculation of 200 Radopholus similis females on root segments of the cultivars Yangambi km5, Valery and Pisang Jari Buaya.
Figure 7.6: Percentage penetration of Radopholus similis at
different time intervals after inoculation of 200 Radopholus similis females on root segments of the cultivars Enzirabahima and TMB2x 9128-3.
Figure 7.7: Percentage penetration of Radopholus similis at
different time intervals after inoculation of 200 Radopholus similis females on root segments of the cultivars Yamgambi km5, TMHx 917K-2 and Mbwazirume.
Figure 7.8: Percentage penetration of Radopholus similis at
different time intervals after inoculation of 200 Radopholus similis females on root segments of the cultivars Grande Naine, Valery and Yangambi km5.
Figure 7.9: Root sections for histological analysis taken near the
corm (X), in the middle of the root (Y) and at the root tip (Z).
Figure 7.10: Final nematode population densities and percentage
root necrosis on six banana cultivars, 4 months after inoculation with 1000 Radopholus similis. 1: Pisang Jari Buaya; 2: Yangambi km5; 3: TMB2x 9128-3; 4: TMHx 917K-2;
131
131
132
134
135
135
136
140
XVI
5: Valery; 6: Mbwazirume. Figure 7.11: Score of cells with phenolic compounds in the cortex
of root sections taken at three different locations in the root.
Figure 7.12: Score of cells with phenolic compounds in the central
cylinder of root sections taken at three different locations in the root.
Figure 7.13: Phenolic cells in the central cylinder and cortex of
TMHx 917K-2, 4 months after inoculation with Radopholus similis.
Figure 7.14: Phenolic cells in the central cylinder and cortex of
Yangambi km5, 4 months after inoculation with Radopholus similis.
Figure 7.15: Phenolic cells in the central cylinder, but not in the
cortex of Mbwazirume, 4 months after inoculation with Radopholus similis.
Figure 7.16: No lignified cell walls in Yangambi km5, 4 months
after inoculation with Radopholus similis. Figure 7.17: Lignified cell walls in the endodermis of Valery, 4
months after inoculation with Radopholus similis. Figure 7.18: Lignified cell walls in the endodermis of Mbwazirume,
4 months after inoculation with Radopholus similis. Figure 7.19: Score of cells with phenolic compounds in control and
Radopholus similis infected plants of Valery in function of time.
Figure 7.20: Score of cells with phenolic compounds in control and
Radopholus similis infected plants of Yangambi km5 in function of time.
141
142
142
145
145
145
146
146
146
148
148
XVII
Figure 7.21: Score of cells with phenolic compounds in control and Radopholus similis infected plants of TMB2x 9128-3 in function of time.
Figure 7.22: Score of cells with phenolic compounds in control and
Radopholus similis infected plants of Mbwazirume in function of time.
Figure 7.23: Final nematode population densities of Radopholus
similis on four Musa cultivars in function of time.
Figure 7.24: Score of cells with phenolic compounds on four Musa cultivars in function of time.
Figure 7.25: Final nematode population densities of two
Radopholus similis populations on five Musa cultivars. Figure 7.26: Score of cells with phenolic compounds on five Musa
cultivars in function of nematode populations. Figure 7.27: Outline of the various branches of the
phenylpropanoid pathway of secondary metabolism in plants leading to production of macromolecules involved in resistance to biotic and abiotic stresses.
149
149
150
150
152
152
158

XVIII
XIX
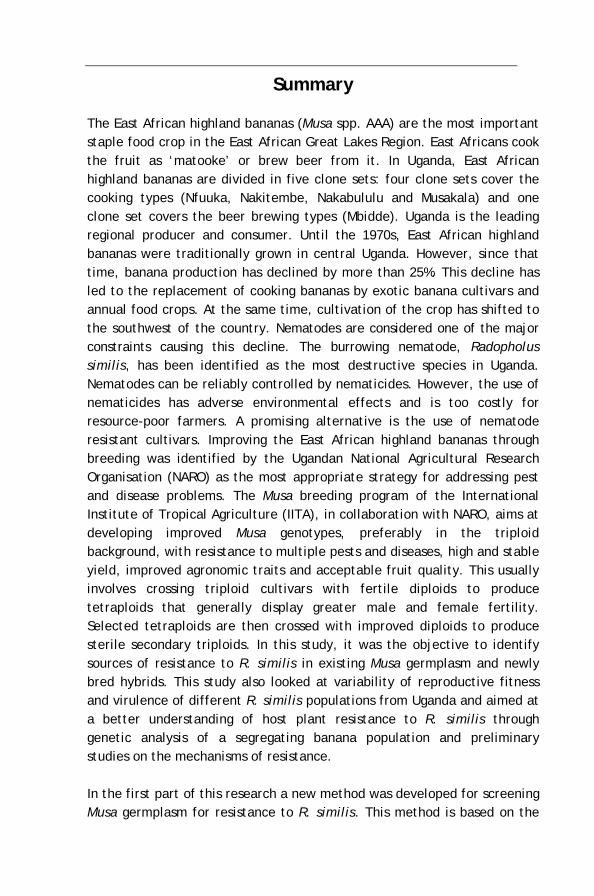
Summary The East African highland bananas (Musa spp. AAA) are the most important staple food crop in the East African Great Lakes Region. East Africans cook the fruit as ‘matooke’ or brew beer from it. In Uganda, East African highland bananas are divided in five clone sets: four clone sets cover the cooking types (Nfuuka, Nakitembe, Nakabululu and Musakala) and one clone set covers the beer brewing types (Mbidde). Uganda is the leading regional producer and consumer. Until the 1970s, East African highland bananas were traditionally grown in central Uganda. However, since that time, banana production has declined by more than 25%. This decline has led to the replacement of cooking bananas by exotic banana cultivars and annual food crops. At the same time, cultivation of the crop has shifted to the southwest of the country. Nematodes are considered one of the major constraints causing this decline. The burrowing nematode, Radopholus similis, has been identified as the most destructive species in Uganda. Nematodes can be reliably controlled by nematicides. However, the use of nematicides has adverse environmental effects and is too costly for resource-poor farmers. A promising alternative is the use of nematode resistant cultivars. Improving the East African highland bananas through breeding was identified by the Ugandan National Agricultural Research Organisation (NARO) as the most appropriate strategy for addressing pest and disease problems. The Musa breeding program of the International Institute of Tropical Agriculture (IITA), in collaboration with NARO, aims at developing improved Musa genotypes, preferably in the triploid background, with resistance to multiple pests and diseases, high and stable yield, improved agronomic traits and acceptable fruit quality. This usually involves crossing triploid cultivars with fertile diploids to produce tetraploids that generally display greater male and female fertility. Selected tetraploids are then crossed with improved diploids to produce sterile secondary triploids. In this study, it was the objective to identify sources of resistance to R. similis in existing Musa germplasm and newly bred hybrids. This study also looked at variability of reproductive fitness and virulence of different R. similis populations from Uganda and aimed at a better understanding of host plant resistance to R. similis through genetic analysis of a segregating banana population and preliminary studies on the mechanisms of resistance. In the first part of this research a new method was developed for screening Musa germplasm for resistance to R. similis. This method is based on the
XX
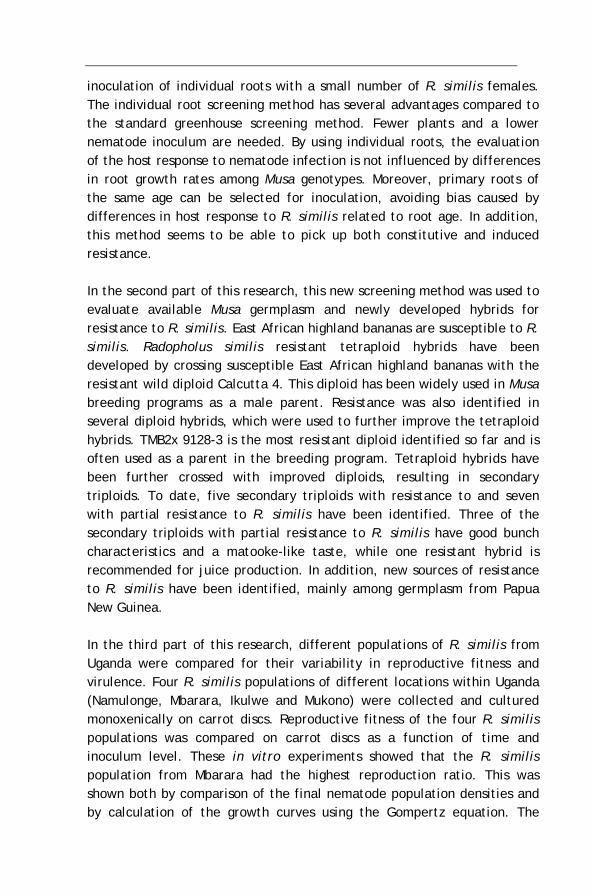
inoculation of individual roots with a small number of R. similis females. The individual root screening method has several advantages compared to the standard greenhouse screening method. Fewer plants and a lower nematode inoculum are needed. By using individual roots, the evaluation of the host response to nematode infection is not influenced by differences in root growth rates among Musa genotypes. Moreover, primary roots of the same age can be selected for inoculation, avoiding bias caused by differences in host response to R. similis related to root age. In addition, this method seems to be able to pick up both constitutive and induced resistance. In the second part of this research, this new screening method was used to evaluate available Musa germplasm and newly developed hybrids for resistance to R. similis. East African highland bananas are susceptible to R. similis. Radopholus similis resistant tetraploid hybrids have been developed by crossing susceptible East African highland bananas with the resistant wild diploid Calcutta 4. This diploid has been widely used in Musa breeding programs as a male parent. Resistance was also identified in several diploid hybrids, which were used to further improve the tetraploid hybrids. TMB2x 9128-3 is the most resistant diploid identified so far and is often used as a parent in the breeding program. Tetraploid hybrids have been further crossed with improved diploids, resulting in secondary triploids. To date, five secondary triploids with resistance to and seven with partial resistance to R. similis have been identified. Three of the secondary triploids with partial resistance to R. similis have good bunch characteristics and a matooke-like taste, while one resistant hybrid is recommended for juice production. In addition, new sources of resistance to R. similis have been identified, mainly among germplasm from Papua New Guinea. In the third part of this research, different populations of R. similis from Uganda were compared for their variability in reproductive fitness and virulence. Four R. similis populations of different locations within Uganda (Namulonge, Mbarara, Ikulwe and Mukono) were collected and cultured monoxenically on carrot discs. Reproductive fitness of the four R. similis populations was compared on carrot discs as a function of time and inoculum level. These in vitro experiments showed that the R. similis population from Mbarara had the highest reproduction ratio. This was shown both by comparison of the final nematode population densities and by calculation of the growth curves using the Gompertz equation. The
XXI
population from Mukono had the lowest reproduction ratio. Pathogenicity experiments on host plants were carried out in pot trials. Both the final nematode population densities and percentages root necrosis on different host plants were higher for the R. similis population from Mbarara than for the populations from Namulonge, Ikulwe and Mukono. The R. similis population from Mbarara managed to break the resistance of Pisang Jari Buaya, world-wide known to be resistant to R. similis. The diploid hybrid TMB2x 9128-3 and Yangambi km5 showed resistance against the four R. similis populations. These results indicate that differences in pathogenicity among different R. similis populations exist and should be taken into consideration in a breeding program. It is recommended to use the R. similis population from Mbarara in routine screening for identification of resistance in Musa germplasm. The fact that the R. similis population from Mbarara is more pathogenic than the other populations may have serious implications for farmers as Mbarara is the main banana growing area in Uganda. Recent observations in farmers’ fields in Mbarara show that R. similis infestation is localised at the moment and that those farms are heavily infested with high toppling incidence. In the fourth part of this research, we studied the genetic analysis of segregation for resistance to R. similis in a diploid banana hybrid population. This diploid banana hybrid population was derived by crossing the diploid hybrids TMB2x 6142-1 and TMB2x 8075-7. The female parent TMB2x 6142-1 is susceptible to R. similis and derived from the cross between the East African highland banana Nyamwihogora (AAA) and the wild banana Long Tavoy (AA), which are both susceptible to R. similis. The male parent TMB2x 8075-7 is resistant to R. similis and derived from the cross between the bred hybrid SH-3362 (AA) and the wild banana Calcutta 4 (AA), which are both resistant to R. similis. The diploid banana hybrid population was evaluated with the individual root inoculation method using the R. similis population from Namulonge. Of the 81 hybrids evaluated, 37 hybrids were resistant, 13 hybrids were partially resistant and 31 hybrids were susceptible to R. similis. After chi-square analysis, the results indicated that resistance to R. similis is controlled by two dominant genes, A and B, both with additive and interactive effects, whereby recessive bb suppresses dominant A (either A- or B- required for partial resistance, both A- and B- confer full resistance, but bb suppresses A-). In the last part of this research, potential mechanisms of resistance to R. similis were studied. Knowledge on the mechanisms of nematode
XXII
resistance may help the breeder to select for a desired characteristic for the breeding program, and it may also assist in the identification of resistance markers to facilitate screening of Musa germplasm. In a first set of experiments, the attraction and penetration ability of R. similis was compared among resistant and susceptible Musa cultivars. No significant differences in attraction and penetration of R. similis were observed between resistant and susceptible cultivars. Similar invasion rates of R. similis on resistant and susceptible Musa cultivars, suggests that the resistance is not due to physical or mechanical barriers. Subsequently, histo-chemical experiments were carried out to detect whether there are differences in lignin and phenolic compounds between susceptible and resistant Musa cultivars. After R. similis infection, a higher number of phenolic cells were observed in the resistant cultivars compared to the susceptible cultivars. Phenolic cells were also observed in healthy plants, though the number was lower compared to nematode infected plants. It is assumed that preformed phenolic compounds in healthy roots do not contribute to the constitutive resistance of banana to R. similis. Lignification of the endodermis was observed in the susceptible cultivars early in time. Lignification in the resistant cultivars was only observed after 12 weeks. No lignified cells were observed in the cortex of any cultivar. More detailed studies are needed to understand the role of phenolic compounds and lignin formation in relation to host plant response to nematode infection.
XXIII
Samenvatting De Oost-Afrikaanse hooglandbanaan (Musa spp. AAA) is het belangrijkste voedselgewas in de Grote Meren regio van Oost Afrika. De lokale bevolking kookt de vrucht als ‘matooke’ of er wordt bier van gebrouwen. In Oeganda worden de Oost-Afrikaanse hooglandbananen onderverdeeld in vijf groepen: vier groepen behoren tot de kookbananen (Nfuuka, Nakitembe, Nakabululu and Musakala) en een groep behoort tot de bierbananen (Mbidde). Oeganda is de grootste producent en consument van bananen in de regio. Tot in de jaren 1970 werden Oost-Afrikaanse hooglandbananen traditioneel gecultiveerd in centraal Oeganda. Sinds deze periode werd er een afname van de productie waargenomen met meer dan 25%. Deze daling heeft geleid tot de vervanging van kookbananen door exotische bananen variëteiten en éénjarige voedselgewassen. Ook de cultivatie van kookbananen is verschoven naar de zuidwestelijke regio van Oeganda. Nematoden zijn één van de belangrijkste oorzaken verantwoordelijk voor deze afname. Radopholus similis werd geïdentificeerd als de meest schadelijke nematode species in Oeganda. Nematoden kunnen bestreden worden met nematiciden, maar het gebruik van nematiciden is schadelijk voor het milieu en te duur voor de kleine boeren. Het gebruik van bananen variëteiten met resistentie tegen nematoden is een veelbelovend alternatief. Verbetering van de Oost-Afrikaanse hooglandbananen via veredeling wordt aanzien door de Nationale Landbouw Onderzoeksorganisatie (NARO) als de beste strategie om ziekten en pesten te bestrijden. Het Musa veredelingsprogramma van het International Institute of Tropical Agriculture (IITA), in samenwerking met NARO, heeft als doel om verbeterde Musa variëteiten te ontwikkelen met resistentie tegen verscheidene ziekten en pesten, verbeterde agronomische karakteristieken, een hoge opbrengst en een goede vrucht kwaliteit. Het doel in dit onderzoek was om bronnen van resistentie tegen R. similis te identificeren, zowel in bestaande bananen variëteiten als in nieuwe hybriden. Dit onderzoek bestudeerde ook de variabiliteit in pathogeniciteit van verschillende R. similis populaties in Oeganda. Ook werd er getracht om een beter inzicht te krijgen in de resistentie van de waardplant via een genetische analyse van een segregerende bananen populatie en via studies over het mechanisme van resistentie tegen R. similis. In het eerste gedeelte van dit onderzoek werd een nieuwe methode ontwikkeld voor het testen van Musa variëteiten voor resistentie tegen R. similis. Deze methode is gebaseerd op de inoculatie van individuele
XXIV
wortels met een klein aantal nematoden. Deze methode heeft als voordeel, in vergelijking met de klassieke pot test, dat een kleiner aantal planten en nematoden zijn nodig. Door het gebruik van individuele wortels wordt de test niet beïnvloed door verschillen in groeisnelheid van de wortels van de verschillende Musa variëteiten. Daarenboven kunnen wortels geselecteerd worden van dezelfde leeftijd. Deze methode heeft ook het voordeel van zowel constitutieve als geïnduceerde resistentie te identificeren. In het tweede gedeelte van dit onderzoek werd deze nieuwe methode gebruikt voor het testen van bestaande bananen variëteiten en nieuwe hybriden voor resistentie tegen R. similis. De Oost-Afrikaanse hooglandbananen zijn vatbaar voor R. similis. Tetraploïde hybriden met resistentie tegen R. similis werden ontwikkeld door kruisingen tussen de vatbare Oost Afrikaanse hooglandbananen en de resistente wilde diploïde banaan, Calcutta 4. Calcutta 4 wordt vaak gebruikt in de veredelingsprogramma’s. Verscheidene resistente diploïde hybriden werden geïdentificeerd, waarvan TMB2x 9182-3 de meest resistente is. Tetraploïde hybriden worden verder gekruist met verbeterde diploïde hybriden, om secundaire triploïden te bekomen. Vijf secundaire triploïden met resistentie en zeven met gedeeltelijke resistentie tegen R. similis werden geïdentificeerd. Drie van deze secundaire triploïden hebben een goede opbrengst en behouden de smaak van de hooglandbananen. Eén van de resistente triploïden kan gebruikt worden voor de productie van vruchtensap. Ook werden nieuwe bronnen van resistentie tegen R. similis geïdentificeerd in variëteiten van Papua Nieuw Guinea. In het derde gedeelte van dit onderzoek, werden verschillende R. similis populaties van Oeganda vergeleken voor variabiliteit in reproductie en virulentie. Vier R. similis populaties van verschillende locaties in Oeganda (Namulonge, Mbarara, Ikulwe and Mukono) werden verzameld en gekweekt op wortelschijfjes. De reproductie van de vier R. similis populaties werd vergeleken op wortelschijfjes in functie van de tijd en inoculum niveau. De Gompertz vergelijking werd gebruikt om de groei van de R. similis populaties te evalueren in functie van de tijd. De R. similis populatie van Mbarara had een hogere reproductie in vergelijking met de andere populaties. De populatie van Mukono had de laagste reproductie. Pathogeniciteits studies werden uitgevoerd op waardplanten in pot experimenten. Zowel de nematoden reproductie als het percentage wortelschade was het hoogste voor de R. similis populatie van Mbarara.
XXV
Deze populatie vertoonde ook een hoge reproductie op de resistente variëteit Pisang Jari Buaya. De diploïde hybride TMB2x 9128-3 and Yangambi km5 waren resistent tegen de vier R. similis populaties. Deze resultaten bevestigen dat er verschillen in pathogeniciteit bestaan tussen verschillende R. similis populaties en dit moet in rekening gebracht worden in het veredelingsprogramma. Het wordt aangeraden om de R. similis populatie van Mbarara te gebruiken in de routine evaluatie van bananen variëteiten voor resistentie. Het feit dat de R. similis populatie van Mbarara meer pathogeen is dan de andere populaties kan ernstige implicaties hebben voor de boeren in Mbarara. Observaties in bananenvelden in Mbarara tonen aan dat R. similis infestatie is gelokaliseerd. Deze velden zijn echter zwaar geïnfesteerd en het ontwortelen van de bananenplanten komt vaak voor. In het vierde gedeelte van dit onderzoek werd de genetische analyse bestudeerd van een segregerende bananen populatie. Deze diploïde bananen populatie was het resultaat van kruisingen tussen de diploïde hybriden TMB2x 6142-1 and TMB2x 8075-7. TMB2x 6142-1 is vatbaar voor R. similis en werd bekomen door de kruising tussen de Oost Afrikaanse hooglandbanaan Nyamwihogora (AAA) en de wilde banaan Long Tavoy (AA), die beiden vatbaar zijn voor R. similis. TMB2x 8075-7 is resistent tegen R. similis en werd bekomen door de kruising tussen de hybride SH-3362 (AA) en de wilde banaan Calcutta 4 (AA), die beiden resistent zijn tegen R. similis. De hybride populatie werd geëvalueerd voor resistentie tegen R. similis met de individuele wortel inoculatie methode waarbij de R. similis populatie van Namulonge werd gebruikt. In totaal werden 81 hybriden geëvalueerd: 37 hybriden waren resistent, 13 hybriden waren gedeeltelijk resistent en 31 hybriden waren vatbaar voor R. similis. Deze resultaten tonen aan dat resistentie tegen R. similis wordt gecontroleerd door twee dominante genen, A en B, met addititieve en interactieve effecten, waarbij de recessieve bb de dominante A onderdrukt (ofwel A of B zijn nodig voor gedeeltelijke resistentie, zowel A en B zijn nodig voor volledige resistentie, maar bb onderdrukt A). In het laatste gedeelte van dit onderzoek werden potentiële resistentiemechanismen bestudeerd. Studies met betrekking tot het werkingsmechanisme van nematoden resistentie kan de veredelaar helpen om een gewenst kenmerk te selecteren voor veredeling, en het kan ook bijdragen tot het ontwikkelen van merkers om de evaluatie van Musa variëteiten te vergemakkelijken. De aantrekking en penetratie van R.
XXVI
similis werd bestudeerd in resistente en vatbare bananen variëteiten. Er werden geen verschillen vastgesteld in aantrekking en penetratie van R. similis in resistente en vatbare variëteiten. Dit resultaat doet vermoeden dat de resistentie niet het gevolg is van mechanische hindernissen. Vervolgens werden er histochemische experimenten uitgevoerd om verschillen in lignine en fenolen vast te stellen tussen resistente en vatbare bananen variëteiten. Na infectie met R. similis werden er meer fenolen geobserveerd in de resistentie variëteiten in vergelijking met de vatbare. Fenolen werden ook waargenomen in gezonde bananenplanten, maar het aantal was lager in vergelijking met de geïnfecteerde planten. Het wordt verondersteld dat deze voorgevormde fenolen niet belangrijk zijn in het resistentie mechanisme. Lignificatie van de endodermis werd vastgesteld in een vroeg stadium in de vatbare variëteiten, maar later in de resistente variëteiten. Er werd geen lignificatie vastgesteld in de cortex. Meer gedetailleerde experimenten zijn nodig om de rol van fenolen en lignine te begrijpen als respons tegen nematoden infectie.
CHAPTER 1 1
Chapter 1: General Introduction
1.1. Musa 1.1.1. Classification, origin, pests and diseases of Musa Bananas and plantains (Musa spp.) are herbaceous, perennial monocotyledonous plants which grow in the tropics and subtropics. The genus Musa belongs to the family Musaceae which belongs to the order Zingiberales (Stover and Simmonds, 1987). The fruit is a major commodity in international trade, though it is much more important as a local staple food crop. Roughly one-third of the total world production of bananas and plantains is produced in Latin America and the Caribbean, one-third in Africa and one-third in the Asia-Pacific region (Jones, 2000). Bananas produced for export account for about 13% of the total world-wide Musa production and are mainly from Latin America and the Caribbean that export almost exclusively giant Cavendish types (Frison and Sharrock, 1999). Bananas and plantains are predominantly grown in household gardens and smallholdings, mainly in the tropics and the subtropics, and provide food to millions of people. They produce fruit all year round and as such provide a continuous supply of nutritious food and a steady cash income (Jones, 2000). Bananas and plantains are propagated vegetatively by means of corms and suckers, although the wild species also propagate by seed (Stover and Simmonds, 1987). Bananas and plantains have a basic chromosome number of x = 11, with either 22 (diploid), 33 (triploid) or 44 (tetraploid) chromosomes (Stover and Simmonds, 1987). Wild banana species are seedy and can still be found in natural forests (Robinson, 1996). Bananas originated in Southeast Asia from two wild progenitors, Musa acuminata Colla and Musa balbisiana Colla, and have been spread throughout the humid tropics. Edible bananas originated from intra- and interspecific hybrids of those two diploid wild bananas. The first step in the evolution of the edible banana was the development of parthenocarpic diploid AA cultivars (Simmonds, 1962). Parthenocarpy is the ability to develop fruit without fertilisation. This fruit has fewer seeds thereby increasing edibility. At the same time, selection for female sterility occurred which also lowered the number of seeds (Jones, 2000). Parthenocarpic diploid AA cultivars are most probably derived from Musa acuminata ssp. banksii and Musa acuminata ssp. errans (Jones, 2000).
CHAPTER 1 2
Ploidy levels vary among the different cultivars and groups of Musa and are designated by A and B to represent the genomes of M. acuminata and M. balbisiana, respectively. As such, the most important cultivars are categorised as the AAA dessert bananas, AAA highland cooking and beer bananas, AAB plantains and ABB cooking bananas. The majority of cultivated Musa are triploids (2n = 3x = 33), although diploid and tetraploid cultivars are also available and might be locally important (Vuylsteke et al., 1993; Vuylsteke, 2001). Southeast Asia is considered to be the center of origin of Musa species. Papua New Guinea hosts many primitive AA diploids. This area may be the first center of domestication of the edible banana (Jones, 2000). The first range of edible diploids and polyploids was the result of domestication through vegetative propagation (De Langhe, 2000a). A great diversity of bananas and plantains exists in sub-Saharan Africa. The various types of Musa cultivated in sub-Saharan Africa are specific to the different eco-regions (Swennen and Vuylsteke, 1991). The AAB plantains are predominant in the humid lowlands of West and Central Africa while the AAA cooking and beer bananas prevail in the East African highlands. These two eco-regions harbour the world’s greatest diversity of plantains and highland bananas, respectively, and are considered secondary centers of plantain and banana diversification (Swennen, 1990). Secondary diversification is a result of human selection and somatic mutations during the long history of the crop’s cultivation in Africa (De Langhe, 1969; Stover and Simmonds, 1987; Vuylsteke, 2001). Triploidy developed following the fertilisation with haploid pollen of viable diploid egg cells, which developed from abnormal megasporogenesis at the second division. Triploids are bigger, sturdier plants than diploids with increased fruit size. Diploids can usually be distinguished from triploids because of their more slender pseudostem and more upright leaves. Tetraploids have robust pseudostems and leaves that tend to droop (Jones, 2000). The AAA genomic group contains some of the most productive cultivars. Major AAA subgroups are Gros Michel, Cavendish and Lujugira-Mutika. The first two subgroups are dessert bananas, the third one are East African highland bananas. Of the total world’s Musa production, the Cavendish subgroup is responsible for about 30% and the Lujugira-Mutika subgroup for 18% of this production. The fruit of the Lujugira-Mutika group, like fruit from other AAA cultivars, is sweet when ripe. However, in
CHAPTER 1 3
East Africa the fruit is cooked as ‘matooke’ or used for brewing beer (Jones, 2000). The cooking and beer bananas that are common in the secondary center of diversification in the highlands of East Africa contain genetic components of M. acuminata ssp. banksii and M. acuminata ssp. Zebrina (Carreel et al., 2002). The latter subspecies is indigenous in western Indonesia, so the progenitor of the East African highland bananas may have its origin in western Indonesia (Jones, 2000). From the perspective of plant pathology, M. acuminata ssp. banksii and M. acuminata ssp. errans are more susceptible to diseases than other Musa species and M. acuminata subspecies. If edible bananas inherited some genes from M. acuminata ssp. banksii and M. acuminata ssp. errans, it can explain their susceptibility to certain diseases (Jones, 2000). Genes for hardiness, drought and disease tolerance, and increased starchiness were contributed by the B genome of M. balbisiana (Robinson, 1996). The most important disease affecting bananas and plantains world-wide is black Sigatoka, caused by the air-borne fungus Mycosphaerella fijiensis Morelet (Carlier et al., 2000). The pathogen causes severe leaf necrosis, leading to reduced yields. Panama disease or Fusarium wilt is a very destructive disease of banana, caused by the soil-borne fungus Fusarium oxysporum f. sp. cubense (E.F.Smith) Snyder and Hansen. This pathogen colonises the xylem of susceptible banana cultivars and causes lethal vascular wilt (Ploetz and Pegg, 2000). Another soil-borne disease is Moko disease, caused by the bacterium Pseudomonas solanacearum (Thwaites et al., 2000). The most important virus diseases are banana bunchy top disease (Thomas and Iskra-Caruana, 2000) and banana streak disease (Lockhart and Jones, 2000). Nematodes are considered the most important pest of bananas and plantains. The most damaging nematodes on bananas and plantains are migratory endoparasites (section 1.3.2): the burrowing nematode Radopholus similis (Cobb) Thorne, the root-lesion nematodes Pratylenchus goodeyi Sher and Allen and Pratylenchus coffeae (Zimmerman) Filipjev and Schuurmans Stekhaven, and the spiral nematode Helicotylenchus multicinctus (Cobb) Golden (De Waele, 1996). The principal insect pest of bananas and plantains is the banana weevil, Cosmopolites sordidus Germar, whose larvae bore tunnels in the corm, thus weakening the plant (Gowen, 1995).
CHAPTER 1 4
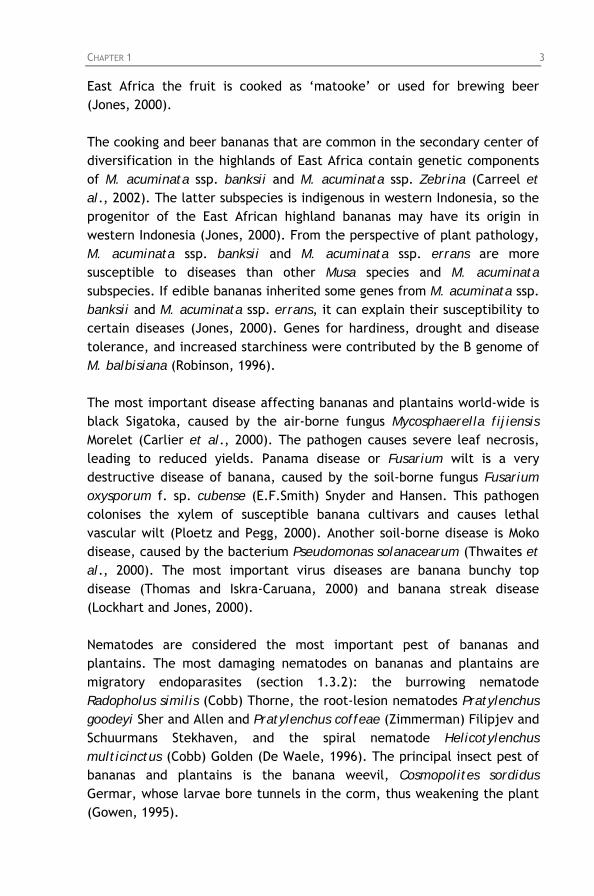
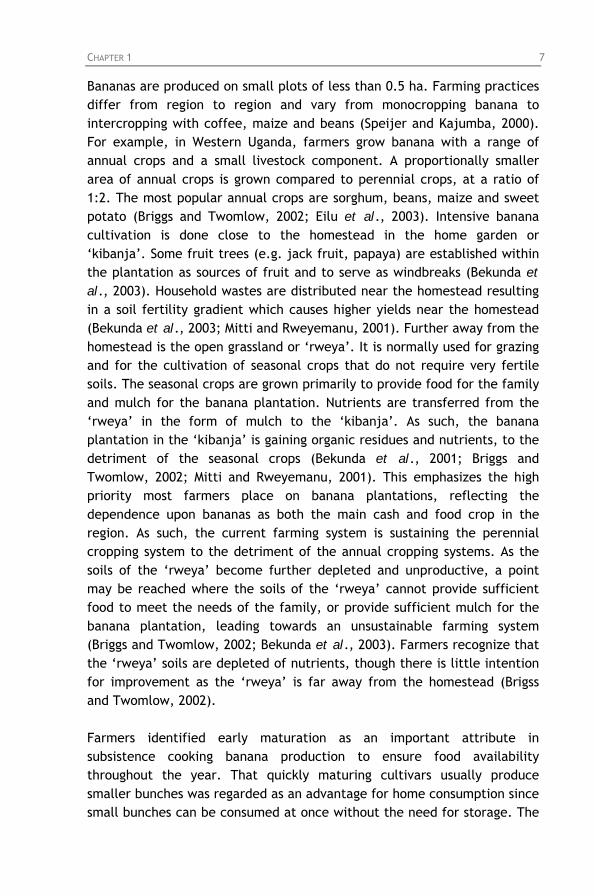
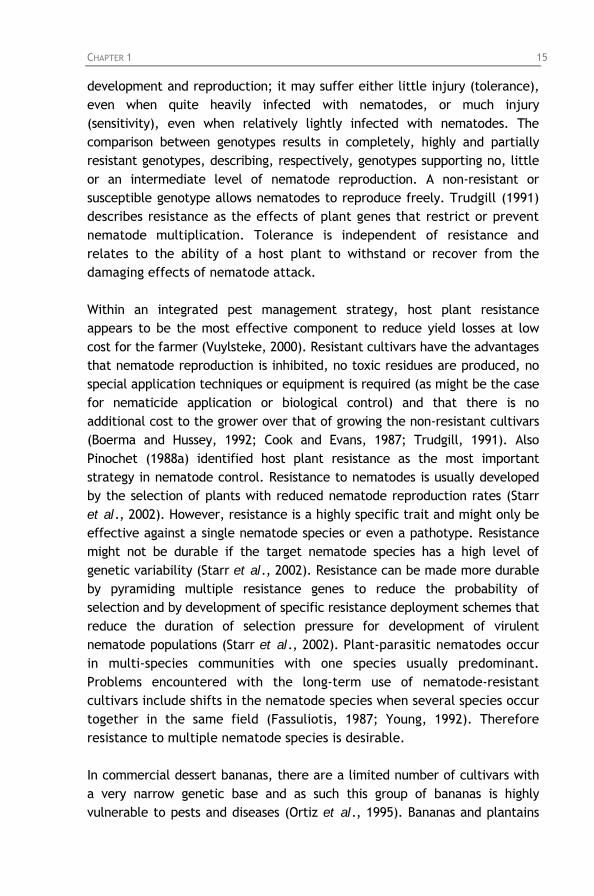
1.1.2. Importance of Musa in the East African Great Lakes Region The East African highland banana (Musa spp. AAA) is the most important staple food crop in the East African Great Lakes Region. Uganda produces around 10 million tons of bananas per year, of which the majority are East African highland bananas (FAOSTAT, 2002). Figure 1.1 shows the major banana growing areas in Uganda: cultivation of East African highland cooking banana is primarily in the southwest of the country focused around Mbarara and Masaka; dessert bananas, like Gros Michel (Bogoya, AAA) and the apple-like-flavour banana Sukali Ndizi (AB) are produced in Mukono, east of Kampala; beer bananas are mainly produced in Kibale, on the Congolese border (Spilsbury et al., 2002).
Areas of major cooking banana production Areas of major beer banana production Areas of major dessert banana production
Figure 1.1: Major banana growing areas in Uganda. Source: Spilsbury et al. (2002).
Karamura (1998) has distinguished five different clone sets covering the East African highland bananas in Uganda: four clone sets cover the cooking types (Nfuuka, Nakitembe, Nakabululu and Musakala); one clone set covers
CHAPTER 1 5
the beer brewing types (Mbidde). DNA marker-aided research showed that the highland bananas are closely related having a narrow genetic base (Pillay et al., 2001). East Africans cook the fruit as ‘matooke’ or brew beer from it. Uganda has a long tradition of banana cultivation starting in the 13th century (Tushemereirwe et al., 2001) and is the region’s leading producer and consumer. Table 1.1 summarizes statistics on production, consumption, area harvested and yield of cooking and beer bananas in the East African Great Lakes Region. Per capita consumption of East African highland bananas is around 185 kg/year in Uganda (FAOSTAT, 2002). Table 1.1: Production, consumption, area harvested and yield of cooking and beer bananas in the East African Great Lakes Region.
Production
(tons)
Consumption per
capita
(kg/year)
Area harvested
(ha)
Yield
(tons /ha)
Uganda 9,600,000 184.4 1,600,000 6.0
Rwanda 2,784,870 137.4 358,863 7.8
Burundi 1,548,897 89.1 300,000 5.2
Kenya 870,000 24.7 80,000 10.9
Tanzania 601,600 12.7 308,000 1.9
World 32,211,419 3.4 5,053,648 6.4
After FAOSTAT (2002).
In Uganda, bananas are cultivated by more than 75% of the farmers which are mainly small-scale farmers (Bridge, 2000; Tushemereirwe et al., 2001). East African highland bananas constitute 85% of the bananas grown in Uganda, the introduced beer clones (Musa AB and ABB) 11%, the dessert bananas 3% and the plantains only 1% (Karamura et al., 1996). Bananas are one of the most important food security crops in Uganda because the all year fruiting coupled with moderately high organic matter yield ensures continuous supply of dietary carbohydrate. Bananas and plantains provide more than 25% of the carbohydrates and 10% of the calorie intake for approximately 70 million people in sub-Saharan Africa (Wilson, 1987). Bananas and plantains are also a good source of many vitamins and minerals, particularly vitamins A, B6 and C and potassium (Frison and Sharrock, 1999). Surplus bunches provide an important source of income. In East Africa, bananas reduce soil erosion on steep slopes and can be used as mulch for maintaining and improving soil fertility (Gold et al., 1999).
CHAPTER 1 6
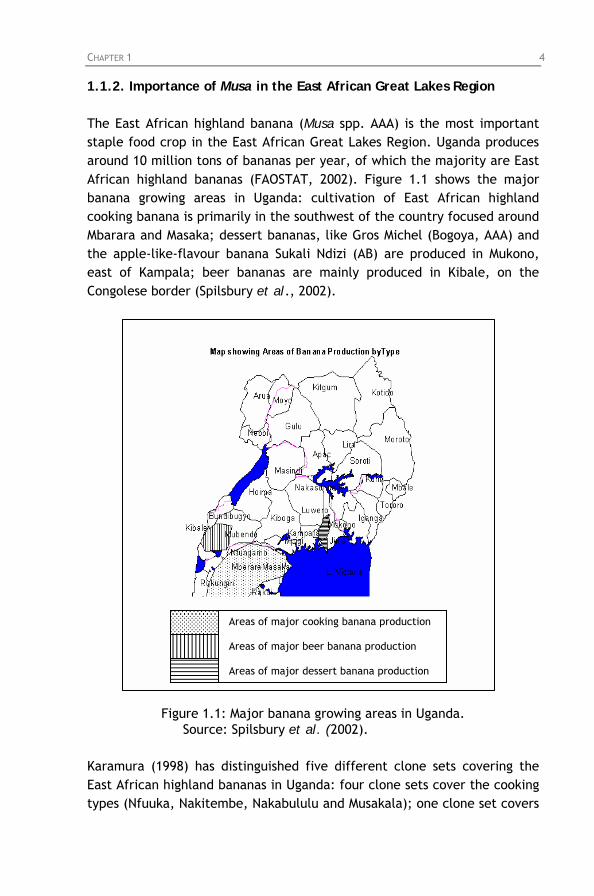
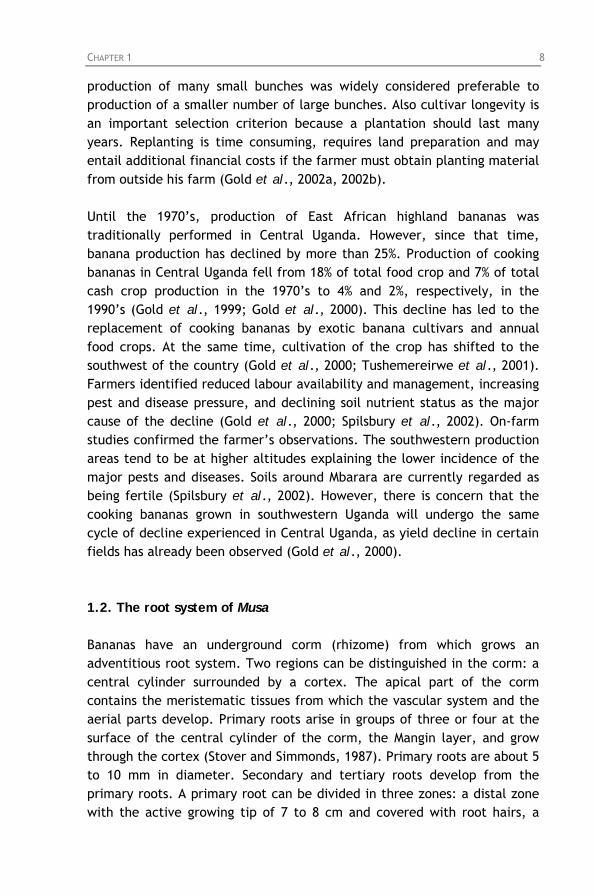
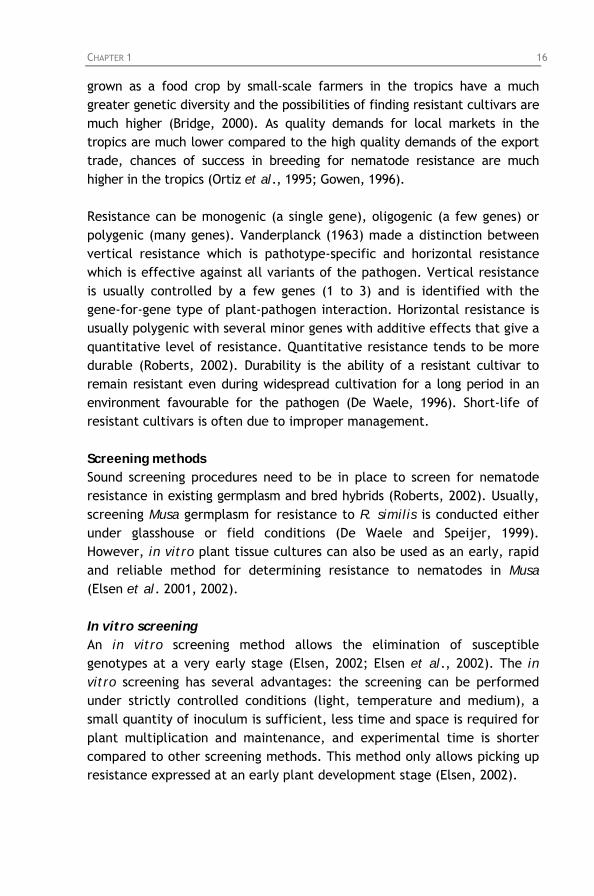
Table 1.2 compares the importance of cooking bananas with other staple food crops in Uganda: cooking bananas are the most important followed by cassava and sweet potatoes (FAOSTAT, 2002). Figure 1.2 shows a banana market in Kampala, Uganda. Table 1.2: Relative importance of cooking and beer bananas in Uganda compared with other staple food crops.
Crop Production (tons)
Consumption per capita (kg/year)
Cooking/ beer bananas 9,600,000 184.4 Cassava 5,300,000 106.9 Sweet potatoes 2,515,000 89.0 Maize 1,174,000 30.6 Finger millet 590,000 16.8 Potatoes 510,000 14.5
After FAOSTAT (2002).
Figure 1.2: Banana market in Kampala, Uganda.
CHAPTER 1 7
Bananas are produced on small plots of less than 0.5 ha. Farming practices differ from region to region and vary from monocropping banana to intercropping with coffee, maize and beans (Speijer and Kajumba, 2000). For example, in Western Uganda, farmers grow banana with a range of annual crops and a small livestock component. A proportionally smaller area of annual crops is grown compared to perennial crops, at a ratio of 1:2. The most popular annual crops are sorghum, beans, maize and sweet potato (Briggs and Twomlow, 2002; Eilu et al., 2003). Intensive banana cultivation is done close to the homestead in the home garden or ‘kibanja’. Some fruit trees (e.g. jack fruit, papaya) are established within the plantation as sources of fruit and to serve as windbreaks (Bekunda et al., 2003). Household wastes are distributed near the homestead resulting in a soil fertility gradient which causes higher yields near the homestead (Bekunda et al., 2003; Mitti and Rweyemanu, 2001). Further away from the homestead is the open grassland or ‘rweya’. It is normally used for grazing and for the cultivation of seasonal crops that do not require very fertile soils. The seasonal crops are grown primarily to provide food for the family and mulch for the banana plantation. Nutrients are transferred from the ‘rweya’ in the form of mulch to the ‘kibanja’. As such, the banana plantation in the ‘kibanja’ is gaining organic residues and nutrients, to the detriment of the seasonal crops (Bekunda et al., 2001; Briggs and Twomlow, 2002; Mitti and Rweyemanu, 2001). This emphasizes the high priority most farmers place on banana plantations, reflecting the dependence upon bananas as both the main cash and food crop in the region. As such, the current farming system is sustaining the perennial cropping system to the detriment of the annual cropping systems. As the soils of the ‘rweya’ become further depleted and unproductive, a point may be reached where the soils of the ‘rweya’ cannot provide sufficient food to meet the needs of the family, or provide sufficient mulch for the banana plantation, leading towards an unsustainable farming system (Briggs and Twomlow, 2002; Bekunda et al., 2003). Farmers recognize that the ‘rweya’ soils are depleted of nutrients, though there is little intention for improvement as the ‘rweya’ is far away from the homestead (Brigss and Twomlow, 2002). Farmers identified early maturation as an important attribute in subsistence cooking banana production to ensure food availability throughout the year. That quickly maturing cultivars usually produce smaller bunches was regarded as an advantage for home consumption since small bunches can be consumed at once without the need for storage. The
CHAPTER 1 8
production of many small bunches was widely considered preferable to production of a smaller number of large bunches. Also cultivar longevity is an important selection criterion because a plantation should last many years. Replanting is time consuming, requires land preparation and may entail additional financial costs if the farmer must obtain planting material from outside his farm (Gold et al., 2002a, 2002b). Until the 1970’s, production of East African highland bananas was traditionally performed in Central Uganda. However, since that time, banana production has declined by more than 25%. Production of cooking bananas in Central Uganda fell from 18% of total food crop and 7% of total cash crop production in the 1970’s to 4% and 2%, respectively, in the 1990’s (Gold et al., 1999; Gold et al., 2000). This decline has led to the replacement of cooking bananas by exotic banana cultivars and annual food crops. At the same time, cultivation of the crop has shifted to the southwest of the country (Gold et al., 2000; Tushemereirwe et al., 2001). Farmers identified reduced labour availability and management, increasing pest and disease pressure, and declining soil nutrient status as the major cause of the decline (Gold et al., 2000; Spilsbury et al., 2002). On-farm studies confirmed the farmer’s observations. The southwestern production areas tend to be at higher altitudes explaining the lower incidence of the major pests and diseases. Soils around Mbarara are currently regarded as being fertile (Spilsbury et al., 2002). However, there is concern that the cooking bananas grown in southwestern Uganda will undergo the same cycle of decline experienced in Central Uganda, as yield decline in certain fields has already been observed (Gold et al., 2000). 1.2. The root system of Musa Bananas have an underground corm (rhizome) from which grows an adventitious root system. Two regions can be distinguished in the corm: a central cylinder surrounded by a cortex. The apical part of the corm contains the meristematic tissues from which the vascular system and the aerial parts develop. Primary roots arise in groups of three or four at the surface of the central cylinder of the corm, the Mangin layer, and grow through the cortex (Stover and Simmonds, 1987). Primary roots are about 5 to 10 mm in diameter. Secondary and tertiary roots develop from the primary roots. A primary root can be divided in three zones: a distal zone with the active growing tip of 7 to 8 cm and covered with root hairs, a
CHAPTER 1 9
second zone without root hairs nor secondary or tertiary roots, and a third zone with secondary and tertiary roots (Swennen et al., 1986). In cross section, a central vascular cylinder is separated from the outer cortex by an endodermis and a pericycle. Swennen et al. (1986) distinguished two types of primary roots based on the density of secondary roots: feeder roots with a high density of secondary roots and pioneers with a low density of secondary roots. Later experiments indicated that young roots are of the pioneer type and later become of the feeder type (Swennen et al., 1988). Primary roots are white in colour when healthy and vigorous, but later turn grey or brown before dying. A healthy corm can bear 200 to 300 primary roots with a total length of 230 m. Horizontal spread is usually about 2 to 3 m but can be as far as 5 m. The major part of the root system occurs within a 60 cm radius from the plant and in the upper part of the soil (Gousseland, 1983). Araya et al. (1998) reported that more than 65% of the total root weight of the cultivar Valery (AAA) was found in the upper 30 cm of the soil. Primary roots emerge in flushes. During the first 3 weeks after planting new primary roots emerge. A second flush starts at 8 weeks and the third flush begins at 5 months after planting (Swennen et al., 1988). New primary roots will emerge until flowering. After flowering, the root system of the mother plant declines and new roots emerge on the suckers. Root systems have a number of functions: absorption of water and nutrients from the soil, synthesis of plant hormones and storage and anchorage in the soil (Fitter, 1996). Development of lateral roots provides important means of constructing a root system, increasing its absorptive area and the volume of the substrate exploited (Charlton, 1996). Root hairs are produced on primary, secondary and tertiary roots and are responsible for most of the water and nutrient uptake of the plant (Robinson, 1996). Musa root growth and distribution is influenced by various factors like substrate type and climate (Blomme, 2000; Moens, 2004). A well developed root system helps the plant not only to absorb water and nutrients from the soil but makes the plant also more tolerant to pathogens, including nematodes. Nematode infection causes a severe reduction in root system size of susceptible Musa cultivars (Blomme, 2000; Moens, 2004). As the banana root system is mainly concentrated within the upper 30 cm of the soil, the major part of the total nematode population can also be encountered in the upper part of the soil (Araya et al., 1999).
CHAPTER 1 10
Sucker-derived plants were observed to be less susceptible to nematode infection compared to in vitro-derived plants (De Waele et al., 1998; Blomme, 2000). Young in vitro-derived plants produce fragile roots which may be less resistant to nematode colonisation compared to the thicker roots produced by young sucker-derived plants. Stoffelen (2000) studied root development and root systems of several Musa cultivars to optimize early nematode resistance screening. To reduce the effect of root growth on nematode reproduction, she recommended that nematode inoculation should be done after the second flush of primary root emergence. Also Speijer et al. (1999a) recommended inoculation of sword sucker-derived plants after 8 to 10 weeks to enable the plants to develop mature root systems. Variability in root development among different Musa cultivars was observed. Each cultivar has a different capacity to form primary, secondary and tertiary roots as shown by hydroponic studies (Swennen et al., 1986). Bananas, for instance, seem to have a greater capacity to form tertiary roots compared to plantains. Blomme (2000) reported an increased root system size with increased ploidy level. 1.3. Nematoda 1.3.1. Biology and life cycle Nematodes or roundworms belong to the Phylum Nematoda (Siddiqui, 2000). Nematodes can live freely in fresh, brackish or salt water or in the soil and feed on micro-organisms and microscopic plants and animals. Several species attack and infect animals and humans, in which they cause various diseases. Many species feed on living plants, obtaining their food with spears or stylets causing a variety of plant diseases (Agrios, 1997; Luc et al., 1990). Based on their feeding behaviour, plant-parasitic nematodes can be divided in three major groups (von Mende et al., 1992; De Waele et al., 1994). Ectoparasitic nematodes do not enter the plant tissues but feed from the outside on the cells by piercing the outermost plant cell layers with their stylet. Eggs are laid outside the plant. Migratory endoparasitic nematodes live inside the plant tissues and can move freely between the roots and the soil. They feed on normal plant cells inside the plant. Eggs
CHAPTER 1 11
are laid either outside or inside the plant. Sedentary endoparasitic nematodes also live inside the plant tissues. The adult female becomes sedentary (immobile). Eggs are laid outside the plant. The sedentary endoparasitic nematodes induce normal plant cells to form specialised feeding structures that serve as food transfer cells. In morphology and behaviour these three groups are very similar; all have a hollow stylet which they use for invading host cells and during feeding. Ingestion of the cell contents is preceded by the injection of saliva produced by oesophageal gland cells and plant cell contents are removed by an oesophageal pump (Trudgill, 1991). Plant-parasitic nematodes are generally between 300 to 1000 μm long and 15 to 35 μm wide. Nematodes are eel-shaped, unsegmented organisms. All nematodes have four juvenile stages, with the first moult usually occurring in the egg. After the final moult the nematodes differentiate into males and females. The female can then produce eggs either after mating with a male or parthenogenetically. A life cycle from egg to egg may be completed within 2 to 4 weeks under optimum environmental conditions, mainly temperature. When the infective stages are produced, the nematodes must feed on a susceptible host or they will starve. Absence of a suitable host may result in the death of certain nematode species, while in other species the juvenile stages may dry up and remain quiescent, or the eggs may remain dormant in the soil for many years (Agrios, 1997). 1.3.2. Damage and crop losses The annual world-wide losses caused by nematodes on the life-sustaining crops (grains, legumes, banana, cassava, potato, sugarbeet, sugarcane and sweet potato) are estimated to be about 11%. Losses for most other economically important crops (vegetables, fruits and non-edible crops) are about 14%. Both cover a total loss of over US$80 billion annually (Agrios, 1997). The most damaging nematodes on bananas and plantains are migratory endoparasites, the burrowing nematode Radopholus similis, the root-lesion nematodes Pratylenchus goodeyi and Pratylenchus coffeae, and the spiral nematode Helicotylenchus multicinctus (De Waele, 1996). Also sedentary endoparasitic nematodes such as root-knot nematodes (Meloidogyne spp.) can cause serious damage (Pinochet, 1996; Speijer and Fogain, 1999).
CHAPTER 1 12
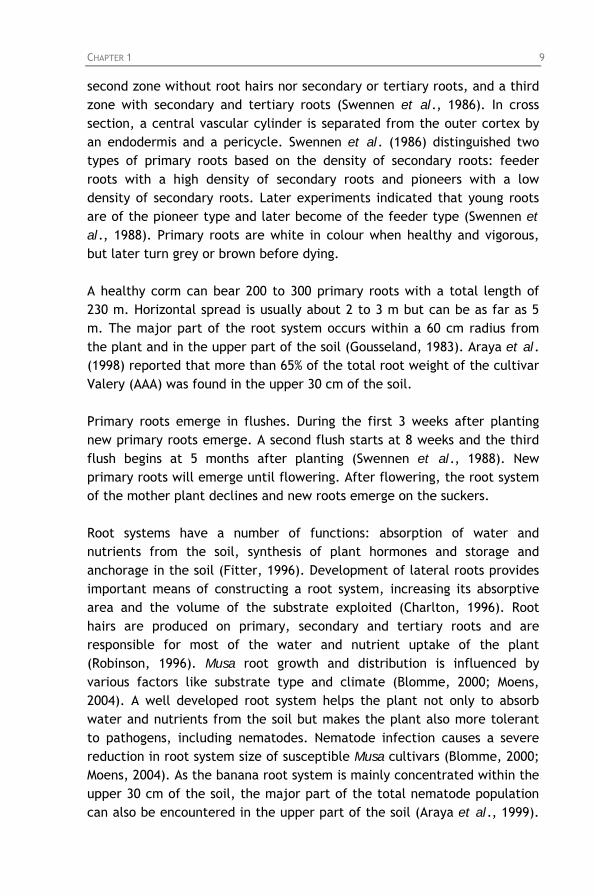
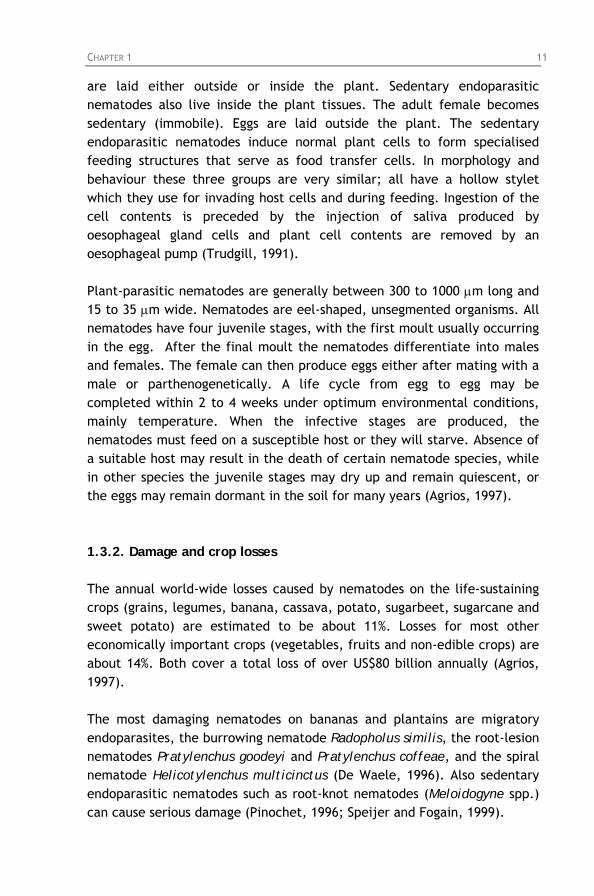
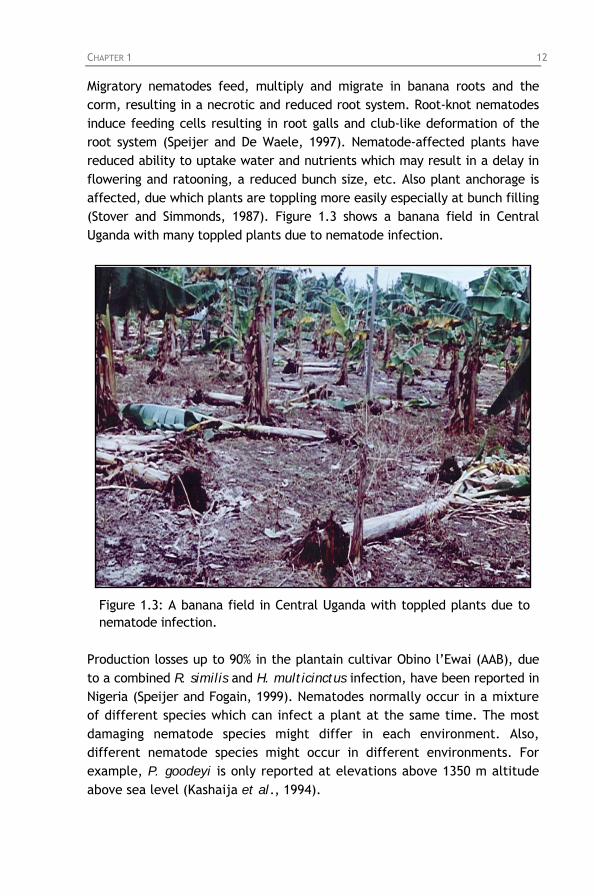
Migratory nematodes feed, multiply and migrate in banana roots and the corm, resulting in a necrotic and reduced root system. Root-knot nematodes induce feeding cells resulting in root galls and club-like deformation of the root system (Speijer and De Waele, 1997). Nematode-affected plants have reduced ability to uptake water and nutrients which may result in a delay in flowering and ratooning, a reduced bunch size, etc. Also plant anchorage is affected, due which plants are toppling more easily especially at bunch filling (Stover and Simmonds, 1987). Figure 1.3 shows a banana field in Central Uganda with many toppled plants due to nematode infection.
Figure 1.3: A banana field in Central Uganda with toppled plants due to nematode infection.
Production losses up to 90% in the plantain cultivar Obino l’Ewai (AAB), due to a combined R. similis and H. multicinctus infection, have been reported in Nigeria (Speijer and Fogain, 1999). Nematodes normally occur in a mixture of different species which can infect a plant at the same time. The most damaging nematode species might differ in each environment. Also, different nematode species might occur in different environments. For example, P. goodeyi is only reported at elevations above 1350 m altitude above sea level (Kashaija et al., 1994).
CHAPTER 1 13
1.3.3. Radopholus similis (Cobb, 1893) Thorne, 1949 Radopholus similis belongs to the family Pratylenchidae, which belongs to the order Tylenchida and class Secernentea (Siddiqui, 2000). The order Tylenchida contains the most important plant-parasitic nematodes in the world (Luc et al., 1990). Radopholus similis is of Australasian origin and was first discovered in 1893 in the Fiji Islands by Cobb. It is widespread in most tropical and subtropical banana and plantain growing areas of the world and is considered the most damaging nematode on Musa (Stover and Simmonds, 1987; Sarah et al., 1996). Its present world-wide distribution is believed to have resulted from the distribution of infected banana planting material (Gowen, 1993; Bridge, 1996; O’Bannon, 1977; Hahn et al., 1996a; Price, 2000). This process has been associated particularly with the introduction of the Cavendish subgroup cultivars that replaced the Fusarium wilt-susceptible cultivar Gros Michel (Gowen and Quénéhervé, 1990). Radopholus similis has a localised distribution in Africa where it was introduced. The spread of R. similis can be limited by quarantine and the use of R. similis-free planting material (Price, 2000). Though localised in occurrence, R. similis is a pest of smallholder Musa production in many of those areas where bananas and plantains are of major importance, both as a subsistence crop and as a farm product for urban markets (Price, 2000). Radopholus similis is a migratory endoparasite and completes its life cycle in 20 to 25 days in the roots and corm. Normal reproduction of R. similis is by amphimixis, though parthenogenesis does occur. Kaplan and Opperman (2000) reported that self-fertilisation could occur 50 to 60 days after the fourth moult in females that have not mated with a male. Eggs are laid in infected tissue during 7 to 8 days, with an average of four eggs per day (Blake, 1972). The females are infectious in contrast to the males which have a degenerated stylet and are considered non-parasitic. Juveniles and adult females are active mobile forms which can leave the roots in adverse conditions. The nematode migrates as well inter- as intracellularly. It feeds on the cytoplasm of cortical cells, collapsing cell walls, and causes cavities and tunnels which evolve as a necrosis and may extend over the whole cortex. These are observed as red-black lesions in the cortex. The stele is not damaged by R. similis, though the nematodes can penetrate young stelar tissues (Sarah et al., 1996). Occasionally, the nematodes can also migrate towards the corm, causing black lesions. Secondary pathogens, such as bacteria and fungi, can increase necrosis of root and corm tissues. The destruction of root and corm tissues by R. similis leads to a reduced water
CHAPTER 1 14
and nutrient uptake. This in turn leads to a reduction in plant growth and yield, and an increase in duration between two successive harvests. Also plant anchorage in the soil is affected, resulting in the toppling or uprooting of plants, especially those bearing fruits (Gowen and Quénéhervé, 1990). The temperature for R. similis distribution ranges from 24 to 32°C. Optimum reproduction is at around 30°C. The nematode does not reproduce below 16°C or above 33°C (Sarah et al., 1996). Price (2000) reported that R. similis establishes at temperatures above 17°C. Radopholus similis does not only attack bananas and plantains but several other crops and weeds as well. It has around 250 host plants, including maize, vegetables, sugarcane, black pepper, tea, coffee, avocado, ornamentals and grasses (O’Bannon, 1977). Biological diversity among R. similis populations from different banana growing areas in the world has been reported (Pinochet, 1979; Sarah et al., 1993; Fallas et al., 1995; Hahn et al., 1996a). Damage depends on the pathogenicity of the population which can vary among banana growing areas. Several terms have been used to describe intraspecific variants of nematodes, e.g. biotype, pathotype, race and strain. Using the term pathotype was recommended (Dropkin, 1988). Trudgill (1991) describes pathogenicity as the capacity to cause disease or damage, and virulence as the capacity to overcome/suppress resistance genes. More details on differences in pathogenicity among R. similis populations will be discussed in chapter 5. 1.3.4. Host plant resistance to nematodes A promising strategy to control nematodes is the development of resistant hybrids (Speijer and De Waele, 1997). This approach includes identifying sources of resistance which can then be used in classical breeding programs (Gowen, 1976). Barker (1993) gives an overview of all the different terminologies relating to resistance and tolerance. For description of the host plant/nematode relationships, this thesis will follow the terminology of Bos and Parlevliet (1995). Resistance/susceptibility on the one hand and tolerance/sensitivity on the other hand are defined as independent, relative qualities of a host plant based on comparison between genotypes. A host plant may either suppress (resistance) or allow (susceptibility) nematode
CHAPTER 1 15
development and reproduction; it may suffer either little injury (tolerance), even when quite heavily infected with nematodes, or much injury (sensitivity), even when relatively lightly infected with nematodes. The comparison between genotypes results in completely, highly and partially resistant genotypes, describing, respectively, genotypes supporting no, little or an intermediate level of nematode reproduction. A non-resistant or susceptible genotype allows nematodes to reproduce freely. Trudgill (1991) describes resistance as the effects of plant genes that restrict or prevent nematode multiplication. Tolerance is independent of resistance and relates to the ability of a host plant to withstand or recover from the damaging effects of nematode attack. Within an integrated pest management strategy, host plant resistance appears to be the most effective component to reduce yield losses at low cost for the farmer (Vuylsteke, 2000). Resistant cultivars have the advantages that nematode reproduction is inhibited, no toxic residues are produced, no special application techniques or equipment is required (as might be the case for nematicide application or biological control) and that there is no additional cost to the grower over that of growing the non-resistant cultivars (Boerma and Hussey, 1992; Cook and Evans, 1987; Trudgill, 1991). Also Pinochet (1988a) identified host plant resistance as the most important strategy in nematode control. Resistance to nematodes is usually developed by the selection of plants with reduced nematode reproduction rates (Starr et al., 2002). However, resistance is a highly specific trait and might only be effective against a single nematode species or even a pathotype. Resistance might not be durable if the target nematode species has a high level of genetic variability (Starr et al., 2002). Resistance can be made more durable by pyramiding multiple resistance genes to reduce the probability of selection and by development of specific resistance deployment schemes that reduce the duration of selection pressure for development of virulent nematode populations (Starr et al., 2002). Plant-parasitic nematodes occur in multi-species communities with one species usually predominant. Problems encountered with the long-term use of nematode-resistant cultivars include shifts in the nematode species when several species occur together in the same field (Fassuliotis, 1987; Young, 1992). Therefore resistance to multiple nematode species is desirable. In commercial dessert bananas, there are a limited number of cultivars with a very narrow genetic base and as such this group of bananas is highly vulnerable to pests and diseases (Ortiz et al., 1995). Bananas and plantains
CHAPTER 1 16
grown as a food crop by small-scale farmers in the tropics have a much greater genetic diversity and the possibilities of finding resistant cultivars are much higher (Bridge, 2000). As quality demands for local markets in the tropics are much lower compared to the high quality demands of the export trade, chances of success in breeding for nematode resistance are much higher in the tropics (Ortiz et al., 1995; Gowen, 1996). Resistance can be monogenic (a single gene), oligogenic (a few genes) or polygenic (many genes). Vanderplanck (1963) made a distinction between vertical resistance which is pathotype-specific and horizontal resistance which is effective against all variants of the pathogen. Vertical resistance is usually controlled by a few genes (1 to 3) and is identified with the gene-for-gene type of plant-pathogen interaction. Horizontal resistance is usually polygenic with several minor genes with additive effects that give a quantitative level of resistance. Quantitative resistance tends to be more durable (Roberts, 2002). Durability is the ability of a resistant cultivar to remain resistant even during widespread cultivation for a long period in an environment favourable for the pathogen (De Waele, 1996). Short-life of resistant cultivars is often due to improper management. Screening methods Sound screening procedures need to be in place to screen for nematode resistance in existing germplasm and bred hybrids (Roberts, 2002). Usually, screening Musa germplasm for resistance to R. similis is conducted either under glasshouse or field conditions (De Waele and Speijer, 1999). However, in vitro plant tissue cultures can also be used as an early, rapid and reliable method for determining resistance to nematodes in Musa (Elsen et al. 2001, 2002). In vitro screening An in vitro screening method allows the elimination of susceptible genotypes at a very early stage (Elsen, 2002; Elsen et al., 2002). The in vitro screening has several advantages: the screening can be performed under strictly controlled conditions (light, temperature and medium), a small quantity of inoculum is sufficient, less time and space is required for plant multiplication and maintenance, and experimental time is shorter compared to other screening methods. This method only allows picking up resistance expressed at an early plant development stage (Elsen, 2002).
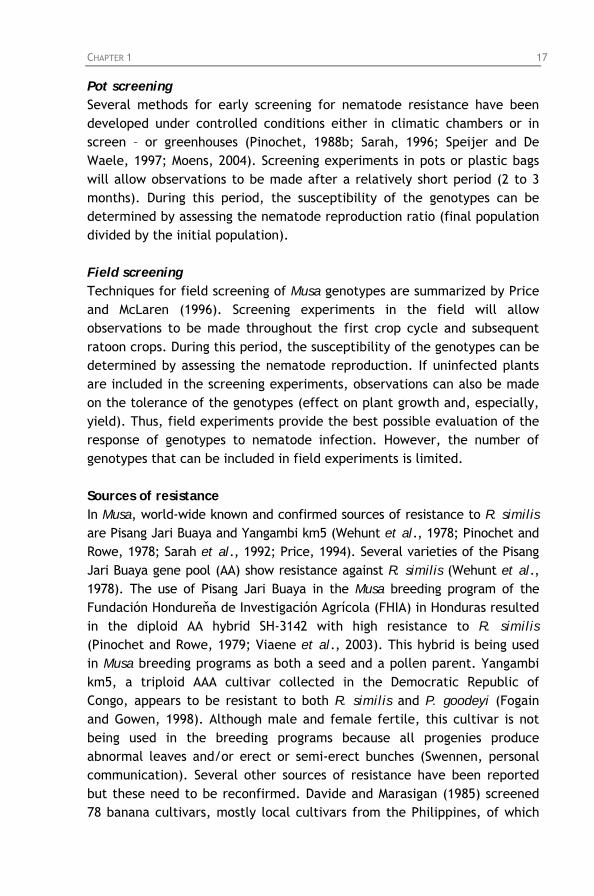
CHAPTER 1 17
Pot screening Several methods for early screening for nematode resistance have been developed under controlled conditions either in climatic chambers or in screen – or greenhouses (Pinochet, 1988b; Sarah, 1996; Speijer and De Waele, 1997; Moens, 2004). Screening experiments in pots or plastic bags will allow observations to be made after a relatively short period (2 to 3 months). During this period, the susceptibility of the genotypes can be determined by assessing the nematode reproduction ratio (final population divided by the initial population). Field screening Techniques for field screening of Musa genotypes are summarized by Price and McLaren (1996). Screening experiments in the field will allow observations to be made throughout the first crop cycle and subsequent ratoon crops. During this period, the susceptibility of the genotypes can be determined by assessing the nematode reproduction. If uninfected plants are included in the screening experiments, observations can also be made on the tolerance of the genotypes (effect on plant growth and, especially, yield). Thus, field experiments provide the best possible evaluation of the response of genotypes to nematode infection. However, the number of genotypes that can be included in field experiments is limited. Sources of resistance In Musa, world-wide known and confirmed sources of resistance to R. similis are Pisang Jari Buaya and Yangambi km5 (Wehunt et al., 1978; Pinochet and Rowe, 1978; Sarah et al., 1992; Price, 1994). Several varieties of the Pisang Jari Buaya gene pool (AA) show resistance against R. similis (Wehunt et al., 1978). The use of Pisang Jari Buaya in the Musa breeding program of the Fundación Hondureňa de Investigación Agrícola (FHIA) in Honduras resulted in the diploid AA hybrid SH-3142 with high resistance to R. similis (Pinochet and Rowe, 1979; Viaene et al., 2003). This hybrid is being used in Musa breeding programs as both a seed and a pollen parent. Yangambi km5, a triploid AAA cultivar collected in the Democratic Republic of Congo, appears to be resistant to both R. similis and P. goodeyi (Fogain and Gowen, 1998). Although male and female fertile, this cultivar is not being used in the breeding programs because all progenies produce abnormal leaves and/or erect or semi-erect bunches (Swennen, personal communication). Several other sources of resistance have been reported but these need to be reconfirmed. Davide and Marasigan (1985) screened 78 banana cultivars, mostly local cultivars from the Philippines, of which
CHAPTER 1 18
24 were found to be resistant to R. similis. Viaene et al. (2003) evaluated the germplasm used and developed by the Musa improvement program of FHIA. Additional sources of resistance have been identified in the Fe’i cultivars Rimina and Menei (Stoffelen et al., 1999c). However, Fe’i bananas are highly seed- and pollen-sterile (De Waele and Elsen, 2002). A list of genotypes with resistance to R. similis is given in Table 1.3, though this list is not conclusive.
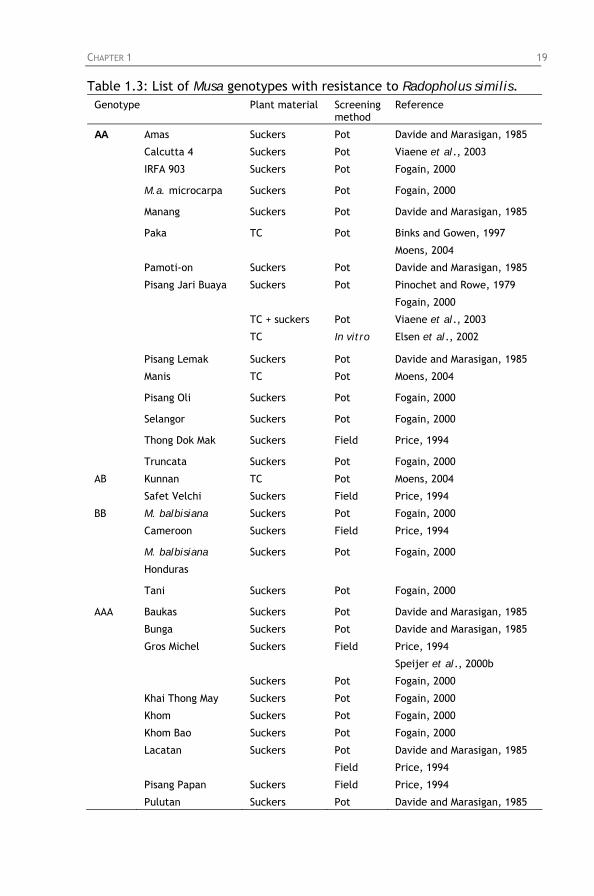
CHAPTER 1 19
Table 1.3: List of Musa genotypes with resistance to Radopholus similis. Genotype Plant material Screening
method Reference
AA Amas Suckers Pot Davide and Marasigan, 1985
Calcutta 4 Suckers Pot Viaene et al., 2003
IRFA 903 Suckers Pot Fogain, 2000
M.a. microcarpa Suckers Pot Fogain, 2000
Manang Suckers Pot Davide and Marasigan, 1985
Paka TC Pot Binks and Gowen, 1997
Moens, 2004
Pamoti-on Suckers Pot Davide and Marasigan, 1985
Pisang Jari Buaya Suckers
TC + suckers
Pot
Pot
Pinochet and Rowe, 1979
Fogain, 2000
Viaene et al., 2003
TC In vitro Elsen et al., 2002
Pisang Lemak
Manis
Suckers
TC
Pot
Pot
Davide and Marasigan, 1985
Moens, 2004
Pisang Oli Suckers Pot Fogain, 2000
Selangor Suckers Pot Fogain, 2000
Thong Dok Mak Suckers Field Price, 1994
Truncata Suckers Pot Fogain, 2000
AB Kunnan TC Pot Moens, 2004
Safet Velchi Suckers Field Price, 1994
BB M. balbisiana
Cameroon
Suckers
Suckers
Pot
Field
Fogain, 2000
Price, 1994
M. balbisiana
Honduras
Suckers Pot Fogain, 2000
Tani Suckers Pot Fogain, 2000
AAA Baukas Suckers Pot Davide and Marasigan, 1985
Bunga Suckers Pot Davide and Marasigan, 1985
Gros Michel Suckers Field Price, 1994
Speijer et al., 2000b
Suckers Pot Fogain, 2000
Khai Thong May Suckers Pot Fogain, 2000
Khom Suckers Pot Fogain, 2000
Khom Bao Suckers Pot Fogain, 2000
Lacatan Suckers Pot
Field
Davide and Marasigan, 1985
Price, 1994
Pisang Papan Suckers Field Price, 1994
Pulutan Suckers Pot Davide and Marasigan, 1985

CHAPTER 1 20
Tanggung Suckers Pot Davide and Marasigan, 1985
Yangambi km5 TC + suckers Pot Viaene et al., 2003
TC Pot Binks and Gowen, 1997
Moens, 2004
Suckers Pot Fogain, 2000
Suckers Field Fogain and Gowen, 1998
Price, 1994
AAB Big Ebanga Suckers Field Price, 1994
Figue Pomme
Ekona
Suckers Field Price, 1994
Foconah TC Pot Binks and Gowen, 1997
Suckers Pot Fogain, 2000
Suckers Field Price, 1994
Galamay Senora Suckers Pot Davide and Marasigan, 1985
Pisang Ceylan Suckers Pot Fogain, 1996
Pisang Kelat Suckers Field Price, 1994
Suckers Pot Fogain, 2000
Prata Enana Suckers Pot Viaene et al. 2003
Rajapuri India Suckers Field Price, 1994
ABB Cardaba Suckers Pot Davide and Marasigan, 1985
Katali Suckers Pot Davide and Marasigan, 1985
Katsila Suckers Pot Davide and Marasigan, 1985
Mundo Suckers Pot Davide and Marasigan, 1985
Pelipita Suckers Field Price, 1994
Penipita Suckers Pot Davide and Marasigan, 1985
Saba puti Suckers Pot Davide and Marasigan, 1985
Siusok Suckers Pot Davide and Marasigan, 1985
Tiparot Suckers Pot Davide and Marasigan, 1985
Turankog Suckers Pot Davide and Marasigan, 1985
BBB Binendito Suckers Pot Davide and Marasigan, 1985
Pa-a Dalaga Suckers Pot Davide and Marasigan, 1985
Fe’i Menei TC Pot Stoffelen et al., 1999c
Rimini TC Pot Stoffelen et al., 1999c
Hybrids SH-2095 (AA) Suckers Pot Viaene et al., 2003
SH-3142 (AA) TC In vitro Elsen et al., 2002
Suckers
TC + suckers
Pot Pinochet and Rowe, 1979
Viaene et al., 2003
Stanton, 1999
SH-3362 (AA) TC + suckers Pot Viaene et al., 2003
SH-3624 (AA) Suckers Pot Viaene et al., 2003
SH-3723 (AA) TC + suckers Pot Viaene et al., 2003
SH-3648 (AABB) TC + suckers Pot Viaene et al., 2003
CHAPTER 1 21
FHIA-01 (AAAB) Suckers Pot
Pot, field
Viaene et al., 2003
Stanton, 1999
FHIA-23 (AAAA) TC Pot Moens, 2004
1877 (AAAA) Suckers Field Price, 1994
PITA-8 (AAAB) Suckers Field Afreh-Nuamah et al., 1996
TC: tissue culture-derived plants.
Resistance mechanisms Knowing the mechanism of resistance is important as it may enable the breeder to select for a desired characteristic for the breeding program (Giebel, 1982; Fogain and Gowen, 1996) and it can also provide resistance markers to facilitate screening of Musa germplasm. Previous research indicates that lignin and phenolic compounds might be involved in nematode resistance mechanisms in Musa (Fogain and Gowen, 1996; Valette et al., 1998). A higher number of phenolic cells were observed in the cultivars Yangambi km5 and Gros Michel compared to Pisang Jari Buaya (Fogain and Gowen, 1996; Valette et al., 1997). Differences in mechanisms of resistance might explain why Pisang Jari Buaya is resistant to R. similis but susceptible to P. goodeyi, while Yangambi km5 is resistant to both R. similis and P. goodeyi. Wuyts et al. (in press) reported that constitutive levels of lignification of root cell walls and induced cell wall strengthening upon nematode infection were similar in susceptible and resistant Musa cultivars. In the resistant cultivars the number of cells containing flavonols in the central cylinder was higher when the cortex was damaged by nematodes. More details on resistance mechanisms will be discussed in chapter 7. 1.4. East African highland bananas and nematodes As described in section 1.1.2, the East African highland bananas are the most important food crop in the Great Lakes Region in East Africa. However, during the last 25 years a drastic decline in banana production was observed (Tushemereirwe et al., 2001). Nematodes are considered one of the major constraints causing this decline. Farmers interviewed in East Africa attributed banana yield decline to increasing pest pressure, reduced management (reduced labour availability and shifting crop priorities), declining soil fertility, climatic changes (increased drought and unreliability of rains) and land pressure (Gold et al.,
CHAPTER 1 22
1999). Increased pest pressure ranked highest but the nature of the pest attack was generally perceived as being weevil infestation, as the insect, unlike nematodes, is visible to the farmers. On-farm verification confirmed farmers’ observations of increasing pest pressure and declining soil fertility. Nematode infection resulted in high root necrosis and a reduced root system indicating a potential yield loss from nematodes of 20 to 40% (Gold et al., 1999). Very few management practices traditionally used by small-scale farmers have been devised or developed with the unseen nematodes in mind (Bridge, 2000). In 1993 a survey was carried out in the major banana growing areas of Uganda. Eight nematode species belonging to four genera were identified: P. goodeyi, H. multicinctus, R. similis and Meloidogyne spp. were the most abundant, while P. coffeae, Pratylenchus zeae Graham, Helicotylenchus pseudorobustus (Steiner) Golden and Helicotylenchus dihystera (Cobb) Sher were found in a few sites only (Kashaija et al., 1994). Also Speijer and Fogain (1999) reported R. similis, P. goodeyi and H. multicinctus as the most prevalent nematode species in Uganda. Radopholus similis occurred primarily in Central and Eastern Uganda, at sites below 1300 m altitude (Kashaija et al., 1994). Pratylenchus goodeyi was the only species found above 1600 m altitude (Kashaija et al., 1994). Barekye et al. (1999) studied nematode occurrence and damage at farm level in Masaka district. Pratylenchus goodeyi and H. multicinctus occurred at all farms surveyed while R. similis occurred in 44% and Meloidogyne spp. only in 22% of the farms surveyed. The highest damage (percentage root necrosis and dead roots) however was observed on the farms where R. similis was present. Production losses up to 50%, associated with a mixture of R. similis and H. multicinctus were observed in the first crop cycle of the East African highland banana Nakitembe (Speijer and Kajumba, 1996). Production losses associated with R. similis and H. multicinctus were in the range of 31 to 37% for the cultivar Mbwazirume (AAA), grown for four cycles under various crop management systems (Speijer et al., 1999b). Radopholus similis and H. multicinctus appear to be equally important in reducing bunch weight of the East African highland bananas. However, Belpaire (1997) reported that R. similis appears to be more destructive as it contributes significantly to plant toppling. Also Speijer and De Waele (2001) reported R. similis and H. multicinctus as the most important nematode species in Central Uganda though R. similis was regarded as more important as it was highly associated with root necrosis. This observation was confirmed in pot trials as R. similis
CHAPTER 1 23
caused significantly more root necrosis than the other nematode species. Minor root necrosis was observed on plants inoculated with only H. multicinctus (Barekye et al., 1999). When R. similis was mixed with H. multicinctus in the same ratio, the populations of R. similis greatly exceeded that of H. multicinctus (Barekye et al., 1999). Plants of Mbwazirume infected with both P. goodeyi and R. similis had a higher root damage, a higher toppling incidence and a lower bunch weight compared to plants infected with P. goodeyi only (Talwana et al., 2003). Thus, R. similis is probably more virulent than P. goodeyi in the banana growing areas of southwestern Uganda. Toppling of bananas was higher in Central Uganda with 20.9%, compared to 7% in the rest of the country (Speijer et al., 1994). Mulching does not have a direct effect on root nematodes associated with Musa (Kashaija et al., 1999). However, mulches enhance root and plant vigour, making the plant more tolerant to nematode infection (Kashaija et al., 1999). The beneficial effects of mulching in banana have been attributed to improvements in physical, chemical and biological soil properties (McIntyre et al., 2000). Mulching increases productivity, preserves soil moisture, and increases root growth which can compensate for nematode damage. Mulch also suppresses weed growth and reduces soil erosion, adding organic matter and increasing the nutritional value of the soil. Bridge (2000) indicated that applying mulch allows the crop to live with the nematodes. Yields were higher in mulched nematode-infested plots (14.2 kg) compared to non-mulched nematode-infested plots (7.2 kg) (Speijer et al., 1999b). Mulching reduced the population densities and the damaging effects of R. similis on Mbwazirume (Talwana et al., 2003). Mats of mulched plants had a lower soil temperature compared to mats of non-mulched plants, which may have slowed down R. similis reproduction (Talwana et al., 2003). Speijer et al. (1997) compared the nematode damage of three plant growth stages (flowering plants, suckers detached from recently flowered plants and suckers detached from recently harvested plants) of Mbwazirume under three different management regimes (mulched, clean weeded and intercropped with finger millet). The damage indices were not significantly different among the three plant growth stages under each management regime. As such, nematode damage assessment can be done at any of the plant growth stages under any management regime (Speijer et al., 1997).
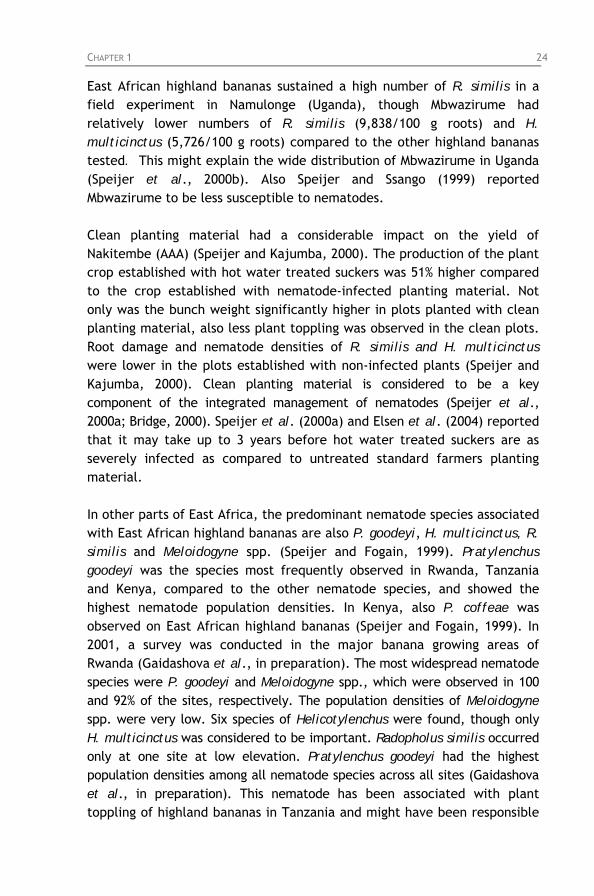
CHAPTER 1 24
East African highland bananas sustained a high number of R. similis in a field experiment in Namulonge (Uganda), though Mbwazirume had relatively lower numbers of R. similis (9,838/100 g roots) and H. multicinctus (5,726/100 g roots) compared to the other highland bananas tested. This might explain the wide distribution of Mbwazirume in Uganda (Speijer et al., 2000b). Also Speijer and Ssango (1999) reported Mbwazirume to be less susceptible to nematodes. Clean planting material had a considerable impact on the yield of Nakitembe (AAA) (Speijer and Kajumba, 2000). The production of the plant crop established with hot water treated suckers was 51% higher compared to the crop established with nematode-infected planting material. Not only was the bunch weight significantly higher in plots planted with clean planting material, also less plant toppling was observed in the clean plots. Root damage and nematode densities of R. similis and H. multicinctus were lower in the plots established with non-infected plants (Speijer and Kajumba, 2000). Clean planting material is considered to be a key component of the integrated management of nematodes (Speijer et al., 2000a; Bridge, 2000). Speijer et al. (2000a) and Elsen et al. (2004) reported that it may take up to 3 years before hot water treated suckers are as severely infected as compared to untreated standard farmers planting material. In other parts of East Africa, the predominant nematode species associated with East African highland bananas are also P. goodeyi, H. multicinctus, R. similis and Meloidogyne spp. (Speijer and Fogain, 1999). Pratylenchus goodeyi was the species most frequently observed in Rwanda, Tanzania and Kenya, compared to the other nematode species, and showed the highest nematode population densities. In Kenya, also P. coffeae was observed on East African highland bananas (Speijer and Fogain, 1999). In 2001, a survey was conducted in the major banana growing areas of Rwanda (Gaidashova et al., in preparation). The most widespread nematode species were P. goodeyi and Meloidogyne spp., which were observed in 100 and 92% of the sites, respectively. The population densities of Meloidogyne spp. were very low. Six species of Helicotylenchus were found, though only H. multicinctus was considered to be important. Radopholus similis occurred only at one site at low elevation. Pratylenchus goodeyi had the highest population densities among all nematode species across all sites (Gaidashova et al., in preparation). This nematode has been associated with plant toppling of highland bananas in Tanzania and might have been responsible
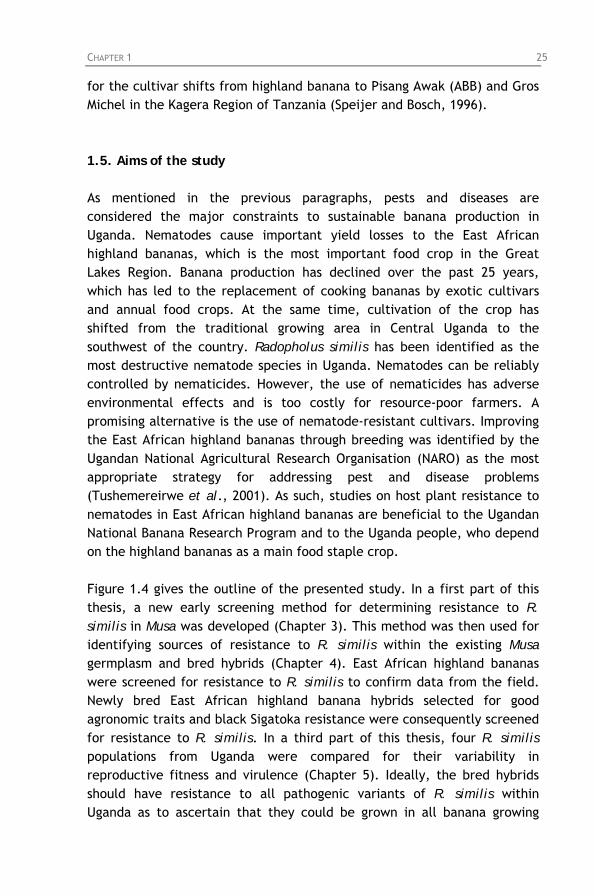
CHAPTER 1 25
for the cultivar shifts from highland banana to Pisang Awak (ABB) and Gros Michel in the Kagera Region of Tanzania (Speijer and Bosch, 1996). 1.5. Aims of the study As mentioned in the previous paragraphs, pests and diseases are considered the major constraints to sustainable banana production in Uganda. Nematodes cause important yield losses to the East African highland bananas, which is the most important food crop in the Great Lakes Region. Banana production has declined over the past 25 years, which has led to the replacement of cooking bananas by exotic cultivars and annual food crops. At the same time, cultivation of the crop has shifted from the traditional growing area in Central Uganda to the southwest of the country. Radopholus similis has been identified as the most destructive nematode species in Uganda. Nematodes can be reliably controlled by nematicides. However, the use of nematicides has adverse environmental effects and is too costly for resource-poor farmers. A promising alternative is the use of nematode-resistant cultivars. Improving the East African highland bananas through breeding was identified by the Ugandan National Agricultural Research Organisation (NARO) as the most appropriate strategy for addressing pest and disease problems (Tushemereirwe et al., 2001). As such, studies on host plant resistance to nematodes in East African highland bananas are beneficial to the Ugandan National Banana Research Program and to the Uganda people, who depend on the highland bananas as a main food staple crop. Figure 1.4 gives the outline of the presented study. In a first part of this thesis, a new early screening method for determining resistance to R. similis in Musa was developed (Chapter 3). This method was then used for identifying sources of resistance to R. similis within the existing Musa germplasm and bred hybrids (Chapter 4). East African highland bananas were screened for resistance to R. similis to confirm data from the field. Newly bred East African highland banana hybrids selected for good agronomic traits and black Sigatoka resistance were consequently screened for resistance to R. similis. In a third part of this thesis, four R. similis populations from Uganda were compared for their variability in reproductive fitness and virulence (Chapter 5). Ideally, the bred hybrids should have resistance to all pathogenic variants of R. similis within Uganda as to ascertain that they could be grown in all banana growing
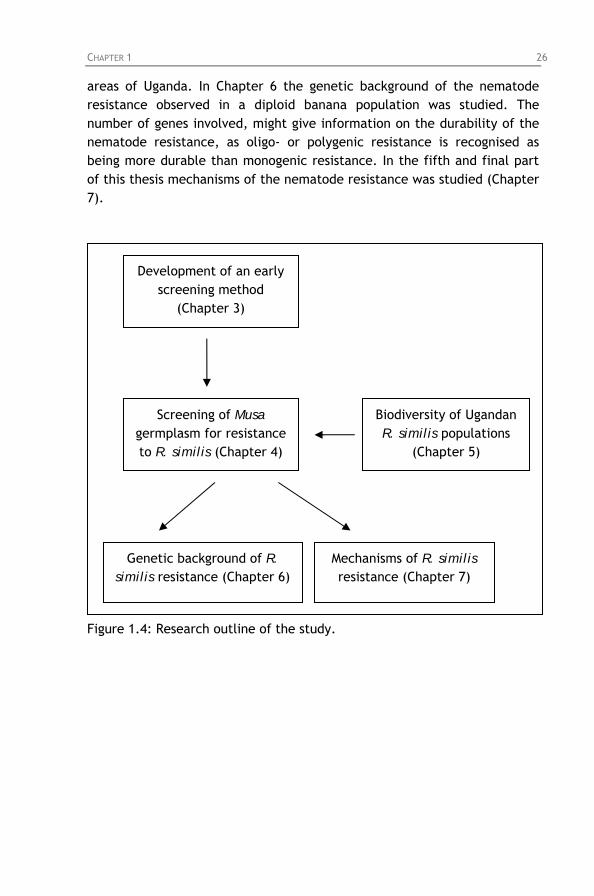
CHAPTER 1 26
areas of Uganda. In Chapter 6 the genetic background of the nematode resistance observed in a diploid banana population was studied. The number of genes involved, might give information on the durability of the nematode resistance, as oligo- or polygenic resistance is recognised as being more durable than monogenic resistance. In the fifth and final part of this thesis mechanisms of the nematode resistance was studied (Chapter 7).
Development of an early screening method
(Chapter 3)
Screening of Musa germplasm for resistance to R. similis (Chapter 4)
Biodiversity of Ugandan R. similis populations
(Chapter 5)
Genetic background of R. similis resistance (Chapter 6)
Mechanisms of R. similis resistance (Chapter 7)
Figure 1.4: Research outline of the study.
CHAPTER 2 27
Chapter 2: Materials and methods
In this chapter an overview is given of the basic materials and methods used in the experiments described in the following chapters. Specific details of each experiment are presented in chapters 3 to 7. 2.1. Site description The study was conducted at the Eastern and Southern Africa Regional Center of the International Institute of Tropical Agriculture (IITA-ESARC) in Namulonge, Uganda. Uganda is situated between 4°7’ northern latitude and 1°3’ southern latitude and between 29°33’ and 35°20’ eastern longitude. The total area of the country is 230,000 km2, of which 45,000 km2 consists of lakes. Uganda has a tropical climate. Namulonge is located 28 km northwest from the capital Kampala at 1,128 m above sea level (masl) and has an average temperature of 22°C. The average annual rainfall is approximately 1,150 mm falling in a bimodal pattern, the heavy rains occurring from March to June and the light rains between September and November (Jagtap, 1993). The soil at Namulonge is a dark reddish-brown loamy soil, composed of 60% sand, 28% clay and 12% silt, with a pH ranging from 5.5 to 6.2 and an organic matter content of 3.3% (Speijer et al., 2000b; Talwana, 2002). 2.2. Planting material 2.2.1. Sword sucker-derived plants Sword suckers were collected from the field and selected for absence of weevil damage. They were then pared to remove roots and corm tissue which showed symptoms of nematode infection (Figure 2.1) and hot water treated at 50 to 55oC for 20 minutes (Colbran, 1967) before planting (Figure 2.2). Speijer et al. (2000a) and Elsen et al. (2004) reported that it may take up to 3 years before hot water treated suckers are as severely infected as compared to untreated standard farmers’ planting material.
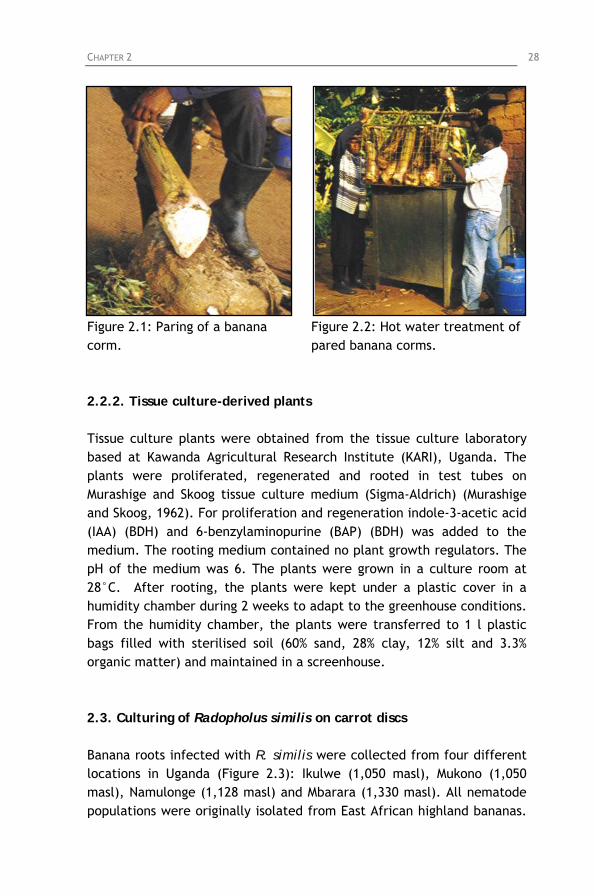
CHAPTER 2 28
Figure 2.1: Paring of a banana corm.
Figure 2.2: Hot water treatment of pared banana corms.
2.2.2. Tissue culture-derived plants Tissue culture plants were obtained from the tissue culture laboratory based at Kawanda Agricultural Research Institute (KARI), Uganda. The plants were proliferated, regenerated and rooted in test tubes on Murashige and Skoog tissue culture medium (Sigma-Aldrich) (Murashige and Skoog, 1962). For proliferation and regeneration indole-3-acetic acid (IAA) (BDH) and 6-benzylaminopurine (BAP) (BDH) was added to the medium. The rooting medium contained no plant growth regulators. The pH of the medium was 6. The plants were grown in a culture room at 28°C. After rooting, the plants were kept under a plastic cover in a humidity chamber during 2 weeks to adapt to the greenhouse conditions. From the humidity chamber, the plants were transferred to 1 l plastic bags filled with sterilised soil (60% sand, 28% clay, 12% silt and 3.3% organic matter) and maintained in a screenhouse. 2.3. Culturing of Radopholus similis on carrot discs Banana roots infected with R. similis were collected from four different locations in Uganda (Figure 2.3): Ikulwe (1,050 masl), Mukono (1,050 masl), Namulonge (1,128 masl) and Mbarara (1,330 masl). All nematode populations were originally isolated from East African highland bananas.
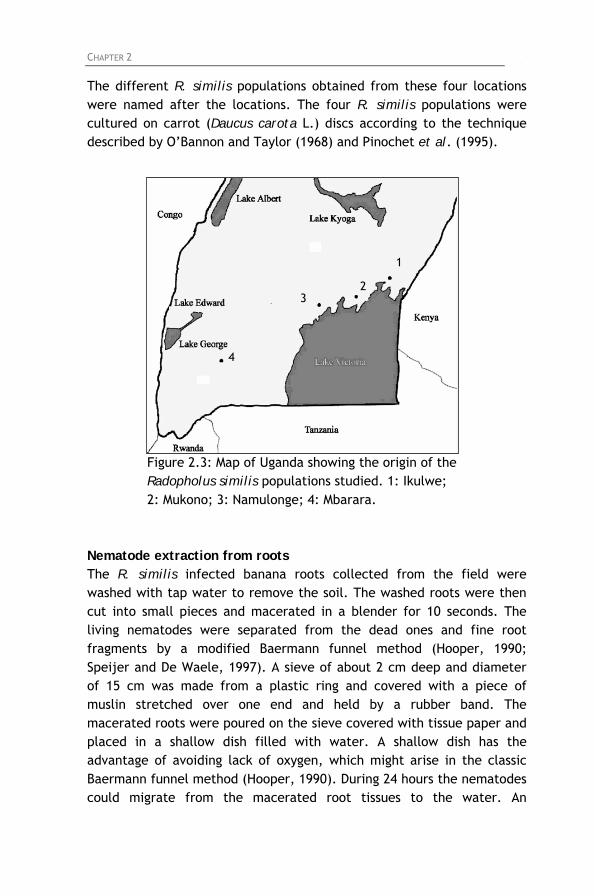
CHAPTER 2 29
The different R. similis populations obtained from these four locations were named after the locations. The four R. similis populations were cultured on carrot (Daucus carota L.) discs according to the technique described by O’Bannon and Taylor (1968) and Pinochet et al. (1995).
4
3 2
1
Figure 2.3: Map of Uganda showing the origin of the Radopholus similis populations studied. 1: Ikulwe; 2: Mukono; 3: Namulonge; 4: Mbarara.
Nematode extraction from roots The R. similis infected banana roots collected from the field were washed with tap water to remove the soil. The washed roots were then cut into small pieces and macerated in a blender for 10 seconds. The living nematodes were separated from the dead ones and fine root fragments by a modified Baermann funnel method (Hooper, 1990; Speijer and De Waele, 1997). A sieve of about 2 cm deep and diameter of 15 cm was made from a plastic ring and covered with a piece of muslin stretched over one end and held by a rubber band. The macerated roots were poured on the sieve covered with tissue paper and placed in a shallow dish filled with water. A shallow dish has the advantage of avoiding lack of oxygen, which might arise in the classic Baermann funnel method (Hooper, 1990). During 24 hours the nematodes could migrate from the macerated root tissues to the water. An
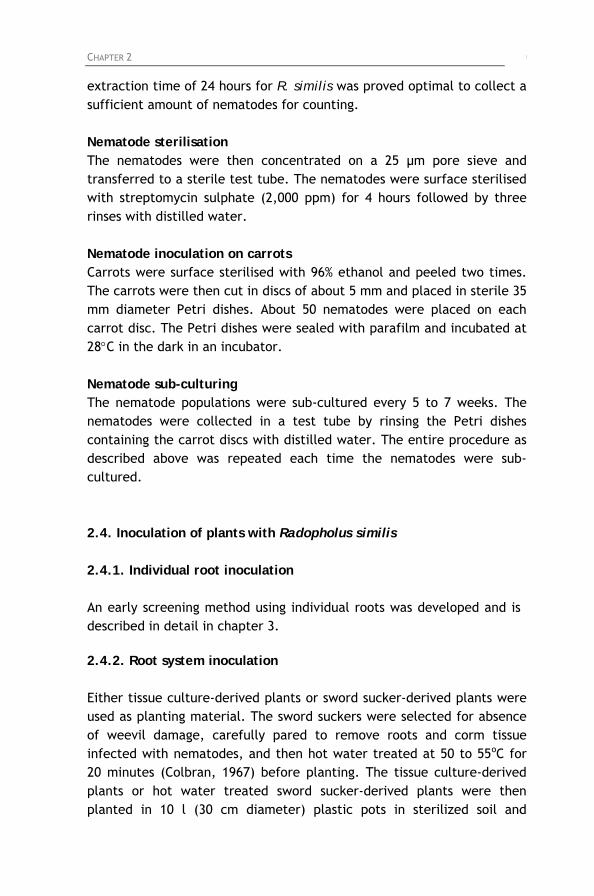
CHAPTER 2 30
extraction time of 24 hours for R. similis was proved optimal to collect a sufficient amount of nematodes for counting. Nematode sterilisation The nematodes were then concentrated on a 25 μm pore sieve and transferred to a sterile test tube. The nematodes were surface sterilised with streptomycin sulphate (2,000 ppm) for 4 hours followed by three rinses with distilled water. Nematode inoculation on carrots Carrots were surface sterilised with 96% ethanol and peeled two times. The carrots were then cut in discs of about 5 mm and placed in sterile 35 mm diameter Petri dishes. About 50 nematodes were placed on each carrot disc. The Petri dishes were sealed with parafilm and incubated at 28°C in the dark in an incubator. Nematode sub-culturing The nematode populations were sub-cultured every 5 to 7 weeks. The nematodes were collected in a test tube by rinsing the Petri dishes containing the carrot discs with distilled water. The entire procedure as described above was repeated each time the nematodes were sub-cultured. 2.4. Inoculation of plants with Radopholus similis 2.4.1. Individual root inoculation An early screening method using individual roots was developed and is described in detail in chapter 3.
2.4.2. Root system inoculation Either tissue culture-derived plants or sword sucker-derived plants were used as planting material. The sword suckers were selected for absence of weevil damage, carefully pared to remove roots and corm tissue infected with nematodes, and then hot water treated at 50 to 55oC for 20 minutes (Colbran, 1967) before planting. The tissue culture-derived plants or hot water treated sword sucker-derived plants were then planted in 10 l (30 cm diameter) plastic pots in sterilized soil and
CHAPTER 2 31
inoculated with 1,000 R. similis (adults and juveniles). Four holes were made in the soil around each plant and 250 nematodes in a 2 ml aqueous suspension were inoculated in each hole after which the holes were filled with soil. Plants were maintained in a screenhouse. Nematode inoculum was obtained from cultures maintained on carrot discs (section 2.2.1). The experiment was concluded 8 weeks after inoculation of tissue culture-derived plants and 12 weeks after inoculation of sword sucker-derived plants. Plants were removed from the pots and the soil washed from the roots with tap water. Per plant the fresh root weight of the total root system was recorded. The percentage root necrosis was estimated for five randomly selected functional primary roots. Five primary root segments of 10 cm were cut lengthwise and the percentage of visible necrotic cortical tissue of five root halves was determined. Each root half could have a maximum percentage root necrosis of 20%, adding up to 100% for the five root halves together (Speijer and Gold, 1996; Speijer and De Waele, 1997). These five root segments were then cut into 0.5 cm pieces, thoroughly mixed and a 5 g sub-sample taken for nematode extraction (Section 2.3). The nematode counts were done three times using 2 ml aliquots taken from a 25 ml aqueous suspension. In case of high nematode population densities, the suspension was diluted to 50 ml. All vermiform developmental stages (juveniles and adults) were counted and nematode population densities were calculated per 100 g fresh root weight. In each experiment two reference Musa cultivars were included: Valery (Musa AAA, Cavendish subgroup) as the R. similis susceptible and Yangambi km5 (Musa AAA, Ibota subgroup) as the R. similis resistant reference cultivar.
2.5. Analysis of experiments For the statistical analysis of the results, the software package SAS version 8 was used (SAS Institute, 1999). Nematode population densities were log(x+1) transformed prior to analysis (Gomez and Gomez, 1984).
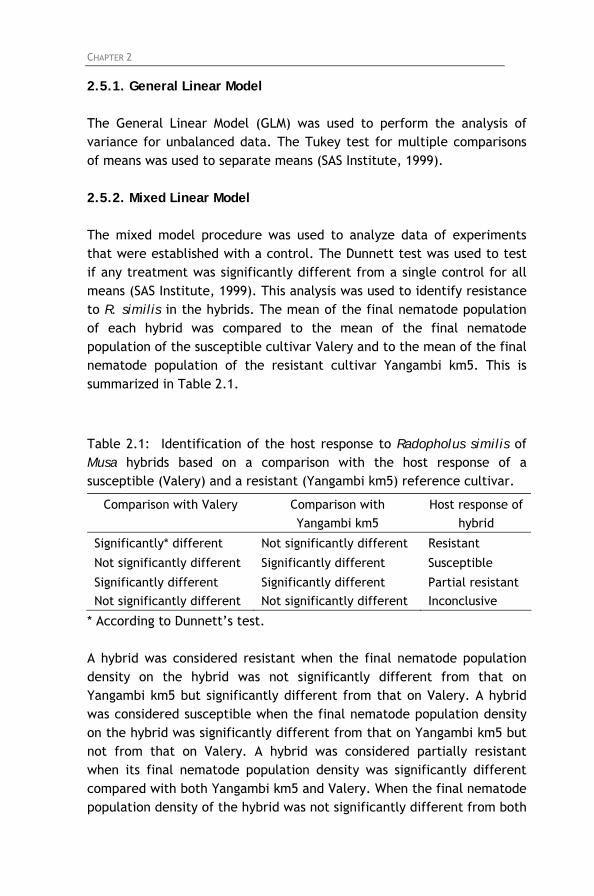
CHAPTER 2 32
2.5.1. General Linear Model The General Linear Model (GLM) was used to perform the analysis of variance for unbalanced data. The Tukey test for multiple comparisons of means was used to separate means (SAS Institute, 1999). 2.5.2. Mixed Linear Model
The mixed model procedure was used to analyze data of experiments that were established with a control. The Dunnett test was used to test if any treatment was significantly different from a single control for all means (SAS Institute, 1999). This analysis was used to identify resistance to R. similis in the hybrids. The mean of the final nematode population of each hybrid was compared to the mean of the final nematode population of the susceptible cultivar Valery and to the mean of the final nematode population of the resistant cultivar Yangambi km5. This is summarized in Table 2.1.
Table 2.1: Identification of the host response to Radopholus similis of Musa hybrids based on a comparison with the host response of a susceptible (Valery) and a resistant (Yangambi km5) reference cultivar.
Comparison with Valery Comparison with Yangambi km5
Host response of hybrid
Significantly* different Not significantly different Resistant
Not significantly different Significantly different Susceptible
Significantly different Significantly different Partial resistant Not significantly different Not significantly different Inconclusive
* According to Dunnett’s test. A hybrid was considered resistant when the final nematode population density on the hybrid was not significantly different from that on Yangambi km5 but significantly different from that on Valery. A hybrid was considered susceptible when the final nematode population density on the hybrid was significantly different from that on Yangambi km5 but not from that on Valery. A hybrid was considered partially resistant when its final nematode population density was significantly different compared with both Yangambi km5 and Valery. When the final nematode population density of the hybrid was not significantly different from both
CHAPTER 2 33
Valery and Yangambi km5, no conclusion could be made on the resistant/susceptible status of the hybrid. 2.5.3. Gompertz equation The growth of a population y against time t can be described by a growth curve. Often there is a lag phase in which the population y does not change with time, followed by an exponential growth phase, and finally a stationary phase. During the lag phase, the growth rate equals zero. During the exponential growth phase, the growth rate increases until the maximum growth rate is achieved and then decreases again. During the stationary phase, the growth rate equals zero again. The Gompertz equation is frequently used to describe the growth of a population (Zwietering et al., 1990):
Y = A + C exp (-exp (B (M-t))), in which y is the response variable, t is time and A, B, C and M are model parameters. The growth is characterised by three biological parameters (Figure 2.4):
1. The lag time in which the nematodes adapt to the new environment, is defined as the t-axis intercept of the tangent line through the inflection point: λ = M -1/B.
2. The maximum growth rate is measured by the slope at the inflection point: μ = CB/e.
3. The asymptotic value for time approaching infinity: A + C.
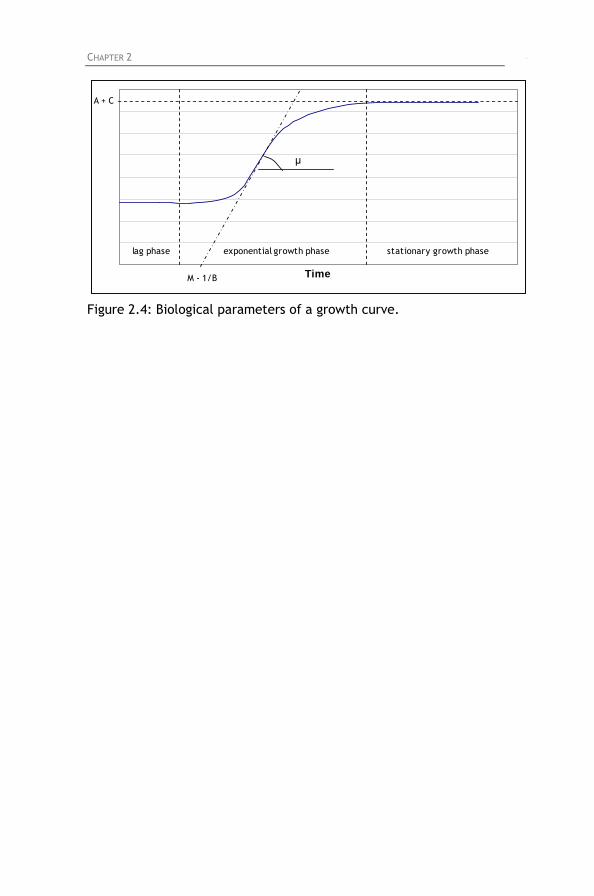
CHAPTER 2 34
Time
lag phase exponential growth phase stationary growth phase
M - 1/B
μ
A + C
Figure 2.4: Biological parameters of a growth curve.
CHAPTER 3 35
Chapter 3: Development of a method for screening
Musa germplasm for resistance to Radopholus similis1
3.1. Background and objectives Host plant resistance was identified as one of the most promising strategies for nematode management in Uganda. Nematode resistant Musa genotypes can be identified by selecting the highest available resistance either within the existing gene pool or among the hybrids produced by the different Musa breeding programs world-wide. In both cases, the first step consists of the screening of germplasm for sources of resistance. In Musa, nematode resistance screening is usually undertaken either in pots (or plastic bags) placed in a greenhouse (Pinochet, 1988b; Sarah, 1996; Speijer and De Waele, 1997; Stoffelen, 2000) or in the field (Price, 1994; Speijer et al., 1999a). Elsen (2002) and Elsen et al. (2002) developed an in vitro screening method for determining resistance to R. similis.
In vitro screening In in vitro screening, plantlets can be inoculated at a very early vegetative growth stage (i.e. in vitro rooted plantlets). An initial inoculum of 25 to 50 R. similis females and an incubation time of 8 weeks are considered optimal for in vitro screening (Elsen, 2002; Elsen et al., 2002). The screening can be performed under highly controlled conditions, a small quantity of inoculum is sufficient, less time and space are required for plant multiplication and maintenance, and experimental time is shorter compared to the other screening methods. An in vitro screening method allows the elimination of susceptible germplasm at a very early growth
1 The description of this screening method has been published in:
Dochez, C., Speijer, P.R., Hartman, J., Vuylsteke, D. and De Waele, D., 2000.
Screening Musa hybrids for resistance to Radopholus similis. InfoMusa 9(2): 3-4.
De Schutter, B., Speijer, P.R., Dochez, C., Tenkouano, A. and De Waele, D., 2001.
Evaluating host plant reaction of Musa germplasm to Radopholus similis by
inoculation of single primary roots. Nematropica 31(2): 295-299.
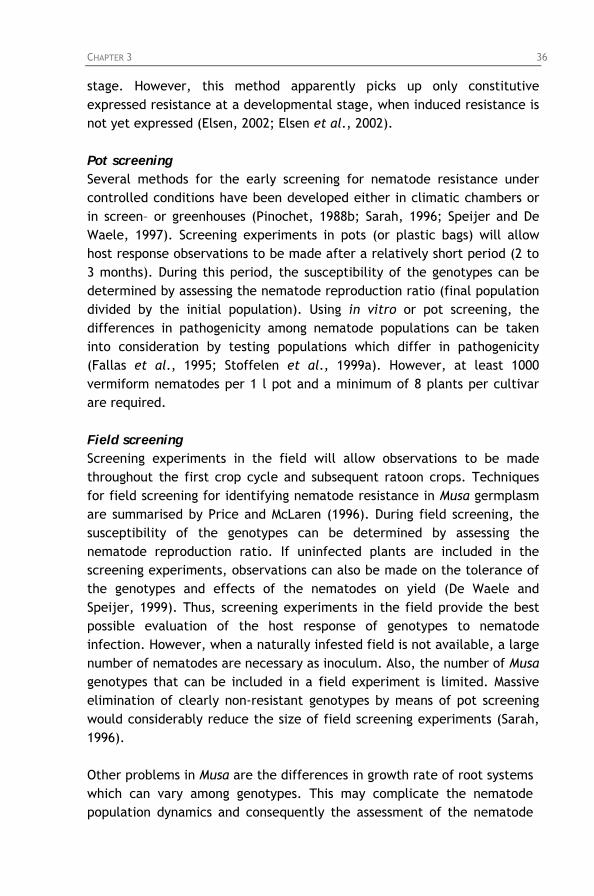
CHAPTER 3 36
stage. However, this method apparently picks up only constitutive expressed resistance at a developmental stage, when induced resistance is not yet expressed (Elsen, 2002; Elsen et al., 2002). Pot screening Several methods for the early screening for nematode resistance under controlled conditions have been developed either in climatic chambers or in screen– or greenhouses (Pinochet, 1988b; Sarah, 1996; Speijer and De Waele, 1997). Screening experiments in pots (or plastic bags) will allow host response observations to be made after a relatively short period (2 to 3 months). During this period, the susceptibility of the genotypes can be determined by assessing the nematode reproduction ratio (final population divided by the initial population). Using in vitro or pot screening, the differences in pathogenicity among nematode populations can be taken into consideration by testing populations which differ in pathogenicity (Fallas et al., 1995; Stoffelen et al., 1999a). However, at least 1000 vermiform nematodes per 1 l pot and a minimum of 8 plants per cultivar are required. Field screening Screening experiments in the field will allow observations to be made throughout the first crop cycle and subsequent ratoon crops. Techniques for field screening for identifying nematode resistance in Musa germplasm are summarised by Price and McLaren (1996). During field screening, the susceptibility of the genotypes can be determined by assessing the nematode reproduction ratio. If uninfected plants are included in the screening experiments, observations can also be made on the tolerance of the genotypes and effects of the nematodes on yield (De Waele and Speijer, 1999). Thus, screening experiments in the field provide the best possible evaluation of the host response of genotypes to nematode infection. However, when a naturally infested field is not available, a large number of nematodes are necessary as inoculum. Also, the number of Musa genotypes that can be included in a field experiment is limited. Massive elimination of clearly non-resistant genotypes by means of pot screening would considerably reduce the size of field screening experiments (Sarah, 1996). Other problems in Musa are the differences in growth rate of root systems which can vary among genotypes. This may complicate the nematode population dynamics and consequently the assessment of the nematode
CHAPTER 3 37
population densities. Also primary roots are produced in flushes and this may result in a root system that consists of a mixture of roots varying in age (Blomme, 2000). Differences in the reproduction (and root damage) of R. similis on 2-month-old sword sucker-derived plants and sword suckers of established mats were observed during field screening of Musa genotypes in Uganda, suggesting a different host response to nematode infection of young root systems compared to old root systems (Speijer et al., 1999a).
The aim of our study was to develop a fast and reliable method for screening Musa germplasm for resistance to R. similis that needs fewer plants and space, and a lower nematode inoculum than the screening methods currently in use, and that is not influenced neither by root growth rate nor age. Following the terminology of Bos and Parlevliet (1995), resistance or susceptibility to nematodes is defined as the ability of the plant either to suppress (resistance) or allow (susceptibility) respectively the nematode reproduction. 3.2. Experimental set-up Three experiments were carried out: two at the Eastern and Southern Africa Regional Center of the International Institute of Tropical Agriculture (IITA-ESARC) at Namulonge in Uganda and one at the High Rainfall Station of IITA at Onne in southeastern Nigeria. In Uganda both experiments were carried out in a greenhouse, in Nigeria the experiment was carried out under a roofed area. In all three experiments, Yangambi km5 (AAA) was included as the R. similis resistant reference cultivar (Sarah et al., 1992; Price, 1994, Fogain and Gowen, 1998). As the R. similis susceptible reference cultivar, Valery (AAA) was included in the experiments in Uganda and Agbagba (AAB) in the experiment in Nigeria. Experiment 1 In experiment 1 in Uganda the following genotypes were included: Valery, Yangambi km5, the diploid hybrid SH-3142, Gros Michel (AAA), the East African highland banana-derived tetraploid hybrid TMHx 481K-1 and the diploid IITA banana hybrids TMB2x 9128-3 (Tenkouano et al., 2003) and TMB2x 9722-1. SH-3142 is resistant to R. similis (Pinochet and Rowe,
CHAPTER 3 38
1979; Viaene et al., 2003). Gros Michel is partially resistant to R. similis (Mateille, 1994a). The host response to R. similis of the other genotypes is unknown. Experiment 2 In experiment 2 in Uganda the following genotypes were included: Valery, Yangambi km5, Grande Naine (AAA), Pisang Jari Buaya (AA), Gros Michel, the tetraploid hybrids FHIA-23 and FHIA-25, the diploid IITA hybrid TMB2x 9719-7 and the triploid IITA hybrid PITA-16 (Ortiz et al., 1998). Pisang Jari Buaya is resistant to R. similis (Pinochet and Rowe, 1979; Fogain, 2000; Viaene et al., 2003). Grande Naine is susceptible to R. similis (Price, 1994; Viaene et al., 2003). The host response of the hybrids to R. similis is unknown. Experiment 3 In experiment 3 in Nigeria the following genotypes were included: Agbagba, Yangambi km5 and the tetraploid IITA plantain hybrid TMPx 1658-4 with unknown host response to R. similis. Hot water treated sword sucker-derived plants of each genotype were planted in wooden boxes (0.5 x 0.5 x 0.5 m) containing sawdust. Eight weeks after planting, three to four equally developed primary roots were selected from each sucker (Figure 3.1). At a distance of 5 cm from the corm, a segment of each selected primary root was carefully placed in a small plastic container (8 cm diameter, 5 cm high) filled with sterilized sand (Figure 3.2). The roots were inoculated by pouring a 1 ml aqueous suspension containing 50 R. similis female nematodes directly onto the 8 cm long root segment, then covering it with sterilized sand. In Uganda, nematode inoculum (R. similis population from Namulonge) was obtained from carrot disc cultures (Section 2.3). The nematode inoculum was prepared by rinsing the Petri dishes containing the carrot discs with distilled water and collecting the nematodes in a test tube. In Nigeria, nematode inoculum was obtained by hand-picking R. similis from an aqueous suspension containing nematodes extracted from infected Valery roots using a modified Baermann funnel technique (Hooper, 1990; Speijer and De Waele, 1997). In both locations, the experiments were concluded 8 weeks after inoculation. The plastic cups with the root segments were carefully excavated (Figure 3.3). The root segments were removed and washed with tap water. The percentage root necrosis was recorded: each root segment was cut lengthwise and the percentage of visible necrotic
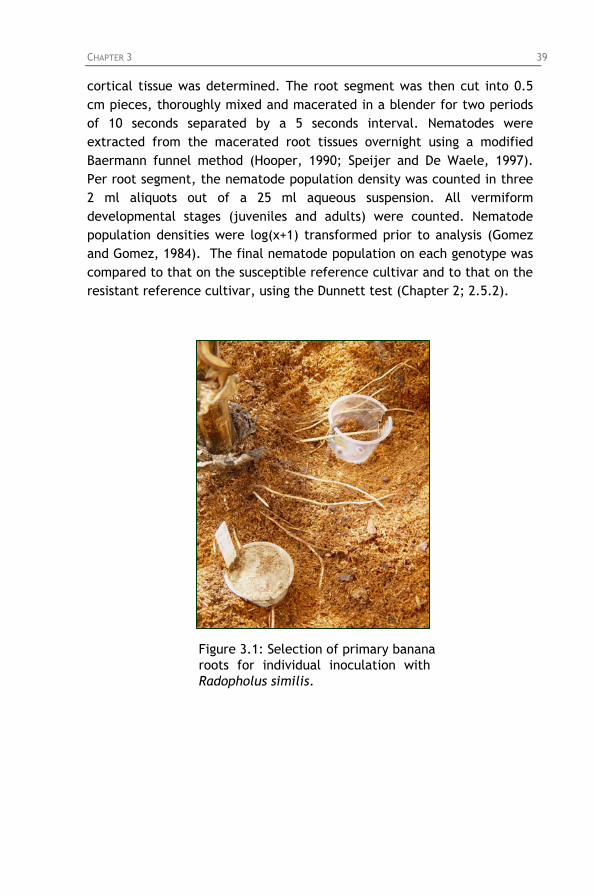
CHAPTER 3 39
cortical tissue was determined. The root segment was then cut into 0.5 cm pieces, thoroughly mixed and macerated in a blender for two periods of 10 seconds separated by a 5 seconds interval. Nematodes were extracted from the macerated root tissues overnight using a modified Baermann funnel method (Hooper, 1990; Speijer and De Waele, 1997). Per root segment, the nematode population density was counted in three 2 ml aliquots out of a 25 ml aqueous suspension. All vermiform developmental stages (juveniles and adults) were counted. Nematode population densities were log(x+1) transformed prior to analysis (Gomez and Gomez, 1984). The final nematode population on each genotype was compared to that on the susceptible reference cultivar and to that on the resistant reference cultivar, using the Dunnett test (Chapter 2; 2.5.2).
Figure 3.1: Selection of primary banana roots for individual inoculation with Radopholus similis.
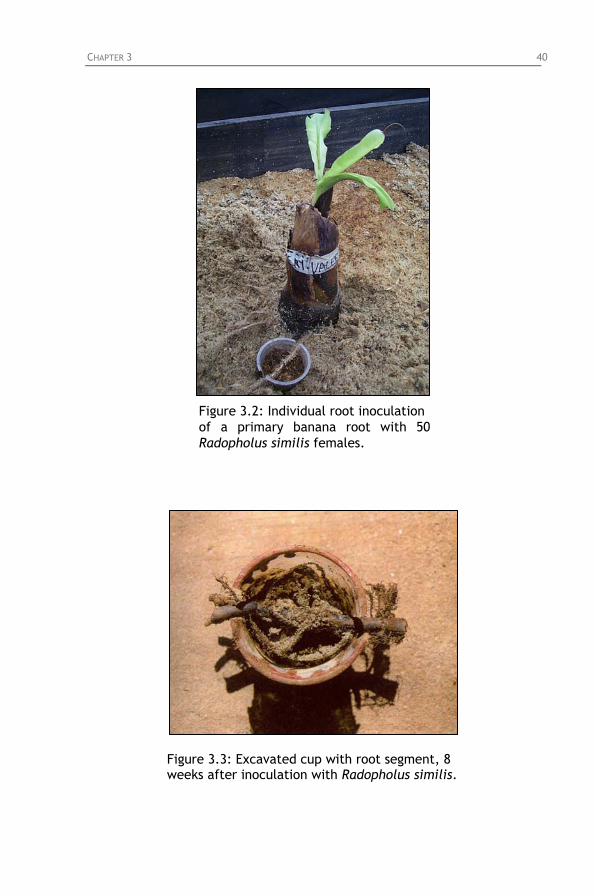
CHAPTER 3 40
Figure 3.2: Individual root inoculation of a primary banana root with 50 Radopholus similis females.
Figure 3.3: Excavated cup with root segment, 8 weeks after inoculation with Radopholus similis.
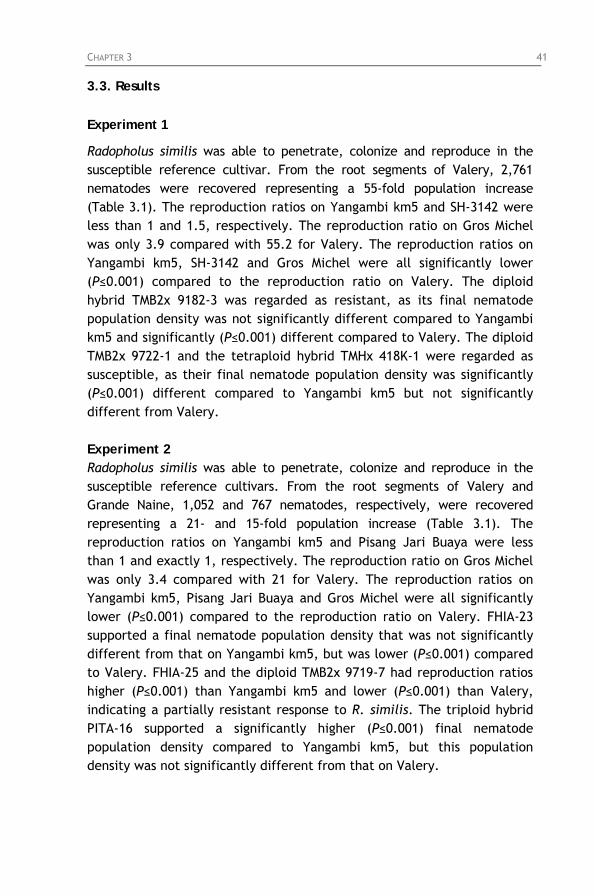
CHAPTER 3 41
3.3. Results
Experiment 1
Radopholus similis was able to penetrate, colonize and reproduce in the susceptible reference cultivar. From the root segments of Valery, 2,761 nematodes were recovered representing a 55-fold population increase (Table 3.1). The reproduction ratios on Yangambi km5 and SH-3142 were less than 1 and 1.5, respectively. The reproduction ratio on Gros Michel was only 3.9 compared with 55.2 for Valery. The reproduction ratios on Yangambi km5, SH-3142 and Gros Michel were all significantly lower (P≤0.001) compared to the reproduction ratio on Valery. The diploid hybrid TMB2x 9182-3 was regarded as resistant, as its final nematode population density was not significantly different compared to Yangambi km5 and significantly (P≤0.001) different compared to Valery. The diploid TMB2x 9722-1 and the tetraploid hybrid TMHx 418K-1 were regarded as susceptible, as their final nematode population density was significantly (P≤0.001) different compared to Yangambi km5 but not significantly different from Valery. Experiment 2 Radopholus similis was able to penetrate, colonize and reproduce in the susceptible reference cultivars. From the root segments of Valery and Grande Naine, 1,052 and 767 nematodes, respectively, were recovered representing a 21- and 15-fold population increase (Table 3.1). The reproduction ratios on Yangambi km5 and Pisang Jari Buaya were less than 1 and exactly 1, respectively. The reproduction ratio on Gros Michel was only 3.4 compared with 21 for Valery. The reproduction ratios on Yangambi km5, Pisang Jari Buaya and Gros Michel were all significantly lower (P≤0.001) compared to the reproduction ratio on Valery. FHIA-23 supported a final nematode population density that was not significantly different from that on Yangambi km5, but was lower (P≤0.001) compared to Valery. FHIA-25 and the diploid TMB2x 9719-7 had reproduction ratios higher (P≤0.001) than Yangambi km5 and lower (P≤0.001) than Valery, indicating a partially resistant response to R. similis. The triploid hybrid PITA-16 supported a significantly higher (P≤0.001) final nematode population density compared to Yangambi km5, but this population density was not significantly different from that on Valery.
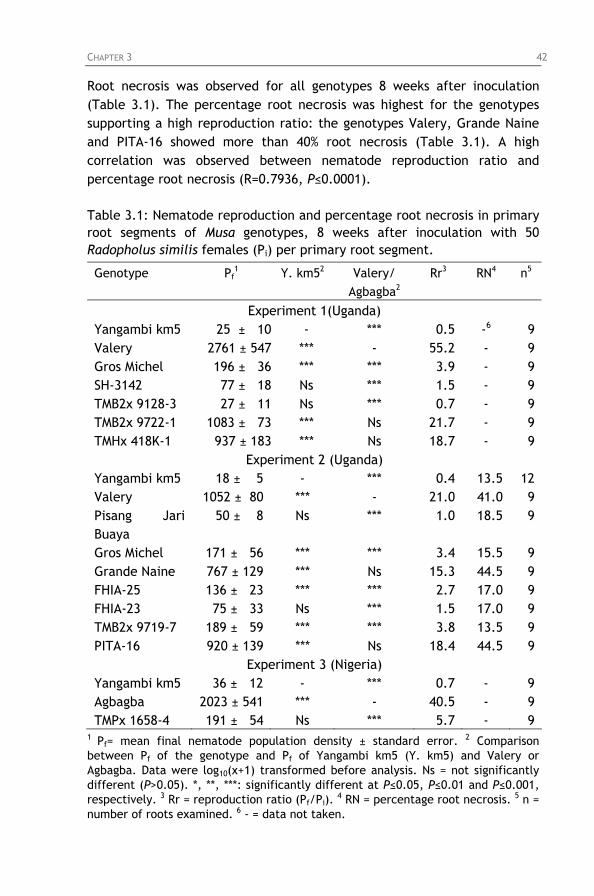
CHAPTER 3 42
Root necrosis was observed for all genotypes 8 weeks after inoculation (Table 3.1). The percentage root necrosis was highest for the genotypes supporting a high reproduction ratio: the genotypes Valery, Grande Naine and PITA-16 showed more than 40% root necrosis (Table 3.1). A high correlation was observed between nematode reproduction ratio and percentage root necrosis (R=0.7936, P≤0.0001). Table 3.1: Nematode reproduction and percentage root necrosis in primary root segments of Musa genotypes, 8 weeks after inoculation with 50 Radopholus similis females (Pi) per primary root segment.
Genotype Pf1 Y. km52 Valery/
Agbagba2
Rr3 RN4 n5
Experiment 1(Uganda) Yangambi km5 25 ± 10 - *** 0.5 -6 9 Valery 2761 ± 547 *** - 55.2 - 9 Gros Michel 196 ± 36 *** *** 3.9 - 9 SH-3142 77 ± 18 Ns *** 1.5 - 9 TMB2x 9128-3 27 ± 11 Ns *** 0.7 - 9 TMB2x 9722-1 1083 ± 73 *** Ns 21.7 - 9 TMHx 418K-1 937 ± 183 *** Ns 18.7 - 9
Experiment 2 (Uganda) Yangambi km5 18 ± 5 - *** 0.4 13.5 12 Valery 1052 ± 80 *** - 21.0 41.0 9 Pisang Jari Buaya
50 ± 8 Ns *** 1.0 18.5 9
Gros Michel 171 ± 56 *** *** 3.4 15.5 9 Grande Naine 767 ± 129 *** Ns 15.3 44.5 9 FHIA-25 136 ± 23 *** *** 2.7 17.0 9 FHIA-23 75 ± 33 Ns *** 1.5 17.0 9 TMB2x 9719-7 189 ± 59 *** *** 3.8 13.5 9 PITA-16 920 ± 139 *** Ns 18.4 44.5 9
Experiment 3 (Nigeria) Yangambi km5 36 ± 12 - *** 0.7 - 9 Agbagba 2023 ± 541 *** - 40.5 - 9 TMPx 1658-4 191 ± 54 Ns *** 5.7 - 9
1 Pf= mean final nematode population density ± standard error. 2 Comparison between Pf of the genotype and Pf of Yangambi km5 (Y. km5) and Valery or Agbagba. Data were log10(x+1) transformed before analysis. Ns = not significantly different (P>0.05). *, **, ***: significantly different at P≤0.05, P≤0.01 and P≤0.001, respectively. 3 Rr = reproduction ratio (Pf/Pi).
4 RN = percentage root necrosis. 5 n = number of roots examined. 6 - = data not taken.
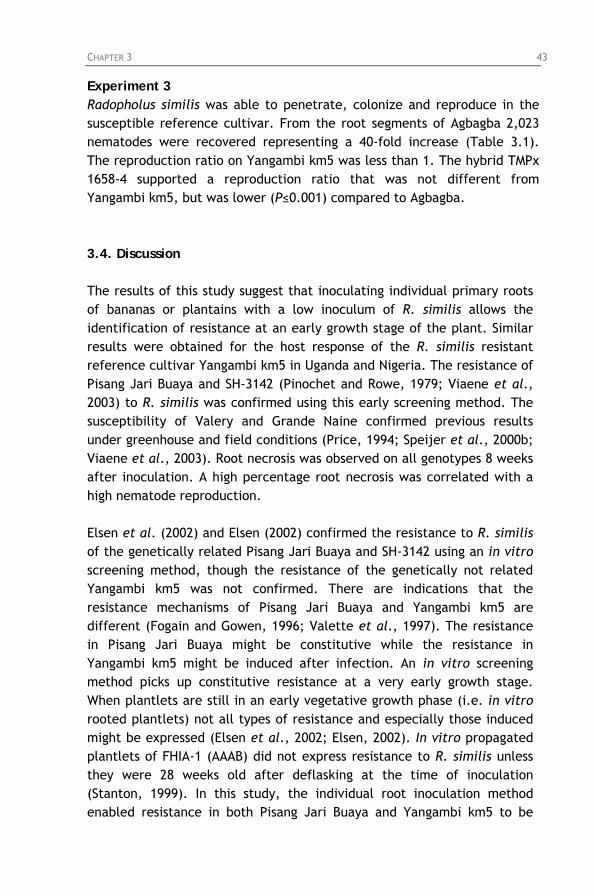
CHAPTER 3 43
Experiment 3 Radopholus similis was able to penetrate, colonize and reproduce in the susceptible reference cultivar. From the root segments of Agbagba 2,023 nematodes were recovered representing a 40-fold increase (Table 3.1). The reproduction ratio on Yangambi km5 was less than 1. The hybrid TMPx 1658-4 supported a reproduction ratio that was not different from Yangambi km5, but was lower (P≤0.001) compared to Agbagba. 3.4. Discussion The results of this study suggest that inoculating individual primary roots of bananas or plantains with a low inoculum of R. similis allows the identification of resistance at an early growth stage of the plant. Similar results were obtained for the host response of the R. similis resistant reference cultivar Yangambi km5 in Uganda and Nigeria. The resistance of Pisang Jari Buaya and SH-3142 (Pinochet and Rowe, 1979; Viaene et al., 2003) to R. similis was confirmed using this early screening method. The susceptibility of Valery and Grande Naine confirmed previous results under greenhouse and field conditions (Price, 1994; Speijer et al., 2000b; Viaene et al., 2003). Root necrosis was observed on all genotypes 8 weeks after inoculation. A high percentage root necrosis was correlated with a high nematode reproduction. Elsen et al. (2002) and Elsen (2002) confirmed the resistance to R. similis of the genetically related Pisang Jari Buaya and SH-3142 using an in vitro screening method, though the resistance of the genetically not related Yangambi km5 was not confirmed. There are indications that the resistance mechanisms of Pisang Jari Buaya and Yangambi km5 are different (Fogain and Gowen, 1996; Valette et al., 1997). The resistance in Pisang Jari Buaya might be constitutive while the resistance in Yangambi km5 might be induced after infection. An in vitro screening method picks up constitutive resistance at a very early growth stage. When plantlets are still in an early vegetative growth phase (i.e. in vitro rooted plantlets) not all types of resistance and especially those induced might be expressed (Elsen et al., 2002; Elsen, 2002). In vitro propagated plantlets of FHIA-1 (AAAB) did not express resistance to R. similis unless they were 28 weeks old after deflasking at the time of inoculation (Stanton, 1999). In this study, the individual root inoculation method enabled resistance in both Pisang Jari Buaya and Yangambi km5 to be
CHAPTER 3 44
identified. The hot water treated sword sucker-derived plants were inoculated around 8 weeks after planting when the root system was well developed. A variable reproduction of the same nematode population among the experiments was observed. The reproduction ratio of R. similis on Valery in the first (Rr = 55) and second (Rr = 21) experiment was very different. Therefore it is important to use a susceptible standard reference cultivar in all screening experiments. At least 8 replicates per treatment should be included to reduce the high variability in nematode reproduction. The individual root screening method has several advantages compared to the standard greenhouse screening method: fewer plants (three plants instead of eight) and a lower nematode inoculum are needed (50 nematodes per individual root compared to 1000 nematodes per plant). By using individual roots, the evaluation of the host response to nematode infection is not influenced by differences in root growth rates among Musa genotypes. Moreover, primary roots of the same age can be selected for inoculation, avoiding bias caused by differences in host response to R. similis related to root age. In addition, this method seems to be able to pick up both constitutive and induced resistance. The reliability and usefulness of this early screening method will be further proved in the following chapters. In chapter 4, this early screening method will be compared with the classical pot screening by inoculating the whole root system.
CHAPTER 4 45
Chapter 4: Identifying sources of resistance and
breeding for resistance to Radopholus similis
4.1. Background Bananas have long been considered intractable to genetic improvement. However, advances in several Musa breeding programs have demonstrated that development of improved germplasm through conventional cross-breeding can result in hybrids suitable for local consumption and commercial production (Vuylsteke, 2000). Banana breeding started in 1922 in Trinidad at the Imperial College of Tropical Agriculture (ICTA) and in 1924 in Jamaica at the Department of Agriculture. The aim of these programs was to develop a Gros Michel (AAA) sweet dessert banana with resistance to Fusarium wilt. The researchers discovered that when pollen from a diploid was applied to female flowers of Gros Michel, a few seeds were produced that yielded tetraploid hybrids. This was the start of banana breeding (Stover and Buddenhagen, 1986; Shepherd, 1994; Jones, 2000). Conventional banana cross-breeding is complicated by low seed fertility, triploidy, slow propagation and time and space requirements (Vuylsteke, 2000). Until recently, the main objective of most conventional banana cross-breeding programs was to develop tetraploid hybrids with resistance to Fusarium wilt and black Sigatoka, and which produced fruit that met the requirements of the international trade in sweet dessert bananas. The United Fruit Company started its breeding program in Panama in the 1920’s, later the program moved to Honduras. This program wanted to combine all desirable qualities into one commercial sweet dessert banana for export. In 1984, the breeding program was donated to the Fundación Hondureňa de Investigación Agrícola (FHIA). With funding from international donors, the emphasis shifted to the development of disease resistant hybrids for subsistence farmers in developing countries. In 1982 a banana breeding program was established in Brazil, by the Empresa Brasiliera de Pesquisa Agropecuaria – Centro Nacional de Pesquisa de Mandioca e Fruticultura (EMBRAPA-CNPMF). The aim of this program was to develop disease resistant tetraploid hybrids with characteristics of the local cultivar Prata (AAB) (Jones, 2000).
CHAPTER 4 46
In Africa, conventional cross-breeding programs aiming at improving the resistance of plantains to black Sigatoka were established at the International Institute of Tropical Agriculture (IITA) at Onne in Nigeria in the late 1980’s and at the Centre Régional Bananiers et Plantains (CRBP) at Nyombe in Cameroon in the early 1990’s. CRBP is now called Centre Africain de Recherches sur Bananiers et Plantains (CARBAP). The initial strategy of these breeding programs was to develop disease resistant, plantain-like tetraploid hybrids (Jones, 2000). This can be achieved by using seed-fertile triploids with the desired fruit qualities as the female parental lines in cross-pollinations with disease resistant diploids (Rowe and Rosales, 2000). However, breeding tetraploid hybrids has been questioned (Stover and Buddenhagen, 1986). Tetraploids have droopier leaves with weaker petioles than triploids which make them more liable to snapping in wind. They are also much more prone to seed set if pollinated, an undesirable characteristic in edible banana and plantain. As triploidy level has evolved in Musa as the most productive ploidy level, breeding programs should aim at producing triploid hybrids (Jones, 2000). Development of triploids has been done by crossing tetraploids with improved diploids. In Guadeloupe a triploid banana breeding program was developed in the early 1980’s at the Département des productions fruitières et horticoles (FLHOR) of the Centre de coopération internationale en recherche agronomique pour le développement (CIRAD) (Tézenas du Montcel et al., 1996). The International Musa Testing Program (IMTP) was established in 1989 as the global Musa evaluation program, supported by the United Nations Development Program (UNDP). The primary objective of IMTP was to identify in multi-locational trials around the world disease resistant banana and plantain hybrids which would meet local requirements and with which small-scale farmers could replace existing susceptible cultivars. In addition, IMTP was also to increase the capacity of national organisations to carry out appropriate research on local consumption bananas and plantains and ultimately embark on locally adapted programs for the genetic improvement of bananas and plantains (Mateo, 1994; Orjeda et al., 2000). During the first phase of IMTP, germplasm from the FHIA breeding program was evaluated for resistance to black Sigatoka. Seven tetraploid hybrids were tested with several reference diploid cultivars that represented the whole range of reaction to black Sigatoka, from highly resistant to highly susceptible. Three hybrids with resistance to black Sigatoka and high productivity were selected for distribution: the
CHAPTER 4 47
dessert bananas FHIA-01 (AAAB) and FHIA-02 (AAAB), and the cooking banana FHIA-03 (AABB) (Jones, 1994; Jones and Tézenas du Montcel, 1994; Orjeda et al., 2000). During the second phase of IMTP, germplasm was evaluated for resistance to black Sigatoka, yellow Sigatoka and Fusarium wilt. Four breeding programs (FHIA, EMBRAPA, INIVIT1 and TBRI2) contributed improved germplasm (Orjeda et al., 1999). IMTP phase 2 was carried out in 21 sites in 15 countries. The FHIA hybrids performed best in the Fusarium wilt experiments. FHIA-23 (AAAA) performed best in the Sigatoka experiments. Detailed results of IMTP phase 2 were published by the International Network for Improvement of Banana and Plantain (INIBAP) (Orjeda, 2000). During the third phase of IMTP, which is currently ongoing, germplasm developed at FHIA, IITA, CARBAP and CIRAD is being evaluated (INIBAP, 2000). This phase also includes screening of Musa germplasm for resistance to nematodes (ProMusa, 2000). Screening of germplasm for resistance to R. similis within the third phase of IMTP is summarised in Chapter 5.
4.2. The Musa breeding program of IITA
Research on plantain at IITA started in 1973 in Ibadan, Nigeria, as a special project funded by the Belgian Government. In 1979, the centre of plantain research was transferred to IITA’s High Rainfall Station at Onne in southeastern Nigeria, in the more suitable ecological niche of the humid forest zone. In 1987, banana and plantain was included among the mandate crops of IITA and as such the plantain breeding program was initiated in response to the black Sigatoka epidemic (Swennen and Vuylsteke, 1993; Vuylsteke et al., 1993; Vuylsteke, 2001). The objective of this program was then enlarged to breed disease and pest resistant Musa hybrids for smallholder farmers in sub-Saharan Africa. In the beginning, focus was on plantains and ABB cooking bananas for lowland humid areas. In the early 1990’s, IITA was able to develop (in about 5 years) improved plantain-banana hybrid germplasm with resistance to black Sigatoka. The potential impact of using black Sigatoka resistant plantains shows a cost-benefit impact of 10:1 over fungicides in southeastern Nigeria (Vuylsteke, 1995; Ortiz and Vuylsteke, 1997; Ortiz et al., 1998; Ortiz, 2001). Owing to its pioneering research-for-development
1 INIVIT: Instituto Nacional de Investigaciones en Viandas Tropicales, Cuba 2 TBRI: Taiwan Banana Research Institute, Taiwan
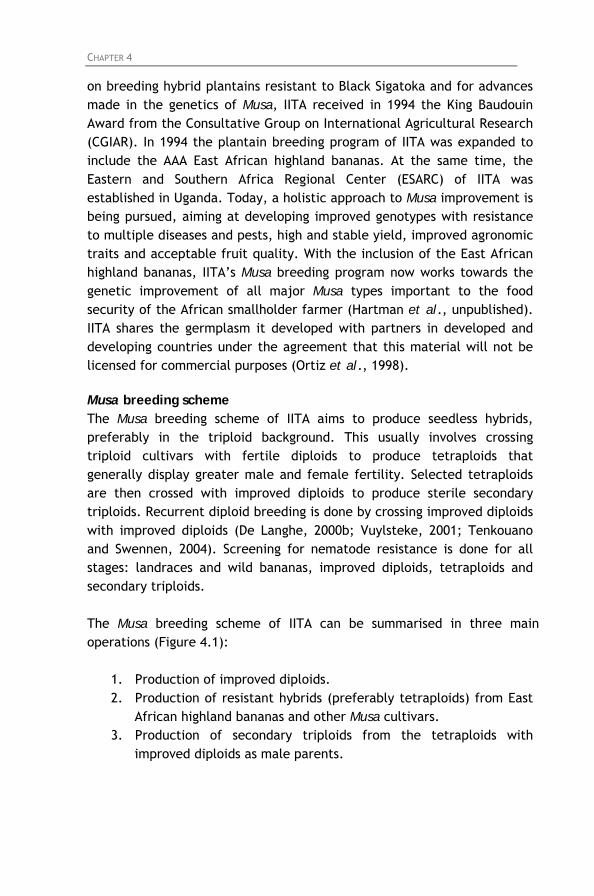
CHAPTER 4 48
on breeding hybrid plantains resistant to Black Sigatoka and for advances made in the genetics of Musa, IITA received in 1994 the King Baudouin Award from the Consultative Group on International Agricultural Research (CGIAR). In 1994 the plantain breeding program of IITA was expanded to include the AAA East African highland bananas. At the same time, the Eastern and Southern Africa Regional Center (ESARC) of IITA was established in Uganda. Today, a holistic approach to Musa improvement is being pursued, aiming at developing improved genotypes with resistance to multiple diseases and pests, high and stable yield, improved agronomic traits and acceptable fruit quality. With the inclusion of the East African highland bananas, IITA’s Musa breeding program now works towards the genetic improvement of all major Musa types important to the food security of the African smallholder farmer (Hartman et al., unpublished). IITA shares the germplasm it developed with partners in developed and developing countries under the agreement that this material will not be licensed for commercial purposes (Ortiz et al., 1998).
Musa breeding scheme The Musa breeding scheme of IITA aims to produce seedless hybrids, preferably in the triploid background. This usually involves crossing triploid cultivars with fertile diploids to produce tetraploids that generally display greater male and female fertility. Selected tetraploids are then crossed with improved diploids to produce sterile secondary triploids. Recurrent diploid breeding is done by crossing improved diploids with improved diploids (De Langhe, 2000b; Vuylsteke, 2001; Tenkouano and Swennen, 2004). Screening for nematode resistance is done for all stages: landraces and wild bananas, improved diploids, tetraploids and secondary triploids. The Musa breeding scheme of IITA can be summarised in three main operations (Figure 4.1):
1. Production of improved diploids. 2. Production of resistant hybrids (preferably tetraploids) from East
African highland bananas and other Musa cultivars. 3. Production of secondary triploids from the tetraploids with
improved diploids as male parents.
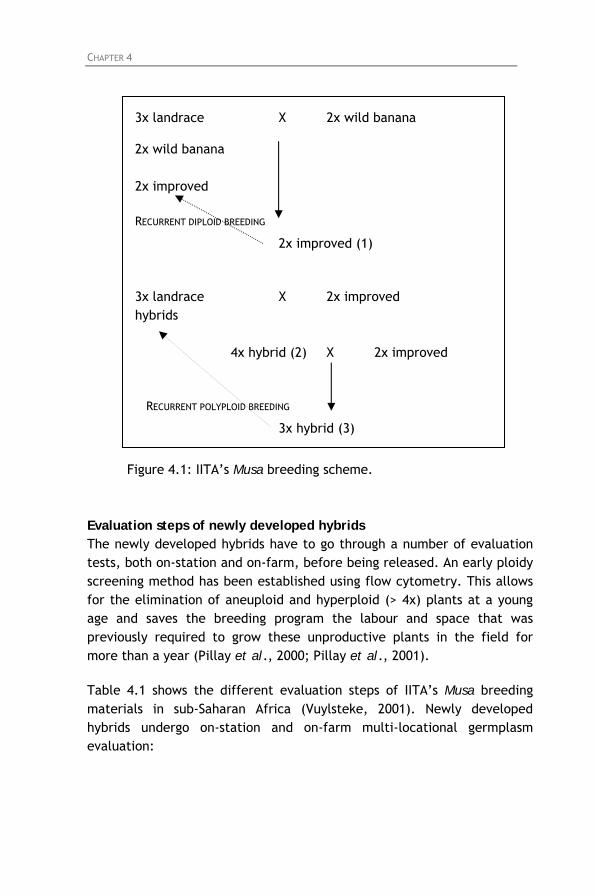
CHAPTER 4 49
3x landrace X 2x wild banana
2x wild banana 2x improved
RECURRENT DIPLOID BREEDING
2x improved (1)
3x landrace X 2x improved hybrids
4x hybrid (2) X 2x improved
RECURRENT POLYPLOID BREEDING
3x hybrid (3)
Figure 4.1: IITA’s Musa breeding scheme. Evaluation steps of newly developed hybrids The newly developed hybrids have to go through a number of evaluation tests, both on-station and on-farm, before being released. An early ploidy screening method has been established using flow cytometry. This allows for the elimination of aneuploid and hyperploid (> 4x) plants at a young age and saves the breeding program the labour and space that was previously required to grow these unproductive plants in the field for more than a year (Pillay et al., 2000; Pillay et al., 2001).
Table 4.1 shows the different evaluation steps of IITA’s Musa breeding materials in sub-Saharan Africa (Vuylsteke, 2001). Newly developed hybrids undergo on-station and on-farm multi-locational germplasm evaluation:
CHAPTER 4 50
1. Selection at the breeding station.
Early evaluation trials (EET) and preliminary yield trials (PYT) are conducted at the IITA research stations (Namulonge in Uganda for East African highland bananas; Onne in Nigeria for plantains). Selection criteria for hybrid progenies are black Sigatoka resistance, high yield, pendulous bunch and large fruit. The best performing hybrids selected in the early evaluation trials are subsequently screened for nematode resistance.
2. Multi-locational evaluation.
Multi-locational evaluation trials (MET) are set up to evaluate the stability of yield and disease and pest resistance in hybrids and assess genotype x environment interactions for specific traits across agro-ecologies. Additional selection criteria relate to local consumer preferences.
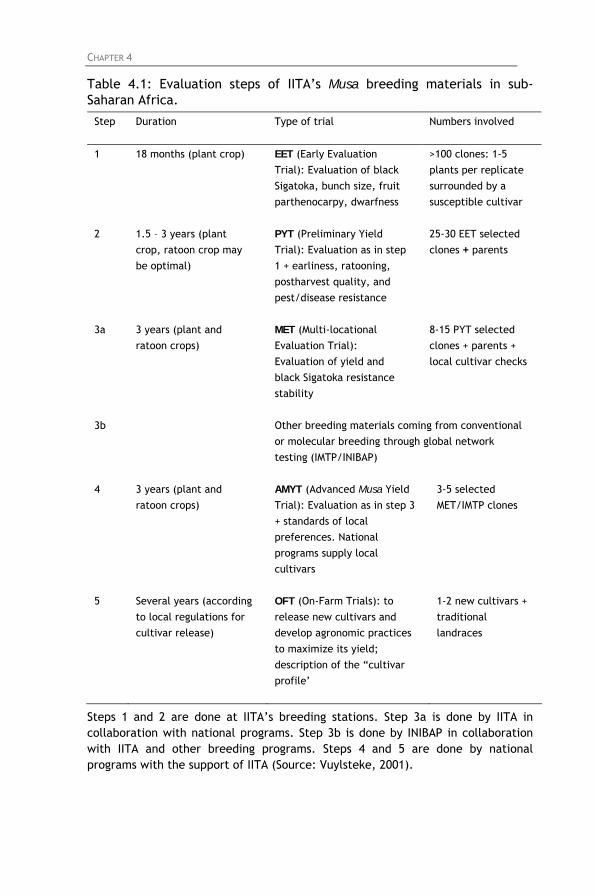
CHAPTER 4 51
Table 4.1: Evaluation steps of IITA’s Musa breeding materials in sub-Saharan Africa.
Step Duration Type of trial Numbers involved
1 18 months (plant crop) EET (Early Evaluation Trial): Evaluation of black Sigatoka, bunch size, fruit parthenocarpy, dwarfness
>100 clones: 1-5 plants per replicate surrounded by a susceptible cultivar
2 1.5 – 3 years (plant crop, ratoon crop may be optimal)
PYT (Preliminary Yield Trial): Evaluation as in step 1 + earliness, ratooning, postharvest quality, and pest/disease resistance
25-30 EET selected clones + parents
3a 3 years (plant and ratoon crops)
MET (Multi-locational Evaluation Trial): Evaluation of yield and black Sigatoka resistance stability
8-15 PYT selected clones + parents + local cultivar checks
3b Other breeding materials coming from conventional or molecular breeding through global network testing (IMTP/INIBAP)
4 3 years (plant and ratoon crops)
AMYT (Advanced Musa Yield Trial): Evaluation as in step 3 + standards of local preferences. National programs supply local cultivars
3-5 selected MET/IMTP clones
5 Several years (according to local regulations for cultivar release)
OFT (On-Farm Trials): to release new cultivars and develop agronomic practices to maximize its yield; description of the “cultivar profile’
1-2 new cultivars + traditional landraces
Steps 1 and 2 are done at IITA’s breeding stations. Step 3a is done by IITA in collaboration with national programs. Step 3b is done by INIBAP in collaboration with IITA and other breeding programs. Steps 4 and 5 are done by national programs with the support of IITA (Source: Vuylsteke, 2001).
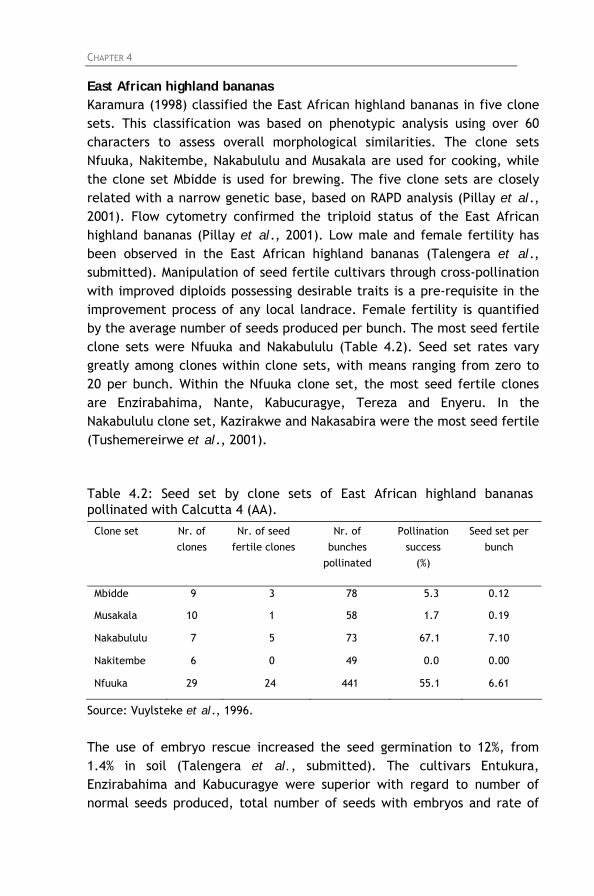
CHAPTER 4 52
East African highland bananas Karamura (1998) classified the East African highland bananas in five clone sets. This classification was based on phenotypic analysis using over 60 characters to assess overall morphological similarities. The clone sets Nfuuka, Nakitembe, Nakabululu and Musakala are used for cooking, while the clone set Mbidde is used for brewing. The five clone sets are closely related with a narrow genetic base, based on RAPD analysis (Pillay et al., 2001). Flow cytometry confirmed the triploid status of the East African highland bananas (Pillay et al., 2001). Low male and female fertility has been observed in the East African highland bananas (Talengera et al., submitted). Manipulation of seed fertile cultivars through cross-pollination with improved diploids possessing desirable traits is a pre-requisite in the improvement process of any local landrace. Female fertility is quantified by the average number of seeds produced per bunch. The most seed fertile clone sets were Nfuuka and Nakabululu (Table 4.2). Seed set rates vary greatly among clones within clone sets, with means ranging from zero to 20 per bunch. Within the Nfuuka clone set, the most seed fertile clones are Enzirabahima, Nante, Kabucuragye, Tereza and Enyeru. In the Nakabululu clone set, Kazirakwe and Nakasabira were the most seed fertile (Tushemereirwe et al., 2001). Table 4.2: Seed set by clone sets of East African highland bananas pollinated with Calcutta 4 (AA).
Clone set Nr. of clones
Nr. of seed fertile clones
Nr. of bunches
pollinated
Pollination success
(%)
Seed set per bunch
Mbidde 9 3 78 5.3 0.12
Musakala 10 1 58 1.7 0.19
Nakabululu 7 5 73 67.1 7.10
Nakitembe 6 0 49 0.0 0.00
Nfuuka 29 24 441 55.1 6.61
Source: Vuylsteke et al., 1996.
The use of embryo rescue increased the seed germination to 12%, from 1.4% in soil (Talengera et al., submitted). The cultivars Entukura, Enzirabahima and Kabucuragye were superior with regard to number of normal seeds produced, total number of seeds with embryos and rate of
CHAPTER 4 53
germinated embryos. These cultivars are recommended as female parents in the breeding program for the improvement of East African highland bananas (Talengera et al., submitted). Calcutta 4 (M. acuminata ssp. burmannicoides, a wild diploid species and one of the progenitors of edible bananas with an AA genome), has been used in many breeding programs to transfer resistance to black Sigatoka to cultivated bananas (Swennen and Vuylsteke, 1993; Vuylsteke et al., 1993). It was used as one of the male parents in the breeding program of IITA to improve the East African highland bananas. 4.3. Objectives Within an integrated pest management (IPM) strategy, host plant resistance to nematodes appears to be the most effective way to reduce yield losses caused by nematodes at low cost for the farmer (Speijer and De Waele, 1997; Vuylsteke, 2000). Resistant cultivars have the advantages that nematode reproduction is limited, no toxic residues are left in the environment, no special application techniques or equipment is required (as might be the case for nematicide application or biological control) and that there is no additional cost to the grower over that of growing the non-resistant cultivars (Cook and Evans, 1987; Trudgill, 1991; Boerma and Hussey, 1992). The initial step in the use of host plant resistance is the identification of sources of resistance, which can then be used in the conventional cross-breeding programs to develop resistant hybrids. Related wild species can be useful for contributing genes for resistance to the cultivated gene pool. However, by incorporating genes for nematode resistance, important features such as bunch size, taste, shelf life, etc. can be altered or lost during the breeding process (Pinochet, 1988c). In Musa, world-wide known sources of resistance to R. similis are Pisang Jari Buaya and Yangambi km5 (Wehunt et al., 1978; Pinochet and Rowe, 1978; Sarah et al., 1992; Price, 1994; Viaene et al., 2003). An overview of resistance to R. similis is given in Chapter 1 (section 1.3.4, table 1.3). The objective of the research reported in this chapter was to screen interesting existing Musa germplasm and hybrids developed by the breeding program of IITA for resistance to R. similis. East African highland bananas were screened for resistance to R. similis to confirm earlier field observations. Newly bred East African highland banana hybrids selected for
CHAPTER 4 54
good agronomic traits and black Sigatoka resistance were consequently screened for resistance to R. similis. This included tetraploids, diploids and secondary triploids. Additionally, wild bananas and landraces other than the East African highland bananas were screened to identify additional sources of resistance.
4.4. Screening for resistance to Radopholus similis
The individual root inoculation method was used for screening the existing Musa germplasm and newly developed hybrids for resistance to R. similis. A detailed description of this method is given in Chapter 3. Two experiments using the root system inoculation method (Chapter 2, section 2.4.2) were carried out to confirm data from the individual root inoculation method. Hot water treated sword sucker-derived plants (Chapter 2, section 2.2.1) were used in all experiments as planting material. Nematode inoculum was obtained from cultures maintained on carrot discs (Chapter 2, section 2.3). The R. similis population from Namulonge was used in all experiments. The experiments were carried out in batches, each comprising two reference cultivars (Yangambi km5 and Valery) and six or seven genotypes with unknown host response to R. similis. The mean of the final nematode population was compared with the means of Yangambi km5 (R. similis resistant) and Valery (R. similis susceptible), by the Dunnett test, and genotypes were classified as resistant, partial resistant or susceptible (Chapter 2, section 2.5.2). 4.4.1. Screening of East African highland bananas Representatives of each of the five East African highland banana clone sets were screened for resistance to R. similis (Table 4.3). The cultivars selected are the most commonly grown in Uganda. Calcutta 4 was also included in the screening experiments.
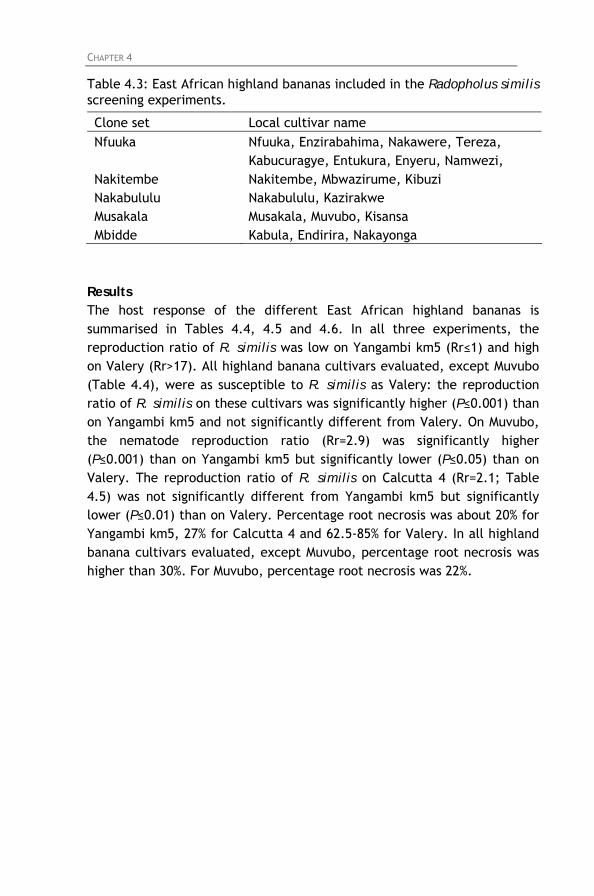
CHAPTER 4 55
Table 4.3: East African highland bananas included in the Radopholus similis screening experiments.
Clone set Local cultivar name Nfuuka Nfuuka, Enzirabahima, Nakawere, Tereza,
Kabucuragye, Entukura, Enyeru, Namwezi, Nakitembe Nakitembe, Mbwazirume, Kibuzi Nakabululu Nakabululu, Kazirakwe Musakala Musakala, Muvubo, Kisansa Mbidde Kabula, Endirira, Nakayonga
Results The host response of the different East African highland bananas is summarised in Tables 4.4, 4.5 and 4.6. In all three experiments, the reproduction ratio of R. similis was low on Yangambi km5 (Rr≤1) and high on Valery (Rr>17). All highland banana cultivars evaluated, except Muvubo (Table 4.4), were as susceptible to R. similis as Valery: the reproduction ratio of R. similis on these cultivars was significantly higher (P≤0.001) than on Yangambi km5 and not significantly different from Valery. On Muvubo, the nematode reproduction ratio (Rr=2.9) was significantly higher (P≤0.001) than on Yangambi km5 but significantly lower (P≤0.05) than on Valery. The reproduction ratio of R. similis on Calcutta 4 (Rr=2.1; Table 4.5) was not significantly different from Yangambi km5 but significantly lower (P≤0.01) than on Valery. Percentage root necrosis was about 20% for Yangambi km5, 27% for Calcutta 4 and 62.5-85% for Valery. In all highland banana cultivars evaluated, except Muvubo, percentage root necrosis was higher than 30%. For Muvubo, percentage root necrosis was 22%.
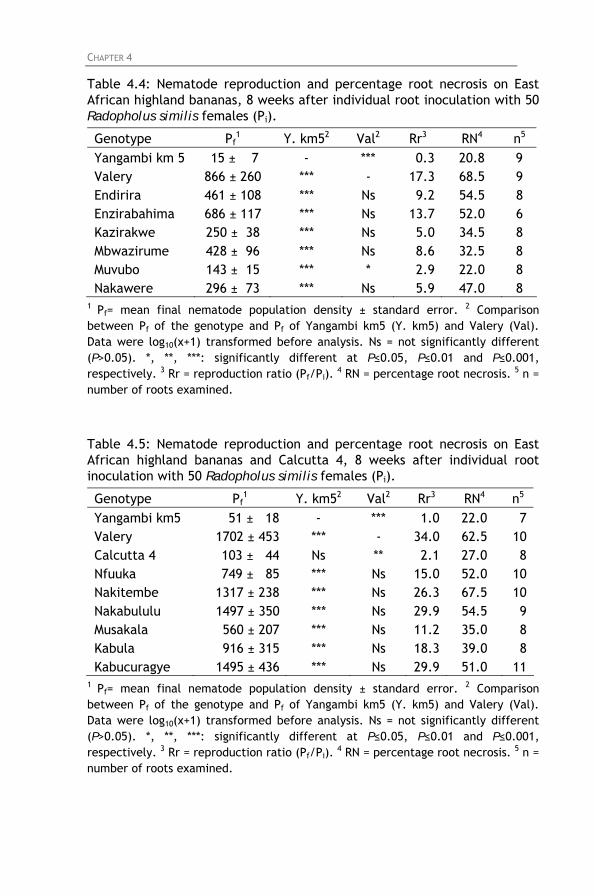
CHAPTER 4 56
Table 4.4: Nematode reproduction and percentage root necrosis on East African highland bananas, 8 weeks after individual root inoculation with 50 Radopholus similis females (Pi).
Genotype Pf1 Y. km52 Val2 Rr3 RN4 n5
Yangambi km 5 15 ± 7 - *** 0.3 20.8 9 Valery 866 ± 260 *** - 17.3 68.5 9 Endirira 461 ± 108 *** Ns 9.2 54.5 8 Enzirabahima 686 ± 117 *** Ns 13.7 52.0 6 Kazirakwe 250 ± 38 *** Ns 5.0 34.5 8 Mbwazirume 428 ± 96 *** Ns 8.6 32.5 8 Muvubo 143 ± 15 *** * 2.9 22.0 8 Nakawere 296 ± 73 *** Ns 5.9 47.0 8
1 Pf= mean final nematode population density ± standard error. 2 Comparison between Pf of the genotype and Pf of Yangambi km5 (Y. km5) and Valery (Val). Data were log10(x+1) transformed before analysis. Ns = not significantly different (P>0.05). *, **, ***: significantly different at P≤0.05, P≤0.01 and P≤0.001, respectively. 3 Rr = reproduction ratio (Pf/Pi).
4 RN = percentage root necrosis. 5 n = number of roots examined.
Table 4.5: Nematode reproduction and percentage root necrosis on East African highland bananas and Calcutta 4, 8 weeks after individual root inoculation with 50 Radopholus similis females (Pi).
Genotype Pf1 Y. km52 Val2 Rr3 RN4 n5
Yangambi km5 51 ± 18 - *** 1.0 22.0 7 Valery 1702 ± 453 *** - 34.0 62.5 10 Calcutta 4 103 ± 44 Ns ** 2.1 27.0 8 Nfuuka 749 ± 85 *** Ns 15.0 52.0 10 Nakitembe 1317 ± 238 *** Ns 26.3 67.5 10 Nakabululu 1497 ± 350 *** Ns 29.9 54.5 9 Musakala 560 ± 207 *** Ns 11.2 35.0 8 Kabula 916 ± 315 *** Ns 18.3 39.0 8 Kabucuragye 1495 ± 436 *** Ns 29.9 51.0 11
1 Pf= mean final nematode population density ± standard error. 2 Comparison between Pf of the genotype and Pf of Yangambi km5 (Y. km5) and Valery (Val). Data were log10(x+1) transformed before analysis. Ns = not significantly different (P>0.05). *, **, ***: significantly different at P≤0.05, P≤0.01 and P≤0.001, respectively. 3 Rr = reproduction ratio (Pf/Pi).
4 RN = percentage root necrosis. 5 n = number of roots examined.
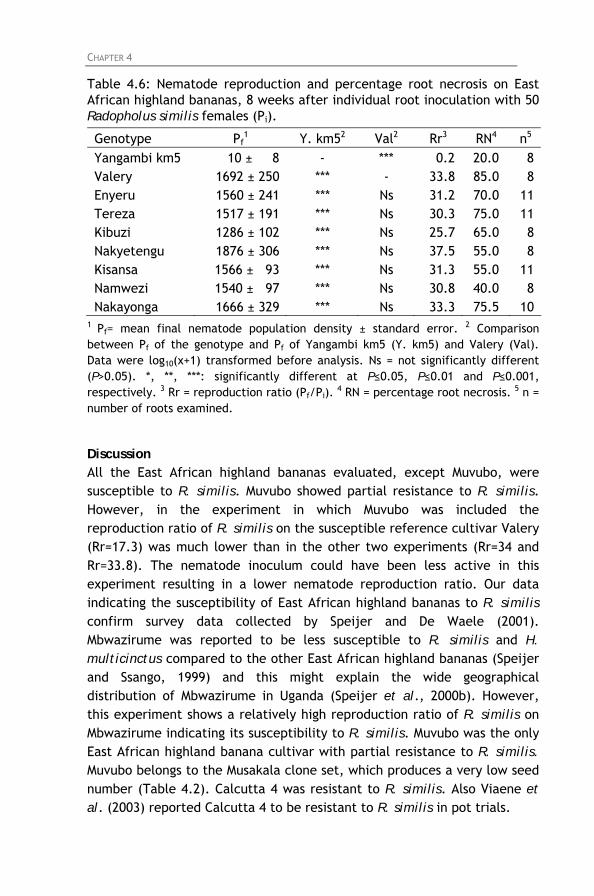
CHAPTER 4 57
Table 4.6: Nematode reproduction and percentage root necrosis on East African highland bananas, 8 weeks after individual root inoculation with 50 Radopholus similis females (Pi).
Genotype Pf1 Y. km52 Val2 Rr3 RN4 n5
Yangambi km5 10 ± 8 - *** 0.2 20.0 8 Valery 1692 ± 250 *** - 33.8 85.0 8 Enyeru 1560 ± 241 *** Ns 31.2 70.0 11 Tereza 1517 ± 191 *** Ns 30.3 75.0 11 Kibuzi 1286 ± 102 *** Ns 25.7 65.0 8 Nakyetengu 1876 ± 306 *** Ns 37.5 55.0 8 Kisansa 1566 ± 93 *** Ns 31.3 55.0 11 Namwezi 1540 ± 97 *** Ns 30.8 40.0 8 Nakayonga 1666 ± 329 *** Ns 33.3 75.5 10
1 Pf= mean final nematode population density ± standard error. 2 Comparison between Pf of the genotype and Pf of Yangambi km5 (Y. km5) and Valery (Val). Data were log10(x+1) transformed before analysis. Ns = not significantly different (P>0.05). *, **, ***: significantly different at P≤0.05, P≤0.01 and P≤0.001, respectively. 3 Rr = reproduction ratio (Pf/Pi).
4 RN = percentage root necrosis. 5 n = number of roots examined.
Discussion All the East African highland bananas evaluated, except Muvubo, were susceptible to R. similis. Muvubo showed partial resistance to R. similis. However, in the experiment in which Muvubo was included the reproduction ratio of R. similis on the susceptible reference cultivar Valery (Rr=17.3) was much lower than in the other two experiments (Rr=34 and Rr=33.8). The nematode inoculum could have been less active in this experiment resulting in a lower nematode reproduction ratio. Our data indicating the susceptibility of East African highland bananas to R. similis confirm survey data collected by Speijer and De Waele (2001). Mbwazirume was reported to be less susceptible to R. similis and H. multicinctus compared to the other East African highland bananas (Speijer and Ssango, 1999) and this might explain the wide geographical distribution of Mbwazirume in Uganda (Speijer et al., 2000b). However, this experiment shows a relatively high reproduction ratio of R. similis on Mbwazirume indicating its susceptibility to R. similis. Muvubo was the only East African highland banana cultivar with partial resistance to R. similis. Muvubo belongs to the Musakala clone set, which produces a very low seed number (Table 4.2). Calcutta 4 was resistant to R. similis. Also Viaene et al. (2003) reported Calcutta 4 to be resistant to R. similis in pot trials.
CHAPTER 4 58
4.4.2. Screening of tetraploid hybrids Most of the tetraploid hybrids screened in this section were derived by crossing East African highland bananas with Calcutta 4. Section 4.4.1 showed that Calcutta 4 is resistant to R. similis. Calcutta 4 is also a source of resistance to black Sigatoka and has widely been used as a male parent in Musa breeding programs (Pillay et al., 2001). Results The host response of the tetraploid hybrids is summarised in Tables 4.7 and 4.8. In both experiments, the reproduction ratio of R. similis was less than 1 on Yangambi km5 and higher than 10 on Valery. The reproduction ratio of R. similis on TMHx 917K-2, TMHx 660K-1, TMHx 4349S-2 and TMHx 1977K-1 was not significantly different from Yangambi km5 but significantly lower (P≤0.001) than on Valery. On these hybrids, the nematode reproduction ratio ranged from 0.8 to 1.7. On TMHx 222K-1 and TMHx 1438K-1, the nematode reproduction ratio (Rr=2.3 and 4.1, respectively) was significantly higher (P≤0.05) than on Yangambi km5 but significantly lower (P≤0.05) than on Valery. The remaining hybrids were as susceptible to R. similis as Valery: the reproduction ratio of R. similis on these hybrids was significantly higher (P≤0.05) than on Yangambi km5 and not significantly different from Valery. Percentage root necrosis was about 4.5-15% for Yangambi km5 and 35-39.5% for Valery. For TMHx 917K-2, TMHx 660K-1, TMHx 4349S-2 and TMHx 1977K-1, the percentage root necrosis ranged from 15 to 23.5%.
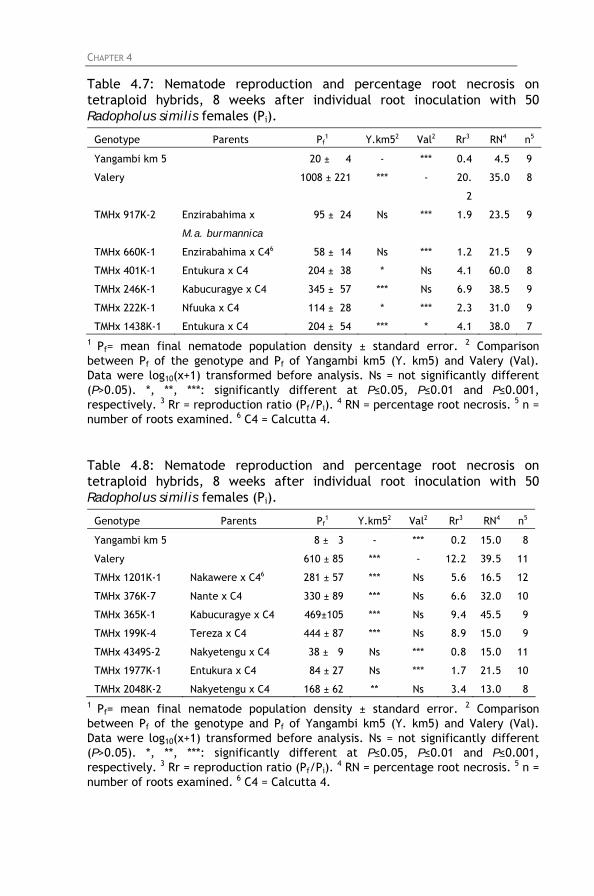
CHAPTER 4 59
Table 4.7: Nematode reproduction and percentage root necrosis on tetraploid hybrids, 8 weeks after individual root inoculation with 50 Radopholus similis females (Pi).
Genotype Parents Pf1 Y.km52 Val2 Rr3 RN4 n5
Yangambi km 5 20 ± 4 - *** 0.4 4.5 9
Valery 1008 ± 221 *** - 20.
2
35.0 8
TMHx 917K-2 Enzirabahima x
M.a. burmannica
95 ± 24 Ns *** 1.9 23.5 9
TMHx 660K-1 Enzirabahima x C46 58 ± 14 Ns *** 1.2 21.5 9
TMHx 401K-1 Entukura x C4 204 ± 38 * Ns 4.1 60.0 8
TMHx 246K-1 Kabucuragye x C4 345 ± 57 *** Ns 6.9 38.5 9
TMHx 222K-1 Nfuuka x C4 114 ± 28 * *** 2.3 31.0 9
TMHx 1438K-1 Entukura x C4 204 ± 54 *** * 4.1 38.0 7 1 Pf= mean final nematode population density ± standard error. 2 Comparison between Pf of the genotype and Pf of Yangambi km5 (Y. km5) and Valery (Val). Data were log10(x+1) transformed before analysis. Ns = not significantly different (P>0.05). *, **, ***: significantly different at P≤0.05, P≤0.01 and P≤0.001, respectively. 3 Rr = reproduction ratio (Pf/Pi).
4 RN = percentage root necrosis. 5 n = number of roots examined. 6 C4 = Calcutta 4. Table 4.8: Nematode reproduction and percentage root necrosis on tetraploid hybrids, 8 weeks after individual root inoculation with 50 Radopholus similis females (Pi).
Genotype Parents Pf1 Y.km52 Val2 Rr3 RN4 n5
Yangambi km 5 8 ± 3 - *** 0.2 15.0 8
Valery 610 ± 85 *** - 12.2 39.5 11
TMHx 1201K-1 Nakawere x C46 281 ± 57 *** Ns 5.6 16.5 12
TMHx 376K-7 Nante x C4 330 ± 89 *** Ns 6.6 32.0 10
TMHx 365K-1 Kabucuragye x C4 469±105 *** Ns 9.4 45.5 9
TMHx 199K-4 Tereza x C4 444 ± 87 *** Ns 8.9 15.0 9
TMHx 4349S-2 Nakyetengu x C4 38 ± 9 Ns *** 0.8 15.0 11
TMHx 1977K-1 Entukura x C4 84 ± 27 Ns *** 1.7 21.5 10
TMHx 2048K-2 Nakyetengu x C4 168 ± 62 ** Ns 3.4 13.0 8 1 Pf= mean final nematode population density ± standard error. 2 Comparison between Pf of the genotype and Pf of Yangambi km5 (Y. km5) and Valery (Val). Data were log10(x+1) transformed before analysis. Ns = not significantly different (P>0.05). *, **, ***: significantly different at P≤0.05, P≤0.01 and P≤0.001, respectively. 3 Rr = reproduction ratio (Pf/Pi).
4 RN = percentage root necrosis. 5 n = number of roots examined. 6 C4 = Calcutta 4.
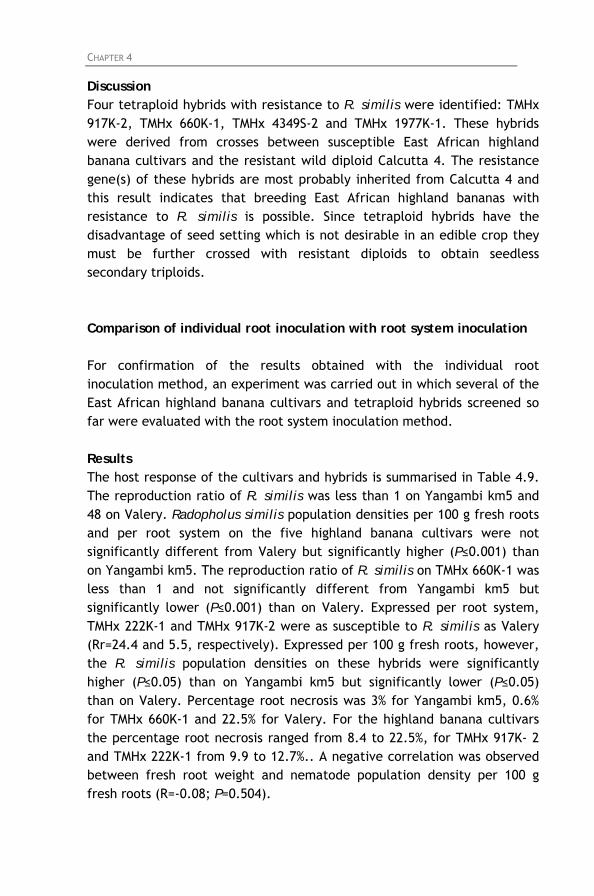
CHAPTER 4 60
Discussion Four tetraploid hybrids with resistance to R. similis were identified: TMHx 917K-2, TMHx 660K-1, TMHx 4349S-2 and TMHx 1977K-1. These hybrids were derived from crosses between susceptible East African highland banana cultivars and the resistant wild diploid Calcutta 4. The resistance gene(s) of these hybrids are most probably inherited from Calcutta 4 and this result indicates that breeding East African highland bananas with resistance to R. similis is possible. Since tetraploid hybrids have the disadvantage of seed setting which is not desirable in an edible crop they must be further crossed with resistant diploids to obtain seedless secondary triploids. Comparison of individual root inoculation with root system inoculation For confirmation of the results obtained with the individual root inoculation method, an experiment was carried out in which several of the East African highland banana cultivars and tetraploid hybrids screened so far were evaluated with the root system inoculation method. Results The host response of the cultivars and hybrids is summarised in Table 4.9. The reproduction ratio of R. similis was less than 1 on Yangambi km5 and 48 on Valery. Radopholus similis population densities per 100 g fresh roots and per root system on the five highland banana cultivars were not significantly different from Valery but significantly higher (P≤0.001) than on Yangambi km5. The reproduction ratio of R. similis on TMHx 660K-1 was less than 1 and not significantly different from Yangambi km5 but significantly lower (P≤0.001) than on Valery. Expressed per root system, TMHx 222K-1 and TMHx 917K-2 were as susceptible to R. similis as Valery (Rr=24.4 and 5.5, respectively). Expressed per 100 g fresh roots, however, the R. similis population densities on these hybrids were significantly higher (P≤0.05) than on Yangambi km5 but significantly lower (P≤0.05) than on Valery. Percentage root necrosis was 3% for Yangambi km5, 0.6% for TMHx 660K-1 and 22.5% for Valery. For the highland banana cultivars the percentage root necrosis ranged from 8.4 to 22.5%, for TMHx 917K- 2 and TMHx 222K-1 from 9.9 to 12.7%.. A negative correlation was observed between fresh root weight and nematode population density per 100 g fresh roots (R=-0.08; P=0.504).
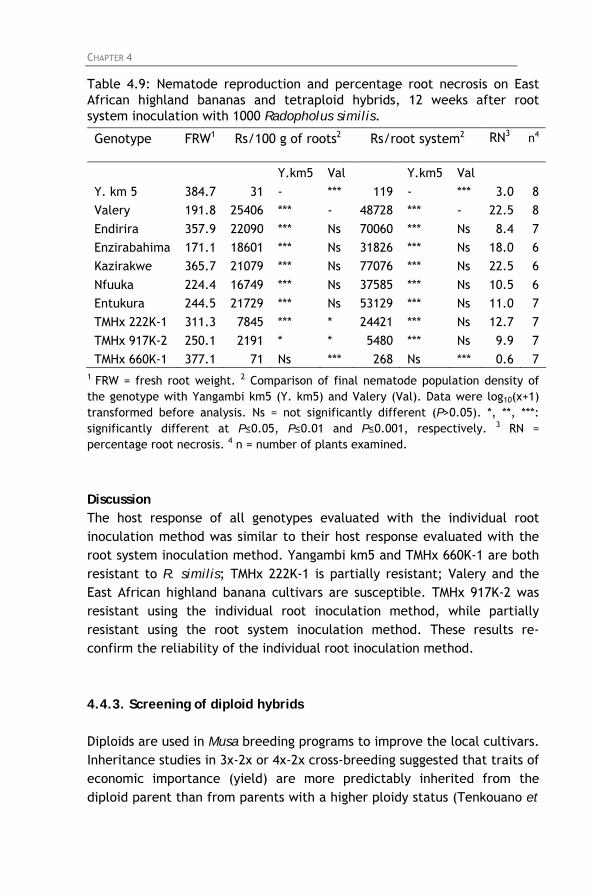
CHAPTER 4 61
Table 4.9: Nematode reproduction and percentage root necrosis on East African highland bananas and tetraploid hybrids, 12 weeks after root system inoculation with 1000 Radopholus similis.
Genotype FRW1 Rs/100 g of roots2 Rs/root system2 RN3 n4
Y.km5 Val Y.km5 Val Y. km 5 384.7 31 - *** 119 - *** 3.0 8 Valery 191.8 25406 *** - 48728 *** - 22.5 8 Endirira 357.9 22090 *** Ns 70060 *** Ns 8.4 7 Enzirabahima 171.1 18601 *** Ns 31826 *** Ns 18.0 6 Kazirakwe 365.7 21079 *** Ns 77076 *** Ns 22.5 6 Nfuuka 224.4 16749 *** Ns 37585 *** Ns 10.5 6 Entukura 244.5 21729 *** Ns 53129 *** Ns 11.0 7 TMHx 222K-1 311.3 7845 *** * 24421 *** Ns 12.7 7 TMHx 917K-2 250.1 2191 * * 5480 *** Ns 9.9 7 TMHx 660K-1 377.1 71 Ns *** 268 Ns *** 0.6 7
1 FRW = fresh root weight. 2 Comparison of final nematode population density of the genotype with Yangambi km5 (Y. km5) and Valery (Val). Data were log10(x+1) transformed before analysis. Ns = not significantly different (P>0.05). *, **, ***: significantly different at P≤0.05, P≤0.01 and P≤0.001, respectively. 3 RN = percentage root necrosis. 4 n = number of plants examined.
Discussion The host response of all genotypes evaluated with the individual root inoculation method was similar to their host response evaluated with the root system inoculation method. Yangambi km5 and TMHx 660K-1 are both resistant to R. similis; TMHx 222K-1 is partially resistant; Valery and the East African highland banana cultivars are susceptible. TMHx 917K-2 was resistant using the individual root inoculation method, while partially resistant using the root system inoculation method. These results re-confirm the reliability of the individual root inoculation method. 4.4.3. Screening of diploid hybrids Diploids are used in Musa breeding programs to improve the local cultivars. Inheritance studies in 3x-2x or 4x-2x cross-breeding suggested that traits of economic importance (yield) are more predictably inherited from the diploid parent than from parents with a higher ploidy status (Tenkouano et
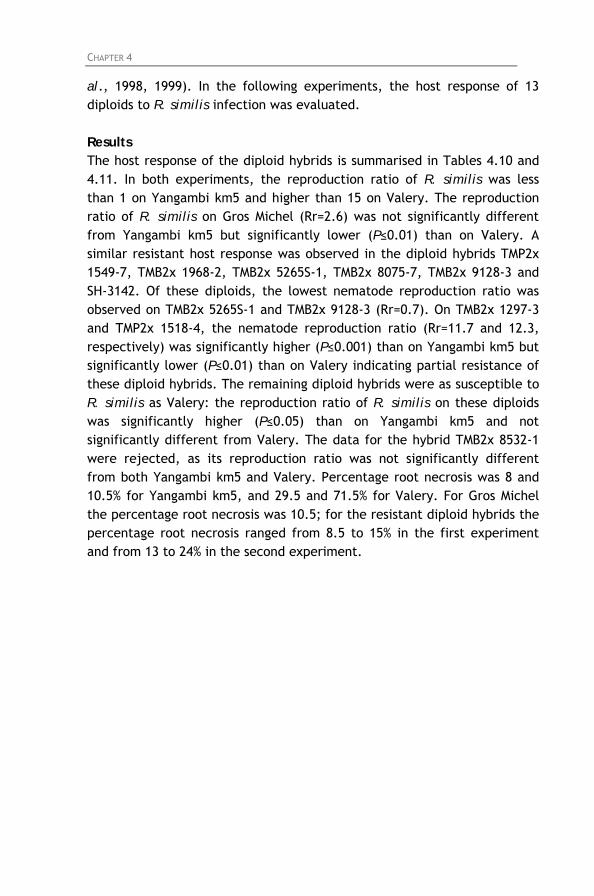
CHAPTER 4 62
al., 1998, 1999). In the following experiments, the host response of 13 diploids to R. similis infection was evaluated. Results The host response of the diploid hybrids is summarised in Tables 4.10 and 4.11. In both experiments, the reproduction ratio of R. similis was less than 1 on Yangambi km5 and higher than 15 on Valery. The reproduction ratio of R. similis on Gros Michel (Rr=2.6) was not significantly different from Yangambi km5 but significantly lower (P≤0.01) than on Valery. A similar resistant host response was observed in the diploid hybrids TMP2x 1549-7, TMB2x 1968-2, TMB2x 5265S-1, TMB2x 8075-7, TMB2x 9128-3 and SH-3142. Of these diploids, the lowest nematode reproduction ratio was observed on TMB2x 5265S-1 and TMB2x 9128-3 (Rr=0.7). On TMB2x 1297-3 and TMP2x 1518-4, the nematode reproduction ratio (Rr=11.7 and 12.3, respectively) was significantly higher (P≤0.001) than on Yangambi km5 but significantly lower (P≤0.01) than on Valery indicating partial resistance of these diploid hybrids. The remaining diploid hybrids were as susceptible to R. similis as Valery: the reproduction ratio of R. similis on these diploids was significantly higher (P≤0.05) than on Yangambi km5 and not significantly different from Valery. The data for the hybrid TMB2x 8532-1 were rejected, as its reproduction ratio was not significantly different from both Yangambi km5 and Valery. Percentage root necrosis was 8 and 10.5% for Yangambi km5, and 29.5 and 71.5% for Valery. For Gros Michel the percentage root necrosis was 10.5; for the resistant diploid hybrids the percentage root necrosis ranged from 8.5 to 15% in the first experiment and from 13 to 24% in the second experiment.
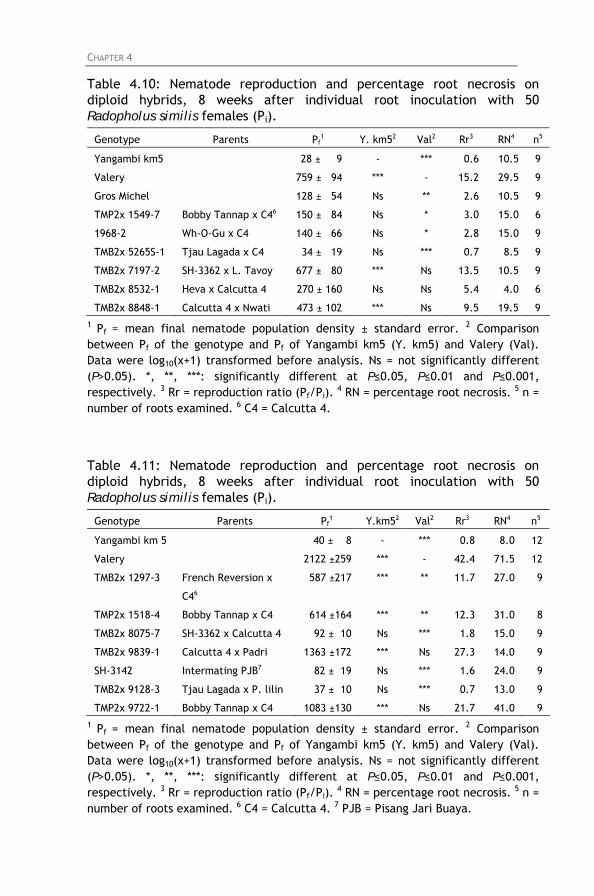
CHAPTER 4 63
Table 4.10: Nematode reproduction and percentage root necrosis on diploid hybrids, 8 weeks after individual root inoculation with 50 Radopholus similis females (Pi).
Genotype Parents Pf1 Y. km52 Val2 Rr3 RN4 n5
Yangambi km5 28 ± 9 - *** 0.6 10.5 9
Valery 759 ± 94 *** - 15.2 29.5 9
Gros Michel 128 ± 54 Ns ** 2.6 10.5 9
TMP2x 1549-7 Bobby Tannap x C46 150 ± 84 Ns * 3.0 15.0 6
1968-2 Wh-O-Gu x C4 140 ± 66 Ns * 2.8 15.0 9
TMB2x 5265S-1 Tjau Lagada x C4 34 ± 19 Ns *** 0.7 8.5 9
TMB2x 7197-2 SH-3362 x L. Tavoy 677 ± 80 *** Ns 13.5 10.5 9
TMB2x 8532-1 Heva x Calcutta 4 270 ± 160 Ns Ns 5.4 4.0 6
TMB2x 8848-1 Calcutta 4 x Nwati 473 ± 102 *** Ns 9.5 19.5 9 1 Pf = mean final nematode population density ± standard error. 2 Comparison between Pf of the genotype and Pf of Yangambi km5 (Y. km5) and Valery (Val). Data were log10(x+1) transformed before analysis. Ns = not significantly different (P>0.05). *, **, ***: significantly different at P≤0.05, P≤0.01 and P≤0.001, respectively. 3 Rr = reproduction ratio (Pf/Pi).
4 RN = percentage root necrosis. 5 n = number of roots examined. 6 C4 = Calcutta 4. Table 4.11: Nematode reproduction and percentage root necrosis on diploid hybrids, 8 weeks after individual root inoculation with 50 Radopholus similis females (Pi).
Genotype Parents Pf1 Y.km52 Val2 Rr3 RN4 n5
Yangambi km 5 40 ± 8 - *** 0.8 8.0 12
Valery 2122 ±259 *** - 42.4 71.5 12
TMB2x 1297-3 French Reversion x
C46
587 ±217 *** ** 11.7 27.0 9
TMP2x 1518-4 Bobby Tannap x C4 614 ±164 *** ** 12.3 31.0 8
TMB2x 8075-7 SH-3362 x Calcutta 4 92 ± 10 Ns *** 1.8 15.0 9
TMB2x 9839-1 Calcutta 4 x Padri 1363 ±172 *** Ns 27.3 14.0 9
SH-3142 Intermating PJB7 82 ± 19 Ns *** 1.6 24.0 9
TMB2x 9128-3 Tjau Lagada x P. lilin 37 ± 10 Ns *** 0.7 13.0 9
TMP2x 9722-1 Bobby Tannap x C4 1083 ±130 *** Ns 21.7 41.0 9 1 Pf = mean final nematode population density ± standard error. 2 Comparison between Pf of the genotype and Pf of Yangambi km5 (Y. km5) and Valery (Val). Data were log10(x+1) transformed before analysis. Ns = not significantly different (P>0.05). *, **, ***: significantly different at P≤0.05, P≤0.01 and P≤0.001, respectively. 3 Rr = reproduction ratio (Pf/Pi).
4 RN = percentage root necrosis. 5 n = number of roots examined. 6 C4 = Calcutta 4. 7 PJB = Pisang Jari Buaya.
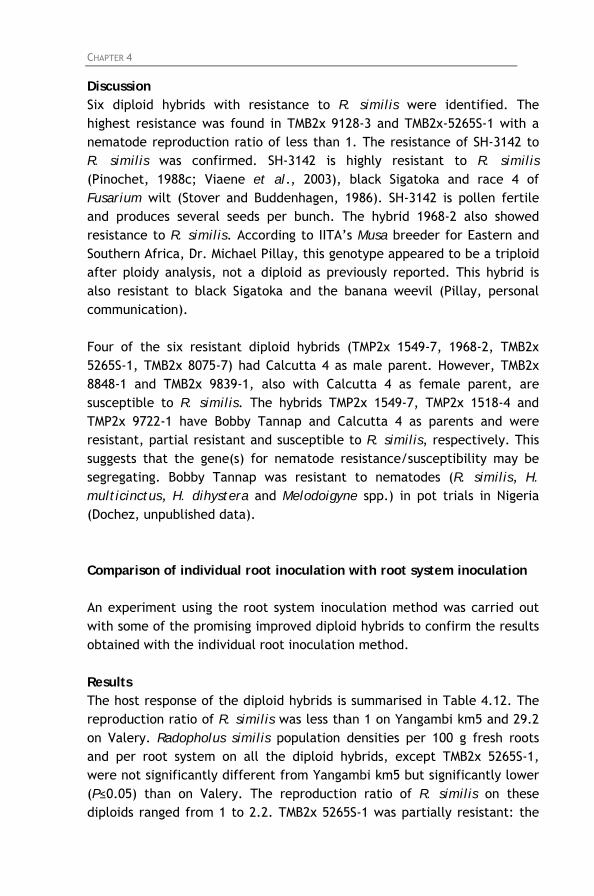
CHAPTER 4 64
Discussion Six diploid hybrids with resistance to R. similis were identified. The highest resistance was found in TMB2x 9128-3 and TMB2x-5265S-1 with a nematode reproduction ratio of less than 1. The resistance of SH-3142 to R. similis was confirmed. SH-3142 is highly resistant to R. similis (Pinochet, 1988c; Viaene et al., 2003), black Sigatoka and race 4 of Fusarium wilt (Stover and Buddenhagen, 1986). SH-3142 is pollen fertile and produces several seeds per bunch. The hybrid 1968-2 also showed resistance to R. similis. According to IITA’s Musa breeder for Eastern and Southern Africa, Dr. Michael Pillay, this genotype appeared to be a triploid after ploidy analysis, not a diploid as previously reported. This hybrid is also resistant to black Sigatoka and the banana weevil (Pillay, personal communication). Four of the six resistant diploid hybrids (TMP2x 1549-7, 1968-2, TMB2x 5265S-1, TMB2x 8075-7) had Calcutta 4 as male parent. However, TMB2x 8848-1 and TMB2x 9839-1, also with Calcutta 4 as female parent, are susceptible to R. similis. The hybrids TMP2x 1549-7, TMP2x 1518-4 and TMP2x 9722-1 have Bobby Tannap and Calcutta 4 as parents and were resistant, partial resistant and susceptible to R. similis, respectively. This suggests that the gene(s) for nematode resistance/susceptibility may be segregating. Bobby Tannap was resistant to nematodes (R. similis, H. multicinctus, H. dihystera and Melodoigyne spp.) in pot trials in Nigeria (Dochez, unpublished data). Comparison of individual root inoculation with root system inoculation An experiment using the root system inoculation method was carried out with some of the promising improved diploid hybrids to confirm the results obtained with the individual root inoculation method. Results The host response of the diploid hybrids is summarised in Table 4.12. The reproduction ratio of R. similis was less than 1 on Yangambi km5 and 29.2 on Valery. Radopholus similis population densities per 100 g fresh roots and per root system on all the diploid hybrids, except TMB2x 5265S-1, were not significantly different from Yangambi km5 but significantly lower (P≤0.05) than on Valery. The reproduction ratio of R. similis on these diploids ranged from 1 to 2.2. TMB2x 5265S-1 was partially resistant: the
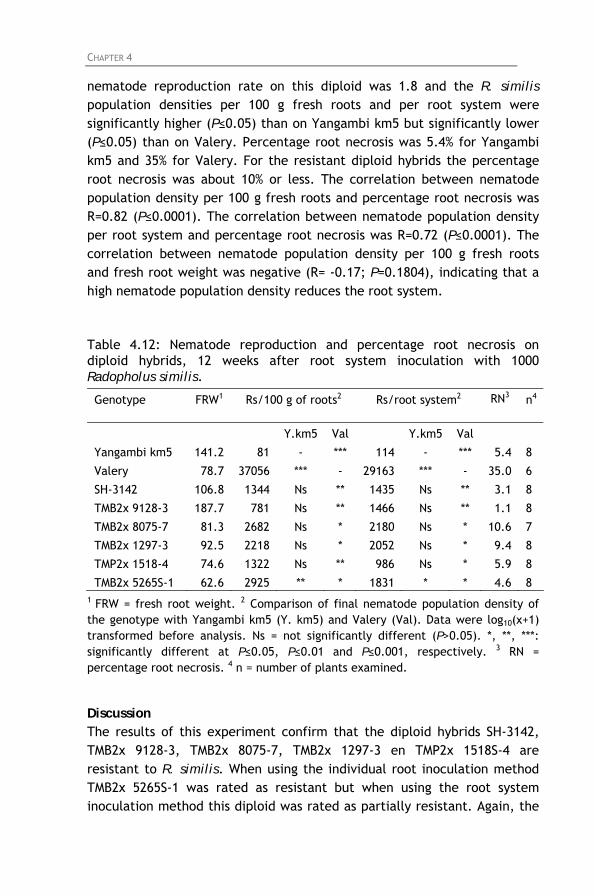
CHAPTER 4 65
nematode reproduction rate on this diploid was 1.8 and the R. similis population densities per 100 g fresh roots and per root system were significantly higher (P≤0.05) than on Yangambi km5 but significantly lower (P≤0.05) than on Valery. Percentage root necrosis was 5.4% for Yangambi km5 and 35% for Valery. For the resistant diploid hybrids the percentage root necrosis was about 10% or less. The correlation between nematode population density per 100 g fresh roots and percentage root necrosis was R=0.82 (P≤0.0001). The correlation between nematode population density per root system and percentage root necrosis was R=0.72 (P≤0.0001). The correlation between nematode population density per 100 g fresh roots and fresh root weight was negative (R= -0.17; P=0.1804), indicating that a high nematode population density reduces the root system. Table 4.12: Nematode reproduction and percentage root necrosis on diploid hybrids, 12 weeks after root system inoculation with 1000 Radopholus similis.
Genotype FRW1 Rs/100 g of roots2 Rs/root system2 RN3 n4
Y.km5 Val Y.km5 Val
Yangambi km5 141.2 81 - *** 114 - *** 5.4 8
Valery 78.7 37056 *** - 29163 *** - 35.0 6
SH-3142 106.8 1344 Ns ** 1435 Ns ** 3.1 8
TMB2x 9128-3 187.7 781 Ns ** 1466 Ns ** 1.1 8
TMB2x 8075-7 81.3 2682 Ns * 2180 Ns * 10.6 7
TMB2x 1297-3 92.5 2218 Ns * 2052 Ns * 9.4 8
TMP2x 1518-4 74.6 1322 Ns ** 986 Ns * 5.9 8
TMB2x 5265S-1 62.6 2925 ** * 1831 * * 4.6 8 1 FRW = fresh root weight. 2 Comparison of final nematode population density of the genotype with Yangambi km5 (Y. km5) and Valery (Val). Data were log10(x+1) transformed before analysis. Ns = not significantly different (P>0.05). *, **, ***: significantly different at P≤0.05, P≤0.01 and P≤0.001, respectively. 3 RN = percentage root necrosis. 4 n = number of plants examined.
Discussion The results of this experiment confirm that the diploid hybrids SH-3142, TMB2x 9128-3, TMB2x 8075-7, TMB2x 1297-3 en TMP2x 1518S-4 are resistant to R. similis. When using the individual root inoculation method TMB2x 5265S-1 was rated as resistant but when using the root system inoculation method this diploid was rated as partially resistant. Again, the
CHAPTER 4 66
host response of all genotypes evaluated with the individual root inoculation method was similar to their host response evaluated with the root system inoculation method thus re-confirming the reliability of the individual root inoculation method. Screening of TMB2x 9128-3 derived hybrids TMB2x 9128-3 is one of the most resistant diploid hybrids identified so far. The host response to R. similis infection of diploid crosses with TMB2x 9128-3 as a parent was evaluated. Crosses of TMB2x 9128-3 were made with the resistant diploid TMB2x 8075-7 (Table 4.10), the susceptible diploids TMB2x 7197-2 (Table 4.10) and TMB2x 9722-1 (Table 4.11) and with the partially resistant diploid TMB2x 9719-7 (Chapter 3, Table 3.1). Crossing improved diploids with improved diploids is called recurrent diploid breeding (Figure 4.1). Diploid hybrids were obtained from these crosses. Results The host response of the diploid hybrids is summarised in table 4.13. The reproduction ratio of R. similis was less than 1 on Yangambi km5 and 21.5 on Valery. The reproduction ratio of R. similis on TMB2x 9128-3 (Rr=0.2) was not significantly different from Yangambi km5 but significantly lower (P≤0.001) than on Valery. A similar resistant host response was observed in all the crosses with TMB2x 9128-3 as a parent. The nematode reproduction ratio of these crosses ranged from less than 1 to 4.4. With reproduction ratios of 0.04 and 0.06 TMB2x 2582S-1 and TMB2x 3107S-4, respectively, were almost immune to R. similis. Percentage root necrosis was 10.5% for Yangambi km5 and 45.5% for Valery. For TMB2x 2582S-1 and TMB2x 3107S-4 the percentage root necrosis was 5 and 8%, respectively, and 11% for TMB2x 9128-3. For the other resistant crosses the percentage root necrosis ranged from 13 to 27.5%.
CHAPTER 4 67
Table 4.13: Nematode reproduction and percentage root necrosis on diploid hybrids, 8 weeks after individual root inoculation with 50 Radopholus similis females (Pi).
Genotype Parents Pf1 Y.km52 Val2 Rr3 RN4 n5
Yangambi km5 13 ± 5 - *** 0.3 10.5 8
Valery 1074 ± 232 *** - 21.5 42.5 8
TMB2x 9128-3 Tjau Lagada x
Pisang Lilin
10 ± 6 Ns *** 0.2 11.0 12
TMB2x 3107S-4 TMB2x 8075-7 x
TMB2x 9128-3
3 ± 1 Ns *** 0.06 8.0 8
TMB2x 2582S-1 TMB2x 8075-7 x
TMB2x 9128-3
2 ± 1 Ns *** 0.04 5.0 8
TMB2x 2537S-1 TMB2x 9722-1 x
TMB2x 9128-3
186 ± 68 Ns *** 3.7 16.5 12
TMB2x 4443S-1 TMB2x 9128-3 x
TMB2x 9719-7
90 ± 25 Ns * 1.8 13.0 7
TMB2x 2569S-1 TMB2x 7197-2 x
TMB2x 9128-3
107 ± 46 Ns *** 2.1 27.5 12
TMB2x 2569S-2 TMB2x 7197-2 x
TMB2x 9128-3
219 ± 31 Ns ** 4.4 22.0 7
1 Pf= mean final nematode population density ± standard error. 2 Comparison between Pf of the genotype and Pf of Yangambi km5 (Y. km5) and Valery (Val). Data were log10(x+1) transformed before analysis. Ns = not significantly different (P>0.05). *, **, ***: significantly different at P≤0.05, P≤0.01 and P≤0.001, respectively. 3 Rr = reproduction ratio (Pf/Pi).
4 RN = percentage root necrosis. 5 n = number of roots examined. Discussion TMB2x 9182-3 was also in this experiment resistant to R. similis. Also the six hybrids with TMB2x 9128-3 as a parent evaluated were resistant to R. similis. TMB2x 9128-3 has been examined in Nigeria for nematode resistance using the root system inoculation method and showed resistance to R. similis, H. multicinctus, H. dihystera and Meloidogyne spp. (Dochez, unpublished data). Tjau Lagada, the female parent of TMB2x 9182-3, and Pisang Lilin, the male parent of TMB2x 9128-3, were both resistant to R. similis, H. multicinctus, H. dihystera and Meloidogyne spp. in pot trials in Nigeria (Dochez, unpublished data). TMB2x 9182-3 also expressed resistance to black Sigatoka (Tenkouano et al., 2003). TMB2x 9128-3 has recently been released as a hybrid with good combining ability, resistance to black Sigatoka and R. similis (Tenkouano et al., 2003).
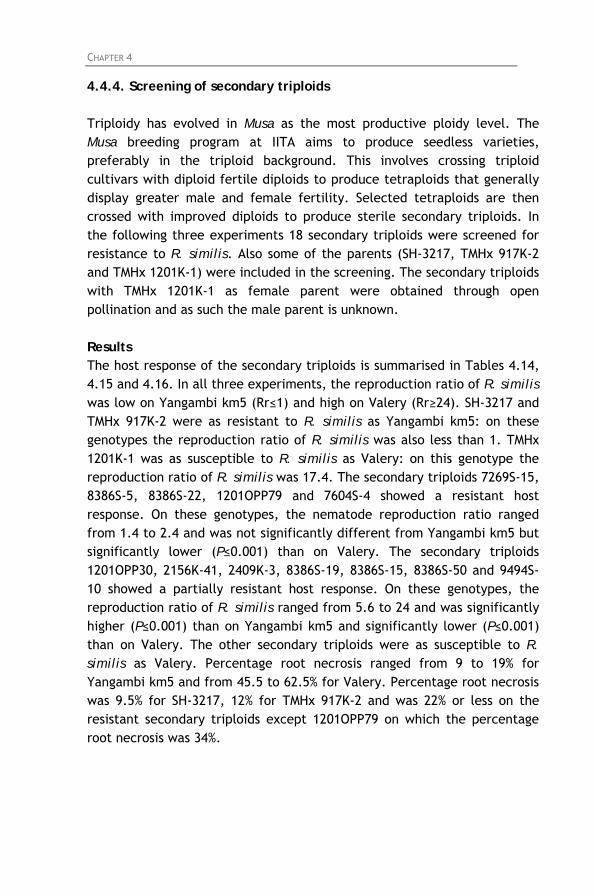
CHAPTER 4 68
4.4.4. Screening of secondary triploids Triploidy has evolved in Musa as the most productive ploidy level. The Musa breeding program at IITA aims to produce seedless varieties, preferably in the triploid background. This involves crossing triploid cultivars with diploid fertile diploids to produce tetraploids that generally display greater male and female fertility. Selected tetraploids are then crossed with improved diploids to produce sterile secondary triploids. In the following three experiments 18 secondary triploids were screened for resistance to R. similis. Also some of the parents (SH-3217, TMHx 917K-2 and TMHx 1201K-1) were included in the screening. The secondary triploids with TMHx 1201K-1 as female parent were obtained through open pollination and as such the male parent is unknown. Results The host response of the secondary triploids is summarised in Tables 4.14, 4.15 and 4.16. In all three experiments, the reproduction ratio of R. similis was low on Yangambi km5 (Rr≤1) and high on Valery (Rr≥24). SH-3217 and TMHx 917K-2 were as resistant to R. similis as Yangambi km5: on these genotypes the reproduction ratio of R. similis was also less than 1. TMHx 1201K-1 was as susceptible to R. similis as Valery: on this genotype the reproduction ratio of R. similis was 17.4. The secondary triploids 7269S-15, 8386S-5, 8386S-22, 1201OPP79 and 7604S-4 showed a resistant host response. On these genotypes, the nematode reproduction ratio ranged from 1.4 to 2.4 and was not significantly different from Yangambi km5 but significantly lower (P≤0.001) than on Valery. The secondary triploids 1201OPP30, 2156K-41, 2409K-3, 8386S-19, 8386S-15, 8386S-50 and 9494S-10 showed a partially resistant host response. On these genotypes, the reproduction ratio of R. similis ranged from 5.6 to 24 and was significantly higher (P≤0.001) than on Yangambi km5 and significantly lower (P≤0.001) than on Valery. The other secondary triploids were as susceptible to R. similis as Valery. Percentage root necrosis ranged from 9 to 19% for Yangambi km5 and from 45.5 to 62.5% for Valery. Percentage root necrosis was 9.5% for SH-3217, 12% for TMHx 917K-2 and was 22% or less on the resistant secondary triploids except 1201OPP79 on which the percentage root necrosis was 34%.
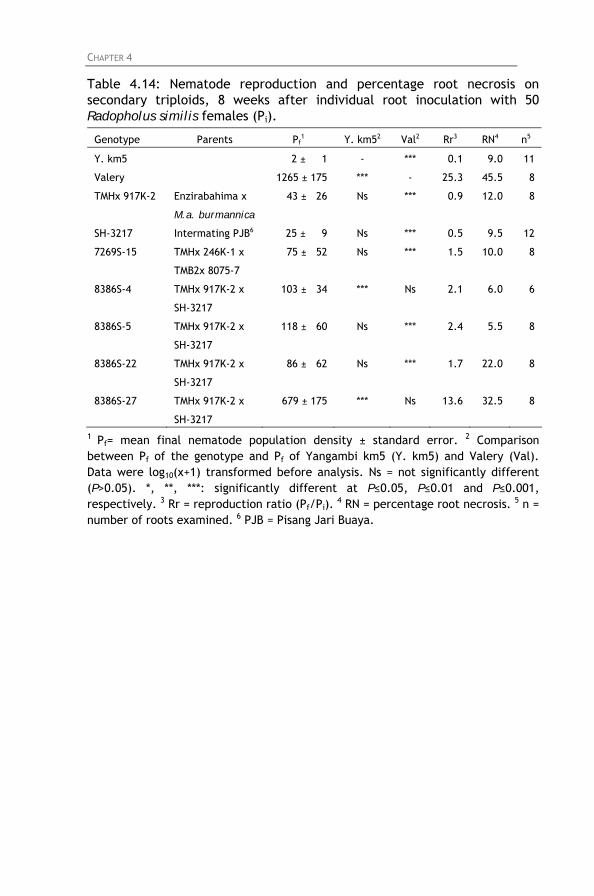
CHAPTER 4 69
Table 4.14: Nematode reproduction and percentage root necrosis on secondary triploids, 8 weeks after individual root inoculation with 50 Radopholus similis females (Pi).
Genotype Parents Pf1 Y. km52 Val2 Rr3 RN4 n5
Y. km5 2 ± 1 - *** 0.1 9.0 11
Valery 1265 ± 175 *** - 25.3 45.5 8
TMHx 917K-2 Enzirabahima x
M.a. burmannica
43 ± 26 Ns *** 0.9 12.0 8
SH-3217 Intermating PJB6 25 ± 9 Ns *** 0.5 9.5 12
7269S-15 TMHx 246K-1 x
TMB2x 8075-7
75 ± 52 Ns *** 1.5 10.0 8
8386S-4 TMHx 917K-2 x
SH-3217
103 ± 34 *** Ns 2.1 6.0 6
8386S-5 TMHx 917K-2 x
SH-3217
118 ± 60 Ns *** 2.4 5.5 8
8386S-22 TMHx 917K-2 x
SH-3217
86 ± 62 Ns *** 1.7 22.0 8
8386S-27 TMHx 917K-2 x
SH-3217
679 ± 175 *** Ns 13.6 32.5 8
1 Pf= mean final nematode population density ± standard error. 2 Comparison between Pf of the genotype and Pf of Yangambi km5 (Y. km5) and Valery (Val). Data were log10(x+1) transformed before analysis. Ns = not significantly different (P>0.05). *, **, ***: significantly different at P≤0.05, P≤0.01 and P≤0.001, respectively. 3 Rr = reproduction ratio (Pf/Pi).
4 RN = percentage root necrosis. 5 n = number of roots examined. 6 PJB = Pisang Jari Buaya.
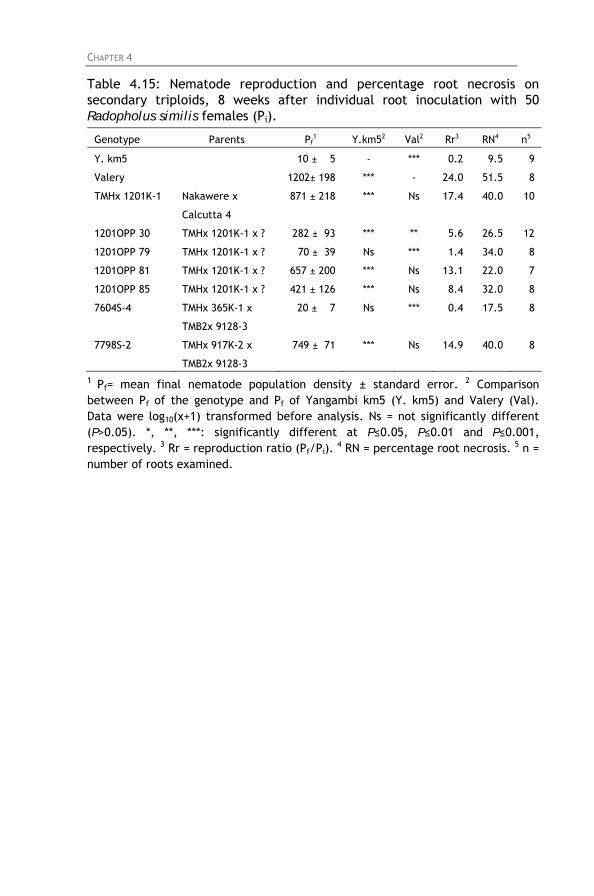
CHAPTER 4 70
Table 4.15: Nematode reproduction and percentage root necrosis on secondary triploids, 8 weeks after individual root inoculation with 50 Radopholus similis females (Pi).
Genotype Parents Pf1 Y.km52 Val2 Rr3 RN4 n5
Y. km5 10 ± 5 - *** 0.2 9.5 9
Valery 1202± 198 *** - 24.0 51.5 8
TMHx 1201K-1 Nakawere x
Calcutta 4
871 ± 218 *** Ns 17.4 40.0 10
1201OPP 30 TMHx 1201K-1 x ? 282 ± 93 *** ** 5.6 26.5 12
1201OPP 79 TMHx 1201K-1 x ? 70 ± 39 Ns *** 1.4 34.0 8
1201OPP 81 TMHx 1201K-1 x ? 657 ± 200 *** Ns 13.1 22.0 7
1201OPP 85 TMHx 1201K-1 x ? 421 ± 126 *** Ns 8.4 32.0 8
7604S-4 TMHx 365K-1 x
TMB2x 9128-3
20 ± 7 Ns *** 0.4 17.5 8
7798S-2 TMHx 917K-2 x
TMB2x 9128-3
749 ± 71 *** Ns 14.9 40.0 8
1 Pf= mean final nematode population density ± standard error. 2 Comparison between Pf of the genotype and Pf of Yangambi km5 (Y. km5) and Valery (Val). Data were log10(x+1) transformed before analysis. Ns = not significantly different (P>0.05). *, **, ***: significantly different at P≤0.05, P≤0.01 and P≤0.001, respectively. 3 Rr = reproduction ratio (Pf/Pi).
4 RN = percentage root necrosis. 5 n = number of roots examined.
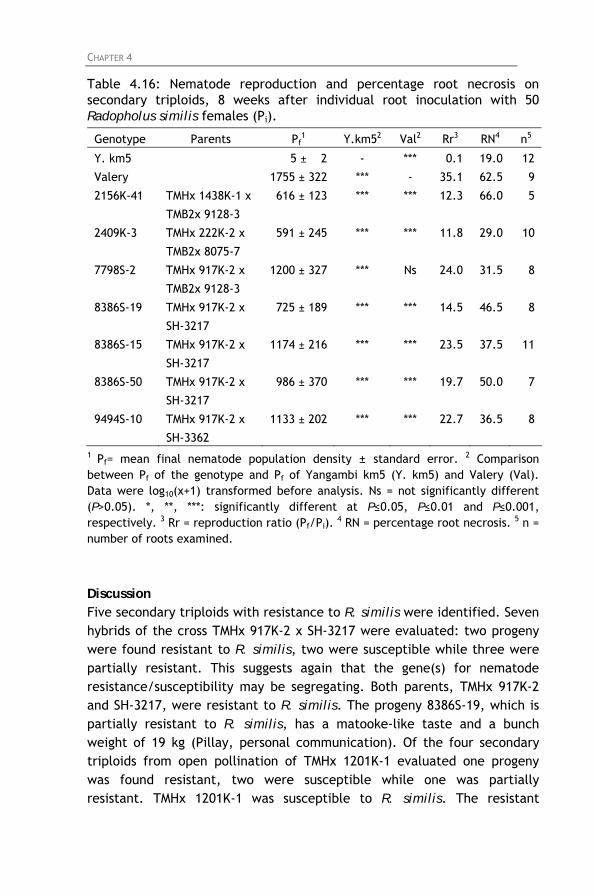
CHAPTER 4 71
Table 4.16: Nematode reproduction and percentage root necrosis on secondary triploids, 8 weeks after individual root inoculation with 50 Radopholus similis females (Pi).
Genotype Parents Pf1 Y.km52 Val2 Rr3 RN4 n5
Y. km5 5 ± 2 - *** 0.1 19.0 12
Valery 1755 ± 322 *** - 35.1 62.5 9
2156K-41 TMHx 1438K-1 x
TMB2x 9128-3
616 ± 123 *** *** 12.3 66.0 5
2409K-3 TMHx 222K-2 x
TMB2x 8075-7
591 ± 245 *** *** 11.8 29.0 10
7798S-2 TMHx 917K-2 x
TMB2x 9128-3
1200 ± 327 *** Ns 24.0 31.5 8
8386S-19 TMHx 917K-2 x
SH-3217
725 ± 189 *** *** 14.5 46.5 8
8386S-15 TMHx 917K-2 x
SH-3217
1174 ± 216 *** *** 23.5 37.5 11
8386S-50 TMHx 917K-2 x
SH-3217
986 ± 370 *** *** 19.7 50.0 7
9494S-10 TMHx 917K-2 x
SH-3362
1133 ± 202 *** *** 22.7 36.5 8
1 Pf= mean final nematode population density ± standard error. 2 Comparison between Pf of the genotype and Pf of Yangambi km5 (Y. km5) and Valery (Val). Data were log10(x+1) transformed before analysis. Ns = not significantly different (P>0.05). *, **, ***: significantly different at P≤0.05, P≤0.01 and P≤0.001, respectively. 3 Rr = reproduction ratio (Pf/Pi).
4 RN = percentage root necrosis. 5 n = number of roots examined.
Discussion Five secondary triploids with resistance to R. similis were identified. Seven hybrids of the cross TMHx 917K-2 x SH-3217 were evaluated: two progeny were found resistant to R. similis, two were susceptible while three were partially resistant. This suggests again that the gene(s) for nematode resistance/susceptibility may be segregating. Both parents, TMHx 917K-2 and SH-3217, were resistant to R. similis. The progeny 8386S-19, which is partially resistant to R. similis, has a matooke-like taste and a bunch weight of 19 kg (Pillay, personal communication). Of the four secondary triploids from open pollination of TMHx 1201K-1 evaluated one progeny was found resistant, two were susceptible while one was partially resistant. TMHx 1201K-1 was susceptible to R. similis. The resistant
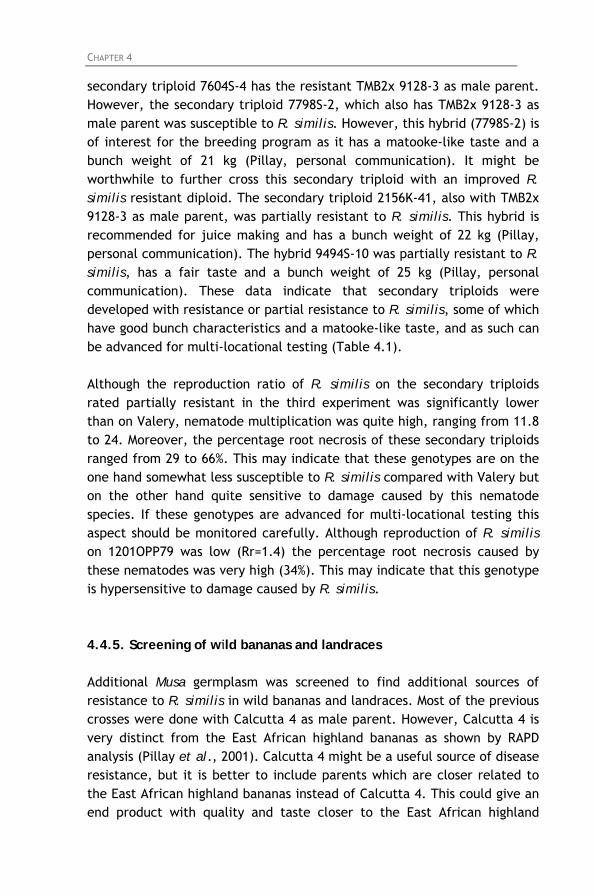
CHAPTER 4 72
secondary triploid 7604S-4 has the resistant TMB2x 9128-3 as male parent. However, the secondary triploid 7798S-2, which also has TMB2x 9128-3 as male parent was susceptible to R. similis. However, this hybrid (7798S-2) is of interest for the breeding program as it has a matooke-like taste and a bunch weight of 21 kg (Pillay, personal communication). It might be worthwhile to further cross this secondary triploid with an improved R. similis resistant diploid. The secondary triploid 2156K-41, also with TMB2x 9128-3 as male parent, was partially resistant to R. similis. This hybrid is recommended for juice making and has a bunch weight of 22 kg (Pillay, personal communication). The hybrid 9494S-10 was partially resistant to R. similis, has a fair taste and a bunch weight of 25 kg (Pillay, personal communication). These data indicate that secondary triploids were developed with resistance or partial resistance to R. similis, some of which have good bunch characteristics and a matooke-like taste, and as such can be advanced for multi-locational testing (Table 4.1). Although the reproduction ratio of R. similis on the secondary triploids rated partially resistant in the third experiment was significantly lower than on Valery, nematode multiplication was quite high, ranging from 11.8 to 24. Moreover, the percentage root necrosis of these secondary triploids ranged from 29 to 66%. This may indicate that these genotypes are on the one hand somewhat less susceptible to R. similis compared with Valery but on the other hand quite sensitive to damage caused by this nematode species. If these genotypes are advanced for multi-locational testing this aspect should be monitored carefully. Although reproduction of R. similis on 1201OPP79 was low (Rr=1.4) the percentage root necrosis caused by these nematodes was very high (34%). This may indicate that this genotype is hypersensitive to damage caused by R. similis. 4.4.5. Screening of wild bananas and landraces Additional Musa germplasm was screened to find additional sources of resistance to R. similis in wild bananas and landraces. Most of the previous crosses were done with Calcutta 4 as male parent. However, Calcutta 4 is very distinct from the East African highland bananas as shown by RAPD analysis (Pillay et al., 2001). Calcutta 4 might be a useful source of disease resistance, but it is better to include parents which are closer related to the East African highland bananas instead of Calcutta 4. This could give an end product with quality and taste closer to the East African highland
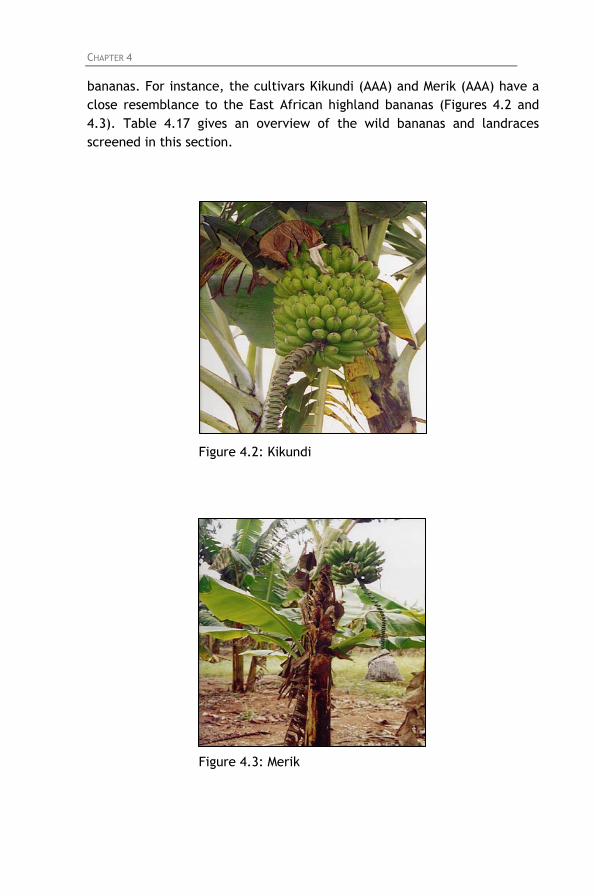
CHAPTER 4 73
bananas. For instance, the cultivars Kikundi (AAA) and Merik (AAA) have a close resemblance to the East African highland bananas (Figures 4.2 and 4.3). Table 4.17 gives an overview of the wild bananas and landraces screened in this section.
Figure 4.2: Kikundi
Figure 4.3: Merik
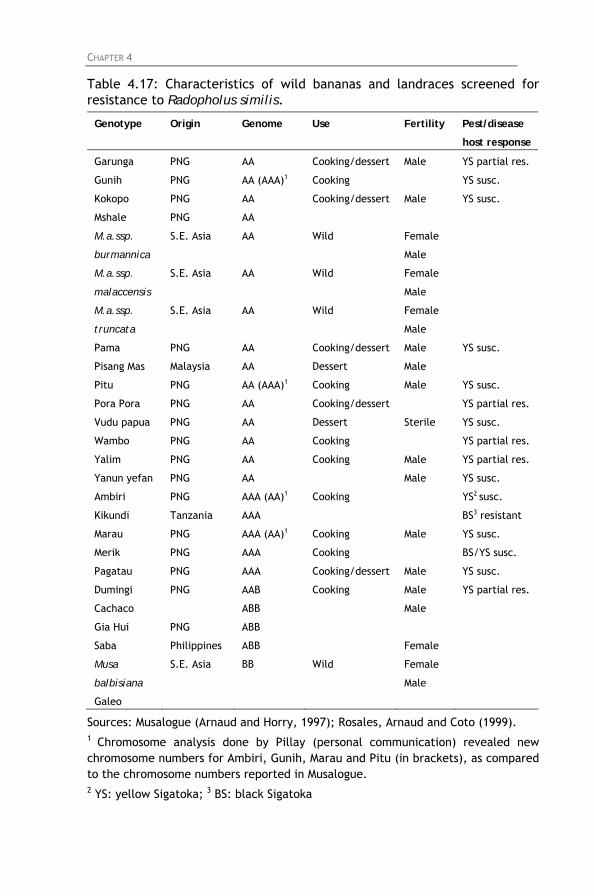
CHAPTER 4 74
Table 4.17: Characteristics of wild bananas and landraces screened for resistance to Radopholus similis.
Genotype Origin Genome Use Fertility Pest/disease
host response
Garunga PNG AA Cooking/dessert Male YS partial res.
Gunih PNG AA (AAA)1 Cooking YS susc.
Kokopo PNG AA Cooking/dessert Male YS susc.
Mshale PNG AA
M.a.ssp.
burmannica
S.E. Asia AA Wild Female
Male
M.a.ssp.
malaccensis
S.E. Asia AA Wild Female
Male
M.a.ssp.
truncata
S.E. Asia AA Wild Female
Male
Pama PNG AA Cooking/dessert Male YS susc.
Pisang Mas Malaysia AA Dessert Male
Pitu PNG AA (AAA)1 Cooking Male YS susc.
Pora Pora PNG AA Cooking/dessert YS partial res.
Vudu papua PNG AA Dessert Sterile YS susc.
Wambo PNG AA Cooking YS partial res.
Yalim PNG AA Cooking Male YS partial res.
Yanun yefan PNG AA Male YS susc.
Ambiri PNG AAA (AA)1 Cooking YS2 susc.
Kikundi Tanzania AAA BS3 resistant
Marau PNG AAA (AA)1 Cooking Male YS susc.
Merik PNG AAA Cooking BS/YS susc.
Pagatau PNG AAA Cooking/dessert Male YS susc.
Dumingi PNG AAB Cooking Male YS partial res.
Cachaco ABB Male
Gia Hui PNG ABB
Saba Philippines ABB Female
Musa
balbisiana
S.E. Asia BB Wild Female
Male
Galeo
Sources: Musalogue (Arnaud and Horry, 1997); Rosales, Arnaud and Coto (1999). 1 Chromosome analysis done by Pillay (personal communication) revealed new chromosome numbers for Ambiri, Gunih, Marau and Pitu (in brackets), as compared to the chromosome numbers reported in Musalogue. 2 YS: yellow Sigatoka; 3 BS: black Sigatoka
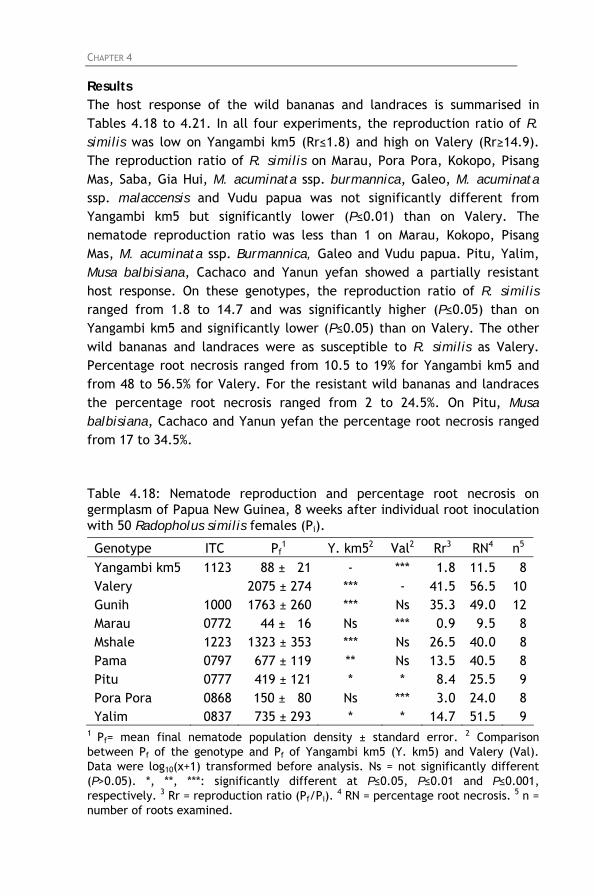
CHAPTER 4 75
Results The host response of the wild bananas and landraces is summarised in Tables 4.18 to 4.21. In all four experiments, the reproduction ratio of R. similis was low on Yangambi km5 (Rr≤1.8) and high on Valery (Rr≥14.9). The reproduction ratio of R. similis on Marau, Pora Pora, Kokopo, Pisang Mas, Saba, Gia Hui, M. acuminata ssp. burmannica, Galeo, M. acuminata ssp. malaccensis and Vudu papua was not significantly different from Yangambi km5 but significantly lower (P≤0.01) than on Valery. The nematode reproduction ratio was less than 1 on Marau, Kokopo, Pisang Mas, M. acuminata ssp. Burmannica, Galeo and Vudu papua. Pitu, Yalim, Musa balbisiana, Cachaco and Yanun yefan showed a partially resistant host response. On these genotypes, the reproduction ratio of R. similis ranged from 1.8 to 14.7 and was significantly higher (P≤0.05) than on Yangambi km5 and significantly lower (P≤0.05) than on Valery. The other wild bananas and landraces were as susceptible to R. similis as Valery. Percentage root necrosis ranged from 10.5 to 19% for Yangambi km5 and from 48 to 56.5% for Valery. For the resistant wild bananas and landraces the percentage root necrosis ranged from 2 to 24.5%. On Pitu, Musa balbisiana, Cachaco and Yanun yefan the percentage root necrosis ranged from 17 to 34.5%. Table 4.18: Nematode reproduction and percentage root necrosis on germplasm of Papua New Guinea, 8 weeks after individual root inoculation with 50 Radopholus similis females (Pi).
Genotype ITC Pf1 Y. km52 Val2 Rr3 RN4 n5
Yangambi km5 1123 88 ± 21 - *** 1.8 11.5 8 Valery 2075 ± 274 *** - 41.5 56.5 10 Gunih 1000 1763 ± 260 *** Ns 35.3 49.0 12 Marau 0772 44 ± 16 Ns *** 0.9 9.5 8 Mshale 1223 1323 ± 353 *** Ns 26.5 40.0 8 Pama 0797 677 ± 119 ** Ns 13.5 40.5 8 Pitu 0777 419 ± 121 * * 8.4 25.5 9 Pora Pora 0868 150 ± 80 Ns *** 3.0 24.0 8 Yalim 0837 735 ± 293 * * 14.7 51.5 9
1 Pf= mean final nematode population density ± standard error. 2 Comparison between Pf of the genotype and Pf of Yangambi km5 (Y. km5) and Valery (Val). Data were log10(x+1) transformed before analysis. Ns = not significantly different (P>0.05). *, **, ***: significantly different at P≤0.05, P≤0.01 and P≤0.001, respectively. 3 Rr = reproduction ratio (Pf/Pi).
4 RN = percentage root necrosis. 5 n = number of roots examined.
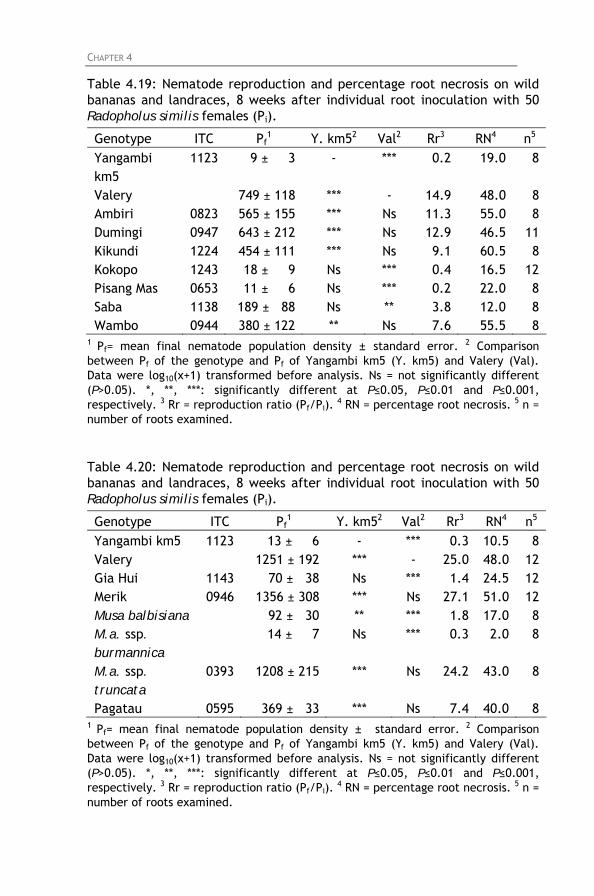
CHAPTER 4 76
Table 4.19: Nematode reproduction and percentage root necrosis on wild bananas and landraces, 8 weeks after individual root inoculation with 50 Radopholus similis females (Pi).
Genotype ITC Pf1 Y. km52 Val2 Rr3 RN4 n5
Yangambi km5
1123 9 ± 3 - *** 0.2 19.0 8
Valery 749 ± 118 *** - 14.9 48.0 8 Ambiri 0823 565 ± 155 *** Ns 11.3 55.0 8 Dumingi 0947 643 ± 212 *** Ns 12.9 46.5 11 Kikundi 1224 454 ± 111 *** Ns 9.1 60.5 8 Kokopo 1243 18 ± 9 Ns *** 0.4 16.5 12 Pisang Mas 0653 11 ± 6 Ns *** 0.2 22.0 8 Saba 1138 189 ± 88 Ns ** 3.8 12.0 8 Wambo 0944 380 ± 122 ** Ns 7.6 55.5 8
1 Pf= mean final nematode population density ± standard error. 2 Comparison between Pf of the genotype and Pf of Yangambi km5 (Y. km5) and Valery (Val). Data were log10(x+1) transformed before analysis. Ns = not significantly different (P>0.05). *, **, ***: significantly different at P≤0.05, P≤0.01 and P≤0.001, respectively. 3 Rr = reproduction ratio (Pf/Pi).
4 RN = percentage root necrosis. 5 n = number of roots examined.
Table 4.20: Nematode reproduction and percentage root necrosis on wild bananas and landraces, 8 weeks after individual root inoculation with 50 Radopholus similis females (Pi).
Genotype ITC Pf1 Y. km52 Val2 Rr3 RN4 n5
Yangambi km5 1123 13 ± 6 - *** 0.3 10.5 8 Valery 1251 ± 192 *** - 25.0 48.0 12 Gia Hui 1143 70 ± 38 Ns *** 1.4 24.5 12 Merik 0946 1356 ± 308 *** Ns 27.1 51.0 12 Musa balbisiana 92 ± 30 ** *** 1.8 17.0 8 M.a. ssp. burmannica
14 ± 7 Ns *** 0.3 2.0 8
M.a. ssp. truncata
0393 1208 ± 215 *** Ns 24.2 43.0 8
Pagatau 0595 369 ± 33 *** Ns 7.4 40.0 8 1 Pf= mean final nematode population density ± standard error. 2 Comparison between Pf of the genotype and Pf of Yangambi km5 (Y. km5) and Valery (Val). Data were log10(x+1) transformed before analysis. Ns = not significantly different (P>0.05). *, **, ***: significantly different at P≤0.05, P≤0.01 and P≤0.001, respectively. 3 Rr = reproduction ratio (Pf/Pi).
4 RN = percentage root necrosis. 5 n = number of roots examined.
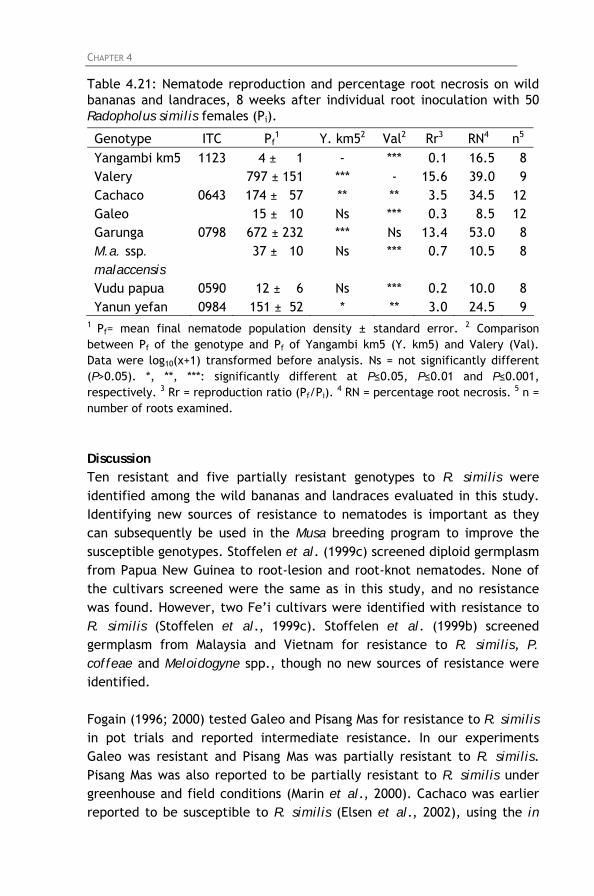
CHAPTER 4 77
Table 4.21: Nematode reproduction and percentage root necrosis on wild bananas and landraces, 8 weeks after individual root inoculation with 50 Radopholus similis females (Pi).
Genotype ITC Pf1 Y. km52 Val2 Rr3 RN4 n5
Yangambi km5 1123 4 ± 1 - *** 0.1 16.5 8 Valery 797 ± 151 *** - 15.6 39.0 9 Cachaco 0643 174 ± 57 ** ** 3.5 34.5 12 Galeo 15 ± 10 Ns *** 0.3 8.5 12 Garunga 0798 672 ± 232 *** Ns 13.4 53.0 8 M.a. ssp. malaccensis
37 ± 10 Ns *** 0.7 10.5 8
Vudu papua 0590 12 ± 6 Ns *** 0.2 10.0 8 Yanun yefan 0984 151 ± 52 * ** 3.0 24.5 9
1 Pf= mean final nematode population density ± standard error. 2 Comparison between Pf of the genotype and Pf of Yangambi km5 (Y. km5) and Valery (Val). Data were log10(x+1) transformed before analysis. Ns = not significantly different (P>0.05). *, **, ***: significantly different at P≤0.05, P≤0.01 and P≤0.001, respectively. 3 Rr = reproduction ratio (Pf/Pi).
4 RN = percentage root necrosis. 5 n = number of roots examined.
Discussion Ten resistant and five partially resistant genotypes to R. similis were identified among the wild bananas and landraces evaluated in this study. Identifying new sources of resistance to nematodes is important as they can subsequently be used in the Musa breeding program to improve the susceptible genotypes. Stoffelen et al. (1999c) screened diploid germplasm from Papua New Guinea to root-lesion and root-knot nematodes. None of the cultivars screened were the same as in this study, and no resistance was found. However, two Fe’i cultivars were identified with resistance to R. similis (Stoffelen et al., 1999c). Stoffelen et al. (1999b) screened germplasm from Malaysia and Vietnam for resistance to R. similis, P. coffeae and Meloidogyne spp., though no new sources of resistance were identified. Fogain (1996; 2000) tested Galeo and Pisang Mas for resistance to R. similis in pot trials and reported intermediate resistance. In our experiments Galeo was resistant and Pisang Mas was partially resistant to R. similis. Pisang Mas was also reported to be partially resistant to R. similis under greenhouse and field conditions (Marin et al., 2000). Cachaco was earlier reported to be susceptible to R. similis (Elsen et al., 2002), using the in
CHAPTER 4 78
vitro screening method. However, in our study Cachaco was partially resistant using the individual root inoculation method. Pinochet (1988b) recommended not using in vitro techniques for screening as the root system is generally filamentous and very tender and a few individuals of R. similis might destroy the plant in a short period of time. This might explain the difference in response using the two different screening methods. Binks and Gowen (1997) reported Gia Hui susceptible to R. similis, but in our study this genotype is resistant. However, Binks and Gowen (1997) used very young in vitro plants, compared to hot water treated suckers in this study. In the experiments carried out by Binks and Gowen (1997), Yangambi km5 had 10400 nematodes per 100 g fresh roots, which is much higher than the population densities we found on plants using the root system inoculation method and hot water treated suckers. The nematode population used by Binks and Gowen (1997) was originally from Nigeria. Wehunt et al. (1978) reported M. acuminata ssp. malaccensis resistant to R. similis based on root lesion ratings. Davide (1980) reported low population densities of R. similis in the field on the cultivar Saba, indicating its resistance. Both genotypes were also resistant in our study using the individual root inoculation method. Some of the landraces evaluated have similar characteristics as the East African highland bananas and could be included in the Musa breeding program for improvement of the highland bananas. 4.5. General discussion and conclusion An overview of the host responses of the Musa germplasm evaluated in this chapter is summarised in Table 4.22. Rowe and Rosales (2000) reported that the East African highland bananas are the only major group of edible Musa in which no seed-fertile natural triploids have been identified which can serve as a parental line in genetic improvement schemes. This is contradictory with the work done at IITA where seed fertility has been identified in two of the five clone sets of the East African highland bananas. Evaluation of IITA breeding material proved that breeding for resistance to R. similis among East African highland bananas is possible. East African highland bananas are susceptible to R. similis. This confirms survey data collected by Speijer and De Waele (2001).
CHAPTER 4 79
Several resistant diploid hybrids have been developed at IITA, of which TMB2x 9128-3 is the most resistant one. Radopholus similis resistant tetraploid hybrids have been developed by crossing susceptible East African highland bananas with the resistant wild diploid Calcutta 4. This diploid has been widely used in Musa breeding programs as a male parent. Tetraploid hybrids have been further crossed with improved diploids, resulting in secondary triploids. Five secondary triploids with resistance and seven with partial resistance to R. similis have been identified. Three of the secondary triploids with partial resistance to R. similis have good bunch characteristics and a matooke-like taste. In addition, the hybrid 1968-2 was resistant to R. similis, as well as to black Sigatoka and the banana weevil. Root tip chromosome counts showed that 1968-2 is a triploid although previously labelled as a diploid. The plant is useful for juice production (Pillay, personal communication). Additional sources of resistance to R. similis have been identified among the germplasm of Papua New Guinea.
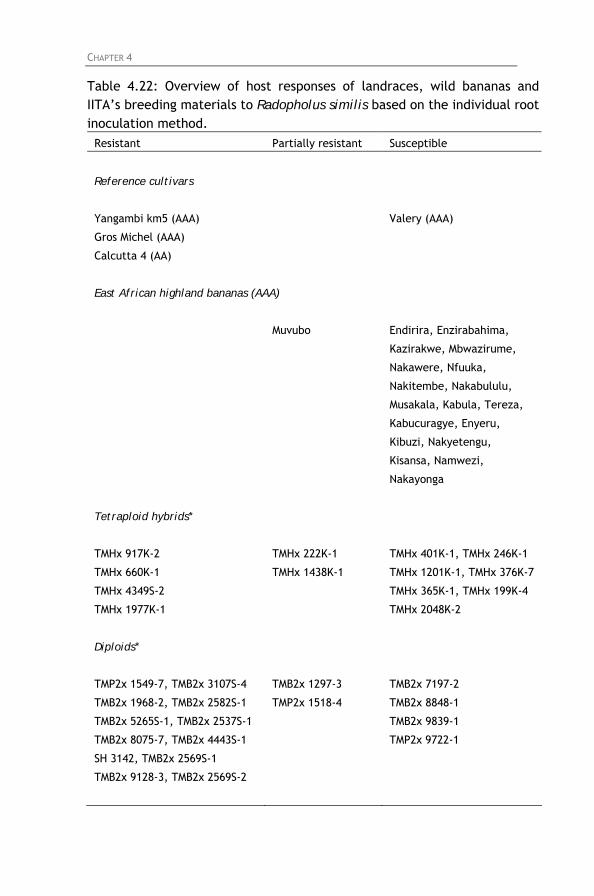
CHAPTER 4 80
Table 4.22: Overview of host responses of landraces, wild bananas and IITA’s breeding materials to Radopholus similis based on the individual root inoculation method.
Resistant Partially resistant Susceptible
Reference cultivars
Yangambi km5 (AAA) Valery (AAA)
Gros Michel (AAA)
Calcutta 4 (AA)
East African highland bananas (AAA)
Muvubo Endirira, Enzirabahima,
Kazirakwe, Mbwazirume,
Nakawere, Nfuuka,
Nakitembe, Nakabululu,
Musakala, Kabula, Tereza,
Kabucuragye, Enyeru,
Kibuzi, Nakyetengu,
Kisansa, Namwezi,
Nakayonga
Tetraploid hybrids*
TMHx 917K-2 TMHx 222K-1 TMHx 401K-1, TMHx 246K-1
TMHx 660K-1 TMHx 1438K-1 TMHx 1201K-1, TMHx 376K-7
TMHx 4349S-2 TMHx 365K-1, TMHx 199K-4
TMHx 1977K-1 TMHx 2048K-2
Diploids*
TMP2x 1549-7, TMB2x 3107S-4 TMB2x 1297-3 TMB2x 7197-2
TMB2x 1968-2, TMB2x 2582S-1 TMP2x 1518-4 TMB2x 8848-1
TMB2x 5265S-1, TMB2x 2537S-1 TMB2x 9839-1
TMB2x 8075-7, TMB2x 4443S-1 TMP2x 9722-1
SH 3142, TMB2x 2569S-1
TMB2x 9128-3, TMB2x 2569S-2
CHAPTER 4 81
Secondary triploids*
7269S-15, 7604S-4 1201OPP30 8386S-4, 8386S-27
8386S-5, 8386S-22 2156K-41, 2409K-3 1201OPP81, 1201OPP85
1201OPP79 8386S-15, 9494S-10 7798S-2
8386S-19, 8386S-50
Wild bananas and landraces
Marau, Pora Pora, Kokopo,
Pisang Mas, Saba, Gia Hiu,
M.a.ssp. burmannica, Galeo,
M.a.ssp. malacencis, Vudu
papua
Pitu, Yalim, M.
balbisiana,
Cachaco, Yanin
Yefan
Gunih, Mshale, Pama,
Dumingi, Kikundi, Wambo,
Merik, M.a.ssp. truncata,
Pagatau, Garunga, Ambiri
* For information on the parents of the hybrids: tetraploids: section 4.4.2; diploids: section 4.4.3; secondary triploids: section 4.4.4.
The information obtained on host plant response of Musa germplasm to R. similis is now being used by IITA’s Musa breeding program. Kokopo, which is highly resistant to R. similis and male fertile, has been selected as a male parent for crosses with selected tetraploid hybrids (Pillay, personal communication). East African highland bananas are currently being crossed with improved diploids (e.g. TMB2x 7197-2, TMB2x 8075-7, TMB2x 9128-3, TMB2x 9719-7, SH-3142, SH-3217 and SH-3362). Tetraploids are being crossed with these improved diploids to obtain secondary triploids. Recurrent diploid breeding is also ongoing by crossing improved diploids with improved diploids (Pillay, personal communication). The diploid TMB2x 7197-2 was found to be the best male parent after pollination on the most seed fertile highland bananas (Kasozi et al., in preparation). Unfortunately, this diploid hybrid was susceptible to R. similis. As field screening of bananas is expensive and time consuming, a pot test is preferred for assessing resistance and tolerance to nematodes of young plants (Stanton, 1999). Stanton (1999) studied the effect of plant age at inoculation on host response. In vitro tissue culture plants should be at least 28 weeks old for resistance assays, as resistance might not be expressed earlier. Some cultivars require a physiological maturation of the root tissues before it can express resistance, e.g. Pisang Jari Buaya showed resistance to R. similis when inoculated at 12 weeks, SH-3142 at 8 weeks,
CHAPTER 4 82
while Goldfinger (AAAB) was only resistant when inoculated 28 weeks after deflasking. In both our screening methods (individual root inoculation and root system inoculation) hot water treated sword sucker-derived plants were used. The inoculation was carried out at around 8 weeks after planting when the root system was developed. Screening Musa genotypes with both screening methods gave similar results. However, early screening methods are only for early elimination of susceptible germplasm which will help to reduce the number of genotypes to be used in field tests. Final evaluation should be done under field conditions (Marin et al., 2000). Therefore a field experiment was established on-station in Namulonge, Uganda, during 2003 to evaluate some of the promising hybrids in the field under a mixed nematode population (R. similis, H. multicinctus, P. goodeyi and Meloidogyne spp.).
CHAPTER 5 83
Chapter 5: Variability in reproductive fitness and virulence of four Radopholus similis populations
from Uganda 5.1. Background and objectives Pathogenicity is defined by two main factors: reproductive fitness (the ability to reproduce) and virulence (the ability to induce damage) (Fallas et al., 1995; Sarah et al., 1993; Shaner et al., 1992). Marin et al. (1999a) described the aggressiveness of a nematode population on Musa as the combination of its reproductive fitness and its ability to cause root necrosis. In vitro reproductive fitness of R. similis on carrot discs and its in vivo pathogenicity on plants are well correlated: the higher the reproductive fitness on carrot discs, the greater the pathogenicity on banana plants (Fallas et al., 1995; Sarah et al., 1993). However, Hahn et al. (1996b) found that a high reproductive fitness of R. similis is not necessarily associated with significant damage on the banana plant. Stoffelen et al. (1999a) studied the dynamics of the reproduction of R. similis using the Gompertz model. Populations with a high reproductive fitness had a high maximum growth rate and an early stationary phase.
Studies on R. similis populations from the major banana growing areas worldwide have revealed a large diversity of this species (Fallas et al., 1995; Fallas and Sarah, 1995; Fogain and Gowen, 1995; Hahn et al., 1996a; Pinochet, 1979; Sarah et al., 1993; Tarté et al., 1981). Sarah et al. (1993) studied different R. similis populations in vitro on carrot discs and in pot experiments on the cultivar Poyo (AAA). They reported that populations from Sri Lanka and Martinique had a lower pathogenicity than a population from Côte d’Ivoire. Pinochet (1988a) reports on differences in pathogenicity of R. similis among populations from Latin America and the Caribbean. Also Sarah and Fallas (1996) reported intraspecific diversity among R. similis populations from Central America and the Caribbean. Variability in reproductive fitness and pathogenicity observed under controlled conditions might explain differences in damage to banana observed in the field. In Central America, the more damaging R. similis populations tend to prevail in Panama and Costa Rica where losses due to high nematode infestation and toppling are much higher than in other banana growing areas, such as the Sula valley in Honduras and Belize
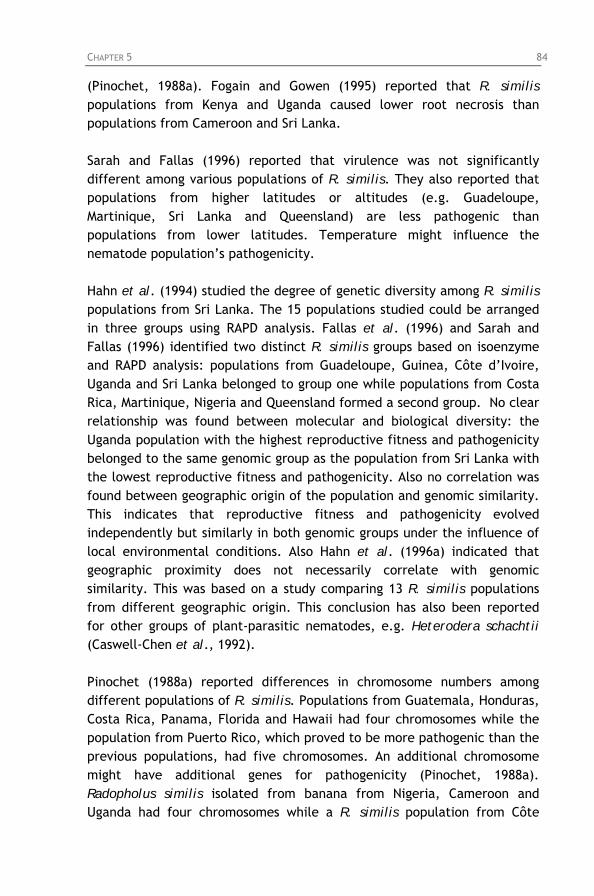
CHAPTER 5 84
(Pinochet, 1988a). Fogain and Gowen (1995) reported that R. similis populations from Kenya and Uganda caused lower root necrosis than populations from Cameroon and Sri Lanka.
Sarah and Fallas (1996) reported that virulence was not significantly different among various populations of R. similis. They also reported that populations from higher latitudes or altitudes (e.g. Guadeloupe, Martinique, Sri Lanka and Queensland) are less pathogenic than populations from lower latitudes. Temperature might influence the nematode population’s pathogenicity. Hahn et al. (1994) studied the degree of genetic diversity among R. similis populations from Sri Lanka. The 15 populations studied could be arranged in three groups using RAPD analysis. Fallas et al. (1996) and Sarah and Fallas (1996) identified two distinct R. similis groups based on isoenzyme and RAPD analysis: populations from Guadeloupe, Guinea, Côte d’Ivoire, Uganda and Sri Lanka belonged to group one while populations from Costa Rica, Martinique, Nigeria and Queensland formed a second group. No clear relationship was found between molecular and biological diversity: the Uganda population with the highest reproductive fitness and pathogenicity belonged to the same genomic group as the population from Sri Lanka with the lowest reproductive fitness and pathogenicity. Also no correlation was found between geographic origin of the population and genomic similarity. This indicates that reproductive fitness and pathogenicity evolved independently but similarly in both genomic groups under the influence of local environmental conditions. Also Hahn et al. (1996a) indicated that geographic proximity does not necessarily correlate with genomic similarity. This was based on a study comparing 13 R. similis populations from different geographic origin. This conclusion has also been reported for other groups of plant-parasitic nematodes, e.g. Heterodera schachtii (Caswell-Chen et al., 1992). Pinochet (1988a) reported differences in chromosome numbers among different populations of R. similis. Populations from Guatemala, Honduras, Costa Rica, Panama, Florida and Hawaii had four chromosomes while the population from Puerto Rico, which proved to be more pathogenic than the previous populations, had five chromosomes. An additional chromosome might have additional genes for pathogenicity (Pinochet, 1988a). Radopholus similis isolated from banana from Nigeria, Cameroon and Uganda had four chromosomes while a R. similis population from Côte
CHAPTER 5 85
d’Ivoire had five chromosomes (Hahn et al., 1996c). Huettel and Dickson (1981) and Huettel et al. (1984) reported four chromosomes in the banana population and five chromosomes in the citrus population of R. similis. Considering the resistance of the host plant to the genetic variability of the pathogen, Van der Planck (1963) described two main types of resistance: horizontal resistance, effective against all genetic variants of a particular pathogen, and vertical resistance, effective against certain variants only. Resistance to nematodes might be effective against only a single pathotype (Starr et al., 2002). This might have implications for the durability of the resistance. The resistance may not be durable if the target nematode species has a high level of genetic variability (Starr et al., 2002). The variability in reproductive fitness and virulence among R. similis populations can influence the results of screening experiments for resistance. In this perspective the exact knowledge on the existence of pathotypes within R. similis is crucial (De Waele, 1996). Breeding efforts should focus on the most pathogenic nematode population and include preferably only host plant genotypes which are resistant to as many as possible genetic variants of the nematode. The objective of the research reported in this chapter was to find out whether R. similis populations differing in pathogenicity exist within Uganda. The reproductive fitness of four different R. similis populations from Uganda was investigated first on carrot discs. Subsequently pathogenicity tests on Musa germplasm were done in the screenhouse. Susceptible and resistant reference cultivars and promising hybrids from the IITA and FHIA Musa breeding programs were tested for resistance to all four R. similis populations.
5.2. Reproductive fitness of Radopholus similis on carrot discs The R. similis populations were obtained from infected banana roots collected at four different locations in Uganda: Namulonge (1,128 masl), Mbarara (1,330 masl), Ikulwe (1,050 masl) and Mukono (1,050 masl) (Chapter 2, Figure 2.3). The populations were cultured monoxenically on carrot discs as described in chapter 2 (section 2.3.1).
CHAPTER 5 86
5.2.1. Reproduction as a function of inoculum level In a first experiment, the reproductive fitness of the four different R. similis populations was compared as a function of inoculum level. Carrot discs were inoculated with 10, 25, 50 or 100 R. similis females, which were individually hand-picked under the stereo microscope. Each inoculum level was replicated eight times. The carrot discs were incubated in the dark at 28°C. The effect of inoculum level on the reproduction of R. similis was determined 6 weeks after inoculation. Nematodes were collected by first rinsing the Petri dishes and collecting the nematodes in a test tube. Carrots were then blended in a kitchen blender two times for 10 seconds. The nematodes were extracted overnight using a modified Baermann funnel method (Chapter 2, section 2.3.1). Eggs and all vermiform developmental stages (juveniles and adults) were counted. The General Linear Model was used to compare the final nematode population densities for the different inoculum levels. Nematode data were log(x+1) transformed before analysis. Means were separated with the Tukey test. The reproduction of the four R. similis populations 6 weeks after inoculation with different inoculum levels is presented in Table 5.1. The population from Mbarara showed the highest reproduction ratio for all inoculum levels compared to the other populations, though this was not significant at inoculum levels of 10 and 25 R. similis females (except Ikulwe at Pi=25). At inoculum levels of 50 and 100 R. similis females, the population of Mbarara had a significantly higher (P≤0.05) reproduction ratio than the populations from Ikulwe and Mukono. The population from Mbarara also had a higher reproduction ratio than the population from Namulonge, though not significantly different (Table 5.1). The population from Mukono showed more or less the same reproduction ratio for all inoculum levels and no significantly differences were observed among inoculum levels. The population from Ikulwe was not very active at the time of inoculation and this might explain the low reproduction ratio for all inoculum levels. For all the nematode populations, except Mukono, there was a significant increase (P≤0.05) in final population density when increasing the inoculum level from 10 to 25 R. similis females. Increasing the inoculum level from 25 to 50 and from 50 to 100 R. similis females did increase the final nematode population density, but no significant differences were found among the different inoculum levels. The only significant increase in final nematode population density was observed for
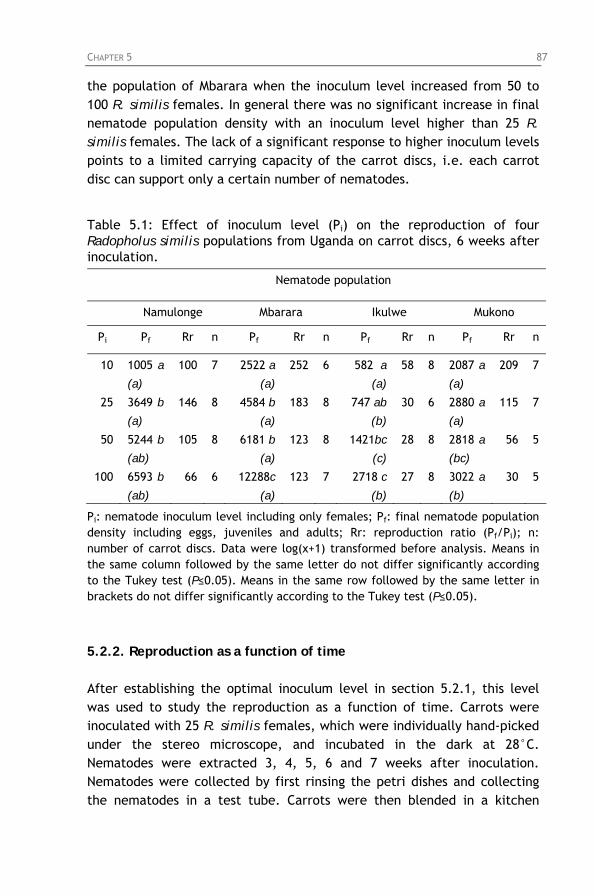
CHAPTER 5 87
the population of Mbarara when the inoculum level increased from 50 to 100 R. similis females. In general there was no significant increase in final nematode population density with an inoculum level higher than 25 R. similis females. The lack of a significant response to higher inoculum levels points to a limited carrying capacity of the carrot discs, i.e. each carrot disc can support only a certain number of nematodes. Table 5.1: Effect of inoculum level (Pi) on the reproduction of four Radopholus similis populations from Uganda on carrot discs, 6 weeks after inoculation.
Nematode population
Namulonge Mbarara Ikulwe Mukono
Pi Pf Rr n Pf Rr n Pf Rr n Pf Rr n
10 1005 a
(a)
100 7 2522 a
(a)
252 6 582 a
(a)
58 8 2087 a
(a)
209 7
25 3649 b
(a)
146 8 4584 b
(a)
183 8 747 ab
(b)
30 6 2880 a
(a)
115 7
50 5244 b
(ab)
105 8 6181 b
(a)
123 8 1421bc
(c)
28 8 2818 a
(bc)
56 5
100 6593 b
(ab)
66 6 12288c
(a)
123 7 2718 c
(b)
27 8 3022 a
(b)
30 5
Pi: nematode inoculum level including only females; Pf: final nematode population density including eggs, juveniles and adults; Rr: reproduction ratio (Pf/Pi); n: number of carrot discs. Data were log(x+1) transformed before analysis. Means in the same column followed by the same letter do not differ significantly according to the Tukey test (P≤0.05). Means in the same row followed by the same letter in brackets do not differ significantly according to the Tukey test (P≤0.05).
5.2.2. Reproduction as a function of time After establishing the optimal inoculum level in section 5.2.1, this level was used to study the reproduction as a function of time. Carrots were inoculated with 25 R. similis females, which were individually hand-picked under the stereo microscope, and incubated in the dark at 28°C. Nematodes were extracted 3, 4, 5, 6 and 7 weeks after inoculation. Nematodes were collected by first rinsing the petri dishes and collecting the nematodes in a test tube. Carrots were then blended in a kitchen
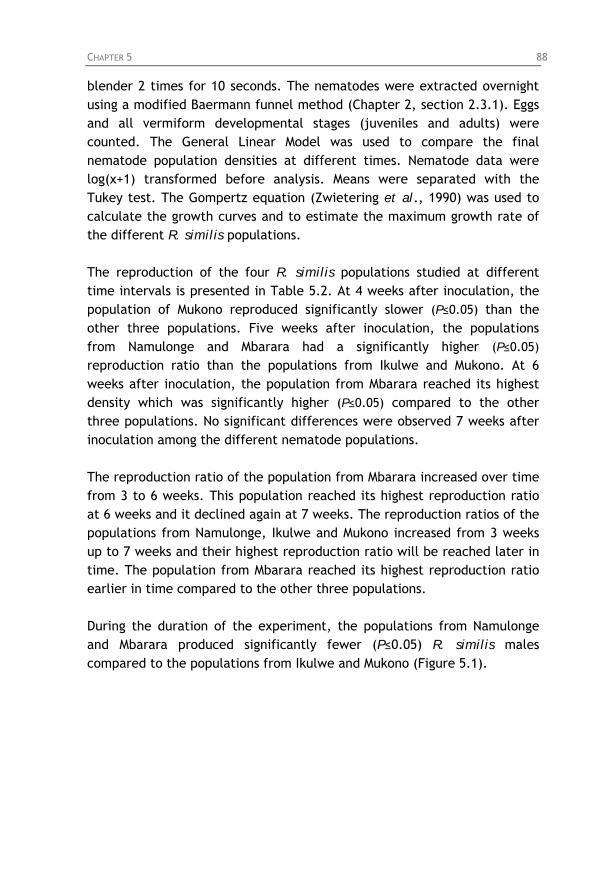
CHAPTER 5 88
blender 2 times for 10 seconds. The nematodes were extracted overnight using a modified Baermann funnel method (Chapter 2, section 2.3.1). Eggs and all vermiform developmental stages (juveniles and adults) were counted. The General Linear Model was used to compare the final nematode population densities at different times. Nematode data were log(x+1) transformed before analysis. Means were separated with the Tukey test. The Gompertz equation (Zwietering et al., 1990) was used to calculate the growth curves and to estimate the maximum growth rate of the different R. similis populations. The reproduction of the four R. similis populations studied at different time intervals is presented in Table 5.2. At 4 weeks after inoculation, the population of Mukono reproduced significantly slower (P≤0.05) than the other three populations. Five weeks after inoculation, the populations from Namulonge and Mbarara had a significantly higher (P≤0.05) reproduction ratio than the populations from Ikulwe and Mukono. At 6 weeks after inoculation, the population from Mbarara reached its highest density which was significantly higher (P≤0.05) compared to the other three populations. No significant differences were observed 7 weeks after inoculation among the different nematode populations. The reproduction ratio of the population from Mbarara increased over time from 3 to 6 weeks. This population reached its highest reproduction ratio at 6 weeks and it declined again at 7 weeks. The reproduction ratios of the populations from Namulonge, Ikulwe and Mukono increased from 3 weeks up to 7 weeks and their highest reproduction ratio will be reached later in time. The population from Mbarara reached its highest reproduction ratio earlier in time compared to the other three populations. During the duration of the experiment, the populations from Namulonge and Mbarara produced significantly fewer (P≤0.05) R. similis males compared to the populations from Ikulwe and Mukono (Figure 5.1).
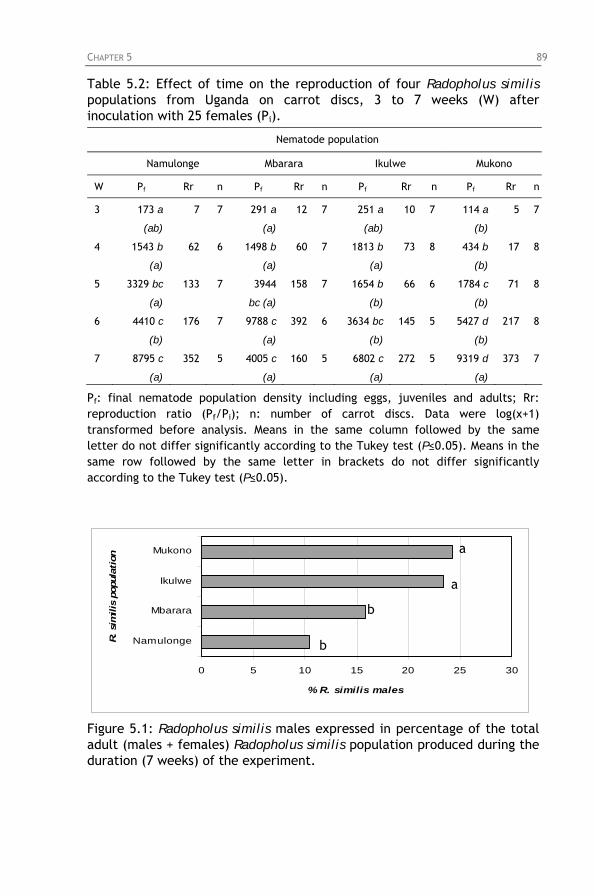
CHAPTER 5 89
Table 5.2: Effect of time on the reproduction of four Radopholus similis populations from Uganda on carrot discs, 3 to 7 weeks (W) after inoculation with 25 females (Pi).
Nematode population
Namulonge Mbarara Ikulwe Mukono
W Pf Rr n Pf Rr n Pf Rr n Pf Rr n
3 173 a
(ab)
7 7 291 a
(a)
12 7 251 a
(ab)
10 7 114 a
(b)
5 7
4 1543 b
(a)
62 6 1498 b
(a)
60 7 1813 b
(a)
73 8 434 b
(b)
17 8
5 3329 bc
(a)
133 7 3944
bc (a)
158 7 1654 b
(b)
66 6 1784 c
(b)
71 8
6 4410 c
(b)
176 7 9788 c
(a)
392 6 3634 bc
(b)
145 5 5427 d
(b)
217 8
7 8795 c
(a)
352 5 4005 c
(a)
160 5 6802 c
(a)
272 5 9319 d
(a)
373 7
Pf: final nematode population density including eggs, juveniles and adults; Rr: reproduction ratio (Pf/Pi); n: number of carrot discs. Data were log(x+1) transformed before analysis. Means in the same column followed by the same letter do not differ significantly according to the Tukey test (P≤0.05). Means in the same row followed by the same letter in brackets do not differ significantly according to the Tukey test (P≤0.05).
0 5 10 15 20 25 30
Namulonge
Mbarara
Ikulwe
Mukono
R. si
milis
pop
ulat
ion
% R. similis males
a
a
b
b
Figure 5.1: Radopholus similis males expressed in percentage of the total adult (males + females) Radopholus similis population produced during the duration (7 weeks) of the experiment.
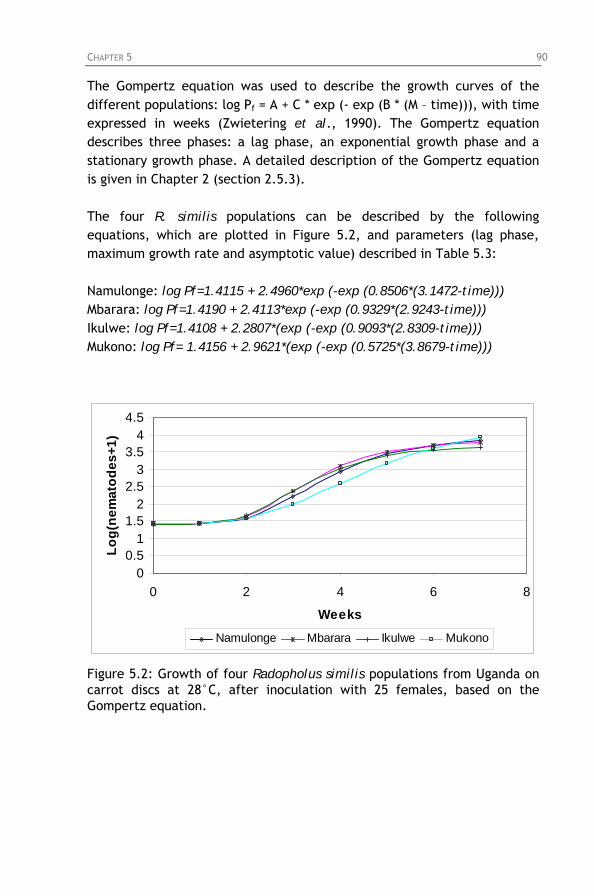
CHAPTER 5 90
The Gompertz equation was used to describe the growth curves of the different populations: log Pf = A + C * exp (- exp (B * (M – time))), with time expressed in weeks (Zwietering et al., 1990). The Gompertz equation describes three phases: a lag phase, an exponential growth phase and a stationary growth phase. A detailed description of the Gompertz equation is given in Chapter 2 (section 2.5.3). The four R. similis populations can be described by the following equations, which are plotted in Figure 5.2, and parameters (lag phase, maximum growth rate and asymptotic value) described in Table 5.3: Namulonge: log Pf=1.4115 + 2.4960*exp (-exp (0.8506*(3.1472-time))) Mbarara: log Pf=1.4190 + 2.4113*exp (-exp (0.9329*(2.9243-time))) Ikulwe: log Pf=1.4108 + 2.2807*(exp (-exp (0.9093*(2.8309-time))) Mukono: log Pf= 1.4156 + 2.9621*(exp (-exp (0.5725*(3.8679-time)))
00.5
11.5
22.5
33.5
44.5
0 2 4 6
Weeks
Log(
nem
atod
es+1
)
8
Namulonge Mbarara Ikulwe Mukono
Figure 5.2: Growth of four Radopholus similis populations from Uganda on carrot discs at 28°C, after inoculation with 25 females, based on the Gompertz equation.
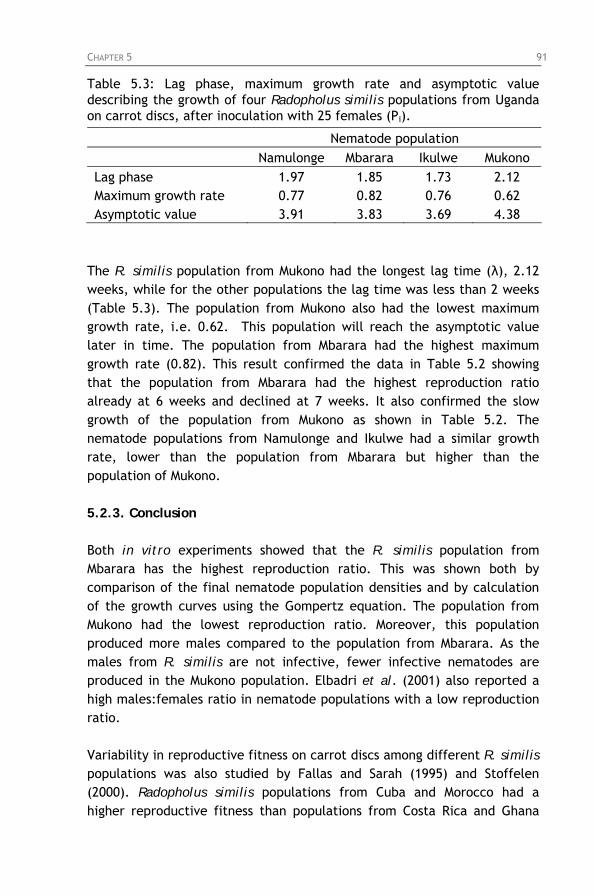
CHAPTER 5 91
Table 5.3: Lag phase, maximum growth rate and asymptotic value describing the growth of four Radopholus similis populations from Uganda on carrot discs, after inoculation with 25 females (Pi).
Nematode population Namulonge Mbarara Ikulwe Mukono Lag phase 1.97 1.85 1.73 2.12 Maximum growth rate 0.77 0.82 0.76 0.62 Asymptotic value 3.91 3.83 3.69 4.38
The R. similis population from Mukono had the longest lag time (λ), 2.12 weeks, while for the other populations the lag time was less than 2 weeks (Table 5.3). The population from Mukono also had the lowest maximum growth rate, i.e. 0.62. This population will reach the asymptotic value later in time. The population from Mbarara had the highest maximum growth rate (0.82). This result confirmed the data in Table 5.2 showing that the population from Mbarara had the highest reproduction ratio already at 6 weeks and declined at 7 weeks. It also confirmed the slow growth of the population from Mukono as shown in Table 5.2. The nematode populations from Namulonge and Ikulwe had a similar growth rate, lower than the population from Mbarara but higher than the population of Mukono. 5.2.3. Conclusion Both in vitro experiments showed that the R. similis population from Mbarara has the highest reproduction ratio. This was shown both by comparison of the final nematode population densities and by calculation of the growth curves using the Gompertz equation. The population from Mukono had the lowest reproduction ratio. Moreover, this population produced more males compared to the population from Mbarara. As the males from R. similis are not infective, fewer infective nematodes are produced in the Mukono population. Elbadri et al. (2001) also reported a high males:females ratio in nematode populations with a low reproduction ratio. Variability in reproductive fitness on carrot discs among different R. similis populations was also studied by Fallas and Sarah (1995) and Stoffelen (2000). Radopholus similis populations from Cuba and Morocco had a higher reproductive fitness than populations from Costa Rica and Ghana
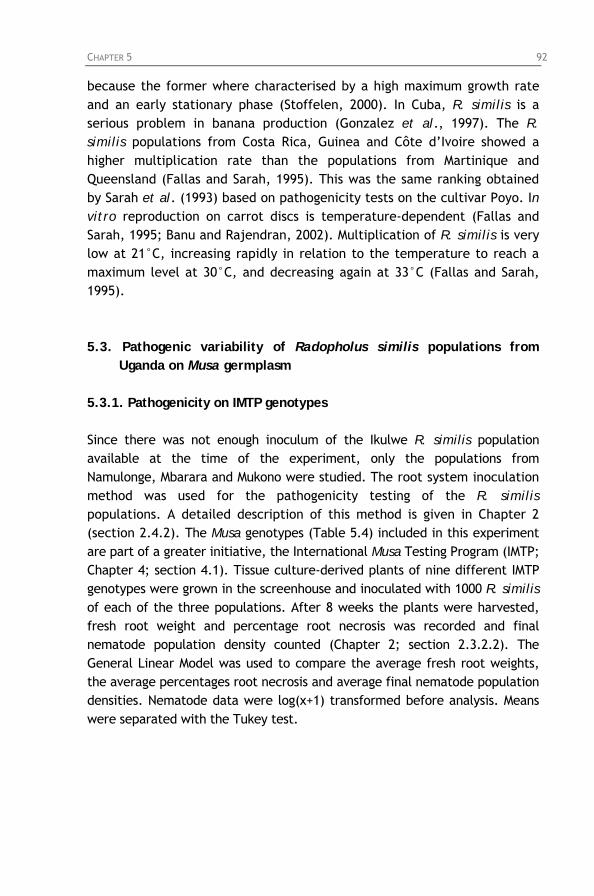
CHAPTER 5 92
because the former where characterised by a high maximum growth rate and an early stationary phase (Stoffelen, 2000). In Cuba, R. similis is a serious problem in banana production (Gonzalez et al., 1997). The R. similis populations from Costa Rica, Guinea and Côte d’Ivoire showed a higher multiplication rate than the populations from Martinique and Queensland (Fallas and Sarah, 1995). This was the same ranking obtained by Sarah et al. (1993) based on pathogenicity tests on the cultivar Poyo. In vitro reproduction on carrot discs is temperature-dependent (Fallas and Sarah, 1995; Banu and Rajendran, 2002). Multiplication of R. similis is very low at 21°C, increasing rapidly in relation to the temperature to reach a maximum level at 30°C, and decreasing again at 33°C (Fallas and Sarah, 1995). 5.3. Pathogenic variability of Radopholus similis populations from
Uganda on Musa germplasm 5.3.1. Pathogenicity on IMTP genotypes Since there was not enough inoculum of the Ikulwe R. similis population available at the time of the experiment, only the populations from Namulonge, Mbarara and Mukono were studied. The root system inoculation method was used for the pathogenicity testing of the R. similis populations. A detailed description of this method is given in Chapter 2 (section 2.4.2). The Musa genotypes (Table 5.4) included in this experiment are part of a greater initiative, the International Musa Testing Program (IMTP; Chapter 4; section 4.1). Tissue culture-derived plants of nine different IMTP genotypes were grown in the screenhouse and inoculated with 1000 R. similis of each of the three populations. After 8 weeks the plants were harvested, fresh root weight and percentage root necrosis was recorded and final nematode population density counted (Chapter 2; section 2.3.2.2). The General Linear Model was used to compare the average fresh root weights, the average percentages root necrosis and average final nematode population densities. Nematode data were log(x+1) transformed before analysis. Means were separated with the Tukey test.
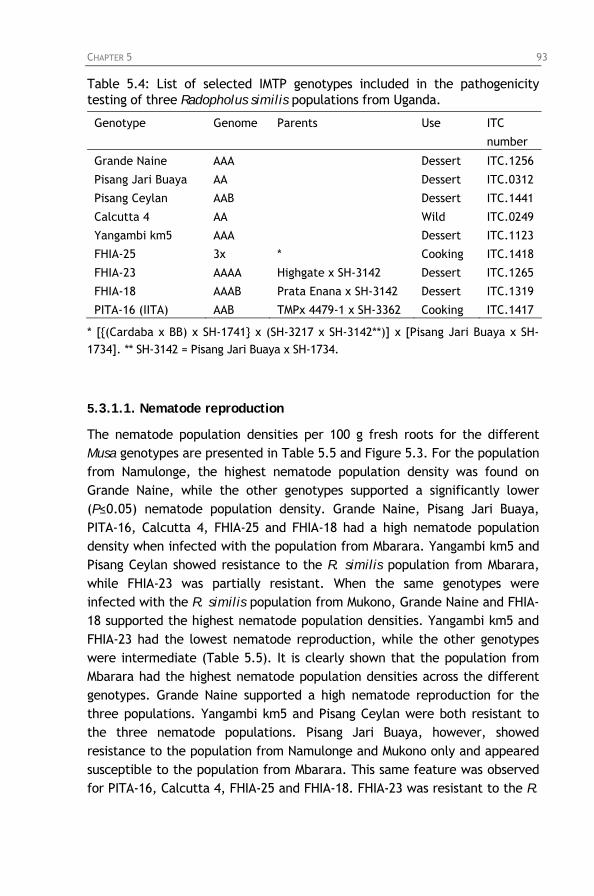
CHAPTER 5 93
Table 5.4: List of selected IMTP genotypes included in the pathogenicity testing of three Radopholus similis populations from Uganda.
Genotype Genome Parents Use ITC
number
Grande Naine AAA Dessert ITC.1256
Pisang Jari Buaya AA Dessert ITC.0312
Pisang Ceylan AAB Dessert ITC.1441
Calcutta 4 AA Wild ITC.0249
Yangambi km5 AAA Dessert ITC.1123
FHIA-25 3x * Cooking ITC.1418
FHIA-23 AAAA Highgate x SH-3142 Dessert ITC.1265
FHIA-18 AAAB Prata Enana x SH-3142 Dessert ITC.1319
PITA-16 (IITA) AAB TMPx 4479-1 x SH-3362 Cooking ITC.1417
* [{(Cardaba x BB) x SH-1741} x (SH-3217 x SH-3142**)] x [Pisang Jari Buaya x SH-1734]. ** SH-3142 = Pisang Jari Buaya x SH-1734.
5.3.1.1. Nematode reproduction
The nematode population densities per 100 g fresh roots for the different Musa genotypes are presented in Table 5.5 and Figure 5.3. For the population from Namulonge, the highest nematode population density was found on Grande Naine, while the other genotypes supported a significantly lower (P≤0.05) nematode population density. Grande Naine, Pisang Jari Buaya, PITA-16, Calcutta 4, FHIA-25 and FHIA-18 had a high nematode population density when infected with the population from Mbarara. Yangambi km5 and Pisang Ceylan showed resistance to the R. similis population from Mbarara, while FHIA-23 was partially resistant. When the same genotypes were infected with the R. similis population from Mukono, Grande Naine and FHIA-18 supported the highest nematode population densities. Yangambi km5 and FHIA-23 had the lowest nematode reproduction, while the other genotypes were intermediate (Table 5.5). It is clearly shown that the population from Mbarara had the highest nematode population densities across the different genotypes. Grande Naine supported a high nematode reproduction for the three populations. Yangambi km5 and Pisang Ceylan were both resistant to the three nematode populations. Pisang Jari Buaya, however, showed resistance to the population from Namulonge and Mukono only and appeared susceptible to the population from Mbarara. This same feature was observed for PITA-16, Calcutta 4, FHIA-25 and FHIA-18. FHIA-23 was resistant to the R.
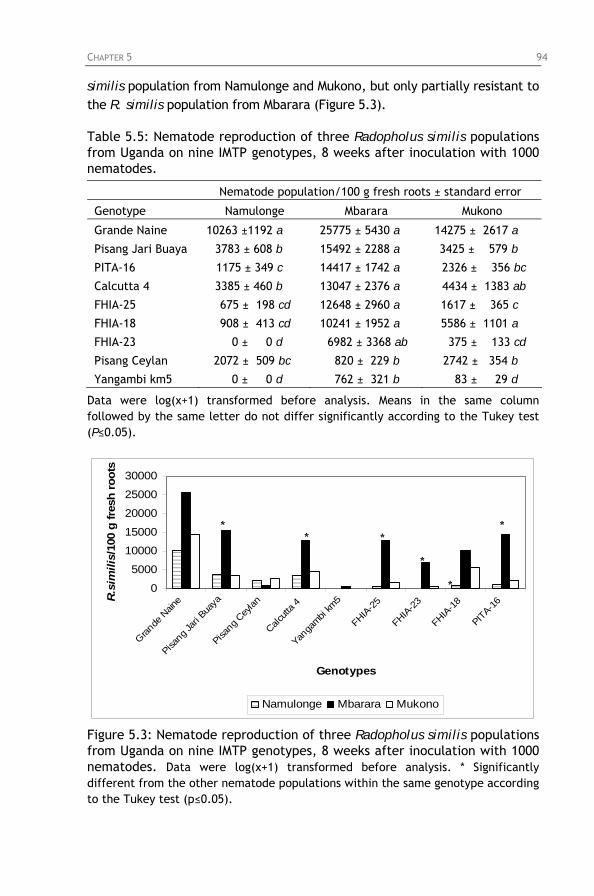
CHAPTER 5 94
similis population from Namulonge and Mukono, but only partially resistant to the R. similis population from Mbarara (Figure 5.3). Table 5.5: Nematode reproduction of three Radopholus similis populations from Uganda on nine IMTP genotypes, 8 weeks after inoculation with 1000 nematodes.
Nematode population/100 g fresh roots ± standard error
Genotype Namulonge Mbarara Mukono
Grande Naine 10263 ±1192 a 25775 ± 5430 a 14275 ± 2617 a
Pisang Jari Buaya 3783 ± 608 b 15492 ± 2288 a 3425 ± 579 b
PITA-16 1175 ± 349 c 14417 ± 1742 a 2326 ± 356 bc
Calcutta 4 3385 ± 460 b 13047 ± 2376 a 4434 ± 1383 ab
FHIA-25 675 ± 198 cd 12648 ± 2960 a 1617 ± 365 c
FHIA-18 908 ± 413 cd 10241 ± 1952 a 5586 ± 1101 a
FHIA-23 0 ± 0 d 6982 ± 3368 ab 375 ± 133 cd
Pisang Ceylan 2072 ± 509 bc 820 ± 229 b 2742 ± 354 b
Yangambi km5 0 ± 0 d 762 ± 321 b 83 ± 29 d
Data were log(x+1) transformed before analysis. Means in the same column followed by the same letter do not differ significantly according to the Tukey test (P≤0.05).
0
5000
10000
15000
20000
25000
30000
Grande
Nain
e
Pisang J
ari B
uaya
Pisang C
eylan
Calcutt
a 4
Yanga
mbi km
5
FHIA-25
FHIA-23
FHIA-18
PITA-16
Genotypes
R.s
imili
s/10
0 g
fresh
root
s
Namulonge Mbarara Mukono
* * * *
*
*
Figure 5.3: Nematode reproduction of three Radopholus similis populations from Uganda on nine IMTP genotypes, 8 weeks after inoculation with 1000 nematodes. Data were log(x+1) transformed before analysis. * Significantly different from the other nematode populations within the same genotype according to the Tukey test (p≤0.05).
CHAPTER 5 95
5.3.1.2. Nematode damage Fresh root weight The fresh root weight of the different genotypes infected with the three R. similis populations is given in Table 5.6. Also the root weight of non-infected plants was recorded. Grande Naine had a significantly lower (P≤0.05) root weight when infected with the populations from Namulonge and Mbarara compared to non-infected plants. The reduction in root weight agreed with the high nematode population densities found in the roots of Grande Naine (Figure 5.3). The population from Mukono did not significantly reduce the root weight of Grande Naine. No significant differences in root weight were found for Pisang Jari Buaya, Pisang Ceylan, Calcutta 4, Yangambi km5, FHIA-23 and PITA-16 when infected with the three nematode populations. FHIA-25 showed a significant reduction (P≤0.05) in root weight when infected with the Mbarara population, which concurred with the nematode population density data in Figure 5.3. Hence, the nematode population from Mbarara is the only one that reproduced well on FHIA-25. FHIA-18 showed a significant reduction (P≤0.05) in root weight when infected with the populations from Mbarara and Mukono. Both nematode populations reproduced well on FHIA-18 (Table 5.5). Table 5.6: Fresh root weight (g) of nine IMTP genotypes inoculated with three Radopholus similis populations from Uganda, 8 weeks after inoculation with 1000 nematodes.
Fresh root weight ± standard error
Control Namulonge Mbarara Mukono
Grande Naine 65 ± 7 a 35 ± 5 b 30 ± 2 b 58 ± 8 a
Pisang Jari Buaya 34 ± 4 a 34 ± 3 a 29 ± 4 a 38 ± 3 a
Pisang Ceylan 30 ± 4 a 21 ± 6 a 19 ± 1 a 26 ± 3 a
Calcutta 4 44 ± 8 a 36 ± 4 a 27 ± 6 a 41 ± 4 a
Yangambi km5 102 ± 6 a 95 ± 8 a 101 ± 7 a 98 ± 9 a
FHIA-25 59 ± 7 a 46 ± 4 ab 29 ± 3 b 50 ± 8 ab
FHIA-23 102 ± 17 a 77 ± 14 a 75 ± 6 a 105 ± 7 a
FHIA-18 70 ± 7 a 57 ± 6 ab 34 ± 5 c 44 ± 4 bc
PITA-16 38 ± 5 a 37 ± 5 a 38 ± 4 a 31 ± 4 a
Means in the same row followed by the same letter do not differ significantly according to the Tukey test (P≤0.05).
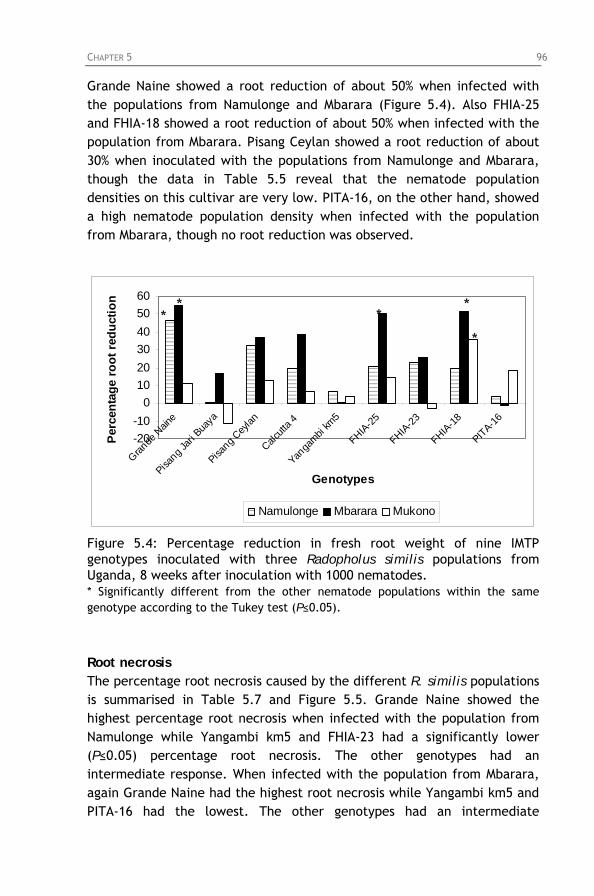
CHAPTER 5 96
Grande Naine showed a root reduction of about 50% when infected with the populations from Namulonge and Mbarara (Figure 5.4). Also FHIA-25 and FHIA-18 showed a root reduction of about 50% when infected with the population from Mbarara. Pisang Ceylan showed a root reduction of about 30% when inoculated with the populations from Namulonge and Mbarara, though the data in Table 5.5 reveal that the nematode population densities on this cultivar are very low. PITA-16, on the other hand, showed a high nematode population density when infected with the population from Mbarara, though no root reduction was observed.
-20-10
0102030405060
Grande
Nain
e
Pisang J
ari B
uaya
Pisang C
eylan
Calcutt
a 4
Yanga
mbi km
5
FHIA-25
FHIA-23
FHIA-18
PITA-16
Genotypes
Perc
enta
ge ro
ot r
educ
tion
Namulonge Mbarara Mukono
* * * *
*
Figure 5.4: Percentage reduction in fresh root weight of nine IMTP genotypes inoculated with three Radopholus similis populations from Uganda, 8 weeks after inoculation with 1000 nematodes. * Significantly different from the other nematode populations within the same genotype according to the Tukey test (P≤0.05).
Root necrosis The percentage root necrosis caused by the different R. similis populations is summarised in Table 5.7 and Figure 5.5. Grande Naine showed the highest percentage root necrosis when infected with the population from Namulonge while Yangambi km5 and FHIA-23 had a significantly lower (P≤0.05) percentage root necrosis. The other genotypes had an intermediate response. When infected with the population from Mbarara, again Grande Naine had the highest root necrosis while Yangambi km5 and PITA-16 had the lowest. The other genotypes had an intermediate
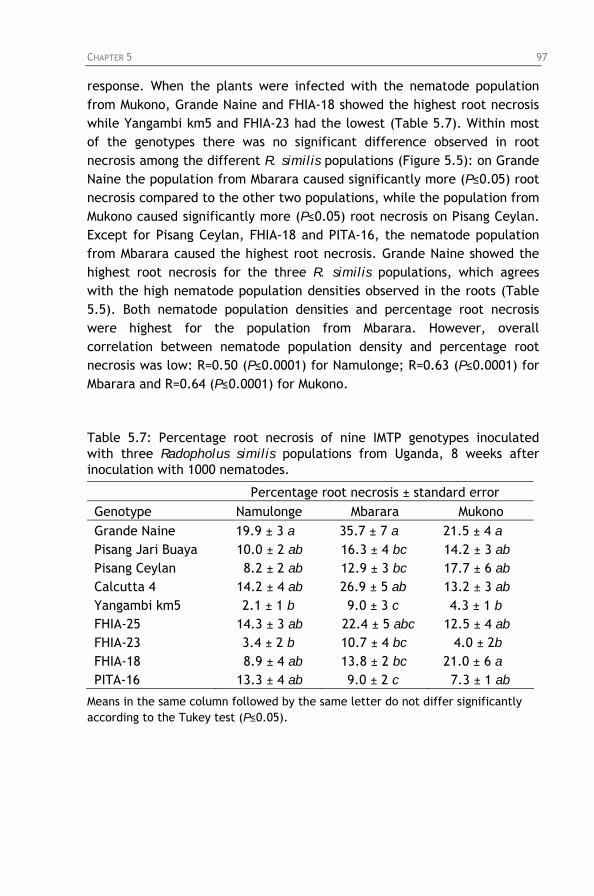
CHAPTER 5 97
response. When the plants were infected with the nematode population from Mukono, Grande Naine and FHIA-18 showed the highest root necrosis while Yangambi km5 and FHIA-23 had the lowest (Table 5.7). Within most of the genotypes there was no significant difference observed in root necrosis among the different R. similis populations (Figure 5.5): on Grande Naine the population from Mbarara caused significantly more (P≤0.05) root necrosis compared to the other two populations, while the population from Mukono caused significantly more (P≤0.05) root necrosis on Pisang Ceylan. Except for Pisang Ceylan, FHIA-18 and PITA-16, the nematode population from Mbarara caused the highest root necrosis. Grande Naine showed the highest root necrosis for the three R. similis populations, which agrees with the high nematode population densities observed in the roots (Table 5.5). Both nematode population densities and percentage root necrosis were highest for the population from Mbarara. However, overall correlation between nematode population density and percentage root necrosis was low: R=0.50 (P≤0.0001) for Namulonge; R=0.63 (P≤0.0001) for Mbarara and R=0.64 (P≤0.0001) for Mukono. Table 5.7: Percentage root necrosis of nine IMTP genotypes inoculated with three Radopholus similis populations from Uganda, 8 weeks after inoculation with 1000 nematodes.
Percentage root necrosis ± standard error Genotype Namulonge Mbarara Mukono Grande Naine 19.9 ± 3 a 35.7 ± 7 a 21.5 ± 4 a Pisang Jari Buaya 10.0 ± 2 ab 16.3 ± 4 bc 14.2 ± 3 ab Pisang Ceylan 8.2 ± 2 ab 12.9 ± 3 bc 17.7 ± 6 ab Calcutta 4 14.2 ± 4 ab 26.9 ± 5 ab 13.2 ± 3 ab Yangambi km5 2.1 ± 1 b 9.0 ± 3 c 4.3 ± 1 b FHIA-25 14.3 ± 3 ab 22.4 ± 5 abc 12.5 ± 4 ab FHIA-23 3.4 ± 2 b 10.7 ± 4 bc 4.0 ± 2b FHIA-18 8.9 ± 4 ab 13.8 ± 2 bc 21.0 ± 6 a PITA-16 13.3 ± 4 ab 9.0 ± 2 c 7.3 ± 1 ab
Means in the same column followed by the same letter do not differ significantly according to the Tukey test (P≤0.05).
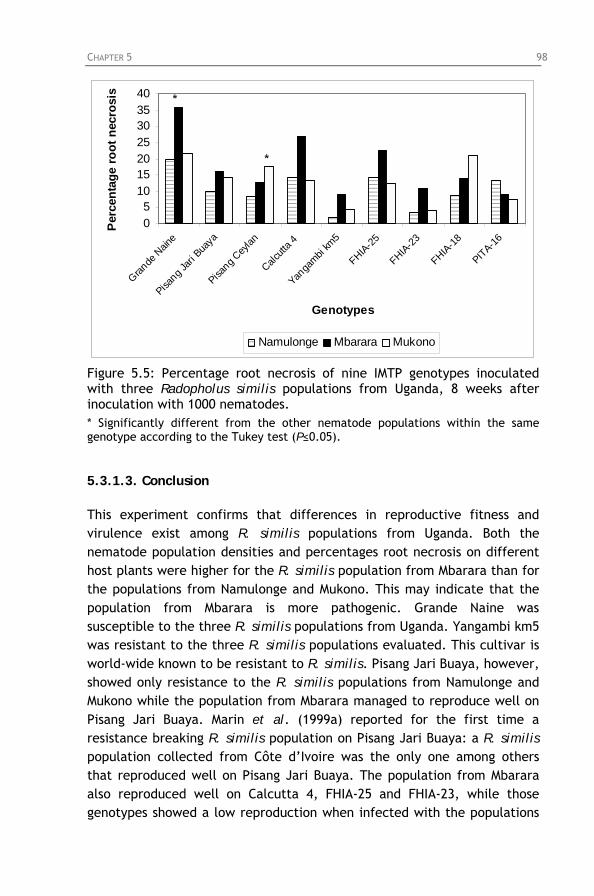
CHAPTER 5 98
05
10152025303540
Grande
Nain
e
Pisang J
ari B
uaya
Pisang C
eylan
Calcutt
a 4
Yanga
mbi km
5
FHIA-25
FHIA-23
FHIA-18
PITA-16
Genotypes
Per
cent
age
root
nec
rosi
s
Namulonge Mbarara Mukono
*
*
Figure 5.5: Percentage root necrosis of nine IMTP genotypes inoculated with three Radopholus similis populations from Uganda, 8 weeks after inoculation with 1000 nematodes. * Significantly different from the other nematode populations within the same genotype according to the Tukey test (P≤0.05). 5.3.1.3. Conclusion This experiment confirms that differences in reproductive fitness and virulence exist among R. similis populations from Uganda. Both the nematode population densities and percentages root necrosis on different host plants were higher for the R. similis population from Mbarara than for the populations from Namulonge and Mukono. This may indicate that the population from Mbarara is more pathogenic. Grande Naine was susceptible to the three R. similis populations from Uganda. Yangambi km5 was resistant to the three R. similis populations evaluated. This cultivar is world-wide known to be resistant to R. similis. Pisang Jari Buaya, however, showed only resistance to the R. similis populations from Namulonge and Mukono while the population from Mbarara managed to reproduce well on Pisang Jari Buaya. Marin et al. (1999a) reported for the first time a resistance breaking R. similis population on Pisang Jari Buaya: a R. similis population collected from Côte d’Ivoire was the only one among others that reproduced well on Pisang Jari Buaya. The population from Mbarara also reproduced well on Calcutta 4, FHIA-25 and FHIA-23, while those genotypes showed a low reproduction when infected with the populations
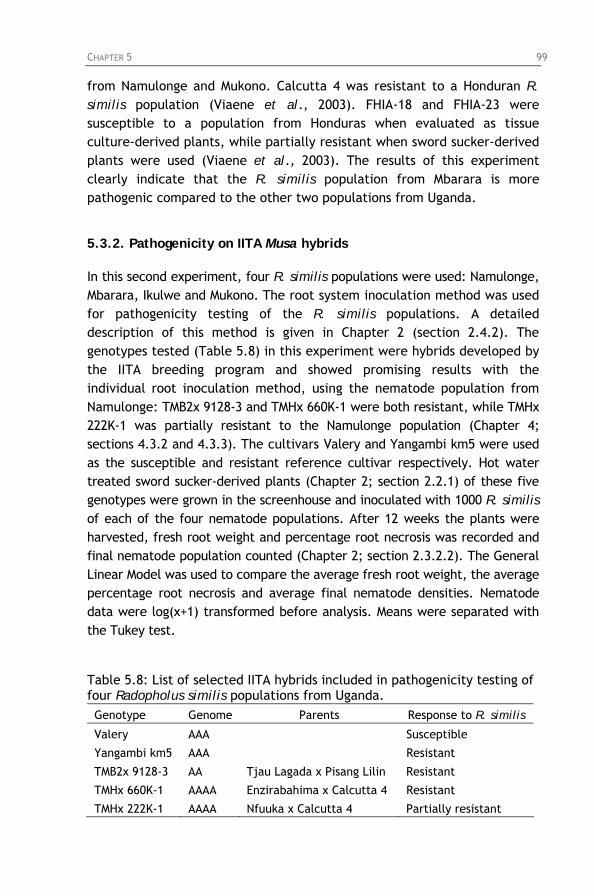
CHAPTER 5 99
from Namulonge and Mukono. Calcutta 4 was resistant to a Honduran R. similis population (Viaene et al., 2003). FHIA-18 and FHIA-23 were susceptible to a population from Honduras when evaluated as tissue culture-derived plants, while partially resistant when sword sucker-derived plants were used (Viaene et al., 2003). The results of this experiment clearly indicate that the R. similis population from Mbarara is more pathogenic compared to the other two populations from Uganda. 5.3.2. Pathogenicity on IITA Musa hybrids In this second experiment, four R. similis populations were used: Namulonge, Mbarara, Ikulwe and Mukono. The root system inoculation method was used for pathogenicity testing of the R. similis populations. A detailed description of this method is given in Chapter 2 (section 2.4.2). The genotypes tested (Table 5.8) in this experiment were hybrids developed by the IITA breeding program and showed promising results with the individual root inoculation method, using the nematode population from Namulonge: TMB2x 9128-3 and TMHx 660K-1 were both resistant, while TMHx 222K-1 was partially resistant to the Namulonge population (Chapter 4; sections 4.3.2 and 4.3.3). The cultivars Valery and Yangambi km5 were used as the susceptible and resistant reference cultivar respectively. Hot water treated sword sucker-derived plants (Chapter 2; section 2.2.1) of these five genotypes were grown in the screenhouse and inoculated with 1000 R. similis of each of the four nematode populations. After 12 weeks the plants were harvested, fresh root weight and percentage root necrosis was recorded and final nematode population counted (Chapter 2; section 2.3.2.2). The General Linear Model was used to compare the average fresh root weight, the average percentage root necrosis and average final nematode densities. Nematode data were log(x+1) transformed before analysis. Means were separated with the Tukey test. Table 5.8: List of selected IITA hybrids included in pathogenicity testing of four Radopholus similis populations from Uganda. Genotype Genome Parents Response to R. similis
Valery AAA Susceptible
Yangambi km5 AAA Resistant
TMB2x 9128-3 AA Tjau Lagada x Pisang Lilin Resistant
TMHx 660K-1 AAAA Enzirabahima x Calcutta 4 Resistant
TMHx 222K-1 AAAA Nfuuka x Calcutta 4 Partially resistant
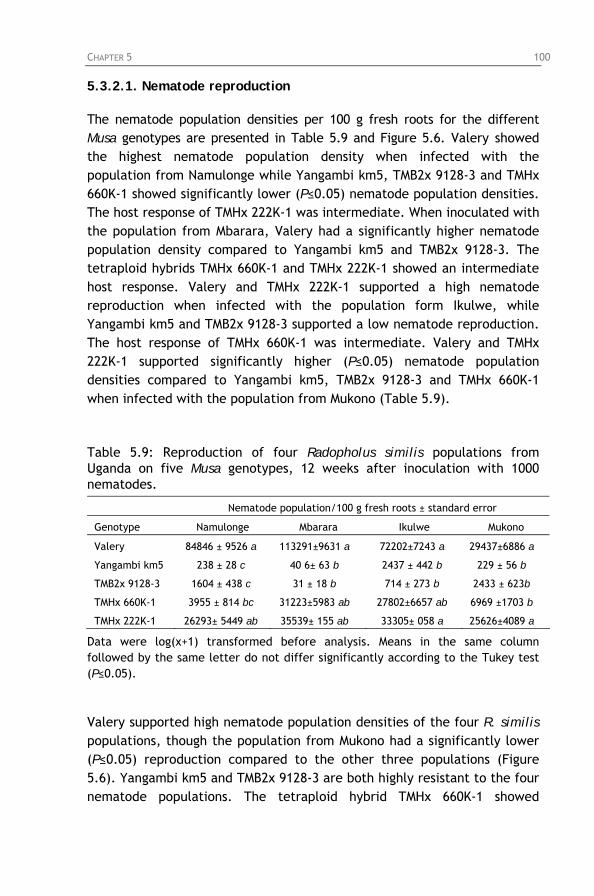
CHAPTER 5 100
5.3.2.1. Nematode reproduction The nematode population densities per 100 g fresh roots for the different Musa genotypes are presented in Table 5.9 and Figure 5.6. Valery showed the highest nematode population density when infected with the population from Namulonge while Yangambi km5, TMB2x 9128-3 and TMHx 660K-1 showed significantly lower (P≤0.05) nematode population densities. The host response of TMHx 222K-1 was intermediate. When inoculated with the population from Mbarara, Valery had a significantly higher nematode population density compared to Yangambi km5 and TMB2x 9128-3. The tetraploid hybrids TMHx 660K-1 and TMHx 222K-1 showed an intermediate host response. Valery and TMHx 222K-1 supported a high nematode reproduction when infected with the population form Ikulwe, while Yangambi km5 and TMB2x 9128-3 supported a low nematode reproduction. The host response of TMHx 660K-1 was intermediate. Valery and TMHx 222K-1 supported significantly higher (P≤0.05) nematode population densities compared to Yangambi km5, TMB2x 9128-3 and TMHx 660K-1 when infected with the population from Mukono (Table 5.9). Table 5.9: Reproduction of four Radopholus similis populations from Uganda on five Musa genotypes, 12 weeks after inoculation with 1000 nematodes.
Nematode population/100 g fresh roots ± standard error
Genotype Namulonge Mbarara Ikulwe Mukono
Valery 84846 ± 9526 a 113291±9631 a 72202±7243 a 29437±6886 a
Yangambi km5 238 ± 28 c 40 6± 63 b 2437 ± 442 b 229 ± 56 b
TMB2x 9128-3 1604 ± 438 c 31 ± 18 b 714 ± 273 b 2433 ± 623b
TMHx 660K-1 3955 ± 814 bc 31223±5983 ab 27802±6657 ab 6969 ±1703 b
TMHx 222K-1 26293± 5449 ab 35539± 155 ab 33305± 058 a 25626±4089 a
Data were log(x+1) transformed before analysis. Means in the same column followed by the same letter do not differ significantly according to the Tukey test (P≤0.05). Valery supported high nematode population densities of the four R. similis populations, though the population from Mukono had a significantly lower (P≤0.05) reproduction compared to the other three populations (Figure 5.6). Yangambi km5 and TMB2x 9128-3 are both highly resistant to the four nematode populations. The tetraploid hybrid TMHx 660K-1 showed
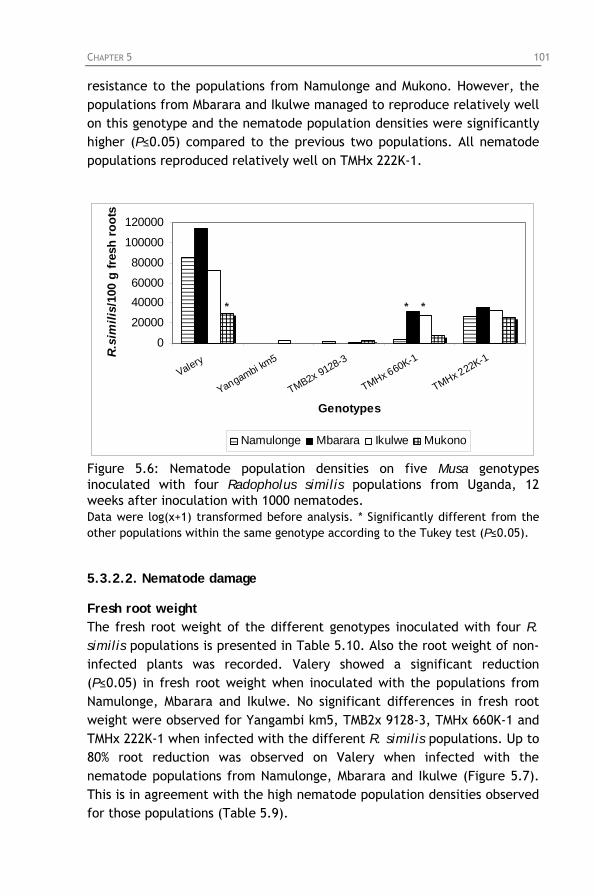
CHAPTER 5 101
resistance to the populations from Namulonge and Mukono. However, the populations from Mbarara and Ikulwe managed to reproduce relatively well on this genotype and the nematode population densities were significantly higher (P≤0.05) compared to the previous two populations. All nematode populations reproduced relatively well on TMHx 222K-1.
0
20000
4000060000
80000
100000
120000
Valery
Yangambi km5
TMB2x 9128-3
TMHx 660K-1
TMHx 222K-1
Genotypes
R.s
imili
s/10
0 g
fres
h ro
ots
Namulonge Mbarara Ikulwe Mukono
* * *
Figure 5.6: Nematode population densities on five Musa genotypes inoculated with four Radopholus similis populations from Uganda, 12 weeks after inoculation with 1000 nematodes. Data were log(x+1) transformed before analysis. * Significantly different from the other populations within the same genotype according to the Tukey test (P≤0.05). 5.3.2.2. Nematode damage Fresh root weight The fresh root weight of the different genotypes inoculated with four R. similis populations is presented in Table 5.10. Also the root weight of non-infected plants was recorded. Valery showed a significant reduction (P≤0.05) in fresh root weight when inoculated with the populations from Namulonge, Mbarara and Ikulwe. No significant differences in fresh root weight were observed for Yangambi km5, TMB2x 9128-3, TMHx 660K-1 and TMHx 222K-1 when infected with the different R. similis populations. Up to 80% root reduction was observed on Valery when infected with the nematode populations from Namulonge, Mbarara and Ikulwe (Figure 5.7). This is in agreement with the high nematode population densities observed for those populations (Table 5.9).
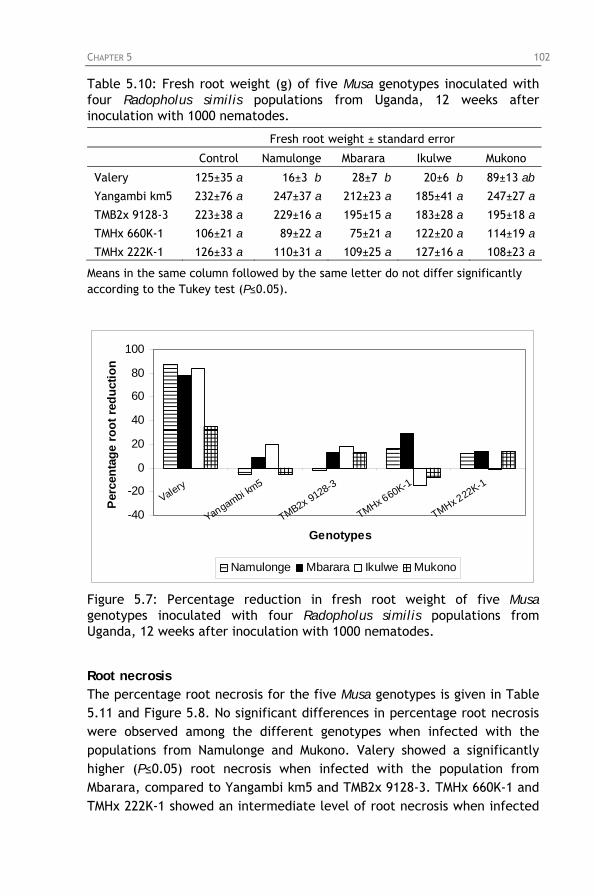
CHAPTER 5 102
Table 5.10: Fresh root weight (g) of five Musa genotypes inoculated with four Radopholus similis populations from Uganda, 12 weeks after inoculation with 1000 nematodes.
Fresh root weight ± standard error
Control Namulonge Mbarara Ikulwe Mukono
Valery 125±35 a 16±3 b 28±7 b 20±6 b 89±13 ab
Yangambi km5 232±76 a 247±37 a 212±23 a 185±41 a 247±27 a
TMB2x 9128-3 223±38 a 229±16 a 195±15 a 183±28 a 195±18 a
TMHx 660K-1 106±21 a 89±22 a 75±21 a 122±20 a 114±19 a
TMHx 222K-1 126±33 a 110±31 a 109±25 a 127±16 a 108±23 a
Means in the same column followed by the same letter do not differ significantly according to the Tukey test (P≤0.05).
-40
-20
0
20
40
60
80
100
Valery
Yangambi km5
TMB2x 9128-3
TMHx 660K-1
TMHx 222K-1
Genotypes
Per
cent
age
root
redu
ctio
n
Namulonge Mbarara Ikulwe Mukono
Figure 5.7: Percentage reduction in fresh root weight of five Musa genotypes inoculated with four Radopholus similis populations from Uganda, 12 weeks after inoculation with 1000 nematodes. Root necrosis The percentage root necrosis for the five Musa genotypes is given in Table 5.11 and Figure 5.8. No significant differences in percentage root necrosis were observed among the different genotypes when infected with the populations from Namulonge and Mukono. Valery showed a significantly higher (P≤0.05) root necrosis when infected with the population from Mbarara, compared to Yangambi km5 and TMB2x 9128-3. TMHx 660K-1 and TMHx 222K-1 showed an intermediate level of root necrosis when infected
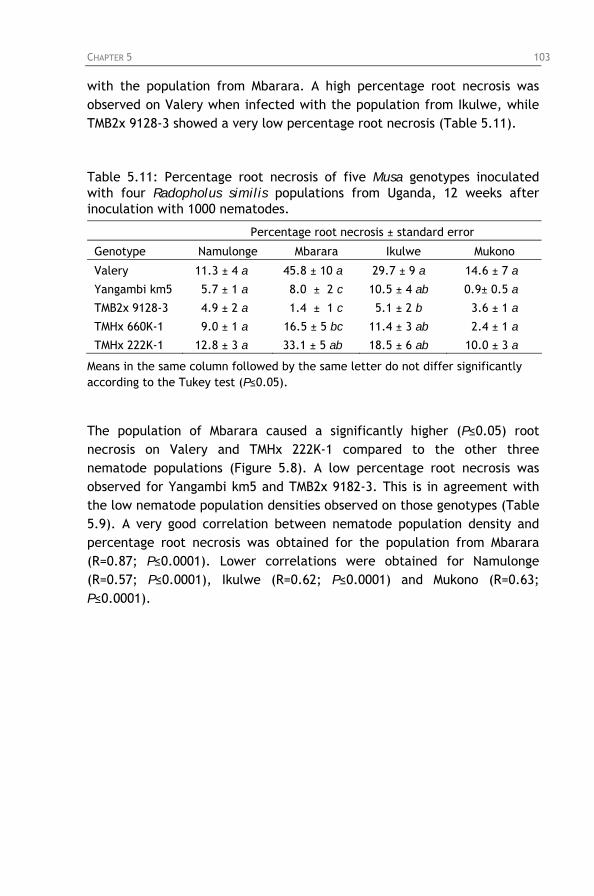
CHAPTER 5 103
with the population from Mbarara. A high percentage root necrosis was observed on Valery when infected with the population from Ikulwe, while TMB2x 9128-3 showed a very low percentage root necrosis (Table 5.11). Table 5.11: Percentage root necrosis of five Musa genotypes inoculated with four Radopholus similis populations from Uganda, 12 weeks after inoculation with 1000 nematodes.
Percentage root necrosis ± standard error
Genotype Namulonge Mbarara Ikulwe Mukono
Valery 11.3 ± 4 a 45.8 ± 10 a 29.7 ± 9 a 14.6 ± 7 a
Yangambi km5 5.7 ± 1 a 8.0 ± 2 c 10.5 ± 4 ab 0.9± 0.5 a
TMB2x 9128-3 4.9 ± 2 a 1.4 ± 1 c 5.1 ± 2 b 3.6 ± 1 a
TMHx 660K-1 9.0 ± 1 a 16.5 ± 5 bc 11.4 ± 3 ab 2.4 ± 1 a
TMHx 222K-1 12.8 ± 3 a 33.1 ± 5 ab 18.5 ± 6 ab 10.0 ± 3 a
Means in the same column followed by the same letter do not differ significantly according to the Tukey test (P≤0.05). The population of Mbarara caused a significantly higher (P≤0.05) root necrosis on Valery and TMHx 222K-1 compared to the other three nematode populations (Figure 5.8). A low percentage root necrosis was observed for Yangambi km5 and TMB2x 9182-3. This is in agreement with the low nematode population densities observed on those genotypes (Table 5.9). A very good correlation between nematode population density and percentage root necrosis was obtained for the population from Mbarara (R=0.87; P≤0.0001). Lower correlations were obtained for Namulonge (R=0.57; P≤0.0001), Ikulwe (R=0.62; P≤0.0001) and Mukono (R=0.63; P≤0.0001).
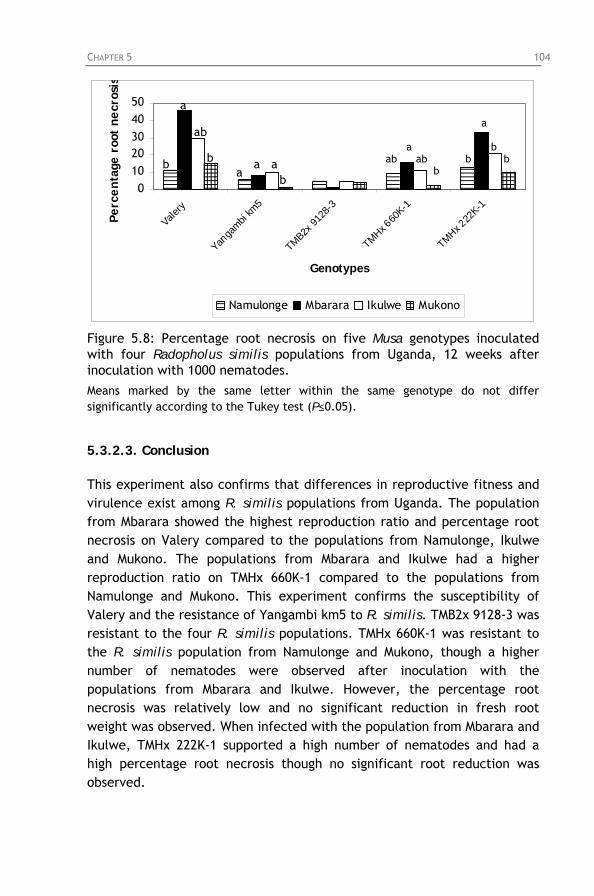
CHAPTER 5 104
01020304050
Valery
Yanga
mbi km
5
TMB2x 91
28-3
TMHx 660
K-1
TMHx 222
K-1
Genotypes
Perc
enta
ge r
oot
necr
osis
Namulonge Mbarara Ikulwe Mukono
b b
a
ab
aa
ab
a
ab ab b
a b
b b
Figure 5.8: Percentage root necrosis on five Musa genotypes inoculated with four Radopholus similis populations from Uganda, 12 weeks after inoculation with 1000 nematodes. Means marked by the same letter within the same genotype do not differ significantly according to the Tukey test (P≤0.05). 5.3.2.3. Conclusion This experiment also confirms that differences in reproductive fitness and virulence exist among R. similis populations from Uganda. The population from Mbarara showed the highest reproduction ratio and percentage root necrosis on Valery compared to the populations from Namulonge, Ikulwe and Mukono. The populations from Mbarara and Ikulwe had a higher reproduction ratio on TMHx 660K-1 compared to the populations from Namulonge and Mukono. This experiment confirms the susceptibility of Valery and the resistance of Yangambi km5 to R. similis. TMB2x 9128-3 was resistant to the four R. similis populations. TMHx 660K-1 was resistant to the R. similis population from Namulonge and Mukono, though a higher number of nematodes were observed after inoculation with the populations from Mbarara and Ikulwe. However, the percentage root necrosis was relatively low and no significant reduction in fresh root weight was observed. When infected with the population from Mbarara and Ikulwe, TMHx 222K-1 supported a high number of nematodes and had a high percentage root necrosis though no significant root reduction was observed.
CHAPTER 5 105
5.4. General discussion and conclusion Differences in pathogenicity were observed among the four R. similis populations from Uganda. The population from Mbarara had a higher reproductive fitness on carrot discs, induced a higher percentage root necrosis and had higher nematode population densities on plants compared to the populations from Namulonge, Ikulwe and Mukono. This may indicate that the population from Mbarara has a higher pathogenic potential (reproductive and damage potential) than the other three populations. Percentage root necrosis was a good indicator of the reproductive fitness of the nematode populations on susceptible genotypes. Also reduction in fresh root weight was highest for the population from Mbarara. Fallas et al. (1995), Hahn et al., (1996b) and Sarah et al. (1993) reported that fresh root weight was a good indicator of reproductive fitness. However, both reproductive and damage potential (percentage root necrosis and fresh root weight) are needed in pathogenicity evaluation, as there are some situations reported where a high reproductive fitness does not reflect high damage to the root system (Hahn et al., 1996b). Sarah and Fallas (1996) reported that R. similis populations from higher altitudes are less pathogenic than population from lower altitudes. Our study, however, showed that the R. similis population from higher altitudes (Mbarara) is more pathogenic. However, the difference in altitude between Mbarara and the other three locations is quite small (around 250 m). The fact that the R. similis population from Mbarara is more pathogenic than the other populations may have serious implications for farmers as Mbarara is the main banana growing area in Uganda. Gold et al. (2000) expressed concern that the cooking bananas grown in southwestern Uganda will undergo the same cycle of decline experienced in Central Uganda as yield decline in certain fields has already been observed. Recent observations in farmers’ fields in Mbarara show that R. similis infestation is localised at the moment and that those farms are heavily infested with high toppling incidence. It might be that by shifting the cultivation of the crop from central to southwestern Uganda, infected planting materials were transferred to establish the new plantations. Observations in farmers’ fields in Luwero, previously the main banana growing area in central Uganda, revealed that newly established farms were free from R. similis. The few remaining old banana plantations were infested with R. similis. A R. similis population from Luwero is now also being maintained on carrot disc cultures and will be evaluated for its reproductive fitness and virulence. This might give indications whether the populations from
CHAPTER 5 106
Mbarara and Luwero are similar and as such could prove the movement of R. similis infected Musa germplasm from Luwero to Mbarara. In addition, DNA fingerprinting would give information on the genetic similarity of both R. similis populations. Tarté et al. (1981) studied differences in morphology relating to pathogenicity. They reported that pointed-tailed females were more frequently observed in less pathogenic R. similis populations while rounded-tailed females were more often observed in more pathogenic populations. A relationship between pathogenicity and female tail characteristics has been established for Pratylenchus penetrans (Townshend et al., 1978). However, we did not find any differences in tail morphology among the four populations of R. similis studied. Also Marin et al. (1999b) did not find any differences in morphometrics between eight different R. similis populations collected from Central America, the Caribbean, Florida and Côte d’Ivoire. Moens (2004) observed differences in reproductive fitness among eleven R. similis populations from Costa Rica. However, the reproductive fitness in pot experiments differed from those in the in vitro carrot experiments: e.g. Corbana and Anabel showed the highest reproduction in in vitro experiments, but showed the lowest final nematode populations in plants (Moens, 2004). Pinochet (1979) studied four different R. similis populations (Honduras, Costa Rica and Armuelles and Changuinola in Panama) on Valery. All four populations reproduced well on Valery, though the populations from Costa Rica and Panama were more pathogenic than the population from Honduras. The four R. similis populations from Uganda reproduced well on Valery, with the population of Mbarara being more pathogenic. Pinochet and Rowe (1978) have previously reported Valery as susceptible to R. similis, while Pisang Jari Buaya was reported as being resistant. This experiment confirms the susceptible status of Valery. However, Pisang Jari Buaya was only resistant to the R. similis populations from Namulonge and Mukono, while the population from Mbarara managed to reproduce well on this cultivar. The fact that the population from Mbarara reproduces well on Pisang Jari Buaya might indicate that a resistance breaking pathotype of R. similis was collected. This might have implications for the Musa breeding program, as preferably only genotypes with resistance to all pathotypes should be included in a breeding program. Yangambi km5 was resistant to the four R. similis populations. This difference in host response towards the different populations between
CHAPTER 5 107
Pisang Jari Buaya and Yangambi km5 might indicate that a different mechanism of resistance exist in those cultivars. Fogain and Gowen (1996) reported that resistance in Yangambi km5 might be due to phenolic compounds while lignin might be responsible for the resistance in Pisang Jari Buaya. However, this needs to be confirmed. The IITA hybrid TMB2x 9128-3 was resistant to the four R. similis populations and is one of the most important breeding materials at IITA (Chapter 4). It is recommended to use the R. similis population from Mbarara in routine screening for identification of resistance in Musa germplasm.

CHAPTER 5 108
CHAPTER 6 109
Chapter 6: Genetic analysis of segregation for resistance to Radopholus similis in a diploid
banana hybrid population 6.1. Background and objectives The breeding process to develop resistant cultivars can be accelerated if the presence of the desired plant characteristic, such as resistance to nematodes, can be demonstrated at an early stage. This is possible when a link can be found between the presence of certain DNA sequences, the so-called molecular markers, and the desired plant characteristic. These DNA bands can be identified in segregating populations, i.e. when segregation has occurred among the progeny derived from a cross between two unlike parents, such as a resistant and a susceptible parent (Moens et al., 2002). DNA markers are valuable in plant breeding because they can be used to monitor the inheritance of important genes. Through the use of these DNA markers, it is rapidly becoming possible to select resistant lines based on genotype rather than phenotype. Because genotype is unaffected by environment, this approach to selection overcomes problems due to variation in environmental conditions. Few samples need to be assayed per line instead of the multiple replicates typically required for screenhouse experiments. Finally, the results of DNA analysis can be completed in a few days, speeding up the overall process (Young and Mudge, 2002). One major advantage of using marker assisted selection (MAS) to select for resistance to biotic constraints is the possibility to carry out selection in the absence of the pathogen (Kling et al., 1999). Pathogen recognition by the host is mediated by single resistant genes (R genes) in the host and single genes in the pathogen called avirulence genes. Recognition initiates a cascade of defence responses, often including a hypersensitivity response consisting of localised cell necrosis at the infection site (Williamson, 1999). Three nematode resistance genes have been cloned. The first gene to be cloned was Hs1pro-1, a gene from a wild relative of sugarbeet with resistance to Heterodera schachtii, the beet cyst nematode. The Mi gene of tomato confers resistance to several root-knot nematode species, M. incognita, M. javanica and M. arenaria (Trudgill, 1991). This gene also confers resistance to the potato aphid. This
CHAPTER 6 110
is the first report of a resistance gene that confers specific resistance to pests in two different phyla (Williamson, 1999). Gpa2 confers resistance to some isolates of the potato cyst nematode Globodera pallida (Williamson, 1999). Genes for parasitism have been defined as genes that enable nematodes to overcome the effect of genes for resistance. Parasites can develop freely on a susceptible host. When a gene for resistance is introduced into the genome of a susceptible host, the host becomes resistant and impedes development of the parasite. Subsequently the parasite may undergo genetic changes which enable it to reproduce on both the susceptible and resistant host (Triantaphyllou, 1987). Utilising only resistant cultivars puts selection pressure on the target nematode from which a new pathogenic race can develop, presumably from a few individuals that mature and reproduce on the resistant cultivar (Fassuliotis, 1987). Most genetic studies are done on root-knot and cyst nematodes, e.g. Meloidogyne, Heterodera and Globodera spp., and resistance is often conferred by major dominant genes. Co-evolution of the genomes of host and parasite, leads to complementarities between genes for resistance and genes for parasitism: the so-called gene-for-gene relationship (Triantaphyllou, 1987; Trudgill, 1991). The mode of inheritance can be used to distinguish three types of resistance: monogenic, oligogenic and polygenic, in which resistance is controlled by one, a few or many genes, respectively (Cook and Evans, 1987; Roberts, 2002). In most cases, resistance to plant-parasitic nematodes is oligogenically inherited (Fassuliotis, 1987). Van der Planck (1963) described two main types of resistance: horizontal resistance, effective against all genetic variants of a particular parasite, and vertical resistance, effective against certain variants only. Vertical resistance is often conditioned by a single gene, while horizontal resistance is usually oligo- or polygenic (Cook and Evans, 1987). Van der Planck (1963) reported that horizontal resistance is likely to be more durable than vertical resistance. However, Roberts (1992) concluded on the basis of reviewing existing host plant resistance programs, that durability of resistance to plant-parasitic nematodes cannot be concluded based on the genetic control of host plant resistance. An efficient way to study inheritance of resistance is to test progeny of appropriate crosses against nematode populations.
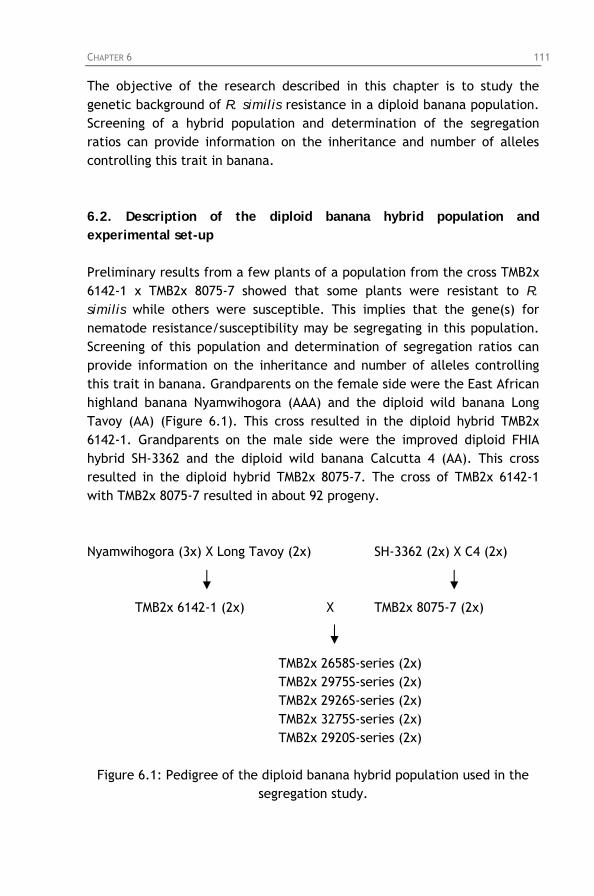
CHAPTER 6 111
The objective of the research described in this chapter is to study the genetic background of R. similis resistance in a diploid banana population. Screening of a hybrid population and determination of the segregation ratios can provide information on the inheritance and number of alleles controlling this trait in banana. 6.2. Description of the diploid banana hybrid population and experimental set-up Preliminary results from a few plants of a population from the cross TMB2x 6142-1 x TMB2x 8075-7 showed that some plants were resistant to R. similis while others were susceptible. This implies that the gene(s) for nematode resistance/susceptibility may be segregating in this population. Screening of this population and determination of segregation ratios can provide information on the inheritance and number of alleles controlling this trait in banana. Grandparents on the female side were the East African highland banana Nyamwihogora (AAA) and the diploid wild banana Long Tavoy (AA) (Figure 6.1). This cross resulted in the diploid hybrid TMB2x 6142-1. Grandparents on the male side were the improved diploid FHIA hybrid SH-3362 and the diploid wild banana Calcutta 4 (AA). This cross resulted in the diploid hybrid TMB2x 8075-7. The cross of TMB2x 6142-1 with TMB2x 8075-7 resulted in about 92 progeny. Nyamwihogora (3x) X Long Tavoy (2x) SH-3362 (2x) X C4 (2x)
TMB2x 6142-1 (2x) X TMB2x 8075-7 (2x) TMB2x 2658S-series (2x) TMB2x 2975S-series (2x) TMB2x 2926S-series (2x)
TMB2x 3275S-series (2x) TMB2x 2920S-series (2x)
Figure 6.1: Pedigree of the diploid banana hybrid population used in the segregation study.
CHAPTER 6 112
The individual root inoculation method was used for screening the parents, grandparents and progeny of the diploid banana hybrid population for resistance to R. similis. A detailed description of this method is given in Chapter 3. Hot water treated sword sucker-derived plants (Chapter 2; section 2.2.1) were used in all experiments as planting material. Nematode inoculum was obtained from cultures maintained on carrot discs (Chapter 2; section 2.3). The R. similis population from Namulonge was used in all the experiments. The experiments were carried out in batches, each comprising the two reference cultivars (Yangambi km5 and Valery) and six or seven genotypes with unknown host response to R. similis. In total 81 hybrids were evaluated for resistance to R. similis. The mean of the final nematode population density of each hybrid was compared with that of Yangambi km5 (resistant) and Valery (susceptible), by the use of the Dunnett test (Chapter 2; section 2.5.2). Genotypes were classified as resistant, partially resistant or susceptible. Data on the frequency of resistance, partially resistance and susceptibility to R. similis were subjected to chi-square analysis (Gomez and Gomez, 1984; Mead et al., 1993). 6.3. Results 6.3.1. Screening of parents and grandparents of a diploid banana hybrid
population for resistance to Radopholus similis The host response of the parents and grandparents of the hybrid population is summarised in Table 6.1. Pisang Jari Buaya was included as an extra control. Valery supported a significantly higher (P≤0.001) reproduction ratio compared to Yangambi km5. Long Tavoy and TMB2x 6142-1 supported a reproduction ratio similar to the one of Valery and significantly higher (P≤0.001) than Yangambi km5. Pisang Jari Buaya, SH-3362, Calcutta 4 and TMB2x 8075-7 supported a significantly lower (P≤0.001) reproduction ratio compared to Valery, but not significantly different from Yangambi km5. A low correlation (R=0.54) was obtained between final nematode population density and percentage root necrosis.
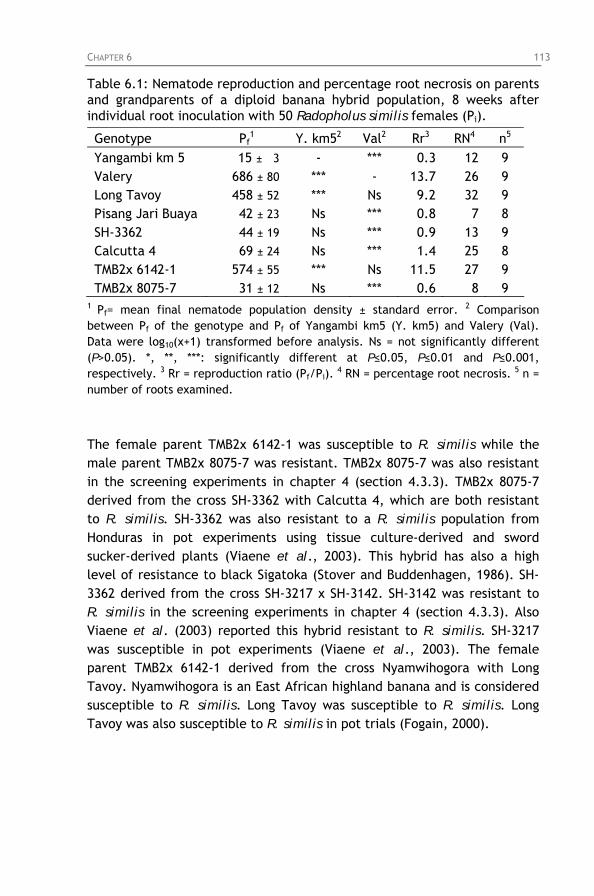
CHAPTER 6 113
Table 6.1: Nematode reproduction and percentage root necrosis on parents and grandparents of a diploid banana hybrid population, 8 weeks after individual root inoculation with 50 Radopholus similis females (Pi).
Genotype Pf1 Y. km52 Val2 Rr3 RN4 n5
Yangambi km 5 15 ± 3 - *** 0.3 12 9 Valery 686 ± 80 *** - 13.7 26 9 Long Tavoy 458 ± 52 *** Ns 9.2 32 9 Pisang Jari Buaya 42 ± 23 Ns *** 0.8 7 8 SH-3362 44 ± 19 Ns *** 0.9 13 9 Calcutta 4 69 ± 24 Ns *** 1.4 25 8 TMB2x 6142-1 574 ± 55 *** Ns 11.5 27 9 TMB2x 8075-7 31 ± 12 Ns *** 0.6 8 9
1 Pf= mean final nematode population density ± standard error. 2 Comparison between Pf of the genotype and Pf of Yangambi km5 (Y. km5) and Valery (Val). Data were log10(x+1) transformed before analysis. Ns = not significantly different (P>0.05). *, **, ***: significantly different at P≤0.05, P≤0.01 and P≤0.001, respectively. 3 Rr = reproduction ratio (Pf/Pi).
4 RN = percentage root necrosis. 5 n = number of roots examined.
The female parent TMB2x 6142-1 was susceptible to R. similis while the male parent TMB2x 8075-7 was resistant. TMB2x 8075-7 was also resistant in the screening experiments in chapter 4 (section 4.3.3). TMB2x 8075-7 derived from the cross SH-3362 with Calcutta 4, which are both resistant to R. similis. SH-3362 was also resistant to a R. similis population from Honduras in pot experiments using tissue culture-derived and sword sucker-derived plants (Viaene et al., 2003). This hybrid has also a high level of resistance to black Sigatoka (Stover and Buddenhagen, 1986). SH-3362 derived from the cross SH-3217 x SH-3142. SH-3142 was resistant to R. similis in the screening experiments in chapter 4 (section 4.3.3). Also Viaene et al. (2003) reported this hybrid resistant to R. similis. SH-3217 was susceptible in pot experiments (Viaene et al., 2003). The female parent TMB2x 6142-1 derived from the cross Nyamwihogora with Long Tavoy. Nyamwihogora is an East African highland banana and is considered susceptible to R. similis. Long Tavoy was susceptible to R. similis. Long Tavoy was also susceptible to R. similis in pot trials (Fogain, 2000).
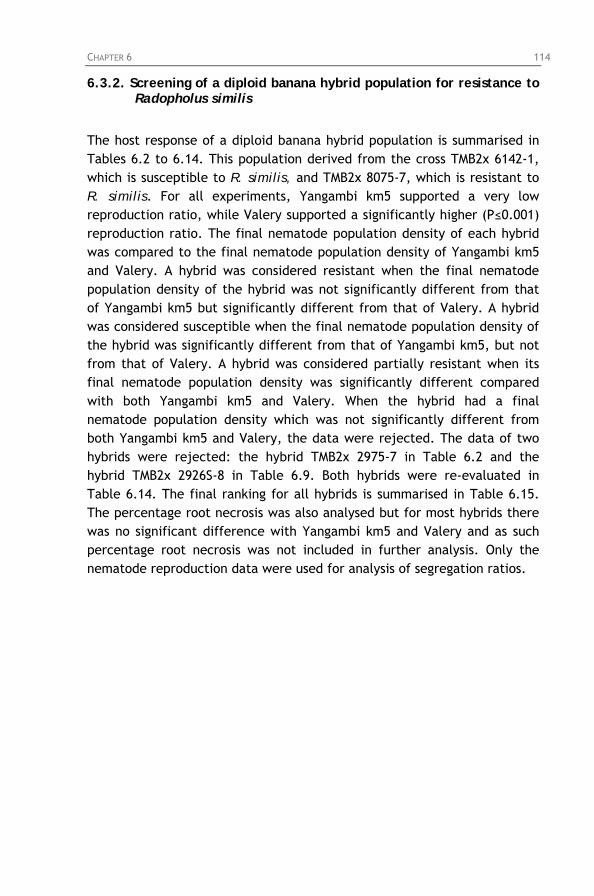
CHAPTER 6 114
6.3.2. Screening of a diploid banana hybrid population for resistance to Radopholus similis
The host response of a diploid banana hybrid population is summarised in Tables 6.2 to 6.14. This population derived from the cross TMB2x 6142-1, which is susceptible to R. similis, and TMB2x 8075-7, which is resistant to R. similis. For all experiments, Yangambi km5 supported a very low reproduction ratio, while Valery supported a significantly higher (P≤0.001) reproduction ratio. The final nematode population density of each hybrid was compared to the final nematode population density of Yangambi km5 and Valery. A hybrid was considered resistant when the final nematode population density of the hybrid was not significantly different from that of Yangambi km5 but significantly different from that of Valery. A hybrid was considered susceptible when the final nematode population density of the hybrid was significantly different from that of Yangambi km5, but not from that of Valery. A hybrid was considered partially resistant when its final nematode population density was significantly different compared with both Yangambi km5 and Valery. When the hybrid had a final nematode population density which was not significantly different from both Yangambi km5 and Valery, the data were rejected. The data of two hybrids were rejected: the hybrid TMB2x 2975-7 in Table 6.2 and the hybrid TMB2x 2926S-8 in Table 6.9. Both hybrids were re-evaluated in Table 6.14. The final ranking for all hybrids is summarised in Table 6.15. The percentage root necrosis was also analysed but for most hybrids there was no significant difference with Yangambi km5 and Valery and as such percentage root necrosis was not included in further analysis. Only the nematode reproduction data were used for analysis of segregation ratios.
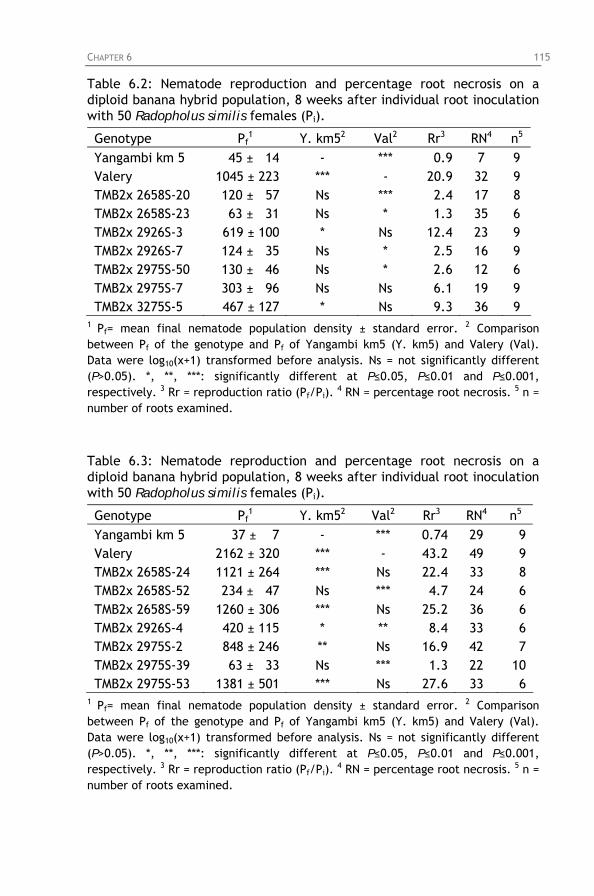
CHAPTER 6 115
Table 6.2: Nematode reproduction and percentage root necrosis on a diploid banana hybrid population, 8 weeks after individual root inoculation with 50 Radopholus similis females (Pi).
Genotype Pf1 Y. km52 Val2 Rr3 RN4 n5
Yangambi km 5 45 ± 14 - *** 0.9 7 9 Valery 1045 ± 223 *** - 20.9 32 9 TMB2x 2658S-20 120 ± 57 Ns *** 2.4 17 8 TMB2x 2658S-23 63 ± 31 Ns * 1.3 35 6 TMB2x 2926S-3 619 ± 100 * Ns 12.4 23 9 TMB2x 2926S-7 124 ± 35 Ns * 2.5 16 9 TMB2x 2975S-50 130 ± 46 Ns * 2.6 12 6 TMB2x 2975S-7 303 ± 96 Ns Ns 6.1 19 9 TMB2x 3275S-5 467 ± 127 * Ns 9.3 36 9
1 Pf= mean final nematode population density ± standard error. 2 Comparison between Pf of the genotype and Pf of Yangambi km5 (Y. km5) and Valery (Val). Data were log10(x+1) transformed before analysis. Ns = not significantly different (P>0.05). *, **, ***: significantly different at P≤0.05, P≤0.01 and P≤0.001, respectively. 3 Rr = reproduction ratio (Pf/Pi).
4 RN = percentage root necrosis. 5 n = number of roots examined.
Table 6.3: Nematode reproduction and percentage root necrosis on a diploid banana hybrid population, 8 weeks after individual root inoculation with 50 Radopholus similis females (Pi).
Genotype Pf1 Y. km52 Val2 Rr3 RN4 n5
Yangambi km 5 37 ± 7 - *** 0.74 29 9 Valery 2162 ± 320 *** - 43.2 49 9 TMB2x 2658S-24 1121 ± 264 *** Ns 22.4 33 8 TMB2x 2658S-52 234 ± 47 Ns *** 4.7 24 6 TMB2x 2658S-59 1260 ± 306 *** Ns 25.2 36 6 TMB2x 2926S-4 420 ± 115 * ** 8.4 33 6 TMB2x 2975S-2 848 ± 246 ** Ns 16.9 42 7 TMB2x 2975S-39 63 ± 33 Ns *** 1.3 22 10 TMB2x 2975S-53 1381 ± 501 *** Ns 27.6 33 6
1 Pf= mean final nematode population density ± standard error. 2 Comparison between Pf of the genotype and Pf of Yangambi km5 (Y. km5) and Valery (Val). Data were log10(x+1) transformed before analysis. Ns = not significantly different (P>0.05). *, **, ***: significantly different at P≤0.05, P≤0.01 and P≤0.001, respectively. 3 Rr = reproduction ratio (Pf/Pi).
4 RN = percentage root necrosis. 5 n = number of roots examined.
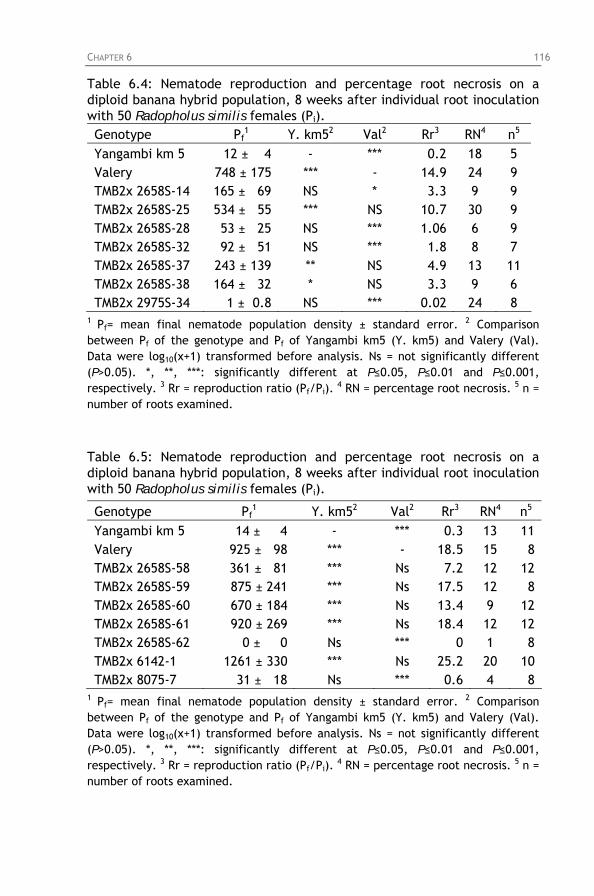
CHAPTER 6 116
Table 6.4: Nematode reproduction and percentage root necrosis on a diploid banana hybrid population, 8 weeks after individual root inoculation with 50 Radopholus similis females (Pi). Genotype Pf
1 Y. km52 Val2 Rr3 RN4 n5
Yangambi km 5 12 ± 4 - *** 0.2 18 5 Valery 748 ± 175 *** - 14.9 24 9 TMB2x 2658S-14 165 ± 69 NS * 3.3 9 9 TMB2x 2658S-25 534 ± 55 *** NS 10.7 30 9 TMB2x 2658S-28 53 ± 25 NS *** 1.06 6 9 TMB2x 2658S-32 92 ± 51 NS *** 1.8 8 7 TMB2x 2658S-37 243 ± 139 ** NS 4.9 13 11 TMB2x 2658S-38 164 ± 32 * NS 3.3 9 6 TMB2x 2975S-34 1 ± 0.8 NS *** 0.02 24 8
1 Pf= mean final nematode population density ± standard error. 2 Comparison between Pf of the genotype and Pf of Yangambi km5 (Y. km5) and Valery (Val). Data were log10(x+1) transformed before analysis. Ns = not significantly different (P>0.05). *, **, ***: significantly different at P≤0.05, P≤0.01 and P≤0.001, respectively. 3 Rr = reproduction ratio (Pf/Pi).
4 RN = percentage root necrosis. 5 n = number of roots examined.
Table 6.5: Nematode reproduction and percentage root necrosis on a diploid banana hybrid population, 8 weeks after individual root inoculation with 50 Radopholus similis females (Pi).
Genotype Pf1 Y. km52 Val2 Rr3 RN4 n5
Yangambi km 5 14 ± 4 - *** 0.3 13 11 Valery 925 ± 98 *** - 18.5 15 8 TMB2x 2658S-58 361 ± 81 *** Ns 7.2 12 12 TMB2x 2658S-59 875 ± 241 *** Ns 17.5 12 8 TMB2x 2658S-60 670 ± 184 *** Ns 13.4 9 12 TMB2x 2658S-61 920 ± 269 *** Ns 18.4 12 12 TMB2x 2658S-62 0 ± 0 Ns *** 0 1 8 TMB2x 6142-1 1261 ± 330 *** Ns 25.2 20 10 TMB2x 8075-7 31 ± 18 Ns *** 0.6 4 8
1 Pf= mean final nematode population density ± standard error. 2 Comparison between Pf of the genotype and Pf of Yangambi km5 (Y. km5) and Valery (Val). Data were log10(x+1) transformed before analysis. Ns = not significantly different (P>0.05). *, **, ***: significantly different at P≤0.05, P≤0.01 and P≤0.001, respectively. 3 Rr = reproduction ratio (Pf/Pi).
4 RN = percentage root necrosis. 5 n = number of roots examined.
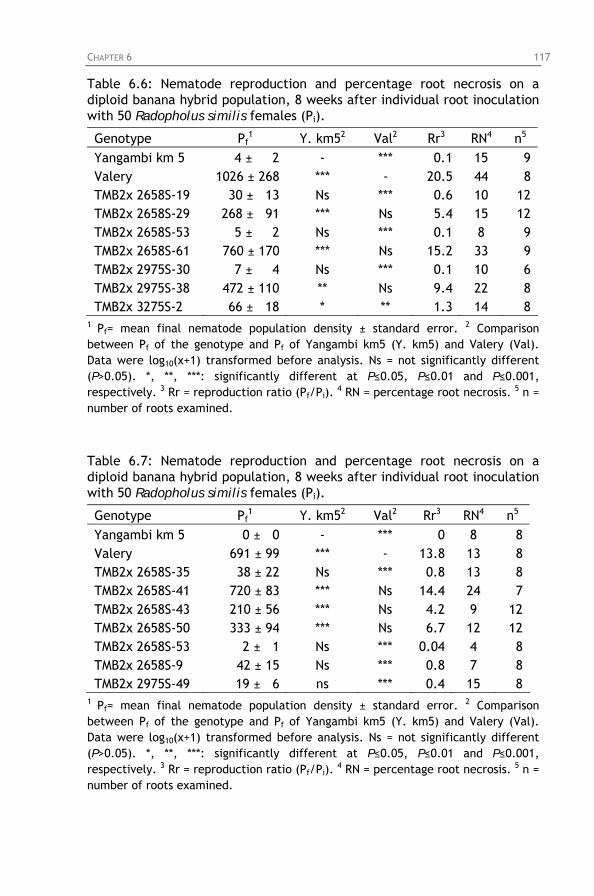
CHAPTER 6 117
Table 6.6: Nematode reproduction and percentage root necrosis on a diploid banana hybrid population, 8 weeks after individual root inoculation with 50 Radopholus similis females (Pi).
Genotype Pf1 Y. km52 Val2 Rr3 RN4 n5
Yangambi km 5 4 ± 2 - *** 0.1 15 9 Valery 1026 ± 268 *** - 20.5 44 8 TMB2x 2658S-19 30 ± 13 Ns *** 0.6 10 12 TMB2x 2658S-29 268 ± 91 *** Ns 5.4 15 12 TMB2x 2658S-53 5 ± 2 Ns *** 0.1 8 9 TMB2x 2658S-61 760 ± 170 *** Ns 15.2 33 9 TMB2x 2975S-30 7 ± 4 Ns *** 0.1 10 6 TMB2x 2975S-38 472 ± 110 ** Ns 9.4 22 8 TMB2x 3275S-2 66 ± 18 * ** 1.3 14 8
1 Pf= mean final nematode population density ± standard error. 2 Comparison between Pf of the genotype and Pf of Yangambi km5 (Y. km5) and Valery (Val). Data were log10(x+1) transformed before analysis. Ns = not significantly different (P>0.05). *, **, ***: significantly different at P≤0.05, P≤0.01 and P≤0.001, respectively. 3 Rr = reproduction ratio (Pf/Pi).
4 RN = percentage root necrosis. 5 n = number of roots examined.
Table 6.7: Nematode reproduction and percentage root necrosis on a diploid banana hybrid population, 8 weeks after individual root inoculation with 50 Radopholus similis females (Pi).
Genotype Pf1 Y. km52 Val2 Rr3 RN4 n5
Yangambi km 5 0 ± 0 - *** 0 8 8 Valery 691 ± 99 *** - 13.8 13 8 TMB2x 2658S-35 38 ± 22 Ns *** 0.8 13 8 TMB2x 2658S-41 720 ± 83 *** Ns 14.4 24 7 TMB2x 2658S-43 210 ± 56 *** Ns 4.2 9 12 TMB2x 2658S-50 333 ± 94 *** Ns 6.7 12 12 TMB2x 2658S-53 2 ± 1 Ns *** 0.04 4 8 TMB2x 2658S-9 42 ± 15 Ns *** 0.8 7 8 TMB2x 2975S-49 19 ± 6 ns *** 0.4 15 8
1 Pf= mean final nematode population density ± standard error. 2 Comparison between Pf of the genotype and Pf of Yangambi km5 (Y. km5) and Valery (Val). Data were log10(x+1) transformed before analysis. Ns = not significantly different (P>0.05). *, **, ***: significantly different at P≤0.05, P≤0.01 and P≤0.001, respectively. 3 Rr = reproduction ratio (Pf/Pi).
4 RN = percentage root necrosis. 5 n = number of roots examined.
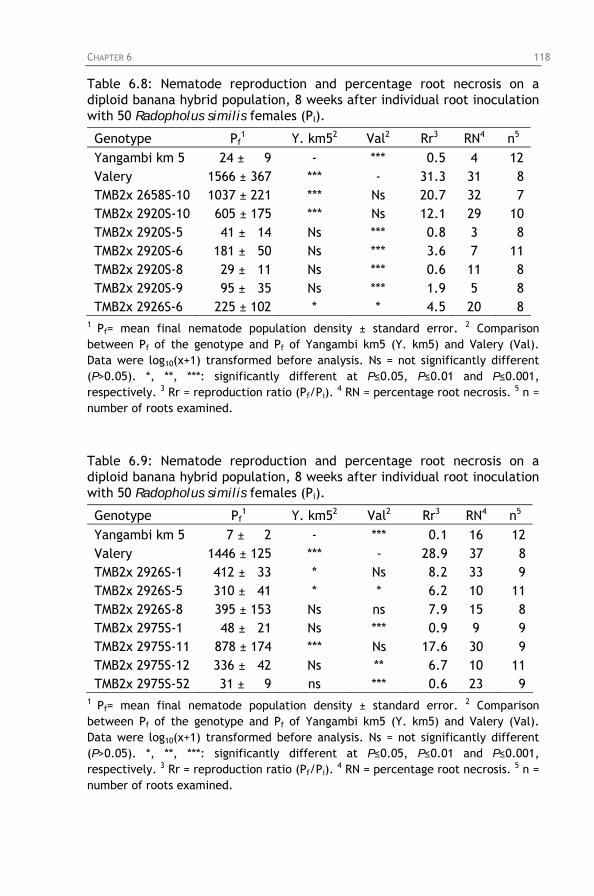
CHAPTER 6 118
Table 6.8: Nematode reproduction and percentage root necrosis on a diploid banana hybrid population, 8 weeks after individual root inoculation with 50 Radopholus similis females (Pi).
Genotype Pf1 Y. km52 Val2 Rr3 RN4 n5
Yangambi km 5 24 ± 9 - *** 0.5 4 12 Valery 1566 ± 367 *** - 31.3 31 8 TMB2x 2658S-10 1037 ± 221 *** Ns 20.7 32 7 TMB2x 2920S-10 605 ± 175 *** Ns 12.1 29 10 TMB2x 2920S-5 41 ± 14 Ns *** 0.8 3 8 TMB2x 2920S-6 181 ± 50 Ns *** 3.6 7 11 TMB2x 2920S-8 29 ± 11 Ns *** 0.6 11 8 TMB2x 2920S-9 95 ± 35 Ns *** 1.9 5 8 TMB2x 2926S-6 225 ± 102 * * 4.5 20 8
1 Pf= mean final nematode population density ± standard error. 2 Comparison between Pf of the genotype and Pf of Yangambi km5 (Y. km5) and Valery (Val). Data were log10(x+1) transformed before analysis. Ns = not significantly different (P>0.05). *, **, ***: significantly different at P≤0.05, P≤0.01 and P≤0.001, respectively. 3 Rr = reproduction ratio (Pf/Pi).
4 RN = percentage root necrosis. 5 n = number of roots examined.
Table 6.9: Nematode reproduction and percentage root necrosis on a diploid banana hybrid population, 8 weeks after individual root inoculation with 50 Radopholus similis females (Pi).
Genotype Pf1 Y. km52 Val2 Rr3 RN4 n5
Yangambi km 5 7 ± 2 - *** 0.1 16 12 Valery 1446 ± 125 *** - 28.9 37 8 TMB2x 2926S-1 412 ± 33 * Ns 8.2 33 9 TMB2x 2926S-5 310 ± 41 * * 6.2 10 11 TMB2x 2926S-8 395 ± 153 Ns ns 7.9 15 8 TMB2x 2975S-1 48 ± 21 Ns *** 0.9 9 9 TMB2x 2975S-11 878 ± 174 *** Ns 17.6 30 9 TMB2x 2975S-12 336 ± 42 Ns ** 6.7 10 11 TMB2x 2975S-52 31 ± 9 ns *** 0.6 23 9
1 Pf= mean final nematode population density ± standard error. 2 Comparison between Pf of the genotype and Pf of Yangambi km5 (Y. km5) and Valery (Val). Data were log10(x+1) transformed before analysis. Ns = not significantly different (P>0.05). *, **, ***: significantly different at P≤0.05, P≤0.01 and P≤0.001, respectively. 3 Rr = reproduction ratio (Pf/Pi).
4 RN = percentage root necrosis. 5 n = number of roots examined.
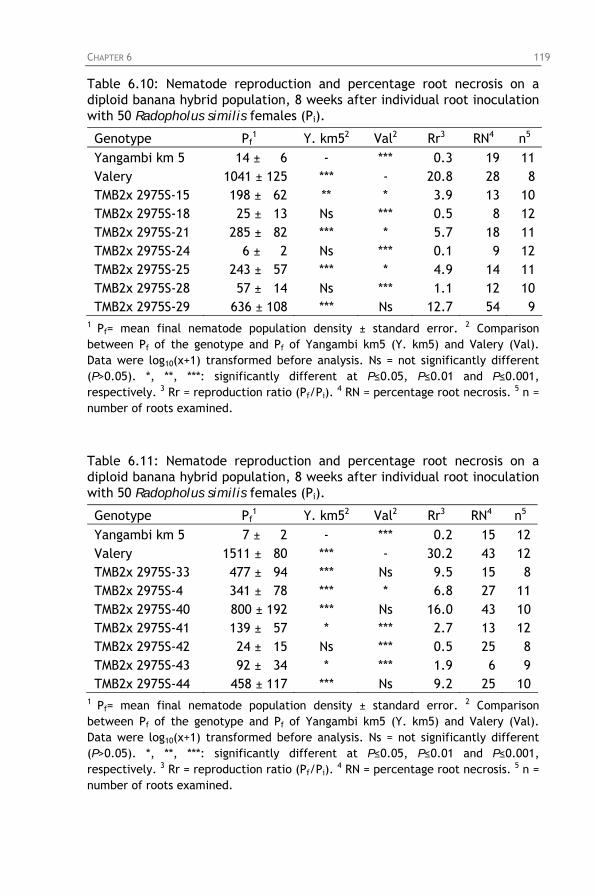
CHAPTER 6 119
Table 6.10: Nematode reproduction and percentage root necrosis on a diploid banana hybrid population, 8 weeks after individual root inoculation with 50 Radopholus similis females (Pi).
Genotype Pf1 Y. km52 Val2 Rr3 RN4 n5
Yangambi km 5 14 ± 6 - *** 0.3 19 11 Valery 1041 ± 125 *** - 20.8 28 8 TMB2x 2975S-15 198 ± 62 ** * 3.9 13 10 TMB2x 2975S-18 25 ± 13 Ns *** 0.5 8 12 TMB2x 2975S-21 285 ± 82 *** * 5.7 18 11 TMB2x 2975S-24 6 ± 2 Ns *** 0.1 9 12 TMB2x 2975S-25 243 ± 57 *** * 4.9 14 11 TMB2x 2975S-28 57 ± 14 Ns *** 1.1 12 10 TMB2x 2975S-29 636 ± 108 *** Ns 12.7 54 9
1 Pf= mean final nematode population density ± standard error. 2 Comparison between Pf of the genotype and Pf of Yangambi km5 (Y. km5) and Valery (Val). Data were log10(x+1) transformed before analysis. Ns = not significantly different (P>0.05). *, **, ***: significantly different at P≤0.05, P≤0.01 and P≤0.001, respectively. 3 Rr = reproduction ratio (Pf/Pi).
4 RN = percentage root necrosis. 5 n = number of roots examined.
Table 6.11: Nematode reproduction and percentage root necrosis on a diploid banana hybrid population, 8 weeks after individual root inoculation with 50 Radopholus similis females (Pi).
Genotype Pf1 Y. km52 Val2 Rr3 RN4 n5
Yangambi km 5 7 ± 2 - *** 0.2 15 12 Valery 1511 ± 80 *** - 30.2 43 12 TMB2x 2975S-33 477 ± 94 *** Ns 9.5 15 8 TMB2x 2975S-4 341 ± 78 *** * 6.8 27 11 TMB2x 2975S-40 800 ± 192 *** Ns 16.0 43 10 TMB2x 2975S-41 139 ± 57 * *** 2.7 13 12 TMB2x 2975S-42 24 ± 15 Ns *** 0.5 25 8 TMB2x 2975S-43 92 ± 34 * *** 1.9 6 9 TMB2x 2975S-44 458 ± 117 *** Ns 9.2 25 10
1 Pf= mean final nematode population density ± standard error. 2 Comparison between Pf of the genotype and Pf of Yangambi km5 (Y. km5) and Valery (Val). Data were log10(x+1) transformed before analysis. Ns = not significantly different (P>0.05). *, **, ***: significantly different at P≤0.05, P≤0.01 and P≤0.001, respectively. 3 Rr = reproduction ratio (Pf/Pi).
4 RN = percentage root necrosis. 5 n = number of roots examined.
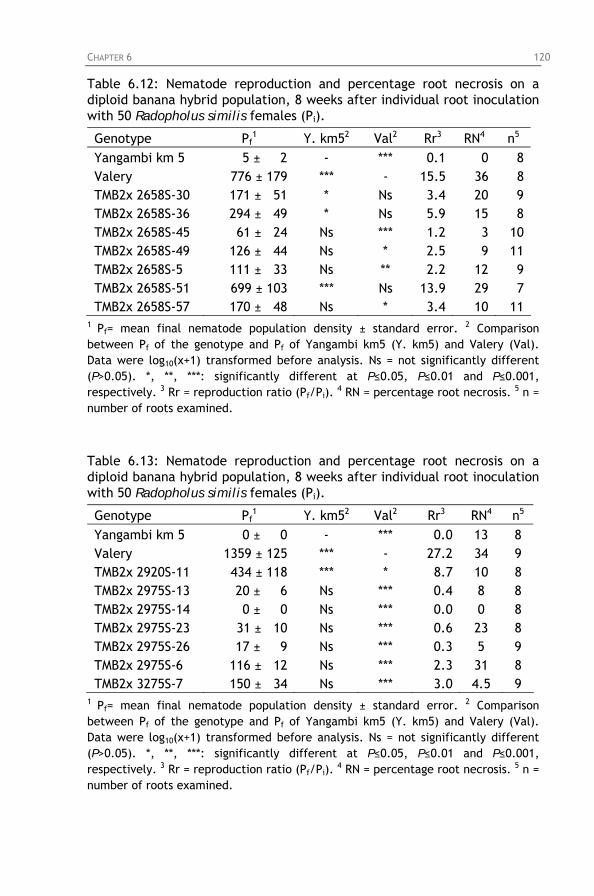
CHAPTER 6 120
Table 6.12: Nematode reproduction and percentage root necrosis on a diploid banana hybrid population, 8 weeks after individual root inoculation with 50 Radopholus similis females (Pi).
Genotype Pf1 Y. km52 Val2 Rr3 RN4 n5
Yangambi km 5 5 ± 2 - *** 0.1 0 8 Valery 776 ± 179 *** - 15.5 36 8 TMB2x 2658S-30 171 ± 51 * Ns 3.4 20 9 TMB2x 2658S-36 294 ± 49 * Ns 5.9 15 8 TMB2x 2658S-45 61 ± 24 Ns *** 1.2 3 10 TMB2x 2658S-49 126 ± 44 Ns * 2.5 9 11 TMB2x 2658S-5 111 ± 33 Ns ** 2.2 12 9 TMB2x 2658S-51 699 ± 103 *** Ns 13.9 29 7 TMB2x 2658S-57 170 ± 48 Ns * 3.4 10 11
1 Pf= mean final nematode population density ± standard error. 2 Comparison between Pf of the genotype and Pf of Yangambi km5 (Y. km5) and Valery (Val). Data were log10(x+1) transformed before analysis. Ns = not significantly different (P>0.05). *, **, ***: significantly different at P≤0.05, P≤0.01 and P≤0.001, respectively. 3 Rr = reproduction ratio (Pf/Pi).
4 RN = percentage root necrosis. 5 n = number of roots examined.
Table 6.13: Nematode reproduction and percentage root necrosis on a diploid banana hybrid population, 8 weeks after individual root inoculation with 50 Radopholus similis females (Pi).
Genotype Pf1 Y. km52 Val2 Rr3 RN4 n5
Yangambi km 5 0 ± 0 - *** 0.0 13 8 Valery 1359 ± 125 *** - 27.2 34 9 TMB2x 2920S-11 434 ± 118 *** * 8.7 10 8 TMB2x 2975S-13 20 ± 6 Ns *** 0.4 8 8 TMB2x 2975S-14 0 ± 0 Ns *** 0.0 0 8 TMB2x 2975S-23 31 ± 10 Ns *** 0.6 23 8 TMB2x 2975S-26 17 ± 9 Ns *** 0.3 5 9 TMB2x 2975S-6 116 ± 12 Ns *** 2.3 31 8 TMB2x 3275S-7 150 ± 34 Ns *** 3.0 4.5 9
1 Pf= mean final nematode population density ± standard error. 2 Comparison between Pf of the genotype and Pf of Yangambi km5 (Y. km5) and Valery (Val). Data were log10(x+1) transformed before analysis. Ns = not significantly different (P>0.05). *, **, ***: significantly different at P≤0.05, P≤0.01 and P≤0.001, respectively. 3 Rr = reproduction ratio (Pf/Pi).
4 RN = percentage root necrosis. 5 n = number of roots examined.
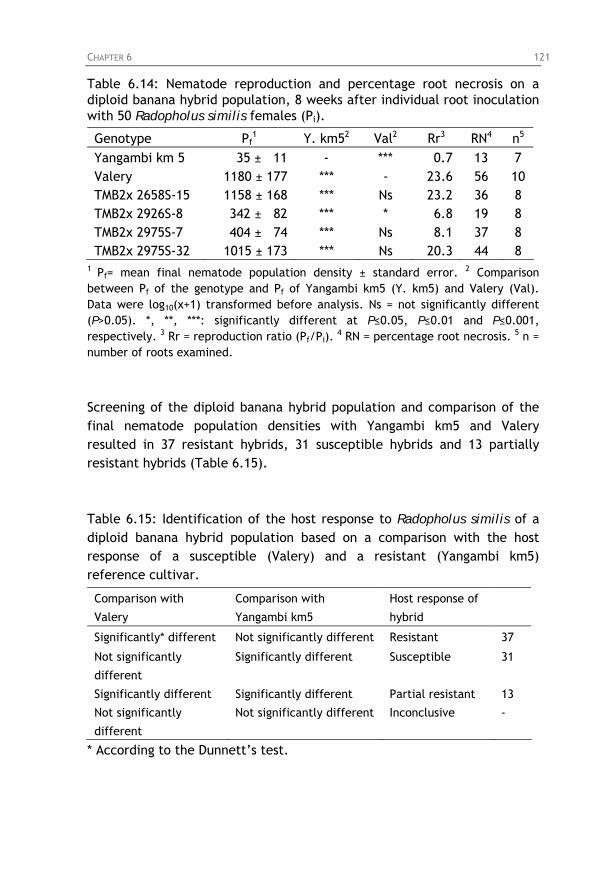
CHAPTER 6 121
Table 6.14: Nematode reproduction and percentage root necrosis on a diploid banana hybrid population, 8 weeks after individual root inoculation with 50 Radopholus similis females (Pi).
Genotype Pf1 Y. km52 Val2 Rr3 RN4 n5
Yangambi km 5 35 ± 11 - *** 0.7 13 7 Valery 1180 ± 177 *** - 23.6 56 10 TMB2x 2658S-15 1158 ± 168 *** Ns 23.2 36 8 TMB2x 2926S-8 342 ± 82 *** * 6.8 19 8 TMB2x 2975S-7 404 ± 74 *** Ns 8.1 37 8 TMB2x 2975S-32 1015 ± 173 *** Ns 20.3 44 8
1 Pf= mean final nematode population density ± standard error. 2 Comparison between Pf of the genotype and Pf of Yangambi km5 (Y. km5) and Valery (Val). Data were log10(x+1) transformed before analysis. Ns = not significantly different (P>0.05). *, **, ***: significantly different at P≤0.05, P≤0.01 and P≤0.001, respectively. 3 Rr = reproduction ratio (Pf/Pi).
4 RN = percentage root necrosis. 5 n = number of roots examined.
Screening of the diploid banana hybrid population and comparison of the final nematode population densities with Yangambi km5 and Valery resulted in 37 resistant hybrids, 31 susceptible hybrids and 13 partially resistant hybrids (Table 6.15). Table 6.15: Identification of the host response to Radopholus similis of a diploid banana hybrid population based on a comparison with the host response of a susceptible (Valery) and a resistant (Yangambi km5) reference cultivar.
Comparison with
Valery
Comparison with
Yangambi km5
Host response of
hybrid
Significantly* different Not significantly different Resistant 37
Not significantly
different
Significantly different Susceptible 31
Significantly different Significantly different Partial resistant 13
Not significantly
different
Not significantly different Inconclusive -
* According to the Dunnett’s test.
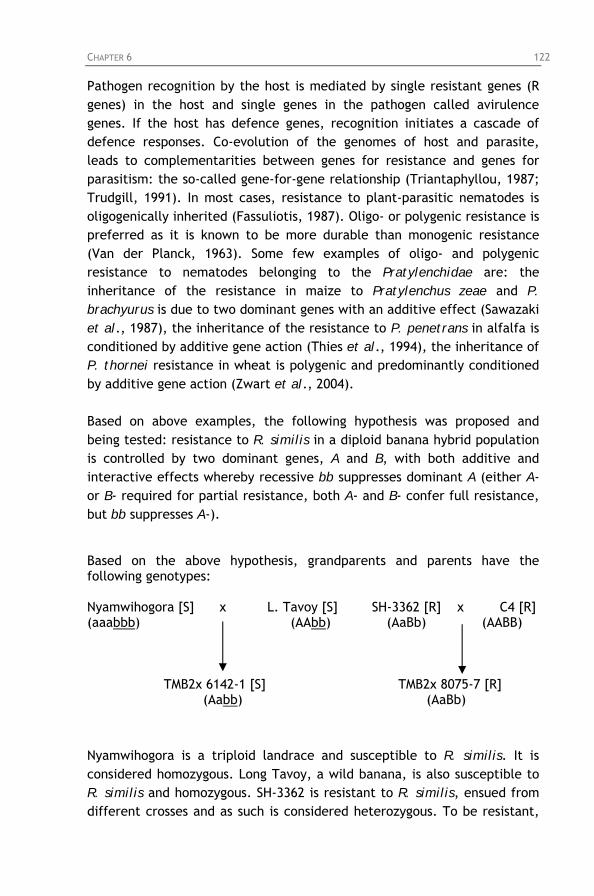
CHAPTER 6 122
Pathogen recognition by the host is mediated by single resistant genes (R genes) in the host and single genes in the pathogen called avirulence genes. If the host has defence genes, recognition initiates a cascade of defence responses. Co-evolution of the genomes of host and parasite, leads to complementarities between genes for resistance and genes for parasitism: the so-called gene-for-gene relationship (Triantaphyllou, 1987; Trudgill, 1991). In most cases, resistance to plant-parasitic nematodes is oligogenically inherited (Fassuliotis, 1987). Oligo- or polygenic resistance is preferred as it is known to be more durable than monogenic resistance (Van der Planck, 1963). Some few examples of oligo- and polygenic resistance to nematodes belonging to the Pratylenchidae are: the inheritance of the resistance in maize to Pratylenchus zeae and P. brachyurus is due to two dominant genes with an additive effect (Sawazaki et al., 1987), the inheritance of the resistance to P. penetrans in alfalfa is conditioned by additive gene action (Thies et al., 1994), the inheritance of P. thornei resistance in wheat is polygenic and predominantly conditioned by additive gene action (Zwart et al., 2004). Based on above examples, the following hypothesis was proposed and being tested: resistance to R. similis in a diploid banana hybrid population is controlled by two dominant genes, A and B, with both additive and interactive effects whereby recessive bb suppresses dominant A (either A- or B- required for partial resistance, both A- and B- confer full resistance, but bb suppresses A-). Based on the above hypothesis, grandparents and parents have the following genotypes: Nyamwihogora [S] x L. Tavoy [S] SH-3362 [R] x C4 [R] (aaabbb) (AAbb) (AaBb) (AABB) TMB2x 6142-1 [S] TMB2x 8075-7 [R] (Aabb) (AaBb) Nyamwihogora is a triploid landrace and susceptible to R. similis. It is considered homozygous. Long Tavoy, a wild banana, is also susceptible to R. similis and homozygous. SH-3362 is resistant to R. similis, ensued from different crosses and as such is considered heterozygous. To be resistant,
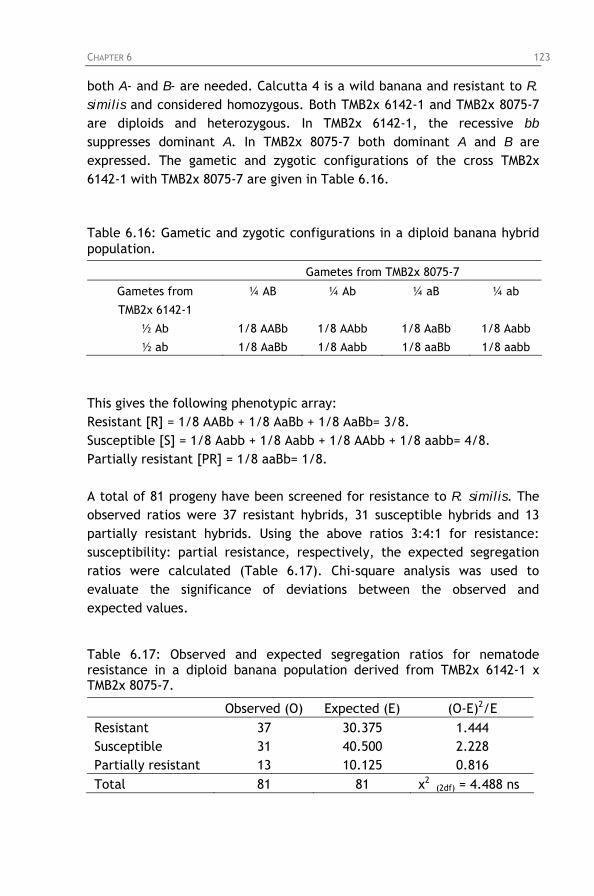
CHAPTER 6 123
both A- and B- are needed. Calcutta 4 is a wild banana and resistant to R. similis and considered homozygous. Both TMB2x 6142-1 and TMB2x 8075-7 are diploids and heterozygous. In TMB2x 6142-1, the recessive bb suppresses dominant A. In TMB2x 8075-7 both dominant A and B are expressed. The gametic and zygotic configurations of the cross TMB2x 6142-1 with TMB2x 8075-7 are given in Table 6.16. Table 6.16: Gametic and zygotic configurations in a diploid banana hybrid population.
Gametes from TMB2x 8075-7
Gametes from
TMB2x 6142-1
¼ AB ¼ Ab ¼ aB ¼ ab
½ Ab 1/8 AABb 1/8 AAbb 1/8 AaBb 1/8 Aabb
½ ab 1/8 AaBb 1/8 Aabb 1/8 aaBb 1/8 aabb
This gives the following phenotypic array: Resistant [R] = 1/8 AABb + 1/8 AaBb + 1/8 AaBb= 3/8. Susceptible [S] = 1/8 Aabb + 1/8 Aabb + 1/8 AAbb + 1/8 aabb= 4/8. Partially resistant [PR] = 1/8 aaBb= 1/8. A total of 81 progeny have been screened for resistance to R. similis. The observed ratios were 37 resistant hybrids, 31 susceptible hybrids and 13 partially resistant hybrids. Using the above ratios 3:4:1 for resistance: susceptibility: partial resistance, respectively, the expected segregation ratios were calculated (Table 6.17). Chi-square analysis was used to evaluate the significance of deviations between the observed and expected values. Table 6.17: Observed and expected segregation ratios for nematode resistance in a diploid banana population derived from TMB2x 6142-1 x TMB2x 8075-7.
Observed (O) Expected (E) (O-E)2/E Resistant 37 30.375 1.444 Susceptible 31 40.500 2.228 Partially resistant 13 10.125 0.816 Total 81 81 χ2 (2df) = 4.488 ns
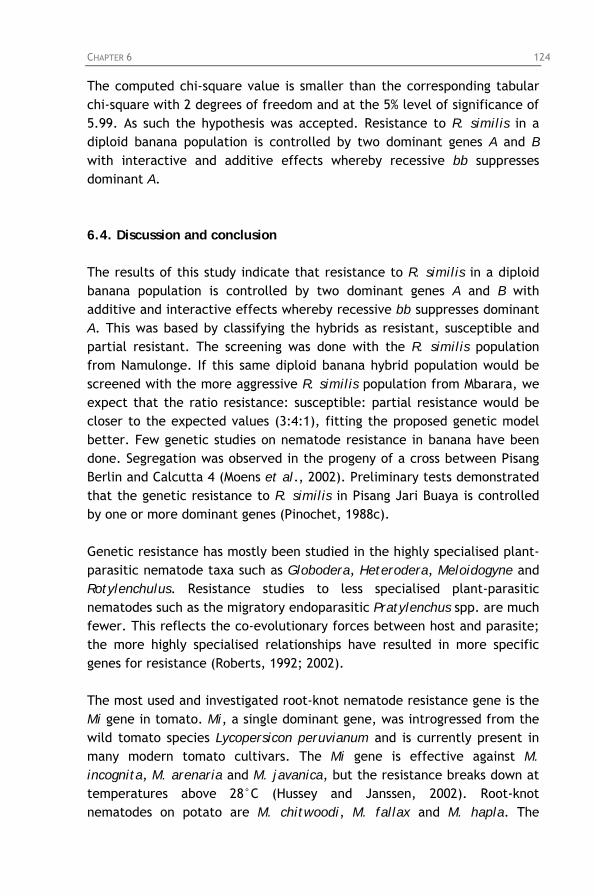
CHAPTER 6 124
The computed chi-square value is smaller than the corresponding tabular chi-square with 2 degrees of freedom and at the 5% level of significance of 5.99. As such the hypothesis was accepted. Resistance to R. similis in a diploid banana population is controlled by two dominant genes A and B with interactive and additive effects whereby recessive bb suppresses dominant A. 6.4. Discussion and conclusion The results of this study indicate that resistance to R. similis in a diploid banana population is controlled by two dominant genes A and B with additive and interactive effects whereby recessive bb suppresses dominant A. This was based by classifying the hybrids as resistant, susceptible and partial resistant. The screening was done with the R. similis population from Namulonge. If this same diploid banana hybrid population would be screened with the more aggressive R. similis population from Mbarara, we expect that the ratio resistance: susceptible: partial resistance would be closer to the expected values (3:4:1), fitting the proposed genetic model better. Few genetic studies on nematode resistance in banana have been done. Segregation was observed in the progeny of a cross between Pisang Berlin and Calcutta 4 (Moens et al., 2002). Preliminary tests demonstrated that the genetic resistance to R. similis in Pisang Jari Buaya is controlled by one or more dominant genes (Pinochet, 1988c). Genetic resistance has mostly been studied in the highly specialised plant-parasitic nematode taxa such as Globodera, Heterodera, Meloidogyne and Rotylenchulus. Resistance studies to less specialised plant-parasitic nematodes such as the migratory endoparasitic Pratylenchus spp. are much fewer. This reflects the co-evolutionary forces between host and parasite; the more highly specialised relationships have resulted in more specific genes for resistance (Roberts, 1992; 2002). The most used and investigated root-knot nematode resistance gene is the Mi gene in tomato. Mi, a single dominant gene, was introgressed from the wild tomato species Lycopersicon peruvianum and is currently present in many modern tomato cultivars. The Mi gene is effective against M. incognita, M. arenaria and M. javanica, but the resistance breaks down at temperatures above 28°C (Hussey and Janssen, 2002). Root-knot nematodes on potato are M. chitwoodi, M. fallax and M. hapla. The
CHAPTER 6 125
resistance in Solanum bulbocastanum is based on a single, dominant gene, Rmc1, and is effective against all three root-knot nematode species. A second single, dominant resistance gene Rmc2 has been identified in S. fendleri and is only effective against M. chitwoodi and M. fallax (Hussey and Janssen, 2002). The inheritance of Meloidogyne resistance in soybean is conditioned in an oligogenic way (Hussey and Janssen, 2002). Resistance in cowpea (Vigna unguiculata) to Meloidogyne incognita is conditioned by a single dominant gene. The same gene confers resistance to M. javanica and M. hapla (Fassuliotis, 1987). Resistance to the tobacco cyst nematode Globodera tabacum tabacum is conferred by a single dominant gene (LaMondia, 2002), while resistance to G. t. solanacearum is multigenic (Elliot et al., 1986). Resistance to Heterodera glycines, the soybean cyst nematode, is complex and controlled by several genes (Young and Mudge, 2002). Resistance to H. glycines race 1 is controlled by three independently inherited recessive genes and one major gene. An additional gene confers resistance to H. glycines race 2 and resistance to race 4 is controlled by one dominant gene and two recessive genes (Fassuliotis, 1987). Resistance in barley (Hordeum spp.) to Heterodera avenae is controlled by one dominant gene (Cook, 1974; Cook and Noel, 2002). Resistance to H. avenae in oat (Avena spp.) indicates that several genes for resistance may be available. Resistance in A. sativa and A. byzantina to H. avenae is controlled by one dominant gene, while resistance in A. sterilis is controlled by three dominant genes (Cotton and Hayes, 1972). In wheat (Triticum spp.) resistance to H. avenae is conferred by a single dominant gene (Cook, 1974). Resistant sources in polyploid plants, e.g. oats and wheat, with simple major resistance genes often appear to have other genes with minor effects. In contrast, single genes are often fully effective in diploid barley (Cook and Noel, 2002). Two pairs of genes with unequal effects were proposed to confer resistance to Rotylenchulus reniformis in soybean. This was not linked with resistance to the soybean cyst nematode (Robinson, 2002). In tomato, genes for resistance to R. reniformis appear unlinked to the genes for resistance to Meloidogyne spp. In most cases resistance to R. reniformis appears inherited independently from resistance to other sedentary nematodes (Robinson, 2002). Resistance to the citrus nematode, Tylenchulus semipenetrans, seems to be dominant and oligogenic (Verdejo-Lucas and Kaplan, 2002).
CHAPTER 6 126
The inheritance of the resistance to Pratylenchus penetrans in alfalfa (Medicago sativa) is conditioned by additive gene action (Thies et al., 1994). The inheritance of the resistance in maize (Zea Mays) to P. zeae and P. brachyurus was due to two dominant genes with an additive effect (Sawazaki et al., 1987). Resistance to P. penetrans in potato is quantitatively inherited. Inheritance of P. thornei resistance in wheat is polygenic and predominantly conditioned by additive gene action (Zwart et al., 2004). Incorporation of genes for resistance to more than one nematode species or more than one pathotype within a species is possible. Oats resistant to both Ditylenchus dipsaci and H. avenae are being developed (Cook, 1974). In most cases resistance to plant-parasitic nematodes is oligogenically inherited (Fassuliotis, 1987). This resistance may be broken down by the emergence of new, more virulent pathotypes (Cook, 1974). Resistance to R. similis in a diploid banana hybrid population was oligogenic as it was conferred by two dominant genes. This however may indicate that the resistance might not be durable and be broken down by new pathotypes. Pisang Jari Buaya showed resistance to the R. similis populations from Namulonge and Mukono, but was susceptible to the R. similis population from Mbarara (Chapter 5; section 5.3.1). On the other hand, Yangambi km5 was resistant to the four nematode populations tested from Uganda (Chapter 5; section 5.3.2). This might indicate that the resistance to R. similis in Pisang Jari Buaya is different from that in Yangambi km5. It should be noted that Pisang Jari Buaya is a diploid, while Yangambi km5 is a triploid. It would be recommended to evaluate other segregating Musa populations. In addition, screening of the segregating Musa population should be done with different R. similis populations.
CHAPTER 7 127
Chapter 7: Studies on mechanisms of resistance to
Radopholus similis in Musa germplasm 7.1. Background and objectives Knowledge on the mechanisms of nematode resistance may help the breeder to select for a desired characteristic (Giebel, 1982; Fogain and Gowen, 1996), and may also assist in the identification of resistance markers to facilitate screening Musa germplasm for a desired characteristic. The primary mechanism of plant-parasitic nematodes to localise a food source is chemoreception of chemotactic signals from the host plants, such as root exudates. The amphids are considered as the primary sensory organs for chemoreception. Food finding behaviour of nematodes is probably caused by host-released allelochemic messengers (Huettel, 1986). Allelochemics are chemicals that cause a physiological or behavioural response between members of different species (interspecific) and are involved in the host recognition response (Huettel, 1986). Endoparasitic nematodes have to penetrate the outer covering of their host and thickened tissues can be a barrier to penetration (Cook and Evans, 1987). Lignin can form a physical barrier for nematode penetration, i.e. pre-infectional resistance. However, according to Kaplan and Davis (1987) incompatibility to nematodes is generally expressed after infection, whereby active compounds are produced post-infectionally, rather than preformed constitutive plant products. In general, nematodes locate and penetrate roots of nematode compatible and nematode incompatible plants equally (reviewed by Kaplan and Davis, 1987). Formation of phenolic compounds might refer to induced resistance as a response to nematode penetration.
The host plant response depends both on the chemical composition of the plant and on the composition of the nematode secretion. Plant-parasitic nematodes cause mechanical damage to the host tissue with their stylets. Enzymes are secreted from their oesophageal glands, which dissolve cell walls enabling intra- and intercellular movement of the nematode. They act as digestive enzymes, digesting solid components of cell walls, which can then be taken up by the pathogen (Giebel, 1974). Pinochet (1988c)
CHAPTER 7 128
postulated that Radopholus similis may lack an enzyme to degrade the cell walls of the resistant cultivar Pisang Jari Buaya. Following injury or infection of plant tissues by pathogens, phenols play a role in sounding the alarm, in inhibiting the enzymatic hydrolysis, in directly inhibiting pathogen development and in the process of repair. The alarm reaction is elicited by indoleactic acid (IAA) (Beckman and Mueller, 1970). Rapid accumulation of phenolic compounds at the infection site may limit the development of the pathogen as a result of rapid cell death (hypersensitivity) (Nicholson and Hammerschmidt, 1992). According to Giebel (1974) and Mateille (1994a) resistance is not only determined by the total concentration of phenols, but also by the type of phenols, e.g. higher monophenols favor resistance. As such, resistance depends on the ratio monophenols/polyphenols. Resistance against nematodes in Musa has been correlated with phenylpropanoids. Phenylpropanoids are secondary metabolites characterised by an aromatic ring system carrying a phenolic hydroxyl group (Halhbrock and Scheel, 1989). The phenylpropanoid pathway is a multi-branched pathway leading to synthesis of flavonoids, isoflavonoids, coumarins, soluble esters such as suberin, lignin, and other cell wall-bound phenolics used in plant defence to pathogens and to environmental assault (Edens et al., 1995). The phenylpropanoid pathway is of critical importance as its products, the phenolic compounds, protect the plant against abiotic and biotic stresses (Dixon and Paiva, 1995). Lignification was observed in Pisang Jari Buaya (Fogain and Gowen, 1996). Preformed phenolic cells and infection induced accumulation of phenolics was observed in Yangambi km5 (Fogain and Gowen, 1996; Valette et al., 1998), indicating that lignin and phenolic compounds might be involved in nematode resistance in Musa. A relation was observed between the degree of plant resistance to R. similis and the phenolics present in the plant tissues. Also Mateille (1994b) found more phenolic compounds in Gros Michel compared to the R. similis susceptible cultivar Poyo. Mace (1963), using both histochemical and chromatographic data, identified 3-hydroxytyramine as the major phenol in roots of Gros Michel. Binks et al. (1997) isolated the phytoalexin, 2-hydroxy-9-phenylphenalen-1-one, from Pisang sipuli (AA) and associated it with the hypersensitive reaction to R. similis. High levels of proanthocyanidins were observed in Kunnan (AB) (Collingborn et al., 2000).
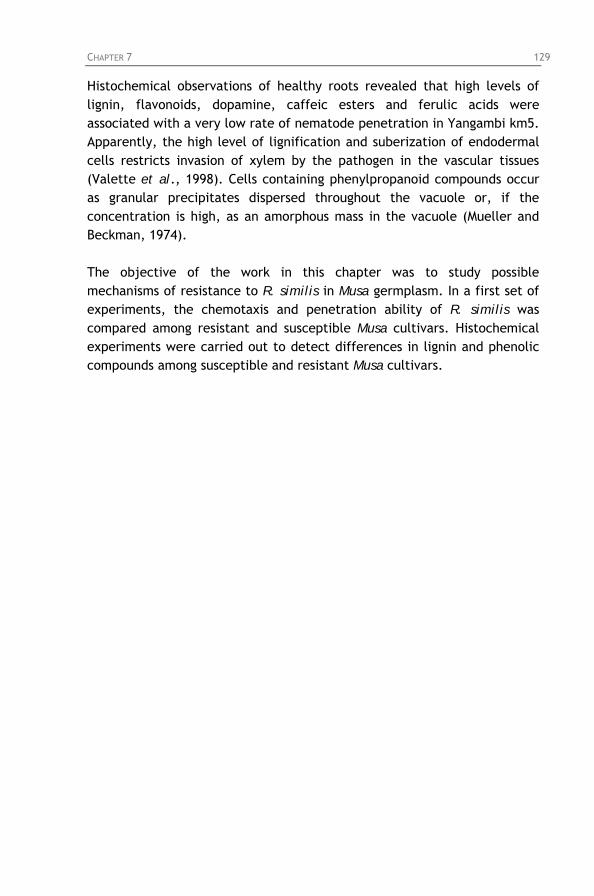
CHAPTER 7 129
Histochemical observations of healthy roots revealed that high levels of lignin, flavonoids, dopamine, caffeic esters and ferulic acids were associated with a very low rate of nematode penetration in Yangambi km5. Apparently, the high level of lignification and suberization of endodermal cells restricts invasion of xylem by the pathogen in the vascular tissues (Valette et al., 1998). Cells containing phenylpropanoid compounds occur as granular precipitates dispersed throughout the vacuole or, if the concentration is high, as an amorphous mass in the vacuole (Mueller and Beckman, 1974). The objective of the work in this chapter was to study possible mechanisms of resistance to R. similis in Musa germplasm. In a first set of experiments, the chemotaxis and penetration ability of R. similis was compared among resistant and susceptible Musa cultivars. Histochemical experiments were carried out to detect differences in lignin and phenolic compounds among susceptible and resistant Musa cultivars.
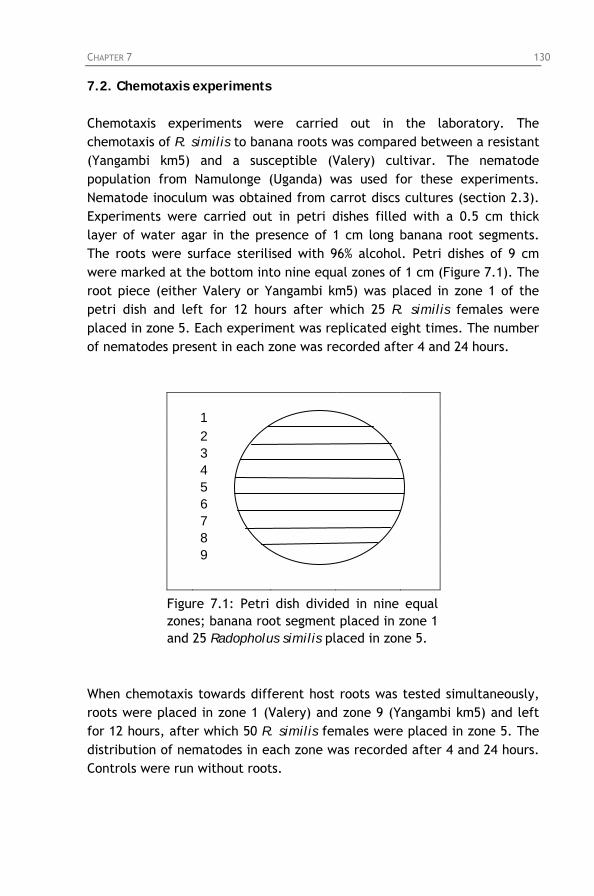
CHAPTER 7 130
7.2. Chemotaxis experiments Chemotaxis experiments were carried out in the laboratory. The chemotaxis of R. similis to banana roots was compared between a resistant (Yangambi km5) and a susceptible (Valery) cultivar. The nematode population from Namulonge (Uganda) was used for these experiments. Nematode inoculum was obtained from carrot discs cultures (section 2.3). Experiments were carried out in petri dishes filled with a 0.5 cm thick layer of water agar in the presence of 1 cm long banana root segments. The roots were surface sterilised with 96% alcohol. Petri dishes of 9 cm were marked at the bottom into nine equal zones of 1 cm (Figure 7.1). The root piece (either Valery or Yangambi km5) was placed in zone 1 of the petri dish and left for 12 hours after which 25 R. similis females were placed in zone 5. Each experiment was replicated eight times. The number of nematodes present in each zone was recorded after 4 and 24 hours.
1 2 3 4 5 6 7 8 9
Figure 7.1: Petri dish divided in nine equal zones; banana root segment placed in zone 1 and 25 Radopholus similis placed in zone 5.
When chemotaxis towards different host roots was tested simultaneously, roots were placed in zone 1 (Valery) and zone 9 (Yangambi km5) and left for 12 hours, after which 50 R. similis females were placed in zone 5. The distribution of nematodes in each zone was recorded after 4 and 24 hours. Controls were run without roots.
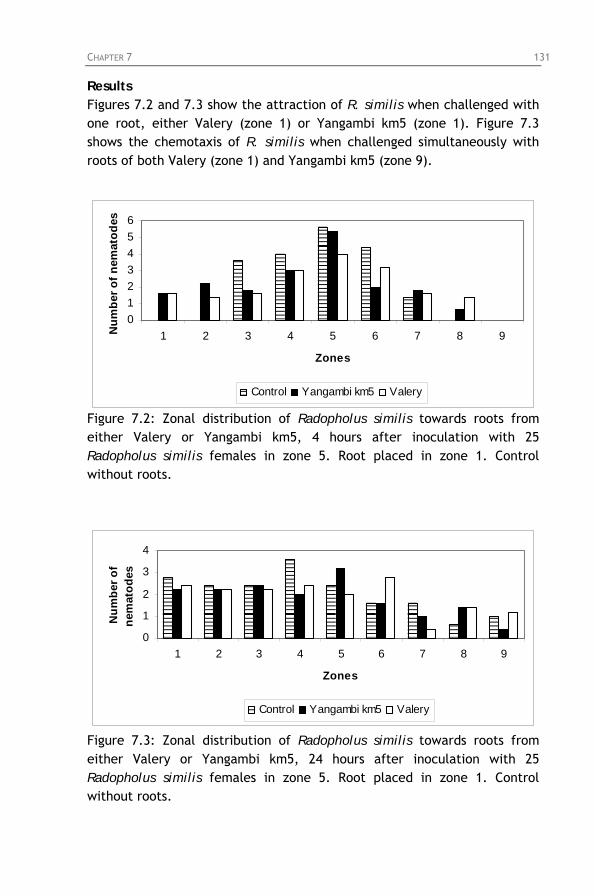
CHAPTER 7 131
Results Figures 7.2 and 7.3 show the attraction of R. similis when challenged with one root, either Valery (zone 1) or Yangambi km5 (zone 1). Figure 7.3 shows the chemotaxis of R. similis when challenged simultaneously with roots of both Valery (zone 1) and Yangambi km5 (zone 9).
0123456
1 2 3 4 5 6 7 8 9
Zones
Num
ber o
f nem
atod
es
Control Yangambi km5 Valery
Figure 7.2: Zonal distribution of Radopholus similis towards roots from either Valery or Yangambi km5, 4 hours after inoculation with 25 Radopholus similis females in zone 5. Root placed in zone 1. Control without roots.
0
1
2
3
4
1 2 3 4 5 6 7 8 9
Zones
Num
ber o
f ne
mat
odes
Control Yangambi km5 Valery
Figure 7.3: Zonal distribution of Radopholus similis towards roots from either Valery or Yangambi km5, 24 hours after inoculation with 25 Radopholus similis females in zone 5. Root placed in zone 1. Control without roots.
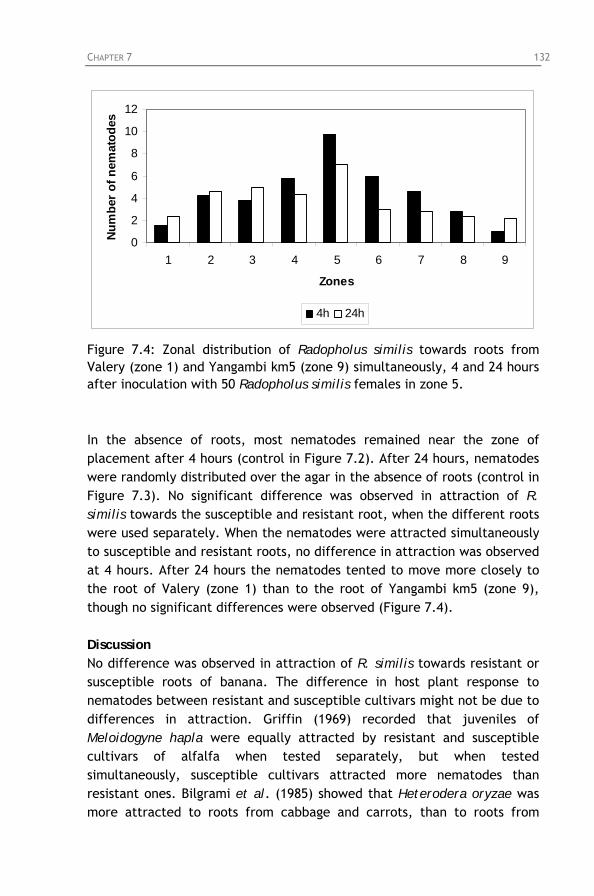
CHAPTER 7 132
0
2
4
6
8
10
12
1 2 3 4 5 6 7 8 9
Zones
Num
ber
of n
emat
odes
4h 24h
Figure 7.4: Zonal distribution of Radopholus similis towards roots from Valery (zone 1) and Yangambi km5 (zone 9) simultaneously, 4 and 24 hours after inoculation with 50 Radopholus similis females in zone 5. In the absence of roots, most nematodes remained near the zone of placement after 4 hours (control in Figure 7.2). After 24 hours, nematodes were randomly distributed over the agar in the absence of roots (control in Figure 7.3). No significant difference was observed in attraction of R. similis towards the susceptible and resistant root, when the different roots were used separately. When the nematodes were attracted simultaneously to susceptible and resistant roots, no difference in attraction was observed at 4 hours. After 24 hours the nematodes tented to move more closely to the root of Valery (zone 1) than to the root of Yangambi km5 (zone 9), though no significant differences were observed (Figure 7.4). Discussion No difference was observed in attraction of R. similis towards resistant or susceptible roots of banana. The difference in host plant response to nematodes between resistant and susceptible cultivars might not be due to differences in attraction. Griffin (1969) recorded that juveniles of Meloidogyne hapla were equally attracted by resistant and susceptible cultivars of alfalfa when tested separately, but when tested simultaneously, susceptible cultivars attracted more nematodes than resistant ones. Bilgrami et al. (1985) showed that Heterodera oryzae was more attracted to roots from cabbage and carrots, than to roots from
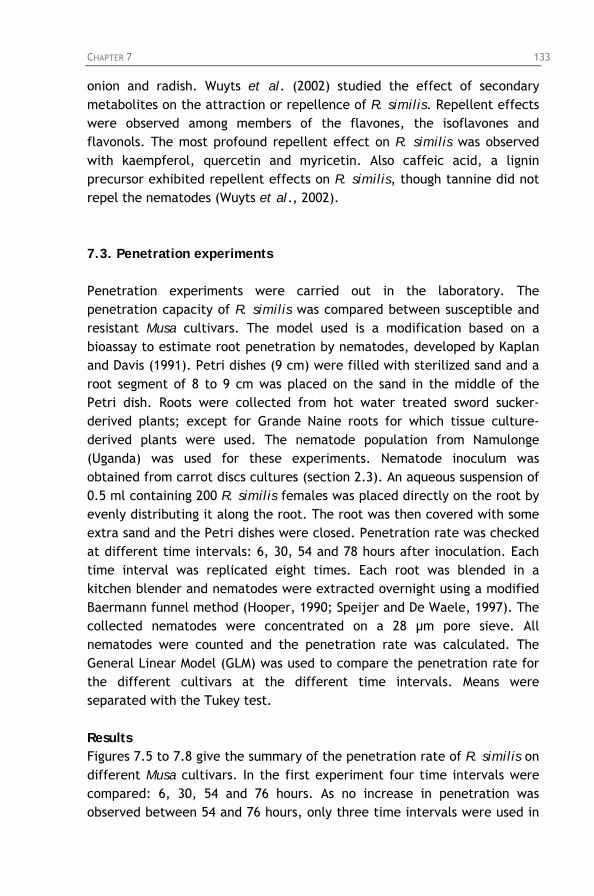
CHAPTER 7 133
onion and radish. Wuyts et al. (2002) studied the effect of secondary metabolites on the attraction or repellence of R. similis. Repellent effects were observed among members of the flavones, the isoflavones and flavonols. The most profound repellent effect on R. similis was observed with kaempferol, quercetin and myricetin. Also caffeic acid, a lignin precursor exhibited repellent effects on R. similis, though tannine did not repel the nematodes (Wuyts et al., 2002). 7.3. Penetration experiments Penetration experiments were carried out in the laboratory. The penetration capacity of R. similis was compared between susceptible and resistant Musa cultivars. The model used is a modification based on a bioassay to estimate root penetration by nematodes, developed by Kaplan and Davis (1991). Petri dishes (9 cm) were filled with sterilized sand and a root segment of 8 to 9 cm was placed on the sand in the middle of the Petri dish. Roots were collected from hot water treated sword sucker-derived plants; except for Grande Naine roots for which tissue culture-derived plants were used. The nematode population from Namulonge (Uganda) was used for these experiments. Nematode inoculum was obtained from carrot discs cultures (section 2.3). An aqueous suspension of 0.5 ml containing 200 R. similis females was placed directly on the root by evenly distributing it along the root. The root was then covered with some extra sand and the Petri dishes were closed. Penetration rate was checked at different time intervals: 6, 30, 54 and 78 hours after inoculation. Each time interval was replicated eight times. Each root was blended in a kitchen blender and nematodes were extracted overnight using a modified Baermann funnel method (Hooper, 1990; Speijer and De Waele, 1997). The collected nematodes were concentrated on a 28 μm pore sieve. All nematodes were counted and the penetration rate was calculated. The General Linear Model (GLM) was used to compare the penetration rate for the different cultivars at the different time intervals. Means were separated with the Tukey test. Results Figures 7.5 to 7.8 give the summary of the penetration rate of R. similis on different Musa cultivars. In the first experiment four time intervals were compared: 6, 30, 54 and 76 hours. As no increase in penetration was observed between 54 and 76 hours, only three time intervals were used in
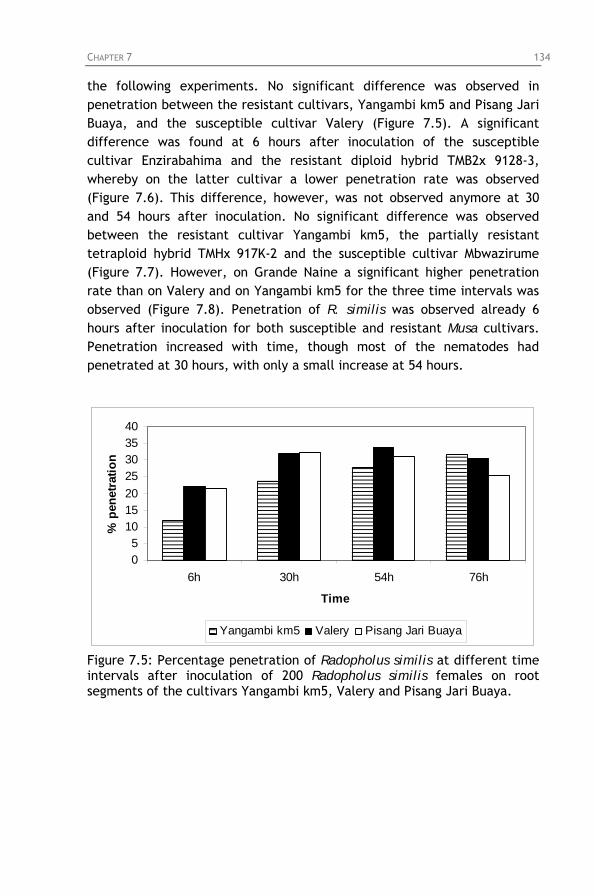
CHAPTER 7 134
the following experiments. No significant difference was observed in penetration between the resistant cultivars, Yangambi km5 and Pisang Jari Buaya, and the susceptible cultivar Valery (Figure 7.5). A significant difference was found at 6 hours after inoculation of the susceptible cultivar Enzirabahima and the resistant diploid hybrid TMB2x 9128-3, whereby on the latter cultivar a lower penetration rate was observed (Figure 7.6). This difference, however, was not observed anymore at 30 and 54 hours after inoculation. No significant difference was observed between the resistant cultivar Yangambi km5, the partially resistant tetraploid hybrid TMHx 917K-2 and the susceptible cultivar Mbwazirume (Figure 7.7). However, on Grande Naine a significant higher penetration rate than on Valery and on Yangambi km5 for the three time intervals was observed (Figure 7.8). Penetration of R. similis was observed already 6 hours after inoculation for both susceptible and resistant Musa cultivars. Penetration increased with time, though most of the nematodes had penetrated at 30 hours, with only a small increase at 54 hours.
05
10152025303540
6h 30h 54h 76h
Time
% p
enet
ratio
n
Yangambi km5 Valery Pisang Jari Buaya
Figure 7.5: Percentage penetration of Radopholus similis at different time intervals after inoculation of 200 Radopholus similis females on root segments of the cultivars Yangambi km5, Valery and Pisang Jari Buaya.
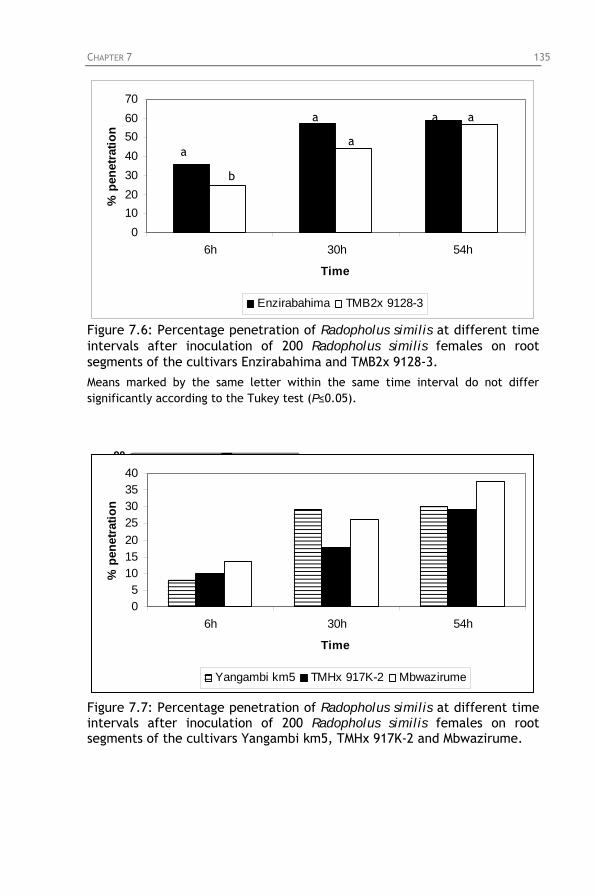
CHAPTER 7 135
010203040506070
6h 30h 54h
Time
% p
enet
ratio
n
Enzirabahima TMB2x 9128-3
a a a
a a
b
Figure 7.6: Percentage penetration of Radopholus similis at different time intervals after inoculation of 200 Radopholus similis females on root segments of the cultivars Enzirabahima and TMB2x 9128-3. Means marked by the same letter within the same time interval do not differ significantly according to the Tukey test (P≤0.05).
0102030405060708090
1st Qtr 2nd Qtr 3rd Qtr 4th Qtr
EastWestNorth
06h 30h
Time
510152025303540
54h
% p
enet
ratio
n
Yangambi km5 TMHx 917K-2 Mbwazirume
Figure 7.7: Percentage penetration of Radopholus similis at different time intervals after inoculation of 200 Radopholus similis females on root segments of the cultivars Yangambi km5, TMHx 917K-2 and Mbwazirume.
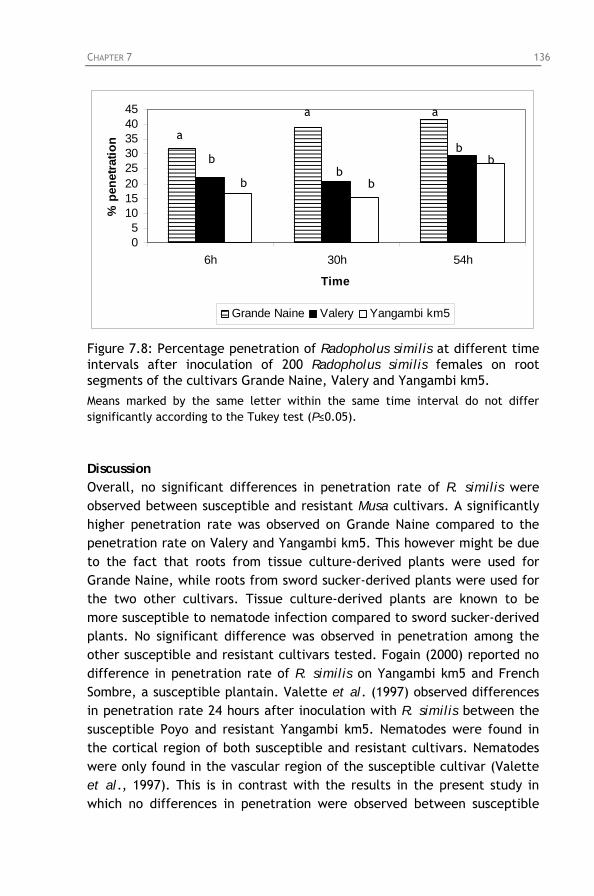
CHAPTER 7 136
05
1015202530354045
6h 30h 54h
Time
% p
enet
ratio
n
Grande Naine Valery Yangambi km5
a a
a b b b
b b b Figure 7.8: Percentage penetration of Radopholus similis at different time intervals after inoculation of 200 Radopholus similis females on root segments of the cultivars Grande Naine, Valery and Yangambi km5. Means marked by the same letter within the same time interval do not differ significantly according to the Tukey test (P≤0.05). Discussion Overall, no significant differences in penetration rate of R. similis were observed between susceptible and resistant Musa cultivars. A significantly higher penetration rate was observed on Grande Naine compared to the penetration rate on Valery and Yangambi km5. This however might be due to the fact that roots from tissue culture-derived plants were used for Grande Naine, while roots from sword sucker-derived plants were used for the two other cultivars. Tissue culture-derived plants are known to be more susceptible to nematode infection compared to sword sucker-derived plants. No significant difference was observed in penetration among the other susceptible and resistant cultivars tested. Fogain (2000) reported no difference in penetration rate of R. similis on Yangambi km5 and French Sombre, a susceptible plantain. Valette et al. (1997) observed differences in penetration rate 24 hours after inoculation with R. similis between the susceptible Poyo and resistant Yangambi km5. Nematodes were found in the cortical region of both susceptible and resistant cultivars. Nematodes were only found in the vascular region of the susceptible cultivar (Valette et al., 1997). This is in contrast with the results in the present study in which no differences in penetration were observed between susceptible
CHAPTER 7 137
and resistant cultivars, when the same origin of root material was used. According to Kaplan and Keen (1980), nematodes invade both resistant and susceptible cultivars, and there is often little difference in the numbers of nematodes penetrating the roots. Although preformed morphological barriers are known to prevent penetration of pathogens in plant tissues, such barriers are not effective against plant-parasitic nematodes. Stylet penetration and enzymes can overcome mechanical barriers like plant cell walls. As mentioned above, incompatibility is generally expressed after infection and active compounds are produced post-infectionally, instead of preformed constitutive plant products (Kaplan and Keen, 1980). 7.4. Histochemical experiments Histochemical experiments were set up to study the role of lignin and phenolic compounds in relation to resistance to R. similis. 7.4.1. Experimental set-up Hot water treated sword sucker-derived plants of different Musa genotypes were grown in the screenhouse. Plants were infected with 1000 R. similis. The Musa cultivars and nematode populations used are described in each experiment (7.4.2. to 7.4.4.). When finalising the experiment, root segments of 1 cm long were taken from each genotype for histochemical analysis. Sections were also taken from non-infected control plants. Fixation Fixation kills and hardens the root tissues and preserves the cellular structure (Daykin and Hussey, 1985). The root segments were submerged in a volume of fixative of at least 10 times greater than that of the volume of the root segment to ensure that the fixative did not become overly diluted by water from the tissues. The different root sections were fixed in 9:0.5:0.5 ethanol 70%:acetic acid:formaldehyde 35% (BDH) for 48 hours (Fogain and Gowen, 1996) and trimmed to small pieces (0.3 cm) to be loaded in the tissue processor machine. Most fixatives are aqueous-based and are not miscible with paraffin wax. To enable impregnation the tissues were processed: the tissues were first dehydrated stepwise in increasingly higher concentrations of alcohol (70%, 80%, 90% and absolute alcohol) to remove water and fixative from the tissues. Water must be removed gradually to avoid plasmolysis (Daykin and Hussey, 1985). After
CHAPTER 7 138
dehydration the tissues were cleared with xylene (BDH) to remove the alcohol from the tissues. Embedding Paraffin wax was used to replace the xylene and to make the tissues firm enough for sectioning. The wax was run from a paraffin dispenser at 100ºC into an aluminium plate and put on a hot plate to keep the wax liquid. The samples were then positioned in the liquid wax. During this process (embedding) all the spaces in the tissues were filled with wax, making the tissues easier to cut. After embedding the tissues were cooled down overnight to get firm sections (hardening). Blocking After hardening, each section was mounted on a wooden block with melted paraffin wax. Each blocked sample was trimmed to expose the section clearly for sectioning with the microtome. The area for sectioning was placed on melting ice to make both the wax and tissue firm and giving them a similar consistency making sectioning easier. Sectioning The sections were cut at 6 µm. As the sections were cut the edge of each section adhered to the previous section to form a ribbon. When the ribbon was long enough (10-15 sections) it was removed from the microtome and the best part of the ribbon was selected for further use. The selected section of the ribbon was mounted on a slide, 20% alcohol was put under the section and was then placed in a water bath to let it float. The section flattened out and wrinkles were removed (floating out of the tissues). The temperature of the water bath was a bit lower than the melting point of wax. A labelled slide was then put in the water bath to collect the section, which was then dried overnight. Dewaxing and rehydration The section was put through two changes of xylene to remove the wax. To rehydrate the tissues, the sections were put through a descending alcohol series and water. Each change of xylene and alcohol was for about 3 minutes.
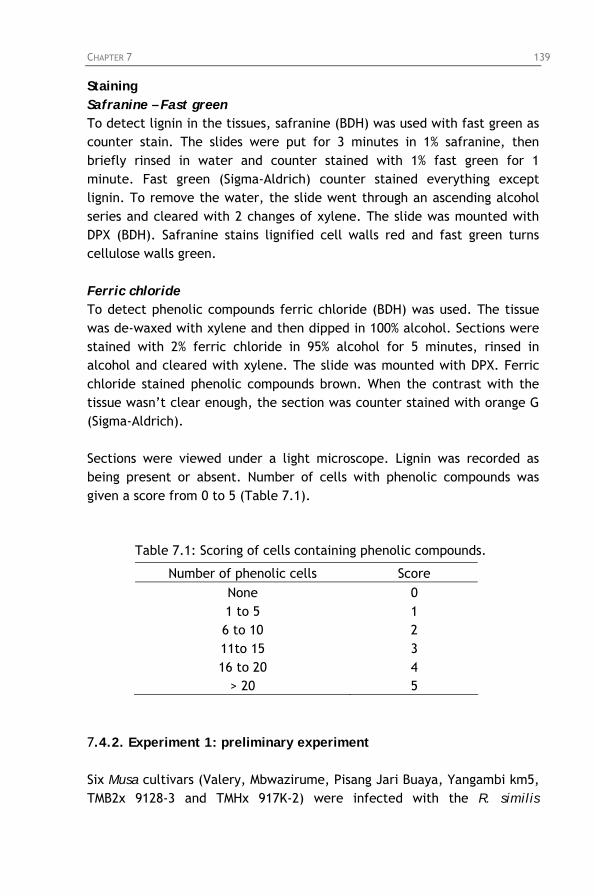
CHAPTER 7 139
Staining Safranine – Fast green To detect lignin in the tissues, safranine (BDH) was used with fast green as counter stain. The slides were put for 3 minutes in 1% safranine, then briefly rinsed in water and counter stained with 1% fast green for 1 minute. Fast green (Sigma-Aldrich) counter stained everything except lignin. To remove the water, the slide went through an ascending alcohol series and cleared with 2 changes of xylene. The slide was mounted with DPX (BDH). Safranine stains lignified cell walls red and fast green turns cellulose walls green. Ferric chloride To detect phenolic compounds ferric chloride (BDH) was used. The tissue was de-waxed with xylene and then dipped in 100% alcohol. Sections were stained with 2% ferric chloride in 95% alcohol for 5 minutes, rinsed in alcohol and cleared with xylene. The slide was mounted with DPX. Ferric chloride stained phenolic compounds brown. When the contrast with the tissue wasn’t clear enough, the section was counter stained with orange G (Sigma-Aldrich). Sections were viewed under a light microscope. Lignin was recorded as being present or absent. Number of cells with phenolic compounds was given a score from 0 to 5 (Table 7.1).
Table 7.1: Scoring of cells containing phenolic compounds.
Number of phenolic cells Score None 0 1 to 5 1 6 to 10 2 11to 15 3 16 to 20 4
> 20 5 7.4.2. Experiment 1: preliminary experiment Six Musa cultivars (Valery, Mbwazirume, Pisang Jari Buaya, Yangambi km5, TMB2x 9128-3 and TMHx 917K-2) were infected with the R. similis
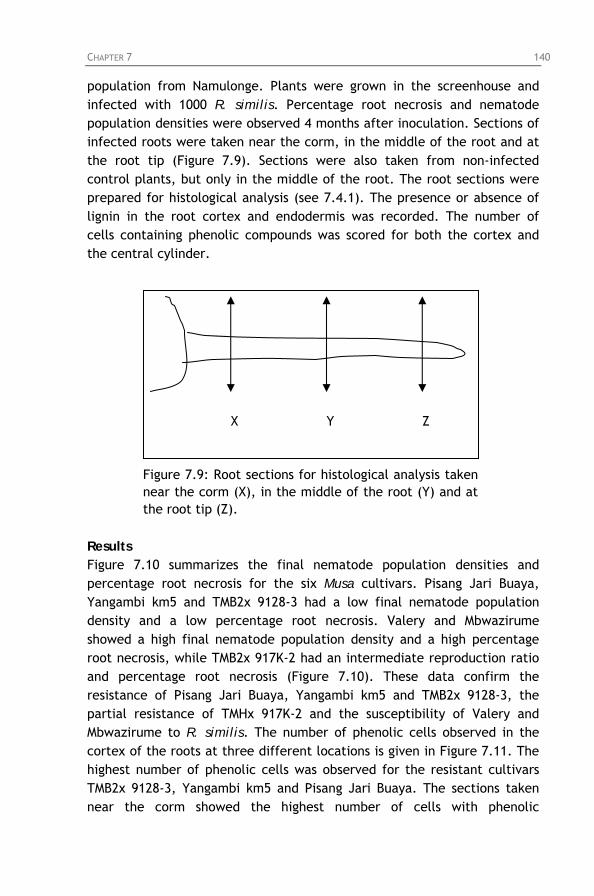
CHAPTER 7 140
population from Namulonge. Plants were grown in the screenhouse and infected with 1000 R. similis. Percentage root necrosis and nematode population densities were observed 4 months after inoculation. Sections of infected roots were taken near the corm, in the middle of the root and at the root tip (Figure 7.9). Sections were also taken from non-infected control plants, but only in the middle of the root. The root sections were prepared for histological analysis (see 7.4.1). The presence or absence of lignin in the root cortex and endodermis was recorded. The number of cells containing phenolic compounds was scored for both the cortex and the central cylinder. X Y Z
Figure 7.9: Root sections for histological analysis taken near the corm (X), in the middle of the root (Y) and at the root tip (Z).
Results Figure 7.10 summarizes the final nematode population densities and percentage root necrosis for the six Musa cultivars. Pisang Jari Buaya, Yangambi km5 and TMB2x 9128-3 had a low final nematode population density and a low percentage root necrosis. Valery and Mbwazirume showed a high final nematode population density and a high percentage root necrosis, while TMB2x 917K-2 had an intermediate reproduction ratio and percentage root necrosis (Figure 7.10). These data confirm the resistance of Pisang Jari Buaya, Yangambi km5 and TMB2x 9128-3, the partial resistance of TMHx 917K-2 and the susceptibility of Valery and Mbwazirume to R. similis. The number of phenolic cells observed in the cortex of the roots at three different locations is given in Figure 7.11. The highest number of phenolic cells was observed for the resistant cultivars TMB2x 9128-3, Yangambi km5 and Pisang Jari Buaya. The sections taken near the corm showed the highest number of cells with phenolic
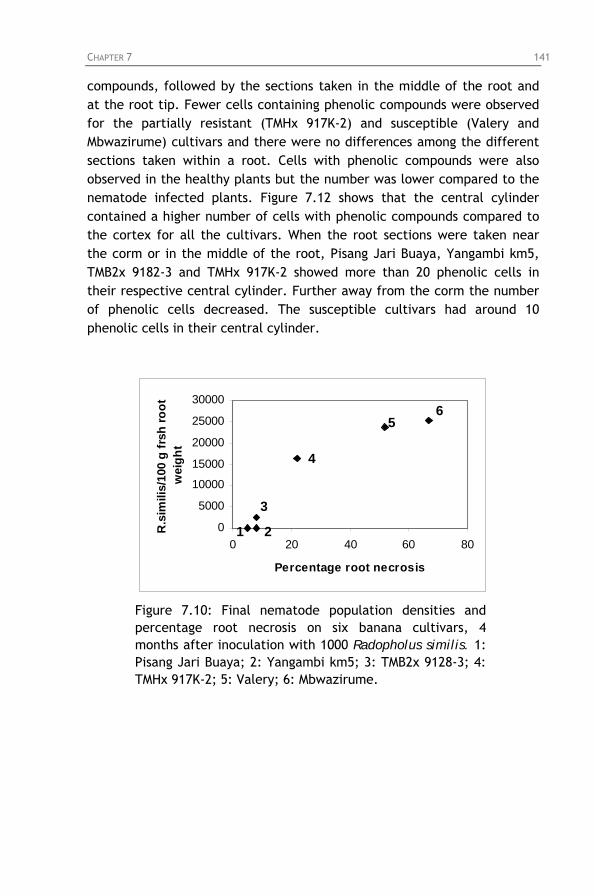
CHAPTER 7 141
compounds, followed by the sections taken in the middle of the root and at the root tip. Fewer cells containing phenolic compounds were observed for the partially resistant (TMHx 917K-2) and susceptible (Valery and Mbwazirume) cultivars and there were no differences among the different sections taken within a root. Cells with phenolic compounds were also observed in the healthy plants but the number was lower compared to the nematode infected plants. Figure 7.12 shows that the central cylinder contained a higher number of cells with phenolic compounds compared to the cortex for all the cultivars. When the root sections were taken near the corm or in the middle of the root, Pisang Jari Buaya, Yangambi km5, TMB2x 9182-3 and TMHx 917K-2 showed more than 20 phenolic cells in their respective central cylinder. Further away from the corm the number of phenolic cells decreased. The susceptible cultivars had around 10 phenolic cells in their central cylinder.
0
5000
10000
15000
20000
25000
30000
0 20 40 60 80
Percentage root necrosis
R.s
imili
s/10
0 g
frsh
root
w
eigh
t
6 5
4
3
1 2
Figure 7.10: Final nematode population densities and percentage root necrosis on six banana cultivars, 4 months after inoculation with 1000 Radopholus similis. 1: Pisang Jari Buaya; 2: Yangambi km5; 3: TMB2x 9128-3; 4: TMHx 917K-2; 5: Valery; 6: Mbwazirume.
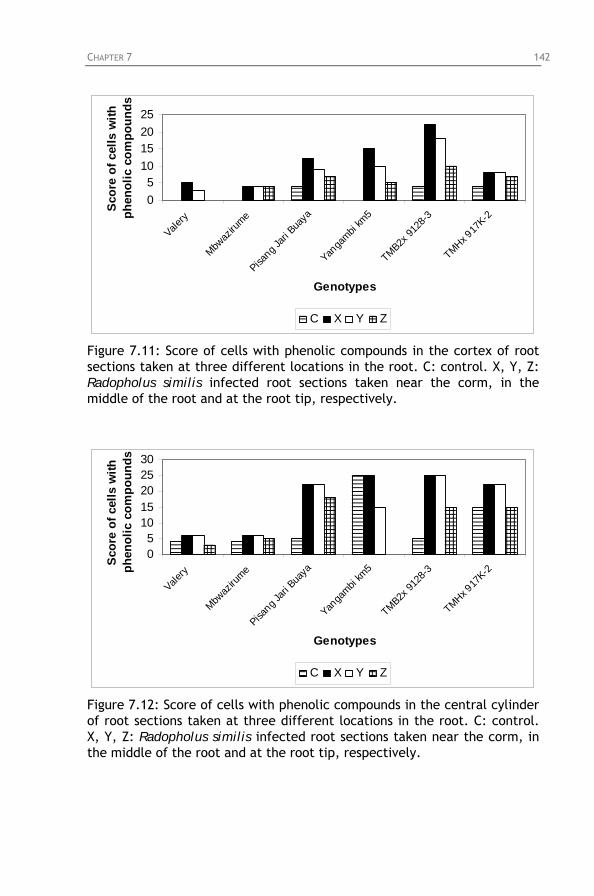
CHAPTER 7 142
05
10152025
Valery
Mbwaz
irume
Pisang J
ari B
uaya
Yanga
mbi km
5
TMB2x 91
28-3
TMHx 917
K-2
Genotypes
Scor
e of
cel
ls w
ith
phen
olic
com
poun
ds
C X Y Z
Figure 7.11: Score of cells with phenolic compounds in the cortex of root sections taken at three different locations in the root. C: control. X, Y, Z: Radopholus similis infected root sections taken near the corm, in the middle of the root and at the root tip, respectively.
05
1015202530
Valery
Mbwaz
irume
Pisang J
ari B
uaya
Yanga
mbi km
5
TMB2x 91
28-3
TMHx 917
K-2
Genotypes
Scor
e of
cel
ls w
ith
phen
olic
com
poun
ds
C X Y Z
Figure 7.12: Score of cells with phenolic compounds in the central cylinder of root sections taken at three different locations in the root. C: control. X, Y, Z: Radopholus similis infected root sections taken near the corm, in the middle of the root and at the root tip, respectively.
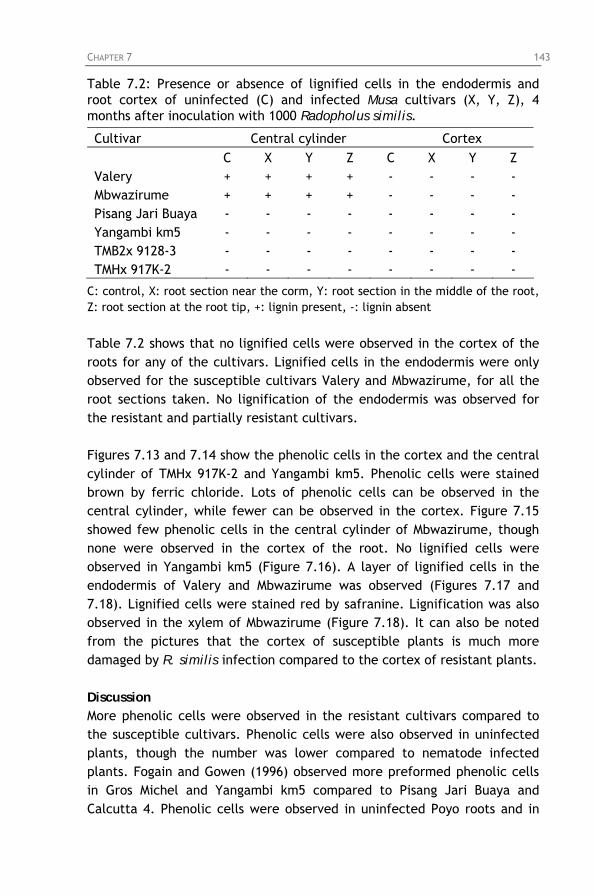
CHAPTER 7 143
Table 7.2: Presence or absence of lignified cells in the endodermis and root cortex of uninfected (C) and infected Musa cultivars (X, Y, Z), 4 months after inoculation with 1000 Radopholus similis.
Cultivar Central cylinder Cortex C X Y Z C X Y Z Valery + + + + - - - - Mbwazirume + + + + - - - - Pisang Jari Buaya - - - - - - - - Yangambi km5 - - - - - - - - TMB2x 9128-3 - - - - - - - - TMHx 917K-2 - - - - - - - -
C: control, X: root section near the corm, Y: root section in the middle of the root, Z: root section at the root tip, +: lignin present, -: lignin absent
Table 7.2 shows that no lignified cells were observed in the cortex of the roots for any of the cultivars. Lignified cells in the endodermis were only observed for the susceptible cultivars Valery and Mbwazirume, for all the root sections taken. No lignification of the endodermis was observed for the resistant and partially resistant cultivars. Figures 7.13 and 7.14 show the phenolic cells in the cortex and the central cylinder of TMHx 917K-2 and Yangambi km5. Phenolic cells were stained brown by ferric chloride. Lots of phenolic cells can be observed in the central cylinder, while fewer can be observed in the cortex. Figure 7.15 showed few phenolic cells in the central cylinder of Mbwazirume, though none were observed in the cortex of the root. No lignified cells were observed in Yangambi km5 (Figure 7.16). A layer of lignified cells in the endodermis of Valery and Mbwazirume was observed (Figures 7.17 and 7.18). Lignified cells were stained red by safranine. Lignification was also observed in the xylem of Mbwazirume (Figure 7.18). It can also be noted from the pictures that the cortex of susceptible plants is much more damaged by R. similis infection compared to the cortex of resistant plants. Discussion More phenolic cells were observed in the resistant cultivars compared to the susceptible cultivars. Phenolic cells were also observed in uninfected plants, though the number was lower compared to nematode infected plants. Fogain and Gowen (1996) observed more preformed phenolic cells in Gros Michel and Yangambi km5 compared to Pisang Jari Buaya and Calcutta 4. Phenolic cells were observed in uninfected Poyo roots and in
CHAPTER 7 144
Yangambi km5 (Valette et al., 1997). Preformed phenolic compounds in uninfected roots do not contribute to the constitutive resistance of banana to R. similis (Valette et al., 1997). When plants were infected with R. similis, a higher number of phenolic cells were observed in the cortex of the root, compared to the control plants. These phenolic cells have been formed as a response to nematode infection. Mateille (1994b) found more phenolic cells in the partially resistant cultivar Gros Michel compared to the susceptible cultivar Poyo. Higher numbers of phenolic cells were observed in Yangambi km5 compared to the susceptible French Sombre and Grande Naine (Fogain, 2000). In general, more phenolic cells were observed in the central cylinder of the root, compared to the cortex. More phenolic cells were observed in root sections taken near the corm, compared to sections taken in the middle of the root and at the root tip. No lignified cells were observed in the cortex of any cultivar. Only lignification in the endodermis was observed in the susceptible cultivars. No lignified cells were observed in the resistant cultivars. However Wuyts et al. (in press) observed lignified cells in both susceptible and resistant cultivars. More detailed studies will be done in the following experiments.
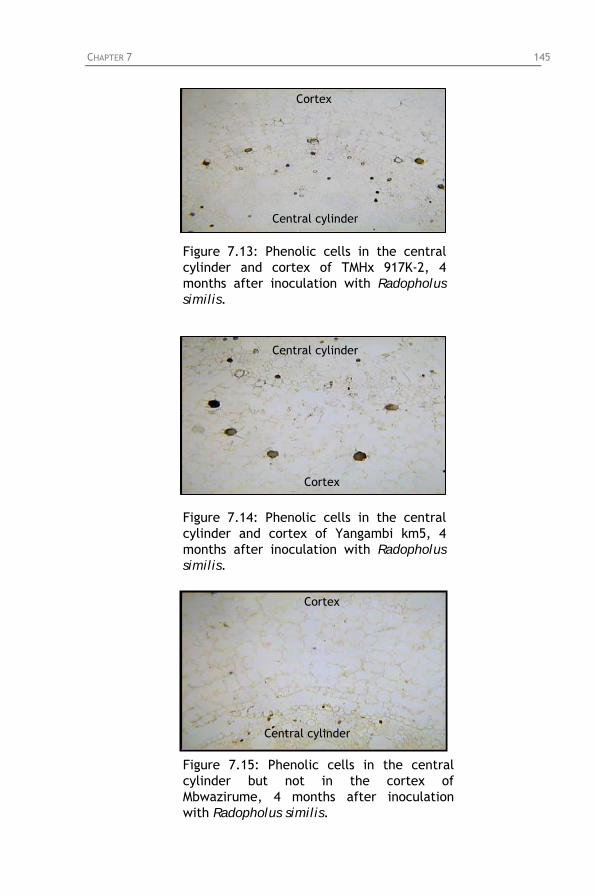
CHAPTER 7 145
Central cylinder
Cortex
Figure 7.13: Phenolic cells in the central cylinder and cortex of TMHx 917K-2, 4 months after inoculation with Radopholus similis.
Central cylinder
Cortex
Figure 7.14: Phenolic cells in the central cylinder and cortex of Yangambi km5, 4 months after inoculation with Radopholus similis.
Central cylinder
Cortex
Figure 7.15: Phenolic cells in the central cylinder but not in the cortex of Mbwazirume, 4 months after inoculation with Radopholus similis.
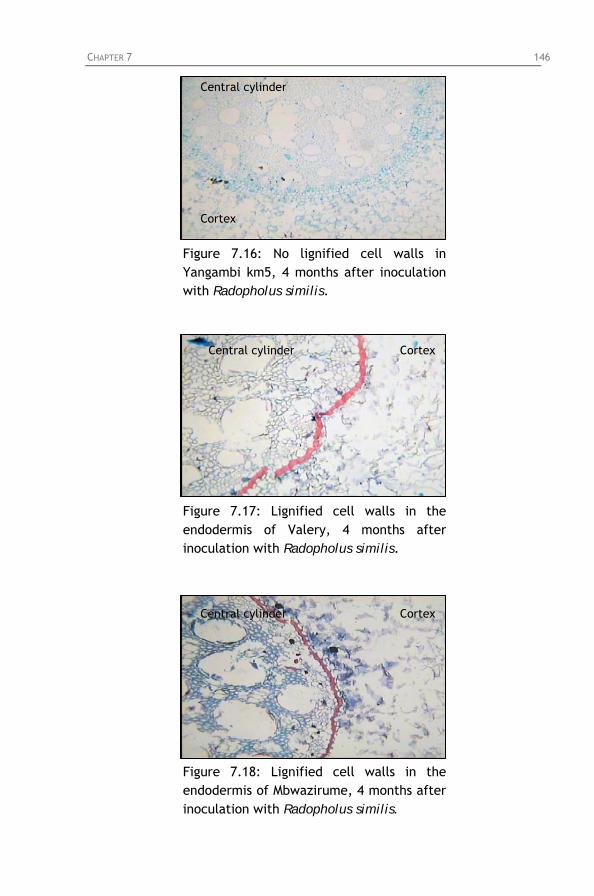
CHAPTER 7 146
Central cylinder
Cortex
Figure 7.16: No lignified cell walls in Yangambi km5, 4 months after inoculation with Radopholus similis.
Central cylinder Cortex
Figure 7.17: Lignified cell walls in the endodermis of Valery, 4 months after inoculation with Radopholus similis.
Central cylinder Cortex
Figure 7.18: Lignified cell walls in the endodermis of Mbwazirume, 4 months after inoculation with Radopholus similis.
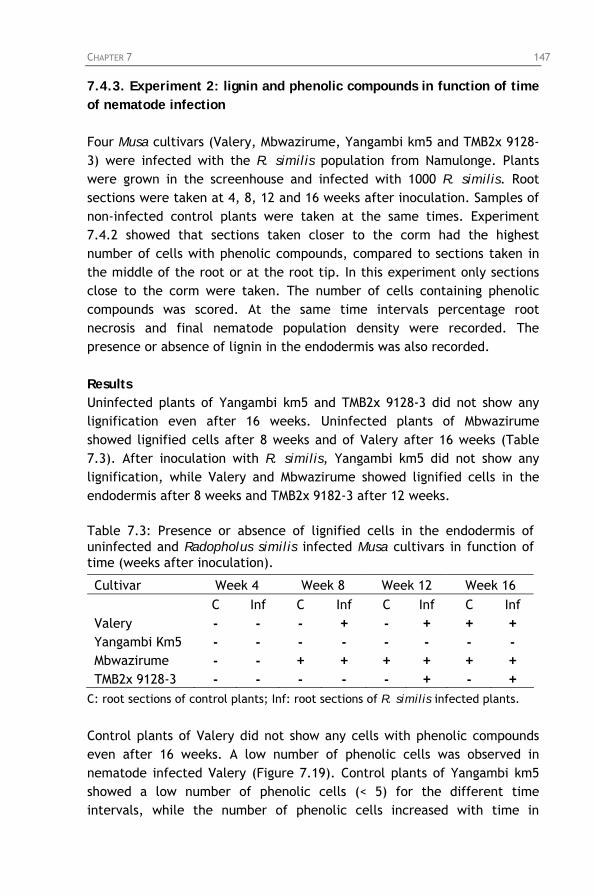
CHAPTER 7 147
7.4.3. Experiment 2: lignin and phenolic compounds in function of time of nematode infection Four Musa cultivars (Valery, Mbwazirume, Yangambi km5 and TMB2x 9128-3) were infected with the R. similis population from Namulonge. Plants were grown in the screenhouse and infected with 1000 R. similis. Root sections were taken at 4, 8, 12 and 16 weeks after inoculation. Samples of non-infected control plants were taken at the same times. Experiment 7.4.2 showed that sections taken closer to the corm had the highest number of cells with phenolic compounds, compared to sections taken in the middle of the root or at the root tip. In this experiment only sections close to the corm were taken. The number of cells containing phenolic compounds was scored. At the same time intervals percentage root necrosis and final nematode population density were recorded. The presence or absence of lignin in the endodermis was also recorded. Results Uninfected plants of Yangambi km5 and TMB2x 9128-3 did not show any lignification even after 16 weeks. Uninfected plants of Mbwazirume showed lignified cells after 8 weeks and of Valery after 16 weeks (Table 7.3). After inoculation with R. similis, Yangambi km5 did not show any lignification, while Valery and Mbwazirume showed lignified cells in the endodermis after 8 weeks and TMB2x 9182-3 after 12 weeks. Table 7.3: Presence or absence of lignified cells in the endodermis of uninfected and Radopholus similis infected Musa cultivars in function of time (weeks after inoculation).
Cultivar Week 4 Week 8 Week 12 Week 16 C Inf C Inf C Inf C Inf
Valery - - - + - + + + Yangambi Km5 - - - - - - - - Mbwazirume - - + + + + + + TMB2x 9128-3 - - - - - + - +
C: root sections of control plants; Inf: root sections of R. similis infected plants.
Control plants of Valery did not show any cells with phenolic compounds even after 16 weeks. A low number of phenolic cells was observed in nematode infected Valery (Figure 7.19). Control plants of Yangambi km5 showed a low number of phenolic cells (< 5) for the different time intervals, while the number of phenolic cells increased with time in
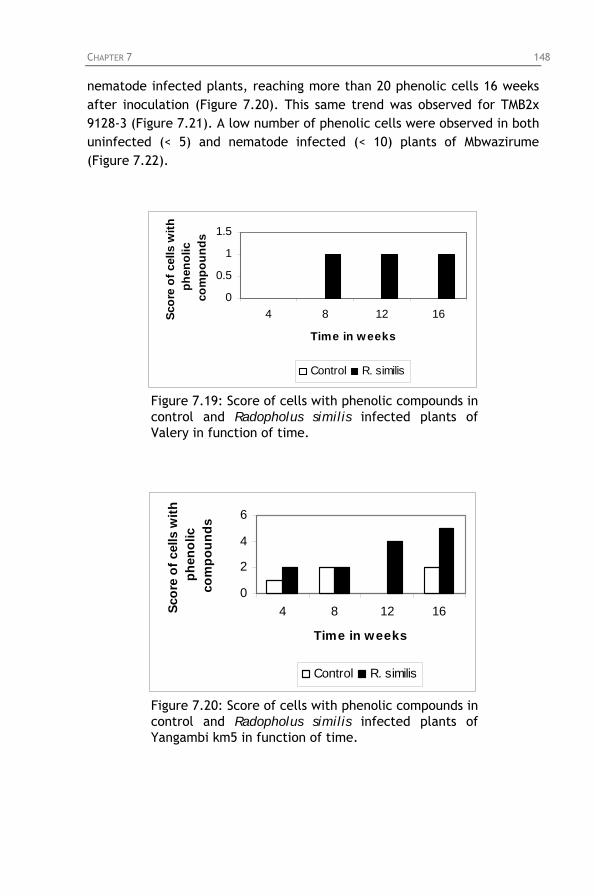
CHAPTER 7 148
nematode infected plants, reaching more than 20 phenolic cells 16 weeks after inoculation (Figure 7.20). This same trend was observed for TMB2x 9128-3 (Figure 7.21). A low number of phenolic cells were observed in both uninfected (< 5) and nematode infected (< 10) plants of Mbwazirume (Figure 7.22).
0
0.5
1
1.5
4 8 12 16
Time in weeks
Scor
e of
cel
ls w
ith
phen
olic
co
mpo
unds
Control R. similis
Figure 7.19: Score of cells with phenolic compounds in control and Radopholus similis infected plants of Valery in function of time.
0
2
4
6
4 8 12 16
Time in weeks
Scor
e of
cel
ls w
ith
phen
olic
co
mpo
unds
Control R. similis
Figure 7.20: Score of cells with phenolic compounds in control and Radopholus similis infected plants of Yangambi km5 in function of time.
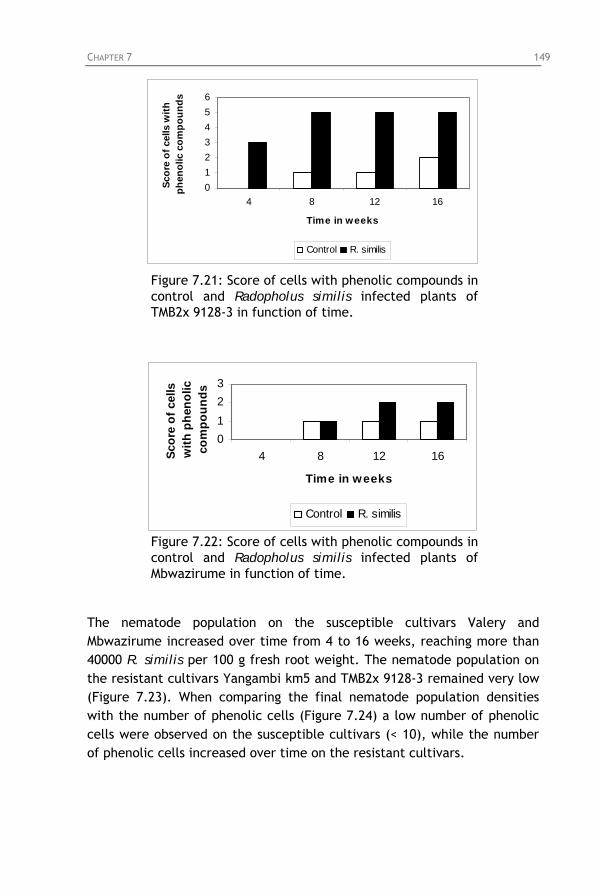
CHAPTER 7 149
0123456
4 8 12 16
Time in weeks
Scor
e of
cel
ls w
ith
phen
olic
com
poun
ds
Control R. similis
Figure 7.21: Score of cells with phenolic compounds in control and Radopholus similis infected plants of TMB2x 9128-3 in function of time.
0123
4 8 12 16
Time in weeks
Scor
e of
cel
ls
with
phe
nolic
co
mpo
unds
Control R. similis
Figure 7.22: Score of cells with phenolic compounds in control and Radopholus similis infected plants of Mbwazirume in function of time.
The nematode population on the susceptible cultivars Valery and Mbwazirume increased over time from 4 to 16 weeks, reaching more than 40000 R. similis per 100 g fresh root weight. The nematode population on the resistant cultivars Yangambi km5 and TMB2x 9128-3 remained very low (Figure 7.23). When comparing the final nematode population densities with the number of phenolic cells (Figure 7.24) a low number of phenolic cells were observed on the susceptible cultivars (< 10), while the number of phenolic cells increased over time on the resistant cultivars.
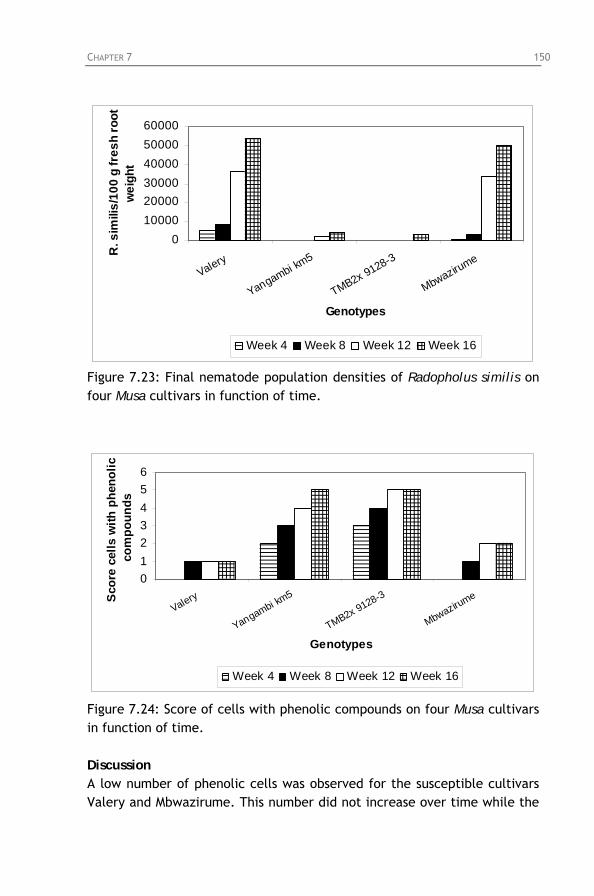
CHAPTER 7 150
0100002000030000400005000060000
Valery
Yangambi km5
TMB2x 9128-3
Mbwazirume
Genotypes
R. s
imili
s/10
0 g
fres
h ro
ot
wei
ght
Week 4 Week 8 Week 12 Week 16
Figure 7.23: Final nematode population densities of Radopholus similis on four Musa cultivars in function of time.
0123456
Valery
Yangambi km5
TMB2x 9128-3
Mbwazirume
Genotypes
Sco
re c
ells
with
phe
nolic
co
mpo
unds
Week 4 Week 8 Week 12 Week 16
Figure 7.24: Score of cells with phenolic compounds on four Musa cultivars in function of time. Discussion A low number of phenolic cells was observed for the susceptible cultivars Valery and Mbwazirume. This number did not increase over time while the
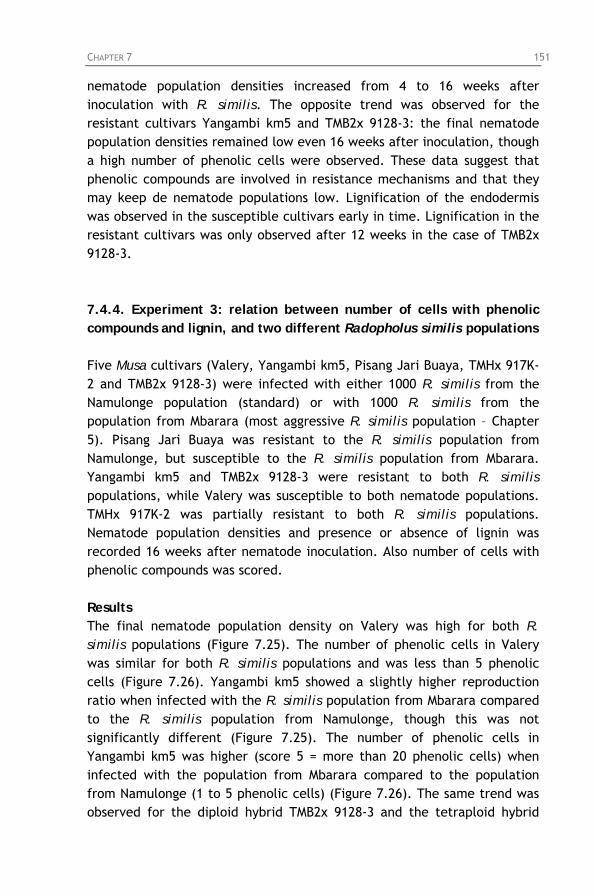
CHAPTER 7 151
nematode population densities increased from 4 to 16 weeks after inoculation with R. similis. The opposite trend was observed for the resistant cultivars Yangambi km5 and TMB2x 9128-3: the final nematode population densities remained low even 16 weeks after inoculation, though a high number of phenolic cells were observed. These data suggest that phenolic compounds are involved in resistance mechanisms and that they may keep de nematode populations low. Lignification of the endodermis was observed in the susceptible cultivars early in time. Lignification in the resistant cultivars was only observed after 12 weeks in the case of TMB2x 9128-3. 7.4.4. Experiment 3: relation between number of cells with phenolic compounds and lignin, and two different Radopholus similis populations Five Musa cultivars (Valery, Yangambi km5, Pisang Jari Buaya, TMHx 917K-2 and TMB2x 9128-3) were infected with either 1000 R. similis from the Namulonge population (standard) or with 1000 R. similis from the population from Mbarara (most aggressive R. similis population – Chapter 5). Pisang Jari Buaya was resistant to the R. similis population from Namulonge, but susceptible to the R. similis population from Mbarara. Yangambi km5 and TMB2x 9128-3 were resistant to both R. similis populations, while Valery was susceptible to both nematode populations. TMHx 917K-2 was partially resistant to both R. similis populations. Nematode population densities and presence or absence of lignin was recorded 16 weeks after nematode inoculation. Also number of cells with phenolic compounds was scored. Results The final nematode population density on Valery was high for both R. similis populations (Figure 7.25). The number of phenolic cells in Valery was similar for both R. similis populations and was less than 5 phenolic cells (Figure 7.26). Yangambi km5 showed a slightly higher reproduction ratio when infected with the R. similis population from Mbarara compared to the R. similis population from Namulonge, though this was not significantly different (Figure 7.25). The number of phenolic cells in Yangambi km5 was higher (score 5 = more than 20 phenolic cells) when infected with the population from Mbarara compared to the population from Namulonge (1 to 5 phenolic cells) (Figure 7.26). The same trend was observed for the diploid hybrid TMB2x 9128-3 and the tetraploid hybrid
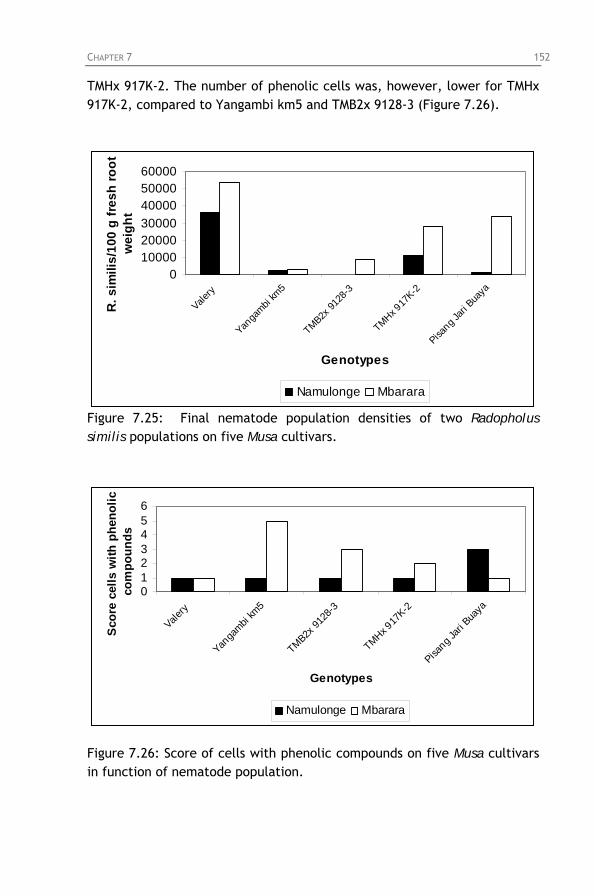
CHAPTER 7 152
TMHx 917K-2. The number of phenolic cells was, however, lower for TMHx 917K-2, compared to Yangambi km5 and TMB2x 9128-3 (Figure 7.26).
0100002000030000400005000060000
Valery
Yanga
mbi km
5
TMB2x 91
28-3
TMHx 917
K-2
Pisang J
ari B
uaya
Genotypes
R. s
imili
s/10
0 g
fres
h ro
ot
wei
ght
Namulonge Mbarara
Figure 7.25: Final nematode population densities of two Radopholus similis populations on five Musa cultivars.
0123456
Valery
Yanga
mbi km
5
TMB2x 91
28-3
TMHx 917
K-2
Pisang J
ari B
uaya
Genotypes
Sco
re c
ells
with
phe
nolic
co
mpo
unds
Namulonge Mbarara
Figure 7.26: Score of cells with phenolic compounds on five Musa cultivars in function of nematode population.
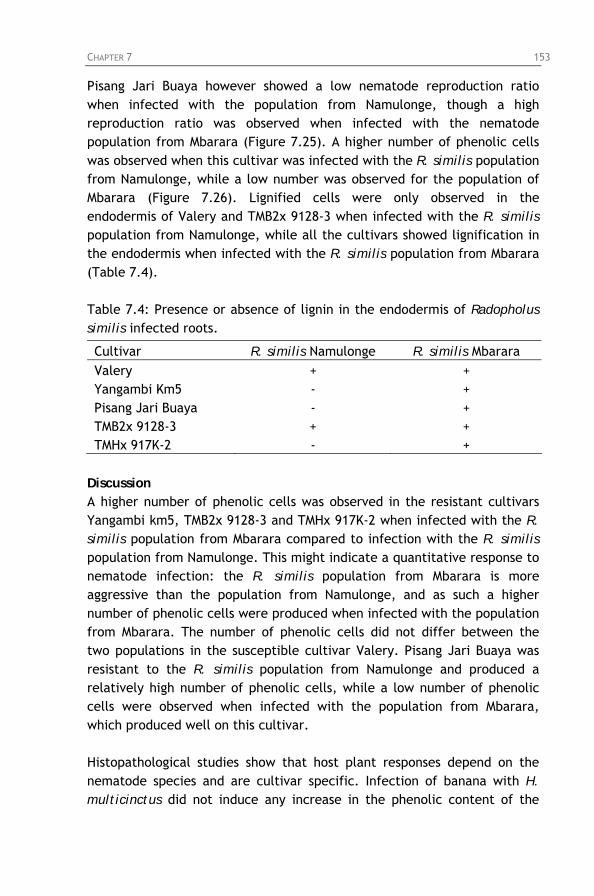
CHAPTER 7 153
Pisang Jari Buaya however showed a low nematode reproduction ratio when infected with the population from Namulonge, though a high reproduction ratio was observed when infected with the nematode population from Mbarara (Figure 7.25). A higher number of phenolic cells was observed when this cultivar was infected with the R. similis population from Namulonge, while a low number was observed for the population of Mbarara (Figure 7.26). Lignified cells were only observed in the endodermis of Valery and TMB2x 9128-3 when infected with the R. similis population from Namulonge, while all the cultivars showed lignification in the endodermis when infected with the R. similis population from Mbarara (Table 7.4). Table 7.4: Presence or absence of lignin in the endodermis of Radopholus similis infected roots.
Cultivar R. similis Namulonge R. similis Mbarara Valery + + Yangambi Km5 - + Pisang Jari Buaya - + TMB2x 9128-3 + + TMHx 917K-2 - +
Discussion A higher number of phenolic cells was observed in the resistant cultivars Yangambi km5, TMB2x 9128-3 and TMHx 917K-2 when infected with the R. similis population from Mbarara compared to infection with the R. similis population from Namulonge. This might indicate a quantitative response to nematode infection: the R. similis population from Mbarara is more aggressive than the population from Namulonge, and as such a higher number of phenolic cells were produced when infected with the population from Mbarara. The number of phenolic cells did not differ between the two populations in the susceptible cultivar Valery. Pisang Jari Buaya was resistant to the R. similis population from Namulonge and produced a relatively high number of phenolic cells, while a low number of phenolic cells were observed when infected with the population from Mbarara, which produced well on this cultivar. Histopathological studies show that host plant responses depend on the nematode species and are cultivar specific. Infection of banana with H. multicinctus did not induce any increase in the phenolic content of the
CHAPTER 7 154
roots, though a higher number of phenolic cells were observed when infected with R. similis (Mateille, 1994a). The present study indicates that host plant responses differ among different nematode populations within a species. 7.5. General discussion and conclusion The present study indicates that there is no difference in attraction and penetration of R. similis between susceptible and resistant Musa cultivars. Nematodes freely penetrate roots of susceptible and resistant cultivars alike and incompatibility at this stage may occur but is uncommon (Kaplan and Keen, 1980). Kathiresan and Mehta (2002) observed no significant difference in the numbers of P. zeae that invaded resistant and susceptible sugarcane clones at 12 and 24 h after inoculation. However at 168 h after inoculation the number of penetrated nematodes was less in the resistant than in the susceptible clones. At 21 days after inoculation, cell walls were thickened in nematode infected zones in the resistant cultivars, but in the susceptible cultivars the cortical cells were collapsed (Kathiresan and Mehta, 2002). Mechanical barriers, e.g. lignin-like substances, might restrict or limit the penetration of nematodes, but once after penetration these substances have no role in controlling the reproduction ratio (Kathiresan and Mehta, 2002). Similar invasion rates of R. similis on resistant and susceptible Musa cultivars suggest that the resistance is not due to physical or mechanical barriers. Root exudates may be important as attractants or repellents (Kaplan and Keen, 1980). Wuyts et al. (2002) tested plant secondary metabolites for chemotactic behaviour. Caffeic acid, a lignin precursor, had repelling effects on R. similis and P. penetrans. Other lignin precursors did not have any repellent effect, nor did tannine. The flavonols kaempferol, quercetin and myricetin had the most profound repelling effect on R. similis and P. penetrans (Wuyts et al., 2002). In an incompatible combination the plant may not supply the proper quantity or quality of food for the nematode, the plant may contain nematicidal compounds or produce them, may neutralize the nematode saliva or may isolate the nematode or its feeding site by a hypersensitive reaction (Gommers, 1981). The resistant reactions of plants to nematodes are not always confined to the feeding sites or vicinity of the nematodes
CHAPTER 7 155
but are often related to changes in metabolism of whole tissues. Indolacetic acid, kinetin, mono- and polyphenols, aglycones and IAA-oxidase are thought to interact and depending on the relative concentrations, to result in a susceptible or resistant reaction (Gommers, 1981). Earlier reports on resistance mechanisms in banana roots deal with the hypothesis that Pisang Jari Buaya constitutively contains higher amounts of lignin (Fogain and Gowen, 1996; Elsen et al., in press). Among the cultivars tested, Pisang Jari Buaya and Calcutta 4 had the highest lignification of the central cylinder, while Yangambi km5 and susceptible cultivars had very few or no lignified cell walls (Fogain and Gowen, 1996; Elsen et al., in press). Wuyts et al. (in press) reported no difference in the level of lignification between resistant and susceptible cultivars. In roots of Grande Naine, cells of the endodermis and central cylinder showed the same degree of thickening of their walls as those of the resistant Pisang Jari Buaya and Yangambi km5. Lignification increased with the age of the roots (Wuyts et al., in press). This observation might explain the contradictory observations on the occurrence of nematodes in the central cylinder of banana roots (Valette et al., 1997; Elsen et al., in press). The lignified cells in the endodermis prevent the nematodes from penetrating the central cylinder and affecting the vascular tissues (Fogain, 2000; Blake, 1966), but in young roots nematodes can be found in the central cylinder (Mateille, 1994a; Sarah et al., 1996) because the barrier (lignified endodermis) is not yet developed. Wuyts et al. (in press) reported that the thickened endodermis was predominantly composed of guaiacyl units (derived from caffeic acid) in Yangambi km5, while in Pisang Jari Buaya and Grande Naine mainly syringyl units (derived from sinapic acid) were observed. Fogain and Gowen (1996) observed that susceptible cultivars had a lower percentage dry root matter compared to resistant cultivars. Fogain and Gowen (1996) observed more preformed phenolic cells in the partially resistant cultivar Gros Michel and in Yangambi km5 compared to Pisang Jari Buaya and Calcutta 4. Mateille (1994b) found more cells with phenolic compounds in Gros Michel, compared to the susceptible cultivar Poyo. More phenolic cells were observed in uninfected Poyo roots and in Yangambi km5 (Valette et al., 1997). Fogain (2000) also reported higher number of cells with phenolic compounds in Yangambi km5 compared to the susceptible cultivars French Sombre and Grande Naine. According to Valette et al. (1997), phenolics in healthy roots do not contribute to the
CHAPTER 7 156
constitutive resistance of banana in Musa. Wuyts et al. (in press) found lower numbers of phenolic cells in the cortex of Yangambi km5 compared to Pisang Jari Buaya. The number of phenolic cells did not increase in the cortex (Wuyts et al., in press; Elsen et al., in press). The number of phenolic cells increased in the central cylinder when necrosis had developed in the cortex. The phenolic compounds were identified as the flavonols quercetin and kaempferol (Wuyts et al., in press). After infection, flavonoids were seen to accumulate early in cell walls close to the nematode migrating channel in all tissues of the infected roots including the vascular tissues (Valette et al., 1998). Plants synthesize a wide variety of pre-infectional and post-infectional compounds which are active against root nematodes (Collingborn et al., 2000). Phytoalexins are antibiotic compounds synthesized in an infected plant in response to infection (Veech, 1982) to limit the spread or development of the invading organism. Binks et al. (1997) isolated the phytoalexin, 2-hydroxy-9-phenylphenalen-1-one, from Pisang sipuli (AA) and associated it with the hypersensitive reaction to R. similis. Root samples from plants which had been inoculated with nematodes showed a significant increase in phytoalexin production, compared to uninfected plants. This compound was also found to be produced in response to fungal attack in Grande Naine. Collingborn et al. (2000) tested whether tannins were present in Musa roots and if they were produced in response to R. similis and could contribute to the resistance mechanisms. Concentrations of condensed tannins and flavan-3,4-diols were significantly higher after R. similis infection in resistant and susceptible Musa cultivars (Yangambi km5, Kunnan and Dwarf Cavendish). The cultivar Kunnan had higher levels of condensed tannins pre- and post-infectionally compared to Yangambi km5 and Dwarf Cavendish, indicating that tannins could be involved in the resistance mechanisms. Tannin composition differed among the cultivars; propelargonidins were only present in Kunnan. Preliminary screening for R. similis resistance of Musa cultivars could include the butanol/HCl assay as a rapid test for both flavan-3,4-diols and condensed tannins (Collingborn et al., 2000). In resistant bananas, phenols including flavonoids, caffeic esters and dopamine may limit root penetration by the nematode and the high level of vascular lignification and suberization of endodermal cells restricts
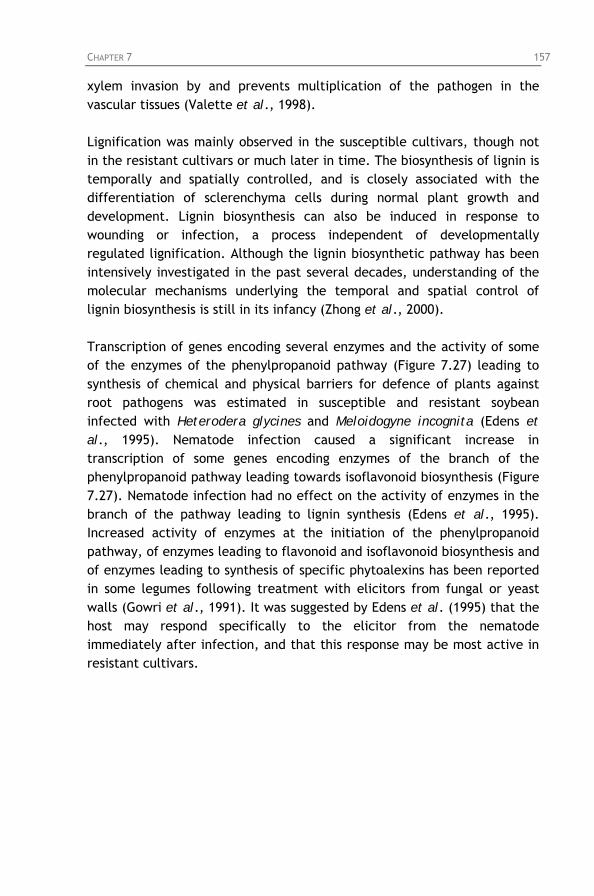
CHAPTER 7 157
xylem invasion by and prevents multiplication of the pathogen in the vascular tissues (Valette et al., 1998).
Lignification was mainly observed in the susceptible cultivars, though not in the resistant cultivars or much later in time. The biosynthesis of lignin is temporally and spatially controlled, and is closely associated with the differentiation of sclerenchyma cells during normal plant growth and development. Lignin biosynthesis can also be induced in response to wounding or infection, a process independent of developmentally regulated lignification. Although the lignin biosynthetic pathway has been intensively investigated in the past several decades, understanding of the molecular mechanisms underlying the temporal and spatial control of lignin biosynthesis is still in its infancy (Zhong et al., 2000).
Transcription of genes encoding several enzymes and the activity of some of the enzymes of the phenylpropanoid pathway (Figure 7.27) leading to synthesis of chemical and physical barriers for defence of plants against root pathogens was estimated in susceptible and resistant soybean infected with Heterodera glycines and Meloidogyne incognita (Edens et al., 1995). Nematode infection caused a significant increase in transcription of some genes encoding enzymes of the branch of the phenylpropanoid pathway leading towards isoflavonoid biosynthesis (Figure 7.27). Nematode infection had no effect on the activity of enzymes in the branch of the pathway leading to lignin synthesis (Edens et al., 1995). Increased activity of enzymes at the initiation of the phenylpropanoid pathway, of enzymes leading to flavonoid and isoflavonoid biosynthesis and of enzymes leading to synthesis of specific phytoalexins has been reported in some legumes following treatment with elicitors from fungal or yeast walls (Gowri et al., 1991). It was suggested by Edens et al. (1995) that the host may respond specifically to the elicitor from the nematode immediately after infection, and that this response may be most active in resistant cultivars.
CHAPTER 7 158
PAL: Phenylalanine ammonia lyase 2: Cinnamate-4-hydroxylase 3: 4-coumarate coa ligase 4: Acetyl coa carboxylase CHS: Cbalcone(flavone) synthase CHI: Chalcone isomerase CoCAR: CinnomyI-CoA:NADP oxidoreductase (cinnomyl coa Reductase) CAD: Cinnomyl alcohol:NADP oxidoreductase (cinnomyl Alcohol dehydrogenase) Figure 7.27: Outline of the various branches of the phenylpropanoid pathway of secondary metabolism in plants leading to production of macromolecules involved in resistance to biotic and abiotic stress. Pathway branches: A. Flavone and flavonol glycosides; B. Lignin; C. Cell wall-bound phenolics; D. Suberin; E. Soluble esters. Source: Edens et al. (1995). Building on the above hypothesis that the pathway leading towards flavonoids, flavonols and isoflavonoids is more active in resistant plants after nematode infection compared to susceptible plants, this might explain the high number of phenolic compounds observed in resistant Musa
CHAPTER 7 159
cultivars. This might also give indications why lignification was mostly observed in susceptible cultivars and not or much later in time in resistant cultivars. As the pathway towards production of phenolic compounds is more expressed in resistant plants, resistant plants will first concentrate on producing phenolic compounds to control the nematode infection. Lignification could be delayed till later. As the pathway leading towards phenolic compounds is not more actively expressed in susceptible cultivars and the pathway leading towards lignin is not influenced by nematode infection, susceptible cultivars have no preference for one pathway or another upon nematode infection, and lignin formation occurs early. Both pathways are not exclusive from one another, e.g. few phenolic cells were observed in susceptible cultivars showing lignification. The pathway towards phenolic compounds is more expressed in resistant cultivars. Lignification of the endodermis is more important for susceptible cultivars to avoid penetration of the nematodes into the central cylinder. This hypothesis should however be confirmed. Further studies are needed to quantify and characterise the specific compounds involved in the pathway leading to phenolic compounds. Also more detailed studies are needed on host plant response in relation to nematode populations differing in pathogenicity.

CHAPTER 7 160
CHAPTER 8 161
Chapter 8: Conclusions and recommendations
The East African highland banana is the major staple food crop in Uganda. Banana production has, however, declined over the past 25 years by more than 25%. Nematodes are one of the major constraints causing this decline. The burrowing nematode, Radopholus similis, is the most destructive nematode species in Uganda. Host plant resistance was identified as one of the most promising strategies for nematode management in Uganda. Our research tried to contribute by identifying sources of resistance to R. similis in existing Musa germplasm and by developing hybrids with resistance to R. similis. This study also looked at variability in pathogenicity of different R. similis populations from Uganda and aimed at a better understanding of host plant resistance to R. similis through genetic analysis of a segregating banana population and preliminary studies on the mechanisms of resistance. In Chapter 3, a new screening method was developed for identifying resistance to R. similis in Musa germplasm. This method allows the identification of resistance at an early growth stage of the plant and is based on the inoculation of individual roots with 50 R. similis females. It has the advantage compared to the standard greenhouse screening method that fewer plants (three plants instead of eight) and a lower nematode inoculum (50 nematodes per individual root compared to 1000 nematodes per plant) are needed. By using individual roots, the evaluation of the host response to nematode infection is not influenced by differences in root growth rates among Musa genotypes. Moreover, primary roots of the same age can be selected for inoculation, avoiding bias caused by differences in host response to R. similis related to root age. In addition, this method seems to be able to pick up both constitutive and induced resistance. The resistance of Yangambi km5, Pisang Jari Buaya and SH-3142 to R. similis was confirmed using this early screening method. This new screening method was used to screen Musa germplasm for resistance to R. similis (Chapter 4). East African highland bananas are susceptible to R. similis, confirming observations in the field. Radopholus similis resistant tetraploid hybrids have been developed by crossing susceptible East African highland bananas with the resistant wild diploid banana, Calcutta 4. This diploid is a useful source of disease and pest
CHAPTER 8 162
resistance and has been widely used in breeding programs as a male parent. Several resistant diploid hybrids have been developed which were used to further improve the tetraploid hybrids. TMB2x 9128-3 is the most resistant diploid hybrid identified so far and is often used in the breeding program. Tetraploid hybrids have been further crossed with improved diploids, resulting in secondary triploids. Five secondary triploids with resistance to and seven with partial resistance to R. similis have been developed. Three of the secondary triploids with partial resistance to R. similis have good bunch characteristics and a matooke-like taste. The hybrid 1968-2 is resistant to R. similis, black Sigatoka and the banana weevil and is recommended for juice production. Additional sources of resistance to R. similis have been identified among the germplasm of Papua New Guinea, which could be used as potential parents in the breeding program to improve the East African highland bananas. The information obtained on host plant response of Musa germplasm to R. similis is now being used by IITA’s Musa breeding program. For example, Kokopo, which is highly resistant to R. similis and male fertile, is selected as a male parent for crosses with selected tetraploid hybrids. East African highland bananas are currently being crossed with improved diploids. Also tetraploid hybrids are being crossed with improved diploids to obtain secondary triploids. During 2003, a first field experiment was established on-station in Namulonge, Uganda, to evaluate some of the promising hybrids in the field under a mixed nematode population. In Chapter 5, different R. similis populations from Uganda were compared for their variability in reproductive fitness and virulence. Four R. similis populations of different locations within Uganda (Namulonge, Mbarara, Ikulwe and Mukono) were collected and cultured monoxenically on carrot discs. Reproductive fitness of the four R. similis populations was compared on carrot discs as a function of time and inoculum level. The R. similis population from Mbarara had a higher reproduction ratio compared to the other three populations. This was shown both by comparison of the final nematode population densities and by calculating the growth curves using the Gompertz equation. The population from Mukono had the lowest reproduction ratio. Pathogenicity experiments on host plants were carried out in pot trials. Both the final nematode population densities and percentages root necrosis on different host plants were higher for the R. similis population from Mbarara than for the populations from Namulonge, Ikulwe and Mukono. The cultivars Valery and Grande Naine were susceptible to the four R. similis populations, though the highest
CHAPTER 8 163
reproduction ratio was obtained when infected with the population from Mbarara. The R. similis population from Mbarara managed to break the resistance of Pisang Jari Buaya, world-wide known to be resistant to R. similis. This population also reproduced well on Calcutta 4, while a low reproduction ratio was observed when infected with the populations from Namulonge and Mukono. Being susceptible to the R. similis population from Mbarara, Calcutta 4 might not be the ideal parent to include in breeding programs for nematode resistance. For example, the tetraploid hybrid TMHx 660K-1, which derived from the cross between Enzirabahima and Calcutta 4, is resistant to the R. similis population from Namulonge and Mukono, but susceptible to the population from Mbarara. The diploid hybrid TMB2x 9128-3 and Yangambi km5 showed resistance against the four R. similis populations. These results indicate that differences in pathogenicity among different R. similis populations exist and should be taken into consideration in the breeding program. It is recommended to use the R. similis population from Mbarara in routine screening for identification of resistance in Musa germplasm. The fact that the R. similis population from Mbarara is more pathogenic than the other populations may have serious implications for farmers as Mbarara is the main banana growing area in Uganda. Recent observations in farmers’ fields in Mbarara show that R. similis infestation is localised at the moment and that those farms are heavily infested with a high toppling incidence. Farmers have been highly recommended to use either tissue culture plants or hot water treated suckers to establish new plantations to avoid movement of R. similis infected banana planting material in the region. In Chapter 6, we studied the genetic analysis of segregation for resistance to R. similis in a diploid banana hybrid population. This diploid banana hybrid population was derived by crossing the diploid hybrids TMB2x 6142-1 and TMB2x 8075-7. The female parent TMB2x 6142-1 is susceptible to R. similis and derived from the cross between the East African highland banana Nyamwihogora (AAA) and the wild banana Long Tavoy (AA), which are both susceptible to R. similis. The male parent TMB2x 8075-7 is resistant to R. similis and derived from the cross between the bred hybrid SH-3362 (AA) and the wild banana Calcutta 4 (AA), which are both resistant to R. similis. The diploid banana hybrid population was evaluated with the individual root inoculation method using the R. similis population from Namulonge. Of the 81 hybrids evaluated, 37 hybrids were resistant, 13 hybrids were partially resistant and 31 hybrids were susceptible to R. similis. After chi-square analysis, the results indicated that resistance to
CHAPTER 8 164
R. similis is controlled by two dominant genes, A and B, with additive and interactive effects, whereby recessive bb suppresses dominant A (either A- or B- required for partial resistance, both A- and B- confer full resistance, but bb suppresses A-). However, as this resistance to R. similis is oligogenically inherited, the resistance might be broken down by the emergence of new, more virulent pathotypes. Pisang Jari Buaya showed resistance to the R. similis populations from Namulonge and Mukono, but was susceptible to the R. similis population from Mbarara. On the other hand, Yangambi km5 and TMB2x 9128-3 were resistant to the four nematode populations tested from Uganda. It would be recommended to evaluate other segregating Musa populations. In addition, screening of these segregating Musa populations should be done with several R. similis populations, differing in pathogenicity. In the last part of the study (Chapter 7), potential mechanisms of resistance to R. similis were studied. Knowledge on the mechanisms of nematode resistance may help the breeder to select for a desired characteristic for the breeding program, and may also assist in the identification of resistance markers to facilitate screening of Musa germplasm for a desired characteristic. In a first set of experiments, the attraction and penetration ability of R. similis was compared among resistant and susceptible Musa cultivars. No significant differences in attraction and penetration of R. similis were observed between resistant and susceptible cultivars. Nematodes penetrated roots of susceptible and resistant cultivars alike. Similar invasion rates of R. similis on resistant and susceptible Musa cultivars, suggests that the resistance is not due to physical or mechanical barriers. Subsequently, histo-chemical experiments were carried out to detect whether there are differences in lignin and phenolic compounds between susceptible and resistant Musa cultivars. After R. similis infection, a higher number of phenolic cells were observed in the resistant cultivars compared to the susceptible cultivars. Phenolic cells were also observed in healthy plants, though the number was lower compared to nematode infected plants. It is assumed that preformed phenolic compounds in healthy roots do not contribute to the constitutive resistance of banana to R. similis. Lignification of the endodermis was observed in the susceptible cultivars early in time. Lignification in the resistant cultivars was only observed after 12 weeks. No lignification was observed in the cortex of any cultivar. A higher number of phenolic compounds were observed in resistant cultivars when infected with the R. similis population from Mbarara, in comparison to infection with the R.
CHAPTER 8 165
similis population from Namulonge. It is hypothesized that the enzymes in the phenylpropanoid pathway, in the branch of the pathway leading to flavonoids, flavonols and isoflavonoids are more active in resistant plants after nematode infection compared to susceptible plants, while there is no effect on the activity of enzymes in the branch of the pathway leading to lignin synthesis. This might explain the high number of phenolic compounds observed in resistant Musa cultivars and might give indications why lignification was mostly observed in susceptible cultivars and much later in time in resistant cultivars. Overall we can conclude that breeding for resistance to R. similis within East African highland bananas is possible. Several hybrids with resistance to R. similis were developed. Differences were observed in pathogenicity among R. similis populations from Uganda and routine screening should be done with the most pathogenic population. The genetic system suggested by our research findings needs further marker-aided analysis to confirm the inheritance model of host plant resistance to R. similis. More detailed studies are needed to understand the role of phenolic compounds and lignin formation in relation to host plant response to nematode infection, and to quantify and characterise the specific compounds involved.

CHAPTER 8 166
REFERENCES 167
References
1. Afreh-Nuamah K., Ahiekpor E.K.S., Ortiz R. and Ferris R.S.B. 1996.
Advanved Musa yield trial at the university of Ghana Agricultural Research station, Kade. 2. Banana weevil and nematode resistance. In: Ortiz R. and Akoroda M.O. (Eds). Plantain and banana production and research in West and Central Africa. Proceedings of a Regional Workshop, Onne, Nigeria, 23-27 September 1995. IITA, Ibadan, Nigeria, pp. 133-136.
2. Agrios G. 1997. Plant pathology, 4th edition. Academic Press, London, UK,
pp. 565-597.
3. Araya M., Vargas A. and Cheves A. 1998. Changes in distribution of roots of banana (Musa AAA cv. Valery) with plant height, distance from the pseudostem and soil dept. Journal of Horticultural Science and Biotechnology 73(4): 437-440.
4. Araya M., Vargas A. and Cheves A. 1999. Nematode distribution in roots of
banana (Musa AAA cv. Valery) in relation to plant height, distance from the pseudostem and soil depth. Nematology 1(7-8): 711-716.
5. Arnaud E. and Horry J.P. (Eds) 1997. Musalogue: a catalogue of Musa
germplasm. Papua New Guinea collecting missions, 1988-1989. INIBAP, Montpellier, France.
6. Banu J. G. and Rajendran G. 2002. Effect of temperature on the
multiplication of Radopholus similis on carrot discs. International Journal of Nematology 12(2): 234-235.
7. Barekye A., Kashaija I.N., Adipala E. and Tushemereirwe W.K. 1999.
Pathogenicity of Radopholus similis and Helicotylenchus multicinctus on bananas in Uganda. In: Frison E.A., Gold C.S., Karamura E.B. and Sikora R.A. (Eds). Mobilising IPM for sustainable banana production in Africa. Proceedings of a workshop on banana IPM held in Nelspruit, South Africa, 23-28 November 1998. INIBAP, Montpellier, France, pp. 319-326.
8. Barker K.R. 1993. Resistance/tolerance and related concepts/terminology
in plant nematology. Plant Disease 77(2): 111-113.
REFERENCES 168
9. Beckman C.H. and Mueller W.C. 1970. Distribution of phenols in specialised cells of banana roots. Phytopathology 60: 79-82.
10. Bekunda M.A., Wortmann C.S., Bwamiki D.P. and Okwakol M. 2003.
Potentials and challenges of soil fertility management in the banana based cropping systems of Eastern Africa. In: Gichuri M.P., Bationo A., Bekunda M.A., Goma H.C., Mafongoya P.L., Mugendi D.N., Murwuira H.K., Nandwa S.M., Nyathi P. and Swift M.J. (Eds). Soil fertility management in Africa: a regional perspective. CIP – TSBF, Nairobi, Kenya, pp.123-145.
11. Belpaire B. 1997. Studie van de infectie door nematoden van Oost-
Afrikaanse hooglandbananen in Oeganda. MSc Thesis, Katholieke Universiteit Leuven, Belgium, 194 pp.
12. Bilgrami A.L., Ahmad I. and Jairajpuri M.S. 1985. Responses of adult
Hirschmanniella oryzae towards different plant roots. Revue Nématologie 8(3): 265-271.
13. Binks R.H. and Gowen S.R. 1997. Early screening of banana and plantain
varieties for resistance to Radopholus similis. International Journal of Nematology 7(1): 57-61.
14. Binks R.H., Greenham J.R., Luis J.G. and Gowen S.R. 1997. A phytoalexin
from roots of Musa acuminata var. Pisang sipulu. Phytochemistry 45(1): 47-49.
15. Blake C.D., 1966. The histological changes in banana roots caused by
Radopholus similis and Helicotylenchus multicinctus. Nematologica 12: 129-137.
16. Blake C.D. 1972. Nematode diseases of banana plantations. In: Webster
(Ed), Economic nematology. Academic Press, London, UK, pp. 245-267. 17. Blomme G. 2000. The interdependence of root and shoot development in
banana (Musa spp.) under field conditions and the influence of different biophysical factors on this relationship. Dissertationes de Agricultura Nº 421. Katholieke Universiteit Leuven, Belgium, 183 pp.
18. Boerma H.R. and Hussey R.S. 1992. Breeding plants for resistance to
nematodes. Journal of Nematology 24(2): 242-252.
REFERENCES 169
19. Bos L. and Parlevliet J.E. 1995. Concepts and terminology on plant/pest relationships: Toward consensus in plant pathology and crop protection. Annual Review of Phytopathology 33: 69-102.
20. Bridge J. 1996. Introduced and indigenous plant nematodes of different
crops and cropping systems in Africa: a personal perspective. African Plant Protection 2: 67-74.
21. Bridge J. 2000. Nematodes of bananas and plantains in Africa: research
trends and management strategies relating to small-scale farmer. In: Craenen K., Ortiz R., Karamura E.B. and Vuylsteke D.R. (Eds). Proceedings of the First International Conference on Banana and Plantain for Africa. Acta Horticulturae 540: 391-408.
22. Briggs L. and Twomlow S.J. 2002. Organic material flows within a
smallholder highland farming system of South West Uganda. Agriculture, Ecosystems and Environment 89: 191-212.
23. Carlier J., Fouré E., Gauhl F., Jones D.R., Lepoivre P., Mourichon X.,
Pasberg-Gauhl C. and Romero R.A. 2000. Fungal diseases of the foliage. Sigatoka leaf spots: Black leaf streak. In: Jones D.R. (Ed). Diseases of banana, abaca and enset. CAB International, Wallingford, UK, pp. 37-79.
24. Carreel F., Gonzalez de Leon D., Lagoda P., Lanaud C., Jenny C., Horry
J.P. and Tézenas du Montcel H. 2002. Ascertaining maternal and paternal lineage within Musa by chloroplast and mitochondrial DNA RFLP analysis. Genome 45: 679-692.
25. Caswell-Chen E.P., Williamson V.M. and Wu F.F. 1992. Random amplified
polymorphic DNA analysis of Heterodera crucifera and H. schachtii populations. Journal of Nematology 24(3): 343-351.
26. Charlton W.A. 1996. Lateral root initiation. In: Waisel Y., Eshel A. and
Kafkafi U. (Eds). Plant roots. The hidden half. 2nd ed. Marcel Dekker, New York, pp.149-173.
27. Colbran R.C. 1967. Hot water tank for treatment of banana planting
material. Advisory Leaflet Nº 924: 4. Queensland Department of Primary Industries, Division of Plant Industry, Brisbane, Australia.
REFERENCES 170
28. Collingborn F.M.B., Gowen S.R. and Mueller-Harvey I. 2000. Investigations into the biochemical basis for nematode resistance in roots of three Musa cultivars in response to Radopholus similis infection. Journal of Agricultural and Food Chemistry 48 (11): 5297-5301.
29. Cook R. 1974. Nature and inheritance of nematode resistance in cereals.
Journal of Nematology 6(4): 165-174. 30. Cook R. and Evans K. 1987. Resistance and tolerance. In: Brown R.H. and
Kerry B.R. (Eds). Principles and practice of nematode control in crops. Academic Press, Australia, pp. 179-223.
31. Cook R. and Noel G.R. 2002. Cyst nematodes: Globodera and Heterodera
species. In: Starr J.L., Cook R. and Bridge J. (Eds). Plant resistance to parasitic nematodes. CAB International, Wallingford, UK, pp. 71-105.
32. Cotton J. and Hayes J.D. 1972. Genetic studies of resistance to the cereal
cyst nematode (Heterodera avenae) in oats (Avena spp.). Euphytica 21: 538-542.
33. Daykin M.E. and Hussey R.S. 1985. Staining and histopathological
techniques in nematology. In: Barker, Carter and Sasser (Eds). An advanced treatise on Meloidogyne. Vol. II. Methodology. N.C. State Univ., Raleigh, pp. 39-48.
34. Davide R. G. 1980. Influence of cultivar, age, soil texture and pH on
Meloidogyne incognita and Radopholus similis on banana. Plant Disease 64: 571-573.
35. Davide R.G. and Marasigan L.Q. 1985. Yield loss assessment and evaluation
of resistance of banana cultivars to the nematodes Radopholus similis Thorne and Meloidogyne incognita Chitwood. The Philippine Agriculturist 68(3): 335-349.
36. De Langhe E. 1969. Bananas (Musa spp.). In: Ferwarda F.P. and Wit F.
(Eds). Outlines of perennial crop breeding in the tropics, Miscellaneous Papers Nº 4, Agricultural University, Wageningen, The Netherlands, pp.53-78.
REFERENCES 171
37. De Langhe E. 2000a. Diversity in the genus Musa: its significance and its potential. In: Craenen K., Ortiz R., Karamura E.B. and Vuylsteke D.R. (Eds). Proceedings of the First International Conference on Banana and Plantain for Africa. Acta Horticulturae 540: 81-88.
38. De Langhe E. 2000b. Genetic improvement of the banana at ESARC. Report
of a consultancy at the Eastern and Southern Africa Regional Center (ESARC). International Institute of Tropical Agriculture, April-June 2000.
39. De Schutter B., Speijer P.R., Dochez C., Tenkouano A. and De Waele D.
2001. Evaluating host plant reaction of Musa germplasm to Radopholus similis by inoculation of single primary roots. Nematropica 31(2): 295-299.
40. De Waele D. 1996. Plant resistance to nematodes in other crops: relevant
research that may be applicable to Musa. In: Frison E.A., Horry J.P. and De Waele D. (Eds). Proceedings of the workshop on new frontiers in resistance breeding for nematode, Fusarium and Sigatoka. Kuala Lumpur, Malaysia, 2-5 October 1995. INIBAP, Montpellier, France, pp. 108-115.
41. De Waele D., Boonen E. and Swennen R.L. 1998. Nematode susceptibility
and sensitivity of in vitro propagated ‘Valery’ bananas under field conditions in Costa Rica. Acta Horticulturae 490: 361-367.
42. De Waele D. and Elsen A. 2002. Migratory endoparasites: Pratylenchus and
Radopholus species. In: Starr J.L., Cook R. and Bridge J. (Eds). Plant resistance to parasitic nematodes. CAB International, Wallingford, UK, pp.175-206.
43. De Waele D., Sagi L. and Swennen R. 1994. Prospects to engineer
nematode resistance in banana. In: Valmayor R., Davide R., Stanton J., Treverrow N. and Roa V. (Eds). Proceedings of a conference workshop on nematodes and weevil borers affecting bananas in Asia and the Pacific. Serdang, Selangor, Malaysia, 18-22 April 1994. INIBAP/ASPNET, Los Banos, Laguna, Philippines, pp. 204-216.
44. De Waele D. and Speijer P.R. 1999. Nematode resistance in Musa. In: Frison
E.A., Gold C.S., Karamura E.B. and Sikora R.A. (Eds). Mobilising IPM for sustainable banana production in Africa. Proceedings of a workshop on banana IPM held in Nelspruit, South Africa, 23-28 November 1998. INIBAP, Montpellier, France, pp. 119-126.
REFERENCES 172
45. Dixon R.A. and Paiva N.L. 1995. Stress-induced phenylpropanoid metabolism. Plant Cell 7: 1085-1097.
46. Dochez C., Speijer P.R., Hartman J., Vuylsteke D. and De Waele D. 2000.
Screening Musa hybrids for resistance to Radopholus similis. InfoMusa 9(2): 3-4.
47. Dropkin V.H. 1988. The concept of race in phytonematology. Annual
Review of Phytopathology 26: 145-161. 48. Edens R.M., Anand S.C. and Bolla R.I. 1995. Enzymes of the
phenylpropanoid pathway in soybean infected with Meloidogyne incognita or Heterodera glycines. Journal of Nematology 27(3): 292-303.
49. Eilu G., Obua J., Tumuhairwe J.K. and Nkwine C. 2003. Traditional farming
and plant species diversity in agricultural landscapes of south-western Uganda. Agriculture, Ecosystems and Environment 99: 125-134.
50. Elabdri G.A.A., De Waele D. and Moens M. 2001. Reproduction of
Radopholus similis isolates after inoculation of carrot disks with one or more females. Nematology 3(8): 767-771.
51. Elliott A.P., Phipps P.M. and Terrill R. 1986. Effect of continuous cropping
of resistant and susceptible cultivars on reproduction potentials of Heterodera glycines and Globodera tabacum solanacearum. Journal of Nematology 18: 375-379.
52. Elsen A. 2002. Study of the interaction between arbuscular mycorrhizal
fungi and plant-parasitic nematodes in Musa spp. Dissertationes de Agricultura Nº 517. Katholieke Universiteit Leuven, Belgium, 168 pp.
53. Elsen A., Goossens B., Belpaire B., Neyens S., Speijer P.R. and De Waele D.
2004. Recolonisation by nematodes of hot water treated cooking banana planting material in Uganda. Nematology 6(2): 215-221.
54. Elsen A., Lens K., Nguyet D.T.M., Broos S., Stoffelen R. and De Waele D.
2001. Aseptic culture systems of Radopholus similis for in vitro assays on Musa spp. and Arabidopsis thaliana. Journal of Nematology 33(2-3): 147-151.
REFERENCES 173
55. Elsen A., Orajay J. and De Waele D. 2004. Expression of nematode resistance in in vitro roots of three Musa genotypes in response to Radopholus similis. Nematology Monographs and Perspectives 2: 303-314.
56. Elsen A., Stoffelen R., Thi Tuyet N., Baimey H., Dupre de Boulois H. and De
Waele D. 2002. In vitro screening for resistance to Radopholus similis in Musa spp. Plant Science 163: 407-416.
57. Fallas G.A. and Sarah J.L. 1995. Effect of temperature on the in vitro
multiplication of seven Radopholus similis isolates from different banana producing zones of the world. Fundamental and Applied Nematology 18(5): 445-449.
58. Fallas G.A., Hahn M.L., Fargette M., Burrows P.R. and Sarah J.L. 1996.
Molecular and biochemical diversity among isolates of Radopholus spp. from different areas of the world. Journal of Nematology 28(4): 422-430.
59. Fallas G.A., Sarah J.L. and Fargette M. 1995. Reproductive fitness and
pathogenicity of eight Radopholus similis isolates on banana plants (Musa AAA cv. Poyo). Nematropica 25: 135-141.
60. FAOSTAT 2002. Production data of primary crops in 2002. FAO, Rome.
http://faostat.fao.org/faostat/collections?subset=agriculture 61. Fassuliotis G. 1987. Genetic basis of plant resistance to nematodes. In:
Veech J.A. and Dickson D.W. (Eds). Vistas on Nematology. Society of Nematologists, Hyattsville, Maryland, USA, pp. 364-371.
62. Fitter A. 1996. Characteristics and functions of root systems. In: Waisel Y.,
Eshel A. and Kafkafi U. (Eds). Plant roots. The hidden half. 2nd ed. Marcel Dekker, New York, pp. 1-20.
63. Fogain R. 1996. Screenhouse evaluation of Musa for susceptibility to
Radopholus similis: evaluation of plantains AAB and diploid AA, AB and BB. In: Frison E.A., Horry J.P. and De Waele D. (Eds). Proceedings of the workshop on new frontiers in resistance breeding for nematode, Fusarium and Sigatoka. Kuala Lumpur, Malaysia, 2-5 October 1995. INIBAP, Montpellier, France, pp. 79-86.
REFERENCES 174
64. Fogain R. 2000. Evaluation of Musa spp. for susceptibility to nematodes and study of resistance mechanisms. In: Craenen K. Ortiz R., Karamura E.B. and Vuylsteke D.R. (Eds). Proceedings of the First International Conference on Banana and Plantain for Africa, Kampala, Uganda, 14-18 October 1996. Acta Horticulturae 540: 215-224.
65. Fogain R. and Gowen S.R. 1995. Pathogenicity on maize and banana among
isolates of Radopholus similis from four producing countries of Africa and Asia. Fruits 50(1): 5-9.
66. Fogain R. and Gowen S.R. 1996. Investigations on possible mechanisms of
resistance to nematodes in Musa. Euphytica 92: 375-381. 67. Fogain R. and Gowen S.R. 1998. ‘’Yangambi km5’’ (Musa AAA, Ibota
subgroup): a possible source of resistance to Radopholus similis and Pratylenchus goodeyi. Fundamental and Applied Nematology 21(1): 75-80.
68. Frison E. and Sharrock S. 1999. The economic, social and nutritional
importance of banana in the world. In: Picq C., Fouré E. and Frison E.A. (Eds). Bananas and food security. Proceedings of an international symposium held in Douala, Cameroon, 10-14 November 1998. INIBAP, Montpellier, France, pp. 21-35.
69. Gaidashova S.V., Okech S., Van de Berg E., Marais M., Gararayiha C.M. and
Ragama P. Plant parasitic nematodes in banana-based farming systems in Rwanda: species profile, distribution and abundance. In preparation.
70. Giebel J. 1974. Biochemical mechanisms of plant resistance to nematodes:
a review. Journal of Nematology 6(4): 175-184. 71. Giebel J. 1982. Mechanisms of resistance to plant nematodes. Annual
Review of Phytopathology 20: 257-259. 72. Gold C.S., Karamura E.B., Kiggundu A., Bagamba F. and Abera A.M.K. 1999.
Monograph on geographic shifts in highland cooking banana (Musa, group AAA-EA) production in Uganda. African Crop Science Journal 7 (3): 223-298.
73. Gold C.S., Karamura E.B., Kiggundi A., Abera A.M.K., Bagamba F., Wejuli
M., Karamura D., Ssendege R. and Kalyebara R. 2000. Geographic shifts in highland banana production in Uganda. In: Craenen K., Ortiz R., Karamura
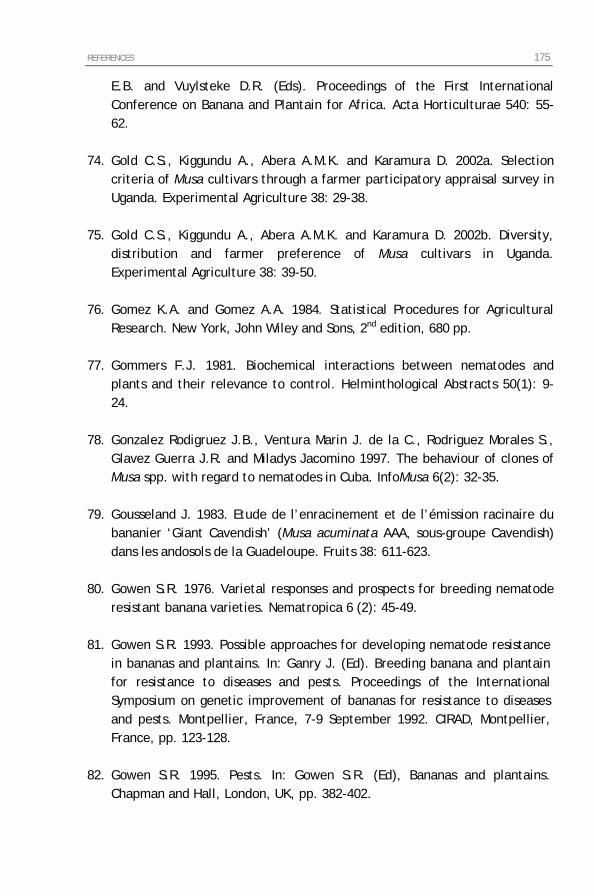
REFERENCES 175
E.B. and Vuylsteke D.R. (Eds). Proceedings of the First International Conference on Banana and Plantain for Africa. Acta Horticulturae 540: 55-62.
74. Gold C.S., Kiggundu A., Abera A.M.K. and Karamura D. 2002a. Selection
criteria of Musa cultivars through a farmer participatory appraisal survey in Uganda. Experimental Agriculture 38: 29-38.
75. Gold C.S., Kiggundu A., Abera A.M.K. and Karamura D. 2002b. Diversity,
distribution and farmer preference of Musa cultivars in Uganda. Experimental Agriculture 38: 39-50.
76. Gomez K.A. and Gomez A.A. 1984. Statistical Procedures for Agricultural
Research. New York, John Wiley and Sons, 2nd edition, 680 pp. 77. Gommers F.J. 1981. Biochemical interactions between nematodes and
plants and their relevance to control. Helminthological Abstracts 50(1): 9-24.
78. Gonzalez Rodigruez J.B., Ventura Marin J. de la C., Rodriguez Morales S.,
Glavez Guerra J.R. and Miladys Jacomino 1997. The behaviour of clones of Musa spp. with regard to nematodes in Cuba. InfoMusa 6(2): 32-35.
79. Gousseland J. 1983. Etude de l’enracinement et de l’émission racinaire du
bananier ‘Giant Cavendish’ (Musa acuminata AAA, sous-groupe Cavendish) dans les andosols de la Guadeloupe. Fruits 38: 611-623.
80. Gowen S.R. 1976. Varietal responses and prospects for breeding nematode
resistant banana varieties. Nematropica 6 (2): 45-49. 81. Gowen S.R. 1993. Possible approaches for developing nematode resistance
in bananas and plantains. In: Ganry J. (Ed). Breeding banana and plantain for resistance to diseases and pests. Proceedings of the International Symposium on genetic improvement of bananas for resistance to diseases and pests. Montpellier, France, 7-9 September 1992. CIRAD, Montpellier, France, pp. 123-128.
82. Gowen S.R. 1995. Pests. In: Gowen S.R. (Ed), Bananas and plantains.
Chapman and Hall, London, UK, pp. 382-402.
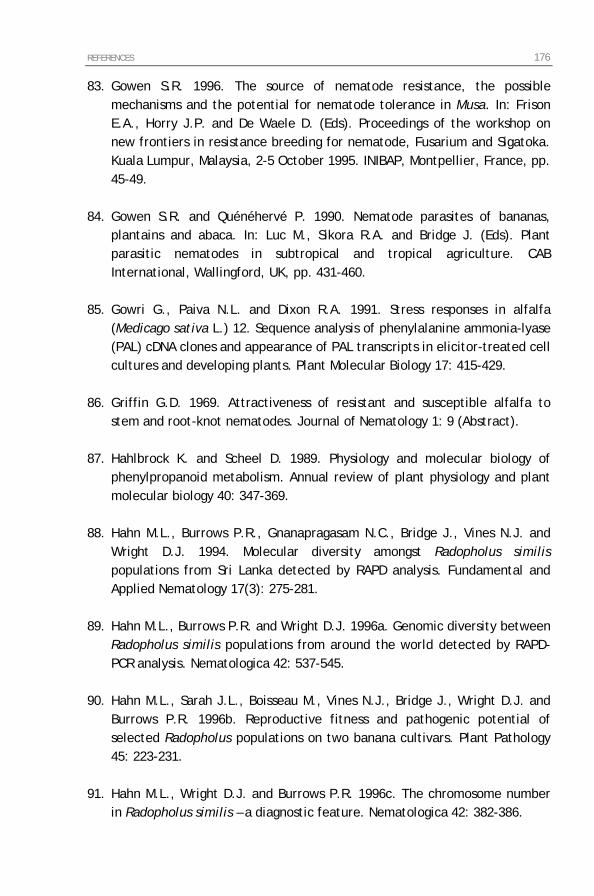
REFERENCES 176
83. Gowen S.R. 1996. The source of nematode resistance, the possible mechanisms and the potential for nematode tolerance in Musa. In: Frison E.A., Horry J.P. and De Waele D. (Eds). Proceedings of the workshop on new frontiers in resistance breeding for nematode, Fusarium and Sigatoka. Kuala Lumpur, Malaysia, 2-5 October 1995. INIBAP, Montpellier, France, pp. 45-49.
84. Gowen S.R. and Quénéhervé P. 1990. Nematode parasites of bananas,
plantains and abaca. In: Luc M., Sikora R.A. and Bridge J. (Eds). Plant parasitic nematodes in subtropical and tropical agriculture. CAB International, Wallingford, UK, pp. 431-460.
85. Gowri G., Paiva N.L. and Dixon R.A. 1991. Stress responses in alfalfa
(Medicago sativa L.) 12. Sequence analysis of phenylalanine ammonia-lyase (PAL) cDNA clones and appearance of PAL transcripts in elicitor-treated cell cultures and developing plants. Plant Molecular Biology 17: 415-429.
86. Griffin G.D. 1969. Attractiveness of resistant and susceptible alfalfa to
stem and root-knot nematodes. Journal of Nematology 1: 9 (Abstract). 87. Hahlbrock K. and Scheel D. 1989. Physiology and molecular biology of
phenylpropanoid metabolism. Annual review of plant physiology and plant molecular biology 40: 347-369.
88. Hahn M.L., Burrows P.R., Gnanapragasam N.C., Bridge J., Vines N.J. and
Wright D.J. 1994. Molecular diversity amongst Radopholus similis populations from Sri Lanka detected by RAPD analysis. Fundamental and Applied Nematology 17(3): 275-281.
89. Hahn M.L., Burrows P.R. and Wright D.J. 1996a. Genomic diversity between
Radopholus similis populations from around the world detected by RAPD-PCR analysis. Nematologica 42: 537-545.
90. Hahn M.L., Sarah J.L., Boisseau M., Vines N.J., Bridge J., Wright D.J. and
Burrows P.R. 1996b. Reproductive fitness and pathogenic potential of selected Radopholus populations on two banana cultivars. Plant Pathology 45: 223-231.
91. Hahn M.L., Wright D.J. and Burrows P.R. 1996c. The chromosome number
in Radopholus similis – a diagnostic feature. Nematologica 42: 382-386.
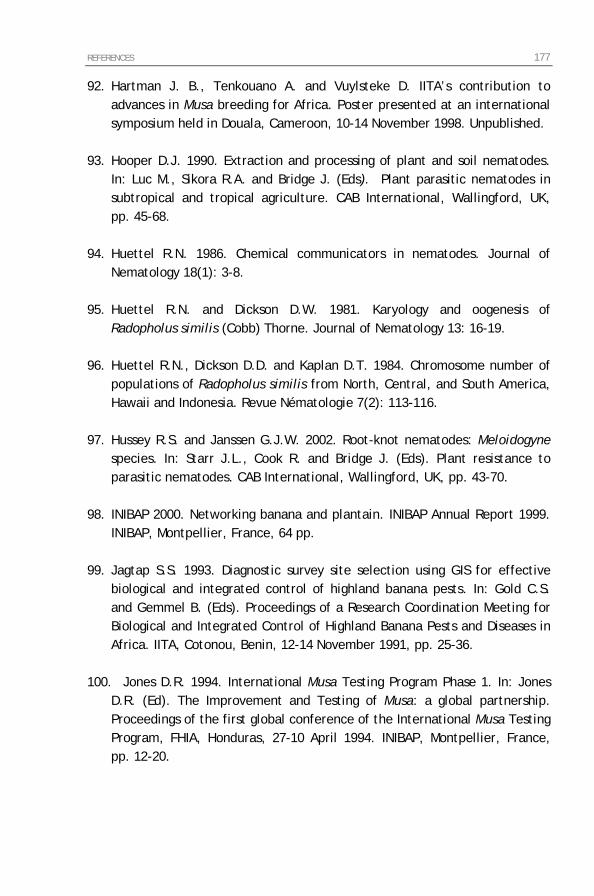
REFERENCES 177
92. Hartman J. B., Tenkouano A. and Vuylsteke D. IITA’s contribution to advances in Musa breeding for Africa. Poster presented at an international symposium held in Douala, Cameroon, 10-14 November 1998. Unpublished.
93. Hooper D.J. 1990. Extraction and processing of plant and soil nematodes.
In: Luc M., Sikora R.A. and Bridge J. (Eds). Plant parasitic nematodes in subtropical and tropical agriculture. CAB International, Wallingford, UK, pp. 45-68.
94. Huettel R.N. 1986. Chemical communicators in nematodes. Journal of
Nematology 18(1): 3-8. 95. Huettel R.N. and Dickson D.W. 1981. Karyology and oogenesis of
Radopholus similis (Cobb) Thorne. Journal of Nematology 13: 16-19. 96. Huettel R.N., Dickson D.D. and Kaplan D.T. 1984. Chromosome number of
populations of Radopholus similis from North, Central, and South America, Hawaii and Indonesia. Revue Nématologie 7(2): 113-116.
97. Hussey R.S. and Janssen G.J.W. 2002. Root-knot nematodes: Meloidogyne
species. In: Starr J.L., Cook R. and Bridge J. (Eds). Plant resistance to parasitic nematodes. CAB International, Wallingford, UK, pp. 43-70.
98. INIBAP 2000. Networking banana and plantain. INIBAP Annual Report 1999.
INIBAP, Montpellier, France, 64 pp. 99. Jagtap S.S. 1993. Diagnostic survey site selection using GIS for effective
biological and integrated control of highland banana pests. In: Gold C.S. and Gemmel B. (Eds). Proceedings of a Research Coordination Meeting for Biological and Integrated Control of Highland Banana Pests and Diseases in Africa. IITA, Cotonou, Benin, 12-14 November 1991, pp. 25-36.
100. Jones D.R. 1994. International Musa Testing Program Phase 1. In: Jones
D.R. (Ed). The Improvement and Testing of Musa: a global partnership. Proceedings of the first global conference of the International Musa Testing Program, FHIA, Honduras, 27-10 April 1994. INIBAP, Montpellier, France, pp. 12-20.
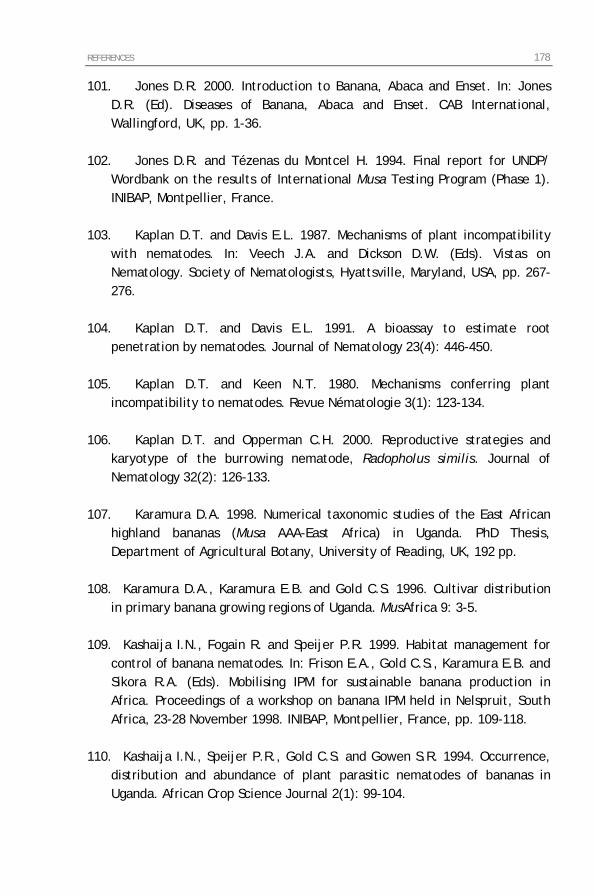
REFERENCES 178
101. Jones D.R. 2000. Introduction to Banana, Abaca and Enset. In: Jones D.R. (Ed). Diseases of Banana, Abaca and Enset. CAB International, Wallingford, UK, pp. 1-36.
102. Jones D.R. and Tézenas du Montcel H. 1994. Final report for UNDP/
Wordbank on the results of International Musa Testing Program (Phase 1). INIBAP, Montpellier, France.
103. Kaplan D.T. and Davis E.L. 1987. Mechanisms of plant incompatibility
with nematodes. In: Veech J.A. and Dickson D.W. (Eds). Vistas on Nematology. Society of Nematologists, Hyattsville, Maryland, USA, pp. 267-276.
104. Kaplan D.T. and Davis E.L. 1991. A bioassay to estimate root
penetration by nematodes. Journal of Nematology 23(4): 446-450. 105. Kaplan D.T. and Keen N.T. 1980. Mechanisms conferring plant
incompatibility to nematodes. Revue Nématologie 3(1): 123-134. 106. Kaplan D.T. and Opperman C.H. 2000. Reproductive strategies and
karyotype of the burrowing nematode, Radopholus similis. Journal of Nematology 32(2): 126-133.
107. Karamura D.A. 1998. Numerical taxonomic studies of the East African
highland bananas (Musa AAA-East Africa) in Uganda. PhD Thesis, Department of Agricultural Botany, University of Reading, UK, 192 pp.
108. Karamura D.A., Karamura E.B. and Gold C.S. 1996. Cultivar distribution
in primary banana growing regions of Uganda. MusAfrica 9: 3-5. 109. Kashaija I.N., Fogain R. and Speijer P.R. 1999. Habitat management for
control of banana nematodes. In: Frison E.A., Gold C.S., Karamura E.B. and Sikora R.A. (Eds). Mobilising IPM for sustainable banana production in Africa. Proceedings of a workshop on banana IPM held in Nelspruit, South Africa, 23-28 November 1998. INIBAP, Montpellier, France, pp. 109-118.
110. Kashaija I.N., Speijer P.R., Gold C.S. and Gowen S.R. 1994. Occurrence,
distribution and abundance of plant parasitic nematodes of bananas in Uganda. African Crop Science Journal 2(1): 99-104.
REFERENCES 179
111. Kasozi L.C., Pillay M., Talengera D., Ssebuliba R., Makumbi D. and Vuylsteke D. Optimization of seed set patterns in East African highland banana. In preparation.
112. Kathiresan T. and Mehta U.K. 2002. Penetration, multiplication and
histopathological response of Pratylenchus zeae in resistant and susceptible sugarcane clones. International Journal of Nematology 12(2): 189-196.
113. Kling J.G., Menkir A., Ajala S.O. and Quin F.M. 1999. Potential for
molecular breeding of maize at IITA. In: Crouch J.H. and Tenkouano A. (Eds). DNA marker-assisted improvement of the staple crops of Sub-Saharan Africa. Proceedings of the workshop on DNA Markers at IITA, Ibadan, Nigeria, 21-22 August 1996. IITA, Ibadan, Nigeria, pp. 124-135.
114. LaMondia J.A. 2002. Genetics of burley and flue-cured tobacco resistance
to Globodera tabacum tabacum. Journal of Nematology 34(1): 34-37. 115. Lockhart B.E.L. and Jones D.R. 2000. Diseases caused by viruses: Banana
Streak. In: Jones D.R. (Ed). Diseases of banana, abaca and enset. CAB International, Wallingford, UK, pp. 263-274.
116. Luc M., Hunt D.J. and Machon J.E. 1990. Morphology, anatomy and
biology of plant parasitic nematodes – a synopsis. In: Luc M., Sikora R.A. and Bridge J. (Eds). Plant parasitic nematodes in subtropical and tropical agriculture. CAB International, Wallingford, UK, pp. 1-44.
117. Mace M.E. 1963. Histochemical localisation of phenols in healthy and
diseased banana roots. Physiologia Plantarum 16: 915-925. 118. Marin D.H., Barker K.R., Kaplan D.T., Sutton T.B. and Opperman C.H.
1999a. Aggressiveness and damage potential of Central American and Caribbean populations of Radopholus spp. in banana. Journal of Nematology 31(4): 377-385.
119. Marin D.H., Barker K.R., Kaplan D.T., Sutton T.B. and Opperman C.H.
2000. Development and evaluation of a standard method for screening for resistance to Radopholus similis in bananas. Plant Disease 84: 689-693.
REFERENCES 180
120. Marin D.H., Kaplan D.T. and Opperman C.H. 1999b. Randomly amplified polymorphic DNA differs with burrowing nematode collection site, but not with host range. Journal of Nematology 31(2): 232-239.
121. Mateille T. 1994a. Comparative host tissue reactions of Musa acuminata
(AAA group) cvs Poyo and Gros Michel roots to three banana parasitic nematodes. Annals of Applied Biology 124: 65-73.
122. Mateille T. 1994b. Réactions biochimiques provoquées par trois
nématodes phytoparasites dans les racines de Musa acuminata (groupe AAA) variétés Poyo et Gros Michel. Fundamental and Applied Nematology 17(3): 283-290.
123. Mateo N. 1994. INIBAP and the International Musa Testing Program. In:
Jones D.R. (Ed). The Improvement and Testing of Musa: a global partnership. Proceedings of the first global conference of the International Musa Testing Program, FHIA, Honduras, 27-10 April 1994. INIBAP, Montpellier, France, pp. 7-11.
124. McIntyre B.D., Speijer P.R., Riha S.J. and Kizito F. 2000. Effects of
mulching on biomass, nutrients and soil water in banana inoculated with nematodes. Agronomy Journal 92(6): 1081-1085.
125. Mead R., Curnow R.N. and Hasted A.M. 1993. Statistical methods in
agriculture and experimental biology. Chapman and Hall, London, 415 pp. 126. Mitti R.D. and Rweyemanu T.G. 2001. A socio-economic profile of
Nyakatoke. http://www.econ.kuleuven.ac.be/ew/academic/cop/members/member/Joachim/intro_en.pdf
127. Moens T. 2004. Variability in reproductive fitness and pathogenicity of
Radopholus similis in Musa: effect of biotic and abiotic factors. Katholieke Universiteit Leuven, Belgium, 189 pp.
128. Moens T., Sandoval J.A., Escalant J.V. and De Waele D. 2002. Evaluation
of the progeny from a cross between Pisang Berlin and M. acuminata spp. burmannicoides Calcutta 4 for evidence of segregation with respect to resistance to black leaf streak disease and nematodes. InfoMusa 11(2): 20-22.
REFERENCES 181
129. Mueller W.C. and Beckman C.H. 1974. Ultrastructure of the phenol-storing cells in the roots of bananas. Physiological Plant Pathology 4: 187-190.
130. Murashige T. and Skoog F. 1962. A revised medium for rapid growth and
bioassays with tobacco tissue cultures. Journal of Nematology 5: 225-226. 131. Nicholson R.L. and Hammerschmidt R. 1992. Phenolic compounds and
their role in disease resistance. Annual Review of Phytopathology 30: 369-389.
132. O’Bannon J.H. 1977. World-wide dissemination of Radopholus similis and
its importance in crop protection. Journal of Nematology 9: 16-25. 133. O’Bannon J.H. and Taylor A.L. 1968. Migratory endoparasitic nematodes
reared on carrot discs. Phytopathology 58: 385. 134. Orjeda G. 2000. Evaluating bananas: a global partnership. Results of IMTP
phase 2. INIBAP, Montpellier, France, 142 pp. 135. Orjeda G., Escalant J.V. and Moore N. 1999. The International Musa
Testing Programme (IMTP) phase 2 overview of final report and summary of results. InfoMusa 8(1): 3-10.
136. Orjeda G., Escalant J.V. and Moore N. 2000. The International Musa
Testing Programme (IMTP) phase 2 – Synthesis of final results. In: Orjeda G. (Ed). Evaluating bananas: a global partnership. Results of IMTP phase 2. INIBAP, Montpellier, France, pp. 7-75.
137. Ortiz R. 2001. Dedication: Dirk R. Vuylsteke: Musa scientist and
humanitarian. Plant Breeding Reviews 21: 1-25. 138. Ortiz R., Ferris R.S.B. and Vuylsteke D.R. 1995. Banana and plantain
breeding. In: Gowen S. (Ed). Bananas and Plantains. Chapman and Hall, pp. 110-146.
139. Ortiz R. and Vuylsteke D. 1997. Improved polyploid Musa germplasm
developed through ploidy manipulations. African Crop Science Journal 5(2): 107-177.
REFERENCES 182
140. Ortiz R., Vuylsteke D., Crouch H. and Crouch J. 1998. TM3x: triploid black Sigatoka resistant Musa hybrid germplasm. HortScience 33(2): 362-365.
141. Pillay M., Nwakanma D.C. and Tenkouano A. 2000. Identification of RAPD
markers linked to A and B genome sequences in Musa L. Genome 43: 763-767.
142. Pillay M., Ogundiwin E., Nwakanma D.C., Ude G. and Tenkouano A. 2001.
Analysis of genetic diversity and relationships in East African banana germplasm. Theoretical Applied Genetics 102: 965-970.
143. Pinochet J. 1979. Comparison of four isolates of Radopholus similis from
Central America on Valery bananas. Nematropica 9: 40-43. 144. Pinochet J. 1988a. Nematode problems in Musa spp.: Pathotypes of R.
similis and breeding for resistance. In: Nematodes and the borer weevil in Bananas: Present status of research and outlook. Proceedings of a workshop held in Bujumbura, Burundi, 7-11 December 1987. INIBAP, Montpellier, France, pp. 66-70.
145. Pinochet J. 1988b. A method for screening banana and plantains to lesion
forming nematodes. In: Nematodes and the borer weevil in Bananas: Present status of research and outlook. Proceedings of a workshop held in Bujumbura, Burundi, 7-11 December 1987. INIBAP, Montpellier, France, pp. 62-65.
146. Pinochet J. 1988c. Comments on the difficulty in breeding bananas and
plantains for resistance to nematodes. Revue Nématologie 11(1): 3-5. 147. Pinochet J. 1996. Review of past research on Musa germplasm and
nematode interactions. In: Frison E.A., Horry J.P. and De Waele D. (Eds). Proceedings of the workshop on new frontiers in resistance breeding for nematode, Fusarium and Sigatoka. Kuala Lumpur, Malaysia, 2-5 October 1995. INIBAP, Montpellier, France, pp. 32-44.
148. Pinochet J., Fernandez C. and Sarah J.L. 1995. Influence of temperature
on the in vitro reproduction of Pratylenchus coffeae, P. goodeyi and Radopholus similis. Fundamental and Applied Nematology 18(4): 391-392.
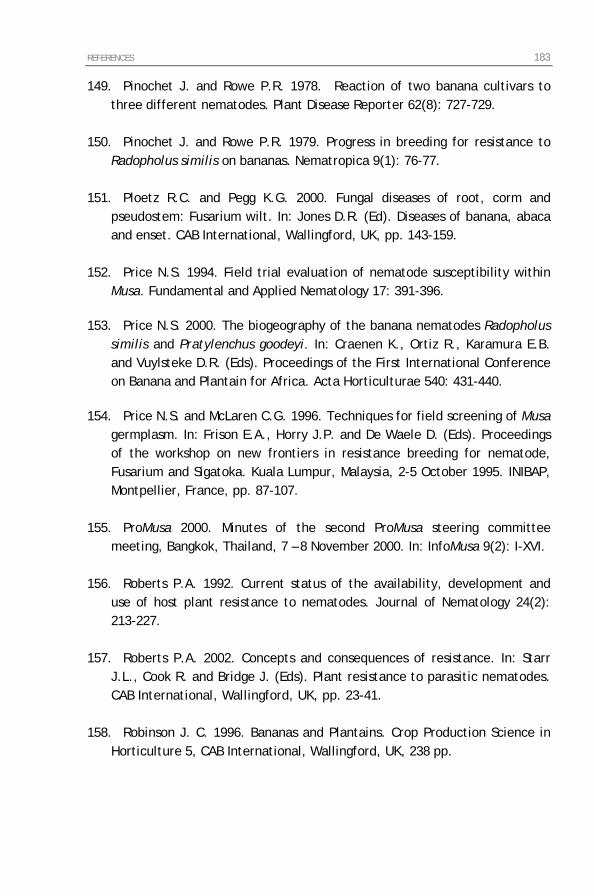
REFERENCES 183
149. Pinochet J. and Rowe P.R. 1978. Reaction of two banana cultivars to three different nematodes. Plant Disease Reporter 62(8): 727-729.
150. Pinochet J. and Rowe P.R. 1979. Progress in breeding for resistance to
Radopholus similis on bananas. Nematropica 9(1): 76-77. 151. Ploetz R.C. and Pegg K.G. 2000. Fungal diseases of root, corm and
pseudostem: Fusarium wilt. In: Jones D.R. (Ed). Diseases of banana, abaca and enset. CAB International, Wallingford, UK, pp. 143-159.
152. Price N.S. 1994. Field trial evaluation of nematode susceptibility within
Musa. Fundamental and Applied Nematology 17: 391-396.
153. Price N.S. 2000. The biogeography of the banana nematodes Radopholus similis and Pratylenchus goodeyi. In: Craenen K., Ortiz R., Karamura E.B. and Vuylsteke D.R. (Eds). Proceedings of the First International Conference on Banana and Plantain for Africa. Acta Horticulturae 540: 431-440.
154. Price N.S. and McLaren C.G. 1996. Techniques for field screening of Musa germplasm. In: Frison E.A., Horry J.P. and De Waele D. (Eds). Proceedings of the workshop on new frontiers in resistance breeding for nematode, Fusarium and Sigatoka. Kuala Lumpur, Malaysia, 2-5 October 1995. INIBAP, Montpellier, France, pp. 87-107.
155. ProMusa 2000. Minutes of the second ProMusa steering committee
meeting, Bangkok, Thailand, 7 – 8 November 2000. In: InfoMusa 9(2): I-XVI. 156. Roberts P.A. 1992. Current status of the availability, development and
use of host plant resistance to nematodes. Journal of Nematology 24(2): 213-227.
157. Roberts P.A. 2002. Concepts and consequences of resistance. In: Starr
J.L., Cook R. and Bridge J. (Eds). Plant resistance to parasitic nematodes. CAB International, Wallingford, UK, pp. 23-41.
158. Robinson J. C. 1996. Bananas and Plantains. Crop Production Science in
Horticulture 5, CAB International, Wallingford, UK, 238 pp.
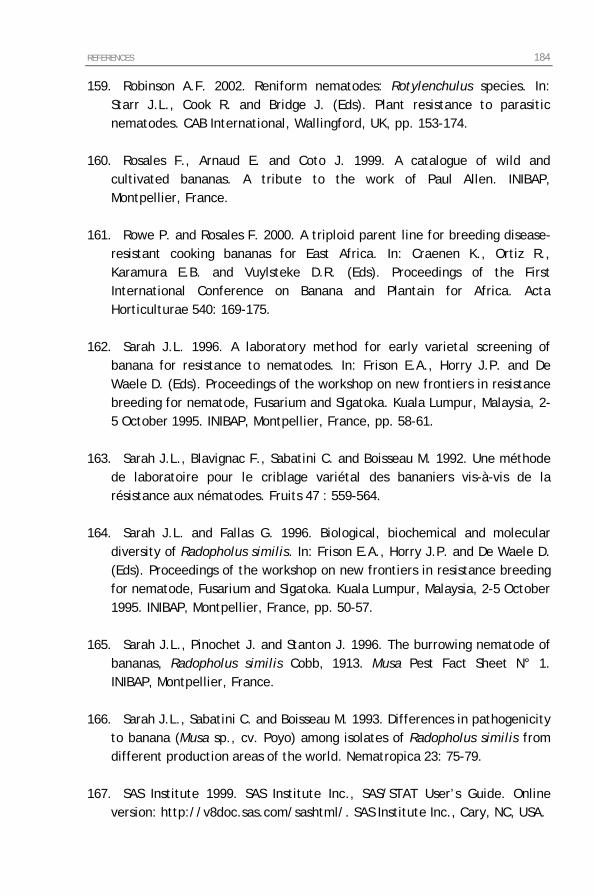
REFERENCES 184
159. Robinson A.F. 2002. Reniform nematodes: Rotylenchulus species. In: Starr J.L., Cook R. and Bridge J. (Eds). Plant resistance to parasitic nematodes. CAB International, Wallingford, UK, pp. 153-174.
160. Rosales F., Arnaud E. and Coto J. 1999. A catalogue of wild and
cultivated bananas. A tribute to the work of Paul Allen. INIBAP, Montpellier, France.
161. Rowe P. and Rosales F. 2000. A triploid parent line for breeding disease-
resistant cooking bananas for East Africa. In: Craenen K., Ortiz R., Karamura E.B. and Vuylsteke D.R. (Eds). Proceedings of the First International Conference on Banana and Plantain for Africa. Acta Horticulturae 540: 169-175.
162. Sarah J.L. 1996. A laboratory method for early varietal screening of
banana for resistance to nematodes. In: Frison E.A., Horry J.P. and De Waele D. (Eds). Proceedings of the workshop on new frontiers in resistance breeding for nematode, Fusarium and Sigatoka. Kuala Lumpur, Malaysia, 2-5 October 1995. INIBAP, Montpellier, France, pp. 58-61.
163. Sarah J.L., Blavignac F., Sabatini C. and Boisseau M. 1992. Une méthode
de laboratoire pour le criblage variétal des bananiers vis-à-vis de la résistance aux nématodes. Fruits 47 : 559-564.
164. Sarah J.L. and Fallas G. 1996. Biological, biochemical and molecular
diversity of Radopholus similis. In: Frison E.A., Horry J.P. and De Waele D. (Eds). Proceedings of the workshop on new frontiers in resistance breeding for nematode, Fusarium and Sigatoka. Kuala Lumpur, Malaysia, 2-5 October 1995. INIBAP, Montpellier, France, pp. 50-57.
165. Sarah J.L., Pinochet J. and Stanton J. 1996. The burrowing nematode of
bananas, Radopholus similis Cobb, 1913. Musa Pest Fact Sheet N° 1. INIBAP, Montpellier, France.
166. Sarah J.L., Sabatini C. and Boisseau M. 1993. Differences in pathogenicity
to banana (Musa sp., cv. Poyo) among isolates of Radopholus similis from different production areas of the world. Nematropica 23: 75-79.
167. SAS Institute 1999. SAS Institute Inc., SAS/STAT User’s Guide. Online
version: http://v8doc.sas.com/sashtml/. SAS Institute Inc., Cary, NC, USA.
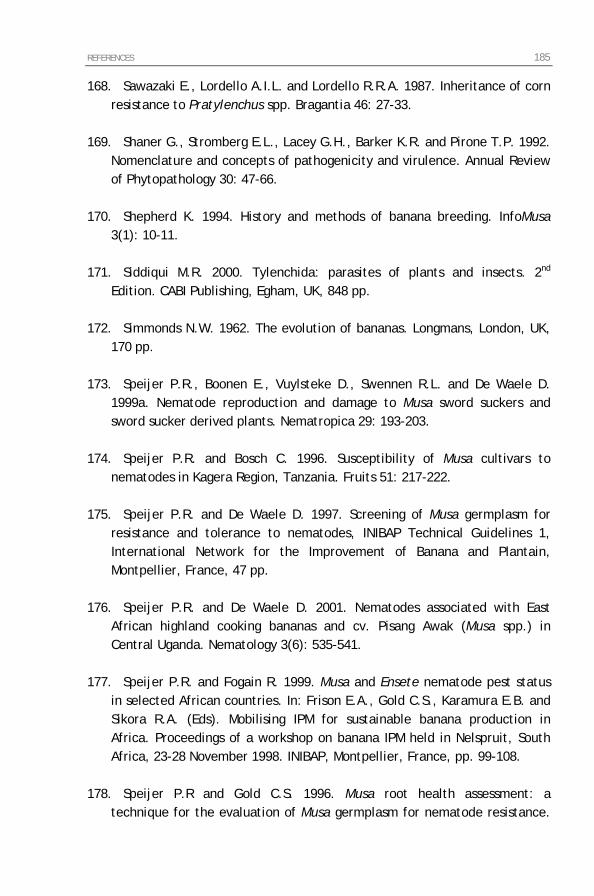
REFERENCES 185
168. Sawazaki E., Lordello A.I.L. and Lordello R.R.A. 1987. Inheritance of corn resistance to Pratylenchus spp. Bragantia 46: 27-33.
169. Shaner G., Stromberg E.L., Lacey G.H., Barker K.R. and Pirone T.P. 1992.
Nomenclature and concepts of pathogenicity and virulence. Annual Review of Phytopathology 30: 47-66.
170. Shepherd K. 1994. History and methods of banana breeding. InfoMusa
3(1): 10-11. 171. Siddiqui M.R. 2000. Tylenchida: parasites of plants and insects. 2nd
Edition. CABI Publishing, Egham, UK, 848 pp. 172. Simmonds N.W. 1962. The evolution of bananas. Longmans, London, UK,
170 pp. 173. Speijer P.R., Boonen E., Vuylsteke D., Swennen R.L. and De Waele D.
1999a. Nematode reproduction and damage to Musa sword suckers and sword sucker derived plants. Nematropica 29: 193-203.
174. Speijer P.R. and Bosch C. 1996. Susceptibility of Musa cultivars to
nematodes in Kagera Region, Tanzania. Fruits 51: 217-222. 175. Speijer P.R. and De Waele D. 1997. Screening of Musa germplasm for
resistance and tolerance to nematodes, INIBAP Technical Guidelines 1, International Network for the Improvement of Banana and Plantain, Montpellier, France, 47 pp.
176. Speijer P.R. and De Waele D. 2001. Nematodes associated with East
African highland cooking bananas and cv. Pisang Awak (Musa spp.) in Central Uganda. Nematology 3(6): 535-541.
177. Speijer P.R. and Fogain R. 1999. Musa and Ensete nematode pest status
in selected African countries. In: Frison E.A., Gold C.S., Karamura E.B. and Sikora R.A. (Eds). Mobilising IPM for sustainable banana production in Africa. Proceedings of a workshop on banana IPM held in Nelspruit, South Africa, 23-28 November 1998. INIBAP, Montpellier, France, pp. 99-108.
178. Speijer P.R and Gold C.S. 1996. Musa root health assessment: a
technique for the evaluation of Musa germplasm for nematode resistance.
REFERENCES 186
In: Frison E.A., Horry J.P. and De Waele D. (Eds). Proceedings of the workshop on new frontiers in resistance breeding for nematode, Fusarium and Sigatoka. Kuala Lumpur, Malaysia, 2-5 October 1995. INIBAP, Montpellier, France, pp. 62-78.
179. Speijer P.R., Gold C.S., Karamura E.B., Goossens B., Elsen A. and De
Waele D. 2000a. Rate of nematode infestation of clean banana planting material (Musa spp. AAA) in Uganda. In: Craenen K., Ortiz R., Karamura E.B. and Vuylsteke D.R. (Eds). Proceedings of the First International Conference on Banana and Plantain for Africa. Acta Horticulturae 540: 461-467.
180. Speijer P.R., Gold C.S., Karamura E.B. and Kashaija I.N. 1994. Banana
weevil and nematode distribution patterns in highland banana systems in Uganda: preliminary results from a diagnostic survey. African Crop Science Conference Proceedings 1: 285-289.
181. Speijer P.R. and Kajumba C. 1996. Yield loss from plant parasitic
nematodes in East African highland banana (Musa AAA). MusAfrica 10: 26. 182. Speijer P.R. and Kajumba C. 2000. Yield loss from plant parasitic
nematodes in East African highland banana (Musa spp. AAA). In: Craenen K., Ortiz R., Karamura E.B. and Vuylsteke D.R. (Eds). Proceedings of the First International Conference on Banana and Plantain for Africa. Acta Horticulturae 540: 453-460.
183. Speijer P.R., Kajumba C. and Ssango F. 1999b. East African highland
banana production as influenced by nematodes and crop management in Uganda. International Journal of Pest Management 45(1): 41-49.
184. Speijer P.R., Mudiope J., Adipala E. and Talwana H.A.L. 1997.
Comparison of plant growth stages for the evaluation of nematode damage on East African highland banana (Musa AAA). African Crop Science Conference Proceedings 3: 1243-1246.
185. Speijer P.R. and Ssango F. 1999. Evaluation of Musa host plant response
using nematode densities and damage indices. Nematropica 29: 185-192. 186. Speijer P.R., Ssango F. and Vuylsteke D. 2000b. Evaluation of host plant
response to nematodes in Musa germplasm in Uganda. In: Craenen K., Ortiz
REFERENCES 187
R., Karamura E.B. and Vuylsteke D.R. (Eds). Proceedings of the First International Conference on Banana and Plantain for Africa, Kampala, Uganda, 14-18 October 1996. Acta Horticulturae 540: 225-232.
187. Spilsbury J., Jagwe J., Ferris S. and Luwandagga D. 2002. Evaluating the
marketing opportunities for banana and its products in the principle banana growing countries of ASARECA. Uganda Report. International Institute of Tropical Agriculture – Foodnet, 60 pp.
188. Stanton J.M. 1999. Assessment of resistance and tolerance of in vitro-
propagated banana plants to burrowing nematode, Radopholus similis. Australian Journal of Experimental Agriculture 39: 891-895.
189. Starr J.L., Bridge J. and Cook R. 2002. Resistance to plant-parasitic
nematodes: history, current use and future potential. In: Starr J.L., Cook R. and Bridge J. (Eds). Plant resistance to parasitic nematodes. CAB International, Wallingford, UK, pp. 1-22.
190. Stoffelen R. 2000. Early screening of Eumusa and Australimusa bananas
against root-lesion and root-knot nematodes. Dissertationes de Agricultura Nº 426. Katholieke Universiteit Leuven, Belgium, 170 pp.
191. Stoffelen R., Jimenez M.I., Dierckxsens C., Tam V.T.T., Swennen R. and
De Waele D. 1999a. Effect of time and inoculum density on the reproductive fitness of Pratylenchus coffeae and Radopholus similis populations on carrot discs. Nematology 1(3): 243-250.
192. Stoffelen R., Tam V.T.T., Swennen R.L. and De Waele D. 1999b. Host
plant response of banana (Musa spp.) cultivars from Southeast Asia to nematodes. International Journal of Nematology 9(2): 130-136.
193. Stoffelen R., Verlinden R., Xuyen N.T., Swennen R. and De Waele D.
1999c. Screening of Papua New Guinea bananas to root-lesion and root-knot nematodes. InfoMusa 8(1): 12-15.
194. Stover R.H. and Buddenhagen I.W. 1986. Banana breeding: polyploidy,
disease resistance and productivity. Fruits 41(3): 175-191. 195. Stover R.H. and Simmonds N.W. 1987. Bananas. 3rd Edition. Wiley and
sons, New York, USA, 468 pp.
REFERENCES 188
196. Swennen R. 1990. Limits of morphotaxonomy: names and synonyms of plantain in Africa and elsewhere. In: Jarret R. L. (Ed). The identification of genetic diversity in the genus Musa. Proceedings of an International Workshop. Los Baños, Philippines, 5-10 September 1988. INIBAP, Montpellier, France, pp. 172-210.
197. Swennen R., De Langhe E., Janssen J. and Decoene D. 1986. Study of the
root development of some Musa cultivars in hydroponics. Fruits 41: 515-524.
198. Swennen R. and Vuylsteke D. 1991. Bananas in Africa: diversity, uses and
prospects for improvement. In: Ng N.Q., Perrino P., Attere F. and Zedan H. (Eds). Crop Genetic Resources of Africa, vol.2, Proc. Intl. Conf., Ibadan, Nigeria, 17-20 October 1988. The Trinity Press, UK, pp. 151-159.
199. Swennen R. and Vuylsteke D. 1993. Breeding black Sigatoka resistant
plantains with a wild banana. Tropical Agriculture 70 (1):74-77. 200. Swennen R., Wilson G.F. and Decoene D. 1988. Priorities for future
research on the root system and corm in plantains and bananas in relation with nematodes and the banana weevil. In: Nematodes and the borer weevil in Bananas: Present status of research and outlook. Proceedings of a workshop held in Bujumbura, Burundi, 7-11 December 1987. INIBAP, Montpellier, France, pp. 91-96.
201. Talengera D., Ssebuliba R., Pillay M., Makumbi D., Tenkouano A. and
Tushemereirwe W. Reproductive efficiency and breeding potential of East African highland bananas. Submitted to African Crop Science Journal.
202. Talwana H. 2002. Spatial distribution and effect of plant-parasitic
nematodes on root systems and plant nutritional status of bananas in Uganda. Dissertationes de Agricultura Nº 512. Katholieke Universiteit Leuven, Belgium, 133 pp.
203. Talwana H.A.L., Speijer P.R., Gold C.S., Swennen R.L. and De Waele D.
2003. A comparison of the effects of the nematodes Radopholus similis and Pratylenchus goodeyi on growth, root health and yield of an East African highland cooking banana (Musa AAA-group). International Journal of Pest Management 49(3): 199-204.
REFERENCES 189
204. Tarté R., Pinochet J., Gabrielli C. and Ventura O. 1981. Differences in population increase, host preferences and frequency of morphological variants among isolates of the banana race of Radopholus similis. Nematropica 11: 43-52.
205. Tenkouano A., Crouch J.H., Crouch H.K., Vuylsteke D. and Oritz R. 1999.
Comparison of DNA marker and pedigree-based methods of genetic analysis in plantain and banana (Musa spp.) clones. II. Predicting hybrid performance. Theoretical Applied Genetics 98: 69-75.
206. Tenkouano A., Ortiz R. and Vuylsteke D. 1998. Combining ability of yield
potential and plant phenology in plantain derived populations. Euphytica 104: 151-158.
207. Tenkouano A. and Swennen R. 2004. Progress in breeding and delivering
improved plantain and banana to African farmers. Chronica Horticulturae 44(1): 9-15.
208. Tenkouano A., Vuylsteke D., Okoro J., Makumbi D., Swennen R. and Ortiz
R. 2003. Diploid banana hybrids TMB2x 5105-1 and TMB2x 9128-3 with good combining ability, resistance to black Sigatoka and nematodes. HortScience 38(3): 468-472.
209. Tézenas du Montcel H., Carreel F. and Bakry F. 1996. Improve the
diploids: the key for banana breeding. In: Frison E.A., Horry J.P. and De Waele D. (Eds). Proceedings of the workshop on new frontiers in resistance breeding for nematode, Fusarium and Sigatoka. Kuala Lumpur, Malaysia, 2-5 October 1995. INIBAP, Montpellier, France, pp. 119-128.
210. Thies J.A., Basigalup D. and Barnes D.K. 1994. Inheritance of resistance
to Pratylenchus penetrans in Alfalfa. Journal of Nematology 26(4): 452-459. 211. Thomas J.E. and Iskra-Caruana M.L. 2000. Diseases caused by viruses:
Bunchy top. In: Jones D.R. (Ed). Diseases of banana, abaca and enset. CAB International, Wallingford, UK, pp. 241-253.
212. Townshend J.L., Tarté R. and Mai W.F. 1978. Growth response of three
vegetables to smooth and crenate-tailed females of three species of Pratylenchus. Journal of Nematology 10(3): 259-263.
REFERENCES 190
213. Triantaphyllou A.C. 1987. Genetics of nematode parasitism on plants. In: Veech J.A. and Dickson D.W. (Eds). Vistas on Nematology. Society of Nematologists, Hyattsville, Maryland, USA, pp. 354-363.
214. Trudgill D.L. 1991. Resistance to and tolerance of plant parasitic
nematodes in plants. Annual Review of Phytopathology 29: 167-192. 215. Tushemereirwe W.K., Karamura D., Ssali H., Bwamiki D., Kashaija I.,
Nankinga C., Bagamba F., Kangire A. and Ssebuliba R. 2001. Bananas (Musa spp.). In: Mukiibi J.K. (Ed). Agriculture in Uganda, Volume II, Crops. Fountain Publishers Ltd., Kampala, Uganda, pp. 281-319.
216. Thwaites R., Eden-Green S.J. and Black R. 2000. Diseases caused by
bacteria. In: Jones D.R. (Ed), Diseases of banana, abaca and enset. CAB International, Wallingford, UK, pp. 213-239.
217. Valette C., Andary C., Geiger J.P., Sarah J.L. and Nicole M. 1998.
Histochemical and cytochemical investigations of phenols in roots of banana infected by the burrowing nematode Radopholus similis. Phytopathology 88(11): 1141-1148.
218. Valette C., Nicole M., Sarah J.L., Boisseau M., Boher B., Fargette M. and
Geiger J.P. 1997. Ultrastructure and cytochemistry of interactions between banana and the nematode Radopholus similis. Fundamental and Applied Nematology 20(1): 65-77.
219. Van der Planck J.E. 1963. Plant diseases: Epidemics and control.
Academic Press, New York, 349 pp. 220. Veech J.A. 1982. Phytoalexins and their role in the resistance of plants to
nematodes. Journal of Nematology 14(1): 2-9. 221. Verdejo-Lucas S. and Kaplan D.T. 2002. The citrus nematode:
Tylenchulus semipenetrans. In: Starr J.L., Cook R. and Bridge J. (Eds). Plant resistance to parasitic nematodes. CAB International, Wallingford, UK, pp. 207-219.
222. Viaene N., Duran L.F., Rivera J.M., Duenas J., Rowe P. and De Waele D.
2003. Responses of banana and plantain cultivars, lines and hybrids to the burrowing nematode Radopholus similis. Nematology 5(1): 85-98.
REFERENCES 191
223. von Mende N., Burrows P. and Bridge J. 1992. Molecular aspects of resistance to nematodes. In: Biotechnology Application for Banana and Plantain Improvement. Proceedings of a workshop held in San Jose, Costa Rica, January 27-31, 1992. INIBAP, Montpellier, France, pp. 125-127.
224. Vuylsteke D. 1995. Banana research at IITA: current status and outlook.
In: The King Baudouin Award to IITA, Proc. Academic Session held at K.U.Leuven, Belgium, 6 April 1995. Cabinet of the minister of foreign affairs and development cooperation, Brussels, Belgium, pp. 33-40.
225. Vuylsteke D. 2000. Breeding bananas and plantain: from intractability
to feasibility. In: Craenen K., Ortiz R., Karamura E.B. and Vuylsteke D.R. (Eds). Proceedings of the First International Conference on Banana and Plantain for Africa. Acta Horticulturae 540: 149-156.
226. Vuylsteke D. 2001. Strategies for utilization of genetic variation in
plantain improvement. Dissertationes de Agricultura. Katholieke Universiteit Leuven, Belgium, 213 pp.
227. Vuylsteke D., Karamura D., Ssebuliba R.N. and Makumbi D. 1996. Seed
and pollen fertility in the East African highland bananas. MusAfrica 10. 228. Vuylsteke D., Ortiz R. and Swennen R. 1993. Genetic improvement of
plantains at the International Institute of Tropical Agriculture (IITA). In: Ganry J. (Ed). Breeding banana and plantain for resistance to diseases and pests. Proceedings of the International Symposium on genetic improvement of bananas for resistance to diseases and pests. Montpellier, France, 7-9 September 1992. CIRAD, Montpellier, France, pp. 267-282.
229. Wehunt E.J., Hutchinson D.J. and Edwards D.I. 1978. Reaction of banana
cultivars to the burrowing nematode (Radopholus similis). Journal of Nematology 10(4): 368-370.
230. Williamson V.M. 1999. Plant nematode resistance genes. Current Opinion
in Plant Biology 2: 327-331. 231. Wilson G.F. 1987. Status of bananas and plantains in West Africa. In:
Perseley G.J. and De Langhe E.A. (Eds). Banana and plantain breeding strategies: Proceedings of an international workshop held in Cairns, Australia 13-17 August 1986. ACIAR Proc. Nº 21, pp. 29-35.
REFERENCES 192
232. Wuyts N., Elsen A., De Waele D., Swennen R. and Sagi L. 2002. Potential of plant secondary metabolites to increase resistance against plant-parasitic nematodes. Med. Fac. Landbouww. Univ. Gent 67(4): 101-104.
233. Wuyts N., Lognay G., Sagi L., De Waele D. and Swennen R. Secondary
metabolites in roots and implications for nematode resistance in banana (Musa spp.). In: Turner D. and Rosales F. (Eds). Conference Proceedings: Banana root system: towards a better understanding for its productive management. November 3-5, 2003, San Jose, Costa Rica. INIBAP-LAC, Turrialba, Costa Rica. In press.
234. Young L.D. 1992. Problems and strategies associated with long-term use
of nematode resistant cultivars. Journal of Nematology 24(2): 228-233. 235. Young N.D. and Mudge J. 2002. Marker-assisted selection for soybean cyst
nematode resistance. In: Starr J.L., Cook R. and Bridge J. (Eds). Plant resistance to parasitic nematodes. CAB International, Wallingford, UK, pp. 241-252.
236. Zhong R., Ripperger A. and Ye Z-H. 2000. Ectopic deposition of lignin in
the pith of stems of two Arabidopsis mutants. Plant Physiology 123(1): 59-70.
237. Zwart R.S., Thompson J.P. and Godwin I.D. 2004. Genetic analysis of
resistance to root-lesion nematode (Pratylenchus thornei) in wheat. Plant Breeding 123: 209-212.
238. Zwietering M.H., Jongenburger I., Rombouts F.M. and van’t Riet K.
1990. Modeling of the bacterial growth curve. Applied and Environmental Microbiology 56(6): 1875-1881.
REFERENCES 193
ANNEXES
Annex 1: List of publications
* Ortiz R., Dochez C., Moonan F. and Asiedu R. Breeding vegetatively propagated crops. In: Lamkey K. and M. Lee (Eds). Plant Breeding. Iowa State University Press, Ames. In press.
* Gold C.S., Nankinga C.M., Dochez C., Tushemereirwe W.K., Karamura E.B. and Karamura D.A. Pests threatening Musa biodiversity in the Great Lakes Region of Eastern Uganda. Submitted to African Crop Science Journal.
* De Schutter B., Speijer P.R., Dochez C., Tenkouano A. and De Waele D. 2001. Evaluating host plant reaction of Musa germplasm to Radopholus similis by inoculation of single primary roots. Nematropica 31(2): 295-299.
* Dochez C., Speijer P.R., Hartman J., Vuylsteke D. and De Waele D. 2000. Screening Musa hybrids for resistance to Radopholus similis. InfoMusa 9(2): 3-4. * Dochez C. 2000. Integrated action against nematodes in Uganda. Contribution to IPM systems. Biocontrol News and Information 21(3): 69N- 70N.
Annex 2: List of abstracts
* Dochez C., Whyte J.B.A., Pillay M., Coyne D. and De Waele D. Reproductive fitness and pathogenic variability of different Radopholus similis populations from Uganda on Musa germplasm. 16th Symposium Nematology Society of Southern Africa, 1-4 July 2003, Strand, South Africa.
* Dochez C., Coyne D., Pillay M. and De Waele D. Status of Host Plant Resistance Breeding to Nematodes among the East African highland bananas. International Conference on IPM in Sub Saharan Africa, 8-12 September 2002, Kampala, Uganda.
REFERENCES 194
* Coyne D. and Dochez C. Towards the Management of Plant Parasitic Nematodes in Tropical and Sub-Tropical Agriculture. International Conference on IPM in Sub Saharan Africa, 8-12 September 2002, Kampala, Uganda.
* Dochez C., Coyne D., Pillay M. and De Waele D. Comparison of two screening methods for early evaluation of resistance to Radopholus similis in Musa germplasm. IFNS meeting, 8-13 June 2002, Tenerife.
* Dochez C., Coyne D., Pillay M. and De Waele D. Early evaluation of Musa germplasm for resistance to Radopholus similis. NARO conference on ‘Contribution of Agricultural Research in Poverty Reduction’, 3-8 December 2001, Kampala, Uganda. * Dochez C., Makumbi D., Tenkouano A. and De Waele D. Screening of Musa germplasm for resistance to Radopholus similis. 15th Symposium Nematology Society of Southern Africa, 20-23 May 2001, Skukuza, South Africa. * Dochez C., Makumbi D., Tenkouano A. and De Waele D. Host plant resistance in Musa to nematodes. ProMusa Meeting, nematology working group, 6-9 November 2000, Bangkok, Thailand. * Dochez C., Speijer P.R., Hartman J. and Vuylsteke D. New Musa hybrids with partial resistance to Radopholus similis. 25th European Nematology Conference, 2-7 April, 2000, Herzliya, Israel. * Wuyts N., Dochez C., Speijer P.R. and De Waele D. Interaction between nematodes and banana weevil on small plants. 25th European Nematology Conference, 2-7 April, 2000, Herzliya, Israel. * Dochez C., Speijer P., De Waele D. and Ortiz R. Host plant response to nematodes in Musa landraces and hybrids. 13th Symposium Nematology Society of Southern Africa, 9-13 March 1997, Southbroom, South Africa. African Plant Protection 3(2): 110.
REFERENCES 195
Annex 3: Guidance to undergraduate students * Wuyts N. 2000. Interactie tussen nematoden en de bananenkever op kleine bananenplanten. Thesis, Faculteit Landbouwkundige en Toegepaste Biologische Wetenschappen, Katholieke Universiteit Leuven. * Wamutsembe I. 2004. Reproductive fitness and pathogenicity of two Radopholus similis populations on three banana cultivars. BSc Thesis. Faculty of Agriculture, Makerere University Kampala, Uganda.