BPO NYSE TSX T HIRD Q UARTER REPORT mber Dear reholders
72
T D N d in c Ik F $ p C t in d D p m H C C 5 f S d b R t c $ THIRD Q Dear Sha Net income for t diluted share du nterest in one p current period a ke. The prior pe Funds from oper $146 million or $ per share. Comparable com hird quarter of ncome to $328 during the same During the third per square foot, managed‐portfo HIGHLIGHTS OF T Completed a num Renew Comple raising perma Extend Front S Closed on the di 51‐story, 1.1‐mil inancial district. Sustained net $8 damage from co been completed Repurchased 1.2 o the quarter, t course issuer bid $11.96. QUART reholders the three month uring the same p roperty in Toron lso includes a on riod also include rations (“FFO”) w $0.36 per dilute mmercial propert 2007. This exclu million. Residen period in 2007. quarter, Brookfi , which represen lio occupancy ra THE THIRD QUA mber of financin wed $300 million eted a bridge fa net proceeds o nently financed ded or refinance Street, Toronto. sposition of a 5 lion‐square‐foot 8 million of no ompromised roo . All properties h 269 million com the company ac d in 1999, Broo ER REPO s: hs ended Septem period in 2007. nto, while the p ne‐time net cost ed one‐time tran was $152 millio ed share during t ty net operating udes the impact ntial operations ield Properties le nts a 22% impro ate finished the q ARTER ngs, including: corporate revo acility of C$300 m of C$25 million in 2009; and ed a further $15 50% interest in T t tower is part o n‐recoverable p fs and windows have been reope mon shares dur quired a furthe okfield Propertie ORT mber 30, 2008 w The current pe rior period inclu t of $8 million o nsaction costs of n or $0.38 per d the same period g income for the t of damage fro were stable and eased 1.9 millio ovement over t quarter at 96.0% lving credit facil million on Petro at ownership. W 55 million throu TD Canada Trust of the company’s property losses s, and other asso ened and are fun ring the quarter r 200,000 share es has invested Septe was $174 millio riod includes a uded a $5 million or $0.02 per sha f $35 million or $ diluted share fo d in 2007. Exclud e third quarter o m Hurricane Ike d contributed $4 n square feet of the average in‐p %. ity with Brookfie o Canada Centre With the recent ugh 2009 and be t Tower for gros s 2.6‐million‐squ to Houston ass ociated collatera nctioning norma for a total of $2 es at an average $457.2 million, ember 30, n or $0.44 per d $127 million ne n net gain or $0 re as a result of $0.09 per dilute r the three mon ding the impact of 2008 was $34 e which otherwi 45 million of ne f space in its man place net rent a eld Asset Manag e, Calgary, subse t signing of a o eyond, including ss proceeds of C uare‐foot Brookf sets from Hurric al damage. Perm ally. 22.3 million at an e price of $13.97 acquiring 38.2 , 2008 diluted share, co et gain or $0.32 .01 per share on the impact of t d share. nths ended Sept of Hurricane Ike 41 million, comp ise reduced com t operating inco naged portfolio t the beginning gement Inc. into equent to the th ne million squa g a 12‐year, 6.2 C$425 million an field Place office cane Ike. Losses manent or temp n average price o 7. Since the ince million commo ompared to $3 per share on th n the sale of two he damage caus tember 30, 2008 e, FFO was $160 pared to $324 m mmercial proper ome, compared at an average n g of the quarter 2010; hird quarter for a are foot lease, t 24% fixed rate r d a net gain of $ e and retail com s resulted from porary clean‐up a of $17.59 per sh eption of the co n shares at an BPO million or nil pe he sale of a 50% o properties. Th sed by Hurrican 8 compared wit 0 million or $0.40 million during th rty net operatin with $43 millio et rent of $28.4 . The company’ a one year term this asset will b refinancing of 2 $127 million. Th plex in Toronto’ wind and wate and repairs hav hare. Subsequen ompany's norma average price o O: NYSE / TSX er % e e h 0 e g n 2 ’s m, e 2 e ’s er e nt al of
Transcript of BPO NYSE TSX T HIRD Q UARTER REPORT mber Dear reholders

T
D
NdincIk F$p Ctind Dpm H C
C5f Sdb Rtc$
THIRD Q
Dear Sha
Net income for tdiluted share dunterest in one pcurrent period ake. The prior pe
Funds from oper$146 million or $per share.
Comparable comhird quarter of ncome to $328 during the same
During the third per square foot,managed‐portfo
HIGHLIGHTS OF T
Completed a num
Renew
Compleraising perma
ExtendFront S
Closed on the di51‐story, 1.1‐milinancial district.
Sustained net $8damage from cobeen completed
Repurchased 1.2o the quarter, tcourse issuer bid$11.96.
QUART
reholders
the three monthuring the same property in Toronlso includes a onriod also include
rations (“FFO”) w$0.36 per dilute
mmercial propert2007. This exclumillion. Residenperiod in 2007.
quarter, Brookfi, which represenlio occupancy ra
THE THIRD QUA
mber of financin
wed $300 million
eted a bridge fanet proceeds onently financed
ded or refinanceStreet, Toronto.
sposition of a 5lion‐square‐foot
8 million of noompromised roo. All properties h
269 million comthe company acd in 1999, Broo
ER REPO
s:
hs ended Septemperiod in 2007. nto, while the pne‐time net costed one‐time tran
was $152 millioed share during t
ty net operatingudes the impactntial operations
ield Properties lents a 22% improate finished the q
ARTER
ngs, including:
corporate revo
acility of C$300 mof C$25 million in 2009; and
ed a further $15
50% interest in Tt tower is part o
n‐recoverable pfs and windowshave been reope
mon shares durquired a furtheokfield Propertie
ORT
mber 30, 2008 wThe current perior period inclut of $8 million onsaction costs of
n or $0.38 per dthe same period
g income for thet of damage frowere stable and
eased 1.9 millioovement over tquarter at 96.0%
lving credit facil
million on Petroat ownership. W
55 million throu
TD Canada Trustof the company’s
property losses s, and other assoened and are fun
ring the quarter r 200,000 sharees has invested
Septe
was $174 millioriod includes a uded a $5 millionor $0.02 per shaf $35 million or $
diluted share fod in 2007. Exclud
e third quarter om Hurricane Iked contributed $4
n square feet ofthe average in‐p%.
ity with Brookfie
o Canada CentreWith the recent
ugh 2009 and be
t Tower for gross 2.6‐million‐squ
to Houston associated collateranctioning norma
for a total of $2es at an average$457.2 million,
ember 30,
n or $0.44 per d$127 million nen net gain or $0re as a result of $0.09 per dilute
r the three monding the impact
of 2008 was $34e which otherwi45 million of ne
f space in its manplace net rent a
eld Asset Manag
e, Calgary, subset signing of a o
eyond, including
ss proceeds of Cuare‐foot Brookf
sets from Hurrical damage. Permally.
22.3 million at ane price of $13.97acquiring 38.2
, 2008
diluted share, coet gain or $0.32 .01 per share onf the impact of td share.
nths ended Septof Hurricane Ike
41 million, compise reduced comt operating inco
naged portfolio t the beginning
gement Inc. into
equent to the thne million squa
g a 12‐year, 6.2
C$425 million anfield Place office
cane Ike. Lossesmanent or temp
n average price o7. Since the incemillion commo
ompared to $3 per share on thn the sale of twohe damage caus
tember 30, 2008e, FFO was $160
pared to $324 mmmercial properome, compared
at an average ng of the quarter
2010;
hird quarter for aare foot lease, t
24% fixed rate r
d a net gain of $e and retail com
s resulted fromporary clean‐up a
of $17.59 per sheption of the con shares at an
BPO
million or nil pehe sale of a 50%o properties. Thsed by Hurrican
8 compared wit0 million or $0.40
million during thrty net operatinwith $43 millio
et rent of $28.4. The company’
a one year termthis asset will b
refinancing of 2
$127 million. Thplex in Toronto’
wind and wateand repairs hav
hare. Subsequenompany's normaaverage price o
O: NYSE / TSX
er % e e
h 0
e g n
2 ’s
m, e
2
e ’s
er e
nt al of

2 Q3/2008 Interim Report
Advanced developments under construction:
Bay Adelaide Centre, Toronto, was topped off on September 23; the project remains on schedule for Q3 2009 completion and is 72% leased;
Bankers Court, Calgary, which is 100% leased, was topped off on September 5. Curtain wall installation is nearing completion;
Two Reston Crescent, Virginia, received its Certificate of Occupancy subsequent to the third quarter;
77 K Street, Washington, DC, was completed in the third quarter;
1225 Connecticut Ave., Washington, DC, curtain wall was completed and mechanical equipment and electrical switchboards installed; substantial completion is expected in the fourth quarter 2008; and
Manhattan West, New York, continued early works on the railroad track bed in preparation for caisson installation.
Leased 1.9 million square feet of space. New leases represent 28% of the total while renewals represent the remaining 72%. Third quarter leasing highlights include: Calgary – 1.1 million square feet
One‐million‐square‐foot extension and expansion for 15 years with Petro‐Canada at Petro Canada Centre
New 78,000‐square‐foot lease for ten years with Petrobank Energy at Petro Canada Centre Toronto – 247,000 square feet
New 99,000‐square‐foot lease for ten years with Citco at Hudson’s Bay Centre
Minneapolis – 140,000 square feet
119,000‐square‐foot renewal for four years with Neiman Marcus at Gaviidae Common
Houston – 122,000 square feet
49,000‐square‐foot expansion for 11 years with Devon Energy at Three Allen Center
OUTLOOK With a well‐leased portfolio and low near‐term lease rollover exposure, Brookfield Properties is strongly positioned to maintain steady financial performance through the economic downturn. At the same time, we are working to generate additional liquidity in order to take advantage of opportunities that will undoubtedly arise in this market.
Gordon E. Arnell Richard B. Clark Chairman President & CEO October 29, 2008
Brookfield Properties Corporation 3
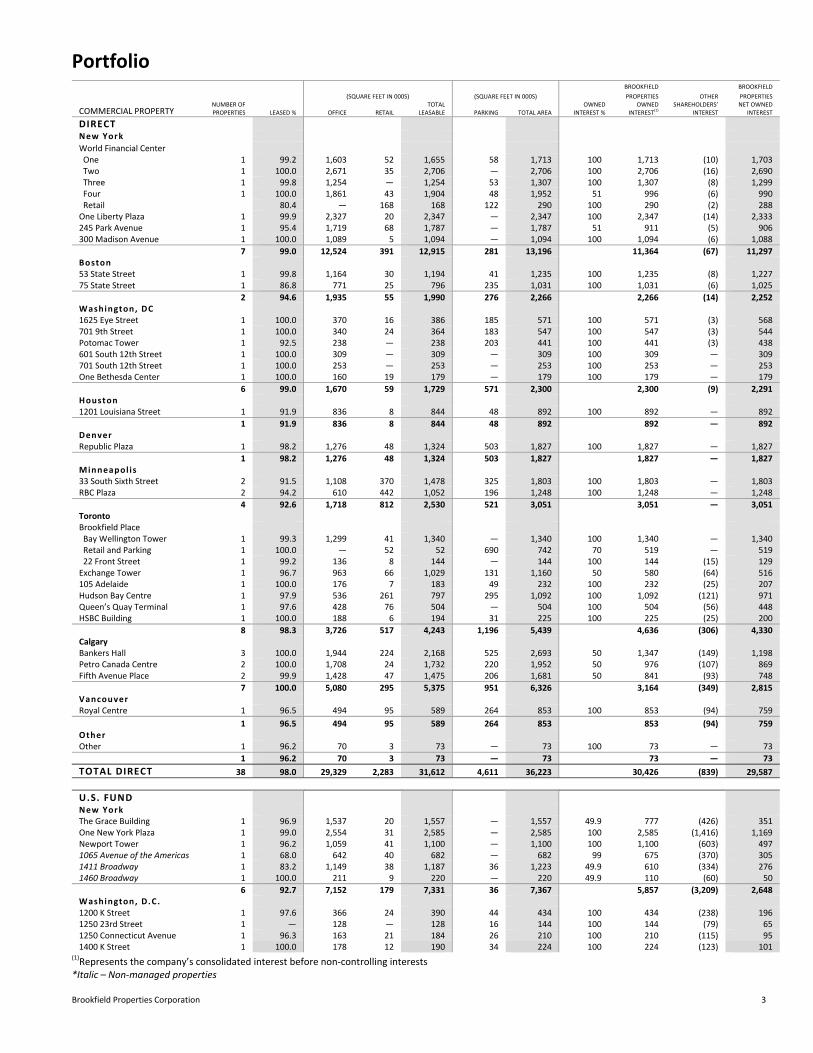
Portfolio BROOKFIELD BROOKFIELD
(SQUARE FEET IN 000S) (SQUARE FEET IN 000S) PROPERTIES OTHER PROPERTIES
COMMERCIAL PROPERTY NUMBER OF PROPERTIES LEASED % OFFICE RETAIL
TOTAL LEASABLE
PARKING
TOTAL AREA
OWNED INTEREST %
OWNED INTEREST
(1)
SHAREHOLDERS’ INTEREST
NET OWNED INTEREST
DIRECT
New York
World Financial Center One 1 99.2 1,603 52 1,655 58 1,713 100 1,713 (10) 1,703 Two 1 100.0 2,671 35 2,706 — 2,706 100 2,706 (16) 2,690 Three 1 99.8 1,254 — 1,254 53 1,307 100 1,307 (8) 1,299 Four 1 100.0 1,861 43 1,904 48 1,952 51 996 (6) 990 Retail 80.4 — 168 168 122 290 100 290 (2) 288 One Liberty Plaza 1 99.9 2,327 20 2,347 — 2,347 100 2,347 (14) 2,333 245 Park Avenue 1 95.4 1,719 68 1,787 — 1,787 51 911 (5) 906 300 Madison Avenue 1 100.0 1,089 5 1,094 — 1,094 100 1,094 (6) 1,088
7 99.0 12,524 391 12,915 281 13,196 11,364 (67) 11,297 Boston 53 State Street 1 99.8 1,164 30 1,194 41 1,235 100 1,235 (8) 1,227 75 State Street 1 86.8 771 25 796 235 1,031 100 1,031 (6) 1,025
2 94.6 1,935 55 1,990 276 2,266 2,266 (14) 2,252 Washington, DC 1625 Eye Street 1 100.0 370 16 386 185 571 100 571 (3) 568 701 9th Street 1 100.0 340 24 364 183 547 100 547 (3) 544 Potomac Tower 1 92.5 238 — 238 203 441 100 441 (3) 438 601 South 12th Street 1 100.0 309 — 309 — 309 100 309 — 309 701 South 12th Street 1 100.0 253 — 253 — 253 100 253 — 253 One Bethesda Center 1 100.0 160 19 179 — 179 100 179 — 179
6 99.0 1,670 59 1,729 571 2,300 2,300 (9) 2,291 Houston 1201 Louisiana Street 1 91.9 836 8 844 48 892 100 892 — 892
1 91.9 836 8 844 48 892 892 — 892 Denver Republic Plaza 1 98.2 1,276 48 1,324 503 1,827 100 1,827 — 1,827
1 98.2 1,276 48 1,324 503 1,827 1,827 — 1,827 Minneapol is 33 South Sixth Street 2 91.5 1,108 370 1,478 325 1,803 100 1,803 — 1,803 RBC Plaza 2 94.2 610 442 1,052 196 1,248 100 1,248 — 1,248
4 92.6 1,718 812 2,530 521 3,051 3,051 — 3,051 Toronto Brookfield Place Bay Wellington Tower 1 99.3 1,299 41 1,340 — 1,340 100 1,340 — 1,340 Retail and Parking 1 100.0 — 52 52 690 742 70 519 — 519 22 Front Street 1 99.2 136 8 144 — 144 100 144 (15) 129 Exchange Tower 1 96.7 963 66 1,029 131 1,160 50 580 (64) 516 105 Adelaide 1 100.0 176 7 183 49 232 100 232 (25) 207 Hudson Bay Centre 1 97.9 536 261 797 295 1,092 100 1,092 (121) 971 Queen’s Quay Terminal 1 97.6 428 76 504 — 504 100 504 (56) 448 HSBC Building 1 100.0 188 6 194 31 225 100 225 (25) 200
8 98.3 3,726 517 4,243 1,196 5,439 4,636 (306) 4,330 Calgary Bankers Hall 3 100.0 1,944 224 2,168 525 2,693 50 1,347 (149) 1,198 Petro Canada Centre 2 100.0 1,708 24 1,732 220 1,952 50 976 (107) 869 Fifth Avenue Place 2 99.9 1,428 47 1,475 206 1,681 50 841 (93) 748
7 100.0 5,080 295 5,375 951 6,326 3,164 (349) 2,815 Vancouver Royal Centre 1 96.5 494 95 589 264 853 100 853 (94) 759
1 96.5 494 95 589 264 853 853 (94) 759 Other Other 1 96.2 70 3 73 — 73 100 73 — 73
1 96.2 70 3 73 — 73 73 — 73
TOTAL DIRECT 38 98.0 29,329 2,283 31,612 4,611 36,223 30,426 (839) 29,587
U.S. FUND New York The Grace Building 1 96.9 1,537 20 1,557 — 1,557 49.9 777 (426) 351 One New York Plaza 1 99.0 2,554 31 2,585 — 2,585 100 2,585 (1,416) 1,169 Newport Tower 1 96.2 1,059 41 1,100 — 1,100 100 1,100 (603) 497 1065 Avenue of the Americas 1 68.0 642 40 682 — 682 99 675 (370) 305 1411 Broadway 1 83.2 1,149 38 1,187 36 1,223 49.9 610 (334) 276 1460 Broadway 1 100.0 211 9 220 — 220 49.9 110 (60) 50
6 92.7 7,152 179 7,331 36 7,367 5,857 (3,209) 2,648 Washington, D.C. 1200 K Street 1 97.6 366 24 390 44 434 100 434 (238) 196 1250 23rd Street 1 — 128 — 128 16 144 100 144 (79) 65 1250 Connecticut Avenue 1 96.3 163 21 184 26 210 100 210 (115) 95 1400 K Street 1 100.0 178 12 190 34 224 100 224 (123) 101
(1)Represents the company’s consolidated interest before non‐controlling interests
*Italic – Non‐managed properties

4 Q3/2008 Interim Report
BROOKFIELD BROOKFIELD
(SQUARE FEET IN 000S) (SQUARE FEET IN 000S) PROPERTIES OTHER PROPERTIES
NUMBER OF PROPERTIES LEASED % OFFICE RETAIL
TOTAL LEASABLE
PARKING
TOTAL AREA
OWNED INTEREST %
OWNED INTEREST
(1)
SHAREHOLDERS’ INTEREST
NET OWNED INTEREST
2000 L Street 1 89.6 308 75 383 — 383 100 383 (210) 173 2001 M Street 1 98.9 190 39 229 35 264 98 259 (142) 117 2401 Pennsylvania Avenue 1 86.9 58 19 77 16 93 100 93 (51) 42 Bethesda Crescent 3 100.0 241 27 268 68 336 100 336 (184) 152 One Reston Crescent 1 100.0 185 — 185 — 185 100 185 (101) 84 Silver Springs Metro Plaza 3 91.4 640 47 687 84 771 100 771 (422) 349 Sunrise Tech Park 4 95.8 315 1 316 — 316 100 316 (173) 143 Two Ballston Plaza 1 90.0 204 19 223 — 223 100 223 (122) 101 Victor Building 1 73.6 302 45 347 — 347 49.9 173 (95) 78 1550 & 1560 Wilson Blvd 2 80.4 248 35 283 76 359 100 359 (197) 162
22 88.7 3,526 364 3,890 399 4,289 4,110 (2,252) 1,858 Los Angeles 601 Figueroa 1 70.5 1,037 2 1,039 123 1,162 100 1,162 (636) 526 Bank of America Plaza 1 95.8 1,383 39 1,422 343 1,765 100 1,765 (967) 798 Ernst & Young Tower 1 83.8 910 335 1,245 391 1,636 100 1,636 (896) 740 Landmark Square 1 94.5 420 23 443 212 655 100 655 (359) 296 Marina Towers 2 94.7 356 25 381 87 468 50 234 (128) 106 5670 Wilshire Center 1 83.1 409 19 428 — 428 100 428 (234) 194 6060 Center Drive 1 85.7 253 15 268 113 381 100 381 (209) 172 6080 Center Drive 1 96.0 316 — 316 163 479 100 479 (263) 216
6100 Center Drive 1 96.9 294 — 294 168 462 100 462 (253) 209 701 B Street 1 85.8 512 37 549 — 549 100 549 (301) 248 707 Broadway 1 83.3 183 — 183 128 311 100 311 (170) 141 9665 Wilshire Blvd 1 88.7 171 — 171 64 235 100 235 (130) 105 Howard Hughes Spectrum 1 100.0 37 — 37 — 37 100 37 (20) 17 Howard Hughes Tower 1 47.0 336 2 338 141 479 100 479 (262) 217 Northpoint 1 75.9 105 — 105 45 150 100 150 (82) 68 Arden Towers at Sorrento 4 80.8 554 54 608 — 608 100 608 (333) 275 Westwood Center 1 92.8 293 25 318 — 318 100 318 (174) 144 Wachovia Center 1 95.7 465 14 479 161 640 100 640 (351) 289
22 85.6 8,034 590 8,624 2,139 10,763 10,529 (5,768) 4,761 Houston Allen Center One Allen Center 1 98.3 914 79 993 — 993 100 993 (544) 449 Two Allen Center 1 97.8 987 9 996 — 996 100 996 (546) 450 Three Allen Center 1 93.9 1,173 22 1,195 — 1,195 100 1,195 (655) 540 Four Allen Center 1 100.0 1,229 38 1,267 — 1,267 100 1,267 (697) 570 Cullen Center Continental Center I 1 98.1 1,048 50 1,098 411 1,509 100 1,509 (826) 683 Continental Center II 1 84.9 428 21 449 81 530 100 530 (290) 240 KBR Tower 1 82.7 985 63 1,048 254 1,302 50 651 (357) 294 500 Jefferson Street 1 96.3 351 39 390 44 434 100 434 (237) 197
8 94.7 7,115 321 7,436 790 8,226 7,575 (4,152) 3,423
TOTAL U.S. FUND 58 90.4 25,827 1,454 27,281 3,364 30,645 28,071 (15,381) 12,690
CANADIAN FUND Toronto First Canadian Place 1 97.2 2,379 232 2,611 170 2,781 25 695 (76) 619 151 Yonge Street 1 94.7 289 10 299 72 371 25 93 (10) 83 2 Queen Street East 1 98.6 448 16 464 81 545 25 136 (15) 121
3 97.2 3,116 258 3,374 323 3,697 924 (101) 823 Calgary Altius Centre 1 98.1 303 3 306 72 378 25 95 (11) 84
1 98.1 303 3 306 72 378 95 (11) 84 Ottawa Place de Ville I 2 97.0 569 18 587 502 1,089 25 272 (30) 242 Place de Ville II 2 99.3 591 19 610 433 1,043 25 261 (29) 232 Jean Edmonds Towers 2 100.0 541 12 553 95 648 25 162 (18) 144
6 98.7 1,701 49 1,750 1,030 2,780 695 (77) 618 Edmonton Canadian Western Bank 1 99.8 371 36 407 91 498 25 125 (14) 111 Enbridge Tower 1 100.0 184 — 184 30 214 25 54 (7) 47
2 99.8 555 36 591 121 712 179 (21) 158
TOTAL CANADIAN FUND 12 98.0 5,675 346 6,021 1,546 7,567 1,893 (210) 1,683
TOTAL PROPERTIES 108 94.8 60,831 4,083 64,914 9,521 74,435 60,390 (16,430) 43,960 Development and Redevelopment — — 16,506 — 16,506 — 16,506 15,067 (2,454) 12,613
TOTAL PORTFOLIO 108 94.8 77,337 4,083 81,420 9,521 90,941 75,457 (18,884) 56,573
TOTAL EXCLUDING NON‐MANAGED 89 96.0 71,407 3,830 75,237 8,502 83,739 68,985 (15,338) 53,647
(1)Represents the company’s consolidated interest before non‐controlling interests
*Italic – Non‐managed properties

Brookfield Properties Corporation 5
Management’s Discussion and Analysis of Financial Results PART I – OBJECTIVES AND FINANCIAL HIGHLIGHTS .................................................................................................................................................. 6 PART II – FINANCIAL STATEMENT ANALYSIS ........................................................................................................................................................... 13 PART III – U.S. OFFICE FUND SUPPLEMENTAL INFORMATION ................................................................................................................................ 40 PART IV – CANADIAN OFFICE FUND SUPPLEMENTAL INFORMATION .................................................................................................................... 43 PART V – RISKS AND UNCERTAINTIES ..................................................................................................................................................................... 46 PART VI – CRITICAL ACCOUNTING POLICIES AND ESTIMATES ................................................................................................................................ 51 FORWARD‐LOOKING STATEMENTS This interim report to shareholders contains forward‐looking statements and information within the meaning of applicable securities legislation. These forward‐looking statements reflect management’s current beliefs and are based on assumptions and information currently available to management of Brookfield Properties. In some cases, forward‐looking statements can be identified by terminology such as “may,” “will,” “expect,” “plan,” “anticipate,” “believe,” “intend,” “estimate,” “predict,” “forecast,” “outlook,” “potential,” “continue,” “should,” “likely,” or the negative of these terms or other comparable terminology. Although management believes that the anticipated future results, performance or achievements expressed or implied by the forward‐looking statements and information are based upon reasonable assumptions and expectations, the reader should not place undue reliance on forward‐looking statements and information because they involve assumptions, known and unknown risks, uncertainties and other factors that may cause the actual results, performance or achievements of Brookfield Properties to differ materially from anticipated future results, performance or achievements expressed or implied by such forward‐looking statements and information. Factors that could cause actual results to differ materially from those set forth in the forward‐looking statements and information include, but are not limited to, general economic conditions; local real estate conditions, including the development of properties in close proximity to the company’s properties; timely leasing of newly developed properties and re‐leasing of occupied square footage upon expiration; dependence on tenants’ financial condition; the uncertainties of real estate development and acquisition activity; the ability to effectively integrate acquisitions; interest rates; availability of equity and debt financing; the impact of newly adopted accounting principles on the company’s accounting policies and on period‐to‐period comparisons of financial results; and other risks and factors described from time to time in the documents filed by the company with the securities regulators in Canada and the United States including in the Annual Information Form under the heading “Business of Brookfield Properties – Company and Real Estate Industry Risks.” The company undertakes no obligation to publicly update or revise any forward‐looking statements or information, whether as a result of new information, future events or otherwise, except as required by securities laws.

6 Q3/2008 Interim Report
Management’s Discussion and Analysis of Financial Results October 29, 2008
PART I – OBJECTIVES AND FINANCIAL HIGHLIGHTS BASIS OF PRESENTATION Financial data included in this Management’s Discussion and Analysis (“MD&A”) for the three and nine months ended September 30, 2008 includes material information up to October 29, 2008. Financial data provided has been prepared in accordance with Canadian generally accepted accounting principles (“GAAP”) with non‐GAAP measures such as net operating income and funds from operations being reconciled to appropriate Canadian GAAP measures. All dollar references, unless otherwise stated, are in millions of US dollars except per share amounts. Amounts in Canadian dollars are identified as “C$.” The following discussion and analysis is intended to provide readers with an assessment of the performance of Brookfield Properties Corporation (“Brookfield Properties”) over the past two years as well as our financial position and future prospects. It should be read in conjunction with the consolidated financial statements and appended notes which begin on page 53 of this report. In our discussion of operating performance, we refer to net operating income and funds from operations on a total and per share basis. Net operating income is defined as income from property operations after operating expenses have been deducted, but prior to deducting financing, administration, depreciation and amortization and income tax expenses. Funds from operations is defined as net income prior to extraordinary items, one‐time transaction costs, income taxes, depreciation and amortization and certain other non‐cash items. Net operating income is an important measure that we use to assess operating performance and funds from operations is a relevant measure in analyzing real estate, as commercial properties generally appreciate rather than depreciate. We provide the components of net operating income on page 29 and a full reconciliation from net income to funds from operations on page 29. Net operating income and funds from operations are both non‐GAAP measures that do not have any standardized meaning prescribed by GAAP and therefore may not be comparable to similar measures presented by other companies. Additional information, including our Annual Information Form, is available on our Web site at www.brookfieldproperties.com, or on www.sedar.com or www.sec.gov. OVERVIEW OF THE BUSINESS Brookfield Properties is a publicly‐traded North American commercial real estate company listed on the New York and Toronto stock exchanges under the symbol BPO. We operate in two principal business segments, the first being the ownership, development and management of premier commercial office properties in select cities in North America, and the second being the development of residential land. In the past three years, we have established and fully invested two core office funds for the purpose of enhancing our position as a leading real estate asset manager. The U.S. Office Fund (a single‐purpose fund established to acquire the Trizec portfolio) and the Canadian Office Fund (a single‐purpose fund established to acquire the O&Y portfolio) are discussed in further detail in Part III and Part IV, respectively, of this MD&A. The term “Brookfield Properties Direct” (“Direct”) refers to those properties that are wholly‐owned or owned through property‐level joint ventures. When referring to ownership of properties by the U.S. or Canadian Office Fund, such ownership percentage refers to that of the applicable fund and not the proportionate percentage ownership of Brookfield Properties. At September 30, 2008, the book value of Brookfield Properties’ assets was $15.5 billion. During the three months ended September 30, 2008 we generated $174 million of net income ($0.44 per diluted share) and $152 million of funds from operations ($0.38 per diluted share). During the nine months ended September 30, 2008 we generated $242 million of net income ($0.61 per diluted share) and $435 million of funds from operations ($1.10 per diluted share). FINANCIAL HIGHLIGHTS Brookfield Properties’ financial results are as follows: Three months ended Sept. 30 Nine months ended Sept. 30(Millions, except per share amounts) 2008 2007 2008 2007
Total revenue $ 718 $ 691 $ 2,092 $ 2,021Net income 174 3 242 135Net income per share – diluted 0.44 ― 0.61 0.33Common share dividends paid per share 0.14 0.14 0.42 0.41Funds from operations 152 146 435 442Funds from operations per share – diluted $ 0.38 $ 0.36 $ 1.10 $ 1.10
(Millions) Sept. 30, 2008 Dec. 31, 2007
Total assets $ 20,129 $ 20,473Commercial properties 15,452 15,889Commercial property debt 11,801 12,125Shareholders’ equity 3,097 3,078
Brookfield Properties Corporation 7
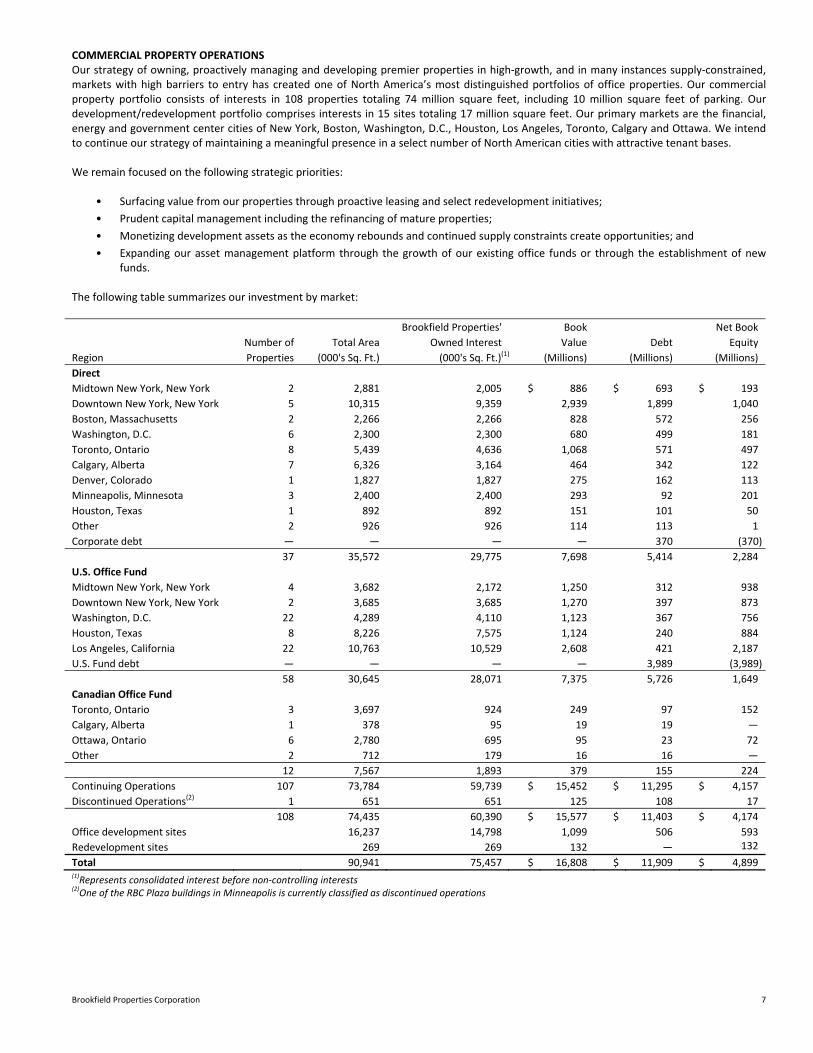
COMMERCIAL PROPERTY OPERATIONS Our strategy of owning, proactively managing and developing premier properties in high‐growth, and in many instances supply‐constrained, markets with high barriers to entry has created one of North America’s most distinguished portfolios of office properties. Our commercial property portfolio consists of interests in 108 properties totaling 74 million square feet, including 10 million square feet of parking. Our development/redevelopment portfolio comprises interests in 15 sites totaling 17 million square feet. Our primary markets are the financial, energy and government center cities of New York, Boston, Washington, D.C., Houston, Los Angeles, Toronto, Calgary and Ottawa. We intend to continue our strategy of maintaining a meaningful presence in a select number of North American cities with attractive tenant bases. We remain focused on the following strategic priorities:
• Surfacing value from our properties through proactive leasing and select redevelopment initiatives;
• Prudent capital management including the refinancing of mature properties;
• Monetizing development assets as the economy rebounds and continued supply constraints create opportunities; and
• Expanding our asset management platform through the growth of our existing office funds or through the establishment of new funds.
The following table summarizes our investment by market: Brookfield Properties' Book Net Book
Number of Total Area Owned Interest Value Debt Equity
Region Properties (000's Sq. Ft.) (000's Sq. Ft.)(1) (Millions) (Millions) (Millions)
Direct
Midtown New York, New York 2 2,881 2,005 $ 886 $ 693 $ 193
Downtown New York, New York 5 10,315 9,359 2,939 1,899 1,040
Boston, Massachusetts 2 2,266 2,266 828 572 256
Washington, D.C. 6 2,300 2,300 680 499 181
Toronto, Ontario 8 5,439 4,636 1,068 571 497
Calgary, Alberta 7 6,326 3,164 464 342 122
Denver, Colorado 1 1,827 1,827 275 162 113
Minneapolis, Minnesota 3 2,400 2,400 293 92 201
Houston, Texas 1 892 892 151 101 50
Other 2 926 926 114 113 1
Corporate debt ― ― ― ― 370 (370)
37 35,572 29,775 7,698 5,414 2,284
U.S. Office Fund
Midtown New York, New York 4 3,682 2,172 1,250 312 938
Downtown New York, New York 2 3,685 3,685 1,270 397 873
Washington, D.C. 22 4,289 4,110 1,123 367 756
Houston, Texas 8 8,226 7,575 1,124 240 884
Los Angeles, California 22 10,763 10,529 2,608 421 2,187
U.S. Fund debt ― ― ― ― 3,989 (3,989)
58 30,645 28,071 7,375 5,726 1,649
Canadian Office Fund
Toronto, Ontario 3 3,697 924 249 97 152
Calgary, Alberta 1 378 95 19 19 ―
Ottawa, Ontario 6 2,780 695 95 23 72
Other 2 712 179 16 16 ―
12 7,567 1,893 379 155 224
Continuing Operations 107 73,784 59,739 $ 15,452 $ 11,295 $ 4,157
Discontinued Operations(2) 1 651 651 125 108 17
108 74,435 60,390 $ 15,577 $ 11,403 $ 4,174
Office development sites 16,237 14,798 1,099 506 593
Redevelopment sites 269 269 132 ― 132
Total 90,941 75,457 $ 16,808 $ 11,909 $ 4,899 (1)Represents consolidated interest before non‐controlling interests
(2)One of the RBC Plaza buildings in Minneapolis is currently classified as discontinued operations

8 Q3/2008 Interim Report
We have historically explored property‐level joint venture opportunities with strategic institutional partners. Although we plan to continue with this endeavor, we are also pursuing the acquisition of individual assets and portfolios through joint venture fund vehicles. In 2005 we formed our Canadian Office Fund to acquire the O&Y portfolio and in 2006 we formed our U.S. Office Fund to consummate the acquisition of Trizec Properties Inc. and Trizec Canada Inc. (collectively, “Trizec”). Of our 108 commercial office properties, 27 are wholly owned, 11 are held in property‐level joint ventures or co‐tenancies, and 70 are held in our funds. Our Canadian Office Fund consists of a consortium of institutional investors, led and managed by us. Affiliates of the consortium members own direct interests in property‐level joint ventures and have entered into several agreements relating to property management, fees, transfer rights and other material issues related to the operation of the properties. We proportionately consolidate our interest in this Fund. Our U.S. Office Fund consists of a consortium of institutional investors, which we lead and manage, investing through direct and indirect investment vehicles who have also entered into several agreements relating to property management, fees, transfer rights and other material issues related to the operation of the properties. We fully consolidate this Fund. We believe that investing our liquidity with these partners in fund formats enables us to enhance returns. The funds and associated asset management fees represent an important area of growth as we expand our assets under management. Purchasing properties or portfolios of properties in a fund format allows us to earn the following categories of fees:
• Asset Management Stable base fee for providing regular, on‐going services.
• Transaction Development, redevelopment and leasing activities conducted on behalf of these funds.
• Performance Earned when certain pre‐determined benchmarks are exceeded. Performance fees which can add considerably to fee revenue, typically arise later in a fund’s life cycle, and are therefore not fully reflected in current results.
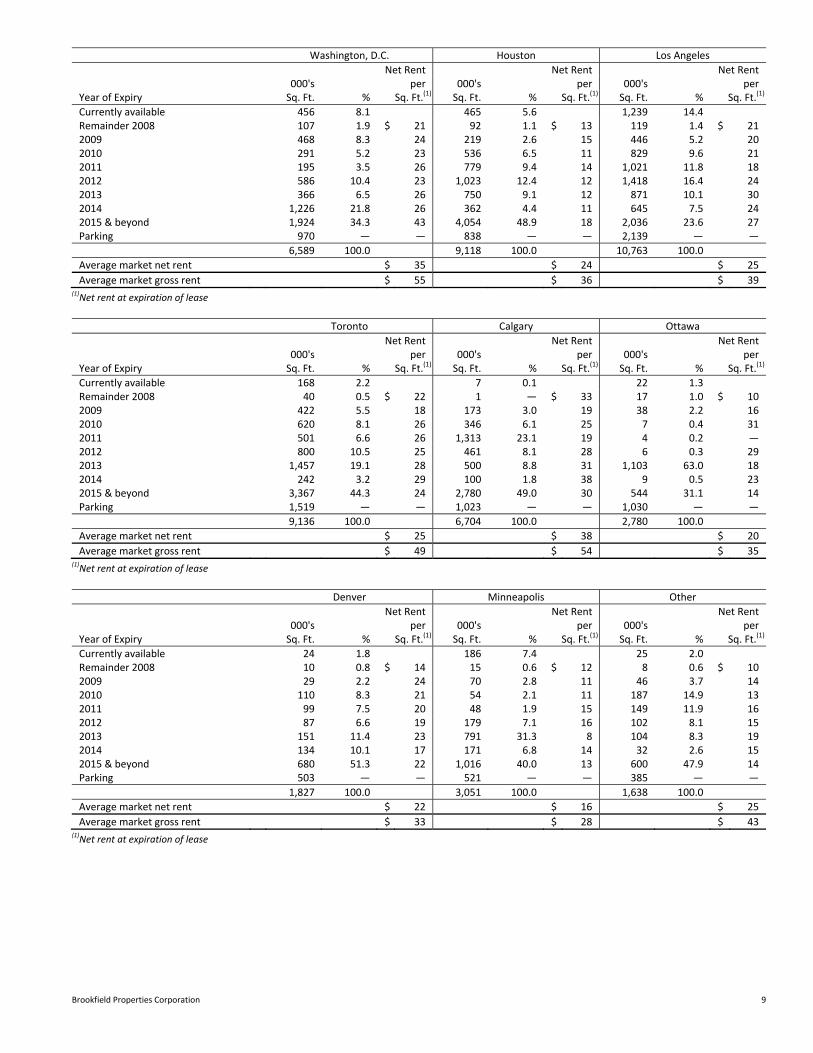
An important characteristic of our portfolio is the strong credit quality of our tenants. We direct special attention to credit quality in order to ensure the long‐term sustainability of rental revenues through economic cycles. Major tenants with over 1,000,000 square feet of space in the portfolio include Merrill Lynch, U.S. and Canadian governments and government agencies, Chevron, Wachovia, CIBC, RBC Financial Group, Bank of Montreal and Petro‐Canada. A detailed list of major tenants is included in Part V (“Risks and Uncertainties”) of this MD&A, which begins on page 46. Our strategy is to sign long‐term leases in order to mitigate risk and reduce our overall retenanting costs. We typically commence discussions with tenants regarding their space requirements well in advance of the contractual expiration, and although each market is different, the majority of our leases, when signed, extend between 10‐ and 20‐year terms. As a result of this strategy, less than 7% of our leases, on average, mature annually over the next five years. The following is a breakdown of lease maturities by region with associated in‐place rental rates:
Total Portfolio Midtown New York Downtown New York Boston
Net Rent Net Rent Net Rent Net Rent 000's per 000's per 000's per 000's perYear of Expiry Sq. Ft. % Sq. Ft.(1) Sq. Ft. % Sq. Ft.(1) Sq. Ft. % Sq. Ft.(1) Sq. Ft. % Sq. Ft.(1)
Currently available 3,363 5.2 546 8.4 118 0.9 107 5.4Remainder 2008 534 0.8 $ 24 68 1.0 $ 54 39 0.3 $ 23 18 0.9 $ 322009 2,698 4.2 20 419 6.4 25 197 1.4 15 171 8.6 232010 3,731 5.7 22 371 5.7 32 255 1.9 20 125 6.3 292011 5,370 8.3 24 137 2.1 36 670 4.9 36 454 22.8 432012 5,533 8.5 21 397 6.1 30 426 3.1 11 48 2.4 252013 11,741 18.1 28 776 11.9 34 4,840 35.3 35 32 1.6 282014 3,584 5.5 25 223 3.4 26 410 3.0 36 30 1.5 392015 & beyond 28,360 43.7 29 3,590 55.0 49 6,764 49.2 29 1,005 50.5 31Parking 9,521 ― ― 36 ― ― 281 ― ― 276 ― ―
74,435 100.0 6,563 100.0 14,000 100.0 2,266 100.0
Average market net rent $ 35 $ 79 $ 39 $ 30
Average market gross rent $ 54 $ 105 $ 61 $ 50(1)Net rent at expiration of lease
Brookfield Properties Corporation 9
Washington, D.C. Houston Los Angeles
Net Rent Net Rent Net Rent 000's per 000's per 000's perYear of Expiry Sq. Ft. % Sq. Ft.(1) Sq. Ft. % Sq. Ft.(1) Sq. Ft. % Sq. Ft.(1)
Currently available 456 8.1 465 5.6 1,239 14.4Remainder 2008 107 1.9 $ 21 92 1.1 $ 13 119 1.4 $ 212009 468 8.3 24 219 2.6 15 446 5.2 202010 291 5.2 23 536 6.5 11 829 9.6 212011 195 3.5 26 779 9.4 14 1,021 11.8 182012 586 10.4 23 1,023 12.4 12 1,418 16.4 242013 366 6.5 26 750 9.1 12 871 10.1 302014 1,226 21.8 26 362 4.4 11 645 7.5 242015 & beyond 1,924 34.3 43 4,054 48.9 18 2,036 23.6 27Parking 970 ― ― 838 ― ― 2,139 ― ―
6,589 100.0 9,118 100.0 10,763 100.0
Average market net rent $ 35 $ 24 $ 25
Average market gross rent $ 55 $ 36 $ 39(1)Net rent at expiration of lease
Toronto Calgary Ottawa
Net Rent Net Rent Net Rent 000's per 000's per 000's perYear of Expiry Sq. Ft. % Sq. Ft.(1) Sq. Ft. % Sq. Ft.(1) Sq. Ft. % Sq. Ft.(1)
Currently available 168 2.2 7 0.1 22 1.3Remainder 2008 40 0.5 $ 22 1 ― $ 33 17 1.0 $ 102009 422 5.5 18 173 3.0 19 38 2.2 162010 620 8.1 26 346 6.1 25 7 0.4 312011 501 6.6 26 1,313 23.1 19 4 0.2 ―2012 800 10.5 25 461 8.1 28 6 0.3 292013 1,457 19.1 28 500 8.8 31 1,103 63.0 182014 242 3.2 29 100 1.8 38 9 0.5 232015 & beyond 3,367 44.3 24 2,780 49.0 30 544 31.1 14Parking 1,519 ― ― 1,023 ― ― 1,030 ― ―
9,136 100.0 6,704 100.0 2,780 100.0
Average market net rent $ 25 $ 38 $ 20
Average market gross rent $ 49 $ 54 $ 35(1)Net rent at expiration of lease
Denver Minneapolis Other
Net Rent Net Rent Net Rent 000's per 000's per 000's perYear of Expiry Sq. Ft. % Sq. Ft.(1) Sq. Ft. % Sq. Ft.(1) Sq. Ft. % Sq. Ft.(1)
Currently available 24 1.8 186 7.4 25 2.0Remainder 2008 10 0.8 $ 14 15 0.6 $ 12 8 0.6 $ 102009 29 2.2 24 70 2.8 11 46 3.7 142010 110 8.3 21 54 2.1 11 187 14.9 132011 99 7.5 20 48 1.9 15 149 11.9 162012 87 6.6 19 179 7.1 16 102 8.1 152013 151 11.4 23 791 31.3 8 104 8.3 192014 134 10.1 17 171 6.8 14 32 2.6 152015 & beyond 680 51.3 22 1,016 40.0 13 600 47.9 14Parking 503 ― ― 521 ― ― 385 ― ―
1,827 100.0 3,051 100.0 1,638 100.0
Average market net rent $ 22 $ 16 $ 25
Average market gross rent $ 33 $ 28 $ 43(1)Net rent at expiration of lease
10 Q3/2008 Interim Report
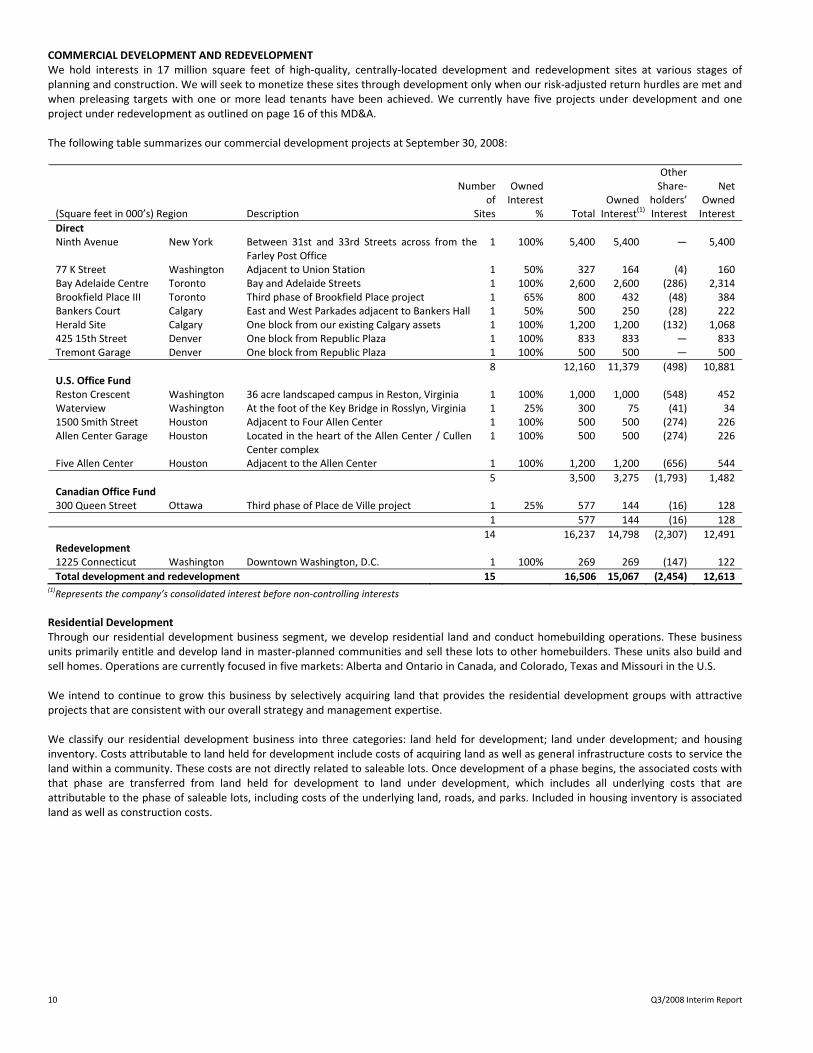
COMMERCIAL DEVELOPMENT AND REDEVELOPMENT We hold interests in 17 million square feet of high‐quality, centrally‐located development and redevelopment sites at various stages of planning and construction. We will seek to monetize these sites through development only when our risk‐adjusted return hurdles are met and when preleasing targets with one or more lead tenants have been achieved. We currently have five projects under development and one project under redevelopment as outlined on page 16 of this MD&A. The following table summarizes our commercial development projects at September 30, 2008: Other
Number
of OwnedInterest
Owned
Share‐holders’
NetOwned
(Square feet in 000’s) Region Description Sites % Total Interest(1) Interest Interest
Direct Ninth Avenue New York Between 31st and 33rd Streets across from the
Farley Post Office 1 100% 5,400 5,400 ― 5,400
77 K Street Washington Adjacent to Union Station 1 50% 327 164 (4) 160Bay Adelaide Centre Toronto Bay and Adelaide Streets 1 100% 2,600 2,600 (286) 2,314Brookfield Place III Toronto Third phase of Brookfield Place project 1 65% 800 432 (48) 384Bankers Court Calgary East and West Parkades adjacent to Bankers Hall 1 50% 500 250 (28) 222Herald Site Calgary One block from our existing Calgary assets 1 100% 1,200 1,200 (132) 1,068425 15th Street Denver One block from Republic Plaza 1 100% 833 833 ― 833Tremont Garage Denver One block from Republic Plaza 1 100% 500 500 ― 500
8 12,160 11,379 (498) 10,881U.S. Office Fund Reston Crescent Washington 36 acre landscaped campus in Reston, Virginia 1 100% 1,000 1,000 (548) 452Waterview Washington At the foot of the Key Bridge in Rosslyn, Virginia 1 25% 300 75 (41) 341500 Smith Street Houston Adjacent to Four Allen Center 1 100% 500 500 (274) 226Allen Center Garage Houston Located in the heart of the Allen Center / Cullen
Center complex 1 100% 500 500 (274) 226
Five Allen Center Houston Adjacent to the Allen Center 1 100% 1,200 1,200 (656) 544
5 3,500 3,275 (1,793) 1,482Canadian Office Fund 300 Queen Street Ottawa Third phase of Place de Ville project 1 25% 577 144 (16) 128
1 577 144 (16) 128
14 16,237 14,798 (2,307) 12,491Redevelopment 1225 Connecticut Washington Downtown Washington, D.C. 1 100% 269 269 (147) 122
Total development and redevelopment 15 16,506 15,067 (2,454) 12,613(1)Represents the company’s consolidated interest before non‐controlling interests
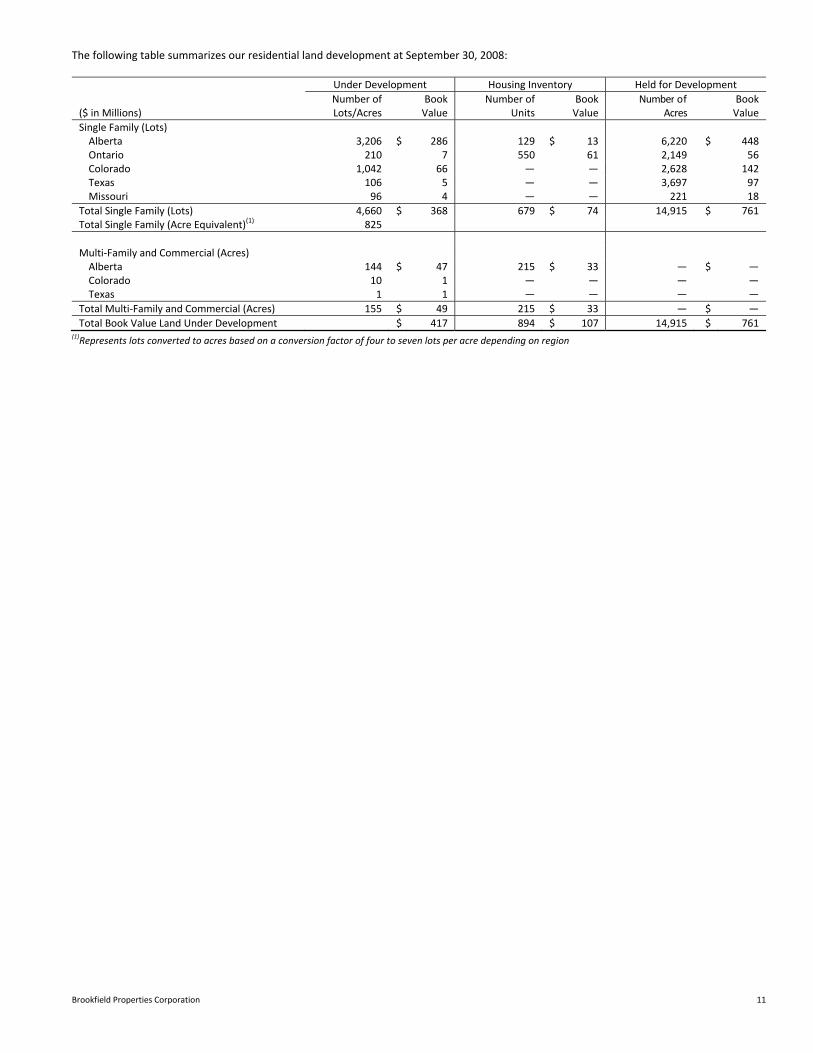
Residential Development Through our residential development business segment, we develop residential land and conduct homebuilding operations. These business units primarily entitle and develop land in master‐planned communities and sell these lots to other homebuilders. These units also build and sell homes. Operations are currently focused in five markets: Alberta and Ontario in Canada, and Colorado, Texas and Missouri in the U.S. We intend to continue to grow this business by selectively acquiring land that provides the residential development groups with attractive projects that are consistent with our overall strategy and management expertise. We classify our residential development business into three categories: land held for development; land under development; and housing inventory. Costs attributable to land held for development include costs of acquiring land as well as general infrastructure costs to service the land within a community. These costs are not directly related to saleable lots. Once development of a phase begins, the associated costs with that phase are transferred from land held for development to land under development, which includes all underlying costs that are attributable to the phase of saleable lots, including costs of the underlying land, roads, and parks. Included in housing inventory is associated land as well as construction costs.
Brookfield Properties Corporation 11
The following table summarizes our residential land development at September 30, 2008: Under Development Housing Inventory Held for Development
($ in Millions) Number of Lots/Acres
Book Value
Number of Units
Book Value
Number of Acres
Book Value
Single Family (Lots) Alberta 3,206 $ 286 129 $ 13 6,220 $ 448Ontario 210 7 550 61 2,149 56Colorado 1,042 66 ― ― 2,628 142Texas 106 5 ― ― 3,697 97Missouri 96 4 ― ― 221 18
Total Single Family (Lots) 4,660 $ 368 679 $ 74 14,915 $ 761Total Single Family (Acre Equivalent)(1) 825
Multi‐Family and Commercial (Acres) Alberta 144 $ 47 215 $ 33 ― $ ―Colorado 10 1 ― ― ― ―Texas 1 1 ― ― ― ―
Total Multi‐Family and Commercial (Acres) 155 $ 49 215 $ 33 ― $ ―
Total Book Value Land Under Development $ 417 894 $ 107 14,915 $ 761(1)Represents lots converted to acres based on a conversion factor of four to seven lots per acre depending on region
12 Q3/2008 Interim Report
PERFORMANCE MEASUREMENT The key indicators by which we measure our performance are:
• Net income per share;
• Net operating income;
• Funds from operations per share;
• Overall indebtedness level;
• Weighted average cost of debt; and
• Occupancy levels. Although we monitor and analyze our financial performance using a number of indicators, our primary business objective of generating reliable and growing cashflow is monitored and analyzed using net income, net operating income and funds from operations. While net income is calculated in accordance with generally accepted accounting principles (“GAAP’), net operating income and funds from operations are both non‐GAAP financial measures that do not have any standardized meaning prescribed by GAAP and are therefore unlikely to be comparable to similar measures presented by other companies. We provide the components of net operating income on page 29 and a full reconciliation from net income to funds from operations on page 29 of this MD&A. Net Income Net income is calculated in accordance with GAAP. Net income is used as a key indicator in assessing the profitability of the company. Net Operating Income Net operating income is defined as income from property operations after operating expenses have been deducted, but prior to deducting financing, administration, depreciation and amortization and income tax expenses. Net operating income is used as a key indicator of performance as it represents a measure over which management has control. We measure the performance of management by comparing the performance of the property portfolio adjusted for the effect of current and prior year sales and acquisitions. Funds from Operations Funds from operations is defined as net income prior to extraordinary items, one‐time transaction costs, income taxes, depreciation and amortization, and certain other non‐cash items. While we believe that funds from operations is the most relevant measure to analyze real estate, as commercial properties generally appreciate rather than depreciate, we believe that funds from operations, net operating income and net income are all relevant measures. Funds from operations does not represent or approximate cash generated from operating activities determined in accordance with GAAP in Canada or the United States and should not be considered an alternative to GAAP measures. Accordingly, we provide a reconciliation of funds from operations to net income, consistent with the definition as set out above. A reconciliation is not provided to cashflow from operating activities, as it is often subject to fluctuations based on the timing of working capital payments. KEY PERFORMANCE DRIVERS In addition to monitoring and analyzing performance in terms of net income, net operating income and funds from operations, we consider the following items to be important drivers of our current and anticipated financial performance:
• Increases in occupancies by leasing vacant space;
• Increases in rental rates as market conditions permit; and
• Reduction in occupancy costs through achieving economies of scale and diligently managing contracts. We also believe that the key external performance drivers are:
• The availability of new property acquisitions that fit into our strategic plan;
• The availability of equity capital at a reasonable cost; and
• The availability of debt capital at a cost and on terms conducive to our goals.
Brookfield Properties Corporation 13
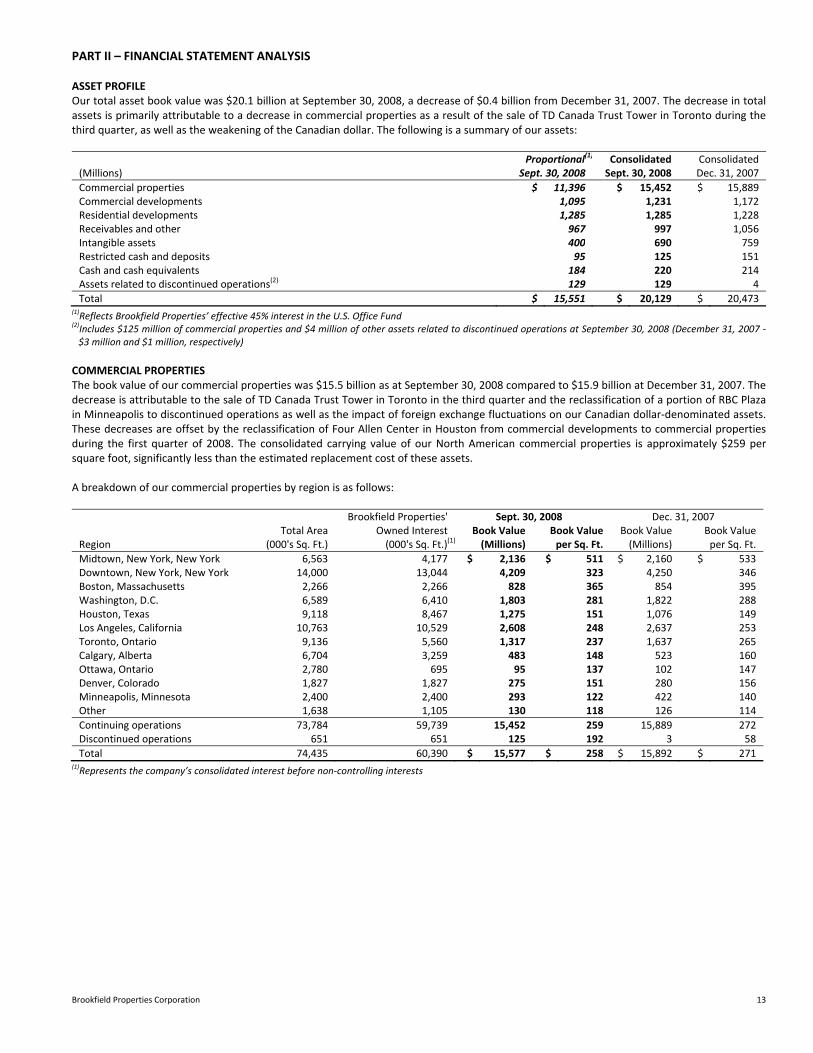
PART II – FINANCIAL STATEMENT ANALYSIS ASSET PROFILE Our total asset book value was $20.1 billion at September 30, 2008, a decrease of $0.4 billion from December 31, 2007. The decrease in total assets is primarily attributable to a decrease in commercial properties as a result of the sale of TD Canada Trust Tower in Toronto during the third quarter, as well as the weakening of the Canadian dollar. The following is a summary of our assets: Proportional(1) Consolidated Consolidated(Millions) Sept. 30, 2008 Sept. 30, 2008 Dec. 31, 2007
Commercial properties $ 11,396 $ 15,452 $ 15,889Commercial developments 1,095 1,231 1,172Residential developments 1,285 1,285 1,228Receivables and other 967 997 1,056Intangible assets 400 690 759Restricted cash and deposits 95 125 151Cash and cash equivalents 184 220 214Assets related to discontinued operations(2) 129 129 4
Total $ 15,551 $ 20,129 $ 20,473(1)Reflects Brookfield Properties’ effective 45% interest in the U.S. Office Fund
(2)Includes $125 million of commercial properties and $4 million of other assets related to discontinued operations at September 30, 2008 (December 31, 2007 ‐ $3 million and $1 million, respectively)
COMMERCIAL PROPERTIES The book value of our commercial properties was $15.5 billion as at September 30, 2008 compared to $15.9 billion at December 31, 2007. The decrease is attributable to the sale of TD Canada Trust Tower in Toronto in the third quarter and the reclassification of a portion of RBC Plaza in Minneapolis to discontinued operations as well as the impact of foreign exchange fluctuations on our Canadian dollar‐denominated assets. These decreases are offset by the reclassification of Four Allen Center in Houston from commercial developments to commercial properties during the first quarter of 2008. The consolidated carrying value of our North American commercial properties is approximately $259 per square foot, significantly less than the estimated replacement cost of these assets. A breakdown of our commercial properties by region is as follows: Brookfield Properties' Sept. 30, 2008 Dec. 31, 2007 Total Area Owned Interest Book Value Book Value Book Value Book ValueRegion (000's Sq. Ft.) (000's Sq. Ft.)(1) (Millions) per Sq. Ft. (Millions) per Sq. Ft.
Midtown, New York, New York 6,563 4,177 $ 2,136 $ 511 $ 2,160 $ 533Downtown, New York, New York 14,000 13,044 4,209 323 4,250 346Boston, Massachusetts 2,266 2,266 828 365 854 395Washington, D.C. 6,589 6,410 1,803 281 1,822 288Houston, Texas 9,118 8,467 1,275 151 1,076 149Los Angeles, California 10,763 10,529 2,608 248 2,637 253Toronto, Ontario 9,136 5,560 1,317 237 1,637 265Calgary, Alberta 6,704 3,259 483 148 523 160Ottawa, Ontario 2,780 695 95 137 102 147Denver, Colorado 1,827 1,827 275 151 280 156Minneapolis, Minnesota 2,400 2,400 293 122 422 140Other 1,638 1,105 130 118 126 114
Continuing operations 73,784 59,739 15,452 259 15,889 272Discontinued operations 651 651 125 192 3 58
Total 74,435 60,390 $ 15,577 $ 258 $ 15,892 $ 271(1)Represents the company’s consolidated interest before non‐controlling interests

14 Q3/2008 Interim Report
TENANT INSTALLATION COSTS AND CAPITAL EXPENDITURES Upon the signing of the majority of our leases, we provide a capital allowance for tenant improvements to leased space in order to accommodate the specific space requirements of the tenant. In addition to this capital, leasing commissions are paid to third‐party brokers representing tenants in lease negotiations. Tenant improvements and leasing commissions are capitalized in the year incurred, amortized over the term of the lease and recovered through rental payments. Expenditures during the three and nine months ended September 30, 2008 totaled $44 million and $79 million, respectively, compared with $27 million and $101 million during the same periods in 2007. The increase in the current quarter was due to increased leasing activity as compared to the third quarter of 2007 as well as increased total leasable area as compared to the same period in 2007 due to the purchase of the remaining interest in 53 and 75 State Street in Boston in the fourth quarter of 2007. Tenant installation costs are summarized as follows: Three months ended Sept. 30 Nine months ended Sept. 30(Millions) 2008 2007 2008 2007
Leasing commissions $ 16 $ 10 $ 25 $ 26Tenant improvements 28 17 54 75
Total $ 44 $ 27 $ 79 $ 101
We also invest in ongoing maintenance and capital improvement projects to sustain the high quality of the infrastructure and tenant service amenities in our properties. Capital expenditures for the three and nine months ended September 30, 2008 totaled $15 million and $46 million, respectively, compared with $10 million and $25 million during the same periods in 2007. These expenditures exclude repairs and maintenance costs, a portion of which are recovered through contractual tenant cost recovery payments. The increase in capital expenditures is due primarily to increased capital projects within the U.S. Office Fund. Capital expenditures include revenue‐enhancing capital expenditures, which represent improvements to an asset or reconfiguration of space to increase rentable area or increase current rental rates, and non‐revenue‐enhancing expenditures, which are those required to extend the service life of an asset. These expenditures are recoverable in some cases. For the three and nine months ended September 30, 2008, $3 million and $12 million of our total capital expenditures is recoverable which compares with $5 million and $10 million during the same time periods in 2007. ASSETS RELATED TO DISCONTINUED OPERATIONS In the third quarter of 2008, one property met the criteria for being classified as discontinued operations; one of the RBC Plaza buildings in Minneapolis. We have reclassified $129 million of assets and $115 million of liabilities to assets and liabilities related to discontinued operations, respectively, in connection with this property as at September 30, 2008. As at December 31, 2007, one property also met the criteria for being classified as discontinued operations; Acres House in Niagara Falls. We reclassified $4 million of assets and $3 million of liabilities to assets and liabilities related to discontinued operations, respectively, in connection with this property as at December 31, 2007. This property was sold during the second quarter of 2008. COMMERCIAL DEVELOPMENTS Commercial developments consist of commercial property development sites, density rights and related infrastructure. The total book value of this development land and infrastructure was $1,231 million at September 30, 2008, an increase of $59 million from $1,172 million at December 31, 2007. The increase is primarily attributable to active construction at a number of development sites, offset by the reclassification of Four Allen Center to commercial properties. A portion of Four Allen Center in Houston, which is 100% leased to Chevron, became operational during the first quarter of 2008. This property was 100% operational in the third quarter.

Brookfield Properties Corporation 15
The details of the commercial property development portfolio and related book values are as follows: Sq. Ft. Currently Buildable Under Construction Book Value Book Value(Millions) Sq. Ft. (000’s) (000’s) Sept. 30, 2008 Dec. 31, 2007
Active developments Bay Adelaide Centre, Toronto 2,600 1,160 $ 551 $ 416 Reston Crescent, Washington, D.C. 1,000 185 68 56 Waterview, Washington, D.C. 300 300 21 27 77 K Street, Washington, D.C. 327 327 44 34 Bankers Court, Calgary 500 265 39 22
4,727 2,237 723 555Planning Ninth Avenue, New York 5,400 254 207 Herald Site, Calgary 1,200 51 53 Others 71 52 1500 Smith Street, Houston 500 Five Allen Center, Houston 1,200 Allen Center Garage, Houston 500 425 15th Street, Denver 833 Tremont Garage, Denver 500 Brookfield Place III, Toronto 800 300 Queen Street, Ottawa 577
Total developments 16,237 2,237 1,099 867Redevelopment 1225 Connecticut Avenue, Washington, D.C. 269 269 132 107Reclassified to commercial Four Allen Center, Houston(1) 198
Total developments and redevelopments 16,506 2,506 $ 1,231 $ 1,172(1)During the first quarter of 2008, this property was reclassified to commercial properties
Although we are generally not a speculative developer, we are a full‐service real estate company with in‐house development expertise. With 17 million square feet of high‐quality, centrally‐located development and redevelopment properties in New York, Washington, D.C., Houston, Toronto, Calgary, Ottawa and Denver, we will undertake developments when our risk‐adjusted returns and preleasing targets have been achieved. The following is a summary of the development activity currently taking place:
• Bay Adelaide Centre in Toronto represents one of our largest development projects. Ground‐breaking on Phase I of this project took place in July of 2006 and construction is actively underway. Phase I represents 1.2 million square feet of a three‐phase project that is expected to total 2.6 million square feet and be completed in 2009. Due to the continuous construction on Phase I, the book value of this site has increased by $135 million since December 31, 2007.
• Reston Crescent, a development project acquired with the Trizec portfolio in the fourth quarter of 2006, is a 36 acre landscaped campus where construction is substantially complete on Two Reston Crescent, a 185,000 square foot building. As a result of construction progress to date, the book value of this project has increased by $12 million since December 31, 2007.
• Construction on Bankers Court in Calgary, a 500,000 square foot, two‐building project, commenced in the third quarter of 2006. Active development of the first building, totaling 265,000 square feet, is taking place and is expected to be complete by the first quarter of 2009. The building is 100% leased. As a result of the continuous development, the book value of this site has increased by $17 million since December 31, 2007.
• Construction on 77 K Street in Washington, D.C., a development project we acquired in July 2006, commenced in the fourth quarter of 2006. As a result of active construction, the book value of this site has increased by $10 million since December 31, 2007. Construction is substantially complete.
• 1225 Connecticut Avenue in Washington, D.C. is a property that was acquired as part of the Trizec portfolio. The property is currently undergoing a full redevelopment of its 269,000 square feet, which is expected to be completed in the fourth quarter of 2008. This site was reclassified as a redevelopment site in the third quarter of 2007. The book value increased to $132 million at September 30, 2008 from $107 million at December 31, 2007 as a result of the ongoing development.
• Waterview, a development site in Washington, D.C. acquired with the Trizec portfolio, was under construction prior to the acquisition. During the second quarter of 2007, we sold the 630,000 square foot office portion of this development site. The remaining 300,000 square foot building is substantially complete. This site is our only hotel/residential asset. The book value of this site has decreased by $6 million to $21 million at September 30, 2008.
16 Q3/2008 Interim Report
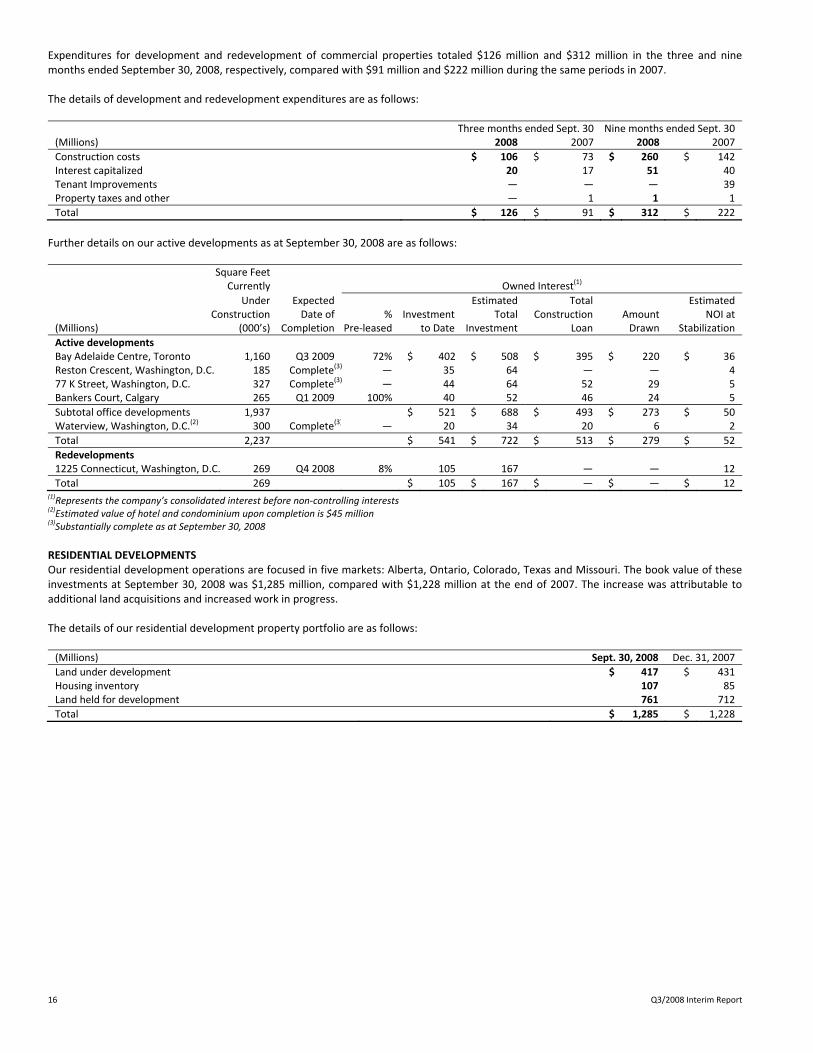
Expenditures for development and redevelopment of commercial properties totaled $126 million and $312 million in the three and nine months ended September 30, 2008, respectively, compared with $91 million and $222 million during the same periods in 2007. The details of development and redevelopment expenditures are as follows: Three months ended Sept. 30 Nine months ended Sept. 30(Millions) 2008 2007 2008 2007
Construction costs $ 106 $ 73 $ 260 $ 142Interest capitalized 20 17 51 40Tenant Improvements ― ― ― 39Property taxes and other ― 1 1 1
Total $ 126 $ 91 $ 312 $ 222
Further details on our active developments as at September 30, 2008 are as follows:
Square Feet Currently Owned Interest(1)
Under Expected Estimated Total Estimated Construction Date of % Investment Total Construction Amount NOI at
(Millions) (000’s) Completion Pre‐leased to Date Investment Loan Drawn Stabilization
Active developments Bay Adelaide Centre, Toronto 1,160 Q3 2009 72% $ 402 $ 508 $ 395 $ 220 $ 36Reston Crescent, Washington, D.C. 185 Complete(3) ― 35 64 ― ― 477 K Street, Washington, D.C. 327 Complete(3) ― 44 64 52 29 5Bankers Court, Calgary 265 Q1 2009 100% 40 52 46 24 5
Subtotal office developments 1,937 $ 521 $ 688 $ 493 $ 273 $ 50Waterview, Washington, D.C.(2) 300 Complete(3) ― 20 34 20 6 2
Total 2,237 $ 541 $ 722 $ 513 $ 279 $ 52
Redevelopments 1225 Connecticut, Washington, D.C. 269 Q4 2008 8% 105 167 ― ― 12
Total 269 $ 105 $ 167 $ ― $ ― $ 12(1)Represents the company’s consolidated interest before non‐controlling interests
(2)Estimated value of hotel and condominium upon completion is $45 million
(3)Substantially complete as at September 30, 2008
RESIDENTIAL DEVELOPMENTS Our residential development operations are focused in five markets: Alberta, Ontario, Colorado, Texas and Missouri. The book value of these investments at September 30, 2008 was $1,285 million, compared with $1,228 million at the end of 2007. The increase was attributable to additional land acquisitions and increased work in progress. The details of our residential development property portfolio are as follows: (Millions) Sept. 30, 2008 Dec. 31, 2007
Land under development $ 417 $ 431Housing inventory 107 85Land held for development 761 712
Total $ 1,285 $ 1,228

Brookfield Properties Corporation 17
The details of our land under development, housing inventory and land held for development are as follows: Number of Lots/Acres Book Value (Millions)Under development Sept. 30, 2008 Dec. 31, 2007 Sept. 30, 2008 Dec. 31, 2007
Single Family (Lots) Alberta 3,206 3,725 $ 286 $ 314Ontario 210 330 7 24Colorado 1,042 858 66 42Texas 106 106 5 4Missouri 96 88 4 2
Total Single Family (Lots) 4,660 5,107 $ 368 $ 386
Total Single Family (Acre Equivalent)(1) 825 843
Multi‐Family and Commercial (Acres) Alberta 144 136 $ 47 $ 44Colorado 10 25 1 1Texas 1 ― 1 ―
Total Multi‐Family and Commercial (Acres) 155 161 $ 49 $ 45
Total Book Value Land Under Development $ 417 $ 431(1)Represents lots converted to acres based on a conversion factor of four to seven lots per acre depending on region
Number of Units Book Value (Millions)Housing Inventory Sept. 30, 2008 Dec. 31, 2007 Sept. 30, 2008 Dec. 31, 2007
Single Family Alberta 129 224 $ 13 $ 28Ontario 550 239 61 28
679 463 74 56Multi‐Family Alberta 215 174 33 29
Total 894 637 $ 107 $ 85
Number of Acres Book Value (Millions)Held for Development Sept. 30, 2008 Dec. 31, 2007 Sept. 30, 2008 Dec. 31, 2007
Alberta 6,220 5,955 $ 448 $ 424Ontario 2,149 2,184 56 64Colorado 2,628 2,167 142 122Texas 3,697 3,328 97 84Missouri 221 226 18 18
Total 14,915 13,860 $ 761 $ 712
RECEIVABLES AND OTHER ASSETS Receivables and other assets decreased to $997 million at September 30, 2008 from $1,056 million at December 31, 2007 primarily due to a reduction in our residential receivables. In addition, there was a decrease in our loans receivable balance related to the repayment of a loan acquired in connection with the acquisition of O&Y properties which occurred in 2005. The components of receivables and other assets are as follows: (Millions) Sept. 30, 2008 Dec. 31, 2007
Accounts receivable $ 153 $ 135Straight‐line rent and free rent receivables 413 378Real estate mortgages and loans receivable 20 63Residential receivables and other assets 252 292Prepaid expenses and other assets 159 188
Total $ 997 $ 1,056
18 Q3/2008 Interim Report
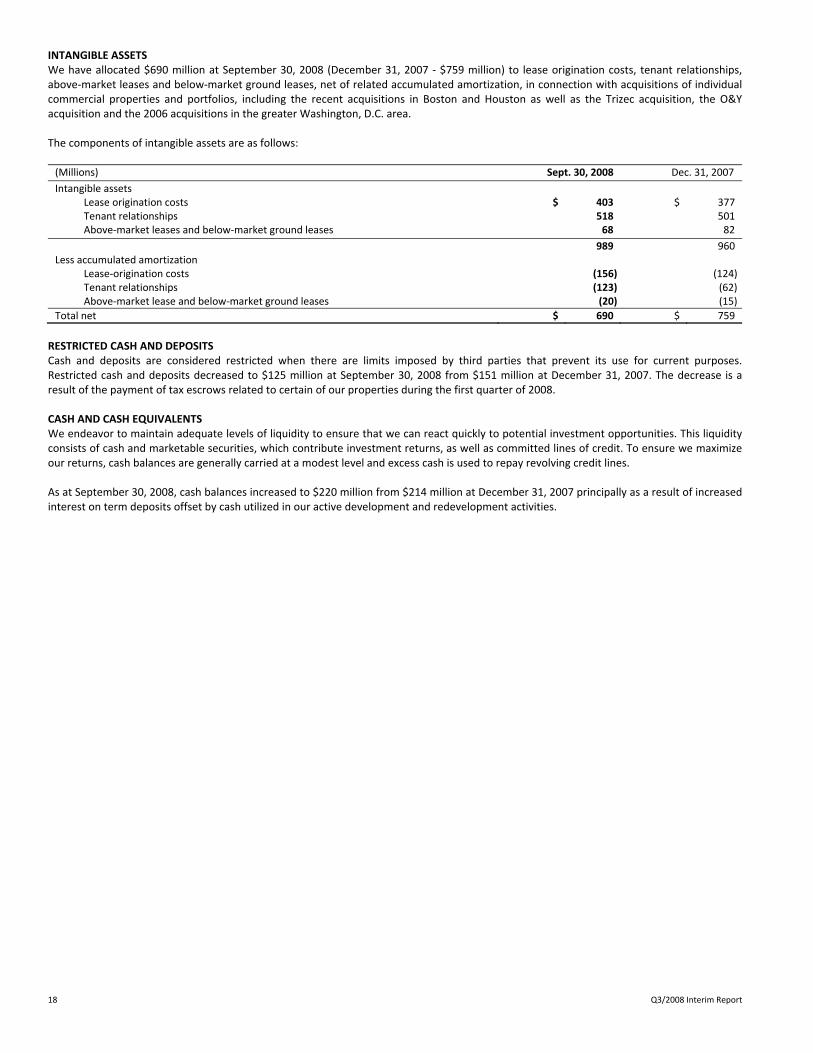
INTANGIBLE ASSETS We have allocated $690 million at September 30, 2008 (December 31, 2007 ‐ $759 million) to lease origination costs, tenant relationships, above‐market leases and below‐market ground leases, net of related accumulated amortization, in connection with acquisitions of individual commercial properties and portfolios, including the recent acquisitions in Boston and Houston as well as the Trizec acquisition, the O&Y acquisition and the 2006 acquisitions in the greater Washington, D.C. area. The components of intangible assets are as follows: (Millions) Sept. 30, 2008 Dec. 31, 2007
Intangible assets Lease origination costs $ 403 $ 377 Tenant relationships 518 501 Above‐market leases and below‐market ground leases 68 82
989 960Less accumulated amortization Lease‐origination costs (156) (124) Tenant relationships (123) (62) Above‐market lease and below‐market ground leases (20) (15)
Total net $ 690 $ 759
RESTRICTED CASH AND DEPOSITS Cash and deposits are considered restricted when there are limits imposed by third parties that prevent its use for current purposes. Restricted cash and deposits decreased to $125 million at September 30, 2008 from $151 million at December 31, 2007. The decrease is a result of the payment of tax escrows related to certain of our properties during the first quarter of 2008. CASH AND CASH EQUIVALENTS We endeavor to maintain adequate levels of liquidity to ensure that we can react quickly to potential investment opportunities. This liquidity consists of cash and marketable securities, which contribute investment returns, as well as committed lines of credit. To ensure we maximize our returns, cash balances are generally carried at a modest level and excess cash is used to repay revolving credit lines. As at September 30, 2008, cash balances increased to $220 million from $214 million at December 31, 2007 principally as a result of increased interest on term deposits offset by cash utilized in our active development and redevelopment activities.

Brookfield Properties Corporation 19
LIABILITIES AND SHAREHOLDERS’ EQUITY Our asset base of $20.1 billion is financed with a combination of debt, capital securities and preferred and common equity. The components of our liabilities and shareholders’ equity at September 30, 2008 and December 31, 2007 are as follows: Proportional(1) Consolidated Consolidated(Millions) Sept. 30, 2008 Sept. 30, 2008 Dec. 31, 2007
Liabilities Commercial property debt $ 8,648 $ 11,801 $ 12,125Accounts payable and other liabilities 1,162 1,293 1,357Intangible liabilities 446 753 834Future income tax liability 665 692 600Liabilities related to discontinued operations(2) 115 115 3Capital securities ‐ corporate 996 996 1,053Capital securities ‐ fund subsidiaries ― 764 762Non‐controlling interests ‐ fund subsidiaries ― 186 193Non‐controlling interests ‐ other subsidiaries 73 73 86Preferred equity ‐ subsidiaries 359 359 382Shareholders' equity Preferred equity ‐ corporate 45 45 45Common equity 3,052 3,052 3,033
Total $ 15,551 $ 20,129 $ 20,473(1)Reflects Brookfield Properties’ effective 45% interest in the U.S. Office Fund
(2)Includes $108 of commercial property debt and $7 million of other liabilities related to discontinued operations at September 30, 2008 (December 31, 2007 – nil and $3 million, respectively)
COMMERCIAL PROPERTY DEBT Commercial property debt totaled $11.8 billion at September 30, 2008, compared with $12.1 billion at December 31, 2007. In addition to principal amortization payments, the decrease is attributable to the repayment of the debt associated with the sale of TD Canada Trust Tower in Toronto as well as the repayment of a portion of our Corporate Term Loan. Additionally, the debt related to RBC Plaza in Minneapolis has been reclassified to discontinued operations. These decreases were partially offset by various refinancings outlined below. Commercial property debt at September 30, 2008 had a weighted average interest rate of 5.67% (December 31, 2007 – 6.65%). The decrease is largely attributable to the reduction in LIBOR during the first three quarters as $3.7 billion of our floating rate date within the U.S. Office Fund is based on LIBOR. Almost all of our Direct commercial property debt is recourse only to specific properties, thereby reducing the overall financial risk to the company. Our U.S. Office Fund debt is recourse to the Fund entities. We attempt to match the maturity of our commercial property debt portfolio with the average lease term of our properties. At September 30, 2008, the average term to maturity of our commercial property debt was six years, compared to our average lease term of about seven years. During the third quarter of 2008, we financed, refinanced or extended $157 million of commercial property debt. On a year‐to‐date basis, we have financed, refinanced or extended $1,091 million. The details are as follows:
Balance at
(Millions) Interest Rate % Maturity Date Mortgage/Loan Sept. 30, 2008(1)
First Quarter
2000 L Street Extended 6.26% March 2009 $ 56 $ 56
Silver Springs Metro Plaza /
2401 Pennsylvania Avenue /
1250 Connecticut Avenue
Financed LIBOR + 240bps June 2009 160 158
105 Adelaide Refinanced 5.77% February 2013 23 21
Second Quarter
Royal Centre Refinanced 4.96% May 2012 122 113
5670 Wilshire Refinanced LIBOR + 205bps May 2013 57 57
Hudson Bay Centre Refinanced 5.20% May 2013 110 102
75 State Street Refinanced LIBOR + 300bps June 2013 300 293
Canadian Western Bank /
2 Queen Street East /
Altius Centre Financed 5.64% December 2017 106 60
Third Quarter
22 Front Street Refinanced 6.24% October 2020 20 19
Corporate Term Loan Extended LIBOR + 250bps September 2009 104 104
Bethesda Crescent Extended 7.07% March 2009 33 33
Total $ 1,091 $ 1,016(1)Net of transaction costs

20 Q3/2008 Interim Report
We have $800 million of committed corporate credit facilities consisting of a $500 million revolving credit facility and a $300 million line from Brookfield Asset Management Inc. (“BAM”), our parent company. At September 30, 2008, the balance drawn on these facilities, was $266 million and nil, respectively (balances at December 31, 2007 were $251 million and nil, respectively). At the time of the Trizec acquisition, we obtained a new $600 million term loan facility at a rate of LIBOR + 250 basis points. The outstanding balance at September 30, 2008 on this facility was $104 million (December 31, 2007 ‐ $150 million) and it matures on September 30, 2009. As at September 30, 2008, we had approximately $15 million (December 31, 2007 ‐ $15 million) of indebtedness outstanding to BAM and its affiliates, after taking into consideration C$200 million Class AAA Series E capital securities which BAM owns and which are offset against an equivalent amount on deposit with BAM. Interest expense related to this indebtedness, totaled $1 million and $2 million for the three and nine months ended September 30, 2008, respectively, compared to $4 million and $12 million for the same periods in 2007.
Brookfield Properties Corporation 21
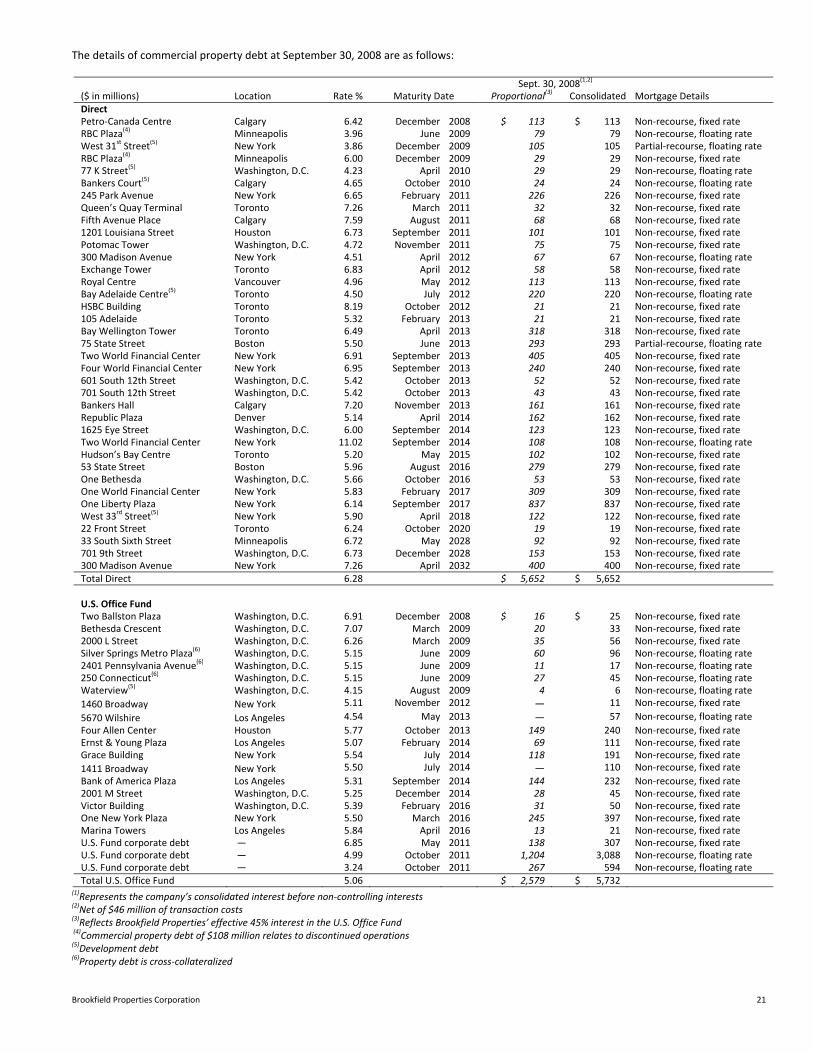
The details of commercial property debt at September 30, 2008 are as follows: Sept. 30, 2008
(1,2)
($ in millions) Location Rate % Maturity Date Proportional(3)
Consolidated Mortgage DetailsDirect Petro‐Canada Centre Calgary 6.42 December 2008 $ 113 $ 113 Non‐recourse, fixed rateRBC Plaza
(4) Minneapolis 3.96 June 2009 79 79 Non‐recourse, floating rate
West 31st Street
(5) New York 3.86 December 2009 105 105 Partial‐recourse, floating rate
RBC Plaza(4) Minneapolis 6.00 December 2009 29 29 Non‐recourse, fixed rate
77 K Street(5) Washington, D.C. 4.23 April 2010 29 29 Non‐recourse, floating rate
Bankers Court(5) Calgary 4.65 October 2010 24 24 Non‐recourse, floating rate
245 Park Avenue New York 6.65 February 2011 226 226 Non‐recourse, fixed rateQueen’s Quay Terminal Toronto 7.26 March 2011 32 32 Non‐recourse, fixed rateFifth Avenue Place Calgary 7.59 August 2011 68 68 Non‐recourse, fixed rate1201 Louisiana Street Houston 6.73 September 2011 101 101 Non‐recourse, fixed ratePotomac Tower Washington, D.C. 4.72 November 2011 75 75 Non‐recourse, fixed rate300 Madison Avenue New York 4.51 April 2012 67 67 Non‐recourse, floating rateExchange Tower Toronto 6.83 April 2012 58 58 Non‐recourse, fixed rateRoyal Centre Vancouver 4.96 May 2012 113 113 Non‐recourse, fixed rateBay Adelaide Centre
(5) Toronto 4.50 July 2012 220 220 Non‐recourse, floating rate
HSBC Building Toronto 8.19 October 2012 21 21 Non‐recourse, fixed rate105 Adelaide Toronto 5.32 February 2013 21 21 Non‐recourse, fixed rateBay Wellington Tower Toronto 6.49 April 2013 318 318 Non‐recourse, fixed rate75 State Street Boston 5.50 June 2013 293 293 Partial‐recourse, floating rateTwo World Financial Center New York 6.91 September 2013 405 405 Non‐recourse, fixed rateFour World Financial Center New York 6.95 September 2013 240 240 Non‐recourse, fixed rate601 South 12th Street Washington, D.C. 5.42 October 2013 52 52 Non‐recourse, fixed rate701 South 12th Street Washington, D.C. 5.42 October 2013 43 43 Non‐recourse, fixed rateBankers Hall Calgary 7.20 November 2013 161 161 Non‐recourse, fixed rateRepublic Plaza Denver 5.14 April 2014 162 162 Non‐recourse, fixed rate1625 Eye Street Washington, D.C. 6.00 September 2014 123 123 Non‐recourse, fixed rateTwo World Financial Center New York 11.02 September 2014 108 108 Non‐recourse, floating rateHudson’s Bay Centre Toronto 5.20 May 2015 102 102 Non‐recourse, fixed rate53 State Street Boston 5.96 August 2016 279 279 Non‐recourse, fixed rateOne Bethesda Washington, D.C. 5.66 October 2016 53 53 Non‐recourse, fixed rateOne World Financial Center New York 5.83 February 2017 309 309 Non‐recourse, fixed rateOne Liberty Plaza New York 6.14 September 2017 837 837 Non‐recourse, fixed rateWest 33
rd Street
(5) New York 5.90 April 2018 122 122 Non‐recourse, fixed rate
22 Front Street Toronto 6.24 October 2020 19 19 Non‐recourse, fixed rate33 South Sixth Street Minneapolis 6.72 May 2028 92 92 Non‐recourse, fixed rate701 9th Street Washington, D.C. 6.73 December 2028 153 153 Non‐recourse, fixed rate300 Madison Avenue New York 7.26 April 2032 400 400 Non‐recourse, fixed rateTotal Direct 6.28 $ 5,652 $ 5,652 U.S. Office Fund Two Ballston Plaza Washington, D.C. 6.91 December 2008 $ 16 $ 25 Non‐recourse, fixed rateBethesda Crescent Washington, D.C. 7.07 March 2009 20 33 Non‐recourse, fixed rate2000 L Street Washington, D.C. 6.26 March 2009 35 56 Non‐recourse, fixed rateSilver Springs Metro Plaza
(6) Washington, D.C. 5.15 June 2009 60 96 Non‐recourse, floating rate
2401 Pennsylvania Avenue(6) Washington, D.C. 5.15 June 2009 11 17 Non‐recourse, floating rate
250 Connecticut(6) Washington, D.C. 5.15 June 2009 27 45 Non‐recourse, floating rate
Waterview(5) Washington, D.C. 4.15 August 2009 4 6 Non‐recourse, floating rate
1460 Broadway New York 5.11 November 2012 ― 11 Non‐recourse, fixed rate
5670 Wilshire Los Angeles 4.54 May 2013 ― 57 Non‐recourse, floating rate
Four Allen Center Houston 5.77 October 2013 149 240 Non‐recourse, fixed rateErnst & Young Plaza Los Angeles 5.07 February 2014 69 111 Non‐recourse, fixed rateGrace Building New York 5.54 July 2014 118 191 Non‐recourse, fixed rate
1411 Broadway New York 5.50 July 2014 ― 110 Non‐recourse, fixed rate
Bank of America Plaza Los Angeles 5.31 September 2014 144 232 Non‐recourse, fixed rate2001 M Street Washington, D.C. 5.25 December 2014 28 45 Non‐recourse, fixed rateVictor Building Washington, D.C. 5.39 February 2016 31 50 Non‐recourse, fixed rateOne New York Plaza New York 5.50 March 2016 245 397 Non‐recourse, fixed rateMarina Towers Los Angeles 5.84 April 2016 13 21 Non‐recourse, fixed rateU.S. Fund corporate debt — 6.85 May 2011 138 307 Non‐recourse, fixed rateU.S. Fund corporate debt — 4.99 October 2011 1,204 3,088 Non‐recourse, floating rateU.S. Fund corporate debt — 3.24 October 2011 267 594 Non‐recourse, floating rateTotal U.S. Office Fund 5.06 $ 2,579 $ 5,732
(1)Represents the company’s consolidated interest before non‐controlling interests
(2)Net of $46 million of transaction costs
(3)Reflects Brookfield Properties’ effective 45% interest in the U.S. Office Fund
(4)Commercial property debt of $108 million relates to discontinued operations
(5)Development debt
(6)Property debt is cross‐collateralized

22 Q3/2008 Interim Report
Sept. 30, 2008(1,2)
($ in millions) Location Rate % Maturity Date Proportional
(3)Consolidated Mortgage Details
Canadian Office Fund Enbridge Tower Edmonton 6.72 June 2009 $ 2 $ 2 Non‐recourse, fixed ratePlace de Ville I Ottawa 7.81 November 2009 6 6 Non‐recourse, fixed rateFirst Canadian Place Toronto 8.06 December 2009 59 59 Non‐recourse, fixed rate151 Yonge Street Toronto 6.01 June 2012 11 11 Non‐recourse, fixed rateJean Edmonds Tower Ottawa 5.55 January 2014 1 1 Non‐recourse, fixed rate2 Queen Street East Toronto 5.64 December 2017 27 27 Non‐recourse, fixed rateAltius Centre Calgary 5.64 December 2017 19 19 Non‐recourse, fixed rateCanadian Western Bank Edmonton 5.64 December 2017 14 14 Non‐recourse, fixed rateJean Edmonds Tower Ottawa 6.79 January 2024 16 16 Non‐recourse, fixed rate
Total Canadian Office Fund 6.80 $ 155 $ 155
Corporate Corporate Revolver 5.03 June 2009 $ 266 $ 266 Recourse, floating rateTerm Facility 6.43 September 2009 104 104 Recourse, floating rate
Total Corporate $ 370 $ 370
Total Commercial Property Debt 5.67 $ 8,756 $ 11,909 (1)Represents the company’s consolidated interest before non‐controlling interests
(2)Net of $46 million of transaction costs
(3)Reflects Brookfield Properties’ effective 45% interest in the U.S. Office Fund
Commercial property debt maturities and scheduled amortization for the next five years and thereafter are as follows: Weighted‐ Average Scheduled Interest Rate at(Millions) Amortization Maturities Total(1) Sept. 30, 2008
Remainder 2008 $ 45 $ 138 $ 183 6.73%2009 166 905 1,071 5.70%2010 184 53 237 6.07%2011 194 4,474 4,668 5.00%2012 200 427 627 5.78%2013 and thereafter 669 4,454 5,123 6.10%
Total commercial property debt $ 1,458 $ 10,451 $ 11,909 5.67%(1)Includes $108 million of commercial property debt related to discontinued operations at September 30, 2008 (December 31, 2007 ‐ nil)
CONTRACTUAL OBLIGATIONS The following table presents our contractual obligations over the next five years: Payments Due By Period
(Millions) Total Less than 1 year 1 ‐ 3 Years 4 ‐ 5 Years After 5 Years
Commercial property debt(1) $ 11,909 $ 183 $ 1,308 $ 5,295 $ 5,123Residential development debt 515 44 463 8 ―Capital securities ‐ corporate 996 ― 188 ― 808Capital securities ‐ fund subsidiaries(2) 257 ― ― ― 257Interest expense(3) Commercial property debt 3,534 335 1,244 839 1,116 Capital securities ‐ corporate 311 14 109 89 99 Capital securities ‐ fund subsidiaries(2) 142 7 56 56 23Minimum rental payments ‐ ground leases(4) 3,234 7 56 56 3,115
(1)Net of transaction costs
(2)Excludes redeemable equity interests
(3)Represents aggregate interest expense expected to be paid over the term of the debt, on an undiscounted basis, based on current interest and foreign exchange rates
(4)Represents payments on properties situated on land held under leases or other agreements
Corporate Guarantees and Contingent Obligations We conduct our operations through entities that are fully or proportionately consolidated in our financial statements except for our investment in Brookfield LePage Johnson Controls and a 23.75% investment in Oakridges, a residential development project in Toronto, which are both equity accounted. We may be contingently liable with respect to litigation and claims that arise in the normal course of business. In addition, we may execute agreements that provide for indemnifications and guarantees to third parties. Disclosure of guarantees, contingencies and commitments can be found in Note 22 to our consolidated financial statements.

Brookfield Properties Corporation 23
ACCOUNTS PAYABLE AND OTHER LIABILITIES Accounts payable and other liabilities totaled $1,293 million at September 30, 2008, compared with $1,357 million at December 31, 2007. Accounts payable and accrued liabilities decreased to $544 million from $613 million at December 31, 2007 primarily due to the settlement of an interest rate swap which we entered into during 2007 to hedge the interest rate risk associated with the anticipated issuance of $350 million of fixed rate debt. As a result of the settlement of this swap in the second quarter, accounts payable decreased approximately $33 million. In addition, various tax payments made throughout the year have resulted in a reduction to our tax accruals. There was also a reduction in our residential payables due to the slowing activity in that market. Offsetting these decreases was an increase in land development debt. This financing is primarily recourse in nature to the underlying residential development properties and relates to construction and development loans, which are repaid from the sales proceeds of building lots and homes, and other short‐term advances. As new homes are constructed, loans are funded on a rolling basis. This financing had a weighted average interest rate of 4.91% at September 30, 2008 (December 31, 2007 ‐ 6.17%). A summary of the components of accounts payable and other liabilities is as follows: (Millions) Sept. 30, 2008 Dec. 31, 2007
Accounts payable and accrued liabilities $ 544 $ 613Straight‐line rent payable 67 59Residential payables and accrued liabilities 167 184Land development debt 515 501
Total $ 1,293 $ 1,357
INTANGIBLE LIABILITIES Intangible liabilities consist of below‐market tenant leases and above‐market ground lease obligations assumed on acquisitions, net of related accumulated amortization. The components of intangible liabilities are as follows: (Millions) Sept. 30, 2008 Dec. 31, 2007
Intangible liabilities Below‐market leases $ 1,007 $ 971 Above‐market ground lease obligations 45 58
1,052 1,029Less accumulated depreciation Below‐market leases (292) (189) Above‐market ground lease obligations (7) (6)
Total net $ 753 $ 834
FUTURE INCOME TAXES At September 30, 2008, we had a net future income tax liability of $692 million broken out as follows: (Millions) Sept. 30, 2008 Dec. 31, 2007
Future income tax assets related to non‐capital losses and capital losses $ 235 $ 344Future income tax liabilities related to difference in tax and book basis, net (927) (944)
Total net $ (692) $ (600)
Together with our Canadian subsidiaries, we have future income tax assets of $60 million (December 31, 2007 ‐ $117 million) that relate to non‐capital losses which expire over the next 20 years and $85 million (December 31, 2007 ‐ $106 million) that relate to capital losses which have no expiry. Our U.S. subsidiaries have future income tax assets of $90 million (December 31, 2007 ‐ $121 million) that relate to net operating losses which expire over the next 15 years. The amount of non‐capital losses and deductible temporary differences, for which no future income tax assets have been recognized, is approximately $380 million (December 31, 2007 ‐ $395 million) which also expire over the next 10 years.
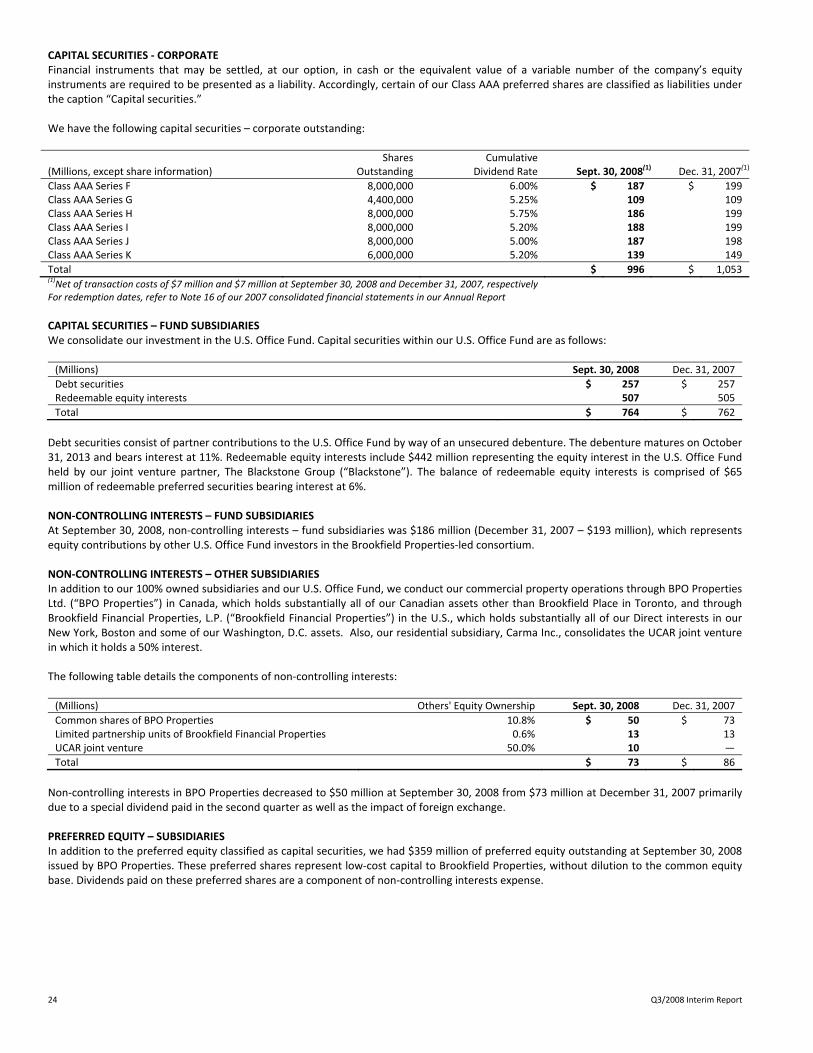
24 Q3/2008 Interim Report
CAPITAL SECURITIES ‐ CORPORATE Financial instruments that may be settled, at our option, in cash or the equivalent value of a variable number of the company’s equity instruments are required to be presented as a liability. Accordingly, certain of our Class AAA preferred shares are classified as liabilities under the caption “Capital securities.” We have the following capital securities – corporate outstanding: Shares Cumulative (Millions, except share information) Outstanding Dividend Rate Sept. 30, 2008(1) Dec. 31, 2007(1)
Class AAA Series F 8,000,000 6.00% $ 187 $ 199Class AAA Series G 4,400,000 5.25% 109 109Class AAA Series H 8,000,000 5.75% 186 199Class AAA Series I 8,000,000 5.20% 188 199Class AAA Series J 8,000,000 5.00% 187 198Class AAA Series K 6,000,000 5.20% 139 149
Total $ 996 $ 1,053(1)Net of transaction costs of $7 million and $7 million at September 30, 2008 and December 31, 2007, respectively
For redemption dates, refer to Note 16 of our 2007 consolidated financial statements in our Annual Report
CAPITAL SECURITIES – FUND SUBSIDIARIES We consolidate our investment in the U.S. Office Fund. Capital securities within our U.S. Office Fund are as follows: (Millions) Sept. 30, 2008 Dec. 31, 2007
Debt securities $ 257 $ 257Redeemable equity interests 507 505
Total $ 764 $ 762
Debt securities consist of partner contributions to the U.S. Office Fund by way of an unsecured debenture. The debenture matures on October 31, 2013 and bears interest at 11%. Redeemable equity interests include $442 million representing the equity interest in the U.S. Office Fund held by our joint venture partner, The Blackstone Group (“Blackstone”). The balance of redeemable equity interests is comprised of $65 million of redeemable preferred securities bearing interest at 6%. NON‐CONTROLLING INTERESTS – FUND SUBSIDIARIES At September 30, 2008, non‐controlling interests – fund subsidiaries was $186 million (December 31, 2007 – $193 million), which represents equity contributions by other U.S. Office Fund investors in the Brookfield Properties‐led consortium. NON‐CONTROLLING INTERESTS – OTHER SUBSIDIARIES In addition to our 100% owned subsidiaries and our U.S. Office Fund, we conduct our commercial property operations through BPO Properties Ltd. (“BPO Properties”) in Canada, which holds substantially all of our Canadian assets other than Brookfield Place in Toronto, and through Brookfield Financial Properties, L.P. (“Brookfield Financial Properties”) in the U.S., which holds substantially all of our Direct interests in our New York, Boston and some of our Washington, D.C. assets. Also, our residential subsidiary, Carma Inc., consolidates the UCAR joint venture in which it holds a 50% interest. The following table details the components of non‐controlling interests: (Millions) Others' Equity Ownership Sept. 30, 2008 Dec. 31, 2007
Common shares of BPO Properties 10.8% $ 50 $ 73Limited partnership units of Brookfield Financial Properties 0.6% 13 13UCAR joint venture 50.0% 10 ―
Total $ 73 $ 86
Non‐controlling interests in BPO Properties decreased to $50 million at September 30, 2008 from $73 million at December 31, 2007 primarily due to a special dividend paid in the second quarter as well as the impact of foreign exchange. PREFERRED EQUITY – SUBSIDIARIES In addition to the preferred equity classified as capital securities, we had $359 million of preferred equity outstanding at September 30, 2008 issued by BPO Properties. These preferred shares represent low‐cost capital to Brookfield Properties, without dilution to the common equity base. Dividends paid on these preferred shares are a component of non‐controlling interests expense.
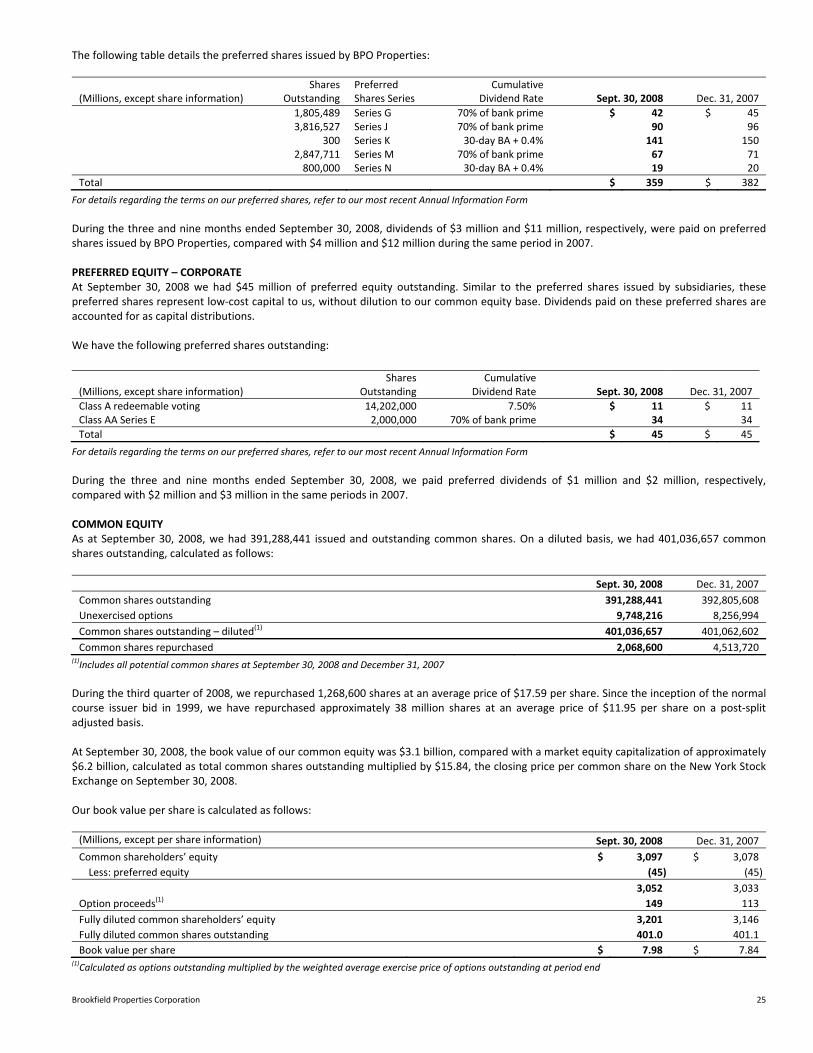
Brookfield Properties Corporation 25
The following table details the preferred shares issued by BPO Properties: Shares Preferred Cumulative(Millions, except share information) Outstanding Shares Series Dividend Rate Sept. 30, 2008 Dec. 31, 2007
1,805,489 Series G 70% of bank prime $ 42 $ 45 3,816,527 Series J 70% of bank prime 90 96 300 Series K 30‐day BA + 0.4% 141 150 2,847,711 Series M 70% of bank prime 67 71 800,000 Series N 30‐day BA + 0.4% 19 20
Total $ 359 $ 382
For details regarding the terms on our preferred shares, refer to our most recent Annual Information Form During the three and nine months ended September 30, 2008, dividends of $3 million and $11 million, respectively, were paid on preferred shares issued by BPO Properties, compared with $4 million and $12 million during the same period in 2007. PREFERRED EQUITY – CORPORATE At September 30, 2008 we had $45 million of preferred equity outstanding. Similar to the preferred shares issued by subsidiaries, these preferred shares represent low‐cost capital to us, without dilution to our common equity base. Dividends paid on these preferred shares are accounted for as capital distributions. We have the following preferred shares outstanding:
For details regarding the terms on our preferred shares, refer to our most recent Annual Information Form
During the three and nine months ended September 30, 2008, we paid preferred dividends of $1 million and $2 million, respectively, compared with $2 million and $3 million in the same periods in 2007. COMMON EQUITY As at September 30, 2008, we had 391,288,441 issued and outstanding common shares. On a diluted basis, we had 401,036,657 common shares outstanding, calculated as follows: Sept. 30, 2008 Dec. 31, 2007
Common shares outstanding 391,288,441 392,805,608
Unexercised options 9,748,216 8,256,994
Common shares outstanding – diluted(1) 401,036,657 401,062,602
Common shares repurchased 2,068,600 4,513,720 (1)Includes all potential common shares at September 30, 2008 and December 31, 2007
During the third quarter of 2008, we repurchased 1,268,600 shares at an average price of $17.59 per share. Since the inception of the normal course issuer bid in 1999, we have repurchased approximately 38 million shares at an average price of $11.95 per share on a post‐split adjusted basis. At September 30, 2008, the book value of our common equity was $3.1 billion, compared with a market equity capitalization of approximately $6.2 billion, calculated as total common shares outstanding multiplied by $15.84, the closing price per common share on the New York Stock Exchange on September 30, 2008. Our book value per share is calculated as follows: (Millions, except per share information) Sept. 30, 2008 Dec. 31, 2007
Common shareholders’ equity $ 3,097 $ 3,078
Less: preferred equity (45) (45) 3,052 3,033
Option proceeds(1) 149 113
Fully diluted common shareholders’ equity 3,201 3,146
Fully diluted common shares outstanding 401.0 401.1
Book value per share $ 7.98 $ 7.84 (1)Calculated as options outstanding multiplied by the weighted average exercise price of options outstanding at period end
Shares Cumulative(Millions, except share information) Outstanding Dividend Rate Sept. 30, 2008 Dec. 31, 2007
Class A redeemable voting 14,202,000 7.50% $ 11 $ 11Class AA Series E 2,000,000 70% of bank prime 34 34
Total $ 45 $ 45

26 Q3/2008 Interim Report
CAPITAL RESOURCES AND LIQUIDITY We employ a broad range of financing strategies to facilitate growth and manage financial risk, with particular emphasis on the overall reduction of the weighted average cost of capital, in order to enhance returns for common shareholders. Our principal liquidity needs for the next twelve months are to:
• fund recurring expenses;
• meet debt service requirements;
• make dividend payments;
• fund capital expenditures, including tenant improvements;
• fund current development costs not covered under construction loans;
• invest in the establishment of new funds;
• repurchase our stock; and
• possibly fund new property acquisitions.
We believe that our liquidity needs will be satisfied using cash on hand, cashflows generated from operating activities and provided by financing activities, as well as proceeds from asset sales. Rental revenue, recoveries from tenants, interest and other income, available cash balances, draws on our corporate credit facilities and refinancings, including upward refinancings, of maturing indebtedness are our principal sources of capital used to pay operating expenses, dividends, debt service and recurring capital and leasing costs in our commercial property portfolio. We seek to increase income from our existing properties by maintaining quality standards for our properties that promote high occupancy rates and support increases in rental rates while reducing tenant turnover and related retenanting costs, and by controlling operating expenses. Another source of cashflow includes third‐party fees generated by our asset management, leasing and development businesses. In addition, our tax status as a corporation and tax loss pools allow us to retain and reinvest cash generated by our operations without incurring significant cash taxes. Consequently, we believe our revenue along with proceeds from financing activities will continue to provide the necessary funds for our short‐term liquidity needs. However, material changes in these factors may adversely affect our net cashflows. Our principal liquidity needs for periods beyond the next twelve months are for development costs, potential property acquisitions, scheduled debt maturities and non‐recurring capital expenditures. We plan to meet these needs with one or more of the following:
• cashflows from operations;
• construction loans;
• investment in new funds;
• proceeds from sales of assets; and
• our credit facilities and refinancing opportunities. Our commercial property debt is primarily fixed‐rate and non‐recourse to the company. These investment‐grade financings are typically structured on a loan‐to‐appraised value basis of up to 60%. In addition, in certain circumstances where a building is leased almost exclusively to a high‐credit quality tenant, a higher loan‐to‐value financing, based on the tenant’s credit quality, is put in place at rates commensurate with the cost of funds for the tenant. This reduces our equity requirements to finance commercial property, and enhances equity returns.
Brookfield Properties Corporation 27
OPERATING RESULTS NET INCOME Our net income for the three and nine months ended September 30, 2008 was $174 million ($0.44 per diluted share) and $242 million ($0.61 per diluted share), respectively, compared to $3 million (nil per diluted share) and $135 million ($0.33 per diluted share) during the same periods in 2007. During the current quarter, we incurred $13 million of operating costs ($8 million net of our non‐controlling interests) resulting from damage to our Houston properties from Hurricane Ike. While we insure these properties at standard commercial terms, the damage to our properties was less than the amount of our deductible for a named wind storm. The net increase quarter over quarter is largely a result of
• an increase in discontinued operations of $122 million ($0.31 per diluted share) due to the gain on the sale of TD Canada Trust Tower in Toronto;
• no transaction costs in the current quarter as compared to 2007, which had transition costs of $35 million ($0.09 per diluted share) associated with the defeasance of debt on One Liberty Plaza in New York in addition to costs related to the Trizec merger and integration;
• a decrease in interest expense of $10 million ($0.03 per diluted share) as a result of reduced LIBOR rates on our floating rate debt offset by the impact of refinancings completed subsequent to the third quarter of 2007;
• an increase in commercial property net operating income of $4 million ($0.01 per diluted share) as a result of the acquisition of the remaining interest in 53 and 75 State Street in Boston in the fourth quarter of 2007 as well as the reclassification of Four Allen Center in Houston to operating inclusive of an offsetting $13 million ($0.03 per diluted share) of costs incurred in the current quarter as a result of damage to our Houston properties from Hurricane Ike;
• a decrease in depreciation and amortization of $3 million ($0.01 per diluted share) as a result of the sale of TD Canada Trust Tower in Toronto, offset by the purchase of the remaining interest in 53 and 75 State Street in Boston subsequent to the third quarter of 2007 and depreciation on Four Allen Center in Houston, which became operational in 2008; offset by:
• a reduction of $5 million ($0.01 per diluted share) in losses absorbed by co‐investors in the U.S. Office Fund as a result of the increased earnings in the Fund.
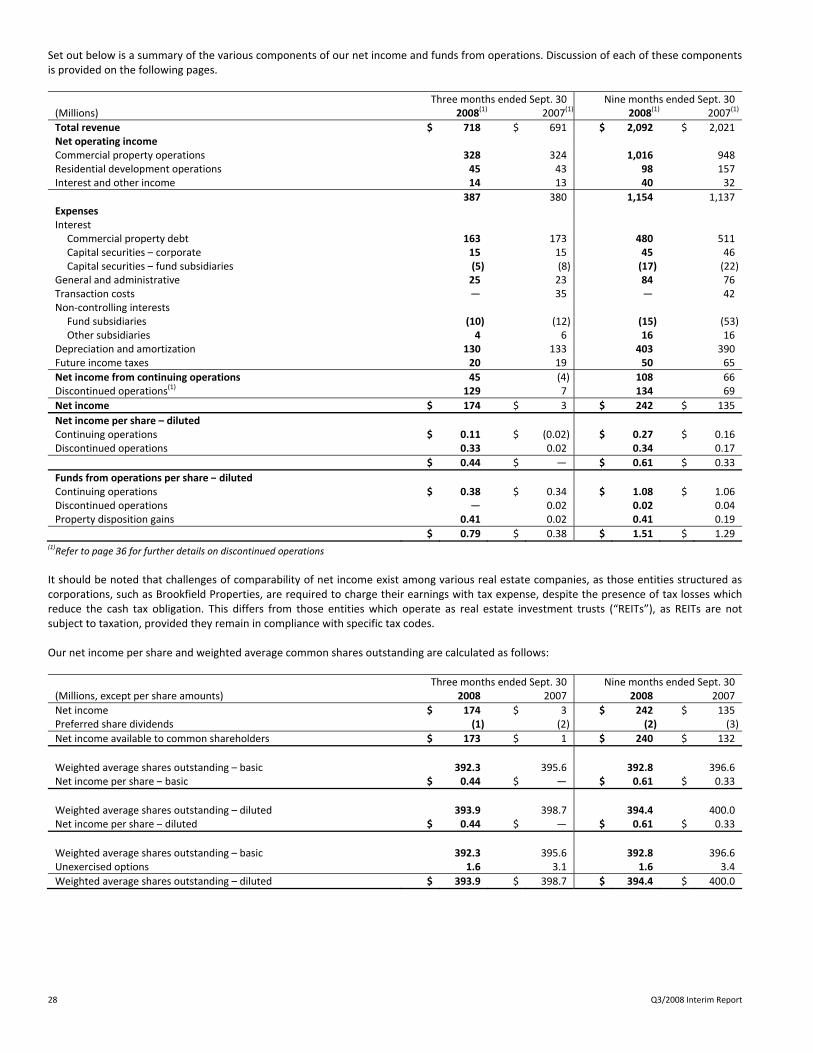
28 Q3/2008 Interim Report
Set out below is a summary of the various components of our net income and funds from operations. Discussion of each of these components is provided on the following pages. Three months ended Sept. 30 Nine months ended Sept. 30(Millions) 2008(1) 2007(1) 2008(1) 2007(1)
Total revenue $ 718 $ 691 $ 2,092 $ 2,021Net operating income Commercial property operations 328 324 1,016 948Residential development operations 45 43 98 157Interest and other income 14 13 40 32
387 380 1,154 1,137Expenses Interest Commercial property debt 163 173 480 511 Capital securities – corporate 15 15 45 46 Capital securities – fund subsidiaries (5) (8) (17) (22)General and administrative 25 23 84 76Transaction costs ― 35 ― 42Non‐controlling interests Fund subsidiaries (10) (12) (15) (53) Other subsidiaries 4 6 16 16Depreciation and amortization 130 133 403 390Future income taxes 20 19 50 65
Net income from continuing operations 45 (4) 108 66Discontinued operations(1) 129 7 134 69
Net income $ 174 $ 3 $ 242 $ 135
Net income per share – diluted Continuing operations $ 0.11 $ (0.02) $ 0.27 $ 0.16Discontinued operations 0.33 0.02 0.34 0.17
$ 0.44 $ ― $ 0.61 $ 0.33
Funds from operations per share – diluted Continuing operations $ 0.38 $ 0.34 $ 1.08 $ 1.06Discontinued operations ― 0.02 0.02 0.04Property disposition gains 0.41 0.02 0.41 0.19
$ 0.79 $ 0.38 $ 1.51 $ 1.29(1)Refer to page 36 for further details on discontinued operations
It should be noted that challenges of comparability of net income exist among various real estate companies, as those entities structured as corporations, such as Brookfield Properties, are required to charge their earnings with tax expense, despite the presence of tax losses which reduce the cash tax obligation. This differs from those entities which operate as real estate investment trusts (“REITs”), as REITs are not subject to taxation, provided they remain in compliance with specific tax codes. Our net income per share and weighted average common shares outstanding are calculated as follows: Three months ended Sept. 30 Nine months ended Sept. 30(Millions, except per share amounts) 2008 2007 2008 2007
Net income $ 174 $ 3 $ 242 $ 135Preferred share dividends (1) (2) (2) (3)
Net income available to common shareholders $ 173 $ 1 $ 240 $ 132
Weighted average shares outstanding – basic 392.3 395.6 392.8 396.6Net income per share – basic $ 0.44 $ ― $ 0.61 $ 0.33
Weighted average shares outstanding – diluted 393.9 398.7 394.4 400.0Net income per share – diluted $ 0.44 $ ― $ 0.61 $ 0.33
Weighted average shares outstanding – basic 392.3 395.6 392.8 396.6Unexercised options 1.6 3.1 1.6 3.4
Weighted average shares outstanding – diluted $ 393.9 $ 398.7 $ 394.4 $ 400.0

Brookfield Properties Corporation 29
RECONCILIATION OF NET INCOME TO FUNDS FROM OPERATIONS Three months ended Sept. 30 Nine months ended Sept. 30(Millions) 2008 2007 2008 2007
Net income $ 174 $ 3 $ 242 $ 135 Add (deduct) non‐cash and extraordinary items: Depreciation and amortization 130 133 403 390 Income taxes 20 19 50 65 Transaction costs ― 35 ― 42 Discontinued operations(1) (127) (1) (125) (50) Non‐controlling interests in above items(2) (45) (43) (135) (140)
Funds from operations $ 152 $ 146 $ 435 $ 442(1)Represents depreciation and amortization, income taxes and disposition gains related to discontinued operations
(2)Includes non‐cash component of capital securities – fund subsidiaries of $19 million and $64 million for the three and nine months ended September 30, 2008 (2007 – $21 million and $64 million, respectively)
After providing for preferred share dividends, our funds from operations per diluted share, excluding lease termination income and gains, is calculated as follows: Three months ended Sept. 30 Nine months ended Sept. 30(Millions, except per share amounts) 2008 2007 2008 2007
Funds from operations $ 152 $ 146 $ 435 $ 442Preferred share dividends (1) (2) (2) (3)
$ 151 $ 144 $ 433 $ 439
Funds from operations per share ‐ diluted $ 0.38 $ 0.36 $ 1.10 $ 1.10
REVENUE The components of revenue are as follows: Three months ended Sept. 30 Nine months ended Sept. 30(Millions) 2008 2007 2008 2007
Commercial property revenue Revenue from continuing operations $ 556 $ 528 $ 1,667 $ 1,528Recurring fee income 10 10 33 28Lease termination, non‐recurring fee and other income ― ― ― 4
Total commercial property revenue 566 538 1,700 1,560Revenue from residential development operations 138 140 352 429
Revenue from commercial property and residential development operations 704 678 2,052 1,989Interest and other 14 13 40 32
Total $ 718 $ 691 $ 2,092 $ 2,021
COMMERCIAL PROPERTY OPERATIONS Commercial property net operating income totaled $328 million and $1,016 million in the three and nine months ended September 30, 2008, respectively, compared with $324 million and $948 million during the same periods in 2007. The components of commercial property net operating income from continuing operations are as follows: Three months ended Sept. 30 Nine months ended Sept. 30(Millions) 2008 2007 2008 2007
Commercial Property Revenue Revenue from current properties $ 516 $ 481 $ 1,536 $ 1,386 Straight‐line rental income 8 11 27 38 Intangible amortization 32 36 104 104
Revenue from continuing operations 556 528 1,667 1,528 Recurring fee income 10 10 33 28 Non‐recurring fee and other income ― ― ― 4
Total commercial property revenue 566 538 1,700 1,560Property operating costs (238) (214) (684) (612)
Commercial property net operating income $ 328 $ 324 $ 1,016 $ 948
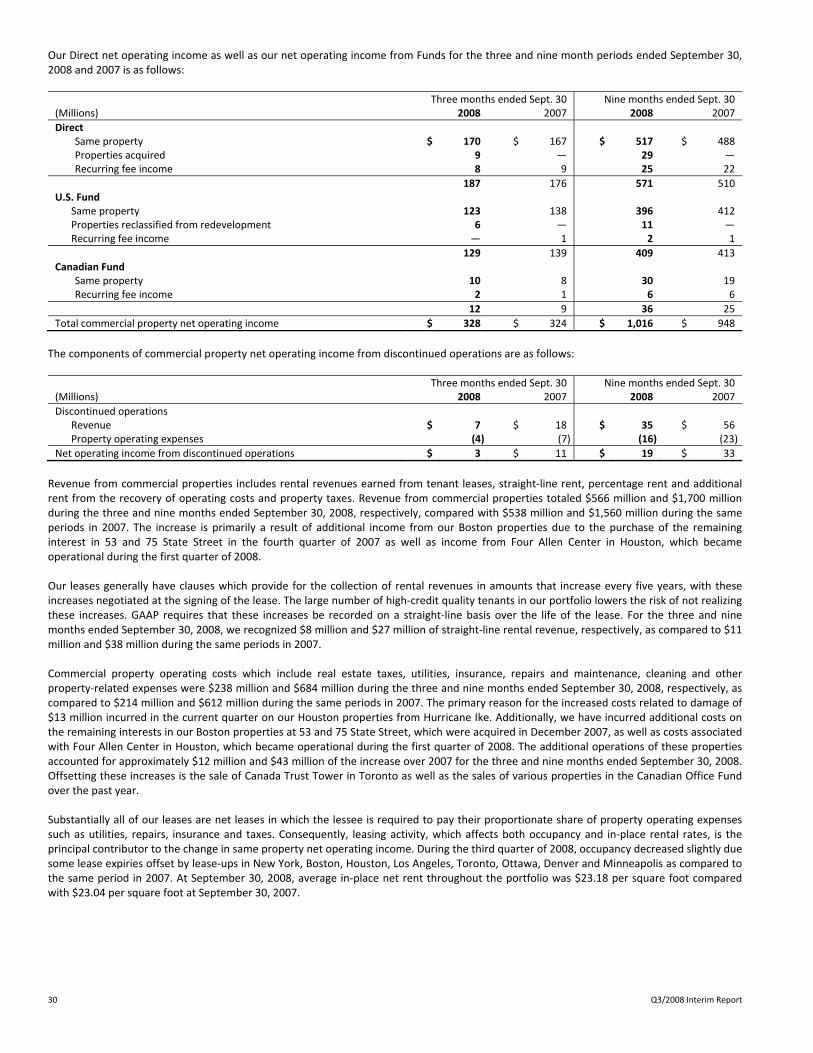
30 Q3/2008 Interim Report
Our Direct net operating income as well as our net operating income from Funds for the three and nine month periods ended September 30, 2008 and 2007 is as follows: Three months ended Sept. 30 Nine months ended Sept. 30(Millions) 2008 2007 2008 2007
Direct Same property $ 170 $ 167 $ 517 $ 488 Properties acquired 9 ― 29 ― Recurring fee income 8 9 25 22
187 176 571 510U.S. Fund
Same property 123 138 396 412Properties reclassified from redevelopment 6 ― 11 ―Recurring fee income ― 1 2 1
129 139 409 413Canadian Fund Same property 10 8 30 19 Recurring fee income 2 1 6 6
12 9 36 25
Total commercial property net operating income $ 328 $ 324 $ 1,016 $ 948
The components of commercial property net operating income from discontinued operations are as follows: Three months ended Sept. 30 Nine months ended Sept. 30(Millions) 2008 2007 2008 2007
Discontinued operations Revenue $ 7 $ 18 $ 35 $ 56Property operating expenses (4) (7) (16) (23)
Net operating income from discontinued operations $ 3 $ 11 $ 19 $ 33
Revenue from commercial properties includes rental revenues earned from tenant leases, straight‐line rent, percentage rent and additional rent from the recovery of operating costs and property taxes. Revenue from commercial properties totaled $566 million and $1,700 million during the three and nine months ended September 30, 2008, respectively, compared with $538 million and $1,560 million during the same periods in 2007. The increase is primarily a result of additional income from our Boston properties due to the purchase of the remaining interest in 53 and 75 State Street in the fourth quarter of 2007 as well as income from Four Allen Center in Houston, which became operational during the first quarter of 2008. Our leases generally have clauses which provide for the collection of rental revenues in amounts that increase every five years, with these increases negotiated at the signing of the lease. The large number of high‐credit quality tenants in our portfolio lowers the risk of not realizing these increases. GAAP requires that these increases be recorded on a straight‐line basis over the life of the lease. For the three and nine months ended September 30, 2008, we recognized $8 million and $27 million of straight‐line rental revenue, respectively, as compared to $11 million and $38 million during the same periods in 2007. Commercial property operating costs which include real estate taxes, utilities, insurance, repairs and maintenance, cleaning and other property‐related expenses were $238 million and $684 million during the three and nine months ended September 30, 2008, respectively, as compared to $214 million and $612 million during the same periods in 2007. The primary reason for the increased costs related to damage of $13 million incurred in the current quarter on our Houston properties from Hurricane Ike. Additionally, we have incurred additional costs on the remaining interests in our Boston properties at 53 and 75 State Street, which were acquired in December 2007, as well as costs associated with Four Allen Center in Houston, which became operational during the first quarter of 2008. The additional operations of these properties accounted for approximately $12 million and $43 million of the increase over 2007 for the three and nine months ended September 30, 2008. Offsetting these increases is the sale of Canada Trust Tower in Toronto as well as the sales of various properties in the Canadian Office Fund over the past year. Substantially all of our leases are net leases in which the lessee is required to pay their proportionate share of property operating expenses such as utilities, repairs, insurance and taxes. Consequently, leasing activity, which affects both occupancy and in‐place rental rates, is the principal contributor to the change in same property net operating income. During the third quarter of 2008, occupancy decreased slightly due some lease expiries offset by lease‐ups in New York, Boston, Houston, Los Angeles, Toronto, Ottawa, Denver and Minneapolis as compared to the same period in 2007. At September 30, 2008, average in‐place net rent throughout the portfolio was $23.18 per square foot compared with $23.04 per square foot at September 30, 2007.
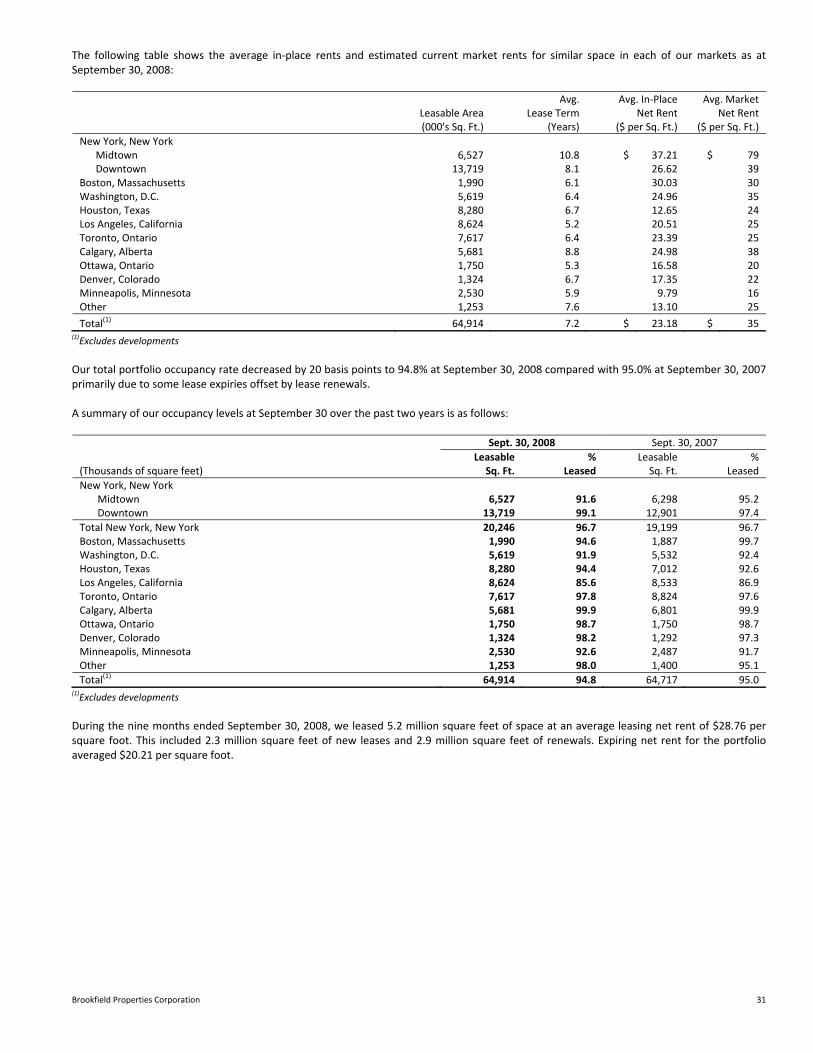
Brookfield Properties Corporation 31
The following table shows the average in‐place rents and estimated current market rents for similar space in each of our markets as at September 30, 2008: Avg. Avg. In‐Place Avg. Market Leasable Area Lease Term Net Rent Net Rent (000's Sq. Ft.) (Years) ($ per Sq. Ft.) ($ per Sq. Ft.)
New York, New York Midtown 6,527 10.8 $ 37.21 $ 79 Downtown 13,719 8.1 26.62 39Boston, Massachusetts 1,990 6.1 30.03 30Washington, D.C. 5,619 6.4 24.96 35Houston, Texas 8,280 6.7 12.65 24Los Angeles, California 8,624 5.2 20.51 25Toronto, Ontario 7,617 6.4 23.39 25Calgary, Alberta 5,681 8.8 24.98 38Ottawa, Ontario 1,750 5.3 16.58 20Denver, Colorado 1,324 6.7 17.35 22Minneapolis, Minnesota 2,530 5.9 9.79 16Other 1,253 7.6 13.10 25
Total(1) 64,914 7.2 $ 23.18 $ 35 (1)Excludes developments
Our total portfolio occupancy rate decreased by 20 basis points to 94.8% at September 30, 2008 compared with 95.0% at September 30, 2007 primarily due to some lease expiries offset by lease renewals. A summary of our occupancy levels at September 30 over the past two years is as follows: Sept. 30, 2008 Sept. 30, 2007
Leasable % Leasable %(Thousands of square feet) Sq. Ft. Leased Sq. Ft. Leased
New York, New York Midtown 6,527 91.6 6,298 95.2 Downtown 13,719 99.1 12,901 97.4
Total New York, New York 20,246 96.7 19,199 96.7Boston, Massachusetts 1,990 94.6 1,887 99.7Washington, D.C. 5,619 91.9 5,532 92.4Houston, Texas 8,280 94.4 7,012 92.6Los Angeles, California 8,624 85.6 8,533 86.9Toronto, Ontario 7,617 97.8 8,824 97.6Calgary, Alberta 5,681 99.9 6,801 99.9Ottawa, Ontario 1,750 98.7 1,750 98.7Denver, Colorado 1,324 98.2 1,292 97.3Minneapolis, Minnesota 2,530 92.6 2,487 91.7Other 1,253 98.0 1,400 95.1
Total(1) 64,914 94.8 64,717 95.0(1)Excludes developments
During the nine months ended September 30, 2008, we leased 5.2 million square feet of space at an average leasing net rent of $28.76 per square foot. This included 2.3 million square feet of new leases and 2.9 million square feet of renewals. Expiring net rent for the portfolio averaged $20.21 per square foot.
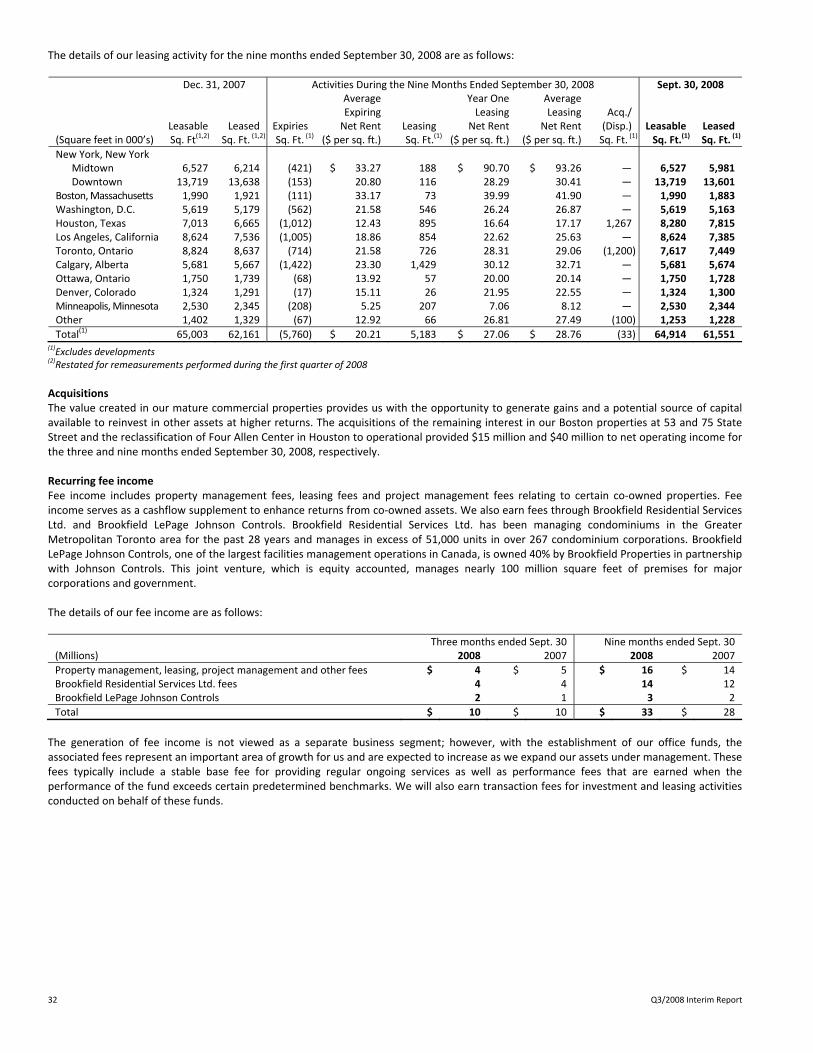
32 Q3/2008 Interim Report
The details of our leasing activity for the nine months ended September 30, 2008 are as follows: Dec. 31, 2007 Activities During the Nine Months Ended September 30, 2008 Sept. 30, 2008 Average Year One Average Expiring Leasing Leasing Acq./ Leasable Leased Expiries Net Rent Leasing Net Rent Net Rent (Disp.) Leasable Leased (Square feet in 000’s) Sq. Ft(1,2) Sq. Ft. (1,2) Sq. Ft. (1) ($ per sq. ft.) Sq. Ft.(1) ($ per sq. ft.) ($ per sq. ft.) Sq. Ft. (1) Sq. Ft.(1) Sq. Ft. (1)
New York, New York Midtown 6,527 6,214 (421) $ 33.27 188 $ 90.70 $ 93.26 ― 6,527 5,981 Downtown 13,719 13,638 (153) 20.80 116 28.29 30.41 ― 13,719 13,601Boston, Massachusetts 1,990 1,921 (111) 33.17 73 39.99 41.90 ― 1,990 1,883Washington, D.C. 5,619 5,179 (562) 21.58 546 26.24 26.87 ― 5,619 5,163Houston, Texas 7,013 6,665 (1,012) 12.43 895 16.64 17.17 1,267 8,280 7,815Los Angeles, California 8,624 7,536 (1,005) 18.86 854 22.62 25.63 ― 8,624 7,385Toronto, Ontario 8,824 8,637 (714) 21.58 726 28.31 29.06 (1,200) 7,617 7,449Calgary, Alberta 5,681 5,667 (1,422) 23.30 1,429 30.12 32.71 ― 5,681 5,674Ottawa, Ontario 1,750 1,739 (68) 13.92 57 20.00 20.14 ― 1,750 1,728Denver, Colorado 1,324 1,291 (17) 15.11 26 21.95 22.55 ― 1,324 1,300Minneapolis, Minnesota 2,530 2,345 (208) 5.25 207 7.06 8.12 ― 2,530 2,344Other 1,402 1,329 (67) 12.92 66 26.81 27.49 (100) 1,253 1,228
Total(1) 65,003 62,161 (5,760) $ 20.21 5,183 $ 27.06 $ 28.76 (33) 64,914 61,551(1)Excludes developments
(2)Restated for remeasurements performed during the first quarter of 2008
Acquisitions The value created in our mature commercial properties provides us with the opportunity to generate gains and a potential source of capital available to reinvest in other assets at higher returns. The acquisitions of the remaining interest in our Boston properties at 53 and 75 State Street and the reclassification of Four Allen Center in Houston to operational provided $15 million and $40 million to net operating income for the three and nine months ended September 30, 2008, respectively. Recurring fee income Fee income includes property management fees, leasing fees and project management fees relating to certain co‐owned properties. Fee income serves as a cashflow supplement to enhance returns from co‐owned assets. We also earn fees through Brookfield Residential Services Ltd. and Brookfield LePage Johnson Controls. Brookfield Residential Services Ltd. has been managing condominiums in the Greater Metropolitan Toronto area for the past 28 years and manages in excess of 51,000 units in over 267 condominium corporations. Brookfield LePage Johnson Controls, one of the largest facilities management operations in Canada, is owned 40% by Brookfield Properties in partnership with Johnson Controls. This joint venture, which is equity accounted, manages nearly 100 million square feet of premises for major corporations and government. The details of our fee income are as follows: Three months ended Sept. 30 Nine months ended Sept. 30(Millions) 2008 2007 2008 2007
Property management, leasing, project management and other fees $ 4 $ 5 $ 16 $ 14Brookfield Residential Services Ltd. fees 4 4 14 12Brookfield LePage Johnson Controls 2 1 3 2
Total $ 10 $ 10 $ 33 $ 28
The generation of fee income is not viewed as a separate business segment; however, with the establishment of our office funds, the associated fees represent an important area of growth for us and are expected to increase as we expand our assets under management. These fees typically include a stable base fee for providing regular ongoing services as well as performance fees that are earned when the performance of the fund exceeds certain predetermined benchmarks. We will also earn transaction fees for investment and leasing activities conducted on behalf of these funds.

Brookfield Properties Corporation 33
RESIDENTIAL DEVELOPMENT OPERATIONS Our residential development operations are located in five markets: Alberta, Ontario, Colorado, Texas and Missouri. Most of our land holdings were purchased in the mid‐1990’s, and as a result have an embedded cost advantage over many companies which are acquiring land today at much higher prices. Our residential development operations contributed $45 million and $98 million of pre‐tax income during the three and nine months ended September 30, 2008, respectively, as compared to $43 million and $157 million during the same periods in 2007. The slight increase in earnings is due mainly to increased land sales offset by decreased home closings as a result of slowing home owner demand caused by a temporary oversupply of homes in the Alberta market. Although there has been no impact to date on lot prices, housing sales prices have been reduced in 2008 relative to 2007 bringing margins on home sales closer to historical levels. The components of residential development net operating income are as follows: Three months ended Sept. 30 Nine months ended Sept. 30(Millions) 2008 2007 2008 2007
Sales revenue $ 138 $ 140 $ 352 $ 429Operating costs (93) (97) (254) (272)
Total $ 45 $ 43 $ 98 $ 157
Lot sales for the three and nine months ended September 30 over the past two years and the related revenue earned are as follows:
Lot Sales
(Units/Acres) Lot Sales Revenue
(Millions) Average Lot Sales Revenue
(Thousands)
Three months ended Sept. 30 2008 2007 2008 2007 2008 2007
Single Family (Lots)
Alberta 378 303 $ 64 $ 61 $ 153 $ 180
Ontario 124 ― 15 ― 118 ―
Colorado 20 49 2 2 108 48
Texas ― ― ― ― ― ―
Missouri 2 ― ― ― ― ―
Total Single Family (Lots) 524 352 81 63
Total Single Family (Acre Equivalent)(1) 80 53
Multi‐Family, Commercial and Industrial (Acres)
Alberta 2 16 2 17 $ 1,212 $ 873
Total Land Sales Revenue $ 83 $ 80 (1)Represents lots converted to acres based on a conversion factor of four to seven lots per acre depending on region
Lot Sales
(Units/Acres) Lot Sales Revenue
(Millions) Average Lot Sales Revenue
(Thousands)
Nine months ended Sept. 30 2008 2007 2008 2007 2008 2007
Single Family (Lots)
Alberta 934 1,512 $ 160 $ 231 $ 163 $ 157
Ontario 124 72 15 7 113 97
Colorado 46 56 5 3 111 54
Texas ― 52 ― 2 ― 38
Missouri 2 1 ― ― 69 ―
Total Single Family (Lots) 1,106 1,693 180 243
Total Single Family (Acre Equivalent)(1) 166 274
Multi‐Family, Commercial and Industrial (Acres)
Alberta 16 42 16 34 $ 772 $ 237
Total Land Sales Revenue $ 196 $ 277 (1)Represents lots converted to acres based on a conversion factor of four to seven lots per acre depending on region
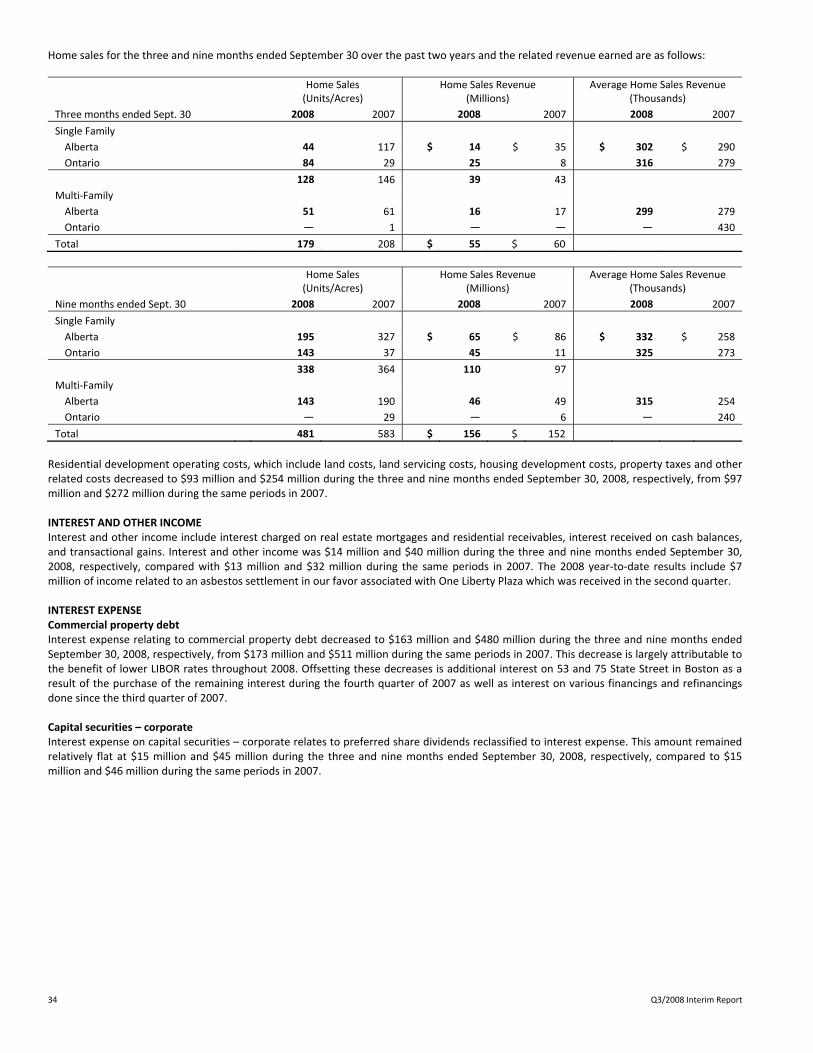
34 Q3/2008 Interim Report
Home sales for the three and nine months ended September 30 over the past two years and the related revenue earned are as follows:
Home Sales (Units/Acres)
Home Sales Revenue(Millions)
Average Home Sales Revenue (Thousands)
Three months ended Sept. 30 2008 2007 2008 2007 2008 2007
Single Family
Alberta 44 117 $ 14 $ 35 $ 302 $ 290
Ontario 84 29 25 8 316 279
128 146 39 43
Multi‐Family
Alberta 51 61 16 17 299 279
Ontario ― 1 ― ― ― 430
Total 179 208 $ 55 $ 60
Home Sales (Units/Acres)
Home Sales Revenue(Millions)
Average Home Sales Revenue (Thousands)
Nine months ended Sept. 30 2008 2007 2008 2007 2008 2007
Single Family
Alberta 195 327 $ 65 $ 86 $ 332 $ 258
Ontario 143 37 45 11 325 273
338 364 110 97
Multi‐Family
Alberta 143 190 46 49 315 254
Ontario ― 29 ― 6 ― 240
Total 481 583 $ 156 $ 152
Residential development operating costs, which include land costs, land servicing costs, housing development costs, property taxes and other related costs decreased to $93 million and $254 million during the three and nine months ended September 30, 2008, respectively, from $97 million and $272 million during the same periods in 2007. INTEREST AND OTHER INCOME Interest and other income include interest charged on real estate mortgages and residential receivables, interest received on cash balances, and transactional gains. Interest and other income was $14 million and $40 million during the three and nine months ended September 30, 2008, respectively, compared with $13 million and $32 million during the same periods in 2007. The 2008 year‐to‐date results include $7 million of income related to an asbestos settlement in our favor associated with One Liberty Plaza which was received in the second quarter. INTEREST EXPENSE Commercial property debt Interest expense relating to commercial property debt decreased to $163 million and $480 million during the three and nine months ended September 30, 2008, respectively, from $173 million and $511 million during the same periods in 2007. This decrease is largely attributable to the benefit of lower LIBOR rates throughout 2008. Offsetting these decreases is additional interest on 53 and 75 State Street in Boston as a result of the purchase of the remaining interest during the fourth quarter of 2007 as well as interest on various financings and refinancings done since the third quarter of 2007. Capital securities – corporate Interest expense on capital securities – corporate relates to preferred share dividends reclassified to interest expense. This amount remained relatively flat at $15 million and $45 million during the three and nine months ended September 30, 2008, respectively, compared to $15 million and $46 million during the same periods in 2007.
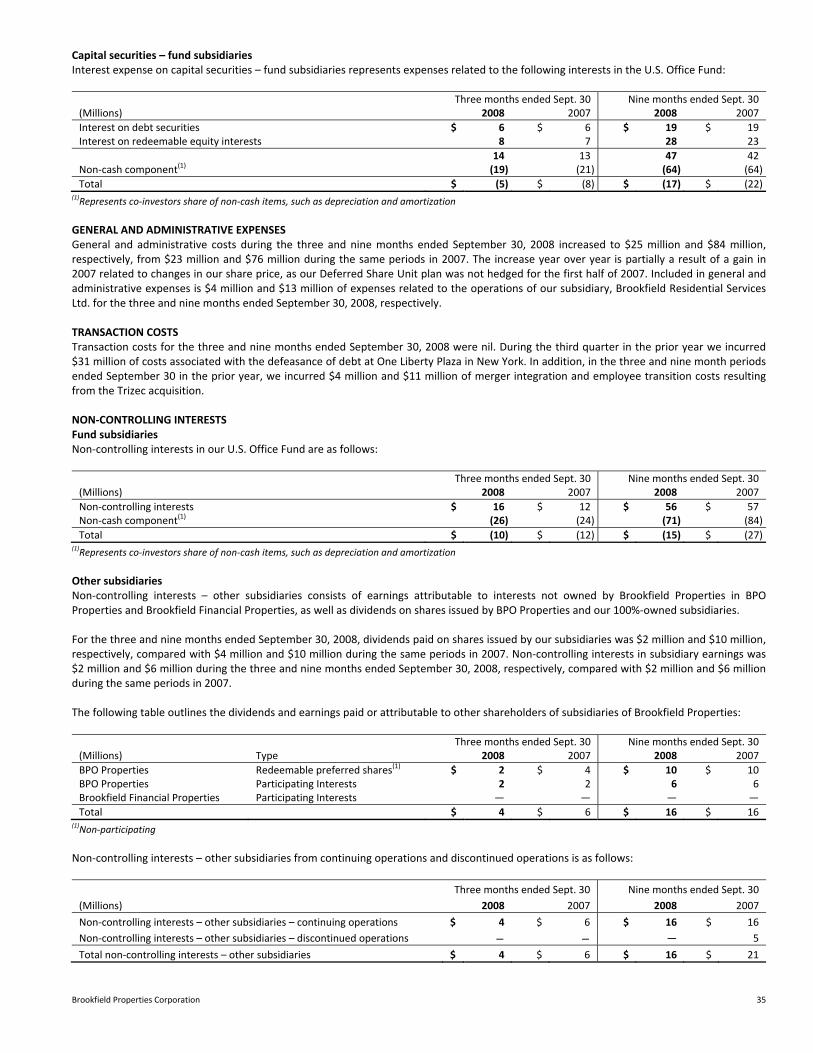
Brookfield Properties Corporation 35
Capital securities – fund subsidiaries Interest expense on capital securities – fund subsidiaries represents expenses related to the following interests in the U.S. Office Fund: Three months ended Sept. 30 Nine months ended Sept. 30(Millions) 2008 2007 2008 2007
Interest on debt securities $ 6 $ 6 $ 19 $ 19Interest on redeemable equity interests 8 7 28 23
14 13 47 42Non‐cash component(1) (19) (21) (64) (64)
Total $ (5) $ (8) $ (17) $ (22)(1)Represents co‐investors share of non‐cash items, such as depreciation and amortization
GENERAL AND ADMINISTRATIVE EXPENSES General and administrative costs during the three and nine months ended September 30, 2008 increased to $25 million and $84 million, respectively, from $23 million and $76 million during the same periods in 2007. The increase year over year is partially a result of a gain in 2007 related to changes in our share price, as our Deferred Share Unit plan was not hedged for the first half of 2007. Included in general and administrative expenses is $4 million and $13 million of expenses related to the operations of our subsidiary, Brookfield Residential Services Ltd. for the three and nine months ended September 30, 2008, respectively. TRANSACTION COSTS Transaction costs for the three and nine months ended September 30, 2008 were nil. During the third quarter in the prior year we incurred $31 million of costs associated with the defeasance of debt at One Liberty Plaza in New York. In addition, in the three and nine month periods ended September 30 in the prior year, we incurred $4 million and $11 million of merger integration and employee transition costs resulting from the Trizec acquisition. NON‐CONTROLLING INTERESTS Fund subsidiaries Non‐controlling interests in our U.S. Office Fund are as follows: Three months ended Sept. 30 Nine months ended Sept. 30(Millions) 2008 2007 2008 2007
Non‐controlling interests $ 16 $ 12 $ 56 $ 57Non‐cash component(1) (26) (24) (71) (84)
Total $ (10) $ (12) $ (15) $ (27)(1)Represents co‐investors share of non‐cash items, such as depreciation and amortization
Other subsidiaries Non‐controlling interests – other subsidiaries consists of earnings attributable to interests not owned by Brookfield Properties in BPO Properties and Brookfield Financial Properties, as well as dividends on shares issued by BPO Properties and our 100%‐owned subsidiaries. For the three and nine months ended September 30, 2008, dividends paid on shares issued by our subsidiaries was $2 million and $10 million, respectively, compared with $4 million and $10 million during the same periods in 2007. Non‐controlling interests in subsidiary earnings was $2 million and $6 million during the three and nine months ended September 30, 2008, respectively, compared with $2 million and $6 million during the same periods in 2007. The following table outlines the dividends and earnings paid or attributable to other shareholders of subsidiaries of Brookfield Properties: Three months ended Sept. 30 Nine months ended Sept. 30(Millions) Type 2008 2007 2008 2007
BPO Properties Redeemable preferred shares(1) $ 2 $ 4 $ 10 $ 10BPO Properties Participating Interests 2 2 6 6Brookfield Financial Properties Participating Interests ― ― ― ―
Total $ 4 $ 6 $ 16 $ 16(1)Non‐participating
Non‐controlling interests – other subsidiaries from continuing operations and discontinued operations is as follows:
Three months ended Sept. 30 Nine months ended Sept. 30
(Millions) 2008 2007 2008 2007
Non‐controlling interests – other subsidiaries – continuing operations $ 4 $ 6 $ 16 $ 16
Non‐controlling interests – other subsidiaries – discontinued operations ― ― ― 5
Total non‐controlling interests – other subsidiaries $ 4 $ 6 $ 16 $ 21

36 Q3/2008 Interim Report
DEPRECIATION AND AMORTIZATION EXPENSE Depreciation for the three and nine months ended September 30, 2008 decreased to $130 million and $403 million, respectively, from $133 million and $390 million during the same periods in 2007. The majority of this decrease was due to the sale of TD Canada Trust Tower in Toronto and the sale of various properties in our Canadian Office Fund in the past twelve months, offset by the acquisition of the remaining interest in our Boston properties at 53 and 75 State Street in the fourth quarter of 2007 as well as the reclassification of Four Allen Center in Houston to operational during the first quarter of 2008. FUTURE INCOME TAXES Future income taxes for the three and nine months ended September 30, 2008 were $20 million and $50 million, respectively compared to $19 million and $65 million during the same time period in 2007. The year‐to‐date decrease is largely due to a decrease in tax expense related to foreign exchange gains and losses offset by a decrease in tax recovery due to lower tax rates in other jurisdictions compared to the same period in 2007, and a decrease in tax recovery with respect to resolution of tax contingencies. DISCONTINUED OPERATIONS During the third quarter of 2008, one property met the criteria to be classified as discontinued operations: one of the RBC Plaza buildings in Minneapolis. During the second quarter of 2008, TD Canada Trust Tower in Toronto and one of the RBC Plaza buildings in Minneapolis were classified as discontinued operations. During the first quarter of 2008, Acres House in Niagara Falls and one of the RBC Plaza buildings in Minneapolis were classified as discontinued operations. TD Canada Trust Tower in Toronto was sold during the third quarter for a gain of $164 million. Acres House in Niagara Falls was sold during the second quarter for cash proceeds of $3 million and a net gain of nil. Excluding gains, non‐controlling interests and future income taxes, income attributable to discontinued operations was $2 million and $7 million for the three and nine months ended September 30, 2008. During the third quarter of 2007, we sold our 25% interest in both 2 and 40 St. Clair Avenue West in Toronto, recognizing a gain of approximately $6 million. During the second quarter of 2007, we sold a portion of our Waterview development site in Washington, D.C., which was acquired in 2006 as part of the Trizec portfolio. In addition, we sold our 25% interest in 18 King Street in Toronto. As a result of these sales, we recognized a gain of $62 million in the second quarter of 2007. Subsequent to the sale of Waterview in the second quarter of 2007, we received $1 million of residual payments, resulting in additional gain in the third quarter of 2007. During the first quarter of 2007, we sold our 50% interest in Atrium on Bay in Toronto as well as our 25% interest in both 2200 Walkley and 2204 Walkley in Ottawa. As a result of these sales, we recognized a gain of $47 million. Excluding gains, non‐controlling interests and future income taxes, income attributable to discontinued operations was $2 million and $13 million for the three and nine months ended September 30, 2007. The following table summarizes the income from discontinued operations: Three months ended Sept. 30 Nine months ended Sept. 30(Millions) 2008 2007 2008 2007
Revenue $ 7 $ 18 $ 35 $ 56Operating expenses (4) (7) (16) (23)
3 11 19 33Interest expense (1) (5) (10) (14)
Funds from operations 2 6 9 19Depreciation and amortization ― (4) (2) (6)
Income from discontinued operations before gains, non‐controlling interests and taxes 2 2 7 13 Gain on sale of commercial properties 164 7 164 116Non‐controlling interests ― ― ― (31)Future income taxes (37) (2) (37) (29)
Income from discontinued operations $ 129 $ 7 $ 134 $ 69

Brookfield Properties Corporation 37
SEGMENTED INFORMATION The company and its subsidiaries operate in the U.S. and Canada within the commercial property and the residential development businesses. The commercial markets in which we operate are primarily New York, Boston, Washington, D.C., Houston, Los Angeles, Denver and Minneapolis in the U.S., and Toronto, Calgary and Ottawa in Canada. Approximately 80% of our commercial property net operating income is derived from the U.S. Our residential development operations are focused in five markets: Alberta and Ontario in Canada and Colorado, Texas and Kansas City in the U.S. Details of the segmented financial information for our principal areas of business are as follows: Commercial Residential United States Canada Development Total
(Millions) Sept. 30,
2008 Dec. 31,
2007 Sept. 30,
2008 Dec. 31,
2007 Sept. 30,
2008 Dec. 31,
2007 Sept. 30,
2008 Dec. 31,
2007
Assets Commercial properties $ 13,438 $ 13,498 $ 2,014 $ 2,391 $ ― $ ― $ 15,452 $ 15,889Development properties 585 676 646 496 1,285 1,228 2,516 2,400Receivables and other 599 569 146 195 252 292 997 1,056Intangible assets 659 719 31 40 ― ― 690 759Restricted cash and deposits 120 146 1 2 4 3 125 151Cash and cash equivalents 110 134 107 74 3 6 220 214Assets related to discontinued
operations 129 ― ― 4 ― ― 129 4
Total $ 15,640 $ 15,742 $ 2,945 $ 3,202 $ 1,544 $ 1,529 $ 20,129 $ 20,473
Details of the segmented financial information for our principal areas of business for the three months ended September 30, 2008 are as follows: Commercial Residential United States Canada Development Total
(Millions) 2008 2007 2008 2007 2008 2007 2008 2007
Revenues $ 456 $ 434 $ 110 $ 104 $ 138 $ 140 $ 704 $ 678Expenses 198 171 40 43 93 97 331 311
258 263 70 61 45 43 373 367Interest and other income 3 6 7 3 4 4 14 13
Net operating income from continuing operations 261 269 77 64 49 47 387 380
Interest expense Commercial property debt 152 167 11 6 ― ― 163 173Capital securities – corporate 3 2 12 13 ― ― 15 15Capital securities – fund subsidiaries (5) (8) ― ― ― ― (5) (8)
General and administrative 15 13 10 10 ― ― 25 23Transaction costs ― 31 ― 4 ― ― ― 35Non‐controlling interests
Fund subsidiaries (10) (12) ― ― ― ― (10) (12)Other subsidiaries ― ― 4 6 ― ― 4 6
Depreciation and amortization 113 116 17 17 ― ― 130 133
Income before unallocated costs (7) (40) 23 8 49 47 65 15Future income taxes 20 19
Net income from continuing operations $ 45 $ (4)Discontinued operations 4 14 125 (7) ― ― 129 7
Net income $ 174 $ 3
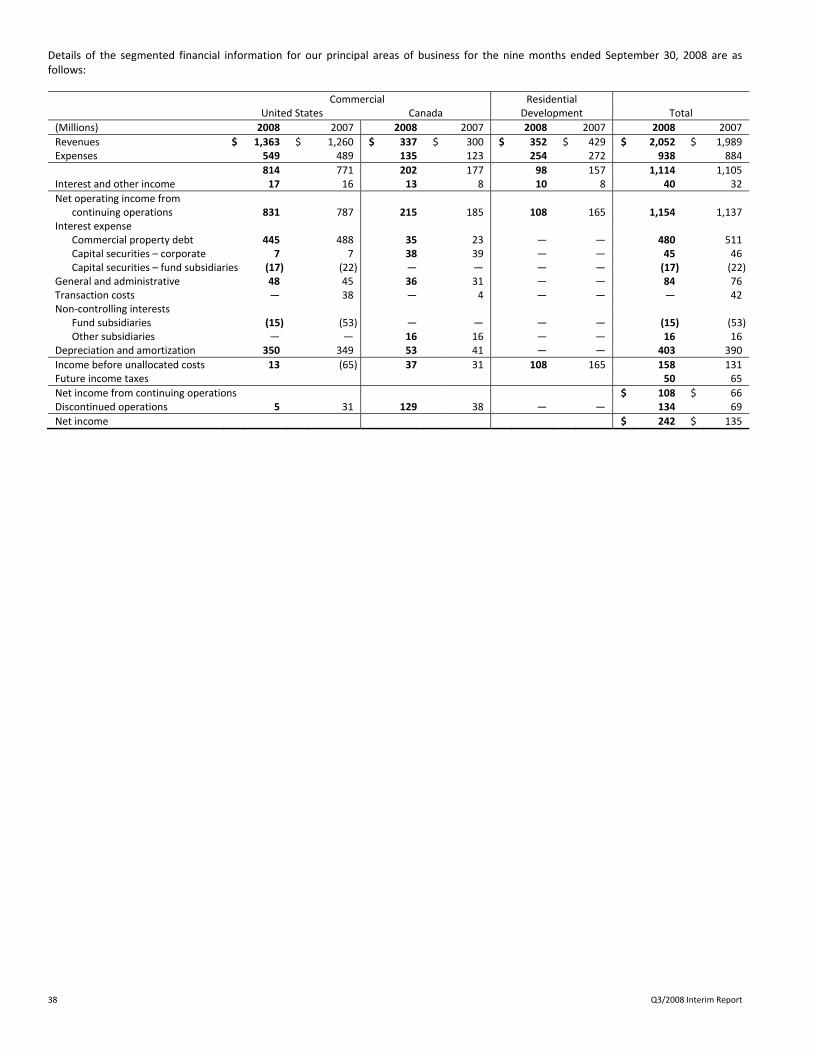
38 Q3/2008 Interim Report
Details of the segmented financial information for our principal areas of business for the nine months ended September 30, 2008 are as follows: Commercial Residential United States Canada Development Total
(Millions) 2008 2007 2008 2007 2008 2007 2008 2007
Revenues $ 1,363 $ 1,260 $ 337 $ 300 $ 352 $ 429 $ 2,052 $ 1,989Expenses 549 489 135 123 254 272 938 884
814 771 202 177 98 157 1,114 1,105Interest and other income 17 16 13 8 10 8 40 32
Net operating income from continuing operations 831 787 215 185 108 165 1,154 1,137
Interest expense Commercial property debt 445 488 35 23 ― ― 480 511Capital securities – corporate 7 7 38 39 ― ― 45 46Capital securities – fund subsidiaries (17) (22) ― ― ― ― (17) (22)
General and administrative 48 45 36 31 ― ― 84 76Transaction costs ― 38 ― 4 ― ― ― 42Non‐controlling interests
Fund subsidiaries (15) (53) ― ― ― ― (15) (53)Other subsidiaries ― ― 16 16 ― ― 16 16
Depreciation and amortization 350 349 53 41 ― ― 403 390
Income before unallocated costs 13 (65) 37 31 108 165 158 131Future income taxes 50 65
Net income from continuing operations $ 108 $ 66Discontinued operations 5 31 129 38 ― ― 134 69
Net income $ 242 $ 135

Brookfield Properties Corporation 39
QUARTERLY RESULTS The 2008, 2007 and 2006 results by quarter are as follows: 2008 2007
(1)2006
(1)
(Millions, except per share amounts) Q3 Q2 Q1 Q4 Q3 Q2 Q1 Q4 Q3 Q2 Q1
Total Revenue $ 718 $ 719 $ 655 $ 834 $ 691 $ 706 $ 624 $ 676 $ 408 $ 401 $ 374
Net operating income Commercial property operations 328 345 343 322 324 317 307 305 174 171 162Residential development operations 45 35 18 80 43 72 42 51 37 31 25Interest and other 14 16 10 12 13 10 9 14 9 8 13
387 396 371 414 380 399 358 370 220 210 200Expenses Interest
Commercial property debt 163 153 164 170 173 169 169 188 79 76 71Capital securities – corporate 15 15 15 15 15 16 15 13 13 13 14
Capital securities – fund subsidiaries (5) (4) (8) (5) (8) (5) (9) (12) ― ― ― General and administrative 25 30 29 27 23 24 29 23 15 14 15Transaction costs
Debt defeasance ― ― ― ― 27 ― ― ― ― ― ―
Other ― ― ― 2 8 3 4 15 ― ― ― Non‐controlling interests
Fund subsidiaries (10) (3) (2) (22) (12) (31) (10) (21) ― ― ― Other subsidiaries 4 6 6 7 6 6 4 4 7 4 4Depreciation and amortization 130 136 137 136 133 134 123 134 46 46 39Future income taxes 20 21 9 4 19 28 18 6 23 36 27
Net income from continuing operations $ 45 $ 42 $ 21 $ 80 $ (4) $ 55 $ 15 $ 20 $ 37 $ 21 $ 30Discontinued operations
(2) 129 3 2 25 7 24 38 1 (2) 9 19
Net income $ 174 $ 45 $ 23 $ 105 $ 3 $ 79 $ 53 $ 21 $ 35 $ 30 $ 49
Net income per share – basic Continuing operations $ 0.11 $ 0.11 $ 0.05 $ 0.20 $ (0.02) $ 0.15 $ 0.03 $ 0.06 $ 0.11 $ 0.05 $ 0.09
Discontinued operations(2) 0.33 ― 0.01 0.07 0.02 0.05 0.10 ― (0.01) 0.03 0.05
$ 0.44 $ 0.11 $ 0.06 $ 0.27 $ ― $ 0.20 $ 0.13 $ 0.06 $ 0.10 $ 0.08 $ 0.14
Net income per share – diluted Continuing operations $ 0.11 $ 0.11 $ 0.05 $ 0.20 $ (0.02) $ 0.15 $ 0.03 $ 0.06 $ 0.10 $ 0.05 $ 0.09
Discontinued operations(2) 0.33 ― 0.01 0.07 0.02 0.05 0.10 ― (0.01) 0.03 0.05
$ 0.44 $ 0.11 $ 0.06 $ 0.27 $ ― $ 0.20 $ 0.13 $ 0.06 $ 0.09 $ 0.08 $ 0.14
Funds from operations per share – diluted Continuing operations $ 0.38 $ 0.39 $ 0.31 $ 0.45 $ 0.34 $ 0.41 $ 0.31 $ 0.33 $ 0.29 $ 0.28 $ 0.27
Discontinued operations(2) ― 0.01 0.01 0.02 0.02 0.01 0.01 0.01 0.02 0.02 0.02
Property disposition gains(2) 0.41 ― ― 0.05 0.02 0.06 0.11 ― ― 0.04 0.09
$ 0.79 $ 0.40 $ 0.32 $ 0.52 $ 0.38 $ 0.48 $ 0.43 $ 0.34 $ 0.31 $ 0.34 $ 0.38(1)Per share amounts restated to include the effect of the three‐for‐two common stock split effective May 4, 2007
(2)All quarters presented are net of non‐controlling interests
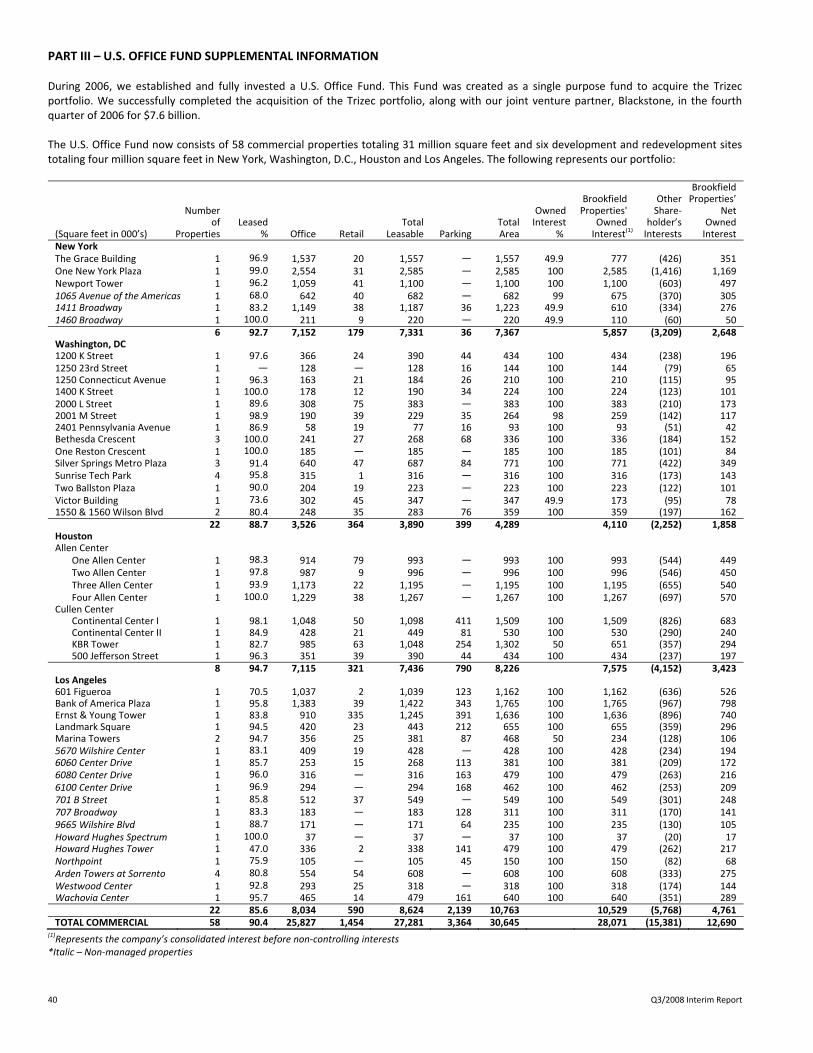
40 Q3/2008 Interim Report
PART III – U.S. OFFICE FUND SUPPLEMENTAL INFORMATION During 2006, we established and fully invested a U.S. Office Fund. This Fund was created as a single purpose fund to acquire the Trizec portfolio. We successfully completed the acquisition of the Trizec portfolio, along with our joint venture partner, Blackstone, in the fourth quarter of 2006 for $7.6 billion. The U.S. Office Fund now consists of 58 commercial properties totaling 31 million square feet and six development and redevelopment sites totaling four million square feet in New York, Washington, D.C., Houston and Los Angeles. The following represents our portfolio: Brookfield Brookfield Other Properties’ Number Owned Properties' Share‐ Net of Leased Total Total Interest Owned holder’s Owned(Square feet in 000’s) Properties % Office Retail Leasable Parking Area % Interest
(1) Interests Interest
New York The Grace Building 1 96.9 1,537 20 1,557 ― 1,557 49.9 777 (426) 351One New York Plaza 1 99.0 2,554 31 2,585 ― 2,585 100 2,585 (1,416) 1,169Newport Tower 1 96.2 1,059 41 1,100 ― 1,100 100 1,100 (603) 4971065 Avenue of the Americas 1 68.0 642 40 682 ― 682 99 675 (370) 3051411 Broadway 1 83.2 1,149 38 1,187 36 1,223 49.9 610 (334) 2761460 Broadway 1 100.0 211 9 220 ― 220 49.9 110 (60) 50 6 92.7 7,152 179 7,331 36 7,367 5,857 (3,209) 2,648Washington, DC 1200 K Street 1 97.6 366 24 390 44 434 100 434 (238) 1961250 23rd Street 1 ― 128 ― 128 16 144 100 144 (79) 651250 Connecticut Avenue 1 96.3 163 21 184 26 210 100 210 (115) 951400 K Street 1 100.0 178 12 190 34 224 100 224 (123) 1012000 L Street 1 89.6 308 75 383 ― 383 100 383 (210) 1732001 M Street 1 98.9 190 39 229 35 264 98 259 (142) 1172401 Pennsylvania Avenue 1 86.9 58 19 77 16 93 100 93 (51) 42Bethesda Crescent 3 100.0 241 27 268 68 336 100 336 (184) 152One Reston Crescent 1 100.0 185 ― 185 ― 185 100 185 (101) 84Silver Springs Metro Plaza 3 91.4 640 47 687 84 771 100 771 (422) 349Sunrise Tech Park 4 95.8 315 1 316 ― 316 100 316 (173) 143Two Ballston Plaza 1 90.0 204 19 223 ― 223 100 223 (122) 101Victor Building 1 73.6 302 45 347 ― 347 49.9 173 (95) 781550 & 1560 Wilson Blvd 2 80.4 248 35 283 76 359 100 359 (197) 162 22 88.7 3,526 364 3,890 399 4,289 4,110 (2,252) 1,858Houston Allen Center One Allen Center 1 98.3 914 79 993 ― 993 100 993 (544) 449 Two Allen Center 1 97.8 987 9 996 ― 996 100 996 (546) 450 Three Allen Center 1 93.9 1,173 22 1,195 ― 1,195 100 1,195 (655) 540 Four Allen Center 1 100.0 1,229 38 1,267 ― 1,267 100 1,267 (697) 570Cullen Center Continental Center I 1 98.1 1,048 50 1,098 411 1,509 100 1,509 (826) 683 Continental Center II 1 84.9 428 21 449 81 530 100 530 (290) 240 KBR Tower 1 82.7 985 63 1,048 254 1,302 50 651 (357) 294 500 Jefferson Street 1 96.3 351 39 390 44 434 100 434 (237) 197 8 94.7 7,115 321 7,436 790 8,226 7,575 (4,152) 3,423Los Angeles 601 Figueroa 1 70.5 1,037 2 1,039 123 1,162 100 1,162 (636) 526Bank of America Plaza 1 95.8 1,383 39 1,422 343 1,765 100 1,765 (967) 798Ernst & Young Tower 1 83.8 910 335 1,245 391 1,636 100 1,636 (896) 740Landmark Square 1 94.5 420 23 443 212 655 100 655 (359) 296Marina Towers 2 94.7 356 25 381 87 468 50 234 (128) 1065670 Wilshire Center 1 83.1 409 19 428 ― 428 100 428 (234) 1946060 Center Drive 1 85.7 253 15 268 113 381 100 381 (209) 1726080 Center Drive 1 96.0 316 ― 316 163 479 100 479 (263) 2166100 Center Drive 1 96.9 294 ― 294 168 462 100 462 (253) 209701 B Street 1 85.8 512 37 549 ― 549 100 549 (301) 248707 Broadway 1 83.3 183 ― 183 128 311 100 311 (170) 1419665 Wilshire Blvd 1 88.7 171 ― 171 64 235 100 235 (130) 105Howard Hughes Spectrum 1 100.0 37 ― 37 ― 37 100 37 (20) 17Howard Hughes Tower 1 47.0 336 2 338 141 479 100 479 (262) 217Northpoint 1 75.9 105 ― 105 45 150 100 150 (82) 68Arden Towers at Sorrento 4 80.8 554 54 608 ― 608 100 608 (333) 275Westwood Center 1 92.8 293 25 318 ― 318 100 318 (174) 144Wachovia Center 1 95.7 465 14 479 161 640 100 640 (351) 289 22 85.6 8,034 590 8,624 2,139 10,763 10,529 (5,768) 4,761TOTAL COMMERCIAL 58 90.4 25,827 1,454 27,281 3,364 30,645 28,071 (15,381) 12,690
(1)Represents the company’s consolidated interest before non‐controlling interests
*Italic – Non‐managed properties

Brookfield Properties Corporation 41
Brookfield Brookfield Properties’ Number Owned Properties' Other Net of Total Interest Owned Shareholder’s Owned(Square feet in 000’s) Sites Area % Interest(1) Interests Interest
Washington, D.C. Reston Crescent 1 1,000 100 1,000 (548) 452 Waterview 1 300 25 75 (41) 34
2 1,300 1,075 (589) 486Houston 1500 Smith Street 1 500 100 500 (274) 226 Allen Center Garage 1 500 100 500 (274) 226 Five Allen Center 1 1,200 100 1,200 (656) 544
3 2,200 2,200 (1,204) 996
TOTAL DEVELOPMENT 5 3,500 3,275 (1,793) 1,482REDEVELOPMENT 1225 Connecticut Avenue, Washington, D.C. 1 269 100 269 (147) 122
TOTAL DEVELOPMENT AND REDEVELOPMENT 6 3,769 3,544 (1,940) 1,604
(1)Represents the company’s consolidated interest before non‐controlling interests
Our 45% economic interest in the Trizec portfolio was initially purchased for $857 million, after the assumption of debt and acquisition financing totaling $3.7 billion, in the fourth quarter of 2006. At September 30, 2008, the impact of our investment in the U.S. Office Fund on our consolidated financial condition and results can be summarized as follows: Funds from Operations Three months ended Sept. 30 Nine months ended Sept. 30(Millions) Balance Sheet 2008 2007 2008 2007
Midtown New York, New York $ 1,250 $ 18 $ 18 $ 59 $ 60Downtown New York, New York 1,270 24 27 72 77Washington, D.C. 1,123 23 25 68 76Houston, Texas 1,124 20 24 70 67Los Angeles, California 2,608 44 44 138 132
7,375 129 138 407 412Property management and leasing fee income ― ― 1 2 1Development properties 248 ― ― ― ―
Total book value / Net operating income 7,623 129 139 409 413Property specific and subsidiary debt / Interest expense (5,732) (73) (98) (220) (292)Partner capital (debt and equity) / Interest expense and non‐controlling interests (950) (30) (24)
(103) (65)
Total 944 26 17 86 56Other assets (liabilities), net / Other income (expenses), net (115) 2 5 7 12
Invested capital / Funds from operations(1) $ 826 $ 28 $ 22 $ 93 $ 68(1)Fees paid by the Fund to Brookfield Properties are eliminated on consolidation. For the three and nine months ended September 30, 2008, a total of $7 million and $24 million of fees, respectively, were paid to Brookfield Properties (2007 ‐ $8 million and $23 million) which resulted in a reduction of non‐controlling interests expense of $5 million and $15 million, respectively (2007 ‐ $5 million and $13 million) representing the net fees earned from partners
The U.S. Office Fund contributed $231 million and $686 million of commercial property revenue and $129 million and $409 million of net operating income during the three and nine months ended September 30, 2008, respectively, as follows: Three months ended Sept. 30 Nine months ended Sept. 30(Millions) 2008 2007 2008 2007
Commercial property revenue Revenue from current properties $ 196 $ 187 $ 574 $ 541 Straight‐line rental income 9 9 27 33 Intangible amortization 26 32 85 93
Total commercial property revenue 231 228 686 667Property operating costs (102) (89) (277) (254)
Commercial property net operating income $ 129 $ 139 $ 409 $ 413
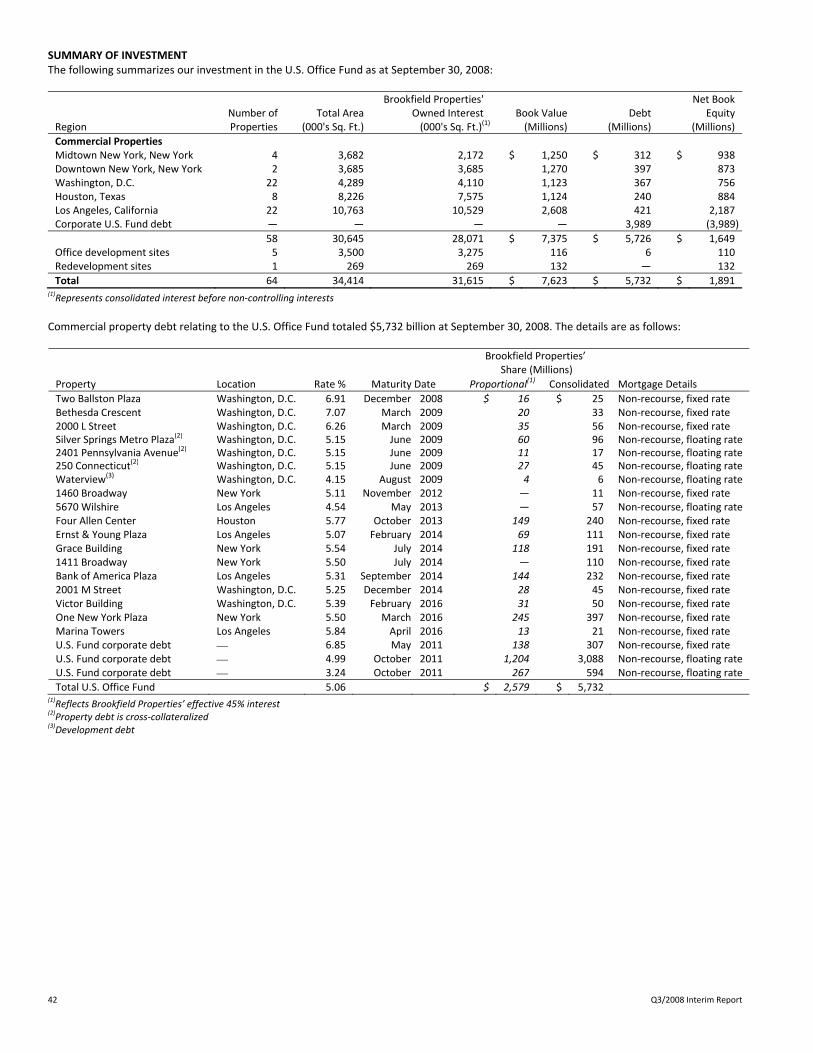
42 Q3/2008 Interim Report
SUMMARY OF INVESTMENT The following summarizes our investment in the U.S. Office Fund as at September 30, 2008: Brookfield Properties' Net Book Number of Total Area Owned Interest Book Value Debt EquityRegion Properties (000's Sq. Ft.) (000's Sq. Ft.)(1) (Millions) (Millions) (Millions)
Commercial Properties Midtown New York, New York 4 3,682 2,172 $ 1,250 $ 312 $ 938Downtown New York, New York 2 3,685 3,685 1,270 397 873Washington, D.C. 22 4,289 4,110 1,123 367 756Houston, Texas 8 8,226 7,575 1,124 240 884Los Angeles, California 22 10,763 10,529 2,608 421 2,187Corporate U.S. Fund debt ― ― ― ― 3,989 (3,989)
58 30,645 28,071 $ 7,375 $ 5,726 $ 1,649Office development sites 5 3,500 3,275 116 6 110Redevelopment sites 1 269 269 132 ― 132
Total 64 34,414 31,615 $ 7,623 $ 5,732 $ 1,891(1)Represents consolidated interest before non‐controlling interests
Commercial property debt relating to the U.S. Office Fund totaled $5,732 billion at September 30, 2008. The details are as follows:
Property Location Rate % Maturity Date
Brookfield Properties’ Share (Millions)
Mortgage Details Proportional(1) Consolidated
Two Ballston Plaza Washington, D.C. 6.91 December 2008 $ 16 $ 25 Non‐recourse, fixed rateBethesda Crescent Washington, D.C. 7.07 March 2009 20 33 Non‐recourse, fixed rate2000 L Street Washington, D.C. 6.26 March 2009 35 56 Non‐recourse, fixed rateSilver Springs Metro Plaza(2) Washington, D.C. 5.15 June 2009 60 96 Non‐recourse, floating rate2401 Pennsylvania Avenue(2) Washington, D.C. 5.15 June 2009 11 17 Non‐recourse, floating rate250 Connecticut(2) Washington, D.C. 5.15 June 2009 27 45 Non‐recourse, floating rateWaterview(3) Washington, D.C. 4.15 August 2009 4 6 Non‐recourse, floating rate1460 Broadway New York 5.11 November 2012 ― 11 Non‐recourse, fixed rate5670 Wilshire Los Angeles 4.54 May 2013 ― 57 Non‐recourse, floating rateFour Allen Center Houston 5.77 October 2013 149 240 Non‐recourse, fixed rateErnst & Young Plaza Los Angeles 5.07 February 2014 69 111 Non‐recourse, fixed rateGrace Building New York 5.54 July 2014 118 191 Non‐recourse, fixed rate1411 Broadway New York 5.50 July 2014 ― 110 Non‐recourse, fixed rateBank of America Plaza Los Angeles 5.31 September 2014 144 232 Non‐recourse, fixed rate2001 M Street Washington, D.C. 5.25 December 2014 28 45 Non‐recourse, fixed rateVictor Building Washington, D.C. 5.39 February 2016 31 50 Non‐recourse, fixed rateOne New York Plaza New York 5.50 March 2016 245 397 Non‐recourse, fixed rateMarina Towers Los Angeles 5.84 April 2016 13 21 Non‐recourse, fixed rateU.S. Fund corporate debt 6.85 May 2011 138 307 Non‐recourse, fixed rateU.S. Fund corporate debt 4.99 October 2011 1,204 3,088 Non‐recourse, floating rateU.S. Fund corporate debt 3.24 October 2011 267 594 Non‐recourse, floating rate
Total U.S. Office Fund 5.06 $ 2,579 $ 5,732 (1)Reflects Brookfield Properties’ effective 45% interest
(2)Property debt is cross‐collateralized
(3)Development debt

Brookfield Properties Corporation 43
PART IV – CANADIAN OFFICE FUND SUPPLEMENTAL INFORMATION During 2005, we established and fully invested a Canadian Office Fund. This Fund was created as a single purpose fund to acquire the O&Y portfolio. We successfully completed the acquisition of the O&Y portfolio in the fourth quarter of 2005 for $1.8 billion. The Canadian Office Fund, at the time of acquisition, consisted of 27 commercial properties totaling 11 million square feet in Toronto, Calgary, Ottawa, Edmonton and Winnipeg. However, certain of these properties, which were considered non‐core, have been disposed of in various quarters since the second quarter of 2006 and the Canadian Office Fund now consists of 12 commercial properties totaling eight million square feet primarily in Toronto, Calgary, Ottawa and Edmonton. The following represents our Canadian Office Fund portfolio as of September 30, 2008: Brookfield Brookfield Other Properties’ Number Owned Properties' Share‐ Net of Leased Total Total Interest Owned holder’s Owned(Square feet in 000’s) Properties % Office Retail Leasable Parking Area % Interest(1) Interests Interest
Toronto First Canadian Place 1 97.2 2,379 232 2,611 170 2,781 25 695 (76) 6192 Queen Street East 1 98.6 448 16 464 81 545 25 136 (15) 121151 Yonge Street 1 94.7 289 10 299 72 371 25 93 (10) 83
3 97.2 3,116 258 3,374 323 3,697 924 (101) 823Calgary Altius Centre 1 98.1 303 3 306 72 378 25 95 (11) 84
1 98.1 303 3 306 72 378 95 (11) 84Ottawa Place de Ville I 2 97.0 569 18 587 502 1,089 25 272 (30) 242Place de Ville II 2 99.3 591 19 610 433 1,043 25 261 (29) 232Jean Edmonds Towers 2 100.0 541 12 553 95 648 25 162 (18) 144
6 98.7 1,701 49 1,750 1,030 2,780 695 (77) 618Other Commercial Canadian Western Bank,
Edmonton 1 99.8 371 36 407 91 498 25 125 (14) 111 Enbridge Tower, Edmonton 1 100.0 184 ― 184 30 214 25 54 (7) 47
2 99.8 555 36 591 121 712 179 (21) 158
TOTAL COMMERCIAL 12 98.0 5,675 346 6,021 1,546 7,567 1,893 (210) 1,683
(1)Represents the company’s consolidated interest before non‐controlling interests
Brookfield Brookfield Number Owned Properties' Other Properties’ of Total Interest Owned Shareholder’s Net Owned(Square feet in 000’s) Sites Area % Interest(1) Interests Brookfield
Ottawa 300 Queen Street 1 577 25 144 (16) 128
TOTAL DEVELOPMENT 1 577 144 (16) 128(1)Represents the company’s consolidated interest before non‐controlling interests

44 Q3/2008 Interim Report
At September 30, 2008, the impact of our investment in the Canadian Office Fund can be summarized as follows: Funds from Operations Three months ended Sept. 30 Nine months ended Sept. 30(Millions) Balance Sheet 2008 2007 2008 2007
Toronto, Ontario $ 249 $ 6 $ 6 $ 18 $ 16Calgary, Alberta 19 1 ― 3 2Ottawa, Ontario 95 2 2 6 5Edmonton, Alberta and other 16 1 1 3 2
379 10 9 30 25Development properties 3 ― ― ― ―
Total book value / Net operating income 382 10 9 30 25Property specific and subsidiary debt / Interest expense (155) (2) (3) (6) (8)
227 8 6 24 17Other assets (liabilities), net / Other income (expenses), net (54) ― ― ― ―
Net investment / Funds from operations prior to fee income 173 8 6 24 17Fee income ― 2 1 6 6
Invested capital / Funds from operations $ 173 $ 10 $ 7 $ 30 $ 23
The Canadian Office Fund contributed $22 million and $64 million of commercial property revenue and $12 million and $36 million of net operating income from continuing operations during the three and nine months ended September 30, 2008, respectively (2007 – $20 million and $59 million, and $9 million and $25 million, respectively) as follows: Three months ended Sept. 30 Nine months ended Sept. 30(Millions) 2008 2007 2008 2007
Commercial property revenue Revenue from current properties $ 18 $ 18 $ 53 $ 48 Straight‐line rental income ― ― ― ― Intangible amortization 2 1 5 5
20 19 58 53 Recurring fee income 2 1 6 6
Total commercial property revenue 22 20 64 59Property operating costs (10) (11) (28) (34)
Commercial property net operating income $ 12 $ 9 $ 36 $ 25
SUMMARY OF INVESTMENT The following summarizes our investment in the Canadian Office Fund as at September 30, 2008: Brookfield Properties' Net Book Number of Total Area Owned Interest Book Value Debt EquityRegion Properties (000's Sq. Ft.) (000's Sq. Ft.)(1) (Millions) (Millions) (Millions)
Commercial Properties Toronto, Ontario 3 3,697 924 $ 249 $ 97 $ 152Calgary, Alberta 1 378 95 19 19 ―Ottawa, Ontario 6 2,780 695 95 23 72Other 2 712 179 16 16 ―
Continuing Operations 12 7,567 1,893 $ 379 $ 155 $ 224
Development sites Ottawa, Ontario 1 577 144 3 ― 3
Total 13 8,144 2,037 $ 382 $ 155 $ 227(1)Represents consolidated interest before non‐controlling interests
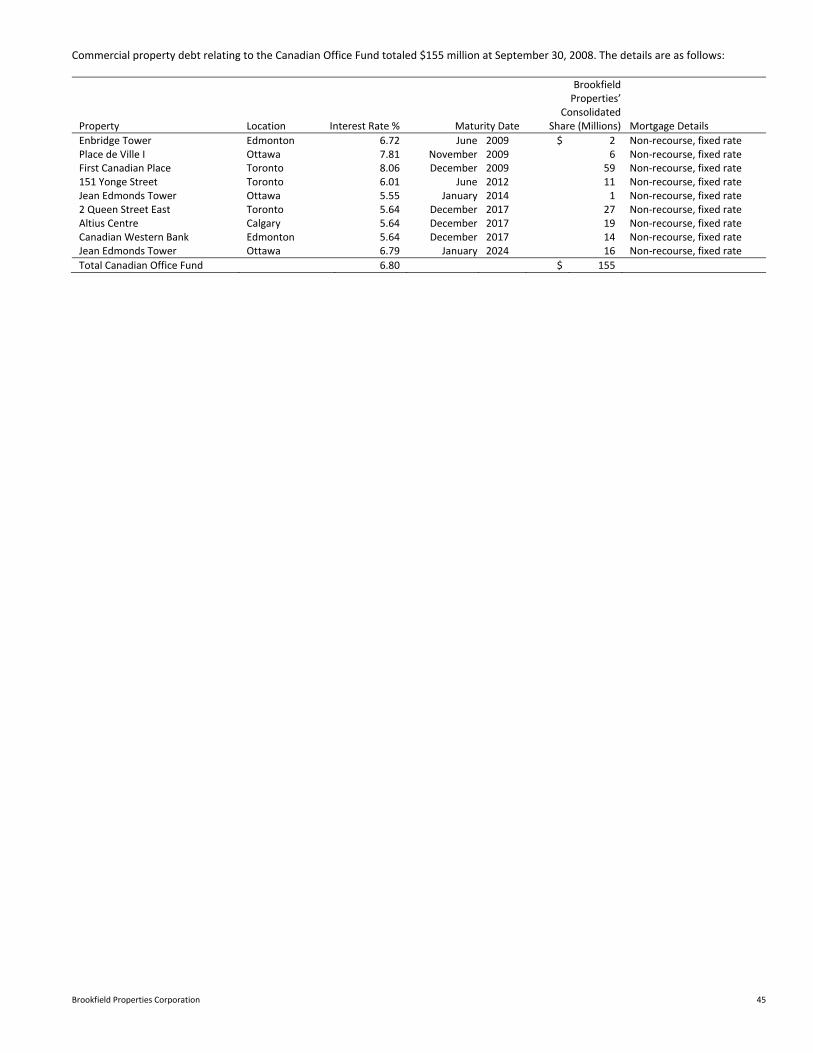
Brookfield Properties Corporation 45
Commercial property debt relating to the Canadian Office Fund totaled $155 million at September 30, 2008. The details are as follows:
Property Location Interest Rate % Maturity Date
Brookfield Properties’
Consolidated Share (Millions) Mortgage Details
Enbridge Tower Edmonton 6.72 June 2009 $ 2 Non‐recourse, fixed ratePlace de Ville I Ottawa 7.81 November 2009 6 Non‐recourse, fixed rateFirst Canadian Place Toronto 8.06 December 2009 59 Non‐recourse, fixed rate151 Yonge Street Toronto 6.01 June 2012 11 Non‐recourse, fixed rateJean Edmonds Tower Ottawa 5.55 January 2014 1 Non‐recourse, fixed rate2 Queen Street East Toronto 5.64 December 2017 27 Non‐recourse, fixed rateAltius Centre Calgary 5.64 December 2017 19 Non‐recourse, fixed rateCanadian Western Bank Edmonton 5.64 December 2017 14 Non‐recourse, fixed rateJean Edmonds Tower Ottawa 6.79 January 2024 16 Non‐recourse, fixed rate
Total Canadian Office Fund 6.80 $ 155

46 Q3/2008 Interim Report
PART V – RISKS AND UNCERTAINTIES Brookfield Properties’ financial results are impacted by the performance of our operations and various external factors influencing the specific sectors and geographic locations in which we operate; macro‐economic factors such as economic growth, changes in currency, inflation and interest rates; regulatory requirements and initiatives; and litigation and claims that arise in the normal course of business. Our strategy is to invest in premier assets which generate sustainable streams of cashflow. While high‐quality assets may initially generate lower returns on capital, we believe that the sustainability and future growth of their cashflows is more assured over the long term, and as a result, warrant higher valuation levels. We also believe that the high quality of our asset base protects the company against future uncertainty and enables us to invest with confidence when opportunities arise. The following is a review of the material factors and the potential impact these factors may have on the company’s business operations. A more detailed description of the business environment and risks is contained in our Annual Information Form which is posted on our Web site at www.brookfieldproperties.com or on www.sedar.com or www.sec.gov. PROPERTY RELATED RISKS Commercial properties Our strategy is to invest in high‐quality core office properties as defined by the physical characteristic of the asset and, more importantly, the certainty of receiving rental payments from large corporate tenants (with investment grade credit ratings – see “Credit Risk” below) which these properties attract. Nonetheless, we remain exposed to certain risks inherent in the core office property business. Commercial property investments are generally subject to varying degrees of risk depending on the nature of the property. These risks include changes in general economic conditions (such as the availability and costs of mortgage funds), local conditions (such as an oversupply of space or a reduction in demand for real estate in the markets in which we operate), the attractiveness of the properties to tenants, competition from other landlords with competitive space and our ability to provide adequate maintenance at an economical cost. Certain significant expenditures, including property taxes, maintenance costs, mortgage payments, insurance costs and related charges, must be made regardless of whether or not a property is producing sufficient income to service these expenses. Our core office properties are subject to mortgages which require substantial debt service payments. If we become unable or unwilling to meet mortgage payments on any property, losses could be sustained as a result of the mortgagee’s exercise of its rights of foreclosure or of sale. We believe the stability and long‐term nature of our contractual revenues effectively mitigates these risks. As owners and managers of premier office properties, lease roll‐overs also present a risk factor, as continued growth of rental income is dependent on strong leasing markets to ensure expiring leases are renewed and new tenants are found promptly to fill vacancies. Refer below to “Lease Roll‐Over Risk” for further details. Residential developments The markets within our residential development and home building operations have been favorable over the past five years with strong demand for well located building lots, particularly in Alberta. Our operations are concentrated in high growth areas which we believe have positive demographic and economic conditions. Nonetheless, the residential home building and development industry is cyclical and may be affected by changes in general and local economic conditions such as consumer confidence, job stability, availability of financing for home buyers and higher interest rates due to their impact on home buyers’ decisions. These conditions can affect the outlook of consumers and, in particular, the price and volume of home purchases. Furthermore, we are subject to risks related to the availability and cost of materials and labor, supply and cost of building lots, and adverse weather conditions that can cause delays in construction schedules and cost overruns. INTEREST RATE AND FINANCING RISK We attempt to stagger the maturities of our mortgage portfolio evenly over a 10‐year time horizon. We believe that this strategy will allow us to most effectively manage interest rate risk. As outlined under “Capital Resources and Liquidity,” beginning on page 26 of this MD&A, we have an on‐going obligation to access debt markets to refinance maturing debt as it comes due. There is a risk that lenders will not refinance such maturing debt on terms and conditions acceptable to us, or on any terms at all. Our strategy to stagger the maturities of our mortgage portfolio attempts to mitigate our exposure to excessive amounts of debt maturing in any one year. We have a floating rate bank credit facility of $500 million, the terms of which extend to 2009, and a floating rate term facility with BAM of $300 million, the terms of which extend through 2010. At September 30, 2008, the balances drawn on these facilities were $266 million and nil, respectively. We also have a floating rate term loan facility established at the time of the Trizec acquisition, the terms of which extend to 2009. The balance drawn on this facility as at September 30, 2008 was $104 million. There is a risk that bank lenders will not refinance these facilities on terms and conditions acceptable to us or on any terms at all. As a mitigating factor, we have been successful in negotiating extension options. The effect of a 25 basis point increase in interest rates on interest expense relating to the company’s corporate and commercial property floating rate debt, all else being equal, is an increase in interest expense of $13 million or approximately $6 million, net of non‐controlling interests or $0.02 per share on an annualized basis. Approximately 44% of the company’s outstanding commercial property debt at September 30, 2008 is floating rate debt (December 31, 2007 – 39%) and subject to fluctuations in interest rates. The effect of a 25 basis point increase in interest rates on interest expense relating to our corporate and commercial property floating rate debt, all else being
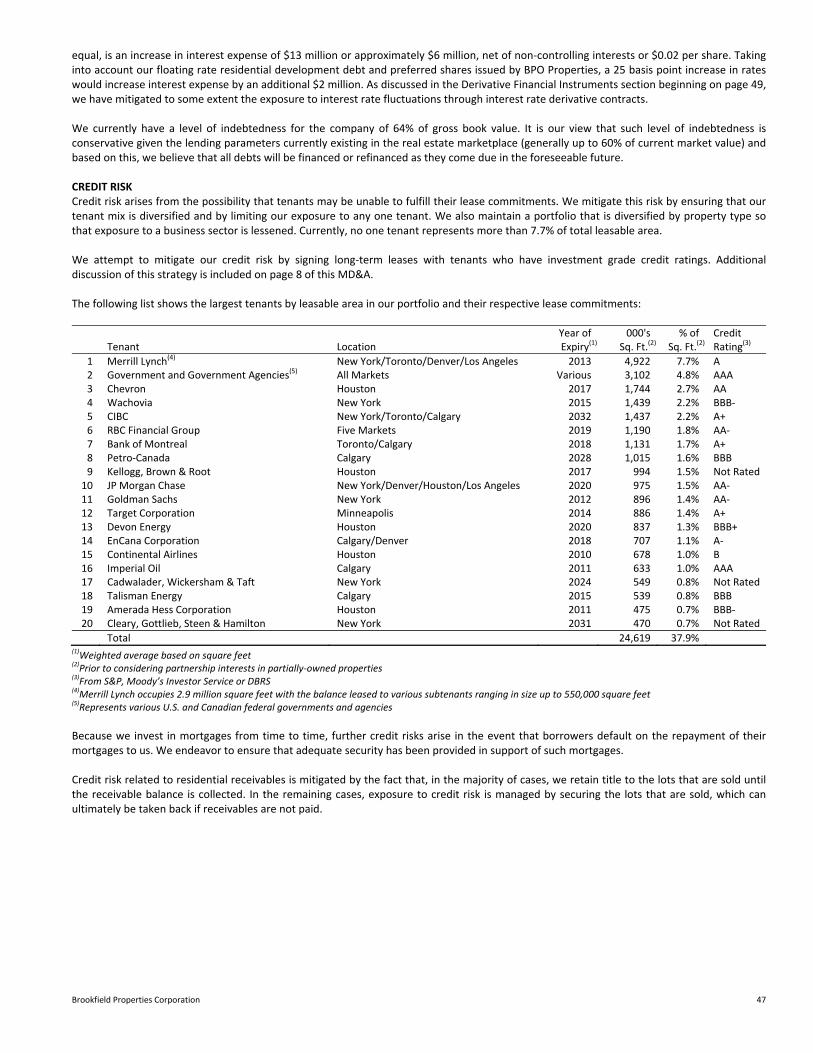
Brookfield Properties Corporation 47
equal, is an increase in interest expense of $13 million or approximately $6 million, net of non‐controlling interests or $0.02 per share. Taking into account our floating rate residential development debt and preferred shares issued by BPO Properties, a 25 basis point increase in rates would increase interest expense by an additional $2 million. As discussed in the Derivative Financial Instruments section beginning on page 49, we have mitigated to some extent the exposure to interest rate fluctuations through interest rate derivative contracts. We currently have a level of indebtedness for the company of 64% of gross book value. It is our view that such level of indebtedness is conservative given the lending parameters currently existing in the real estate marketplace (generally up to 60% of current market value) and based on this, we believe that all debts will be financed or refinanced as they come due in the foreseeable future. CREDIT RISK Credit risk arises from the possibility that tenants may be unable to fulfill their lease commitments. We mitigate this risk by ensuring that our tenant mix is diversified and by limiting our exposure to any one tenant. We also maintain a portfolio that is diversified by property type so that exposure to a business sector is lessened. Currently, no one tenant represents more than 7.7% of total leasable area. We attempt to mitigate our credit risk by signing long‐term leases with tenants who have investment grade credit ratings. Additional discussion of this strategy is included on page 8 of this MD&A. The following list shows the largest tenants by leasable area in our portfolio and their respective lease commitments: Year of 000's % of Credit
Tenant Location Expiry(1) Sq. Ft.(2) Sq. Ft.(2) Rating(3)
1 Merrill Lynch(4) New York/Toronto/Denver/Los Angeles 2013 4,922 7.7% A2 Government and Government Agencies(5) All Markets Various 3,102 4.8% AAA3 Chevron Houston 2017 1,744 2.7% AA4 Wachovia New York 2015 1,439 2.2% BBB‐5 CIBC New York/Toronto/Calgary 2032 1,437 2.2% A+6 RBC Financial Group Five Markets 2019 1,190 1.8% AA‐7 Bank of Montreal Toronto/Calgary 2018 1,131 1.7% A+8 Petro‐Canada Calgary 2028 1,015 1.6% BBB9 Kellogg, Brown & Root Houston 2017 994 1.5% Not Rated
10 JP Morgan Chase New York/Denver/Houston/Los Angeles 2020 975 1.5% AA‐11 Goldman Sachs New York 2012 896 1.4% AA‐12 Target Corporation Minneapolis 2014 886 1.4% A+13 Devon Energy Houston 2020 837 1.3% BBB+14 EnCana Corporation Calgary/Denver 2018 707 1.1% A‐15 Continental Airlines Houston 2010 678 1.0% B16 Imperial Oil Calgary 2011 633 1.0% AAA17 Cadwalader, Wickersham & Taft New York 2024 549 0.8% Not Rated18 Talisman Energy Calgary 2015 539 0.8% BBB19 Amerada Hess Corporation Houston 2011 475 0.7% BBB‐20 Cleary, Gottlieb, Steen & Hamilton New York 2031 470 0.7% Not Rated
Total 24,619 37.9%(1)Weighted average based on square feet
(2)Prior to considering partnership interests in partially‐owned properties
(3)From S&P, Moody’s Investor Service or DBRS
(4)Merrill Lynch occupies 2.9 million square feet with the balance leased to various subtenants ranging in size up to 550,000 square feet
(5)Represents various U.S. and Canadian federal governments and agencies
Because we invest in mortgages from time to time, further credit risks arise in the event that borrowers default on the repayment of their mortgages to us. We endeavor to ensure that adequate security has been provided in support of such mortgages. Credit risk related to residential receivables is mitigated by the fact that, in the majority of cases, we retain title to the lots that are sold until the receivable balance is collected. In the remaining cases, exposure to credit risk is managed by securing the lots that are sold, which can ultimately be taken back if receivables are not paid.

48 Q3/2008 Interim Report
LEASE ROLL‐OVER RISK Lease roll‐over risk arises from the possibility that we may experience difficulty renewing leases as they expire or in releasing space vacated by tenants upon early lease expiry. We attempt to stagger the lease expiry profile so that we are not faced with disproportionate amounts of space expiring in any one year; approximately 7% of our leases mature annually. We further mitigate this risk by maintaining a diversified portfolio mix by geographic location and by proactively leasing space in advance of its contractual expiry. Additional discussion of our strategy to manage lease roll‐over risk can be found on page 8 of this MD&A. The following table sets out lease expiries, by square footage, for our portfolio at September 30, 2008: Currently Remainder 2015 (000's Sq. Ft.) Available 2008 2009 2010 2011 2012 2013 2014 & Beyond Parking Total
Midtown New York 546 68 419 371 137 397 776 223 3,590 36 6,563Downtown New York 118 39 197 255 670 426 4,840 410 6,764 281 14,000Boston 107 18 171 125 454 48 32 30 1,005 276 2,266Washington, D.C. 456 107 468 291 195 586 366 1,226 1,924 970 6,589Los Angeles 1,239 119 446 829 1,021 1,418 871 645 2,036 2,139 10,763Houston 465 92 219 536 779 1,023 750 362 4,054 838 9,118Toronto 168 40 422 620 501 800 1,457 242 3,367 1,519 9,136Calgary 7 1 173 346 1,313 461 500 100 2,780 1,023 6,704Ottawa 22 17 38 7 4 6 1,103 9 544 1,030 2,780Denver 24 10 29 110 99 87 151 134 680 503 1,827Minneapolis 186 15 70 54 48 179 791 171 1,016 521 3,051Other 25 8 46 187 149 102 104 32 600 385 1,638
Total 3,363 534 2,698 3,731 5,370 5,533 11,741 3,584 28,360 9,521 74,435 5.2% 0.8% 4.2% 5.7% 8.3% 8.5% 18.1% 5.5% 43.7% 100.0%
ENVIRONMENTAL RISKS As an owner of real property, we are subject to various federal, provincial, state and municipal laws relating to environmental matters. Such laws provide that we could be liable for the costs of removing certain hazardous substances and remediating certain hazardous locations. The failure to remove or remediate such substances or locations, if any, could adversely affect our ability to sell such real estate or to borrow using such real estate as collateral and could potentially result in claims against us. We are not aware of any material non‐compliance with environmental laws at any of our properties nor are we aware of any pending or threatened investigations or actions by environmental regulatory authorities in connection with any of our properties or any pending or threatened claims relating to environmental conditions at our properties. We will continue to make the necessary capital and operating expenditures to ensure that we are compliant with environmental laws and regulations. Although there can be no assurances, we do not believe that costs relating to environmental matters will have a materially adverse effect on our business, financial condition or results of operations. However, environmental laws and regulations can change and we may become subject to more stringent environmental laws and regulations in the future, which could have an adverse effect on our business, financial condition or results of operations. OTHER RISKS AND UNCERTAINTIES Real estate is relatively illiquid. Such illiquidity may limit our ability to vary our portfolio promptly in response to changing economic or investment conditions. Also, financial difficulties of other property owners resulting in distressed sales could depress real estate values in the markets in which we operate. Our commercial properties generate a relatively stable source of income from contractual tenant rent payments. Continued growth of rental income is dependent on strong leasing markets to ensure expiring leases are renewed and new tenants are found promptly to fill vacancies. While the outlook for commercial office rents is positive in the long term, 2008 may not provide the same level of increases in rental rates on renewal as compared to previous years. We are, however, substantially protected against short‐term market conditions, as most of our leases are long‐term in nature with an average term of seven years. A protracted disruption in the economy, such as the onset of a severe recession, could place downward pressure on overall occupancy levels and net effective rents. Brookfield maintains insurance on its properties in amounts and with deductibles that we believe are in line with what owners of similar properties carry. We maintain all risk property insurance and rental value coverage (including coverage for the perils of flood, earthquake and named windstorm). Our all risk policy limit is $1.5 billion per occurrence. Our earthquake limit is $300 million per occurrence and in the annual aggregate for our California properties and a separate $300 million per occurrence and annual aggregate limit for all other properties. This coverage is subject to a deductible of 5% of the value of the affected property for California locations and $100,000 for all other locations. The named windstorm limit is $300 million per occurrence and in the annual aggregate subject to a deductible of 5% of the value of the affected property. The flood limit is $300 million per occurrence and in the annual aggregate subject to a deductible of $50,000 per occurrence. The Terrorism Risk Insurance Act (“TRIA”) was enacted in November 2002 in response to the uncertainty surrounding the insurance market in the aftermath of the terrorist attacks of September 11, 2001 and provides protection for “certified acts” as defined by the statute. TRIA mandates that insurance carriers offer insurance covering physical damage from terrorist incidents as certified by the U.S. Secretary of the
Brookfield Properties Corporation 49
Treasury. On December 22, 2005, the Terrorism Risk Insurance Extension Act of 2005 (the “Extension Act”) was enacted, which extended the duration of the Terrorism Risk Insurance Program until December 31, 2007. The Terrorism Risk Insurance Program Reauthorization Act of 2007 (“TRIPRA”) was signed into law on December 26, 2007. It extends the TRIA program through December 2014. TRIPRA effectively continues the Extension Act while removing the distinction between foreign and domestic acts of terrorism, among other provisions. For our U.S. Direct properties, our current all risk property insurance policy provides coverage for certified acts of terrorism up to $500 million per occurrence. In December 2005, we formed a wholly‐owned captive insurance company, Realrisk Insurance Corp. (“Realrisk”). Effective January 1, 2008 Realrisk provides $1 billion of TRIA coverage excess of the $500 million provided in the all risk property insurance policy noted above. Realrisk also provides protection against losses due solely to biological, chemical or radioactive contamination arising out of a certified terrorist act. In the event of a covered loss in 2008, we expect Realrisk to recover 85% of its losses, less certain deductibles, from the United States government with the remaining 15% to be funded by us. As a result of the merger with Trizec Properties, Inc. we acquired two wholly‐owned captive insurance companies: Chapman Insurance LLC (“Chapman”) and Concordia Insurance LLC (“Concordia”). Effective April 21, 2008, Chapman and Concordia provide coverage to our U.S. Office Fund properties for up to $500 million of losses resulting from a certified act of terrorism. In the event of a covered loss in 2008, we expect Chapman and Concordia to recover 85% of their losses, less certain deductibles from the U.S. government with the remaining 15% to be funded by us. In the fourth quarter of 2008 we will be restructuring and consolidating our TRIA captives into a segregated cell structure. Our Canada Direct properties are protected by a stand alone policy that covers all acts of terrorism for limits up to $1 billion. FOREIGN EXCHANGE FLUCTUATIONS Approximately 20% of our assets and 34% of our revenues originate in Canada and consequently are subject to foreign currency risk due to potential fluctuations in exchange rates between the Canadian dollar and the U.S. dollar. To mitigate this risk, we attempt to maintain a hedged position with respect to the carrying value of net assets denominated in Canadian dollars through debt agreements denominated in Canadian dollars and through the use of financial contracts as discussed below. However, even if we do so, the carrying value may not equal the economic value, and any differences therein may not be hedged. In addition, we attempt to mitigate the currency risk of revenues denominated in Canadian dollars through similar means. At September 30, 2008, based on our net Canadian dollar funds from operations, a $0.01 change in the Canadian dollar relative to the U.S. dollar would result in a change in our funds from operations of approximately $3 million on an annual basis. DERIVATIVE FINANCIAL INSTRUMENTS We utilize derivative financial instruments primarily to manage financial risks, including interest rate, commodity, equity price and foreign exchange risks. Hedge accounting is applied where the derivative is designated as a hedge of a specific exposure and there is reasonable assurance the hedge will be effective in offsetting an identified risk. Realized and unrealized gains and losses on forward foreign exchange contracts designated as hedges of currency risks are included in other comprehensive income when the currency risk being hedged relates to a net investment in a self‐sustaining subsidiary. Otherwise, realized and unrealized gains and losses on the effective portion of derivative financial instruments designated as cashflow hedges of financial risks are recorded in other comprehensive income and reclassified to income in the period the underlying hedged item impacts income. Derivatives that are not designated as hedges are carried at estimated fair values and gains and losses arising from changes in fair values are recognized in income as a component of interest and other income or general and administrative expense, depending on the type of derivative, in the period the changes occur. The use of non‐hedging derivative contracts is governed by documented risk management policies and approved limits. Our use of derivative financial instruments was limited to the transactions identified below. Unrealized gains and losses, representing the fair value of such contracts, are determined in reference to the appropriate interest rate curve or forward exchange rate for each contract and are reflected in receivables and other assets or accounts payable and other liabilities, as appropriate, on the balance sheet. In 2006, we entered into a series of interest rate cap contracts that are designated as hedges of interest rate exposure associated with variable rate debt issued in October 2006 in connection with the acquisition of Trizec. At September 30, 2008, there were contracts outstanding to cap the interest rate on a notional $3.1 billion of variable rate debt at 6.0% and $600 million of variable rate debt at 7.0% for a period of one year. The contracts have been recorded at fair value in receivables and other with changes in fair value reported in other comprehensive income for the effective portion of the hedge. Gains or losses associated with the caps are reclassified from accumulated other comprehensive income to interest expense in the periods the hedged interest payments occur. The ineffective portion of the change in fair value of these hedges recognized in net income is nil. The fair value of the contracts at September 30, 2008 was nil. The cost of these contracts was $1.2 million. In September 2007, we de‐designated hedge relationships associated with $350 million of the interest rate caps as they were no longer eligible for hedge accounting. The cumulative loss associated with the de‐designated contracts will be amortized out of accumulated other comprehensive income to interest expense as the previously hedged interest payments occur. Subsequent changes in fair value of the de‐designated contracts will be recorded in interest expense as they occur. In June 2007, we entered into a forward‐starting interest rate swap to hedge the interest rate risk associated with the anticipated issuance of fixed rate debt. The forward‐starting swap hedged a notional $350 million of fixed rate debt issuance at a rate of 5.824%. During the second quarter of 2008, we terminated the hedge relationship and settled the swap contract. A loss of $17 million, representing the loss on the swap at the date the hedge relationship was terminated net of non‐controlling interests, is recorded in accumulated other comprehensive income and will be amortized to interest expense over the term of the hedged debt. We recognized a gain of $4 million, net of non‐controlling

50 Q3/2008 Interim Report
interests, representing the favorable change in the value of the swap from the point the hedge relationship was terminated to the settlement of the swap. In July 2007, we entered into a forward starting interest rate swap to hedge the risk associated with debt of $700 million that was issued in August 2007. The contract was settled in August 2007 for a loss of $15 million. The loss was recorded in other comprehensive income and will be amortized to interest expense over the term of the hedged debt. In September 2007, the company entered into a total return swap under which it receives the returns on a notional 966,000 Brookfield Properties common shares as an economic hedge of its exposure to variability in share price under the Deferred Share Unit program. The fair value of the total return swap was nil and the change in fair value has been recorded in general and administrative expense. At September 30, 2008, we had foreign exchange contracts to sell a notional amount of C$800 million, maturing in December 2008, designated as hedges for accounting purposes to manage our foreign exchange risk in respect to our Canadian‐denominated net investments in self‐sustaining subsidiaries. The fair value of these contracts at September 30, 2008 resulted in no gain or loss. Our self‐sustaining subsidiaries also had foreign exchange contracts to sell a notional amount of US$21 million, maturing in December 2008, which have not been designated as hedges for financial reporting purposes. The fair value of these contracts at September 30, 2008 resulted in no gain or loss. The primary risks associated with our use of derivatives are credit risk and price risk. Credit risk is the risk that losses will be incurred from the default of the counterparty on its contractual obligations. The use of derivative contracts is governed by documented risk management policies and approved limits, which includes an evaluation of the creditworthiness of counterparties, as well as managing the size, diversification and maturity of the portfolio. Price risk is the risk that we will incur losses from derivatives from adverse changes in foreign exchange rates, interest rates or share prices. We mitigate price risk by entering only into derivative transactions where we have determined a significant offset exists between changes in the fair value of, or the cashflows attributable to, the hedged item and the hedging item.

Brookfield Properties Corporation 51
PART VI – CRITICAL ACCOUNTING POLICIES AND ESTIMATES CHANGES IN ACCOUNTING POLICIES Capital Disclosures On December 1, 2006, the Canadian Institute of Chartered Accountants (“the CICA”) issued Handbook Section 1535, “Capital Disclosures.” Section 1535 requires the disclosure of (i) an entity’s objectives, policies and process for managing capital; (ii) quantitative data about an entity’s managed capital; (iii) whether an entity has complied with capital requirements; and (iv) if an entity has not complied with such capital requirements, the consequences of such non‐compliance. The company adopted the requirements of Section 1535 on January 1, 2008 and the required disclosures are included in Note 23 to the unaudited interim financial statements. Financial Instruments – Disclosures and Presentation On December 1, 2006, the CICA issued two new accounting standards, Section 3862, “Financial Instruments – Disclosures” and Section 3863, “Financial Instruments – Presentation.” These standards replace Section 3861, “Financial Instruments – Disclosure and Presentation” and require additional disclosure of the nature and extent of risks arising from financial instruments and how the entity manages those risks. Certain disclosures required under Section 3862 were made in the notes to the annual consolidated financial statements for the year ended December 31, 2007 and do not differ materially at September 30, 2008. Additional disclosures required by Section 3862 have been made to the unaudited interim consolidated financial statements. The adoption of Section 3863 did not have any impact on the company’s consolidated financial statements. INTERNATIONAL FINANCIAL REPORTING STANDARDS In 2006, the Canadian Accounting Standards Board ("AcSB") published a new strategic plan that will significantly affect financial reporting requirements for Canadian companies. The AcSB strategic plan outlines the convergence of Canadian GAAP with International Financial Reporting Standards (“IFRS”) over an expected five‐year transitional period. In February 2008, the AcSB announced that 2011 is the changeover date for publicly accountable companies to use IFRS, replacing Canadian GAAP. Consequently, IFRS will be applicable for interim and annual financial statements relating to the fiscal periods beginning on or after January 1, 2011. The transition date of January 1, 2011 will require the restatement for comparative purposes of amounts reported by the company for the year ended December 31, 2010. While the company has begun assessing the adoption of IFRS for 2011, the financial reporting impact of the transition to IFRS cannot be reasonably estimated at this time. The company continues to monitor and assess the impact of the convergence of Canadian GAAP and IFRS as new standard changes are introduced over the transitional period. USE OF ESTIMATES The preparation of our financial statements requires management to make judgments, estimates and assumptions that affect the reported amounts of assets and liabilities, disclosure of contingent assets and liabilities at the date of the financial statements and the reported amounts of revenues and expenses during the reporting period. Our estimates are based on historical experience and on various other assumptions that are believed to be reasonable under the circumstances. The result of our ongoing evaluation of these estimates forms the basis for making judgments about the carrying values of assets and liabilities and the reported amounts of revenues and expenses that are not readily apparent from other sources. Actual results may differ from these estimates under different assumptions. RELATED‐PARTY TRANSACTIONS In the normal course of operations, we enter into various transactions on market terms with related parties which have been measured at exchange value and are recognized in the consolidated financial statements. At September 30, 2008, we had approximately $15 million (December 31, 2007 ‐ $15 million) of indebtedness outstanding to our parent company, BAM and its affiliates. Interest expense related to this indebtedness, totaled $1 million and $2 million for the three and nine months ended September 30, 2008, respectively, compared to $4 million and $12 million for the same periods in 2007, and was recorded at the exchange amount. Additionally, we renewed a $300 million line from BAM in the form of a two‐year revolving credit facility to December 2010. The outstanding balance on this facility at September 30, 2008 was nil. Included in rental revenues are amounts received from BAM, and its affiliates for the rental of office premises of $0.6 million and $1.8 million for the three and nine months ended September 30, 2008 respectively (2007 ‐ $0.4 million and $1.3 million, respectively). These amounts have been recorded at the exchange amount. In addition, we have certain arrangements with BAM and its affiliates to acquire insurance in the normal course and at market rates or at cost. The expense for the quarter ended September 30, 2008 was $1 million. ADDITIONAL INFORMATION A supplementary information package with more detailed financial information is posted on Brookfield Properties’ website at www.brookfieldproperties.com and should be read in conjunction with this Interim Report. Bryan K. Davis Senior Vice President and Chief Financial Officer October 29, 2008

52 Q3/2008 Interim Report
DISTRIBUTIONS Distributions paid by the company during the first three quarters of 2008 and the year 2007 are as follows: Three months ended Three months ended Three months ended Year ended Currency Sept. 30, 2008 Jun. 30, 2008 Mar. 31, 2008 Dec. 31, 2007
Common shares(1) US$ $ 0.1400 $ 0.1400 $ 0.1400 $ 0.5500Class A preferred shares(2) C$ 0.0208 0.0208 0.0208 0.0833Class AA Series E preferred shares C$ 0.1982 0.2305 0.2582 1.0178Class AAA Series E preferred shares C$ 0.2095 0.2125 0.2470 0.4830Class AAA Series F preferred shares C$ 0.3750 0.3750 0.3750 1.5000Class AAA Series G preferred shares US$ 0.3281 0.3281 0.3281 1.3125Class AAA Series H preferred shares C$ 0.3594 0.3594 0.3594 1.4375Class AAA Series I preferred shares C$ 0.3250 0.3250 0.3250 1.3000Class AAA Series J preferred shares C$ 0.3125 0.3125 0.3125 1.2500Class AAA Series K preferred shares C$ 0.3250 0.3250 0.3250 1.3000
(1)Per share amounts have been restated to reflect the impact of the three‐for‐two common stock split effective May 4, 2007
(2)Per share amounts have been restated to reflect the impact of the nine‐for‐four class A preferred share stock split effective May 4, 2007

Brookfield Properties Corporation 53
Consolidated Balance Sheets
(US Millions) Note Sept. 30, 2008
Unaudited Dec. 31, 2007
Audited
Assets Commercial properties 3 $ 15,452 $ 15,889Commercial developments 4 1,231 1,172Residential developments 5 1,285 1,228Receivables and other 6 997 1,056Intangible assets 7 690 759Restricted cash and deposits 8 125 151Cash and cash equivalents 24 220 214Assets related to discontinued operations 9 129 4
$ 20,129 $ 20,473
Liabilities Commercial property debt 10 $ 11,801 $ 12,125Accounts payable and other liabilities 11 1,293 1,357Intangible liabilities 12 753 834Future income tax liabilities 13 692 600Liabilities related to discontinued operations 9 115 3Capital securities – corporate 14 996 1,053Capital securities – fund subsidiaries 15 764 762Non‐controlling interests – fund subsidiaries 15 186 193Non‐controlling interests – other subsidiaries 16 73 86Preferred equity – subsidiaries 17 359 382Shareholders’ equity Preferred equity – corporate 18 45 45Common equity 3,052 3,033
$ 20,129 $ 20,473
See accompanying notes to the consolidated financial statements

54 Q3/2008 Interim Report
Consolidated Statements of Income Unaudited Three months ended Sept. 30 Nine months ended Sept. 30(US Millions, except per share amounts) Note 2008 2007 2008 2007
Total revenue 21 $ 718 $ 691 $ 2,092 $ 2,021
Net operating income Commercial property operations 21 $ 328 $ 324 $ 1,016 $ 948Residential development operations 21 45 43 98 157Interest and other 14 13 40 32
387 380 1,154 1,137
Expenses Interest Commercial property debt 163 173 480 511 Capital securities – corporate 14 15 15 45 46 Capital securities – fund subsidiaries 15 (5) (8) (17) (22)General and administrative 25 23 84 76Transaction costs ― 35 ― 42Non‐controlling interests Fund subsidiaries 15 (10) (12) (15) (53) Other subsidiaries 4 6 16 16Depreciation and amortization 130 133 403 390Future income taxes 13 20 19 50 65
Net income from continuing operations 45 (4) 108 66Discontinued operations 9 129 7 134 69
Net income $ 174 $ 3 $ 242 $ 135
Earnings per share – basic and diluted 19 Continuing operations $ 0.11 $ (0.02) $ 0.27 $ 0.16 Net income $ 0.44 $ ― $ 0.61 $ 0.33
See accompanying notes to the consolidated financial statements

Brookfield Properties Corporation 55
Consolidated Statements of Changes in Common Equity Unaudited Three months ended Sept. 30 Nine months ended Sept. 30(US Millions) Note 2008 2007 2008 2007
Common shares Balance, beginning of period $ 2,281 $ 2,301 $ 2,282 $ 2,303Shares repurchased (7) (13) (12) (19)Proceeds from shares issued on exercise of options 1 ― 5 4
Balance, end of period 19 2,275 2,288 2,275 2,288
Contributed surplus Balance, beginning of period ― ― ― 2Shares repurchased (2) (2) (5) (6)Stock‐based compensation awards 20 2 2 5 4
Balance, end of period ― ― ― ―
Retained earnings Balance, beginning of period 609 718 659 706Net income 174 3 242 135Shareholder distributions
Preferred share dividends – corporate (1) (2) (2) (3)Common share dividends (55) (56) (165) (161)
Amount paid in excess of the book value of common shares purchased for cancellation (14) (33) (21) (48)
Cumulative impact of changes in accounting policies, net of taxes of $1 million ― ― ― 1
Balance, end of period 713 630 713 630
Accumulated other comprehensive income Balance, beginning of period 78 95 92 56Transition adjustment on adoption of financial instruments standards ― ― ― (4)Other comprehensive (loss) income for the period (14) 22 (28) 65
Balance, end of period 64 117 64 117
Total retained earnings and accumulated other comprehensive income 777 747 777 747
Total common equity $ 3,052 $ 3,035 $ 3,052 $ 3,035
See accompanying notes to the consolidated financial statements
Consolidated Statements of Comprehensive Income Unaudited Three months ended Sept. 30 Nine months ended Sept. 30(US Millions) Note 2008 2007 2008 2007
Net income $ 174 $ 3 $ 242 $ 135
Other comprehensive income Change in foreign currency translation (losses) gains on
investments in subsidiaries $ (66) $
92
$ (99) $ 203 Gains (losses) arising from hedges of net investments in subsidiaries,
net of taxes of $10 million and $17 million for the three and nine months ended September 30, 2008 (2007 ‐ $18 million and $37 million) 52 (57) 74 (123)
Net gains (losses) on derivatives designated as cash flow hedges, net of non‐controlling interests, net of taxes of nil and nil for the three and nine months ended September 30, 2008 (2007 – nil and nil) (1) (13) (5) (16)
Reclassification to earnings of losses, net of taxes of nil and nil for the three and nine months ended September 30, 2008 (2007 – nil and nil) 1 ― 2 1
Total other comprehensive (loss) income (14) 22 (28) 65
Comprehensive income $ 160 $ 25 $ 214 $ 200
See accompanying notes to the consolidated financial statements
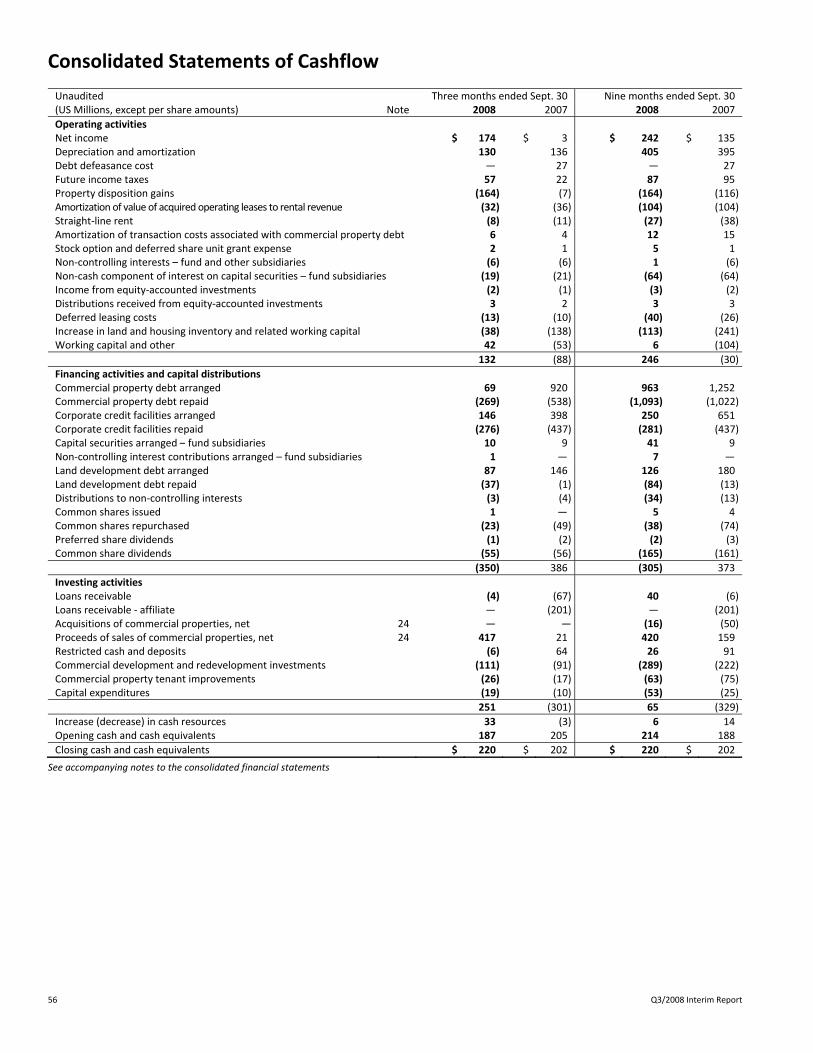
56 Q3/2008 Interim Report
Consolidated Statements of Cashflow Unaudited Three months ended Sept. 30 Nine months ended Sept. 30(US Millions, except per share amounts) Note 2008 2007 2008 2007
Operating activities Net income $ 174 $ 3 $ 242 $ 135Depreciation and amortization 130 136 405 395Debt defeasance cost ― 27 ― 27Future income taxes 57 22 87 95Property disposition gains (164) (7) (164) (116)Amortization of value of acquired operating leases to rental revenue (32) (36) (104) (104)Straight‐line rent (8) (11) (27) (38)Amortization of transaction costs associated with commercial property debt 6 4 12 15Stock option and deferred share unit grant expense 2 1 5 1Non‐controlling interests – fund and other subsidiaries (6) (6) 1 (6)Non‐cash component of interest on capital securities – fund subsidiaries (19) (21) (64) (64)Income from equity‐accounted investments (2) (1) (3) (2)Distributions received from equity‐accounted investments 3 2 3 3Deferred leasing costs (13) (10) (40) (26)Increase in land and housing inventory and related working capital (38) (138) (113) (241)Working capital and other 42 (53) 6 (104)
132 (88) 246 (30)
Financing activities and capital distributions Commercial property debt arranged 69 920 963 1,252Commercial property debt repaid (269) (538) (1,093) (1,022)Corporate credit facilities arranged 146 398 250 651Corporate credit facilities repaid (276) (437) (281) (437)Capital securities arranged – fund subsidiaries 10 9 41 9Non‐controlling interest contributions arranged – fund subsidiaries 1 ― 7 ―Land development debt arranged 87 146 126 180Land development debt repaid (37) (1) (84) (13)Distributions to non‐controlling interests (3) (4) (34) (13)Common shares issued 1 ― 5 4Common shares repurchased (23) (49) (38) (74)Preferred share dividends (1) (2) (2) (3)Common share dividends (55) (56) (165) (161)
(350) 386 (305) 373
Investing activities Loans receivable (4) (67) 40 (6)Loans receivable ‐ affiliate ― (201) ― (201)Acquisitions of commercial properties, net 24 ― ― (16) (50)Proceeds of sales of commercial properties, net 24 417 21 420 159Restricted cash and deposits (6) 64 26 91Commercial development and redevelopment investments (111) (91) (289) (222)Commercial property tenant improvements (26) (17) (63) (75)Capital expenditures (19) (10) (53) (25)
251 (301) 65 (329)
Increase (decrease) in cash resources 33 (3) 6 14Opening cash and cash equivalents 187 205 214 188
Closing cash and cash equivalents $ 220 $ 202 $ 220 $ 202
See accompanying notes to the consolidated financial statements

Brookfield Properties Corporation 57
Notes to the Consolidated Financial Statements NOTE 1: SUMMARY OF ACCOUNTING POLICIES Reference is made to the most recently‐issued Annual Report of Brookfield Properties Corporation (the “company” or “Brookfield Properties”) which includes information necessary or useful to understanding the company’s businesses and financial statement presentation. In particular, the company’s significant accounting policies and practices were presented as Note 1 and Note 2 to the Consolidated Financial Statements included in that report, and have been consistently applied in the preparation of these interim financial statements except for the changes in accounting policies described in Note 2. Financial information in this report reflects any adjustments that are, in the opinion of management, necessary to reflect a fair statement of results for the interim periods in accordance with Canadian generally accepted accounting principles. The results reported in these consolidated interim financial statements should not be regarded as necessarily indicative of results that may be expected for the entire year. Certain prior period amounts have been reclassified to conform to the current period’s presentation. The financial information included in the Notes to these consolidated interim financial statements is unaudited. NOTE 2: CHANGES IN ACCOUNTING POLICIES Capital Disclosures On December 1, 2006, the Canadian Institute of Chartered Accountants (the “CICA”) issued Handbook Section 1535, “Capital Disclosures.” Section 1535 requires the disclosure of (i) an entity’s objectives, policies and process for managing capital; (ii) quantitative data about an entity’s managed capital; (iii) whether an entity has complied with capital requirements; and (iv) if an entity has not complied with such capital requirements, the consequences of such non‐compliance. The company adopted the requirements of Section 1535 on January 1, 2008 and the required disclosures are included in Note 23 to these unaudited interim financial statements. Financial Instruments – Disclosures and Presentation On December 1, 2006, the CICA issued two new accounting standards, Section 3862, “Financial Instruments – Disclosures” and Section 3863, “Financial Instruments – Presentation.” These standards replace Section 3861, “Financial Instruments – Disclosure and Presentation” and require additional disclosure of the nature and extent of risks arising from financial instruments and how the entity manages those risks. Certain disclosures required under Section 3862 were made in the notes to the annual consolidated financial statements for the year ended December 31, 2007 and do not differ materially at September 30, 2008. Additional disclosures required by Section 3862 have been made in the notes to these unaudited interim consolidated financial statements. The adoption of Section 3863 did not have any impact on the company’s consolidated financial statements. NOTE 3: COMMERCIAL PROPERTIES A breakdown of commercial properties is as follows:
(Millions) Sept. 30, 2008 Dec. 31, 2007
Commercial properties
Land $ 2,773 $ 2,828
Building and improvements 14,032 14,253
Total commercial properties 16,805 17,081
Less: Accumulated depreciation (1,353) (1,192)
Total $ 15,452 $ 15,889
Depreciation and amortization on commercial properties for the three and nine months ended September 30, 2008 was $97 million and $296 million, respectively (2007 ‐ $100 million and $282 million). NOTE 4: COMMERCIAL DEVELOPMENTS During the three and nine months ended September 30, 2008, the company capitalized a total of $126 million and $312 million, respectively, (2007 ‐ $91 million and $222 million) of costs related to commercial developments. Included in this amount is $106 million and $261 million (2007 ‐ $74 million and $182 million) of construction and related costs and $20 million and $51 million (2007 ‐ $17 million and $40 million) of interest capitalized to the company’s commercial development sites for the three and nine months ended September 30, 2008. NOTE 5: RESIDENTIAL DEVELOPMENTS Residential developments are composed of the following:
(Millions) Sept. 30, 2008 Dec. 31, 2007
Land under development $ 417 $ 431
Housing inventory 107 85
Land held for development 761 712
Total $ 1,285 $ 1,228
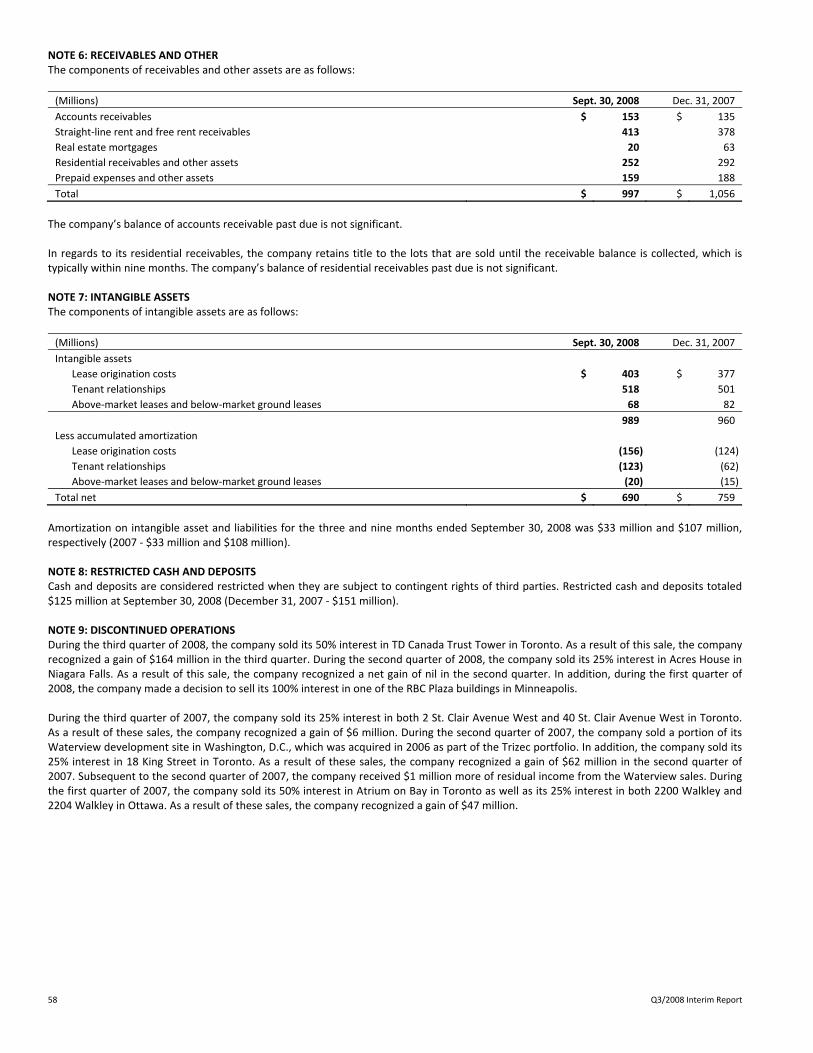
58 Q3/2008 Interim Report
NOTE 6: RECEIVABLES AND OTHER The components of receivables and other assets are as follows:
(Millions) Sept. 30, 2008 Dec. 31, 2007
Accounts receivables $ 153 $ 135
Straight‐line rent and free rent receivables 413 378
Real estate mortgages 20 63
Residential receivables and other assets 252 292
Prepaid expenses and other assets 159 188
Total $ 997 $ 1,056
The company’s balance of accounts receivable past due is not significant. In regards to its residential receivables, the company retains title to the lots that are sold until the receivable balance is collected, which is typically within nine months. The company’s balance of residential receivables past due is not significant. NOTE 7: INTANGIBLE ASSETS The components of intangible assets are as follows:
(Millions) Sept. 30, 2008 Dec. 31, 2007
Intangible assets
Lease origination costs $ 403 $ 377
Tenant relationships 518 501
Above‐market leases and below‐market ground leases 68 82
989 960
Less accumulated amortization
Lease origination costs (156) (124)
Tenant relationships (123) (62)
Above‐market leases and below‐market ground leases (20) (15)
Total net $ 690 $ 759
Amortization on intangible asset and liabilities for the three and nine months ended September 30, 2008 was $33 million and $107 million, respectively (2007 ‐ $33 million and $108 million). NOTE 8: RESTRICTED CASH AND DEPOSITS Cash and deposits are considered restricted when they are subject to contingent rights of third parties. Restricted cash and deposits totaled $125 million at September 30, 2008 (December 31, 2007 ‐ $151 million). NOTE 9: DISCONTINUED OPERATIONS During the third quarter of 2008, the company sold its 50% interest in TD Canada Trust Tower in Toronto. As a result of this sale, the company recognized a gain of $164 million in the third quarter. During the second quarter of 2008, the company sold its 25% interest in Acres House in Niagara Falls. As a result of this sale, the company recognized a net gain of nil in the second quarter. In addition, during the first quarter of 2008, the company made a decision to sell its 100% interest in one of the RBC Plaza buildings in Minneapolis. During the third quarter of 2007, the company sold its 25% interest in both 2 St. Clair Avenue West and 40 St. Clair Avenue West in Toronto. As a result of these sales, the company recognized a gain of $6 million. During the second quarter of 2007, the company sold a portion of its Waterview development site in Washington, D.C., which was acquired in 2006 as part of the Trizec portfolio. In addition, the company sold its 25% interest in 18 King Street in Toronto. As a result of these sales, the company recognized a gain of $62 million in the second quarter of 2007. Subsequent to the second quarter of 2007, the company received $1 million more of residual income from the Waterview sales. During the first quarter of 2007, the company sold its 50% interest in Atrium on Bay in Toronto as well as its 25% interest in both 2200 Walkley and 2204 Walkley in Ottawa. As a result of these sales, the company recognized a gain of $47 million.
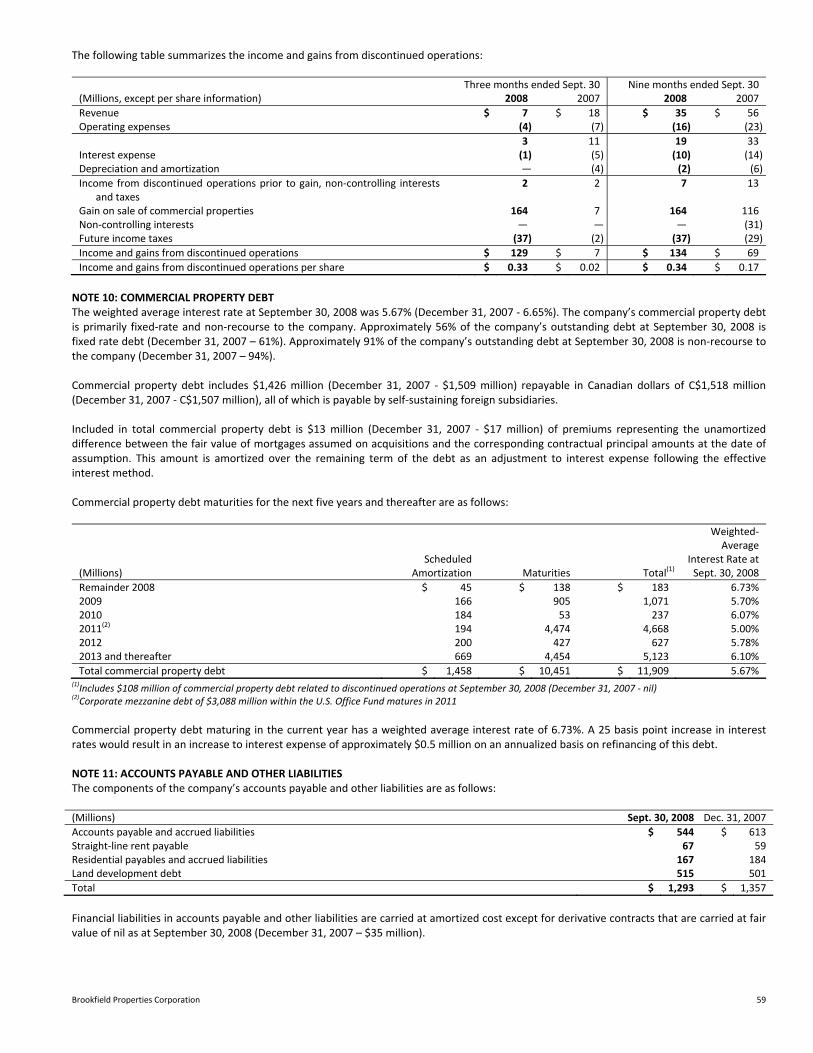
Brookfield Properties Corporation 59
The following table summarizes the income and gains from discontinued operations: Three months ended Sept. 30 Nine months ended Sept. 30(Millions, except per share information) 2008 2007 2008 2007
Revenue $ 7 $ 18 $ 35 $ 56Operating expenses (4) (7) (16) (23)
3 11 19 33Interest expense (1) (5) (10) (14)Depreciation and amortization ― (4) (2) (6)
Income from discontinued operations prior to gain, non‐controlling interests and taxes
2 2 7 13
Gain on sale of commercial properties 164 7 164 116Non‐controlling interests ― ― ― (31)Future income taxes (37) (2) (37) (29)
Income and gains from discontinued operations $ 129 $ 7 $ 134 $ 69
Income and gains from discontinued operations per share $ 0.33 $ 0.02 $ 0.34 $ 0.17
NOTE 10: COMMERCIAL PROPERTY DEBT The weighted average interest rate at September 30, 2008 was 5.67% (December 31, 2007 ‐ 6.65%). The company’s commercial property debt is primarily fixed‐rate and non‐recourse to the company. Approximately 56% of the company’s outstanding debt at September 30, 2008 is fixed rate debt (December 31, 2007 – 61%). Approximately 91% of the company’s outstanding debt at September 30, 2008 is non‐recourse to the company (December 31, 2007 – 94%). Commercial property debt includes $1,426 million (December 31, 2007 ‐ $1,509 million) repayable in Canadian dollars of C$1,518 million (December 31, 2007 ‐ C$1,507 million), all of which is payable by self‐sustaining foreign subsidiaries. Included in total commercial property debt is $13 million (December 31, 2007 ‐ $17 million) of premiums representing the unamortized difference between the fair value of mortgages assumed on acquisitions and the corresponding contractual principal amounts at the date of assumption. This amount is amortized over the remaining term of the debt as an adjustment to interest expense following the effective interest method. Commercial property debt maturities for the next five years and thereafter are as follows: Weighted‐ Average Scheduled Interest Rate at(Millions) Amortization Maturities Total(1) Sept. 30, 2008
Remainder 2008 $ 45 $ 138 $ 183 6.73%2009 166 905 1,071 5.70%2010 184 53 237 6.07%2011(2) 194 4,474 4,668 5.00%2012 200 427 627 5.78%2013 and thereafter 669 4,454 5,123 6.10%
Total commercial property debt $ 1,458 $ 10,451 $ 11,909 5.67%(1)Includes $108 million of commercial property debt related to discontinued operations at September 30, 2008 (December 31, 2007 ‐ nil)
(2)Corporate mezzanine debt of $3,088 million within the U.S. Office Fund matures in 2011
Commercial property debt maturing in the current year has a weighted average interest rate of 6.73%. A 25 basis point increase in interest rates would result in an increase to interest expense of approximately $0.5 million on an annualized basis on refinancing of this debt. NOTE 11: ACCOUNTS PAYABLE AND OTHER LIABILITIES The components of the company’s accounts payable and other liabilities are as follows: (Millions) Sept. 30, 2008 Dec. 31, 2007
Accounts payable and accrued liabilities $ 544 $ 613Straight‐line rent payable 67 59Residential payables and accrued liabilities 167 184Land development debt 515 501
Total $ 1,293 $ 1,357
Financial liabilities in accounts payable and other liabilities are carried at amortized cost except for derivative contracts that are carried at fair value of nil as at September 30, 2008 (December 31, 2007 – $35 million).
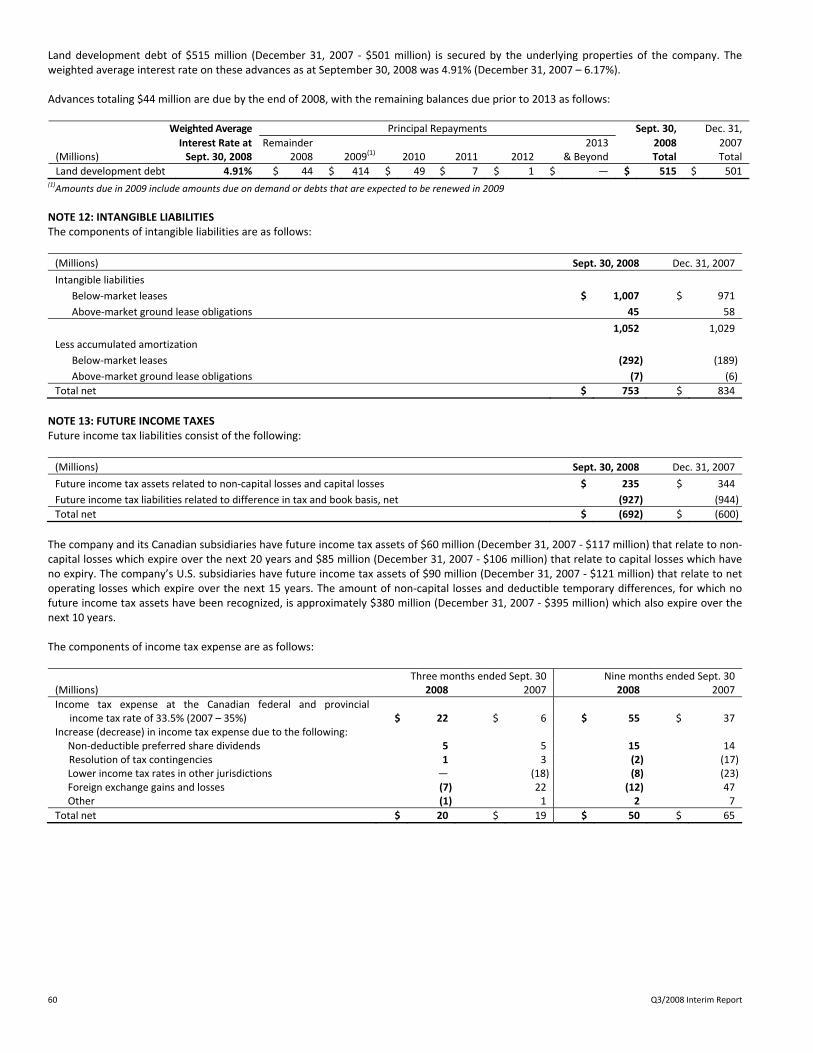
60 Q3/2008 Interim Report
Land development debt of $515 million (December 31, 2007 ‐ $501 million) is secured by the underlying properties of the company. The weighted average interest rate on these advances as at September 30, 2008 was 4.91% (December 31, 2007 – 6.17%). Advances totaling $44 million are due by the end of 2008, with the remaining balances due prior to 2013 as follows:
Weighted Average Principal Repayments Sept. 30, Dec. 31,
Interest Rate at Remainder 2013 2008 2007(Millions) Sept. 30, 2008 2008 2009(1) 2010 2011 2012 & Beyond Total Total
Land development debt 4.91% $ 44 $ 414 $ 49 $ 7 $ 1 $ ― $ 515 $ 501(1)Amounts due in 2009 include amounts due on demand or debts that are expected to be renewed in 2009
NOTE 12: INTANGIBLE LIABILITIES The components of intangible liabilities are as follows:
(Millions) Sept. 30, 2008 Dec. 31, 2007
Intangible liabilities
Below‐market leases $ 1,007 $ 971
Above‐market ground lease obligations 45 58
1,052 1,029
Less accumulated amortization
Below‐market leases (292) (189)
Above‐market ground lease obligations (7) (6)
Total net $ 753 $ 834
NOTE 13: FUTURE INCOME TAXES Future income tax liabilities consist of the following:
(Millions) Sept. 30, 2008 Dec. 31, 2007
Future income tax assets related to non‐capital losses and capital losses $ 235 $ 344
Future income tax liabilities related to difference in tax and book basis, net (927) (944)
Total net $ (692) $ (600)
The company and its Canadian subsidiaries have future income tax assets of $60 million (December 31, 2007 ‐ $117 million) that relate to non‐capital losses which expire over the next 20 years and $85 million (December 31, 2007 ‐ $106 million) that relate to capital losses which have no expiry. The company’s U.S. subsidiaries have future income tax assets of $90 million (December 31, 2007 ‐ $121 million) that relate to net operating losses which expire over the next 15 years. The amount of non‐capital losses and deductible temporary differences, for which no future income tax assets have been recognized, is approximately $380 million (December 31, 2007 ‐ $395 million) which also expire over the next 10 years. The components of income tax expense are as follows: Three months ended Sept. 30 Nine months ended Sept. 30(Millions) 2008 2007 2008 2007
Income tax expense at the Canadian federal and provincial income tax rate of 33.5% (2007 – 35%) $ 22 $ 6
$ 55 $ 37
Increase (decrease) in income tax expense due to the following: Non‐deductible preferred share dividends 5 5 15 14
Resolution of tax contingencies 1 3 (2) (17) Lower income tax rates in other jurisdictions ― (18) (8) (23) Foreign exchange gains and losses (7) 22 (12) 47 Other (1) 1 2 7
Total net $ 20 $ 19 $ 50 $ 65

Brookfield Properties Corporation 61
NOTE 14: CAPITAL SECURITIES ‐ CORPORATE The company has the following capital securities outstanding: Shares Shares Cumulative (Millions, except share information) Authorized Outstanding Dividend Rate Sept. 30, 2008 Dec. 31, 2007
Class AAA Series E(1) 8,000,000 8,000,000 70% of bank prime $ ― $ ―Class AAA Series F 8,000,000 8,000,000 6.00% 187 199Class AAA Series G 6,000,000 4,400,000 5.25% 109 109Class AAA Series H 8,000,000 8,000,000 5.75% 186 199Class AAA Series I 8,000,000 8,000,000 5.20% 188 199Class AAA Series J 8,000,000 8,000,000 5.00% 187 198Class AAA Series K 6,000,000 6,000,000 5.20% 139 149
Total(2) $ 996 $ 1,053(1)Owned by Brookfield Asset Management Inc. (“BAM”); balance has been offset with a promissory note receivable from BAM – refer to Note 24(d)
(2)Net of transaction costs of $7 million at September 30, 2008 (2007 ‐ $7 million) which are amortized to interest expense over the life of the securities following the effective interest method
The redemption terms of the Class AAA Preferred Shares can be found in the company’s Annual Information Form for the year ended December 31, 2007. Cumulative preferred dividends are payable quarterly, as and when declared by the Board of Directors, on the last day of March, June, September and December. Interest expense on capital securities – corporate is comprised as follows: Unaudited Three months ended Sept. 30 Nine months ended Sept. 30(Millions) 2008 2007 2008 2007
Series E $ ― $ 1 $ ― $ 5Series' F through K 15 14 45 41
Total $ 15 $ 15 $ 45 $ 46
NOTE 15: U.S. OFFICE FUND Third party interests in the Fund are as follows:
(Millions) Sept. 30, 2008 Dec. 31, 2007
Capital securities – fund subsidiaries
Debt securities $ 257 $ 257
Redeemable equity interests 507 505
764 762
Non‐controlling interests – fund subsidiaries 186 193
Total $ 950 $ 955
Debt securities consist of contributions to the U.S. Office Fund by an institutional investor in the Brookfield Properties‐led consortium in the form of an unsecured debenture. The debenture matures on October 31, 2013 and bears interest at 11%. Redeemable equity interests include $442 million (2007 ‐ $440 million) representing the equity interest in the U.S. Office Fund held by the company’s joint venture partner, The Blackstone Group. The balance of redeemable equity interests is comprised of $65 million (2007 ‐ $65 million) of redeemable preferred securities bearing interest at 6%. Non‐controlling interests ‐ fund subsidiaries represent equity contributions by other U.S. Office Fund investors in the Brookfield Properties‐led consortium.
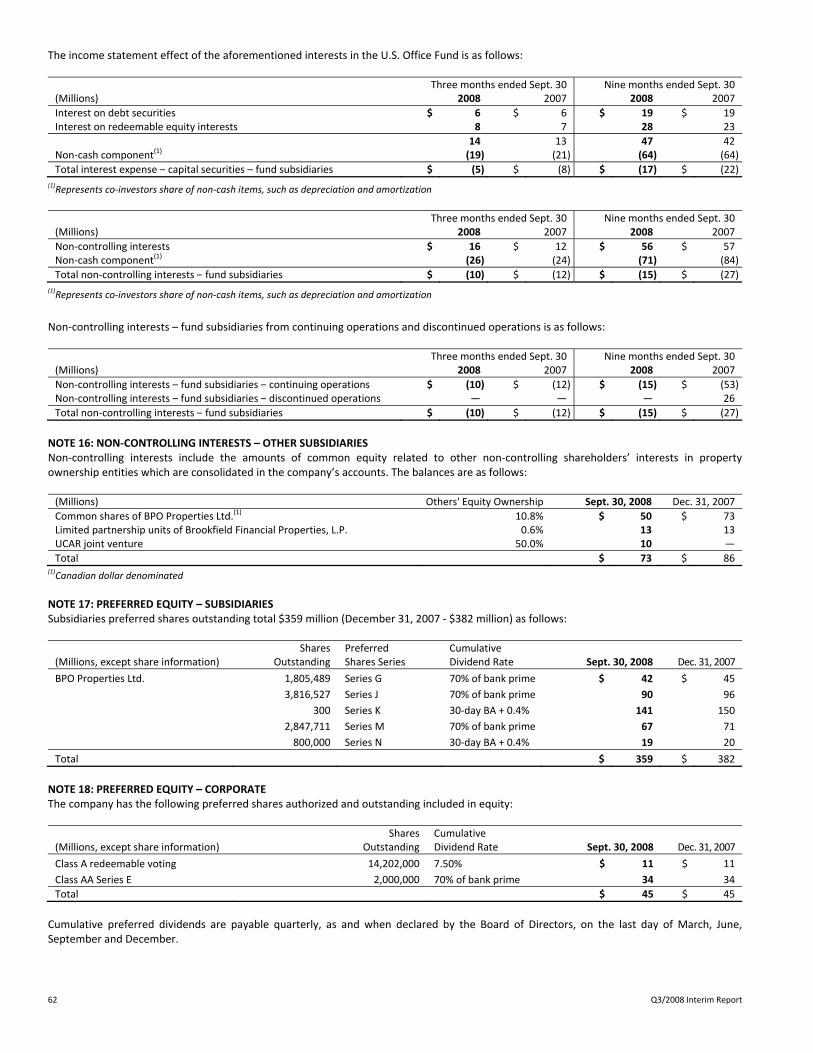
62 Q3/2008 Interim Report
The income statement effect of the aforementioned interests in the U.S. Office Fund is as follows: Three months ended Sept. 30 Nine months ended Sept. 30(Millions) 2008 2007 2008 2007
Interest on debt securities $ 6 $ 6 $ 19 $ 19Interest on redeemable equity interests 8 7 28 23
14 13 47 42Non‐cash component(1) (19) (21) (64) (64)
Total interest expense – capital securities – fund subsidiaries $ (5) $ (8) $ (17) $ (22)
(1)Represents co‐investors share of non‐cash items, such as depreciation and amortization
Three months ended Sept. 30 Nine months ended Sept. 30(Millions) 2008 2007 2008 2007
Non‐controlling interests $ 16 $ 12 $ 56 $ 57Non‐cash component(1) (26) (24) (71) (84)
Total non‐controlling interests – fund subsidiaries $ (10) $ (12) $ (15) $ (27)
(1)Represents co‐investors share of non‐cash items, such as depreciation and amortization
Non‐controlling interests – fund subsidiaries from continuing operations and discontinued operations is as follows: Three months ended Sept. 30 Nine months ended Sept. 30(Millions) 2008 2007 2008 2007
Non‐controlling interests – fund subsidiaries – continuing operations $ (10) $ (12) $ (15) $ (53)Non‐controlling interests – fund subsidiaries – discontinued operations ― ― ― 26
Total non‐controlling interests – fund subsidiaries $ (10) $ (12) $ (15) $ (27)
NOTE 16: NON‐CONTROLLING INTERESTS – OTHER SUBSIDIARIES Non‐controlling interests include the amounts of common equity related to other non‐controlling shareholders’ interests in property ownership entities which are consolidated in the company’s accounts. The balances are as follows: (Millions) Others' Equity Ownership Sept. 30, 2008 Dec. 31, 2007
Common shares of BPO Properties Ltd.(1) 10.8% $ 50 $ 73Limited partnership units of Brookfield Financial Properties, L.P. 0.6% 13 13UCAR joint venture 50.0% 10 ―
Total $ 73 $ 86(1)Canadian dollar denominated
NOTE 17: PREFERRED EQUITY – SUBSIDIARIES Subsidiaries preferred shares outstanding total $359 million (December 31, 2007 ‐ $382 million) as follows: Shares Preferred Cumulative(Millions, except share information) Outstanding Shares Series Dividend Rate Sept. 30, 2008 Dec. 31, 2007
BPO Properties Ltd. 1,805,489 Series G 70% of bank prime $ 42 $ 45
3,816,527 Series J 70% of bank prime 90 96
300 Series K 30‐day BA + 0.4% 141 150
2,847,711 Series M 70% of bank prime 67 71
800,000 Series N 30‐day BA + 0.4% 19 20
Total $ 359 $ 382
NOTE 18: PREFERRED EQUITY – CORPORATE The company has the following preferred shares authorized and outstanding included in equity: Shares Cumulative (Millions, except share information) Outstanding Dividend Rate Sept. 30, 2008 Dec. 31, 2007
Class A redeemable voting 14,202,000 7.50% $ 11 $ 11
Class AA Series E 2,000,000 70% of bank prime 34 34
Total $ 45 $ 45
Cumulative preferred dividends are payable quarterly, as and when declared by the Board of Directors, on the last day of March, June, September and December.

Brookfield Properties Corporation 63
NOTE 19: COMMON EQUITY (a) Common shares The authorized common share capital consists of an unlimited number of common voting shares. Common shares issued and outstanding consists of:
(Millions) Sept. 30, 2008 Dec. 31, 2007
Common shares outstanding, beginning of period 392,805,608 396,868,457
Shares issued as a result of exercise of options 551,433 450,871
Shares repurchased for cancellation (2,068,600) (4,513,720)
Common shares outstanding, end of period 391,288,441 392,805,608
(b) Accumulated other comprehensive income As of September 30, 2008, accumulated other comprehensive income consists of the following amounts: As at Sept. 30(Millions) 2008 2007
Unrealized foreign currency translation gains on investments in subsidiaries, net of related hedging activities, net of taxes
$ 90 $ 136
Losses on derivatives designated as cash flow hedges(1), net of taxes and non‐controlling interests (26) (19)
Accumulated other comprehensive income $ 64 $ 117(1)Includes losses of $4 million which will be reclassified to interest expense over the next 12 months
(c) Earnings per share Net income per share and weighted average common shares outstanding are calculated as follows: Three months ended Sept. 30 Nine months ended Sept. 30(Millions, except per share amounts) 2008 2007 2008 2007
Net income from continuing operations $ 45 $ (4) $ 108 $ 66Preferred share dividends (1) (2) (2) (3)
Net income from continuing operations available to common shareholders 44 (6) 106 63
Net income 174 3 242 135Preferred share dividends (1) (2) (2) (3)
Net income available to common shareholders $ 173 $ 1 $ 240 $ 132
Weighted average shares outstanding – basic 392.3 395.6 392.8 396.6Unexercised dilutive options 1.6 3.1 1.6 3.4
Weighted average shares outstanding – diluted 393.9 398.7 394.4 400.0
NOTE 20: STOCK‐BASED COMPENSATION Options issued under the company’s Share Option Plan vest proportionately over five years and expire ten years after the grant date. The exercise price of each option is not less than the closing price on the last trading day preceding the date of grant of such option. During 2008, the company granted 2,080,299 stock options (2007 – 1,528,407, on a post‐split basis), under the Share Option Plan with a weighted average exercise price of $19.11 per share (2007 ‐ $31.21 per share), which was equal to the market price on the grant date. The compensation expense was calculated using the Black‐Scholes model, assuming a 7.5‐year term, 34% volatility (2007 – 19%), a weighted average dividend yield of 3.3% (2007 – 1.6%) and a risk free interest rate of 3.4% (2007 – 4.8%). The resulting fair value of $11 million is charged to expense over the vesting period of the options granted. A corresponding amount is initially recorded in contributed surplus and subsequently reclassified to share capital when options are exercised. Any consideration paid upon exercise of options is credited directly to common shares. At September 30, 2008, the company had a total of 1,023,498 deferred share units outstanding (December 31, 2007 – 982,381) under its Deferred Share Unit plan, of which 1,011,055 were vested (December 31, 2007 – 949,206). Employee compensation expense related to the Stock Option and the Deferred Share Unit plans for the three and nine months ended September 30, 2008 was $2 million and $5 million, respectively (2007 – $1 million and $1 million, respectively).
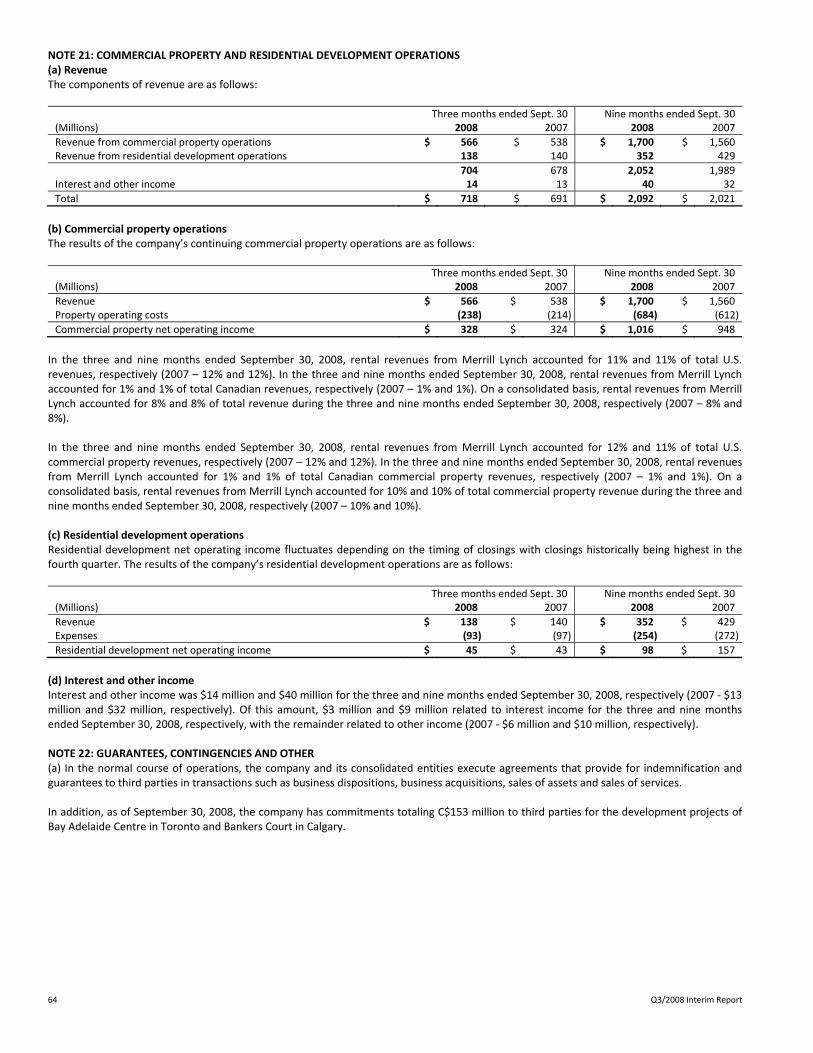
64 Q3/2008 Interim Report
NOTE 21: COMMERCIAL PROPERTY AND RESIDENTIAL DEVELOPMENT OPERATIONS (a) Revenue The components of revenue are as follows: Three months ended Sept. 30 Nine months ended Sept. 30(Millions) 2008 2007 2008 2007
Revenue from commercial property operations $ 566 $ 538 $ 1,700 $ 1,560Revenue from residential development operations 138 140 352 429
704 678 2,052 1,989Interest and other income 14 13 40 32
Total $ 718 $ 691 $ 2,092 $ 2,021
(b) Commercial property operations The results of the company’s continuing commercial property operations are as follows: Three months ended Sept. 30 Nine months ended Sept. 30(Millions) 2008 2007 2008 2007
Revenue $ 566 $ 538 $ 1,700 $ 1,560Property operating costs (238) (214) (684) (612)
Commercial property net operating income $ 328 $ 324 $ 1,016 $ 948
In the three and nine months ended September 30, 2008, rental revenues from Merrill Lynch accounted for 11% and 11% of total U.S. revenues, respectively (2007 – 12% and 12%). In the three and nine months ended September 30, 2008, rental revenues from Merrill Lynch accounted for 1% and 1% of total Canadian revenues, respectively (2007 – 1% and 1%). On a consolidated basis, rental revenues from Merrill Lynch accounted for 8% and 8% of total revenue during the three and nine months ended September 30, 2008, respectively (2007 – 8% and 8%). In the three and nine months ended September 30, 2008, rental revenues from Merrill Lynch accounted for 12% and 11% of total U.S. commercial property revenues, respectively (2007 – 12% and 12%). In the three and nine months ended September 30, 2008, rental revenues from Merrill Lynch accounted for 1% and 1% of total Canadian commercial property revenues, respectively (2007 – 1% and 1%). On a consolidated basis, rental revenues from Merrill Lynch accounted for 10% and 10% of total commercial property revenue during the three and nine months ended September 30, 2008, respectively (2007 – 10% and 10%). (c) Residential development operations Residential development net operating income fluctuates depending on the timing of closings with closings historically being highest in the fourth quarter. The results of the company’s residential development operations are as follows: Three months ended Sept. 30 Nine months ended Sept. 30(Millions) 2008 2007 2008 2007
Revenue $ 138 $ 140 $ 352 $ 429Expenses (93) (97) (254) (272)
Residential development net operating income $ 45 $ 43 $ 98 $ 157
(d) Interest and other income Interest and other income was $14 million and $40 million for the three and nine months ended September 30, 2008, respectively (2007 ‐ $13 million and $32 million, respectively). Of this amount, $3 million and $9 million related to interest income for the three and nine months ended September 30, 2008, respectively, with the remainder related to other income (2007 ‐ $6 million and $10 million, respectively). NOTE 22: GUARANTEES, CONTINGENCIES AND OTHER (a) In the normal course of operations, the company and its consolidated entities execute agreements that provide for indemnification and guarantees to third parties in transactions such as business dispositions, business acquisitions, sales of assets and sales of services. In addition, as of September 30, 2008, the company has commitments totaling C$153 million to third parties for the development projects of Bay Adelaide Centre in Toronto and Bankers Court in Calgary.

Brookfield Properties Corporation 65
NOTE 23: CAPITAL MANAGEMENT AND LIQUIDITY The company employs a broad range of financing strategies to facilitate growth and manage financial risk, with particular emphasis on the overall reduction of the weighted average cost of capital, in order to enhance returns for common shareholders. The company’s objective is to reduce its weighted average cost of capital and improve common shareholders’ equity returns through value enhancement initiatives and the consistent monitoring of the balance between debt and equity financing. As at September 30, 2008, the company’s weighted average cost of capital, assuming a 12% return on common equity, was 6.53%. The following schedule details the components of the company’s capital as at September 30, 2008 and the related costs thereof:
Cost of Capital(1) Underlying Value(2)
(Millions) Sept. 30, 2008 Dec. 31, 2007 Sept. 30, 2008 Dec. 31, 2007
Liabilities
Commercial property debt 5.67% 6.65% $ 11,909 $ 12,125
Residential debt 4.91% 6.17% 515 501
Capital securities – corporate 5.42% 5.42% 996 1,053
Capital securities – fund subsidiaries(3) 10.00% 10.00% 764 762
Non‐controlling interests – fund subsidiaries(3) 10.00% 10.00% 186 193
Non‐controlling interests – other subsidiaries 12.00% 12.00% 73 86
Preferred equity ‐ subsidiaries 4.37% 4.40% 359 382
Shareholders’ equity
Preferred equity ‐ corporate 5.01% 5.01% 45 45
Common equity(4) 12.00% 12.00% 6,198 7,562
Total(5) 6.53% 7.19% $ 21,045 $ 22,709 (1)As a percentage of average book value
(2)Underlying value of liabilities represents the cost to retire on maturity. Underlying value of common equity is based on the closing stock price of Brookfield Properties’ common shares
(3)Assuming 10% return on co‐invested capital
(4)Determined on a market value basis
(5)In calculating the weighted average cost of capital, the cost of debt has been tax‐effected
Commercial property debt – The company’s commercial property debt is primarily fixed‐rate and non‐recourse to the company. These financings are typically structured on a loan‐to‐appraised value basis of up to 60%. In addition, in certain circumstances where a building is leased almost exclusively to a high‐credit quality tenant, a higher loan‐to‐value financing, based on the tenant’s credit quality, is put in place at rates commensurate with the cost of funds for the tenant. This reduces equity requirements to finance commercial property, and enhances equity returns. Capital securities – fund subsidiaries and Non‐controlling interest – fund subsidiaries The company invests its liquidity alongside capital from strategic institutional partners in fund formats to acquire individual assets and portfolios in order to, together with the associated asset management fees, enable the company to increase returns on equity. Capital securities – corporate, Preferred equity – subsidiaries and Preferred equity – corporate. These represent sources of low‐cost capital to the company, without dilution to the common equity base. The company is subject to certain covenants on its credit facilities. The covenants include a total and secured leverage ratio, an interest and fixed charge ratio, as well as a dividend payout ratio and a recourse debt requirement. The company monitors the ratios on a quarterly basis. As at September 30, 2008, the company was in compliance with all of its covenants. The company’s strategy is to satisfy its liquidity needs using cash on hand, cashflows generated from operating activities and provided by financing activities, as well as proceeds from asset sales. Rental revenue, recoveries from tenants, lot and home sale proceeds, interest and other income, available cash balances, draws on corporate credit facilities and refinancings, including upward refinancings, of maturing indebtedness are the company’s principal sources of capital used to pay operating expenses, dividends, debt service and recurring capital and leasing costs in its commercial property portfolio and residential development business. The company finances its residential development operations and ongoing working capital requirements with residential development debt and accounts payable. Another source of cashflow includes third‐party fees generated by the company’s asset management, leasing and development businesses. Consequently, the company plans to meet its short‐term liquidity needs with revenue along with proceeds from financing activities.

66 Q3/2008 Interim Report
The principal liquidity needs for periods beyond the next twelve months are for development costs, potential property acquisitions, scheduled debt maturities and non‐recurring capital expenditures. The company’s strategy is to meet these needs with one or more of the following:
• cashflows from operations;
• construction loans;
• investment in new funds;
• proceeds from sales of assets; and
• credit facilities and refinancing opportunities. The company attempts to match the maturity of its commercial property debt portfolio with the average lease terms of its properties. At September 30, 2008, the average term to maturity of the company’s commercial property debt was six years, close to its average lease term at approximately seven years. The following table presents the contractual maturities of the company’s financial liabilities: Payments Due By Period
(Millions) Total Less than 1 year 1 ‐ 3 Years 4 ‐ 5 Years After 5 Years
Commercial property debt(1) $ 11,909 $ 183 $ 1,308 $ 5,295 $ 5,123Residential development debt 515 44 463 8 ―Capital securities ‐ corporate 996 ― 188 ― 808Capital securities ‐ fund subsidiaries(2) 257 ― ― ― 257
(1)Includes transaction costs
(2)Excludes redeemable equity interests
NOTE 24: OTHER INFORMATION (a) At September 30, 2008, the company had foreign exchange contracts to sell a notional amount of C$800 million at a weighted average exchange rate of C$1.00 = US$0.97, maturing in December 2008, designated as hedges for accounting purposes to manage the company’s foreign exchange risk in respect to its Canadian‐denominated net investments. The fair value of these contracts at September 30, 2008 resulted in no gain or loss. The company’s self‐sustaining subsidiaries also had foreign exchange contracts to sell a notional amount of US$21 million at a weighted average exchange rate of US$1.00 = C$1.031, maturing in December 2008, which have not been designated as hedges for financial reporting purposes. The aggregate fair value of these contracts at September 30, 2008 resulted in no gain or loss. The company is structured such that its foreign operations are primarily self‐sustaining. As a result, the company’s currency risk associated with financial instruments is limited as its financial assets and liabilities are generally denominated in the functional currency of the subsidiary that holds the financial instrument. However, the company is exposed to foreign currency risk on net Canadian dollar financial liabilities of $1,082 million. The company has designated C$750 million of these financial liabilities as hedges of its Canadian denominated net investments. Based on the balance of these financial liabilities at September 30, 2008, a 1% change in the U.S. to Canadian dollar exchange rate would have impacted other comprehensive income by $7 million and net income by $3 million, on a pre‐tax basis. The exposure to translation of net Canadian dollar financial liabilities is in part off‐set by the effects of translating the Canadian dollar denominated future income tax assets. The company is also exposed to foreign currency risk on U.S. denominated loans receivable of a subsidiary that has the Canadian dollar as its functional currency. Based on the balance of these financial assets at September 30, 2008, a 1% change in the U.S. to Canadian dollar exchange rate would have no impact on net income. (b) In 2006, the company entered into a series of interest rate cap contracts that are designated as hedges of interest rate exposure associated with variable rate debt issued in October 2006 in connection with the acquisition of Trizec. At September 30, 2008, there were contracts outstanding to cap the interest rate on a notional $3.1 billion of variable rate debt at 6.0% and $600 million of variable rate debt at 7.0% for a period of one year. The contracts have been recorded at fair value in receivables and other with changes in fair value reported in other comprehensive income for the effective portion of the hedge. Gains or losses associated with the caps are reclassified from accumulated other comprehensive income to interest expense in the periods the hedged interest payments occur. In September 2007, the company de‐designated hedge relationships associated with $350 million of the interest rate caps as they were no longer eligible for hedge accounting. The cumulative loss associated with the de‐designated contracts will be amortized out of accumulated other comprehensive income to interest expense as the previously hedged interest payments occur. Subsequent changes in fair value of the de‐designated contracts will be recorded in interest expense as they occur. The ineffective portion of the change in fair value of these hedges recognized in net income is nil. The fair value of the contracts at September 30, 2008 is nil. The cost of these contracts was $1.2 million. In June 2007, the company entered into a forward‐starting interest rate swap to hedge the interest rate risk associated with the anticipated issuance of fixed rate debt. The forward‐starting swap hedged a notional $350 million of fixed rate debt issuance at a rate of 5.824%. During the second quarter of 2008, the company terminated the hedge relationship and settled the swap contract. A loss of $17 million, representing the loss on the swap at the date the hedge relationship was terminated net of non‐controlling interests, is recorded in accumulated other comprehensive income and will be amortized to interest expense over the term of the hedged debt. The company recognized a gain of $4 million, net of non‐controlling interests, representing the favorable change in the value of the swap from the point the hedge relationship was terminated to the date of settlement of the swap.

Brookfield Properties Corporation 67
In July 2007, the company entered into a forward‐starting interest rate swap to hedge the risk associated with anticipated debt of $700 million that was issued in August 2007. The contract was settled in August 2007 for a loss of $15 million. The loss was recorded in other comprehensive income and will be amortized to interest expense over the term of the hedged debt. The effect of a 25 basis point increase in interest rates on interest expense relating to the company’s corporate and commercial property floating rate debt, all else being equal, is an increase in interest expense of $13 million or approximately $6 million, net of non‐controlling interests or $0.02 per share on an annualized basis. Taking into account the company’s floating rate residential development debt and preferred shares issued by BPO Properties Ltd., a 25 basis point increase in rates would increase interest expense by an additional $2 million on an annualized basis. (c) In September 2007, the company entered into a total return swap under which it receives the returns on a notional 966,000 Brookfield Properties common shares as an economic hedge of its exposure to variability in share price under the company’s Deferred Share Unit program (refer to Note 20). The fair value of the total return swap was nil at September 30, 2008 and the change in fair value has been recorded in general and administrative expense. Based on the notional amount of the total return swap at September 30, 2008, a $1 change in the market price of Brookfield Properties’ common shares would impact net income by $1 million. Offsetting this would be a change in our employee compensation expense related to the deferred share units outstanding of an equal amount. (d) In September 2007, the company loaned C$200 million to Brookfield Asset Management Inc., the company’s parent, at a rate of 108% of prime, which has been offset against C$200 million Class AAA Series E capital securities held by Brookfield Asset Management Inc., pursuant to the terms of a promissory note. The company has a $300 million credit facility with Brookfield Asset Management Inc. At September 30, 2008, the balance drawn on this facility was nil (December 31, 2007 – nil). As at September 30, 2008, the company had approximately $15 million (December 31, 2007 ‐ $15 million) of indebtedness outstanding to Brookfield Asset Management Inc. and its affiliates. The indebtedness consists of floating rate debt included in the company’s commercial property debt. Interest expense related to this indebtedness, totaled $1 million and $2 million for the three and nine months ended September 30, 2008 compared to $4 million and $12 million for the same periods in 2007, and was recorded at the exchange amount. (e) Included in rental revenues are amounts received from Brookfield Asset Management Inc., and its affiliates for the rental of office premises of $0.6 million and $1.8 million for the three and nine months ended September 30, 2008 (2007 ‐ $0.4 million and $1.3 million, respectively). These amounts have been recorded at the exchange amount. (f) Supplemental cashflow information Three months ended Sept. 30 Nine months ended Sept. 30(Millions) 2008 2007 2008 2007
Acquisitions of real estate $ ― $ ― $ 16 $ 152Mortgages and other balances assumed on acquisition ― ― ― (102)
Net acquisitions $ ― $ ― $ 16 $ 50
Dispositions of real estate $ 417 $ 21 $ 420 $ 233Mortgages assumed by purchasers ― ― ― (74)
Net dispositions $ 417 $ 21 $ 420 $ 159
Cash taxes paid $ ― $ 6 $ 2 $ 12
Cash interest paid (excluding dividends paid on capital securities) $ 170 $ 168 $ 533 $ 523
(g) The assets and liabilities of certain of the company’s subsidiaries are neither available to pay debts of, nor constitute legal obligations of the parent or other subsidiaries, respectively. (h) In the three and nine months ended September 30, 2008, interest expense included $6 million and $12 million relating to amortization of transaction costs included in the carrying amount of commercial property debt and capital securities – corporate which has been recognized in interest expense using the effective interest method. (i) Included in general and administrative expenses is foreign exchange gains of $2 million and $4 million for the three and nine months ended September 30, 2008 (no gains or losses for the three and nine months ended September 30, 2007). (j) Included in cash and cash equivalents is $22 million of short‐term deposits at September 30, 2008 (December 31, 2007 ‐ $39 million). (k) In the three and nine months ended September 30, 2008, the company recorded income from equity accounted investments of $4 million and $4 million (2007 ‐ $1 million and $2 million, respectively). Of this amount, $3 million and $3 million was recorded in net operating income from commercial property operations in the three and nine months ended September 30, 2008 (2007 ‐ $1 million and $2 million, respectively) and $1 million and $1 million was recorded in interest and other income (2007 ‐ nil and nil, respectively).

68 Q3/2008 Interim Report
NOTE 25: SEGMENTED INFORMATION The company and its subsidiaries operate in the United States and Canada within the commercial property business and the residential development business. The following summary presents segmented financial information for the company’s principal areas of business: Commercial Residential United States Canada Development Total
(Millions) Sept. 30, 2008
Dec. 31, 2007
Sept. 30, 2008
Dec. 31, 2007
Sept. 30, 2008
Dec. 31, 2007
Sept. 30, 2008
Dec. 31, 2007
Assets Commercial properties $ 13,438 $ 13,498 $ 2,014 $ 2,391 $ ― $ ― $ 15,452 $ 15,889Development properties 585 676 646 496 1,285 1,228 2,516 2,400Receivables and other 599 569 146 195 252 292 997 1,056Intangible assets 659 719 31 40 ― ― 690 759Restricted cash and deposits 120 146 1 2 4 3 125 151Cash and cash equivalents 110 134 107 74 3 6 220 214Assets related to discontinued
operations 129 ― ― 4 ― ― 129 4
Total $ 15,640 $ 15,742 $ 2,945 $ 3,202 $ 1,544 $ 1,529 $ 20,129 $ 20,473
The carrying amounts of properties located in the United States and Canada at September 30, 2008 were $14,326 million and $3,643 million, respectively (December 31, 2007 ‐ $14,445 million and $3,844 million, respectively). The following summary presents segmented financial information for the company’s principal areas of business for the three months ended Sept. 30: Commercial Residential United States Canada Development Total
(Millions) 2008 2007 2008 2007 2008 2007 2008 2007
Revenues $ 456 $ 434 $ 110 $ 104 $ 138 $ 140 $ 704 $ 678Expenses 198 171 40 43 93 97 331 311
258 263 70 61 45 43 373 367Interest and other income 3 6 7 3 4 4 14 13
Net operating income from continuing operations 261 269 77 64 49 47 387 380
Interest expense Commercial property debt 152 167 11 6 ― ― 163 173Capital securities – corporate 3 2 12 13 ― ― 15 15Capital securities – fund subsidiaries (5) (8) ― ― ― ― (5) (8)
General and administrative 15 13 10 10 ― ― 25 23Transaction costs ― 31 ― 4 ― ― ― 35Non‐controlling interests
Fund subsidiaries (10) (12) ― ― ― ― (10) (12)Other subsidiaries ― ― 4 6 ― ― 4 6
Depreciation and amortization 113 116 17 17 ― ― 130 133
Income before unallocated costs (7) (40) 23 8 49 47 65 15Future income taxes 20 19
Net income from continuing operations $ 45 $ (4)Discontinued operations 4 14 125 (7) ― ― 129 7
Net income $ 174 $ 3
Acquisitions of commercial properties, net $ ― $ ― $ ― $ ― $ ― $ ― $ ― $ ―Dispositions of commercial properties, net ― ― (417) (21) ― ― (417) (21)Commercial property tenant improvements 25 16 1 1 ― ― 26 17Development and redevelopment 47 52 64 39 ― ― 111 91Capital expenditures 14 5 5 5 ― ― 19 10
Total revenues earned in the United States and Canada for the three months ended September 30, 2008 were $460 million and $258 million, respectively (2007 ‐ $450 million and $241 million, respectively).
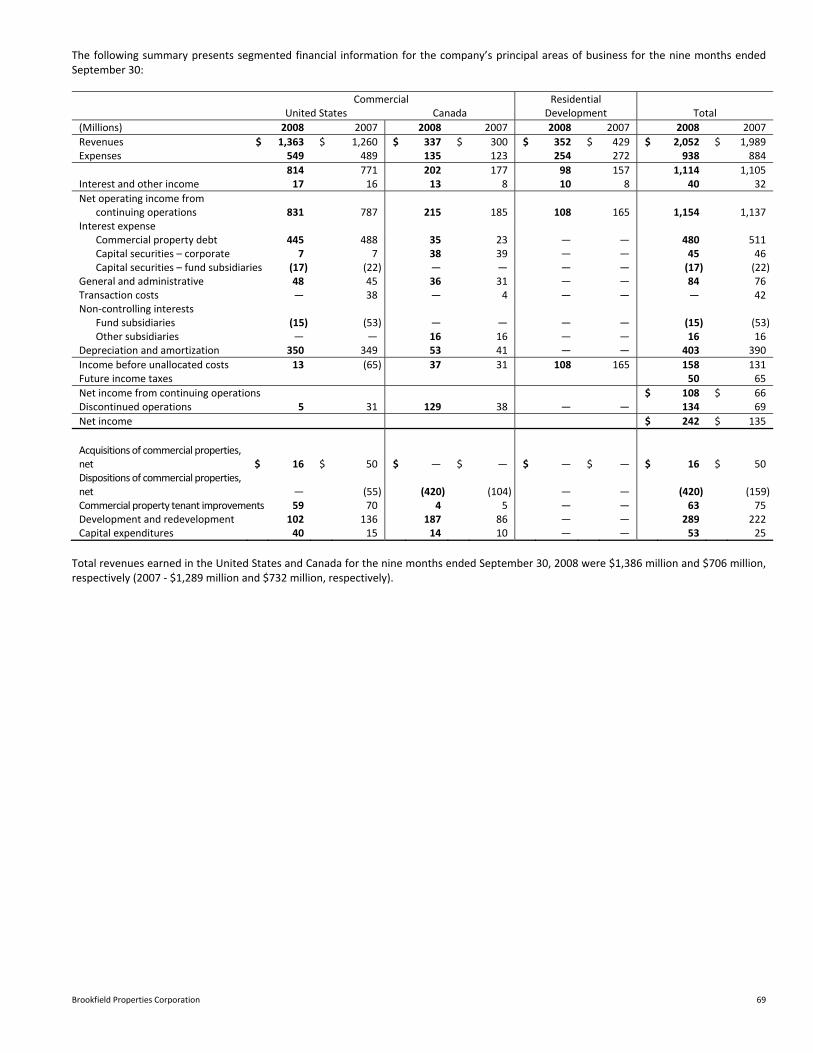
Brookfield Properties Corporation 69
The following summary presents segmented financial information for the company’s principal areas of business for the nine months ended September 30: Commercial Residential United States Canada Development Total
(Millions) 2008 2007 2008 2007 2008 2007 2008 2007
Revenues $ 1,363 $ 1,260 $ 337 $ 300 $ 352 $ 429 $ 2,052 $ 1,989Expenses 549 489 135 123 254 272 938 884
814 771 202 177 98 157 1,114 1,105Interest and other income 17 16 13 8 10 8 40 32
Net operating income from continuing operations 831 787 215 185 108 165 1,154 1,137
Interest expense Commercial property debt 445 488 35 23 ― ― 480 511Capital securities – corporate 7 7 38 39 ― ― 45 46Capital securities – fund subsidiaries (17) (22) ― ― ― ― (17) (22)
General and administrative 48 45 36 31 ― ― 84 76Transaction costs ― 38 ― 4 ― ― ― 42Non‐controlling interests
Fund subsidiaries (15) (53) ― ― ― ― (15) (53)Other subsidiaries ― ― 16 16 ― ― 16 16
Depreciation and amortization 350 349 53 41 ― ― 403 390
Income before unallocated costs 13 (65) 37 31 108 165 158 131Future income taxes 50 65
Net income from continuing operations $ 108 $ 66Discontinued operations 5 31 129 38 ― ― 134 69
Net income $ 242 $ 135
Acquisitions of commercial properties, net
$ 16
$ 50 $ ― $ ― $ ― $ ― $ 16 $ 50
Dispositions of commercial properties, net
― (55) (420) (104) ― ― (420) (159)
Commercial property tenant improvements 59 70 4 5 ― ― 63 75Development and redevelopment 102 136 187 86 ― ― 289 222Capital expenditures 40 15 14 10 ― ― 53 25
Total revenues earned in the United States and Canada for the nine months ended September 30, 2008 were $1,386 million and $706 million, respectively (2007 ‐ $1,289 million and $732 million, respectively).
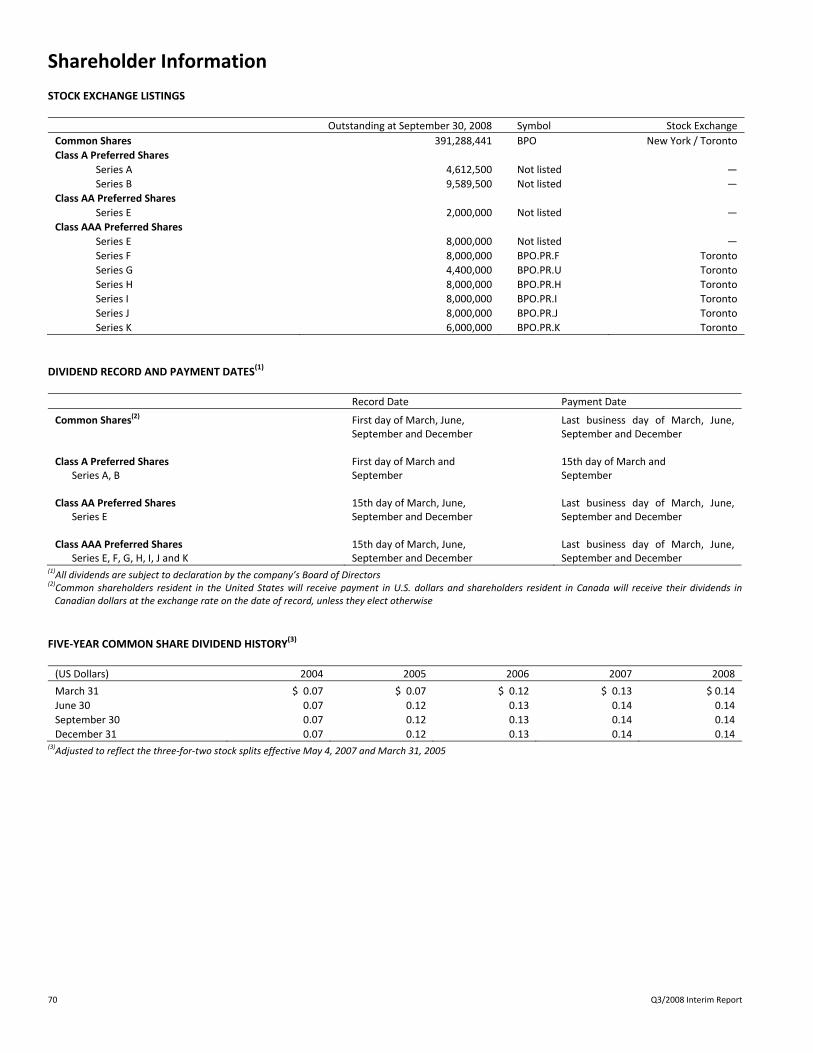
70 Q3/2008 Interim Report
Shareholder Information STOCK EXCHANGE LISTINGS
Outstanding at September 30, 2008 Symbol Stock Exchange
Common Shares 391,288,441 BPO New York / Toronto
Class A Preferred Shares
Series A 4,612,500 Not listed ―
Series B 9,589,500 Not listed ―
Class AA Preferred Shares
Series E 2,000,000 Not listed ―
Class AAA Preferred Shares
Series E 8,000,000 Not listed ―
Series F 8,000,000 BPO.PR.F Toronto
Series G 4,400,000 BPO.PR.U Toronto
Series H 8,000,000 BPO.PR.H Toronto
Series I 8,000,000 BPO.PR.I Toronto
Series J 8,000,000 BPO.PR.J Toronto
Series K 6,000,000 BPO.PR.K Toronto
DIVIDEND RECORD AND PAYMENT DATES
(1)
Record Date Payment Date
Common Shares(2) First day of March, June, September and December
Last business day of March, June, September and December
Class A Preferred Shares Series A, B
First day of March and September
15th day of March and September
Class AA Preferred Shares Series E
15th day of March, June, September and December
Last business day of March, June, September and December
Class AAA Preferred Shares Series E, F, G, H, I, J and K
15th day of March, June, September and December
Last business day of March, June, September and December
(1)All dividends are subject to declaration by the company’s Board of Directors
(2)Common shareholders resident in the United States will receive payment in U.S. dollars and shareholders resident in Canada will receive their dividends in Canadian dollars at the exchange rate on the date of record, unless they elect otherwise
FIVE‐YEAR COMMON SHARE DIVIDEND HISTORY(3)
(US Dollars) 2004 2005 2006 2007 2008
March 31 $ 0.07 $ 0.07 $ 0.12 $ 0.13 $ 0.14
June 30 0.07 0.12 0.13 0.14 0.14
September 30 0.07 0.12 0.13 0.14 0.14
December 31 0.07 0.12 0.13 0.14 0.14 (3)Adjusted to reflect the three‐for‐two stock splits effective May 4, 2007 and March 31, 2005

Brookfield Properties Corporation 71
Corporate Information CORPORATE PROFILE One of North America's largest commercial real estate companies, the corporation owns, develops and manages premier office properties. The office properties portfolio is comprised of interests in 108 properties totaling 74 million square feet in the downtown cores of New York, Boston, Washington, D.C., Los Angeles, Houston, Toronto, Calgary and Ottawa. Landmark assets include the World Financial Center in Manhattan, Brookfield Place in Toronto, Bank of America Plaza in Los Angeles and Bankers Hall in Calgary. The corporation also holds interests in over 17 million square feet of high‐quality, centrally‐located development and redevelopment properties in its major markets. The corporation’s common shares trade on the NYSE and TSX under the symbol BPO. BROOKFIELD PROPERTIES CORPORATION Three World Financial Center Brookfield Place, Bay Wellington Tower 200 Vesey Street, 11th Floor 181 Bay Street, Suite 330 New York, New York 10281‐1021 Toronto, Ontario M5J 2T3 Tel: (212) 417‐7000 Tel: (416) 369‐2300 Fax: (212) 417‐7214 Fax: (416) 369‐2301 www.brookfieldproperties.com SHAREHOLDER INQUIRIES Brookfield Properties welcomes inquiries from shareholders, analysts, media representatives and other interested parties. Questions relating to investor relations or media inquiries can be directed to Melissa Coley, Vice President, Investor Relations at (212) 417‐7215 or via e‐mail at [email protected]. Inquiries regarding financial results should be directed to Bryan Davis, Senior Vice President and Chief Financial Officer at (212) 417‐7166 or via e‐mail at [email protected]. Shareholder questions relating to dividends, address changes and share certificates should be directed to the company’s Transfer Agent: CIBC MELLON TRUST COMPANY By mail: P.O. Box 7010
Adelaide Street Postal Station Toronto, Ontario, M5C 2W9
By courier: 199 Bay Street
Commerce Court West Securities Level Toronto, Ontario, M5L 1G9
Attention: Courier Window Tel: (800) 387‐0825; (416) 643‐5500 Fax: (416) 643‐5501 Web site: www.cibcmellon.com E‐mail: [email protected] COMMUNICATIONS We strive to keep our shareholders updated on our progress through a comprehensive annual report, quarterly interim reports, periodic press releases and quarterly conference calls. Brookfield Properties maintains a Web site, brookfieldproperties.com, which provides access to our published reports, press releases, statutory filings, supplementary information and stock and dividend information as well as summary information on the company. We maintain an investor relations program and respond to inquiries in a timely manner. Management meets on a regular basis with investment analysts and shareholders to ensure that accurate information is available to investors, and conducts quarterly conference calls and webcasts to discuss the company’s financial results. We strive to disseminate material information about the company’s activities to the media in a timely, factual and accurate manner.

www.brookfieldproperties.com


![Bhartrhariiriab.soka.ac.jp › content › pdf › kudo › Kudo2009d-Vākyabheda...41 U.A. Bungalow Road, ]awahar Nagar, Delhi 110007 8Mahalaxmiα国mber, 22Bh叫abhaiDesai Road,](https://static.fdocuments.nl/doc/165x107/5f0f32857e708231d442f7d9/a-content-a-pdf-a-kudo-a-kudo2009d-vkyabheda-41-ua-bungalow-road.jpg)