BigDataBench: a Big Data Benchmark Suite from Internet...
12
BigDataBench: a Big Data Benchmark Suite from Internet Services Lei Wang 1,7 , Jianfeng Zhan *1 , Chunjie Luo 1 , Yuqing Zhu 1 , Qiang Yang 1 , Yongqiang He 2 , Wanling Gao 1 , Zhen Jia 1 , Yingjie Shi 1 , Shujie Zhang 3 , Chen Zheng 1 , Gang Lu 1 , Kent Zhan 4 , Xiaona Li 5 , and Bizhu Qiu 6 1 State Key Laboratory of Computer Architecture (Institute of Computing Technology, Chinese Academy of Sciences) {wanglei 2011, zhanjianfeng, luochunjie, zhuyuqing, yangqiang, gaowanling, jiazhen, shiyingjie, zhengchen, lugang}@ict.ac.cn 2 Dropbox, [email protected] 3 Huawei, [email protected] 4 Tencent, [email protected] 5 Baidu, [email protected] 6 Yahoo!, [email protected] 7 University of Chinese Academy of Sciences, China Abstract As architecture, systems, and data management commu- nities pay greater attention to innovative big data systems and architecture, the pressure of benchmarking and evalu- ating these systems rises. However, the complexity, diver- sity, frequently changed workloads, and rapid evolution of big data systems raise great challenges in big data bench- marking. Considering the broad use of big data systems, for the sake of fairness, big data benchmarks must include diversity of data and workloads, which is the prerequisite for evaluating big data systems and architecture. Most of the state-of-the-art big data benchmarking efforts target e- valuating specific types of applications or system software stacks, and hence they are not qualified for serving the pur- poses mentioned above. This paper presents our joint research efforts on this is- sue with several industrial partners. Our big data bench- mark suite—BigDataBench not only covers broad applica- tion scenarios, but also includes diverse and representative data sets. Currently, we choose 19 big data benchmarks from dimensions of application scenarios, operations/ algo- rithms, data types, data sources, software stacks, and appli- cation types, and they are comprehensive for fairly measur- ing and evaluating big data systems and architecture. Big- DataBench is publicly available from the project home page http://prof.ict.ac.cn/BigDataBench. Also, we comprehensively characterize 19 big data workloads included in BigDataBench with varying data in- puts. On a typical state-of-practice processor, Intel Xeon E5645, we have the following observations: First, in com- * The corresponding author is Jianfeng Zhan. parison with the traditional benchmarks: including PAR- SEC, HPCC, and SPECCPU, big data applications have very low operation intensity, which measures the ratio of the total number of instructions divided by the total byte num- ber of memory accesses; Second, the volume of data input has non-negligible impact on micro-architecture character- istics, which may impose challenges for simulation-based big data architecture research; Last but not least, corrobo- rating the observations in CloudSuite and DCBench (which use smaller data inputs), we find that the numbers of L1 in- struction cache (L1I) misses per 1000 instructions (in short, MPKI) of the big data applications are higher than in the traditional benchmarks; also, we find that L3 caches are ef- fective for the big data applications, corroborating the ob- servation in DCBench. 1 Introduction Data explosion is an inevitable trend as the world is con- nected more than ever. Data are generated faster than ever, and to date about 2.5 quintillion bytes of data are created daily [1]. This speed of data generation will continue in the coming years and is expected to increase at an expo- nential level, according to IDC’s recent survey. The above fact gives birth to the widely circulated concept Big Da- ta. But turning big data into insights or true treasure de- mands an in-depth extraction of their values, which heavily relies upon and hence boosts deployments of massive big data systems. As architecture, systems, and data manage- ment communities pay greater attention to innovative big data systems and architecture [13, 17], [31], the pressure of measuring, comparing, and evaluating these systems rises [19]. Big data benchmarks are the foundation of those ef-
Transcript of BigDataBench: a Big Data Benchmark Suite from Internet...
BigDataBench: a Big Data Benchmark Suite from Internet Services
Lei Wang1,7, Jianfeng Zhan ∗1, Chunjie Luo1, Yuqing Zhu1, Qiang Yang1, Yongqiang He2, Wanling Gao1, Zhen Jia1,Yingjie Shi1, Shujie Zhang3, Chen Zheng1, Gang Lu1, Kent Zhan4, Xiaona Li5, and Bizhu Qiu6
1State Key Laboratory of Computer Architecture (Institute of Computing Technology, Chinese Academy of Sciences){wanglei 2011, zhanjianfeng, luochunjie, zhuyuqing, yangqiang, gaowanling, jiazhen, shiyingjie, zhengchen,
lugang}@ict.ac.cn2Dropbox, [email protected]
3Huawei, [email protected], [email protected]
5Baidu, [email protected]!, [email protected]
7University of Chinese Academy of Sciences, China
AbstractAs architecture, systems, and data management commu-
nities pay greater attention to innovative big data systemsand architecture, the pressure of benchmarking and evalu-ating these systems rises. However, the complexity, diver-sity, frequently changed workloads, and rapid evolution ofbig data systems raise great challenges in big data bench-marking. Considering the broad use of big data systems,for the sake of fairness, big data benchmarks must includediversity of data and workloads, which is the prerequisitefor evaluating big data systems and architecture. Most ofthe state-of-the-art big data benchmarking efforts target e-valuating specific types of applications or system softwarestacks, and hence they are not qualified for serving the pur-poses mentioned above.
This paper presents our joint research efforts on this is-sue with several industrial partners. Our big data bench-mark suite—BigDataBench not only covers broad applica-tion scenarios, but also includes diverse and representativedata sets. Currently, we choose 19 big data benchmarksfrom dimensions of application scenarios, operations/ algo-rithms, data types, data sources, software stacks, and appli-cation types, and they are comprehensive for fairly measur-ing and evaluating big data systems and architecture. Big-DataBench is publicly available from the project home pagehttp://prof.ict.ac.cn/BigDataBench.
Also, we comprehensively characterize 19 big dataworkloads included in BigDataBench with varying data in-puts. On a typical state-of-practice processor, Intel XeonE5645, we have the following observations: First, in com-
∗The corresponding author is Jianfeng Zhan.
parison with the traditional benchmarks: including PAR-SEC, HPCC, and SPECCPU, big data applications havevery low operation intensity, which measures the ratio of thetotal number of instructions divided by the total byte num-ber of memory accesses; Second, the volume of data inputhas non-negligible impact on micro-architecture character-istics, which may impose challenges for simulation-basedbig data architecture research; Last but not least, corrobo-rating the observations in CloudSuite and DCBench (whichuse smaller data inputs), we find that the numbers of L1 in-struction cache (L1I) misses per 1000 instructions (in short,MPKI) of the big data applications are higher than in thetraditional benchmarks; also, we find that L3 caches are ef-fective for the big data applications, corroborating the ob-servation in DCBench.
1 IntroductionData explosion is an inevitable trend as the world is con-
nected more than ever. Data are generated faster than ever,and to date about 2.5 quintillion bytes of data are createddaily [1]. This speed of data generation will continue inthe coming years and is expected to increase at an expo-nential level, according to IDC’s recent survey. The abovefact gives birth to the widely circulated concept Big Da-ta. But turning big data into insights or true treasure de-mands an in-depth extraction of their values, which heavilyrelies upon and hence boosts deployments of massive bigdata systems. As architecture, systems, and data manage-ment communities pay greater attention to innovative bigdata systems and architecture [13, 17], [31], the pressure ofmeasuring, comparing, and evaluating these systems rises[19]. Big data benchmarks are the foundation of those ef-
forts [18]. However, the complexity, diversity, frequentlychanged workloads—so called workload churns [13], andrapid evolution of big data systems impose great challengesto big data benchmarking.
First, there are many classes of big data application-s without comprehensive characterization. Even for inter-net service workloads, there are several important applica-tion domains, e.g., search engines, social networks, and e-commerce. Meanwhile, the value of big data drives the e-mergence of innovative application domains. The diversityof data and workloads needs comprehensive and continuousefforts on big data benchmarking. Second, most big data ap-plications are built on the basis of complex system softwarestacks, e.g., widely used Hadoop systems. However, thereare not one-size-fits-all solutions [27], and hence big datasystem software stacks cover a broad spectrum. Third, evenif some big data applications are mature in terms of businessand technology, customers, vendors, or researchers from a-cademia or even different industry domains do not knowenough about each other. The reason is that most internetservice providers treat data, applications, and web accesslogs as business confidential, which prevents us from build-ing benchmarks.
As summarized in Table 1, most of the state-of-the-artbig data benchmark efforts target evaluating specific typesof applications or system software stacks, and hence fail tocover diversity of workloads and real-world data sets. How-ever, considering the broad use of big data systems, for thesake of fairness, big data benchmarks must include diversi-ty of workloads and data sets, which is the prerequisite forevaluating big data systems and architecture. This paperpresents our joint research efforts on big data benchmark-ing with several industrial partners. Our methodology isfrom real systems, covering not only broad application s-cenarios but also diverse and representative real-world datasets. Since there are many emerging big data applications,we take an incremental and iterative approach in stead of atop-down approach. After investigating typical applicationdomains of internet services—an important class of big da-ta applications, we pay attention to investigating workloadsin three most important application domains according towidely acceptable metrics—the number of page views anddaily visitors, including search engine, e-commerce, and so-cial network. To consider workload candidates, we make atradeoff between choosing different types of applications:including online services, offline analytics, and realtime an-alytics. In addition to workloads in three main applicationdomains, we include micro benchmarks for different datasources, ”Cloud OLTP” workloads1, and relational queries
1OLTP is short for online transaction processing, referring to a classof information systems that facilitate and manage transaction-oriented ap-plications with ACID (Atomicity, Consistency, Isolation, and Durability)support. Different from OLTP workloads, Cloud OLTP workloads do not
workloads, since they are fundamental and widely used. Forthree types of big data applications, we include both widely-used and state-of-the-art system software stacks.
From search engines, social networks, and e-commercedomains, six representative real-world data sets, whose va-rieties are reflected in two dimensions of data types and da-ta sources, are collected, with the whole spectrum of da-ta types including structured, semi-structured, and unstruc-tured data. Currently, the included data sources are text,graph, and table data. Using these real data sets as the seed,the data generators [23] of BigDataBench generate synthet-ic data by scaling the seed data while keeping the data char-acteristics of raw data. To date, we chose and developednineteen big data benchmarks from dimensions of appli-cation scenarios, operations/ algorithms, data types, datasources, software stacks, and application types. We alsoplan to provide different implementations using the othersoftware stacks. All the software code is available from [6].
On a typical state-of-practice processor: Intel XeonE5645, we comprehensively characterize nineteen big da-ta workloads included in BigDataBench with varying datainputs and have the following observation. First, in com-parison with the traditional benchmarks: including HPCC,PARSEC, and SPECCPU, the floating point operation in-tensity of BigDataBench is two orders of magnitude lowerthan in the traditional benchmarks. Though for the big da-ta applications, the average ratio of integer instructions tofloating point instructions is about two orders of magnitudehigher than in the traditional benchmarks, the average inte-ger operation intensity of the big data applications is still inthe same order of magnitude like those of the other bench-marks. Second, we observe that the volume of data inputhas non-negligible impact on micro-architecture events. Forthe worst cases, the number of MIPS (Million InstructionsPer Second) of Grep has a 2.9 times gap between the base-line and the 32X data volume; the number of L3 cache MP-KI of K-means has a 2.5 times gap between the baseline andthe 32X data volume. This case may impose challenges forbig data architecture research, since simulation-based ap-proaches are widely used in architecture research and theyare very time-consuming. Last but not least, corroborat-ing the observations in CloudSuite [17] and DCBench [21](which use smaller data inputs), we find that the numbers ofL1I cache MPKI of the big data applications are higher thanin the traditional benchmarks. We also find that L3 cachesare effective for the big data applications, corroborating theobservation in DCBench [21].
The rest of this paper is organized as follows. In Sec-tion 2, we discuss big data benchmarking requirements.Section 3 presents the related work. Section 4 sum-marizes our benchmarking methodology and decisions—-BigDataBench. Section 5 presents how to synthesize big
need ACID support.
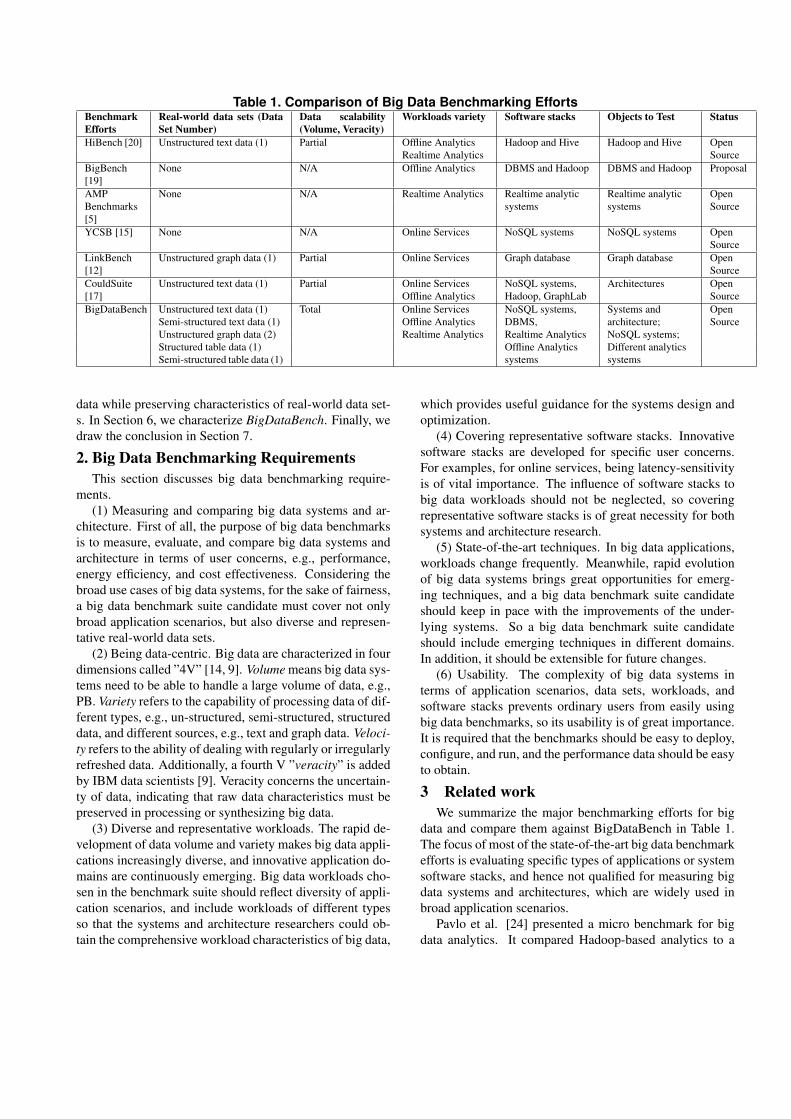
Table 1. Comparison of Big Data Benchmarking EffortsBenchmarkEfforts
Real-world data sets (DataSet Number)
Data scalability(Volume, Veracity)
Workloads variety Software stacks Objects to Test Status
HiBench [20] Unstructured text data (1) Partial Offline Analytics Hadoop and Hive Hadoop and Hive OpenRealtime Analytics Source
BigBench[19]
None N/A Offline Analytics DBMS and Hadoop DBMS and Hadoop Proposal
AMP None N/A Realtime Analytics Realtime analytic Realtime analytic OpenBenchmarks[5]
systems systems Source
YCSB [15] None N/A Online Services NoSQL systems NoSQL systems OpenSource
LinkBench[12]
Unstructured graph data (1) Partial Online Services Graph database Graph database OpenSource
CouldSuite Unstructured text data (1) Partial Online Services NoSQL systems, Architectures Open[17] Offline Analytics Hadoop, GraphLab SourceBigDataBench Unstructured text data (1) Total Online Services NoSQL systems, Systems and Open
Semi-structured text data (1) Offline Analytics DBMS, architecture; SourceUnstructured graph data (2) Realtime Analytics Realtime Analytics NoSQL systems;Structured table data (1) Offline Analytics Different analyticsSemi-structured table data (1) systems systems
data while preserving characteristics of real-world data set-s. In Section 6, we characterize BigDataBench. Finally, wedraw the conclusion in Section 7.
2. Big Data Benchmarking RequirementsThis section discusses big data benchmarking require-
ments.(1) Measuring and comparing big data systems and ar-
chitecture. First of all, the purpose of big data benchmarksis to measure, evaluate, and compare big data systems andarchitecture in terms of user concerns, e.g., performance,energy efficiency, and cost effectiveness. Considering thebroad use cases of big data systems, for the sake of fairness,a big data benchmark suite candidate must cover not onlybroad application scenarios, but also diverse and represen-tative real-world data sets.
(2) Being data-centric. Big data are characterized in fourdimensions called ”4V” [14, 9]. Volume means big data sys-tems need to be able to handle a large volume of data, e.g.,PB. Variety refers to the capability of processing data of dif-ferent types, e.g., un-structured, semi-structured, structureddata, and different sources, e.g., text and graph data. Veloci-ty refers to the ability of dealing with regularly or irregularlyrefreshed data. Additionally, a fourth V ”veracity” is addedby IBM data scientists [9]. Veracity concerns the uncertain-ty of data, indicating that raw data characteristics must bepreserved in processing or synthesizing big data.
(3) Diverse and representative workloads. The rapid de-velopment of data volume and variety makes big data appli-cations increasingly diverse, and innovative application do-mains are continuously emerging. Big data workloads cho-sen in the benchmark suite should reflect diversity of appli-cation scenarios, and include workloads of different typesso that the systems and architecture researchers could ob-tain the comprehensive workload characteristics of big data,
which provides useful guidance for the systems design andoptimization.
(4) Covering representative software stacks. Innovativesoftware stacks are developed for specific user concerns.For examples, for online services, being latency-sensitivityis of vital importance. The influence of software stacks tobig data workloads should not be neglected, so coveringrepresentative software stacks is of great necessity for bothsystems and architecture research.
(5) State-of-the-art techniques. In big data applications,workloads change frequently. Meanwhile, rapid evolutionof big data systems brings great opportunities for emerg-ing techniques, and a big data benchmark suite candidateshould keep in pace with the improvements of the under-lying systems. So a big data benchmark suite candidateshould include emerging techniques in different domains.In addition, it should be extensible for future changes.
(6) Usability. The complexity of big data systems interms of application scenarios, data sets, workloads, andsoftware stacks prevents ordinary users from easily usingbig data benchmarks, so its usability is of great importance.It is required that the benchmarks should be easy to deploy,configure, and run, and the performance data should be easyto obtain.
3 Related workWe summarize the major benchmarking efforts for big
data and compare them against BigDataBench in Table 1.The focus of most of the state-of-the-art big data benchmarkefforts is evaluating specific types of applications or systemsoftware stacks, and hence not qualified for measuring bigdata systems and architectures, which are widely used inbroad application scenarios.
Pavlo et al. [24] presented a micro benchmark for bigdata analytics. It compared Hadoop-based analytics to a
row-based RDBMS system and a column-based RDBMSone. It is the Spark [30] and Shark [16] systems that in-spire the AMP Lab big data benchmarks [5], which target-s real-time analytic. This effort follows the benchmarkingmethodology in [24]. The benchmarks not only have a lim-ited coverage of workloads, but also cover only table da-ta. Its object under test is restricted to realtime analyticsframeworks. HiBench [20] is a benchmark suite for HadoopMapReduce and Hive. It covers incomplete data types andsoftware stacks. GridMix [2] is a benchmark specially de-signed for Hadoop MapReduce, which includes only microbenchmarks for text data.
Internet services players also try to develop their bench-mark suites. Yahoo! released their cloud benchmark spe-cially for data storage systems, i.e, YCSB [15]. Having itsroot in cloud computing, YCSB is mainly for simple onlineservice workloads—-so called ”Cloud OLTP” workloads.Armstrong et al. [12] characterized the social graph dataand database workloads for Facebook’s social network, andpresented the motivation, design, and implementation ofLinkBench, a database benchmark that reflects real-worlddatabase workloads for social network applications. TheTeraSort or GraySort benchmark [10] considers the perfor-mance and cost involved in sorting a large number of 100-byte records, and its workload is not sufficient to cover thevarious needs of big data processing. TPC-DS is TPC’s lat-est decision support benchmark, covering complex relation-al queries for decision support. TPC-DS handles some as-pects of big data like volume and velocity. Still, it lacks keydata types like semi-structured and unstructured data andkey applications types like realtime analytics. BigBench[19] is the recent effort towards designing big data bench-marks. BigBench focuses on big data offline analytics, thusadopting TPC-DS as the basis and adding atop new datatypes like semi-/un-structured data, as well as non-relationalworkloads. Although BigBench has a complete coverage ofdata types, its object under test is DBMS and MapReducesystems that claim to provide big data solutions, leading topartial coverage of software stacks. Furthermore, currently,it is not open-source for easy usage and adoption.
Recently, architecture communities also proposedCloudSuite [17] for scale-out cloud workloads, and D-CBench [21] for datacenter workloads. Those efforts in-clude small data sets, e.g., only 4.5 GB for Naive Bayesreported in CloudSuite [17]. Moreover, they fail to includediversity of real-world data sets and workloads. For exam-ple, for both CloudSuite and DCBench, realtime big data an-alytics workloads are not included, while they are very im-portant emerging big data workloads. Moreover, they paidlittle attention to how to generate diversity of scalable bigdata sets (volume) while keeping their veracity.
4 Our Benchmarking Methodology and De-cisions
This section presents our methodology and decisions onBigDataBench.
4.1 Our Benchmarking Methodology
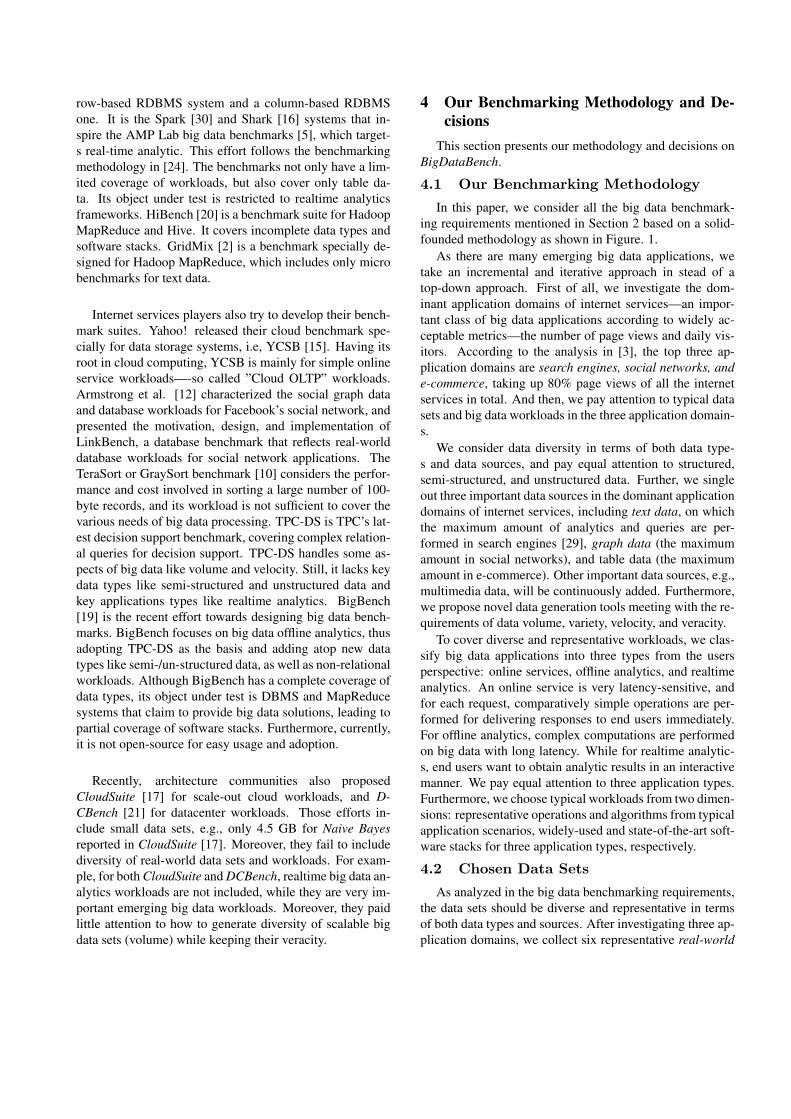
In this paper, we consider all the big data benchmark-ing requirements mentioned in Section 2 based on a solid-founded methodology as shown in Figure. 1.
As there are many emerging big data applications, wetake an incremental and iterative approach in stead of atop-down approach. First of all, we investigate the dom-inant application domains of internet services—an impor-tant class of big data applications according to widely ac-ceptable metrics—the number of page views and daily vis-itors. According to the analysis in [3], the top three ap-plication domains are search engines, social networks, ande-commerce, taking up 80% page views of all the internetservices in total. And then, we pay attention to typical datasets and big data workloads in the three application domain-s.
We consider data diversity in terms of both data type-s and data sources, and pay equal attention to structured,semi-structured, and unstructured data. Further, we singleout three important data sources in the dominant applicationdomains of internet services, including text data, on whichthe maximum amount of analytics and queries are per-formed in search engines [29], graph data (the maximumamount in social networks), and table data (the maximumamount in e-commerce). Other important data sources, e.g.,multimedia data, will be continuously added. Furthermore,we propose novel data generation tools meeting with the re-quirements of data volume, variety, velocity, and veracity.
To cover diverse and representative workloads, we clas-sify big data applications into three types from the usersperspective: online services, offline analytics, and realtimeanalytics. An online service is very latency-sensitive, andfor each request, comparatively simple operations are per-formed for delivering responses to end users immediately.For offline analytics, complex computations are performedon big data with long latency. While for realtime analytic-s, end users want to obtain analytic results in an interactivemanner. We pay equal attention to three application types.Furthermore, we choose typical workloads from two dimen-sions: representative operations and algorithms from typicalapplication scenarios, widely-used and state-of-the-art soft-ware stacks for three application types, respectively.
4.2 Chosen Data Sets
As analyzed in the big data benchmarking requirements,the data sets should be diverse and representative in termsof both data types and sources. After investigating three ap-plication domains, we collect six representative real-world
Representative
Real Data Sets
Diverse and
Important
workloads
Synthetic data generation tool preserving data characteristicsInvestigate
Typical
Application
Domains
BigDataBench:
Big Data
Benchmark Suite
Data types :
· Structured data
· Unstructured data
· Semi-Structured data
Data Sources
· Table data
· Text data
· Graph data
· Extended…
Application types :
· Offline analytics
· Realtime analytics
· Online services
Big Data Sets
Preserving 4V
Big Data
Workloads
Basic & Important
Algorithms and
Operations
Extended…..
Representative
Software Stacks
Extended...
Figure 1. BigDataBench Methodology.
data sets. Our chosen data sets are diverse in three dimen-sions: data types, data sources, and application domains.Table 2 shows the characteristics of six real-world data sets.The original data set sizes are not necessarily scaled to thehardware and software to be tested. We need to scale thevolume of the data sets while keeping their veracity, whichwe discuss in Section 5.
Table 2. The summary of real-world data sets.
No. data sets data size1 Wikipedia Entries 4,300,000 English articles2 Amazon Movie
Reviews7,911,684 reviews
3 Google WebGraph
875713 nodes, 5105039edges
4 Facebook SocialNetwork
4039 nodes, 88234 edges
5 E-commerceTransaction Data
Table 1: 4 columns, 38658rows. Table 2: 6 columns,242735 rows
6 ProfSearch Per-son Resumes
278956 resumes
Wikipedia Entries [11]. The Wikipedia data set is un-structured, consisting of 4,300,000 English articles. Fourworkloads use this data set, including Sort, Grep, Word-Count and Index.
Amazon Movie Reviews [4]. This data set is semi-structured, consisting of 7,911,684 reviews on 889,176movies by 253,059 users. The data span from Aug 1997 toOct 2012. Two workloads use this data set, including NaiveBayes for sentiment classification, and Collaborative Filter-ing (in short, CF)– a typical recommendation algorithm.
Google Web Graph (Directed graph)[8]. This data setis unstructured, containing 875713 nodes representing webpages and 5105039 edges representing the links betweenweb pages. This data set is released by Google as a part ofGoogle Programming Contest. We use it for PageRank.
Facebook Social Graph (Undirected graph) [7]. Thisdata set contains 4039 nodes, which represent users, and
Table 3. Schema of E-commerce TransactionData
ORDER ITEMORDER ID INT ITEM ID INTBUYER ID INT ORDER ID INT
CREATE DATE DATE GOODS ID INTGOODS NUMBER NUMBER(10,2)
GOODS PRICE NUMBER(10,2)GOODS AMOUNT NUMBER(14,6)
88234 edges, which represent friendship between users.The data set is used for the graph mining workload– Con-nected Components, in short (CC).
E-commerce Transaction Data. This data set is froman e-commerce web site, which we keep anonymous by re-quest. The data set is structured, consisting of two tables:ORDER and order ITEM. The details are shown in Table 3.This data set is used for the relational queries workloads.
ProfSearch Person Resumes. This data set is from avertical search engine for scientists developed by ourselves,and its web site is http://prof.ict.ac.cn. The da-ta set is semi-structured, consisting of 278956 resumes au-tomatically extracted from 20,000,000 web pages of about200 universities and research institutions. This data set isused for ”Cloud OLTP” workloads.
We plan to add other real-world data sets to investigatethe impact of different data sets on the same workloads.
4.3 Chosen Workloads
We choose the BigDataBench workloads with the fol-lowing considerations: 1) Paying equal attention to differ-ent types of applications: online service, real-time analytics,and offline analytics; 2) Covering workloads in diverse andrepresentative application scenarios ; 3) Including differentdata sources: text, graph, and table data; 4) Covering therepresentative big data software stacks.
In total, we choose 19 big data benchmarks. Table 4presents BigDataBench from perspectives of application s-cenarios, operations/ algorithms, data types, data sources,software stacks, and application types. For some end users,they may just pay attention to big data application of a spe-
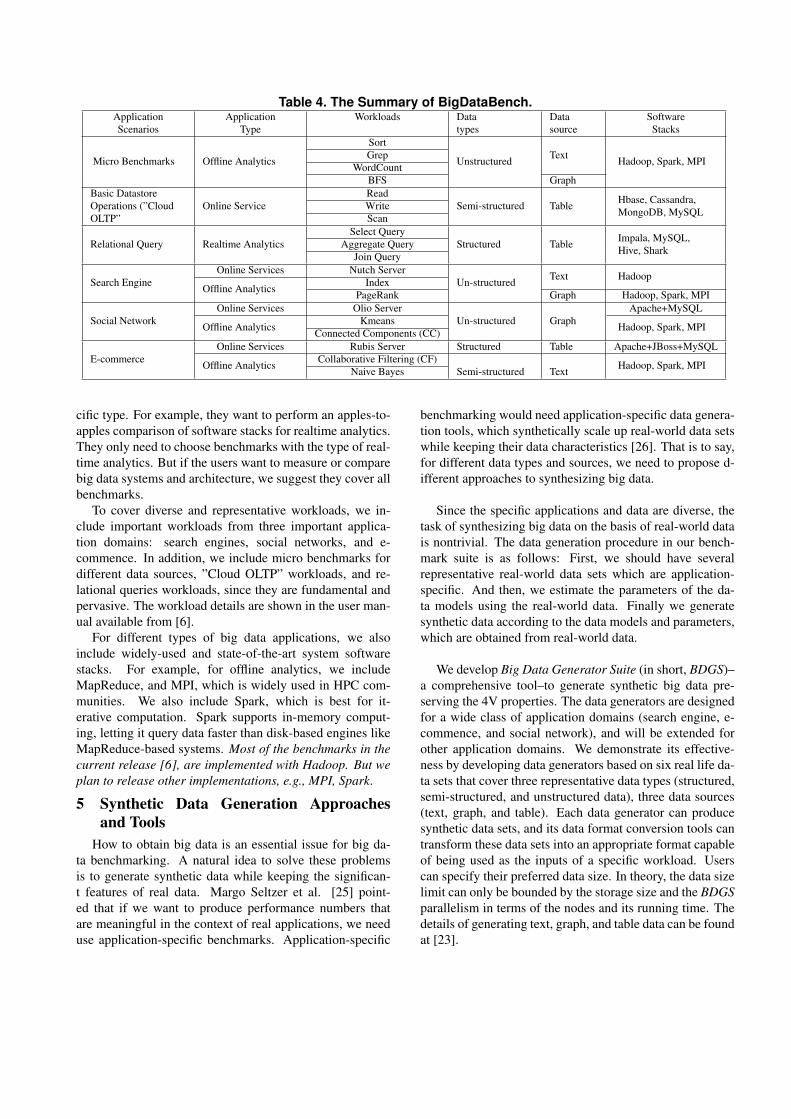
Table 4. The Summary of BigDataBench.Application Application Workloads Data Data SoftwareScenarios Type types source Stacks
Micro Benchmarks Offline Analytics
Sort
Unstructured Text Hadoop, Spark, MPIGrepWordCount
BFS GraphBasic DatastoreOperations (”CloudOLTP”
Online ServiceRead
Semi-structured Table Hbase, Cassandra,MongoDB, MySQLWrite
Scan
Relational Query Realtime AnalyticsSelect Query
Structured Table Impala, MySQL,Hive, SharkAggregate Query
Join Query
Search EngineOnline Services Nutch Server
Un-structured Text HadoopOffline Analytics Index
PageRank Graph Hadoop, Spark, MPI
Social NetworkOnline Services Olio Server
Un-structured GraphApache+MySQL
Offline Analytics Kmeans Hadoop, Spark, MPIConnected Components (CC)
E-commerceOnline Services Rubis Server Structured Table Apache+JBoss+MySQL
Offline Analytics Collaborative Filtering (CF) Hadoop, Spark, MPINaive Bayes Semi-structured Text
cific type. For example, they want to perform an apples-to-apples comparison of software stacks for realtime analytics.They only need to choose benchmarks with the type of real-time analytics. But if the users want to measure or comparebig data systems and architecture, we suggest they cover allbenchmarks.
To cover diverse and representative workloads, we in-clude important workloads from three important applica-tion domains: search engines, social networks, and e-commence. In addition, we include micro benchmarks fordifferent data sources, ”Cloud OLTP” workloads, and re-lational queries workloads, since they are fundamental andpervasive. The workload details are shown in the user man-ual available from [6].
For different types of big data applications, we alsoinclude widely-used and state-of-the-art system softwarestacks. For example, for offline analytics, we includeMapReduce, and MPI, which is widely used in HPC com-munities. We also include Spark, which is best for it-erative computation. Spark supports in-memory comput-ing, letting it query data faster than disk-based engines likeMapReduce-based systems. Most of the benchmarks in thecurrent release [6], are implemented with Hadoop. But weplan to release other implementations, e.g., MPI, Spark.
5 Synthetic Data Generation Approachesand Tools
How to obtain big data is an essential issue for big da-ta benchmarking. A natural idea to solve these problemsis to generate synthetic data while keeping the significan-t features of real data. Margo Seltzer et al. [25] point-ed that if we want to produce performance numbers thatare meaningful in the context of real applications, we needuse application-specific benchmarks. Application-specific
benchmarking would need application-specific data genera-tion tools, which synthetically scale up real-world data setswhile keeping their data characteristics [26]. That is to say,for different data types and sources, we need to propose d-ifferent approaches to synthesizing big data.
Since the specific applications and data are diverse, thetask of synthesizing big data on the basis of real-world datais nontrivial. The data generation procedure in our bench-mark suite is as follows: First, we should have severalrepresentative real-world data sets which are application-specific. And then, we estimate the parameters of the da-ta models using the real-world data. Finally we generatesynthetic data according to the data models and parameters,which are obtained from real-world data.
We develop Big Data Generator Suite (in short, BDGS)–a comprehensive tool–to generate synthetic big data pre-serving the 4V properties. The data generators are designedfor a wide class of application domains (search engine, e-commence, and social network), and will be extended forother application domains. We demonstrate its effective-ness by developing data generators based on six real life da-ta sets that cover three representative data types (structured,semi-structured, and unstructured data), three data sources(text, graph, and table). Each data generator can producesynthetic data sets, and its data format conversion tools cantransform these data sets into an appropriate format capableof being used as the inputs of a specific workload. Userscan specify their preferred data size. In theory, the data sizelimit can only be bounded by the storage size and the BDGSparallelism in terms of the nodes and its running time. Thedetails of generating text, graph, and table data can be foundat [23].
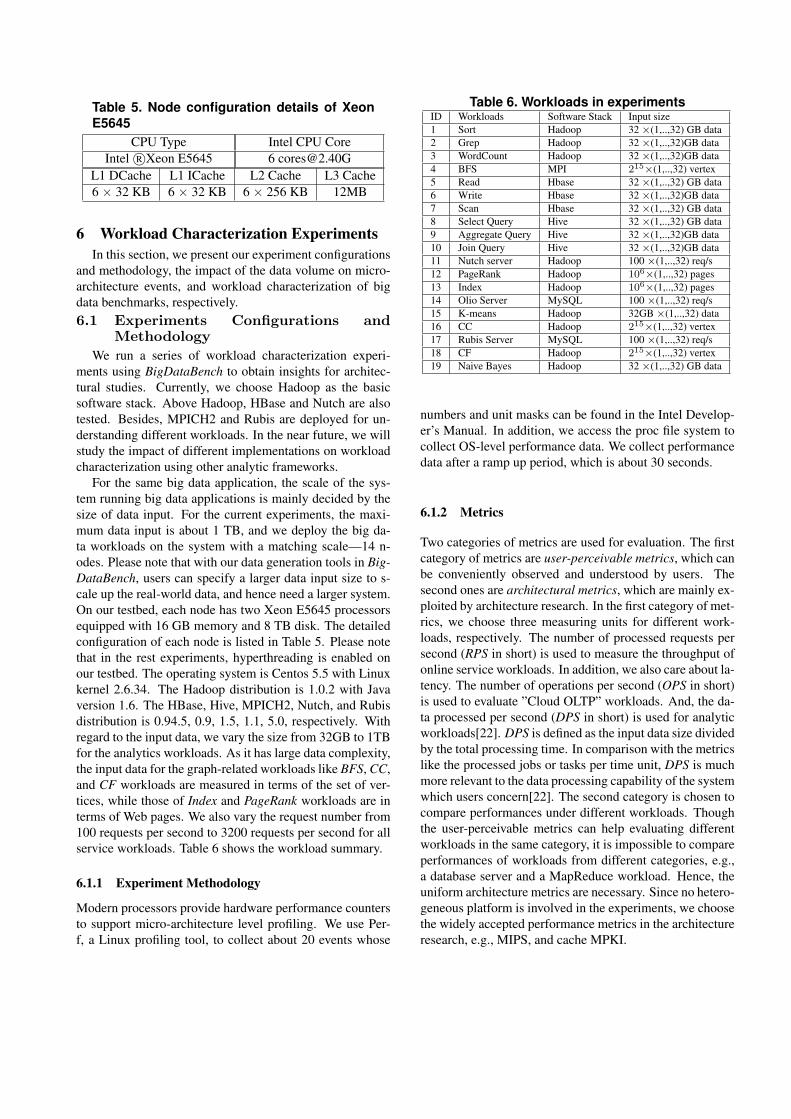
Table 5. Node configuration details of XeonE5645
CPU Type Intel CPU CoreIntel R⃝Xeon E5645 6 [email protected]
L1 DCache L1 ICache L2 Cache L3 Cache6 × 32 KB 6 × 32 KB 6 × 256 KB 12MB
6 Workload Characterization ExperimentsIn this section, we present our experiment configurations
and methodology, the impact of the data volume on micro-architecture events, and workload characterization of bigdata benchmarks, respectively.6.1 Experiments Configurations and
Methodology
We run a series of workload characterization experi-ments using BigDataBench to obtain insights for architec-tural studies. Currently, we choose Hadoop as the basicsoftware stack. Above Hadoop, HBase and Nutch are alsotested. Besides, MPICH2 and Rubis are deployed for un-derstanding different workloads. In the near future, we willstudy the impact of different implementations on workloadcharacterization using other analytic frameworks.
For the same big data application, the scale of the sys-tem running big data applications is mainly decided by thesize of data input. For the current experiments, the maxi-mum data input is about 1 TB, and we deploy the big da-ta workloads on the system with a matching scale—14 n-odes. Please note that with our data generation tools in Big-DataBench, users can specify a larger data input size to s-cale up the real-world data, and hence need a larger system.On our testbed, each node has two Xeon E5645 processorsequipped with 16 GB memory and 8 TB disk. The detailedconfiguration of each node is listed in Table 5. Please notethat in the rest experiments, hyperthreading is enabled onour testbed. The operating system is Centos 5.5 with Linuxkernel 2.6.34. The Hadoop distribution is 1.0.2 with Javaversion 1.6. The HBase, Hive, MPICH2, Nutch, and Rubisdistribution is 0.94.5, 0.9, 1.5, 1.1, 5.0, respectively. Withregard to the input data, we vary the size from 32GB to 1TBfor the analytics workloads. As it has large data complexity,the input data for the graph-related workloads like BFS, CC,and CF workloads are measured in terms of the set of ver-tices, while those of Index and PageRank workloads are interms of Web pages. We also vary the request number from100 requests per second to 3200 requests per second for allservice workloads. Table 6 shows the workload summary.
6.1.1 Experiment Methodology
Modern processors provide hardware performance countersto support micro-architecture level profiling. We use Per-f, a Linux profiling tool, to collect about 20 events whose
Table 6. Workloads in experimentsID Workloads Software Stack Input size1 Sort Hadoop 32 ×(1,..,32) GB data2 Grep Hadoop 32 ×(1,..,32)GB data3 WordCount Hadoop 32 ×(1,..,32)GB data4 BFS MPI 215×(1,..,32) vertex5 Read Hbase 32 ×(1,..,32) GB data6 Write Hbase 32 ×(1,..,32)GB data7 Scan Hbase 32 ×(1,..,32) GB data8 Select Query Hive 32 ×(1,..,32) GB data9 Aggregate Query Hive 32 ×(1,..,32)GB data10 Join Query Hive 32 ×(1,..,32)GB data11 Nutch server Hadoop 100 ×(1,..,32) req/s12 PageRank Hadoop 106×(1,..,32) pages13 Index Hadoop 106×(1,..,32) pages14 Olio Server MySQL 100 ×(1,..,32) req/s15 K-means Hadoop 32GB ×(1,..,32) data16 CC Hadoop 215×(1,..,32) vertex17 Rubis Server MySQL 100 ×(1,..,32) req/s18 CF Hadoop 215×(1,..,32) vertex19 Naive Bayes Hadoop 32 ×(1,..,32) GB data
numbers and unit masks can be found in the Intel Develop-er’s Manual. In addition, we access the proc file system tocollect OS-level performance data. We collect performancedata after a ramp up period, which is about 30 seconds.
6.1.2 Metrics
Two categories of metrics are used for evaluation. The firstcategory of metrics are user-perceivable metrics, which canbe conveniently observed and understood by users. Thesecond ones are architectural metrics, which are mainly ex-ploited by architecture research. In the first category of met-rics, we choose three measuring units for different work-loads, respectively. The number of processed requests persecond (RPS in short) is used to measure the throughput ofonline service workloads. In addition, we also care about la-tency. The number of operations per second (OPS in short)is used to evaluate ”Cloud OLTP” workloads. And, the da-ta processed per second (DPS in short) is used for analyticworkloads[22]. DPS is defined as the input data size dividedby the total processing time. In comparison with the metricslike the processed jobs or tasks per time unit, DPS is muchmore relevant to the data processing capability of the systemwhich users concern[22]. The second category is chosen tocompare performances under different workloads. Thoughthe user-perceivable metrics can help evaluating differentworkloads in the same category, it is impossible to compareperformances of workloads from different categories, e.g.,a database server and a MapReduce workload. Hence, theuniform architecture metrics are necessary. Since no hetero-geneous platform is involved in the experiments, we choosethe widely accepted performance metrics in the architectureresearch, e.g., MIPS, and cache MPKI.
6.1.3 The Other Benchmarks Setup
For SPEC CPU2006, we run the official applications withthe first reference input, and report the average results in-to two groups: integer benchmarks (SPECINT) and floatingpoint benchmarks (SPECFP). HPCC is a representative H-PC benchmark suite, and we run HPCC with version 1.4.We run all seven benchmarks, including HPL, STREAM, P-TRANS, RandomAccess, DGEMM, FFT, and COMM. PAR-SEC is a benchmark suite composed of multi-threaded pro-grams, and we deploy PARSEC 3.0 Beta Release. We runall 12 benchmarks with native input data sets and use gccwith version 4.1.2 to compile them.
6.2 The Implication of Data Volume forArchitecture Research
Intuitively, data input should be highly relevant to big da-ta workloads characterization. Specifically, the size of datainput should be relevant to micro-architectural characteris-tics. In this subsection, we pay attention to an importantissue—what amount of data qualifies for being called bigdata from a perspective of workload characterization? Thisissue is very important and interesting, because simulationis the basic approach for architecture research, but it is verytime-consuming. Bigger input data size would significantlyincrease the run time of a program, especially on the sim-ulation platform. If there is no obvious difference betweenlarge and small data inputs in terms of micro-architecturalevents, the simulation-based approaches using small datasets can still be valid for architecture research. As differ-ent workloads have different input data types and sizes, weset the minimum data scales in Table 6 as the baseline datainputs, e.g., 32 GB for Sort, 1000000 pages for PageRank,and 100 requests per second for Nutch Server. On the base-line data input, we scale up the data size by 4, 8, 16 and 32times, respectively.
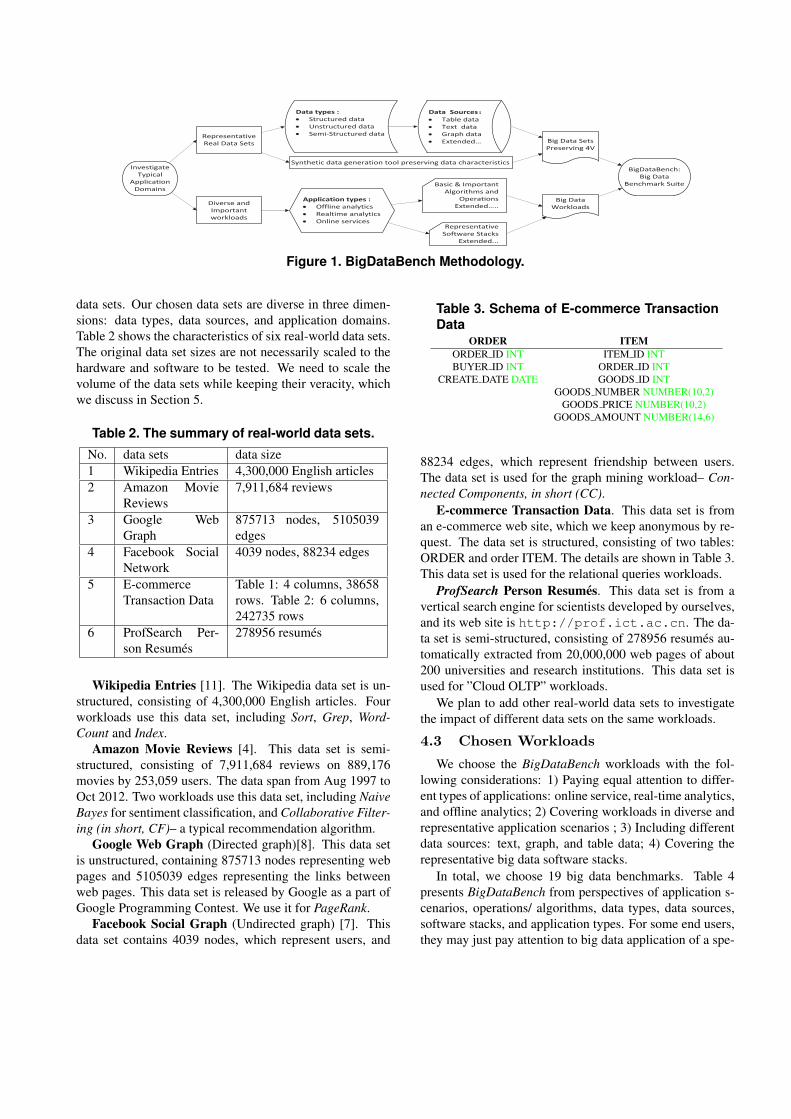
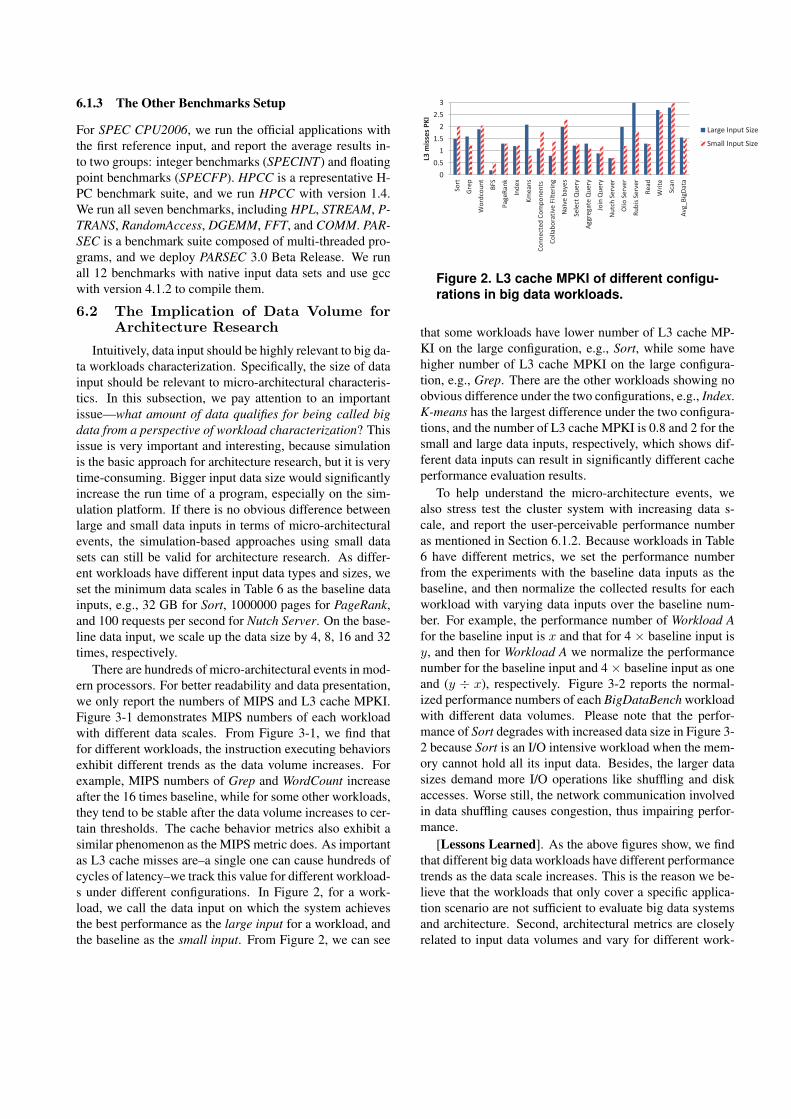
There are hundreds of micro-architectural events in mod-ern processors. For better readability and data presentation,we only report the numbers of MIPS and L3 cache MPKI.Figure 3-1 demonstrates MIPS numbers of each workloadwith different data scales. From Figure 3-1, we find thatfor different workloads, the instruction executing behaviorsexhibit different trends as the data volume increases. Forexample, MIPS numbers of Grep and WordCount increaseafter the 16 times baseline, while for some other workloads,they tend to be stable after the data volume increases to cer-tain thresholds. The cache behavior metrics also exhibit asimilar phenomenon as the MIPS metric does. As importantas L3 cache misses are–a single one can cause hundreds ofcycles of latency–we track this value for different workload-s under different configurations. In Figure 2, for a work-load, we call the data input on which the system achievesthe best performance as the large input for a workload, andthe baseline as the small input. From Figure 2, we can see
0
0.5
1
1.5
2
2.5
3
So
rt
Gre
p
Wo
rdco
un
t
BF
S
Pa
ge
Ra
nk
Ind
ex
Km
ea
ns
Co
nn
ect
ed
Co
mp
on
en
ts
Co
lla
bo
rati
ve
Fil
teri
ng
Na
ïve
ba
ye
s
Se
lect
Qu
ery
Ag
gre
ga
te Q
ue
ry
Join
Qu
ery
Nu
tch
Se
rve
r
Oli
o S
erv
er
Ru
bis
Se
rve
r
Re
ad
Wri
te
Sca
n
Av
g_
Big
Da
ta
L3
mis
se
s P
KI
Large Input Size
Small Input Size
Figure 2. L3 cache MPKI of different configu-rations in big data workloads.
that some workloads have lower number of L3 cache MP-KI on the large configuration, e.g., Sort, while some havehigher number of L3 cache MPKI on the large configura-tion, e.g., Grep. There are the other workloads showing noobvious difference under the two configurations, e.g., Index.K-means has the largest difference under the two configura-tions, and the number of L3 cache MPKI is 0.8 and 2 for thesmall and large data inputs, respectively, which shows dif-ferent data inputs can result in significantly different cacheperformance evaluation results.
To help understand the micro-architecture events, wealso stress test the cluster system with increasing data s-cale, and report the user-perceivable performance numberas mentioned in Section 6.1.2. Because workloads in Table6 have different metrics, we set the performance numberfrom the experiments with the baseline data inputs as thebaseline, and then normalize the collected results for eachworkload with varying data inputs over the baseline num-ber. For example, the performance number of Workload Afor the baseline input is x and that for 4 × baseline input isy, and then for Workload A we normalize the performancenumber for the baseline input and 4 × baseline input as oneand (y ÷ x), respectively. Figure 3-2 reports the normal-ized performance numbers of each BigDataBench workloadwith different data volumes. Please note that the perfor-mance of Sort degrades with increased data size in Figure 3-2 because Sort is an I/O intensive workload when the mem-ory cannot hold all its input data. Besides, the larger datasizes demand more I/O operations like shuffling and diskaccesses. Worse still, the network communication involvedin data shuffling causes congestion, thus impairing perfor-mance.
[Lessons Learned]. As the above figures show, we findthat different big data workloads have different performancetrends as the data scale increases. This is the reason we be-lieve that the workloads that only cover a specific applica-tion scenario are not sufficient to evaluate big data systemsand architecture. Second, architectural metrics are closelyrelated to input data volumes and vary for different work-
0
5000
10000
15000
20000
25000
30000
35000
MIP
S
3-1 MIPS of different workloads with different data scale
Baseline
4X
8X
16X
32X
0
1
2
3
4
5
6
7
Sp
ee
dU
p
3-2 Speedup of different workloads with different data scale
Baseline
4X
8X
16X
32X
Figure 3. Performance data vary with different data input sizes.
loads, and data volume has non-negligible impact on work-load characterization. For example, the MIPS number ofGrep has a 2.9 times gap between the baseline and 32X da-ta volume; the L3 cache MPKI of K-means has a 2.5 timesgap between the baseline and 32X data volume. This resultimplies that using only simple applications with small datasets is not sufficient for big data systems and architectureresearch, which may impose great challenges.
6.3 Workload Characterization
This section mainly focuses on characterizing operationintensity and cache behaviors of big data workloads.
0%10%20%30%40%50%60%70%80%90%
100%
So
rt
Gre
p
Wo
rdco
un
t
BF
S
Pa
ge
Ra
nk
Ind
ex
Km
ea
ns
Co
nn
ect
ed
Co
mp
on
en
ts
Co
lla
bo
rati
ve
Fil
teri
ng
Na
ive
Ba
ye
s
Se
lect
Qu
ery
Ag
gre
ga
te Q
ue
ry
Join
Qu
ery
Nu
tch
Se
rve
r
Oli
o S
erv
er
Ru
bis
Se
rve
r
Re
ad
Wri
te
Sca
n
Av
g_
Big
Da
ta
Av
g_
HP
CC
Av
g_
Pa
rse
c
Sp
ecF
P
Sp
ecI
nt
Integer
FP
Branch
Store
Load
Figure 4. Instruction Breakdown.
6.3.1 Measuring operation intensity.
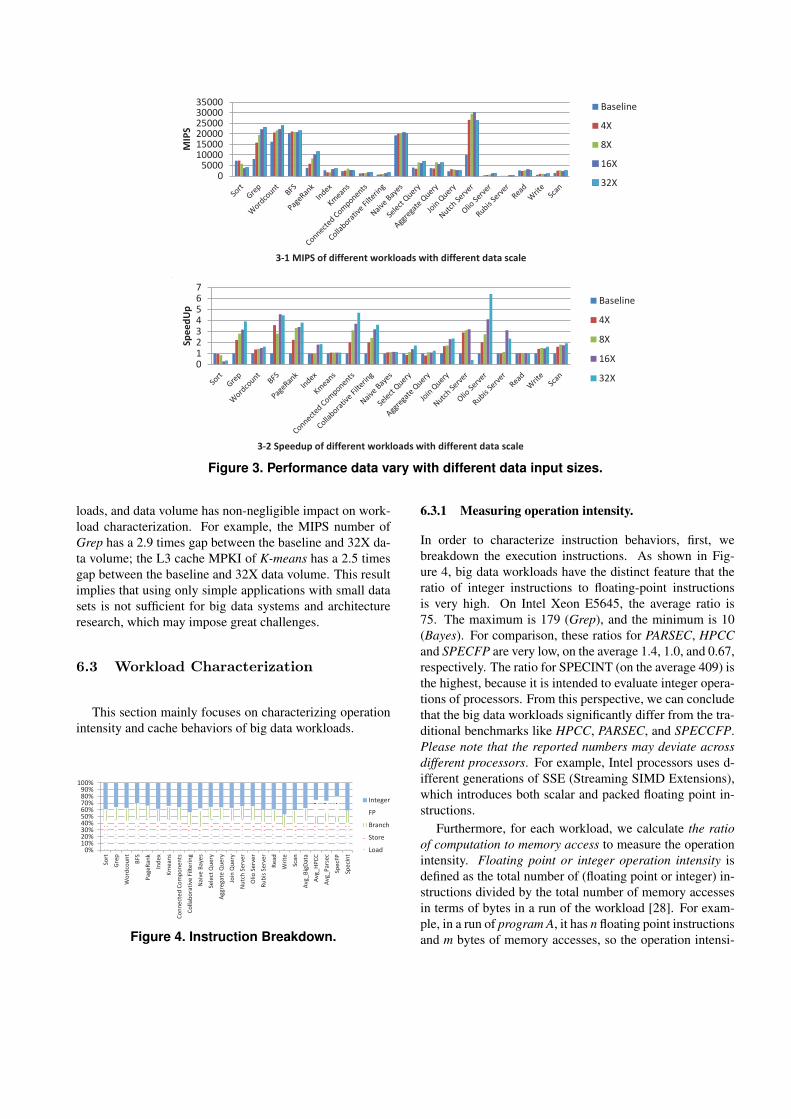
In order to characterize instruction behaviors, first, webreakdown the execution instructions. As shown in Fig-ure 4, big data workloads have the distinct feature that theratio of integer instructions to floating-point instructionsis very high. On Intel Xeon E5645, the average ratio is75. The maximum is 179 (Grep), and the minimum is 10(Bayes). For comparison, these ratios for PARSEC, HPCCand SPECFP are very low, on the average 1.4, 1.0, and 0.67,respectively. The ratio for SPECINT (on the average 409) isthe highest, because it is intended to evaluate integer opera-tions of processors. From this perspective, we can concludethat the big data workloads significantly differ from the tra-ditional benchmarks like HPCC, PARSEC, and SPECCFP.Please note that the reported numbers may deviate acrossdifferent processors. For example, Intel processors uses d-ifferent generations of SSE (Streaming SIMD Extensions),which introduces both scalar and packed floating point in-structions.
Furthermore, for each workload, we calculate the ratioof computation to memory access to measure the operationintensity. Floating point or integer operation intensity isdefined as the total number of (floating point or integer) in-structions divided by the total number of memory accessesin terms of bytes in a run of the workload [28]. For exam-ple, in a run of program A, it has n floating point instructionsand m bytes of memory accesses, so the operation intensi-
ty of program A is (n ÷ m). Since the memory hierarchywould impact the memory access performance significant-ly, for comparison, we report experiments on two state-of-practice processors: the Xeon E5310 and the Xeon E5460,respectively. The Xeon E5310 is equipped with only twolevels of caches, while the Xeon E5645 is equipped withthree levels of caches. The configuration of the Xeon E5310is shown in Table. 7.
Table 7. Configuration details of Xeon E5310.CPU Type Intel CPU Core
Intel R⃝Xeon E5310 4 [email protected] DCache L1 ICache L2 Cache L3 Cache4 × 32 KB 4 × 32 KB 2 × 4MB None
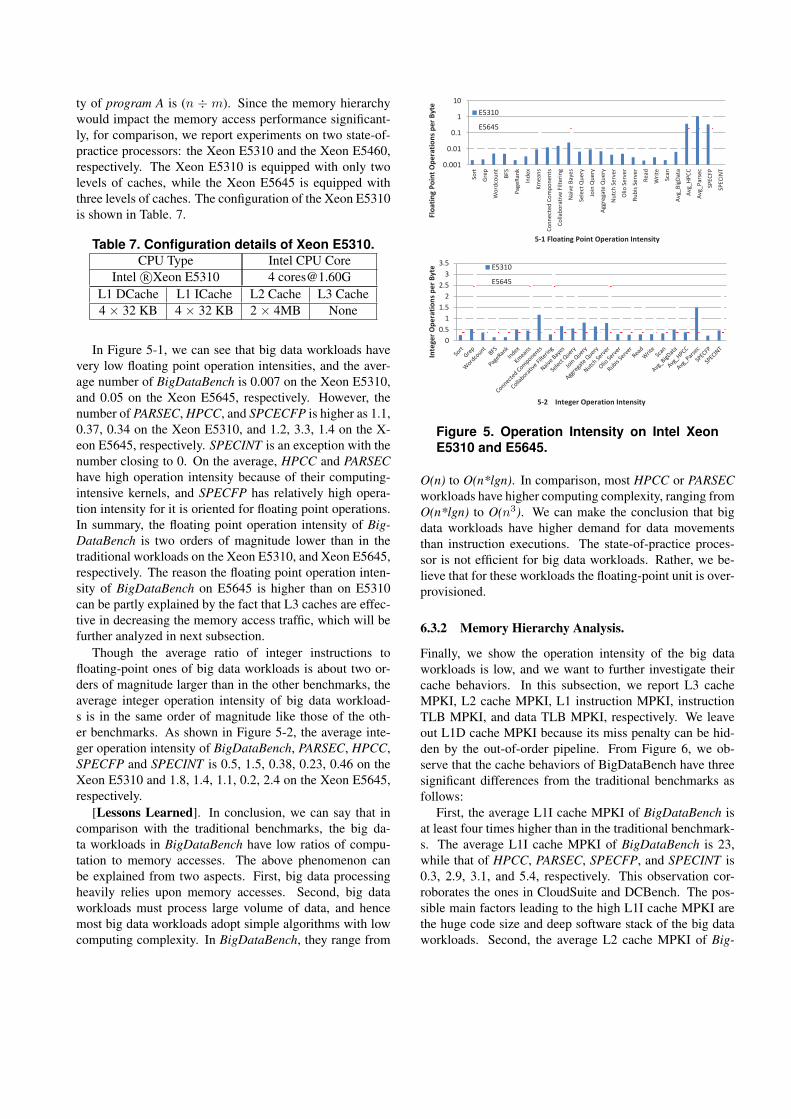
In Figure 5-1, we can see that big data workloads havevery low floating point operation intensities, and the aver-age number of BigDataBench is 0.007 on the Xeon E5310,and 0.05 on the Xeon E5645, respectively. However, thenumber of PARSEC, HPCC, and SPCECFP is higher as 1.1,0.37, 0.34 on the Xeon E5310, and 1.2, 3.3, 1.4 on the X-eon E5645, respectively. SPECINT is an exception with thenumber closing to 0. On the average, HPCC and PARSEChave high operation intensity because of their computing-intensive kernels, and SPECFP has relatively high opera-tion intensity for it is oriented for floating point operations.In summary, the floating point operation intensity of Big-DataBench is two orders of magnitude lower than in thetraditional workloads on the Xeon E5310, and Xeon E5645,respectively. The reason the floating point operation inten-sity of BigDataBench on E5645 is higher than on E5310can be partly explained by the fact that L3 caches are effec-tive in decreasing the memory access traffic, which will befurther analyzed in next subsection.
Though the average ratio of integer instructions tofloating-point ones of big data workloads is about two or-ders of magnitude larger than in the other benchmarks, theaverage integer operation intensity of big data workload-s is in the same order of magnitude like those of the oth-er benchmarks. As shown in Figure 5-2, the average inte-ger operation intensity of BigDataBench, PARSEC, HPCC,SPECFP and SPECINT is 0.5, 1.5, 0.38, 0.23, 0.46 on theXeon E5310 and 1.8, 1.4, 1.1, 0.2, 2.4 on the Xeon E5645,respectively.
[Lessons Learned]. In conclusion, we can say that incomparison with the traditional benchmarks, the big da-ta workloads in BigDataBench have low ratios of compu-tation to memory accesses. The above phenomenon canbe explained from two aspects. First, big data processingheavily relies upon memory accesses. Second, big dataworkloads must process large volume of data, and hencemost big data workloads adopt simple algorithms with lowcomputing complexity. In BigDataBench, they range from
0
0.5
1
1.5
2
2.5
3
3.5
Inte
ge
r O
pe
rati
on
s p
er
By
te
5-2 Integer Operation Intensity
E5310
E5645
0.001
0.01
0.1
1
10
So
rt
Gre
p
Wo
rdco
un
t
BF
S
Pa
ge
Ra
nk
Ind
ex
Km
ea
ns
Co
nn
ect
ed
Co
mp
on
en
ts
Co
lla
bo
rati
ve
Fil
teri
ng
Na
ive
Ba
ye
s
Se
lect
Qu
ery
Join
Qu
ery
Ag
gre
ga
te Q
ue
ry
Nu
tch
Se
rve
r
Oli
o S
erv
er
Ru
bis
Se
rve
r
Re
ad
Wri
te
Sca
n
Avg
_B
igD
ata
Avg
_H
PC
C
Avg
_P
ars
ec
SP
EC
FP
SP
EC
INT
Flo
ati
ng
Po
int
Op
era
tio
ns
pe
r B
yte
5-1 Floating Point Operation Intensity
E5310
E5645
Figure 5. Operation Intensity on Intel XeonE5310 and E5645.
O(n) to O(n*lgn). In comparison, most HPCC or PARSECworkloads have higher computing complexity, ranging fromO(n*lgn) to O(n3). We can make the conclusion that bigdata workloads have higher demand for data movementsthan instruction executions. The state-of-practice proces-sor is not efficient for big data workloads. Rather, we be-lieve that for these workloads the floating-point unit is over-provisioned.
6.3.2 Memory Hierarchy Analysis.
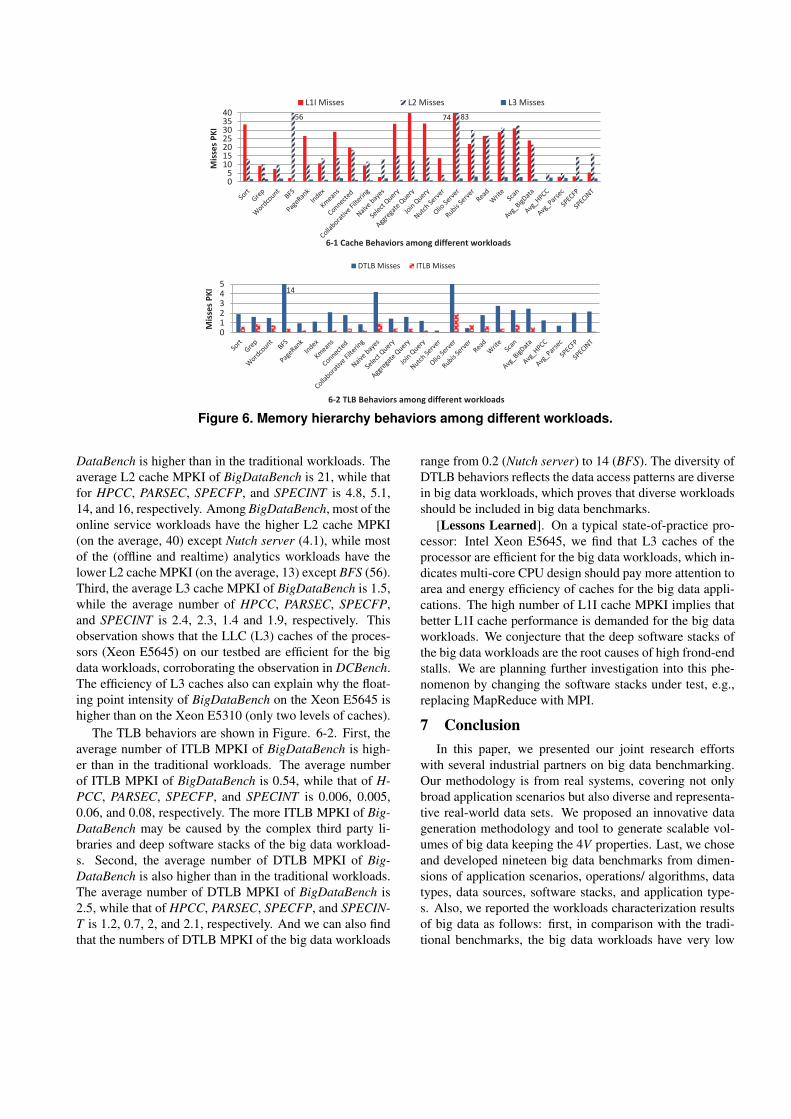
Finally, we show the operation intensity of the big dataworkloads is low, and we want to further investigate theircache behaviors. In this subsection, we report L3 cacheMPKI, L2 cache MPKI, L1 instruction MPKI, instructionTLB MPKI, and data TLB MPKI, respectively. We leaveout L1D cache MPKI because its miss penalty can be hid-den by the out-of-order pipeline. From Figure 6, we ob-serve that the cache behaviors of BigDataBench have threesignificant differences from the traditional benchmarks asfollows:
First, the average L1I cache MPKI of BigDataBench isat least four times higher than in the traditional benchmark-s. The average L1I cache MPKI of BigDataBench is 23,while that of HPCC, PARSEC, SPECFP, and SPECINT is0.3, 2.9, 3.1, and 5.4, respectively. This observation cor-roborates the ones in CloudSuite and DCBench. The pos-sible main factors leading to the high L1I cache MPKI arethe huge code size and deep software stack of the big dataworkloads. Second, the average L2 cache MPKI of Big-
0
1
2
3
4
5
Mis
ses
PK
I
6-2 TLB Behaviors among different workloads
DTLB Misses ITLB Misses
0
5
10
15
20
25
30
35
40
Mis
ses
PK
I
6-1 Cache Behaviors among different workloads
L1I Misses L2 Misses L3 Misses
56 74 83
14
Figure 6. Memory hierarchy behaviors among different workloads.
DataBench is higher than in the traditional workloads. Theaverage L2 cache MPKI of BigDataBench is 21, while thatfor HPCC, PARSEC, SPECFP, and SPECINT is 4.8, 5.1,14, and 16, respectively. Among BigDataBench, most of theonline service workloads have the higher L2 cache MPKI(on the average, 40) except Nutch server (4.1), while mostof the (offline and realtime) analytics workloads have thelower L2 cache MPKI (on the average, 13) except BFS (56).Third, the average L3 cache MPKI of BigDataBench is 1.5,while the average number of HPCC, PARSEC, SPECFP,and SPECINT is 2.4, 2.3, 1.4 and 1.9, respectively. Thisobservation shows that the LLC (L3) caches of the proces-sors (Xeon E5645) on our testbed are efficient for the bigdata workloads, corroborating the observation in DCBench.The efficiency of L3 caches also can explain why the float-ing point intensity of BigDataBench on the Xeon E5645 ishigher than on the Xeon E5310 (only two levels of caches).
The TLB behaviors are shown in Figure. 6-2. First, theaverage number of ITLB MPKI of BigDataBench is high-er than in the traditional workloads. The average numberof ITLB MPKI of BigDataBench is 0.54, while that of H-PCC, PARSEC, SPECFP, and SPECINT is 0.006, 0.005,0.06, and 0.08, respectively. The more ITLB MPKI of Big-DataBench may be caused by the complex third party li-braries and deep software stacks of the big data workload-s. Second, the average number of DTLB MPKI of Big-DataBench is also higher than in the traditional workloads.The average number of DTLB MPKI of BigDataBench is2.5, while that of HPCC, PARSEC, SPECFP, and SPECIN-T is 1.2, 0.7, 2, and 2.1, respectively. And we can also findthat the numbers of DTLB MPKI of the big data workloads
range from 0.2 (Nutch server) to 14 (BFS). The diversity ofDTLB behaviors reflects the data access patterns are diversein big data workloads, which proves that diverse workloadsshould be included in big data benchmarks.
[Lessons Learned]. On a typical state-of-practice pro-cessor: Intel Xeon E5645, we find that L3 caches of theprocessor are efficient for the big data workloads, which in-dicates multi-core CPU design should pay more attention toarea and energy efficiency of caches for the big data appli-cations. The high number of L1I cache MPKI implies thatbetter L1I cache performance is demanded for the big dataworkloads. We conjecture that the deep software stacks ofthe big data workloads are the root causes of high frond-endstalls. We are planning further investigation into this phe-nomenon by changing the software stacks under test, e.g.,replacing MapReduce with MPI.
7 ConclusionIn this paper, we presented our joint research efforts
with several industrial partners on big data benchmarking.Our methodology is from real systems, covering not onlybroad application scenarios but also diverse and representa-tive real-world data sets. We proposed an innovative datageneration methodology and tool to generate scalable vol-umes of big data keeping the 4V properties. Last, we choseand developed nineteen big data benchmarks from dimen-sions of application scenarios, operations/ algorithms, datatypes, data sources, software stacks, and application type-s. Also, we reported the workloads characterization resultsof big data as follows: first, in comparison with the tradi-tional benchmarks, the big data workloads have very low
operation intensity. Second, the volume of data input hasnon-negligible impact on micro-architecture characteristicsof big data workloads, so architecture research using onlysimple applications and small data sets is not sufficient forbig data scenarios. Last but not least, on a typical state-of-practice processor: Intel Xeon E5645, we find that for thebig data workloads the LLC of the processor is effective andbetter L1I cache performance is demanded as the big dataworkloads suffer high L1I cache MPKI.
8 AcknowledgementsWe are very grateful to the anonymous reviewers and our
shepherd, Dr. Michael D. Powell. This work is supportedby Chinese 973 projects (Grants No. 2011CB302502 and2014CB340402), NSFC projects (Grants No. 60933003and 61202075) and the BNSF project (Grant No.4133081).
References[1] http://www-01.ibm.com/software/data/bigdata/.[2] http://hadoop.apache.org/mapreduce/docs/current/gridmix.html.[3] Alexa website. http://www.alexa.com/topsites/global.[4] Amazon movie reviews. http://snap.stanford.edu/data/web-
Amazon.html.[5] Amp lab big data benchmark. http-
s://amplab.cs.berkeley.edu/benchmark/.[6] Bigdatabench. http://prof.ict.ac.cn/BigDataBench/.[7] facebook graph. http://snap.stanford.edu/data/egonets-
Facebook.html.[8] google web graph. http://snap.stanford.edu/data/web-
Google.html.[9] ibmbigdatahub. http://www.ibmbigdatahub.com/infographic/four-
vs-big-data.[10] Sort benchmark home page. http://sortbenchmark.org/.[11] wikipedia. http://en.wikipedia.org.[12] T. G. Armstrong, V. Ponnekanti, D. Borthakur, and
M. Callaghan. Linkbench: a database benchmark based onthe facebook social graph. 2013.
[13] L. A. Barroso and U. Holzle. The datacenter as a computer:An introduction to the design of warehouse-scale machines.Synthesis Lectures on Computer Architecture, 4(1):1–108,2009.
[14] M. Beyer. Gartner says solving big data challengeinvolves more than just managing volumes of data.http://www.gartner.com/it/page.jsp?id=1731916.
[15] B. F. Cooper, A. Silberstein, E. Tam, R. Ramakrishnan, andR. Sears. Benchmarking cloud serving systems with ycsb.In Proceedings of the 1st ACM symposium on Cloud com-puting, SoCC ’10, pages 143–154, 2010.
[16] C. Engle, A. Lupher, R. Xin, M. Zaharia, M. J. Franklin,S. Shenker, and I. Stoica. Shark: fast data analysis usingcoarse-grained distributed memory. In Proceedings of the2012 ACM SIGMOD International Conference on Manage-ment of Data, pages 689–692. ACM, 2012.
[17] M. Ferdman, A. Adileh, O. Kocberber, S. Volos, M. Al-isafaee, D. Jevdjic, C. Kaynak, A. D. Popescu, A. Ailamaki,and B. Falsafi. Clearing the clouds: A study of emergingworkloads on modern hardware. Architectural Support forProgramming Languages and Operating Systems, 2012.
[18] W. Gao, Y. Zhu, Z. Jia, C. Luo, L. Wang, J. Zhan, Y. He,S. Gong, X. Li, S. Zhang, and B. Qiu. Bigdatabench: a bigdata benchmark suite from web search engines. The ThirdWorkshop on Architectures and Systems for Big Data (ASBD2013), in conjunction with ISCA 2013.
[19] A. Ghazal, M. Hu, T. Rabl, F. Raab, M. Poess, A. Crolotte,and H.-A. Jacobsen. Bigbench: Towards an industry stan-dard benchmark for big data analytics. In SIGMOD 2013,2013.
[20] S. Huang, J. Huang, J. Dai, T. Xie, and B. Huang. The hi-bench benchmark suite: Characterization of the mapreduce-based data analysis. In Data Engineering Workshops(ICDEW), 2010 IEEE 26th International Conference on,pages 41–51. IEEE, 2010.
[21] Z. Jia, L. Wang, J. Zhan, L. Zhang, and C. Luo. Character-izing data analysis workloads in data centers. In WorkloadCharacterization (IISWC), 2013 IEEE International Sympo-sium on. IEEE.
[22] C. Luo, J. Zhan, Z. Jia, L. Wang, G. Lu, L. Zhang, C. Xu,and N. Sun. Cloudrank-d: benchmarking and ranking cloudcomputing systems for data processing applications. Fron-tiers of Computer Science, 6(4):347–362, 2012.
[23] Z. Ming, C. Luo, W. Gao, R. Han, Q. Yang, L. Wang, andJ. Zhan. Bdgs: A scalable big data generator suite in bigdata benchmarking. In Arxiv, 2014.
[24] A. Pavlo, E. Paulson, A. Rasin, D. J. Abadi, D. J. DeWitt,S. Madden, and M. Stonebraker. A comparison of approach-es to large-scale data analysis. In Proceedings of the 2009ACM SIGMOD International Conference on Management ofdata, SIGMOD ’09, pages 165–178, 2009.
[25] M. Seltzer, D. Krinsky, K. Smith, and X. Zhang. The casefor application-specific benchmarking. In Hot Topics in Op-erating Systems, 1999. Proceedings of the Seventh Workshopon, pages 102–107. IEEE, 1999.
[26] Y. Tay. Data generation for application-specific benchmark-ing. VLDB, Challenges and Visions, 2011.
[27] P. Wang, D. Meng, J. Han, J. Zhan, B. Tu, X. Shi, andL. Wan. Transformer: a new paradigm for building data-parallel programming models. Micro, IEEE, 30(4):55–64,2010.
[28] S. Williams, A. Waterman, and D. Patterson. Roofline: aninsightful visual performance model for multicore architec-tures. Communications of the ACM, 52(4):65–76, 2009.
[29] H. Xi, J. Zhan, Z. Jia, X. Hong, L. Wang, L. Zhang, N. Sun,and G. Lu. Characterization of real workloads of we-b search engines. In Workload Characterization (IISWC),2011 IEEE International Symposium on, volume 11, pages15–25. IEEE, 2011.
[30] M. Zaharia, M. Chowdhury, T. Das, A. Dave, J. Ma, M. Mc-Cauley, M. Franklin, S. Shenker, and I. Stoica. Resilient dis-tributed datasets: A fault-tolerant abstraction for in-memorycluster computing. In Proceedings of the 9th USENIX con-ference on Networked Systems Design and Implementation,pages 2–2. USENIX Association, 2012.
[31] J. Zhan, L. Zhang, N. Sun, L. Wang, Z. Jia, and C. Luo. Highvolume computing: Identifying and characterizing through-put oriented workloads in data centers. In Parallel andDistributed Processing Symposium Workshops & PhD Fo-rum (IPDPSW), 2012 IEEE 26th International, pages 1712–1721. IEEE, 2012.