Bescherming tegen roofdieren: Zelforganisatie van visscholen en vogelzwermen Charlotte K. Hemelrijk...
54
Bescherming tegen roofdieren: Zelforganisatie van visscholen en vogelzwermen Charlotte K. Hemelrijk Behavioural Ecology and Self- organisation Centre for Ecological and Evolutionary Studies University of Groningen The Netherlands
-
Upload
kerry-williams -
Category
Documents
-
view
217 -
download
1
Transcript of Bescherming tegen roofdieren: Zelforganisatie van visscholen en vogelzwermen Charlotte K. Hemelrijk...
Bescherming tegen roofdieren:
Zelforganisatie van visscholen en vogelzwermen
Charlotte K. HemelrijkBehavioural Ecology and Self-organisation
Centre for Ecological and Evolutionary StudiesUniversity of Groningen
The Netherlands
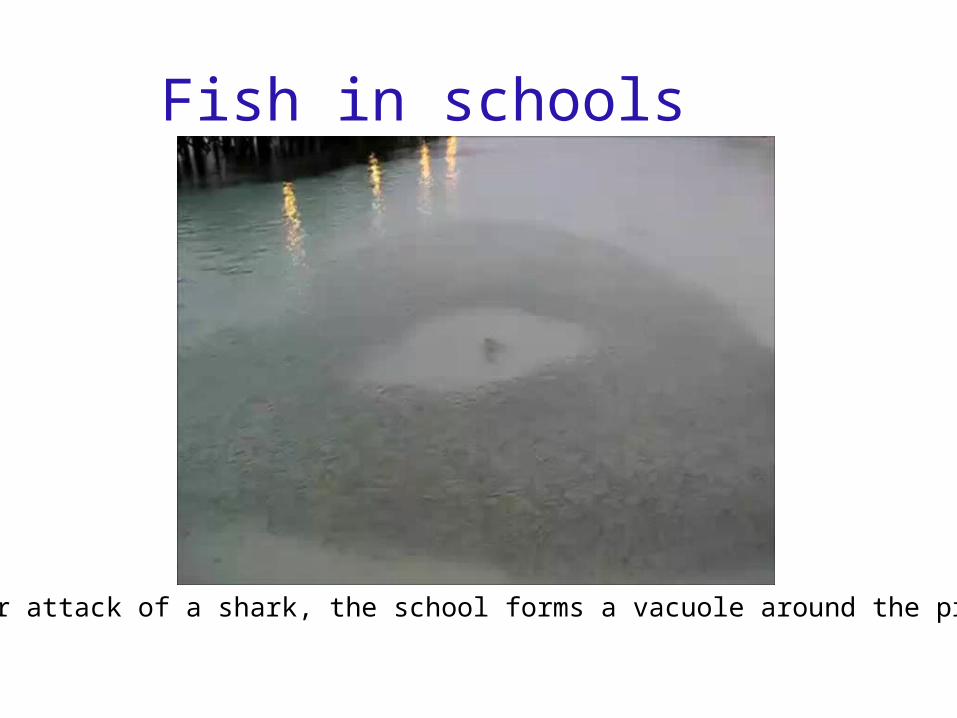
Fish in schools
Under attack of a shark, the school forms a vacuole around the predator
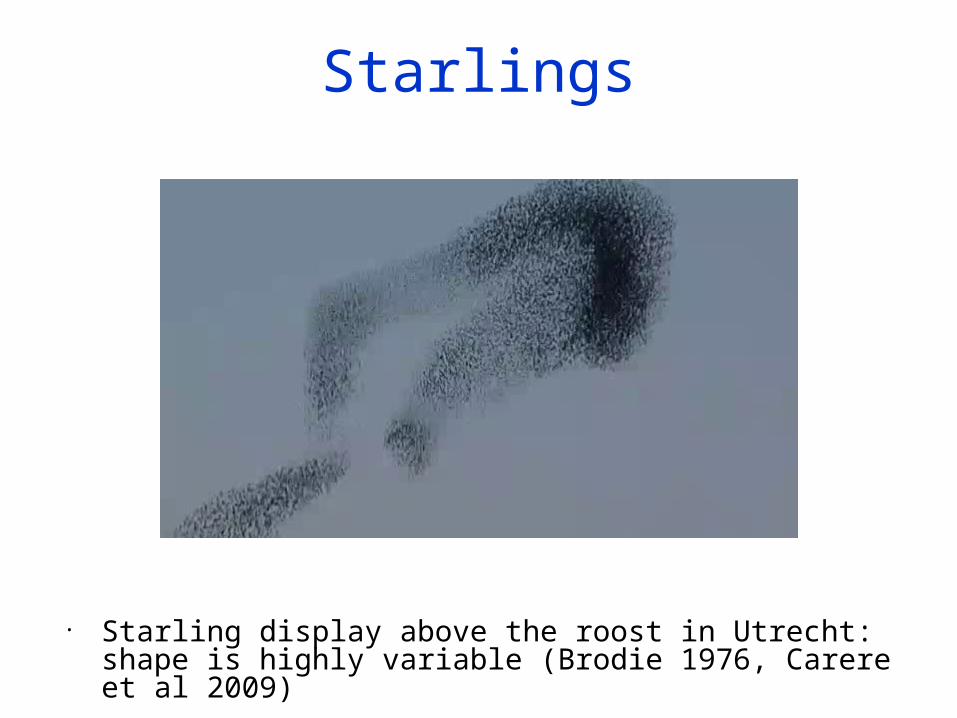
Starlings
• Starling display above the roost in Utrecht: shape is highly variable (Brodie 1976, Carere et al 2009)
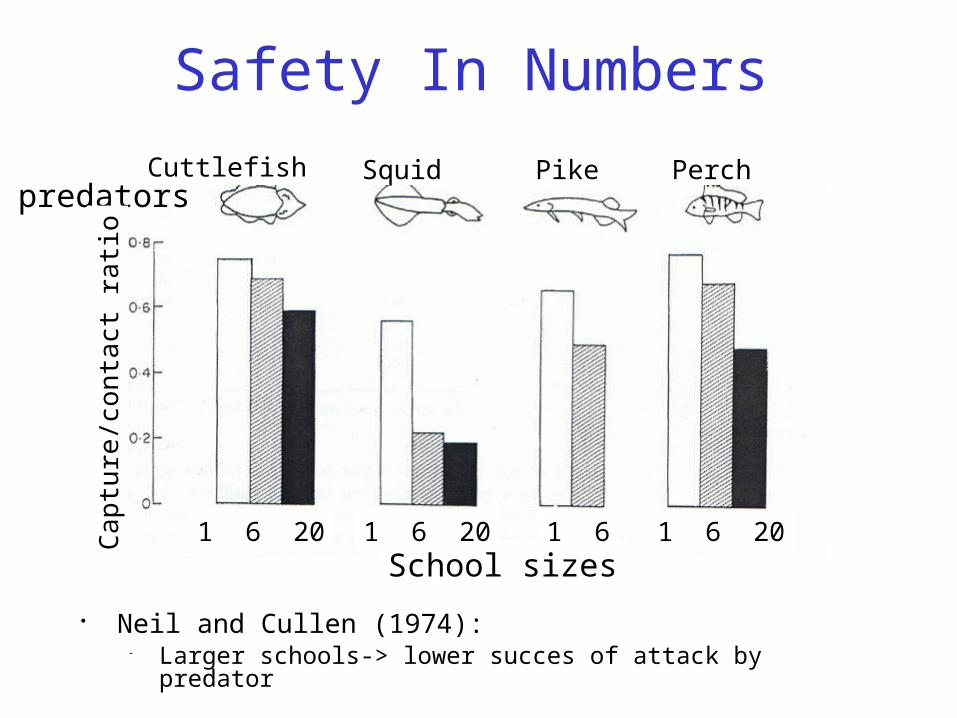
Safety In Numbers
Neil and Cullen (1974): Larger schools-> lower succes of attack by predator
Cuttlefish Squid Pike Perch
School sizes1 6 20 1 6 20 1 6 201 6
predators
Ca
ptu
re/c
on
tact
ra
tio
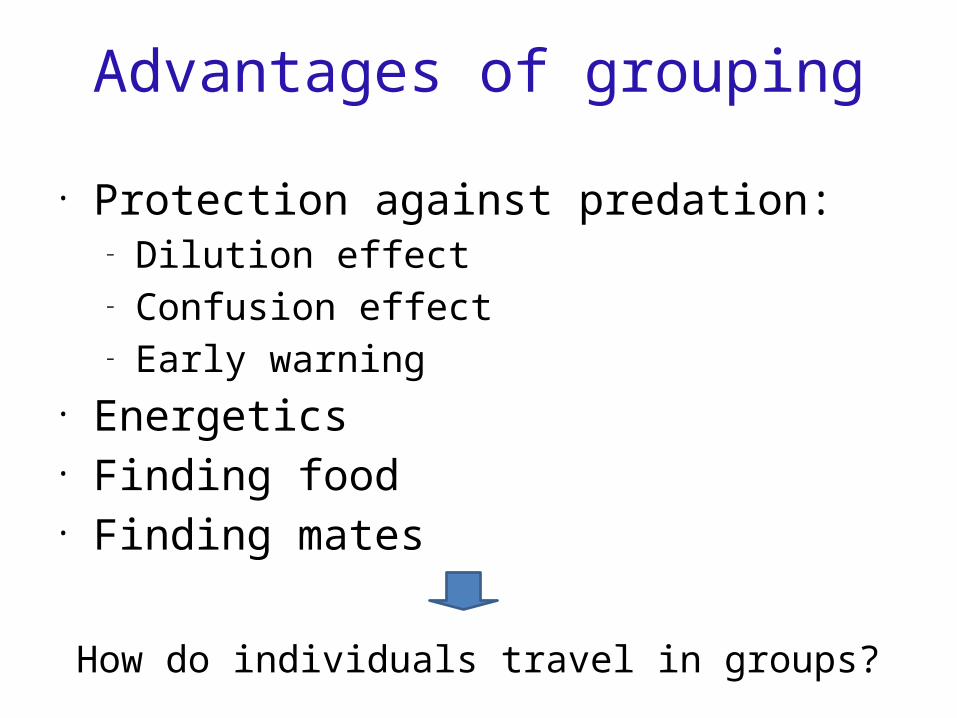
Advantages of grouping
• Protection against predation:– Dilution effect– Confusion effect– Early warning
• Energetics• Finding food• Finding mates
How do individuals travel in groups?
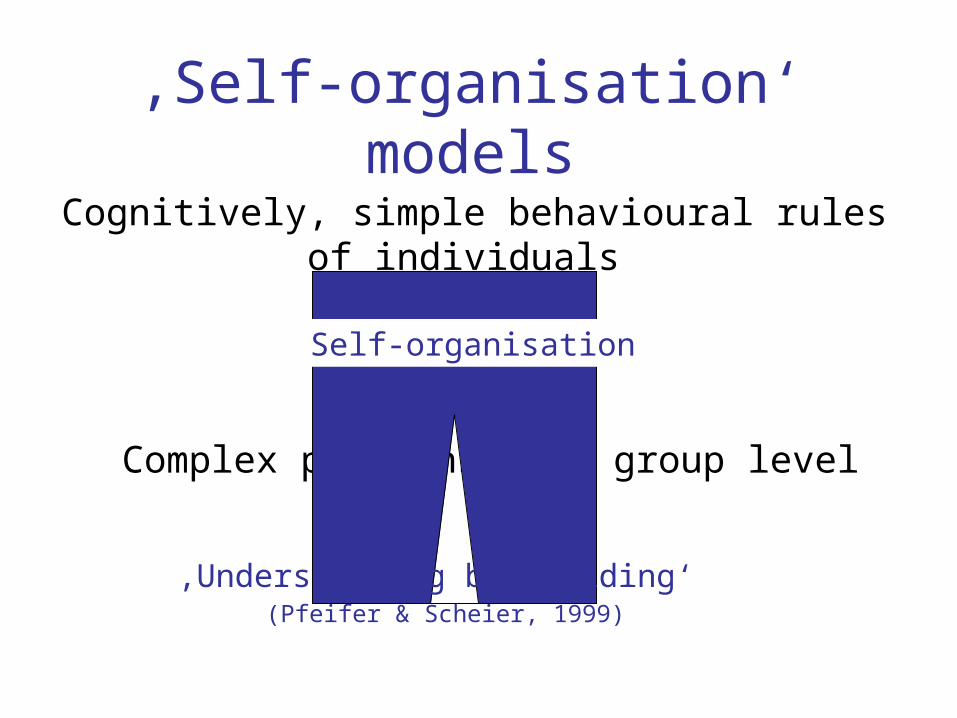
‚Self-organisation‘ models
Cognitively, simple behavioural rules of individuals
Complex patterns at a group level
Self-organisation
‚Understanding by building‘ (Pfeifer & Scheier, 1999)
Click to edit the outline text format Second Outline
Level Third Outline
LevelFourth Outline Level Fifth Outline Level
Sixth Outline Level
Seventh Outline Level
Eighth Outline Level
Ninth Outline LevelClick to edit Master text styles Second level
Third level Fourth level
» Fifth level
Click to edit the outline text format Second Outline
Level Third Outline
LevelFourth Outline Level Fifth Outline Level
Sixth Outline Level
Seventh Outline Level
Eighth Outline Level
Ninth Outline LevelClick to edit Master text styles Second level
Third level Fourth level
» Fifth level
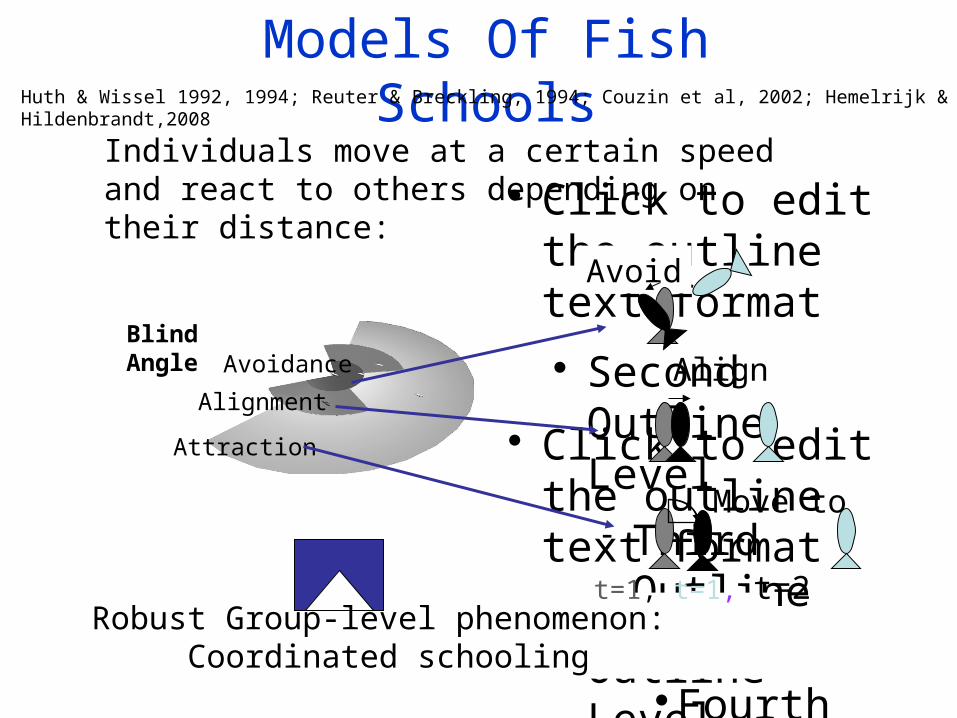
Models Of Fish Schools
Attraction/
Individuals move at a certain speed and react to others depending on their distance:
Robust Group-level phenomenon: Coordinated schooling
Huth & Wissel 1992, 1994; Reuter & Breckling, 1994; Couzin et al, 2002; Hemelrijk & Hildenbrandt,2008
Avoid
Align
Move to
t=1, t=1, t=2
Avoidance
Alignment
Attraction
Blind Angle
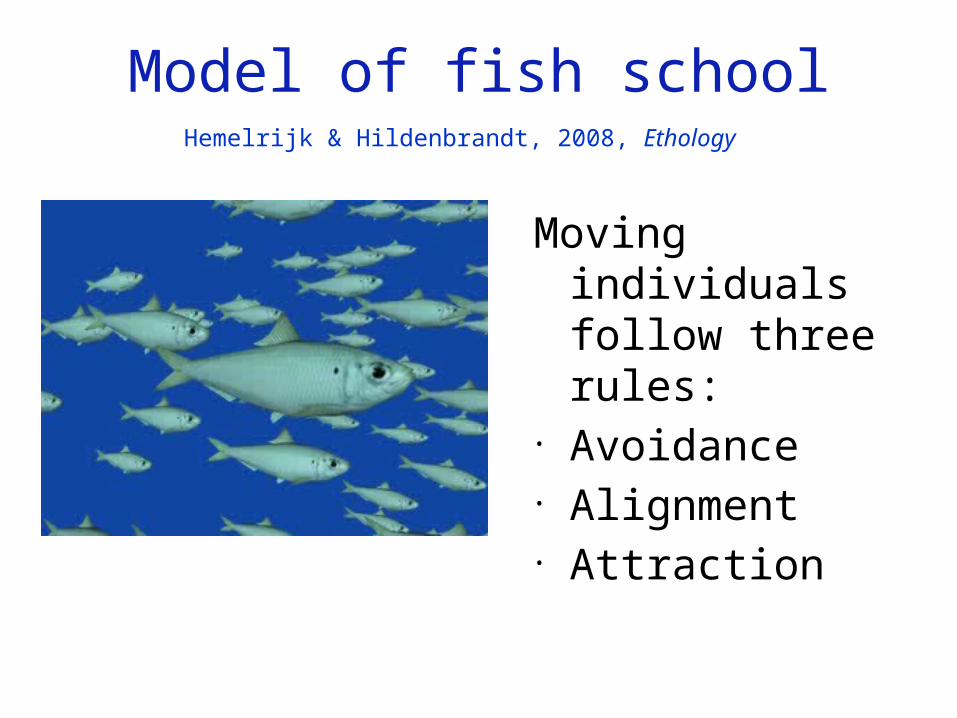
Model of fish school
Moving individuals follow three rules:
• Avoidance• Alignment• Attraction
Hemelrijk & Hildenbrandt, 2008, Ethology
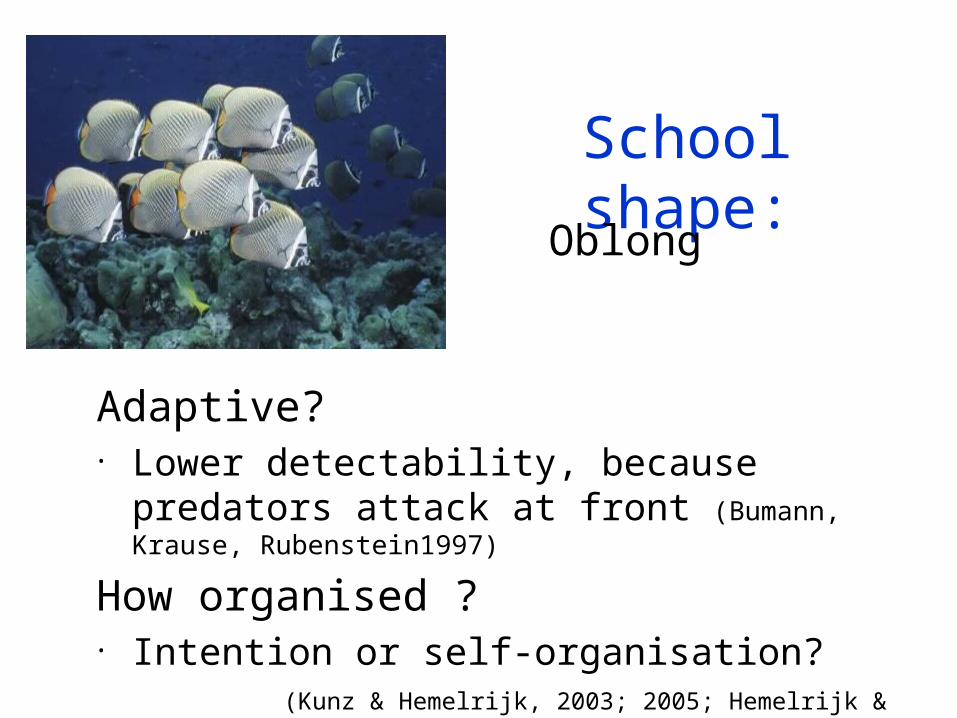
School shape:
Adaptive? • Lower detectability, because predators attack at
front (Bumann, Krause, Rubenstein1997)
How organised ?• Intention or self-organisation? (Kunz &
Hemelrijk, 2003; 2005; Hemelrijk & Hildenbrandt 2008)
Oblong
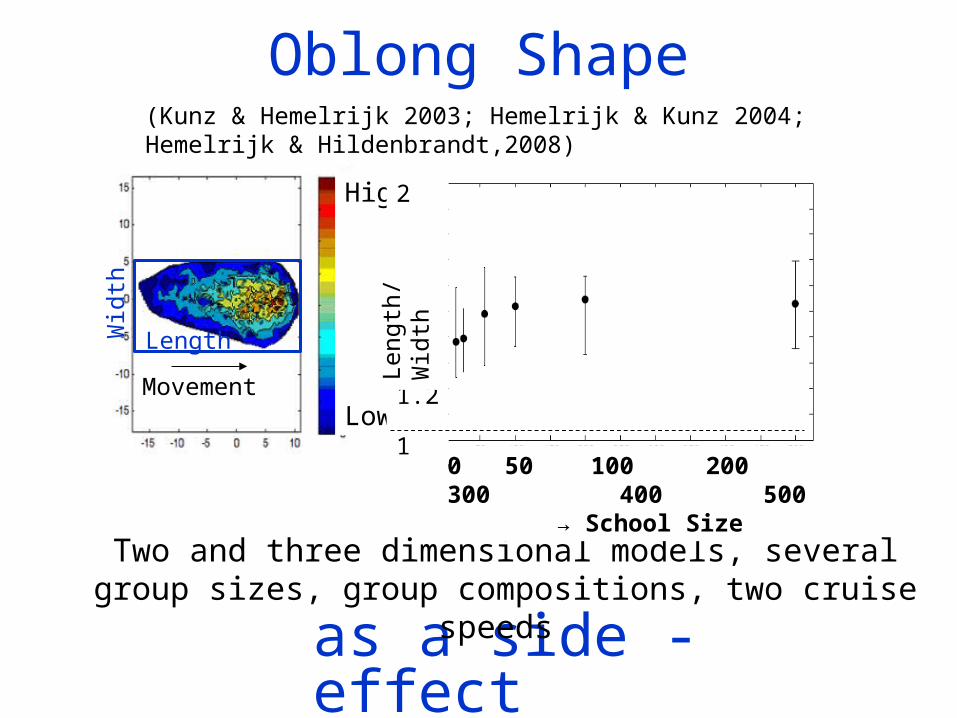
Oblong Shape
as a side - effect
Two and three dimensional models, several group sizes, group compositions, two cruise speeds
High Low
Movement
Length
Wid
th
0 50 100 200 300 400 500
→ School Size
2
1.8
1.6
1.4
1.2
1
Leng
th/W
idth
(Kunz & Hemelrijk 2003; Hemelrijk & Kunz 2004; Hemelrijk & Hildenbrandt,2008)
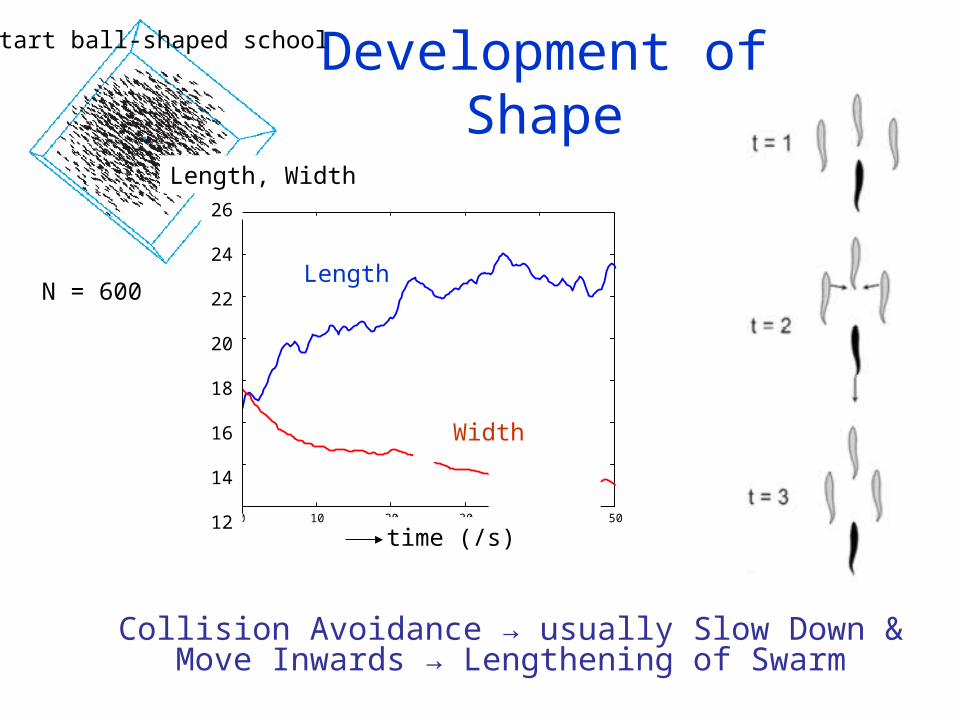
Start ball-shaped school
N = 600
0 10 20 30 40 5012
14
16
18
20
22
24
26
t/s
leng
th w
idth
/ B
LU
length
width
26
24
22
20
18
16
14
12
Length
Length, Width
time (/s)
Width
Development of Shape
Collision Avoidance → usually Slow Down & Move Inwards → Lengthening of Swarm
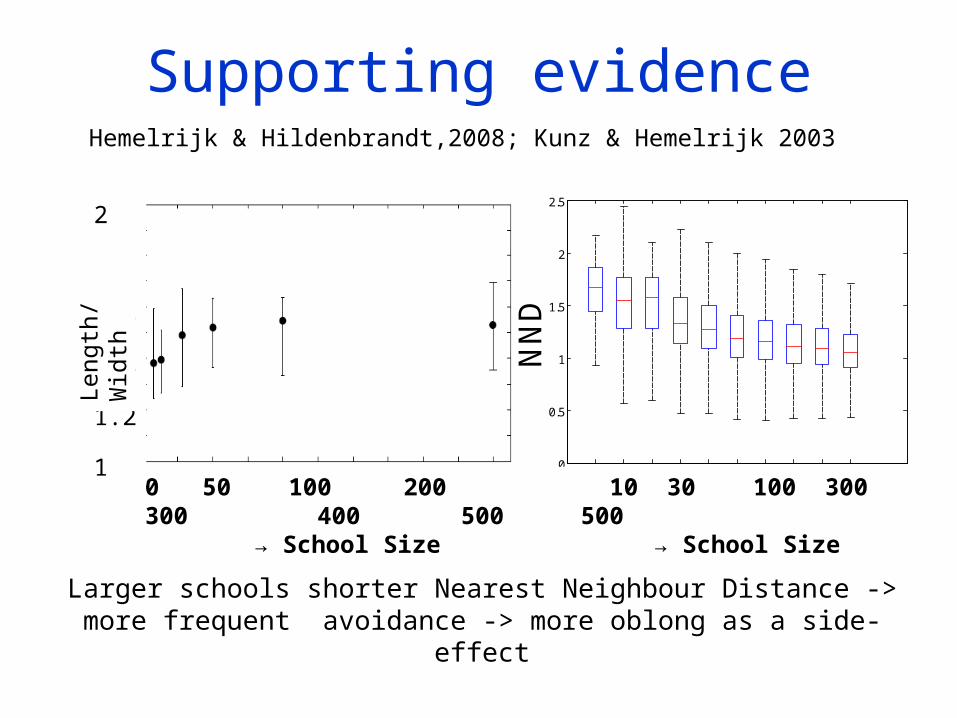
Supporting evidence
Fast
Hemelrijk & Hildenbrandt,2008; Kunz & Hemelrijk 2003
De
nsi
ty
Larger schools shorter Nearest Neighbour Distance -> more frequent avoidance -> more oblong as a side-effect
0 50 100 200 300 400 500
→ School Size
2
1.8
1.6
1.4
1.2
1
Leng
th/W
idth
10 20 30 60 100 200 300 600 1000 20000
0.5
1
1.5
2
2.5
NN
DGroup Size 10 30 100 300 500→ School Size
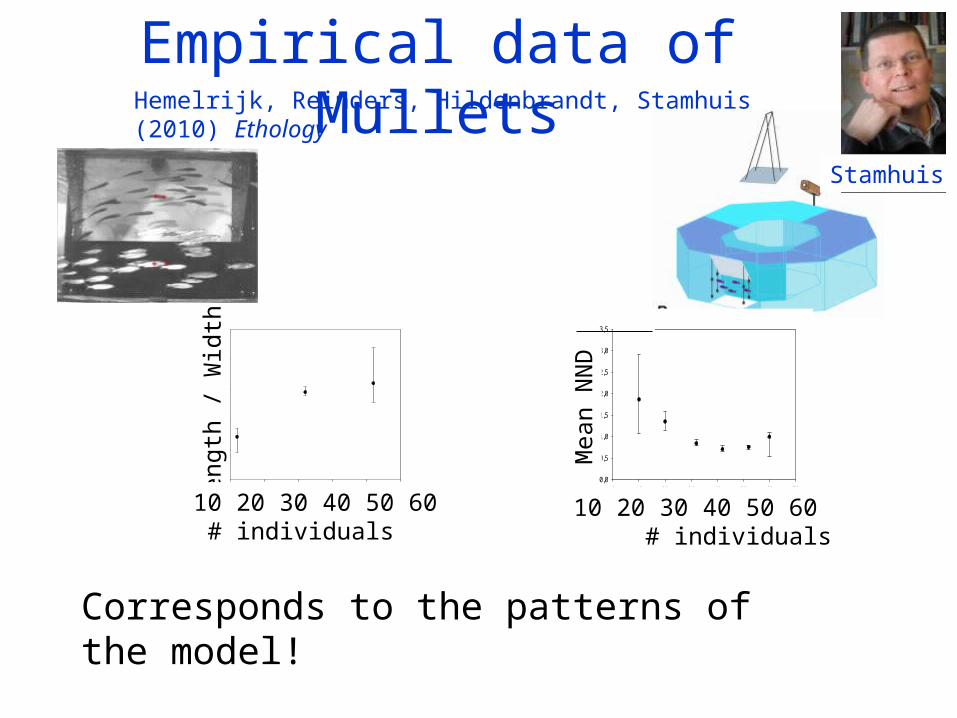
Empirical data of Mullets
Corresponds to the patterns of the model!
Hemelrijk, Reinders, Hildenbrandt, Stamhuis (2010) Ethology
WIDE
School size (# individuals)
10 20 30 40 50 60
Leng
ht t
o W
idth
(BL
U)
0
2
4
6
8
10
Leng
th /
Wid
th
10 20 30 40 50 60 # individuals
NARROW
School size (# individuals)
0 10 20 30 40 50 60 70
Mea
n N
ND
(B
LU)
0,0
0,5
1,0
1,5
2,0
2,5
3,0
3,5
Mea
n N
ND
10 20 30 40 50 60 # individuals10 20 30 40 50 60 # individuals
Stamhuis
Click to edit the outline text format Second Outline
Level Third Outline
LevelFourth Outline Level Fifth Outline Level
Sixth Outline Level
Seventh Outline Level
Eighth Outline Level
Ninth Outline LevelClick to edit Master text styles Second level
Third level Fourth level
» Fifth level
Click to edit the outline text format Second Outline
Level Third Outline
LevelFourth Outline Level Fifth Outline Level
Sixth Outline Level
Seventh Outline Level
Eighth Outline Level
Ninth Outline LevelClick to edit Master text styles Second level
Third level Fourth level
» Fifth level
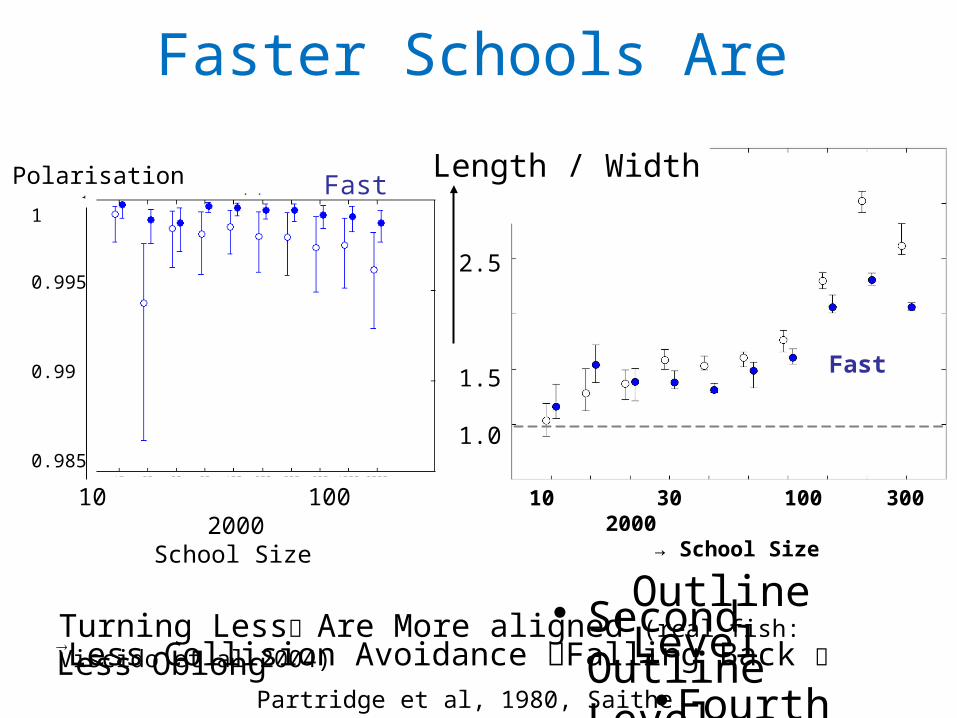
Faster Schools Are
10 100 2000School Size
1
0.995
0.99
0.985
FastPolarisation
Slow
Turning Less Are More aligned (real fish: Viscido et al 2004) Less Collision Avoidance Falling Back Less Oblong
10 30 100 300 2000→ School Size
Fast
Length / Width
2.5
1.5
1.0
Slow
Partridge et al, 1980, Saithe
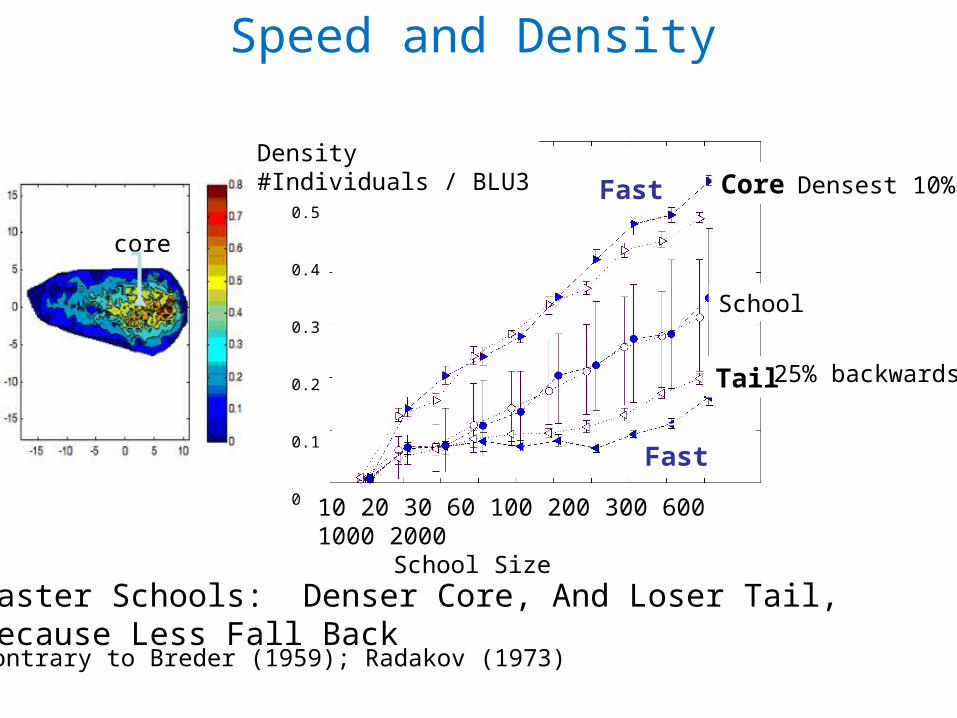
Faster Schools: Denser Core, And Loser Tail,Because Less Fall BackContrary to Breder (1959); Radakov (1973)
0.6
0.5
0.4
0.3
0.2
0.1
0 10 20 30 60 100 200 300 600 1000 2000School Size
Density#Individuals / BLU3 Core
School
Tail
Speed and Density
Fast
Fast
Slow
Slow
Densest 10%
25% backwards
core
Oblong form
Arises as a side-effect of coordination! Due to falling back to avoid collision
Question
Why are bird flocks seldom oblong and why are they variable in shape?
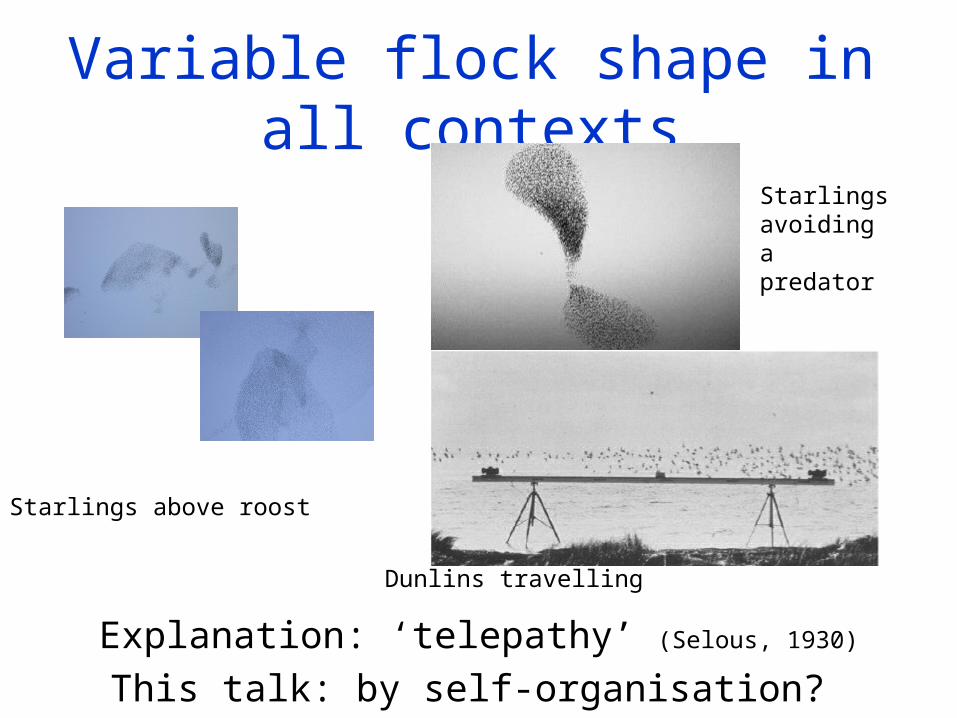
Variable flock shape in all contexts
Explanation: ‘telepathy’ (Selous, 1930)
This talk: by self-organisation?
Starlings above roost
Starlings avoiding a predator
Dunlins travelling
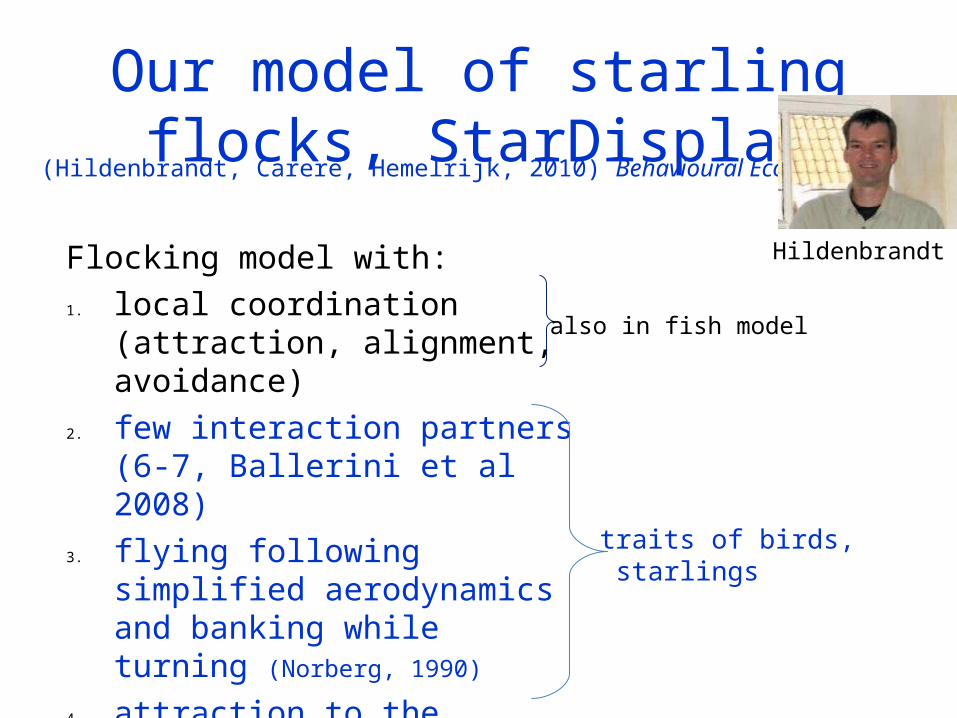
Our model of starling flocks, StarDisplay
Flocking model with:1. local coordination (attraction,
alignment, avoidance)2. few interaction partners (6-7,
Ballerini et al 2008)3. flying following simplified
aerodynamics and banking while turning (Norberg, 1990)
4. attraction to the sleeping site (roost) (Carere et al 2009)
(Hildenbrandt, Carere, Hemelrijk, 2010) Behavioural Ecology
traits of birds, starlings
also in fish model
Hildenbrandt
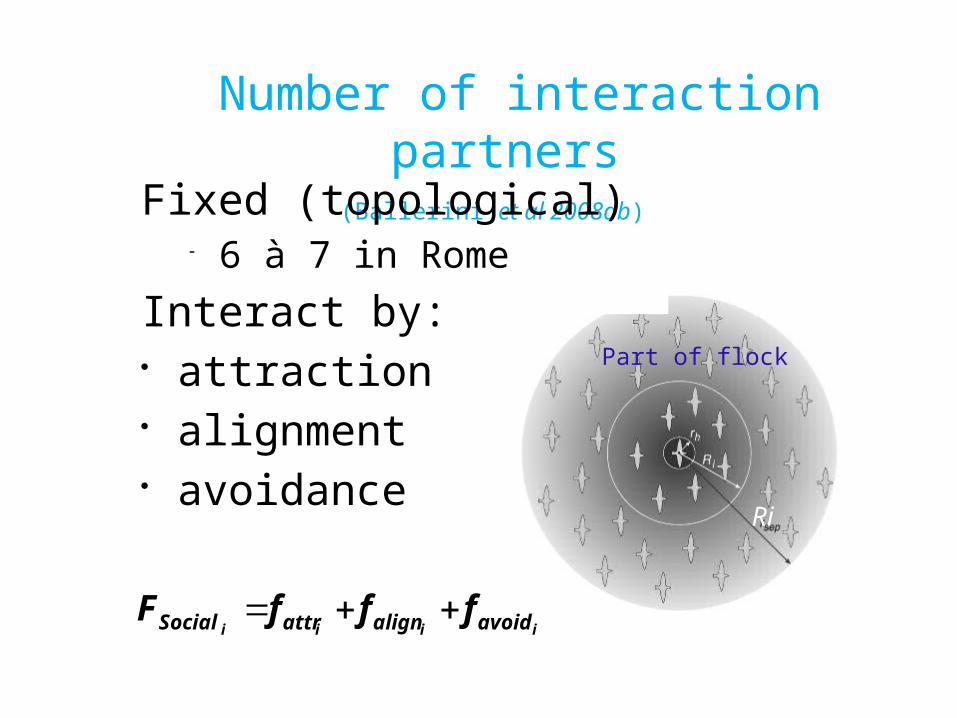
Number of interaction partners(Ballerini et al 2008ab)
Fixed (topological) 6 à 7 in Rome
Interact by: attraction alignment avoidance
Part of flock
Ri
iiii avoidalignattrSocial fffF
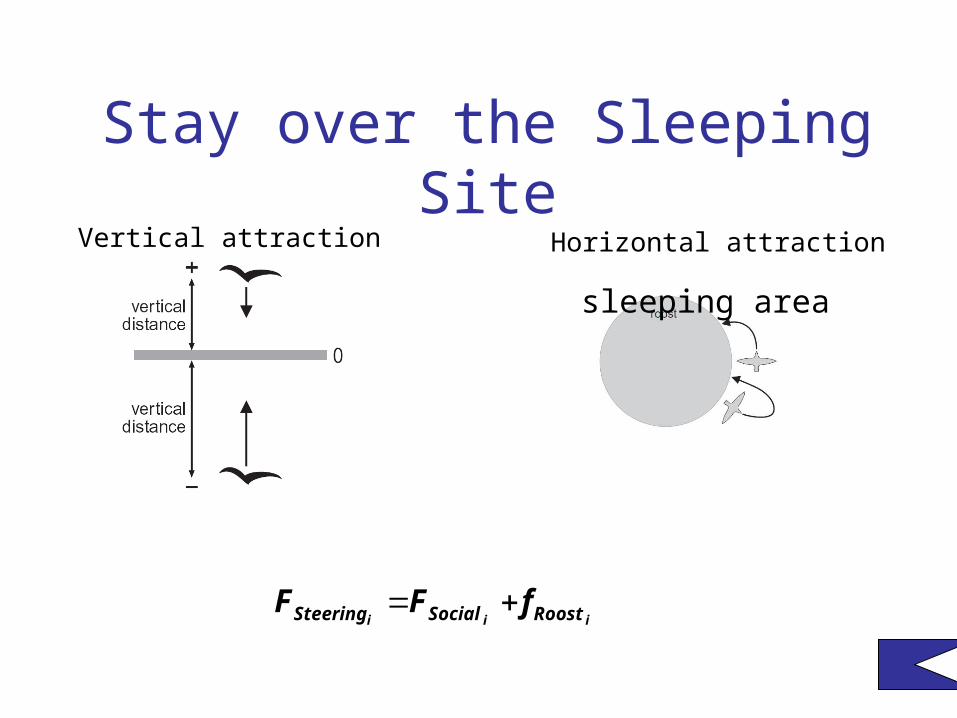
Stay over the Sleeping Site
Horizontal attractionVertical attraction
iii RoostSocialSteering fFF
sleeping area
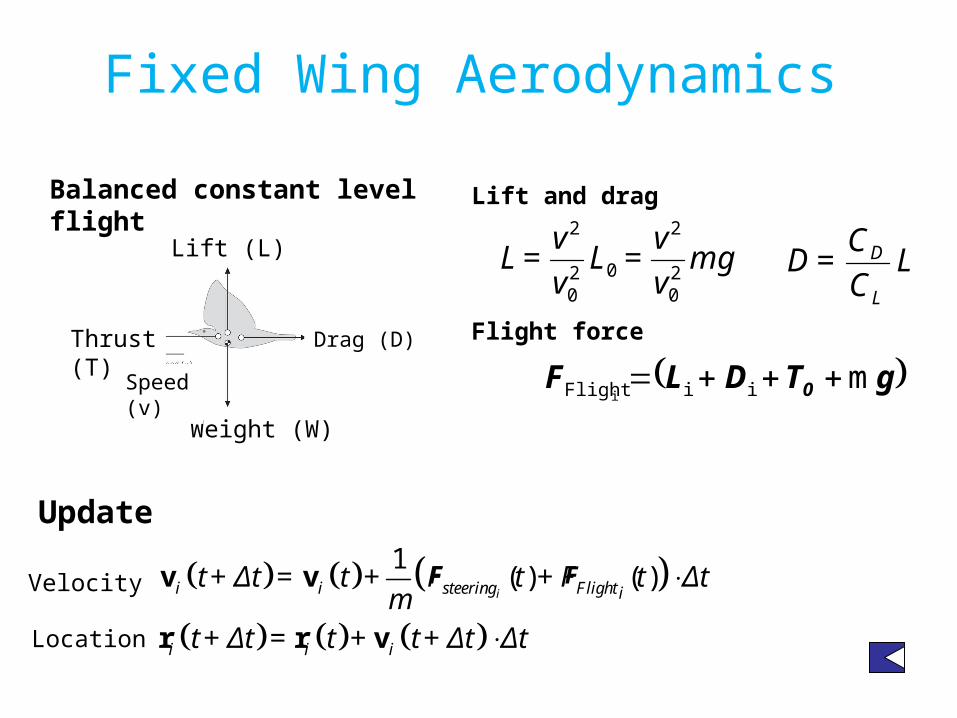
Fixed Wing Aerodynamics
Balanced constant level flight
Lift (L)
Drag (D)Thrust(T)
Weight (W)
Speed (v)
mgv
v=L
v
v=L
20
2
020
2
LC
C=D
L
D
Lift and drag
gTDLF 0 miiFlighti
Flight force
1( ) ( )ii i steering Flight i
i i i
t + Δt = t + F t +F t Δtm
t+ Δt = t + t+ Δt Δt
v v
r r v
Update
Velocity
Location
FF
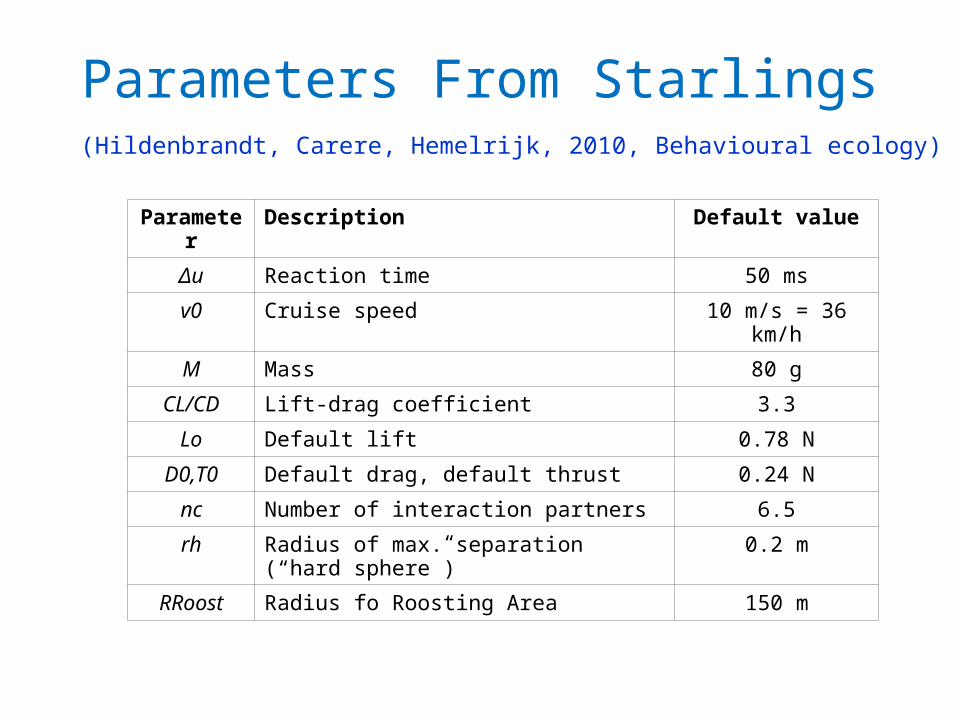
Parameters From Starlings
Parameter Description Default value
Δu Reaction time 50 ms
v0 Cruise speed 10 m/s = 36 km/h
M Mass 80 g
CL/CD Lift-drag coefficient 3.3
Lo Default lift 0.78 N
D0,T0 Default drag, default thrust 0.24 N
nc Number of interaction partners 6.5
rh Radius of max. separation (“hard sphere”) 0.2 m
RRoost Radius fo Roosting Area 150 m
(Hildenbrandt, Carere, Hemelrijk, 2010, Behavioural ecology)
Resemblance to real flocks?
QualitativeQuantitative
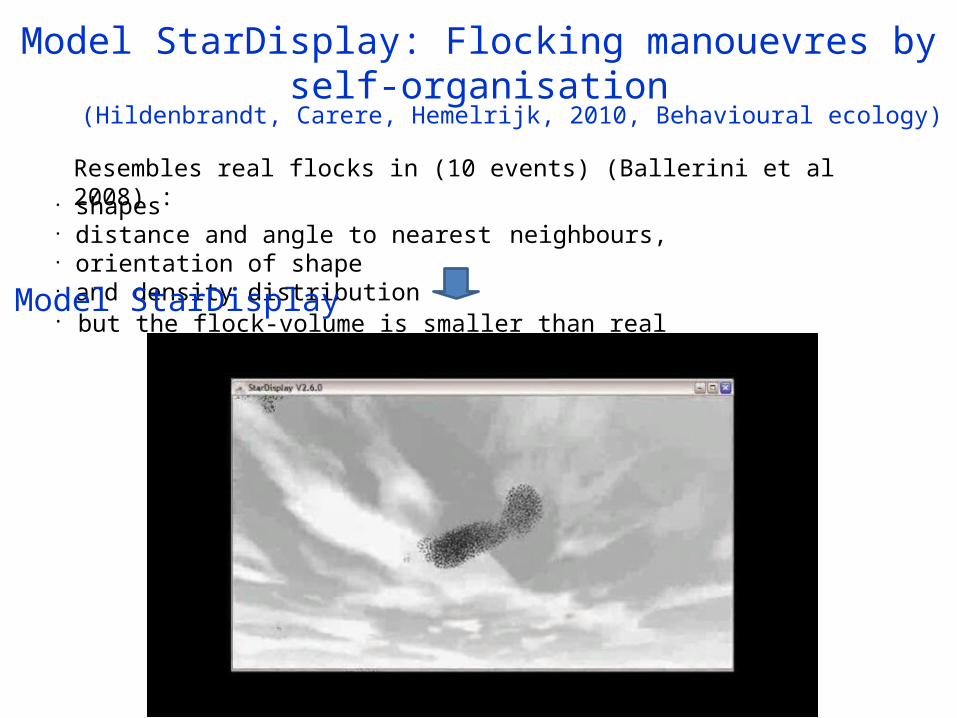
Model StarDisplay: Flocking manouevres by self-organisation
• shapes• distance and angle to nearest neighbours,• orientation of shape • and density distribution• but the flock-volume is smaller than real
(Hildenbrandt, Carere, Hemelrijk, 2010, Behavioural ecology)
Resembles real flocks in (10 events) (Ballerini et al 2008) :
Model StarDisplay
Model
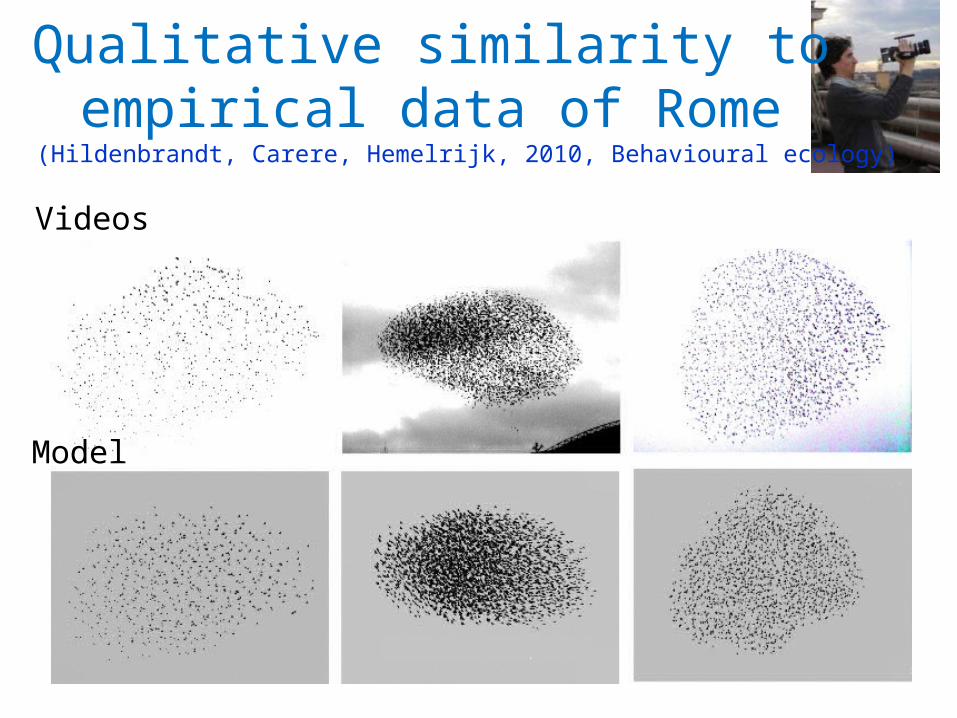
Videos
Qualitative similarity to empirical data of Rome
(Hildenbrandt, Carere, Hemelrijk, 2010, Behavioural ecology)
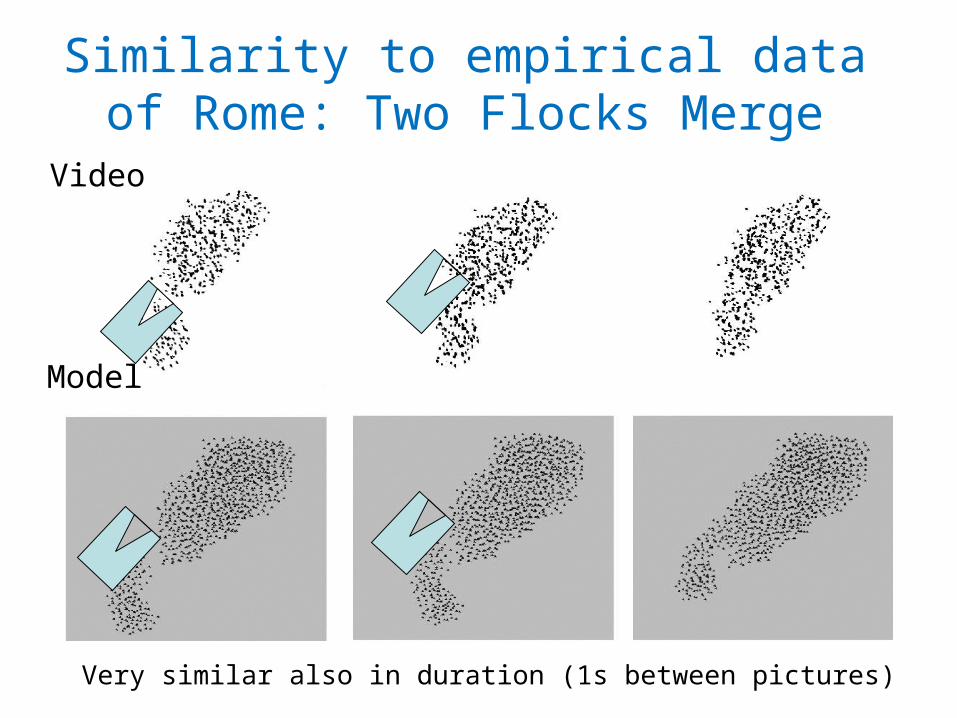
Similarity to empirical data of Rome: Two Flocks Merge
Video
Model
Very similar also in duration (1s between pictures)
Question
Why are bird flocks seldom oblong and why are they variable in shape?
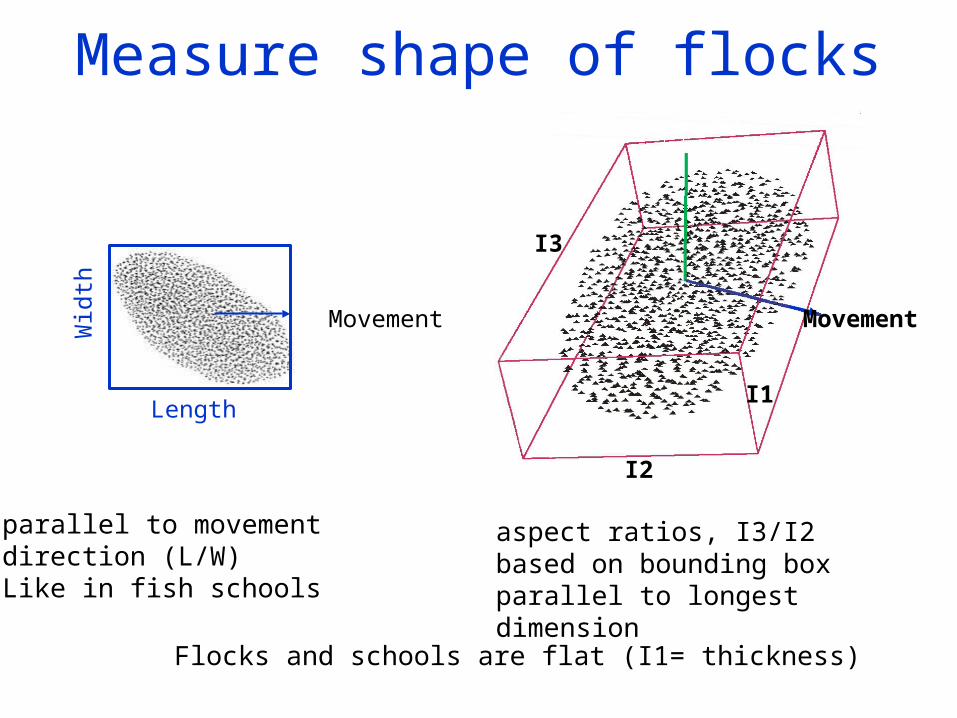
Measure shape of flocks
Movement
Length
Wid
th
parallel to movement direction (L/W)Like in fish schools
I1
I2
I3
aspect ratios, I3/I2 based on bounding box parallel to longest dimension
Flocks and schools are flat (I1= thickness)
Movement
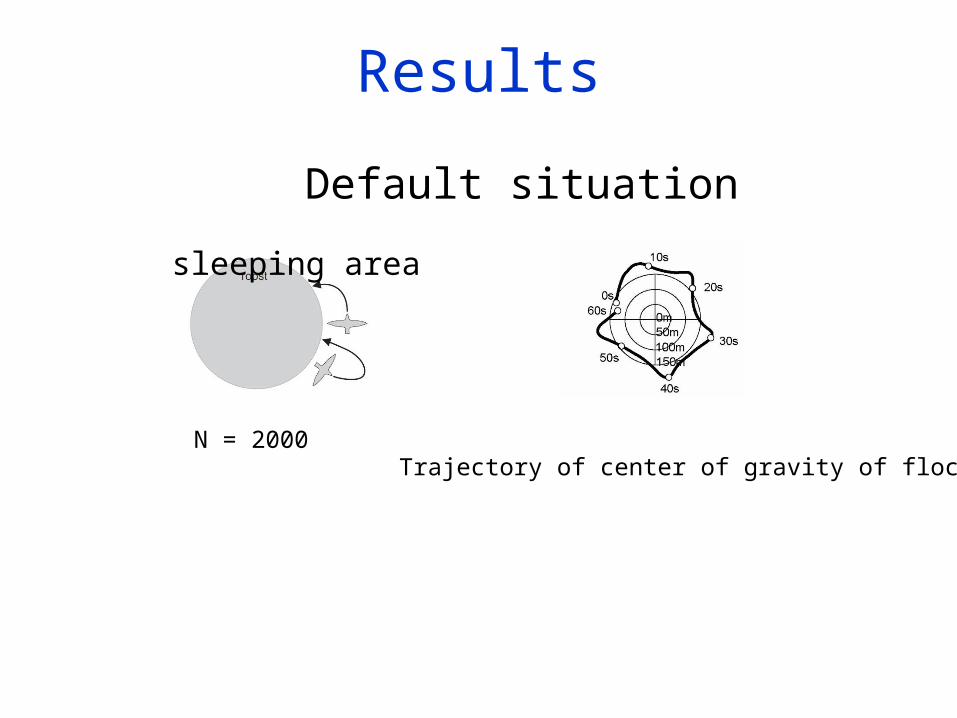
Results
Default situation
sleeping area
N = 2000Trajectory of center of gravity of flock
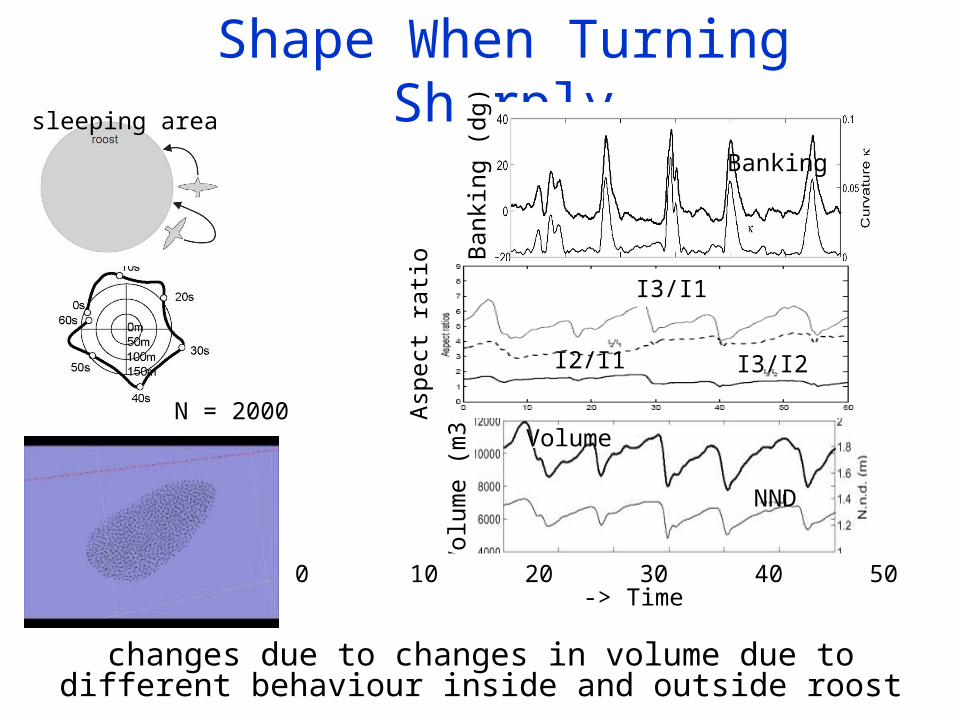
Shape When Turning Sharply
changes due to changes in volume due to different behaviour inside and outside roost
N = 2000
sleeping area
Ban
king
(dg
)
Banking
NND
Vol
ume
(m3) Volume
0 10 20 30 40 50 60-> Time
Asp
ect
ratio I3/I1
I2/I1 I3/I2
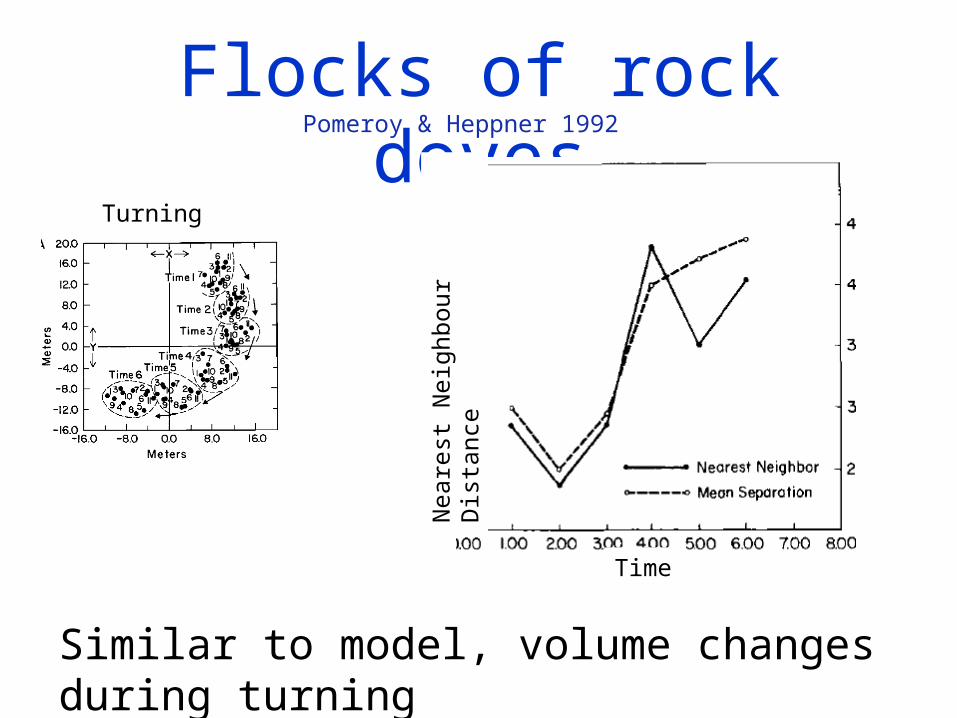
Flocks of rock doves
Similar to model, volume changes during turning
Nea
rest
Nei
ghbo
ur D
ista
nce
Pomeroy & Heppner 1992
Turning
Time
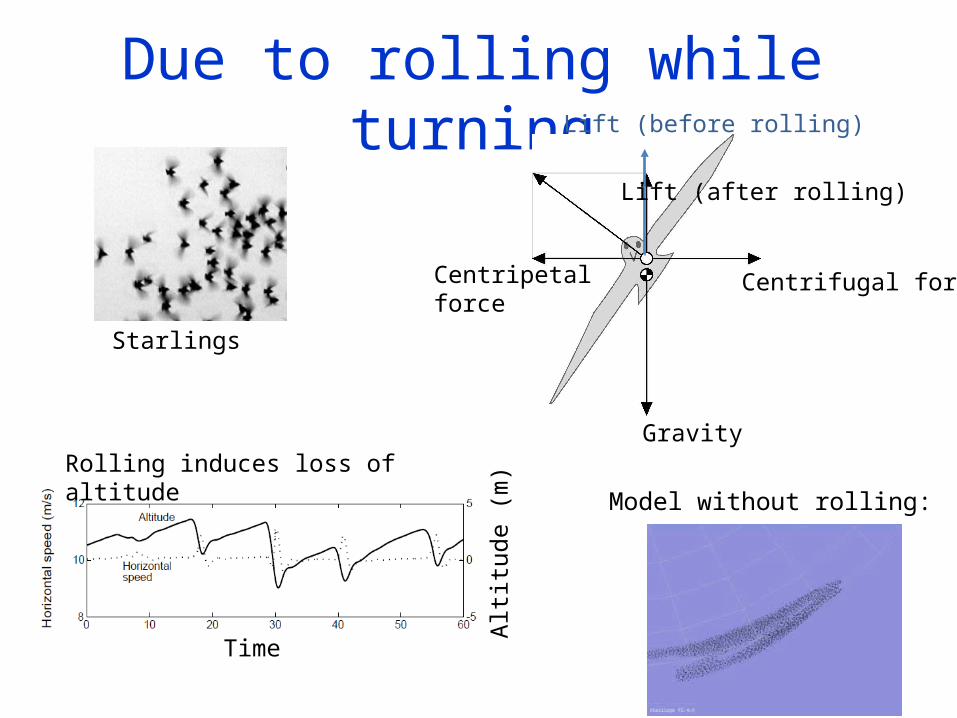
Due to rolling while turning
Starlings
Lift (before rolling)
Lift (after rolling)
Gravity
Centripetal force
Centrifugal force
Model without rolling: Rolling induces loss of altitude
Alti
tude
(m
)
Time
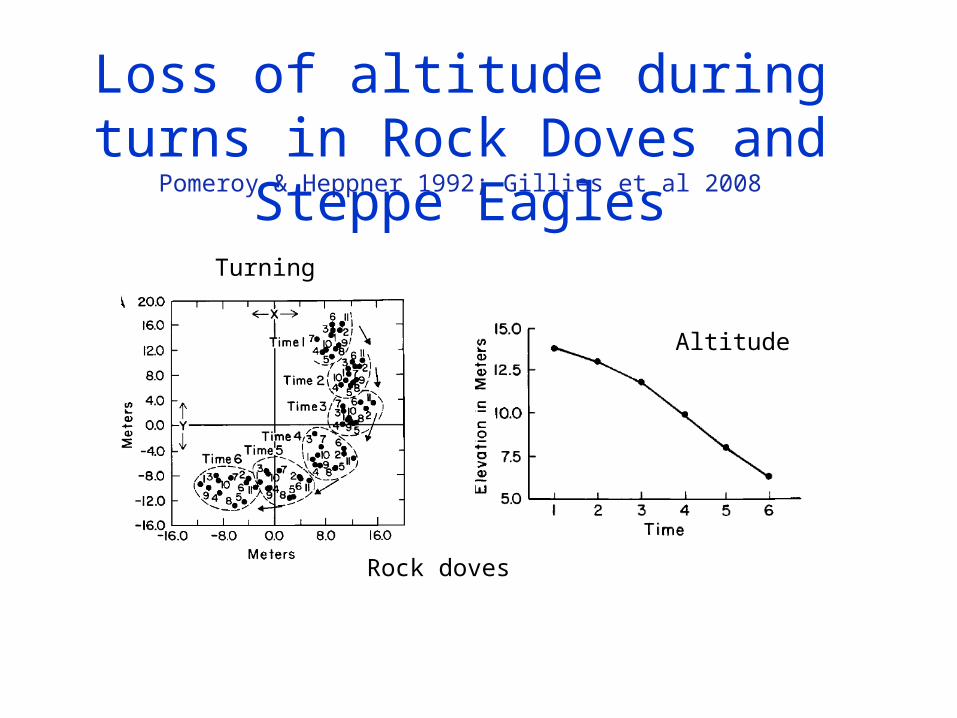
Loss of altitude during turns in Rock Doves and Steppe Eagles
Altitude
Turning
Pomeroy & Heppner 1992; Gillies et al 2008
Rock doves
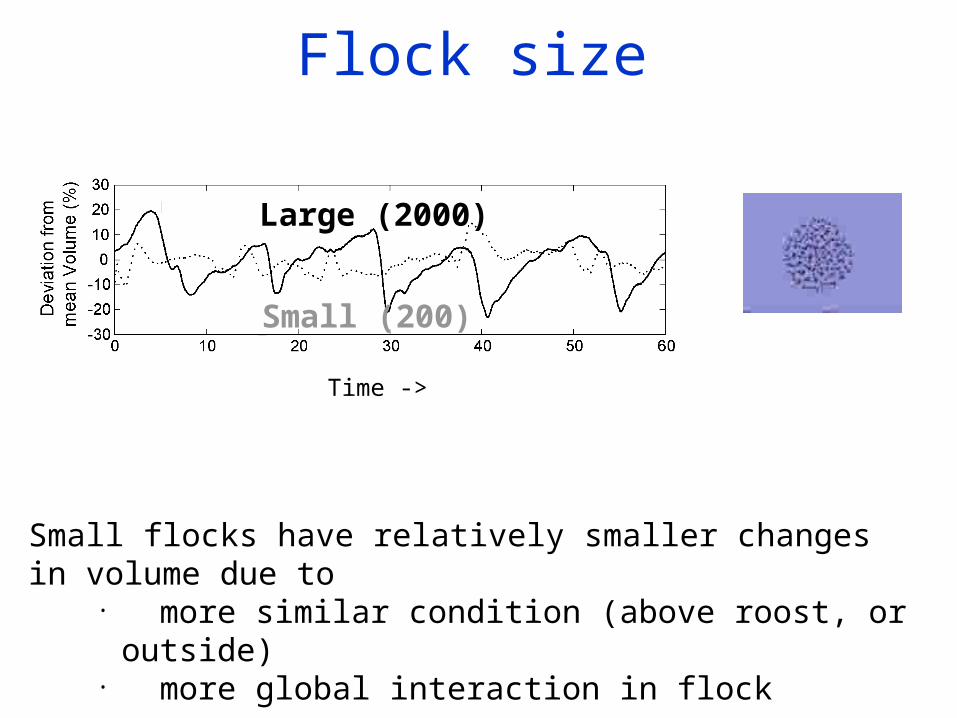
Flock size
Small flocks have relatively smaller changes in volume due to• more similar condition (above roost, or outside)• more global interaction in flock
Large (2000)
Small (200)
Time ->
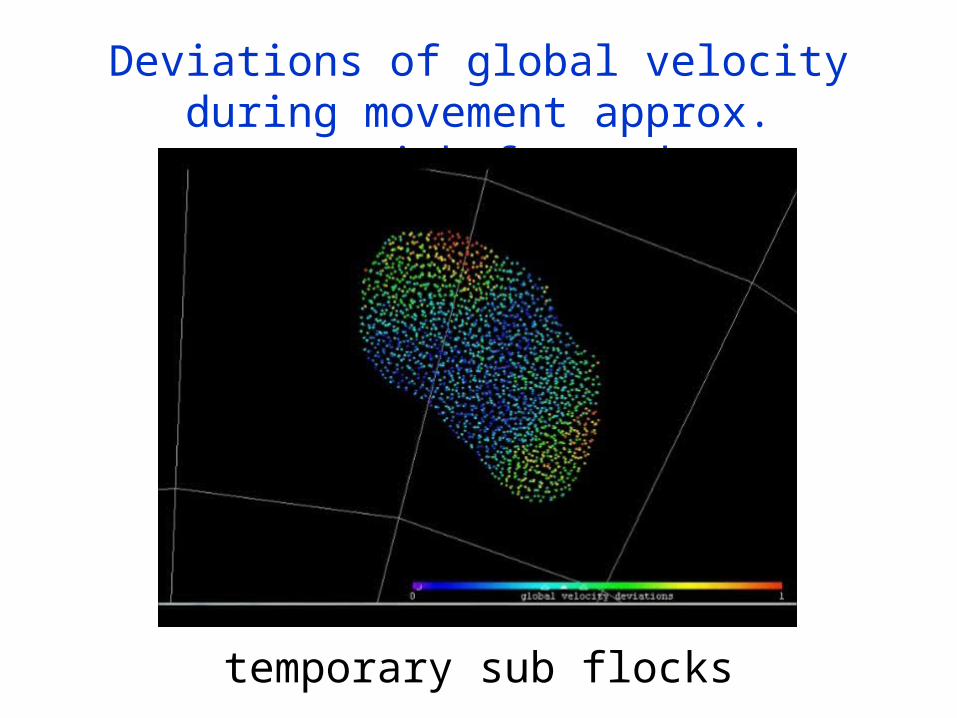
Deviations of global velocityduring movement approx. straightforward
temporary sub flocks
Corr
elati
on le
ngth
ξ (m
)
Deviation of Velocity
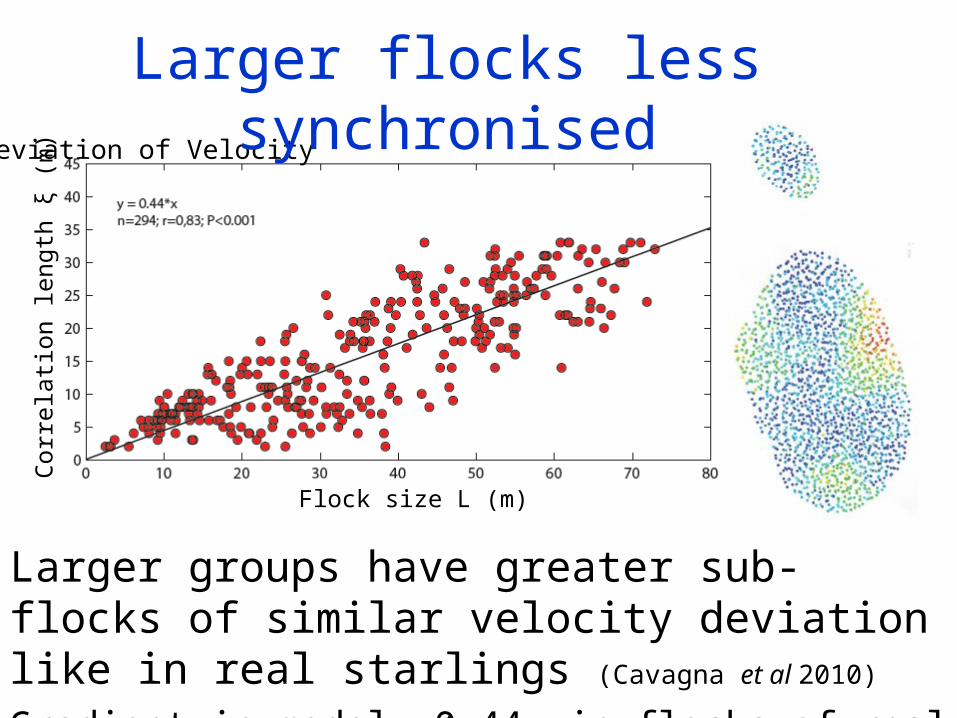
Larger flocks less synchronised
Larger groups have greater sub-flocks of similar velocity deviation like in real starlings (Cavagna et al 2010)
Gradient in model, 0.44, in flocks of real starlings 0.35
Flock size L (m)
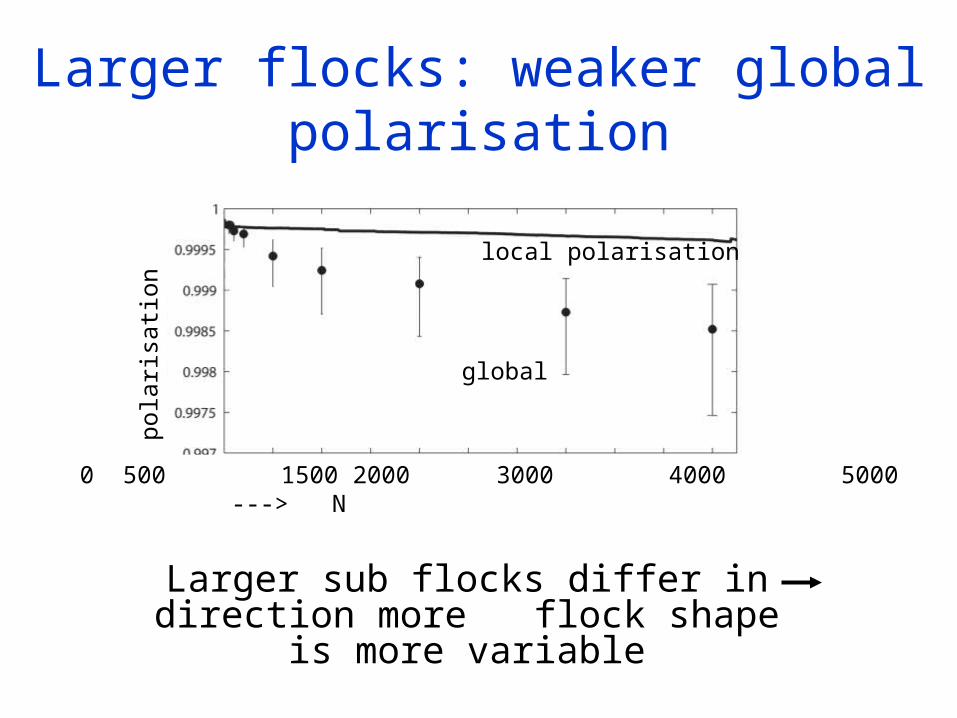
Larger flocks: weaker global polarisation
Larger sub flocks differ in direction more flock shape is more variable
global
local polarisation
pola
risati
on
0 500 1500 2000 3000 4000 5000---> N
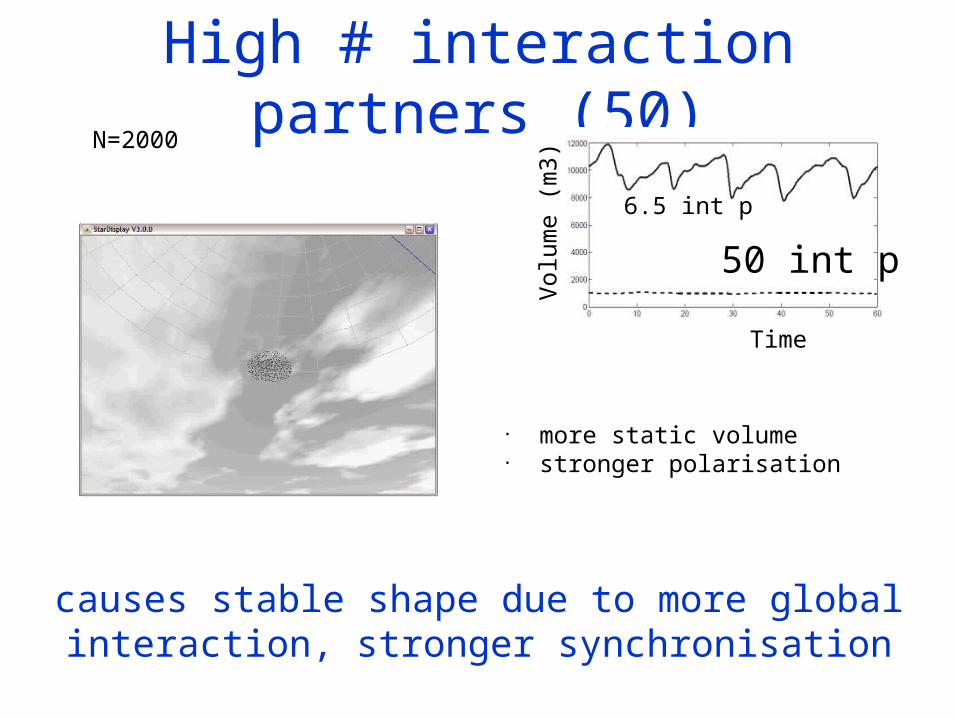
High # interaction partners (50)N=2000
causes stable shape due to more global interaction, stronger synchronisation
Vol
ume
(m3)
Time
6.5 int p
50 int p
• more static volume• stronger polarisation
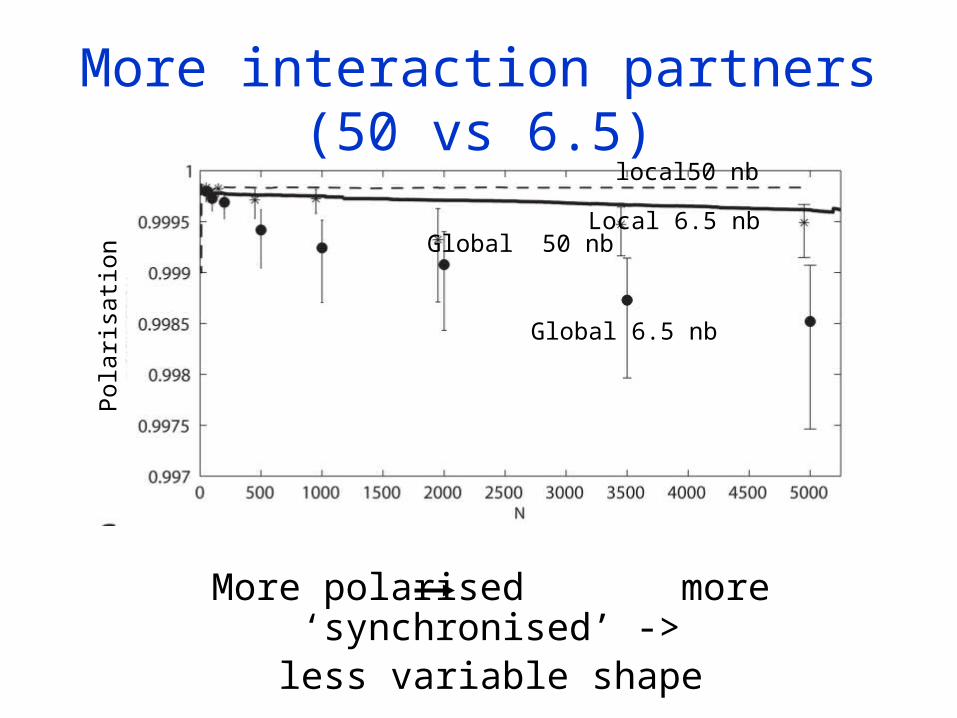
More interaction partners (50 vs 6.5)
More polarised more ‘synchronised’ ->less variable shape
Local 6.5 nb
Global 6.5 nb
local50 nb
Global 50 nb
Pola
risati
on
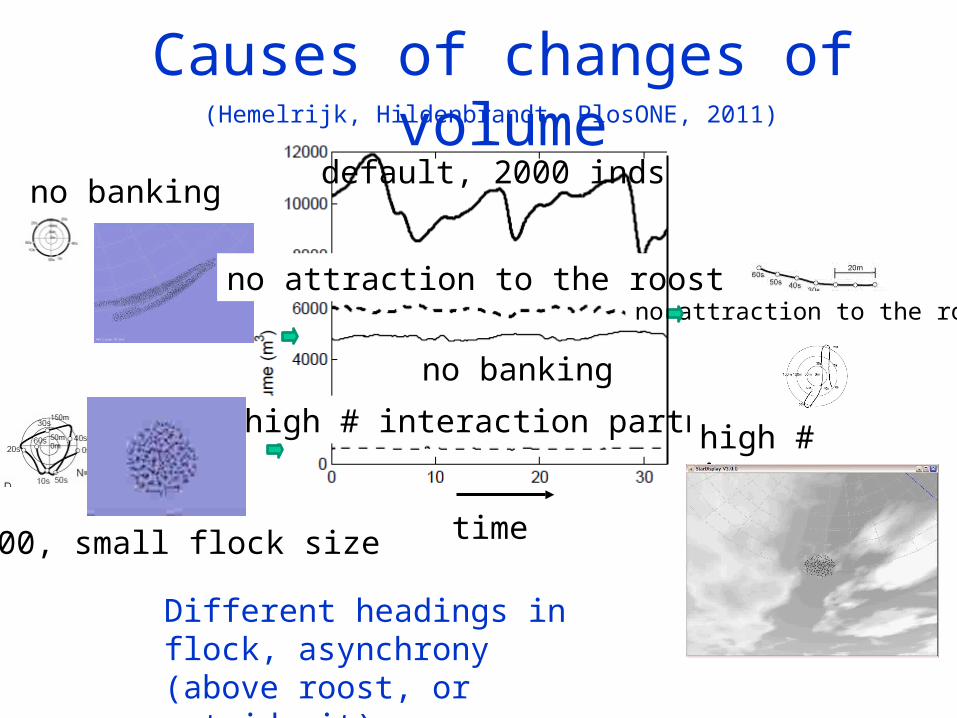
Causes of changes of volume
Different headings in flock, asynchrony (above roost, or outside it)
no attraction to the roost
no banking
high # interaction partners
time
no attraction to the roost
no banking
high # interact.-partners
default, 2000 inds
N=200, small flock size
(Hemelrijk, Hildenbrandt, PlosONE, 2011)
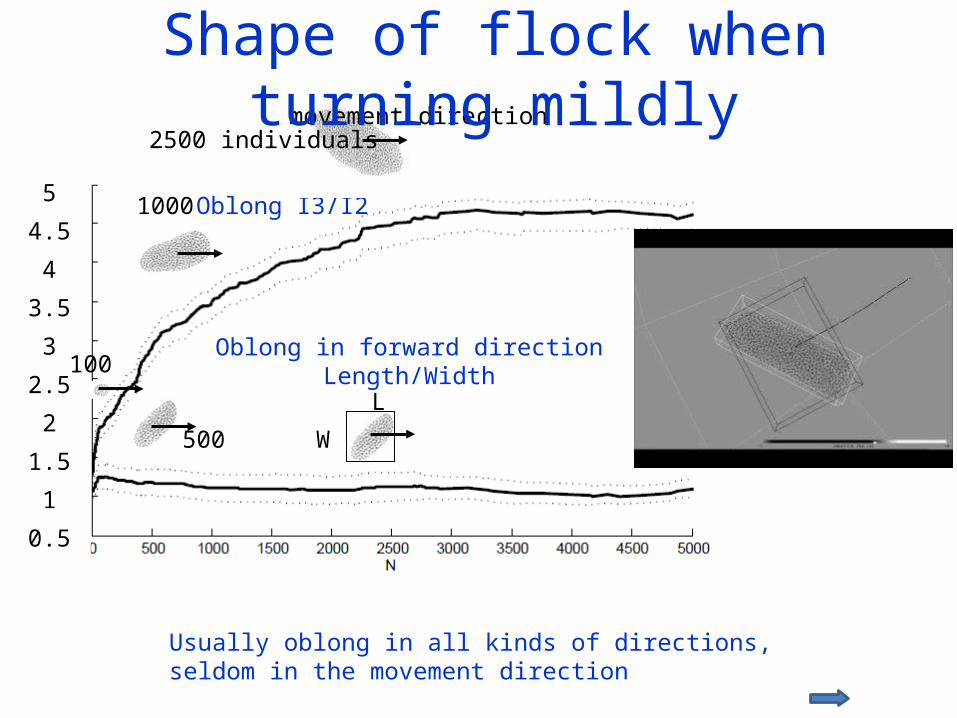
Oblong I3/I25
4.5
4
3.5
3
2.5
2
1.5
1
0.5
100
500
1000
2500 individuals
L
W
Oblong in forward directionLength/Width
movement direction
Usually oblong in all kinds of directions, seldom in the movement direction
Shape of flock when turning mildly
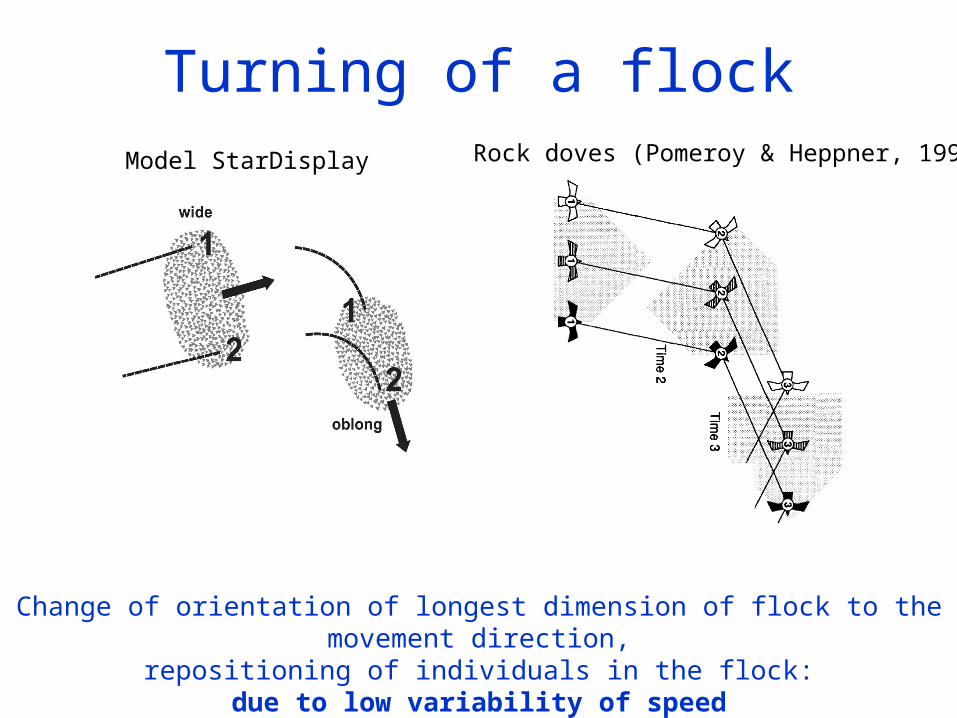
Turning of a flockModel StarDisplay Rock doves (Pomeroy & Heppner, 1992)
Change of orientation of longest dimension of flock to the movement direction,repositioning of individuals in the flock:
due to low variability of speed
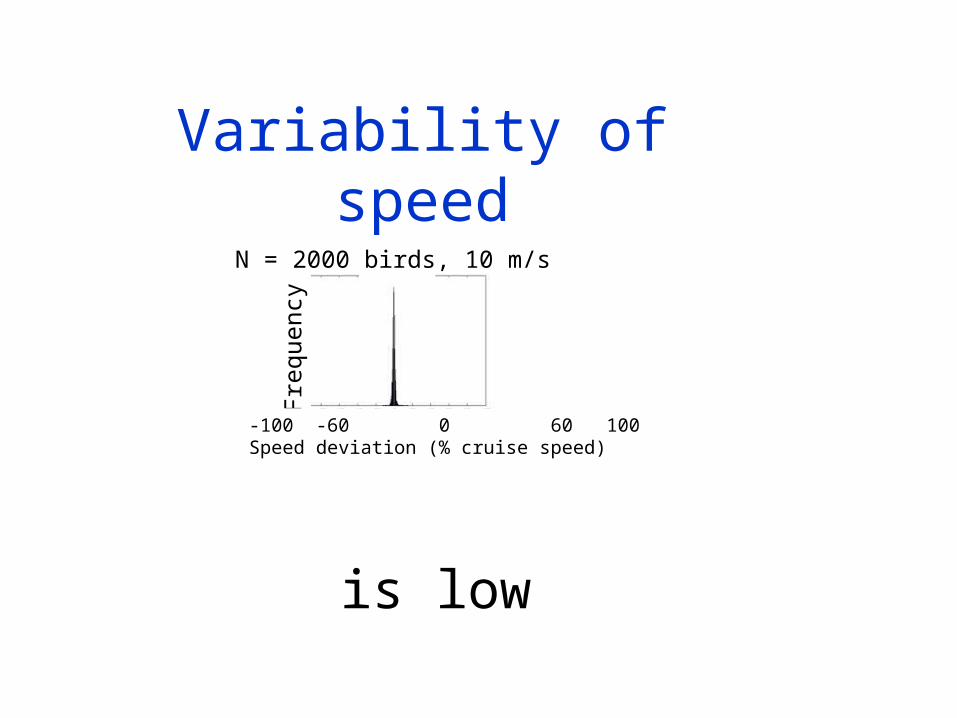
Variability of speed
Fre
quen
cy
-100 -60 0 60 100Speed deviation (% cruise speed)
N = 2000 birds, 10 m/s
is low
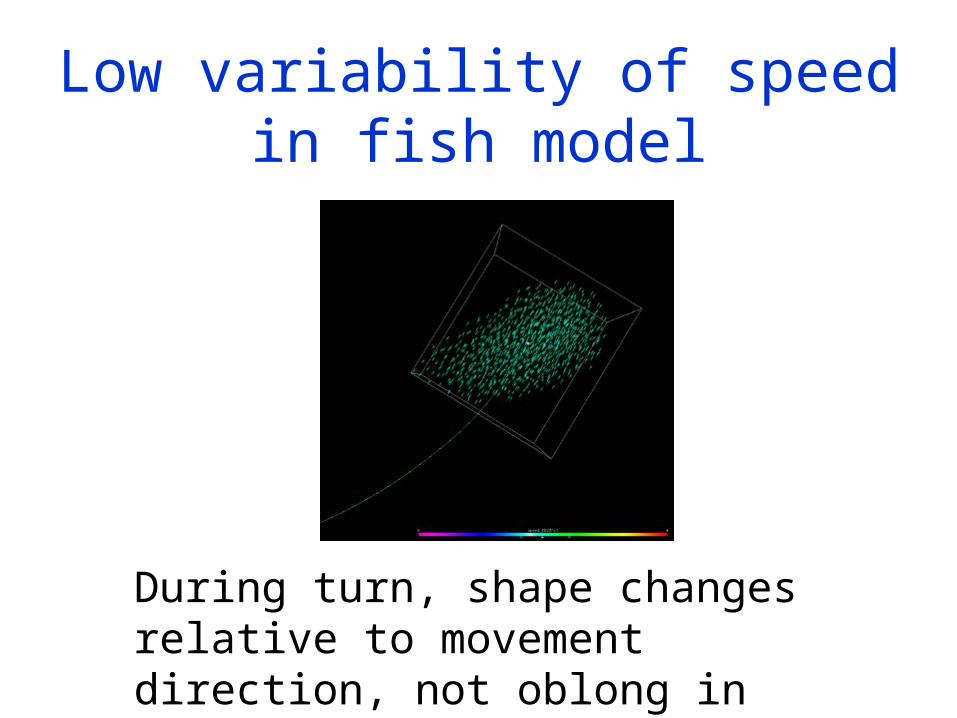
Low variability of speed in fish model
During turn, shape changes relative to movement direction, not oblong in movement direction
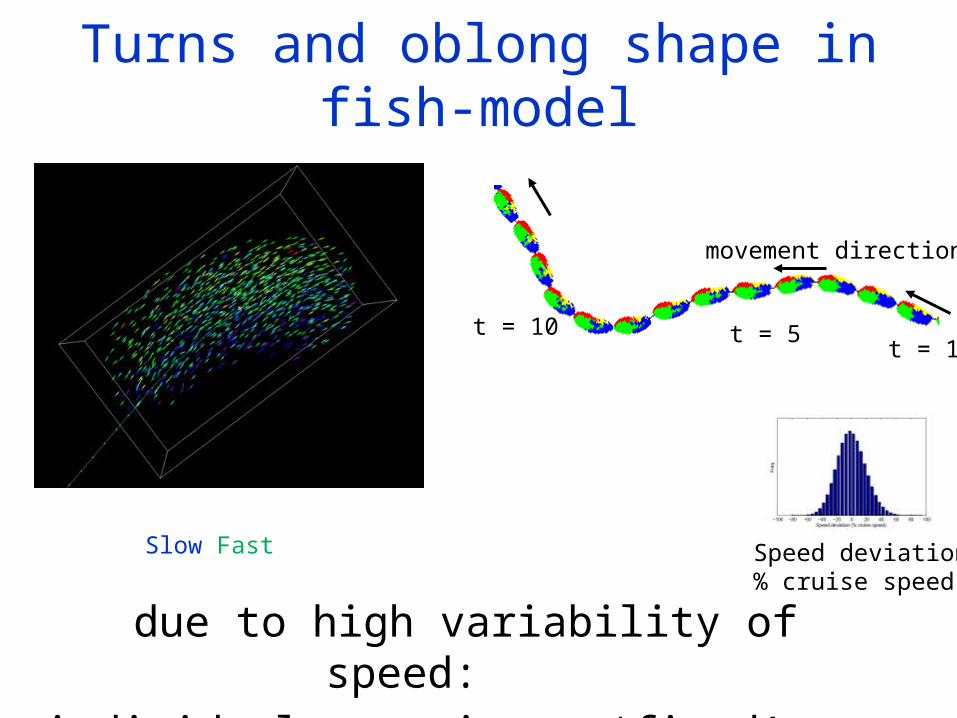
Turns and oblong shape in fish-model
due to high variability of speed: individuals remain at ‘fixed’ positions
t = 1
movement direction
t = 5t = 10
Speed deviation% cruise speed
Slow Fast
Advantage of lower variability of speed
• Saving energy • Confusing predators• Avoiding collisions -> traffic
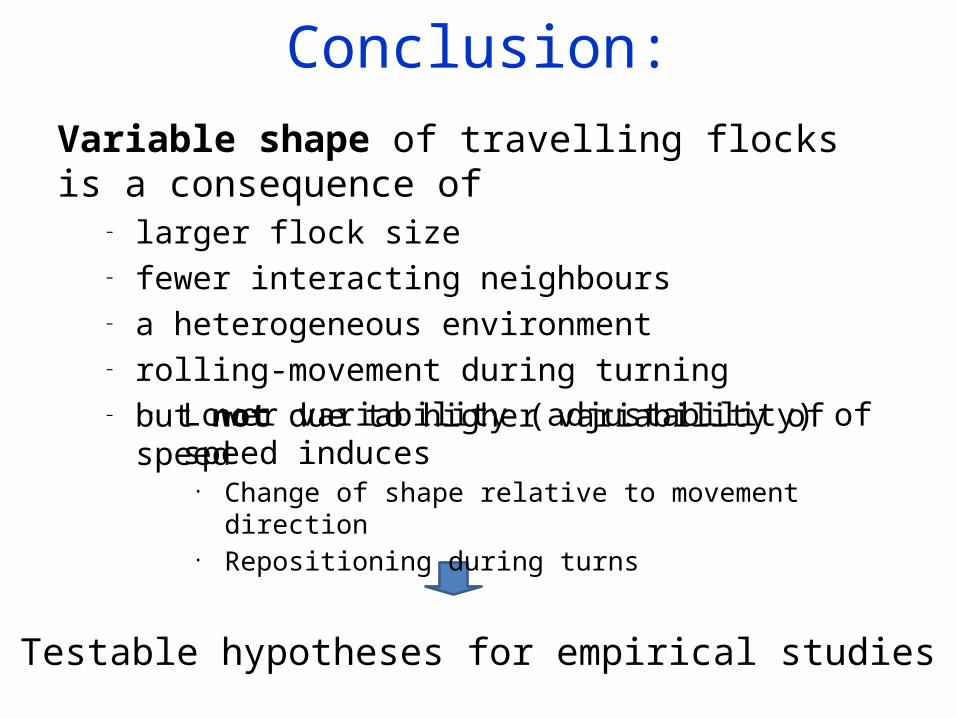
Conclusion:Variable shape of travelling flocks is a consequence of
– larger flock size– fewer interacting neighbours– a heterogeneous environment– rolling-movement during turning– but not due to higher variability of speed
• Lower variability (adjustability) of speed induces• Change of shape relative to movement direction• Repositioning during turns
Testable hypotheses for empirical studies
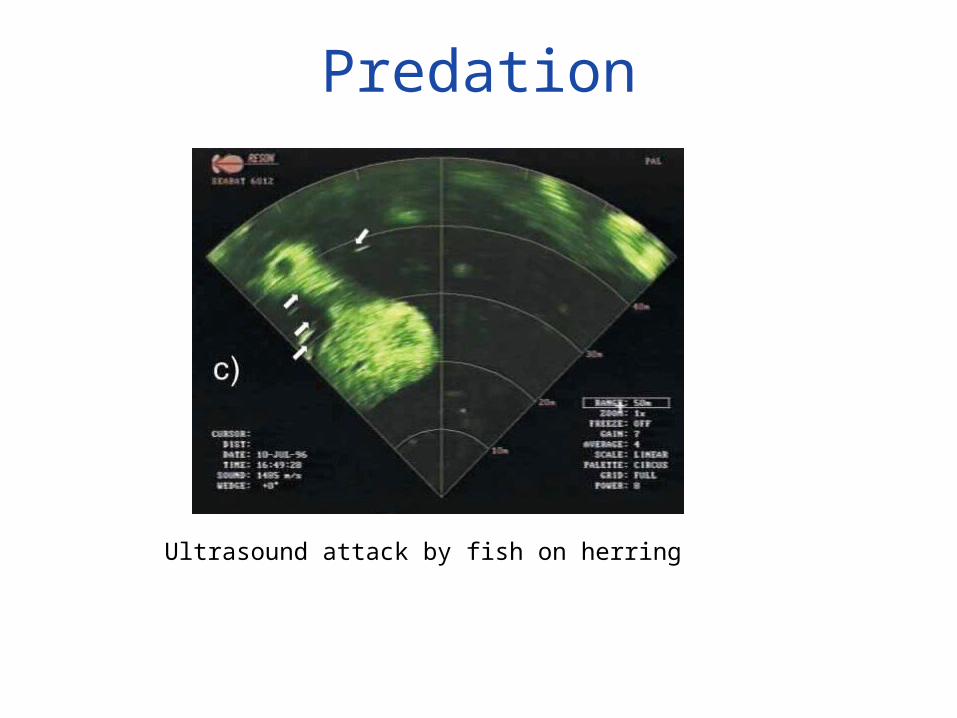
Predation
Ultrasound attack by fish on herring
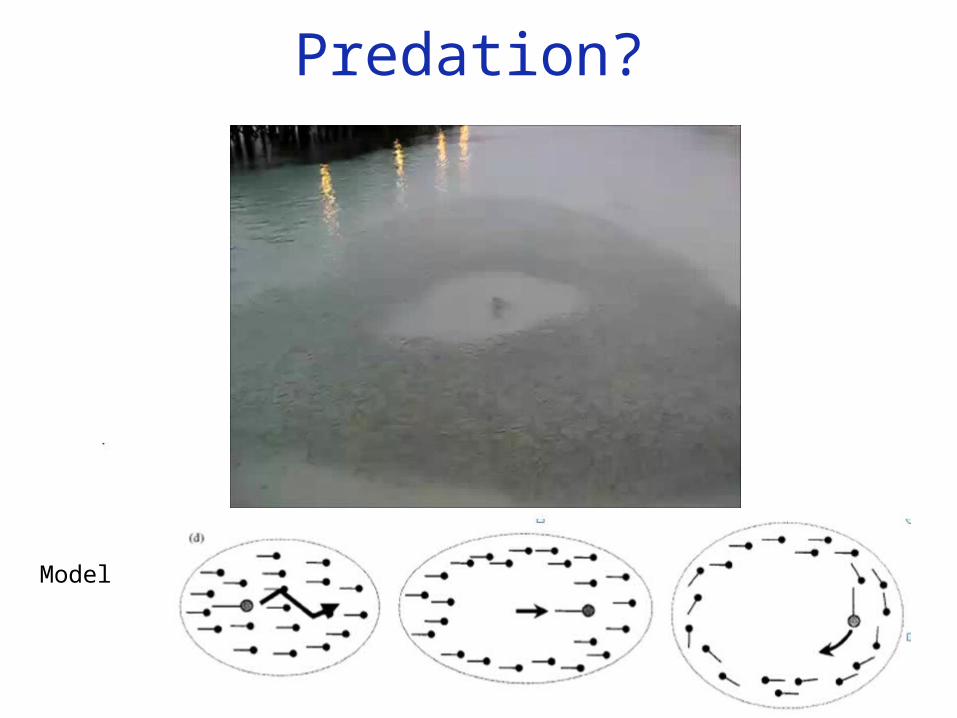
Predation?
Model
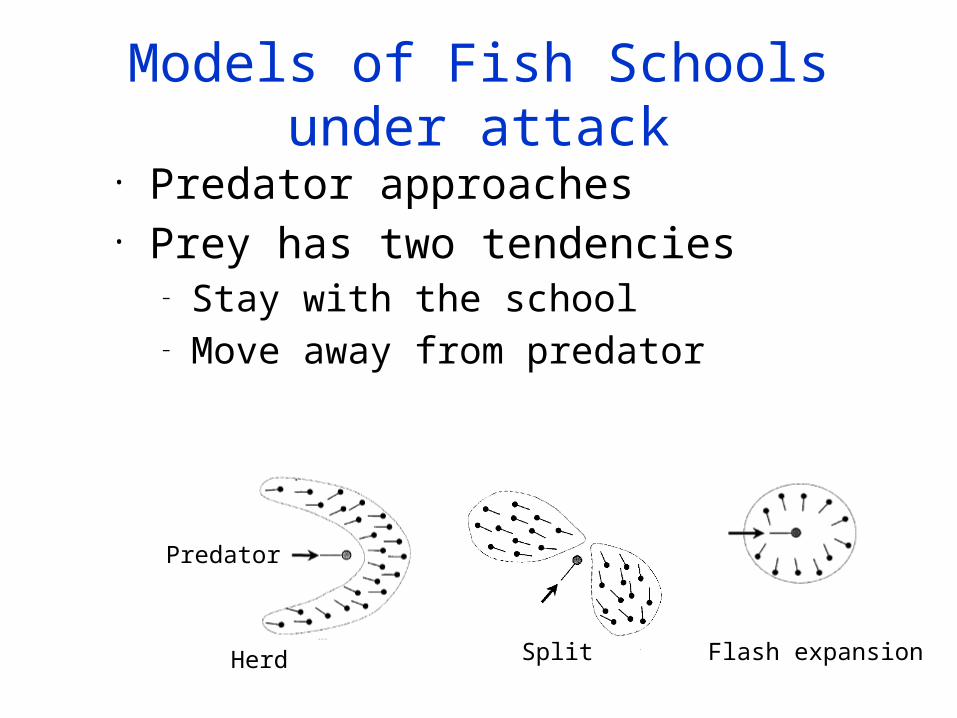
Models of Fish Schools under attack
• Predator approaches• Prey has two tendencies
– Stay with the school– Move away from predator
Herd Split Flash expansion
Predator
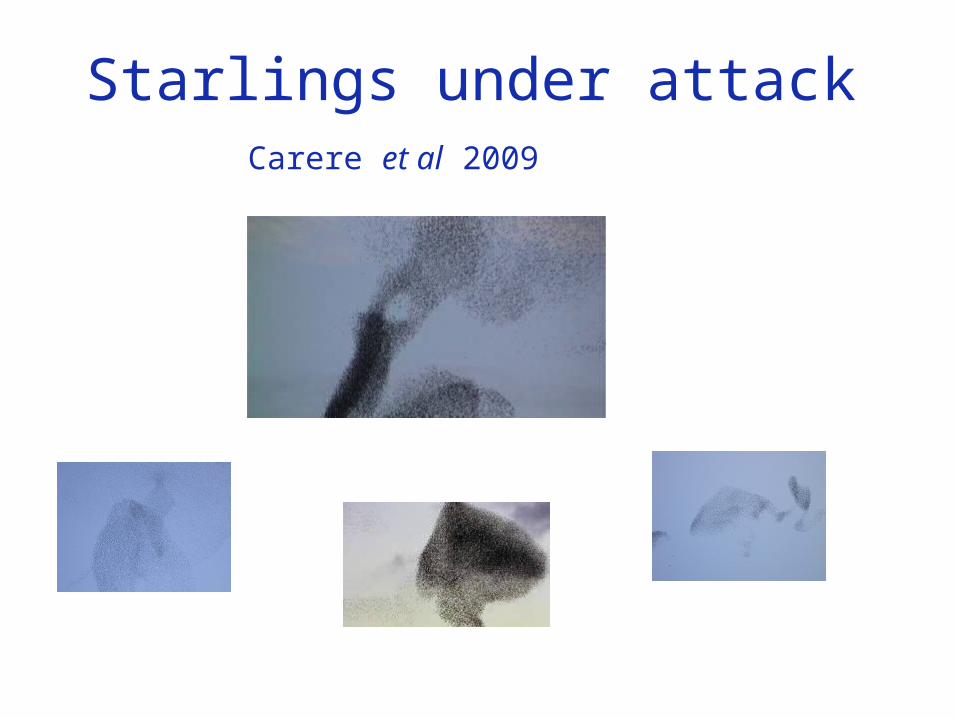
Starlings under attackCarere et al 2009
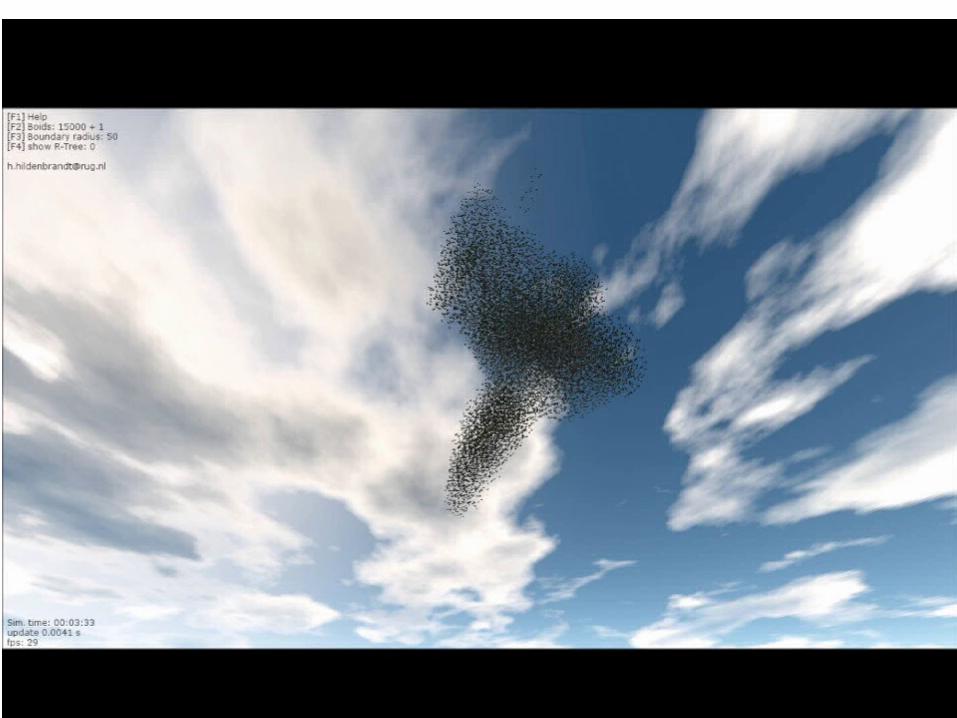
Model with bird-flocks under attack
Financial support
• European framework, StarFlag• NWO pilot grant• Startup grant from Rosalind Franklin
Fellowship at University of Groningen
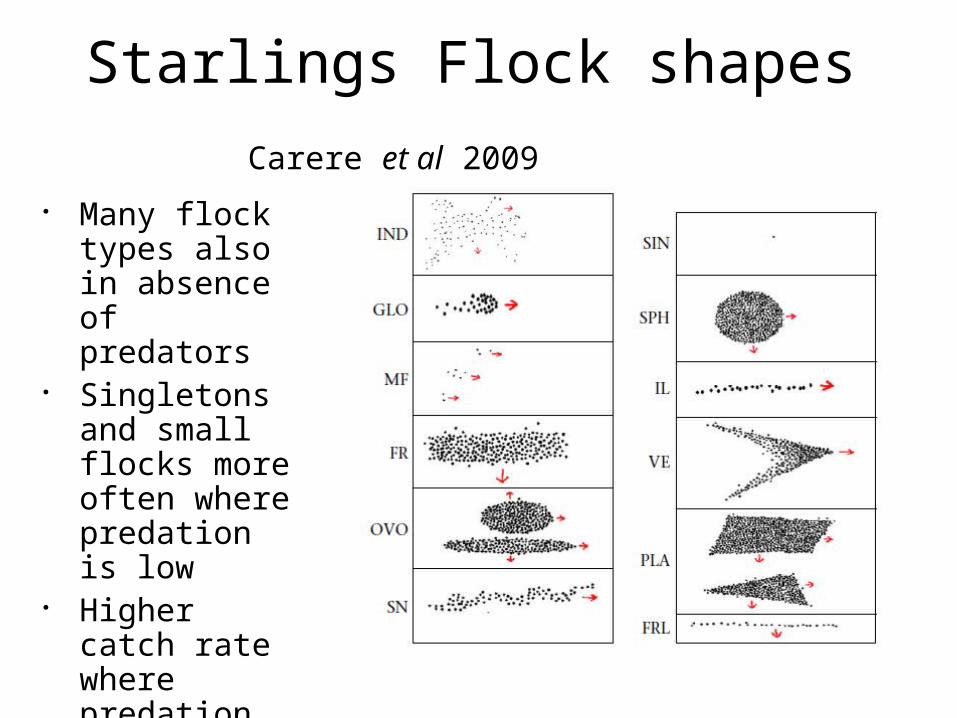
Starlings Flock shapes
Many flock types also in absence of predators
Singletons and small flocks more often where predation is low
Higher catch rate where predation is low
Carere et al 2009