ARBY’S - LoopNet
20
ARBY’S 4484 E MAIN STREET, WHITEHALL, OH 43213 OFFERING MEMORANDUM
Transcript of ARBY’S - LoopNet
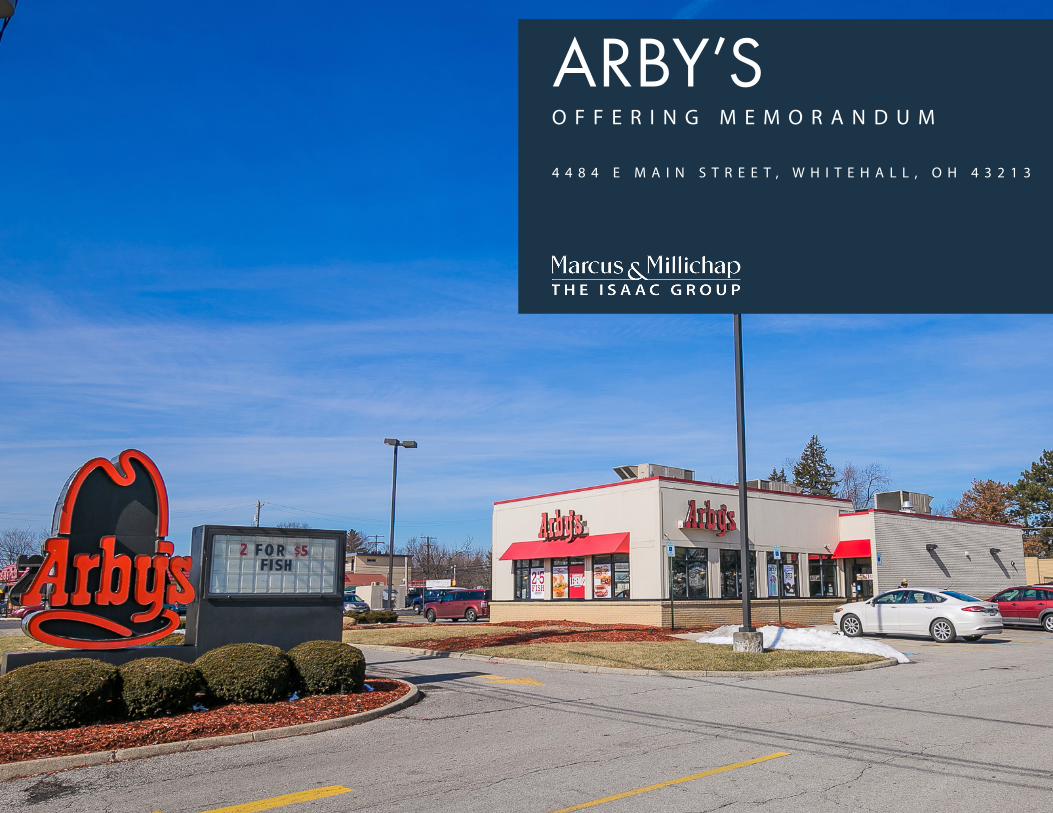
ARBY’S4 4 8 4 E M A I N S T R E E T , W H I T E H A L L , O H 4 3 2 1 3
O F F E R I N G M E M O R A N D U M
TABLE OF CONTENTS
01THE
INVESTMENT
PAGES 4-8
02THE
PROPERTY
PAGES 9-12
4 4 8 4 E M A I N S T R E E T, W H I T E H A L L , O H 4 3 2 1 3
03THE
MARKET
PAGE 14-16
04THE
OFFER
PAGE 18-19
Drew IsaacFirst Vice President InvestmentsDirector, Net Leased Properties Group& National Retail [email protected]
Brian BaileyAssociateNet Leased Properties GroupThe Isaac [email protected]

AR
BY
’S
-
W
HI
TE
HA
LL
,
OH
//
T
HE
I
NV
ES
TM
EN
T
THE INVESTMENT
01
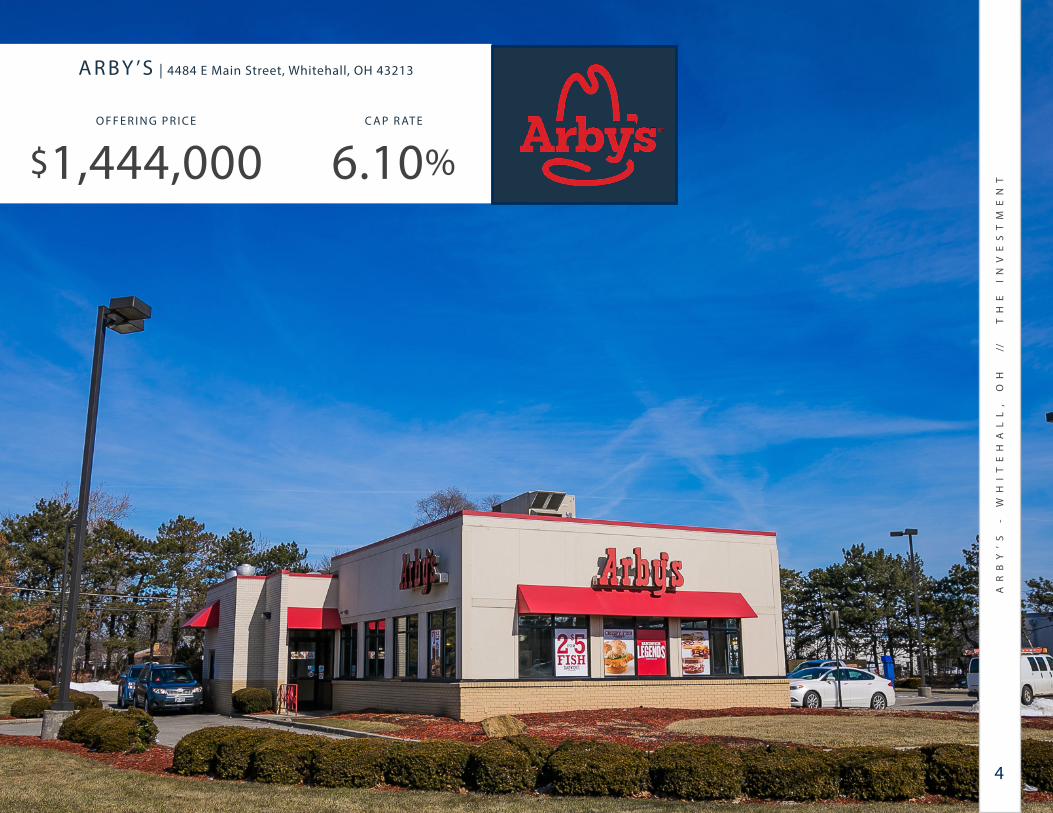
O F F E R I N G P R I C E
$1,444,000C A P R AT E
6.10%
A R BY ’S | 4484 E Main Street, Whitehall, OH 43213
AR
BY
’S
-
W
HI
TE
HA
LL
,
OH
//
T
HE
I
NV
ES
TM
EN
T
4
O F F E R I N G S U M M A R Y A R BY ’S | W H I T E H A L L , O H
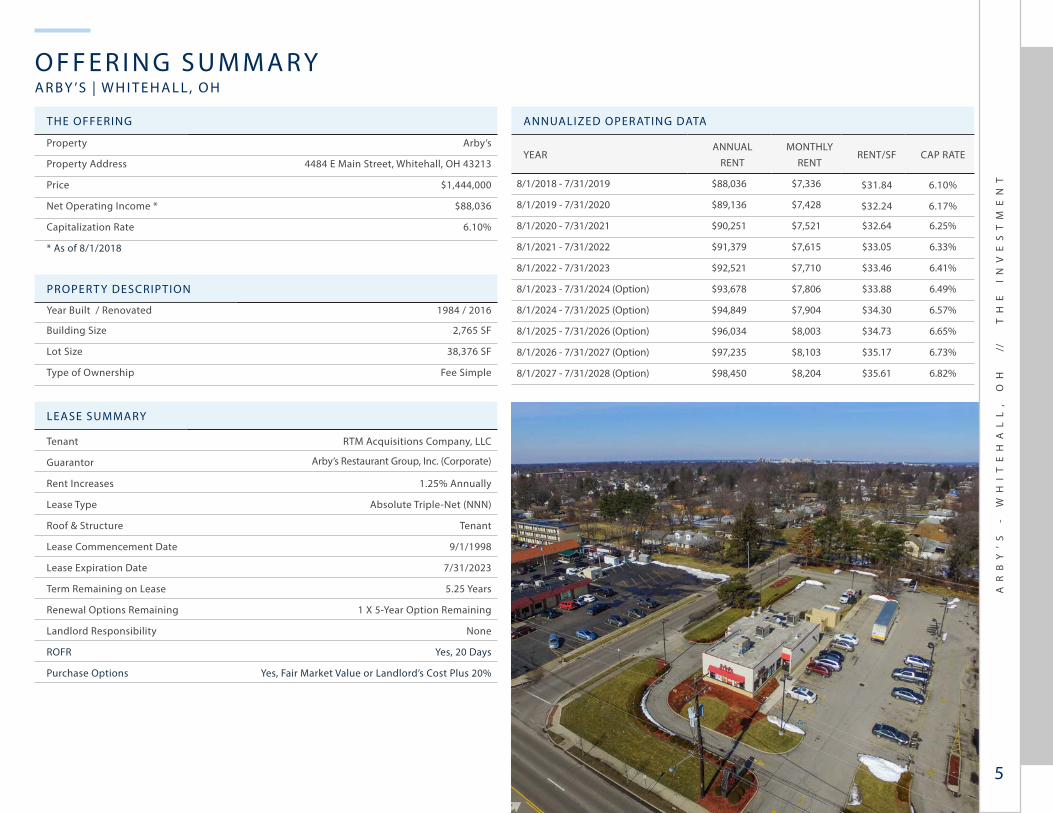
THE OFFERING
Property Arby’s
Property Address 4484 E Main Street, Whitehall, OH 43213
Price $1,444,000
Net Operating Income * $88,036
Capitalization Rate 6.10%
* As of 8/1/2018
PROPERT Y DESCRIPTION
Year Built / Renovated 1984 / 2016
Building Size 2,765 SF
Lot Size 38,376 SF
Type of Ownership Fee Simple
LEASE SUMMARY
Tenant RTM Acquisitions Company, LLC
Guarantor Arby’s Restaurant Group, Inc. (Corporate)
Rent Increases 1.25% Annually
Lease Type Absolute Triple-Net (NNN)
Roof & Structure Tenant
Lease Commencement Date 9/1/1998
Lease Expiration Date 7/31/2023
Term Remaining on Lease 5.25 Years
Renewal Options Remaining 1 X 5-Year Option Remaining
Landlord Responsibility None
ROFR Yes, 20 Days
Purchase Options Yes, Fair Market Value or Landlord’s Cost Plus 20%
ANNUALIZED OPERATING DATA
YEARANNUAL
RENTMONTHLY
RENTRENT/SF CAP RATE
8/1/2018 - 7/31/2019 $88,036 $7,336 $31.84 6.10%
8/1/2019 - 7/31/2020 $89,136 $7,428 $32.24 6.17%
8/1/2020 - 7/31/2021 $90,251 $7,521 $32.64 6.25%
8/1/2021 - 7/31/2022 $91,379 $7,615 $33.05 6.33%
8/1/2022 - 7/31/2023 $92,521 $7,710 $33.46 6.41%
8/1/2023 - 7/31/2024 (Option) $93,678 $7,806 $33.88 6.49%
8/1/2024 - 7/31/2025 (Option) $94,849 $7,904 $34.30 6.57%
8/1/2025 - 7/31/2026 (Option) $96,034 $8,003 $34.73 6.65%
8/1/2026 - 7/31/2027 (Option) $97,235 $8,103 $35.17 6.73%
8/1/2027 - 7/31/2028 (Option) $98,450 $8,204 $35.61 6.82%
AR
BY
’S
-
W
HI
TE
HA
LL
,
OH
//
T
HE
I
NV
ES
TM
EN
T
5
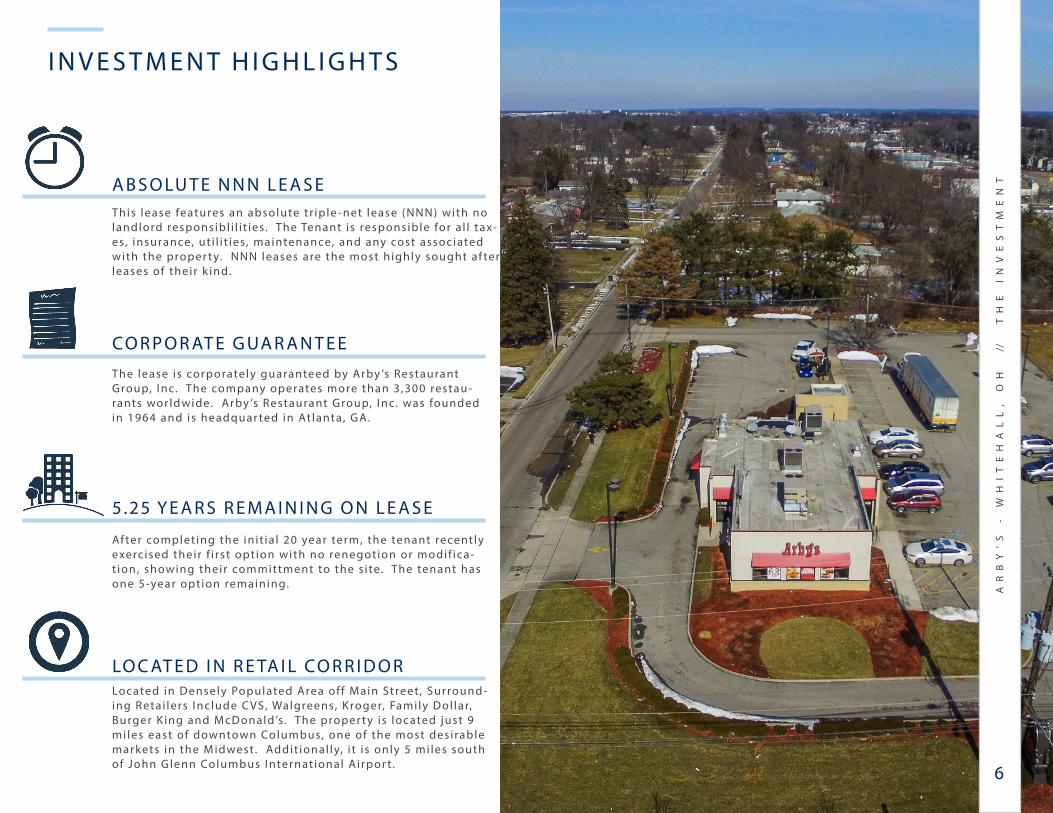
This lease features an absolute t r ip le -net lease (NNN) with no landlord responsibl i l i t ies. The Tenant is responsible for a l l tax-es, insurance, ut i l i t ies, maintenance, and any cost associated with the proper t y. NNN leases are the most h ighly sought af ter leases of their k ind.
The lease is corporately guaranteed by Arby ’s Restaurant Group, I nc. The company operates more than 3 ,300 restau-rants wor ldwide. Arby ’s Restaurant Group, I nc. was founded in 1964 and is headquar ted in At lanta , GA.
Af ter complet ing the in i t ia l 20 year term, the tenant recent ly exerc ised their f i rst opt ion with no renegotion or modif ica-t ion, showing their committment to the s i te. The tenant has one 5-year opt ion remaining.
Located in Densely Populated Area of f Main Street , Surround-ing Retai lers I nc lude C VS, Walgreens, K roger, Family Dol lar, Burger K ing and M cDonald ’s . The proper t y is located just 9 mi les east of downtown Columbus, one of the most des i rable markets in the M idwest . Addit ional ly, i t i s only 5 mi les south of John Glenn Columbus I nternat ional Airpor t .
I N V E S T M E N T H I G H L I G H T S
A B S O LU T E N N N L E A S E
CO R P O R AT E G UA R A N T E E
5.25 Y E A R S R E M A I N I N G O N L E A S E
LO C AT E D I N R E TA I L CO R R I D O R
AR
BY
’S
-
W
HI
TE
HA
LL
,
OH
//
T
HE
I
NV
ES
TM
EN
T
6
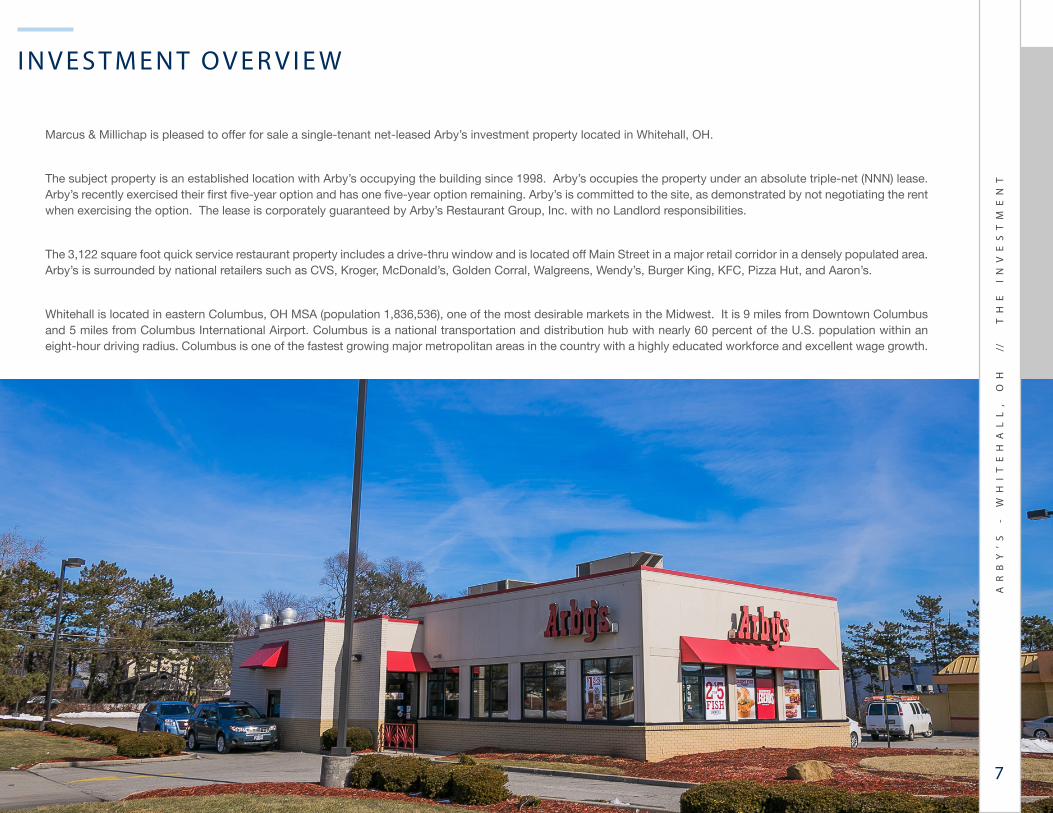
Marcus & Millichap is pleased to offer for sale a single-tenant net-leased Arby’s investment property located in Whitehall, OH.
The subject property is an established location with Arby’s occupying the building since 1998. Arby’s occupies the property under an absolute triple-net (NNN) lease. Arby’s recently exercised their first five-year option and has one five-year option remaining. Arby’s is committed to the site, as demonstrated by not negotiating the rent when exercising the option. The lease is corporately guaranteed by Arby’s Restaurant Group, Inc. with no Landlord responsibilities.
The 3,122 square foot quick service restaurant property includes a drive-thru window and is located off Main Street in a major retail corridor in a densely populated area. Arby’s is surrounded by national retailers such as CVS, Kroger, McDonald’s, Golden Corral, Walgreens, Wendy’s, Burger King, KFC, Pizza Hut, and Aaron’s.
Whitehall is located in eastern Columbus, OH MSA (population 1,836,536), one of the most desirable markets in the Midwest. It is 9 miles from Downtown Columbus and 5 miles from Columbus International Airport. Columbus is a national transportation and distribution hub with nearly 60 percent of the U.S. population within an eight-hour driving radius. Columbus is one of the fastest growing major metropolitan areas in the country with a highly educated workforce and excellent wage growth.
I N V E S T M E N T O V E R V I E W
AR
BY
’S
-
W
HI
TE
HA
LL
,
OH
//
T
HE
I
NV
ES
TM
EN
T
7
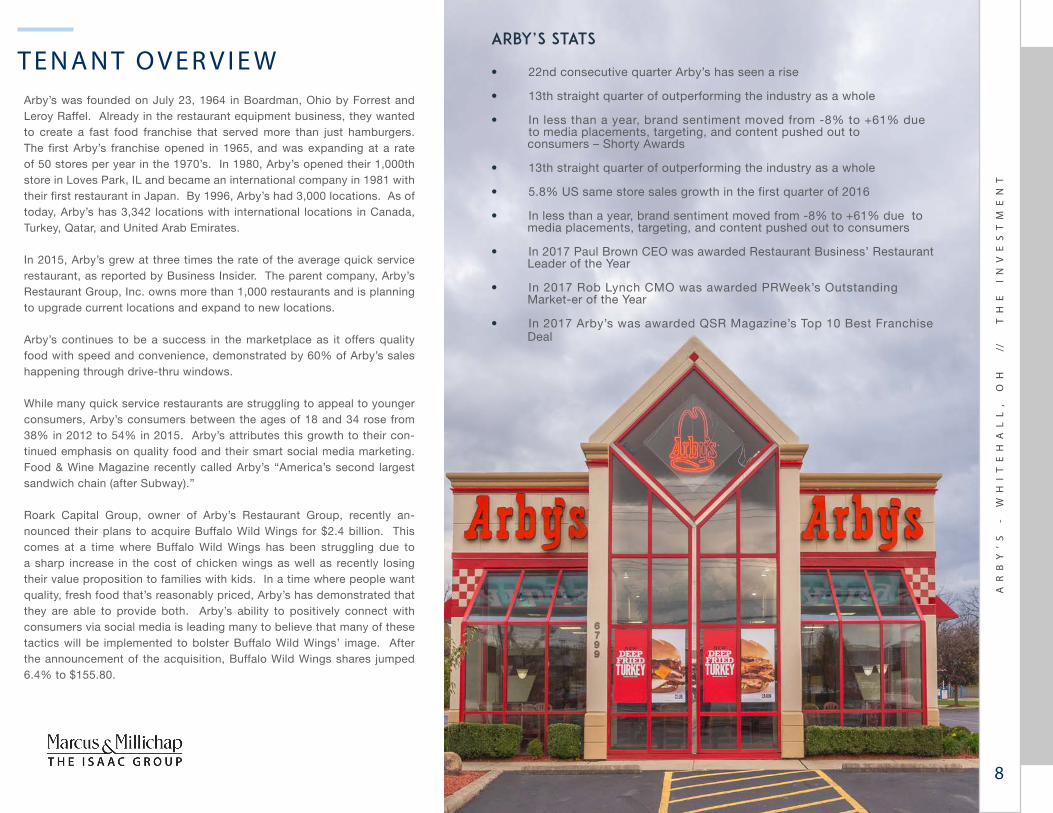
• 22nd consecutive quarter Arby’s has seen a rise
• 13th straight quarter of outperforming the industry as a whole
• In less than a year, brand sentiment moved from -8% to +61% due to media placements, targeting, and content pushed out to consumers – Shorty Awards
• 13th straight quarter of outperforming the industry as a whole
• 5.8% US same store sales growth in the first quarter of 2016
• In less than a year, brand sentiment moved from -8% to +61% due to media placements, targeting, and content pushed out to consumers
• In 2017 Paul Brown CEO was awarded Restaurant Business’ Restaurant Leader of the Year • In 2017 Rob Lynch CMO was awarded PRWeek’s Outstanding Market-er of the Year
• In 2017 Arby’s was awarded QSR Magazine’s Top 10 Best Franchise Deal
ARBY’S STATS
Arby’s was founded on July 23, 1964 in Boardman, Ohio by Forrest and Leroy Raffel. Already in the restaurant equipment business, they wanted to create a fast food franchise that served more than just hamburgers. The first Arby’s franchise opened in 1965, and was expanding at a rate of 50 stores per year in the 1970’s. In 1980, Arby’s opened their 1,000th store in Loves Park, IL and became an international company in 1981 with their first restaurant in Japan. By 1996, Arby’s had 3,000 locations. As of today, Arby’s has 3,342 locations with international locations in Canada, Turkey, Qatar, and United Arab Emirates.
In 2015, Arby’s grew at three times the rate of the average quick service restaurant, as reported by Business Insider. The parent company, Arby’s Restaurant Group, Inc. owns more than 1,000 restaurants and is planning to upgrade current locations and expand to new locations.
Arby’s continues to be a success in the marketplace as it offers quality food with speed and convenience, demonstrated by 60% of Arby’s sales happening through drive-thru windows.
While many quick service restaurants are struggling to appeal to younger consumers, Arby’s consumers between the ages of 18 and 34 rose from 38% in 2012 to 54% in 2015. Arby’s attributes this growth to their con-tinued emphasis on quality food and their smart social media marketing. Food & Wine Magazine recently called Arby’s “America’s second largest sandwich chain (after Subway).”
Roark Capital Group, owner of Arby’s Restaurant Group, recently an-nounced their plans to acquire Buffalo Wild Wings for $2.4 billion. This comes at a time where Buffalo Wild Wings has been struggling due to a sharp increase in the cost of chicken wings as well as recently losing their value proposition to families with kids. In a time where people want quality, fresh food that’s reasonably priced, Arby’s has demonstrated that they are able to provide both. Arby’s ability to positively connect with consumers via social media is leading many to believe that many of these tactics will be implemented to bolster Buffalo Wild Wings’ image. After the announcement of the acquisition, Buffalo Wild Wings shares jumped 6.4% to $155.80.
T E N A N T O V E R V I E W
AR
BY
’S
-
W
HI
TE
HA
LL
,
OH
//
T
HE
I
NV
ES
TM
EN
T
8
AR
BY
’S
-
W
HI
TE
HA
LL
,
OH
//
T
HE
P
RO
PE
RT
Y
THEPROPER T Y
02
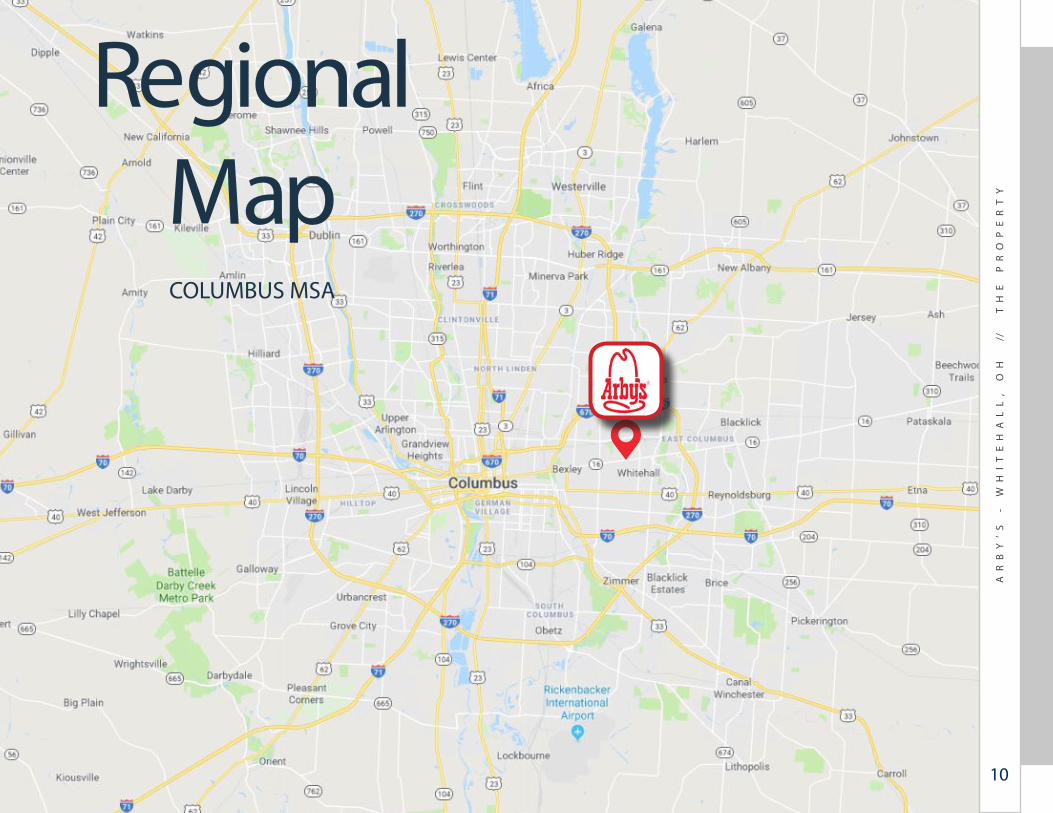
RegionalMapCOLUMBUS MSA
AR
BY
’S
-
W
HI
TE
HA
LL
,
OH
//
T
HE
P
RO
PE
RT
Y
10
317
Columbus, OH
9 Miles
John Glenn Columbus International Airport
5 Miles
11
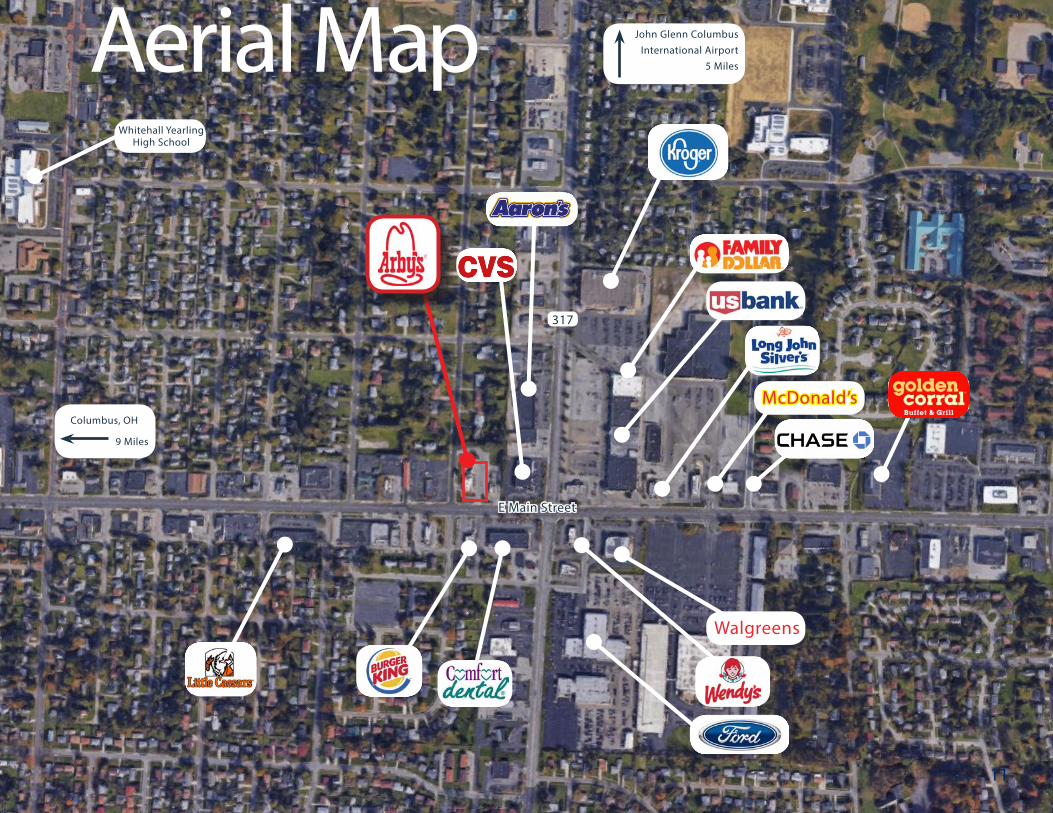
Aerial Map
McDonald’s
Walgreens
Whitehall YearlingHigh School
E Main Street
317
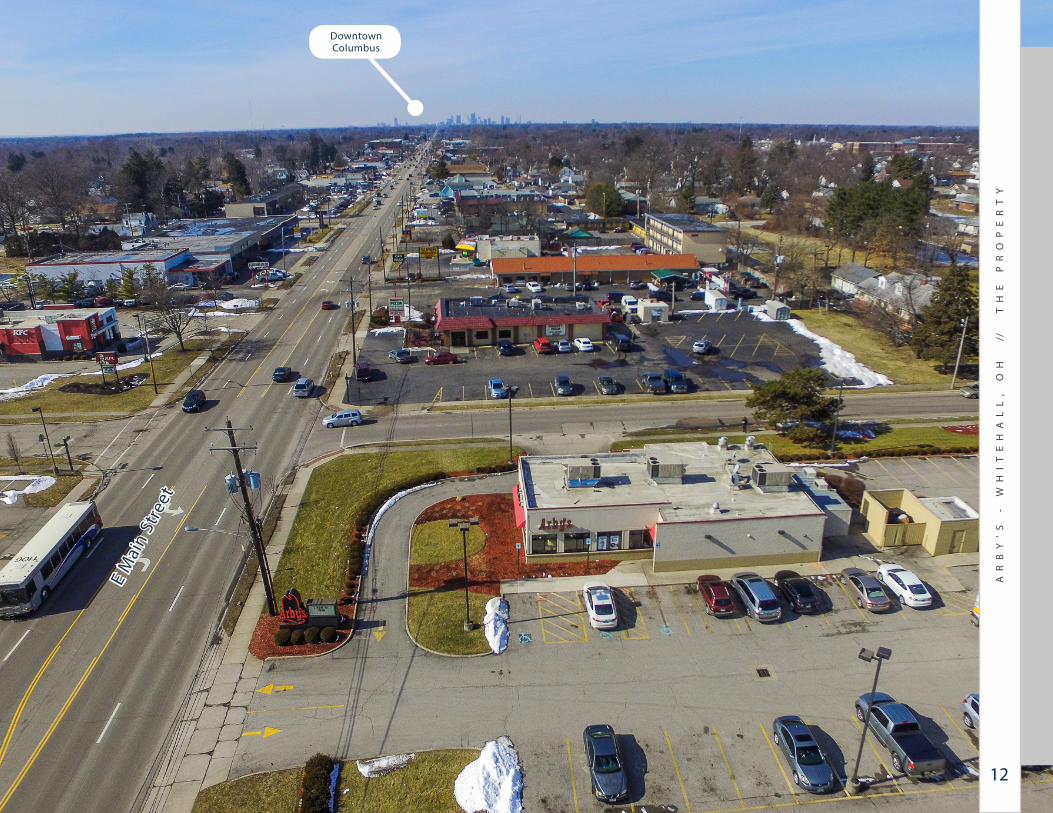
Downtown Columbus
AR
BY
’S
-
W
HI
TE
HA
LL
,
OH
//
T
HE
P
RO
PE
RT
Y
12
E M
ain
Stre
et

AR
BY
’S
-
W
HI
TE
HA
LL
,
OH
//
T
HE
M
AR
KE
TTHEMARKE T
03
location overviewColumbus, OH
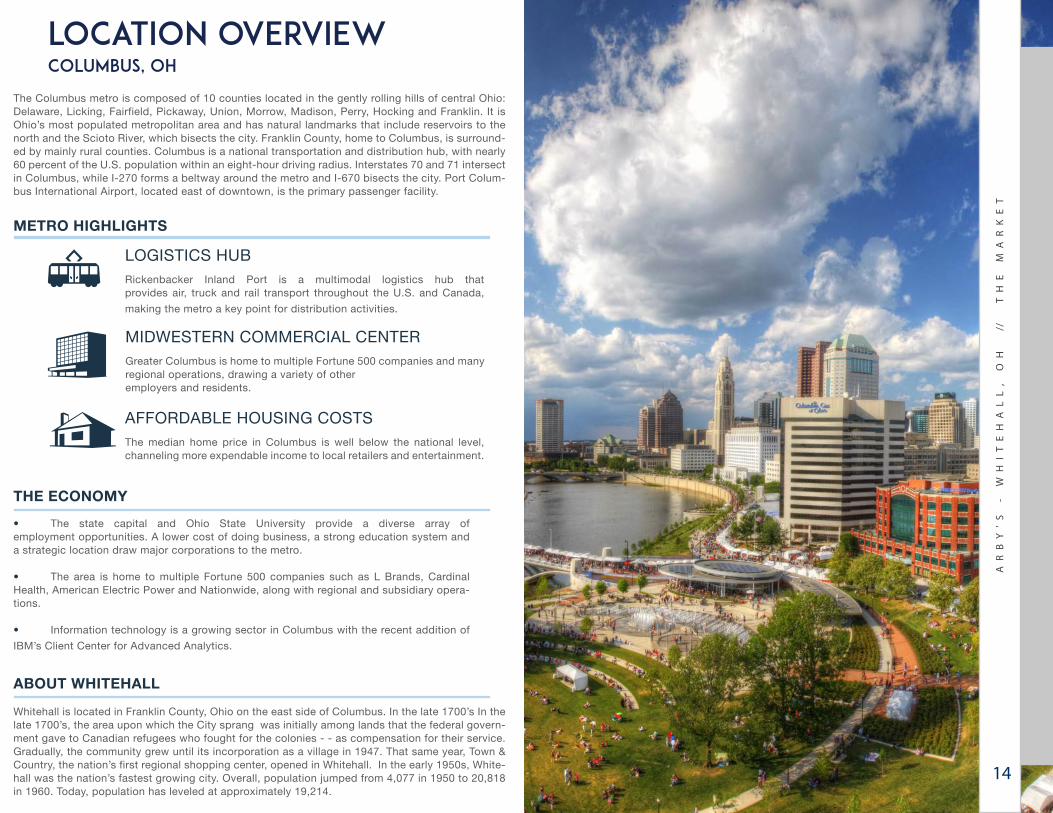
The Columbus metro is composed of 10 counties located in the gently rolling hills of central Ohio: Delaware, Licking, Fairfield, Pickaway, Union, Morrow, Madison, Perry, Hocking and Franklin. It is Ohio’s most populated metropolitan area and has natural landmarks that include reservoirs to the north and the Scioto River, which bisects the city. Franklin County, home to Columbus, is surround-ed by mainly rural counties. Columbus is a national transportation and distribution hub, with nearly 60 percent of the U.S. population within an eight-hour driving radius. Interstates 70 and 71 intersect in Columbus, while I-270 forms a beltway around the metro and I-670 bisects the city. Port Colum-bus International Airport, located east of downtown, is the primary passenger facility.
Rickenbacker Inland Port is a multimodal logistics hub that provides air, truck and rail transport throughout the U.S. and Canada,
making the metro a key point for distribution activities.
LOGISTICS HUB
Greater Columbus is home to multiple Fortune 500 companies and many regional operations, drawing a variety of other employers and residents.
MIDWESTERN COMMERCIAL CENTER
The median home price in Columbus is well below the national level, channeling more expendable income to local retailers and entertainment.
AFFORDABLE HOUSING COSTS
• The state capital and Ohio State University provide a diverse array of employment opportunities. A lower cost of doing business, a strong education system and a strategic location draw major corporations to the metro.
• The area is home to multiple Fortune 500 companies such as L Brands, Cardinal Health, American Electric Power and Nationwide, along with regional and subsidiary opera-tions.
• Information technology is a growing sector in Columbus with the recent addition of
IBM’s Client Center for Advanced Analytics.
METRO HIGHLIGHTS
THE ECONOMY
Whitehall is located in Franklin County, Ohio on the east side of Columbus. In the late 1700’s In the late 1700’s, the area upon which the City sprang was initially among lands that the federal govern-ment gave to Canadian refugees who fought for the colonies - - as compensation for their service. Gradually, the community grew until its incorporation as a village in 1947. That same year, Town & Country, the nation’s first regional shopping center, opened in Whitehall. In the early 1950s, White-hall was the nation’s fastest growing city. Overall, population jumped from 4,077 in 1950 to 20,818 in 1960. Today, population has leveled at approximately 19,214.
ABOUT WHITEHALL
AR
BY
’S
-
W
HI
TE
HA
LL
,
OH
//
T
HE
M
AR
KE
T
14
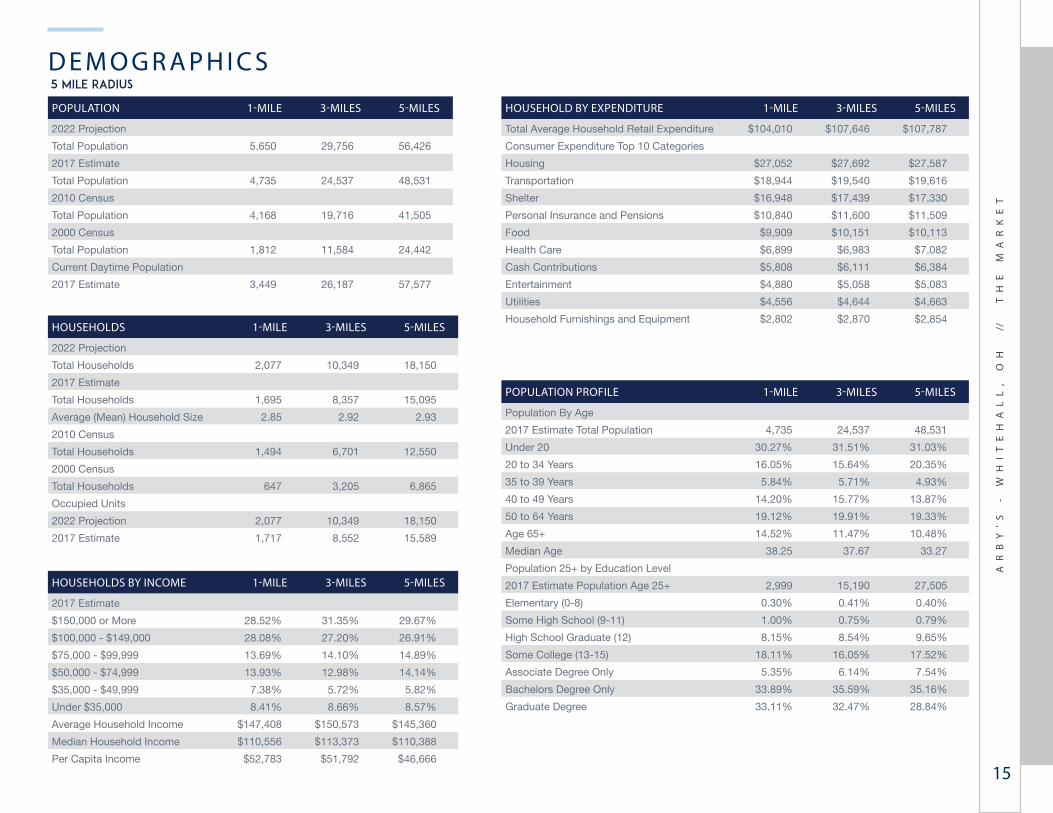
D E M O G R A P H I C S5 Mile radius
POPULATION 1-MILE 3-MILES 5-MILES
2022 Projection
Total Population 5,650 29,756 56,426
2017 Estimate
Total Population 4,735 24,537 48,531
2010 Census
Total Population 4,168 19,716 41,505
2000 Census
Total Population 1,812 11,584 24,442
Current Daytime Population
2017 Estimate 3,449 26,187 57,577
HOUSEHOLDS 1-MILE 3-MILES 5-MILES
2022 Projection
Total Households 2,077 10,349 18,150
2017 Estimate
Total Households 1,695 8,357 15,095
Average (Mean) Household Size 2.85 2.92 2.93
2010 Census
Total Households 1,494 6,701 12,550
2000 Census
Total Households 647 3,205 6,865
Occupied Units
2022 Projection 2,077 10,349 18,150
2017 Estimate 1,717 8,552 15,589
HOUSEHOLDS BY INCOME 1-MILE 3-MILES 5-MILES
2017 Estimate
$150,000 or More 28.52% 31.35% 29.67%
$100,000 - $149,000 28.08% 27.20% 26.91%
$75,000 - $99,999 13.69% 14.10% 14.89%
$50,000 - $74,999 13.93% 12.98% 14.14%
$35,000 - $49,999 7.38% 5.72% 5.82%
Under $35,000 8.41% 8.66% 8.57%
Average Household Income $147,408 $150,573 $145,360
Median Household Income $110,556 $113,373 $110,388
Per Capita Income $52,783 $51,792 $46,666
HOUSEHOLD BY EXPENDITURE 1-MILE 3-MILES 5-MILES
Total Average Household Retail Expenditure $104,010 $107,646 $107,787
Consumer Expenditure Top 10 Categories
Housing $27,052 $27,692 $27,587
Transportation $18,944 $19,540 $19,616
Shelter $16,948 $17,439 $17,330
Personal Insurance and Pensions $10,840 $11,600 $11,509
Food $9,909 $10,151 $10,113
Health Care $6,899 $6,983 $7,082
Cash Contributions $5,808 $6,111 $6,384
Entertainment $4,880 $5,058 $5,083
Utilities $4,556 $4,644 $4,663
Household Furnishings and Equipment $2,802 $2,870 $2,854
POPULATION PROFILE 1-MILE 3-MILES 5-MILES
Population By Age
2017 Estimate Total Population 4,735 24,537 48,531
Under 20 30.27% 31.51% 31.03%
20 to 34 Years 16.05% 15.64% 20.35%
35 to 39 Years 5.84% 5.71% 4.93%
40 to 49 Years 14.20% 15.77% 13.87%
50 to 64 Years 19.12% 19.91% 19.33%
Age 65+ 14.52% 11.47% 10.48%
Median Age 38.25 37.67 33.27
Population 25+ by Education Level
2017 Estimate Population Age 25+ 2,999 15,190 27,505
Elementary (0-8) 0.30% 0.41% 0.40%
Some High School (9-11) 1.00% 0.75% 0.79%
High School Graduate (12) 8.15% 8.54% 9.65%
Some College (13-15) 18.11% 16.05% 17.52%
Associate Degree Only 5.35% 6.14% 7.54%
Bachelors Degree Only 33.89% 35.59% 35.16%
Graduate Degree 33.11% 32.47% 28.84%
AR
BY
’S
-
W
HI
TE
HA
LL
,
OH
//
T
HE
M
AR
KE
T
15
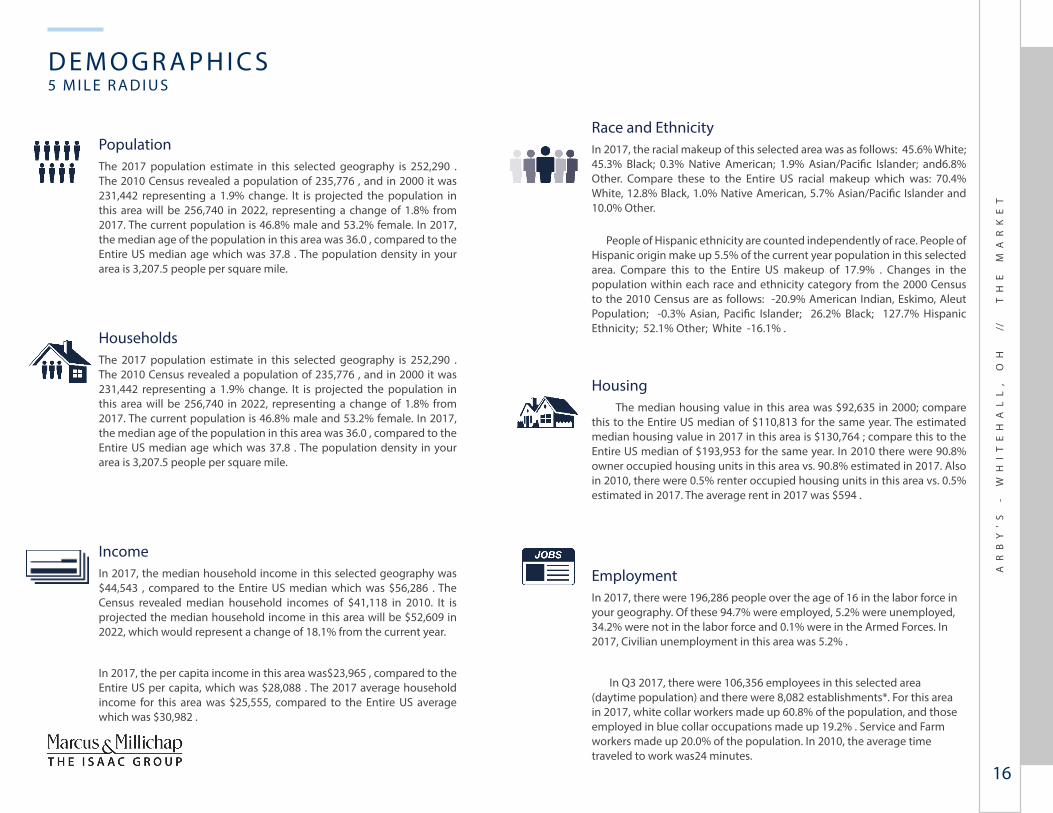
PopulationThe 2017 population estimate in this selected geography is 252,290 . The 2010 Census revealed a population of 235,776 , and in 2000 it was 231,442 representing a 1.9% change. It is projected the population in this area will be 256,740 in 2022, representing a change of 1.8% from 2017. The current population is 46.8% male and 53.2% female. In 2017, the median age of the population in this area was 36.0 , compared to the Entire US median age which was 37.8 . The population density in your area is 3,207.5 people per square mile.
Households The 2017 population estimate in this selected geography is 252,290 . The 2010 Census revealed a population of 235,776 , and in 2000 it was 231,442 representing a 1.9% change. It is projected the population in this area will be 256,740 in 2022, representing a change of 1.8% from 2017. The current population is 46.8% male and 53.2% female. In 2017, the median age of the population in this area was 36.0 , compared to the Entire US median age which was 37.8 . The population density in your area is 3,207.5 people per square mile.
Income In 2017, the median household income in this selected geography was $44,543 , compared to the Entire US median which was $56,286 . The Census revealed median household incomes of $41,118 in 2010. It is projected the median household income in this area will be $52,609 in 2022, which would represent a change of 18.1% from the current year.
In 2017, the per capita income in this area was$23,965 , compared to the Entire US per capita, which was $28,088 . The 2017 average household income for this area was $25,555, compared to the Entire US average which was $30,982 .
Race and Ethnicity In 2017, the racial makeup of this selected area was as follows: 45.6% White; 45.3% Black; 0.3% Native American; 1.9% Asian/Pacific Islander; and6.8% Other. Compare these to the Entire US racial makeup which was: 70.4% White, 12.8% Black, 1.0% Native American, 5.7% Asian/Pacific Islander and 10.0% Other.
People of Hispanic ethnicity are counted independently of race. People of Hispanic origin make up 5.5% of the current year population in this selected area. Compare this to the Entire US makeup of 17.9% . Changes in the population within each race and ethnicity category from the 2000 Census to the 2010 Census are as follows: -20.9% American Indian, Eskimo, Aleut Population; -0.3% Asian, Pacific Islander; 26.2% Black; 127.7% Hispanic Ethnicity; 52.1% Other; White -16.1% .
Housing
The median housing value in this area was $92,635 in 2000; compare this to the Entire US median of $110,813 for the same year. The estimated median housing value in 2017 in this area is $130,764 ; compare this to the Entire US median of $193,953 for the same year. In 2010 there were 90.8% owner occupied housing units in this area vs. 90.8% estimated in 2017. Also in 2010, there were 0.5% renter occupied housing units in this area vs. 0.5% estimated in 2017. The average rent in 2017 was $594 .
Employment In 2017, there were 196,286 people over the age of 16 in the labor force in your geography. Of these 94.7% were employed, 5.2% were unemployed, 34.2% were not in the labor force and 0.1% were in the Armed Forces. In 2017, Civilian unemployment in this area was 5.2% .
In Q3 2017, there were 106,356 employees in this selected area (daytime population) and there were 8,082 establishments*. For this area in 2017, white collar workers made up 60.8% of the population, and those employed in blue collar occupations made up 19.2% . Service and Farm workers made up 20.0% of the population. In 2010, the average time traveled to work was24 minutes.
IncomeIn 2016, the median household income for your selected geography is$77,654, compare this to the US average which is currently $54,505.The median household income for your area has changed by 15.08%since 2000. It is estimated that the median household income in yourarea will be $85,742 five years from now, which represents a changeof 10.42% from the current year.
The current year per capita income in your area is $31,059, comparethis to the US average, which is $29,962. The current year averagehousehold income in your area is $91,380, compare this to the USaverage which is $78,425.
PopulationIn 2016, the population in your selected geography is 8,415. Thepopulation has changed by 7.86% since 2000. It is estimated that thepopulation in your area will be 8,475.00 five years from now, whichrepresents a change of 0.71% from the current year. The currentpopulation is 48.21% male and 51.79% female. The median age ofthe population in your area is 38.89, compare this to the US averagewhich is 37.68. The population density in your area is 2,678.71 peopleper square mile.
HouseholdsThere are currently 2,860 households in your selected geography. Thenumber of households has changed by 12.82% since 2000. It isestimated that the number of households in your area will be 2,902five years from now, which represents a change of 1.47% from thecurrent year. The average household size in your area is 2.93 persons.
EmploymentIn 2016, there are 4,581 employees in your selected area, this is alsoknown as the daytime population. The 2000 Census revealed that71.61% of employees are employed in white-collar occupations inthis geography, and 28.03% are employed in blue-collar occupations.In 2016, unemployment in this area is 3.31%. In 2000, the averagetime traveled to work was 32.00 minutes.
Race and EthnicityThe current year racial makeup of your selected area is as follows:72.22% White, 12.18% Black, 0.02% Native American and 4.50%Asian/Pacific Islander. Compare these to US averages which are:70.77% White, 12.80% Black, 0.19% Native American and 5.36%Asian/Pacific Islander. People of Hispanic origin are countedindependently of race.
People of Hispanic origin make up 23.24% of the current yearpopulation in your selected area. Compare this to the US average of17.65%.
PROPERTY NAME
MARKETING TEAM
4902 ROWLETT RD
HousingThe median housing value in your area was $131,169 in 2016,compare this to the US average of $187,181. In 2000, there were2,326 owner occupied housing units in your area and there were 209renter occupied housing units in your area. The median rent at thetime was $595.
Source: © 2016 Experian
DEMOGRAPHICS
11
D E M O G R A P H I C S5 M I L E R A D I U S
AR
BY
’S
-
W
HI
TE
HA
LL
,
OH
//
T
HE
M
AR
KE
T
16

AR
BY
’S
-
W
HI
TE
HA
LL
,
OH
//
T
HE
O
FF
ERTHE
OFFER04
I N T E R E S T O F F E R E DMarcus & Millichap is marketing for sale to qualified investors an opportunity to acquire 100% fee simple Interest in the subject property. Seller shall assign to purchaser all leases encumbering the property at Closing.
O F F E R I N G P R O C E S SThe property is being offered on an open bid basis. Prospective purchasers will be notified if a call for offers or best and final date is set; however, Seller intends to review offers as they are submitted and will respond promptly to all offers. Please contact the listing brokers to discuss submitting a Letter of Intent to purchase.
F I N A N C I N GThe property is being offered free & clear of any existing debt and prospective purchasers shall be afforded the opportunity to obtain a new financing for acquisition. Prospective purchasers are encouraged to submit proof of funds, expected loan terms, and a preliminary approval from lender with a Letter of Intent. Marcus & Millichap Capital Corp. has also sourced potential lenders for this acquisition and the listing brokers can provide terms upon request.
CO O P E R AT I V E B R O K E R AG E CO M M I S S I O NMarcus & Millichap is offering a cooperative brokerage commission equal to 50% of the gross commission by seller to brokers that represent purchas-ers that were not directly contacted by the listing brokers and that successfully close on the property at terms acceptable to seller.
P R O P E R T Y TO U R SProspective purchasers are encouraged to visit the subject property prior to submitting a Letter of Intent; however, all property tours must be arranged with the listing broker or landlord only. Under no circumstances should any prospective purchaser or related entity contact the tenant, on-site management, or employees. Recipients of this offering memorandum acknowledge that such contact may damage the tenant’s operations which may impair the financial results. The landlord/seller reserves the right to seek legal redress for any damage that may occur from such interfer-ence with their relationship with tenant.
S U M M A R Y O F T E R M S
AR
BY
’S
-
W
HI
TE
HA
LL
,
OH
//
T
HE
O
FF
ER
18
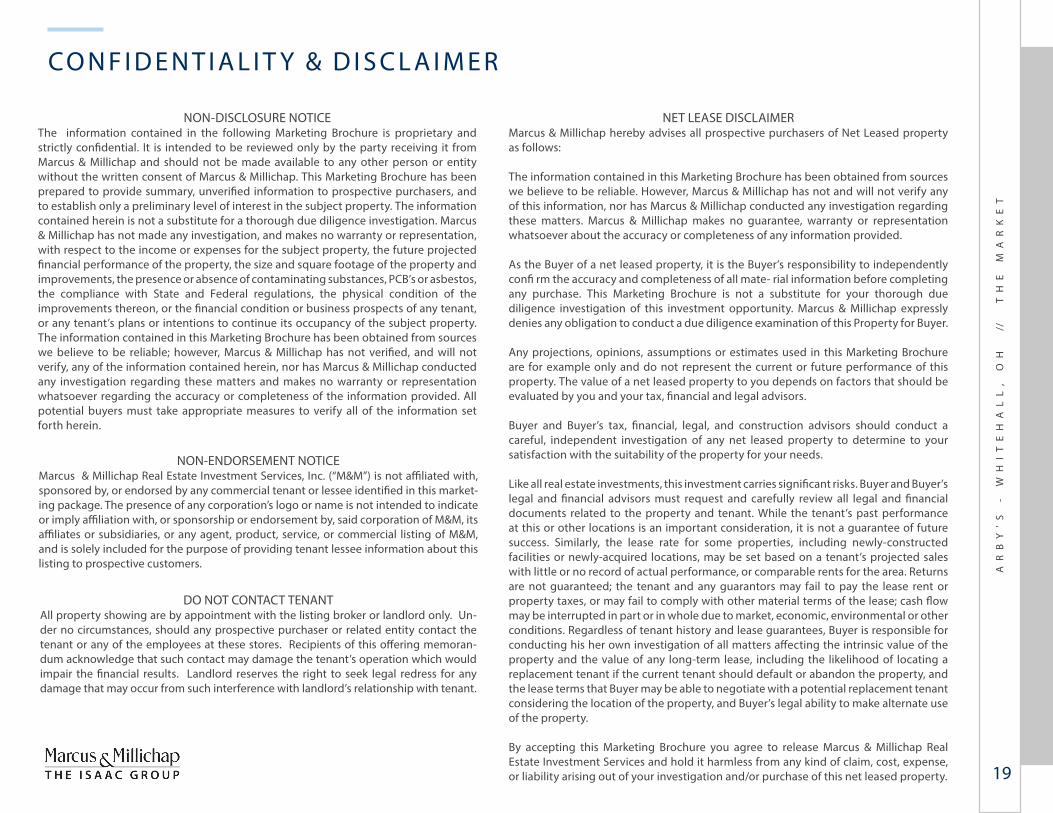
NON-DISCLOSURE NOTICEThe information contained in the following Marketing Brochure is proprietary and strictly confidential. It is intended to be reviewed only by the party receiving it from Marcus & Millichap and should not be made available to any other person or entity without the written consent of Marcus & Millichap. This Marketing Brochure has been prepared to provide summary, unverified information to prospective purchasers, and to establish only a preliminary level of interest in the subject property. The information contained herein is not a substitute for a thorough due diligence investigation. Marcus & Millichap has not made any investigation, and makes no warranty or representation, with respect to the income or expenses for the subject property, the future projected financial performance of the property, the size and square footage of the property and improvements, the presence or absence of contaminating substances, PCB’s or asbestos, the compliance with State and Federal regulations, the physical condition of the improvements thereon, or the financial condition or business prospects of any tenant, or any tenant’s plans or intentions to continue its occupancy of the subject property. The information contained in this Marketing Brochure has been obtained from sources we believe to be reliable; however, Marcus & Millichap has not verified, and will not verify, any of the information contained herein, nor has Marcus & Millichap conducted any investigation regarding these matters and makes no warranty or representation whatsoever regarding the accuracy or completeness of the information provided. All potential buyers must take appropriate measures to verify all of the information set forth herein.
NON-ENDORSEMENT NOTICEMarcus & Millichap Real Estate Investment Services, Inc. (“M&M”) is not affiliated with, sponsored by, or endorsed by any commercial tenant or lessee identified in this market-ing package. The presence of any corporation’s logo or name is not intended to indicate or imply affiliation with, or sponsorship or endorsement by, said corporation of M&M, its affiliates or subsidiaries, or any agent, product, service, or commercial listing of M&M, and is solely included for the purpose of providing tenant lessee information about this listing to prospective customers.
DO NOT CONTACT TENANTAll property showing are by appointment with the listing broker or landlord only. Un-der no circumstances, should any prospective purchaser or related entity contact the tenant or any of the employees at these stores. Recipients of this offering memoran-dum acknowledge that such contact may damage the tenant’s operation which would impair the financial results. Landlord reserves the right to seek legal redress for any damage that may occur from such interference with landlord’s relationship with tenant.
NET LEASE DISCLAIMERMarcus & Millichap hereby advises all prospective purchasers of Net Leased property as follows:
The information contained in this Marketing Brochure has been obtained from sources we believe to be reliable. However, Marcus & Millichap has not and will not verify any of this information, nor has Marcus & Millichap conducted any investigation regarding these matters. Marcus & Millichap makes no guarantee, warranty or representation whatsoever about the accuracy or completeness of any information provided.
As the Buyer of a net leased property, it is the Buyer’s responsibility to independently confi rm the accuracy and completeness of all mate- rial information before completing any purchase. This Marketing Brochure is not a substitute for your thorough due diligence investigation of this investment opportunity. Marcus & Millichap expressly denies any obligation to conduct a due diligence examination of this Property for Buyer.
Any projections, opinions, assumptions or estimates used in this Marketing Brochure are for example only and do not represent the current or future performance of this property. The value of a net leased property to you depends on factors that should be evaluated by you and your tax, financial and legal advisors.
Buyer and Buyer’s tax, financial, legal, and construction advisors should conduct a careful, independent investigation of any net leased property to determine to your satisfaction with the suitability of the property for your needs.
Like all real estate investments, this investment carries significant risks. Buyer and Buyer’s legal and financial advisors must request and carefully review all legal and financial documents related to the property and tenant. While the tenant’s past performance at this or other locations is an important consideration, it is not a guarantee of future success. Similarly, the lease rate for some properties, including newly-constructed facilities or newly-acquired locations, may be set based on a tenant’s projected sales with little or no record of actual performance, or comparable rents for the area. Returns are not guaranteed; the tenant and any guarantors may fail to pay the lease rent or property taxes, or may fail to comply with other material terms of the lease; cash flow may be interrupted in part or in whole due to market, economic, environmental or other conditions. Regardless of tenant history and lease guarantees, Buyer is responsible for conducting his her own investigation of all matters affecting the intrinsic value of the property and the value of any long-term lease, including the likelihood of locating a replacement tenant if the current tenant should default or abandon the property, and the lease terms that Buyer may be able to negotiate with a potential replacement tenant considering the location of the property, and Buyer’s legal ability to make alternate use of the property.
By accepting this Marketing Brochure you agree to release Marcus & Millichap Real Estate Investment Services and hold it harmless from any kind of claim, cost, expense, or liability arising out of your investigation and/or purchase of this net leased property.
CO N F I D E N T I A L I T Y & D I S C L A I M E R
AR
BY
’S
-
W
HI
TE
HA
LL
,
OH
//
T
HE
M
AR
KE
T
19
01
ARBY’S | WHITEHALL, OH
Transaction Lead
Drew IsaacFirst Vice President Investments
Net Leased Properties GroupTel: (303) 328-2048
Madison SChaffnerDirector of Marketing & Operations
The Isaac GroupTel: (303) 328-2037
James RassenfossAssociate
The Isaac GroupTel: (303) 328-2022
Kaitlin O’malleyAnalyst / Escrow Manager
The Isaac GroupTel: (303) 328-2031
kaitlin.o’[email protected]
Ryan ChakroffAssociate
The Isaac GroupTel: (303) 328-2055
Transaction Lead
brian BaileyAssociate
Net Leased Properties GroupTel: (303) 328-2018