Annual Market Report Rick van der Wal
56
2017 Market Report, 2016 Data | 1 Compliments of RICK VAN DER WAL MARKET REPORT Decker Bullock Sotheby’s International Realty Unifies Brand in 2017
-
Upload
decker-bullock-sothebys-international-realty -
Category
Documents
-
view
218 -
download
0
description
Presenting real estate statistics and home sales data for Marin, Napa, Sonoma, and San Francisco.
Transcript of Annual Market Report Rick van der Wal

PB | 2017 Market Report, 2016 Data 2017 Market Report, 2016 Data | 1
Compliments of
RICKVAN DER WAL
MARKET REPORT
Decker Bullock Sotheby’s International Realty
Unifies Brand in 2017

2 | 2017 Market Report, 2016 Data 2017 Market Report, 2016 Data | 3All data courtesy of local MLS
C O N T E N T S
EVOLUTION OF THE BRAND
FIR ST IN M A R IN 4 FIR ST IN V IDEO 6
TIMELINE 8
BAY ARE A SALES SUMMARY 10
BAY ARE A LUXURY MARKET 1 2
MARIN COUNT Y
HISTOR IC SA LES 14
MARIN CITIES
BE ACH CITIES 16 BELV EDER E 17 CORTE M A DER A 18 FA IR FA X 19 GR EENBR A E 20 K ENTFIELD 21 L A R K SPUR 22 MILL VA LLEY 23 NOVATO 24 ROSS 25 SA N A NSELMO 26 SA N R A FA EL 27 SAUSA LITO 28 TIBURON 29 W EST M A R IN 30
M A R IN CONDOS 31
SAN FRANCISCO 32
WINE COUNTRY
SONOM A COUNT Y 38
NA PA COUNT Y 40
E AST BAY
A L A MEDA COUNT Y 42
CONTR A COSTA COUNT Y 44
SILICON VALLEY AND PENINSUL A
SA N M ATEO COUNT Y 46
SA NTA CL A R A COUNT Y 48
SIGNIFICANT SALES 50
MANAGEMENT TE AM 54
CONNECTING TO BUYERS GLOBALLY 56
2017 ANNUAL MARKET REPORTM L S D ATA F O R 2 0 1 6
2 | 2017 Market Report, 2016 Data 2017 Market Report, 2016 Data | 3
Decker Bullock Sotheby’s International Realty earned the #1 brokerage ranking on every metric: sales volume and units, both on and off market in Marin County. We ranked 3rd among Sotheby’s International Realty affiliates in California and 12th in the United States. In 2016 we celebrated our 25th year providing luxury service to clients at all price points. In 2017 we are excited to expand our area to include Silicon Valley and the Peninsula, in addition to the other Bay Area counties we serve.
We are launching this expansion as Golden Gate Sotheby’s International Realty, leveraging the globally recognizable icon that is synonymous with California. This transformation will take place in early 2017, and will increase the visibility of our listings in online media portals by firmly establishing their location within the world, while maintaining the cachet of the Sotheby’s International Realty brand.
To complement our expansion, our annual market report now includes eight counties in the greater Bay Area, providing context for each of the local markets. The Bay Area is one of the most desirable places to live in the United States, and Silicon Valley has become a global hub of economic power and influence. Northern California’s economy outpaced the rest of the state and country in economic growth for the last five years, fueled by technology companies and venture capitalists.
By the end of 2016, unemployment fell below 5% for the eight Bay Area counties, with the lowest in San Mateo and Marin, both under 3%, followed by San Francisco, Santa Clara, Sonoma and Alameda counties, all under 4%.
This year, throughout the region, the highest level of single family home appreciation was in Sonoma County at 10%, followed by Marin County at 8%. San Francisco, the East Bay, and Silicon Valley, which experienced a high level of growth in the previous year, tapered in 2016 to levels ranging from 4% to 7%. Low supply resulted in fewer sales in 2016, although prices continued to rise. Nationally, home prices rose 6.5%, the fastest seen since the peak of the housing bubble in 2006-2007. Locally, the positive economic environment— increasing jobs and wages, coupled with low interest rates—makes for an optimistic outlook for Bay Area real estate, provided that sufficient inventory is available for home buyers.
We hope you enjoy our market report. All statistical data was provided by the local MLS and may not include off market sales.
Sincerely,
R I C K V A N D E R W A L
+1.415.306.4106
CalBRE# 01978369
All data courtesy of local MLS
4 | 2017 Market Report, 2016 Data 2017 Market Report, 2016 Data | 5
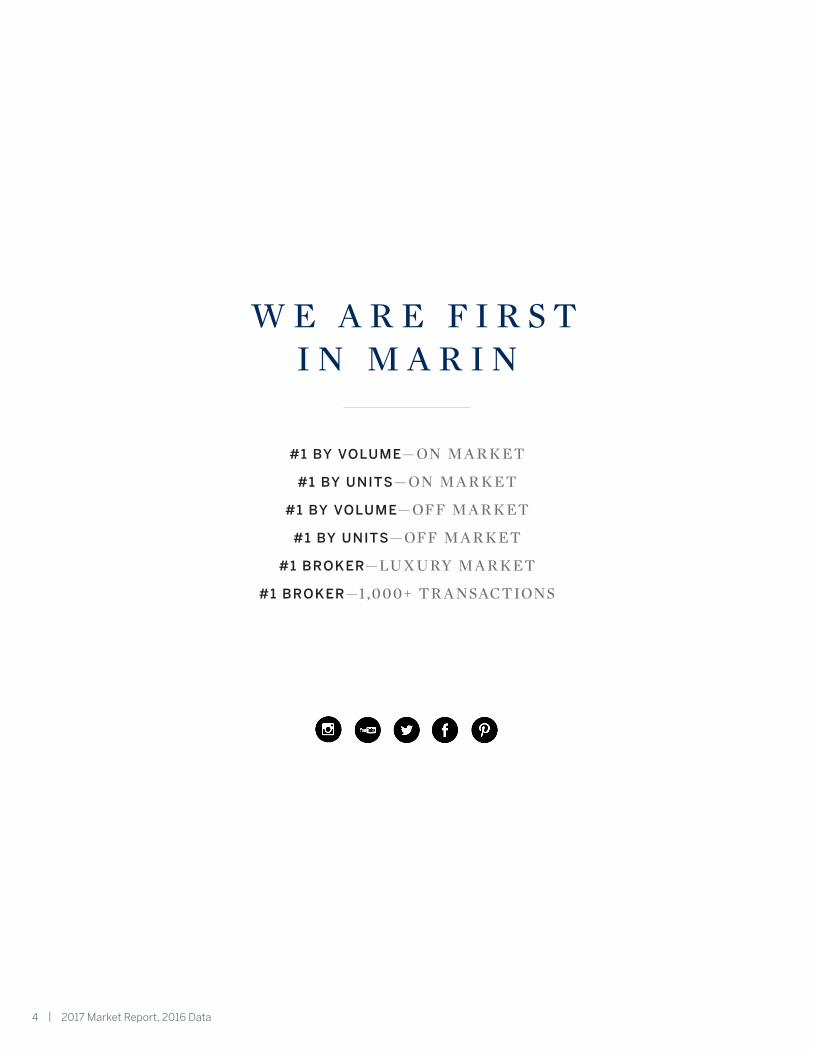
W E A R E F I R S T I N M A R I N
#1 BY VOLUME— ON M A R K ET
#1 BY UNITS— ON M A R K ET
#1 BY VOLUME— OFF M A R K ET
#1 BY UNITS— OFF M A R K ET
#1 BROKER—LUXURY M A R K ET
#1 BROKER—1,000+ TR A NSACTIONS
4 | 2017 Market Report, 2016 Data 2017 Market Report, 2016 Data | 5
6 | 2017 Market Report, 2016 Data
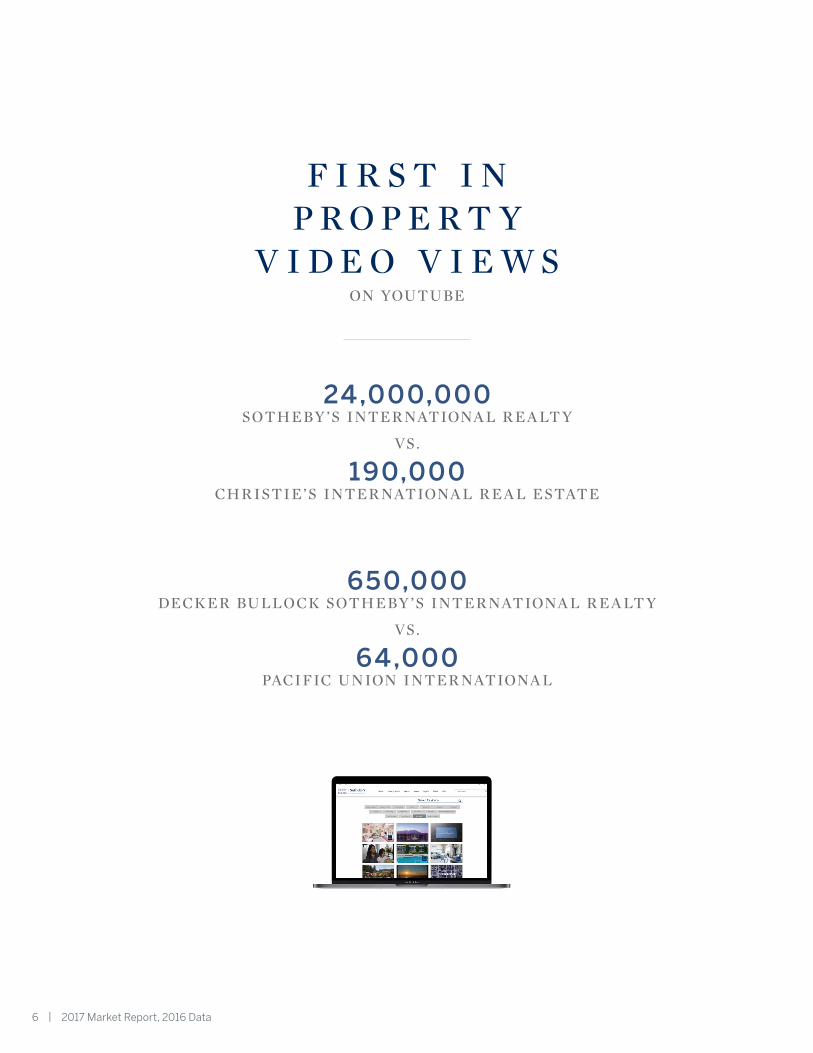
F I R S T I NP R O P E R T Y
V I D E O V I E W SON YOUTUBE
24,000,000SOTHEBY ’S INTER NATIONA L R E A LT Y
VS.
190,000CHR ISTIE’S INTER NATIONA L R E A L ESTATE
650,000DECK ER BULLOCK SOTHEBY ’S INTER NATIONA L R E A LT Y
VS.
64,000PACIFIC UNION INTER NATIONA L

F I R S T I NP R O P E R T Y
V I D E O V I E W SON YOUTUBE
8 | 2017 Market Report, 2016 Data 2017 Market Report, 2016 Data | 9
1744
1937
19761987
2000
1973
1998
2007
1984
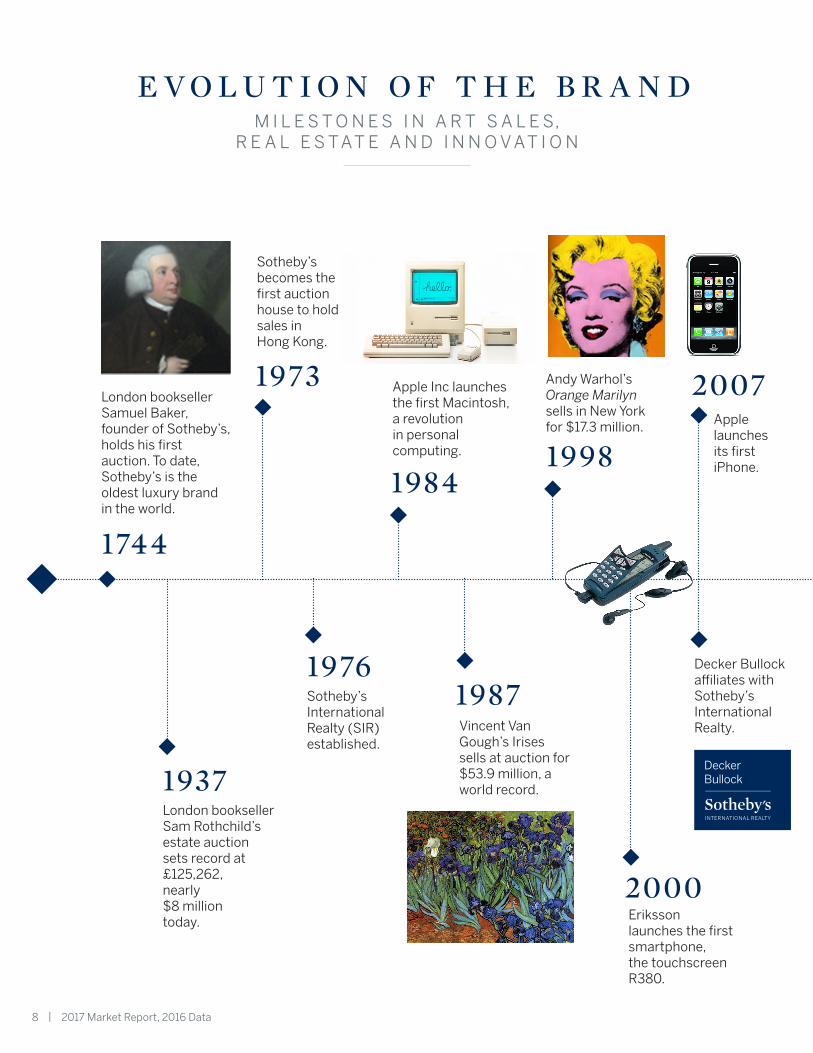
London bookseller Samuel Baker, founder of Sotheby’s, holds his first auction. To date, Sotheby’s is the oldest luxury brand in the world.
London bookseller Sam Rothchild’s estate auction sets record at £125,262, nearly $8 million today.
Sotheby’s International Realty (SIR)established.
Andy Warhol’s Orange Marilyn sells in New York for $17.3 million.
Sotheby’s becomes the first auction house to hold sales in Hong Kong.
Vincent Van Gough’s Irises sells at auction for $53.9 million, a world record.
Eriksson launches the first smartphone, the touchscreen R380.
Decker Bullock affiliates with Sotheby’s International Realty.
Apple launches its first iPhone.
Apple Inc launches the first Macintosh, a revolution in personal computing.
E V O L U T I O N O F T H E B R A N DM I L E S T O N E S I N A R T S A L E S,
R E A L E S TAT E A N D I N N O V AT I O N
8 | 2017 Market Report, 2016 Data 2017 Market Report, 2016 Data | 9
20092015
2015
2013
20072008
2012
2014
2016
2017
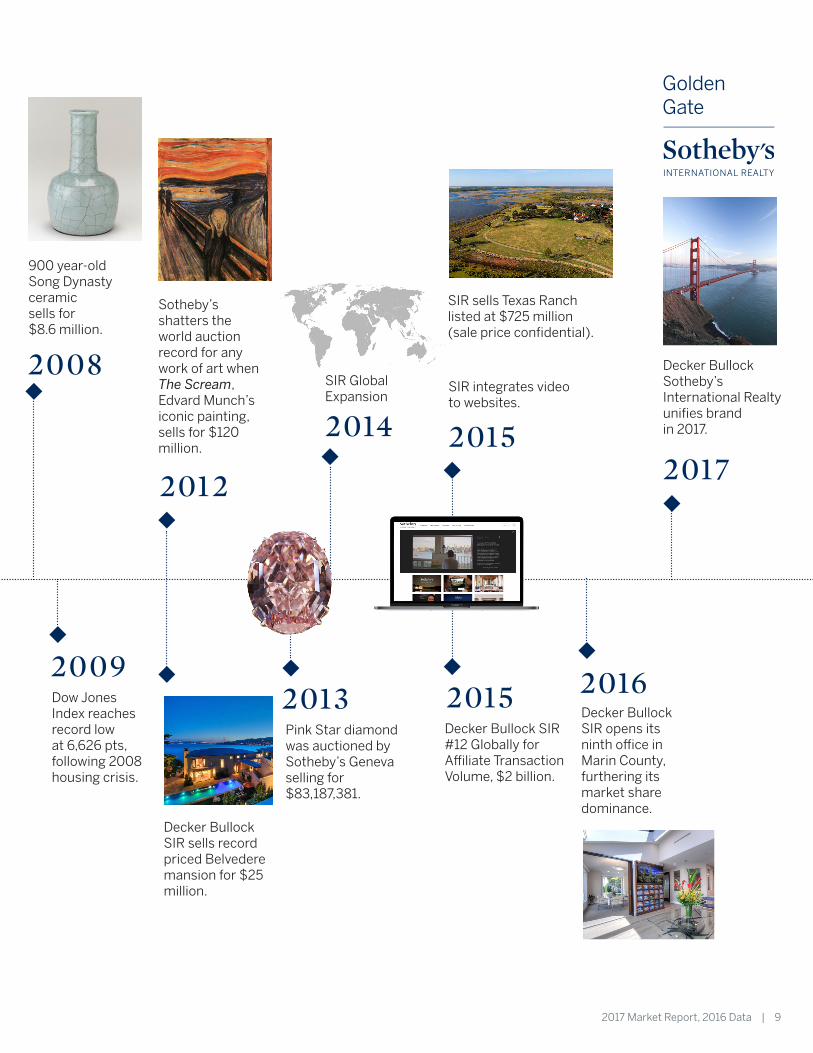
900 year-oldSong Dynastyceramicsells for$8.6 million.
Sotheby’s shatters the world auction record for any work of art when The Scream, Edvard Munch’s iconic painting, sells for $120 million.
SIR Global Expansion
Decker Bullock SIR opens its ninth office in Marin County, furthering its market share dominance.
Decker Bullock Sotheby’s International Realty unifies brand in 2017.
Decker Bullock SIR sells record priced Belvedere mansion for $25 million.
Dow Jones Index reaches record low at 6,626 pts, following 2008 housing crisis.
Decker Bullock SIR #12 Globally for Affiliate Transaction Volume, $2 billion.
SIR integrates video to websites.
SIR sells Texas Ranch listed at $725 million (sale price confidential).
Pink Star diamond was auctioned by Sotheby’s Geneva selling for $83,187,381.
Decker Bullock affiliates with Sotheby’s International Realty.
10 | 2017 Market Report, 2016 Data 2017 Market Report, 2016 Data | 11
Beach Cities: Bolinas, Muir Beach, Stinson Beach****** West Marin: Forest Knolls, Inverness, Lagunitas, Marshall, Nicasio, Olema,
Pt. Reyes Station, San Geronimo, Tomales, Woodacre
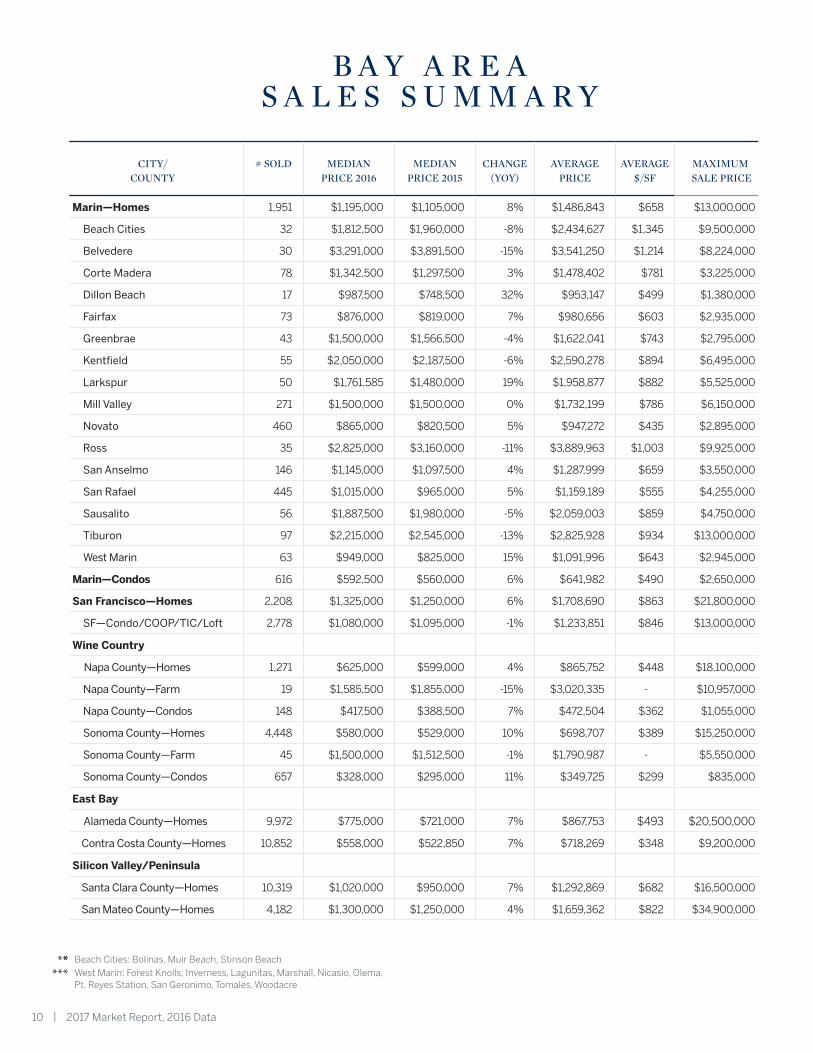
B A Y A R E A S A L E S S U M M A R Y
CITY/COUNTY
# SOLD MEDIAN PRICE 2016
MEDIAN PRICE 2015
CHANGE (YOY)
AVERAGEPRICE
AVERAGE $/SF
MAXIMUM
SALE PRICE
Marin—Homes 1,951 $1,195,000 $1,105,000 8% $1,486,843 $658 $13,000,000
Beach Cities 32 $1,812,500 $1,960,000 -8% $2,434,627 $1,345 $9,500,000
Belvedere 30 $3,291,000 $3,891,500 -15% $3,541,250 $1,214 $8,224,000
Corte Madera 78 $1,342,500 $1,297,500 3% $1,478,402 $781 $3,225,000
Dillon Beach 17 $987,500 $748,500 32% $953,147 $499 $1,380,000
Fairfax 73 $876,000 $819,000 7% $980,656 $603 $2,935,000
Greenbrae 43 $1,500,000 $1,566,500 -4% $1,622,041 $743 $2,795,000
Kentfield 55 $2,050,000 $2,187,500 -6% $2,590,278 $894 $6,495,000
Larkspur 50 $1,761,585 $1,480,000 19% $1,958,877 $882 $5,525,000
Mill Valley 271 $1,500,000 $1,500,000 0% $1,732,199 $786 $6,150,000
Novato 460 $865,000 $820,500 5% $947,272 $435 $2,895,000
Ross 35 $2,825,000 $3,160,000 -11% $3,889,963 $1,003 $9,925,000
San Anselmo 146 $1,145,000 $1,097,500 4% $1,287,999 $659 $3,550,000
San Rafael 445 $1,015,000 $965,000 5% $1,159,189 $555 $4,255,000
Sausalito 56 $1,887,500 $1,980,000 -5% $2,059,003 $859 $4,750,000
Tiburon 97 $2,215,000 $2,545,000 -13% $2,825,928 $934 $13,000,000
West Marin 63 $949,000 $825,000 15% $1,091,996 $643 $2,945,000
Marin—Condos 616 $592,500 $560,000 6% $641,982 $490 $2,650,000
San Francisco—Homes 2,208 $1,325,000 $1,250,000 6% $1,708,690 $863 $21,800,000
SF—Condo/COOP/TIC/Loft 2,778 $1,080,000 $1,095,000 -1% $1,233,851 $846 $13,000,000
Wine Country
Napa County—Homes 1,271 $625,000 $599,000 4% $865,752 $448 $18,100,000
Napa County—Farm 19 $1,585,500 $1,855,000 -15% $3,020,335 - $10,957,000
Napa County—Condos 148 $417,500 $388,500 7% $472,504 $362 $1,055,000
Sonoma County—Homes 4,448 $580,000 $529,000 10% $698,707 $389 $15,250,000
Sonoma County—Farm 45 $1,500,000 $1,512,500 -1% $1,790,987 - $5,550,000
Sonoma County—Condos 657 $328,000 $295,000 11% $349,725 $299 $835,000
East Bay
Alameda County—Homes 9,972 $775,000 $721,000 7% $867,753 $493 $20,500,000
Contra Costa County—Homes 10,852 $558,000 $522,850 7% $718,269 $348 $9,200,000
Silicon Valley/Peninsula
Santa Clara County—Homes 10,319 $1,020,000 $950,000 7% $1,292,869 $682 $16,500,000
San Mateo County—Homes 4,182 $1,300,000 $1,250,000 4% $1,659,362 $822 $34,900,000
10 | 2017 Market Report, 2016 Data 2017 Market Report, 2016 Data | 11
B A Y A R E A S A L E S S U M M A R Y
12 | 2017 Market Report, 2016 Data 2017 Market Report, 2016 Data | 13
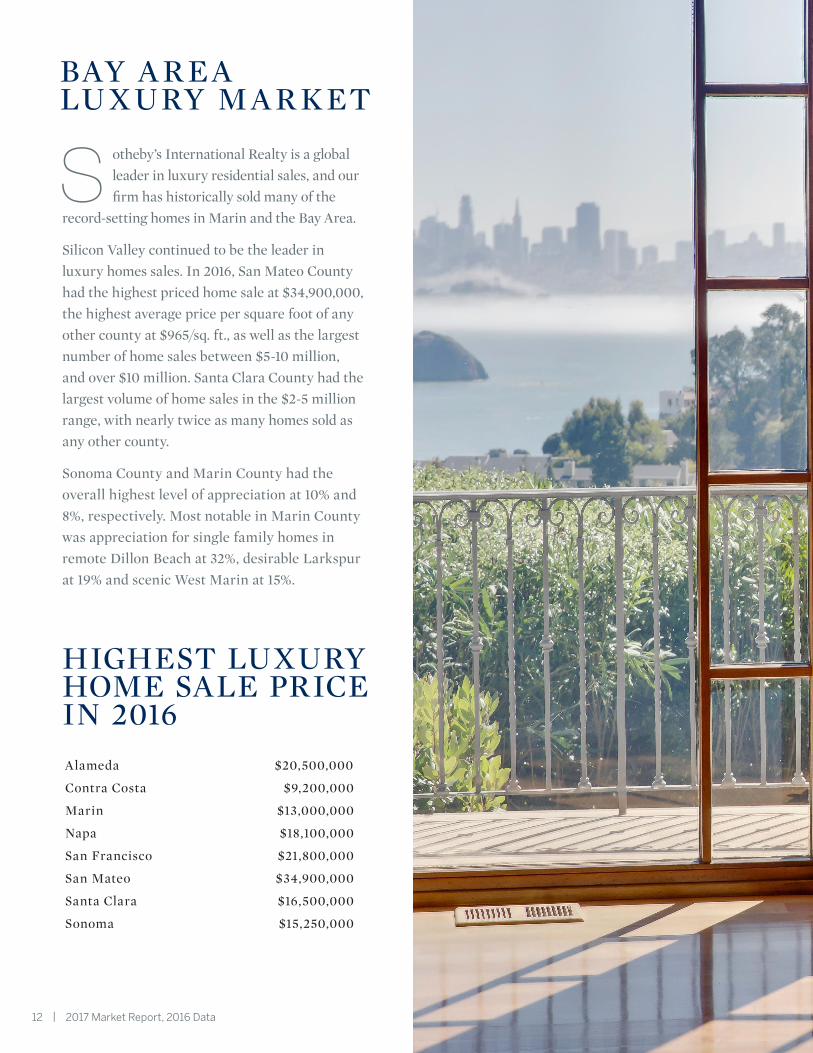
BAY A R E ALUXURY M A R K ET
Alameda $20,500,000
Contra Costa $9,200,000
Marin $13,000,000
Napa $18,100,000
San Francisco $21,800,000
San Mateo $34,900,000
Santa Clara $16,500,000
Sonoma $15,250,000
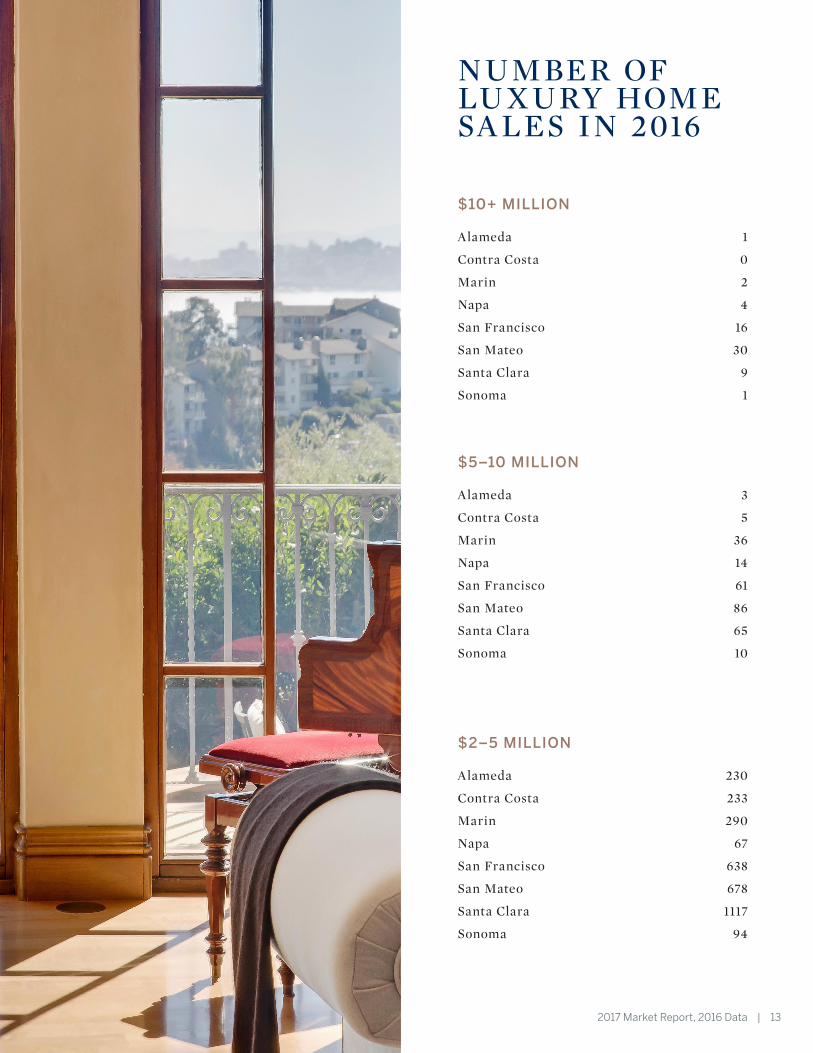
HIGHEST LUXURYHOME SALE PRICE IN 2016
Sotheby’s International Realty is a global leader in luxury residential sales, and our firm has historically sold many of the
record-setting homes in Marin and the Bay Area. Silicon Valley continued to be the leader in luxury homes sales. In 2016, San Mateo County had the highest priced home sale at $34,900,000, the highest average price per square foot of any other county at $965/sq. ft., as well as the largest number of home sales between $5-10 million, and over $10 million. Santa Clara County had the largest volume of home sales in the $2-5 million range, with nearly twice as many homes sold as any other county. Sonoma County and Marin County had the overall highest level of appreciation at 10% and 8%, respectively. Most notable in Marin County was appreciation for single family homes in remote Dillon Beach at 32%, desirable Larkspur at 19% and scenic West Marin at 15%.
12 | 2017 Market Report, 2016 Data 2017 Market Report, 2016 Data | 13
$10+ MILLION
Alameda 1
Contra Costa 0
Marin 2
Napa 4
San Francisco 16
San Mateo 30
Santa Clara 9
Sonoma 1
$5–10 MILLION
Alameda 3
Contra Costa 5
Marin 36
Napa 14
San Francisco 61
San Mateo 86
Santa Clara 65
Sonoma 10
$2–5 MILLION
Alameda 230
Contra Costa 233
Marin 290
Napa 67
San Francisco 638
San Mateo 678
Santa Clara 1117
Sonoma 94
NUMBER OF LUXURY HOME SA LES IN 2016

14 | 2017 Market Report, 2016 Data 2017 Market Report, 2016 Data | 15
2016 M A R IN SA LES IN SUMM A RY M A R IN 1965–2016
1 9 7 0
Median Household
Income $12K
$30k1965
Van Gogh’s “Irises”Sells at
Auction for $53.9M
Apple, Inc. IPOat $22.00Dow Jones Industrial Avg.
Ended at 805.01
Index at End of 2015: 17,425.03
1 9 8 7
1 9 8 0
1 9 7 8
All Residential
Number Sold 2,567
Average Sale Price $1,284,103
Median Sale Price $990,000
Average Price/Sq. Ft. $618
Average Square Feet 2,031
Single Family
Number Sold 1,951
Average Sale Price $1,486,843
Median Sale Price $1,195,000
Average Price/Sq. Ft. $658
Average Square Feet 2,322
Condos
Number Sold 616
Average Sale Price $641,982
Median Sale Price $592,500
Average Price/Sq. Ft. $490
Average Square Feet 1,307
$250k1990
14 | 2017 Market Report, 2016 Data 2017 Market Report, 2016 Data | 15
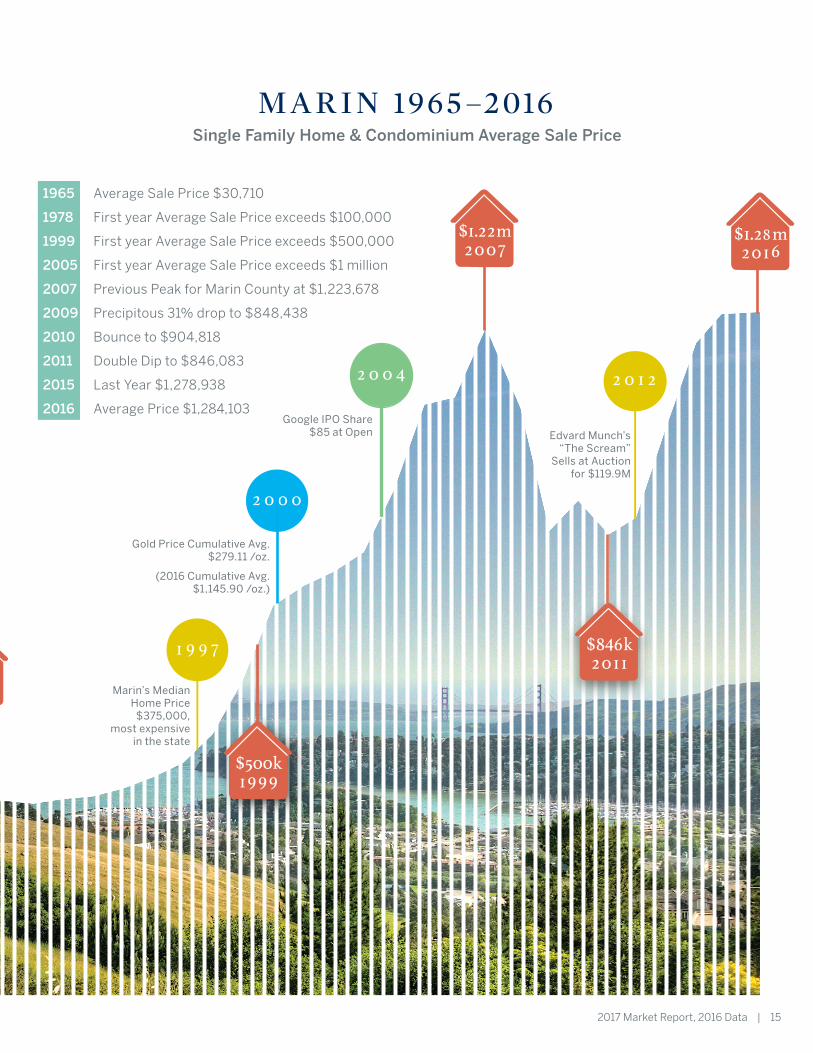
Single Family Home & Condominium Average Sale Price
M A R IN 1965–2016
1965 Average Sale Price $30,710
1978 First year Average Sale Price exceeds $100,000
1999 First year Average Sale Price exceeds $500,000
2005 First year Average Sale Price exceeds $1 million
2007 Previous Peak for Marin County at $1,223,678
2009 Precipitous 31% drop to $848,438
2010 Bounce to $904,818
2011 Double Dip to $846,083
2015 Last Year $1,278,938
2016 Average Price $1,284,103Google IPO Share
$85 at Open
Gold Price Cumulative Avg. $279.11 /oz.
(2016 Cumulative Avg.$1,145.90 /oz.)
1 9 9 7
Edvard Munch’s “The Scream”
Sells at Auction for $119.9M
2 0 0 4
$1.22m2007
$846k2011
$500k1999
2 0 1 2
Marin’s Median Home Price
$375,000, most expensive
in the state
2 0 0 0
All Residential
Number Sold 2,567
Average Sale Price $1,284,103
Median Sale Price $990,000
Average Price/Sq. Ft. $618
Average Square Feet 2,031
Single Family
Number Sold 1,951
Average Sale Price $1,486,843
Median Sale Price $1,195,000
Average Price/Sq. Ft. $658
Average Square Feet 2,322
Condos
Number Sold 616
Average Sale Price $641,982
Median Sale Price $592,500
Average Price/Sq. Ft. $490
Average Square Feet 1,307
$250k1990
$1.28m2016
16 | 2017 Market Report, 2016 Data 2017 Market Report, 2016 Data | 17
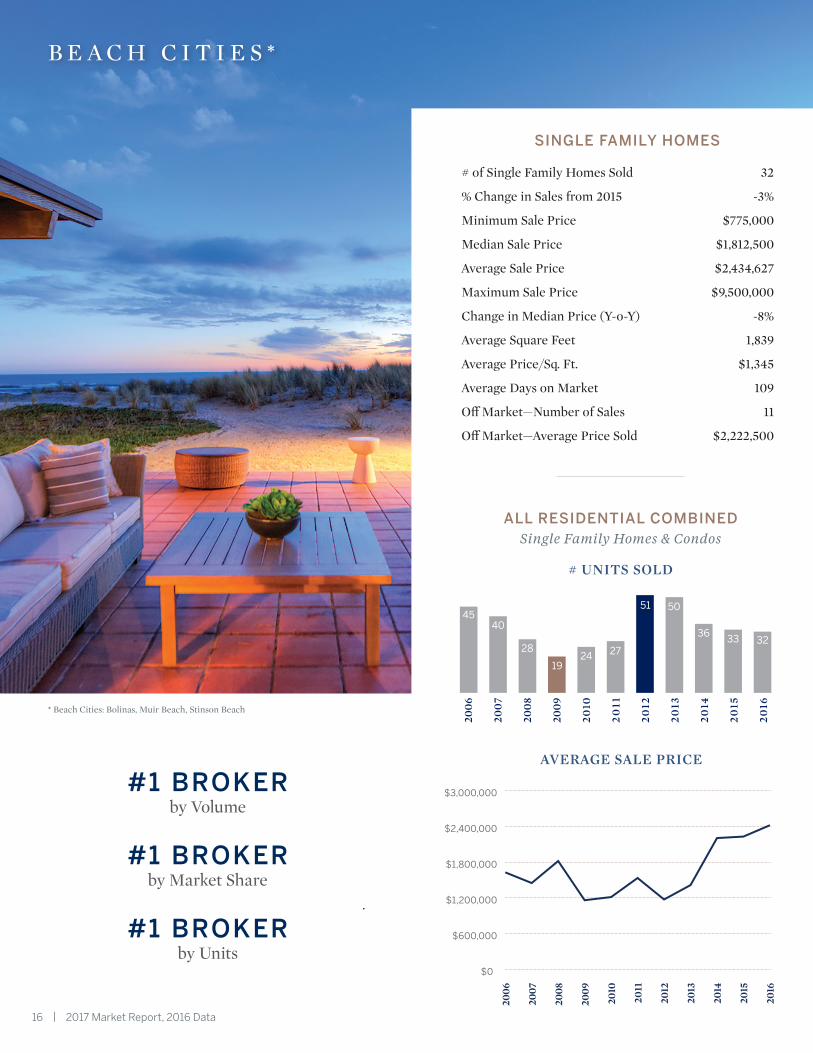
* Beach Cities: Bolinas, Muir Beach, Stinson Beach
B E A C H C I T I E S *
SINGLE FAMILY HOMES
# of Single Family Homes Sold 32
% Change in Sales from 2015 -3%
Minimum Sale Price $775,000
Median Sale Price $1,812,500
Average Sale Price $2,434,627
Maximum Sale Price $9,500,000
Change in Median Price (Y-o-Y) -8%
Average Square Feet 1,839
Average Price/Sq. Ft. $1,345
Average Days on Market 109
Off Market—Number of Sales 11
Off Market—Average Price Sold $2,222,500
#1 BROKERby Volume
#1 BROKERby Market Share
#1 BROKERby Units
AVERAGE SALE PRICE
$0
$600,000
$1,200,000
$1,800,000
$2,400,000
$3,000,000
2006
2007
2008
2009
2010
2011
2012
2013
2014
2015
2016
45
32
40
28
1924 27
51 50
36 33
2006
2007
2008
2009
2010
2011
2012
2013
2014
2015
2016
# UNITS SOLD
ALL RESIDENTIAL COMBINED Single Family Homes & Condos
16 | 2017 Market Report, 2016 Data 2017 Market Report, 2016 Data | 17
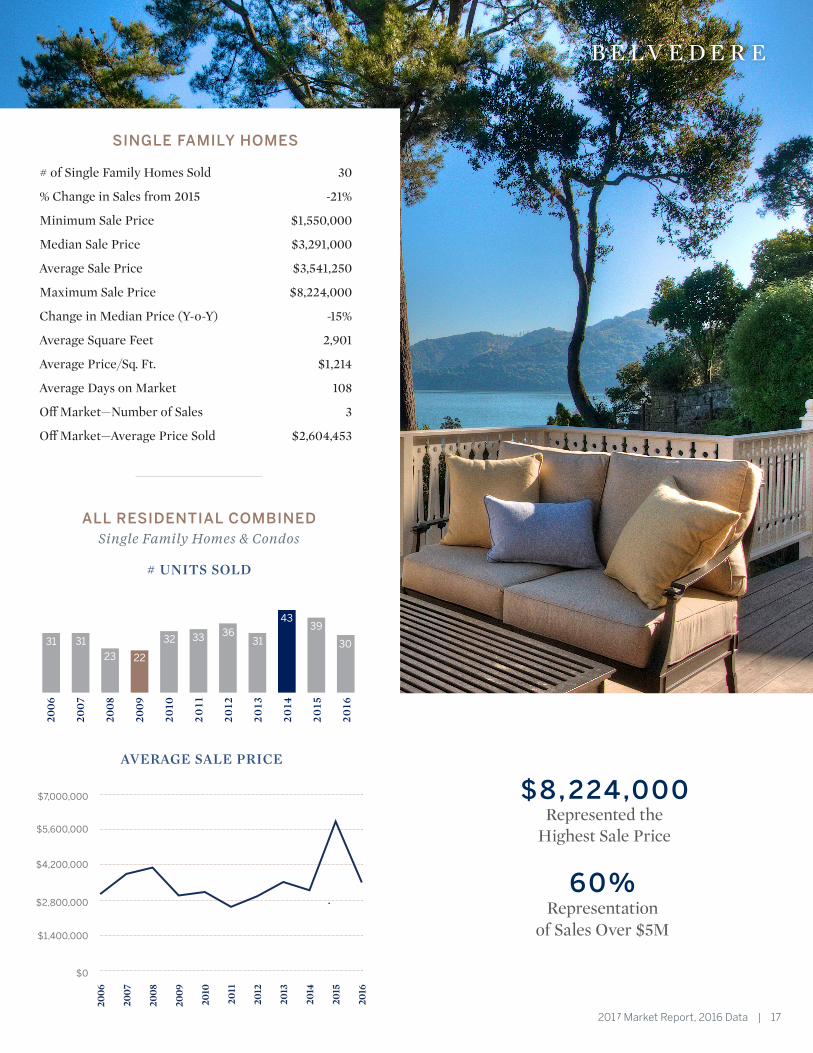
B E LV E D E R E
SINGLE FAMILY HOMES
# of Single Family Homes Sold 30
% Change in Sales from 2015 -21%
Minimum Sale Price $1,550,000
Median Sale Price $3,291,000
Average Sale Price $3,541,250
Maximum Sale Price $8,224,000
Change in Median Price (Y-o-Y) -15%
Average Square Feet 2,901
Average Price/Sq. Ft. $1,214
Average Days on Market 108
Off Market—Number of Sales 3
Off Market—Average Price Sold $2,604,453
$8,224,000Represented the
Highest Sale Price
60%Representation
of Sales Over $5M
AVERAGE SALE PRICE
$0
$1,400,000
$2,800,000
$4,200,000
$5,600,000
$7,000,000
2006
2007
2008
2009
2010
2011
2012
2013
2014
2015
2016
31 3031
23 22
32 33 3631
4339
2006
2007
2008
2009
2010
2011
2012
2013
2014
2015
2016
# UNITS SOLD
ALL RESIDENTIAL COMBINED Single Family Homes & Condos
18 | 2017 Market Report, 2016 Data 2017 Market Report, 2016 Data | 19
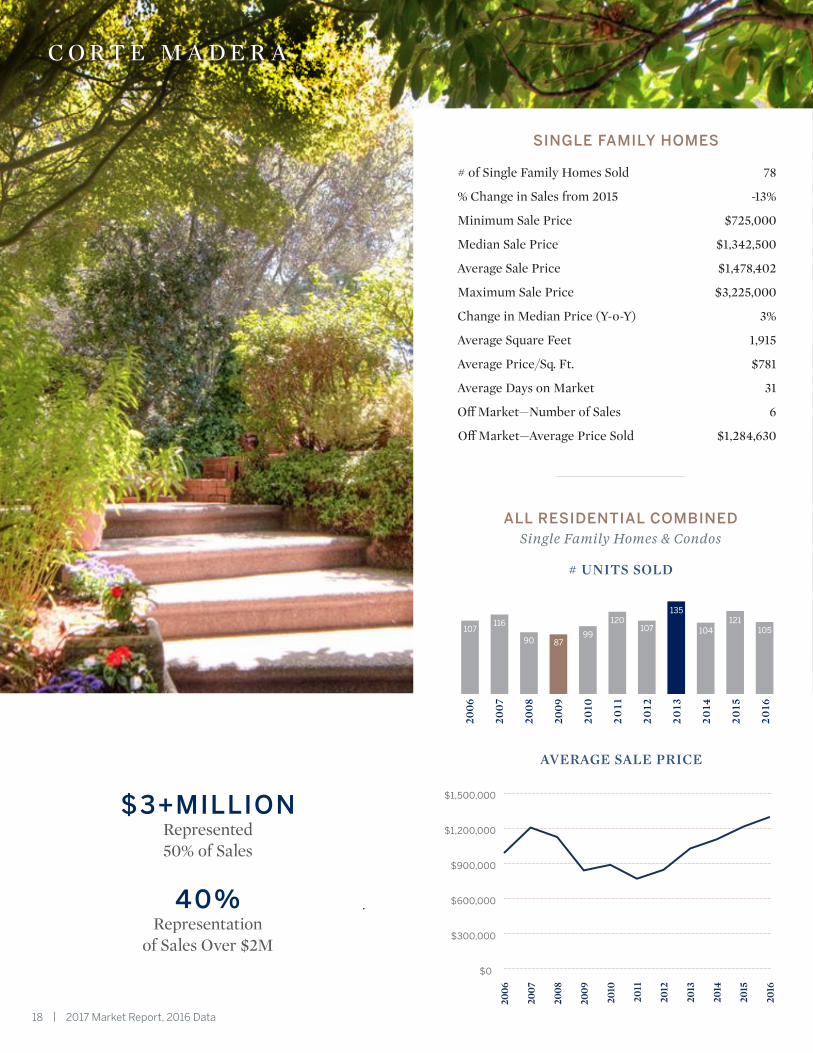
C O R T E M A D E R A
SINGLE FAMILY HOMES
# of Single Family Homes Sold 78
% Change in Sales from 2015 -13%
Minimum Sale Price $725,000
Median Sale Price $1,342,500
Average Sale Price $1,478,402
Maximum Sale Price $3,225,000
Change in Median Price (Y-o-Y) 3%
Average Square Feet 1,915
Average Price/Sq. Ft. $781
Average Days on Market 31
Off Market—Number of Sales 6
Off Market—Average Price Sold $1,284,630
$3+MILLIONRepresented 50% of Sales
40%Representation
of Sales Over $2M $0
$300,000
$600,000
$900,000
$1,200,000
$1,500,000
2006
2007
2008
2009
2010
2011
2012
2013
2014
2015
2016
107 105116
90 8799
120107
135
104121
2006
2007
2008
2009
2010
2011
2012
2013
2014
2015
2016
# UNITS SOLD
ALL RESIDENTIAL COMBINED Single Family Homes & Condos
AVERAGE SALE PRICE
18 | 2017 Market Report, 2016 Data 2017 Market Report, 2016 Data | 19
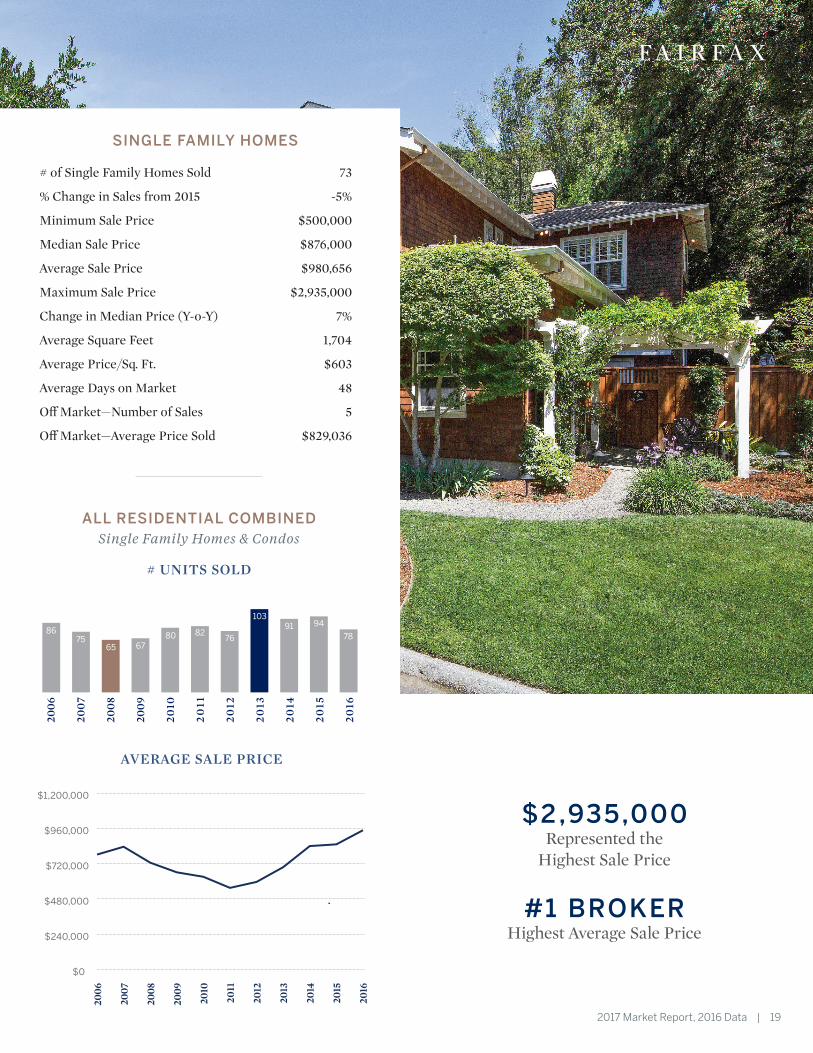
F A I R F A X
SINGLE FAMILY HOMES
# of Single Family Homes Sold 73
% Change in Sales from 2015 -5%
Minimum Sale Price $500,000
Median Sale Price $876,000
Average Sale Price $980,656
Maximum Sale Price $2,935,000
Change in Median Price (Y-o-Y) 7%
Average Square Feet 1,704
Average Price/Sq. Ft. $603
Average Days on Market 48
Off Market—Number of Sales 5
Off Market—Average Price Sold $829,036
$2,935,000Represented the
Highest Sale Price
#1 BROKERHighest Average Sale Price
$0
$240,000
$480,000
$720,000
$960,000
$1,200,000
2006
2007
2008
2009
2010
2011
2012
2013
2014
2015
2016
867875
65 6780 82
76
10391 94
2006
2007
2008
2009
2010
2011
2012
2013
2014
2015
2016
# UNITS SOLD
ALL RESIDENTIAL COMBINED Single Family Homes & Condos
AVERAGE SALE PRICE
20 | 2017 Market Report, 2016 Data 2017 Market Report, 2016 Data | 21
AVERAGE SALES PRICE
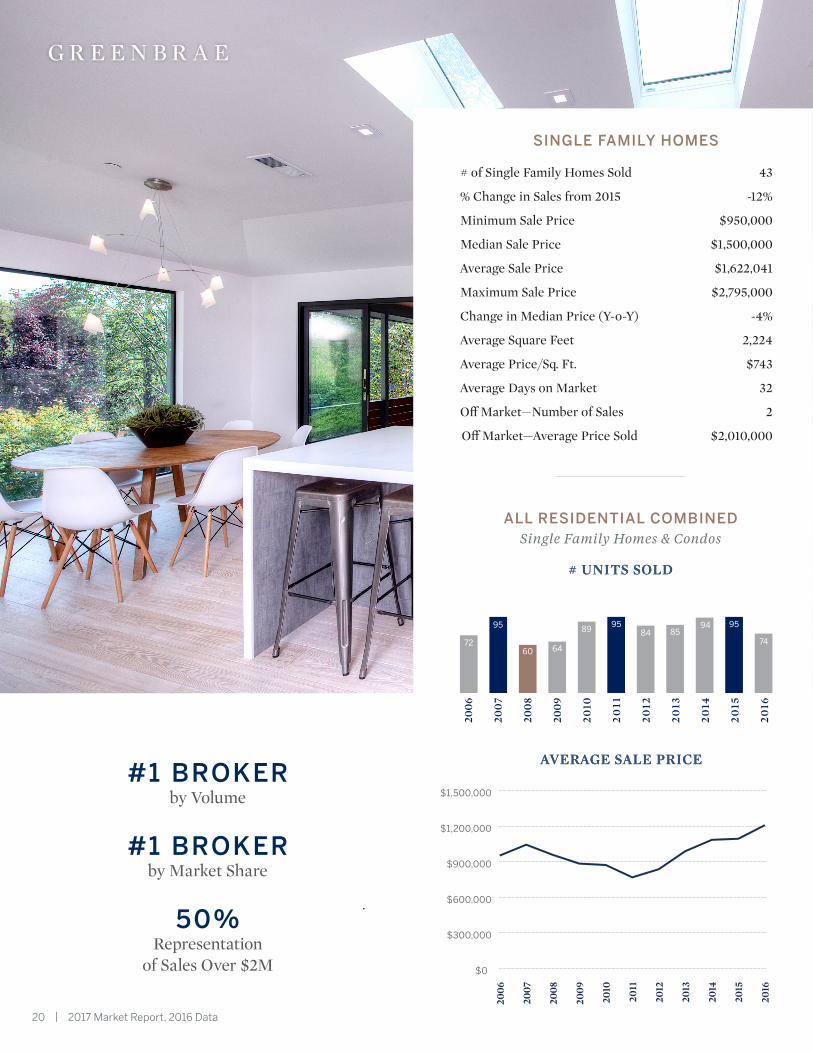
G R E E N B R A E
4540
28
1923 26
51 50
36 33
$0
$1,400,000
$2,800,000
$4,200,000
$5,600,000
$7,000,000
2000
2001
2002
2003
2004
2005
2006
2007
2008
2009
2010
2011
2012
2013
2014
2015
2006
2007
2008
2009
2010
2011
2012
2013
2014
2015
2006
2007
2008
2009
2010
2011
2012
2013
2014
2015
13
30
19
8
1311
16 15
36 37
2006
2007
2008
2009
2010
2011
2012
2013
2014
2015
13
3 3
8
163
2
7
3 32
1
32
7
SINGLE FAMILY HOMES
# of Single Family Homes Sold 43
% Change in Sales from 2015 -12%
Minimum Sale Price $950,000
Median Sale Price $1,500,000
Average Sale Price $1,622,041
Maximum Sale Price $2,795,000
Change in Median Price (Y-o-Y) -4%
Average Square Feet 2,224
Average Price/Sq. Ft. $743
Average Days on Market 32
Off Market—Number of Sales 2
Off Market—Average Price Sold $2,010,000
72 74
95
60 64
8995
84 8594 95
2006
2007
2008
2009
2010
2011
2012
2013
2014
2015
2016
G R E E N B R A E
$0
$300,000
$600,000
$900,000
$1,200,000
$1,500,000
2006
2007
2008
2009
2010
2011
2012
2013
2014
2015
2016
#1 BROKERby Volume
#1 BROKERby Market Share
50%Representation
of Sales Over $2M
# UNITS SOLD
ALL RESIDENTIAL COMBINED Single Family Homes & Condos
AVERAGE SALE PRICE
# UNITS SOLD
AVERAGE SALE PRICE
20 | 2017 Market Report, 2016 Data 2017 Market Report, 2016 Data | 21
AVERAGE SALES PRICE
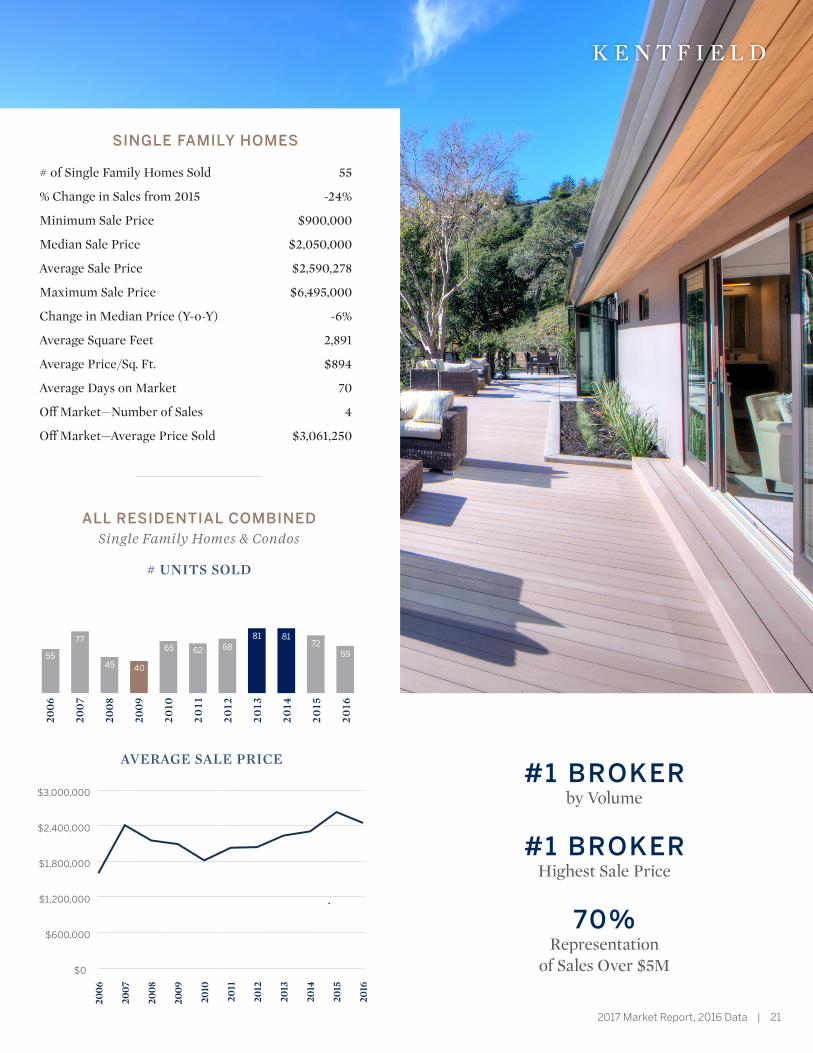
K E N T F I E L D
SINGLE FAMILY HOMES
# of Single Family Homes Sold 55
% Change in Sales from 2015 -24%
Minimum Sale Price $900,000
Median Sale Price $2,050,000
Average Sale Price $2,590,278
Maximum Sale Price $6,495,000
Change in Median Price (Y-o-Y) -6%
Average Square Feet 2,891
Average Price/Sq. Ft. $894
Average Days on Market 70
Off Market—Number of Sales 4
Off Market—Average Price Sold $3,061,250
55 59
77
45 40
65 62 6881 81
72
2006
2007
2008
2009
2010
2011
2012
2013
2014
2015
2016
K E N T F I E L D
$0
$600,000
$1,200,000
$1,800,000
$2,400,000
$3,000,000
2006
2007
2008
2009
2010
2011
2012
2013
2014
2015
2016
#1 BROKERby Volume
#1 BROKERHighest Sale Price
70%Representation
of Sales Over $5M
# UNITS SOLD
ALL RESIDENTIAL COMBINED Single Family Homes & Condos
AVERAGE SALE PRICE
22 | 2017 Market Report, 2016 Data 2017 Market Report, 2016 Data | 23
AVERAGE SALES PRICE
G R E E N B R A E
4540
28
1923 26
51 50
36 33
$0
$1,400,000
$2,800,000
$4,200,000
$5,600,000
$7,000,000
2000
2001
2002
2003
2004
2005
2006
2007
2008
2009
2010
2011
2012
2013
2014
2015
2006
2007
2008
2009
2010
2011
2012
2013
2014
2015
2006
2007
2008
2009
2010
2011
2012
2013
2014
2015
13
30
19
8
1311
16 15
36 37
2006
2007
2008
2009
2010
2011
2012
2013
2014
2015
13
3 3
8
163
2
7
3 32
1
32
7
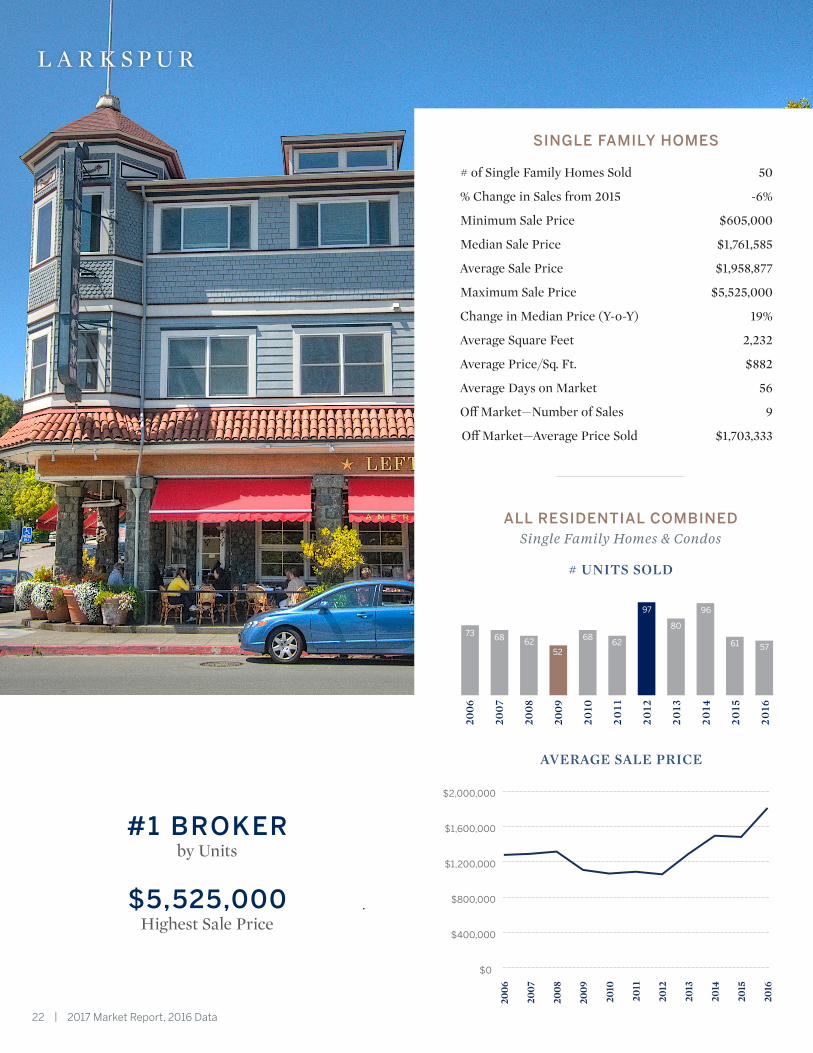
SINGLE FAMILY HOMES
# of Single Family Homes Sold 50
% Change in Sales from 2015 -6%
Minimum Sale Price $605,000
Median Sale Price $1,761,585
Average Sale Price $1,958,877
Maximum Sale Price $5,525,000
Change in Median Price (Y-o-Y) 19%
Average Square Feet 2,232
Average Price/Sq. Ft. $882
Average Days on Market 56
Off Market—Number of Sales 9
Off Market—Average Price Sold $1,703,333
73
5768 62
52
6862
97
80
96
61
2006
2007
2008
2009
2010
2011
2012
2013
2014
2015
2016
L A R K S P U R
$0
$400,000
$800,000
$1,200,000
$1,600,000
$2,000,000
2006
2007
2008
2009
2010
2011
2012
2013
2014
2015
2016
#1 BROKERby Units
$5,525,000Highest Sale Price
# UNITS SOLD
ALL RESIDENTIAL COMBINED Single Family Homes & Condos
AVERAGE SALE PRICE
22 | 2017 Market Report, 2016 Data 2017 Market Report, 2016 Data | 23
AVERAGE SALES PRICE
K E N T F I E L D
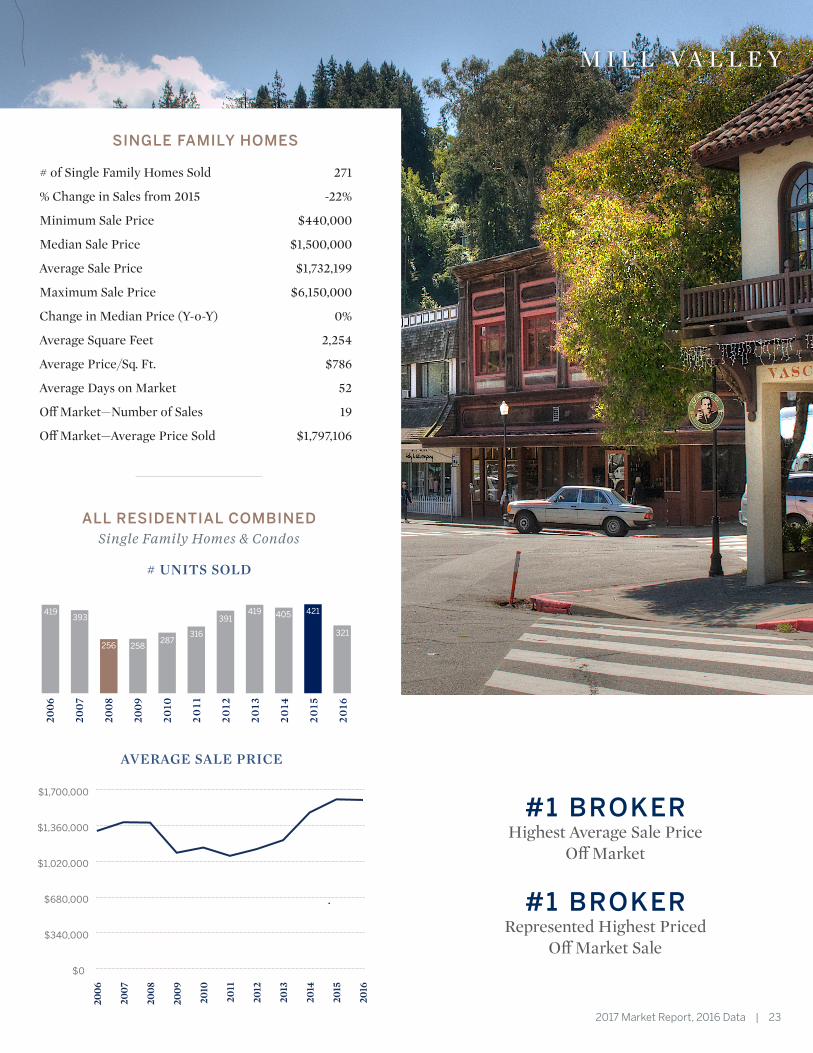
SINGLE FAMILY HOMES
# of Single Family Homes Sold 271
% Change in Sales from 2015 -22%
Minimum Sale Price $440,000
Median Sale Price $1,500,000
Average Sale Price $1,732,199
Maximum Sale Price $6,150,000
Change in Median Price (Y-o-Y) 0%
Average Square Feet 2,254
Average Price/Sq. Ft. $786
Average Days on Market 52
Off Market—Number of Sales 19
Off Market—Average Price Sold $1,797,106
419
321
393
256 258287
316
391419 405 421
2006
2007
2008
2009
2010
2011
2012
2013
2014
2015
2016
M I L L VA L L E Y
$0
$340,000
$680,000
$1,020,000
$1,360,000
$1,700,000
2006
2007
2008
2009
2010
2011
2012
2013
2014
2015
2016
#1 BROKERHighest Average Sale Price
Off Market
#1 BROKERRepresented Highest Priced
Off Market Sale
# UNITS SOLD
ALL RESIDENTIAL COMBINED Single Family Homes & Condos
AVERAGE SALE PRICE
24 | 2017 Market Report, 2016 Data 2017 Market Report, 2016 Data | 25
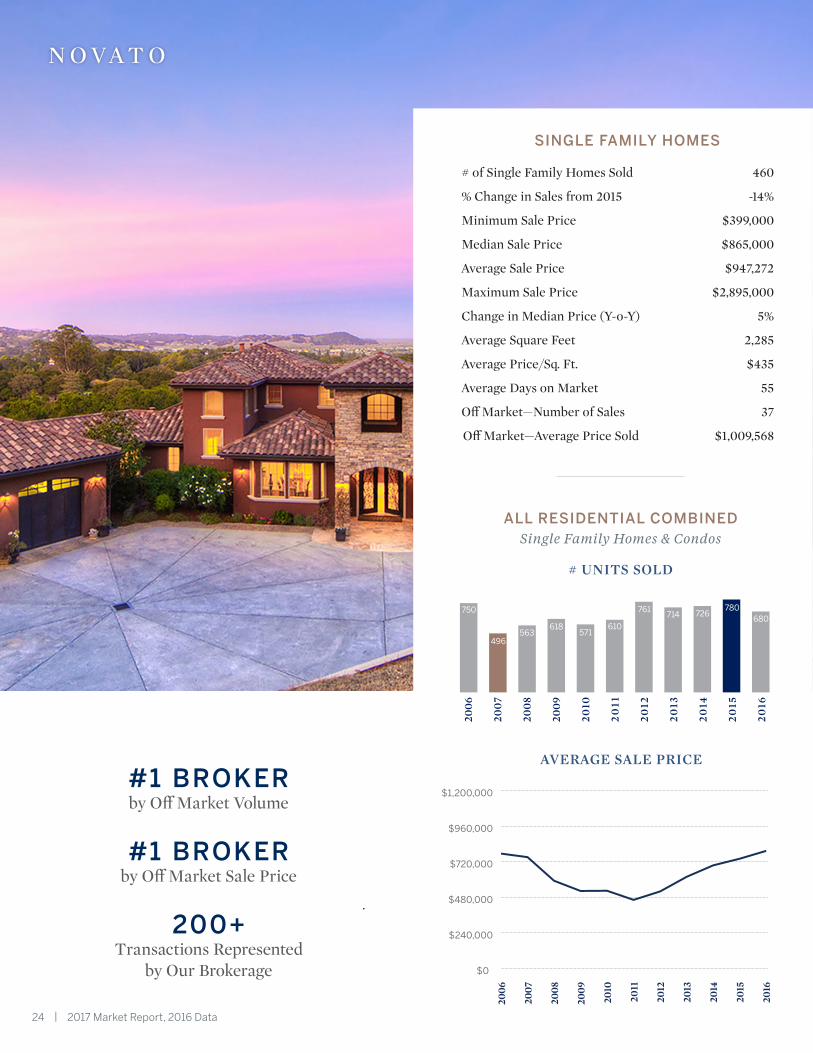
N O VA T O
SINGLE FAMILY HOMES
# of Single Family Homes Sold 460
% Change in Sales from 2015 -14%
Minimum Sale Price $399,000
Median Sale Price $865,000
Average Sale Price $947,272
Maximum Sale Price $2,895,000
Change in Median Price (Y-o-Y) 5%
Average Square Feet 2,285
Average Price/Sq. Ft. $435
Average Days on Market 55
Off Market—Number of Sales 37
Off Market—Average Price Sold $1,009,568
750680
496563
618571
610
761714 726
780
2006
2007
2008
2009
2010
2011
2012
2013
2014
2015
2016
$0
$240,000
$480,000
$720,000
$960,000
$1,200,000
2006
2007
2008
2009
2010
2011
2012
2013
2014
2015
2016
#1 BROKERby Off Market Volume
#1 BROKERby Off Market Sale Price
200+Transactions Represented
by Our Brokerage
# UNITS SOLD
ALL RESIDENTIAL COMBINED Single Family Homes & Condos
AVERAGE SALE PRICE

24 | 2017 Market Report, 2016 Data 2017 Market Report, 2016 Data | 25
R O S S
SINGLE FAMILY HOMES
# of Single Family Homes Sold 35
% Change in Sales from 2015 17%
Minimum Sale Price $975,000
Median Sale Price $2,825,000
Average Sale Price $3,889,963
Maximum Sale Price $9,925,000
Change in Median Price (Y-o-Y) -11%
Average Square Feet 3,864
Average Price/Sq. Ft. $1,003
Average Days on Market 73
Off Market—Number of Sales 4
Off Market—Average Price Sold $5,982,500
34 3529 28
36
20
27
4244 44
30
2006
2007
2008
2009
2010
2011
2012
2013
2014
2015
2016
$0
$800,000
$1,600,000
$2,400,000
$3,200,000
$4,000,000
2006
2007
2008
2009
2010
2011
2012
2013
2014
2015
2016
30%Representation of
Highest Priced Sales
$9,925,000Highest Sale Price
# UNITS SOLD
ALL RESIDENTIAL COMBINED Single Family Homes & Condos
AVERAGE SALE PRICE
26 | 2017 Market Report, 2016 Data 2017 Market Report, 2016 Data | 27
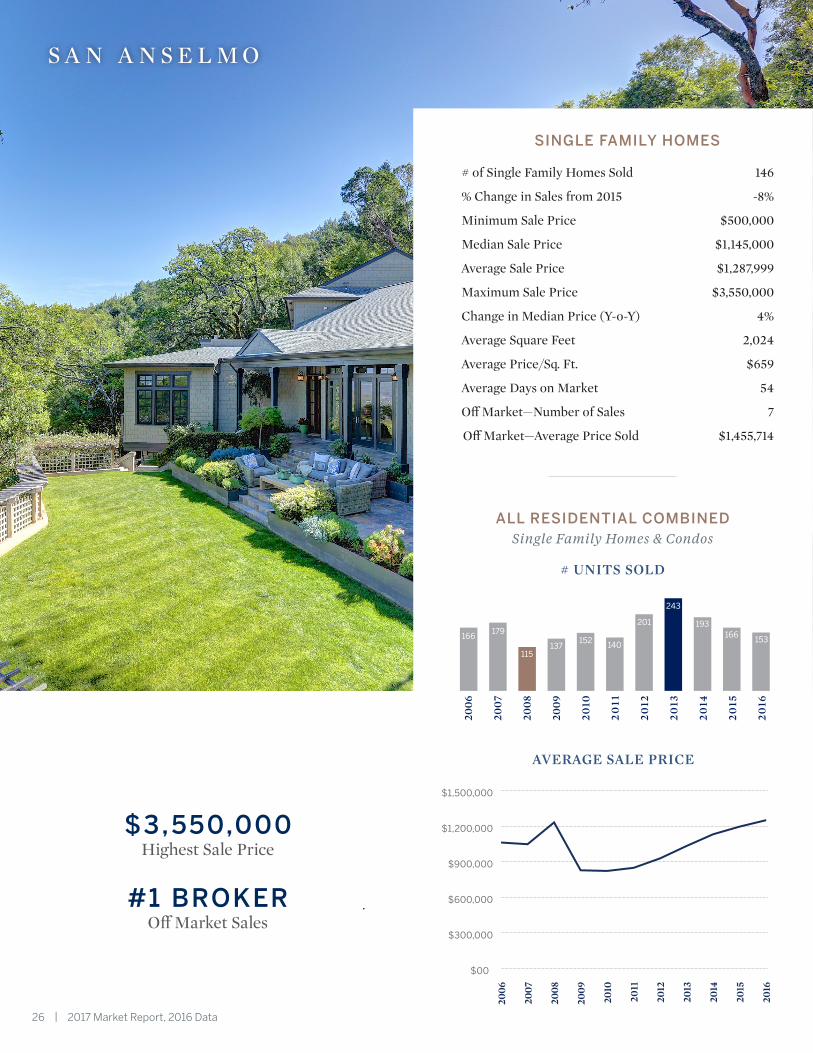
S A N A N S E L M O
SINGLE FAMILY HOMES
# of Single Family Homes Sold 146
% Change in Sales from 2015 -8%
Minimum Sale Price $500,000
Median Sale Price $1,145,000
Average Sale Price $1,287,999
Maximum Sale Price $3,550,000
Change in Median Price (Y-o-Y) 4%
Average Square Feet 2,024
Average Price/Sq. Ft. $659
Average Days on Market 54
Off Market—Number of Sales 7
Off Market—Average Price Sold $1,455,714
166 153179
115137
152 140
201
243
193166
2006
2007
2008
2009
2010
2011
2012
2013
2014
2015
2016
$00
$300,000
$600,000
$900,000
$1,200,000
$1,500,000
2006
2007
2008
2009
2010
2011
2012
2013
2014
2015
2016
$3,550,000Highest Sale Price
#1 BROKEROff Market Sales
# UNITS SOLD
ALL RESIDENTIAL COMBINED Single Family Homes & Condos
AVERAGE SALE PRICE
26 | 2017 Market Report, 2016 Data 2017 Market Report, 2016 Data | 27
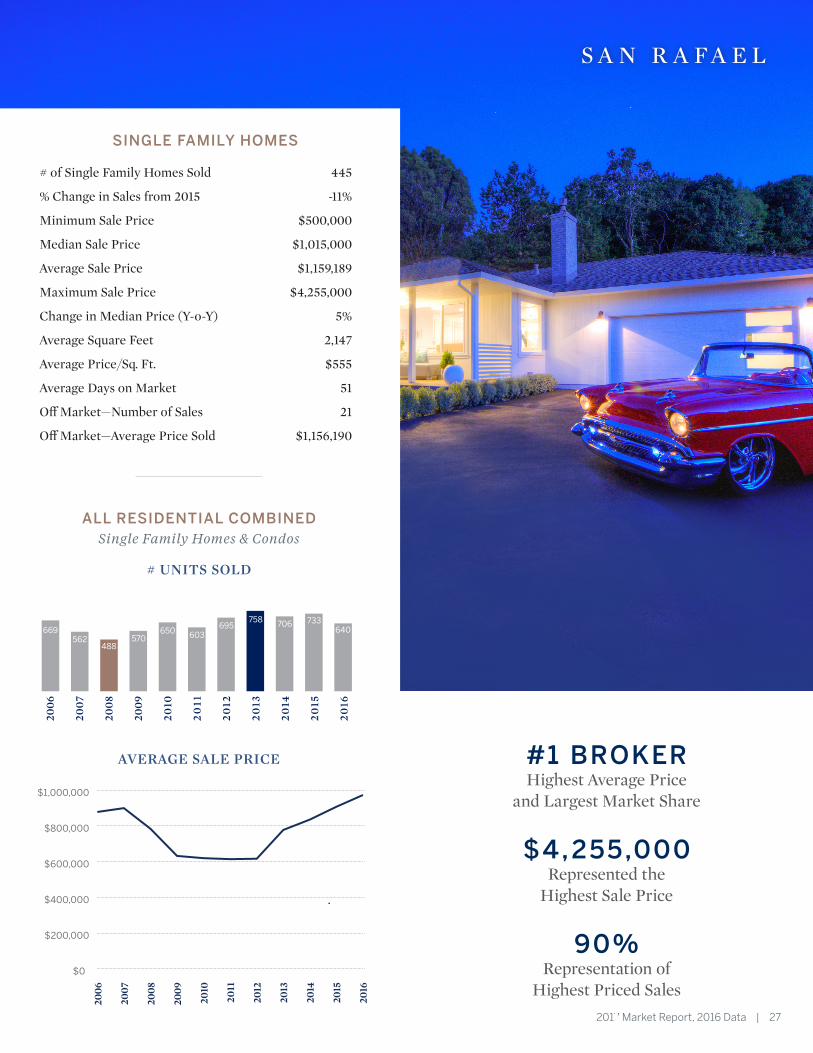
S A N R A F A E L
SINGLE FAMILY HOMES
# of Single Family Homes Sold 445
% Change in Sales from 2015 -11%
Minimum Sale Price $500,000
Median Sale Price $1,015,000
Average Sale Price $1,159,189
Maximum Sale Price $4,255,000
Change in Median Price (Y-o-Y) 5%
Average Square Feet 2,147
Average Price/Sq. Ft. $555
Average Days on Market 51
Off Market—Number of Sales 21
Off Market—Average Price Sold $1,156,190
669 640562
488570
650 603695
758 706 733
2006
2007
2008
2009
2010
2011
2012
2013
2014
2015
2016
$0
$200,000
$400,000
$600,000
$800,000
$1,000,000
2006
2007
2008
2009
2010
2011
2012
2013
2014
2015
2016
#1 BROKERHighest Average Price
and Largest Market Share
$4,255,000Represented the
Highest Sale Price
90%Representation of
Highest Priced Sales
# UNITS SOLD
ALL RESIDENTIAL COMBINED Single Family Homes & Condos
AVERAGE SALE PRICE
28 | 2017 Market Report, 2016 Data 2017 Market Report, 2016 Data | 29
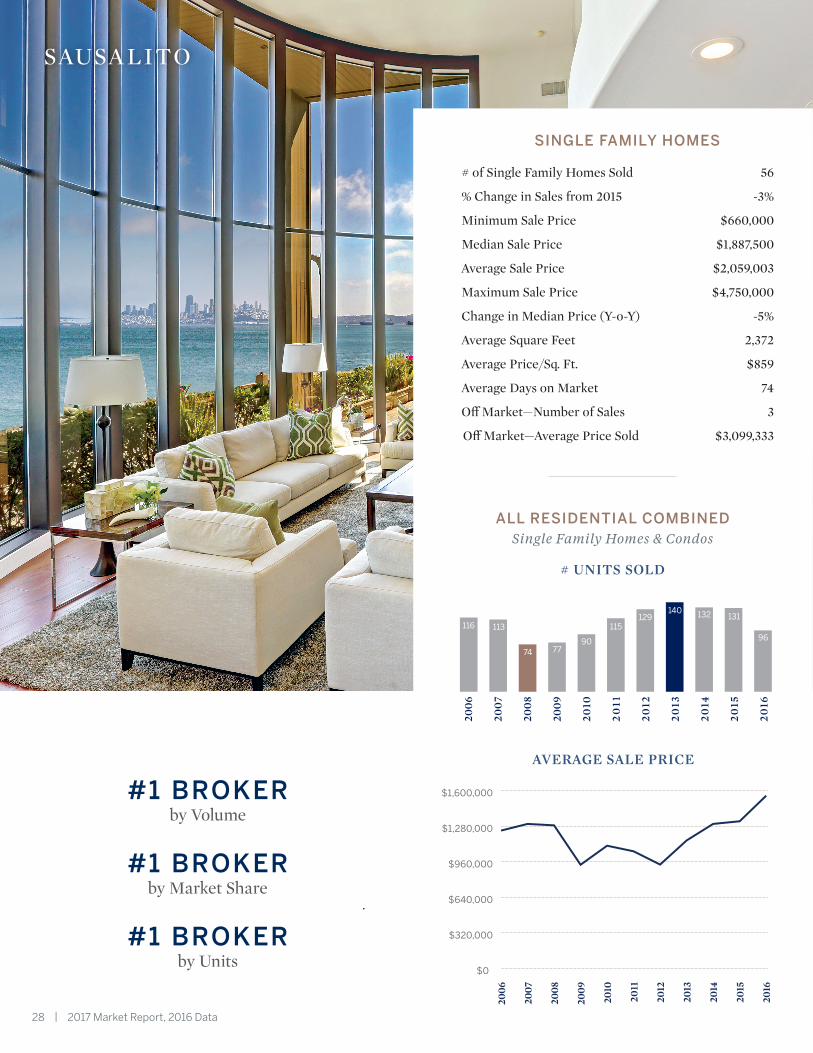
SAUSA LITO
SINGLE FAMILY HOMES
# of Single Family Homes Sold 56
% Change in Sales from 2015 -3%
Minimum Sale Price $660,000
Median Sale Price $1,887,500
Average Sale Price $2,059,003
Maximum Sale Price $4,750,000
Change in Median Price (Y-o-Y) -5%
Average Square Feet 2,372
Average Price/Sq. Ft. $859
Average Days on Market 74
Off Market—Number of Sales 3
Off Market—Average Price Sold $3,099,333
116
96113
74 7790
115129
140 132 131
2006
2007
2008
2009
2010
2011
2012
2013
2014
2015
2016
$0
$320,000
$640,000
$960,000
$1,280,000
$1,600,000
2006
2007
2008
2009
2010
2011
2012
2013
2014
2015
2016
#1 BROKERby Volume
#1 BROKERby Market Share
#1 BROKERby Units
# UNITS SOLD
ALL RESIDENTIAL COMBINED Single Family Homes & Condos
AVERAGE SALE PRICE
28 | 2017 Market Report, 2016 Data 2017 Market Report, 2016 Data | 29
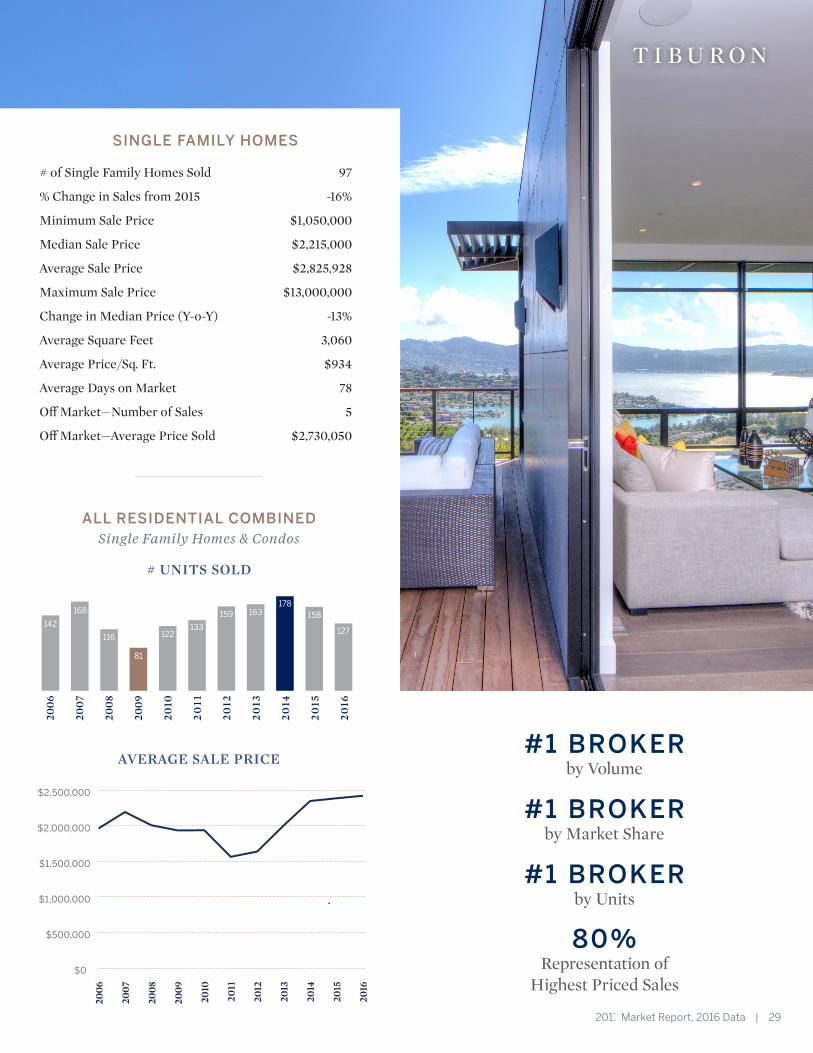
T I B U R O N
SINGLE FAMILY HOMES
# of Single Family Homes Sold 97
% Change in Sales from 2015 -16%
Minimum Sale Price $1,050,000
Median Sale Price $2,215,000
Average Sale Price $2,825,928
Maximum Sale Price $13,000,000
Change in Median Price (Y-o-Y) -13%
Average Square Feet 3,060
Average Price/Sq. Ft. $934
Average Days on Market 78
Off Market—Number of Sales 5
Off Market—Average Price Sold $2,730,050
142127
168
116
81
122133
159 163178
158
2006
2007
2008
2009
2010
2011
2012
2013
2014
2015
2016
$0
$500,000
$1,000,000
$1,500,000
$2,000,000
$2,500,000
2006
2007
2008
2009
2010
2011
2012
2013
2014
2015
2016
80%Representation of
Highest Priced Sales
#1 BROKERby Volume
#1 BROKERby Market Share
#1 BROKERby Units
# UNITS SOLD
ALL RESIDENTIAL COMBINED Single Family Homes & Condos
AVERAGE SALE PRICE
30 | 2017 Market Report, 2016 Data 2017 Market Report, 2016 Data | 31
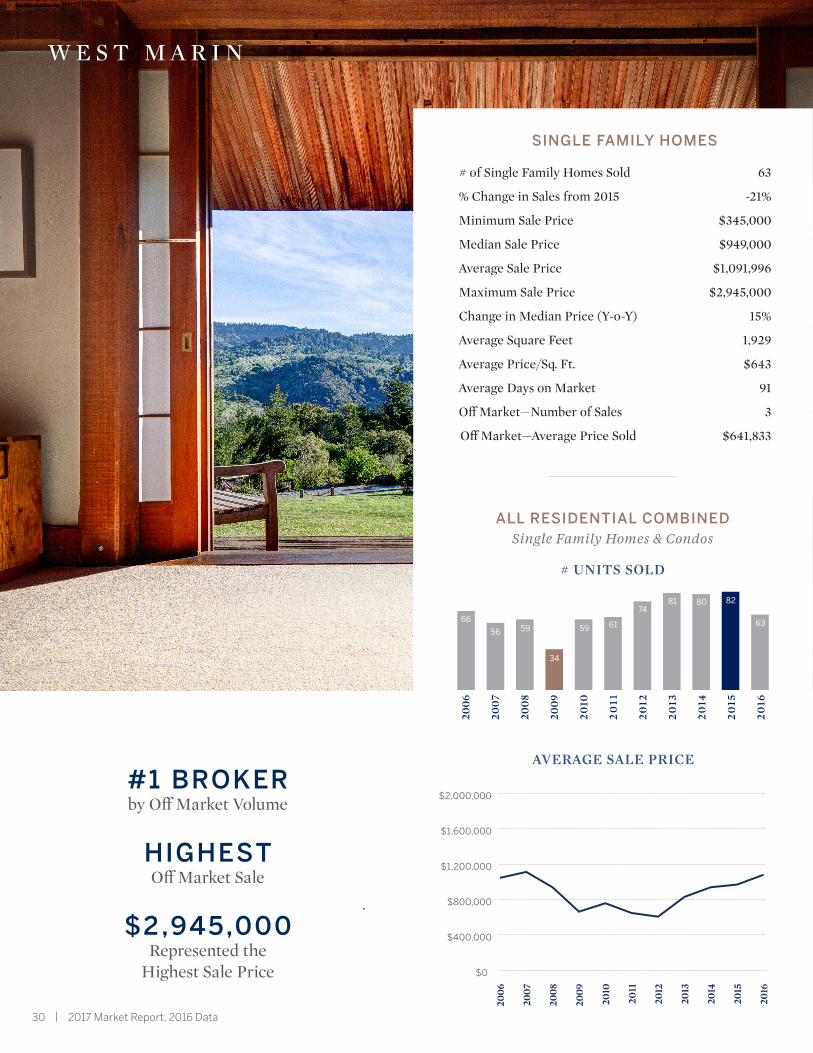
W E S T M A R I N
SINGLE FAMILY HOMES
# of Single Family Homes Sold 63
% Change in Sales from 2015 -21%
Minimum Sale Price $345,000
Median Sale Price $949,000
Average Sale Price $1,091,996
Maximum Sale Price $2,945,000
Change in Median Price (Y-o-Y) 15%
Average Square Feet 1,929
Average Price/Sq. Ft. $643
Average Days on Market 91
Off Market—Number of Sales 3
Off Market—Average Price Sold $641,833
66 6356 59
34
59 61
7481 80 82
2006
2007
2008
2009
2010
2011
2012
2013
2014
2015
2016
$0
$400,000
$800,000
$1,200,000
$1,600,000
$2,000,000
2006
2007
2008
2009
2010
2011
2012
2013
2014
2015
2016
#1 BROKERby Off Market Volume
HIGHESTOff Market Sale
$2,945,000Represented the
Highest Sale Price
# UNITS SOLD
ALL RESIDENTIAL COMBINED Single Family Homes & Condos
AVERAGE SALE PRICE
30 | 2017 Market Report, 2016 Data 2017 Market Report, 2016 Data | 31
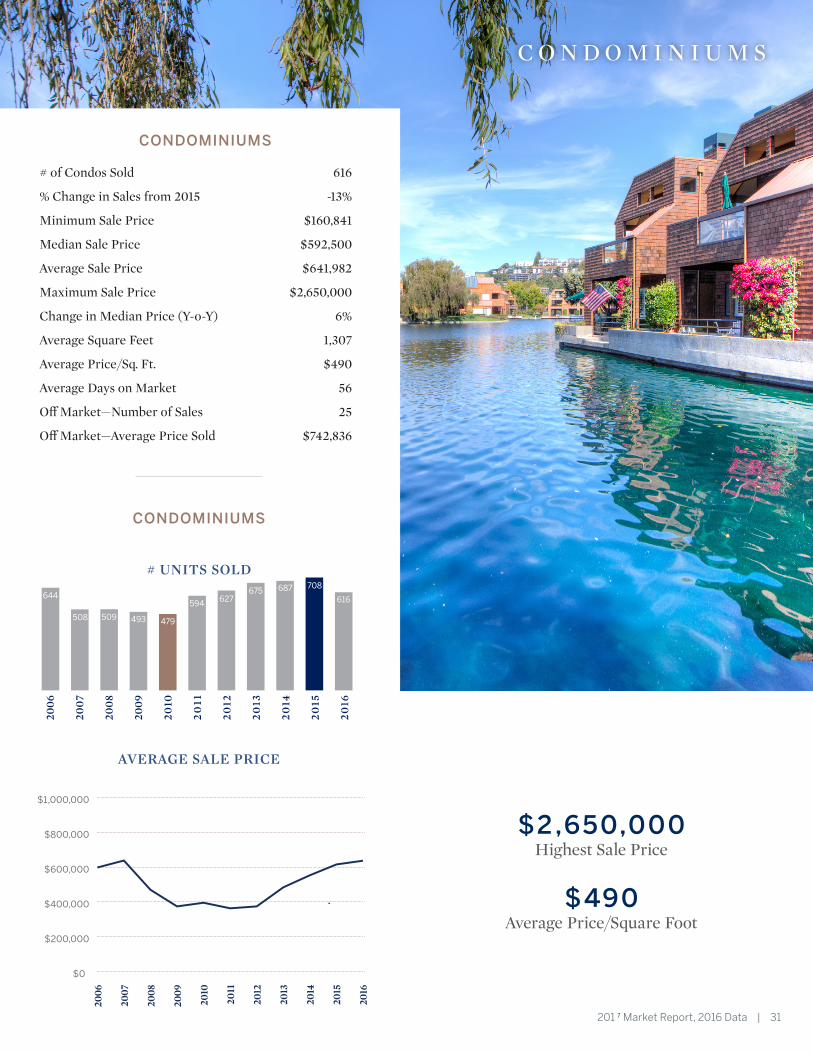
CONDOMINIUMS
# of Condos Sold 616
% Change in Sales from 2015 -13%
Minimum Sale Price $160,841
Median Sale Price $592,500
Average Sale Price $641,982
Maximum Sale Price $2,650,000
Change in Median Price (Y-o-Y) 6%
Average Square Feet 1,307
Average Price/Sq. Ft. $490
Average Days on Market 56
Off Market—Number of Sales 25
Off Market—Average Price Sold $742,836
C O N D O M I N I U M S
644 616
508 509 493 479
594 627675 687 708
2006
2007
2008
2009
2010
2011
2012
2013
2014
2015
2016
$0
$200,000
$400,000
$600,000
$800,000
$1,000,000
2006
2007
2008
2009
2010
2011
2012
2013
2014
2015
2016
$2,650,000Highest Sale Price
$490Average Price/Square Foot
# UNITS SOLD
CONDOMINIUMS
AVERAGE SALE PRICE
32 | 2017 Market Report, 2016 Data 2017 Market Report, 2016 Data | 33
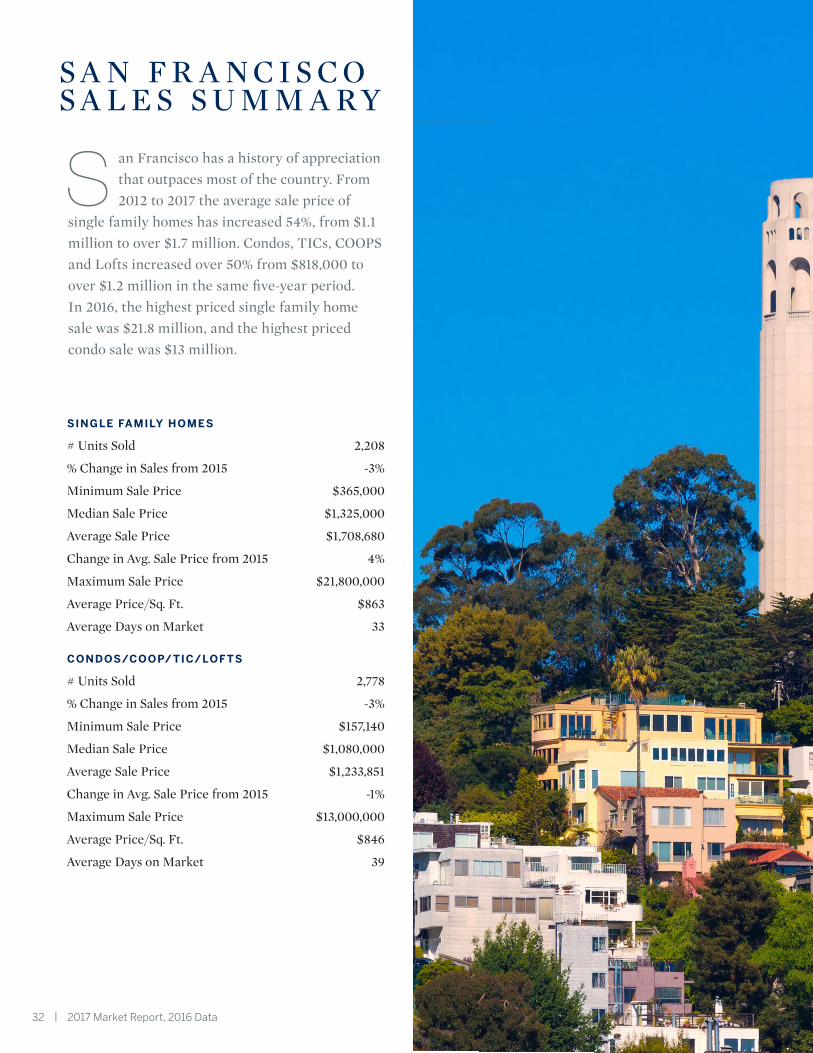
S A N F R A N C I S C OS A L E S S U M M A R Y
San Francisco has a history of appreciation that outpaces most of the country. From 2012 to 2017 the average sale price of
single family homes has increased 54%, from $1.1 million to over $1.7 million. Condos, TICs, COOPS and Lofts increased over 50% from $818,000 to over $1.2 million in the same five-year period. In 2016, the highest priced single family home sale was $21.8 million, and the highest priced condo sale was $13 million.
SINGLE FAMILY HOMES
# Units Sold 2,208
% Change in Sales from 2015 -3%
Minimum Sale Price $365,000
Median Sale Price $1,325,000
Average Sale Price $1,708,680
Change in Avg. Sale Price from 2015 4%
Maximum Sale Price $21,800,000
Average Price/Sq. Ft. $863
Average Days on Market 33
CONDOS/COOP/TIC/LOF TS
# Units Sold 2,778
% Change in Sales from 2015 -3%
Minimum Sale Price $157,140
Median Sale Price $1,080,000
Average Sale Price $1,233,851
Change in Avg. Sale Price from 2015 -1%
Maximum Sale Price $13,000,000
Average Price/Sq. Ft. $846
Average Days on Market 39
32 | 2017 Market Report, 2016 Data 2017 Market Report, 2016 Data | 33
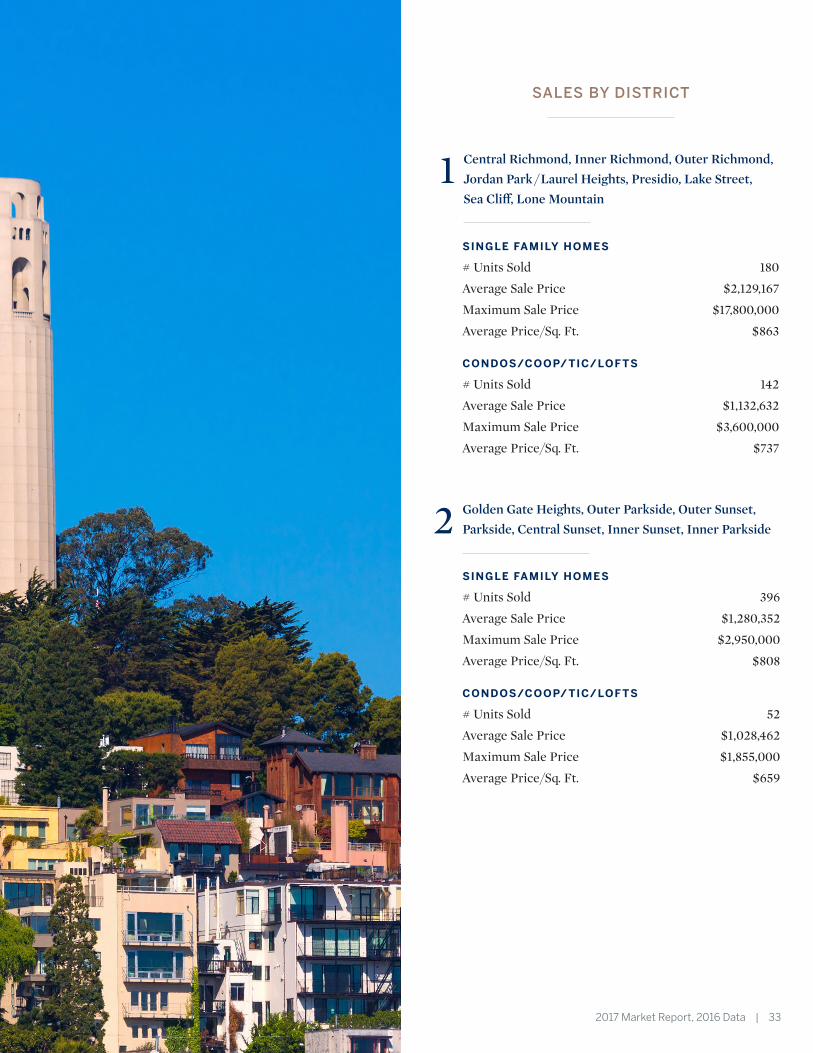
SALES BY DISTRICT
1 Central Richmond, Inner Richmond, Outer Richmond, Jordan Park / Laurel Heights, Presidio, Lake Street, Sea Cliff, Lone Mountain
SINGLE FAMILY HOMES
# Units Sold 180
Average Sale Price $2,129,167
Maximum Sale Price $17,800,000
Average Price/Sq. Ft. $863
CONDOS/COOP/TIC/LOF TS
# Units Sold 142
Average Sale Price $1,132,632
Maximum Sale Price $3,600,000
Average Price/Sq. Ft. $737
2 Golden Gate Heights, Outer Parkside, Outer Sunset, Parkside, Central Sunset, Inner Sunset, Inner Parkside
SINGLE FAMILY HOMES
# Units Sold 396
Average Sale Price $1,280,352
Maximum Sale Price $2,950,000
Average Price/Sq. Ft. $808
CONDOS/COOP/TIC/LOF TS
# Units Sold 52
Average Sale Price $1,028,462
Maximum Sale Price $1,855,000
Average Price/Sq. Ft. $659
34 | 2017 Market Report, 2016 Data 2017 Market Report, 2016 Data | 35
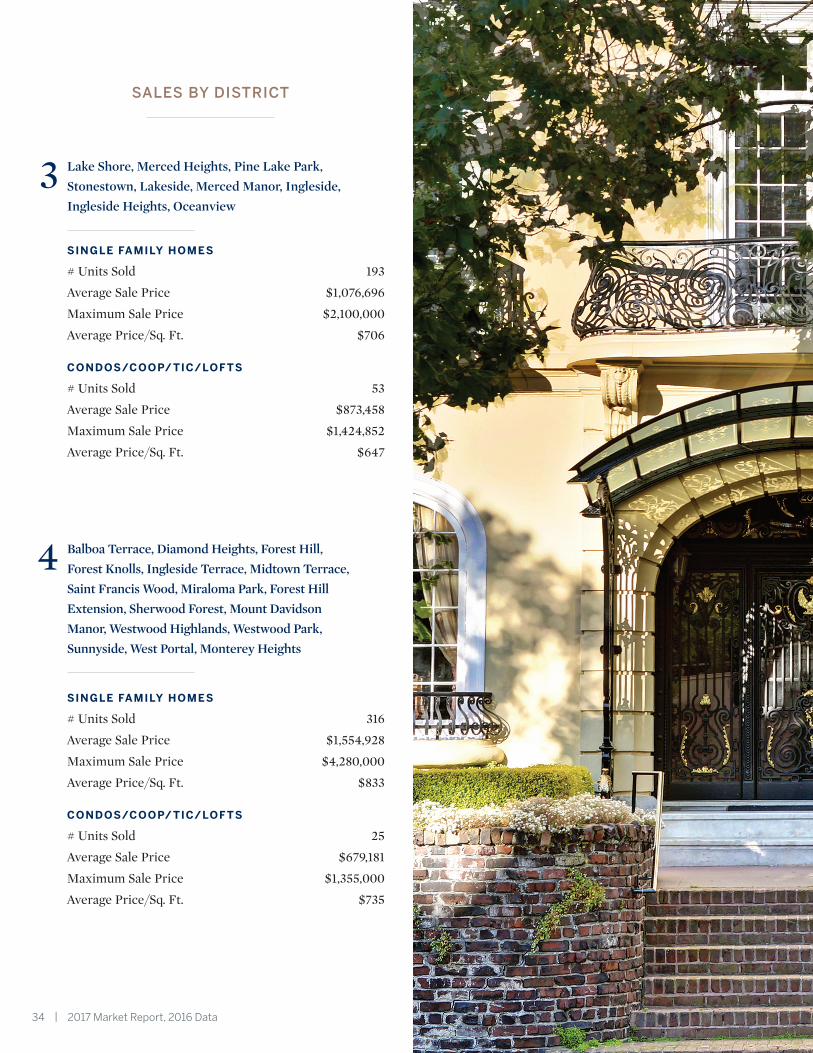
4 Balboa Terrace, Diamond Heights, Forest Hill, Forest Knolls, Ingleside Terrace, Midtown Terrace, Saint Francis Wood, Miraloma Park, Forest Hill Extension, Sherwood Forest, Mount Davidson Manor, Westwood Highlands, Westwood Park, Sunnyside, West Portal, Monterey Heights
SINGLE FAMILY HOMES
# Units Sold 316
Average Sale Price $1,554,928
Maximum Sale Price $4,280,000
Average Price/Sq. Ft. $833
CONDOS/COOP/TIC/LOF TS
# Units Sold 25
Average Sale Price $679,181
Maximum Sale Price $1,355,000
Average Price/Sq. Ft. $735
SALES BY DISTRICT
3 Lake Shore, Merced Heights, Pine Lake Park, Stonestown, Lakeside, Merced Manor, Ingleside, Ingleside Heights, Oceanview
SINGLE FAMILY HOMES
# Units Sold 193
Average Sale Price $1,076,696
Maximum Sale Price $2,100,000
Average Price/Sq. Ft. $706
CONDOS/COOP/TIC/LOF TS
# Units Sold 53
Average Sale Price $873,458
Maximum Sale Price $1,424,852
Average Price/Sq. Ft. $647
34 | 2017 Market Report, 2016 Data 2017 Market Report, 2016 Data | 35
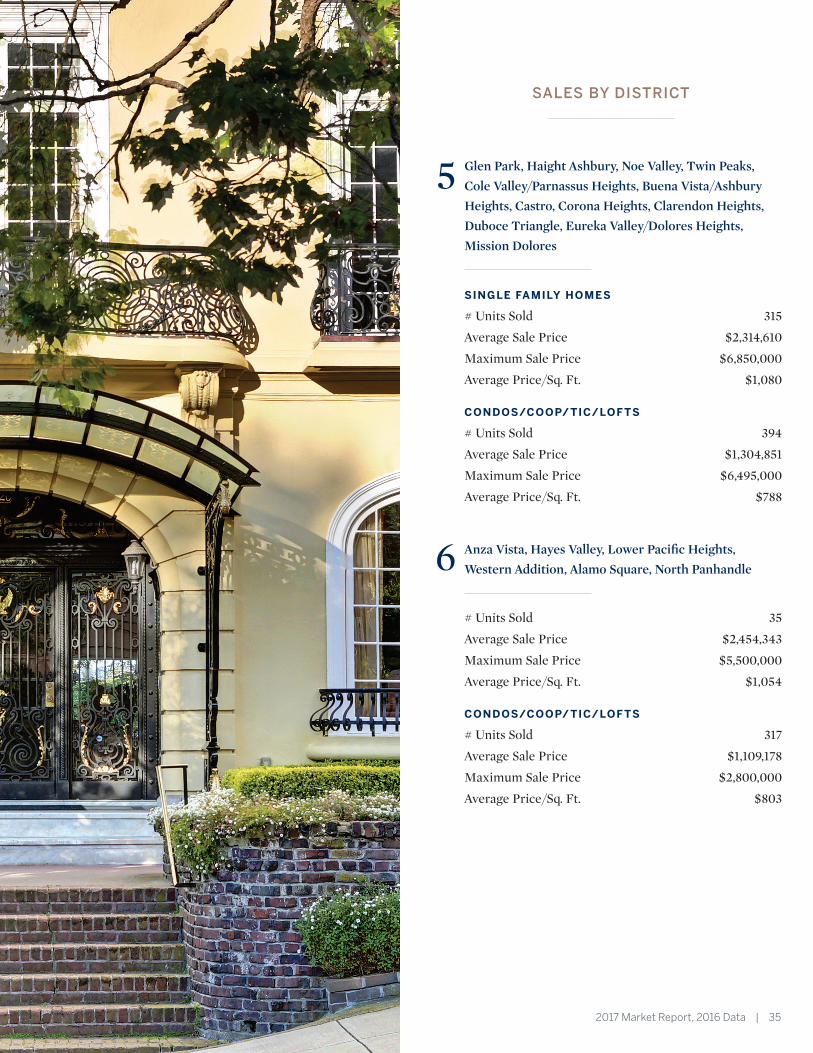
SALES BY DISTRICT
5 Glen Park, Haight Ashbury, Noe Valley, Twin Peaks, Cole Valley/Parnassus Heights, Buena Vista/Ashbury Heights, Castro, Corona Heights, Clarendon Heights, Duboce Triangle, Eureka Valley/Dolores Heights, Mission Dolores
SINGLE FAMILY HOMES
# Units Sold 315
Average Sale Price $2,314,610
Maximum Sale Price $6,850,000
Average Price/Sq. Ft. $1,080
CONDOS/COOP/TIC/LOF TS
# Units Sold 394
Average Sale Price $1,304,851
Maximum Sale Price $6,495,000
Average Price/Sq. Ft. $788
6 Anza Vista, Hayes Valley, Lower Pacific Heights, Western Addition, Alamo Square, North Panhandle
# Units Sold 35
Average Sale Price $2,454,343
Maximum Sale Price $5,500,000
Average Price/Sq. Ft. $1,054
CONDOS/COOP/TIC/LOF TS
# Units Sold 317
Average Sale Price $1,109,178
Maximum Sale Price $2,800,000
Average Price/Sq. Ft. $803
36 | 2017 Market Report, 2016 Data 2017 Market Report, 2016 Data | 37
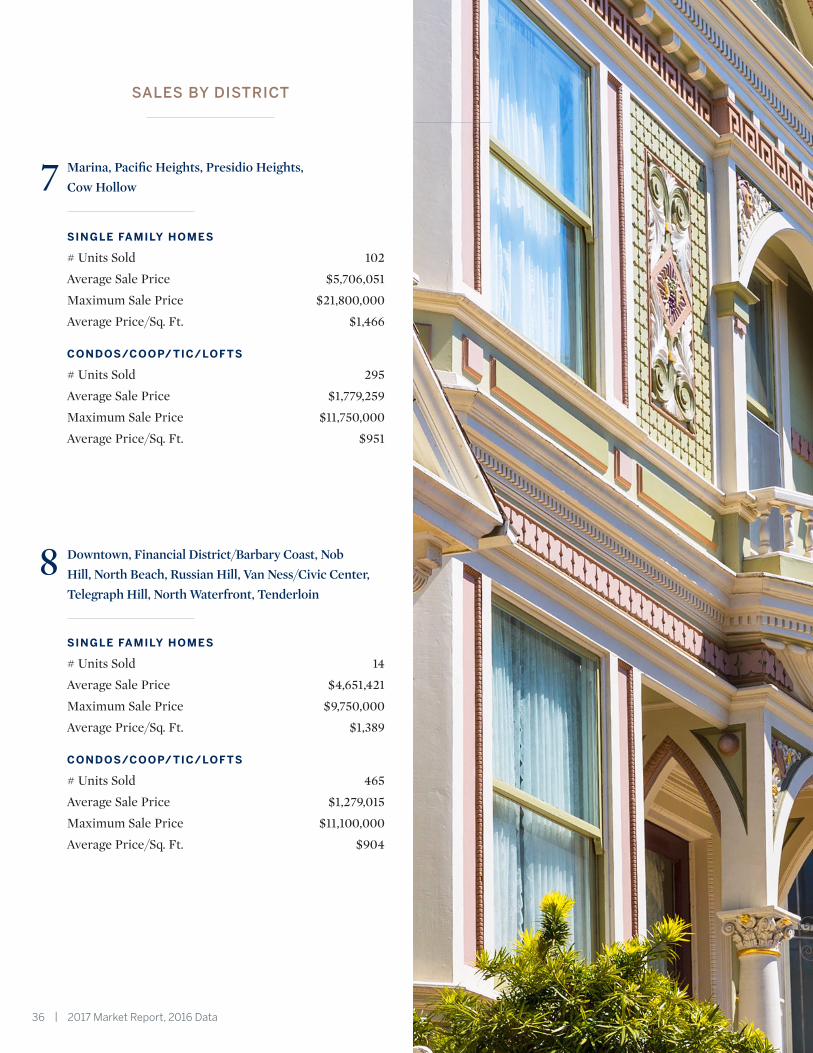
SALES BY DISTRICT
7 Marina, Pacific Heights, Presidio Heights,Cow Hollow
SINGLE FAMILY HOMES
# Units Sold 102
Average Sale Price $5,706,051
Maximum Sale Price $21,800,000
Average Price/Sq. Ft. $1,466
CONDOS/COOP/TIC/LOF TS
# Units Sold 295
Average Sale Price $1,779,259
Maximum Sale Price $11,750,000
Average Price/Sq. Ft. $951
8 Downtown, Financial District/Barbary Coast, Nob Hill, North Beach, Russian Hill, Van Ness/Civic Center, Telegraph Hill, North Waterfront, Tenderloin
SINGLE FAMILY HOMES
# Units Sold 14
Average Sale Price $4,651,421
Maximum Sale Price $9,750,000
Average Price/Sq. Ft. $1,389
CONDOS/COOP/TIC/LOF TS
# Units Sold 465
Average Sale Price $1,279,015
Maximum Sale Price $11,100,000
Average Price/Sq. Ft. $904
36 | 2017 Market Report, 2016 Data 2017 Market Report, 2016 Data | 37
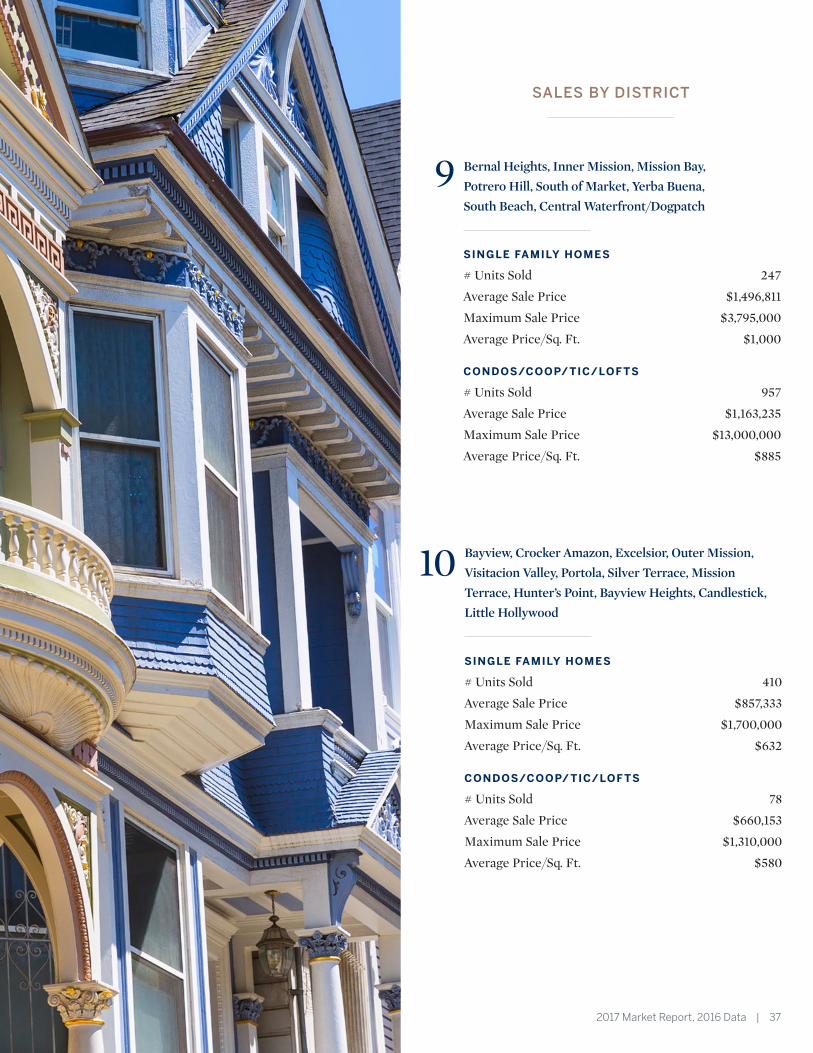
SALES BY DISTRICT
9 Bernal Heights, Inner Mission, Mission Bay, Potrero Hill, South of Market, Yerba Buena, South Beach, Central Waterfront/Dogpatch
SINGLE FAMILY HOMES
# Units Sold 247
Average Sale Price $1,496,811
Maximum Sale Price $3,795,000
Average Price/Sq. Ft. $1,000
CONDOS/COOP/TIC/LOF TS
# Units Sold 957
Average Sale Price $1,163,235
Maximum Sale Price $13,000,000
Average Price/Sq. Ft. $885
10 Bayview, Crocker Amazon, Excelsior, Outer Mission, Visitacion Valley, Portola, Silver Terrace, Mission Terrace, Hunter’s Point, Bayview Heights, Candlestick, Little Hollywood
SINGLE FAMILY HOMES
# Units Sold 410
Average Sale Price $857,333
Maximum Sale Price $1,700,000
Average Price/Sq. Ft. $632
CONDOS/COOP/TIC/LOF TS
# Units Sold 78
Average Sale Price $660,153
Maximum Sale Price $1,310,000
Average Price/Sq. Ft. $580
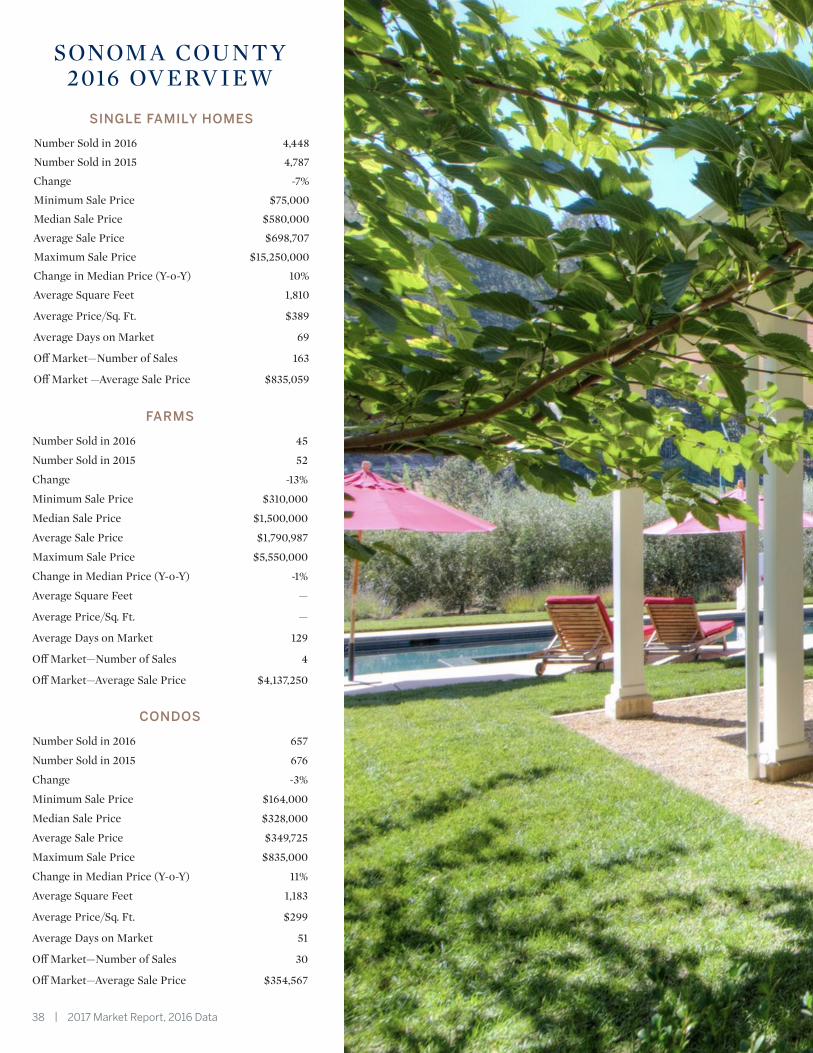
38 | 2017 Market Report, 2016 Data 2017 Market Report, 2016 Data | 39
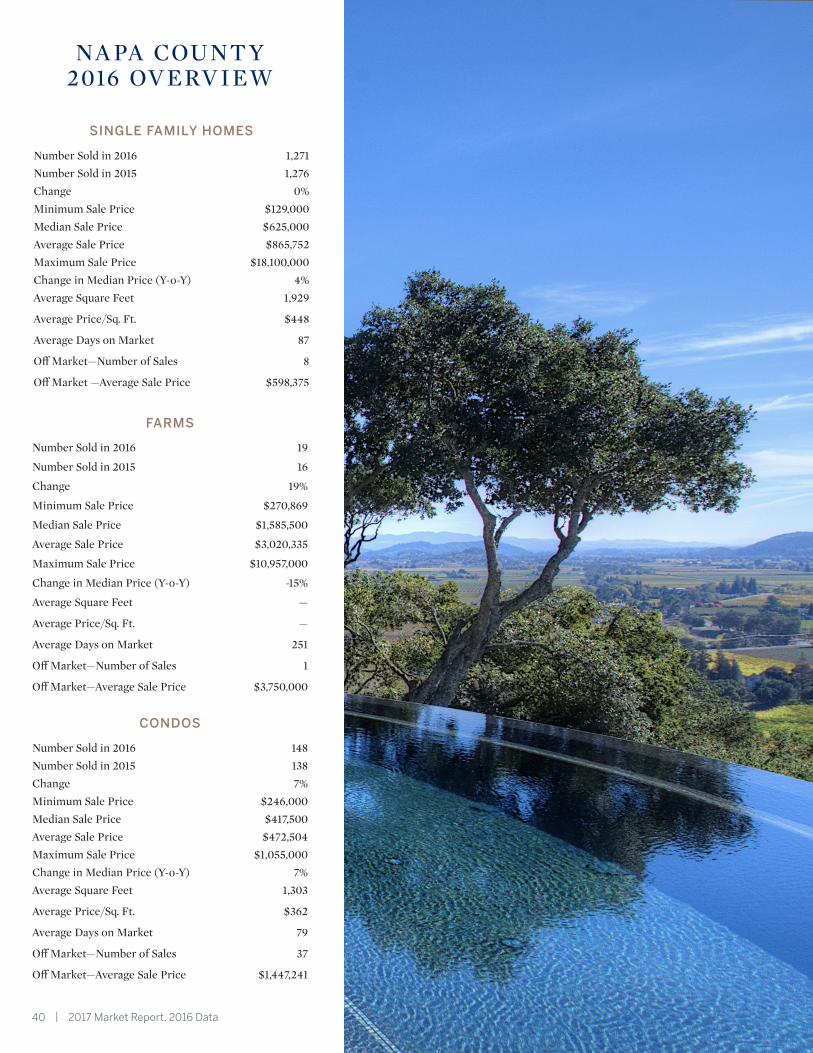
FARMS
Number Sold in 2016 45
Number Sold in 2015 52
Change -13%
Minimum Sale Price $310,000
Median Sale Price $1,500,000
Average Sale Price $1,790,987
Maximum Sale Price $5,550,000
Change in Median Price (Y-o-Y) -1%
Average Square Feet —
Average Price/Sq. Ft. —
Average Days on Market 129
Off Market—Number of Sales 4
Off Market—Average Sale Price $4,137,250
CONDOS
Number Sold in 2016 657
Number Sold in 2015 676
Change -3%
Minimum Sale Price $164,000
Median Sale Price $328,000
Average Sale Price $349,725
Maximum Sale Price $835,000
Change in Median Price (Y-o-Y) 11%
Average Square Feet 1,183
Average Price/Sq. Ft. $299
Average Days on Market 51
Off Market—Number of Sales 30
Off Market—Average Sale Price $354,567
SINGLE FAMILY HOMES
Number Sold in 2016 4,448
Number Sold in 2015 4,787
Change -7%
Minimum Sale Price $75,000
Median Sale Price $580,000
Average Sale Price $698,707
Maximum Sale Price $15,250,000
Change in Median Price (Y-o-Y) 10%
Average Square Feet 1,810
Average Price/Sq. Ft. $389
Average Days on Market 69
Off Market—Number of Sales 163
Off Market —Average Sale Price $835,059
SONOM A COUNT Y 2016 OV ERV IEW
38 | 2017 Market Report, 2016 Data 2017 Market Report, 2016 Data | 39
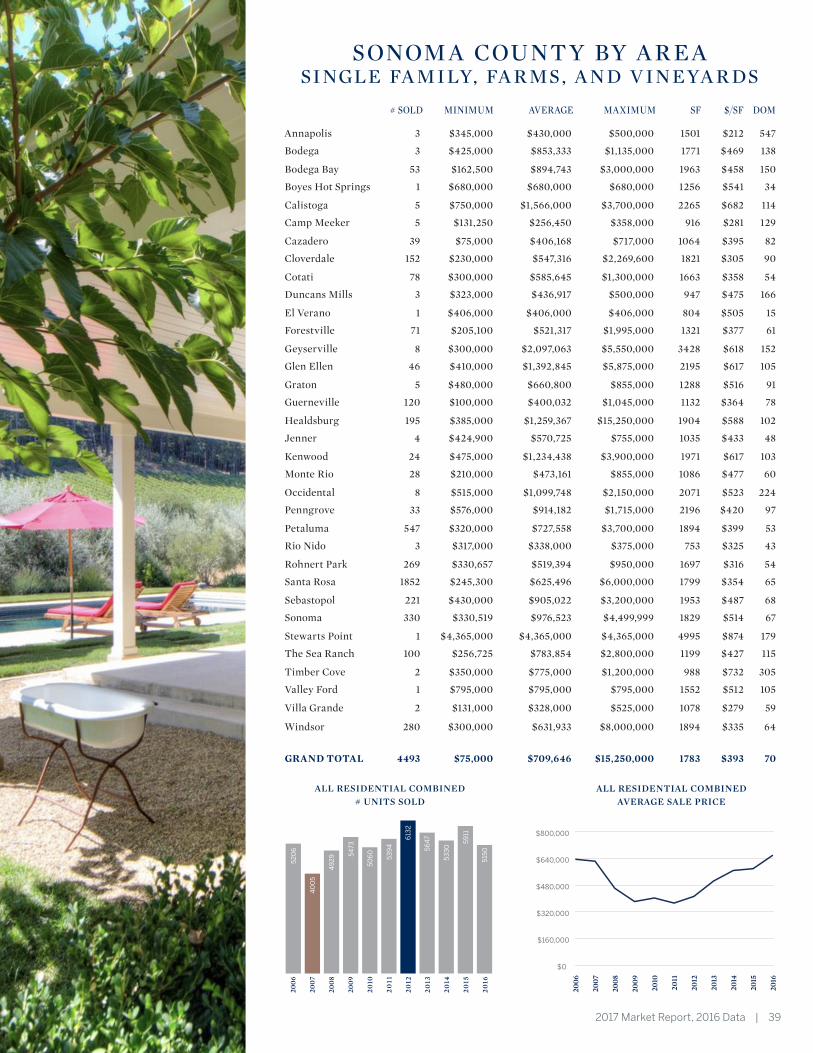
SONOM A COUNT Y BY A R E A SINGLE FA MILY, FA R MS, A ND V INEYA R DS
ALL RESIDENTIAL COMBINEDAVERAGE SALE PRICE
ALL RESIDENTIAL COMBINED# UNITS SOLD
$0
$160,000
$320,000
$480,000
$640,000
$800,000
2006
2007
2008
2009
2010
2011
2012
2013
2014
2015
2016
515
0
49
29
5911
53
30
56
476
132
53
94
50
6054
73
40
05
52
06
2006
2007
2008
2009
2010
2011
2012
2013
2014
2015
2016
Annapolis 3 $345,000 $430,000 $500,000 1501 $212 547
Bodega 3 $425,000 $853,333 $1,135,000 1771 $469 138
Bodega Bay 53 $162,500 $894,743 $3,000,000 1963 $458 150
Boyes Hot Springs 1 $680,000 $680,000 $680,000 1256 $541 34
Calistoga 5 $750,000 $1,566,000 $3,700,000 2265 $682 114
Camp Meeker 5 $131,250 $256,450 $358,000 916 $281 129
Cazadero 39 $75,000 $406,168 $717,000 1064 $395 82
Cloverdale 152 $230,000 $547,316 $2,269,600 1821 $305 90
Cotati 78 $300,000 $585,645 $1,300,000 1663 $358 54
Duncans Mills 3 $323,000 $436,917 $500,000 947 $475 166
El Verano 1 $406,000 $406,000 $406,000 804 $505 15
Forestville 71 $205,100 $521,317 $1,995,000 1321 $377 61
Geyserville 8 $300,000 $2,097,063 $5,550,000 3428 $618 152
Glen Ellen 46 $410,000 $1,392,845 $5,875,000 2195 $617 105
Graton 5 $480,000 $660,800 $855,000 1288 $516 91
Guerneville 120 $100,000 $400,032 $1,045,000 1132 $364 78
Healdsburg 195 $385,000 $1,259,367 $15,250,000 1904 $588 102
Jenner 4 $424,900 $570,725 $755,000 1035 $433 48
Kenwood 24 $475,000 $1,234,438 $3,900,000 1971 $617 103
Monte Rio 28 $210,000 $473,161 $855,000 1086 $477 60
Occidental 8 $515,000 $1,099,748 $2,150,000 2071 $523 224
Penngrove 33 $576,000 $914,182 $1,715,000 2196 $420 97
Petaluma 547 $320,000 $727,558 $3,700,000 1894 $399 53
Rio Nido 3 $317,000 $338,000 $375,000 753 $325 43
Rohnert Park 269 $330,657 $519,394 $950,000 1697 $316 54
Santa Rosa 1852 $245,300 $625,496 $6,000,000 1799 $354 65
Sebastopol 221 $430,000 $905,022 $3,200,000 1953 $487 68
Sonoma 330 $330,519 $976,523 $4,499,999 1829 $514 67
Stewarts Point 1 $4,365,000 $4,365,000 $4,365,000 4995 $874 179
The Sea Ranch 100 $256,725 $783,854 $2,800,000 1199 $427 115
Timber Cove 2 $350,000 $775,000 $1,200,000 988 $732 305
Valley Ford 1 $795,000 $795,000 $795,000 1552 $512 105
Villa Grande 2 $131,000 $328,000 $525,000 1078 $279 59
Windsor 280 $300,000 $631,933 $8,000,000 1894 $335 64
GRAND TOTAL 4493 $75,000 $709,646 $15,250,000 1783 $393 70
# SOLD MINIMUM AVERAGE MAXIMUM SF $/SF DOM
40 | 2017 Market Report, 2016 Data 2017 Market Report, 2016 Data | 41
SINGLE FAMILY HOMES
Number Sold in 2016 1,271 Number Sold in 2015 1,276 Change 0%Minimum Sale Price $129,000Median Sale Price $625,000Average Sale Price $865,752Maximum Sale Price $18,100,000Change in Median Price (Y-o-Y) 4%Average Square Feet 1,929
Average Price/Sq. Ft. $448
Average Days on Market 87
Off Market—Number of Sales 8
Off Market —Average Sale Price $598,375
FARMS
Number Sold in 2016 19
Number Sold in 2015 16
Change 19%
Minimum Sale Price $270,869
Median Sale Price $1,585,500
Average Sale Price $3,020,335
Maximum Sale Price $10,957,000
Change in Median Price (Y-o-Y) -15%
Average Square Feet —
Average Price/Sq. Ft. —
Average Days on Market 251
Off Market—Number of Sales 1
Off Market—Average Sale Price $3,750,000
CONDOS
Number Sold in 2016 148 Number Sold in 2015 138 Change 7%Minimum Sale Price $246,000Median Sale Price $417,500Average Sale Price $472,504Maximum Sale Price $1,055,000Change in Median Price (Y-o-Y) 7%Average Square Feet 1,303
Average Price/Sq. Ft. $362
Average Days on Market 79
Off Market—Number of Sales 37
Off Market—Average Sale Price $1,447,241
NA PA COUNT Y 2016 OV ERV IEW
40 | 2017 Market Report, 2016 Data 2017 Market Report, 2016 Data | 41
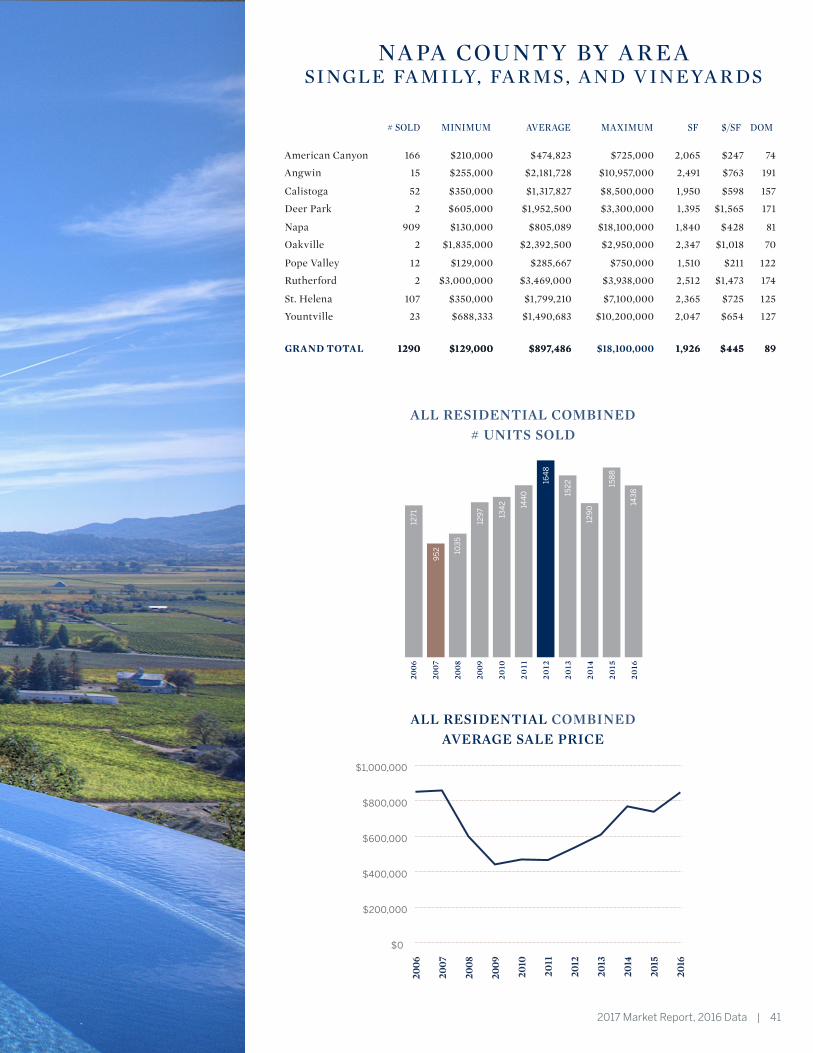
American Canyon 166 $210,000 $474,823 $725,000 2,065 $247 74
Angwin 15 $255,000 $2,181,728 $10,957,000 2,491 $763 191
Calistoga 52 $350,000 $1,317,827 $8,500,000 1,950 $598 157
Deer Park 2 $605,000 $1,952,500 $3,300,000 1,395 $1,565 171
Napa 909 $130,000 $805,089 $18,100,000 1,840 $428 81
Oakville 2 $1,835,000 $2,392,500 $2,950,000 2,347 $1,018 70
Pope Valley 12 $129,000 $285,667 $750,000 1,510 $211 122
Rutherford 2 $3,000,000 $3,469,000 $3,938,000 2,512 $1,473 174
St. Helena 107 $350,000 $1,799,210 $7,100,000 2,365 $725 125
Yountville 23 $688,333 $1,490,683 $10,200,000 2,047 $654 127
GRAND TOTAL 1290 $129,000 $897,486 1,926 $445 89 1290 $129,000 $897,486 $18,100,000 1,926 $445 89
# SOLD MINIMUM AVERAGE MAXIMUM SF $/SF DOM
ALL RESIDENTIAL COMBINEDAVERAGE SALE PRICE
ALL RESIDENTIAL COMBINED# UNITS SOLD
$0
$200,000
$400,000
$600,000
$800,000
$1,000,000
2006
2007
2008
2009
2010
2011
2012
2013
2014
2015
2016
143
8
1271
158
8
129
0
152
2164
8
144
0
134
2
129
7
103
5
95
2
2006
2007
2008
2009
2010
2011
2012
2013
2014
2015
2016
NA PA COUNT Y BY A R E A SINGLE FA MILY, FA R MS, A ND V INEYA R DS
42 | 2017 Market Report, 2016 Data 2017 Market Report, 2016 Data | 43
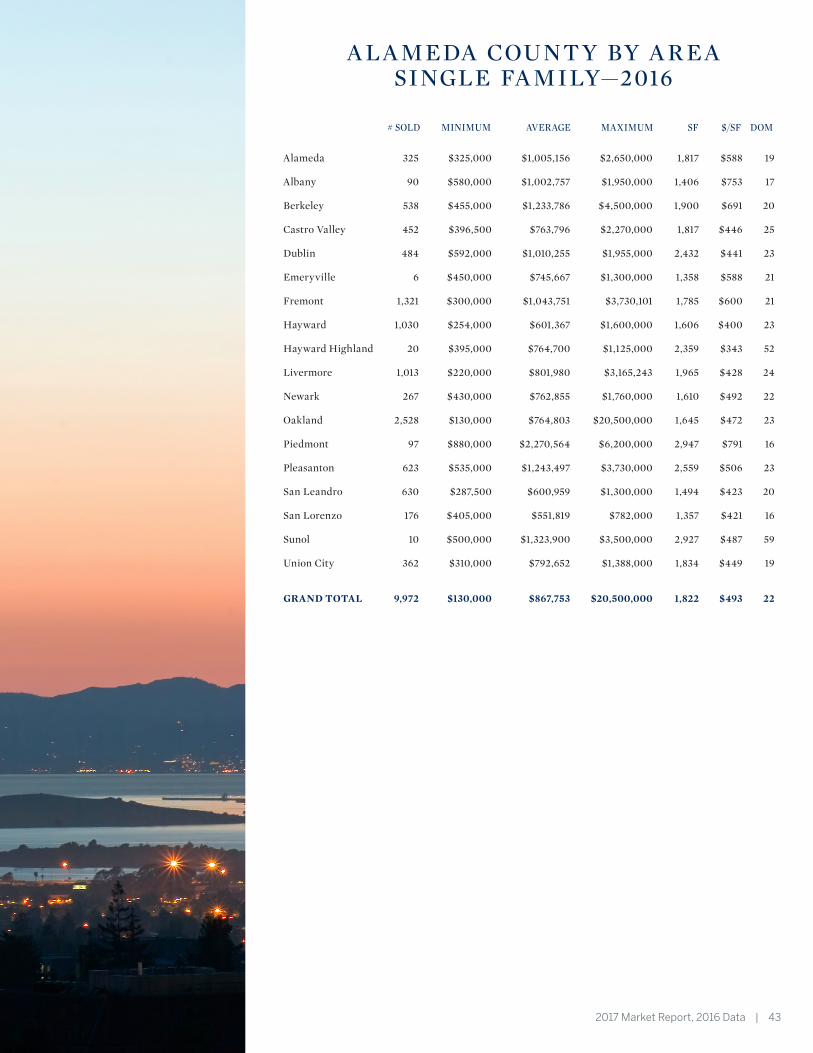
SINGLE FAMILY HOMES
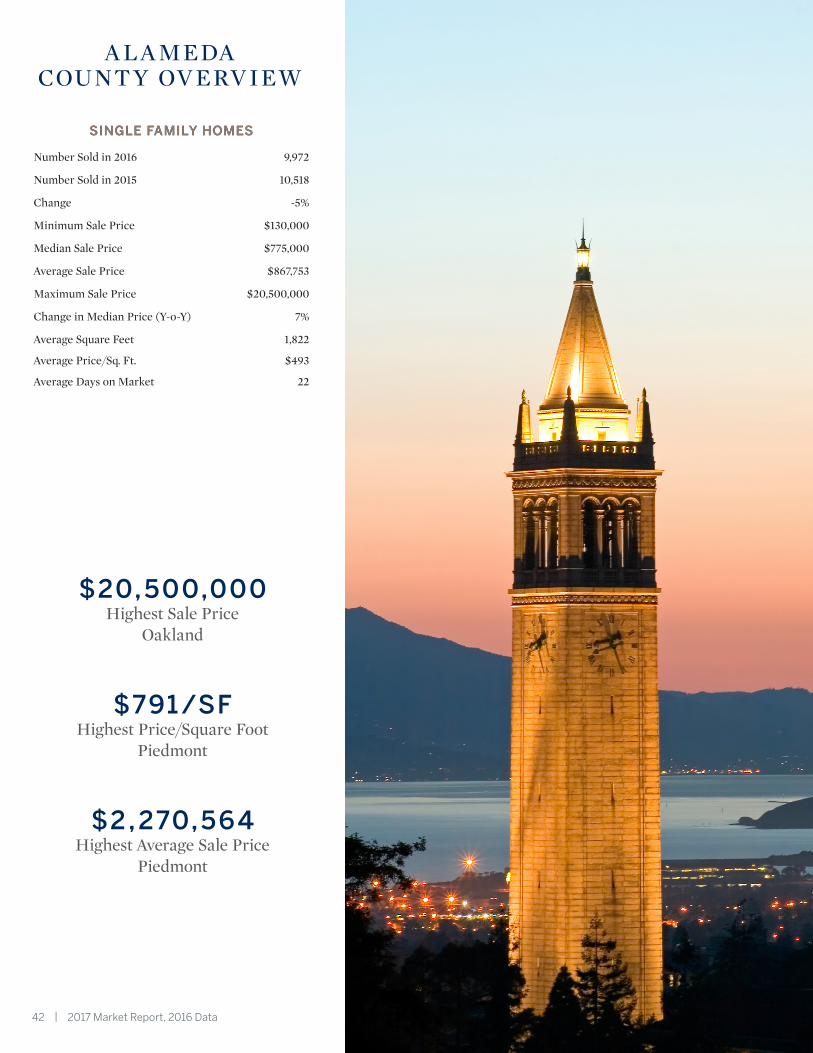
A L A MEDACOUNT Y OV ERV IEW
SINGLE FAMILY HOMES
Number Sold in 2016 9,972
Number Sold in 2015 10,518
Change -5%
Minimum Sale Price $130,000
Median Sale Price $775,000
Average Sale Price $867,753
Maximum Sale Price $20,500,000
Change in Median Price (Y-o-Y) 7%
Average Square Feet 1,822
Average Price/Sq. Ft. $493
Average Days on Market 22
$20,500,000Highest Sale Price
Oakland
$791/SFHighest Price/Square Foot
Piedmont
$2,270,564Highest Average Sale Price
Piedmont
42 | 2017 Market Report, 2016 Data 2017 Market Report, 2016 Data | 43
Alameda 325 $325,000 $1,005,156 $2,650,000 1,817 $588 19
Albany 90 $580,000 $1,002,757 $1,950,000 1,406 $753 17
Berkeley 538 $455,000 $1,233,786 $4,500,000 1,900 $691 20
Castro Valley 452 $396,500 $763,796 $2,270,000 1,817 $446 25
Dublin 484 $592,000 $1,010,255 $1,955,000 2,432 $441 23
Emeryville 6 $450,000 $745,667 $1,300,000 1,358 $588 21
Fremont 1,321 $300,000 $1,043,751 $3,730,101 1,785 $600 21
Hayward 1,030 $254,000 $601,367 $1,600,000 1,606 $400 23
Hayward Highland 20 $395,000 $764,700 $1,125,000 2,359 $343 52
Livermore 1,013 $220,000 $801,980 $3,165,243 1,965 $428 24
Newark 267 $430,000 $762,855 $1,760,000 1,610 $492 22
Oakland 2,528 $130,000 $764,803 $20,500,000 1,645 $472 23
Piedmont 97 $880,000 $2,270,564 $6,200,000 2,947 $791 16
Pleasanton 623 $535,000 $1,243,497 $3,730,000 2,559 $506 23
San Leandro 630 $287,500 $600,959 $1,300,000 1,494 $423 20
San Lorenzo 176 $405,000 $551,819 $782,000 1,357 $421 16
Sunol 10 $500,000 $1,323,900 $3,500,000 2,927 $487 59
Union City 362 $310,000 $792,652 $1,388,000 1,834 $449 19
GRAND TOTAL 9,972 $130,000 $867,753 $20,500,000 1,822 $493 22
# SOLD MINIMUM AVERAGE MAXIMUM SF $/SF DOM
A L A MEDA COUNT Y BY A R E A SINGLE FA MILY—2016
44 | 2017 Market Report, 2016 Data 2017 Market Report, 2016 Data | 45
SINGLE FAMILY HOMES
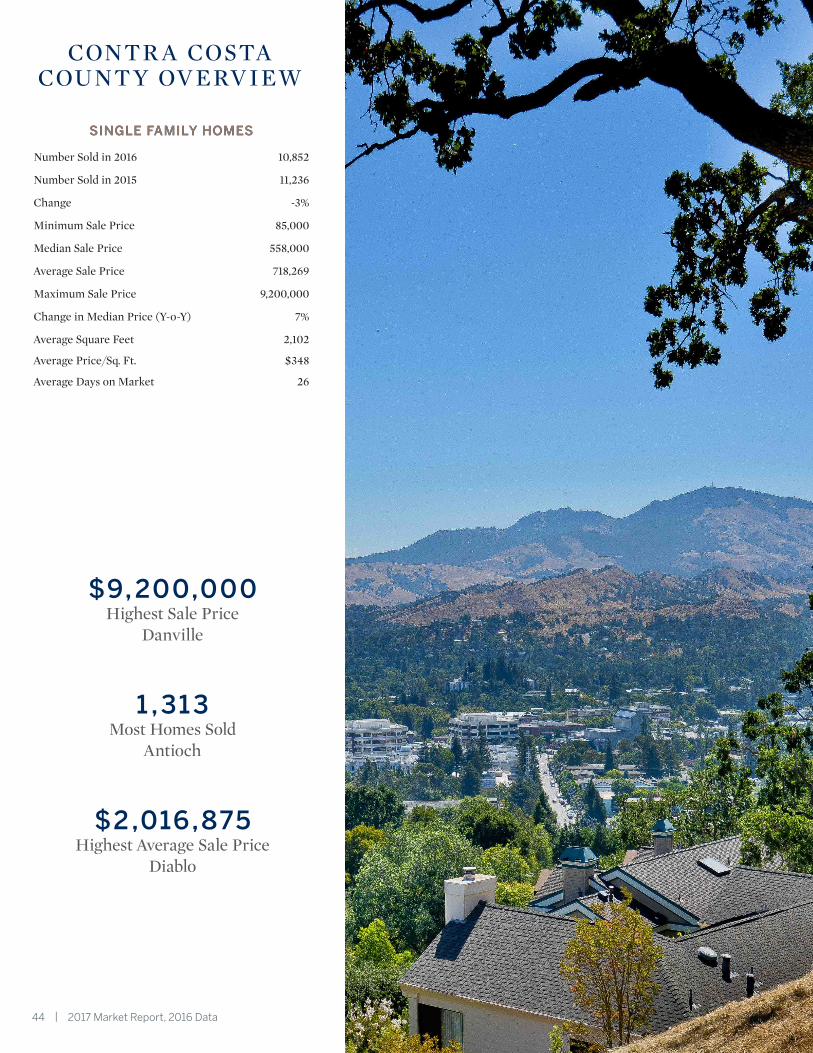
CONTR A COSTACOUNT Y OV ERV IEW
SINGLE FAMILY HOMES
Number Sold in 2016 10,852
Number Sold in 2015 11,236
Change -3%
Minimum Sale Price 85,000
Median Sale Price 558,000
Average Sale Price 718,269
Maximum Sale Price 9,200,000
Change in Median Price (Y-o-Y) 7%
Average Square Feet 2,102
Average Price/Sq. Ft. $348
Average Days on Market 26
$9,200,000Highest Sale Price
Danville
1 ,313Most Homes Sold
Antioch
$2,016,875Highest Average Sale Price
Diablo

44 | 2017 Market Report, 2016 Data 2017 Market Report, 2016 Data | 45
Alamo 201 $963,500 $1,850,676 $5,775,000 3,682 $522 41
Antioch 1,313 $120,000 $381,073 $744,500 1,906 $212 20
Bay Point 154 $150,000 $364,888 $710,000 1,514 $253 22
Bethel Island 27 $142,000 $363,259 $650,000 1,445 $276 64
Brentwood 1,031 $220,000 $552,466 $1,199,000 2,449 $236 32
Byron 10 $179,000 $881,695 $5,000,000 3,547 $237 41
Canyon 1 $744,000 $744,000 $744,000 1,323 $562 -
Clayton 129 $350,000 $774,557 $1,299,000 2,227 $358 27
Concord 1,137 $275,500 $574,850 $3,500,000 1,697 $354 24
Crockett 31 $292,500 $464,642 $609,000 1,565 $309 35
Danville 728 $710,000 $1,363,998 $9,200,000 2,970 $472 31
Diablo 16 $1,200,000 $2,016,875 $3,375,000 3,611 $584 43
Discovery Bay 308 $324,900 $598,598 $2,750,000 2,529 $245 44
El Cerrito 209 $393,500 $822,983 $1,500,000 1,685 $537 23
El Sobrante 141 $270,000 $513,191 $919,000 1,754 $321 34
Hercules 168 $322,500 $592,488 $1,235,000 2,107 $290 30
Kensington 49 $578,000 $1,087,806 $1,850,000 1,781 $646 18
Knightsen 2 $810,000 $889,500 $969,000 2,115 $420 91
Lafayette 263 $635,000 $1,506,811 $3,900,000 2,638 $589 29
Martinez 459 $250,000 $590,411 $1,775,000 1,693 $363 28
Moraga 107 $685,000 $1,277,116 $2,254,000 2,351 $558 26
Oakley 600 $143,750 $422,408 $870,000 2,019 $224 21
Orinda 229 $750,000 $1,577,527 $4,650,000 2,712 $594 23
Pacheco 18 $350,000 $509,370 $655,000 1,513 $348 25
Pinole 159 $286,800 $504,982 $890,000 1,604 $325 24
Pittsburg 702 $150,000 $432,464 $819,030 1,959 $230 25
Pleasant Hill 290 $375,000 $735,816 $1,950,000 1,721 $442 17
Point Richmond 7 $590,000 $834,571 $1,350,000 1,951 $453 22
Port Costa 6 $295,000 $414,667 $533,000 1,288 $347 54
Richmond 776 $85,000 $451,416 $1,275,000 1,553 $336 26
Rodeo 63 $231,000 $422,464 $550,000 1,492 $298 33
San Pablo 225 $97,100 $383,718 $720,000 1,200 $330 24
San Ramon 717 $520,000 $1,090,707 $2,375,000 2,525 $447 23
Walnut Creek 576 $500,000 $1,079,745 $3,500,000 2,202 $508 20
GRAND TOTAL 10,852 $85,000 $718,269 $9,200,000 2,102 $348 26
# SOLD MINIMUM AVERAGE MAXIMUM SF $/SF DOM
CONTR A COSTA COUNT Y BY A R E A SINGLE FA MILY HOMES
46 | 2017 Market Report, 2016 Data 2017 Market Report, 2016 Data | 47
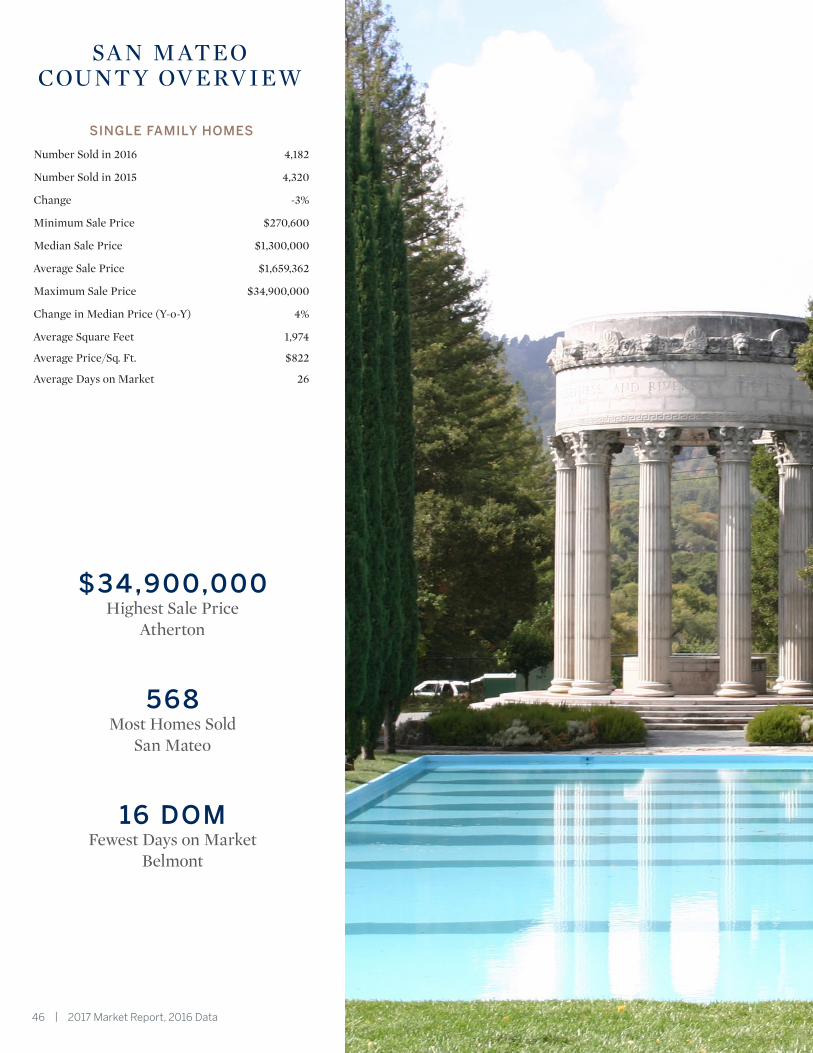
SINGLE FAMILY HOMES
Number Sold in 2016 4,182
Number Sold in 2015 4,320
Change -3%
Minimum Sale Price $270,600
Median Sale Price $1,300,000
Average Sale Price $1,659,362
Maximum Sale Price $34,900,000
Change in Median Price (Y-o-Y) 4%
Average Square Feet 1,974
Average Price/Sq. Ft. $822
Average Days on Market 26
SA N M ATEOCOUNT Y OV ERV IEW
$34,900,000Highest Sale Price
Atherton
568Most Homes Sold
San Mateo
16 DOMFewest Days on Market
Belmont

46 | 2017 Market Report, 2016 Data 2017 Market Report, 2016 Data | 47
Atherton 70 $1,670,000 $8,276,192 $34,900,000 5,750 $1,460 73
Belmont 195 $935,000 $1,541,241 $2,900,000 1,850 $872 16
Brisbane 38 $430,000 $1,021,468 $1,875,000 1,808 $634 47
Burlingame 168 $1,210,000 $2,159,940 $4,588,000 2,252 $1,004 19
Colma 2 $770,000 $785,000 $800,000 1,415 $560 18
Daly City 331 $492,000 $863,550 $1,640,000 1,531 $595 22
East Palo Alto 126 $485,000 $806,433 $2,780,000 1,395 $617 25
El Granada 53 $710,000 $1,095,580 $2,300,000 2,079 $559 27
Foster City 100 $888,000 $1,652,093 $3,008,500 2,058 $813 21
Half Moon Bay 115 $708,000 $1,255,140 $2,700,000 2,410 $550 50
Hillsborough 113 $2,200,000 $4,474,333 $13,150,000 4,284 $1,052 44
La Honda 19 $270,600 $758,595 $2,200,000 1,457 $551 106
Menlo Park 299 $512,000 $2,383,950 $7,750,000 2,124 $1,143 25
Millbrae 132 $753,744 $1,537,148 $2,928,000 1,877 $848 24
Montara 27 $665,000 $1,204,942 $3,450,000 2,072 $645 36
Moss Beach 25 $749,000 $1,135,400 $2,498,000 2,038 $613 35
Pacifica 260 $550,000 $947,205 $2,200,000 1,588 $641 23
Pescadero 9 $390,000 $1,828,222 $6,875,000 2,235 $690 90
Portola Valley 63 $950,000 $3,023,225 $13,297,500 2,911 $1,051 33
Redwood City 566 $345,000 $1,457,113 $5,575,000 1,782 $855 24
Redwood Shores 38 $1,020,000 $1,679,375 $2,875,000 1,968 $874 23
San Bruno 234 $510,000 $956,607 $1,615,000 1,471 $682 22
San Carlos 264 $820,000 $1,797,213 $9,800,000 2,007 $935 18
San Gregorio 2 $1,840,000 $1,920,000 $2,000,000 2,050 $1,268 65
San Mateo 568 $610,000 $1,406,353 $4,500,000 1,698 $846 19
S. San Francisco 292 $520,000 $901,299 $1,926,600 1,531 $623 21
Woodside 73 $375,000 $4,046,024 $22,000,000 3,756 $1,076 74
GRAND TOTAL 4,182 $270,600 $1,659,362 $34,900,000 1,974 $822 26
# SOLD MINIMUM AVERAGE MAXIMUM SF $/SF DOM
SA N M ATEO COUNT Y BY A R E A SINGLE FA MILY HOMES
48 | 2017 Market Report, 2016 Data 2017 Market Report, 2016 Data | 49
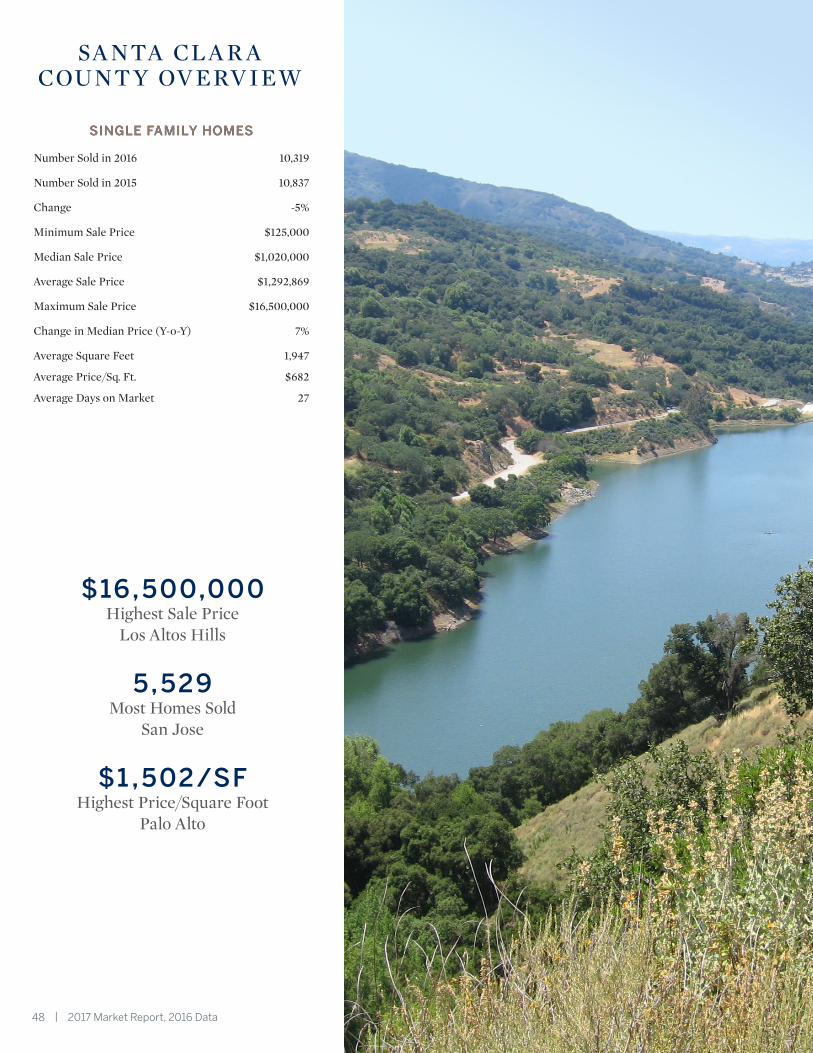
SINGLE FAMILY HOMES
SA NTA CL A R ACOUNT Y OV ERV IEW
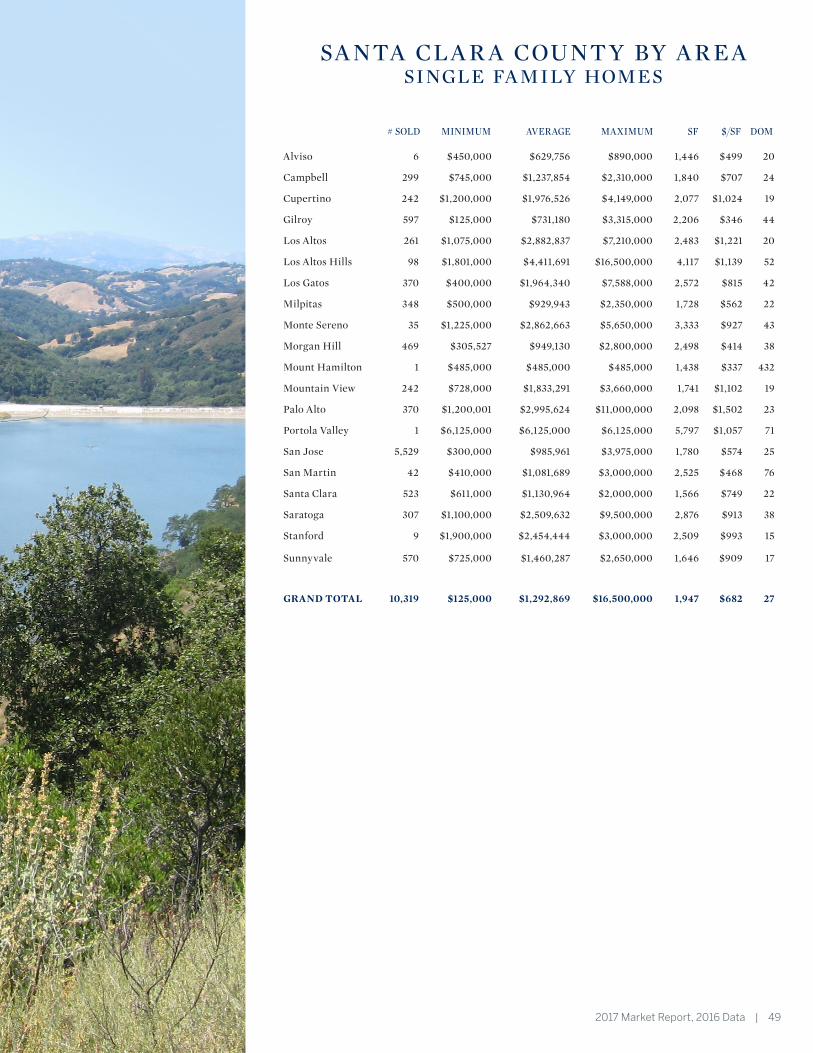
SINGLE FAMILY HOMES
Number Sold in 2016 10,319
Number Sold in 2015 10,837
Change -5%
Minimum Sale Price $125,000
Median Sale Price $1,020,000
Average Sale Price $1,292,869
Maximum Sale Price $16,500,000
Change in Median Price (Y-o-Y) 7%
Average Square Feet 1,947
Average Price/Sq. Ft. $682
Average Days on Market 27
$16,500,000Highest Sale Price
Los Altos Hills
5,529Most Homes Sold
San Jose
$1 ,502/SFHighest Price/Square Foot
Palo Alto
48 | 2017 Market Report, 2016 Data 2017 Market Report, 2016 Data | 49
Alviso 6 $450,000 $629,756 $890,000 1,446 $499 20
Campbell 299 $745,000 $1,237,854 $2,310,000 1,840 $707 24
Cupertino 242 $1,200,000 $1,976,526 $4,149,000 2,077 $1,024 19
Gilroy 597 $125,000 $731,180 $3,315,000 2,206 $346 44
Los Altos 261 $1,075,000 $2,882,837 $7,210,000 2,483 $1,221 20
Los Altos Hills 98 $1,801,000 $4,411,691 $16,500,000 4,117 $1,139 52
Los Gatos 370 $400,000 $1,964,340 $7,588,000 2,572 $815 42
Milpitas 348 $500,000 $929,943 $2,350,000 1,728 $562 22
Monte Sereno 35 $1,225,000 $2,862,663 $5,650,000 3,333 $927 43
Morgan Hill 469 $305,527 $949,130 $2,800,000 2,498 $414 38
Mount Hamilton 1 $485,000 $485,000 $485,000 1,438 $337 432
Mountain View 242 $728,000 $1,833,291 $3,660,000 1,741 $1,102 19
Palo Alto 370 $1,200,001 $2,995,624 $11,000,000 2,098 $1,502 23
Portola Valley 1 $6,125,000 $6,125,000 $6,125,000 5,797 $1,057 71
San Jose 5,529 $300,000 $985,961 $3,975,000 1,780 $574 25
San Martin 42 $410,000 $1,081,689 $3,000,000 2,525 $468 76
Santa Clara 523 $611,000 $1,130,964 $2,000,000 1,566 $749 22
Saratoga 307 $1,100,000 $2,509,632 $9,500,000 2,876 $913 38
Stanford 9 $1,900,000 $2,454,444 $3,000,000 2,509 $993 15
Sunnyvale 570 $725,000 $1,460,287 $2,650,000 1,646 $909 17
GRAND TOTAL 10,319 $125,000 $1,292,869 $16,500,000 1,947 $682 27
# SOLD MINIMUM AVERAGE MAXIMUM SF $/SF DOM
SA NTA CL A R A COUNT Y BY A R E A SINGLE FA MILY HOMES
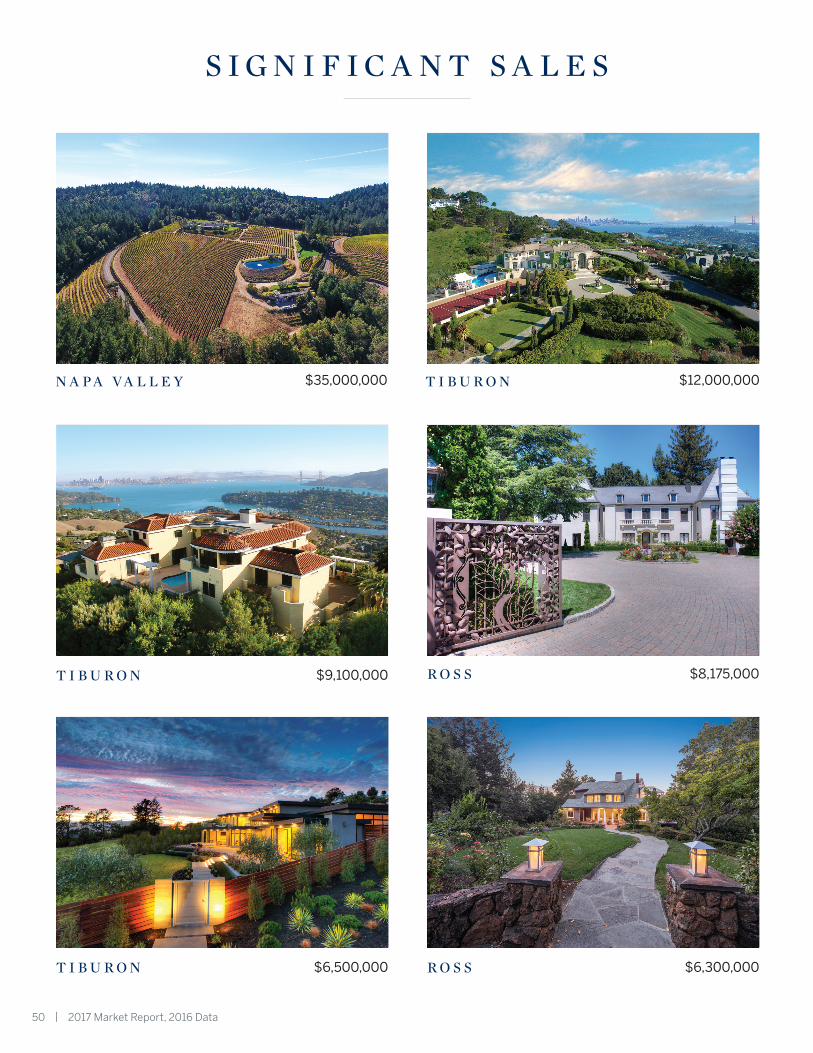
50 | 2017 Market Report, 2016 Data 2017 Market Report, 2016 Data | 51
$35,000,000N A P A VA L L E Y
$9,100,000T I B U R O N
$6,500,000T I B U R O N
$12,000,000T I B U R O N
$8,175,000R O S S
$6,300,000R O S S
S I G N I F I C A N T S A L E S
50 | 2017 Market Report, 2016 Data 2017 Market Report, 2016 Data | 51
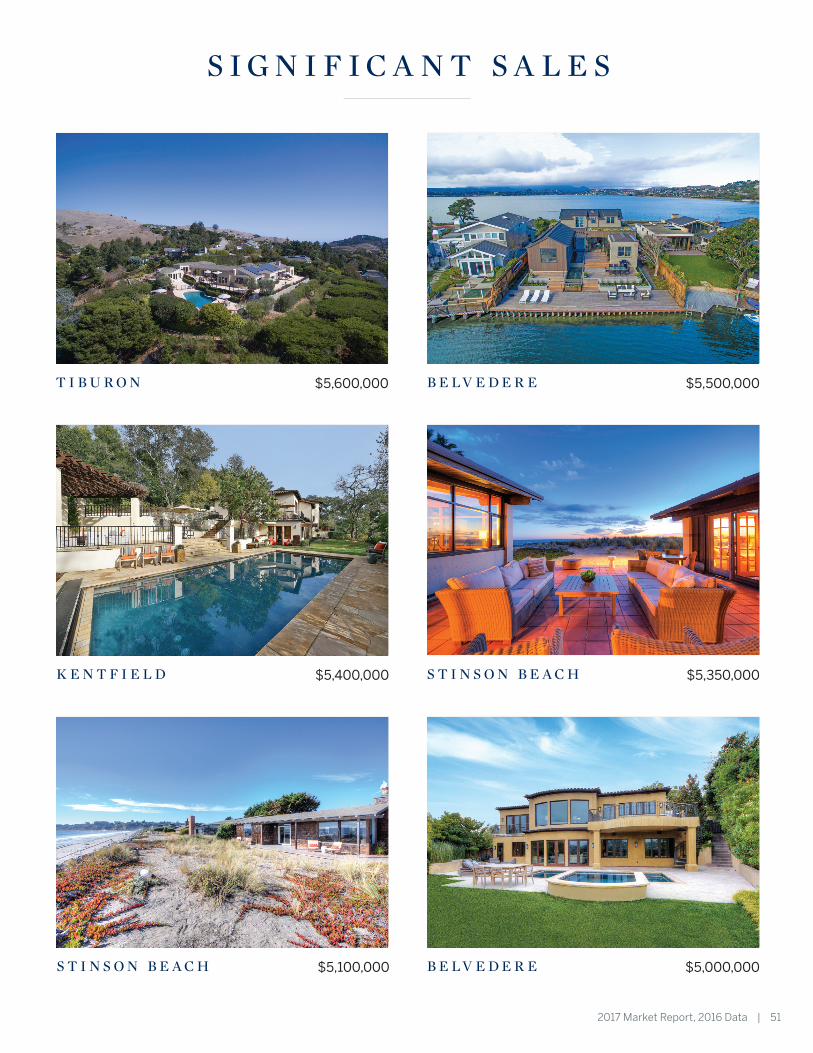
$5,600,000T I B U R O N
$5,350,000S T I N S O N B E A C H
$5,500,000B E LV E D E R E
$5,400,000K E N T F I E L D
$5,100,000S T I N S O N B E A C H $5,000,000B E LV E D E R E
S I G N I F I C A N T S A L E S

52 | 2017 Market Report, 2016 Data 2017 Market Report, 2016 Data | 53
$4,750,000K E N T F I E L D
$3,750,000S A N R A F A E L
$3,400,000S A N R A F A E L
$4,255,000S A N R A F A E L
$3,675,000M I L L VA L L E Y
$2,950,000S T . H E L E N A
S I G N I F I C A N T S A L E S
52 | 2017 Market Report, 2016 Data 2017 Market Report, 2016 Data | 53
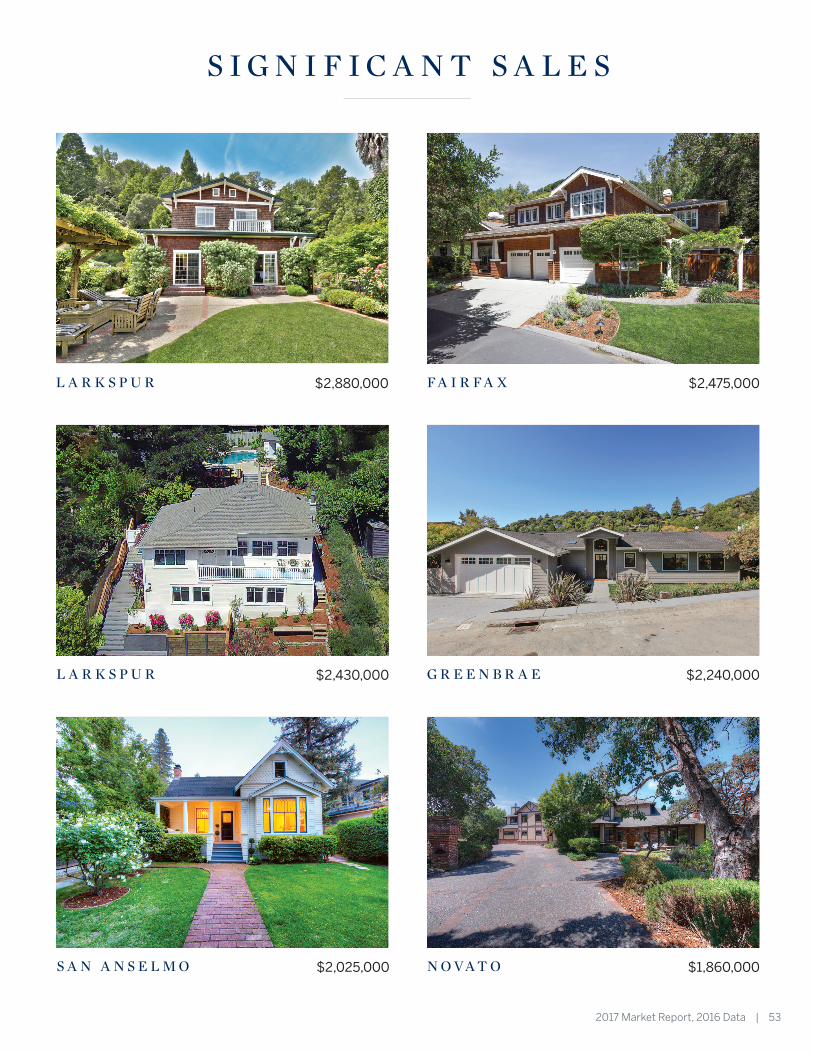
$2,880,000L A R K S P U R
$2,240,000G R E E N B R A E
$2,475,000F A I R F A X
$2,430,000L A R K S P U R
$2,025,000S A N A N S E L M O $1,860,000N O VA T O
S I G N I F I C A N T S A L E S

54 | 2017 Market Report, 2016 Data 2017 Market Report, 2016 Data | 55
HEIDI PAYCOO/General Manager
[email protected] 415.384.4008
MICHAEL COHENVP of Sales
DAVID ELGORTVP of Sales, Director of Risk Management
415.384.3422
FRED ANGELIVP of Sales & Risk Management
415.528.5088
PENELOPE HUANGVP of Sales
650.281.8028
OUR MANAGEMENT TEAM

54 | 2017 Market Report, 2016 Data 2017 Market Report, 2016 Data | 55
Novato Office
438 Ignacio Blvd.
Novato, CA 94949
415.883.2900
Southern Marin Office
100 Tiburon Blvd.
Mill Valley, CA 94941
415.381.7300
Mill Valley Office
78 E. Blithedale Ave.
Mill Valley, CA 94941
415.380.4300
San Rafael Office
902 Irwin St.
San Rafael, CA 94901
415.456.1200
Stinson Beach Office
3605 Shoreline Hwy. | Box 66
Stinson Beach CA 94970
415.868.9200
Ross Valley Office
189 Sir Francis Drake Blvd.
Greenbrae, CA 94904
415.461.7200
Sausalito Office
211 Second St.
Sausalito, CA 94965
415.331.9000
Drakes Landing Office
500 Drakes Landing Rd.
Greenbrae, CA 94904
415.464.9300
Palo Alto Office
728 Emerson St.
Palo Alto, CA 94301
650.644.3474
Belvedere - Tiburon Office
10 Beach Rd.
Tiburon, CA 94920
415.435.0700
Menlo Park Office
640 Oak Grove
Menlo Park, CA 94025
650.847.1141
OUR MARIN OFFICES
OUR SILICON VALLEY OFFICES
56 | 2017 Market Report, 2016 Data 2017 Market Report, 2016 Data | PB
GOLDENGATESIR.COM
C O N N E C T I N G T O S I L IC O N VA L L E Y A N D G L O B A L BU Y E R S
VIA PARTNERSHIPS WITH THE WORLD’S
LEADING PUBLICATIONS AND LUXURY BRANDS
S O T H E B Y ’ S I N T E R N AT IO N A L R E A LT Y ® I S A R E G I S T E R E D T R A D E M A R K L IC E N S E D T O S O T H E B Y ’ S I N T E R N AT IO N A L R E A LT Y A F F I L I AT E S L L C . E AC H O F F IC E I S I N D E P E N D E N T LY OW N E D A N D O P E R AT E D .
Decker Bullock Sotheby’s International Realty
Unifies Brand in 2017
Lorem ipsum