A versatile vane-shear apparatus.
74
A VERSATILE VANE-SHEAR APPARATUS Edward M. Minugh
Transcript of A versatile vane-shear apparatus.

A VERSATILE VANE-SHEAR APPARATUS
Edward M. Minugh

LIBRARYNAVAL POSTGRADUATE SCHOOEMONTEREY, CALIF. 93940

United StatesNaval Postgraduate School
THESISA VERSATILE VANE -SHEAR APPARATUS
by
Edward M. Minugh
April 1970
Tklt> document kaub been approved ^on public kc-
lccu>t and t>aJL<L; <Ltt> dUViibuXAjon -1& unUmitcd.


A Versatile Vane-Shear Apparatus
by
Edward M„ MinughLieutenant Commander, United States NavyB.S., University of California, 1958
Submitted in partial fulfillment of the
requirements for the degree of
MASTER OF SCIENCE IN OCEANOGRAPHY
from the
NAVAL POSTGRADUATE SCHOOLApril 1970
\c o L^
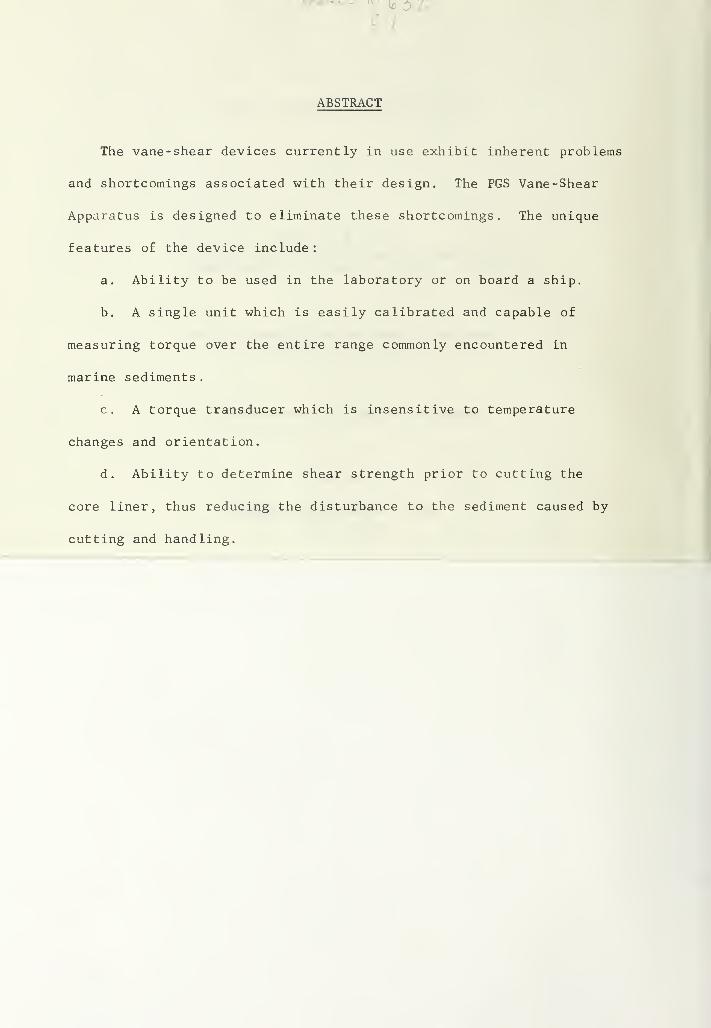
ABSTRACT
The vane-shear devices currently in use exhibit inherent problems
and shortcomings associated with their design. The PGS Vane-Shear
Apparatus is designed to eliminate these shortcomings. The unique
features of the device include:
a. Ability to be used in the laboratory or on board a ship.
b. A single unit which is easily calibrated and capable of
measuring torque over the entire range commonly encountered in
marine sediments
.
c. A torque transducer which is insensitive to temperature
changes and orientation.
d. Ability to determine shear strength prior to cutting the
core liner, thus reducing the disturbance to the sediment caused by
cutting and handling.
LIBRARYNAVAL POSTGRADUATE SCffOOBMONTEREY, CALIF. 93940
TABLE OF CONTENTS
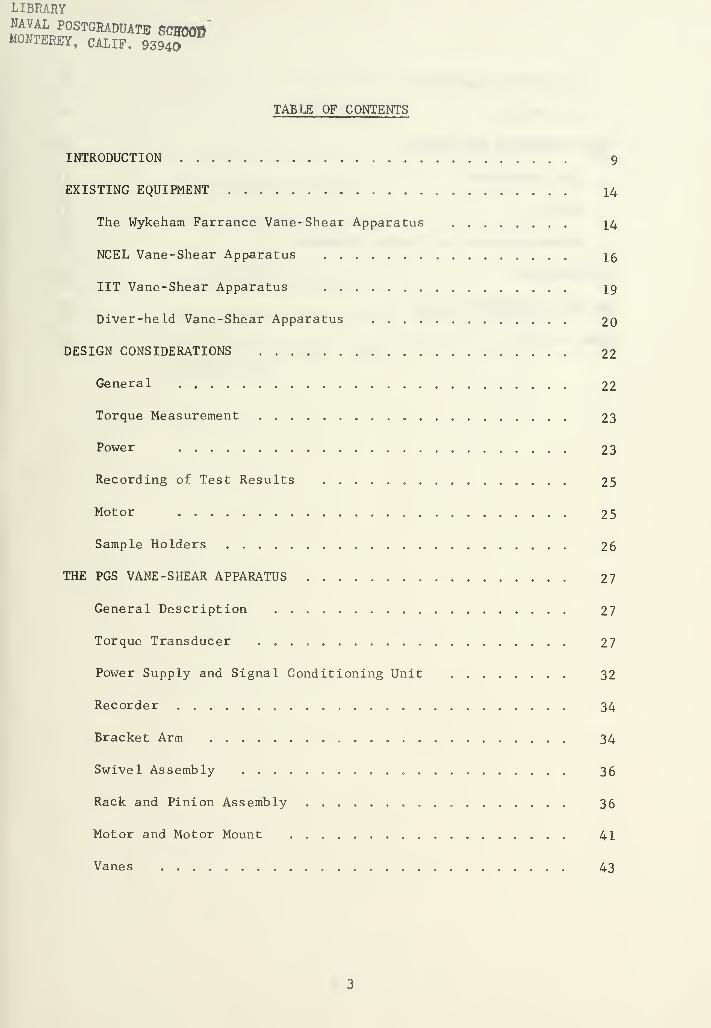
INTRODUCTION 9
EXISTING EQUIPMENT 14
The Wykeham Farrance Vane-Shear Apparatus 14
NCEL Vane-Shear Apparatus ..... 16
IIT Vane-Shear Apparatus 19
Diver-held Vane-Shear Apparatus 20
DESIGN CONSIDERATIONS 22
General 22
Torque Measurement 23
Power . 23
Recording of Test Results ........ 25
Motor 25
Sample Holders 26
THE PGS VANE-SHEAR APPARATUS 27
General Description ..... 27
Torque Transducer .......... 27
Power Supply and Signal Conditioning Unit ........ 32
Recorder ....... 34
Bracket Arm 34
Swivel Assembly ....... 36
Rack and Pinion Assembly 36
Motor and Motor Mount 41
Vanes 43
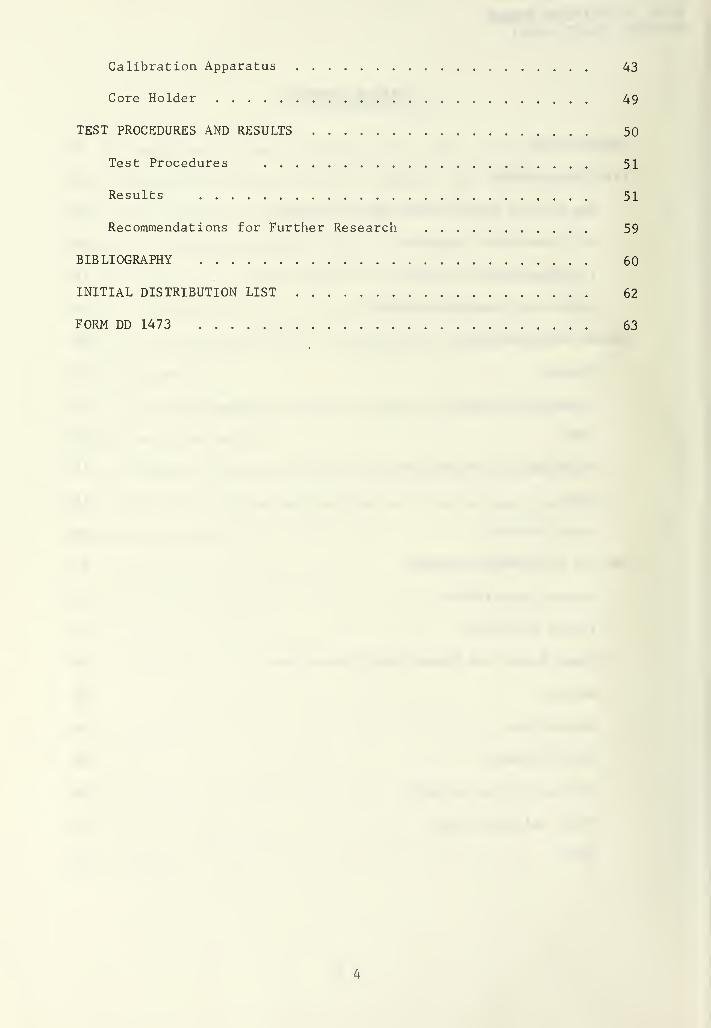
Calibration Apparatus „ 43
Core Holder 49
TEST PROCEDURES AND RESULTS ......... . . 50
Test Procedures 51
Results 51
Recommendations for Further Research 59
BIBLIOGRAPHY 60
INITIAL DISTRIBUTION LIST 62
FORM DD 1473 63
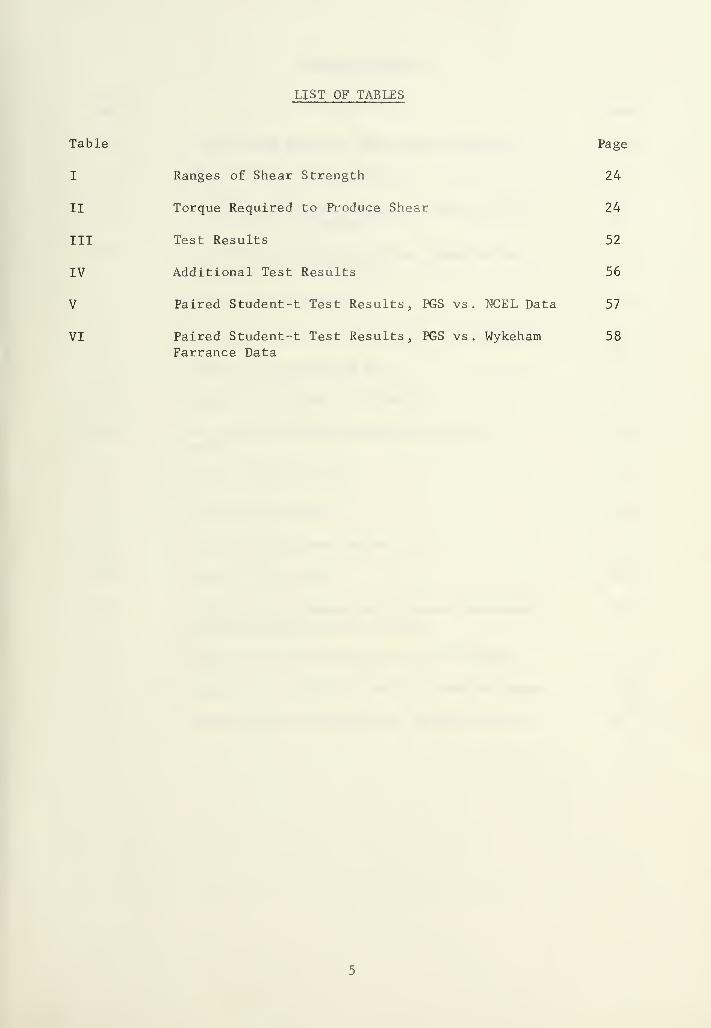
LIST OF TABLES
Table Page
I Ranges of Shear Strength 24
II Torque Required to Produce Shear 24
III Test Results 52
IV Additional Test Results 56
V Paired Student-t Test Results, PCS vs. NCEL Data 57
VI Paired Student-t Test Results, PGS vs. Wykeham 58Farrance Data

LIST OF FIGURES
Figure Page
1 The Wykeham Farrance Vane-Shear Apparatus 15
2 The NCEL Vane-Shear Device 17
3 The PGS Vane-Shear Apparatus, shown in the 28Laboratory Configuration
4 The PGS Vane-Shear Apparatus, shown in the 29Shipboard Configuration
5 The Torque Transducer 31
6 The Power Supply and Signal Conditioning Unit 33
7 Detail of the Bracket Arm 35
-8 Detail of the Swivel Assembly 37
9 The PGS Vane-Shear Apparatus with Core 38Holder
10 Detail of the Pinion 39
11 Detail of the Rack 40
12 Detail of the Motor Mount . 42
13 Detail of the Vanes 44
14 Calibration Apparatus with Torque Transducer 46
and Calibration Wheel Attached
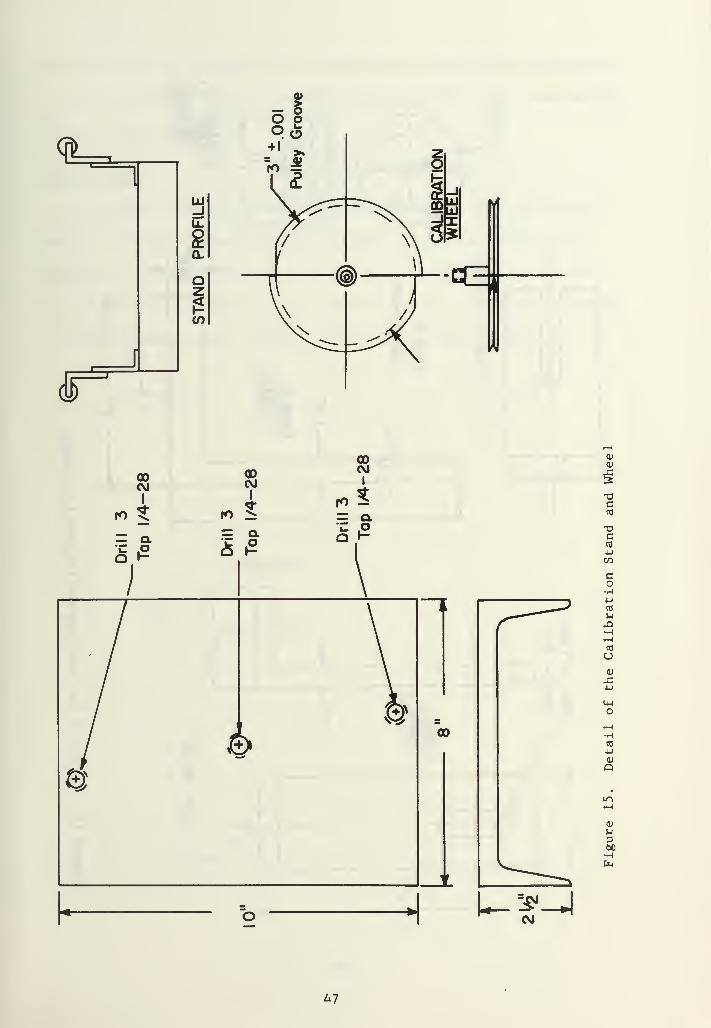
15 Detail of the Calibration Stand and Wheel 47
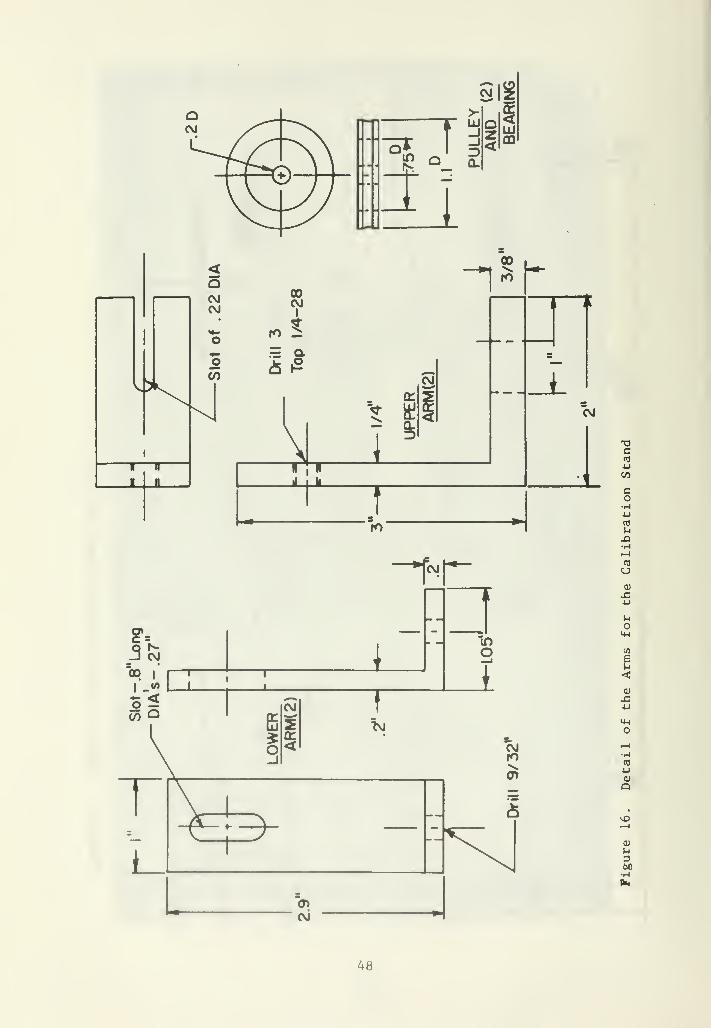
16 Detail of the Arms for the Calibration Stand 48
17 Graph of Shear Strength vs. Length in Core 54

ACKNOWLEDGEMENTS
The author wishes to thank Dr. R. J. Smith for his assistance and
continued encouragement in the development of this device. Appreciation
is also expressed to Mssrs. H. Gill, M. Hironaka, H. Lee, and L. Nunez
of the Naval Civil Engineering Laboratory, Port Hueneme , California for
their assistance and use of equipment during the evaluation of the
apparatus. The author is also grateful for the interest and support
provided by the Naval Facilities Engineering Command. Finally, the
author is indebted to his wife Rose for her continued support and
understanding throughout the entire period of postgraduate studies.
INTRODUCTION
Recent years have seen a growing interest by both private industry
and government agencies in the physical characteristics of the marine
sediments on the continental shelf and the deep sea floor. Extensive
efforts are being expended to determine such factors as:
a. The amount of support sea floor sediments can provide objects
placed on the bottom, such as platforms, instruments, and manned
habitats .
b. The breakout forces required for large-object salvage
operations
.
c. The degree of traf f icability of the sea floor.
d. Ability of slopes on the sea floor to resist sliding.
All of these factors are directly or indirectly related to the
shear strength of the sediment. It can be demonstrated that the shear
strength of a marine sediment can be expressed by Coulomb's formula:
s = c + N tan i>
where s =» total shear strength
c cohesion
N = effective normal stress
(6 = angle of internal friction.
The significance of each of these terms are discussed in the
standard texts on soil mechanics. Fine-grained, saturated marine
sediments stressed without loss of pore water are generally assumed
to behave as if they were cohesive materials without any internal
friction under normal loading. For these conditions the angle of
internal friction will be equal to zero [Keller, 1968]. The shear
strength of saturated marine sediments is therefore sometimes alter-
nately referred to strictly as cohesion. Measurement of the shear
strength of marine sediments may be made by direct shear, triaxial
shear, and unconfined compression tests. These tests require the
sample to be removed from core liners, and the resulting disturbances
may appreciably affect the results of the tests. These shortcomings
can be minimized by applying the vane shear test [Smith, 1962],
All vane shear testing devices currently in use are adaptations
of the vane borer, which was developed simultaneously in Sweden by
John Olsson in 1928 and in Germany as evidenced by a patent in 1929
[Osterberg, 1957]. These devices received little attention until
Cadling and Odenstad [1950] reported results of comprehensive tests
conducted in Sweden on the shear strength of clays. This report
described a method of obtaining shear strength of clays in-situ. The
equipment used by them consisted of four rectangular shaped vanes,
welded at right angles to a rod. The vane assemblage was inserted
into a hole bored into the ground and extensions added to the rod
until the vane reached the bottom. The vane was then driven into
the undisturbed soil below the bore hole and torque applied to the
rod from the surface. This torque was measured by means of a cali-
brated spring. The vane was rotated until the maximum torque was
reached, followed by a decrease to a value which was necessary to
maintain a constant rate of rotation of the vane. The shear strength
of the soil was then determined from the following equation, which was
derived by Cadling and Odenstad:
10

Mmax
s =
^„ ntI D , „ nD2
2 D^
where M s maximum torsional moment required to produce shearIT13.X
D - diameter of the vane
H - height of the vane.
The above equation assumes the surface of rupture is a circular
cylinder surrounding the vane, with the height and diameter of the
cylinder being equal to the dimension of the vane. It is also assumed
the stress distribution at the maximum torsional moment is uniform
across the surface of the cylinder including the end surfaces. The
friction exerted by the soil on the shaft of the vane is considered
negligible. These assumptions are taken to be valid in all vane
shear testing devices currently employed.
Cadling and Odenstad also report that the rate of rotation of the
vane influences the results, with a higher shear strength being associ-
ated with the higher rotation rate. They worked with rotation rates
from 0.1 to 1.0 degrees per second and note that higher rotation
rates may yield shear strengths as much as fifteen percent greater
than the shear strength determinations at the lower rotation rate.
On the assumption that the reported values of shear strength should
correspond to the. most unfavorable case, the rotation rate of 0.1
degrees per second was adopted as standard. Various investigators
have abandoned this "standard" in favor of higher rotation rates.
Morelock [1967] uses a rotation rate of 0.2 degrees per second,
assuming that the resultant increase in shear strength is minimal and
that the higher rate is much more practical when examining large
11
numbers of samples. Bouma, Bryant, and Tieh [1968] have app; sed
the 0.2 degrees per second rotation rate in their studies of tl
tinental shelf of the Gulf of Mexico. Aas [1965] reports fir.,
significant difference in shear strength by using rotation rates from
one to ten revolutions per hour and all intermediate values.
The height/diameter (H/D) ratio of the vanes has been studied
extensively by Cadling and Odenstad [1950], who use an H/D ratio of
two as the standard for their work. Aas [1965] experimented with
various vane shapes to determine whether the H/D ratio significantly
altered the test results, and concluded the results were not appreciably
changed unless the H/D ratio was greater than three. Osterberg [1957]
suggests that to avoid disturbance of the soil to be tested, the area
of the vane should not exceed 10 percent of the area of the circular
section to be sheared.
The vane borer of Cadling and Odenstad was the predecessor to all
vane-shear devices currently used in determination of the shear strength
of marine sediments. While it was designed for testing terrestial soils,
those subsequently developed for testing marine sediments are scaled-
down models of the vane borer. Although the principles rema i same,
the shear strength, torsional moments measured, and the dimensions of
the vanes are several orders of magnitude less when dealing with marine
soils .
The following comparison illustrates the differences between
terrestial and marine soils:
12
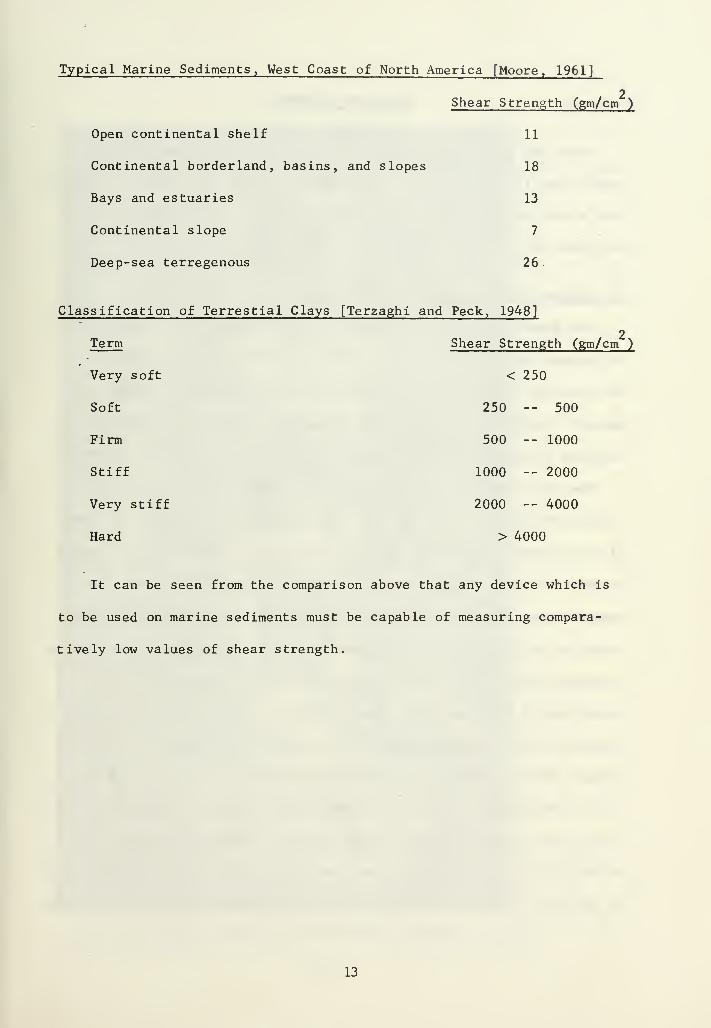
Typical Marine Sediments, West Coast of North America [Moore, 1961]
2Shear Strength (gm/cm )
Open continental shelf 11
Continental borderland, basins, and slopes 18
Bays and estuaries 13
Continental slope 7
Deep-sea terregenous 26
Classification of Terrestial Clays [Terzaghi and Peck, 1948]
2Term Shear Strength (gm/cm )
Very soft < 250
Soft 250 -- 500
Firm 500 -- 1000
Stiff 1000 -- 2000
Very stiff 2000 -- 4000
Hard > 4000
It can be seen from the comparison above that any device which is
to be used on marine sediments must be capable of measuring compara-
tively low values of shear strength.
13

EXISTING EQUIPMENT
There are several variations of vane-shear testing equipment cur-
rently used to determine the shear strength of marine soils. The devices
most widely used or those with particularly interesting features are
mentioned below.
The Wykeham Farrance Vane-Shear Apparatus
The Wykeham Farrance Vane-Shear Apparatus (Figure 1) is manufactured
in England and is in wide use throughout the world. It is available in
two versions: the hand-driven model, in which the vane is rotated by
manually turning a hand crank, or the motor-driven model. Several vane
rotation rates are available, with 6 per minute the standard equipment.
The sample container is secured to the base plate to prevent its
rotation during the test. The vane is lowered into the sample by means
of the top hand crank until the top of the vane is at least 0.75 inches
below the surface of the sample. The torque necessary to shear the
sample is measured by a spring having a linear response to torque. The
spring is calibrated by the manufacturer, who provides the linear spring
constant associated with each spring. Two dials are provided on the
upper part of the apparatus. The outer dial indicates the degrees of
rotation of the vane, while the inner dial shows the degrees of applied
torque. The outer and inner dials are initially set to zero, and the
test is started by turning on the motor or by manually turning the side
hand crank. When the sample shears, the vane rotates at the same speed
as the application of torque. The inner dial will remain on the reading
at the time of shear, while the outer dial continues to rotate until the
14
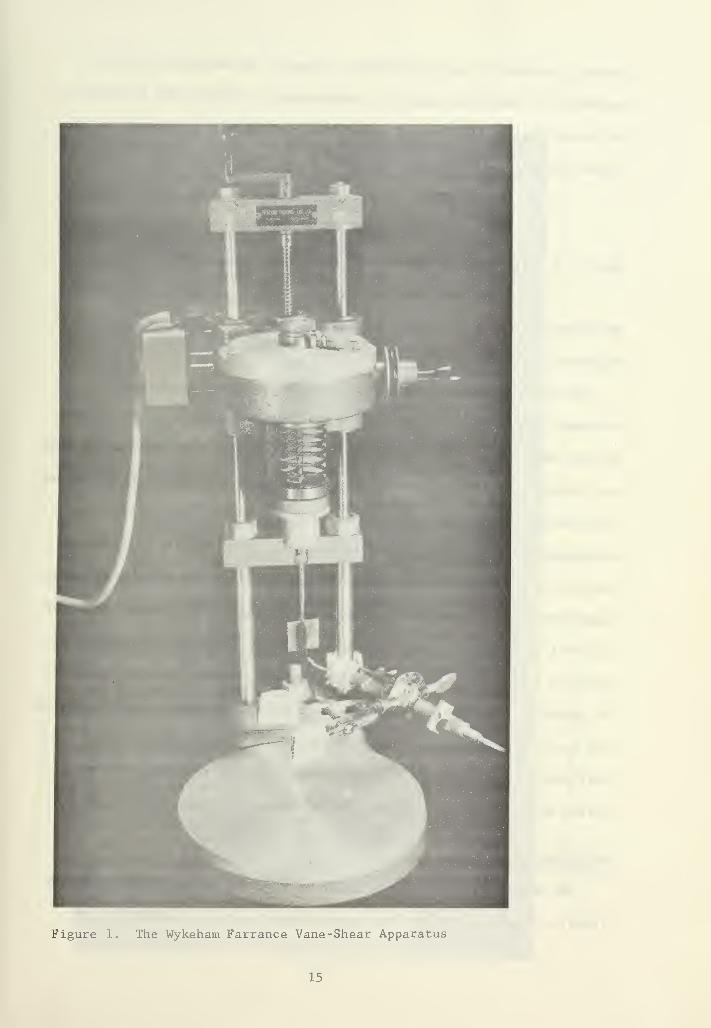
Figure 1. The Wykeham Farrance Vane-Shear Apparatus
15

motor is turned off or the cranking stopped. The amount of torque
necessary to shear the sample is determined by dividing the reading on
the inner dial at the time of shear (applied degrees of torque) by the
spring constant. The shear strength is then determined by:
torques = a
2tt r2
(h + 0.667r)
where h = height of the vane
r = radius of the vane.
According to Richards [1961], a vane rotation of at least 20 degrees is
required for a valid test.
The Wykeham Farrance apparatus apparently yields good results,
although very sensitive springs are required for soft soils which shear
at the very low torque ranges. In addition, the spring calibration must
be checked frequently to ensure the spring has not been stretched beyond
its elastic limit. The principal advantages of the Wykeham Farrance
apparatus are that it is simple to operate, is relatively light-weight,
and can be used aboard ship or in the laboratory. The primary disadvan-
tages are that it does not provide a continuous and permanent record of
the soil shear, and spring calibration must be checked frequently. To
obtain a sequential record of a test, it is necessary for the operator
to record the degrees of applied torque every 2 of vane rotation during
the test. The values must then be plotted, a process which is not
difficult but exceedingly time consuming. In addition, much of the
detail of the shear profile is lost by manual plotting.
NCEL Vane-Shear Apparatus
The NCEL vane-shear device shown in Figure 2 was designed by Smith
[1962] at the Naval Civil Engineering Laboratory, to provide a high
16

O)
o
>
QJ-i
ca
<u
j:
i
c
>
wg
-CH
d60•Hfa
17

degree of sensitivity throughout the range of shear strengths normally
encountered in marine soils, while allowing a continuous and permanent
record of the test. The sample to be tasted need not be removed from
the core liner, as the liner segment containing the soil is fastened to
a disc which is rotated by a motor mounted beneath the base plate. The
vane remains fixed throughout the test while the sample rotates around
the vane. The vane is attached to a shaft, which in turn is guided
through an upper plate by means of a teflon bushing and ball bearings.
The top of the shaft is equipped with cantilevered feeler gauge
stock reeds equipped with SR-4 strain gages. The ends of the reeds
rest against vertical posts attached to the upper plate assembly. As
the sample is rotated, torque is applied to the shaft which in turn
bends the reeds. The strain gages, in turn, measure the distortion
of the reeds which is proportional to the torque developed. Inter-
changeable reeds, having thicknesses of 1/64 and 1/32 in. are provided
to allow for variability in the samples being tested.
Power to the strain gages and the bridge balance unit is provided
by rectified 110 volt a-c source. The imbalance of the bridge caused
by the output of the strain gages is amplified, and the output is fed
to a strip chart recorder. Thus, a permanent record of the entire test
is available.
The apparatus is easily calibrated by use of a . calibration wheel
which is screwed into the shaft. Known weights are passed over a guide
block while attached to notches in the calibration wheel. In this
manner, known torsional moments are utilized to adjust the amplifier
gain to the desired level. Calibration can be accomplished in five
minutes
.
18

The NCEL Vane-Shear Apparatus is restricted to laboratory use only,
and cannot be used aboard ship. The unit must be precisely leveled on
the laboratory work bench to prevent misalignment of the shaft, and
attendant binding in the bushing and ball bearings. Binding occurs if
the shaft is not maintained exactly vertical. The shaft configuration
is such that samples in excess of 3 inches in length cannot be tested.
IIT Vane-Shear Test Apparatus
An interesting apparatus designed to measure vane-shear strength
with the soil sample under high environmental pressures, and patterned
after the NCEL vane-shear device, was developed at the Illinois Institute
of Technology (IIT) Research Institute by Vey and Nelson [1966].
The soil specimen is placed in a 2.5 x 2.0 inch container fitted
with a porous stone at the bottom to provide drainage. The vane,
shaft, and transducer assembly are then mounted to the top cover of
a pressure vessel. The torque transducer consists of a beam rigidly
mounted to the shaft. A rigid post mounted 2.0 inches from the center
of the shaft keeps the beam from rotating, thereby providing the bending
moment to the beam. SR-4 strain gages attached to both sides of the
beam then measure the deflection due to twist from the shaft.
The torque transducer is contained in a plexiglass housing filled
with oil and has a flexible diaphragm cover to equalize the fluid pres-
sure in the housing.
Calibration of the torque transducer while under pressure is
accomplished by mounting a calibration wheel to the shaft. A known
torsional moment is applied to the shaft via the calibration wheel by
means of weights attached to a cable. A small weight is always suspended
19

from the calibration wheel. This ensures that the beam is in contact
with the rigid post support at the start of the test.
The entire vane-shear apparatus, including the soil sample, is
placed in a pressure chamber by securing the top cover to the pressure
vessel. Vane shear tests may be conducted at environmental pressures
from atmospheric to 5000 psi and at temperatures from 1 C to 3 C.
Diver-held Vane-Shear Apparatus
An inexpensive diver-held vane-shear apparatus capable of in-situ
operation in shallow waters has been developed by Dill and Moore [1965].
The device consists of a commercial torque screwdriver with a 3/4 x 3/4
inch vane attached to the shaft. The device is capable of measuring
torques from 0-24 inch -ounces . According to Moore [1962], these
parameters (3/4 in x 3/4 in vane, 0-24 inch-ounces torque) are adequate
for most shear strengths encountered in the upper six inches of marine
sediment
.
The device has proven useful in determining shear strength and
residual strength in and around an active slumping area at the head of
Scripps Submarine Canyon. It has also been used successfully on board
ship to determine shear strength of relatively undisturbed sea-floor
sediments obtained by box samplers.
The primary disadvantage of a device of this nature is that there
is no means of controlling the rate of stress application. In this
instance the diver was instructed to gradually build up torque over a
period of not less than two minutes, until the sediment sheared. It is
difficult, if not impossible, for a diver to duplicate the rate of stress
application. Another disadvantage is that the shear pattern cannot be
20
obtained since no permanent record is made. It may be desirable to
forsake this record for an in-situ test, but for shipboard and laboratory
vane-shear tests, a permanent record is highly desirable.
21
DESIGN CONSIDERATIONS
The following presents some of the more important factors which must
be considered in designing a vane-shear apparatus. These factors
explain, in part, the final design and component selection of the items
that constitute the vane-shear apparatus described in the following
chapter.
General
A vane-shear apparatus should be versatile, performing equally well
aboard a vessel at sea or in the laboratory. In order to meet this
criteria, the device must be capable of being easily assembled and/or
disassembled, portable, preferably light-weight, and with no special
leveling required. At the same time, the individual components must
be sturdy enough to withstand the inevitable jolts incurred during
transportation.
Vane shear tests are generally conducted on soils contained in a
core segment which has been cut from the core liner. It would be more
desirable to conduct vane shear tests on a soil prior to cutting the
core liner into segments in order to minimize disturbance. The vane-
shear test could be run on the uppermost portion of the core. The core
liner could then be cut and the vane-shear test is run on the next
section while still intact with the remainder of the core. This pro-
cedure would minimize disturbance of the sediment sample. When the
core is cut into sections prior to testing, each section is subjected
to two cuttings except for the top and bottom segment of the core.
22

Torque Measurement
The critical component of any vane-shear device is that part which
measures the amount of torque on the vanes at the time the soil shears.
Regardless of the type of device used to measure torque, it must be
capable of measuring the entire range encountered in the determination
of shear strength of marine soils. Table I shows the range of shear
strengths commonly found in marine soils. Table II shows the torque
required to produce the shear strength reported in Table I. Examination
of these tables reveals that by proper choice of the vane size, a device
capable of accurately measuring 1-250 inch-ounces of torque is adequate
except in the most unusual circumstances. Measurements of torque in
the higher ranges present no special difficulty, but a very sensitive
instrument is required to measure torque in the neighborhood of 1
inch-ounce or less. Sensitive, calibrated springs are easily damaged
by straining beyond their elastic limit. The use of electronic,
strain-gage transducers is feasible but presents problems of signal
discrimination over noise at these low torque values.
It is highly desirable to utilize a single unit, rather than inter-
changeable units which cover only discrete segments of the torque
range. Such a single unit eliminates errors in judgment on the
operators part, and thus saves time and produces more accurate results.
Once a sepcific area of a soil sample has been sheared, it is impossible
to obtain an accurate value of shear strength at the same location on a
test re-run.
Power
If electronic devices are to be used in the apparatus, provision
should be made for a regulated power supply. Voltage and frequency
23
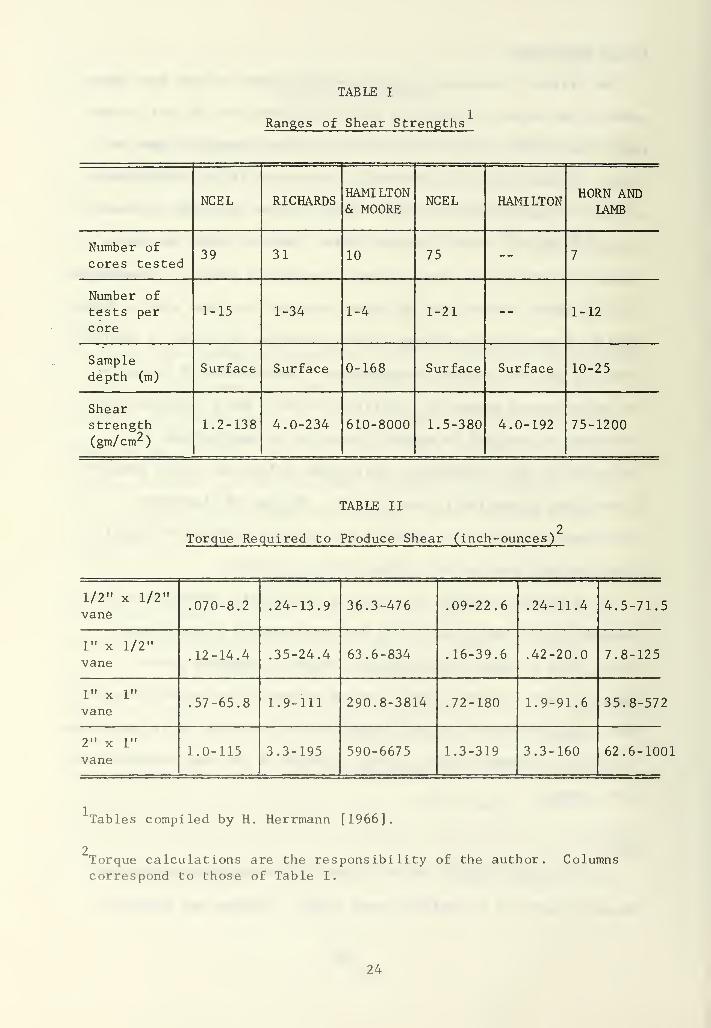
TABLE I
Ranges of Shear Strengths
NCEL RICHARDSHAMILTON& MOORE
NCEL HAMILTONHORN AND
IAMB
Number of
cores tested39 31 10 75 -- 7
Number of
tests per
core
1-15 1-34 1-4 1-21 -- 1-12
Sampledepth (m)
Surface Surface 0-168 Surface Surface 10-25
Shearstrength(gm/cm2 )
1.2-138 4.0-234 610-8000 1.5-380 4.0-192 75-1200
TABLE II
Torque Required to Produce Shear (inch-ounces)'
1/2" x 1/2"
vane.070-8.2 .24-13.9 36.3-476 .09-22.6 .24-11.4 4.5-71.5
1" x 1/2"
vane.12-14.4 .35-24.4 63.6-834 .16-39.6 .42-20.0 7.8-125
1" x 1"
vane.57-65.8 1.9-111 290.8-3814 .72-180 1.9-91.6 35.8-572
2" x 1"
vane1.0-115 3.3-195 590-6675 1.3-319 3.3-160 62.6-100
Tables compiled by H. Herrmann [1966]
'Torque calculations are the responsibility of the authorcorrespond to those of Table I.
Columns
24
surges are common in electrical circuits, both in the laboratory and
aboard ship. Surges of this nature can produce erroneous signals in
sensitive electronic equipment. Whenever possible, circuits provided
with stabilizing transformers should be used. (Such circuits are not
commonly found aboard ship.)
The basic power supply should be 115 volt-60 cycle, enabling the
unit to be used anywhere.
Recording of Test Results
The desirability of a continuous graph-type record of the test has
been emphasized throughout this study. Such a graph provides a shear
profile, which varies with different soil types. These profiles may
be obtained by manually plotting torque versus degrees of vane
rotation at discrete points throughout the test but are demanding
upon the time of the laboratory technicians, especially when a large
number of tests are to be conducted. In addition, minute variations
in the shear profile are missed by incremental plotting.
Motor
The ideal motor for rotating the vanes or the sample is one which is
variable in speed, can provide the necessary torque, and does not require
gear reduction to produce the desired rotation rate. Unfortunately,
such motors are not available. The slow rotation rates commonly
employed (1-2 revolutions per hour), coupled with the torque require-
ments, are too demanding upon the armature of the motor. Consequently,
reduction gears must be relied upon to produce the desired rotation
rate. Every attempt should be made to use precision gearing in order
to eliminate "slop" and the attendant vibrations. Vibrations of this
25

nature can be transmitted through the vanes or sample holder (depending
upon whether the vane or the sample is rotated) to the test specimen,
resulting in undue disturbance.
Variable speed motors should be avoided because of their tendency
to "hunt" under changing torque loads.
Sample Holders
Care must be exercised in the design of sample holders to avoid
stress application to the sample. Compressive forces on the side walls
of the core liner or sample container should be avoided. Such com-
pressive forces result in soil disturbance and erroneous results.
Where possible, the forces necessary to prevent the sample from
rotating during the test should be exerted on the core liner in a
vertical direction.
If the vane-shear tests are to be conducted prior to cutting the
core liner, as explained in the general discussion section of this
chapter, the sample holder should maintain the core as nearly vertical
as possible to prevent excess water drainage and separation of the soil
from the walls of the core liner.
26
THE PGS VANE-SHEAR APPARATUS
The design of the vane-shear device was selected following a review
of the literature, conversations with users of the various existing
vane-shear devices, and correspondence with numerous manufacturers of
component parts.
General Description
The PGS vane-shear apparatus may be configured for laboratory or
shipboard use. The combined weight of all the component parts (less
recorder) in the laboratory configuration shown by Figure 3 is 26 pounds
and the total weight in the shipboard configuration of Figure 4 is
44 pounds
.
The PGS vane-shear apparatus consists of the following components:
1. torque transducer2. power supply and signal conditioning unit3. bracket arm4. swivel assembly5. rack and pinion assembly6. motor and motor mount7. calibration stand and wheel.
All components except the torque transducer, power supply and signal
conditioning unit, and the recorder were constructed by the Machine
Facility at the Naval Postgraduate School during December 1969 and
January 1970. A description of these parts is contained in the fol-
lowing sections.
Torque Transducer
A review of various torque measuring techniques indicated the
desirability of utilizing a torque transducer in this apparatus. This
27

co•H•UCOS-i
3M)•-Imcou
ouJO
o
Mi
o
CO
to
•uCO
U«0aa,
<uCO
<u
JSwa)
Cco
>COOCM
a)
x:H
iMttlM^U.,.
*
CO
a)u
(JO
28

Figure 4. The PGS Vane-Shear Apparatus, shown in the ShipboardConfiguration
29
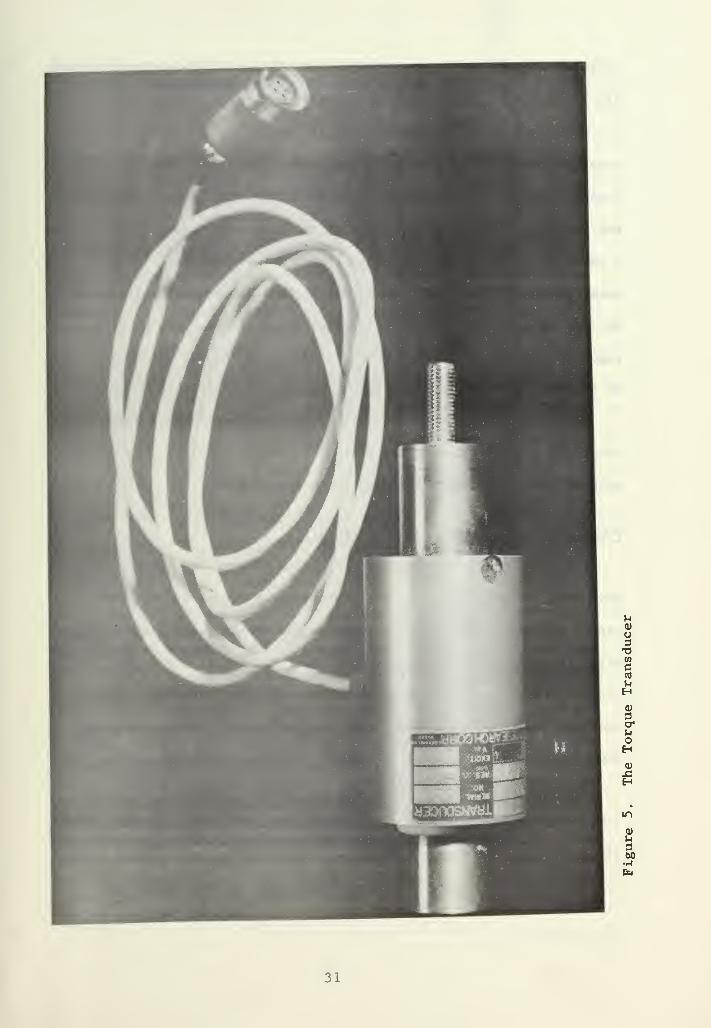
eliminates many of the disadvantages of the calibrated spring. The
torque transducer selected, as shown in Figure 5, is an in-line., semi-
conductor strain gage transducer, Model A44, manufactured by West Coast
Research Corporation of Santa Monica, California. The range of the
transducer is 0-250 inch-ounces, although it may be over-torqued 100
percent without damage. The output of the transducer is .269 millivolts/
volt excitation/inch-ounce, and is linear throughout the entire range.
Accuracy of the torque measurement is + 0.1 percent throughout the
range. The internal resistance of the transducer is 350 ohms. For all
practical purposes, it is insensitive to temperature change with a
temperature response of 0.0045 millivolts/degree Farenheit, and 72 F
being the calibration temperature. The transducer will measure either
clockwise or counterclockwise torque, the polarity of the output signal
indicating the direction.
The semiconductor type transducer was used because of its ability
to discriminate signals over noise in the very low torque ranges. The
use of semiconductors enhances signal discrimination at these low out-
put levels by a factor of approximately thirty over the conventional
strain gage. Excitation to the strain gages is a regulated 5 volt DC
signal from the power supply unit. Because of the slow rotation rate
involved, slip rings are not needed, which helps to eliminate noise in
the output signal. The output is unaffected by the orientation; it may
be used horizontally, vertically, or in an oblique attitude.
The top of the transducer is provided with a 1/2 inch long l/4"-28
thread stud which is screwed into an adapter when the transducer is used
for testing. When calibrating the equipment, this stud screws into the
30
u
u3XICD
Gto
UH0)
hoH<u
X!H
mCD
U3
31

calibration stand. The bottom of the transducer is equipped wit -
l/4"-28 thread female socket, into which the vanes are screwed.
When the vane is attached to the transducer, the motor causes the
vane to turn in the sample. The resistance provided by the soil to the
vane is opposite in direction to the vane rotation. Thus, the motor
and the resistance of the soil act in opposite directions, resulting in
a twisting moment being applied to the torque transducer. The strain
gages attached to the inner shaft of the transducer measure the shaft
deflection caused by this twisting moment. The output of the strain
gages is linear and directly proportional to the amount of deflection
of the shaft.
Power supply and output signals are sent through a four wire
conductor equipped with a Viking connector which is plugged into the
back of the power supply and signal conditioning unit.
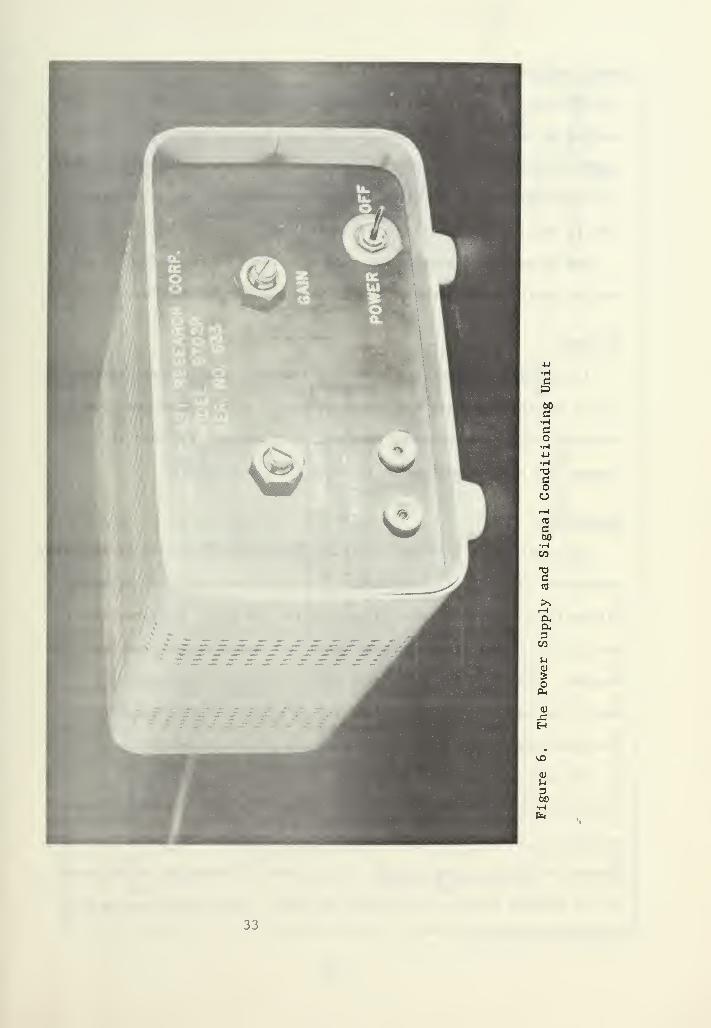
Power Supply and Signal Conditioning Unit
This is a combined transistorized power supply, bridge circuit,
and amplifier as is shown in the photograph of Figure 6. The power
supply provides 5 volt DC excitation to the strain gages. The output
signal from the strain gages produces an imbalance in the bridge
circuit proportional to the torque applied to the transducer. This
imbalance results in an output which is fed through a variable gain
amplifier to the recorder.
The unit is provided with a push button resistive circuit equiva-
lent to a 125 inch-ounce torque (half range load) and may be used to
adjust the amplifier gain. When the "R Cal" button on the back panel
is depressed, the signal from the strain gages is interrupted and
32
cDMc•Hco
T3CO
CO
CtoO
CO
dCO
a,3CO
^1
a)
oCM
-C
•H
33
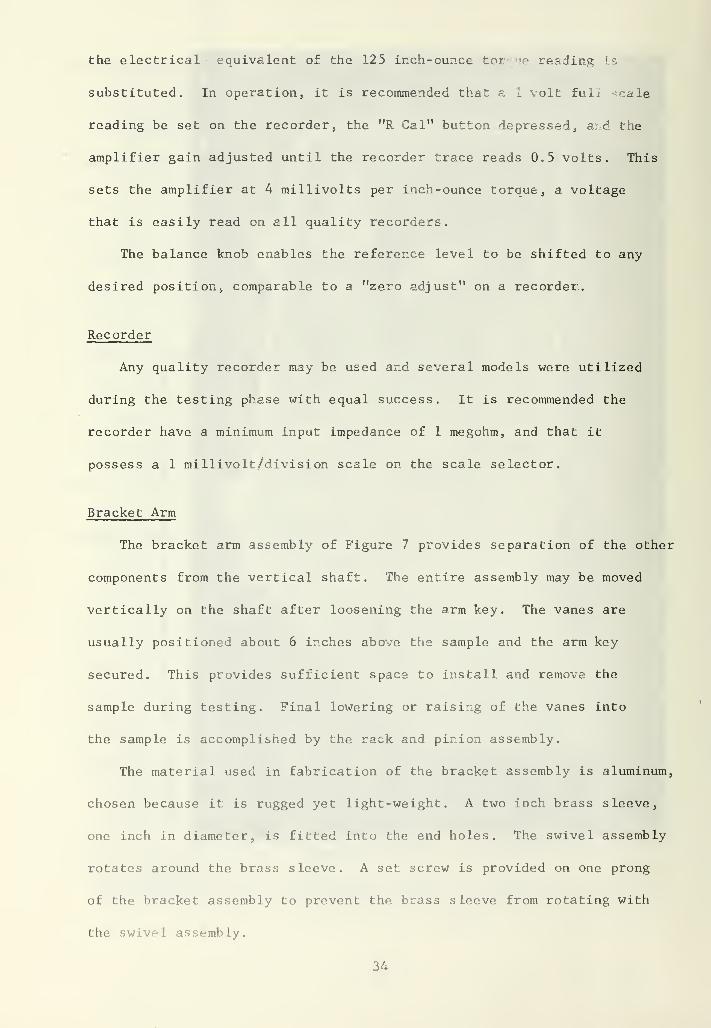
the electrical equivalent of the 125 inch-ounce torque reading Ls
substituted. In operation, it is recommended that a 1 volt full ^ale
reading be set on the recorder, the "R Cal" button depressed, &:<d the
amplifier gain adjusted until the recorder trace reads 0.5 volts. This
sets the amplifier at 4 millivolts per inch-ounce torque, a voltage
that is easily read on all quality recorders.
The balance knob enables the reference level to be shifted to any
desired position, comparable to a "zero adjust" on a recorder.
Recorder
Any quality recorder may be used and several models were utilized
during the testing phase with equal success. It is recommended the
recorder have a minimum input impedance of 1 megohm, and that it
possess a 1 millivolt/division scale on the scale selector.
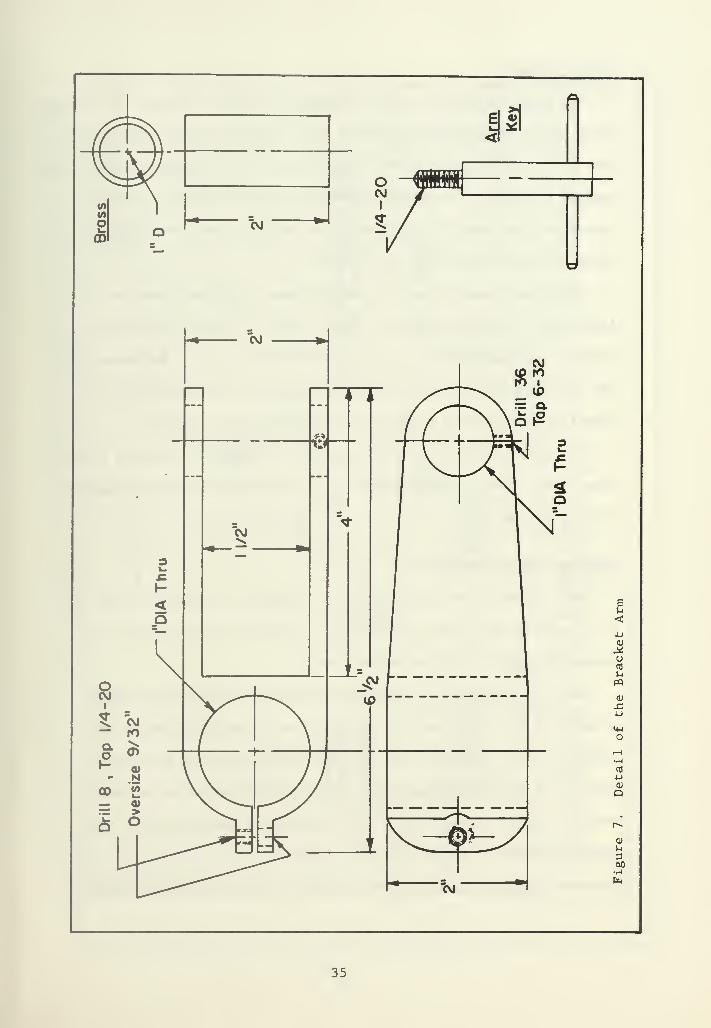
Bracket Arm
The bracket arm assembly of Figure 7 provides separation of the other
components from the vertical shaft. The entire assembly may be moved
vertically on the shaft after loosening the arm key. The vanes are
usually positioned about 6 inches above the sample and the arm key
secured. This provides sufficient space to install and remove the
sample during testing. Final lowering or raising of the vanes into
the sample is accomplished by the rack and pinion assembly.
The material used in fabrication of the bracket assembly is aluminum,
chosen because it is rugged yet light-weight. A two inch brass sleeve,
one inch in diameter, is fitted into the end holes. The swivel assembly
rotates around the brass sleeve. A set screw is provided on one prong
of the bracket assembly to prevent the brass sleeve from rotating with
the swivel assembly.
34
CM
(VI
<
CM
«f
it (I
10
Bu<
oCO
upq
CM
Q
u3
35
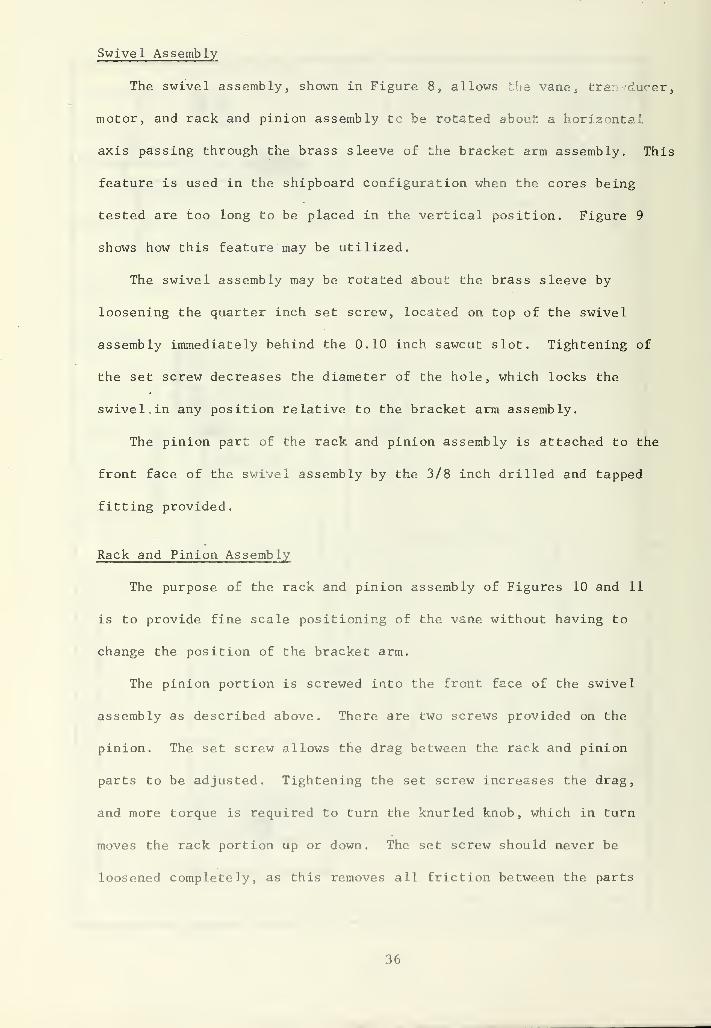
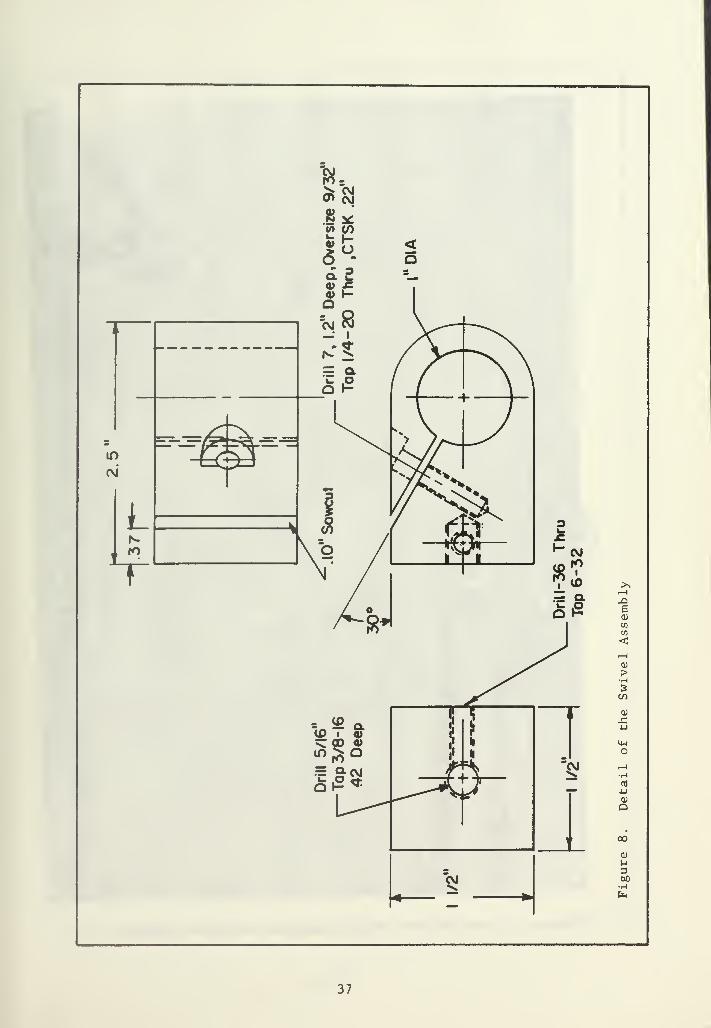
Swivel Assembly
The swivel assembly, shown in Figure 8, allows the vane, tra. sducer,
motor, and rack and pinion assembly tc be rotated about a horizontal
axis passing through the brass sleeve of the bracket arm assembly. This
feature is used in the shipboard configuration when the cores being
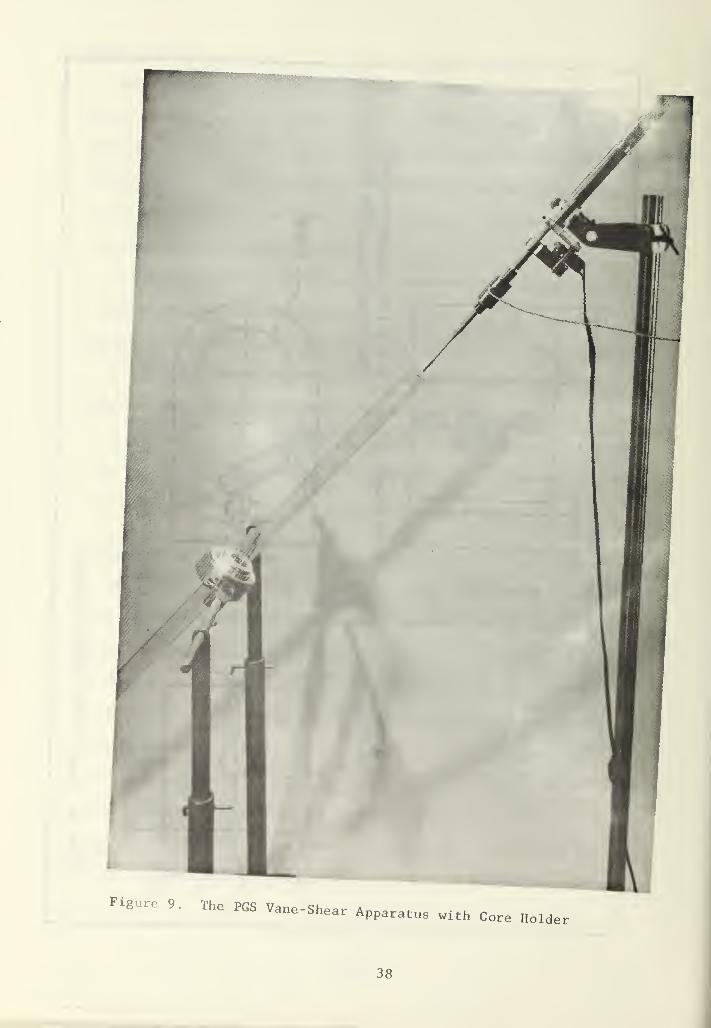
tested are too long to be placed in the vertical position. Figure 9
shows how this feature may be utilized.
The swivel assembly may be rotated about the brass sleeve by
loosening the quarter inch set screw, located on top of the swivel
assembly immediately behind the 0.10 inch sawcut slot. Tightening of
the set screw decreases the diameter of the hole, which locks the
swivel. in any position relative to the bracket arm assembly.
The pinion part of the rack and pinion assembly is attached to the
front face of the swivel assembly by the 3/8 inch drilled and tapped
fitting provided.
Rack and Pinion Assembly
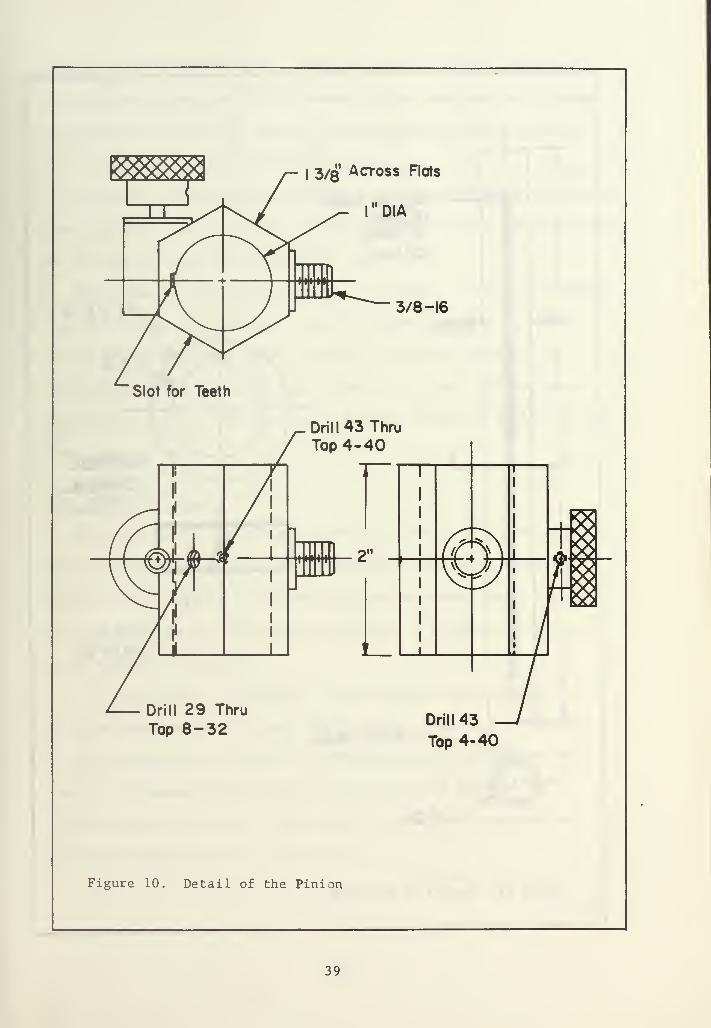
The purpose of the rack and pinion assembly of Figures 10 and 11
is to provide fine scale positioning of the vane without having to
change the position of the bracket arm.
The pinion portion is screwed into the front face of the swivel
assembly as described above. There are two screws provided on the
pinion. The set screw allows the drag between the rack and pinion
parts to be adjusted. Tightening the set screw increases the drag,
and more torque is required to turn the knurled knob, which in turn
moves the rack portion up or down. The set screw should never be
loosened completely, as this removes all friction between the parts
36
cvi
JOE
!>•r-l
CO
-C
a;Q
oo
CM
QJ
U300
37
""!-:;.;*:. -;;..
f*
Figure 9. The PGS Vane-Shear Apparatus wlth Core Holder
38
Slot for Teeth
3/8 Across Rots
"DIA
3/8-16
Drill 43 Thru
Tap 4-40
nt 2"
Drill 29 Thru
Tap 8-32 Drill 43
Top 4-40
Figure 10. Detail of the Pinion
39
12"
Slot for Teeth.12" Wide.10" Deep10" Long
Brass
Teeth -16 /in.
1/2" D
ALuminum
Retaining
Ring
Drill 21
Top 10-32
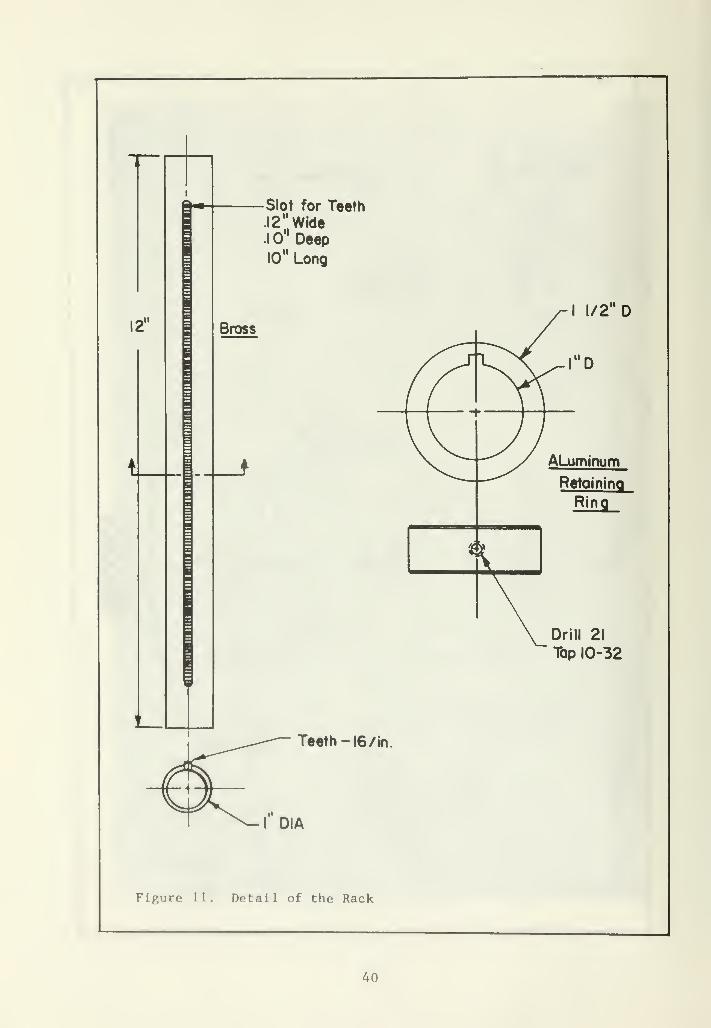
Figure 11. Detail of the Rack
40
and the rack portion will fall freely by its own weight. The thumb
screw on the pinion part of the assembly allows the rack to be locked
in place in any position. Both screws are teflon tipped to prevent
scoring of the barrel of the rack portion.
An aluminum retaining ring fits over the barrel of the rack portion,
The retaining ring is slotted to avoid interference with the gear teeth
so that the ring may be positioned at any location.
The purpose of the retaining ring is two-fold: first, it prevents
free fall of the rack portion if the set screw adjusting the drag
should inadvertently be turned the wrong direction; secondly, the
retaining ring may be positioned so that it is flush with the motor
mount when the top of the vane is 0.75 inches below the surface of the
sample being tested.
Motor and Motor Mount
The motor mount provides the means for securing the motor to the
rack protion of the rack and pinion assembly. The mount shown was
designed for a specific motor installation and would require alter-
ation if the motor is subsequently replaced. A drawing of the motor
mount appears as Figure 12.
The single phase, synchronous, heavy duty motor is manufactured
by Hurst Manufacturing Corporation, Princeton, Indiana. It is rated
at 150 inch-ounces of torque at 1 RPM and requires 115 VAC, 60 cycle
power. The output shaft rotates at one revolution per hour in a
counterclockwise direction. The reduction gears are contained in a
sealed unit and require no lubrication.
41

jro
CM
M
%7a9> CP5CM fi^ -— CM-IO
tP 1
ro <£> gDrill
Tap
a2Q.
<t
y8
5ro
1
<4
^
e
Qt)
0**"
©v. )
c3Oss
o
o
<u
u
roa)
Q
3
r-l
42
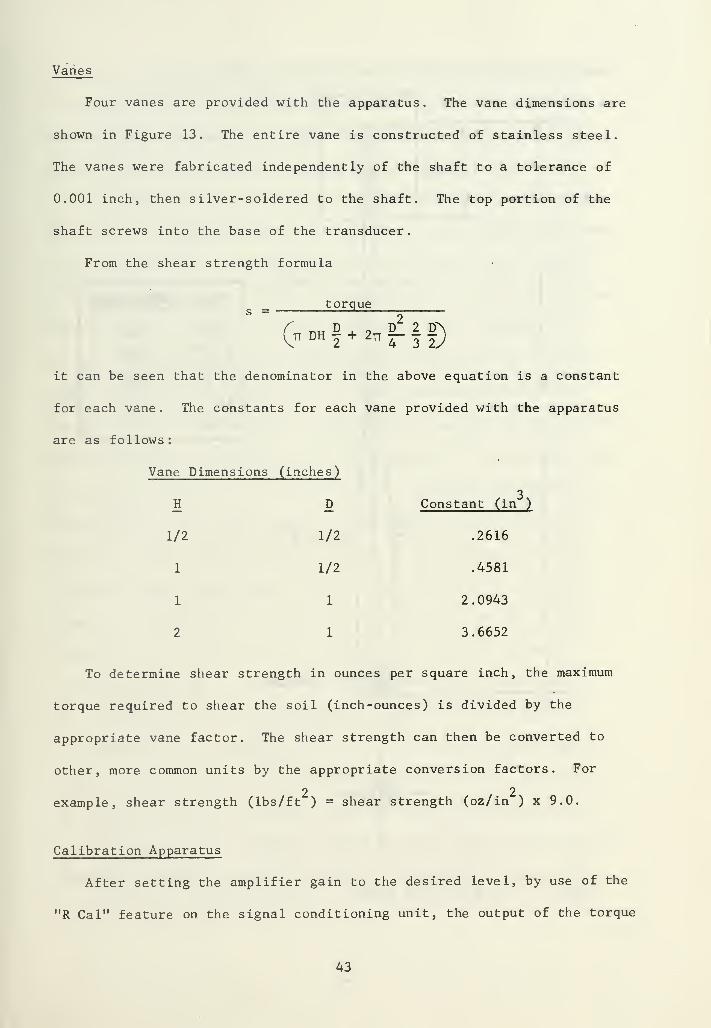
Varies
Four vanes are provided with the apparatus. The vane dimensions are
shown in Figure 13. The entire vane is constructed of stainless steel.
The vanes were fabricated independently of the shaft to a tolerance of
0.001 inch, then silver-soldered to the shaft. The top portion of the
shaft screws into the base of the transducer.
From the shear strength formula
torques = 3
_ u D, , D
22 ITS
tt DH - + 2n —3 j)
it can be seen that the denominator in the above equation is a constant
for each vane. The constants for each vane provided with the apparatus
are as follows
:
Vane Dimensions (inches)
, 3 XH D Constant (in )
1/2 1/2 .2616
1 1/2 .4581
1 1 2.0943
2 1 3.6652
To determine shear strength in ounces per square inch, the maximum
torque required to shear the soil (inch-ounces) is divided by the
appropriate vane factor. The shear strength can then be converted to
other, more common units by the appropriate conversion factors. For
2 2example, shear strength (lbs/ft ) = shear strength (oz/in ) x 9.0.
Calibration Apparatus
After setting the amplifier gain to the desired level, by use of the
"R Cal" feature on the signal conditioning unit, the output of the torque
43

H.
1/8" D
3/8"D
1/4-28
VANE
1) 1/2"
VARIATIONS
1/2"
2)1" 1/2"
3)1" 1"
4)2" 1"
Figure L3. Detail of the Vanes
44
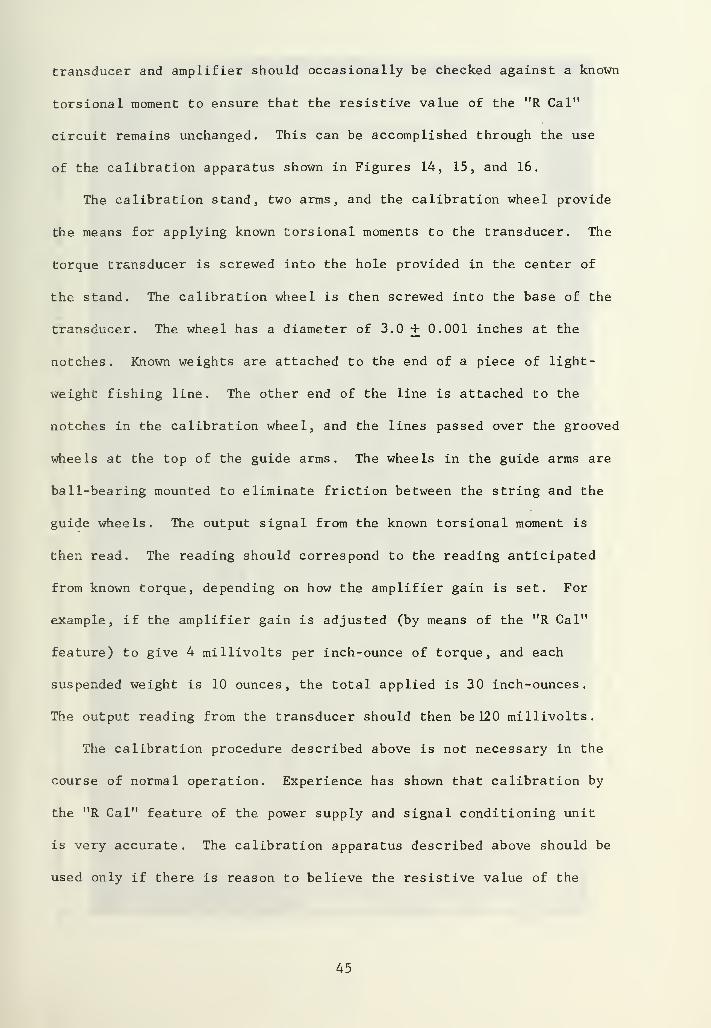
transducer and amplifier should occasionally be checked against a known
torsional moment to ensure that the resistive value of the "R Cal"
circuit remains unchanged. This can be accomplished through the use
of the calibration apparatus shown in Figures 14, 15, and 16.
The calibration stand, two arms, and the calibration wheel provide
the means for applying known torsional moments to the transducer. The
torque transducer is screwed into the hole provided in the center of
the stand. The calibration wheel is then screwed into the base of the
transducer. The wheel has a diameter of 3.0 + 0.001 inches at the
notches. Known weights are attached to the end of a piece of light-
weight fishing line. The other end of the line is attached to the
notches in the calibration wheel, and the lines passed over the grooved
wheels at the top of the guide arms. The wheels in the guide arms are
ball-bearing mounted to eliminate friction between the string and the
guide wheels. The output signal from the known torsional moment is
then read. The reading should correspond to the reading anticipated
from known torque, depending on how the amplifier gain is set. For
example, if the amplifier gain is adjusted (by means of the "R Cal"
feature) to give 4 millivolts per inch-ounce of torque, and each
suspended weight is 10 ounces, the total applied is 30 inch-ounces.
The output reading from the transducer should then be 120 millivolts.
The calibration procedure described above is not necessary in the
course of normal operation. Experience has shown that calibration by
the "R Cal" feature of the power supply and signal conditioning unit
is very accurate. The calibration apparatus described above should be
used only if there is reason to believe the resistive value of the
45

<u
SiucO
4JU<
0)
CO
•i-l
4JctJ
u43
co
uT>dco
<u
o3x)CO
cCO
uH0)
3a*UoH-C4-1
at
4-J
CO
MCO
a,a<J
co•H4JCO
S>
CO
CO
•H
46
qu
f
_J
u.
Q.
QZ
X)cCO
*oGCO
•u
en
co
to
u
CO
o(1)
J2
H-l
o
CD
o
m
M360
CVJ
LI
C
CO
uXI
crj
UQJ
.c4-1
uo
03
£U<
-C
Q
n£>
48

"R Cal" circuit has changed. The calibration apparatus was originally
designed to check the output specifications supplied by the manufacturer
of the torque transducer.
Core Holders
The legs of the core holders may be adjusted, in three inch incre-
ments, to heights between 2.5 and 4.0 feet. The cross member may be
rotated to facilitate placing the core at any desired angle. Adapters
are provided to accommodate core liners of 3.5, 3.0, 2.5, and 1.5 inches
outside diameter. The assembled core holder is shown in Figure 9.
49

TEST PROCEDURES AND RESULTS
The PGS vane-shear apparatus was transported to the Naval Civil
Engineering Laboratory at Port Hueneme , California where provision
was made for cores and samples from storage and use of the NCEL vane-
shear apparatus permitted in order to establish comparative values from
each device. Tests were conducted on numerous samples and the results
obtained from each vane-shear apparatus compared. In order to eliminate
temporal variability of the samples as much as possible, comparative
tests were conducted within fifteen minutes of each other. The
apparatus selected to test each sample first was varied randomly so
that the succeeding test result would not be biased by the result of
the first test.
It was not possible to obtain comparisons of undisturbed shear
strength, although several attempts were made to conduct such tests.
The maximum length of core which can be tested on the NCEL apparatus
is three inches. The sample was first tested on one apparatus, then
inverted and tested on the other, but portions of the vane on the
second test were extruding into the cylindrical area previously
ruptured by the first test. Since it was impossible to extend the
length of the test sample (because of the three inch limitation on
sample length with the NCEL apparatus) it was necessary to resort to
remoulded samples to obtain a valid comparison.
The samples were chiefly dark, clayey sediments containing numerous
1 fragments. Where large discrepancies existed in the test results,
Ii he sample revealed shell fragments or other irregularities
',(i

on or in the vicinity of the shear cylinder. Only those tests which
were considered valid are included in the results.
Test Procedure
After cutting the core liner, the soil was extruded from the liner
into a ten inch diameter crucible and thoroughly mixed and kneaded.
Visible shell fragments and other foreign objects were removed. In
certain instances, water was added to the sample to obtain a more
favorable consistency in order to ensure valid comparisons over a
representative range of strengths. The soil was then placed in a
brass cylinder 3 inches long and 2-1/2 inches in diameter. The
cylinder was secured to the sample holder and the vanes lowered to
0.75 inches below the surface of the sample. The rotation rate used
during all tests was one revolution per hour. Upon completion of the
test, the sample was removed and again mixed thoroughly and replaced
in the cylinder. The test was then repeated on the second apparatus.
Results
Fifteen valid sets of comparative data were obtained, the results
of which are shown in Table III. The right hand column of Table III
expresses the value of the NCEL apparatus result as a percentage of
the value obtained with the PGS apparatus. The largest difference
obtained expressed as a percentage of NCEL t PGS, was 19.7 percent.
The smallest difference was 1.2 percent. Of the fifteen comparative
values, three had a difference greater than 10 percent, three had a
difference between 5 and 10 percent, and nine had a difference of less
than 5 percent. The average difference of results for all tests is
51
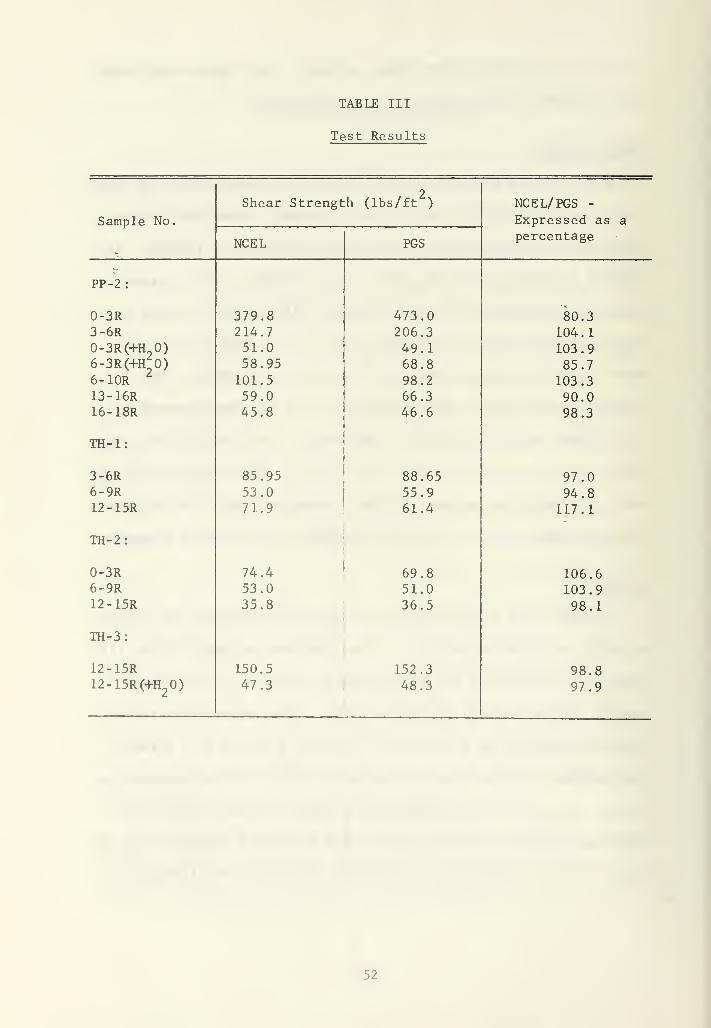
TABLE III
Test Results
2Shear Strength (lbs/ft ) NCEL/ PGS -
Sample No. Expressed as a
NCEL PGSpercentage
PP-2:
0-3R 379.8 473.0 80.33-6R 214.7 206.3 104.10-3R(+H
?0)
6-3R(+IC0)6-10R
51.0 49.1 103.958.95 68.8 85.7101.5 98.2 103.3
13-16R 59.0 66.3 90.016-18R 45.8 46.6 98.3
TH-1:
3-6R 85.95 88.65 97.06-9R 53.0 55.9 94.812-15R 71.9 61.4 117 .
1
TH-2:
0-3R 74.4 69.8 106.66-9R 53.0 51.0 103.912-15R 35.8 36.5 98.1
TH-3:
12-15R 150.5 152.3 98.812-15R(+H
20) 47.3 48.3 97.9
52
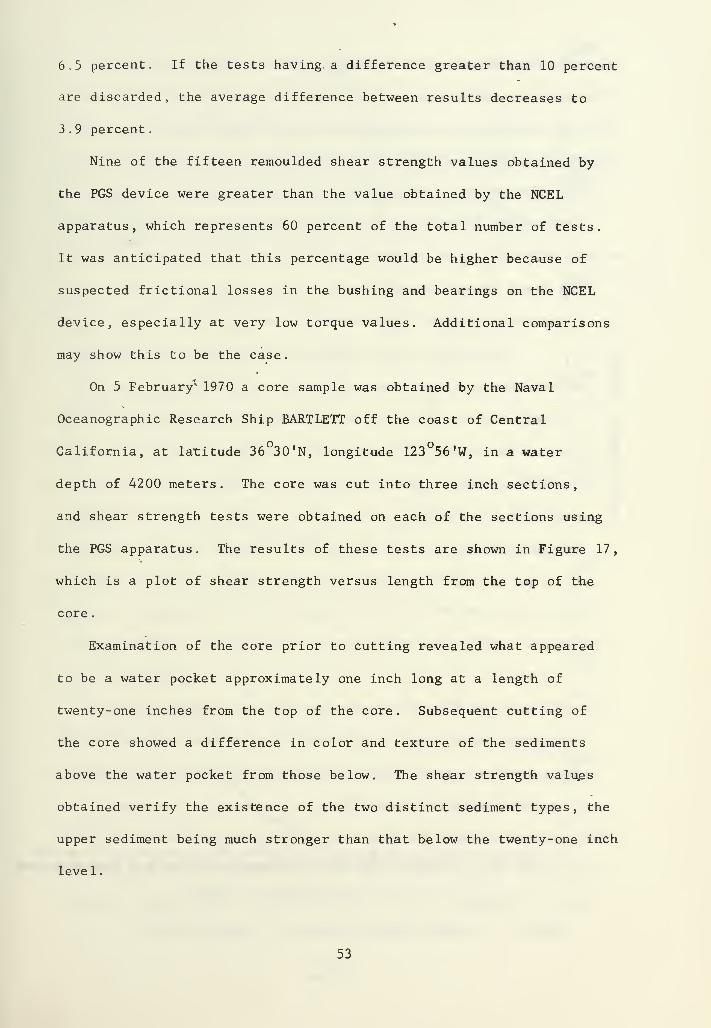
6.5 percent. If the tests having, a difference greater than 10 percent
are discarded, the average difference between results decreases to
3 .9 percent
.
Nine of the fifteen remoulded shear strength values obtained by
the PGS device were greater than the value obtained by the NCEL
apparatus, which represents 60 percent of the total number of tests.
It was anticipated that this percentage would be higher because of
suspected frictional losses in the bushing and bearings on the NCEL
device, especially at very low torque values. Additional comparisons
may show this to be the case.
On 5 February*" 1970 a core sample was obtained by the Naval
Oceanographic Research Ship BARTLETT off the coast of Central
California, at latitude 36 30 'N, longitude 123 56'W, in a water
depth of 4200 meters. The core was cut into three inch sections,
and shear strength tests were obtained on each of the sections using
the PGS apparatus. The results of these tests are shown in Figure 17,
which is a plot of shear strength versus length from the top of the
core .
Examination of the core prior to cutting revealed what appeared
to be a water pocket approximately one inch long at a length of
twenty-one inches from the top of the core. Subsequent cutting of
the core showed a difference in color and texture of the sediments
above the water pocket from those below. The shear strength values
obtained verify the existence of the two distinct sediment types, the
upper sediment being much stronger than that below the twenty-one inch
level.
53

360 t
335„
285--
4-1
CO
00c<u
u4J
CO
cu
CO
260-
235 -
210-
185•
160--
I . I\1-4 4-7 7-10 10-D 13-16 16-19 22-25 25-28 28-31 31-34 34-37 37-40 40-43 43-46
Core Interval, inches.
Figure 17. Graph of Shear Strength vs. Length in Core
54

After determining the shear strength of each core section with the
PGS vane-shear apparatus , the sample was inverted after each test and
a subsequent shear strength value determined with the Wykeham Farrance
vane-shear apparatus. Care was taken to ensure the ruptured areas did
not overlap. Table IV shows the results of these comparisons. The
largest difference obtained, expressed as a percentage of Wykeham
Farrance t PGS, was 10.0 percent. Two samples had a difference between
5.0 and 10.0 percent, and eleven of the fourteen samples had a dif-
ference less than 5.0 percent. The average difference of shear
strength values obtained by these tests was 3.08 percent.
A total of twenty-nine comparative tests were obtained; fifteen
with the NCEL vane-shear apparatus, and fourteen with the Wykeham
Farrance vane-shear apparatus. The average difference of all twenty-
nine tests is 4.86 percent. If the three tests showing a difference
of greater than 10.0 percent (which may be attributed to handling,
testing procedures, etc.) are discarded, the average difference of
the remaining twenty-six tests is 3.6 percent. This average is
considered reasonable for this type of test, since handling, cutting
of core liners, and other factors can produce significant differences
in test results.
The data comparing the PGS vane-shear apparatus with the NCEL and
Wykeham Farrance devices was subjected to a statistical analysis by
the use of the Paired Student-t Test. The objective of this analysis
was to determine if there is any significant difference between the
results obtained with the PGS apparatus and the results obtained with
the NCEL and the Wykeham Farrance devices. Tables V and VI show the
results of these tests. In both cases, the null hypothesis is that
55
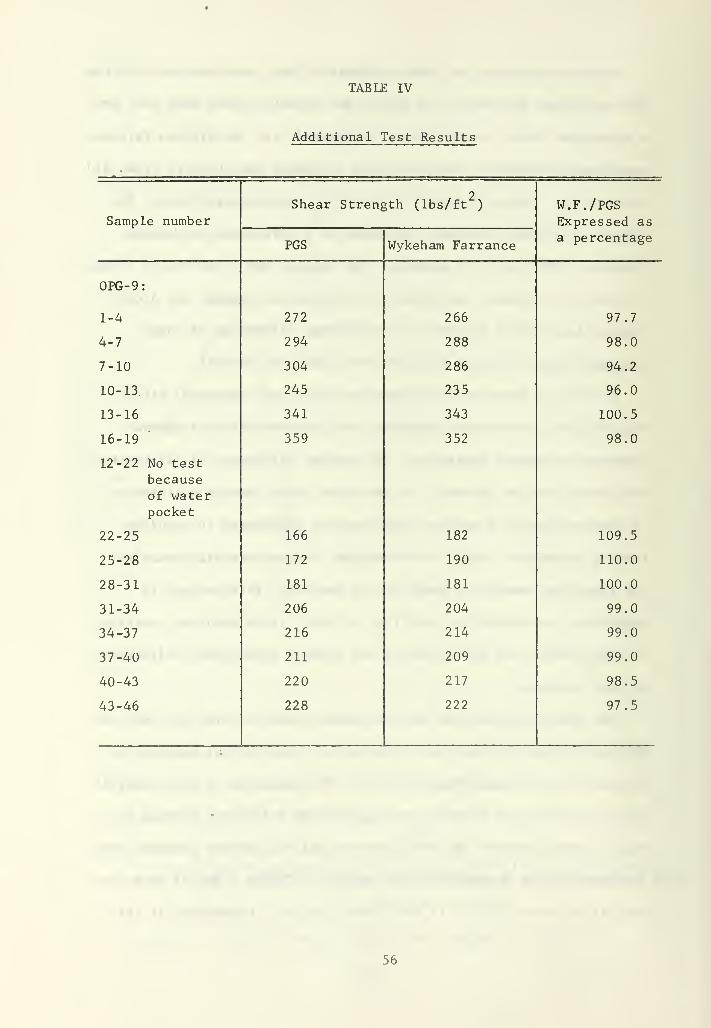
TABLE IV
Additional Test Results
2Shear Strength (lbs/ft ) W.F./PGS
Sample number Expressed as
PGS Wykeham Farrancea percentage
OPG-9:
1-4 272 266 97.7
4-7 294 288 98.0
7-10 304 286 94.2
10-13 245 235 96.0
13-16 341 343 100.5
16-19 359 352 98.0
12-22 No test
becauseof waterpocket
22-25 166 182 109.5
25-28 172 190 110.0
28-31 181 181 100.0
31-34 206 204 99.0
34-37 216 214 99.0
37-40 211 209 99.0
40-43 220 217 98.5
43-46 228 222 97.5
56

TABLE V
Paired Student-t Test Results, PGS vs. NCEL Data
SampleNumber
Shear Strength (lbs/ft )
PGS NCELDifference
0<d )<VV
PP-2
0-3R3-6R0-3R (+H 0)
3-6R (+1C0)6-10R13-16R16-18R
473.0206
49
68
98
66
46
379.8214.751.0
58.9101.5
59.045.8
93.2
-8.4-1.9
9.8-3.3
7.3
0.8
7607.3
206.762.114.6
86.11.7
26.8
TH-1
3-6R6-9R12-15R
88.6 85.9 2.7 10.855.9 53.0 2.9 19.3
61.4 71.9 -10.5 271.6
TH-2
0-3R6-9R12-15R
69.8 74.4 -4.6
51.0 53.0 -2.036.5 35.8 0.7
111.963.727.9
TH-3
12-15R 152.3
12-15R (+H20) 48.3
X, = fJk , %fi = 5 . 98d N 15
— 2
2(X
d "Xd ) 8552
150.547.3
(N-l) 14- = 610.9
s J =, Sj = 24.7
a ' a
t= ^.^18s A 24.71a
1.81.0
89.8
17.5
24.8
8552.8
t value for 95$ confidence level,
14 degree of freedom = 1.761
[Natrella, 1963].
57

TABLE V
Paired Student-t Test Results, PGS vs. NCEL Data
SampleNumber
Shear Strength (lbs/ft )
PGS NCEL
Difference(xd
) <WPP-2:
0-3R3-6R0-3R (+H
20)
3-6R C+H^O)6-10R13-16R16-18R
473.0206.349.168.898.266.346.6
379.8214.751.058.9101.559.045.8
93.2-8.4-1.9
9.8-3.3
7.3
0.8
7607.3206.762.114.6
86.11.7
26.8
TH-1:
3-6R6-9R12-15R
TH-2:
0-3R6-9R12-15R
TH-3:
88.6 85.9 2.7
55.9 53.0 2.961.4 71.9 -10.5
69.8 74.4 -4.6
51.0 53.0 -2.0
36.5 35.8 0.7
12-15R 152.3
12-15R (+H20) 48.3
- Z Xd _„ 89.8 _X
d " N " 155 ' 98
- 2
2(X
d V 8552. 8
°d (N-1) 14
Sd=\/7 =24 - ?
s , 24.71a
150.547.3
= 610.9
1.8
1.0
89.8
10.819.3
271.6
111.9
63.727.9
17.5
24.8
8552.8
t value for 95% confidence
level, 14 degrees of freedom
- 1.761 [Natrella, 1963].
58
on the average there is no significant difference between the results
obtained with the PGS vane-shear apparatus and the device it is compared
against. The results of these calculations show that, in both cases,
the null hypothesis cannot be rejected since the t-values determined
from the test results are less than the tabulated t-values for a
95 percent confidence level. Thus, it is safe to conclude that based
on a 95 percent confidence level there is no significant difference
between the shear strength values obtained with the PGS apparatus and
those obtained with the other two devices.
Recommendations for Further Research
The following areas associated with vane-shear testing are suggested
for additional research:
1. Determine the effects of additional blades on the vane.
Such additions should result in a shear surface more nearly cylindrical,
but may give erroneous results because of additional disturbance and
increased pore water pressures.
2. Quantitatively determine the effects of higher vane rotation
rates
.
3. Investigate the effects of friction exerted by the sediment
on the vane shaft.
4. Develop a new technique for cutting all types of core
liner material without increasing the disturbance of the sediment.
The "hot wire" technique is extremely time consuming with some types
of plastic.
59

BIBLIOGRAPHY
Aas , G., "A Study of the Effect of Vane Shape and Rate of Strain on theMeasured Values of In-Situ Shear Strength of Clays", NorwegianGeotechnical Institute , Publication No. 65, p. 5-9, 1965.
Arthur D. Little, Inc., "Engineering Properties of Marine Sediments,Project Trident", Report No. 1281262 , -December 1962 (unpublished).
Bryant, W. R., Cernock, P., and Morelock, J., "Shear Strength and Con-solidation Characteristics of Marine Sediments from the WesternGulf of Mexico", in Marine Geotechnique , edited by A. F. Richards,
p. 41-64, University of Illinois Press, 1967.
Bouma, A. H., Bryant, W. R. , and Tieh, T. T. , "Study of the ContinentalShelf of the Gulf of Mexico", prepared by Texas A&M University,Department of Oceanography as a report for the U. S. GeologicalSurvey under Contract No. 14-08-0001-10866, March 1968 (unpublished)
Cadling, L. , and Odenstad, S., "The Vane Borer, An Apparatus for Deter-mining the Shear Strength of Clay Soils Directly in the Ground",Royal Swedish Geotechnical Institute , Proceedings No. 2, 1950.
Dill, R. F., and Moore, D. G., "A Diver-Held Vane-Shear Apparatus",Marine Geology , Vol. 3, p. 323-327, 1965.
Hamilton, E. L. , "Sound Velocity, Elasticity, and Related Properties of
Marine Sediments, North Pacific, Part 1", Naval Undersea Research- and Development Center Technical Publication #143 , 1969.
Herrmann, H., "Typical Range of Properties of Sea Floor Sediments",Table compiled December 1966 (unpublished).
Hough, B. K. , Basic Soils Engineering , p. 135-165, Ronald Press Company,1957.
Inderbitzen, A. L. , and Simpson, F., "A Comparison of the Test Results
of Vane and Direct Shear Tests Made on Recent Marine Sediments",Lockheed Missiles and Space Company Report LMSC 694965 , 1969
(unpublished)
.
Keller, G. H. , "Shear Strength and Other Physical Properties of
Sediments from Some Ocean Basins", Proceedings of the Conference
on Civil Engineering in the Oceans , American Society of CivilEngineers, 1968.
Kenney, T. C. and Landva , A., "Vane-Triaxial Apparatus", NorwegianGeotechnical Institute Publication No. 65, p. 10-13, 1965.
60
Kessler, R. S., and Stiles, N. T. , "Comparison of Shear StrengthMeasurements with the Laboratory Vane Shear and Fall-Cone Devices",Naval Oceanographic Office Informal Report No. 68-75 , November 1968,
Moore, D. G. , "Shear Strength and Related Properties of Sediments fromExperiment Mohole", Journal of Geophysical Research , Vol. 69,
p. 4271-4291, 1965.
Morelock, Jack, "Sedimentation and Mass Physical Properties of MarineSediments, Western Gulf of Mexico", Ph.D. Thesis, Texas A&MUniversity, May 1967.
Natrella, M. G., Experimental Statistics , U. S. Department of Commerce,National Bureau of Standards, Handbook 91, August 1963.
Osterberg, J. A., Introductory Comments, Symposium on Vane ShearTesting of Soils, American Society for Testing Materials, SpecialTechnical Publication No. 193, 1957.
Richards, A. F., "Investigation of Deep-.Sea Sediment Cores, Vol. I:
Shear Strength, Bearing Capacity, and Consolidation", NavalHydrographic Office Technical Report No. 63 , August 1961.
Smith, R. J., "Engineering Properties of Ocean Floor Soils", ASTMSymposium on Field Testing of Soils , American Society for
V Testing Materials, Special Technical Publication No. 322, 1962.
Spangler, M. G., "Soil Engineering", 2nd ed., International TextbookCompany, 1960.
Vey, E., and Nelson, R. D., "Environmental Effects on EngineeringProperties of Deep Ocean Sediments", U. S. Naval Civil EngineeringLaboratory Report CR 67.020 , December 1966.
61
INITIAL DISTRIBUTION LIST
No. Copies
1. Defense Documentation Center 20j Cameron StationAlexandria, Virginia 22314
2. Library, Code 0212 2
Naval Postgraduate SchoolMonterey, California 93940
3. Oceanographer of the Navy 1
The Madison Building732 N. Washington StreetAlexandria, Virginia 22314
4. Professor R. J. Smith, Code 58 1
Department of OceanographyNaval Postgraduate SchoolMonterey, California 93940
5. LCDR Edward M. Minugh, USN 2
USS TIRU (SS-416)Fleet Post OfficeSan Francisco, California 96601
62

Security Classification2DOCUMENT CONTROL DATA -R&D
(Security classification of title, body ol abstract and indexing annotation must be entered when the overall report Is classified)
I ORIGINATING ACTIVITY (Corporate author)
Naval Postgraduate SchoolMonterey, California 93940
2«. REPORT SECURITY CLASSIFICATION
Unclassified2b. GROUP
3 REPORT TITLE
A Versatile Vane-Shear Apparatus
4 DESCRIPTIVE NOTES (Type of report and.inclusive dates)
Master's Thesis ; April 19705 AUTHORISI (First name, middle initial, last name)
Edward M. Minugh
6 REPOR T D A TE
April 1970
la. TOTAL NO. OF PAGES
63
7b. NO. OF REFS
22
8a CONTRACT OR GRANT NO.
b. PROJEC T NO
9a. ORIGINATOR'S REPORT NUMBERI3)
9b. OTHER REPORT NO(SI (Any other numbers that may be assignedthis report)
10 DISTRIBUTION STATEMENT
This document has been approved for public release and sale;
its distribution is unlimited.
11. SUPPLEMENTARY NOTES 12. SPONSORING MILI TARY ACTIVITY
Naval Postgraduate SchoolMonterey, California 93940
13. ABSTR AC T
The vane-shear devices currently in use exhibit inherent problems and short-comings associated with their design. The PGS Vane-Shear Apparatus is designedto eliminate these shortcomings. The unique features of the device include:
a. Ability to be used in the laboratory or on board ship.
b. A single unit which is easily calibrated and capable of measuring torqueover the entire range commonly encountered in marine sediments.
c. A torque transducer which is insensitive to temperature changes andorientation.
d. Ability to determine shear strength prior to cutting the core liner,
thus reducing the disturbance to the sediment caused by cutting and handling.
DD .'.T..1473S/N 0101 -807-681 1
(PAGE 1)
63 Security ClassificationA- 3 1408
Security Classification
KEY WORDS
Vane-shear apparatus
Shear strength
Marine sediments
Sediment testing
DD ,rv
M6,1473 'back,
64'
• 6 <i 7 \ Security Classification A - 3 1 409


18 AUG 72A '.172
2 T) 'U 6 $
2 I 8 «i
61) n5iOThesisM632 Minugh
c 1 A versati 1e vane-shear apparatus.
^0 AUG72^40CT72
2 0!» 6 5
2 1 8 ii
Thesi s
M632c.l
J. :>' n ' 5Minugh
A versati 1e vane-shear apparatus.

thesM632
A versatile vane-shear apparatus.
3 2768 001 89107DUDLEY KNOX LIBRARY