a aa - IBD › wp-content › uploads › 2019 › ...179 180 158 Cmp–Hrdwre/Perip .. +30.2 –0.4...
1
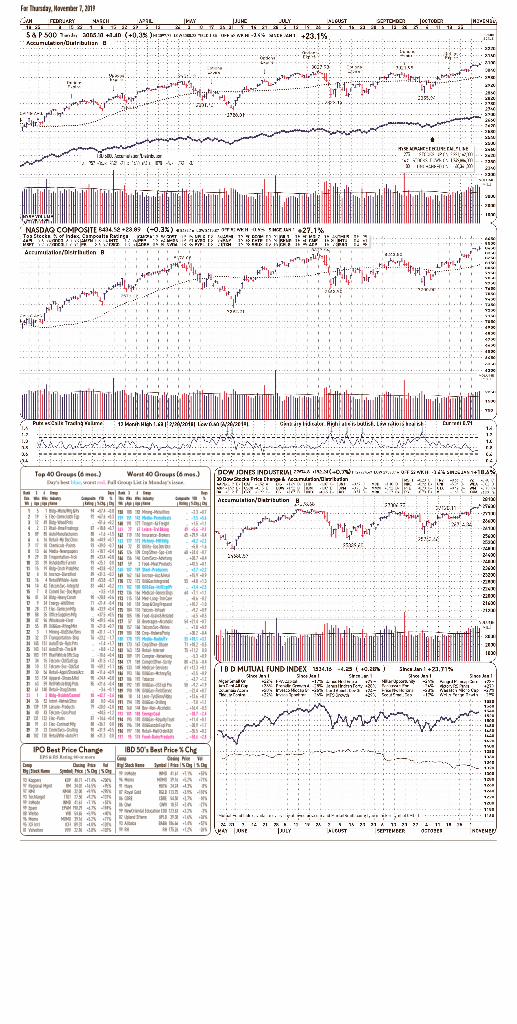
a a a a a a 158 188 183 Mining–Metal Ores .. –2.3 +0.7 159 151 142 Media–Periodicals .. –7.5 +5.6 160 191 177 Trnsprt–Air Freight .. +1.5 +1.1 161 77 67 Leisre–TrvlBking 49 +5.6 –9.1 162 119 110 Insurance–Brokers 65 +29.9 –0.4 163 177 173 Mchnry–MtlHdlg .. +0.2 +2.2 164 72 87 Utility–Gas Dstribtn .. +5.8 –1.6 165 126 109 Cmp Sftwr–Spc–Entr 68 +24.4 –0.7 166 156 146 Coml Svcs–Advrtsng .. +28.7 +0.4 167 59 2 Food–Meat Products .. +42.5 +0.1 168 187 189 Steel–Producers .. +2.7 +2.2 169 162 163 Insrnce–Acc & Heal .. +15.9 +0.9 170 172 172 Oil&Gas Integrated 55 +4.8 +1.3 171 182 180 Oil&Gas–IntlExplPr .. +1.4 +2.5 172 136 166 Medical–Generc Drgs 64 +7.1 +1.1 173 115 154 Med–Long–Trm Care .. +8.6 –0.2 174 141 118 Soap & Clng Preparat .. +10.2 –1.0 175 184 176 Telcom–Infrastr .. +9.2 +0.9 176 185 185 Food–Grain & Related .. –6.5 +0.5 177 57 53 Beverages–Alcoholic 54 +21.4 –0.7 178 157 168 Telcom Svc–Wirles .. +7.8 +0.9 179 180 158 Cmp–Hrdwre/Perip .. +30.2 –0.4 180 178 175 Media–Radio/Tv 55 +10.1 +3.1 181 173 167 Cmp Sftwr–Dbase 71 +18.2 –0.5 182 163 153 Retail–Internet 75 +11.2 0.0 183 189 191 Compter–Netwrking .. –5.3 +0.9 184 171 169 Comptr Sftwr–Scrity 80 +27.6 –0.4 185 133 149 Medical–Services 61 +12.3 +0.1 186 193 186 Oil&Gas–Mchnry/Eq .. +2.5 –0.9 187 186 192 Tobacco .. +3.7 –1.2 188 192 187 Oil&Gas–U S Expl Pro 50 –9.2 +1.9 189 190 190 Oil&Gas–Field Servic .. –22.4 +0.7 190 18 14 Leisr–Tys/Gms/Hbby .. +13.6 +0.7 191 194 195 Oil&Gas–Drilling .. –7.0 +1.1 192 160 144 Bev–Non–Alcoholic .. +16.4 –0.3 193 181 188 EnergyCoal .. –30.7 –2.4 194 195 193 Oil&Gas–Royalty Trust .. +11.4 +0.1 195 196 194 Oil&Gascdn Expl Pro .. –28.9 +1.7 196 197 196 Retail–Mail Order&Di .. –35.5 +0.2 197 95 174 Food–DairyProducts .. –50.6 –2.8 Day’s best blue, worst red. Full Group List in Monday’s issue. 1 5 7 Bldg–Mbile/Mfg & Rv 94 +57.4 –0.8 2 19 5 Elec–Semicndctr Eqp 92 +67.6 +0.3 3 12 49 Bldg–Wood Prds .. +51.6 +0.2 4 2 21 Rtail–Hme Frnshngs 87 +18.8 +0.7 5 89 85 Auto Manufacturers 88 +1.6 +1.5 6 6 16 Retail–Mjr Dsc Chns 86 +44.9 +0.7 7 17 18 Chemicals–Paints 93 +39.0 –0.7 8 13 66 Media–Newspapers 51 +18.7 +0.4 9 29 28 Trnsportation–Trck 89 +33.4 +0.8 10 33 39 Hsholdoffic Furnitr 93 +25.1 0.0 11 15 19 Bldg–Cnstr Prds/Msc 92 +43.8 –0.2 12 4 10 Insrnce–Divrsified 89 +31.5 –0.2 13 16 4 Retail/Whlsle–Auto 87 +53.8 –0.7 14 14 42 Telcom Svc–Integrtd 81 +44.1 +0.2 15 7 8 Comml Svc–Doc Mgmt .. +3.5 +1.0 16 41 54 Bldg–Heavy Constr 90 +28.8 +0.6 17 9 24 Energy–Alt/Other 71 +21.4 –0.4 18 28 27 Elec–Semicon Mfg 86 +33.9 +0.4 19 88 35 Office Supplies Mfg .. +37.5 +0.5 20 42 96 Wholesale–Elect 94 +49.5 +0.6 21 55 89 Oil&Gas–Rfing/Mkt 70 +21.8 +0.7 22 3 1 Mining–Gld/Silvr/Gms 78 +31.1 –1.1 23 32 37 Transportation–Ship 76 +23.2 –1.7 24 145 151 Auto/Trck–Rplc Prts .. +1.4 +1.7 25 143 161 Auto/Trck–Tirs & M .. +8.8 +1.2 26 183 197 Rtail Whlsle Offc Sup .. –10.6 +0.4 27 34 15 Telcom–Cbl/Sat Eqp 74 +31.5 +1.2 28 10 12 Telcom–Svc–Cbl/Sat 78 +59.2 +1.1 29 30 56 Retail–Apprl/Shoes/Acc 88 +11.6 +0.9 30 53 134 Apparel–Shoes & Rel 90 +24.4 +0.8 31 63 59 Retl Whsle Bldg Prds 85 +21.6 –0.4 32 61 140 Retail–Drug Stores .. –3.6 –0.1 33 1 3 Bldg–Rsidnt/Comml 88 +42.7 –2.6 34 36 52 Intrnt–Netwk Sltns 68 0.0 +0.6 35 139 139 Leisure–Products 79 +20.0 +2.0 36 40 43 Telcom–Cons Prod .. +44.5 +1.2 37 131 132 Elec–Parts 87 +14.6 +0.4 38 91 61 Elec–Contract Mfg 88 +36.7 0.0 39 31 23 Cmml Svcs–Cnsltng 90 +31.9 +0.5 40 102 120 Retail/Wsl–Auto Prt 88 +31.3 0.0 99 InMode INMD 41.61 +7.1% +53% 96 Momo MOMO 39.16 +5.2% +71% 91 Huya HUYA 24.24 +4.3% -8% 87 Royal Gold RGLD 113.75 +3.9% +110% 86 CBRE CBRE 54.50 +2.7% -10% 86 Qiwi QIWI 18.57 +2.4% -27% 99 NewOriental Education EDU 123.63 +2.2% -3% 82 Upland Sftwre UPLD 39.38 +1.6% +26% 93 Alibaba BABA 186.66 +1.4% +52% 99 RH RH 175.26 +1.2% -26% Worst 40 Groups (6 mos.) Rank 3 6 Group Days This Wks Wks Industry Composite YTD % Wk | Ago | Ago | Name | Rating | %Chg.| Chg Top 40 Groups (6 mos.) Rank 3 6 Group Days This Wks Wks Industry Composite YTD % Wk | Ago | Ago | Name | Rating | %Chg. | Chg 93 Koppers KOP 40.71 +17.4% +200% 97 Regional Mgmt RM 34.02 +16.5% +95% 97 NMI NMIH 32.00 +9.9% +295% 93 Techtarget TTGT 27.50 +9.2% +131% 99 InMode INMD 41.61 +7.1% +53% 99 Epam EPAM 190.29 +6.7% +194% 88 Weibo WB 54.65 +5.9% +40% 96 Momo MOMO 39.16 +5.2% +71% 95 ICF Intl ICFI 89.37 +4.0% +120% 81 Valvoline VVV 22.96 +3.8% +102% IPO Best Price Change Comp Closing Price Vol Rtg Stock Name Symbol Price % Chg % Chg IBD 50’s Best Price % Chg Comp Closing Price Vol Rtg Stock Name Symbol Price % Chg % Chg EPS & RS Rating 80 or more For Thursday, November 7, 2019
Transcript of a aa - IBD › wp-content › uploads › 2019 › ...179 180 158 Cmp–Hrdwre/Perip .. +30.2 –0.4...
a aa a aa
158 188 183 Mining–MetalOres .. –2.3 +0.7159 151 142 Media–Periodicals .. –7.5 +5.6160 191 177 Trnsprt–AirFreight .. +1.5 +1.1161 77 67 Leisre–TrvlBking 49 +5.6 –9.1162 119 110 Insurance–Brokers 65 +29.9 –0.4163 177 173 Mchnry–MtlHdlg .. +0.2 +2.2164 72 87 Utility–GasDstribtn .. +5.8 –1.6165 126 109 Cmp Sftwr–Spc–Entr 68 +24.4 –0.7166 156 146 ComlSvcs–Advrtsng .. +28.7 +0.4167 59 2 Food–MeatProducts .. +42.5 +0.1168 187 189 Steel–Producers .. +2.7 +2.2169 162 163 Insrnce–Acc& Heal .. +15.9 +0.9170 172 172 Oil&Gas Integrated 55 +4.8 +1.3171 182 180 Oil&Gas–IntlExpl Pr .. +1.4 +2.5172 136 166 Medical–GenercDrgs 64 +7.1 +1.1173 115 154 Med–Long–Trm Care .. +8.6 –0.2174 141 118 Soap &Clng Preparat .. +10.2 –1.0175 184 176 Telcom–Infrastr .. +9.2 +0.9176 185 185 Food–Grain& Related .. –6.5 +0.5177 57 53 Beverages–Alcoholic 54 +21.4 –0.7178 157 168 Telcom Svc–Wirles .. +7.8 +0.9179 180 158 Cmp–Hrdwre/Perip .. +30.2 –0.4180 178 175 Media–Radio/Tv 55 +10.1 +3.1181 173 167 Cmp Sftwr–Dbase 71 +18.2 –0.5182 163 153 Retail–Internet 75 +11.2 0.0183 189 191 Compter–Netwrking .. –5.3 +0.9184 171 169 ComptrSftwr–Scrity 80 +27.6 –0.4185 133 149 Medical–Services 61 +12.3 +0.1186 193 186 Oil&Gas–Mchnry/Eq .. +2.5 –0.9187 186 192 Tobacco .. +3.7 –1.2188 192 187 Oil&Gas–US Expl Pro 50 –9.2 +1.9189 190 190 Oil&Gas–FieldServic .. –22.4 +0.7190 18 14 Leisr–Tys/Gms/Hbby .. +13.6 +0.7191 194 195 Oil&Gas–Drilling .. –7.0 +1.1192 160 144 Bev–Non–Alcoholic .. +16.4 –0.3193 181 188 EnergyCoal .. –30.7 –2.4194 195 193 Oil&Gas–Royalty Trust .. +11.4 +0.1195 196 194 Oil&GascdnExpl Pro .. –28.9 +1.7196 197 196 Retail–MailOrder&Di .. –35.5 +0.2197 95 174 Food–DairyProducts .. –50.6 –2.8
Day’s best blue, worst red. Full Group List in Monday’s issue.
1 5 7 Bldg–Mbile/Mfg&Rv 94 +57.4 –0.82 19 5 Elec–SemicndctrEqp 92 +67.6 +0.33 12 49 Bldg–Wood Prds .. +51.6 +0.24 2 21 Rtail–Hme Frnshngs 87 +18.8 +0.75 89 85 AutoManufacturers 88 +1.6 +1.56 6 16 Retail–MjrDscChns 86 +44.9 +0.77 17 18 Chemicals–Paints 93 +39.0 –0.78 13 66 Media–Newspapers 51 +18.7 +0.49 29 28 Trnsportation–Trck 89 +33.4 +0.8
10 33 39 HsholdofficFurnitr 93 +25.1 0.011 15 19 Bldg–CnstrPrds/Msc 92 +43.8 –0.212 4 10 Insrnce–Divrsified 89 +31.5 –0.213 16 4 Retail/Whlsle–Auto 87 +53.8 –0.714 14 42 Telcom Svc–Integrtd 81 +44.1 +0.215 7 8 Comml Svc–Doc Mgmt .. +3.5 +1.016 41 54 Bldg–HeavyConstr 90 +28.8 +0.617 9 24 Energy–Alt/Other 71 +21.4 –0.418 28 27 Elec–Semicon Mfg 86 +33.9 +0.419 88 35 Office Supplies Mfg .. +37.5 +0.520 42 96 Wholesale–Elect 94 +49.5 +0.621 55 89 Oil&Gas–Rfing/Mkt 70 +21.8 +0.722 3 1 Mining–Gld/Silvr/Gms 78 +31.1 –1.123 32 37 Transportation–Ship 76 +23.2 –1.724 145 151 Auto/Trck–RplcPrts .. +1.4 +1.725 143 161 Auto/Trck–Tirs& M .. +8.8 +1.226 183 197 Rtail Whlsle Offc Sup .. –10.6 +0.427 34 15 Telcom–Cbl/SatEqp 74 +31.5 +1.228 10 12 Telcom–Svc–Cbl/Sat 78 +59.2 +1.129 30 56 Retail–Apprl/Shoes/Acc 88 +11.6 +0.930 53 134 Apparel–Shoes &Rel 90 +24.4 +0.831 63 59 Retl Whsle Bldg Prds 85 +21.6 –0.432 61 140 Retail–DrugStores .. –3.6 –0.133 1 3 Bldg–Rsidnt/Comml 88 +42.7 –2.634 36 52 Intrnt–NetwkSltns 68 0.0 +0.635 139 139 Leisure–Products 79 +20.0 +2.036 40 43 Telcom–ConsProd .. +44.5 +1.237 131 132 Elec–Parts 87 +14.6 +0.438 91 61 Elec–ContractMfg 88 +36.7 0.039 31 23 Cmml Svcs–Cnsltng 90 +31.9 +0.540 102 120 Retail/Wsl–Auto Prt 88 +31.3 0.0
99 InMode INMD 41.61 +7.1% +53%96 Momo MOMO 39.16 +5.2% +71%91 Huya HUYA 24.24 +4.3% -8%87 Royal Gold RGLD 113.75 +3.9% +110%86 CBRE CBRE 54.50 +2.7% -10%86 Qiwi QIWI 18.57 +2.4% -27%99 NewOriental Education EDU 123.63 +2.2% -3%82 Upland Sftwre UPLD 39.38 +1.6% +26%93 Alibaba BABA 186.66 +1.4% +52%99 RH RH 175.26 +1.2% -26%
Worst 40 Groups (6 mos.)
Rank 3 6 Group DaysThis Wks Wks Industry Composite YTD %Wk | Ago | Ago | Name | Rating | %Chg.| Chg
Top 40 Groups (6 mos.)
Rank 3 6 Group DaysThis Wks Wks Industry Composite YTD %Wk | Ago | Ago | Name | Rating | %Chg. | Chg
93 Koppers KOP 40.71 +17.4% +200%97 Regional Mgmt RM 34.02 +16.5% +95%97 NMI NMIH 32.00 +9.9% +295%93 Techtarget TTGT 27.50 +9.2% +131%99 InMode INMD 41.61 +7.1% +53%99 Epam EPAM 190.29 +6.7% +194%88 Weibo WB 54.65 +5.9% +40%96 Momo MOMO 39.16 +5.2% +71%95 ICF Intl ICFI 89.37 +4.0% +120%81 Valvoline VVV 22.96 +3.8% +102%
IPO Best Price Change
Comp Closing Price VolRtg Stock Name Symbol Price % Chg % Chg
IBD 50’s Best Price % ChgComp Closing Price VolRtg Stock Name Symbol Price % Chg % Chg
EPS & RS Rating 80 or more
For Thursday, November 7, 2019