816 POSTBUS RB UTRECHT AND THE EUROPEAN DIRECTIVE
107
EXPLORATORY STUDY FOR WASTEWATER TREATMENT TECHNIQUES AND THE EUROPEAN WATER FRAMEWORK DIRECTIVE 2005 34
Transcript of 816 POSTBUS RB UTRECHT AND THE EUROPEAN DIRECTIVE
STICHTINGTOEGEPAST ONDERZOEK WATERBEHEER
[email protected] WWW.stowa.nlTEL 030 232 11 99 FAX 030 232 17 66
Arthur van Schendelstraat 816POSTBUS 8090 3503 RB UTRECHT
EXPLORATORY STUDY FOR W
ASTEWATER TREATM
ENT TECHNIQU
ES AND THE EU
ROPEAN WATER FRAM
EWORK DIRECTIVE
2005 34
EXPLORATORY STUDY FOR WASTEWATER TREATMENT TECHNIQUESAND THE EUROPEANWATER FRAMEWORKDIRECTIVE
2005
34
[email protected] WWW.stowa.nl
TEL +31 30 232 11 99 FAX +31 30 232 17 66
Arthur van Schendelstraat 816
POSTBUS 8090 3503 RB UTRECHT
Publicaties van de STOWA kunt u bestellen bij:
Hageman Fulfilment POSTBUS 1110, 3300 CC Zwijndrecht,
TEL +31 78 623 05 00 FAX +31 78 623 05 48 EMAIL [email protected]
onder vermelding van ISBN of STOWA rapportnummer en een afleveradres.
EXPLORATORY STUDY FOR WASTEWATER TREATMENT TECHNIQUES AND THE EUROPEAN WATER FRAMEWORK DIRECTIVE
2005
34
ISBN 90.5773.316.1
RAPPORT
II
STOWA 2005-34 EXPLORATORY STUDY FOR WASTEWATER TREATMENT TECHNIQUES AND THE EUROPEAN WATER FRAMEWORK DIRECTIVE
COLOPHON
Utrecht, 2005
ISSUED STOWA, Utrecht
AUTHORS
ir. P. de Jong (Witteveen+Bos)
ir. J.F. Kramer (Witteveen+Bos)
ir. W.F. Slotema (Witteveen+Bos)
dr. K.A. Third (Witteveen+Bos)
WITH CONTRIBUTION OF
ir. H. Evenblij (Witteveen+Bos)
ir. P.G.B. Hermans (Witteveen+Bos)
dr.ir. E.M. Cornelissen (KIWA)
dr.ir. S.G.J. Heijman (KIWA)
dr. G.F. IJpelaar (KIWA)
SUPERVISING COMMITTEE
ing. R. van Dalen (Waterschap Veluwe)
ir. J.O.J. Duin (Hoogheemraadschap De Stichtse Rijnlanden)
D. Jaksiç MSc (Evides)
ing. R. Neef (Dienst Waterbeheer en Riolering)
ir. S. Gerbens (Wetterskip Fryslân)
ing. G.B.J. Rijs (RIZA)
ir. C.A. Uijterlinde (STOWA)
ir. H.M. van Veldhuizen (Waterschap Groot Salland)
ing. F.H. Wagemaker (RIZA)
drs. B. van der Wal (STOWA)
ing. D. de Vente (Waterschap Regge en Dinkel)
FRONTCOVER
WWTP of Deventer near the river IJssel, picture is property of the Water Board Groot Salland
PRINT Kruyt Grafisch Advies Bureau
STOWA Report number 2005-34
ISBN 90.5773.316.1
III
STOWA 2005-34 EXPLORATORY STUDY FOR WASTEWATER TREATMENT TECHNIQUES AND THE EUROPEAN WATER FRAMEWORK DIRECTIVE
PREFACE
In order to implement the European Water Framework Directive (WFD) water authorities and
policy officers need up to date information on water treatment techniques that can be used
to improve the quality of WWTP-effluent. Based on this information measures can be formu-
lated for the river basin management plans, leading to the required water quality improve-
ments. Apart from that, it is desirable to timely identify possible gaps in available knowledge
and practical experience, hindering implementation of the WFD.
STOWA, RIZA and The Urban Water Cycle (European funding Interreg IIIB; North Sea
Programme ) commissioned an exploratory study to obtain insight in the mentioned needs,
resulting in this report.
This report presents an overview of the substances relevant for WWTPs in view of the WFD.
Next to that, the report provides insight in the available treatment techniques for the sub-
stances to be removed and determines gaps in knowledge. The report may be used as input
for the integral assessment of measures to be taken by water authorities. In order to reduce
the contribution of WWTP effluents to the load of surface waters, point-source reduction
measures in the water cycle should also be considered, for example measures in the sewer
system (e.g. reducing run-off area), reducing industrial and diffuse discharges, moving the
WWTP-outlet and implementation of other possible sanitation methods.
Utrecht, September 2005
The Director of STOWA, ir. J.M.J. Leenen
“Urban Water Cycle” is part of the INTERREG III North Sea Programme. The INTERREG III Programmes are an initiative
of the European Union aiming at fostering of transnational cooperation in the EU between 2000 and 2006. In the North
Sea Programme 7 countries are cooperating to concertedly solve problems in the field of spatial planning, like environ-
mental care, improvement of transport, creating chances for rural areas, instructing how to cope with natural disasters.
The aim of Urban Water Cycle is to show how the water cycle in urban areas can be optimised, taking into account the
existing environment. For more information, see www.interregnorthsea.org
IV
STOWA 2005-34 EXPLORATORY STUDY FOR WASTEWATER TREATMENT TECHNIQUES AND THE EUROPEAN WATER FRAMEWORK DIRECTIVE
SUMMARY
THE EUROPEAN WATER FRAMEWORK DIRECTIVE (WFD)
The European Water Framework Directive recently became effective in December 2000. The
WFD aims to achieve and maintain European water bodies in a “good status”. The European
Commission identified priority substances for which community legislation is likely to be
implemented. These priority substances are considered to be dangerous enough that their
levels need to be systematically reduced in all European countries, in order to achieve a “good
chemical status”. For some of these priority substances zero-discharge will be aimed for by
the year 2021. In addition to the priority substances, new discharge limits will also be esta-
blished for “relevant river basin” substances. Meanwhile, the environmental standards for
surface water specified in the 4th Article on Water Quality Management still apply, as well as
the European Bathing Water- and Dangerous Substances Directives.
After an initial national screening of the effluent produced by wastewater treatment plants
(WWTPs) in The Netherlands, it appeared that a certain number of priority substances are
regularly measured in WWTP-effluent, forming a significant emission source of priority
substances into regional surface water. The Exploratory Study of Wastewater Treatment
Techniques and the European Water Framework Directive provides basic information about
the WFD-relevant substances in WWTP-effluent and treatment techniques that can be applied
now or in the near future to reduce the load of these substances emitted from WWTPs.
SUBSTANCES
A list of substances is set up in this report which includes important and relevant substances
for surface water in The Netherlands, in the light of the WFD. These are substances which are
present in WWTP-effluent and which have been shown in area-specific reports to be present
in higher concentrations than is specified in the surface water legislation. It is assumed that
point-source reduction of these substances will be insufficient to reduce levels. To achieve the
not yet fully established discharge limits for these substances before 2015, extra treatment
steps will be required. The following substances need to be considered:
- the nutrients nitrogen and phosphorous;
- certain polyaromatic hydrocarbons;
- the pesticides hexachlorocyclohexane, atrazine and diuron;
- the metal ions cadmium, copper, zinc, lead and nickel;
- a plasticising agent DEHP (diethylhexylpthalate).
There has been no testing of brominated diphenyl ethers or octyl-/nonylphenol compounds,
since at this moment no limits are available yet. However based on the general occurren-
ce of these substances in WWTP-effluent and the low concentrations at which they cause
adverse effects on aquatic organisms, these substances are also considered as being relevant
to WWTPs.
V
STOWA 2005-34 EXPLORATORY STUDY FOR WASTEWATER TREATMENT TECHNIQUES AND THE EUROPEAN WATER FRAMEWORK DIRECTIVE
TECHNIQUES
The WFD dictates that plans for the required measures shall be in place by 2009, such that
the desired water quality can be obtained by 2015. This time schedule requires a choice of
techniques that can be operational at WWTPs within a period of three to five years. Further
selection criteria used for an inventory of treatment techniques are:
- the tec hniques will be capable of removing the selected substances from wwtp-effluent to
the standards of surface water;
- the techniques will be capable of handling large flow rates;
- the techniques will preferably be capable of removing a broad spectrum of substances;
- the techniques preferably consume minimal energy, additional chemicals and building
space.
Current techniques for treatment of domestic wastewater are not designed to remove the
selected substances from wastewater. Applicable treatment techniques have been selected
based on their treatment principle and their estimated effectiveness for treating WWTP-ef-
fluent. This estimation is partly based on results from pilot-scale tests and/or full-scale ap-
plications for the advanced treatment of WWTP-effluent. Where inadequate information is
available over certain techniques the potential effectiveness of the technique was estimated
from other applications such as drinking water production or industrial water treatment.
In addition to end-of-pipe techniques for post-treatment of WWTP-effluent, attention is also
paid to integrated techniques, amongst which the Membrane Bioreactor. For quality-impro-
vement within the WFD the Membrane Bioreactor is considered as an activated sludge system
followed by an ultra- or microfiltration membrane.
TREATMENT SCENARIOS
Many of the WFD-substances are more or less present in suspended or colloidal particles.
Removal of suspended solids from the effluent as a first step therefore leads to improvement
of the quality of the effluent. The extra advantage is that disturbing effects on the end-of-pipe
techniques are avoided.
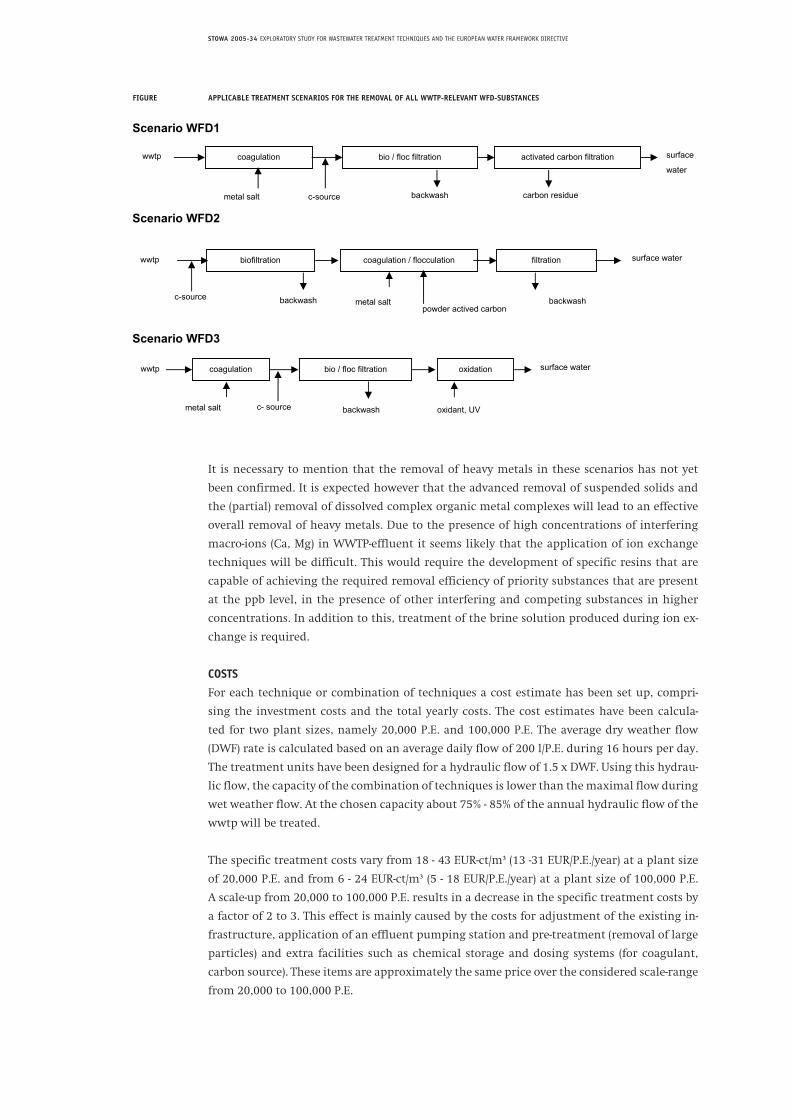
The treatment scenarios for removal of WFD-substances are largely based on systems in which
advanced removal of suspended solids, nutrients, dissolved organic macromolecules and me-
tals can be achieved, in combination with adsorptive or oxidative techniques for the removal
of organic micro-contaminants and pesticides. With the techniques applicable for organic
micro-contaminants, also the hormone disrupting substances and medicinal substances are
removed. The applicable treatment scenarios for complete removal of all WWTP-relevant
WFD-substances are shown in the figure.
VI
STOWA 2005-34 EXPLORATORY STUDY FOR WASTEWATER TREATMENT TECHNIQUES AND THE EUROPEAN WATER FRAMEWORK DIRECTIVE
FIGURE APPLICABLE TREATMENT SCENARIOS FOR THE REMOVAL OF ALL WWTP-RELEVANT WFD-SUBSTANCES
It is necessary to mention that the removal of heavy metals in these scenarios has not yet
been confirmed. It is expected however that the advanced removal of suspended solids and
the (partial) removal of dissolved complex organic metal complexes will lead to an effective
overall removal of heavy metals. Due to the presence of high concentrations of interfering
macro-ions (Ca, Mg) in WWTP-effluent it seems likely that the application of ion exchange
techniques will be difficult. This would require the development of specific resins that are
capable of achieving the required removal efficiency of priority substances that are present
at the ppb level, in the presence of other interfering and competing substances in higher
concentrations. In addition to this, treatment of the brine solution produced during ion ex-
change is required.
COSTS
For each technique or combination of techniques a cost estimate has been set up, compri-
sing the investment costs and the total yearly costs. The cost estimates have been calcula-
ted for two plant sizes, namely 20,000 P.E. and 100,000 P.E. The average dry weather flow
(DWF) rate is calculated based on an average daily flow of 200 l/P.E. during 16 hours per day.
The treatment units have been designed for a hydraulic flow of 1.5 x DWF. Using this hydrau-
lic flow, the capacity of the combination of techniques is lower than the maximal flow during
wet weather flow. At the chosen capacity about 75% - 85% of the annual hydraulic flow of the
wwtp will be treated.
The specific treatment costs vary from 18 - 43 EUR-ct/m³ (13 -31 EUR/P.E./year) at a plant size
of 20,000 P.E. and from 6 - 24 EUR-ct/m³ (5 - 18 EUR/P.E./year) at a plant size of 100,000 P.E.
A scale-up from 20,000 to 100,000 P.E. results in a decrease in the specific treatment costs by
a factor of 2 to 3. This effect is mainly caused by the costs for adjustment of the existing in-
frastructure, application of an effluent pumping station and pre-treatment (removal of large
particles) and extra facilities such as chemical storage and dosing systems (for coagulant,
carbon source). These items are approximately the same price over the considered scale-range
from 20,000 to 100,000 P.E.
Witteveen+Bos STO126-1 Exploratory Study for Water Treatment Techniques and the European Water Framework Directive final d.d. november 25, 2005
TREATMENT SCENARIOS Many of the WFD-substances are more or less present in suspended or colloidal particles. Removal of suspended solids from the effluent as a first step therefore leads to improvement of the quality of the effluent. The extra advantage is that disturbing effects on the end-of-pipe techniques are avoided.
The treatment scenarios for removal of WFD-substances are largely based on systems in which advanced removal of suspended solids, nutrients, dissolved organic macromolecules and metals can be achieved, in combination with adsorptive or oxidative techniques for the removal of organic micro-contaminants and pesticides. With the techniques applicable for organic micro-contaminants, also the hormone disrupting substances and medicinal substances are removed. The applicable treatment scenarios forcomplete removal of all WWTP-relevant WFD-substances are shown in the figure.
FIGURE APPLICABLE TREATMENT SCENARIOS FOR THE REMOVAL OF ALL WWTP-RELEVANT WFD-SUBSTANCES
Scenario WFD1
Scenario WFD2
Scenario WFD3
It is necessary to mention that the removal of heavy metals in these scenarios has not yet been confirmed. It is expected however that the advanced removal of suspended solids and the (partial) removal of dissolved complex organic metal complexes will lead to aneffective overall removal of heavy metals. Due to the presence of high concentrations of interfering macro-ions (Ca, Mg) in WWTP-effluent it seems likely that the application of ion exchange techniques will be difficult. This would require the development of specific resins that are capable of achieving the required removal efficiency of priority substances that are present at the ppb level, in the presence of other interfering and competing substances in higher concentrations. In addition to this, treatment of the brinesolution produced during ion exchange is required.
COSTSFor each technique or combination of techniques a cost estimate has been set up, comprising the investment costs and the total yearly costs. The cost estimates have been calculated for two plant sizes, namely 20,000 P.E. and 100,000 P.E. The average dry weatherflow (DWF) rate is calculated based on an average daily flow of 200 l/P.E. during 16 hours per day. The treatment units have beendesigned for a hydraulic flow of 1.5 x DWF. Using this hydraulic flow, the capacity of the combination of techniques is lower thanthe maximal flow during wet weather flow. At the chosen capacity about 75% - 85% of the annual hydraulic flow of the wwtp will betreated.
The specific treatment costs vary from 18 - 43 EUR-ct/m³ (13 -31 EUR/P.E./year) at a plant size of 20,000 P.E. and from 6 - 24 EUR-ct/m³ (5 - 18 EUR/P.E./year) at a plant size of 100,000 P.E. A scale-up from 20,000 to 100,000 P.E. results in a decrease in the specific treatment costs by a factor of 2 to 3. This effect is mainly caused by the costs for adjustment of the existing infrastructure,
wwtp activated carbon filtration
metal salt
coagulation bio / floc filtration
carbon residue backwash
surface
water
c-source
metal salt
wwtp coagulation / flocculation filtration
c-source
biofiltration
backwash backwash
surface water
powder actived carbon
wwtp
metal salt
coagulation bio / floc filtration
backwash
oxidation
oxidant, UV
surface water
c- source
VII
STOWA 2005-34 EXPLORATORY STUDY FOR WASTEWATER TREATMENT TECHNIQUES AND THE EUROPEAN WATER FRAMEWORK DIRECTIVE
Nutrient removal in a single-stage filter configuration combining coagulation and filtration
with denitrification in one process unit, results in the lowest treatment costs. The highest
costs are incurred when coagulation and filtration are used in combination with advanced
oxidation (UV/H2O2). Biofiltration with powdered activated carbon dosage combined with
coagulation and filtration or biofiltration with activated carbon filtration, leads to the lowest
costs for the “WFD-scenario”.
GAPS IN KNOWLEDGE
The implementation of the WFD policy will lead The Netherlands and Europe into a new
phase of domestic wastewater treatment. This will lead to a new focus in wastewater treat-
ment in which the number of relevant substances to be removed will be largely expanded,
leading to the application of new techniques and the introduction of new cost factors. Each
of these aspects still contain several gaps in the knowledge and further research is necessary
before 2009 in order to implement adequate measures to cope with the new legislation.
For some WFD-substances, especially organic micro-contaminants, pesticides, hormone dis-
rupters and medicinal substances, there is little or no data available for WWTP-effluent. More
information regarding the distribution of these components between the water phase and
the suspended material phase is required to enable an appropriate choice of treatment.
The different treatment scenarios have been compiled based on the expectation that the re-
quired treatment standards for the relevant WFD-substances will be achieved with these tech-
niques. This expectation is partially based on results from pilot scale research results and/or
full-scale applications. In cases where insufficient information was available the potential
removal efficiencies have been derived from other applications such as drinking water pro-
duction or industrial wastewater treatment. This means that further research is needed in
order to establish the exact removal efficiencies of these treatment techniques for a number
of substances, including pesticides, organic micro contaminants, heavy metals, hormone dis-
rupters and medicinal substances.
The estimated costs for a number of techniques (especially microfiltration / ultrafiltration,
activated carbon treatment and oxidation) have been extrapolated from applications in the
drinking water sector in cases where no information is available on WWTP-effluent. A risk
in this approach is that the actual costs may be higher or lower depending on the develop-
ment of the construction costs (e.g. if a more economical construction is developed), or on
the development of the operational costs (e.g. if the required chemical dosage is higher than
thought). The applicability of these techniques to WWTPs in practice will depend on the
costs. It is therefore important to test these cost estimates again as soon as further insight is
available in effluent treatment (laboratory → pilot → demonstration scale), and adjust them
where necessary.
VIII
STOWA 2005-34 EXPLORATORY STUDY FOR WASTEWATER TREATMENT TECHNIQUES AND THE EUROPEAN WATER FRAMEWORK DIRECTIVE
STOWA IN BRIEF
The Institute of Applied Water Research (in short, STOWA) is a research platform for Dutch
water controllers. STOWA participants are ground and surface water managers in rural and
urban areas, managers of domestic wastewater purification installations and dam inspectors.
In 2002 that includes all the country’s water boards, the provinces and the State.
These water controllers avail themselves of STOWA’s facilities for the realisation of all
kinds of applied technological, scientific, administrative-legal and social-scientific research
activities that may be of communal importance. Research programmes are developed on the
basis of requirement reports generated by the institute’s participants. Research suggestions
proposed by third parties such as centres of learning and consultancy bureaux, are more than
welcome. After having received such suggestions STOWA then consults its participants in
order to verify the need for such proposed research.
STOWA does not conduct any research itself, instead it commissions specialised bodies to do
the required research. All the studies are supervised by supervisory boards composed of staff
from the various participating organisations and, where necessary, experts are brought in.
All the money required for research, development, information and other services is raised by
the various participating parties. At the moment, this amounts to an annual budget of some
six million euro.
For telephone contact STOWA’s number is: +31 (0)30-2321199.
The postal address is: STOWA, P.O. Box 8090, 3503 RB, Utrecht.
E-mail: [email protected].
Website: www.stowa.nl.
1
STOWA 2005-34 EXPLORATORY STUDY FOR WASTEWATER TREATMENT TECHNIQUES AND THE EUROPEAN WATER FRAMEWORK DIRECTIVE
EXPLORATORY STUDY FOR WASTEWATER TREATMENT
TECHNIQUES AND THE EUROPEAN WATER FRAMEWORK DIRECTIVE
CONTENTS
PREFACE
SUMMARY
STOWA IN BRIEF
1 INTRODUCTION 1
2 BACKGROUND 4
3 RELEVANT SUBSTANCES 6
3.1 INTRODUCTION 6
3.2 LIST OF SUBSTANCES 6
3.3 WWTP-EFFLUENT AND THE LIST OF SUBSTANCES 7
STOWA 2005-34 EXPLORATORY STUDY FOR WASTEWATER TREATMENT TECHNIQUES AND THE EUROPEAN WATER FRAMEWORK DIRECTIVE
2
STOWA 2005-34 EXPLORATORY STUDY FOR WASTEWATER TREATMENT TECHNIQUES AND THE EUROPEAN WATER FRAMEWORK DIRECTIVE
4 TREATMENT TECHNIQUES 9
4.1 INTRODUCTION 9
4.2 CHARACTERISTICS OF EFFLUENT IN RELATION TO WATER TREATMENT TECHNIQUES 9
4.3 APPLICABLE TREATMENT TECHNIQUES 11
4.3.1 BIOLOGICAL TECHNIQUES 13
4.3.2 OXIDATIVE TECHNIQUES 16
4.3.3 CHEMICAL PRECIPITATION TECHNIQUES 17
4.3.4 ADSORPTION TECHNIQUES 19
4.3.5 BED FILTRATION 20
4.3.6 SCREEN- AND MEMBRANE FILTRATION 21
4.3.7 DISINFECTION 23
4.3.8 INTEGRATED TREATMENT TECHNIQUES 24
4.3.9 TECHNIQUES AND SUBSTANCES 24
5 TREATMENT SCENARIOS 27
5.1 BASIC ASSUMPTIONS 27
5.2 NUTRIENTS 30
5.3 ORGANIC MICRO-CONTAMINANTS, PESTICIDES, HORMONE DISRUPTERS AND MEDICINAL SUBSTANCES 31
5.4 HEAVY METALS AND METALLOIDS 33
5.5 MICRO-ORGANISMS AND VIRUSES 34
5.6 WFD TREATMENT SCENARIOS 35
5.7 COSTS 37
6 GAPS IN THE KNOWLEDGE 40
6.1 SUBSTANCES 40
6.2 TECHNIQUES 40
6.3 RESIDUAL WASTE STREAMS 42
6.4 COSTS 43
7 REFERENCE LIST 44
Appendices
I List of Substances 47
II Overview of Long and Short List Treatment Techniques 51
III Fact Sheets 53
IV Basic Assumptions for Cost Estimation 89
1
STOWA 2005-34 EXPLORATORY STUDY FOR WASTEWATER TREATMENT TECHNIQUES AND THE EUROPEAN WATER FRAMEWORK DIRECTIVE
1
INTRODUCTION
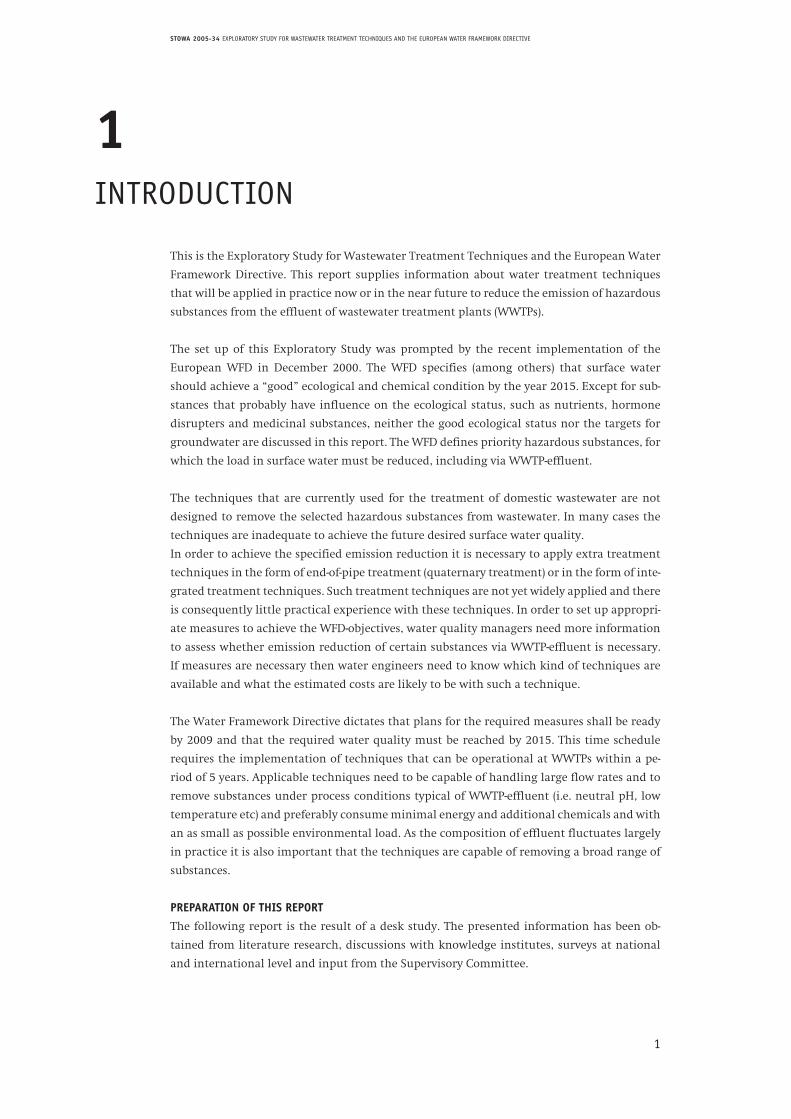
This is the Exploratory Study for Wastewater Treatment Techniques and the European Water
Framework Directive. This report supplies information about water treatment techniques
that will be applied in practice now or in the near future to reduce the emission of hazardous
substances from the effluent of wastewater treatment plants (WWTPs).
The set up of this Exploratory Study was prompted by the recent implementation of the
European WFD in December 2000. The WFD specifies (among others) that surface water
should achieve a “good” ecological and chemical condition by the year 2015. Except for sub-
stances that probably have influence on the ecological status, such as nutrients, hormone
disrupters and medicinal substances, neither the good ecological status nor the targets for
groundwater are discussed in this report. The WFD defines priority hazardous substances, for
which the load in surface water must be reduced, including via WWTP-effluent.
The techniques that are currently used for the treatment of domestic wastewater are not
designed to remove the selected hazardous substances from wastewater. In many cases the
techniques are inadequate to achieve the future desired surface water quality.
In order to achieve the specified emission reduction it is necessary to apply extra treatment
techniques in the form of end-of-pipe treatment (quaternary treatment) or in the form of inte-
grated treatment techniques. Such treatment techniques are not yet widely applied and there
is consequently little practical experience with these techniques. In order to set up appropri-
ate measures to achieve the WFD-objectives, water quality managers need more information
to assess whether emission reduction of certain substances via WWTP-effluent is necessary.
If measures are necessary then water engineers need to know which kind of techniques are
available and what the estimated costs are likely to be with such a technique.
The Water Framework Directive dictates that plans for the required measures shall be ready
by 2009 and that the required water quality must be reached by 2015. This time schedule
requires the implementation of techniques that can be operational at WWTPs within a pe-
riod of 5 years. Applicable techniques need to be capable of handling large flow rates and to
remove substances under process conditions typical of WWTP-effluent (i.e. neutral pH, low
temperature etc) and preferably consume minimal energy and additional chemicals and with
an as small as possible environmental load. As the composition of effluent fluctuates largely
in practice it is also important that the techniques are capable of removing a broad range of
substances.
PREPARATION OF THIS REPORT
The following report is the result of a desk study. The presented information has been ob-
tained from literature research, discussions with knowledge institutes, surveys at national
and international level and input from the Supervisory Committee.
2
STOWA 2005-34 EXPLORATORY STUDY FOR WASTEWATER TREATMENT TECHNIQUES AND THE EUROPEAN WATER FRAMEWORK DIRECTIVE
The approach used in setting up the report is one of converging information streams: star-
ting with a very broad topic, information was sifted through and converged along the way,
leading in the end to the set up of an overview that is practical for the user. To achieve this
choices were made, which are outlined in each chapter.
The research focuses in parallel on the one hand on (hazardous) substances, groups of sub-
stances and characteristics of substances, and on the other hand on the treatment techniques
capable of removing them from water. For the selection of techniques it was chosen to inves-
tigate “broad spectrum” techniques. After all, the chance that only one specific substance
will be present in the effluent is minimal. In practically all cases there will be a mixture of
substances, which above all will likely change in the course of time.
The estimated costs calculated for combinations of techniques in chapter 5 are based on
typical ballpark figures obtained from practical experience. They provide an indication of
the expected costs per cubic metre treated water in relation to the plant size, however they
should not be used for estimation of investment costs.
READER’S GUIDE
The report is structured as follows:
In chapter 2 the background and framework of the WFD is explained together with the pos-
sible consequences for WWTP-effluent. In chapter 3 the hazardous substances for which
emission will probably need to be reduced are outlined and presented in a List of Priority
Substances. The set up of this list is based on the list of priority hazardous substances and
the list of “Rhine and Muese relevant substances”. Groups of substances were selected from
the total (complete) list and the treatment techniques are aimed at removing one or more of
these groups of substances.
Chapter 4 begins with the selection of treatment techniques that can be considered appli-
cable to WWTP-effluent. These techniques are detailed further in the attached Fact Sheets,
which contain a description of the techniques, required conditions for application and achie-
vable removal efficiencies.
In chapter 5 the techniques that are described as unit operations in chapter 4 are combined
into integrated treatment configurations. These configurations are considered the most pro-
mising for achieving the WFD-objectives and are set up with the aim of removing the most
commonly occurring hazardous substances form waste streams. Attention is not only paid to
the water stream (removal of substances from effluent) but also to the treatment and disposal
of residual products (brine, flush water, sludge). The estimated costs for these treatment con-
figurations are calculated for two plant sizes.
In chapter 6 the gaps in the knowledge that may form a barrier to the implementation of the
WFD are described. This may involve gaps in the available information that make it difficult
to draw solid conclusions regarding the applicability of certain techniques, but may also
involve practical observations for which there are as yet no solutions. Recommendations are
provided for these problems.
3
STOWA 2005-34 EXPLORATORY STUDY FOR WASTEWATER TREATMENT TECHNIQUES AND THE EUROPEAN WATER FRAMEWORK DIRECTIVE
Finally, there are two comments that need to be made regarding the use of this report:
The composition of effluent varies from treatment plant to treatment plant, as does the con-
dition of the receiving surface water. To move from the current situation to the desired situ-
ation, certain specific measures are necessary. This report provides indications and possible
solutions but is not intended to generate area-specific solutions.
This report is a snapshot in time. The current available knowledge and state-of-the-art is unra-
velled and presented. In addition to this the current gaps in the knowledge are highlighted.
In a few years time the amount of available knowledge will inevitably increase, technologies
will change and the costs will change.
4
STOWA 2005-34 EXPLORATORY STUDY FOR WASTEWATER TREATMENT TECHNIQUES AND THE EUROPEAN WATER FRAMEWORK DIRECTIVE
2
BACKGROUND
On the 22nd December 2000 the European Water Framework Directive (WFD) became effec-
tive. The WFD aims to achieve and maintain European water bodies in a “good status”.
In 2004 water quality managers began with an analysis and drafting of reports on the “cur-
rent status of surface water”. In these reports the current situation for each specific water
body is described, including the significant loads, current geography and type of water body,
as well as an estimate of the feasibility for achieving the WFD-objectives by 2015. These re-
ports provide a better insight into the significant emission sources for each region and/or
the dispersion routes of the EU-defined priority substances (2000/60/EG, appendix X), for
which EU legislation is likely to be implemented (the “good chemical surface water status”).
The priority substances are considered to be hazardous enough for the environment that
their levels need to be systematically reduced in all EU states. For some particularly hazar-
dous substances, new zero-discharge standards will be introduced in 2021. The reduction
of the load of hazardous substances in surface water will gain high priority. Aside from the
33 priority substances, new discharge limits will also be implemented for other “relevant
area-specific” substances. Meanwhile, the environmental standards for surface water in The
Netherlands specified in the 4th Article on Water Quality Management, the European Bathing
Water directives (76/160/EEG) and Hazardous Substances directives (76/464/EEG) still apply.
Depending on the desired biological condition of surface water it is likely that region-specific
standards will also be developed for nitrogen and phosphorous concentrations.
In several studies over the last few years it has become clear that WWTP-effluent forms a
significant emission source for priority substances in regional surface water. In an initial
national screening of the effluent produced by WWTPs it appeared that a certain number
of the priority substances are regularly measured in WWTP-effluent. Emitted substances in
WWTP-effluent can be reduced in a “point source” approach and/or “end-of-pipe” approach.
Important principles in these approaches are for example “the polluter pays”, “chance of
success upon realisation of the desired objective within the required time-frame”, “cost ef-
fectiveness” etc. National screenings of these principles have been carried out in the light of
the Water Surveys (RIZA, 1999).
To what extent these measures will actually have a visible effect on the receiving surface
water depends on other emission sources that influence the quality of the water bodies. This
is location-specific and should be expressed in area-specific analyses that provide insight into
the useful effect and the associated costs. Whatever the case, it is inevitable that measures
will need to be taken at several wastewater treatment plants. This is discussed in the article
“Pragmatic implementation of the WFD” (V&W, 2004).
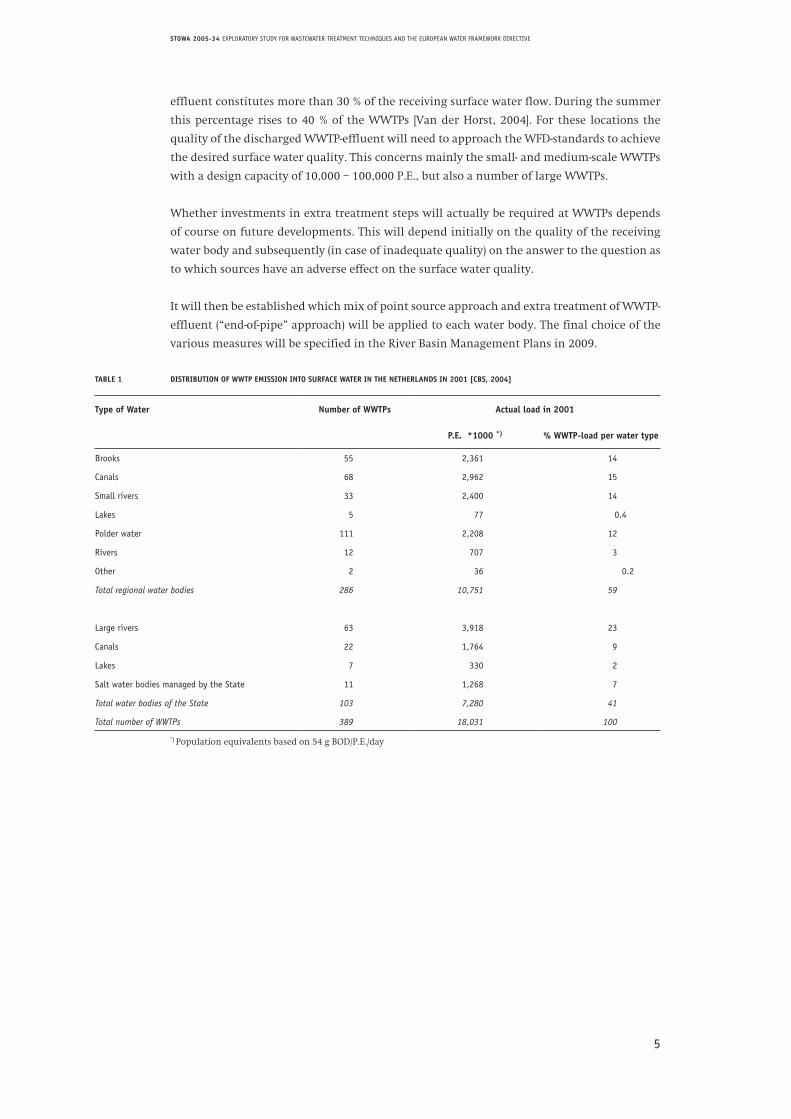
In 2001 The Netherlands operated 389 WWTPs with a total capacity of 25.3 million popula-
tion equivalents (P.E.), which altogether were loaded with approximately 18 million P.E. [CBS,
2004]. A relatively large number of these WWTPs release effluent into small regional water
bodies; approximately 40 % of WWTP-effluent is released into brooks, lakes, small rivers and
polders (see table 1). It has been calculated that in the case of 20 % of the WWTPs, the WWTP-
5
STOWA 2005-34 EXPLORATORY STUDY FOR WASTEWATER TREATMENT TECHNIQUES AND THE EUROPEAN WATER FRAMEWORK DIRECTIVE
effluent constitutes more than 30 % of the receiving surface water flow. During the summer
this percentage rises to 40 % of the WWTPs [Van der Horst, 2004]. For these locations the
quality of the discharged WWTP-effluent will need to approach the WFD-standards to achieve
the desired surface water quality. This concerns mainly the small- and medium-scale WWTPs
with a design capacity of 10,000 – 100,000 P.E., but also a number of large WWTPs.
Whether investments in extra treatment steps will actually be required at WWTPs depends
of course on future developments. This will depend initially on the quality of the receiving
water body and subsequently (in case of inadequate quality) on the answer to the question as
to which sources have an adverse effect on the surface water quality.
It will then be established which mix of point source approach and extra treatment of WWTP-
effluent (“end-of-pipe” approach) will be applied to each water body. The final choice of the
various measures will be specified in the River Basin Management Plans in 2009.
TABLE 1 DISTRIBUTION OF WWTP EMISSION INTO SURFACE WATER IN THE NETHERLANDS IN 2001 [CBS, 2004]
Type of Water Number of WWTPs Actual load in 2001
P.E. *1000 *) % WWTP-load per water type
Brooks 55 2,361 14
Canals 68 2,962 15
Small rivers 33 2,400 14
Lakes 5 77 0.4
Polder water 111 2,208 12
Rivers 12 707 3
Other 2 36 0.2
Total regional water bodies 286 10,751 59
Large rivers 63 3,918 23
Canals 22 1,764 9
Lakes 7 330 2
Salt water bodies managed by the State 11 1,268 7
Total water bodies of the State 103 7,280 41
Total number of WWTPs 389 18,031 100
*) Population equivalents based on 54 g BOD/P.E./day
6
STOWA 2005-34 EXPLORATORY STUDY FOR WASTEWATER TREATMENT TECHNIQUES AND THE EUROPEAN WATER FRAMEWORK DIRECTIVE
3
RELEVANT SUBSTANCES
3.1 INTRODUCTION
One of the objectives of the Water Framework Directive is the achievement of a good chemical
condition of all surface water bodies in 2015 (article 4, Directive 2000/60/EG). The good che-
mical condition is relevant for all substances for which environmental objectives have been
formulated at EU level. This includes substances reported in the list of priority substances as
well as substances included in the earlier European environmental directives (Appendix IX,
directive 2000/60/EG), and for substances included in directives that may still be established
in the near future. Based on article 4 and Appendix V of the WFD, European States should
derive their own directives for all polluting substances that are important for a Member State
or water body, based on the WFD-approach. Substances are considered “important” if they are
released in significant amounts into the specific water bodies.
In this chapter the substances that is relevant for WWTPs and therefore also for the Exploratory
Study for Wastewater Treatment Techniques and the European Water Framework Directive,
are presented in a “list of substances”. This concerns substances that are present in WWTP-
effluent and which have been shown in river basin characterisation reports to be present in
levels higher than those specified in the standards for surface water. To achieve the not yet
fully established discharge limits for these substances before 2015, extra treatment steps at
the WWTP will be required, besides point source reduction measures.
3.2 LIST OF SUBSTANCES
For the set up of the List of Substances, European directives were used. Documents were also
consulted regarding substances which adversely affect the environmental state upon release
into the surface water, and for which the government has not yet set standards.
In this paragraph the directives and lists of substances derived from these directives will first
be discussed. Finally, substances that influence the ecological condition of the water will be
considered. The list of substances established in this chapter consists of 77 substances and is
presented in Appendix I.
DIRECTIVES
For the set up of the list of substances that are relevant for the WFD, the following substance
directives were used:
- The list of priority and priority hazardous substances of the European Water Framework
Directive (2000/60/EG).
This list contains substances that are considered to be hazardous enough that their
levels need to be systematically reduced in all European Member States. All priority and
priority hazardous WFD-substances are included in the List of Substances in this report.
7
STOWA 2005-34 EXPLORATORY STUDY FOR WASTEWATER TREATMENT TECHNIQUES AND THE EUROPEAN WATER FRAMEWORK DIRECTIVE
For priority substances, the measures are aimed at achieving a progressive reduction of
emissions. The measures for priority hazardous substances are aimed at ceasing all emis-
sions within 20 years (zero-discharge).
- The substances in List I of the Dangerous Substances Directive (76/464/EEG).
The so-called “black” substances in List I of the Dangerous Substances Directive are in-
cluded in the Basic Substances List in this report. The candidate substances in the “black
list” are not included.
For the specified “black” substances of the Dangerous Substances Directive the same re-
quired measures apply as for the priority and priority dangerous substances.
- The “relevant area-specific substances” of the International Commission for Protection of
the Rhine and the Meuse.
In The Netherlands the relevant river basin management district in the WFD are the Eems,
Meuse, Schelde en Rhine. At the time of writing this report the lists of relevant substances
were only available for the Rhine- and Meuse river basins. These substances are also in-
cluded in the List of Substances.
- The biological parameters of the future European Bathing Water Directive
(Com(2002) 581).
Based on the new Bathing Water Directive, the microorganisms included under the
Intestinal Enterococci and the strain of bacteria Escherichia coli have been included in
the List.
Although viruses are not yet included in the new EU Bathing Water Directive, it is
expected that they will be included in future stricter directives. For this reason viruses
have been included in the List of Substances.
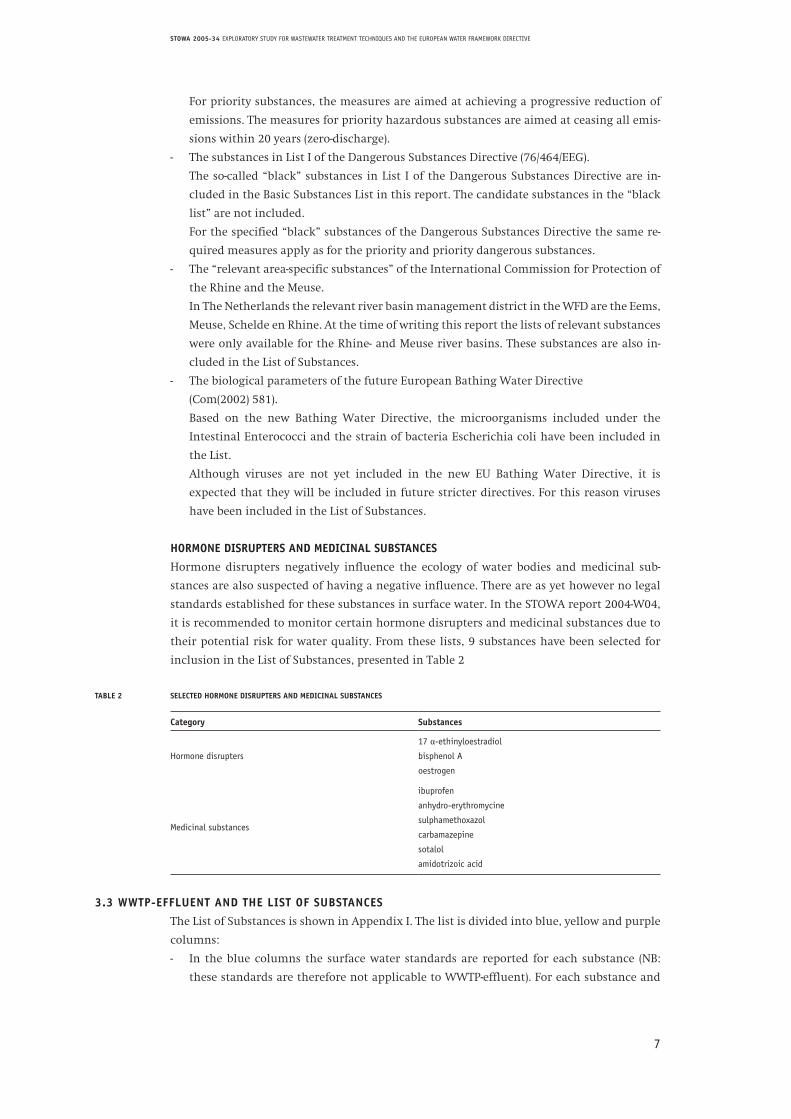
HORMONE DISRUPTERS AND MEDICINAL SUBSTANCES
Hormone disrupters negatively influence the ecology of water bodies and medicinal sub-
stances are also suspected of having a negative influence. There are as yet however no legal
standards established for these substances in surface water. In the STOWA report 2004-W04,
it is recommended to monitor certain hormone disrupters and medicinal substances due to
their potential risk for water quality. From these lists, 9 substances have been selected for
inclusion in the List of Substances, presented in Table 2
TABLE 2 SELECTED HORMONE DISRUPTERS AND MEDICINAL SUBSTANCES
Category Substances
Hormone disrupters
17 α-ethinyloestradiol
bisphenol A
oestrogen
Medicinal substances
ibuprofen
anhydro-erythromycine
sulphamethoxazol
carbamazepine
sotalol
amidotrizoic acid
3.3 WWTP-EFFLUENT AND THE LIST OF SUBSTANCES
The List of Substances is shown in Appendix I. The list is divided into blue, yellow and purple
columns:
- In the blue columns the surface water standards are reported for each substance (NB:
these standards are therefore not applicable to WWTP-effluent). For each substance and
8
STOWA 2005-34 EXPLORATORY STUDY FOR WASTEWATER TREATMENT TECHNIQUES AND THE EUROPEAN WATER FRAMEWORK DIRECTIVE
each standard a colour code is allocated to indicate whether (according to expectations)
the water quality standards in surface water will be exceeded.
- In the yellow columns it is indicated how frequently and in which concentration range
the substances have been detected in WWTP effluent, up until the present day.
- In the purple columns an indication is given as to whether the substance is considered
relevant for WWTP. The level of relevance is divided into three levels (orange, yellow or
green):
- If the substance occurs in WWTP-effluent and exceeds the discharge standard for sur-
face water, the substance is marked with orange.
- Substances that have been detected in WWTP-effluent but which do not exceed al-
lowed levels in surface water are marked as yellow (restricted relevance).
- If the substance is measured in less than 5% of the measurements of WWTP-effluent it
is marked with green, regardless of whether the substance exceeds the surface water
standards or not.
The data presented in the table come from a data file of RIZA. In this file (Watson) the research
results over the period 2000 – 2004 are given for a large number of substances. This file is
supplemented with inventories from certain regional water quality managers and forms the
basis for the given concentration range, within which the various substances in WWTP-efflu-
ent have been shown to be present in WWTP effluent.
Based on the current available information, the following WWTP-relevant substances are im-
portant:
- the nutrients nitrogen and phosphorous;
- certain polyaromatic hydrocarbons;
- the pesticides hexachlorocyclohexane, atrazine and diuron;
- the metal ions cadmium, copper, zinc, lead and nickel;
- a plasticising additive DEHP (diethylhexylpthalate).
As yet there has been no testing of brominated diphenyl ethers or octyl-/nonylphenol com-
pounds, however based on the general occurrence of these substances in WWTP-effluent and
the low concentrations at which they cause adverse effects on aquatic organisms, these sub-
stances are also considered as being relevant to WWTPs.
This selection is a snapshot in time based on the current available information. As more infor-
mation becomes available it is possible that the information shown in the table changes.
9
STOWA 2005-34 EXPLORATORY STUDY FOR WASTEWATER TREATMENT TECHNIQUES AND THE EUROPEAN WATER FRAMEWORK DIRECTIVE
4
TREATMENT TECHNIQUES
4.1 INTRODUCTION
In order to achieve the required ecological and chemical quality of surface water in 2015,
extra discharge treatment steps will have to be implemented at WWTPs. This may require a
different approach for each WWTP, depending on the occurrence of substances in the efflu-
ent, the configuration of the WWTP, the nature of the receiving water body and the contribu-
tion of the effluent load of contaminants to the total loading of the surface water.
This chapter discusses water treatment techniques that can potentially be applied to WWTPs
to achieve the new effluent standards The selection of techniques is based on literature, in-
ventory studies by water authorities and knowledge institutes and expert judgement. In this
case special attention is given to documented full-scale applications, pilot-scale studies and
estimated feasibility.
The selection of techniques for the Short List is based on literature, inventory studies by water
authorities and knowledge institutes, and expert judgement. In this case special attention is
given to documented full-scale applications, pilot-scale studies and estimated feasibility.
For each applicable technique a Fact Sheet has been created, in which the technical back-
ground, treatment principle, design guidelines and costs are presented (see Appendix III).
Before the techniques are described, the nature of WWTP-effluent is discussed in relation
to the consequences for treatment techniques. At the end of this chapter a summary table
is presented in which potential techniques for the removal of the problem substances from
effluent is presented.
4.2 CHARACTERISTICS OF EFFLUENT IN RELATION TO WATER TREATMENT TECHNIQUES
The efficiency of treatment techniques for the removal of priority substances, which occur
typically in extremely low concentrations, is strongly influenced by the characteristics of
the effluent as a whole and the presence of other components. It is therefore useful to first
consider the relationship between the effluent characteristics and the influence of these cha-
racteristics on the techniques.
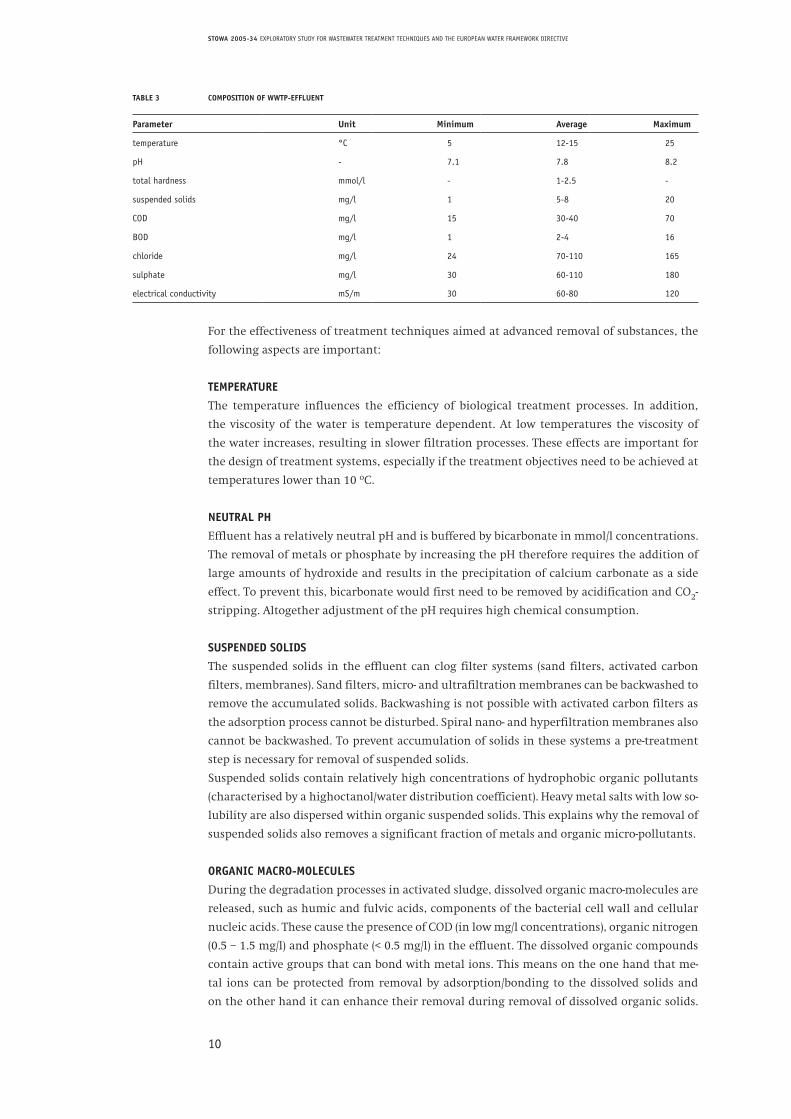
Table 3 indicates the typical composition of the effluent of modern WWTPs that achieve the
discharge standards specified in the Urban WasteWater Directive (see STOWA 2001-14).
10
STOWA 2005-34 EXPLORATORY STUDY FOR WASTEWATER TREATMENT TECHNIQUES AND THE EUROPEAN WATER FRAMEWORK DIRECTIVE
TABLE 3 COMPOSITION OF WWTP-EFFLUENT
Parameter Unit Minimum Average Maximum
temperature °C 5 12-15 25
pH - 7.1 7.8 8.2
total hardness mmol/l - 1-2.5 -
suspended solids mg/l 1 5-8 20
COD mg/l 15 30-40 70
BOD mg/l 1 2-4 16
chloride mg/l 24 70-110 165
sulphate mg/l 30 60-110 180
electrical conductivity mS/m 30 60-80 120
For the effectiveness of treatment techniques aimed at advanced removal of substances, the
following aspects are important:
TEMPERATURE
The temperature influences the efficiency of biological treatment processes. In addition,
the viscosity of the water is temperature dependent. At low temperatures the viscosity of
the water increases, resulting in slower filtration processes. These effects are important for
the design of treatment systems, especially if the treatment objectives need to be achieved at
temperatures lower than 10 oC.
NEUTRAL PH
Effluent has a relatively neutral pH and is buffered by bicarbonate in mmol/l concentrations.
The removal of metals or phosphate by increasing the pH therefore requires the addition of
large amounts of hydroxide and results in the precipitation of calcium carbonate as a side
effect. To prevent this, bicarbonate would first need to be removed by acidification and CO2-
stripping. Altogether adjustment of the pH requires high chemical consumption.
SUSPENDED SOLIDS
The suspended solids in the effluent can clog filter systems (sand filters, activated carbon
filters, membranes). Sand filters, micro- and ultrafiltration membranes can be backwashed to
remove the accumulated solids. Backwashing is not possible with activated carbon filters as
the adsorption process cannot be disturbed. Spiral nano- and hyperfiltration membranes also
cannot be backwashed. To prevent accumulation of solids in these systems a pre-treatment
step is necessary for removal of suspended solids.
Suspended solids contain relatively high concentrations of hydrophobic organic pollutants
(characterised by a highoctanol/water distribution coefficient). Heavy metal salts with low so-
lubility are also dispersed within organic suspended solids. This explains why the removal of
suspended solids also removes a significant fraction of metals and organic micro-pollutants.
ORGANIC MACRO-MOLECULES
During the degradation processes in activated sludge, dissolved organic macro-molecules are
released, such as humic and fulvic acids, components of the bacterial cell wall and cellular
nucleic acids. These cause the presence of COD (in low mg/l concentrations), organic nitrogen
(0.5 – 1.5 mg/l) and phosphate (< 0.5 mg/l) in the effluent. The dissolved organic compounds
contain active groups that can bond with metal ions. This means on the one hand that me-
tal ions can be protected from removal by adsorption/bonding to the dissolved solids and
on the other hand it can enhance their removal during removal of dissolved organic solids.
11
STOWA 2005-34 EXPLORATORY STUDY FOR WASTEWATER TREATMENT TECHNIQUES AND THE EUROPEAN WATER FRAMEWORK DIRECTIVE
The presence of dissolved organic material can interfere with treatment techniques such as
adsorption or advanced oxidation, which are focused on the removal of micro-pollutants.
This is due to the fact that a fraction of the adsorptive surface or oxidative compound is
consumed due to reaction with the dissolved organic compounds, leaving less surface area
available for the adsorption of micro-contaminants. It is important to realise here that the
concentration of dissolved organic material is present in concentrations that are a factor 100
– 1000 times higher than the concentration of the micro-pollutants that need to be removed.
Another effect is the colour of the organic material. The application of UV for disinfection or
advanced oxidation colour removal requires a high radiation intensity.
DEGRADABLE ORGANICE MATTER
The remaining degradable organic material, expressed as the BOD content of the effluent,
can result in biofouling of membrane systems. Biological treatment systems aimed at remo-
val of micro-pollutants by specialised biomass can fail because they become overgrown by
general BOD-consuming heterotrophic biomass. The general BOD-consuming biomass has a
much larger available substrate supply (milligrams instead of micrograms per litre) than the
biomass growing specifically on micro-pollutants.
DISSOLVED SALTS
Effluent contains several hundred mg/l dissolved salts, expressed as the parameters electrical
conductivity, residue after evaporation or concentrations of chloride and sulphate. During
the application of nanofiltration or reverse osmosis as treatment techniques, a fraction of the
dissolved salts is retained. This can result in salt accumulation in the treatment system, with
subsequent precipitation as a result and other undesired effects. Macro-ions such as calcium
and magnesium can compete with the heavy metals that need to be removed during the ap-
plication of ion exchange. This requires the application of selective ion exchange resins that
remove specific heavy metals.
From this overview it appears that treatment techniques cannot be selected purely based on
their ability to remove micro-pollutants. Other effluent characteristics can strongly influence
their efficiency. It is therefore necessary to practice caution when using the results of other
treatment applications for the treatment of WWTP-effluent. Industrial waste streams are of-
ten concentrated and small, while WWTP-effluent is very dilute with a large volume. For the
application of drinking water techniques on WWTP-effluent special attention should be paid
to the high concentrations of suspended solids and dissolved organic material. For a well-
founded assessment of a certain technique it should at least first be tested on WWTP-effluent
at semi-full scale.
4.3 APPLICABLE TREATMENT TECHNIQUES
From the broad range of potential treatment techniques, a selection has been made of appli-
cable techniques in the light of the WFD. Applicable treatment techniques should fulfil the
following criteria:
- (potentially) capable of removing the described problematic substances to the levels pre-
sented in the standards in Appendix I;
- applicable at full-scale by 2009;
- capable of treating large flows;
- preferably capable of removing a broad range of substances;
- preferably require little energy, space and additives.
12
STOWA 2005-34 EXPLORATORY STUDY FOR WASTEWATER TREATMENT TECHNIQUES AND THE EUROPEAN WATER FRAMEWORK DIRECTIVE
In addition to well-known techniques for wastewater treatment, techniques from other water
treatment areas are also applicable, such as industrial water treatment and drinking water
production. In all cases it is assumed that the WWTP consists of an activated sludge system,
such as is the case in The Netherlands, to which extra techniques can be added/integrated.
This may include end-of-pipe techniques located after the activated sludge system, or integra-
ted techniques that be incorporated into the activated sludge system itself.
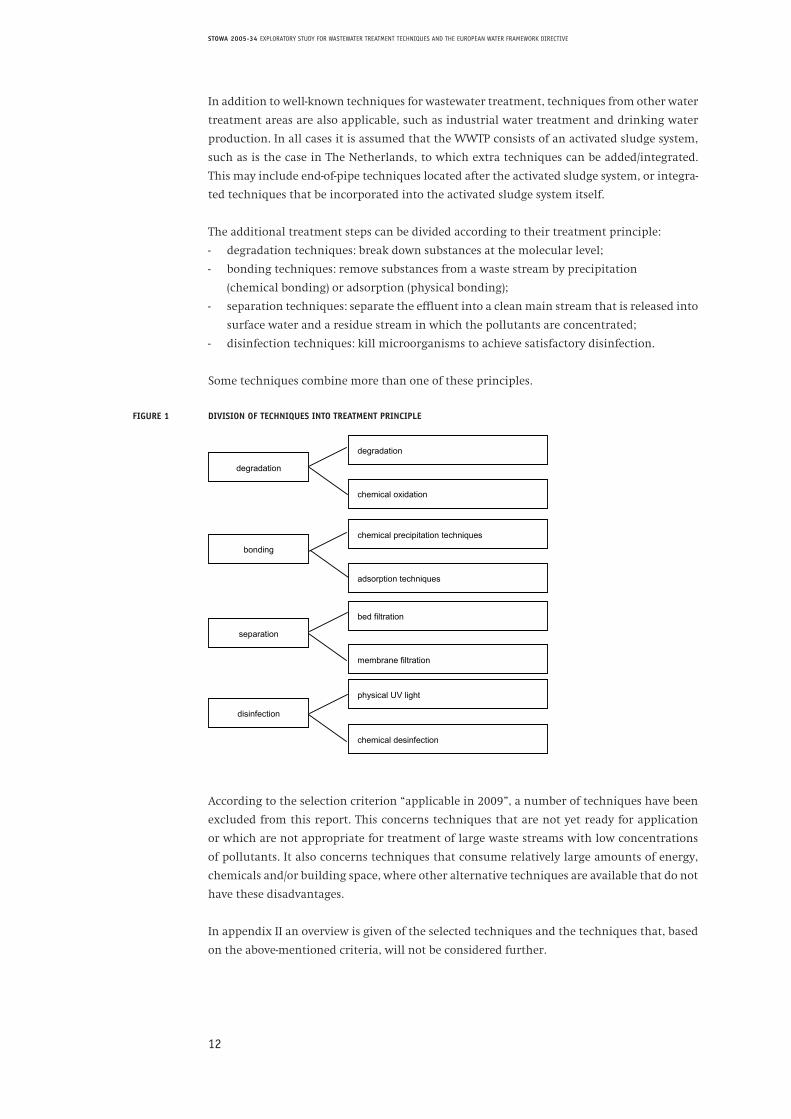
The additional treatment steps can be divided according to their treatment principle:
- degradation techniques: break down substances at the molecular level;
- bonding techniques: remove substances from a waste stream by precipitation
(chemical bonding) or adsorption (physical bonding);
- separation techniques: separate the effluent into a clean main stream that is released into
surface water and a residue stream in which the pollutants are concentrated;
- disinfection techniques: kill microorganisms to achieve satisfactory disinfection.
Some techniques combine more than one of these principles.
FIGURE 1 DIVISION OF TECHNIQUES INTO TREATMENT PRINCIPLE
According to the selection criterion “applicable in 2009”, a number of techniques have been
excluded from this report. This concerns techniques that are not yet ready for application
or which are not appropriate for treatment of large waste streams with low concentrations
of pollutants. It also concerns techniques that consume relatively large amounts of energy,
chemicals and/or building space, where other alternative techniques are available that do not
have these disadvantages.
In appendix II an overview is given of the selected techniques and the techniques that, based
on the above-mentioned criteria, will not be considered further.
Witteveen+Bos STO126-1 Exploratory Study for Water Treatment Techniques and the European Water Framework Directive final d.d. november 25, 2005 9
- preferably capable of removing a broad range of substances; - preferably require little energy, space and additives.
In addition to well-known techniques for wastewater treatment, techniques from other water treatment areas are also applicable, such as industrial water treatment and drinking water production. In all cases it is assumed that the WWTP consists of an activated sludge system, such as is the case in The Netherlands, to which extra techniques can be added/integrated. This may include end-of-pipetechniques located after the activated sludge system, or integrated techniques that be incorporated into the activated sludge system itself.
The additional treatment steps can be divided according to their treatment principle: - degradation techniques: break down substances at the molecular level; - bonding techniques: remove substances from a waste stream by precipitation (chemical bonding) or adsorption (physical
bonding);- separation techniques: separate the effluent into a clean main stream that is released into surface water and a residue stream in
which the pollutants are concentrated; - disinfection techniques: kill microorganisms to achieve satisfactory disinfection.
Some techniques combine more than one of these principles.
FIGURE 1. DIVISION OF TECHNIQUES INTO TREATMENT PRINCIPLE
According to the selection criterion “applicable in 2009”, a number of techniques have been excluded from this report. This concerns techniques that are not yet ready for application or which are not appropriate for treatment of large waste streams with low concentrations of pollutants. It also concerns techniques that consume relatively large amounts of energy, chemicals and/or building space, where other alternative techniques are available that do not have these disadvantages.
In appendix II an overview is given of the selected techniques and the techniques that, based on the above-mentioned criteria, will not be considered further.
degradation
bonding
separation
degradation
chemical oxidation
chemical precipitation techniques
membrane filtration
bed filtration
adsorption techniques
disinfection
physical UV light
chemical desinfection
13
STOWA 2005-34 EXPLORATORY STUDY FOR WASTEWATER TREATMENT TECHNIQUES AND THE EUROPEAN WATER FRAMEWORK DIRECTIVE
Under the term separation techniques, sedimentation and flotation techniques will not be
considered further. In comparison to filtration these techniques have a lower efficiency and
require more building space, while the advantage of the high solids handling capacity of
these techniques does not play a decisive role in the WFD-scenario.
In the following paragraphs the techniques that are considered applicable for further treat-
ment of WWTP-effluent are described. Essentially it is also possible to apply techniques that
are integrated into the activated sludge treatment process. These treatment techniques are
considered in more detail in paragraph 4.3.8.
4.3.1 BIOLOGICAL TECHNIQUES
LIMITATIONS OF THE CONVENTIONAL ACTIVATED SLUDGE SYSTEM
Since the implementation of the environmental standard Urban Wastewater Directive, most
of the Dutch WWTPs achieve an effluent quality of maximum 10 mg Ntotal/l and 1 – 2 mg
Ptotal/l. In many upgraded WWTPs it appears that effluent concentrations of 4 – 6 mg Ntoaal/
l and 0.3 – 0.7 mg Ptotal/l are achievable, due to the combination of a favorable wastewater
composition, very low sludge loading rates, optimised biological N- and P-processes and an
adequate process control. Although this surpasses the effluent quality specified in the Urban
Wastewater Directive, the MTR-standards for surface water (2.2 mg Ntotal/l, 0.15 mg Ptotal/l)
are not attainable in existing activated sludge systems. This study focuses therefore on ad-
ditional techniques that have a relatively high probability of being able to achieve the WFD-
water quality goals, assuming the WWTP fulfills the requirements of the Urban Wastewater
Directive (10 mg Ntotal/l, 1 mg Ptotal/l). The upgrading of existing activated sludge systems
from the Urban Wastewater Directive standard to the improved effluent quality is not within
the scope of this report.
MEMBRANE BIOREACTOR (MBR)
The MBR is an activated sludge system in which the sludge/water separation step takes
place via micro- or ultrafiltration membranes, instead of in secondary clarifiers. The activated
sludge process works in the same manner as a conventional WWTP, except that the higher
applicable sludge concentration enables a larger volume of biomass to be contained within
the same activated sludge volume, providing a higher intensity of the biological processes.
If comparing the MBR with a conventional system containing the same sludge concentration,
similar partitioning (number of compartments) and process conditions, the MBR behaves
biologically in exactly the same manner as a conventional WWTP. Where the effluent qua-
lity and the removal of problematic substances is concerned, the most relevant advantage of
the MBR is the complete removal of fine suspended solids and colloidal substances (and the
pollutants attached to these) by the micro- or ultrafiltration membranes, instead of seconda-
ry clarification. In addition, the higher sludge concentration in the MBR enables an improved
biological treatment in situations where space is limited.
In several Dutch pilot-scale research projects it has been shown that the MTR-quality for
nitrogen and phosphate is achievable in an MBR, provided extra measures are taken such as
dosage of a C-source for denitrification and extra chemical dosage for phosphate removal.
14
STOWA 2005-34 EXPLORATORY STUDY FOR WASTEWATER TREATMENT TECHNIQUES AND THE EUROPEAN WATER FRAMEWORK DIRECTIVE
ADVANCED NITROGEN REMOVAL
Biological removal of nitrogen molecules by nitrification and/or denitrification is an impor-
tant technique in effluent treatment. The required biomass is generally in the form of a bio-
film in a bed of granular material with 1 to several millimetres diameter. In nitrification
systems the incoming water is aerated; in denitrification systems a C-source is added (usually
methanol or acetate) in an anoxic environment. Depending on the mode of operation the
granular bed can consist of different types of material, the water can flow upwards or down-
wards and the bacterial growth and retained suspended solids can be removed by different
modes of backwashing. In the case of the application of a nitrification filter for the removal
of excess ammonium, a denitrification filter needs to follow the nitrification filter, so that
the final step can be dedicated to nitrate removal. A typical design construction of this post-
treatment principle is the continuous upflow sand filter with preceding methanol dosage
ADVANCED REMOVAL OF ORGANIC CONTAMINANTS
Biological removal of organic components from WWTP-effluent can involve the following
processes:
1. physical/chemical bonding of particles or macro-molecules to biomass, followed (possibly) by
hydrolysis to smaller dissolved molecules;
2. active uptake of dissolved molecules through the cell wall of the bacterial cell;
3. degradation within the cell.
NB 1. The physical-chemical bonding, a non-specific process, is the most important process
for the removal of micro-pollutants in the main activated sludge process. The pollutants are
removed (without further degradation) with the removed surplus sludge.
NB 2. The biological removal of remaining organic pollutants that have passed through the
activated sludge process requires a large population of specialised bacteria that use these
substances as substrate. An important problem with this is that their substrate is present in
very small concentrations (maximum a few dozen µg/l), making it impossible to enrich and
maintain biomass on these substrates. The total remaining BOD in the effluent (3 – 5 mg/l) is
already insufficient to maintain any kind of bacterial population.
EXAMPLE CALCULATION
Consider a filter or post-MBR system with a sludge concentration of 10 g/l, contact time of 0.5 h and
an incoming BOD-concentration of 5 mg BOD/l. The sludge-loading rate is 0.024 kg BOD/kg MLSS.d.
At a biological yield of 0.5 kg MLSS/kg BOD, the sludge age is approximately 80 days. This is extre-
mely long for maintenance of biological ac-tivated sludge. Because organic micro-pollutants occur
in concentrations of a factor 50 – 100 lower, the growth of a bacterial population on these substan-
ces is extremely difficult, if not impossible. Biological techniques are therefore only applicable for
concentrated waste streams in which no degradable components are present in concentrations much
higher than the contaminants to be removed.
NB 3. Organic macro-pollutants and nutrients (in the mg/l range) can be removed by systems
in which sufficient biomass is retained in the system (for example biofilm reactors, MBR or
wetland systems), provided the contaminants do not have to be removed down to the µg/l
level.
15
STOWA 2005-34 EXPLORATORY STUDY FOR WASTEWATER TREATMENT TECHNIQUES AND THE EUROPEAN WATER FRAMEWORK DIRECTIVE
In the last few decades a large amount of research has been conducted into the biological
breakdown of specific contaminants in industrial wastewater and polluted groundwater.
There is still little information available regarding the biological oxidation and/or removal
of contaminants from WWTP-effluent. Research conducted by the Water Board of Wetterskip
Fryslân showed that an MBR post-treatment system was capable of removing hormones and
medicinal residues from WWTP-effluent. Pesticides (e.g. simazine) were however not effecti-
vely removed.
POND TREATMENT SYSTEMS
Pond systems or helophyte filters have been applied at several locations in The Netherlands
for the treatment of raw wastewater or for effluent polishing. In small-scale (individual)
applications, vertical flow systems have also been used, in which the wastewater passes a
root zone; for the treatment of WWTP-effluent, from a practical viewpoint only pond systems
or horizontal flow helophyte filters are applicable. In these systems certain types of reed are
planted whose stalks and roots have a filtering effect on suspended solids, and upon which
biofilms can easily grow for the removal of nutrients and remaining organic compounds.
In comparison to bioreactors, the concentration of biomass in pond systems is limited, the
effectiveness of the process is strongly dependent on the season and it is impossible to influ-
ence the process conditions. The treatment efficiencies for total nitrogen and phosphorous
are generally not higher than 30 – 50 %. A large surface area is also required.
To systematically achieve the WFD-standards, pond systems are not considered applicable.
The technique does have useful side effects; after several days of contact time pathogenic
bacteria die off. An advantage is also that the character of the water changes (becomes more
“natural”) because algae and water fleas replace the presence of flushed-out activated sludge
flocs. Within in the WFD the chemical standards serve the ecological standards. From this
point of view helophyte filters could contribute in the sense that they have an ‘ecology-en-
hancing’ effect on the effluent.
For the following biological treatment techniques Fact Sheets have been set up:
- membrane bioreactors (fact sheet no.1);
- (de)nitrifying sand filters (fact sheet no.2).
CONCLUSIONS
From a biological viewpoint the MBR is comparable to an optimised conventional activated
sludge system with a post-treatment step by MF- or UF-membrane filtration; the difference in
effluent quality is determined by the separation efficiency of the membrane system in compa-
rison to a secondary clarifier. In several full-scale research projects in The Netherlands it has
been shown that the MTR-effluent quality for nitrogen and phosphorous is attainable with
the MBR, provided extra measures are implemented such as dosage of a C-source and extra
chemical dosage for phosphate removal. Biological techniques are effective for the removal
of nutrients in the concentration range of a few mg/l. They are however not effective for the
removal of organic contaminants to the level of µg/l concentrations, because these concentra-
tions are too low to enable the growth of a biomass population, due to competition with the
higher numbers of general heterotrophic bacteria.
16
STOWA 2005-34 EXPLORATORY STUDY FOR WASTEWATER TREATMENT TECHNIQUES AND THE EUROPEAN WATER FRAMEWORK DIRECTIVE
Pond systems can effectively remove pathogenic organisms at a sufficiently long contact time.
Due to the low density of biomass and the sensitivity of this technique to disturbances, the
efficiency of the biological degradation processes is limited. On the other hand, pond systems
may contribute to achieving the ecological standards.
4.3.2 OXIDATIVE TECHNIQUES
Oxidative techniques are used to “crack” organic compounds with the aid of strong oxidants
such as ozone or hydrogen peroxide. They are applied for the oxidation of organic contami-
nants. Some oxidants can also be applied for disinfection. The treatment principle involves
a non-specific reaction of the oxidant with the organic compounds, which are oxidised and
partially degraded to smaller molecules. The extent to which the process proceeds depends
directly on the nature of the organic compounds, the nature and the concentration of dosed
oxidant and the contact time.
A specific branch of oxidation processes is the Advanced Oxidation Processes (AOP). By combi-
ning oxidation techniques, free radicals can be formed which cause the oxidation processes
to proceed by a factor of 10 to several thousand times faster. Applicable combinations are
ozone/hydrogen peroxide, ozone/UV and UV/hydrogen peroxide.
An important advantage of chemical oxidation is that it is effective for contaminants in extre-
mely low concentrations (µg/l). Especially with advanced oxidation (e.g. UV/H2O2), it has been
shown that high removal efficiencies are possible, even in some cases for the treatment of
WWTP-effluent. High UV-intensities are however required. A particular point of importance
is the required UV-dosage in relation to the transmission (turbidity) of the effluent, which is
negatively influenced by dissolved and suspended organic material. Removal of these compo-
nents in an effective pre-treatment step is essential.
More information is available concerning the removal of micro-contaminants from effluent
using conventional oxidation than for advanced oxidation. The capital and energy costs of
oxidation with UV are relatively high. Possibly, these costs are lower for oxidative techniques
without UV-light, such as ozone/H2O2, which makes them more promising for full-scale ap-
plication to WWTP-effluent. However, the efficiency and formation of by-products of these
processes will have to be investigated.
One advantage of oxidation in comparison to other treatment techniques is that no waste
streams are produced. It is however possible during oxidation that undesirable by-products
may be produced that are suspected of having carcinogenic properties, such as bromates
which may be formed when using ozone. Another drawback is that during incomplete oxi-
dation to CO2 and H2O, unknown degradation products are formed. In drinking water pro-
duction it has been shown that the degradation products are in general less toxic than the
original compounds; this is however not guaranteed for all types of problematic substances.
Before discharging the effluent, residues of the oxidant will have to be removed from the
treated water, for example by dosing a reducing agent or a (short) treatment in an activated
carbon filter.
The use of chlorine to reach the WFD-standards is not desirable due to the production of
chlorinated by-products.
17
STOWA 2005-34 EXPLORATORY STUDY FOR WASTEWATER TREATMENT TECHNIQUES AND THE EUROPEAN WATER FRAMEWORK DIRECTIVE
For the advanced oxidation processes (AOP: UV / H2O2, ozone / H2O2, ozone / UV) a fact sheet
has been set up (fact sheet no. 3).
CONCLUSIONS
Oxidative techniques (specifically advanced oxidation) are potentially applicable for the
removal of organic micro-contaminants from WWTP-effluent in the required concentration
range. The effectiveness for treatment of WWTP-effluent has however not yet been clearly
demonstrated. The relatively high concentrations of organic compounds in WWTP-effluent
require an effective pre-treatment. Due to the high costs of advanced oxidation in combina-
tion with UV, alternative combinations without UV are recommended to improve the feasi-
bility of advanced oxidation for effluent treatment. The formation of by-products and their
possible toxicity is a point requiring particular attention during application of oxidation.
4.3.3 CHEMICAL PRECIPITATION TECHNIQUES
Chemical precipitation is the addition of chemicals to water that bind with other substances
in the form of a precipitate, which is subsequently removed. Examples of techniques that
form a so-called “precipitate” are precipitation, coagulation and flocculation.
PRECIPITATION
is the most direct form of chemical bonding, as the substances to be removed form an inso-
luble product with the dosed chemicals, which precipitate out of solution. In the treatment
of WWTP-effluent, precipitation of phosphate with iron or aluminum salts is a commonly
applied technique.
Other insoluble products can also be formed between heavy metals and hydroxide or sulpha-
te ions. This principle is applied in the treatment of industrial waste streams. To reduce the
metal ion concentrations to the required levels, however, high pH values or sulphide concen-
trations are necessary. A significant practical problem with pH-correction before and after
treatment is that large quantities of chemicals are necessary. High sulphide concentrations
in the treated water are also undesirable. Due to these disadvantages the use of this form of
precipitation for treatment of WWTP-effluent is not considered feasible.
COAGULATION/FLOCCULATION
Coagulation/flocculation is based on the idea that contaminants are retained in a network of
flocs, which are then removed in a subsequent settling or filtration step. The process begins
with the dosage of a coagulant (usually Fe- or Al-salts) which polymerises in water to form a
network of positively charged groups. Due to the attraction between opposite charges, the
flocculent attaches to dissolved organic molecules, whose charge is then neutralised, causing
them to floc out of solution. Colloidal and fine particles become retained in the growing net-
work and metal ions become incorporated into the crystal lattice. After an initial intensive
mixing phase, gentle mixing conditions are provided in which the growing flocs gradually
form larger flocs that settle efficiently out of solution.
FLOC REMOVAL
The precipitate produced can essentially be removed by settling, flotation or filtration. Aside
from an effective precipitate formation, the efficiency of the coagulation/flocculation process
is also determined by the separation of flocs from solution. Filtration is typically the prefer-
red separation technique used in effluent treatment due to the compact construction and
18
STOWA 2005-34 EXPLORATORY STUDY FOR WASTEWATER TREATMENT TECHNIQUES AND THE EUROPEAN WATER FRAMEWORK DIRECTIVE
effective separation efficiency. In the following paragraphs the different types of available
filter configurations will be discussed.
RESIDUE PRODUCTS
The dosed coagulant and flocculent emerge in the residual waste stream as a chemical sludge.
If high dosage concentrations are necessary to achieve the required removal efficiency, the
amount of chemical sludge produced can be many times higher than the amount of contami-
nants removed. The residual waste stream will typically be mixed with the backwash water of
the filtration system and subsequently be removed together with the surplus sludge genera-
ted in the activated sludge process.
COAGULATION/FLOCCULATION IN COMBINATION WITH SUSPENDED SOLIDS REMOVAL
Since direct filtration of effluent typically has a limited ability to remove very fine suspended
particles (except in the case of nano- and hyperfiltration), filtration is typically combined
with coagulation/flocculation. This is especially the case with sand filtration and to a lesser
extent for micro/ultrafiltration. In the latter technique, however, it appears that coagulant
dosage can effectively improve the filtration process and extend the production time between
backwash steps.
In different treatment scenarios the combination of coagulation, floc-formation (floccula-
tion) and filtration are typically applied for the removal of suspended particles, phosphate
and a fraction of the dissolved macromolecules. A distinction can be made hereby between
the application of in-line coagulation followed by filtration in which the floc formation and
floc separation are performed in the filter bed (flocking filtration), and application of a sepa-
rate coagulation and floc forming step followed by filtration for floc separation (floc filtration).
Due to the simplicity and low costs, flocking filtration is preferred. In the case where the
water quality leads to an unstable or incomplete floc formation, floc filtration is preferred,
since the floc forming process can be optimised and better controlled.
Fact Sheets have been created for the following techniques:
- Precipitation, coagulation and flocculation (fact sheet no. 5).
CONCLUSION
Coagulation/flocculation is a suitable technique for the removal of suspended solids and
colloidal material, to which micro-contaminants and heavy metals are often attached.
The application of coagulation/flocculation in combination with filtration techniques can re-
sult in very effective removal of suspended solids. The technique is not suited to the removal
of specific dissolved substances in the µg/l range. Disadvantages are the chemical consump-
tion and subsequent chemical sludge production. The extra sludge can be treated together
with the surplus sludge stream in the main process.
Precipitation techniques are suitable for the reduction of phosphate levels to a few mg/l.
WWTP effluent, without further treatment, contains a few µg/l of metals, depending on the
specific metal. It is questionable whether precipitation techniques can further decrease these
concentrations.
19
STOWA 2005-34 EXPLORATORY STUDY FOR WASTEWATER TREATMENT TECHNIQUES AND THE EUROPEAN WATER FRAMEWORK DIRECTIVE
4.3.4 ADSORPTION TECHNIQUES
Adsorption refers to the attachment of substances in the water phase to a fixed surface.
For the treatment of effluent the following types of adsorbents are available:
- activated carbon: the bonding of non-polar organic compounds due to Van der Waals
forces;
- ion exchange: bonding of ions to specific charged groups on the surface of a
synthetic resin;
- other adsorptive surfaces with some kind of affinity for organic and/or inorganic
components.
Important criteria for the adsorbent material (regardless of the type of treatment principle)
are:
- a high specificity for the contaminant, such that low concentrations are attained and
other components are not adsorbed;
- the surface area is as large as possible such that the maximum amount of adsorption
occurs per unit adsorptive material;
- preferably capable of releasing the adsorbed components under controlled conditions via
a technically and economically acceptable discharge route and the possibility to reuse the
resin (less preferable alternative: discharge of adsorbent complete with contaminants as
waste residue).
ACTIVATED CARBON
Activated carbon is a commonly used and reliable technique for the removal of non-polar
organic contaminants to very low concentrations. In activated carbon filtration the efflu-
ent is led over a fixed bed of granular activated carbon. Essentially all organic compounds
presented in the List of Substances can be removed from WWTP-effluent. The standing time
of the filter bed varies per substance. Humic-type of dissolved organic macro-molecules are
also removed; in practice it appears however that humic substances do not interfere with
the removal of the contaminants: the removal of contaminants continues when humic sub-
stances have already reached breakthrough point. Several filters are typically used in series,
such that the first filter can be regenerated once it becomes saturated. The most commonly
used granule types can be regenerated by the manufacturer. The removed adsorbed organic
contaminants are then incinerated.
To maintain a clearly discernible adsorption front in the carbon column, backwashing is ge-
nerally not desirable. Pre-treatment for the removal of suspended solids is therefore necessary
to prevent clogging of the column.
One possible financially interesting alternative is the use of powdered activated carbon (PAC)
in combination with a filtration technique (e.g. flocking filtration or denitrification filter).
In this manner removal of organic contaminants can take place without investing in an ex-
tra filter step. One practical limitation is however that powdered activated carbon dosage
should not lead to overloading of the filter. This application is only interesting if treatment
objectives can be achieved with a low dosage (maximum dosage concentration 20 mg/l), since
powdered activated carbon is more expensive than granular activated carbon per ton and it
cannot be regenerated. The carbon is removed with the rest of the filter surplus sludge and
treated in the sludge line of the WWTP.
20
STOWA 2005-34 EXPLORATORY STUDY FOR WASTEWATER TREATMENT TECHNIQUES AND THE EUROPEAN WATER FRAMEWORK DIRECTIVE
ION EXCHANGE
Ion exchange resins are capable of bonding with dissolved heavy metals. A problem in the
treatment of WWTP-effluent is however the competition between the heavy metals (in con-
centrations in the µg/l range) with the ions Ca and Mg (mg/l range). To remove heavy metals,
ion exchange resins require a high specificity for heavy metals. The regeneration of ion ex-
change resins produces a residue stream in which the heavy metals are concentrated (residue
stream volume: less than 1 % of the main stream).
There is very little experience with the application of ion exchange for the removal of heavy
metals from WWTP-effluent. Full-scale experience with ion exchange is mainly available in
the industrial wastewater treatment sector and to a limited extent in the drinking water
production industry. It has been shown in laboratory research that specific resins can remove
heavy metals in the µg/l range from surface water [Stetter et al. 2002].
Fact Sheets are available for the following techniques:
- activated carbon (fact sheet no. 6)
- ion exchange (fact sheet no. 7)
CONCLUSION
Activated carbon filtration is a suitable technique for the removal of almost all-organic micro-
contaminants and pesticides included in the WFD List of Priority Substances. The removal of
suspended solids is necessary before activated carbon filtration. Granular activated carbon
can be regenerated and reused, whereby no difficult waste products are produced.
The application of powdered activated carbon, followed by filtration, has potential if
treatment objectives can be achieved with a low dosage. Further research is necessary in this
area.
Once its suitability is proven, ion exchange is an interesting technique. An economically and
technically feasible solution should be available for the treatment of the produced residue
stream after regeneration of ion exchange resins.
4.3.5 BED FILTRATION
Bed filtration relies on the separation of particles from the water phase, while water flows
through the pores in between the filter bed medium granules. The particles are removed by
sieving, adsorption to the filter bed medium and settling onto the medium. The irregular
pore size/structure and the different removal mechanisms in bed filtration means there is no
clear specific granule size above which all particles are removed (in contrast to membrane
filtration in which filtration occurs through a membrane with a certain nominal pore size).
As an indication, it can be assumed that bed filtration is not capable of removing particles
smaller than 1 – 1.5 µm, and above this particle size 100 % removal of particles cannot be
guaranteed. To achieve the desired removal of fine particles and their attached contaminants
it is generally necessary to combine filtration with pre-coagulation and flocculation (see
paragraph 4.3.3).
Since the pore volume in the filter bed is large, there is significant room for precipitate for-
mation and biological processes in the filter bed. Especially due to the growth of microorga-
nisms in the pores, remaining substances, such as nitrate, can be removed. This technique is
discussed in more detail in paragraph 4.3.1. and the corresponding Fact Sheet.
21
STOWA 2005-34 EXPLORATORY STUDY FOR WASTEWATER TREATMENT TECHNIQUES AND THE EUROPEAN WATER FRAMEWORK DIRECTIVE
The most important types of bed filtration are the downflow and upflow fast(better: rapid?)
filters. The downflow types need to be stopped regularly and backwashed in order to remove
the retained solids and contaminants. In contrast, in the upflow configuration the filter bed
medium is continuously removed from the bottom of the bed, washed and deposited back
onto the top of the filter bed. The efficiency of both filter types increases with a decreasing
medium granule size; on the other hand a fine granule bed cannot retain such high sludge
concentrations. From experience it appears that downflow filters can achieve a better remo-
val of suspended solids, while upflow filters can retain more sludge (and biomass), which is
an advantage in the application of biofilm processes and/or high filter suspended solids and
(if applicable) powdered activated carbon loading rates.
Slow sand filtration with fine sand and low loading rates (0.1 – 0.3 m3/m2.h) are used in the
drinking water world for the removal of low concentrations of organic contaminants and for
disinfection. Due to the large surface area required and the labour intensive cleaning process
involving scraping off of the top layer, slow sand filtration is not considered feasible for the
treatment of WWTP-effluent.
FACT SHEETS
- rapid bed filtration: continuous sand filtration, fixed bed filtration, multi media filtra-
tion (fact sheet no.8).
CONCLUSION
Bed filtration is a proven technique for particle removal from water. In order to obtain a high
removal efficiency of suspended solids, the application of coagulation is generally necessary.
Different chemicals can be added for different purposes, such as the addition of iron salts for
phosphate removal or carbon source addition for nitrate removal.
Bed filtration results in the production of an extra sludge stream, the size of which is depen-
dent on the coagulant dosage and the pollutant removal efficiency. The produced sludge can
be treated together with the surplus sludge from the activated sludge system.
4.3.6 SCREEN- AND MEMBRANE FILTRATION
This type of filtration works by passing water through a filter of a defined pore size. Only
particles and molecules that are smaller than the pore size can pass through the filter. In
contrast to bed filtration, these filter techniques do not contain spaces between the pores in
which precipitates can form or in which biological degradation can take place.
Filtration processes can be divided into groups, based on their separation of respective
particle diameters. Figure 2. presents an overview of the diameter application range for the
different filtration techniques. In general, a distinction can be made between particle-related
membrane filtration (micro- and ultrafiltration, separation diameter > 10 nm) and molecule-
related membrane filtration (nano- and hyperfiltration, molecular weight cut off; removal
efficiencies up to log 5).
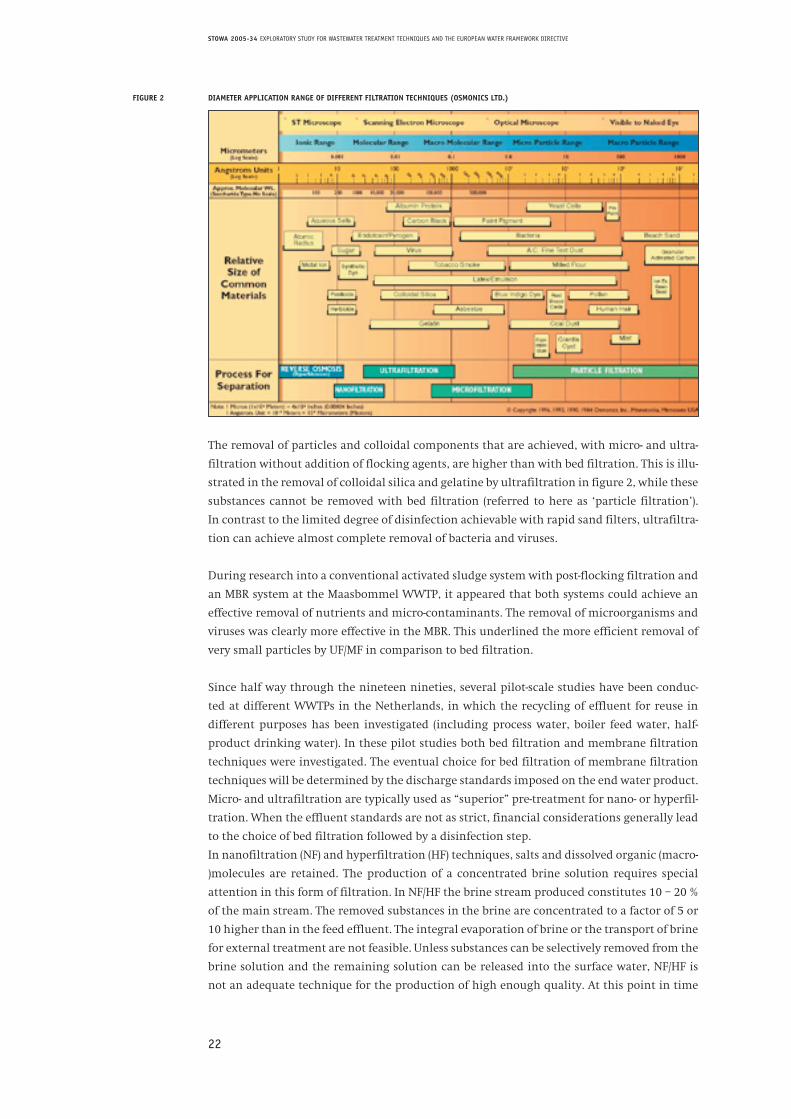
22
STOWA 2005-34 EXPLORATORY STUDY FOR WASTEWATER TREATMENT TECHNIQUES AND THE EUROPEAN WATER FRAMEWORK DIRECTIVE
FIGURE 2 DIAMETER APPLICATION RANGE OF DIFFERENT FILTRATION TECHNIQUES (OSMONICS LTD.)
The removal of particles and colloidal components that are achieved, with micro- and ultra-
filtration without addition of flocking agents, are higher than with bed filtration. This is illu-
strated in the removal of colloidal silica and gelatine by ultrafiltration in figure 2, while these
substances cannot be removed with bed filtration (referred to here as ‘particle filtration’).
In contrast to the limited degree of disinfection achievable with rapid sand filters, ultrafiltra-
tion can achieve almost complete removal of bacteria and viruses.
During research into a conventional activated sludge system with post-flocking filtration and
an MBR system at the Maasbommel WWTP, it appeared that both systems could achieve an
effective removal of nutrients and micro-contaminants. The removal of microorganisms and
viruses was clearly more effective in the MBR. This underlined the more efficient removal of
very small particles by UF/MF in comparison to bed filtration.
Since half way through the nineteen nineties, several pilot-scale studies have been conduc-
ted at different WWTPs in the Netherlands, in which the recycling of effluent for reuse in
different purposes has been investigated (including process water, boiler feed water, half-
product drinking water). In these pilot studies both bed filtration and membrane filtration
techniques were investigated. The eventual choice for bed filtration of membrane filtration
techniques will be determined by the discharge standards imposed on the end water product.
Micro- and ultrafiltration are typically used as “superior” pre-treatment for nano- or hyperfil-
tration. When the effluent standards are not as strict, financial considerations generally lead
to the choice of bed filtration followed by a disinfection step.
In nanofiltration (NF) and hyperfiltration (HF) techniques, salts and dissolved organic (macro-
)molecules are retained. The production of a concentrated brine solution requires special
attention in this form of filtration. In NF/HF the brine stream produced constitutes 10 – 20 %
of the main stream. The removed substances in the brine are concentrated to a factor of 5 or
10 higher than in the feed effluent. The integral evaporation of brine or the transport of brine
for external treatment are not feasible. Unless substances can be selectively removed from the
brine solution and the remaining solution can be released into the surface water, NF/HF is
not an adequate technique for the production of high enough quality. At this point in time
Witteveen+Bos STO126-1 Exploratory Study for Water Treatment Techniques and the European Water Framework Directive final d.d. november 25, 2005 16
Filtration processes can be divided into groups, based on their separation of respective particle diameters. Figure 2. presents an overview of the diameter application range for the different filtration techniques. In general, a distinction can be made betweenparticle-related membrane filtration (micro- and ultrafiltration, separation diameter > 10 nm) and molecule-related membrane filtration (nano- and hyperfiltration, molecular weight cut off; removal efficiencies up to log 5).
FIGURE 2. DIAMETER APPLICATION RANGE OF DIFFERENT FILTRATION TECHNIQUES (OSMONICS LTD.)
The removal of particles and colloidal components that are achieved, with micro- and ultrafiltration without addition of flockingagents, are higher than with bed filtration. This is illustrated in the removal of colloidal silica and gelatine by ultrafiltration in figure 2, while these substances cannot be removed with bed filtration (referred to here as ‘particle filtration’). In contrast to the limited degree of disinfection achievable with rapid sand filters, ultrafiltration can achieve almost complete removal of bacteria and viruses.
During research into a conventional activated sludge system with post-flocking filtration and an MBR system at the Maasbommel WWTP, it appeared that both systems could achieve an effective removal of nutrients and micro-contaminants. The removal of microorganisms and viruses was clearly more effective in the MBR. This underlined the more efficient removal of very small particles by UF/MF in comparison to bed filtration.
Since half way through the nineteen nineties, several pilot-scale studies have been conducted at different WWTPs in the Netherlands, in which the recycling of effluent for reuse in different purposes has been investigated (including process water, boiler feed water, half-product drinking water). In these pilot studies both bed filtration and membrane filtration techniques were investigated. The eventual choice for bed filtration of membrane filtration techniques will be determined by the discharge standards imposed on theend water product. Micro- and ultrafiltration are typically used as “superior” pre-treatment for nano- or hyperfiltration. When the effluent standards are not as strict, financial considerations generally lead to the choice of bed filtration followed by a disinfection step. In nanofiltration (NF) and hyperfiltration (HF) techniques, salts and dissolved organic (macro-)molecules are retained. The production of a concentrated brine solution requires special attention in this form of filtration. In NF/HF the brine stream produced constitutes 10 – 20 % of the main stream. The removed substances in the brine are concentrated to a factor of 5 or 10 higher than in the feed effluent. The integral evaporation of brine or the transport of brine for external treatment are not feasible. Unless substances
23
STOWA 2005-34 EXPLORATORY STUDY FOR WASTEWATER TREATMENT TECHNIQUES AND THE EUROPEAN WATER FRAMEWORK DIRECTIVE
there is not enough information or practical experience available with this technique. Based
on current insight, the application of nanofiltration with a separate concentrate treatment
step is not considered feasible for the improvement of WWTP-effluent quality.
Different applications of membranes for effluent treatment are being investigated at pilot
scale. Particular points requiring attention are the design (flux) in relation to operation, clea-
ning, energy consumption etc.
Fact Sheets:
- microfiltration, ultrafiltration (fact sheet no.9).
CONCLUSION
MF/UF are proven techniques for the removal of insoluble particles and pathogenic microor-
ganisms. These membrane techniques can achieve a higher removal efficiency than sand
filtration.
Molecular filtration (NF/HF) is only an applicable technique if a cost- and environmentally
effective solution is available for treatment or disposal of brine.
4.3.7 DISINFECTION
Destruction of micro-organisms and the removal of viruses are applied if disinfection of the
effluent is required, for example if extra standards apply due to the use of the water body for
bathing purposes or as a livestock water source.
Effective disinfection can be achieved by:
1. filtration;
2. physical disinfection;
3. chemical disinfection.
NB 1. With the aid of micro- and ultrafiltration, bacteria can be retained (see paragraph 4.3.6.)
With ultra-filtration an almost complete removal of viruses is possible.
NB 2. The best known physical form of disinfection is UV light (fact sheet no. 4). UV radiation
affects the genetic material of microorganisms and viruses, preventing them from reprodu-
cing. The effectiveness of UV radiation is negatively affected by the presence of suspended
solids in the water (provides protection for microbes against UV light) or by colour in the
water (faster extinction of light). Pre-treatment aimed at the removal of suspended solids is
therefore required in many cases.
NB 3. Chemical disinfection relies on the degradation of microorganisms by the oxidation of
their cell and genetic material, preventing them from being able to reproduce. A commonly
used form of disinfection is the use of chlorine (also in the form of sodium hypochlorite or
chlorine dioxide). Although chlorine is a relatively cheap and manageable technique, its use
is undesirable due to the formation of chlorinated by-products which are then released into
surface water; this is contradictory to the objectives of the WFD. Chemical disinfection is also
possible with ozone (see par. 4.3.2.) or with an advanced oxidation technique, which is aimed
at removal of micro-contaminants (see par. 4.3.2.).
24
STOWA 2005-34 EXPLORATORY STUDY FOR WASTEWATER TREATMENT TECHNIQUES AND THE EUROPEAN WATER FRAMEWORK DIRECTIVE
4.3.8 INTEGRATED TREATMENT TECHNIQUES
Integrated treatment techniques are techniques that are added to or combined with con-
ventional activated sludge systems so that a better effluent quality can be achieved. These
techniques usually achieve a better removal of specific substances or components from efflu-
ent. To achieve all objectives outlined in the WFD, extra treatment steps must be added. The
following integrated treatment options are possible:
- membrane bioreactor; see paragraph 4.3.1.;
- dosage of powdered activated carbon (PAC) in the activated sludge process; the dosage of
PAC during biological treatment of wastewater is a proven technique for the treatment
of industrial wastewater that is (heavily) polluted with organic micro-pollutants and/or
pesticides. For the application of PAC in communal wastewater treatment the same con-
siderations apply as those described for adsorption techniques in paragraph 4.3.4. Due
to the competition with humus like macromolecules and the growth of biomass on the
activated carbon, the efficiency of this integrated technique is limited. In addition to this,
the lowering of the sludge age due to the addition of PAC is a risk, resulting in a negative
influence on other biological processes (such as the nitrogen removal). Based on these
considerations, separate treatment of WWTP effluent with powder activated carbon is
deemed more effective than dosage of powder activated carbon in the activated sludge
process. Therefore the application of powdered activated carbon in the activated sludge
process for obtaining the WFD-objectives will not be considered further.
- treatment of high ammonium-containing streams such as sludge digester rejection wa-
ter; these techniques (including Sharon, Anammox, CANON, Babe) are aimed at reducing
the nitrogen load to the main process, leading to an improvement in the effluent quality,
especially in highly loaded systems. For the actual realisation of the WFD-treatment objec-
tives however, combination with a post-treatment step is necessary. Bio-augmentation is a
technique where a specific bioculture is seeded in the activated sludge system, where this
bioculture cannot survive for a longer period of time. The application of this technique is
therefore not a sustainable solution for the removal of WFD-substances with a continuous
flow. For peak loads this technique may be considered, if the arrival time of the concentra-
tion peak is known early enough. For a WWTP this technique is therefore less suitable.
4.3.9 TECHNIQUES AND SUBSTANCES
Based on the List of Substances and the characteristics of the described techniques, an over-
view is presented in table 4 of the applicable techniques for the removal of the different sub-
stances and groups of substances. Whether or not a substance in the List of Substances will
actually be removed with a specific technique depends not only on the physical-chemical cha-
racteristics of the substance to be removed, but also on the characteristics that are required
by the specific technique, in order to be removed.
For the evaluation of the applicability of adsorption techniques the polarity (expressed as log
Kow or log P) is the most important parameter used. For the molecular removal techniques the
molecular weight (Mw) is used as an indication of the molecule size. The log Kow values and the
molecular weights of the WFD substances are shown in table 4.
25
STOWA 2005-34 EXPLORATORY STUDY FOR WASTEWATER TREATMENT TECHNIQUES AND THE EUROPEAN WATER FRAMEWORK DIRECTIVE
The removal efficiencies predicted for the different techniques for the treatment of WWTP-
effluent are primarily based on the efficiencies experienced with these techniques in other
branches of the water industry, under other conditions. For the interpretation of these re-
sults for application to effluent polishing, the authors have used their practical experience
and knowledge in the fields of effluent polishing, industrial wastewater treatment and the
production of drinking water. It is recommended to test the new configurations in cases
where very low discharge standards are defined. This also applies to cases where changes in
the composition and characteristics of the water can have a large effect on the efficiency of
new configurations (e.g. during interference by dissolved and particle forming organic sub-
stances).
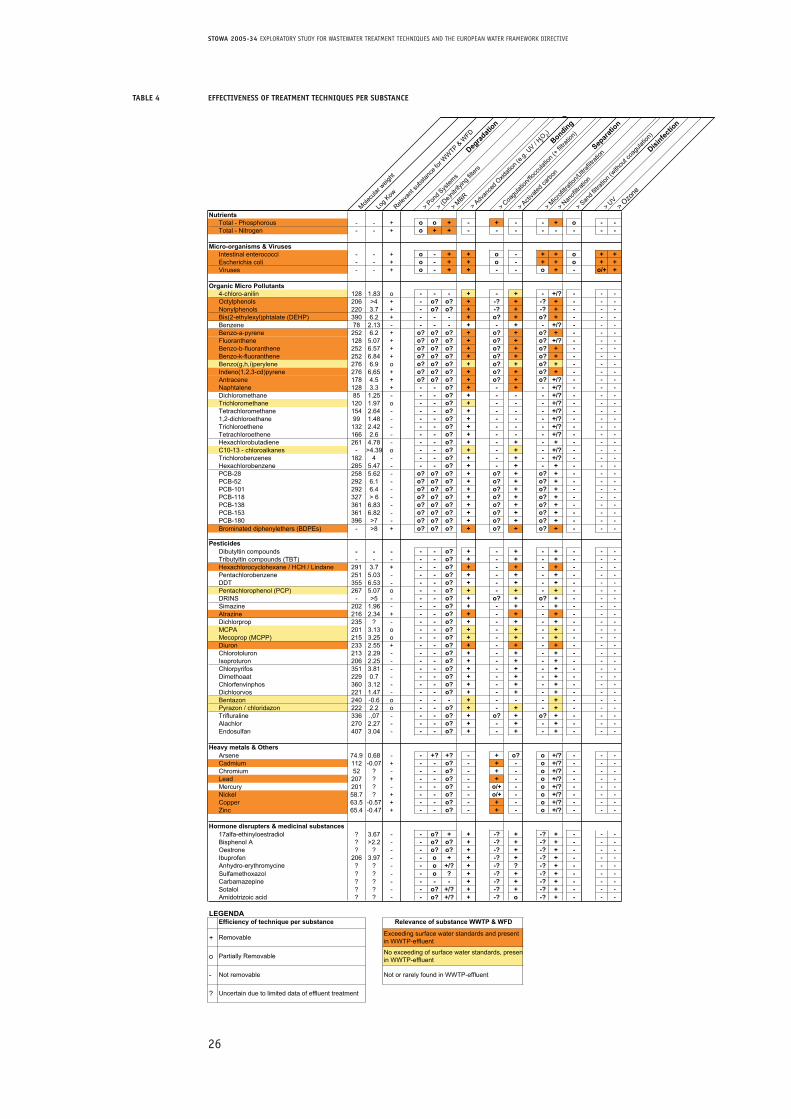
26
STOWA 2005-34 EXPLORATORY STUDY FOR WASTEWATER TREATMENT TECHNIQUES AND THE EUROPEAN WATER FRAMEWORK DIRECTIVE
TABLE 4 EFFECTIVENESS OF TREATMENT TECHNIQUES PER SUBSTANCE
Molecu
lar w
eight
Log K
ow
Releva
nt su
bstan
ce fo
r WW
TP & WFD
Degrad
ation
> Pond S
ystem
s
> (De)n
itrifyi
ng fil
ters
> MBR> Adv
ance
d Oxid
ation
(e.g.
UV / H2O 2
)Bonding
> Coagu
lation
/flocc
ulatio
n (+ filt
ration
)
> Activa
ted ca
rbon
Separa
tion
> Microfi
ltratio
n/Ultra
filtrat
ion
> Nanofi
ltratio
n
> Sand f
iltrati
on (w
ithou
t coa
gulat
ion)
Disinfec
tion
> UV> O
zone
NutrientsTotal - Phosphorous - - + o o + - + - - + o - -Total - Nitrogen - - + o + + - - - - - - - -
Micro-organisms & VirusesIntestinal enterococci - - + o - + + o - + + o + +Escherichia coli - - + o - + + o - + + o + +Viruses - - + o - + + - - o + - o/+ +
Organic Micro Pollutants4-chloro-anilin 128 1.83 o - - - + - + - +/? - - -Octylphenols 206 >4 + - o? o? + -? + -? + - - -Nonylphenols 220 3.7 + - o? o? + -? + -? + - - -Bis(2-ethylexyl)phtalate (DEHP) 390 6.2 + - - - + o? + o? + - - -Benzene 78 2.13 - - - - + - + - +/? - - -Benzo-a-pyrene 252 6.2 + o? o? o? + o? + o? + - - -Fluoranthene 128 5.07 + o? o? o? + o? + o? +/? - - -Benzo-b-fluoranthene 252 6.57 + o? o? o? + o? + o? + - - -Benzo-k-fluoranthene 252 6.84 + o? o? o? + o? + o? + - - -Benzo(g,h,i)perylene 276 6.9 o o? o? o? + o? + o? + - - -Indeno(1,2,3-cd)pyrene 276 6,65 + o? o? o? + o? + o? + - - -Antracene 178 4.5 + o? o? o? + o? + o? +/? - - -Naphtalene 128 3.3 + - - o? + - + - +/? - - -Dichloromethane 85 1.25 - - - o? + - - - +/? - - -Trichloromethane 120 1.97 o - - o? + - - - +/? - - -Tetrachloromethane 154 2.64 - - - o? + - - - +/? - - -1,2-dichloroethane 99 1.48 - - - o? + - - - +/? - - -Trichloroethene 132 2.42 - - - o? + - - - +/? - - -Tetrachloroethene 166 2.6 - - - o? + - - - +/? - - -Hexachlorobutadiene 261 4.78 - - - o? + - + - + - - -C10-13 - chloroalkanes - >4.39 o - - o? + - + - +/? - - -Trichlorobenzenes 182 4 - - - o? + - + - +/? - - -Hexachlorobenzene 285 5.47 - - - o? + - + - + - - -PCB-28 258 5.62 - o? o? o? + o? + o? + - - -PCB-52 292 6.1 - o? o? o? + o? + o? + - - -PCB-101 292 6.4 - o? o? o? + o? + o? + - - -PCB-118 327 > 6 - o? o? o? + o? + o? + - - -PCB-138 361 6.83 - o? o? o? + o? + o? + - - -PCB-153 361 6.82 - o? o? o? + o? + o? + - - -PCB-180 396 >7 - o? o? o? + o? + o? + - - -Brominated diphenylethers (BDPEs) - >8 + o? o? o? + o? + o? + - - -
PesticidesDibutyltin compounds - - - - - o? + - + - + - - -Tributyltin compounds (TBT) - - - - - o? + - + - + - - -Hexachlorocyclohexane / HCH / Lindane 291 3.7 + - - o? + - + - + - - -Pentachlorobenzene 251 5.03 - - - o? + - + - + - - -DDT 355 6.53 - - - o? + - + - + - - -Pentachlorophenol (PCP) 267 5.07 o - - o? + - + - + - - -DRINS - >5 - - - o? + o? + o? + - - -Simazine 202 1.96 - - - o? + - + - + - - -Atrazine 216 2.34 + - - o? + - + - + - - -Dichlorprop 235 ? - - - o? + - + - + - - -MCPA 201 3.13 o - - o? + - + - + - - -Mecoprop (MCPP) 215 3.25 o - - o? + - + - + - - -Diuron 233 2.55 + - - o? + - + - + - - -Chlorotoluron 213 2.29 - - - o? + - + - + - - -Isoproturon 206 2.25 - - - o? + - + - + - - -Chlorpyrifos 351 3.81 - - - o? + - + - + - - -Dimethoaat 229 0.7 - - - o? + - + - + - - -Chlorfenvinphos 360 3.12 - - - o? + - + - + - - -Dichloorvos 221 1.47 - - - o? + - + - + - - -Bentazon 240 -0.6 o - - - + - - - + - - -Pyrazon / chloridazon 222 2.2 o - - o? + - + - + - - -Trifluraline 336 .,07 - - - o? + o? + o? + - - -Alachlor 270 2.27 - - - o? + - + - + - - -Endosulfan 407 3.04 - - - o? + - + - + - - -
Heavy metals & OthersArsene 74.9 0.68 - - +? +? - + o? o +/? - - -Cadmium 112 -0.07 + - - o? - + - o +/? - - -Chromium 52 ? - - - o? - + - o +/? - - -Lead 207 ? + - - o? - + - o +/? - - -Mercury 201 ? - - - o? - o/+ - o +/? - - -Nickel 58.7 ? + - - o? - o/+ - o +/? - - -Copper 63.5 -0.57 + - - o? - + - o +/? - - -Zinc 65.4 -0.47 + - - o? - + - o +/? - - -
Hormone disrupters & medicinal substances17alfa-ethinyloestradiol ? 3.67 - - o? + + -? + -? + - - -Bisphenol A ? >2.2 - - o? o? + -? + -? + - - -Oestrone ? ? - - o? o? + -? + -? + - - -Ibuprofen 206 3.97 - - o + + -? + -? + - - -Anhydro-erythromycine ? ? - - o +/? + -? ? -? + - - -Sulfamethoxazol ? ? - - o ? + -? + -? + - - -Carbamazepine ? ? - - - - + -? + -? + - - -Sotalol ? ? - - o? +/? + -? + -? + - - -Amidotrizoic acid ? ? - - o? +/? + -? o -? + - - -
LEGENDA
+
o
-
? Uncertain due to limited data of effluent treatment
Relevance of substance WWTP & WFD
Exceeding surface water standards and present in WWTP-effluent
No exceeding of surface water standards, presenin WWTP-effluent
Not or rarely found in WWTP-effluent
Efficiency of technique per substance
Removable
Partially Removable
Not removable
27
STOWA 2005-34 EXPLORATORY STUDY FOR WASTEWATER TREATMENT TECHNIQUES AND THE EUROPEAN WATER FRAMEWORK DIRECTIVE
5
TREATMENT SCENARIOS
5.1 BASIC ASSUMPTIONS
In chapter 4 the potentially applicable treatment techniques are described. For many techni-
ques a pre-treatment step is necessary for the effective removal of contaminants. In addition
it should be mentioned that not all substances in the List of Substances would actually be a
problem during treatment of WWTP-effluent. This will be strongly dependent on the location
of the particular area, the defined qualitative objectives for the relevant surface water and
the specific contribution of the WWTP-effluent to the presence of the critical components in
the water. It is expected that one or more substances in the List of Substances will be critical
to the receiving surface water. It is also important to acknowledge that a large number of tre-
atment techniques can remove a broad range of substances, whereby less critical substances
will also be removed. An example of this is the application of activated carbon. In this techni-
que a large range of dissolved organic compounds are removed.
The applicable treatment techniques combined in the different wastewater treatment scena-
rios are expected to attain the desired removal efficiencies for the relevant WFD substances.
This expectation is partly based upon results from full-scale research and / or full-scale appli-
cation for WWTP-effluent treatment. When insufficient data are available for application in
WWTP, removal efficiencies are deduced from other domains such as drinking water produc-
tion and industrial (waste)water treatment.
WWTP-EFFLUENT
The current generation of activated sludge treatment systems was developed for the removal
of nitrogen and phosphorous to levels specified in the Urban Wastewater Directive. Although
further optimisation of the activated sludge process is possible by optimising process confi-
gurations and/or advanced process control, the MTR-standards for nitrogen and phosphorous
cannot (yet) be achieved with conventional activated sludge processes. Additional treatment
steps such as the addition of a carbon source for nitrate removal and chemical dosage for
phosphate removal, in combination with suspended solids removal by micro/ultrafiltration,
have been investigated in various pilot studies with membrane bioreactors (e.g. Maasbommel
and Hilversum WWTPs). In these research studies it was shown that an MBR with additional
measures can achieve the MTR-quality for nitrogen and phosphorous.
Treatment scenarios aimed at post-treatment of WWTP-effluent are based on the assumption
that the effluent is produced in a current generation activated sludge treatment plant, in
which a “state of the art” optimisation has been applied for advanced nitrogen and phospho-
rous removal (see table 5). An important assumption in this case is that ammonium removal
in the activated sludge process is almost complete (N-NH4 < 1.0 mg/l) and that nitrogen is
present in the WWTP-effluent predominantly as nitrate and organic nitrogen.
28
STOWA 2005-34 EXPLORATORY STUDY FOR WASTEWATER TREATMENT TECHNIQUES AND THE EUROPEAN WATER FRAMEWORK DIRECTIVE
TABLE 5 NITROGEN, PHOSPHOROUS AND SUSPENDED SOLIDS IN WWTP-EFFLUENT
current generation WWTPs
in The NetherlandsMembrane Bioreactor
Membrane Bioreactor with additional
measures*)
Nitrogen (mg N/l)**) 4 –10 3 – 10 2 –3
Phosphorous (mg P/l)**) 0.5 – 2.0 0.3 – 2.0 0.1 – 0.3
Suspended solids (mg/l) 5 – 15 < 1 < 1
*) with C-source dosage and extra chemical phosphate removal in addition to biological phosphate removal
**) MTR-standards: for nitrogen – 2,2 mg N/l ; for phosphorous – 0,15 mg P/l.
INTEGRATED TREATMENT OPTIONS
Possible integrated treatment options have been described already, including the membrane
bioreactor and the addition of adsorbing media to activated sludge, such as powdered acti-
vated carbon. The latter option is considered less applicable for urban wastewater treatment
(see paragraph 4.3.8). In the membrane bioreactor a complete removal of suspended solids
can be achieved. Pathogenic microorganisms are also removed. For advanced removal of
nutrients and other selected WFD substances during MBR treatment, extra post-treatment
is required. The effluent quality achieved with the MBR is similar to the effluent quality
achieved with a similarly designed and loaded conventional activated sludge system, with
additional post-treatment by micro- or ultrafiltration.
PARTICLE REMOVAL
Almost all of the contaminants are to some extent present in suspended solids in the effluent.
Removal of these solids therefore produces a significant improvement in the effluent qua-
lity. The presence of suspended solids also interferes with adsorptive, oxidative and filtration
techniques, in which dissolved compounds are removed (nano- and hyperfiltration). Based
on these considerations it can be concluded that in all possible treatment scenarios aimed at
post-treatment, an initial particleremoval step is necessary. The filtration techniques presen-
ted in chapter 4 are relevant for particle removal.
HYDRAULIC CAPACITY
Location-specific factors are important when establishing the hydraulic capacity to be instal-
led for treatment techniques. Investment costs can be lowered by installing a lower hydraulic
capacity than the maximum wet weather flow rate (WWF), whilst treating the majority of
the flow. For the set up of the treatment scenarios a hydraulic capacity of approximately
300 l/P.E. during 16 hours per day has been assumed. This is equal to about 1.5 times the
dry weather flow (DWF) rate. Using this capacity about 85% of the yearly volume flow will be
treated, assuming that an average WWTP has a maximal hydraulic capacity of 3 to 4 times
DWF. In figure 3 the relationship between the treatment percentage of the yearly flow and
the hydraulic capacity to be installed of the post-treatment techniques is presented.
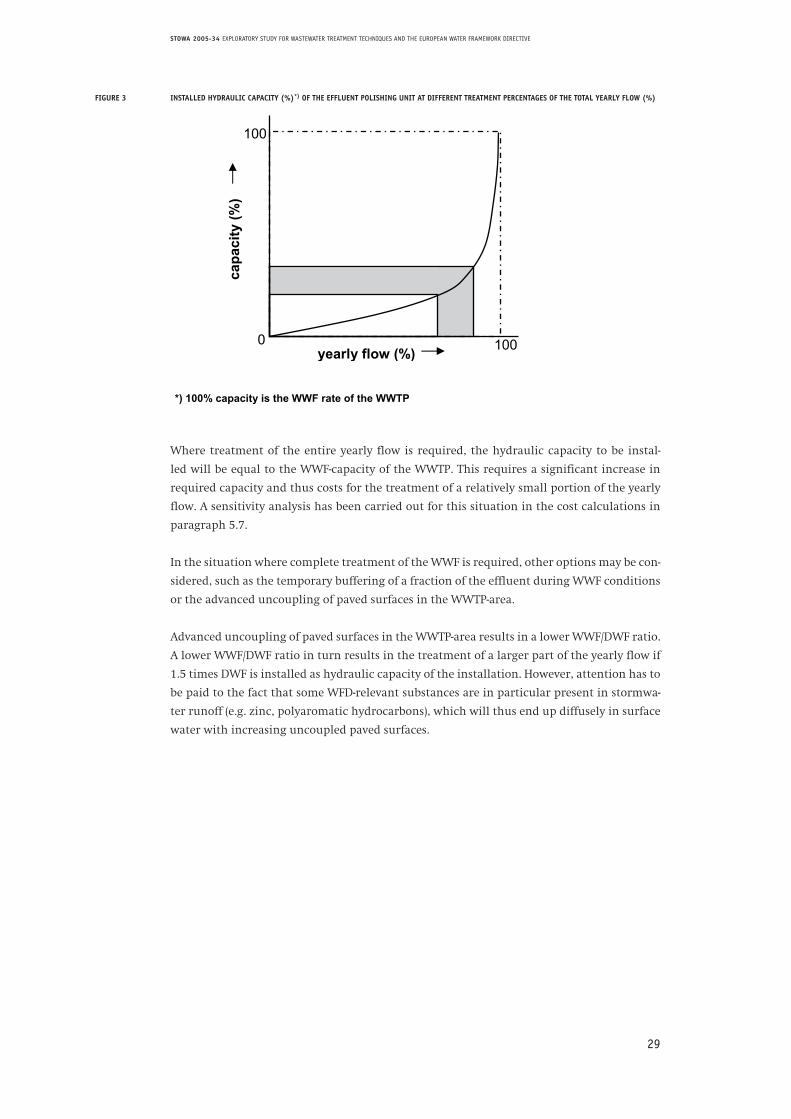
29
STOWA 2005-34 EXPLORATORY STUDY FOR WASTEWATER TREATMENT TECHNIQUES AND THE EUROPEAN WATER FRAMEWORK DIRECTIVE
FIGURE 3 INSTALLED HYDRAULIC CAPACITY (%)*) OF THE EFFLUENT POLISHING UNIT AT DIFFERENT TREATMENT PERCENTAGES OF THE TOTAL YEARLY FLOW (%)
Where treatment of the entire yearly flow is required, the hydraulic capacity to be instal-
led will be equal to the WWF-capacity of the WWTP. This requires a significant increase in
required capacity and thus costs for the treatment of a relatively small portion of the yearly
flow. A sensitivity analysis has been carried out for this situation in the cost calculations in
paragraph 5.7.
In the situation where complete treatment of the WWF is required, other options may be con-
sidered, such as the temporary buffering of a fraction of the effluent during WWF conditions
or the advanced uncoupling of paved surfaces in the WWTP-area.
Advanced uncoupling of paved surfaces in the WWTP-area results in a lower WWF/DWF ratio.
A lower WWF/DWF ratio in turn results in the treatment of a larger part of the yearly flow if
1.5 times DWF is installed as hydraulic capacity of the installation. However, attention has to
be paid to the fact that some WFD-relevant substances are in particular present in stormwa-
ter runoff (e.g. zinc, polyaromatic hydrocarbons), which will thus end up diffusely in surface
water with increasing uncoupled paved surfaces.
Witteveen+Bos STO126-1 Exploratory Study for Water Treatment Techniques and the European Water Framework Directive final d.d. november 25, 2005 21
oxidative and filtration techniques, in which dissolved compounds are removed (nano- and hyperfiltration). Based on these considerations it can be concluded that in all possible treatment scenarios aimed at post-treatment, an initial particleremoval step is necessary. The filtration techniques presented in chapter 4 are relevant for particle removal.
HYDRAULIC CAPACITY Location-specific factors are important when establishing the hydraulic capacity to be installed for treatment techniques. Investment costs can be lowered by installing a lower hydraulic capacity than the maximum wet weather flow rate (WWF), whilst treating themajority of the flow. For the set up of the treatment scenarios a hydraulic capacity of approximately 300 l/P.E. during 16 hours per day has been assumed. This is equal to about 1.5 times the dry weather flow (DWF) rate. Using this capacity about 85% of the yearly volume flow will be treated, assuming that an average WWTP has a maximal hydraulic capacity of 3 to 4 times DWF. In figure 3 therelationship between the treatment percentage of the yearly flow and the hydraulic capacity to be installed of the post-treatmenttechniques is presented.
FIGURE 3 INSTALLED HYDRAULIC CAPACITY (%)*) OF THE EFFLUENT POLISHING UNIT AT DIFFERENT TREATMENT PERCENTAGES
OF THE TOTAL YEARLY FLOW (%)
*) 100% capacity is the WWF rate of the WWTP
Where treatment of the entire yearly flow is required, the hydraulic capacity to be installed will be equal to the WWF-capacity of the WWTP. This requires a significant increase in required capacity and thus costs for the treatment of a relatively small portion of the yearly flow. A sensitivity analysis has been carried out for this situation in the cost calculations in paragraph 5.7.
In the situation where complete treatment of the WWF is required, other options may be considered, such as the temporary bufferingof a fraction of the effluent during WWF conditions or the advanced uncoupling of paved surfaces in the WWTP-area.
Advanced uncoupling of paved surfaces in the WWTP-area results in a lower WWF/DWF ratio. A lower WWF/DWF ratio in turn results in the treatment of a larger part of the yearly flow if 1.5 times DWF is installed as hydraulic capacity of the installation. However, attention has to be paid to the fact that some WFD-relevant substances are in particular present in stormwater runoff (e.g.zinc, polyaromatic hydrocarbons), which will thus end up diffusely in surface water with increasing uncoupled paved surfaces.
100
100
yearly flow (%)
capa
city
(%)
0
30
STOWA 2005-34 EXPLORATORY STUDY FOR WASTEWATER TREATMENT TECHNIQUES AND THE EUROPEAN WATER FRAMEWORK DIRECTIVE
EXAMPLE CALCULATION
Using an installed capacity of 1.5 times DWF about 85% of the yearly volume flow is treated. The
WFD standards apply for the total yearly volume flow. This implies that a mixture of treated (90%)
and untreated (10%) WWTP-effluent should satisfy the standards for all WFD-relevant substances.
The treatment-efficiency of the techniques should therefore be sufficiently large to compensate
the extra load of a certain substance in an untreated discharge. In the table below a number of
examples are presented.
*) The average concentrations in WWTP-effluent for copper and benzo(a)pyrene come from a survey carried out amongst all water
boards in The Netherlands for this report (number of data respectively 963 and 17). The average concentration for total Nitrogen
corresponds to the standards of the Urban Wastewater Treatment Directive.
**) Proposition of FHI, see appendix I.
***) Post-treatment of 85% of the total yearly volume flow.
Based on the considerations presented in the above paragraph, a number of promising scena-
rios have been established for each group of substances. In paragraphs 5.2 – 5.6 the correspon-
ding treatment scenarios are presented. The costs are calculated in paragraph 5.7.
5.2 NUTRIENTS
For the removal of nitrogen it is assumed that biofiltration (denitrification) takes place
in a post-treatment filter. For an effective removal of phosphate, chemical precipitation is
applicable.
In scenario NP1 the biofilter is followed by flocking filtration. The alternative to this is
micro/ultrafiltration with in-line coagulation (see Fact Sheets no. 5 and 9). Scenario NP2
combines denitrification and phosphate precipitation in one filter. This scenario has not yet been
implemented at full-scale and is therefore not a proven technique. However, this configura-
tion will be tested intensively at full-scale by the Water Board of Rijnland over the coming
years.
Substance WWTP-effluent
average*)
WFD-Standard **) After
post-treatment***)
Needed efficiency
(µg/l) (µg/l) (µg/l) (%)
Copper 11.2 3.8 2.5 > 78
Benzo(a)pyrene 0.110 0.050 0.040 > 64
Total Nitrogen 10,000 2,200 850 > 91
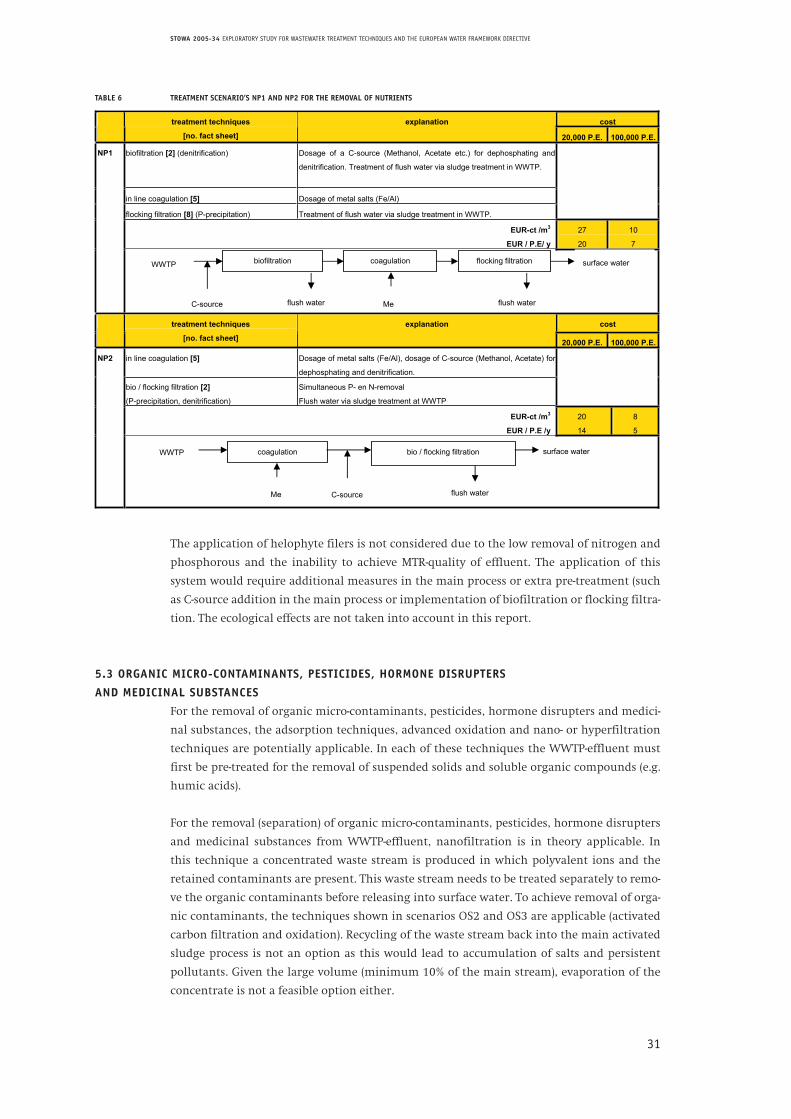
31
STOWA 2005-34 EXPLORATORY STUDY FOR WASTEWATER TREATMENT TECHNIQUES AND THE EUROPEAN WATER FRAMEWORK DIRECTIVE
TABLE 6 TREATMENT SCENARIO’S NP1 AND NP2 FOR THE REMOVAL OF NUTRIENTS
The application of helophyte filers is not considered due to the low removal of nitrogen and
phosphorous and the inability to achieve MTR-quality of effluent. The application of this
system would require additional measures in the main process or extra pre-treatment (such
as C-source addition in the main process or implementation of biofiltration or flocking filtra-
tion. The ecological effects are not taken into account in this report.
5.3 ORGANIC MICRO-CONTAMINANTS, PESTICIDES, HORMONE DISRUPTERS
AND MEDICINAL SUBSTANCES
For the removal of organic micro-contaminants, pesticides, hormone disrupters and medici-
nal substances, the adsorption techniques, advanced oxidation and nano- or hyperfiltration
techniques are potentially applicable. In each of these techniques the WWTP-effluent must
first be pre-treated for the removal of suspended solids and soluble organic compounds (e.g.
humic acids).
For the removal (separation) of organic micro-contaminants, pesticides, hormone disrupters
and medicinal substances from WWTP-effluent, nanofiltration is in theory applicable. In
this technique a concentrated waste stream is produced in which polyvalent ions and the
retained contaminants are present. This waste stream needs to be treated separately to remo-
ve the organic contaminants before releasing into surface water. To achieve removal of orga-
nic contaminants, the techniques shown in scenarios OS2 and OS3 are applicable (activated
carbon filtration and oxidation). Recycling of the waste stream back into the main activated
sludge process is not an option as this would lead to accumulation of salts and persistent
pollutants. Given the large volume (minimum 10% of the main stream), evaporation of the
concentrate is not a feasible option either.
Witteveen+Bos STO126-1 Exploratory Study for Water Treatment Techniques and the European Water Framework Directive final d.d. november 25, 2005 23
TABLE 6. TREATMENT SCENARIO’S NP1 AND NP2 FOR THE REMOVAL OF NUTRIENTS
costtreatment techniques
[no. fact sheet]
explanation
20,000 P.E. 100,000 P.E.
biofiltration [2] (denitrification) Dosage of a C-source (Methanol, Acetate etc.) for dephosphating and
denitrification. Treatment of flush water via sludge treatment in WWTP.
in line coagulation [5] Dosage of metal salts (Fe/Al)
flocking filtration [8] (P-precipitation) Treatment of flush water via sludge treatment in WWTP.
EUR-ct /m3
EUR / P.E/ y
27
20
10
7
NP1
costtreatment techniques
[no. fact sheet]
explanation
20,000 P.E. 100,000 P.E.
in line coagulation [5] Dosage of metal salts (Fe/Al), dosage of C-source (Methanol, Acetate) for
dephosphating and denitrification.
bio / flocking filtration [2]
(P-precipitation, denitrification)
Simultaneous P- en N-removal
Flush water via sludge treatment at WWTP
EUR-ct /m3
EUR / P.E /y
20
14
8
5
NP2
The application of helophyte filers is not considered due to the low removal of nitrogen and phosphorous and the inability to achieveMTR-quality of effluent. The application of this system would require additional measures in the main process or extra pre-treatment (such as C-source addition in the main process or implementation of biofiltration or flocking filtration. The ecological effects are not taken into account in this report.
5.3. ORGANIC MICRO-CONTAMINANTS, PESTICIDES, HORMONE DISRUPTERS AND MEDICINAL SUBSTANCES
For the removal of organic micro-contaminants, pesticides, hormone disrupters and medicinal substances, the adsorption techniques, advanced oxidation and nano- or hyperfiltration techniques are potentially applicable. In each of these techniques the WWTP-effluent must first be pre-treated for the removal of suspended solids and soluble organic compounds (e.g. humic acids).
For the removal (separation) of organic micro-contaminants, pesticides, hormone disrupters and medicinal substances from WWTP-effluent, nanofiltration is in theory applicable. In this technique a concentrated waste stream is produced in which polyvalent ions and the retained contaminants are present. This waste stream needs to be treated separately to remove the organic contaminants before releasing into surface water. To achieve removal of organic contaminants, the techniques shown in scenarios OS2 and OS3 are applicable (activated carbon filtration and oxidation). Recycling of the waste stream back into the main activated sludge process is not an option as this would lead to accumulation of salts and persistent pollutants. Given the large volume (minimum 10% of themain stream), evaporation of the concentrate is not a feasible option either.
The positive effect of nanofiltration is that pollutants are concentrated into a small stream, requiring a small hydraulic capacity of an eventual treatment step, in comparison to the application of the technique in the main stream. The cost savings achieved by thisconcentration step before activated carbon filtration or oxidation is however not nearly high enough to cover the costs of the
MeC-source flush water flush water
WWTP coagulation flocking filtration biofiltration surface water
WWTP bio / flocking filtration
Me
coagulation
C-source
surface water
flush water
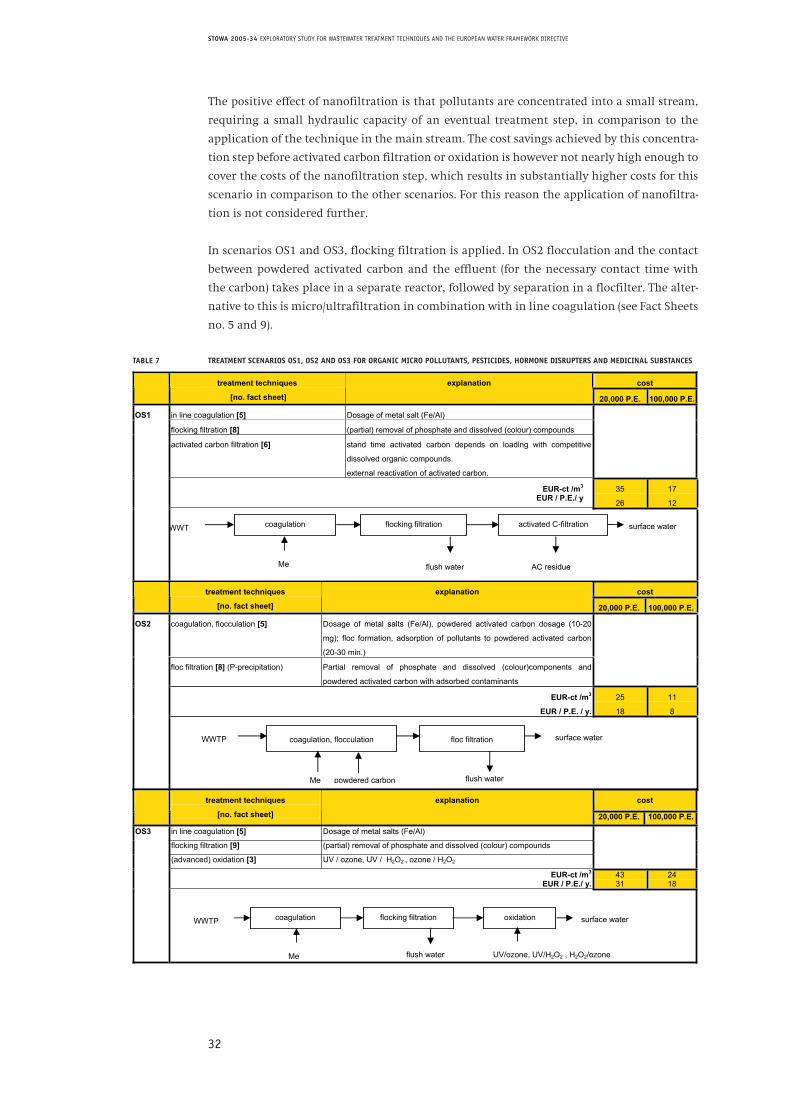
32
STOWA 2005-34 EXPLORATORY STUDY FOR WASTEWATER TREATMENT TECHNIQUES AND THE EUROPEAN WATER FRAMEWORK DIRECTIVE
The positive effect of nanofiltration is that pollutants are concentrated into a small stream,
requiring a small hydraulic capacity of an eventual treatment step, in comparison to the
application of the technique in the main stream. The cost savings achieved by this concentra-
tion step before activated carbon filtration or oxidation is however not nearly high enough to
cover the costs of the nanofiltration step, which results in substantially higher costs for this
scenario in comparison to the other scenarios. For this reason the application of nanofiltra-
tion is not considered further.
In scenarios OS1 and OS3, flocking filtration is applied. In OS2 flocculation and the contact
between powdered activated carbon and the effluent (for the necessary contact time with
the carbon) takes place in a separate reactor, followed by separation in a flocfilter. The alter-
native to this is micro/ultrafiltration in combination with in line coagulation (see Fact Sheets
no. 5 and 9).
TABLE 7 TREATMENT SCENARIOS OS1, OS2 AND OS3 FOR ORGANIC MICRO POLLUTANTS, PESTICIDES, HORMONE DISRUPTERS AND MEDICINAL SUBSTANCES
Witteveen+Bos STO126-1 Exploratory Study for Water Treatment Techniques and the European Water Framework Directive final d.d. november 25, 2005 24
nanofiltration step, which results in substantially higher costs for this scenario in comparison to the other scenarios. For this reason the application of nanofiltration is not considered further.
In scenarios OS1 and OS3, flocking filtration is applied. In OS2 flocculation and the contact between powdered activated carbon and the effluent (for the necessary contact time with the carbon) takes place in a separate reactor, followed by separation in a flocfilter. The alternative to this is micro/ultrafiltration in combination with in line coagulation (see Fact Sheets no. 5 and 9).
Table 7. Treatment scenarios OS1, OS2 and OS3 for organic micro pollutants, pesticides, hormone disrupters and medicinal substances
costtreatment techniques
[no. fact sheet]
explanation
20,000 P.E. 100,000 P.E.
in line coagulation [5] Dosage of metal salt (Fe/Al)
flocking filtration [8] (partial) removal of phosphate and dissolved (colour) compounds
activated carbon filtration [6] stand time activated carbon depends on loading with competitive
dissolved organic compounds.
external reactivation of activated carbon.
EUR-ct /m3
EUR / P.E./ y35
26
17
12
OS1
costtreatment techniques
[no. fact sheet]
explanation
20,000 P.E. 100,000 P.E.
coagulation, flocculation [5] Dosage of metal salts (Fe/Al), powdered activated carbon dosage (10-20
mg); floc formation, adsorption of pollutants to powdered activated carbon
(20-30 min.)
floc filtration [8] (P-precipitation) Partial removal of phosphate and dissolved (colour)components and
powdered activated carbon with adsorbed contaminants
EUR-ct /m3
EUR / P.E. / y.
25
18
11
8
OS2
WWT activated C-filtration
Me
coagulation flocking filtration
AC residue flush water
surface water
Me
WWTP coagulation, flocculation floc filtration
flush water
surface water
powdered carbon
Witteveen+Bos STO126-1 Exploratory Study for Water Treatment Techniques and the European Water Framework Directive final d.d. november 25, 2005 25
costtreatment techniques
[no. fact sheet]
explanation
20,000 P.E. 100,000 P.E.
in line coagulation [5] Dosage of metal salts (Fe/Al)
flocking filtration [9] (partial) removal of phosphate and dissolved (colour) compounds
(advanced) oxidation [3] UV / ozone, UV / H2O2 , ozone / H2O2
EUR-ct /m3
EUR / P.E./ y.4331
2418
OS3
5.4. HEAVY METALS AND METALLOIDS Heavy metals may be present as dissolved metal ions or adsorbed to suspended solids. By applying treatment techniques aimed at suspended solids removal from effluent, a number of critical metals can be removed to the levels required in the discharge standards(see appendix I, List of Substances). Extra removal of dissolved metals and metalloids requires a separate and selective treatment step. The applicable technique for this purpose is ion exchange. Because the concentration of heavy metals in WWTP-effluent is toolow for an effective functioning of ion exchange in a conventional set up, specific ion exchange resins need to be developed. There is a large amount of uncertainty regarding the effectiveness of ion exchange due to the presence of interfering metals and organicmacromolecules in relatively high concentrations, in relation to the concentrations of the heavy metals to be removed (see alsoparagraph 4.3.3). The strongly concentrated waste residue stream produced after regeneration (constituting 0.01% volume of the main stream) should be dealt with as well..
Nano- en hyperfiltration are in theory capable of retaining and separating metals into a separate concentrated residue stream. The critical heavy metals and other hazardous substances can then be removed from the concentrate (approximately 10 % of the treatedeffluent volume) before release into the surface water together with the WWTP-effluent. Treatment of the concentrate requires asignificant and complex treatment step, leading to high costs. Based on the current available techniques, the application of nanofiltration with separate concentrate treatment is not considered financially feasible, for the same reasons as described inparagraph 5.3. This technique is therefore not considered further for the removal of heavy metals and metalloids.
The potentially applicable treatment scenarios (M1 and M3) are based on coagulation and separation of particles and dissolved organic macromolecules (metal complexes). In this case the flocking or floc filtration techniques are possible and (probably more efficient) micro/ultrafiltration techniques. Whether or not these scenarios can achieve the required removal of heavy metals without the application of ion exchange (scenario M2) remains however to be seen.
Table 8. Treatment scenarios M1, M2 and M3 for removal of heavy metals and metalloids costtreatment techniques
[no. fact sheet] explanation
20,000 P.E. 100,000 P.E
in line coagulation [5] Dosage of metal salts (Fe/Al)
flocking filtration [8] (partial) removal of phosphate particles and dissolved (colour)
compounds
M1
EUR-ct /m3
EUR / P.E./ y.18
13
6
5
WWTP
Me
coagulation flocking filtration
flush water
oxidation
UV/ozone, UV/H2O2 , H2O2/ozone
surface water
WWTP
Me
coagulation flocking filtration surface water
flush water
33
STOWA 2005-34 EXPLORATORY STUDY FOR WASTEWATER TREATMENT TECHNIQUES AND THE EUROPEAN WATER FRAMEWORK DIRECTIVE
5.4 HEAVY METALS AND METALLOIDS
Heavy metals may be present as dissolved metal ions or adsorbed to suspended solids.
By applying treatment techniques aimed at suspended solids removal from effluent, a num-
ber of critical metals can be removed to the levels required in the discharge standards (see
appendix I, List of Substances). Extra removal of dissolved metals and metalloids requires
a separate and selective treatment step. The applicable technique for this purpose is ion
exchange. Because the concentration of heavy metals in WWTP-effluent is too low for an effec-
tive functioning of ion exchange in a conventional set up, specific ion exchange resins need
to be developed. There is a large amount of uncertainty regarding the effectiveness of ion
exchange due to the presence of interfering metals and organic macromolecules in relatively
high concentrations, in relation to the concentrations of the heavy metals to be removed (see
also paragraph 4.3.3). The strongly concentrated waste residue stream produced after regene-
ration (constituting 0.01% volume of the main stream) should be dealt with as well..
Nano- en hyperfiltration are in theory capable of retaining and separating metals into a
separate concentrated residue stream. The critical heavy metals and other hazardous substan-
ces can then be removed from the concentrate (approximately 10 % of the treated effluent
volume) before release into the surface water together with the WWTP-effluent. Treatment
of the concentrate requires a significant and complex treatment step, leading to high costs.
Based on the current available techniques, the application of nanofiltration with separate
concentrate treatment is not considered financially feasible, for the same reasons as descri-
bed in paragraph 5.3. This technique is therefore not considered further for the removal of
heavy metals and metalloids.
The potentially applicable treatment scenarios (M1 and M3) are based on coagulation and
separation of particles and dissolved organic macromolecules (metal complexes). In this case
the flocking or floc filtration techniques are possible and (probably more efficient) micro/
ultrafiltration techniques. Whether or not these scenarios can achieve the required
removal of heavy metals without the application of ion exchange (scenario M2) remains however
to be seen.
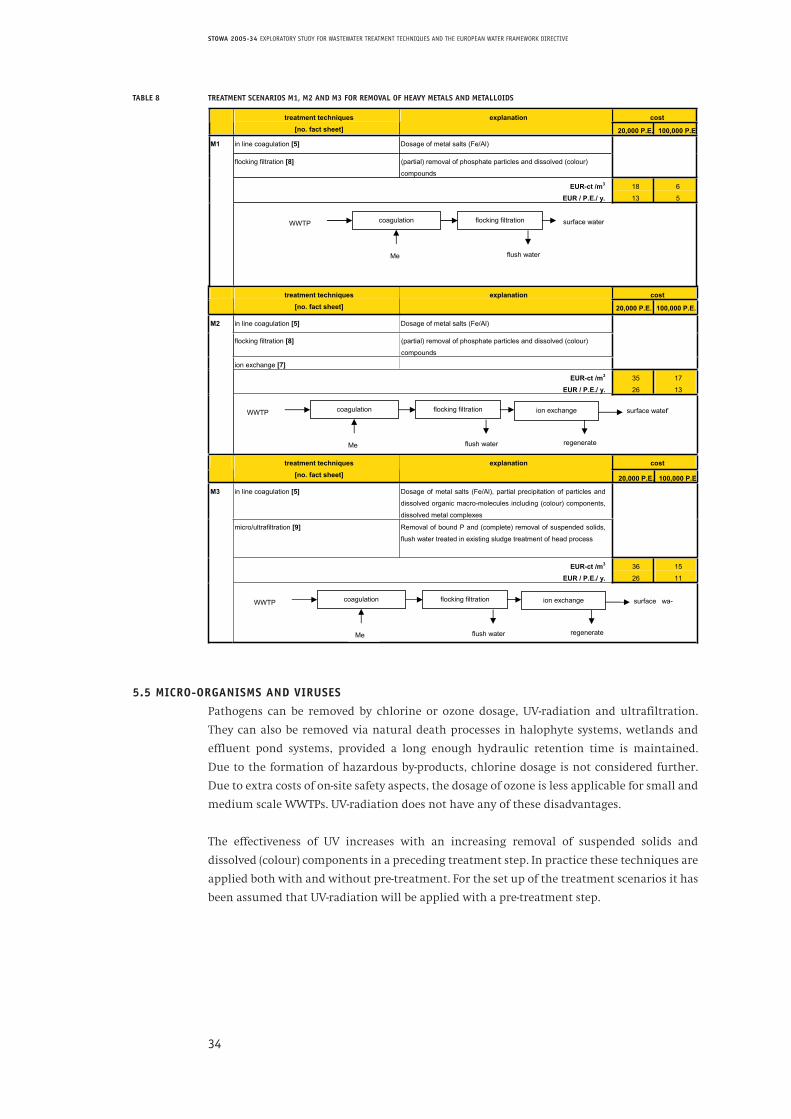
34
STOWA 2005-34 EXPLORATORY STUDY FOR WASTEWATER TREATMENT TECHNIQUES AND THE EUROPEAN WATER FRAMEWORK DIRECTIVE
TABLE 8 TREATMENT SCENARIOS M1, M2 AND M3 FOR REMOVAL OF HEAVY METALS AND METALLOIDS
5.5 MICRO-ORGANISMS AND VIRUSES
Pathogens can be removed by chlorine or ozone dosage, UV-radiation and ultrafiltration.
They can also be removed via natural death processes in halophyte systems, wetlands and
effluent pond systems, provided a long enough hydraulic retention time is maintained.
Due to the formation of hazardous by-products, chlorine dosage is not considered further.
Due to extra costs of on-site safety aspects, the dosage of ozone is less applicable for small and
medium scale WWTPs. UV-radiation does not have any of these disadvantages.
The effectiveness of UV increases with an increasing removal of suspended solids and
dissolved (colour) components in a preceding treatment step. In practice these techniques are
applied both with and without pre-treatment. For the set up of the treatment scenarios it has
been assumed that UV-radiation will be applied with a pre-treatment step.
Witteveen+Bos STO126-1 Exploratory Study for Water Treatment Techniques and the European Water Framework Directive final d.d. november 25, 2005 25
costtreatment techniques
[no. fact sheet]
explanation
20,000 P.E. 100,000 P.E.
in line coagulation [5] Dosage of metal salts (Fe/Al)
flocking filtration [9] (partial) removal of phosphate and dissolved (colour) compounds
(advanced) oxidation [3] UV / ozone, UV / H2O2 , ozone / H2O2
EUR-ct /m3
EUR / P.E./ y.4331
2418
OS3
5.4. HEAVY METALS AND METALLOIDS Heavy metals may be present as dissolved metal ions or adsorbed to suspended solids. By applying treatment techniques aimed at suspended solids removal from effluent, a number of critical metals can be removed to the levels required in the discharge standards(see appendix I, List of Substances). Extra removal of dissolved metals and metalloids requires a separate and selective treatment step. The applicable technique for this purpose is ion exchange. Because the concentration of heavy metals in WWTP-effluent is toolow for an effective functioning of ion exchange in a conventional set up, specific ion exchange resins need to be developed. There is a large amount of uncertainty regarding the effectiveness of ion exchange due to the presence of interfering metals and organicmacromolecules in relatively high concentrations, in relation to the concentrations of the heavy metals to be removed (see alsoparagraph 4.3.3). The strongly concentrated waste residue stream produced after regeneration (constituting 0.01% volume of the main stream) should be dealt with as well..
Nano- en hyperfiltration are in theory capable of retaining and separating metals into a separate concentrated residue stream. The critical heavy metals and other hazardous substances can then be removed from the concentrate (approximately 10 % of the treatedeffluent volume) before release into the surface water together with the WWTP-effluent. Treatment of the concentrate requires asignificant and complex treatment step, leading to high costs. Based on the current available techniques, the application of nanofiltration with separate concentrate treatment is not considered financially feasible, for the same reasons as described inparagraph 5.3. This technique is therefore not considered further for the removal of heavy metals and metalloids.
The potentially applicable treatment scenarios (M1 and M3) are based on coagulation and separation of particles and dissolved organic macromolecules (metal complexes). In this case the flocking or floc filtration techniques are possible and (probably more efficient) micro/ultrafiltration techniques. Whether or not these scenarios can achieve the required removal of heavy metals without the application of ion exchange (scenario M2) remains however to be seen.
Table 8. Treatment scenarios M1, M2 and M3 for removal of heavy metals and metalloids costtreatment techniques
[no. fact sheet] explanation
20,000 P.E. 100,000 P.E
in line coagulation [5] Dosage of metal salts (Fe/Al)
flocking filtration [8] (partial) removal of phosphate particles and dissolved (colour)
compounds
M1
EUR-ct /m3
EUR / P.E./ y.18
13
6
5
WWTP
Me
coagulation flocking filtration
flush water
oxidation
UV/ozone, UV/H2O2 , H2O2/ozone
surface water
WWTP
Me
coagulation flocking filtration surface water
flush water
Witteveen+Bos STO126-1 Exploratory Study for Water Treatment Techniques and the European Water Framework Directive final d.d. november 25, 2005 26
costtreatment techniques [no. fact sheet]
explanation
20,000 P.E. 100,000 P.E.
in line coagulation [5] Dosage of metal salts (Fe/Al)
flocking filtration [8] (partial) removal of phosphate particles and dissolved (colour)
compounds
ion exchange [7]
M2
EUR-ct /m3
EUR / P.E./ y.35
26
17
13
costtreatment techniques [no. fact sheet]
explanation
20,000 P.E. 100,000 P.E
in line coagulation [5] Dosage of metal salts (Fe/Al), partial precipitation of particles and
dissolved organic macro-molecules including (colour) components,
dissolved metal complexes
micro/ultrafiltration [9] Removal of bound P and (complete) removal of suspended solids,
flush water treated in existing sludge treatment of head process
EUR-ct /m3
EUR / P.E./ y.36
26
15
11
M3
5.5. MICRO-ORGANISMS AND VIRUSES Pathogens can be removed by chlorine or ozone dosage, UV-radiation and ultrafiltration. They can also be removed via natural death processes in halophyte systems, wetlands and effluent pond systems, provided a long enough hydraulic retention time is maintained. Due to the formation of hazardous by-products, chlorine dosage is not considered further. Due to extra costs of on-site safety aspects, the dosage of ozone is less applicable for small and medium scale WWTPs. UV-radiation does not have any of these disadvantages.
The effectiveness of UV increases with an increasing removal of suspended solids and dissolved (colour) components in a preceding treatment step. In practice these techniques are applied both with and without pre-treatment. For the set up of the treatment scenarios it has been assumed that UV-radiation will be applied with a pre-treatment step.
WWTP
Me
coagulation flocking filtration surface water
flush water
ion exchange
regenerate
WWTP
Me
coagulation flocking filtration surface wa-
flush water
ion exchange
regenerate
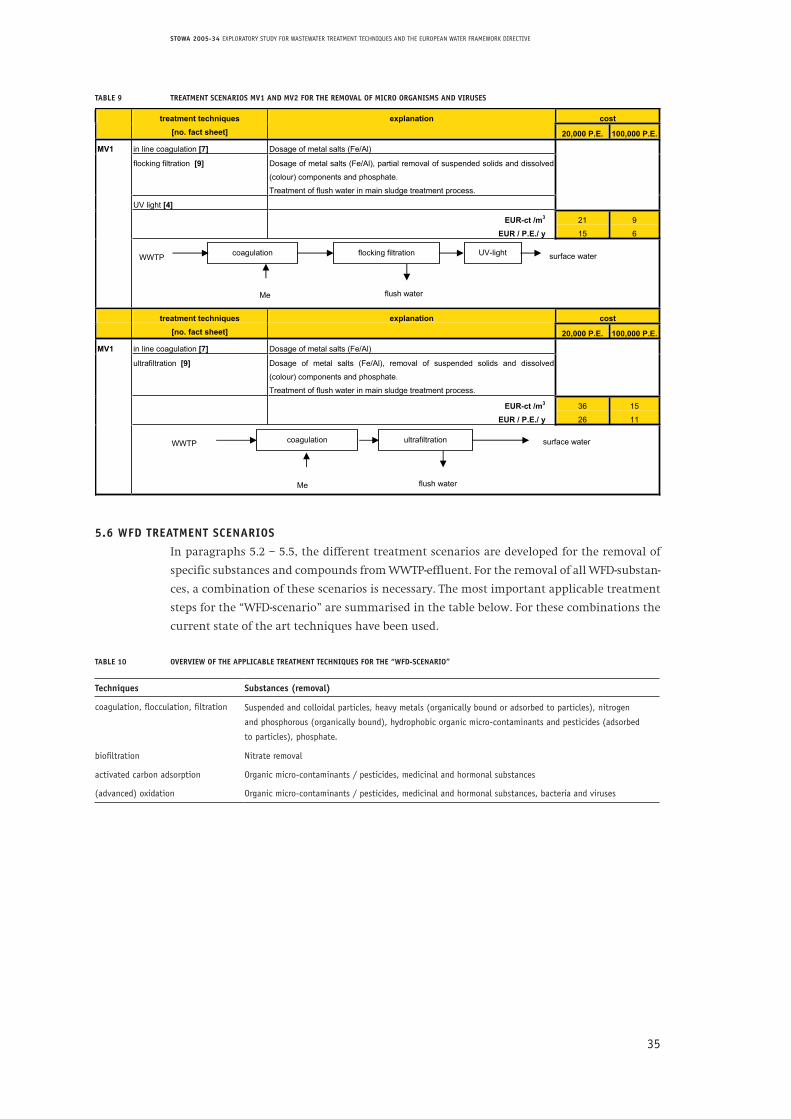
35
STOWA 2005-34 EXPLORATORY STUDY FOR WASTEWATER TREATMENT TECHNIQUES AND THE EUROPEAN WATER FRAMEWORK DIRECTIVE
TABLE 9 TREATMENT SCENARIOS MV1 AND MV2 FOR THE REMOVAL OF MICRO ORGANISMS AND VIRUSES
5.6 WFD TREATMENT SCENARIOS
In paragraphs 5.2 – 5.5, the different treatment scenarios are developed for the removal of
specific substances and compounds from WWTP-effluent. For the removal of all WFD-substan-
ces, a combination of these scenarios is necessary. The most important applicable treatment
steps for the “WFD-scenario” are summarised in the table below. For these combinations the
current state of the art techniques have been used.
TABLE 10 OVERVIEW OF THE APPLICABLE TREATMENT TECHNIQUES FOR THE “WFD-SCENARIO”
Techniques Substances (removal)
coagulation, flocculation, filtration Suspended and colloidal particles, heavy metals (organically bound or adsorbed to particles), nitrogen
and phosphorous (organically bound), hydrophobic organic micro-contaminants and pesticides (adsorbed
to particles), phosphate.
biofiltration Nitrate removal
activated carbon adsorption Organic micro-contaminants / pesticides, medicinal and hormonal substances
(advanced) oxidation Organic micro-contaminants / pesticides, medicinal and hormonal substances, bacteria and viruses
Witteveen+Bos STO126-1 Exploratory Study for Water Treatment Techniques and the European Water Framework Directive final d.d. november 25, 2005 27
TABLE 9. TREATMENT SCENARIOS MV1 AND MV2 FOR THE REMOVAL OF MICRO ORGANISMS AND VIRUSES
costtreatment techniques [no. fact sheet]
explanation
20,000 P.E. 100,000 P.E.
in line coagulation [7] Dosage of metal salts (Fe/Al)
flocking filtration [9] Dosage of metal salts (Fe/Al), partial removal of suspended solids and dissolved
(colour) components and phosphate.
Treatment of flush water in main sludge treatment process.
UV light [4]
EUR-ct /m3
EUR / P.E./ y21
15
9
6
MV1
costtreatment techniques [no. fact sheet]
explanation
20,000 P.E. 100,000 P.E.
in line coagulation [7] Dosage of metal salts (Fe/Al)
ultrafiltration [9] Dosage of metal salts (Fe/Al), removal of suspended solids and dissolved
(colour) components and phosphate.
Treatment of flush water in main sludge treatment process.
EUR-ct /m3
EUR / P.E./ y36
26
15
11
MV1
5.6. WFD TREATMENT SCENARIOS In paragraphs 5.2 – 5.5, the different treatment scenarios are developed for the removal of specific substances and compounds from WWTP-effluent. For the removal of all WFD-substances, a combination of these scenarios is necessary. The most important applicable treatment steps for the “WFD-scenario” are summarised in the table below. For these combinations the current state of the art techniques have been used.
TABLE 10. OVERVIEW OF THE APPLICABLE TREATMENT TECHNIQUES FOR THE “WFD-SCENARIO”
Techniques Substances (removal)
coagulation, flocculation, filtration Suspended and colloidal particles, heavy metals (organically bound or adsorbed
to particles), nitrogen and phosphorous (organically bound), hydrophobic organic
micro-contaminants and pesticides (adsorbed to particles), phosphate.
biofiltration Nitrate removal
activated carbon adsorption Organic micro-contaminants / pesticides, medicinal and hormonal substances
(advanced) oxidation Organic micro-contaminants / pesticides, medicinal and hormonal substances,
bacteria and viruses
WWTP UV-light
Me
coagulation flocking filtration
flush water
surface water
Me
WWTP ultrafiltration coagulation
flush water
surface water
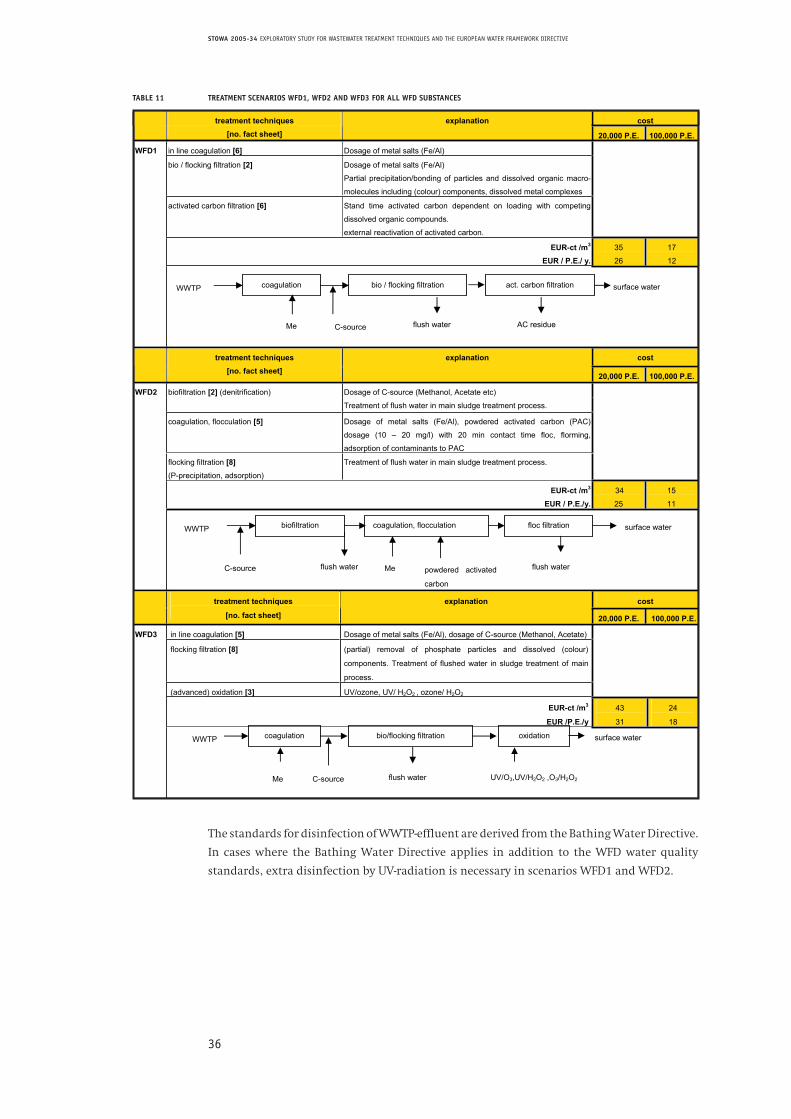
36
STOWA 2005-34 EXPLORATORY STUDY FOR WASTEWATER TREATMENT TECHNIQUES AND THE EUROPEAN WATER FRAMEWORK DIRECTIVE
TABLE 11 TREATMENT SCENARIOS WFD1, WFD2 AND WFD3 FOR ALL WFD SUBSTANCES
The standards for disinfection of WWTP-effluent are derived from the Bathing Water Directive.
In cases where the Bathing Water Directive applies in addition to the WFD water quality
standards, extra disinfection by UV-radiation is necessary in scenarios WFD1 and WFD2.
Witteveen+Bos STO126-1 Exploratory Study for Water Treatment Techniques and the European Water Framework Directive final d.d. november 25, 2005 28
Table 11. Treatment scenarios WFD1, WFD2 and WFD3 for all WFD substances
costtreatment techniques [no. fact sheet]
explanation
20,000 P.E. 100,000 P.E.
in line coagulation [6] Dosage of metal salts (Fe/Al)
bio / flocking filtration [2] Dosage of metal salts (Fe/Al)
Partial precipitation/bonding of particles and dissolved organic macro-
molecules including (colour) components, dissolved metal complexes
activated carbon filtration [6] Stand time activated carbon dependent on loading with competing
dissolved organic compounds.
external reactivation of activated carbon.
EUR-ct /m3
EUR / P.E./ y.35
26
17
12
WFD1
costtreatment techniques [no. fact sheet]
explanation
20,000 P.E. 100,000 P.E.
biofiltration [2] (denitrification) Dosage of C-source (Methanol, Acetate etc)
Treatment of flush water in main sludge treatment process.
coagulation, flocculation [5] Dosage of metal salts (Fe/Al), powdered activated carbon (PAC)
dosage (10 – 20 mg/l) with 20 min contact time floc, florming,
adsorption of contaminants to PAC
flocking filtration [8] (P-precipitation, adsorption)
Treatment of flush water in main sludge treatment process.
EUR-ct /m3
EUR / P.E./y.34
25
15
11
WFD2
costtreatment techniques
[no. fact sheet]
explanation
20,000 P.E. 100,000 P.E.
in line coagulation [5] Dosage of metal salts (Fe/Al), dosage of C-source (Methanol, Acetate)
flocking filtration [8] (partial) removal of phosphate particles and dissolved (colour)
components. Treatment of flushed water in sludge treatment of main
process.
(advanced) oxidation [3] UV/ozone, UV/ H2O2 , ozone/ H2O2
EUR-ct /m3
EUR /P.E./y
43
31
24
18
WFD3
C-source
WWTP act. carbon filtration
Me
coagulation bio / flocking filtration
AC residue flush water
surface water
WWTP coagulation, flocculation
Me
floc filtration
C-source
biofiltration
flush water flush water
surface water
powdered activated
carbon
WWTP
Me
coagulation bio/flocking filtration
flush water
oxidation
UV/O3,UV/H2O2 ,O3/H2O2
surface water
C-source
37
STOWA 2005-34 EXPLORATORY STUDY FOR WASTEWATER TREATMENT TECHNIQUES AND THE EUROPEAN WATER FRAMEWORK DIRECTIVE
5.7 COSTS
For each scenario, a cost estimate has been set up, containing the investment costs and the
total yearly costs. The cost estimates have been calculated for two plant sizes, namely 20,000
P.E. and 100,000 P.E. (P.E. – polution equivalent 136 g TOD/d)
The average dry weather flow (DWF) rate is calculated based on an average daily flow of 200
l/P.E. during 16 hours per day = 12.5 l/P.E./h. For the cost estimates the treatment units have
been designed for a hydraulic flow of 1.5 x DWF = 18.75 l/P.E./h.
The basic assumptions used in the costs calculations are presented in appendix IV. In this
appendix also the dimensions of the main treatment techniques and the needed surface per
scenario are presented.
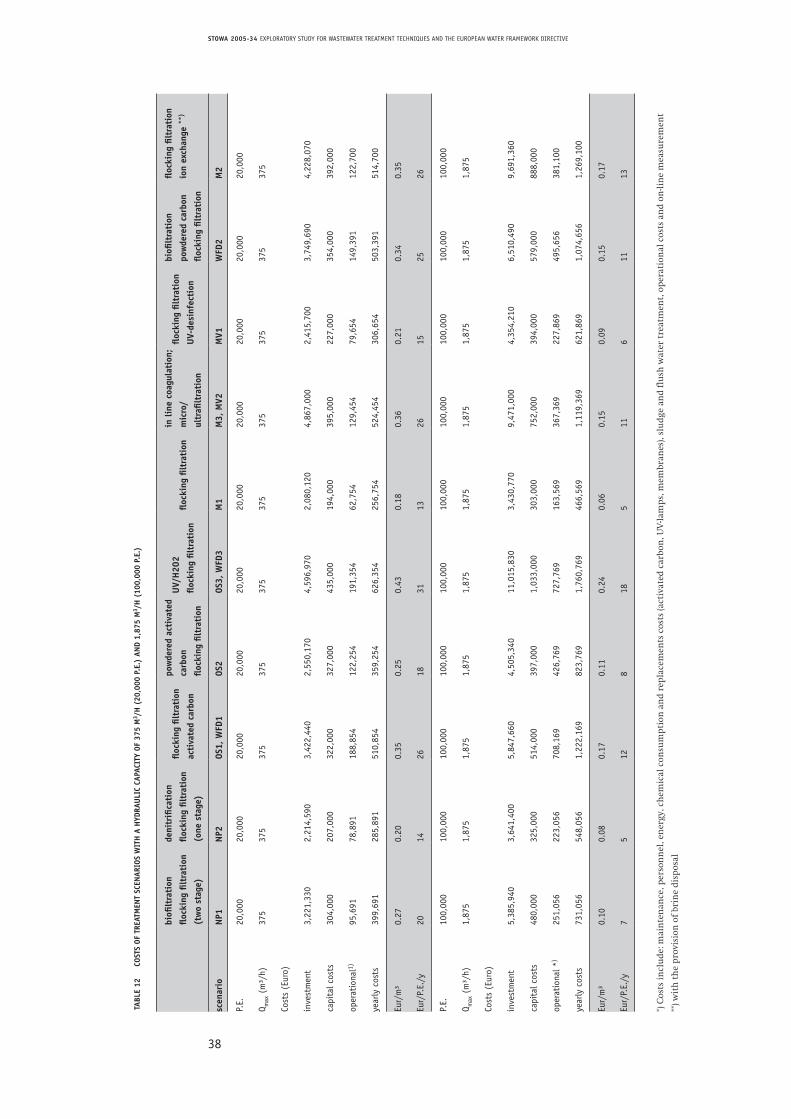
38
STOWA 2005-34 EXPLORATORY STUDY FOR WASTEWATER TREATMENT TECHNIQUES AND THE EUROPEAN WATER FRAMEWORK DIRECTIVE
TABL
E 12
C
OSTS
OF
TREA
TMEN
T SC
ENAR
IOS
WIT
H A
HYD
RAU
LIC
CAPA
CITY
OF
375
M3 /
H (
20,0
00 P
.E.)
AN
D 1,
875
M3 /
H (
100,
000
P.E.
)
biofi
ltra
tion
floc
king
filt
rati
on
(tw
o st
age)
deni
trifi
cati
on
floc
king
filt
rati
on
(one
sta
ge)
floc
king
filt
rati
on
acti
vate
d ca
rbon
pow
dere
d ac
tiva
ted
carb
on
floc
king
filt
rati
on
UV/
H2O
2
floc
king
filt
rati
onfl
ocki
ng fi
ltra
tion
in li
ne c
oagu
lati
on;
mic
ro/
ultr
afilt
rati
on
floc
king
filt
rati
on
UV-
desi
nfec
tion
biofi
ltra
tion
pow
dere
d ca
rbon
floc
king
filt
rati
on
floc
king
filt
rati
on
ion
exch
ange
**)
scen
ario
NP1
NP2
OS1,
WFD
1OS
2OS
3, W
FD3
M1
M3,
MV2
MV1
WFD
2M
2
P.E.
20,0
0020
,000
20,0
0020
,000
20,0
0020
,000
20,0
0020
,000
20,0
0020
,000
Q max
(m
³/h)
375
375
375
375
375
375
375
375
375
375
Cost
s (E
uro)
inve
stm
ent
3,22
1,33
02,
214,
590
3,42
2,44
02,
550,
170
4,59
6,97
02,
080,
120
4,86
7,00
02,
415,
700
3,74
9,69
04,
228,
070
capi
tal c
osts
304,
000
207,
000
322,
000
327,
000
435,
000
194,
000
395,
000
227,
000
354,
000
392,
000
oper
atio
nal1
)95
,691
78,8
9118
8,85
412
2,25
419
1,35
462
,754
129,
454
79,6
5414
9,39
112
2,70
0
year
ly c
osts
399,
691
285,
891
510,
854
359,
254
626,
354
256,
754
524,
454
306,
654
503,
391
514,
700
Eur/
m³
0.27
0.20
0.35
0.25
0.43
0.18
0.36
0.21
0.34
0.35
Eur/
P.E.
/y20
1426
1831
1326
1525
26
P.E.
100,
000
100,
000
100,
000
100,
000
100,
000
100,
000
100,
000
100,
000
100,
000
100,
000
Q max
(m
³/h)
1,87
51,
875
1,87
51,
875
1,87
51,
875
1,87
51,
875
1,87
51,
875
Cost
s (E
uro)
inve
stm
ent
5,38
5,94
03,
641,
400
5,84
7,66
04,
505,
340
11,0
15,8
303,
430,
770
9,47
1,00
04,
354,
210
6,51
0,49
09,
691,
360
capi
tal c
osts
480,
000
325,
000
514,
000
397,
000
1,03
3,00
030
3,00
075
2,00
039
4,00
057
9,00
088
8,00
0
oper
atio
nal *
)25
1,05
622
3,05
670
8,16
942
6,76
972
7,76
916
3,56
936
7,36
922
7,86
949
5,65
638
1,10
0
year
ly c
osts
731,
056
548,
056
1,22
2,16
982
3,76
91,
760,
769
466,
569
1,11
9,36
962
1,86
91,
074,
656
1,26
9,10
0
Eur/
m³
0.10
0.08
0.17
0.11
0.24
0.06
0.15
0.09
0.15
0.17
Eur/
P.E.
/y7
512
818
511
611
13
*) C
osts
in
clu
de:
mai
nte
nan
ce, p
erso
nn
el, e
ner
gy, c
hem
ical
con
sum
pti
on a
nd
rep
lace
men
ts c
osts
(act
ivat
ed c
arbo
n, U
V-la
mp
s, m
embr
anes
), sl
ud
ge a
nd
flu
sh w
ater
tre
atm
ent,
op
erat
ion
al c
osts
an
d o
n-li
ne
mea
sure
men
t
**) w
ith
th
e p
rovi
sion
of
brin
e d
isp
osal
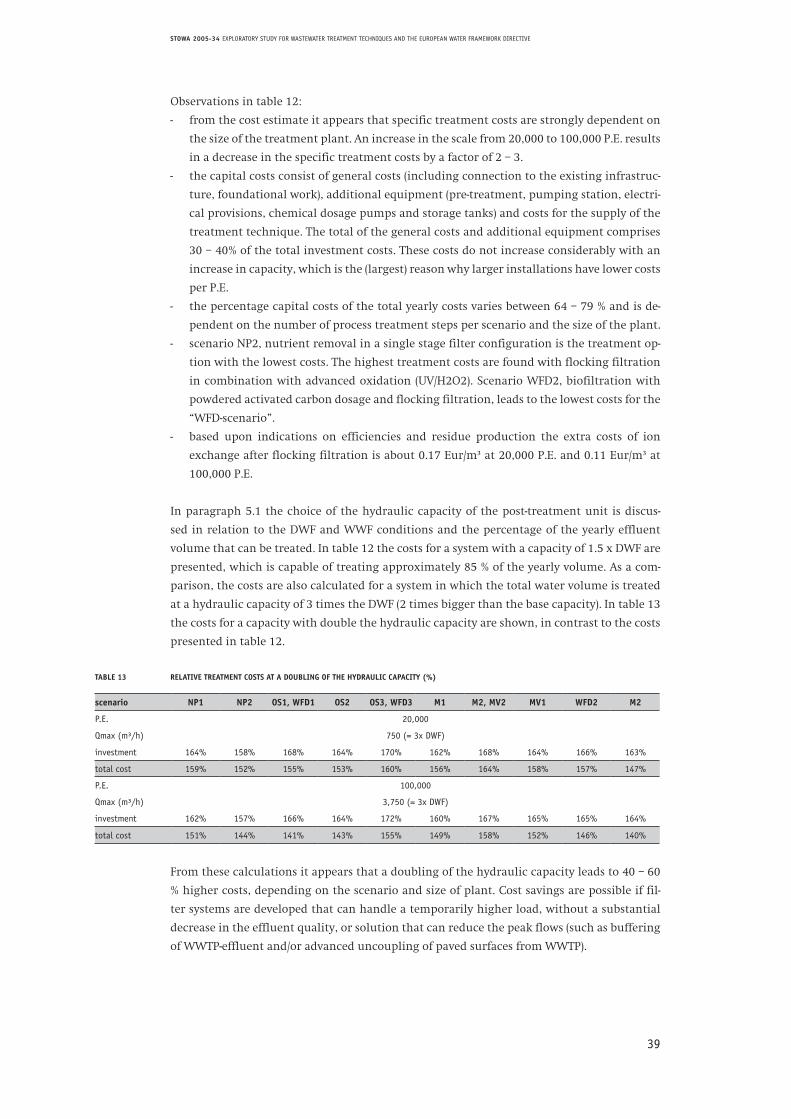
39
STOWA 2005-34 EXPLORATORY STUDY FOR WASTEWATER TREATMENT TECHNIQUES AND THE EUROPEAN WATER FRAMEWORK DIRECTIVE
Observations in table 12:
- from the cost estimate it appears that specific treatment costs are strongly dependent on
the size of the treatment plant. An increase in the scale from 20,000 to 100,000 P.E. results
in a decrease in the specific treatment costs by a factor of 2 – 3.
- the capital costs consist of general costs (including connection to the existing infrastruc-
ture, foundational work), additional equipment (pre-treatment, pumping station, electri-
cal provisions, chemical dosage pumps and storage tanks) and costs for the supply of the
treatment technique. The total of the general costs and additional equipment comprises
30 – 40% of the total investment costs. These costs do not increase considerably with an
increase in capacity, which is the (largest) reason why larger installations have lower costs
per P.E.
- the percentage capital costs of the total yearly costs varies between 64 – 79 % and is de-
pendent on the number of process treatment steps per scenario and the size of the plant.
- scenario NP2, nutrient removal in a single stage filter configuration is the treatment op-
tion with the lowest costs. The highest treatment costs are found with flocking filtration
in combination with advanced oxidation (UV/H2O2). Scenario WFD2, biofiltration with
powdered activated carbon dosage and flocking filtration, leads to the lowest costs for the
“WFD-scenario”.
- based upon indications on efficiencies and residue production the extra costs of ion
exchange after flocking filtration is about 0.17 Eur/m³ at 20,000 P.E. and 0.11 Eur/m³ at
100,000 P.E.
In paragraph 5.1 the choice of the hydraulic capacity of the post-treatment unit is discus-
sed in relation to the DWF and WWF conditions and the percentage of the yearly effluent
volume that can be treated. In table 12 the costs for a system with a capacity of 1.5 x DWF are
presented, which is capable of treating approximately 85 % of the yearly volume. As a com-
parison, the costs are also calculated for a system in which the total water volume is treated
at a hydraulic capacity of 3 times the DWF (2 times bigger than the base capacity). In table 13
the costs for a capacity with double the hydraulic capacity are shown, in contrast to the costs
presented in table 12.
TABLE 13 RELATIVE TREATMENT COSTS AT A DOUBLING OF THE HYDRAULIC CAPACITY (%)
scenario NP1 NP2 OS1, WFD1 OS2 OS3, WFD3 M1 M2, MV2 MV1 WFD2 M2
P.E. 20,000
Qmax (m³/h) 750 (= 3x DWF)
investment 164% 158% 168% 164% 170% 162% 168% 164% 166% 163%
total cost 159% 152% 155% 153% 160% 156% 164% 158% 157% 147%
P.E. 100,000
Qmax (m³/h) 3,750 (= 3x DWF)
investment 162% 157% 166% 164% 172% 160% 167% 165% 165% 164%
total cost 151% 144% 141% 143% 155% 149% 158% 152% 146% 140%
From these calculations it appears that a doubling of the hydraulic capacity leads to 40 – 60
% higher costs, depending on the scenario and size of plant. Cost savings are possible if fil-
ter systems are developed that can handle a temporarily higher load, without a substantial
decrease in the effluent quality, or solution that can reduce the peak flows (such as buffering
of WWTP-effluent and/or advanced uncoupling of paved surfaces from WWTP).
40
STOWA 2005-34 EXPLORATORY STUDY FOR WASTEWATER TREATMENT TECHNIQUES AND THE EUROPEAN WATER FRAMEWORK DIRECTIVE
6
GAPS IN THE KNOWLEDGE
6.1 SUBSTANCES
For some WFD-substances, especially organic micro-contaminants, pesticides, hormone
disrupters and medicinal substances, there is little or no data available for WWTP-effluent.
For some WFD-substances, the presence in the effluent is also related to the type of supply.
An example thereof is zinc. This metal is more present in the effluent during WWF than
during DWF.
More insight into the presence of WFD-substances in WWTP-effluent, surface water and other
emission sources is necessary in order to establish the required measures that must be incor-
porated into the River Basin Management Plans in 2009.
The suspended solids in WWTP-effluent contain relatively high concentrations of hydrop-
hobic organic contaminants (characterised by a high octanol/water distribution coefficient).
The availability of more information regarding the distribution of these components bet-
ween the water phase and the suspended material phase will make an appropriate choice of
treatment possible.
Also heavy metals are partitioned between the different phases. A part of the heavy metals
is present in suspended solids. Another part is present in dissolved form, on the one hand in
ionic form, on the other hand in complex organic substances. More information regarding
the distribution of heavy metal (forms) in WWTP-effluent will make a well-founded choice of
treatment technique possible.
The presence of dissolved, slowly degradable organic nitrogen compounds in WWTP-effluent
(in concentrations > 1.5 g/l) can be a problem for achieving the MTR-limit for nitrogen (=2.2
mg Ntotaal/l). More knowledge is desirable regarding the concentrations of dissolved, slowly
degradable organic nitrogen compounds and the factors that can have an influence on these
concentrations.
The WFD aims for reaching a good water status for surface water. At this moment it is not
clear whether a good ecological status can be reached with a good chemical composition of
WWTP-effluent, which fulfills all defined standards of the WFD-substances. Not only removal
efficiencies for substances have to kept in mind, also the reduction of environmental load has
to be studied through ecotoxicity tests.
6.2 TECHNIQUES
The different treatment scenarios have been compiled based on the expectation that the
required treatment standards for the relevant WFD substances will be achieved with these
techniques. This expectation is partially based on results from pilot scale research results
and/or full-scale applications. In cases where insufficient information was available the
potential removal efficiencies have been derived from other applications such as drinking
41
STOWA 2005-34 EXPLORATORY STUDY FOR WASTEWATER TREATMENT TECHNIQUES AND THE EUROPEAN WATER FRAMEWORK DIRECTIVE
water production or industrial wastewater treatment. This means that further research is
necessary in order to establish the exact removal efficiencies of these treatment techniques
for WFD-substances, including pesticides, organic micro-contaminants, heavy metals, hor-
mone disrupters and medicinal substances.
Suspended solids and dissolved organic (coloured) compounds influence the functioning
of specific treatment techniques for the removal of WFD substances. The application of
coagulation and flocculation followed by a filtration technique can remove suspended solids,
colloidal particles, a fraction of the dissolved negatively charged organic complexes and hea-
vy metals. Whether heavy metals are sufficiently removed using coagulation and flocculation
is unclear. The removal of these components is also important as a pre-treatment step prior
to other treatment techniques (for example activated carbon filtration, advanced oxidation,
UV disinfection).
The optimal configuration of coagulation and flocculation in combination with filtration
needs to be further developed. An important question in this development is whether or not a
portion of the organic metal complexes and other contaminants are removed in an optimised
coagulation process, such that the discharge standards for these compounds can be achieved.
A significant question is whether the simple set up of in line coagulation followed by floc
forming in the filter bed is sufficient, or whether a separated coagulation and flocculation
reactor is necessary prior to the filter. Another question is whether the required removal
efficiencies can be obtained with sand filtration (in upwards or downwards configuration)
or if membrane filtration is necessary (micro- or ultrafiltration).
Due to the large pore size in the filter bed, sand filters can also be used as flocking filters
for phosphate removal (with dosage of flocculent) or as a biofilter for denitrification (with
dosage of a carbon-source). The combination of both techniques, in which both flocculent
and a carbon-source are added to the influent, has been tried with varying success. As this
technique could provide an interesting saving in costs, further research into the possibilities
and operational aspects is necessary.
Advanced oxidation processes (AOP) are applicable for the removal of a large number of WFD
substances. The combination of UV-radiation with either hydrogen peroxide or ozone results
in the formation of free radicals, which have a stronger oxidative effect than hydrogen per-
oxide or ozone. The investment costs for an AOP installation are higher than for an ozone
unit alone. The energy consumption is also higher than that for the production of ozone.
Further research is desired into the optimisation of the oxidative technique, especially the
need for UV-application and the possibility for pre-treatment (to increase transmission) to
improve the efficiency.
In the use of oxidation techniques, organic compounds are degraded into (largely unidenti-
fied) degradation products. These by-products usually seem to have a low or no toxic effect
on organisms. In drinking water production activated carbon filtration is generally applied
after oxidation in order to remove degradation by-products. In the case of effluent treatment
it is not known whether (expensive) activated carbon treatment is necessary after oxidation
techniques, or whether the release of the oxidised water into surface water does not present
a risk for the ecosystem. To answer these questions more information is required regarding
the formation of degradation by-products and their toxicity.
42
STOWA 2005-34 EXPLORATORY STUDY FOR WASTEWATER TREATMENT TECHNIQUES AND THE EUROPEAN WATER FRAMEWORK DIRECTIVE
In Europe, little long-term continuing research has been performed looking at the applicati-
on of granular activated carbon filtration (GAC) for the removal of organic contaminants, pes-
ticides, hormone disrupters and medicinal substances from WWTP-effluent. The stand time
of carbon has been estimated conservatively in the cost estimates (0.6 – 0.7 years). Further
experience with stand times obtained in practice is necessary, especially in relation to the
applied pre-treatment.
In small-scale installations good results have been achieved with biological activated carbon
filtration, in which denitrification takes place in the carbon filter. An important question ari-
sing from these results is how can the biomass be retained and regularly discharged without
interrupting the optimal process conditions of the adsorption process?
An interesting alternative for activated carbon filtration is the application of powdered
carbon in (floc) filtration. This option is especially interesting if a low dosage can be applied
to achieve the required removal of organic contaminants. Further research is necessary into
the efficiency, technical and financial feasibility of this technique in its application to WWTP-
effluent.
Due to the more than 1000 times lower concentration of the metals to be removed (Cd, Cu,
Ni, Zn in ppb/l) in relation to the macro-ions Ca and Mg present (> 10 mg/l), the application of
ion exchange to WWTP-effluent is not considered promising. However, in a pilot study look-
ing at the removal of metals during drinking water production with specific ion exchange
resins, good results have been obtained at similar concentration levels of the macro-ions and
metals, at long operating times. A similar problem may arise during the biological removal of
organic contaminants (at ppb level), in which the contaminants compete with the remaining
BOD and COD (mg/l). The development of specific biomass that can degrade the micro-conta-
minants in this environment is considered difficult and not very promising. Verification of
this technique is necessary, given the potential importance of these techniques for effluent
treatment.
6.3 RESIDUAL WASTE STREAMS
When choosing a treatment system for the removal of WFD-substances, a complete solution
should be chosen including treatment of the waste streams produced. Due to the fact that
a feasible treatment step has not (yet) been found for treatment of the relatively large vo-
lume of concentrated salt solution, nano- and hyperfiltration are at this stage not considered
applicable for complete treatment of effluent. In all other filtration systems it is assumed that
the backflush water containing the removed contaminants can be recycled back to the main
activated sludge process. Particular points requiring attention in the recycling of flush water
back to the main plant are: the acceptable hydraulic loading rate of the plant receiving the
extra load, the influence on the sludge treatment and the prevention of breakthrough of fine
particles into the effluent.
43
STOWA 2005-34 EXPLORATORY STUDY FOR WASTEWATER TREATMENT TECHNIQUES AND THE EUROPEAN WATER FRAMEWORK DIRECTIVE
6.4 COSTS
The estimated costs for a number of techniques (especially MF/UF, activated carbon treatment
and oxidation) have been extrapolated from applications in the drinking water sector, in
cases where no information is available on WWTP-effluent. A risk in this approach is that
the actual costs may be higher or lower depending on the development of the construction
costs (e.g. if a more economical construction is developed), or on the development of the ope-
rational costs (e.g. if the required chemical dosage is higher than thought). The applicability
of these techniques to WWTPs in practice will depend on the costs. It is therefore important
to test these cost estimates again as soon as further insight is available in effluent treatment
(laboratory → pilot → demonstration scale), and adjust them where necessary.
In the cost estimates it appears that a doubling of the installed hydraulic capacity of the
treatment technique (from 1.5 to 3.0 times the dry weather flow) results in a 40 – 60 %
increase in the yearly costs. The extra water treatment that is achieved is however limited
(10 – 15 % of the yearly flow). Cost savings are possible by developing filtration systems that
can handle temporarily higher peak flows without a substantial decrease in effluent quality,
or the development of systems or solutions that reduce the peak flow to the treatment unit
(such as buffering of WWTP-effluent and/or advanced uncoupling of paved surfaces in the
area of the WWTP).
44
STOWA 2005-34 EXPLORATORY STUDY FOR WASTEWATER TREATMENT TECHNIQUES AND THE EUROPEAN WATER FRAMEWORK DIRECTIVE
7
REFERENCE LIST
Water Advising Commission, Reaction to draft report ‘Envisioning Water 2004’. Letter d.d. 08 March
2004 of the Water Advising Commission, The Hague, The Netherlands (2004).
Beltran, F.J., Ovejero, G., Rivas, J. (1996). Oxidation of Polynuclear Aromatic Hydrocarbons in water.
3. UV radiation combined with jydrogen peroxide. Ind. Eng. Chem. Res., 35, p. 883 890
Beltran, F.J., Encinar, J.M., Gonzalez, J.F. (1997) Industrial wastewater advanced oxidation. Part 2.
Ozone combined with hydrogen peroxide or UV radiation. Water Research 31(10), p. 2415 2428
Bibo, B.H. et al., Water in industry: handbook for industrial water reuse, Ten Hagen Stam, The Hague,
The Netherlands (1998)
Birkett, J.W. et al., Endocrine Disrupters in Wastewater and Sludge Treatment Processes Lewish
Publishers, CRCPress, Boca Raton, (2003)
Booy, de C., Kramer, J.F., Rijnland start grootschalige zandfiltratie afvalwaterzuivering, Land+Water,
February 2005, nr 1/2
CBS www.statline.nl Waterkwaliteitsbeheer in NL – Afvalwaterzuivering, (2004)
Denneman, W.D. et al., Xeno-oestrogenen en drinkwater(bronnen) RIWA, Kiwa, Schiedam,
The Netherlands (1998)
Derksen, J.G.M. et al., Milieu-effecten van humane geneesmiddelen, RIZA 2000.051, Lelystad,
The Netherlands (2000)
EU, Non-paper for directive on environmental quality standards and emission controls in the field of
water policy and amending Directive 2000/60/EC and 96/61/EC, (2004) Brussels.
EU, Richtlijn 2000/60/EG van het Europees Parlement en de Raad van 23 oktober 2000 tot vaststelling
van een kader voor communautaire maatregelen betreffende het waterbeleid, (2000) Brussels.
EU, Beschikking Nr. 2455/2001/EG van het Europees Parlement en de Raad van 20 november 2001 tot
vaststelling van de lijst van prioritaire stoffen op het gebied van het waterbeleid en tot wijziging van
Richtlijn 2000/60/EG, (2001) Brussels.
Gommers, P. et al., ‘Gezuiverde’ cijfers over zuiveren, RIZA 99.018, Lelystad, The Netherlands (1999)
Hofman, J.A.M.H., Gijsbertsen A.J., Cornelissen, E., (2005) NF Retention Models for Organic
Contaminants, Kiwa Water Research and AWWA Research Foundation (in preparation)
IJpelaar, G.F., Kruithof, J.C. (2001). Advanced Oxidation Processes for the Degradation of Pesticides
in Ground Water and Surface Water. IOA Congres London GB
45
STOWA 2005-34 EXPLORATORY STUDY FOR WASTEWATER TREATMENT TECHNIQUES AND THE EUROPEAN WATER FRAMEWORK DIRECTIVE
Kramer, J F., van der Graaf J.H.M.J., van der Velde R.T., van ́ t Oever, E., van Kessel, A.A.L., Innovation of
conventional water treatment techniques in effluent reclamation, IWA/AWWA conference “Innovations
in conventional and advanced treatment processes, Amsterdam, The Netherlands, September 26 – 29,
2000
Kruithof, J.C., Kamp, P.C. (1999). Impact of the type of Advanced Oxidation (O3/H2O2 and UV/H2O2)
on Bromate Formation. 5e congress over ‘Advanced Oxidation technologies, Albequerque, United
States.
Kruithof, J.C., Kamp, P.C., Finch, G.R. (2000). UV/H2O2 Treatment: The ultimate solution for pesticide
control and disinfection. Annual Awwa Conference, Denver, United States.
Lide, D.R. ,CRC Handbook of Chemistry and Physics, CRC Press 82nd Ed., Boca Raton (2001)
Meijers, R.T., Oderwald�Muller, E.J., Nuhn, P.A.N.M., Kruithof, J.C. (1995). Degradation of pesticides
by ozonation and advanced oxidation. IOA Congres, Lille, France.
Meinema K. & J. Rienks (1995). Inventarisatie en evaluatie van technieken voor het polijsten van
effluent van rioolwaterzuiveringsinrichtingen. RIZA-rapport 95.033, Lelystad, The Netherlands.
Mulder, M., Basic Principles of Membrane Technology, Kluwer Acadeic Publishers, Dordrecht,
The Netherlands (1996)
Novem, http://www.WaterTechnoWijzer.nl, Novem, DHV, TIM, Royal Haskoning (2005)
Parsons, S.A., Advanced Oxidation Processes for Water and Wastewater Treatment, IWA Publishing,
London, (2004)
Rautenbach, R. et al., Möglichkeiten und Perspektiven der Membrantechnik bei der kommunalen
Abwasserbehandlung und Trinkwasseraufbereitung, IVT Aachen, Aachen, Germany (1997)
RIZA, Waterverkenningen. Een strategie voor de aanpak van microverontreinigingen in communaal
afvalwater. RIZA-rapport 99.027, Lelystad, The Netherlands (1999).
RIZA. Totaal-effluentbeoordeling bij RWZI’s. Literatuurstudie naar de toepassing van ecotoxicologische
testmethoden bij totaaleffluentbeoordeling van RWZI-effluenten. RIZA-rapport 2000.055, Lelystad,
The Netherlands (1999)
Roex E., TEB-praktijk-onderzoek. Meten TEB-parameters. FWVO-nota 03-03, Den Haag, The Netherlands
(2003)
Roorda, J.H., Filtration Characteristics in Dead-End Ultrafiltration of WWTP-Effluent, PhD-Thesis,
The Hague (2004)
Stetter, D., Dördelmann, Overath, H., Pilot scale studies on the removal of trace metal contaminations
in drinking water treatment using chelating ion-exchange resins, Water Science and Technology; Water
supply Vol 2 No 1 pp 25-35 2002
STOWA, Compendium RWZI-efflluent als bron voor ‘ander water’, STOWA-rapport 2001-14, Utrecht,
The Netherlands (2001)
STOWA, Buitenlandse technieken, Een zoektocht naar andere oplossingen, STOWA-rapport 2002-41
Utrecht, The Netherlands (2002)
STOWA, Review oestrogenen en geneesmiddelen in het milieu, STOWA 2003-09, Utrecht, The Netherlands
(2003)
46
STOWA 2005-34 EXPLORATORY STUDY FOR WASTEWATER TREATMENT TECHNIQUES AND THE EUROPEAN WATER FRAMEWORK DIRECTIVE
STOWA, Verwijdering van hormoonverstorende stoffen in rioolwater zuiveringsinstallaties, STOWA
2003-15, Utrecht, The Netherlands (2003)
STOWA, Prioritering hormoonverstorende stoffen voor waterbeheerders / prioritaire geneesmiddelen
voor waterbeheerders, STOWA 2004-W04, Utrecht, The Netherlands (2004)
STOWA, Verkenning van de gevolgen van de Kaderrichtlijn Water voor het onderzoeksveld waterbeheer,
STOWA-rapport 2004-27, Utrecht, The Netherlands (2004)
STOWA, Monitoringsonderzoek naar hormoonverstorende stoffen en fecale verontreinigingen op RWZI’s.
STOWA-rapport, Utrecht, The Netherlands (in preparation, 2005)
Tonkes, M. et al., Totaal-effluentbeoordeling bij RWZI’s, Riza 2000.055, Lelystad, The Netherlands
(2000)
Van de Guchte, C. et al. Normen voor het waterbeheer, CIW, The Hague, The Netherlands (2000)
Van der Horst M., Quick-scan verdunningsratio’s RWZI-effluenten. RIZA/STOWA werkdocument,
Lelystad/Utrecht, The Netherlands (in preparation, 2004)
Van der Velde, O. et al., KRW-project Fact-sheets stoffen, Rapportage & Evaluatie, RIZA-werkdocument
2004-204X, RIKZ & RIZA, Utrecht, The Netherlands (2004)
Verkeer & Waterstaat, Vierde Nota Waterhuishouding, Regeringsbeslissing. Ministerie van Verkeer &
Waterstaat, The Hague, The Netherlands (1998).
Verkeer & Waterstaat, Pragmatische Implementatie Europese Kaderrichtlijn Water in Nederland. Tweede
Kamer, vergaderjaar 2003-2004, 28.808, nr 12, The Hague, The Netherlands (2004).
Verkeer & Waterstaat, ‘Water in Beeld 2004’, Voortgangsrapportage over het waterbeheer in Nederland.
Ministerie van Verkeer & Waterstaat, The Hague, The Netherlands (2004)
Vethaak, A.D. et al., Estrogens and xeno-estrogens in the aquatic environment of the Netherlands,
Occurence, Potency and Biological Effects, RIZA-rapport 2002.001, Lelystad (2002)
Wagemaker F. et al.,. Probleemverkenning prioritaire stoffen (fact sheets), RIZA-werkdocument
2003.222x, RIKZ & RIZA, Lelystad, The Netherlands (2003)
www.kaderrichtlijnwater.nl, ‘Handboek Kaderrichtlijn Water’
47
STOWA 2005-34 EXPLORATORY STUDY FOR WASTEWATER TREATMENT TECHNIQUES AND THE EUROPEAN WATER FRAMEWORK DIRECTIVE
APPENDIX I
LIST OF SUBSTANCES
READER´S GUIDE TO THE LIST OF SUBSTANCES
In the following table, hazardous substances are presented for which WWTPs are conside-
red to be a relevant emission source. This has been established by studies into the presence
of these substances in WWTP-effluent (over the period 2000 – 2004) and in tests that have
shown that these substances are detected in surface water at concentrations higher than the
required levels. The list of substances is derived from the list of priority substances of the
European Water Framework Directive, the River Basin Management Plans for the Rhine and
the Meuse (ICBR and ICBM), substances of list of the dangerous substances directive (76/464/
EEC) and the future EU Bathing Water Directive (Com 2002 581).
In cases where a substance has been detected in WWTP-effluent and the concentration in the
surface water is above the allowed level, they are marked as relevant for the WWTP (orange).
In cases where the substance has not been detected in WWTP-effluent and the allowed level
in surface water is not exceeded, the substance is marked as not relevant to wwtps (green).
In case the surface water limit is not exceeded but the substance has been detected in WWTP-
effluent, this is marked as possibly locally relevant (yellow).
The table also presents the concentration range and the frequency of the presence in WWTP-
effluent.
This table has been established based upon currently available monitoring data. The expec-
tation is that when more monitoring data become available this will lead to changes in the
table.
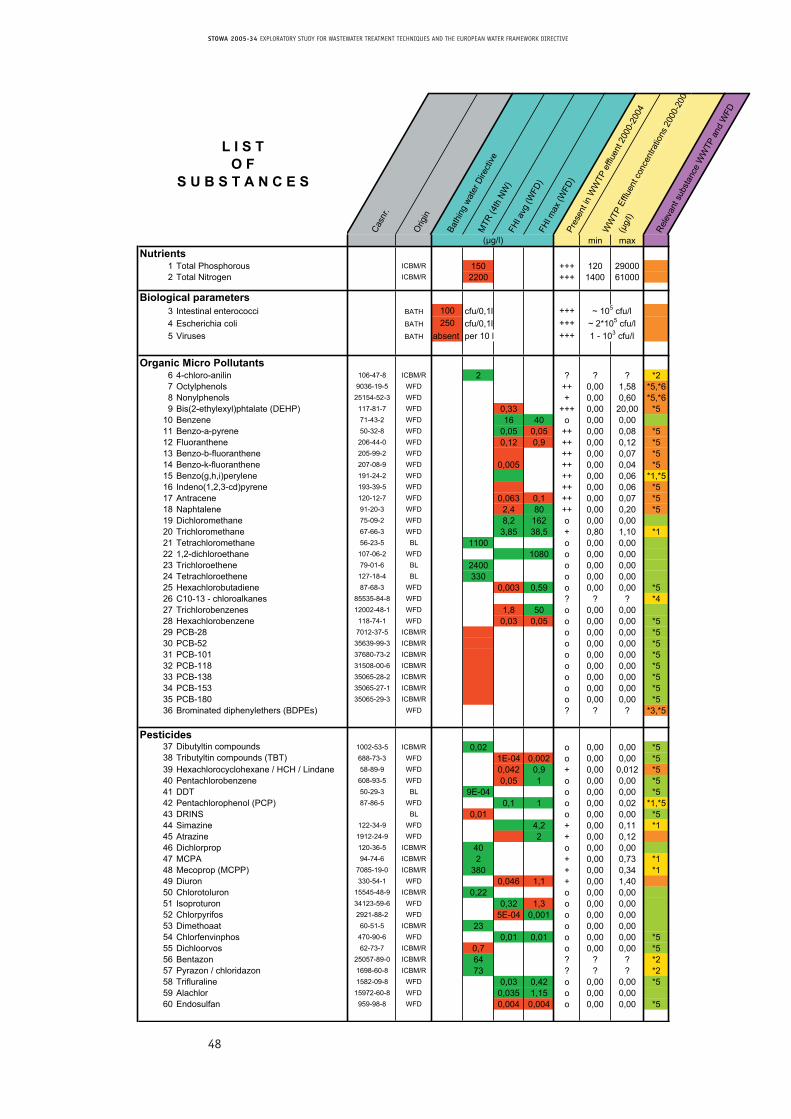
48
STOWA 2005-34 EXPLORATORY STUDY FOR WASTEWATER TREATMENT TECHNIQUES AND THE EUROPEAN WATER FRAMEWORK DIRECTIVE
Casn
r.
Orig
in
Bath
ing
wate
r Dire
ctive
MTR
(4th
NW)
FHI a
vg(W
FD)
FHI m
ax(W
FD)
Pres
ent i
nW
WTP
efflu
ent 2
000-
2004
WW
TPEf
fluen
t con
cent
ratio
ns20
00-2
004
(µg/
l)
Rele
vant
subs
tanc
eW
WTP
and
WFD
L I S TO F
S U B S T A N C E S
(µg/l) min maxNutrients
1 Total Phosphorous ICBM/R 150 +++ 120 290002 Total Nitrogen ICBM/R 2200 +++ 1400 61000
Biological parameters3 Intestinal enterococci BATH 100 cfu/0,1l +++4 Escherichia coli BATH 250 cfu/0,1l +++5 Viruses BATH absent per 10 l +++
Organic Micro Pollutants6 4-chloro-anilin 106-47-8 ICBM/R 2 ? ? ? *27 Octylphenols 9036-19-5 WFD ++ 0,00 1,58 *5,*68 Nonylphenols 25154-52-3 WFD + 0,00 0,60 *5,*69 Bis(2-ethylexyl)phtalate (DEHP) 117-81-7 WFD 0,33 +++ 0,00 20,00 *5
10 Benzene 71-43-2 WFD 16 40 o 0,00 0,0011 Benzo-a-pyrene 50-32-8 WFD 0,05 0,05 ++ 0,00 0,08 *512 Fluoranthene 206-44-0 WFD 0,12 0,9 ++ 0,00 0,12 *513 Benzo-b-fluoranthene 205-99-2 WFD ++ 0,00 0,07 *514 Benzo-k-fluoranthene 207-08-9 WFD 0,005 ++ 0,00 0,04 *515 Benzo(g,h,i)perylene 191-24-2 WFD ++ 0,00 0,06 *1,*516 Indeno(1,2,3-cd)pyrene 193-39-5 WFD ++ 0,00 0,06 *517 Antracene 120-12-7 WFD 0,063 0,1 ++ 0,00 0,07 *518 Naphtalene 91-20-3 WFD 2,4 80 ++ 0,00 0,20 *519 Dichloromethane 75-09-2 WFD 8,2 162 o 0,00 0,0020 Trichloromethane 67-66-3 WFD 3,85 38,5 + 0,80 1,10 *121 Tetrachloromethane 56-23-5 BL 1100 o 0,00 0,0022 1,2-dichloroethane 107-06-2 WFD 1080 o 0,00 0,0023 Trichloroethene 79-01-6 BL 2400 o 0,00 0,0024 Tetrachloroethene 127-18-4 BL 330 o 0,00 0,0025 Hexachlorobutadiene 87-68-3 WFD 0,003 0,59 o 0,00 0,00 *526 C10-13 - chloroalkanes 85535-84-8 WFD ? ? ? *427 Trichlorobenzenes 12002-48-1 WFD 1,8 50 o 0,00 0,0028 Hexachlorobenzene 118-74-1 WFD 0,03 0,05 o 0,00 0,00 *529 PCB-28 7012-37-5 ICBM/R o 0,00 0,00 *530 PCB-52 35639-99-3 ICBM/R o 0,00 0,00 *531 PCB-101 37680-73-2 ICBM/R o 0,00 0,00 *532 PCB-118 31508-00-6 ICBM/R o 0,00 0,00 *533 PCB-138 35065-28-2 ICBM/R o 0,00 0,00 *534 PCB-153 35065-27-1 ICBM/R o 0,00 0,00 *535 PCB-180 35065-29-3 ICBM/R o 0,00 0,00 *536 Brominated diphenylethers (BDPEs) WFD ? ? ? *3,*5
Pesticides37 Dibutyltin compounds 1002-53-5 ICBM/R 0,02 o 0,00 0,00 *538 Tributyltin compounds (TBT) 688-73-3 WFD 1E-04 0,002 o 0,00 0,00 *539 Hexachlorocyclohexane / HCH / Lindane 58-89-9 WFD 0,042 0,9 + 0,00 0,012 *540 Pentachlorobenzene 608-93-5 WFD 0,05 1 o 0,00 0,00 *541 DDT 50-29-3 BL 9E-04 o 0,00 0,00 *542 Pentachlorophenol (PCP) 87-86-5 WFD 0,1 1 o 0,00 0,02 *1,*543 DRINS BL 0,01 o 0,00 0,00 *544 Simazine 122-34-9 WFD 4,2 + 0,00 0,11 *145 Atrazine 1912-24-9 WFD 2 + 0,00 0,1246 Dichlorprop 120-36-5 ICBM/R 40 o 0,00 0,0047 MCPA 94-74-6 ICBM/R 2 + 0,00 0,73 *148 Mecoprop (MCPP) 7085-19-0 ICBM/R 380 + 0,00 0,34 *149 Diuron 330-54-1 WFD 0,046 1,1 + 0,00 1,4050 Chlorotoluron 15545-48-9 ICBM/R 0,22 o 0,00 0,0051 Isoproturon 34123-59-6 WFD 0,32 1,3 o 0,00 0,0052 Chlorpyrifos 2921-88-2 WFD 5E-04 0,001 o 0,00 0,0053 Dimethoaat 60-51-5 ICBM/R 23 o 0,00 0,0054 Chlorfenvinphos 470-90-6 WFD 0,01 0,01 o 0,00 0,00 *555 Dichloorvos 62-73-7 ICBM/R 0,7 o 0,00 0,00 *556 Bentazon 25057-89-0 ICBM/R 64 ? ? ? *257 Pyrazon / chloridazon 1698-60-8 ICBM/R 73 ? ? ? *258 Trifluraline 1582-09-8 WFD 0,03 0,42 o 0,00 0,00 *559 Alachlor 15972-60-8 WFD 0,035 1,15 o 0,00 0,0060 Endosulfan 959-98-8 WFD 0,004 0,004 o 0,00 0,00 *5
~ 105 cfu/l~ 2*105 cfu/l1 - 103 cfu/l
(µg/l)
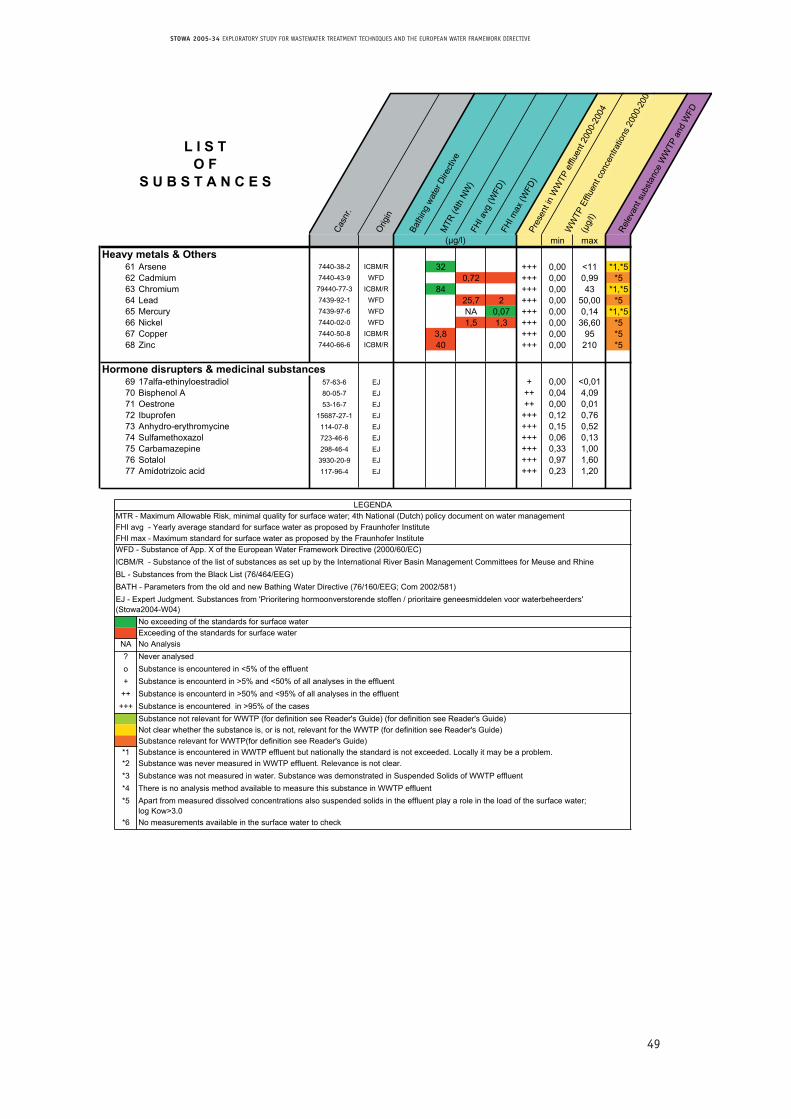
49
STOWA 2005-34 EXPLORATORY STUDY FOR WASTEWATER TREATMENT TECHNIQUES AND THE EUROPEAN WATER FRAMEWORK DIRECTIVE
Casn
r.
Orig
in
Bath
ing
wate
r Dire
ctive
MTR
(4th
NW)
FHI a
vg(W
FD)
FHI m
ax(W
FD)
Pres
ent i
nW
WTP
efflu
ent 2
000-
2004
WW
TPEf
fluen
t con
cent
ratio
ns20
00-2
004
(µg/
l)
Rele
vant
subs
tanc
eW
WTP
and
WFD
L I S TO F
S U B S T A N C E S
(µg/l) min max(µg/l)
Heavy metals & Others61 Arsene 7440-38-2 ICBM/R 32 +++ 0,00 <11 *1,*562 Cadmium 7440-43-9 WFD 0,72 +++ 0,00 0,99 *563 Chromium 79440-77-3 ICBM/R 84 +++ 0,00 43 *1,*564 Lead 7439-92-1 WFD 25,7 2 +++ 0,00 50,00 *565 Mercury 7439-97-6 WFD NA 0,07 +++ 0,00 0,14 *1,*566 Nickel 7440-02-0 WFD 1,5 1,3 +++ 0,00 36,60 *567 Copper 7440-50-8 ICBM/R 3,8 +++ 0,00 95 *568 Zinc 7440-66-6 ICBM/R 40 +++ 0,00 210 *5
Hormone disrupters & medicinal substances69 17alfa-ethinyloestradiol 57-63-6 EJ + 0,00 <0,0170 Bisphenol A 80-05-7 EJ ++ 0,04 4,0971 Oestrone 53-16-7 EJ ++ 0,00 0,0172 Ibuprofen 15687-27-1 EJ +++ 0,12 0,7673 Anhydro-erythromycine 114-07-8 EJ +++ 0,15 0,5274 Sulfamethoxazol 723-46-6 EJ +++ 0,06 0,1375 Carbamazepine 298-46-4 EJ +++ 0,33 1,0076 Sotalol 3930-20-9 EJ +++ 0,97 1,6077 Amidotrizoic acid 117-96-4 EJ +++ 0,23 1,20
NA?o+
+++++
*1*2*3*4*5
*6
There is no analysis method available to measure this substance in WWTP effluentApart from measured dissolved concentrations also suspended solids in the effluent play a role in the load of the surface water;log Kow>3.0No measurements available in the surface water to check
Substance relevant for WWTP(for definition see Reader's Guide)Substance is encountered in WWTP effluent but nationally the standard is not exceeded. Locally it may be a problem.Substance was never measured in WWTP effluent. Relevance is not clear.Substance was not measured in water. Substance was demonstrated in Suspended Solids of WWTP effluent
Substance is encounterd in >50% and <95% of all analyses in the effluentSubstance is encountered in >95% of the casesSubstance not relevant for WWTP (for definition see Reader's Guide) (for definition see Reader's Guide)Not clear whether the substance is, or is not, relevant for the WWTP (for definition see Reader's Guide)
Exceeding of the standards for surface waterNo Analysis
Substance is encountered in <5% of the effluentSubstance is encounterd in >5% and <50% of all analyses in the effluent
Never analysed
BL - Substances from the Black List (76/464/EEG)BATH - Parameters from the old and new Bathing Water Directive (76/160/EEG; Com 2002/581)EJ - Expert Judgment. Substances from 'Prioritering hormoonverstorende stoffen / prioritaire geneesmiddelen voor waterbeheerders'(Stowa2004-W04)
No exceeding of the standards for surface water
LEGENDA
WFD - Substance of App. X of the European Water Framework Directive (2000/60/EC)ICBM/R - Substance of the list of substances as set up by the International River Basin Management Committees for Meuse and Rhine
MTR - Maximum Allowable Risk, minimal quality for surface water; 4th National (Dutch) policy document on water managementFHI avg - Yearly average standard for surface water as proposed by Fraunhofer InstituteFHI max - Maximum standard for surface water as proposed by the Fraunhofer Institute

50
STOWA 2005-34 EXPLORATORY STUDY FOR WASTEWATER TREATMENT TECHNIQUES AND THE EUROPEAN WATER FRAMEWORK DIRECTIVE
51
STOWA 2005-34 EXPLORATORY STUDY FOR WASTEWATER TREATMENT TECHNIQUES AND THE EUROPEAN WATER FRAMEWORK DIRECTIVE
APPENDIX II
OVERVIEW OF TREATMENT TECHNIQUES
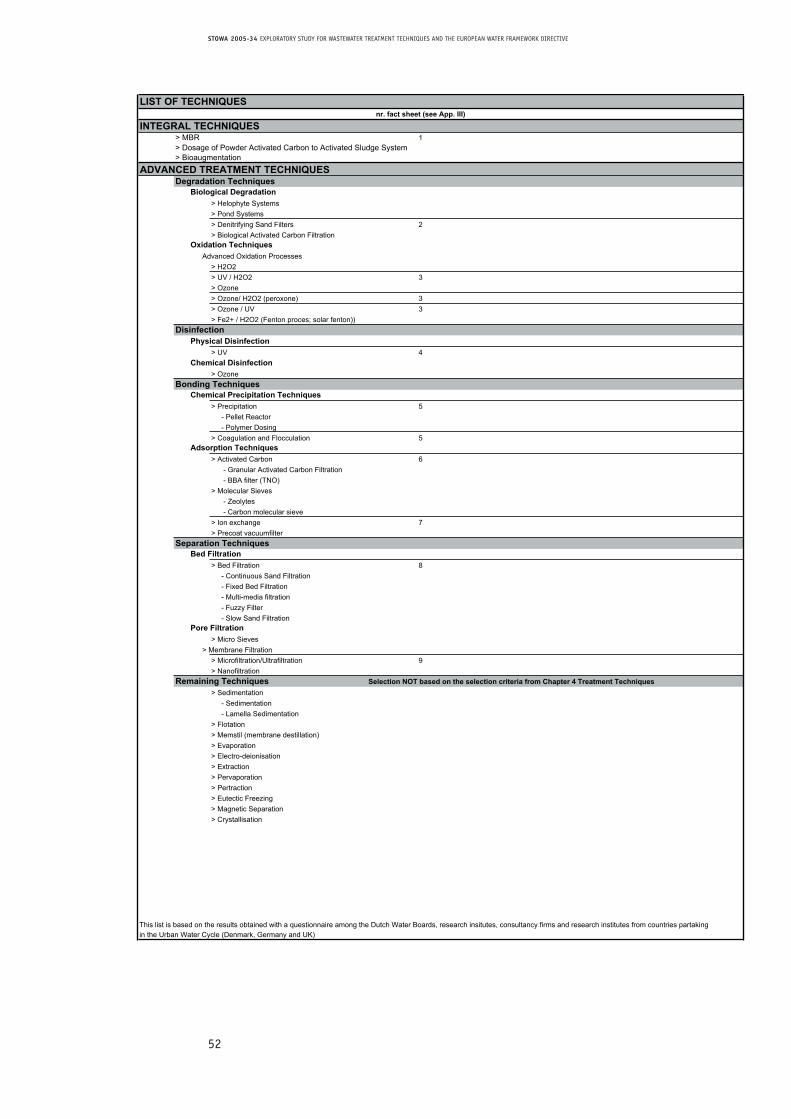
52
STOWA 2005-34 EXPLORATORY STUDY FOR WASTEWATER TREATMENT TECHNIQUES AND THE EUROPEAN WATER FRAMEWORK DIRECTIVE
LIST OF TECHNIQUESnr. fact sheet (see App. III)
INTEGRAL TECHNIQUES> MBR 1> Dosage of Powder Activated Carbon to Activated Sludge System> Bioaugmentation
ADVANCED TREATMENT TECHNIQUESDegradation Techniques
Biological Degradation> Helophyte Systems > Pond Systems> Denitrifying Sand Filters 2> Biological Activated Carbon Filtration
Oxidation TechniquesAdvanced Oxidation Processes
> H2O2> UV / H2O2 3> Ozone> Ozone/ H2O2 (peroxone) 3> Ozone / UV 3> Fe2+ / H2O2 (Fenton proces; solar fenton))
DisinfectionPhysical Disinfection
> UV 4Chemical Disinfection
> OzoneBonding Techniques
Chemical Precipitation Techniques> Precipitation 5
- Pellet Reactor- Polymer Dosing
> Coagulation and Flocculation 5Adsorption Techniques
> Activated Carbon 6 - Granular Activated Carbon Filtration - BBA filter (TNO)
> Molecular Sieves - Zeolytes - Carbon molecular sieve
> Ion exchange 7> Precoat vacuumfilter
Separation TechniquesBed Filtration
> Bed Filtration 8- Continuous Sand Filtration- Fixed Bed Filtration- Multi-media filtration- Fuzzy Filter- Slow Sand Filtration
Pore Filtration> Micro Sieves
> Membrane Filtration> Microfiltration/Ultrafiltration 9> Nanofiltration
Remaining Techniques Selection NOT based on the selection criteria from Chapter 4 Treatment Techniques> Sedimentation
- Sedimentation- Lamella Sedimentation
> Flotation> Memstil (membrane destillation)> Evaporation> Electro-deionisation> Extraction> Pervaporation> Pertraction> Eutectic Freezing > Magnetic Separation > Crystallisation
This list is based on the results obtained with a questionnaire among the Dutch Water Boards, research insitutes, consultancy firms and research institutes from countries partaking in the Urban Water Cycle (Denmark, Germany and UK)

53
STOWA 2005-34 EXPLORATORY STUDY FOR WASTEWATER TREATMENT TECHNIQUES AND THE EUROPEAN WATER FRAMEWORK DIRECTIVE
APPENDIX III
FACT SHEETS
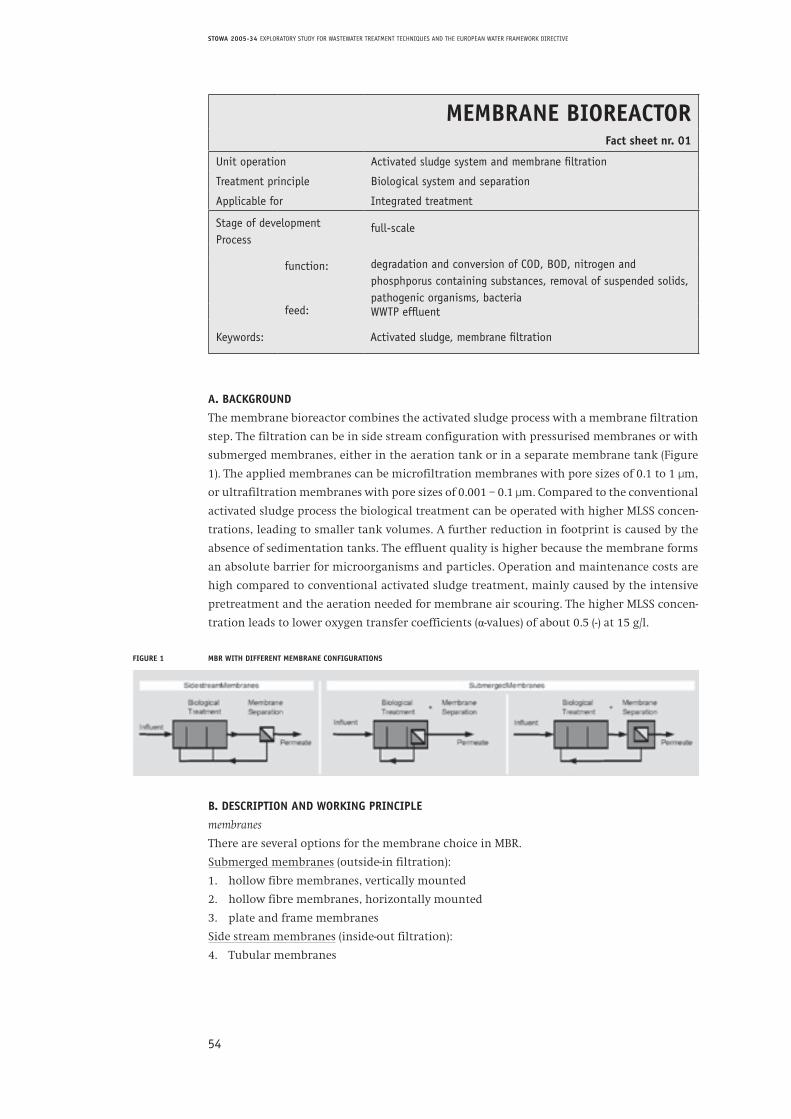
54
STOWA 2005-34 EXPLORATORY STUDY FOR WASTEWATER TREATMENT TECHNIQUES AND THE EUROPEAN WATER FRAMEWORK DIRECTIVE
MEMBRANE BIOREACTORFact sheet nr. 01
Unit operation Activated sludge system and membrane filtration
Treatment principle Biological system and separation
Applicable for Integrated treatment
Stage of developmentProcess
full-scale
function: degradation and conversion of COD, BOD, nitrogen and phosphporus containing substances, removal of suspended solids, pathogenic organisms, bacteria
feed: WWTP effluent
Keywords: Activated sludge, membrane filtration
A. BACKGROUND
The membrane bioreactor combines the activated sludge process with a membrane filtration
step. The filtration can be in side stream configuration with pressurised membranes or with
submerged membranes, either in the aeration tank or in a separate membrane tank (Figure
1). The applied membranes can be microfiltration membranes with pore sizes of 0.1 to 1 µm,
or ultrafiltration membranes with pore sizes of 0.001 – 0.1 µm. Compared to the conventional
activated sludge process the biological treatment can be operated with higher MLSS concen-
trations, leading to smaller tank volumes. A further reduction in footprint is caused by the
absence of sedimentation tanks. The effluent quality is higher because the membrane forms
an absolute barrier for microorganisms and particles. Operation and maintenance costs are
high compared to conventional activated sludge treatment, mainly caused by the intensive
pretreatment and the aeration needed for membrane air scouring. The higher MLSS concen-
tration leads to lower oxygen transfer coefficients (α-values) of about 0.5 (-) at 15 g/l.
FIGURE 1 MBR WITH DIFFERENT MEMBRANE CONFIGURATIONS
B. DESCRIPTION AND WORKING PRINCIPLE
membranes
There are several options for the membrane choice in MBR.
Submerged membranes (outside-in filtration):
1. hollow fibre membranes, vertically mounted
2. hollow fibre membranes, horizontally mounted
3. plate and frame membranes
Side stream membranes (inside-out filtration):
4. Tubular membranes
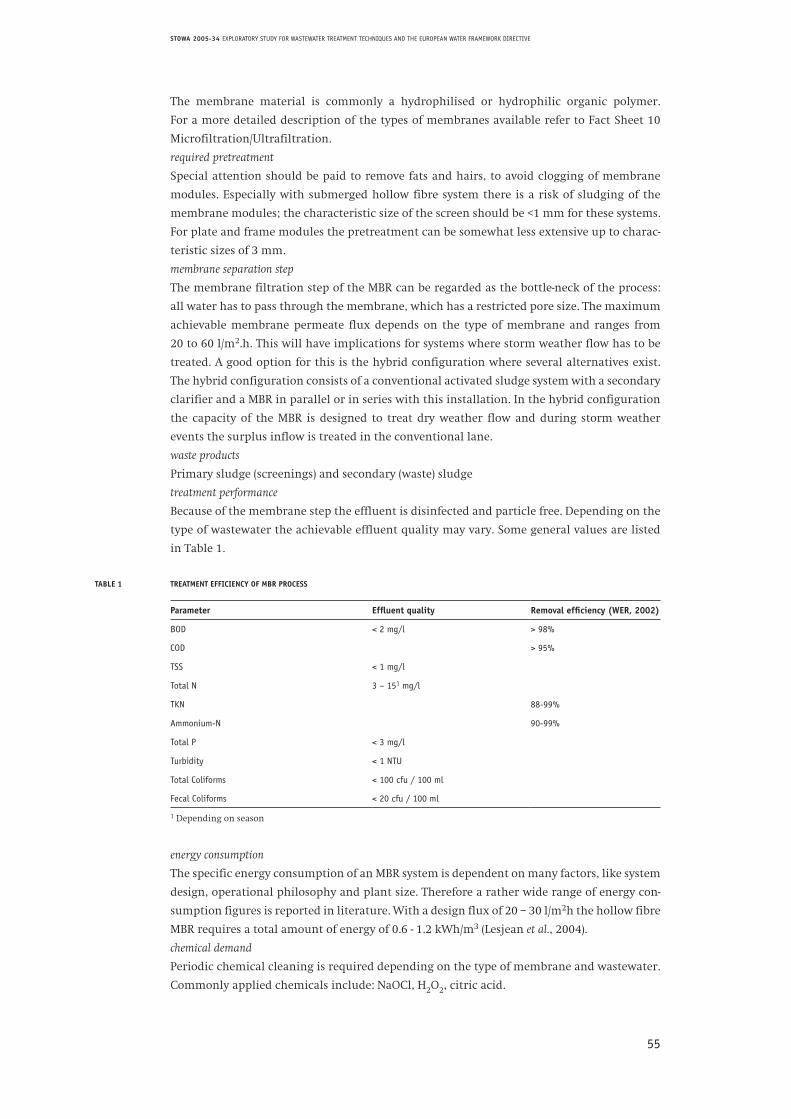
55
STOWA 2005-34 EXPLORATORY STUDY FOR WASTEWATER TREATMENT TECHNIQUES AND THE EUROPEAN WATER FRAMEWORK DIRECTIVE
The membrane material is commonly a hydrophilised or hydrophilic organic polymer.
For a more detailed description of the types of membranes available refer to Fact Sheet 10
Microfiltration/Ultrafiltration.
required pretreatment
Special attention should be paid to remove fats and hairs, to avoid clogging of membrane
modules. Especially with submerged hollow fibre system there is a risk of sludging of the
membrane modules; the characteristic size of the screen should be <1 mm for these systems.
For plate and frame modules the pretreatment can be somewhat less extensive up to charac-
teristic sizes of 3 mm.
membrane separation step
The membrane filtration step of the MBR can be regarded as the bottle-neck of the process:
all water has to pass through the membrane, which has a restricted pore size. The maximum
achievable membrane permeate flux depends on the type of membrane and ranges from
20 to 60 l/m2.h. This will have implications for systems where storm weather flow has to be
treated. A good option for this is the hybrid configuration where several alternatives exist.
The hybrid configuration consists of a conventional activated sludge system with a secondary
clarifier and a MBR in parallel or in series with this installation. In the hybrid configuration
the capacity of the MBR is designed to treat dry weather flow and during storm weather
events the surplus inflow is treated in the conventional lane.
waste products
Primary sludge (screenings) and secondary (waste) sludge
treatment performance
Because of the membrane step the effluent is disinfected and particle free. Depending on the
type of wastewater the achievable effluent quality may vary. Some general values are listed
in Table 1.
TABLE 1 TREATMENT EFFICIENCY OF MBR PROCESS
Parameter Effluent quality Removal efficiency (WER, 2002)
BOD < 2 mg/l > 98%
COD > 95%
TSS < 1 mg/l
Total N 3 – 151 mg/l
TKN 88-99%
Ammonium-N 90-99%
Total P < 3 mg/l
Turbidity < 1 NTU
Total Coliforms < 100 cfu / 100 ml
Fecal Coliforms < 20 cfu / 100 ml
1 Depending on season
energy consumption
The specific energy consumption of an MBR system is dependent on many factors, like system
design, operational philosophy and plant size. Therefore a rather wide range of energy con-
sumption figures is reported in literature. With a design flux of 20 – 30 l/m2h the hollow fibre
MBR requires a total amount of energy of 0.6 - 1.2 kWh/m3 (Lesjean et al., 2004).
chemical demand
Periodic chemical cleaning is required depending on the type of membrane and wastewater.
Commonly applied chemicals include: NaOCl, H2O2, citric acid.
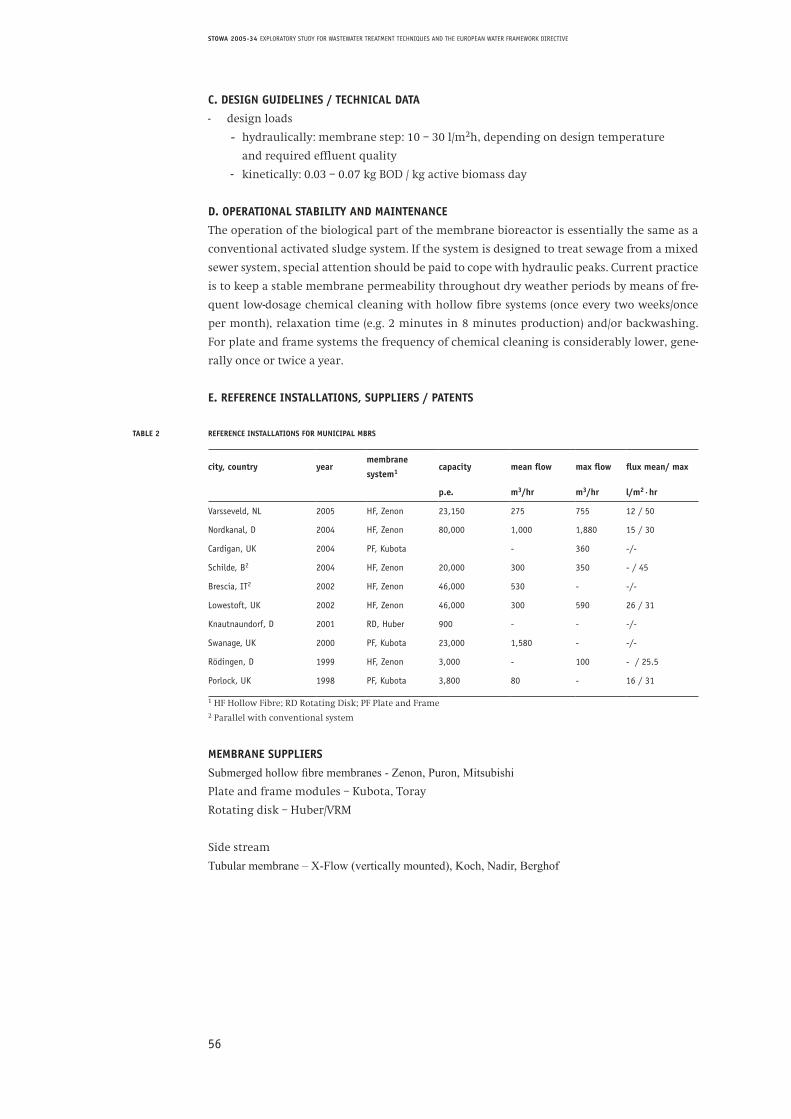
56
STOWA 2005-34 EXPLORATORY STUDY FOR WASTEWATER TREATMENT TECHNIQUES AND THE EUROPEAN WATER FRAMEWORK DIRECTIVE
C. DESIGN GUIDELINES / TECHNICAL DATA
- design loads
- hydraulically: membrane step: 10 – 30 l/m2h, depending on design temperature
and required effluent quality
- kinetically: 0.03 – 0.07 kg BOD / kg active biomass day
D. OPERATIONAL STABILITY AND MAINTENANCE
The operation of the biological part of the membrane bioreactor is essentially the same as a
conventional activated sludge system. If the system is designed to treat sewage from a mixed
sewer system, special attention should be paid to cope with hydraulic peaks. Current practice
is to keep a stable membrane permeability throughout dry weather periods by means of fre-
quent low-dosage chemical cleaning with hollow fibre systems (once every two weeks/once
per month), relaxation time (e.g. 2 minutes in 8 minutes production) and/or backwashing.
For plate and frame systems the frequency of chemical cleaning is considerably lower, gene-
rally once or twice a year.
E. REFERENCE INSTALLATIONS, SUPPLIERS / PATENTS
TABLE 2 REFERENCE INSTALLATIONS FOR MUNICIPAL MBRS
city, country yearmembrane
system1capacity mean flow max flow flux mean/ max
p.e. m3/hr m3/hr l/m2·hr
Varsseveld, NL 2005 HF, Zenon 23,150 275 755 12 / 50
Nordkanal, D 2004 HF, Zenon 80,000 1,000 1,880 15 / 30
Cardigan, UK 2004 PF, Kubota - 360 -/-
Schilde, B2 2004 HF, Zenon 20,000 300 350 - / 45
Brescia, IT2 2002 HF, Zenon 46,000 530 - -/-
Lowestoft, UK 2002 HF, Zenon 46,000 300 590 26 / 31
Knautnaundorf, D 2001 RD, Huber 900 - - -/-
Swanage, UK 2000 PF, Kubota 23,000 1,580 - -/-
Rödingen, D 1999 HF, Zenon 3,000 - 100 - / 25.5
Porlock, UK 1998 PF, Kubota 3,800 80 - 16 / 31
1 HF Hollow Fibre; RD Rotating Disk; PF Plate and Frame2 Parallel with conventional system
MEMBRANE SUPPLIERS
Submerged hollow fibre membranes - Zenon, Puron, MitsubishiPlate and frame modules – Kubota, Toray
Rotating disk – Huber/VRM
Side stream
Tubular membrane – X-Flow (vertically mounted), Koch, Nadir, Berghof
57
STOWA 2005-34 EXPLORATORY STUDY FOR WASTEWATER TREATMENT TECHNIQUES AND THE EUROPEAN WATER FRAMEWORK DIRECTIVE
F. LITERATURE REFERENCES
Lesjean, B.; S. Rosenberger and J.-C. Schrotter (2004) Membrane aided biological wastewater treat-
ment – overview an applied systems and their fields of application. Membrane Technology, August
2004.
T. Stephenson, S. Judd, B. Jefferson and K. Brindle (2000) Membrane Bioreactors for Wastewater
Treatment. IWA Publishing, London, UK.
Ellis, T.G. C. G. Schmit, K. Jahan, E. Debik and B. Elioso (2004). WER Review: Activated sludge and
other aerobic suspended culture processes. Water Environment Research, Volume 76, Number 6
STOWA (2002). MBR for municipal wastewater treatment – pilot plant research at Beverwijk wwtp.
STOWA 2002-11A, Utrecht, the Netherlands
STOWA (2004). Comparative investigation of MBR and sandfiltration at Maasbommel wwtp
(in Dutch). STOWA 2004-28, Utrecht, the Netherlands
Websites
- Membrane Academia Industry Network http://www.main.wizzy.co.uk/
- MBR wwtp Varsseveld www.mbrvarsseveld.nl
- Zenon references http://www.zenon.com/MBR/case_studies.shtml
- Kubota references in UK http://www.copa.co.uk/products/mbr choose -sewage-
- Koch/Puron: www.puron.de
- Huber/VRM: www.huber.de choose: - solutions – Membrane Technology
- Toray: www.segherskeppel.com
- X-Flow: www.X-Flow.com
58
STOWA 2005-34 EXPLORATORY STUDY FOR WASTEWATER TREATMENT TECHNIQUES AND THE EUROPEAN WATER FRAMEWORK DIRECTIVE
DENITRIFYING SAND FILTERSFact sheet nr. 02
Unit operation Biological denitrification
Treatment principle Attached growth (biofilm) filtration
Applicable for Advanced effluent treatment
Stage of development Full-scale
Process function: Denitrification, suspended solids (TSS), phosphorous removal
feed: WWTP effluent
Keywords: filtration, denitrification, sand filters, fixed-bed, continuous sand filtration
A. BACKGROUND
Attached growth post-denitrification sand filters can be used to reduce the nitrate, nitrite and
suspended solids levels in WWTP effluent. An exogenous carbon source is typically added in
the influent stream to provide an electron donor for the reduction of NOx- by denitrification.
Methanol is often used as the carbon source and is dosed in the influent in proportion to the
influent flow rate. In case phosphate levels must also be reduced, an iron salt can be added
in the influent stream for chemical precipitation of FePO4. Different types of post-denitrifica-
tion processes include (1) downflow sand filters with periodic, discontinuous back-washing to
prevent filter bed clogging, or (2) continuous upflow sand filtration with continuous washing
of the filter material. Both types have been successfully used in many installations for post-
denitrification.
B. DESCRIPTION AND WORKING PRINCIPLE AND PICTURE
downflow filtration
Downflow filters are deep bed sand or granular media filters (1,2 – 2 m) which can typi-
cally achieve TSS concentrations of < 5 mg/l. With proper control of the methanol dose total
effluent N-concentrations of 1 – 3 mg/l can be achieved. During operation headloss gradually
increases due to solids accumulation, biomass growth and accumulation of nitrogen gas. The
filter is “bumped” periodically by a hydraulic surge to remove gas (once every 2 – 4 h) and
backwashed for solids removal by air scouring followed by an air/water backwash (once every
24 – 48 h). The solids storage capacity is estimated to be about 4 kg TSS/m3 before headloss
occurs. A schematic diagram of a downflow filter is shown in Fact Sheet 9 Bed Filtration.
continuous sand filtration
A schematic diagram of a typical continuous upflow sand filter is shown in Fact Sheet 8 Bed
Filtration.
required pretreatment
Large particles that could interfere with the effective working of the filter bed must be remo-
ved from the influent by a screen with a maximum opening of 5 mm.
waste products
In both systems excess biological sludge (and chemical sludge in the case of Fe-dosage) is pro-
duced. The flush water containing the excess sludge is recycled back into the main activated
sludge process.
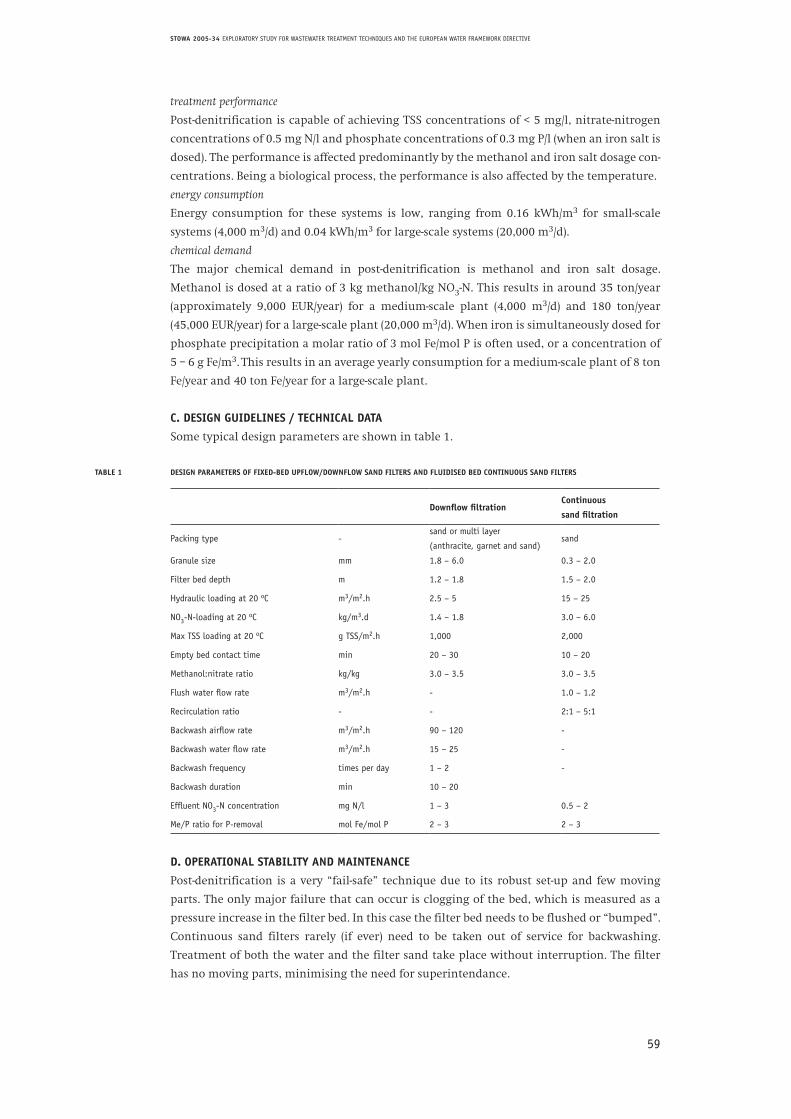
59
STOWA 2005-34 EXPLORATORY STUDY FOR WASTEWATER TREATMENT TECHNIQUES AND THE EUROPEAN WATER FRAMEWORK DIRECTIVE
treatment performance
Post-denitrification is capable of achieving TSS concentrations of < 5 mg/l, nitrate-nitrogen
concentrations of 0.5 mg N/l and phosphate concentrations of 0.3 mg P/l (when an iron salt is
dosed). The performance is affected predominantly by the methanol and iron salt dosage con-
centrations. Being a biological process, the performance is also affected by the temperature.
energy consumption
Energy consumption for these systems is low, ranging from 0.16 kWh/m3 for small-scale
systems (4,000 m3/d) and 0.04 kWh/m3 for large-scale systems (20,000 m3/d).
chemical demand
The major chemical demand in post-denitrification is methanol and iron salt dosage.
Methanol is dosed at a ratio of 3 kg methanol/kg NO3-N. This results in around 35 ton/year
(approximately 9,000 EUR/year) for a medium-scale plant (4,000 m3/d) and 180 ton/year
(45,000 EUR/year) for a large-scale plant (20,000 m3/d). When iron is simultaneously dosed for
phosphate precipitation a molar ratio of 3 mol Fe/mol P is often used, or a concentration of
5 – 6 g Fe/m3. This results in an average yearly consumption for a medium-scale plant of 8 ton
Fe/year and 40 ton Fe/year for a large-scale plant.
C. DESIGN GUIDELINES / TECHNICAL DATA
Some typical design parameters are shown in table 1.
TABLE 1 DESIGN PARAMETERS OF FIXED-BED UPFLOW/DOWNFLOW SAND FILTERS AND FLUIDISED BED CONTINUOUS SAND FILTERS
Downflow filtrationContinuous
sand filtration
Packing type -sand or multi layer
(anthracite, garnet and sand)sand
Granule size mm 1.8 – 6.0 0.3 – 2.0
Filter bed depth m 1.2 – 1.8 1.5 – 2.0
Hydraulic loading at 20 oC m3/m2.h 2.5 – 5 15 – 25
NO3-N-loading at 20 oC kg/m3.d 1.4 – 1.8 3.0 – 6.0
Max TSS loading at 20 oC g TSS/m2.h 1,000 2,000
Empty bed contact time min 20 – 30 10 – 20
Methanol:nitrate ratio kg/kg 3.0 – 3.5 3.0 – 3.5
Flush water flow rate m3/m2.h - 1.0 – 1.2
Recirculation ratio - - 2:1 – 5:1
Backwash airflow rate m3/m2.h 90 – 120 -
Backwash water flow rate m3/m2.h 15 – 25 -
Backwash frequency times per day 1 – 2 -
Backwash duration min 10 – 20
Effluent NO3-N concentration mg N/l 1 – 3 0.5 – 2
Me/P ratio for P-removal mol Fe/mol P 2 – 3 2 – 3
D. OPERATIONAL STABILITY AND MAINTENANCE
Post-denitrification is a very “fail-safe” technique due to its robust set-up and few moving
parts. The only major failure that can occur is clogging of the bed, which is measured as a
pressure increase in the filter bed. In this case the filter bed needs to be flushed or “bumped”.
Continuous sand filters rarely (if ever) need to be taken out of service for backwashing.
Treatment of both the water and the filter sand take place without interruption. The filter
has no moving parts, minimising the need for superintendance.
60
STOWA 2005-34 EXPLORATORY STUDY FOR WASTEWATER TREATMENT TECHNIQUES AND THE EUROPEAN WATER FRAMEWORK DIRECTIVE
E. REFERENCE INSTALLATIONS, SUPPLIERS/PATENTS
Installations
• De Groote Lucht WWTP, Vlaardingen, the Netherlands, 3.600 m3/h (Paques)
• Genk WWTP, Belgium, 1.440 m3/h (Paques)
• KA Freising, Germany, 2.200 m3/h (Nordic Water)
• KA Rietberg, Germany, 833 m3/h (Nordic Water)
Suppliers
• Paques Natural Solutions, P.O. Box 52, 8560 AB BALK, the Netherlands (ASTRASAND®).
• Nordic Water Benelux BV, P.O. Box 522,1940 AM Beverwijk, the Netherlands
(DYNASAND®).
• Andritz Ltd, Speedwell Road, Parkhouse East, Newcastle-under-Lyme, Staffordshire,
ST5 7, UK (HYDRASAND® patent).
• UNIDRO S.p.A, Via Alghero 19, 20128 Milan, Italy.
F. LITERATURE REFERENCES
De Booy C, Kramer, JF (2005) Rijnland start grootschalige zandfiltratie afvalwaterzuivering,
Land+Water 1/2: 18 – 19.
Kramer JP, Wouters JW, Noordink MP, Anink DM, Janus JM (2000) Dynamic denitrification of 3,
600 m3/h sewage effluent by moving bed biofiltration. Water Science & Technology 41 (4 – 5):
29–33.
Oesterholt FIHM, Bult BA (1993) Improving municipal waste water quality by effluent polishing –
a pilot scale experiment at Winterswijk, the Netherlands. Water Science & Technology 27 (5 – 6):
277 – 286.
Hultman B, Jonsson K, Plaza E (1994) Combined nitrogen and phosphorous removal in a full-scale
continuous up-flow sand filter. Water Science & Technology 29 (10 – 11): 127 – 134.
Forsell B (1994) Removal of phosphorous and nitrogen from municipal wastewater by DynaSand
continuous sand filter, Polijstingsfiltratie en denitrificatie met behulp van DynaSand filtratie, Astraco
Trading, Astracom, Sassenheim.
61
STOWA 2005-34 EXPLORATORY STUDY FOR WASTEWATER TREATMENT TECHNIQUES AND THE EUROPEAN WATER FRAMEWORK DIRECTIVE
ADVANCED OXIDATION PROCESSES O3/H2O2, UV/O3 and UV/H2O2
Fact sheet nr. 03Unit operation Advanced oxidationTreatment principle Oxidation
Applicable for Advanced effluent treatment
Stage of developmentProcess
Full-scale development for drinking water production, not yet applied at full-scale for WWTP effluent treatment, techniques researched since 1970
function: Disinfection, oxidation of inorganic compounds, organic micro-pollutant oxidation (taste and colour removal, phenolic pollutants, pesticides), organic macro-pollutant oxidation, improvement of biological degradability of water.
feed: WWTP effluent
Keywords: advanced oxidation, UV, hydrogen peroxide, ozone
A. BACKGROUND
Advanced oxidation processes (AOP) are used to oxidise complex organic constituents that
are difficult to degrade biologically into simpler end products. An AOP is a highly accelerated
oxidation reaction that typically involves the use of the hydroxyl free radical (OH.) as a strong
oxidant to destroy compounds that cannot be oxidised by conventional oxidants such as oxy-
gen, ozone and chlorine. Free radicals can be produced from ozone (O3) or hydrogen peroxide
(H2O2) by means of direct reaction with each other (Eq 1) or by reaction with UV light (photo-
lysis) (Eqs 2 – 3). The most commonly applied methods in water treatment until now are UV/
O3, O3/H2O2 and UV/H2O2, although the techniques have not yet to applied widely to WWTP
effluent. The free radicals react with pollutants to initiate a series of oxidative degradation
reactions. When UV light is used a large fraction of organic breakdown occurs due to pho-
tolysis of organics. Until now AOPs have been mostly applied to drinking water and specific
industrial (e.g. textile) wastewater. Their main treatment purpose is for removal of substan-
ces such as SOCs (Synthetic Organic Chemicals), pesticides, and odour-causing compounds,
which have been of little relevance in the municipal wastewater treatment industry until
now. The complexity of the chemistry of AOPs is high due to the large number of reactions
that are possible. This makes it difficult to predict the products of an AOP. Disadvantages of
AOPs are that the toxicity of the byproducts is not always better than the original compounds
(e.g. bromate formation is a problem with O3/H2O2 treatment), and the chemical consump-
tion can be high due to the non-specificity of the technique. Other disadvantages are high
cost, complex maintenance and the reduced effectiveness in presence of radical scavenging
compounds. An important advantage of AOPs is that complete oxidation to CO2 and water is
possible and no sludge or concentrate is produced.
Production of OH. from ozone and peroxide:
2O3 + H2O2 2 ·OH + 3 O2 (Eq 1)
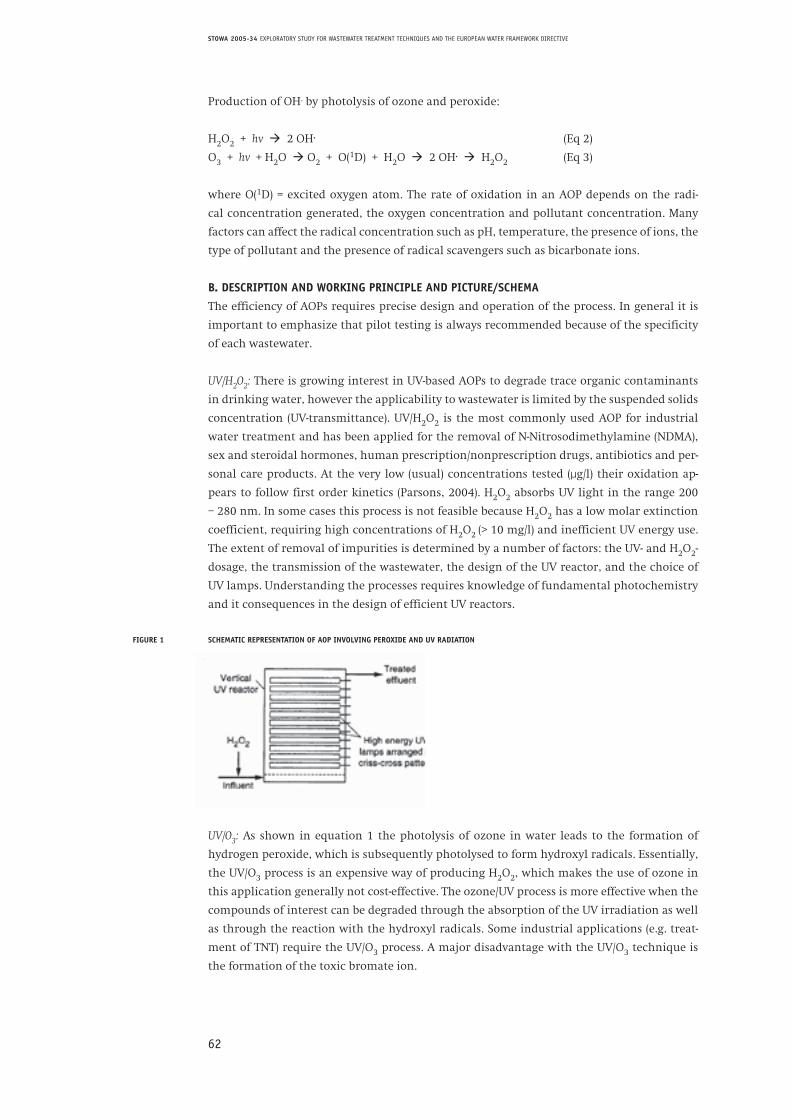
62
STOWA 2005-34 EXPLORATORY STUDY FOR WASTEWATER TREATMENT TECHNIQUES AND THE EUROPEAN WATER FRAMEWORK DIRECTIVE
Production of OH. by photolysis of ozone and peroxide:
H2O2 + hv 2 OH. (Eq 2)
O3 + hv + H2O O2 + O(1D) + H2O 2 OH. H2O2 (Eq 3)
where O(1D) = excited oxygen atom. The rate of oxidation in an AOP depends on the radi-
cal concentration generated, the oxygen concentration and pollutant concentration. Many
factors can affect the radical concentration such as pH, temperature, the presence of ions, the
type of pollutant and the presence of radical scavengers such as bicarbonate ions.
B. DESCRIPTION AND WORKING PRINCIPLE AND PICTURE/SCHEMA
The efficiency of AOPs requires precise design and operation of the process. In general it is
important to emphasize that pilot testing is always recommended because of the specificity
of each wastewater.
UV/H2O2: There is growing interest in UV-based AOPs to degrade trace organic contaminants
in drinking water, however the applicability to wastewater is limited by the suspended solids
concentration (UV-transmittance). UV/H2O2 is the most commonly used AOP for industrial
water treatment and has been applied for the removal of N-Nitrosodimethylamine (NDMA),
sex and steroidal hormones, human prescription/nonprescription drugs, antibiotics and per-
sonal care products. At the very low (usual) concentrations tested (µg/l) their oxidation ap-
pears to follow first order kinetics (Parsons, 2004). H2O2 absorbs UV light in the range 200
– 280 nm. In some cases this process is not feasible because H2O2 has a low molar extinction
coefficient, requiring high concentrations of H2O2 (> 10 mg/l) and inefficient UV energy use.
The extent of removal of impurities is determined by a number of factors: the UV- and H2O2-
dosage, the transmission of the wastewater, the design of the UV reactor, and the choice of
UV lamps. Understanding the processes requires knowledge of fundamental photochemistry
and it consequences in the design of efficient UV reactors.
FIGURE 1 SCHEMATIC REPRESENTATION OF AOP INVOLVING PEROXIDE AND UV RADIATION
UV/O3: As shown in equation 1 the photolysis of ozone in water leads to the formation of
hydrogen peroxide, which is subsequently photolysed to form hydroxyl radicals. Essentially,
the UV/O3 process is an expensive way of producing H2O2, which makes the use of ozone in
this application generally not cost-effective. The ozone/UV process is more effective when the
compounds of interest can be degraded through the absorption of the UV irradiation as well
as through the reaction with the hydroxyl radicals. Some industrial applications (e.g. treat-
ment of TNT) require the UV/O3 process. A major disadvantage with the UV/O3 technique is
the formation of the toxic bromate ion.
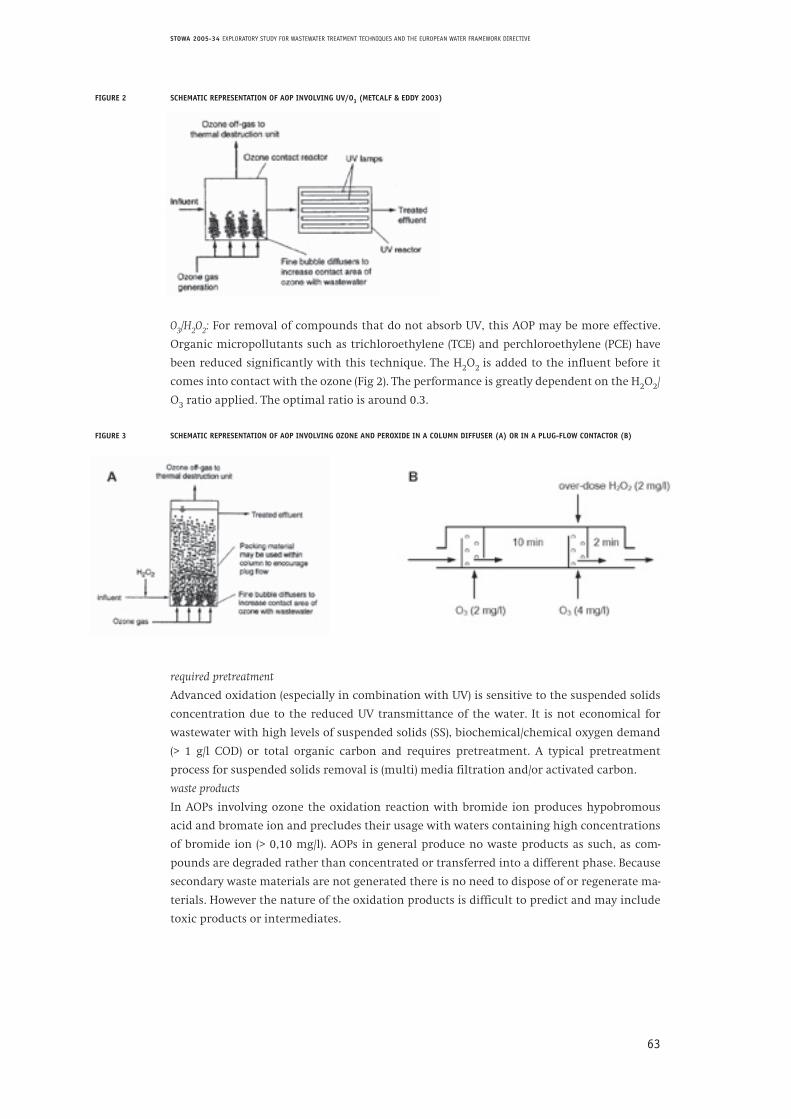
63
STOWA 2005-34 EXPLORATORY STUDY FOR WASTEWATER TREATMENT TECHNIQUES AND THE EUROPEAN WATER FRAMEWORK DIRECTIVE
FIGURE 2 SCHEMATIC REPRESENTATION OF AOP INVOLVING UV/O3 (METCALF & EDDY 2003)
O3/H2O2: For removal of compounds that do not absorb UV, this AOP may be more effective.
Organic micropollutants such as trichloroethylene (TCE) and perchloroethylene (PCE) have
been reduced significantly with this technique. The H2O2 is added to the influent before it
comes into contact with the ozone (Fig 2). The performance is greatly dependent on the H2O2/
O3 ratio applied. The optimal ratio is around 0.3.
FIGURE 3 SCHEMATIC REPRESENTATION OF AOP INVOLVING OZONE AND PEROXIDE IN A COLUMN DIFFUSER (A) OR IN A PLUG-FLOW CONTACTOR (B)
required pretreatment
Advanced oxidation (especially in combination with UV) is sensitive to the suspended solids
concentration due to the reduced UV transmittance of the water. It is not economical for
wastewater with high levels of suspended solids (SS), biochemical/chemical oxygen demand
(> 1 g/l COD) or total organic carbon and requires pretreatment. A typical pretreatment
process for suspended solids removal is (multi) media filtration and/or activated carbon.
waste products
In AOPs involving ozone the oxidation reaction with bromide ion produces hypobromous
acid and bromate ion and precludes their usage with waters containing high concentrations
of bromide ion (> 0,10 mg/l). AOPs in general produce no waste products as such, as com-
pounds are degraded rather than concentrated or transferred into a different phase. Because
secondary waste materials are not generated there is no need to dispose of or regenerate ma-
terials. However the nature of the oxidation products is difficult to predict and may include
toxic products or intermediates.
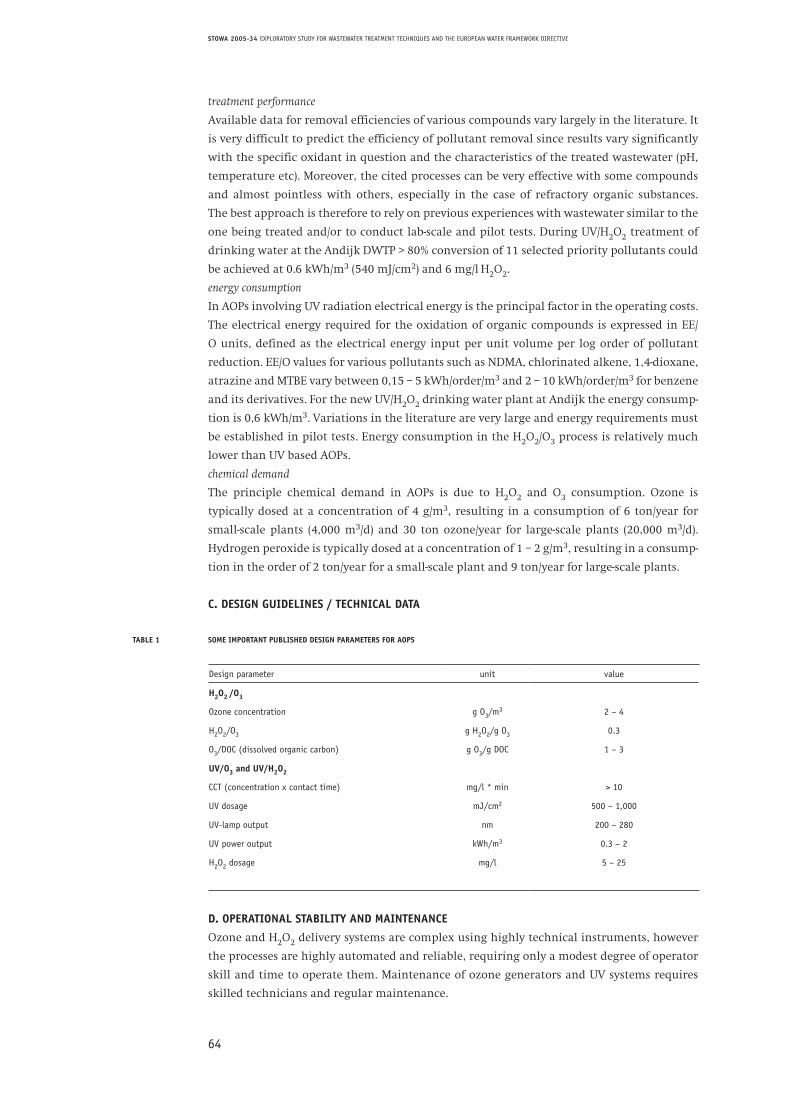
64
STOWA 2005-34 EXPLORATORY STUDY FOR WASTEWATER TREATMENT TECHNIQUES AND THE EUROPEAN WATER FRAMEWORK DIRECTIVE
treatment performance
Available data for removal efficiencies of various compounds vary largely in the literature. It
is very difficult to predict the efficiency of pollutant removal since results vary significantly
with the specific oxidant in question and the characteristics of the treated wastewater (pH,
temperature etc). Moreover, the cited processes can be very effective with some compounds
and almost pointless with others, especially in the case of refractory organic substances.
The best approach is therefore to rely on previous experiences with wastewater similar to the
one being treated and/or to conduct lab-scale and pilot tests. During UV/H2O2 treatment of
drinking water at the Andijk DWTP > 80% conversion of 11 selected priority pollutants could
be achieved at 0.6 kWh/m3 (540 mJ/cm2) and 6 mg/l H2O2.15
energy consumption
In AOPs involving UV radiation electrical energy is the principal factor in the operating costs.
The electrical energy required for the oxidation of organic compounds is expressed in EE/
O units, defined as the electrical energy input per unit volume per log order of pollutant
reduction. EE/O values for various pollutants such as NDMA, chlorinated alkene, 1,4-dioxane,
atrazine and MTBE vary between 0,15 – 5 kWh/order/m3 and 2 – 10 kWh/order/m3 for benzene
and its derivatives. For the new UV/H2O2 drinking water plant at Andijk the energy consump-
tion is 0,6 kWh/m3. Variations in the literature are very large and energy requirements must
be established in pilot tests. Energy consumption in the H2O2/O3 process is relatively much
lower than UV based AOPs.
chemical demand
The principle chemical demand in AOPs is due to H2O2 and O3 consumption. Ozone is
typically dosed at a concentration of 4 g/m3, resulting in a consumption of 6 ton/year for
small-scale plants (4,000 m3/d) and 30 ton ozone/year for large-scale plants (20,000 m3/d).
Hydrogen peroxide is typically dosed at a concentration of 1 – 2 g/m3, resulting in a consump-
tion in the order of 2 ton/year for a small-scale plant and 9 ton/year for large-scale plants.
C. DESIGN GUIDELINES / TECHNICAL DATA
TABLE 1 SOME IMPORTANT PUBLISHED DESIGN PARAMETERS FOR AOPS
Design parameter unit value
H2O2 /O3
Ozone concentration g O3/m3 2 – 4
H2O2/O3 g H2O2/g O3 0.3
O3/DOC (dissolved organic carbon) g O3/g DOC 1 – 3
UV/O3 and UV/H2O2
CCT (concentration x contact time) mg/l * min > 10
UV dosage mJ/cm2 500 – 1,000
UV-lamp output nm 200 – 280
UV power output kWh/m3 0.3 – 2
H2O2 dosage mg/l 5 – 25
D. OPERATIONAL STABILITY AND MAINTENANCE
Ozone and H2O2 delivery systems are complex using highly technical instruments, however
the processes are highly automated and reliable, requiring only a modest degree of operator
skill and time to operate them. Maintenance of ozone generators and UV systems requires
skilled technicians and regular maintenance.
65
STOWA 2005-34 EXPLORATORY STUDY FOR WASTEWATER TREATMENT TECHNIQUES AND THE EUROPEAN WATER FRAMEWORK DIRECTIVE
E. REFERENCE INSTALLATIONS, SUPPLIERS/PATENTS
Reference installations:
- H2O2/O3: Neuilly sur Marne drinking water production plant, France, 6.300 m3/h, 5 mg/l
ozone, 1,5 mg/l H2O2.
- UV/H2O2: Andijk drinking water production plant (4.000 m3/h).
- Widely applied in textile industry for colour removal.
Commercial-scale AOP systems:
Calgon Carbon Corboration PeropureTM and RayoxTM UV/H2O2 systems, Magnum Water
Technology Inc. CAV-OX® UV/H2O2 system, Trojan and Wedeco UV/H2O2 and UV/O3 systems
and US Filter/Zimpro Inc UV/H2O2/O3 system.
F. LITERATURE REFERENCES
articles
Aquarec Review Report on Wastewater Treatment Unit Operations EVK1-CT-2002-00130, Work
package 7, Deliverable D6, edited by Viviane Miska, Aldo Ravazzini, Jaap de Koning, Delft University
of Technology, April 2004.
Kruithof JC, Peer Kamp, Mike Belosevic, Mihaela Stefan (2005) UV/H2O2 retrofit of PWN´s water
treatment plant Andijk for primary disinfection and organic contaminant control, Water Intelligence
Online © IWA Publishing 2005 (http://www.iwaponline.com/wio/2005/04/wio200504006.htm).
books
Parsons S (2004) Advanced oxidation processes for water and wastewater treatment, IWA Publishing,
Cornwall UK.
Tchobanoglous G, Franklin L, Burton H, Stensel D (2003) Wastewater engineering, treatment and
reuse, 4th edition, McGraw-Hill Publishing, New York, ISBN 0-07-112250-8 (ISE).
STOWA (2001) Compendium rwzi-effluent als bron, Deel 4 bijlagen, Utrecht, the Netherlands.
websites
http://www.mep.tno.nl/water/Afvalwater/afvalwater_innovatieve_technieken_advanced_oxidation_
processes.html
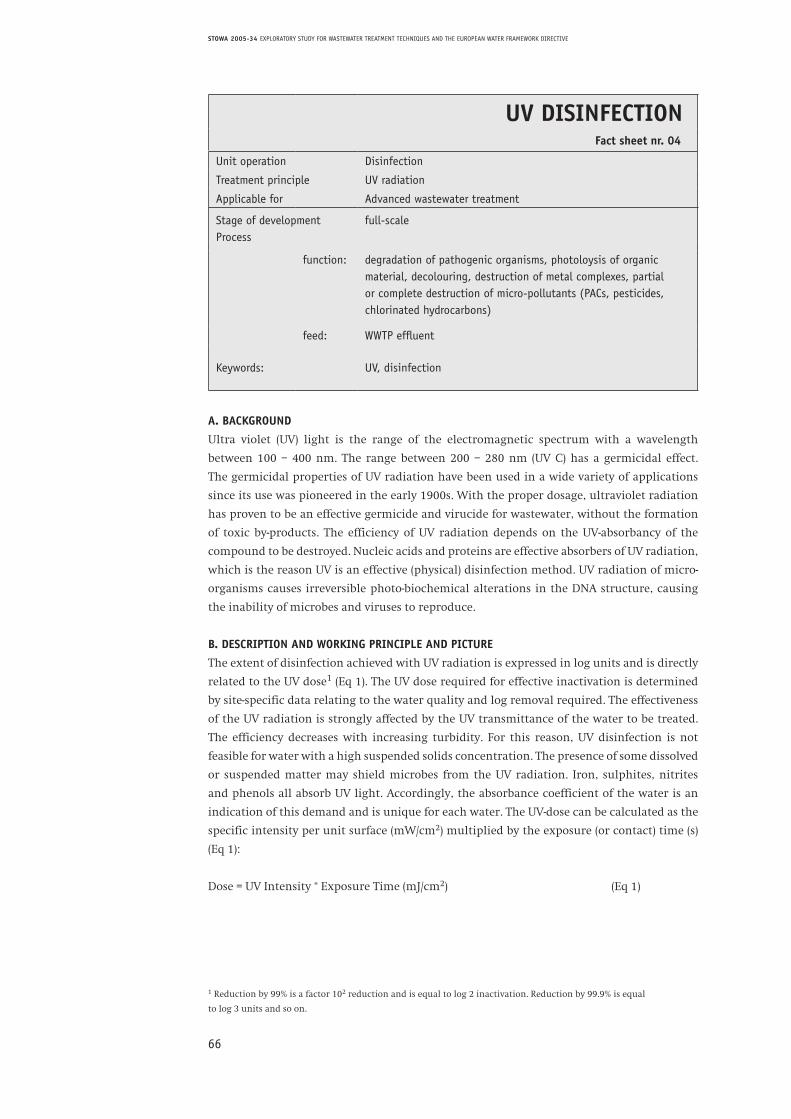
66
STOWA 2005-34 EXPLORATORY STUDY FOR WASTEWATER TREATMENT TECHNIQUES AND THE EUROPEAN WATER FRAMEWORK DIRECTIVE
UV DISINFECTIONFact sheet nr. 04
Unit operation Disinfection
Treatment principle UV radiation
Applicable for Advanced wastewater treatment
Stage of developmentProcess
full-scale
function: degradation of pathogenic organisms, photoloysis of organic material, decolouring, destruction of metal complexes, partial or complete destruction of micro-pollutants (PACs, pesticides, chlorinated hydrocarbons)
feed: WWTP effluent
Keywords:
UV, disinfection
A. BACKGROUND
Ultra violet (UV) light is the range of the electromagnetic spectrum with a wavelength
between 100 – 400 nm. The range between 200 – 280 nm (UV C) has a germicidal effect.
The germicidal properties of UV radiation have been used in a wide variety of applications
since its use was pioneered in the early 1900s. With the proper dosage, ultraviolet radiation
has proven to be an effective germicide and virucide for wastewater, without the formation
of toxic by-products. The efficiency of UV radiation depends on the UV-absorbancy of the
compound to be destroyed. Nucleic acids and proteins are effective absorbers of UV radiation,
which is the reason UV is an effective (physical) disinfection method. UV radiation of micro-
organisms causes irreversible photo-biochemical alterations in the DNA structure, causing
the inability of microbes and viruses to reproduce.
B. DESCRIPTION AND WORKING PRINCIPLE AND PICTURE
The extent of disinfection achieved with UV radiation is expressed in log units and is directly
related to the UV dose1 (Eq 1). The UV dose required for effective inactivation is determined
by site-specific data relating to the water quality and log removal required. The effectiveness
of the UV radiation is strongly affected by the UV transmittance of the water to be treated.
The efficiency decreases with increasing turbidity. For this reason, UV disinfection is not
feasible for water with a high suspended solids concentration. The presence of some dissolved
or suspended matter may shield microbes from the UV radiation. Iron, sulphites, nitrites
and phenols all absorb UV light. Accordingly, the absorbance coefficient of the water is an
indication of this demand and is unique for each water. The UV-dose can be calculated as the
specific intensity per unit surface (mW/cm2) multiplied by the exposure (or contact) time (s)
(Eq 1):
Dose = UV Intensity * Exposure Time (mJ/cm2) (Eq 1)
1 Reduction by 99% is a factor 102 reduction and is equal to log 2 inactivation. Reduction by 99.9% is equal
to log 3 units and so on.
67
STOWA 2005-34 EXPLORATORY STUDY FOR WASTEWATER TREATMENT TECHNIQUES AND THE EUROPEAN WATER FRAMEWORK DIRECTIVE
Specific “design” parameters vary for individual waters and should be determined empiri-
cally for each application. The UV demand of water can be measured simply in a spectropho-
tometer set at a wavelength of 254 nm using a 1 cm thick water layer.
UV lamps
Almost all UV lamps are mercury arc discharge lamps in which an electric current is sent
through mercury vapour, causing mercury atoms to become excited and emit light at
UV wavelengths. The mercury “arc” is inherently unstable and requires specific current
conditions. A ballast is used to control the current. There are 3 main types of lamps, 1) Low
pressure (LP), 2) Low/pressure/high output (LPHO) and 3) Medium pressure (MP). Low-pressure
lamps are generally more energy efficient, while medium pressure lamps emit up to 10 times
more energy but are more expensive. The output of a UV lamp decreases during its lifetime
(12 – 20 months, depending on type of lamp) and lamps need to be replaced when the output
is reduced to 70%. For disinfection purposes low pressure lamps are preferred due to the spe-
cific wavelength that can be produced and the lower energy consumption. For AOP purposes
medium pressure lamps are preferred due to the more intensive oxidation reactions they
can produce. The broad emission spectrum and the higher intensity of medium pressure
lamps is used to produce free radicals (OH.) from hydrogen peroxide and ozone, as well as
disinfection.
ballasts
Ballasts are transformers that control the power to the UV lamps. They generally generate
enough heat to supply cooling fans or air conditioning. Ballasts should be compatible with
the UV lamps and must be in a waterproof remote location.
UV reactor design
The design of a UV reactor has a large influence on the efficiency of the process. The following
factors need to be taken into account, 1) Hydraulics: direction and flow rate of the water
flow through the reactor; 2) Positioning of the lamps; 3) Radiation intensity of the lamps in
relation to the water flow; 4) Configuration of the reactors in series; 5) Use of space due to the
lamp dimensions, and 6) Energy consumption due to the water flow. Most conventional UV
reactors are available in two types: closed channel and open channel. Closed channel systems
are generally applied in drinking water production plants, however they are becoming
increasingly popular for WWTP effluent. Open channels are commonly used in WWTP
effluent disinfection, however they are more susceptible to fouling.
required pretreatment
The efficiency of UV treatment is sensitive to the dissolved organics concentration and solids
concentration in the water. UV radiation is generally not effective for effluent with TSS >
30 mg/l. An overview of some interfering substances to UV radiation is shown in table 1.
TABLE 1 DISTURBING SUBSTANCES FOR UV DISINFECTION (METCALF & EDDY 2003)
Constituent Effect
BOD, COD, TOC
Humic material
Oil and grease
TSS
pH, Alkalinity, Hardness
No, or minor effect
Strong adsorbers of UV radiation
Can accumulate on quartz sleeves of UV lamps, can absorb UV radiation
Absorption of UV radiation, can shield embedded bacteria
Can impact scaling potential
68
STOWA 2005-34 EXPLORATORY STUDY FOR WASTEWATER TREATMENT TECHNIQUES AND THE EUROPEAN WATER FRAMEWORK DIRECTIVE
waste products
An important advantage of UV radiation is that no sludge or concentrate is produced.
There is no residual effect that can be harmful to humans or aquatic life, which is an
advantage when compared to chlorine disinfection systems. By-product formation is gene-
rally insignificant under disinfection conditions. Nitrate absorbs UV light and is reduced to
nitrite in the presence of UV light, which may be a major problem if nitrate concentrations
are high. An overview of possible by-product formation is shown in table 2.
TABLE 2 BY-PRODUCT FORMATION IN UV RADIATION FOR DISINFECTION AND AOPS
CompoundDisinfection conditions
40 – 120 mJ/cm2
Organic contaminant control
conditions 1000 – 2000 mJ/cm2
Bromate absent absent
Nitrite present high
AOC up to a few µg/l 100 – 150 µg/l
Mutagenicity insignificant absent
treatment performance
Since UV radiation is energy in the form of electromagnetic waves, its effectiveness is not
limited by chemical water properties. It appears that pH, temperature, alkalinity and total
inorganic carbon do not impact the overall effectiveness. The addition of oxidants (H2O2 or
ozone) enhances the effectiveness. The quality of the treated water is however dependent on
the extent of fouling of the lamps, the UV transmittance of the water (UVT) and the turbidity,
which make this technique ineffective for WWTP effluent with a high suspended solids con-
centration (> 30 mg TSS/l). UVT is the most important performance parameter. As a rule of
thumb, for every 5% decrease in UVT, 50% less UV is available for disinfection.
energy consumption
Energy consumption for disinfection purposes (UV intensity 40 – 125 mJ/cm2) is in the range
0.1 – 0.2 kWh/m3. For the use of UV in advanced oxidation processes (UV intensity 600 – 1,000
mJ/cm2) the energy consumption is much higher (0.2 – 0.6 kWh/m3).
chemical demand
Chemical addition is not required in UV disinfection, which is a major advantage of this
technique.
C. DESIGN GUIDELINES / TECHNICAL DATA
design loads
• hydraulically: UV installations have been designed for systems as small as 90 m3/d to
large-scale systems (1.600.000 m3/d). Installation of enough hydraulic capacity is gener-
ally a question of installing more units and elements. Single UV units can treat flow rates
of up to 200 m3/h.
• kinetically: For adequate disinfection of most viruses and micro-organisms a UV dosage of
40 – 125 mJ/cm2 is required.
• residence time: UV disinfection has a shorter contact time when compared with other
disinfectants (approximately 20 to 30 seconds with low pressure lamps).
69
STOWA 2005-34 EXPLORATORY STUDY FOR WASTEWATER TREATMENT TECHNIQUES AND THE EUROPEAN WATER FRAMEWORK DIRECTIVE
D. OPERATIONAL STABILITY AND MAINTENANCE
UV lamps have a limited life (1 – 2 years LP lamps, 0.5 – 1 year MP lamps), meaning lamps
need to be replaced regularly. A major disadvantage is the development of biofilm (fouling)
on the exposed surfaces of the UV reactor. Especially open channel systems that are exposed
to daylight may encounter fouling. Closed UV systems, however, can also experience fou-
ling. Fouling occurs essentially when treating any water. Removal of biomass growth must
be conducted on an as-need basis either with a mechanical wipe or by a chemical (acid) clean.
In addition, UV sensors can drift over time and need to be recalibrated periodically. UV instal-
lations do not require any storage of hazardous material, neither proportioning nor handling
of chemical substances is involved. Installation is relatively simple.
E. REFERENCE INSTALLATIONS, SUPPLIERS / PATENTS
• reference installations
city, country year supplier pretreatment system capacity, max
m3/h
number
of lamps
Manukau, N-Z 2001 wedeco anthracite filtration open channel, tangential, 57 7,700
Bad Tölz, D 2003 sand filtration-TSS=5 mg/l open channel, low pressure 2 144
Fairfield, Ohio, USA 2003 Aquionics medium-pressure 56
• suppliersBerson, Neunen, the Netherlands, http://www.bersonuv.com
Trojan, Ontario, Canada, http://www.trojanuv.com
Wedeco, Herford, Germany, http://www.wedecouv.de
Calgon Carbon Corporation, http://www.calgoncarbon.com
Magnum Water Technology, http://www.magnumwater.com
F. LITERATURE REFERENCES
König, R. (2001) UV wastewater disinfection: the key to the future, Water21, April 2001
Metcalf & Eddy (2003). Wastewater engineering; treatment and reuse (4th international edition)
McGraw-Hill, New York
Parsons, S. (ed.)(2004) Advanced Oxidation Processes for Water and Wastewater Treatment.
IWA Publishing, London, UK.
websites
International Ultraviolet Association (IUVA): www.iuva.org
ANSI/NSF: www.nsf.org/water.html
Austrian Standards (ONORM): www.onorm.at
NWRI/AWWA Guidelines: www.awwa.org.bookstore
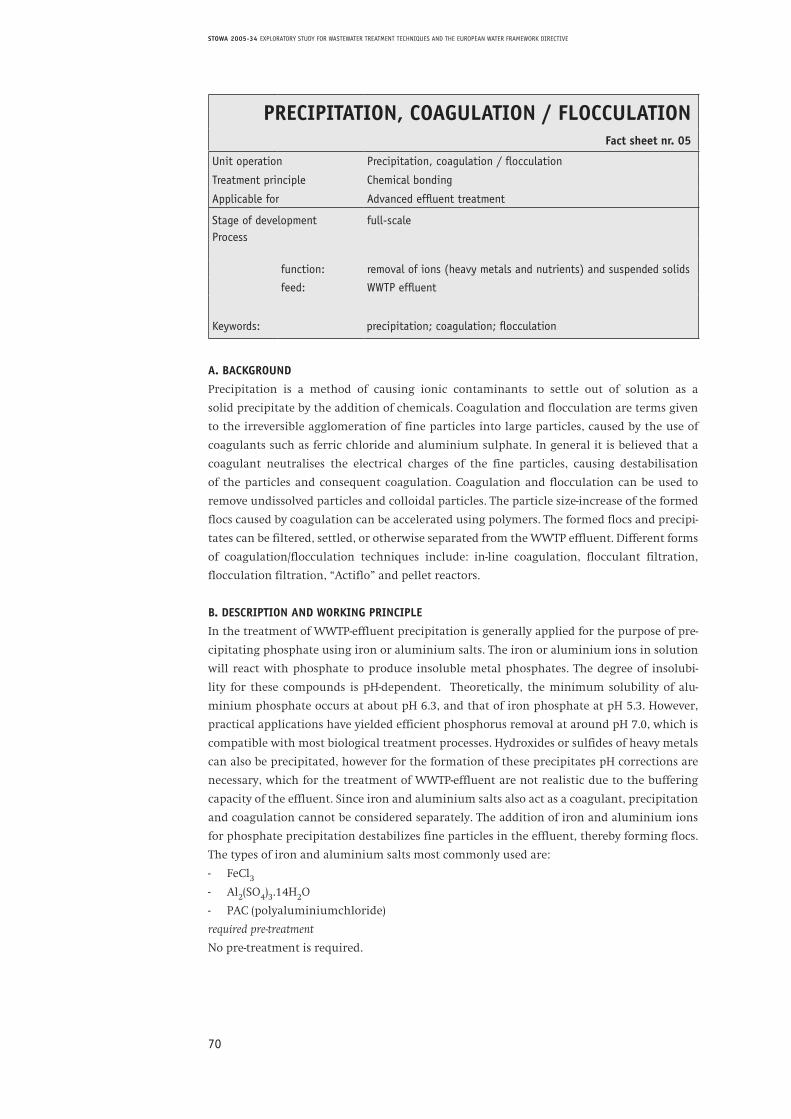
70
STOWA 2005-34 EXPLORATORY STUDY FOR WASTEWATER TREATMENT TECHNIQUES AND THE EUROPEAN WATER FRAMEWORK DIRECTIVE
PRECIPITATION, COAGULATION / FLOCCULATIONFact sheet nr. 05
Unit operation Precipitation, coagulation / flocculation
Treatment principle Chemical bonding
Applicable for Advanced effluent treatment
Stage of developmentProcess
full-scale
function: removal of ions (heavy metals and nutrients) and suspended solids
feed: WWTP effluent
Keywords: precipitation; coagulation; flocculation
A. BACKGROUND
Precipitation is a method of causing ionic contaminants to settle out of solution as a
solid precipitate by the addition of chemicals. Coagulation and flocculation are terms given
to the irreversible agglomeration of fine particles into large particles, caused by the use of
coagulants such as ferric chloride and aluminium sulphate. In general it is believed that a
coagulant neutralises the electrical charges of the fine particles, causing destabilisation
of the particles and consequent coagulation. Coagulation and flocculation can be used to
remove undissolved particles and colloidal particles. The particle size-increase of the formed
flocs caused by coagulation can be accelerated using polymers. The formed flocs and precipi-
tates can be filtered, settled, or otherwise separated from the WWTP effluent. Different forms
of coagulation/flocculation techniques include: in-line coagulation, flocculant filtration,
flocculation filtration, “Actiflo” and pellet reactors.
B. DESCRIPTION AND WORKING PRINCIPLE
In the treatment of WWTP-effluent precipitation is generally applied for the purpose of pre-
cipitating phosphate using iron or aluminium salts. The iron or aluminium ions in solution
will react with phosphate to produce insoluble metal phosphates. The degree of insolubi-
lity for these compounds is pH-dependent. Theoretically, the minimum solubility of alu-
minium phosphate occurs at about pH 6.3, and that of iron phosphate at pH 5.3. However,
practical applications have yielded efficient phosphorus removal at around pH 7.0, which is
compatible with most biological treatment processes. Hydroxides or sulfides of heavy metals
can also be precipitated, however for the formation of these precipitates pH corrections are
necessary, which for the treatment of WWTP-effluent are not realistic due to the buffering
capacity of the effluent. Since iron and aluminium salts also act as a coagulant, precipitation
and coagulation cannot be considered separately. The addition of iron and aluminium ions
for phosphate precipitation destabilizes fine particles in the effluent, thereby forming flocs.
The types of iron and aluminium salts most commonly used are:
- FeCl3
- Al2(SO4)3.14H2O
- PAC (polyaluminiumchloride)
required pre-treatment
No pre-treatment is required.
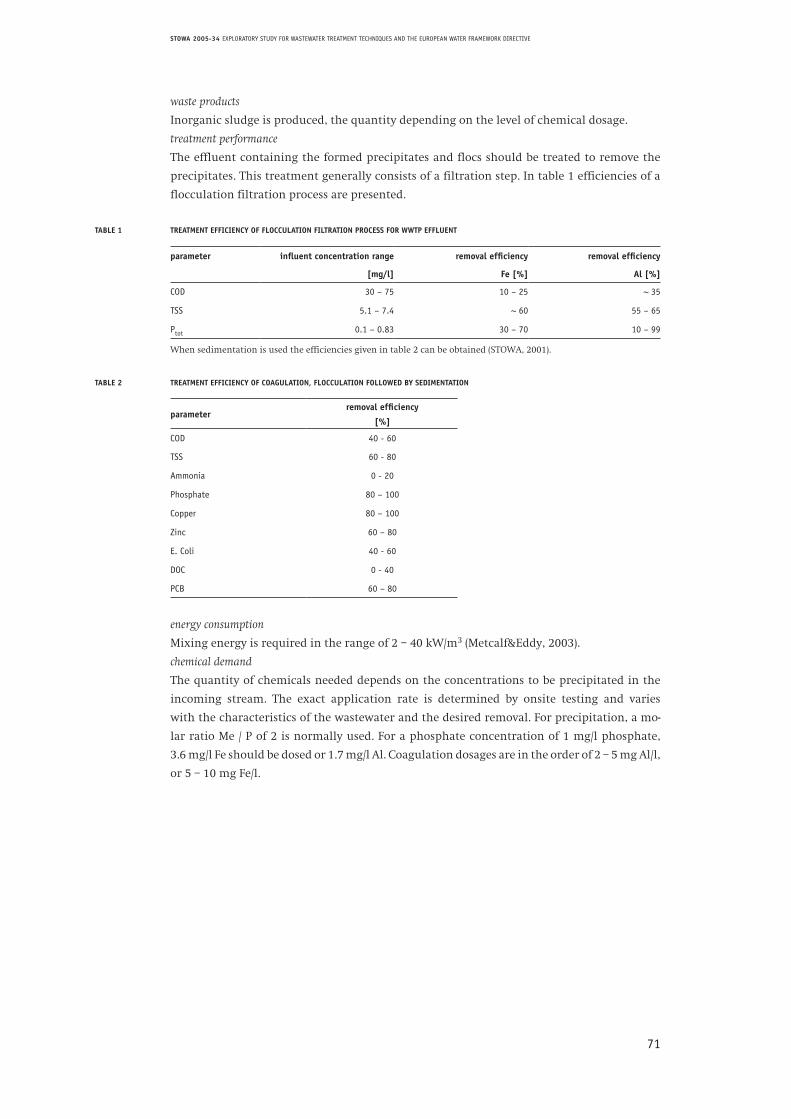
71
STOWA 2005-34 EXPLORATORY STUDY FOR WASTEWATER TREATMENT TECHNIQUES AND THE EUROPEAN WATER FRAMEWORK DIRECTIVE
waste products
Inorganic sludge is produced, the quantity depending on the level of chemical dosage.
treatment performance
The effluent containing the formed precipitates and flocs should be treated to remove the
precipitates. This treatment generally consists of a filtration step. In table 1 efficiencies of a
flocculation filtration process are presented.
TABLE 1 TREATMENT EFFICIENCY OF FLOCCULATION FILTRATION PROCESS FOR WWTP EFFLUENT
parameter influent concentration range removal efficiency removal efficiency
[mg/l] Fe [%] Al [%]
COD 30 – 75 10 – 25 ~ 35
TSS 5.1 – 7.4 ~ 60 55 – 65
Ptot 0.1 – 0.83 30 – 70 10 – 99
When sedimentation is used the efficiencies given in table 2 can be obtained (STOWA, 2001).
TABLE 2 TREATMENT EFFICIENCY OF COAGULATION, FLOCCULATION FOLLOWED BY SEDIMENTATION
parameterremoval efficiency
[%]
COD 40 - 60
TSS 60 - 80
Ammonia 0 - 20
Phosphate 80 – 100
Copper 80 – 100
Zinc 60 – 80
E. Coli 40 - 60
DOC 0 - 40
PCB 60 – 80
energy consumption
Mixing energy is required in the range of 2 – 40 kW/m3 (Metcalf&Eddy, 2003).
chemical demand
The quantity of chemicals needed depends on the concentrations to be precipitated in the
incoming stream. The exact application rate is determined by onsite testing and varies
with the characteristics of the wastewater and the desired removal. For precipitation, a mo-
lar ratio Me / P of 2 is normally used. For a phosphate concentration of 1 mg/l phosphate,
3.6 mg/l Fe should be dosed or 1.7 mg/l Al. Coagulation dosages are in the order of 2 – 5 mg Al/l,
or 5 – 10 mg Fe/l.
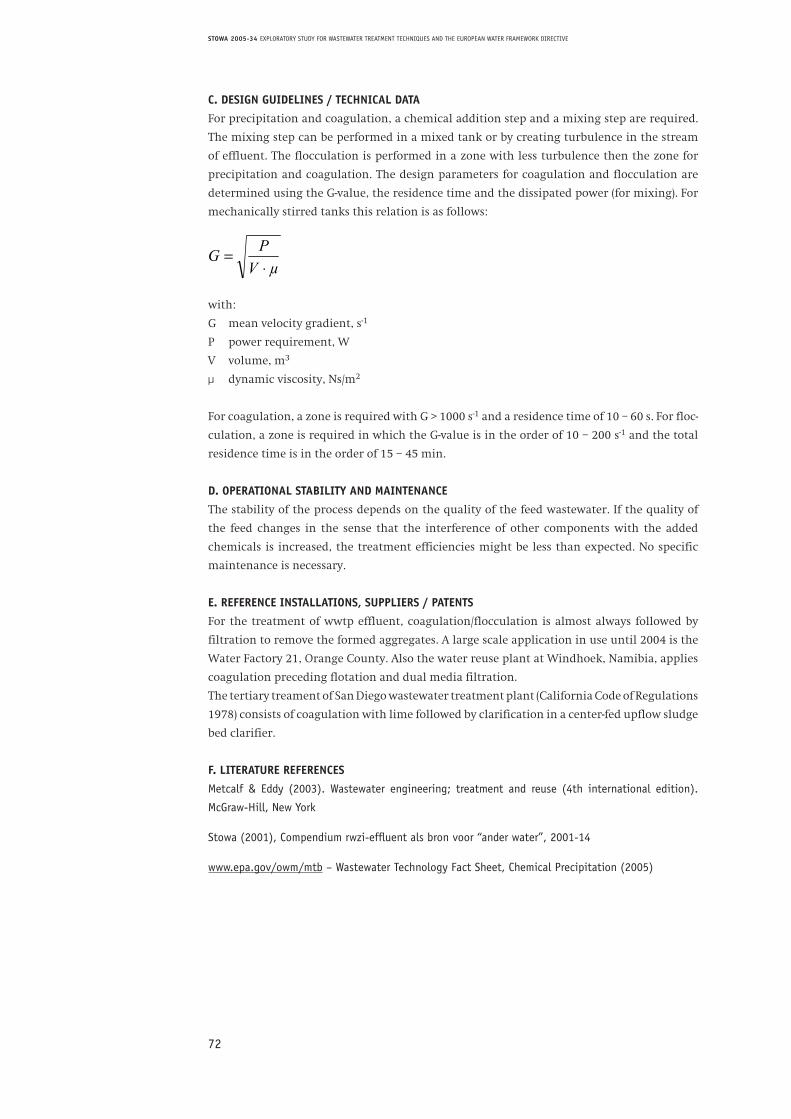
72
STOWA 2005-34 EXPLORATORY STUDY FOR WASTEWATER TREATMENT TECHNIQUES AND THE EUROPEAN WATER FRAMEWORK DIRECTIVE
C. DESIGN GUIDELINES / TECHNICAL DATA
For precipitation and coagulation, a chemical addition step and a mixing step are required.
The mixing step can be performed in a mixed tank or by creating turbulence in the stream
of effluent. The flocculation is performed in a zone with less turbulence then the zone for
precipitation and coagulation. The design parameters for coagulation and flocculation are
determined using the G-value, the residence time and the dissipated power (for mixing). For
mechanically stirred tanks this relation is as follows:
with:
G mean velocity gradient, s-1
P power requirement, W
V volume, m3
µ dynamic viscosity, Ns/m2
For coagulation, a zone is required with G > 1000 s-1 and a residence time of 10 – 60 s. For floc-
culation, a zone is required in which the G-value is in the order of 10 – 200 s-1 and the total
residence time is in the order of 15 – 45 min.
D. OPERATIONAL STABILITY AND MAINTENANCE
The stability of the process depends on the quality of the feed wastewater. If the quality of
the feed changes in the sense that the interference of other components with the added
chemicals is increased, the treatment efficiencies might be less than expected. No specific
maintenance is necessary.
E. REFERENCE INSTALLATIONS, SUPPLIERS / PATENTS
For the treatment of wwtp effluent, coagulation/flocculation is almost always followed by
filtration to remove the formed aggregates. A large scale application in use until 2004 is the
Water Factory 21, Orange County. Also the water reuse plant at Windhoek, Namibia, applies
coagulation preceding flotation and dual media filtration.
The tertiary treament of San Diego wastewater treatment plant (California Code of Regulations
1978) consists of coagulation with lime followed by clarification in a center-fed upflow sludge
bed clarifier.
F. LITERATURE REFERENCES
Metcalf & Eddy (2003). Wastewater engineering; treatment and reuse (4th international edition).
McGraw-Hill, New York
Stowa (2001), Compendium rwzi-effluent als bron voor “ander water”, 2001-14
www.epa.gov/owm/mtb – Wastewater Technology Fact Sheet, Chemical Precipitation (2005)
When sedimentation is used the efficiencies given in table 2 can be obtained (STOWA, 2001).
Table 2 Treatment efficiency of coagulation, flocculation followed by sedimentation parameter removal efficiency
[%] COD 40 - 60 TSS 60 - 80 Ammonia 0 - 20 Phosphate 80 – 100 Copper 80 – 100 Zinc 60 – 80 E. Coli 40 - 60 DOC 0 - 40 PCB 60 – 80
energy consumptionMixing energy is required in the range of 2 – 40 kW/m3 (Metcalf&Eddy, 2003). chemical demandThe quantity of chemicals needed depends on the concentrations to be precipitated in the incoming stream. The exact application rate is determined by onsite testing and varies with the characteristics of the wastewater and the desired removal. For precipitation, a molar ratio Me / P of 2 is normally used. For a phosphate concentration of 1 mg/l phosphate, 3.6 mg/l Fe should be dosed or 1.7 mg/l Al. Coagulation dosages are in the order of 2 – 5 mg Al/l, or 5 – 10 mg Fe/l.
C. Design guidelines / Technical data For precipitation and coagulation, a chemical addition step and a mixing step are required. The mixing step can be performed in a mixed tank or by creating turbulence in the stream of effluent. The flocculation is performed in a zone with less turbulence then the zone for precipitation and coagulation. The design parameters for coagulation and flocculation are determined using the G-value, the residence time and the dissipated power (for mixing). For mechanically stirred tanks this relation is as follows:
µVPG⋅
=
with:G mean velocity gradient, s-1
P power requirement, W V volume, m3
µ dynamic viscosity, Ns/m2
For coagulation, a zone is required with G > 1000 s-1 and a residence time of 10 – 60 s. For flocculation, a zone is required in which the G-value is in the order of 10 – 200 s-1 and the total residence time is in the order of 15 – 45 min.
D. Operational stability and maintenance The stability of the process depends on the quality of the feed wastewater. If the quality of the feed changes in the sense that the interference of other components with the added chemicals is increased, the treatment efficiencies might be less than expected. No specific maintenance is necessary.
E. Reference installations, Suppliers / Patents For the treatment of wwtp effluent, coagulation/flocculation is almost always followed by filtration to remove the formed aggregates. A large scale application in use until 2004 is the Water Factory 21, Orange County. Also the water reuse plant at Windhoek, Namibia, applies coagulation preceding flotation and dual media filtration.
73
STOWA 2005-34 EXPLORATORY STUDY FOR WASTEWATER TREATMENT TECHNIQUES AND THE EUROPEAN WATER FRAMEWORK DIRECTIVE
ACTIVATED CARBONFact sheet nr. 06
Unit operation Adsorption
Treatment principle Physical bonding
Applicable for Advanced effluent treatment
Stage of developmentProcess
full scale in drinking water treatment; effluent: only pilot scale
function: removal of organic micropollutants, pesticides, endocrine disruptors and medicinal substances
feed: WWTP effluent
Keywords: adsorption, activated carbon, pesticides, nutrients, medicine residue
A. BACKGROUND
Activated carbon has a broad spectrum of adsorptive activity, as most organic molecules are
retained on its surface. The adsorption of substances onto activated carbon can be predicted
according to their Kow coefficient, which is the octanol/water partition coefficient. Substances
with a log Kow < 0 are not retained by activated carbon. Activated carbon can be applied in
several ways, such as in a granular activated carbon (GAC) filter, by in-line addition of powder
activated carbon (PAC), in a membrane assisted affinity separator (MAAS) or a continuous
moving bed adsorption system (MBA).
B. DESCRIPTION AND WORKING PRINCIPLE AND PICTURE
Treatment with a Granular Activated Carbon (GAC) filter involves passing the WWTP-effluent
through a bed of activated carbon. A typical filter is represented in Fig. 1. The GAC particles
have a diameter of 0.25 – 3 mm. When the column is fully loaded with a certain organic com-
pound this compound will not be adsorbed anymore and will break through the filter. At that
moment, the GAC needs to be regenerated and reactivated. The moment of breakthrough
differs per organic compound and depends (among others) on the polarity of the com-
pound.
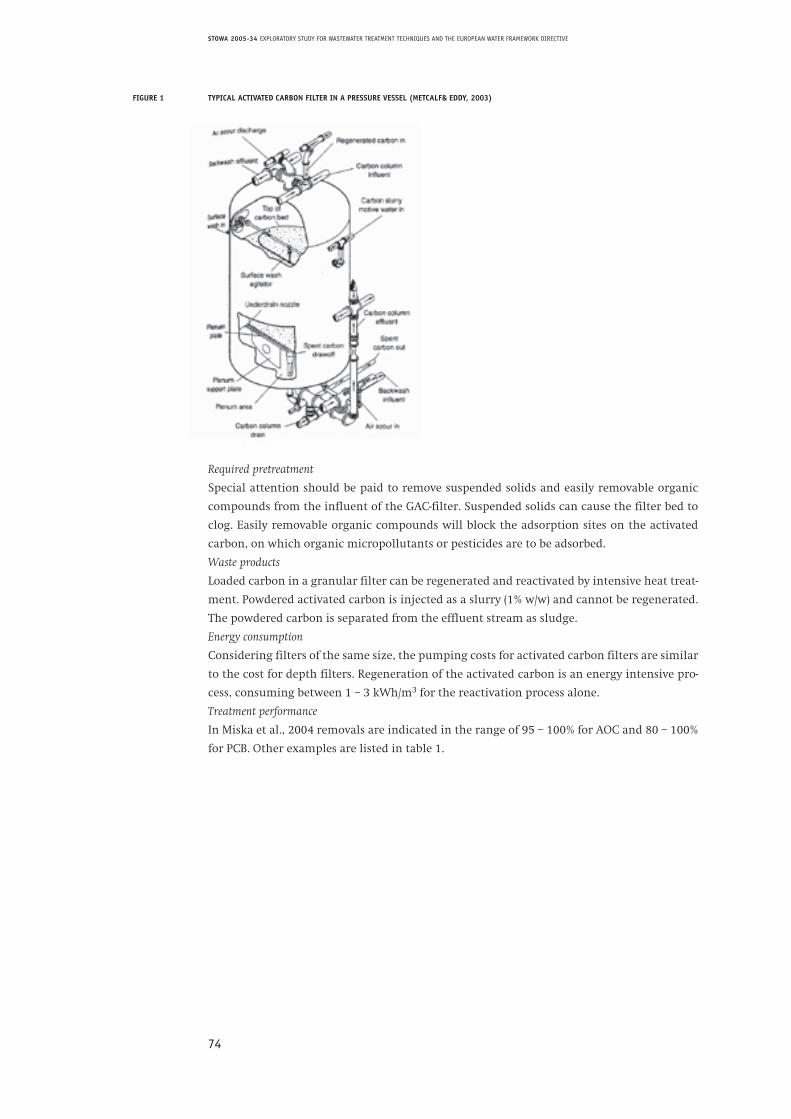
74
STOWA 2005-34 EXPLORATORY STUDY FOR WASTEWATER TREATMENT TECHNIQUES AND THE EUROPEAN WATER FRAMEWORK DIRECTIVE
FIGURE 1 TYPICAL ACTIVATED CARBON FILTER IN A PRESSURE VESSEL (METCALF& EDDY, 2003)
Required pretreatment
Special attention should be paid to remove suspended solids and easily removable organic
compounds from the influent of the GAC-filter. Suspended solids can cause the filter bed to
clog. Easily removable organic compounds will block the adsorption sites on the activated
carbon, on which organic micropollutants or pesticides are to be adsorbed.
Waste products
Loaded carbon in a granular filter can be regenerated and reactivated by intensive heat treat-
ment. Powdered activated carbon is injected as a slurry (1% w/w) and cannot be regenerated.
The powdered carbon is separated from the effluent stream as sludge.
Energy consumption
Considering filters of the same size, the pumping costs for activated carbon filters are similar
to the cost for depth filters. Regeneration of the activated carbon is an energy intensive pro-
cess, consuming between 1 – 3 kWh/m3 for the reactivation process alone.
Treatment performance
In Miska et al., 2004 removals are indicated in the range of 95 – 100% for AOC and 80 – 100%
for PCB. Other examples are listed in table 1.
75
STOWA 2005-34 EXPLORATORY STUDY FOR WASTEWATER TREATMENT TECHNIQUES AND THE EUROPEAN WATER FRAMEWORK DIRECTIVE
TABLE 1 REMOVAL OF ORGANIC COMPOUNDS THROUGH A TEST GAC FILTER, TREATING EFFLUENT OF A SAND FILTER AFTER CONVENTIONAL
TREATMENT (MISKA ET AL., 2004)
Parameter compound substances Average influent to process Average effluent of process
1,2 Dichlorethane 0.1- 24 mg < 1 mg/l
Atrazine < 0.1- 5360 ng/l < detection limit
Chlorinated hydrocarbon insecticides (CHI) < 5 ng/l < detection limit
C. DESIGN GUIDELINES / TECHNICAL DATA
The design values for a GAC filter are listed in table 2.
TABLE 2 TYPICAL DESIGN VALUES FOR GAC CONTACTORS (METCALF & EDDY, 2003)
Parameter Unit Value
Volumetric flow rate m3/h 50 – 400
Bed volume m3 10 – 50
Cross-section area m2 5 – 30
Length m 1.8 – 4
Void fraction m3/m3 0.38 – 0.42
GAC density kg/m3 350 – 550
Approach velocity m/h 5 – 15
Effective contact time min 2 – 10
Empty bed contact time min 5 – 30
Operation time d 100 – 600
Throughput volume m3 10 – 100
Specific throughput m3/kg 50 – 200
Bed Volumes m3/m3 2,000 – 20,000
D. OPERATIONAL STABILITY AND MAINTENANCE
Loaded activated carbon requires regular regeneration. Upon regeneration and reactivation
activated carbon is lost. After each life-cycle activated carbon has to be added to compensate
this loss.
E. REFERENCE INSTALLATIONS, SUPPLIERS / PATENTS
• No WWTP-effluent polishing references in Wester Europe
• Windhoek, Namibia
76
STOWA 2005-34 EXPLORATORY STUDY FOR WASTEWATER TREATMENT TECHNIQUES AND THE EUROPEAN WATER FRAMEWORK DIRECTIVE
F. LITERATURE REFERENCES
Roorda, J.H.; N.C. Wortel, R. van Dalen, (2004) New Processes for Treatment of Organically Fouled
Water: Experiences with Effluent Proceeding IWA Conference Membranes in Drinking and Industrial
Water Production, 15-17 November 2004, L’Aquila, Italy
Metcalf&Eddy (2003) Wastewater Engineering, Treatment and Reuse, 4th Ed. McGrawHill
Faust, S. D. and O.M. Aly (1987) Adsorption Processes for Water Treatment. Butterworth Pub.,
Stoneham, MA, USA
Miska V et al., (2004) Aquarec - Integrated Concepts for Reuse of Upgraded Wastewater, Delft
University of Technology, Delft
websites
Chemviron carbon: www.chemvironcarbon.com
Norit: www.norit.com
77
STOWA 2005-34 EXPLORATORY STUDY FOR WASTEWATER TREATMENT TECHNIQUES AND THE EUROPEAN WATER FRAMEWORK DIRECTIVE
ION EXCHANGEFact sheet nr. 7
Unit operation Adsorption
Treatment principle Bonding
Applicable forStage of developmentProcess
Advanced treatment of WWTP effluent
full scale
function removal of dissolved solids and/or organics or heavy metals
feed pre-treated wwtp effluent
Keywords: advanced treatment WWTP effluent, ion-exchange., selective removal of heavy metals, cadmium, nickel, copper, sink , selective chelating ion exchange resins
A. BACKGROUND
In this unit process the exchangeable given species attached to an insoluble material (resin)
are displaced by ions of a different species present in the solution. The displacement is mainly
ruled by electromagnetic forces and/or adsorption. The ion-exchange resins can be either of
natural origin or manufactured. Natural materials are better known as Zeolites, which are
complex aluminosilicates with sodium as a mobile ion. Manufactured materials can also be
synthetic aluminosilicates, in which case they are still called Zeolites, but more often they are
resins (styrene and divinylbenzene copolymerised) or phenolic polymers.
Five types of synthetic ion-exchange resins are in use: (1) strong-acid cation, (2) weak-acid
cation, (3) strong-base anion, (4) weak-base anion, and (5) heavy metal selective chelating
resins. Besides, resins can be of macro-porous structure for adsorption of organic material.
The relevant properties of ion-exchange resins are the following:
• Exchange capacity [eq/L] or [eq/kg]: quantity of exchangeable ions that the resin can take
up. The “ideal” value is much higher than the actual operating capacity, which is influ-
enced by competing ions, flow rates, temperature and regeneration level. For removal of
organics, the exchange capacity is (normally) expressed in [KMnO4/L].
• Particle size: important towards the hydraulics and the kinetics of the ion-exchange;
• Stability: chemical-physical resistance in the long term.
• Selectivity: the ion-exchange process is basically a chemical equilibrium where the taking
up capacity of the resin towards a certain ion is specific, depending upon the nature and
the valence of the ion, as well as from the operating conditions (such as saturation of the
resin, ions concentrations, pH, presence of concurrent ions). The selectivity coefficient is
basically the constant of the equilibrium of the ion exchange; therefore it is valid only for
the conditions under which it was measured. On the basis of selectivity, a “series” of the
affinity towards different ions is created for each resin. For strong acid cation exchange
resins the selectivity in order of decreasing preference is: Ba2+ > Pb2+ > Hg2+ > Ca2+ > Ni2+
> Cd2+ > Cu2+ > Zn2+ > Mg2+ > K+ > NH4+ > Na+. Furthermore, especially for drinking water
production, in the past years selective chelating ion exchange resins have been developed
for the efficient removal of heavy metals with a high removal efficiency on a ppb level
(Stetter, D., 2002).
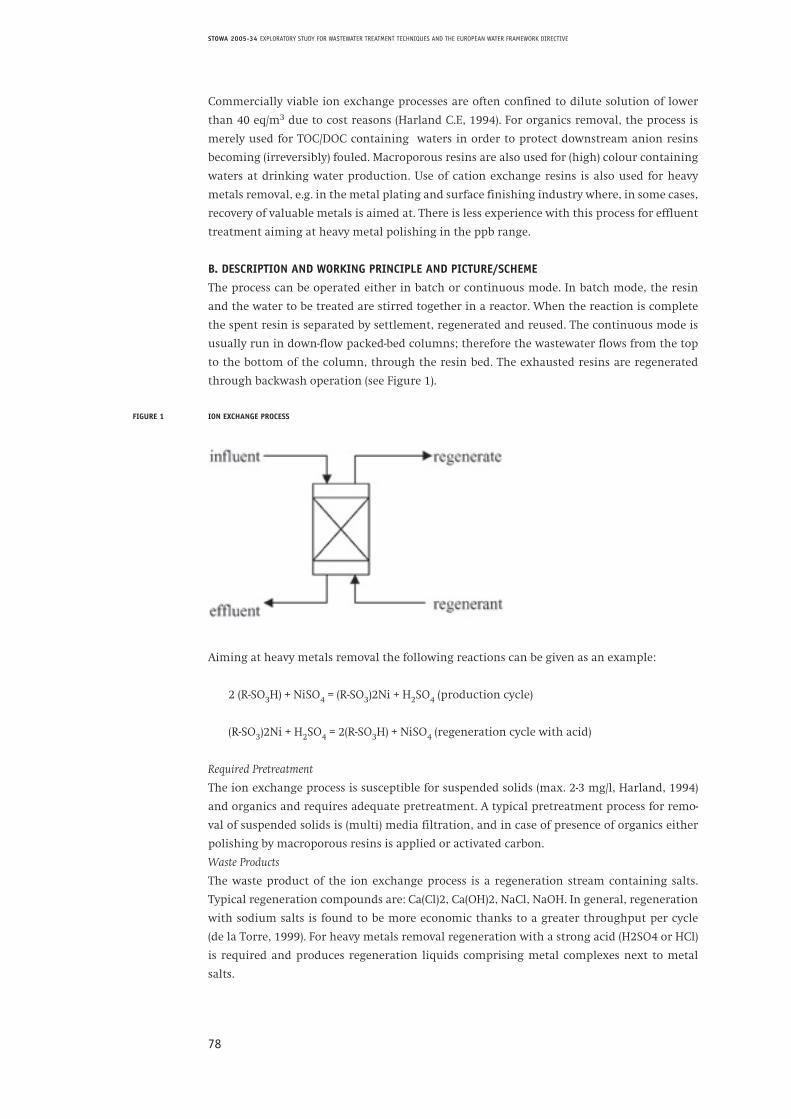
78
STOWA 2005-34 EXPLORATORY STUDY FOR WASTEWATER TREATMENT TECHNIQUES AND THE EUROPEAN WATER FRAMEWORK DIRECTIVE
Commercially viable ion exchange processes are often confined to dilute solution of lower
than 40 eq/m3 due to cost reasons (Harland C.E, 1994). For organics removal, the process is
merely used for TOC/DOC containing waters in order to protect downstream anion resins
becoming (irreversibly) fouled. Macroporous resins are also used for (high) colour containing
waters at drinking water production. Use of cation exchange resins is also used for heavy
metals removal, e.g. in the metal plating and surface finishing industry where, in some cases,
recovery of valuable metals is aimed at. There is less experience with this process for effluent
treatment aiming at heavy metal polishing in the ppb range.
B. DESCRIPTION AND WORKING PRINCIPLE AND PICTURE/SCHEME
The process can be operated either in batch or continuous mode. In batch mode, the resin
and the water to be treated are stirred together in a reactor. When the reaction is complete
the spent resin is separated by settlement, regenerated and reused. The continuous mode is
usually run in down-flow packed-bed columns; therefore the wastewater flows from the top
to the bottom of the column, through the resin bed. The exhausted resins are regenerated
through backwash operation (see Figure 1).
FIGURE 1 ION EXCHANGE PROCESS
Aiming at heavy metals removal the following reactions can be given as an example:
2 (R-SO3H) + NiSO4 = (R-SO3)2Ni + H2SO4 (production cycle)
(R-SO3)2Ni + H2SO4 = 2(R-SO3H) + NiSO4 (regeneration cycle with acid)
Required Pretreatment
The ion exchange process is susceptible for suspended solids (max. 2-3 mg/l, Harland, 1994)
and organics and requires adequate pretreatment. A typical pretreatment process for remo-
val of suspended solids is (multi) media filtration, and in case of presence of organics either
polishing by macroporous resins is applied or activated carbon.
Waste Products
The waste product of the ion exchange process is a regeneration stream containing salts.
Typical regeneration compounds are: Ca(Cl)2, Ca(OH)2, NaCl, NaOH. In general, regeneration
with sodium salts is found to be more economic thanks to a greater throughput per cycle
(de la Torre, 1999). For heavy metals removal regeneration with a strong acid (H2SO4 or HCl)
is required and produces regeneration liquids comprising metal complexes next to metal
salts.
79
STOWA 2005-34 EXPLORATORY STUDY FOR WASTEWATER TREATMENT TECHNIQUES AND THE EUROPEAN WATER FRAMEWORK DIRECTIVE
Effluent
Applying ion exchange processes, the removal efficiency of a resin depends upon the
characteristics of the feed water (concentrations and ions concurrency) and the applied pro-
cess parameters (flow, regenerative level, etc.). As a consequence it is usual to design the
whole process on the basis of the desired concentration value in the effluent. For heavy
metals removal and/or recovery, experiences show effluent concentrations in the order of
<0.1 ppm. Lower concentrations are not yet experienced and need to be pilot tested.
C. DESIGN GUIDELINES AND TECHNICAL DATA
design loads
• hydraulically: 20-30 BedVolume/h; regeneration and rinsing load: 90 g HCl per liter resin;
• kinetically: exchange capacity between 0.2 and 0.7 meq/L
• energy consumption; the energy consumption of ion exchange process is general less
than 0.3 – 0.4 kWh/m³. • chemical demand; regeneration chemicals (acid and base chemicals, salts like lime or NaCl)
are required at intervals. Consumption figures are much dependent on feed water compo-
sition, regeneration frequency and load. General figures cannot be given.
treatment performance see table 1
TABLE 1 TREATMENT PERFORMANCE
parameter component
substances
average influent to process
(ppm)
average effluent of process
(ppm)
process parameters
(research/full scale)
NH4 50 1 Zeolite exchange process, research
colour > 20 ppm PtCo < 10 ppm PtCo full scale
organics not known / limited not known / limited research
(heavy) metalslow (10 – 0,01) and high (>100)
concentrations< 0.1 – 0,001 full scale; research
waste / by product production regeneration fluids.
D. OPERATIONAL STABILITY AND MAINTENANCE
The ion exchange process is a well-known and robust process used merely in the industry.
The process can be operated fully automatic. Filter vessels are generally installed in parallel
for continuous filtration of the wastewater. Maintenance is mainly required for chemical
dosing facilities (especially lime) and during resin exchange after exceeding its lifetime.
E. REFERENCE INSTALLATIONS, SUPPLIERS / PATENTS
The ion exchange process is in general a well-known and robust process and is applied world-
wide, mostly for the production of demineralised water in the industry, but also for treat-
ment and/or recovery of (heavy) metals at e.g. the galvano industry. Worldwide, numerous
installations are installed at industries, from small size (several m³/h) upto large size (>1000
m³/h) units. For effluent polishing, reducing organics and/or trace (heavy) metals, the process
is relatively new.
Suppliers of (synthetic) ion exchange resin are (a.o.): Rohm&Haas, Purolite, ResinTech, Dow
Chemical, Bayer. Natural ion exchange material (Zeolite) can be extracted at several places
(mountain and vulcanic areas).
80
STOWA 2005-34 EXPLORATORY STUDY FOR WASTEWATER TREATMENT TECHNIQUES AND THE EUROPEAN WATER FRAMEWORK DIRECTIVE
Alternative Processes
Alternative processes for removal of soluble organic substances and/or suspended solids are:
denitrifying (sand) filters, activated carbon filtration, membrane filtration and coagulation/
floccuation processes.
An alternative resin to remove heavy metal ions is the AlgaSORB® technology being a bio-
logical sorption process. This system functions as an biological ion exchange resin to bind
metallic cations. The product is composed of a non-living algal biomass immobilised in a
silica polymer.
A second alternative process for removal of heavy metals achieving metal effluent concen-
trations at ppb level would be the MAAS technology. This technology is developed by TNO-
MEP specifically for the removal of heavy metals and combines the high selectivity of ion
exchange resins with the continuous membrane filtration process. The MAAS technology has
been tested on pilot scale level.
F. LITERATURE REFERENCES
Degremont Water and Environment, Water Treatment Handbook (6th edition),
available at www.degremont.fr.
Harland, C.E., (1994), Ion Exchange: theory and practice (2nd ed.), Royal Society of Chemistry, UK.
Miska V., Ravazzini A., Koning J. de, Delft University of Technology, Integrated concepts for reuse
of upgraded wastewater EVK1-CT-2002-00130 Work package 7 Deliverable D6, April 2004.
Rees, D. Goltz, B. Gisch, D. (2004), Ion exchange resins can reduce nitrogen levels in water,
Water and Wastewater International, November 2004.
Torre Gutierrez, L. de la, (1999), Ammonium removal from municipal wastewater by Ion Exchange,
Afstudeerverslag TU-Delft (Sectie Gezondheidstechniek), DUP Science, Delft.
Stetter, D., Dördelmann, O.,Overath, H., Pilot scale studies on the removal of trace metal
contaminations in drinking water treatment using chelating ion-exchange resins, Water Science
and Technology: Water Supply Vol 2 No 1 pp 25-35, IWA 2002.
81
STOWA 2005-34 EXPLORATORY STUDY FOR WASTEWATER TREATMENT TECHNIQUES AND THE EUROPEAN WATER FRAMEWORK DIRECTIVE
BED FILTRATIONFact sheet nr. 08
Unit operation Separation
Treatment principle Bed filtration with sand or multimedia
Applicable for Stage of development
Advanced wastewater treatment
Full-scale
Process function: removal of particles, suspended solids, pathogenic organisms, bacteria
feed: WWTP effluent
Keywords: filtration, multi media filtration, sand filtration, fixed-bed, continuous sand filtration, flocculating filtration
A. BACKGROUND
Different types of bed filtration are available such as rapid bed filtration, slow filtration, con-
tinuous filtration and fuzzy filtration. Rapid (sand or multi media) filtration and continuous
sand filters are the most commonly used filtration techniques for effluent treatment. Slow
sand filtration is an older technique that, due to its very large space requirement and main-
tenance-intensive operation (manual cleaning of filter bed), is less applied in recent times.
Rapid bed filtration is a bed filtration technique originating from drinking water treatment
where it is used to remove particle matter and turbidity. The process is very robust and has
been in operation in drinking water production for more than 100 years throughout the
world. Within wastewater treatment rapid filtration has been used for over 30 years for
advanced effluent treatment, mainly in Germany, Switzerland, UK and the USA. Rapid sand
filtration is the flow of water through a bed of granular media, normally following settling
basins in conventional water treatment plants. The purpose of this filtration is to remove
any particulate matter left over after flocculation and settling. The filtration mechanisms
are sieving, sedimentation, adsorption, coagulation and flocculation (in case of metal salt
addition). During passage of water through the granular bed, water fills the pores of the filter
medium and the suspended solids and colloidal impurities are adsorbed on the surface of the
grains or become trapped in the openings. The key to this process is the relative grain size of
the filter medium.
Slow sand filtration is a filtration technique which generally uses fine sand (effective size
0.15 – 0.4 mm) and slow filtration rates in the range from 0.1 to 0.3 m/h. The fine media and
low filtration rates encourage the surface capture of large (> 20 um) particulate material.
Head loss, maximum biofilm growth and finer particle capture is usually concentrated in
the top 20 – 30 mm of sand media. With rapid and slow bed filtration the filtration resist-
ance increases over time due to accumulation of retained material. This requires periodical
backwashing. The time interval between cleaning operations is called ‘run time’. The types of
available filtration techniques can be separated into discontinuous and continuous filtration
techniques.
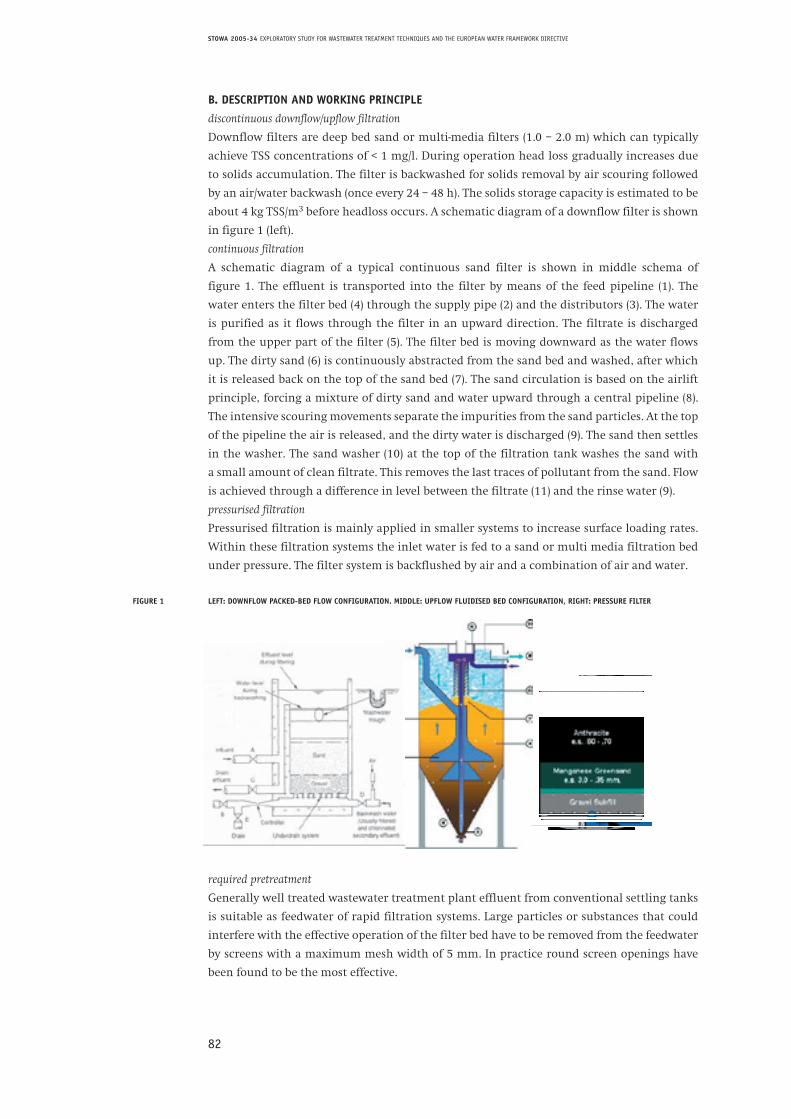
82
STOWA 2005-34 EXPLORATORY STUDY FOR WASTEWATER TREATMENT TECHNIQUES AND THE EUROPEAN WATER FRAMEWORK DIRECTIVE
B. DESCRIPTION AND WORKING PRINCIPLE
discontinuous downflow/upflow filtration
Downflow filters are deep bed sand or multi-media filters (1.0 – 2.0 m) which can typically
achieve TSS concentrations of < 1 mg/l. During operation head loss gradually increases due
to solids accumulation. The filter is backwashed for solids removal by air scouring followed
by an air/water backwash (once every 24 – 48 h). The solids storage capacity is estimated to be
about 4 kg TSS/m3 before headloss occurs. A schematic diagram of a downflow filter is shown
in figure 1 (left).
continuous filtration
A schematic diagram of a typical continuous sand filter is shown in middle schema of
figure 1. The effluent is transported into the filter by means of the feed pipeline (1). The
water enters the filter bed (4) through the supply pipe (2) and the distributors (3). The water
is purified as it flows through the filter in an upward direction. The filtrate is discharged
from the upper part of the filter (5). The filter bed is moving downward as the water flows
up. The dirty sand (6) is continuously abstracted from the sand bed and washed, after which
it is released back on the top of the sand bed (7). The sand circulation is based on the airlift
principle, forcing a mixture of dirty sand and water upward through a central pipeline (8).
The intensive scouring movements separate the impurities from the sand particles. At the top
of the pipeline the air is released, and the dirty water is discharged (9). The sand then settles
in the washer. The sand washer (10) at the top of the filtration tank washes the sand with
a small amount of clean filtrate. This removes the last traces of pollutant from the sand. Flow
is achieved through a difference in level between the filtrate (11) and the rinse water (9).
pressurised filtration
Pressurised filtration is mainly applied in smaller systems to increase surface loading rates.
Within these filtration systems the inlet water is fed to a sand or multi media filtration bed
under pressure. The filter system is backflushed by air and a combination of air and water.
FIGURE 1 LEFT: DOWNFLOW PACKED-BED FLOW CONFIGURATION. MIDDLE: UPFLOW FLUIDISED BED CONFIGURATION, RIGHT: PRESSURE FILTER
required pretreatment
Generally well treated wastewater treatment plant effluent from conventional settling tanks
is suitable as feedwater of rapid filtration systems. Large particles or substances that could
interfere with the effective operation of the filter bed have to be removed from the feedwater
by screens with a maximum mesh width of 5 mm. In practice round screen openings have
been found to be the most effective.
pressurised filtration Pressurised filtration is mainly applied in smaller systems to increase surface loading rates. Within these filtration systems the inlet water is fed to a sand or multi media filtration bed under pressure. The filter system is backflushed by air and a combination of air and water.
Figure 1. Left: Downflow packed-bed flow configuration. Middle: Upflow fluidised bed configuration, Right: Pressure filter
required pretreatment Generally well treated wastewater treatment plant effluent from conventional settling tanks is suitable as feedwater of rapid filtration systems. Large particles or substances that could interfere with the effective operation of the filter bed have to beremoved from the feedwater by screens with a maximum mesh width of 5 mm. In practice round screen openings have been found to be the most effective. waste products In rapid filtration systems excess particulate matter (and chemical sludge in the case of metal dosages) is produced. In fixed-bed systems the sludge is partially dislodged during the backwash stage and in continuous sand filtration the biomass is separated from the sand particles by the sand-flushing step. The flush water containing the excess sludge is recycled back intothe main activated sludge process. treatment performance Rapid filtration is capable of achieving TSS concentrations of < 1 mg/l. The performance is affected predominantly by the filtermedium size and the applied metal salt dosage. See table 1.
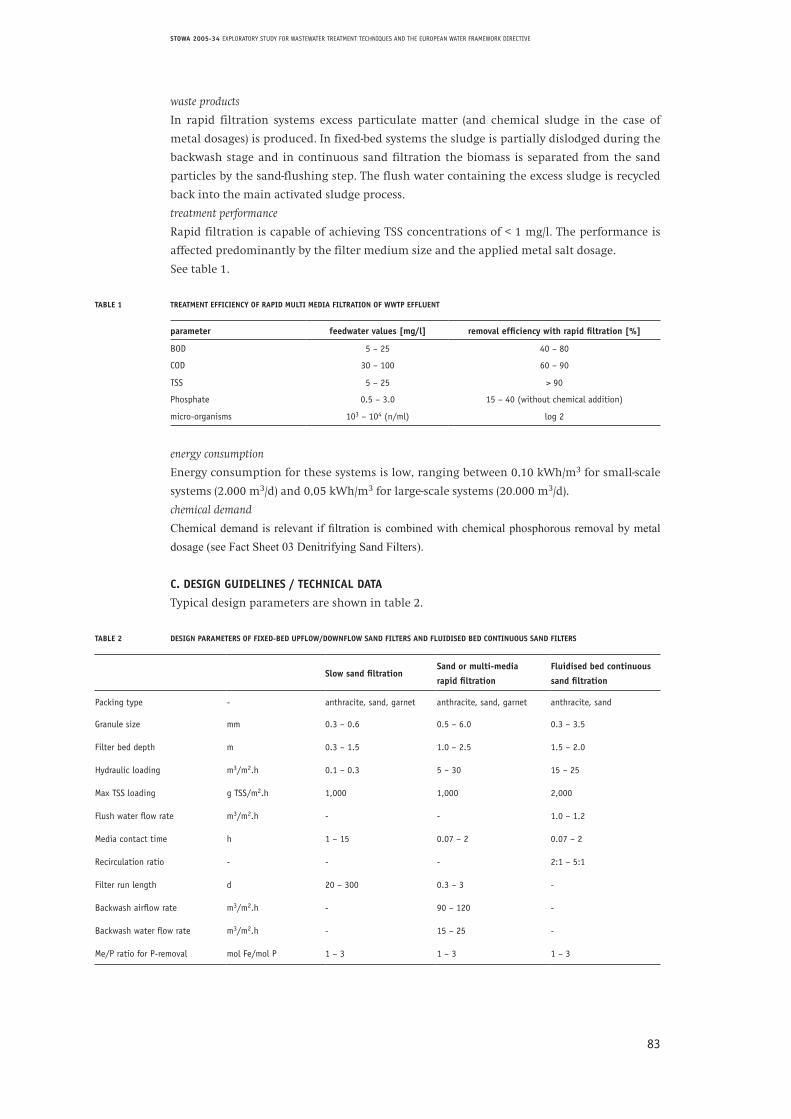
83
STOWA 2005-34 EXPLORATORY STUDY FOR WASTEWATER TREATMENT TECHNIQUES AND THE EUROPEAN WATER FRAMEWORK DIRECTIVE
waste products
In rapid filtration systems excess particulate matter (and chemical sludge in the case of
metal dosages) is produced. In fixed-bed systems the sludge is partially dislodged during the
backwash stage and in continuous sand filtration the biomass is separated from the sand
particles by the sand-flushing step. The flush water containing the excess sludge is recycled
back into the main activated sludge process.
treatment performance
Rapid filtration is capable of achieving TSS concentrations of < 1 mg/l. The performance is
affected predominantly by the filter medium size and the applied metal salt dosage.
See table 1.
TABLE 1 TREATMENT EFFICIENCY OF RAPID MULTI MEDIA FILTRATION OF WWTP EFFLUENT
parameter feedwater values [mg/l] removal efficiency with rapid filtration [%]
BOD 5 – 25 40 – 80
COD 30 – 100 60 – 90
TSS 5 – 25 > 90
Phosphate 0.5 – 3.0 15 – 40 (without chemical addition)
micro-organisms 103 – 104 (n/ml) log 2
energy consumption
Energy consumption for these systems is low, ranging between 0,10 kWh/m3 for small-scale
systems (2.000 m3/d) and 0,05 kWh/m3 for large-scale systems (20.000 m3/d).
chemical demand
Chemical demand is relevant if filtration is combined with chemical phosphorous removal by metal dosage (see Fact Sheet 03 Denitrifying Sand Filters).
C. DESIGN GUIDELINES / TECHNICAL DATA
Typical design parameters are shown in table 2.
TABLE 2 DESIGN PARAMETERS OF FIXED-BED UPFLOW/DOWNFLOW SAND FILTERS AND FLUIDISED BED CONTINUOUS SAND FILTERS
Slow sand filtrationSand or multi-media
rapid filtration
Fluidised bed continuous
sand filtration
Packing type - anthracite, sand, garnet anthracite, sand, garnet anthracite, sand
Granule size mm 0.3 – 0.6 0.5 – 6.0 0.3 – 3.5
Filter bed depth m 0.3 – 1.5 1.0 – 2.5 1.5 – 2.0
Hydraulic loading m3/m2.h 0.1 – 0.3 5 – 30 15 – 25
Max TSS loading g TSS/m2.h 1,000 1,000 2,000
Flush water flow rate m3/m2.h - - 1.0 – 1.2
Media contact time h 1 – 15 0.07 – 2 0.07 – 2
Recirculation ratio - - - 2:1 – 5:1
Filter run length d 20 – 300 0.3 – 3 -
Backwash airflow rate m3/m2.h - 90 – 120 -
Backwash water flow rate m3/m2.h - 15 – 25 -
Me/P ratio for P-removal mol Fe/mol P 1 – 3 1 – 3 1 – 3
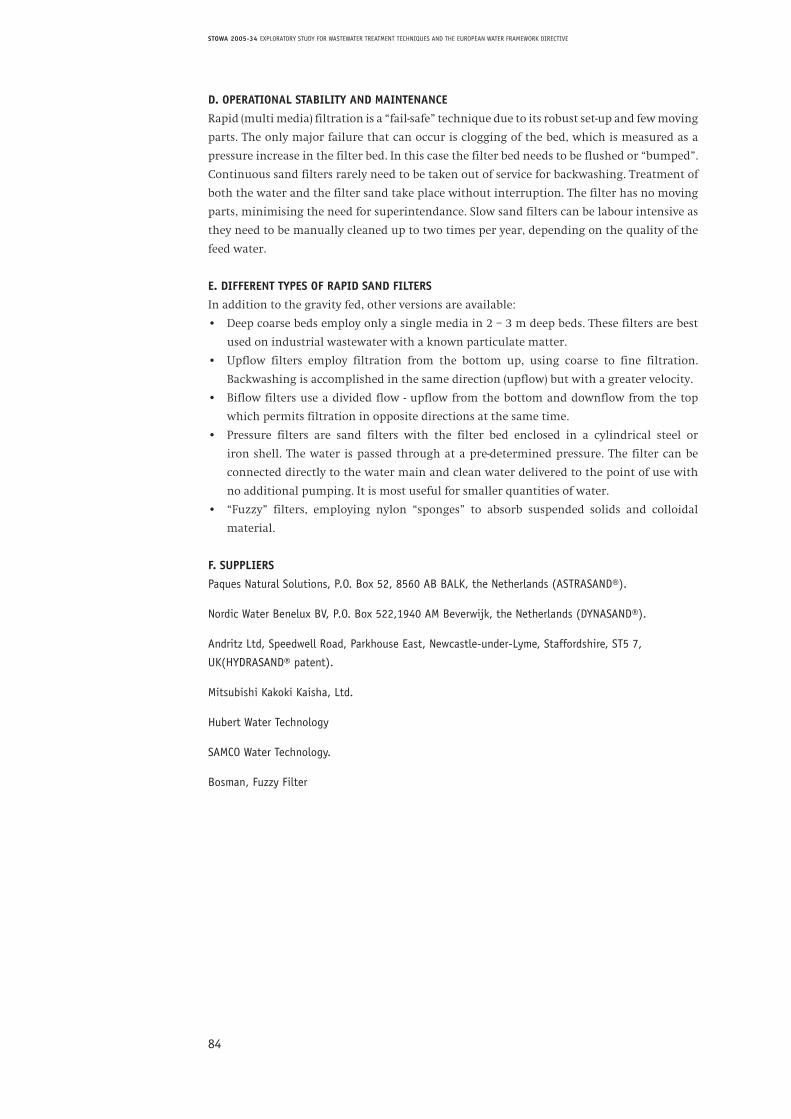
84
STOWA 2005-34 EXPLORATORY STUDY FOR WASTEWATER TREATMENT TECHNIQUES AND THE EUROPEAN WATER FRAMEWORK DIRECTIVE
D. OPERATIONAL STABILITY AND MAINTENANCE
Rapid (multi media) filtration is a “fail-safe” technique due to its robust set-up and few moving
parts. The only major failure that can occur is clogging of the bed, which is measured as a
pressure increase in the filter bed. In this case the filter bed needs to be flushed or “bumped”.
Continuous sand filters rarely need to be taken out of service for backwashing. Treatment of
both the water and the filter sand take place without interruption. The filter has no moving
parts, minimising the need for superintendance. Slow sand filters can be labour intensive as
they need to be manually cleaned up to two times per year, depending on the quality of the
feed water.
E. DIFFERENT TYPES OF RAPID SAND FILTERS
In addition to the gravity fed, other versions are available:
• Deep coarse beds employ only a single media in 2 – 3 m deep beds. These filters are best
used on industrial wastewater with a known particulate matter.
• Upflow filters employ filtration from the bottom up, using coarse to fine filtration.
Backwashing is accomplished in the same direction (upflow) but with a greater velocity.
• Biflow filters use a divided flow - upflow from the bottom and downflow from the top
which permits filtration in opposite directions at the same time.
• Pressure filters are sand filters with the filter bed enclosed in a cylindrical steel or
iron shell. The water is passed through at a pre-determined pressure. The filter can be
connected directly to the water main and clean water delivered to the point of use with
no additional pumping. It is most useful for smaller quantities of water.
• “Fuzzy” filters, employing nylon “sponges” to absorb suspended solids and colloidal
material.
F. SUPPLIERS
Paques Natural Solutions, P.O. Box 52, 8560 AB BALK, the Netherlands (ASTRASAND®).
Nordic Water Benelux BV, P.O. Box 522,1940 AM Beverwijk, the Netherlands (DYNASAND®).
Andritz Ltd, Speedwell Road, Parkhouse East, Newcastle-under-Lyme, Staffordshire, ST5 7,
UK(HYDRASAND® patent).
Mitsubishi Kakoki Kaisha, Ltd.
Hubert Water Technology
SAMCO Water Technology.
Bosman, Fuzzy Filter
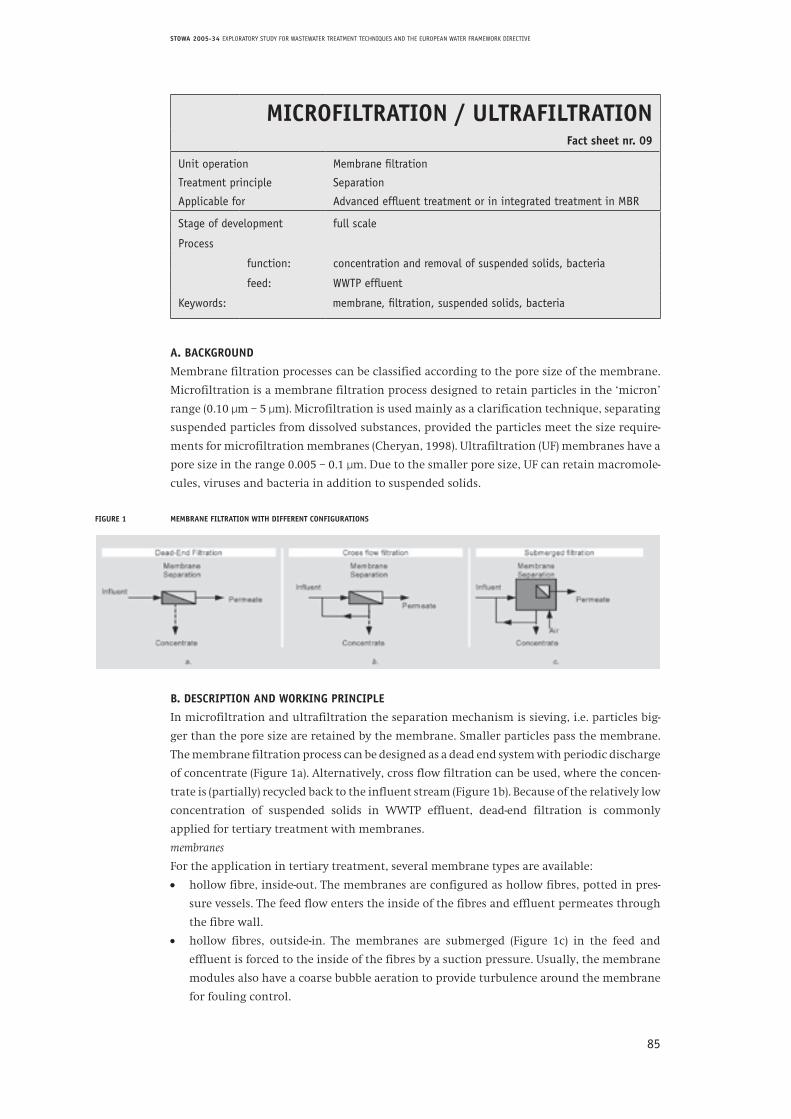
85
STOWA 2005-34 EXPLORATORY STUDY FOR WASTEWATER TREATMENT TECHNIQUES AND THE EUROPEAN WATER FRAMEWORK DIRECTIVE
MICROFILTRATION / ULTRAFILTRATIONFact sheet nr. 09
Unit operation Membrane filtration
Treatment principle Separation
Applicable for Advanced effluent treatment or in integrated treatment in MBR
Stage of development full scale
Process
function: concentration and removal of suspended solids, bacteria
feed: WWTP effluent
Keywords: membrane, filtration, suspended solids, bacteria
A. BACKGROUND
Membrane filtration processes can be classified according to the pore size of the membrane.
Microfiltration is a membrane filtration process designed to retain particles in the ‘micron’
range (0.10 µm – 5 µm). Microfiltration is used mainly as a clarification technique, separating
suspended particles from dissolved substances, provided the particles meet the size require-
ments for microfiltration membranes (Cheryan, 1998). Ultrafiltration (UF) membranes have a
pore size in the range 0.005 – 0.1 µm. Due to the smaller pore size, UF can retain macromole-
cules, viruses and bacteria in addition to suspended solids.
FIGURE 1 MEMBRANE FILTRATION WITH DIFFERENT CONFIGURATIONS
B. DESCRIPTION AND WORKING PRINCIPLE
In microfiltration and ultrafiltration the separation mechanism is sieving, i.e. particles big-
ger than the pore size are retained by the membrane. Smaller particles pass the membrane.
The membrane filtration process can be designed as a dead end system with periodic discharge
of concentrate (Figure 1a). Alternatively, cross flow filtration can be used, where the concen-
trate is (partially) recycled back to the influent stream (Figure 1b). Because of the relatively low
concentration of suspended solids in WWTP effluent, dead-end filtration is commonly
applied for tertiary treatment with membranes.
membranes
For the application in tertiary treatment, several membrane types are available:
• hollow fibre, inside-out. The membranes are configured as hollow fibres, potted in pres-
sure vessels. The feed flow enters the inside of the fibres and effluent permeates through
the fibre wall.
• hollow fibres, outside-in. The membranes are submerged (Figure 1c) in the feed and
effluent is forced to the inside of the fibres by a suction pressure. Usually, the membrane
modules also have a coarse bubble aeration to provide turbulence around the membrane
for fouling control.
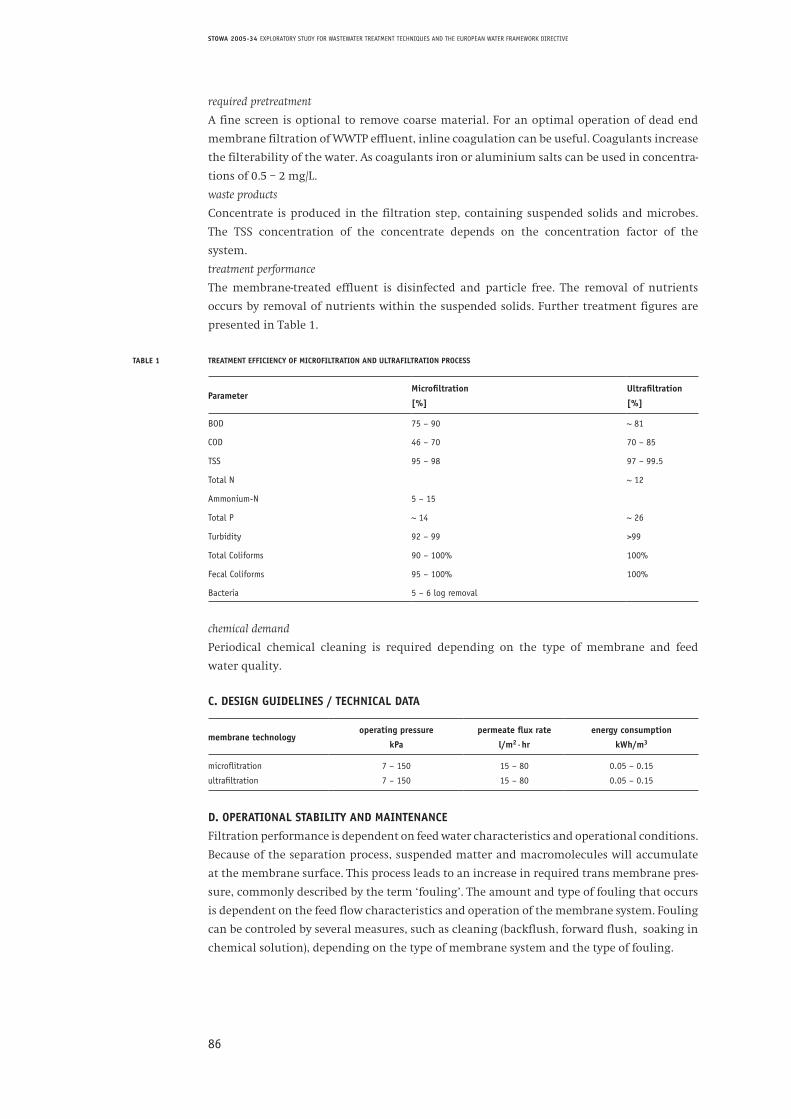
86
STOWA 2005-34 EXPLORATORY STUDY FOR WASTEWATER TREATMENT TECHNIQUES AND THE EUROPEAN WATER FRAMEWORK DIRECTIVE
required pretreatment
A fine screen is optional to remove coarse material. For an optimal operation of dead end
membrane filtration of WWTP effluent, inline coagulation can be useful. Coagulants increase
the filterability of the water. As coagulants iron or aluminium salts can be used in concentra-
tions of 0.5 – 2 mg/L.
waste products
Concentrate is produced in the filtration step, containing suspended solids and microbes.
The TSS concentration of the concentrate depends on the concentration factor of the
system.
treatment performance
The membrane-treated effluent is disinfected and particle free. The removal of nutrients
occurs by removal of nutrients within the suspended solids. Further treatment figures are
presented in Table 1.
TABLE 1 TREATMENT EFFICIENCY OF MICROFILTRATION AND ULTRAFILTRATION PROCESS
ParameterMicrofiltration
[%]
Ultrafiltration
[%]
BOD 75 – 90 ~ 81
COD 46 – 70 70 – 85
TSS 95 – 98 97 – 99.5
Total N ~ 12
Ammonium-N 5 – 15
Total P ~ 14 ~ 26
Turbidity 92 – 99 >99
Total Coliforms 90 – 100% 100%
Fecal Coliforms 95 – 100% 100%
Bacteria 5 – 6 log removal
chemical demand
Periodical chemical cleaning is required depending on the type of membrane and feed
water quality.
C. DESIGN GUIDELINES / TECHNICAL DATA
membrane technologyoperating pressure
kPa
permeate flux rate
l/m2·hr
energy consumption
kWh/m3
microflitration
ultrafiltration
7 – 150
7 – 150
15 – 80
15 – 80
0.05 – 0.15
0.05 – 0.15
D. OPERATIONAL STABILITY AND MAINTENANCE
Filtration performance is dependent on feed water characteristics and operational conditions.
Because of the separation process, suspended matter and macromolecules will accumulate
at the membrane surface. This process leads to an increase in required trans membrane pres-
sure, commonly described by the term ‘fouling’. The amount and type of fouling that occurs
is dependent on the feed flow characteristics and operation of the membrane system. Fouling
can be controled by several measures, such as cleaning (backflush, forward flush, soaking in
chemical solution), depending on the type of membrane system and the type of fouling.
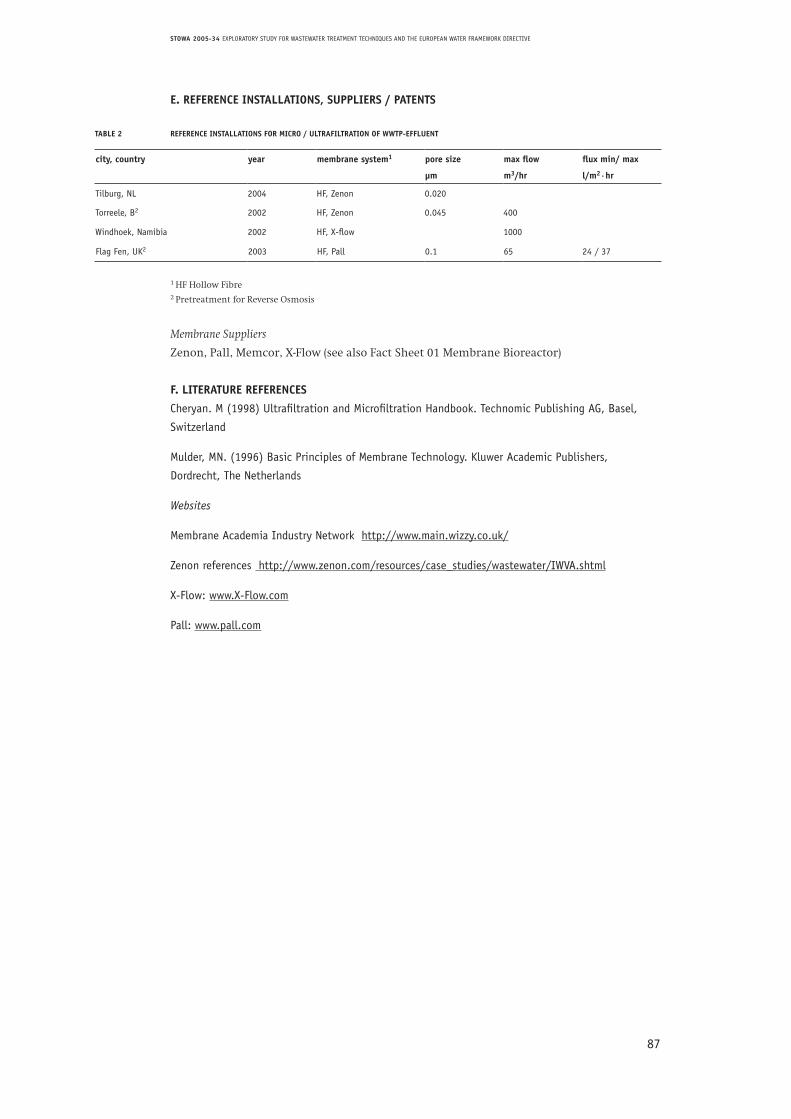
87
STOWA 2005-34 EXPLORATORY STUDY FOR WASTEWATER TREATMENT TECHNIQUES AND THE EUROPEAN WATER FRAMEWORK DIRECTIVE
E. REFERENCE INSTALLATIONS, SUPPLIERS / PATENTS
TABLE 2 REFERENCE INSTALLATIONS FOR MICRO / ULTRAFILTRATION OF WWTP-EFFLUENT
city, country year membrane system1 pore size max flow flux min/ max
µm m3/hr l/m2·hr
Tilburg, NL 2004 HF, Zenon 0.020
Torreele, B2 2002 HF, Zenon 0.045 400
Windhoek, Namibia 2002 HF, X-flow 1000
Flag Fen, UK2 2003 HF, Pall 0.1 65 24 / 37
1 HF Hollow Fibre2 Pretreatment for Reverse Osmosis
Membrane Suppliers
Zenon, Pall, Memcor, X-Flow (see also Fact Sheet 01 Membrane Bioreactor)
F. LITERATURE REFERENCES
Cheryan. M (1998) Ultrafiltration and Microfiltration Handbook. Technomic Publishing AG, Basel,
Switzerland
Mulder, MN. (1996) Basic Principles of Membrane Technology. Kluwer Academic Publishers,
Dordrecht, The Netherlands
Websites
Membrane Academia Industry Network http://www.main.wizzy.co.uk/
Zenon references http://www.zenon.com/resources/case_studies/wastewater/IWVA.shtml
X-Flow: www.X-Flow.com
Pall: www.pall.com

88
STOWA 2005-34 EXPLORATORY STUDY FOR WASTEWATER TREATMENT TECHNIQUES AND THE EUROPEAN WATER FRAMEWORK DIRECTIVE
89
STOWA 2005-34 EXPLORATORY STUDY FOR WASTEWATER TREATMENT TECHNIQUES AND THE EUROPEAN WATER FRAMEWORK DIRECTIVE
APPENDIX IV
BASIC ASSUMPTIONS FOR THE COST ESTIMATES
90
STOWA 2005-34 EXPLORATORY STUDY FOR WASTEWATER TREATMENT TECHNIQUES AND THE EUROPEAN WATER FRAMEWORK DIRECTIVE
GENERAL
For each technique or combination of techniques a cost estimate has been set up, containing
the investment costs and the total yearly costs. The cost estimates have been calculated for
two plant sizes, namely 20,000 P.E. and 100,000 P.E.
The average dry weather flow (DWF) rate is calculated based on an average daily flow of 200
l/P.E. during 16 hours per day = 12.5 l/P.E./h. The treatment units have been designed for a
hydraulic flow of 1.5 x DWF = 18.75 l/P.E./h.
20,000 P.E. 100,000 P.E.
Average daily flow 4,000 20,000 m³/d
Average flow 250 1,250 m³/h
Maximum flow 375 1,875 m³/h
Yearly flow 1,460,000 7,300,000 m³/year
The total costs are presented both per cubic metre treated (m3) and as costs per P.E./year.
For estimation of the construction costs, the estimated costs have been used from the de-
tailed design phase of a project in which denitrifying sand filter post-treatment units are
being implemented for 6 different WWTPs by the Water Board of Rijnland. Both plant sizes
of 20,000 and 100,000 P.E. have been applied in this project. The costs for connection to the
existing facilities, elevation of water, pre-treatment, filtration and extra provisions required
at the Rijnland installations are considered representative for the “typical” application at
other WWTPs in The Netherlands.
CONSTRUCTION COSTS AND INVESTMENT COSTS
The estimation of the construction costs includes:
- connection to the effluent pumping system of the existing WWTP;
- pumping station with fine screen for the elevation of effluent to the post treatment
unit;
- the treatment step(s), including extra provisions (e.g. compressed air), feeding, measure-
ment and control units and process control;
- chemical storage and dosage units;
- simple operation rooms for instruments that cannot be mounted outside.
For the application of filter installations in plants of 20,000 P.E., it has been assumed that
steel filters mounted outdoors will be used; for plants of 100,000 P.E., it is assumed that filters
will be built in concrete filter constructions.
For the treatment of residual waste streams, integral costs are accounted for in the operatio-
nal costs (internal costs in the WWTP and transport costs of residual waste products); no extra
treatment units have been calculated in the investment costs.
The investment costs presented are excluding the costs for eventual extra building space
(land).
All treatment scenarios are provided with a simple cascade step as a last process step to en-
sure sufficient oxygen levels in the effluent (3 – 5 mg/l).
91
STOWA 2005-34 EXPLORATORY STUDY FOR WASTEWATER TREATMENT TECHNIQUES AND THE EUROPEAN WATER FRAMEWORK DIRECTIVE
The investment costs are calculated from the construction costs. Construction costs are mul-
tiplied by a factor of 61 % for unforeseen costs, design and supervision, funding costs, per-
mits, insurance, costs for commissioning and service goods tax (BTW in The Netherlands).
TOTAL YEARLY COSTS (OPERATIONAL COSTS)
In the operational costs the following aspects have been accounted for:
- capital costs are based on the method of annuity, with 6 % rent. Depreciation period civil:
30 years, mechanical, electrical and process control: 15 years. This results in annuities of
7.3 %/year and 10.3 %/year, respectively.
- maintenance costs 0.5 %/year of civil construction costs, 3 %/year of mechanical, electrical
and process control construction costs.
- personnel 50,000 EUR/FTE/year, required service is dependent on the technique.
- Energy costs based on 0.07 EUR/kWh.
- Additional chemicals:
40 %FeCl3 EUR 150/1,000 kg
methanol EUR 275/1,000 kg
35 % H2O2 EUR 300/1,000 kg
powdered activated carbon EUR 1,100/1,000 kg
- Replacement costs during operation time:
- granular activated carbon (GAC) EUR 600/1,000 kg (run time 0.6 – 0.7 y)
- UV-lamps depending on application
(advanced oxidation or disinfection)
- MF/UF membranes EUR 30/m2, lifetime 7 year
- Treatment of residual waste streams
(internal & external costs):
- filtration sludge, surplus sludge EUR 500/1,000 kg ds (= thickening, dewatering,
transport, end treatment together
with WWTP-sludge)
- Brine of ion exchange 0.01 % of main stream, 60 EUR/m³- On line measurement (quality control) EUR 3,000/y (operational costs)
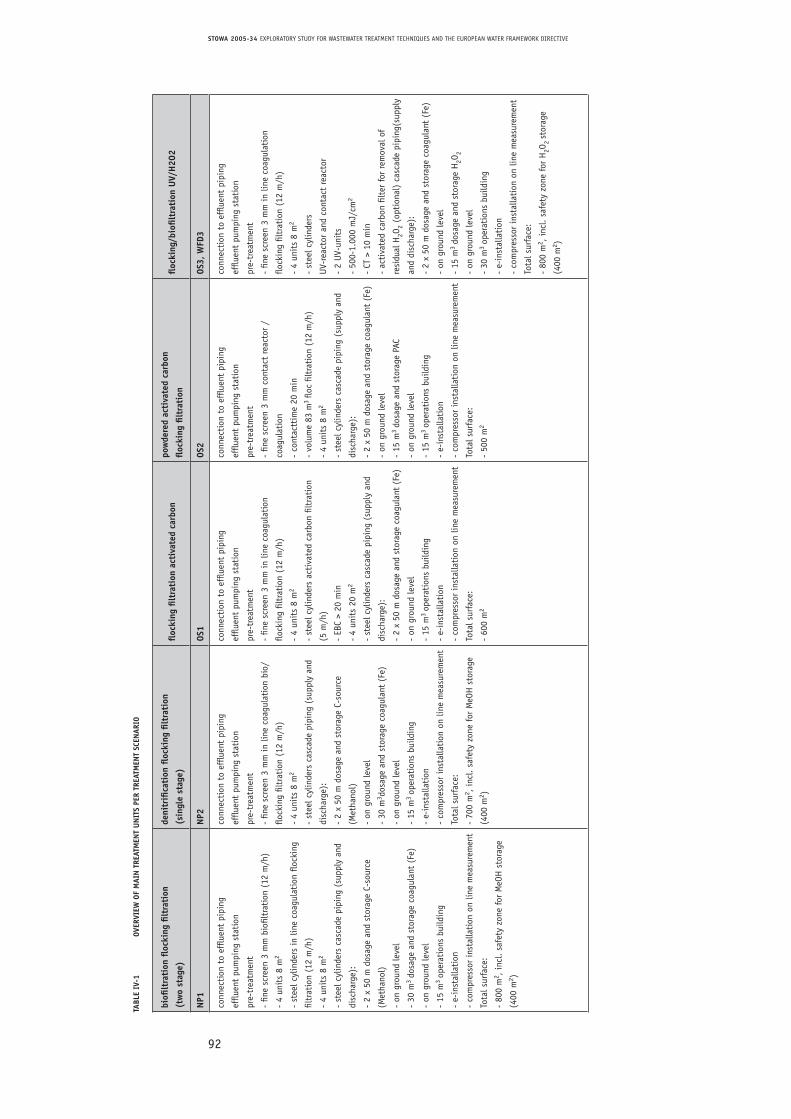
92
STOWA 2005-34 EXPLORATORY STUDY FOR WASTEWATER TREATMENT TECHNIQUES AND THE EUROPEAN WATER FRAMEWORK DIRECTIVE
TABL
E IV
-1
OVER
VIEW
OF
MAI
N T
REAT
MEN
T U
NIT
S PE
R TR
EATM
ENT
SCEN
ARIO
biofi
ltra
tion
floc
king
filt
rati
on
(tw
o st
age)
deni
trifi
cati
on fl
ocki
ng fi
ltra
tion
(sin
gle
stag
e)fl
ocki
ng fi
ltra
tion
act
ivat
ed c
arbo
npo
wde
red
acti
vate
d ca
rbon
floc
king
filt
rati
onfl
ocki
ng/b
iofil
trat
ion
UV/
H2O
2
NP1
NP2
OS1
OS2
OS3,
WFD
3
conn
ecti
on t
o ef
fluen
t pi
ping
efflu
ent
pum
ping
sta
tion
pre-
trea
tmen
t
- fin
e sc
reen
3 m
m b
iofil
trat
ion
(12
m/h
)
- 4
unit
s 8
m2
- st
eel c
ylin
ders
in li
ne c
oagu
lati
on fl
ocki
ng
filtr
atio
n (1
2 m
/h)
- 4
unit
s 8
m2
- st
eel c
ylin
ders
cas
cade
pip
ing
(sup
ply
and
disc
harg
e):
- 2
x 50
m d
osag
e an
d st
orag
e C-
sour
ce
(Met
hano
l)
- on
gro
und
leve
l
- 30
m3 do
sage
and
sto
rage
coa
gula
nt (
Fe)
- on
gro
und
leve
l
- 15
m3 op
erat
ions
bui
ldin
g
- e-
inst
alla
tion
- co
mpr
esso
r in
stal
lati
on o
n lin
e m
easu
rem
ent
Tota
l sur
face
:
- 80
0 m
2 , in
cl.
safe
ty z
one
for
MeO
H s
tora
ge
(400
m2 )
conn
ecti
on t
o ef
fluen
t pi
ping
efflu
ent
pum
ping
sta
tion
pre-
trea
tmen
t
- fin
e sc
reen
3 m
m in
line
coa
gula
tion
bio
/
flock
ing
filtr
atio
n (1
2 m
/h)
- 4
unit
s 8
m2
- st
eel c
ylin
ders
cas
cade
pip
ing
(sup
ply
and
disc
harg
e):
- 2
x 50
m d
osag
e an
d st
orag
e C-
sour
ce
(Met
hano
l)
- on
gro
und
leve
l
- 30
m3 d
osag
e an
d st
orag
e co
agul
ant
(Fe)
- on
gro
und
leve
l
- 15
m3 op
erat
ions
bui
ldin
g
- e-
inst
alla
tion
- co
mpr
esso
r in
stal
lati
on o
n lin
e m
easu
rem
ent
Tota
l sur
face
:
- 70
0 m
2 , in
cl. sa
fety
zon
e fo
r M
eOH
sto
rage
(400
m2 )
conn
ecti
on t
o ef
fluen
t pi
ping
efflu
ent
pum
ping
sta
tion
pre-
trea
tmen
t
- fin
e sc
reen
3 m
m in
line
coa
gula
tion
flock
ing
filtr
atio
n (1
2 m
/h)
- 4
unit
s 8
m2
- st
eel c
ylin
ders
act
ivat
ed c
arbo
n fil
trat
ion
(5 m
/h)
- EB
C >
20 m
in
- 4
unit
s 20
m2
- st
eel c
ylin
ders
cas
cade
pip
ing
(sup
ply
and
disc
harg
e):
- 2
x 50
m d
osag
e an
d st
orag
e co
agul
ant
(Fe)
- on
gro
und
leve
l
- 15
m3 op
erat
ions
bui
ldin
g
- e-
inst
alla
tion
- co
mpr
esso
r in
stal
lati
on o
n lin
e m
easu
rem
ent
Tota
l sur
face
:
- 60
0 m
2
conn
ecti
on t
o ef
fluen
t pi
ping
efflu
ent
pum
ping
sta
tion
pre-
trea
tmen
t
- fin
e sc
reen
3 m
m c
onta
ct r
eact
or /
coag
ulat
ion
- co
ntac
ttim
e 20
min
- vo
lum
e 83
m3 flo
c fil
trat
ion
(12
m/h
)
- 4
unit
s 8
m2
- st
eel c
ylin
ders
cas
cade
pip
ing
(sup
ply
and
disc
harg
e):
- 2
x 50
m d
osag
e an
d st
orag
e co
agul
ant
(Fe)
- on
gro
und
leve
l
- 15
m3 do
sage
and
sto
rage
PAC
- on
gro
und
leve
l
- 15
m3 op
erat
ions
bui
ldin
g
- e-
inst
alla
tion
- co
mpr
esso
r in
stal
lati
on o
n lin
e m
easu
rem
ent
Tota
l sur
face
:
- 50
0 m
2
conn
ecti
on t
o ef
fluen
t pi
ping
efflu
ent
pum
ping
sta
tion
pre-
trea
tmen
t
- fin
e sc
reen
3 m
m in
line
coa
gula
tion
flock
ing
filtr
atio
n (1
2 m
/h)
- 4
unit
s 8
m2
- st
eel c
ylin
ders
UV-
reac
tor
and
cont
act
reac
tor
- 2
UV-
unit
s
- 50
0-1.
000
mJ/
cm2
- CT
> 1
0 m
in
- ac
tiva
ted
carb
on fi
lter
for
rem
oval
of
resi
dual
H2O
2 (o
ptio
nal)
cas
cade
pip
ing(
supp
ly
and
disc
harg
e):
- 2
x 50
m d
osag
e an
d st
orag
e co
agul
ant
(Fe)
- on
gro
und
leve
l
- 15
m3 do
sage
and
sto
rage
H2O
2
- on
gro
und
leve
l
- 30
m3 op
erat
ions
bui
ldin
g
- e-
inst
alla
tion
- co
mpr
esso
r in
stal
lati
on o
n lin
e m
easu
rem
ent
Tota
l sur
face
:
- 80
0 m
2 , in
cl.
safe
ty z
one
for
H2O
2 st
orag
e
(400
m2 )
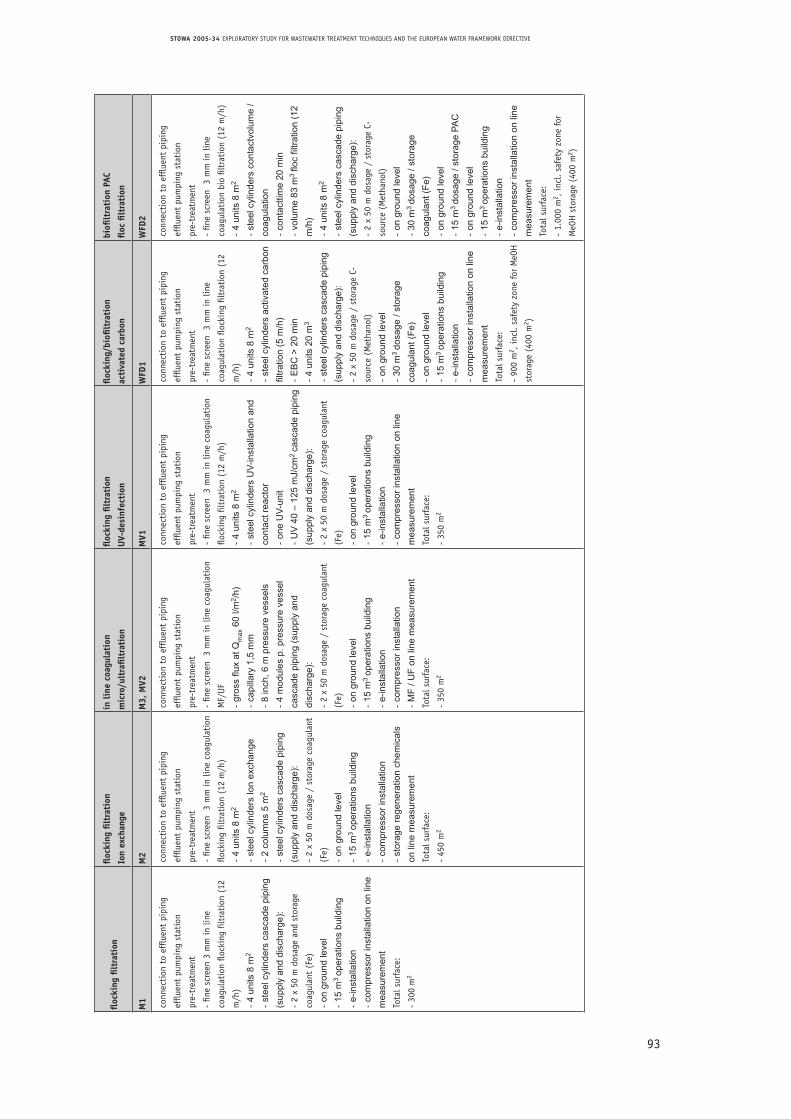
93
STOWA 2005-34 EXPLORATORY STUDY FOR WASTEWATER TREATMENT TECHNIQUES AND THE EUROPEAN WATER FRAMEWORK DIRECTIVE
floc
king
filt
rati
onfl
ocki
ng fi
ltra
tion
Ion
exch
ange
in li
ne c
oagu
lati
on
mic
ro/u
ltra
filtr
atio
n
floc
king
filt
rati
on
UV-
desi
nfec
tion
floc
king
/bio
filtr
atio
n
acti
vate
d ca
rbon
biofi
ltra
tion
PAC
floc
filt
rati
on
M1
M2
M3,
MV2
MV1
WFD
1W
FD2
conn
ecti
on t
o ef
fluen
t pi
ping
efflu
ent
pum
ping
sta
tion
pre-
trea
tmen
t
- fin
e sc
reen
3 m
m in
line
coag
ulat
ion
flock
ing
filtr
atio
n (1
2
m/h
)
- 4
units
8 m
2
- st
eel c
ylin
ders
cas
cade
pip
ing
(sup
ply
and
disc
harg
e):
- 2
x 50
m d
osag
e an
d st
orag
e
coag
ulan
t (F
e)
- on
gro
und
leve
l-
15 m
3 op
erat
ions
bui
ldin
g-
e-in
stal
latio
n-
com
pres
sor i
nsta
llatio
n on
line
m
easu
rem
ent
Tota
l sur
face
:
- 30
0 m
2
conn
ecti
on t
o ef
fluen
t pi
ping
efflu
ent
pum
ping
sta
tion
pre-
trea
tmen
t
- fin
e sc
reen
3
mm
in li
ne c
oagu
lati
on
flock
ing
filtr
atio
n (1
2 m
/h)
- 4
units
8 m
2
- st
eel c
ylin
ders
Ion
exch
ange
- 2
colu
mns
5 m
2 -
stee
l cyl
inde
rs c
asca
de p
ipin
g (s
uppl
y an
d di
scha
rge)
:-
2 x
50 m
dos
age
/ st
orag
e co
agul
ant
(Fe)
- on
gro
und
leve
l-
15 m
3 op
erat
ions
bui
ldin
g-
e-in
stal
latio
n-
com
pres
sor i
nsta
llatio
n-
stor
age
rege
nera
tion
chem
ical
s on
line
mea
sure
men
t To
tal s
urfa
ce:
- 45
0 m
2
conn
ecti
on t
o ef
fluen
t pi
ping
efflu
ent
pum
ping
sta
tion
pre-
trea
tmen
t
- fin
e sc
reen
3
mm
in li
ne c
oagu
lati
on
MF/
UF
- gr
oss
flux
at Q
max
60
l/m2 /
h)-
capi
llary
1,5
mm
- 8
inch
, 6 m
pre
ssur
e ve
ssel
s-
4 m
odul
es p
. pre
ssur
e ve
ssel
ca
scad
e pi
ping
(sup
ply
and
disc
harg
e):
- 2
x 50
m d
osag
e /
stor
age
coag
ulan
t
(Fe)
- on
gro
und
leve
l-
15 m
3 op
erat
ions
bui
ldin
g-
e-in
stal
latio
n-
com
pres
sor i
nsta
llatio
n-
MF
/ UF
on li
ne m
easu
rem
ent
Tota
l sur
face
:
- 35
0 m
2
conn
ecti
on t
o ef
fluen
t pi
ping
efflu
ent
pum
ping
sta
tion
pre-
trea
tmen
t
- fin
e sc
reen
3
mm
in li
ne c
oagu
lati
on
flock
ing
filtr
atio
n (1
2 m
/h)
- 4
units
8 m
2
- st
eel c
ylin
ders
UV-
inst
alla
tion
and
cont
act r
eact
or-
one
UV-
unit
- U
V 4
0 –
125
mJ/
cm2
casc
ade
pipi
ng
(sup
ply
and
disc
harg
e):
- 2
x 50
m d
osag
e /
stor
age
coag
ulan
t
(Fe)
- on
gro
und
leve
l-
15 m
3 op
erat
ions
bui
ldin
g -
e-in
stal
latio
n-
com
pres
sor i
nsta
llatio
n on
line
m
easu
rem
ent
Tota
l sur
face
:
- 35
0 m
2
conn
ecti
on t
o ef
fluen
t pi
ping
efflu
ent
pum
ping
sta
tion
pre-
trea
tmen
t
- fin
e sc
reen
3
mm
in li
ne
coag
ulat
ion
flock
ing
filtr
atio
n (1
2
m/h
)
- 4
units
8 m
2
- st
eel c
ylin
ders
act
ivat
ed c
arbo
n fil
tratio
n (5
m/h
)-
EB
C >
20
min
- 4
units
20
m3
- st
eel c
ylin
ders
cas
cade
pip
ing
(sup
ply
and
disc
harg
e):
- 2
x 50
m d
osag
e /
stor
age
C-
sour
ce (
Met
hano
l)
- on
gro
und
leve
l-
30 m
3 do
sage
/ st
orag
e co
agul
ant (
Fe)
- on
gro
und
leve
l-
15 m
3 op
erat
ions
bui
ldin
g-
e-in
stal
latio
n-
com
pres
sor i
nsta
llatio
n on
line
m
easu
rem
ent
Tota
l sur
face
:
- 90
0 m
2 , in
cl.
safe
ty z
one
for
MeO
H
stor
age
(400
m2 )
conn
ecti
on t
o ef
fluen
t pi
ping
efflu
ent
pum
ping
sta
tion
pre-
trea
tmen
t
- fin
e sc
reen
3
mm
in li
ne
coag
ulat
ion
bio
filtr
atio
n (1
2 m
/h)
- 4
units
8 m
2
- st
eel c
ylin
ders
con
tact
volu
me
/ co
agul
atio
n-
cont
actti
me
20 m
in-
volu
me
83 m
3 flo
c fil
tratio
n (1
2 m
/h)
- 4
units
8 m
2
- st
eel c
ylin
ders
cas
cade
pip
ing
(sup
ply
and
disc
harg
e):
- 2
x 50
m d
osag
e /
stor
age
C-
sour
ce (
Met
hano
l)
- on
gro
und
leve
l-
30 m
3 do
sage
/ st
orag
e co
agul
ant (
Fe)
- on
gro
und
leve
l-
15 m
3 do
sage
/ st
orag
e PA
C-
on g
roun
d le
vel
- 15
m3
oper
atio
ns b
uild
ing
- e-
inst
alla
tion
- co
mpr
esso
r ins
talla
tion
on li
ne
mea
sure
men
t To
tal s
urfa
ce:
- 1.
000
m2 ,
incl
. sa
fety
zon
e fo
r
MeO
H s
tora
ge (
400
m2 )
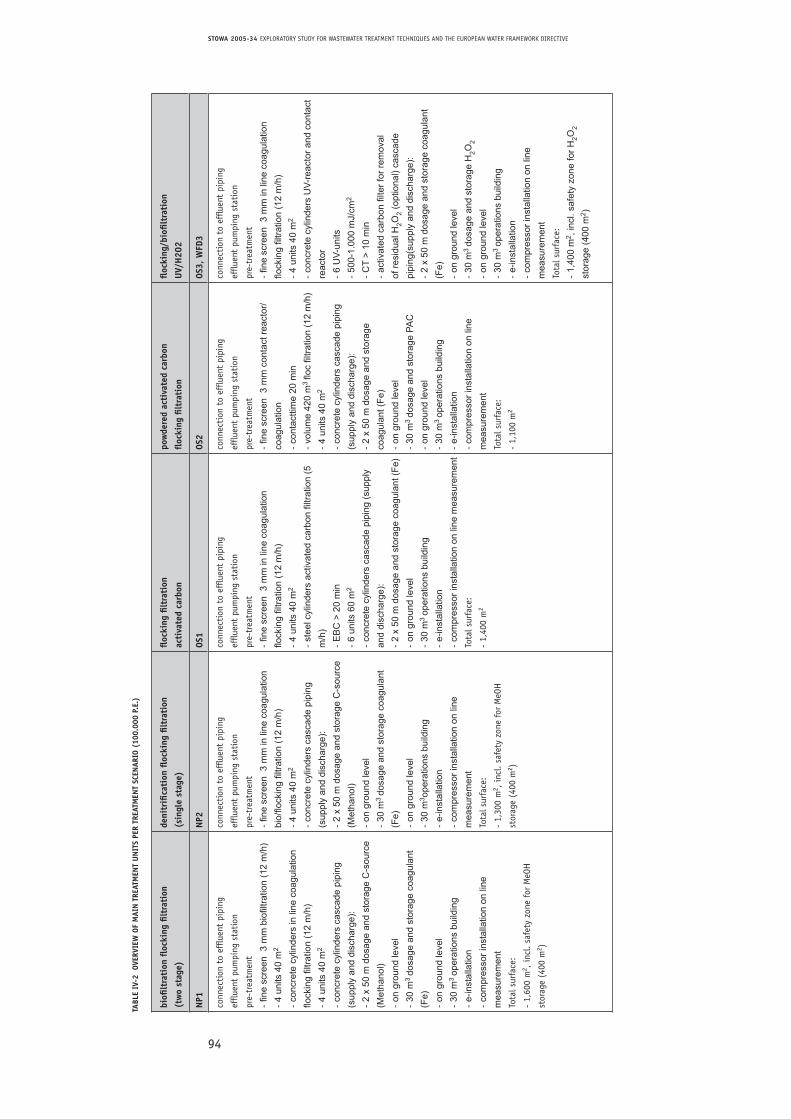
94
STOWA 2005-34 EXPLORATORY STUDY FOR WASTEWATER TREATMENT TECHNIQUES AND THE EUROPEAN WATER FRAMEWORK DIRECTIVE
TABL
E IV
-2 O
VERV
IEW
OF
MAI
N T
REAT
MEN
T U
NIT
S PE
R TR
EATM
ENT
SCEN
ARIO
(10
0.00
0 P.
E.)
biofi
ltra
tion
floc
king
filt
rati
on
(tw
o st
age)
deni
trifi
cati
on fl
ocki
ng fi
ltra
tion
(sin
gle
stag
e)
floc
king
filt
rati
on
acti
vate
d ca
rbon
pow
dere
d ac
tiva
ted
carb
on
floc
king
filt
rati
on
floc
king
/bio
filtr
atio
n
UV/
H2O
2
NP1
NP2
OS1
OS2
OS3,
WFD
3
conn
ecti
on t
o ef
fluen
t pi
ping
efflu
ent
pum
ping
sta
tion
pre-
trea
tmen
t
- fin
e sc
reen
3 m
m b
iofil
tratio
n (1
2 m
/h)
- 4
units
40
m2
- co
ncre
te c
ylin
ders
in li
ne c
oagu
latio
n flo
ckin
g fil
tratio
n (1
2 m
/h)
- 4
units
40
m2
- co
ncre
te c
ylin
ders
cas
cade
pip
ing
(sup
ply
and
disc
harg
e):
- 2
x 50
m d
osag
e an
d st
orag
e C
-sou
rce
(Met
hano
l)-
on g
roun
d le
vel
- 30
m3
dosa
ge a
nd s
tora
ge c
oagu
lant
(F
e)
- on
gro
und
leve
l-
30 m
3 op
erat
ions
bui
ldin
g-
e-in
stal
latio
n-
com
pres
sor i
nsta
llatio
n on
line
m
easu
rem
ent
Tota
l sur
face
:
- 1,
600
m2 ,
incl
. sa
fety
zon
e fo
r M
eOH
stor
age
(400
m2 )
conn
ecti
on t
o ef
fluen
t pi
ping
efflu
ent
pum
ping
sta
tion
pre-
trea
tmen
t
- fin
e sc
reen
3 m
m in
line
coa
gula
tion
bio/
flock
ing
filtra
tion
(12
m/h
) -
4 un
its 4
0 m
2
- co
ncre
te c
ylin
ders
cas
cade
pip
ing
(sup
ply
and
disc
harg
e):
- 2
x 50
m d
osag
e an
d st
orag
e C
-sou
rce
(Met
hano
l)-
on g
roun
d le
vel
- 30
m3
dosa
ge a
nd s
tora
ge c
oagu
lant
(F
e)
- on
gro
und
leve
l-
30 m
3 ope
ratio
ns b
uild
ing
- e-
inst
alla
tion
- co
mpr
esso
r ins
talla
tion
on li
ne
mea
sure
men
t To
tal s
urfa
ce:
- 1,
300
m2 ,
incl
. sa
fety
zon
e fo
r M
eOH
stor
age
(400
m2 )
conn
ecti
on t
o ef
fluen
t pi
ping
efflu
ent
pum
ping
sta
tion
pre-
trea
tmen
t
- fin
e sc
reen
3 m
m in
line
coa
gula
tion
flock
ing
filtra
tion
(12
m/h
) -
4 un
its 4
0 m
2
- st
eel c
ylin
ders
act
ivat
ed c
arbo
n fil
tratio
n (5
m
/h)
- E
BC
> 2
0 m
in-
6 un
its 6
0 m
2
- co
ncre
te c
ylin
ders
cas
cade
pip
ing
(sup
ply
and
disc
harg
e):
- 2
x 50
m d
osag
e an
d st
orag
e co
agul
ant (
Fe)
- on
gro
und
leve
l-
30 m
3 op
erat
ions
bui
ldin
g-
e-in
stal
latio
n-
com
pres
sor i
nsta
llatio
n on
line
mea
sure
men
t To
tal s
urfa
ce:
- 1,
400
m2
conn
ecti
on t
o ef
fluen
t pi
ping
efflu
ent
pum
ping
sta
tion
pre-
trea
tmen
t
- fin
e sc
reen
3 m
m c
onta
ct re
acto
r/co
agul
atio
n-
cont
actti
me
20 m
in-
volu
me
420
m3
floc
filtra
tion
(12
m/h
) -
4 un
its 4
0 m
2
- co
ncre
te c
ylin
ders
cas
cade
pip
ing
(sup
ply
and
disc
harg
e):
- 2
x 50
m d
osag
e an
d st
orag
e co
agul
ant (
Fe)
- on
gro
und
leve
l-
30 m
3 do
sage
and
sto
rage
PA
C
- on
gro
und
leve
l-
30 m
3 op
erat
ions
bui
ldin
g-
e-in
stal
latio
n-
com
pres
sor i
nsta
llatio
n on
line
m
easu
rem
ent
Tota
l sur
face
:
- 1,
100
m2
conn
ecti
on t
o ef
fluen
t pi
ping
efflu
ent
pum
ping
sta
tion
pre-
trea
tmen
t
- fin
e sc
reen
3 m
m in
line
coa
gula
tion
flock
ing
filtra
tion
(12
m/h
) -
4 un
its 4
0 m
2
- co
ncre
te c
ylin
ders
UV-
reac
tor a
nd c
onta
ct
reac
tor
- 6
UV-
units
- 50
0-1.
000
mJ/
cm2
- C
T >
10 m
in-
activ
ated
car
bon
filte
r for
rem
oval
of
resi
dual
H2O
2 (o
ptio
nal)
casc
ade
pipi
ng(s
uppl
y an
d di
scha
rge)
:-
2 x
50 m
dos
age
and
stor
age
coag
ulan
t (F
e)
- on
gro
und
leve
l-
30 m
3 do
sage
and
sto
rage
H2O
2 -
on g
roun
d le
vel
- 30
m3
oper
atio
ns b
uild
ing
- e-
inst
alla
tion
- co
mpr
esso
r ins
talla
tion
on li
ne
mea
sure
men
tTo
tal s
urfa
ce:
- 1,
400
m2 ,
incl
. saf
ety
zone
for H
2O2
stor
age
(400
m2 )
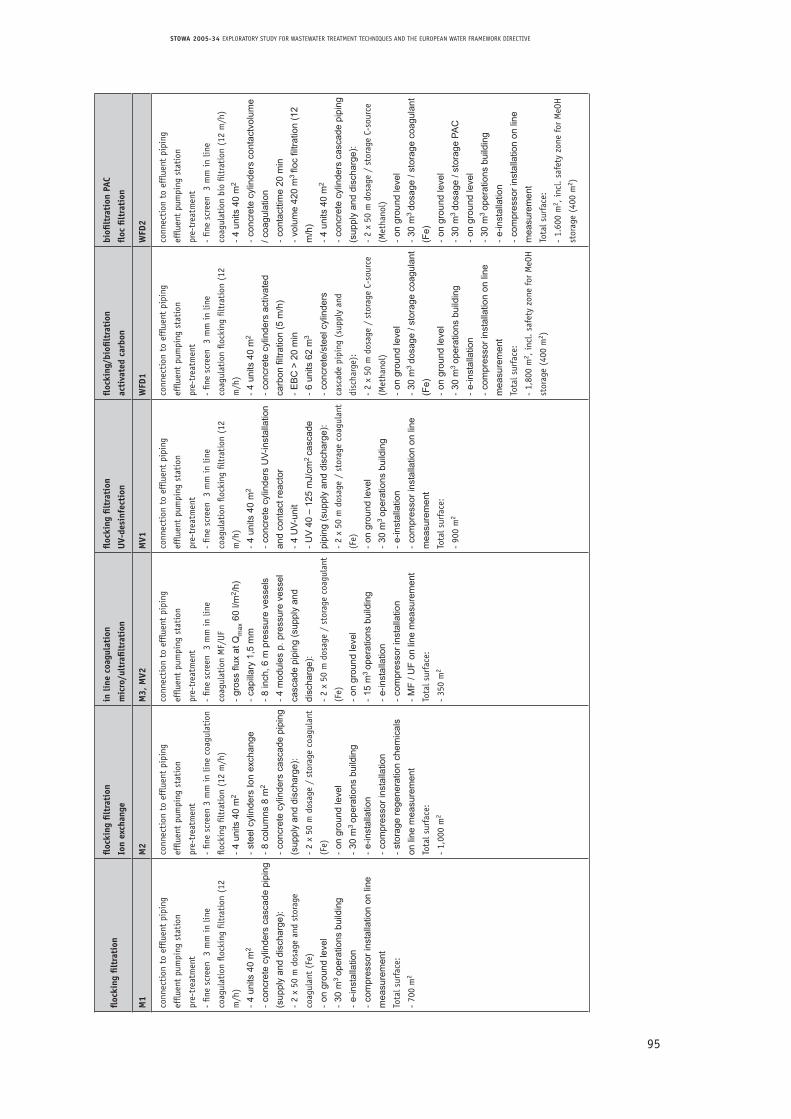
95
STOWA 2005-34 EXPLORATORY STUDY FOR WASTEWATER TREATMENT TECHNIQUES AND THE EUROPEAN WATER FRAMEWORK DIRECTIVE
floc
king
filt
rati
onfl
ocki
ng fi
ltra
tion
Ion
exch
ange
in li
ne c
oagu
lati
on
mic
ro/u
ltra
filtr
atio
n
floc
king
filt
rati
on
UV-
desi
nfec
tion
floc
king
/bio
filtr
atio
n
acti
vate
d ca
rbon
biofi
ltra
tion
PAC
floc
filt
rati
on
M1
M2
M3,
MV2
MV1
WFD
1W
FD2
conn
ecti
on t
o ef
fluen
t pi
ping
efflu
ent
pum
ping
sta
tion
pre-
trea
tmen
t
- fin
e sc
reen
3
mm
in li
ne
coag
ulat
ion
flock
ing
filtr
atio
n (1
2
m/h
)
- 4
units
40
m2
- co
ncre
te c
ylin
ders
cas
cade
pip
ing
(sup
ply
and
disc
harg
e):
- 2
x 50
m d
osag
e an
d st
orag
e
coag
ulan
t (F
e)
- on
gro
und
leve
l-
30 m
3 op
erat
ions
bui
ldin
g-
e-in
stal
latio
n-
com
pres
sor i
nsta
llatio
n on
line
m
easu
rem
ent
Tota
l sur
face
:
- 70
0 m
2
conn
ecti
on t
o ef
fluen
t pi
ping
efflu
ent
pum
ping
sta
tion
pre-
trea
tmen
t
- fin
e sc
reen
3 m
m in
line
coa
gula
tion
flock
ing
filtr
atio
n (1
2 m
/h)
- 4
units
40
m2
- st
eel c
ylin
ders
Ion
exch
ange
- 8
colu
mns
8 m
2 -
conc
rete
cyl
inde
rs c
asca
de p
ipin
g (s
uppl
y an
d di
scha
rge)
:-
2 x
50 m
dos
age
/ st
orag
e co
agul
ant
(Fe)
- on
gro
und
leve
l-
30 m
3 op
erat
ions
bui
ldin
g-
e-in
stal
latio
n-
com
pres
sor i
nsta
llatio
n-
stor
age
rege
nera
tion
chem
ical
s on
line
mea
sure
men
t To
tal s
urfa
ce:
- 1,
000
m2
conn
ecti
on t
o ef
fluen
t pi
ping
efflu
ent
pum
ping
sta
tion
pre-
trea
tmen
t
- fin
e sc
reen
3
mm
in li
ne
coag
ulat
ion
MF/
UF
- gr
oss
flux
at Q
max
60
l/m2 /
h)-
capi
llary
1,5
mm
- 8
inch
, 6 m
pre
ssur
e ve
ssel
s-
4 m
odul
es p
. pre
ssur
e ve
ssel
ca
scad
e pi
ping
(sup
ply
and
disc
harg
e):
- 2
x 50
m d
osag
e /
stor
age
coag
ulan
t
(Fe)
- on
gro
und
leve
l-
15 m
3 op
erat
ions
bui
ldin
g-
e-in
stal
latio
n-
com
pres
sor i
nsta
llatio
n-
MF
/ UF
on li
ne m
easu
rem
ent
Tota
l sur
face
:
- 35
0 m
2
conn
ecti
on t
o ef
fluen
t pi
ping
efflu
ent
pum
ping
sta
tion
pre-
trea
tmen
t
- fin
e sc
reen
3
mm
in li
ne
coag
ulat
ion
flock
ing
filtr
atio
n (1
2
m/h
)
- 4
units
40
m2
- co
ncre
te c
ylin
ders
UV-
inst
alla
tion
and
cont
act r
eact
or-
4 U
V-un
it-
UV
40
– 12
5 m
J/cm
2 ca
scad
e pi
ping
(sup
ply
and
disc
harg
e):
- 2
x 50
m d
osag
e /
stor
age
coag
ulan
t
(Fe)
- on
gro
und
leve
l-
30 m
3 op
erat
ions
bui
ldin
g -
e-in
stal
latio
n-
com
pres
sor i
nsta
llatio
n on
line
m
easu
rem
ent
Tota
l sur
face
:
- 90
0 m
2
conn
ecti
on t
o ef
fluen
t pi
ping
efflu
ent
pum
ping
sta
tion
pre-
trea
tmen
t
- fin
e sc
reen
3
mm
in li
ne
coag
ulat
ion
flock
ing
filtr
atio
n (1
2
m/h
)
- 4
units
40
m2
- co
ncre
te c
ylin
ders
act
ivat
ed
carb
on fi
ltrat
ion
(5 m
/h)
- E
BC
> 2
0 m
in-
6 un
its 6
2 m
3
- co
ncre
te/s
teel
cyl
inde
rsca
scad
e pi
ping
(su
pply
and
disc
harg
e):
- 2
x 50
m d
osag
e /
stor
age
C-so
urce
(Met
hano
l)
- on
gro
und
leve
l-
30 m
3 do
sage
/ st
orag
e co
agul
ant
(Fe)
-
on g
roun
d le
vel
- 30
m3
oper
atio
ns b
uild
ing
- e-
inst
alla
tion
- co
mpr
esso
r ins
talla
tion
on li
ne
mea
sure
men
t To
tal s
urfa
ce:
- 1,
800
m2 ,
incl
. sa
fety
zon
e fo
r M
eOH
stor
age
(400
m2 )
conn
ecti
on t
o ef
fluen
t pi
ping
efflu
ent
pum
ping
sta
tion
pre-
trea
tmen
t
- fin
e sc
reen
3
mm
in li
ne
coag
ulat
ion
bio
filtr
atio
n (1
2 m
/h)
- 4
units
40
m2
- co
ncre
te c
ylin
ders
con
tact
volu
me
/ coa
gula
tion
- co
ntac
ttim
e 20
min
- vo
lum
e 42
0 m
3 flo
c fil
tratio
n (1
2 m
/h)
- 4
units
40
m2
- co
ncre
te c
ylin
ders
cas
cade
pip
ing
(sup
ply
and
disc
harg
e):
- 2
x 50
m d
osag
e /
stor
age
C-so
urce
(Met
hano
l)
- on
gro
und
leve
l-
30 m
3 do
sage
/ st
orag
e co
agul
ant
(Fe)
-
on g
roun
d le
vel
- 30
m3
dosa
ge /
stor
age
PAC
- on
gro
und
leve
l-
30 m
3 op
erat
ions
bui
ldin
g-
e-in
stal
latio
n-
com
pres
sor i
nsta
llatio
n on
line
m
easu
rem
ent
Tota
l sur
face
:
- 1.
600
m2 ,
incl
. sa
fety
zon
e fo
r M
eOH
stor
age
(400
m2 )

96
STOWA 2005-34 EXPLORATORY STUDY FOR WASTEWATER TREATMENT TECHNIQUES AND THE EUROPEAN WATER FRAMEWORK DIRECTIVE