810415_Noordegraaf, Ewoud Marinus.pdf
132
GL YCOSAMINOGL YCANS AND THE HAEMOPOI ETIC MICROENVIRONMENT PROEFSCHRIFT TER VERKRIJGING VAN DE GRAAD VAN DOCTOR IN DE GENEESKUNDE AAN DE ERASMUS UNIVERSITEIT ROTTERDAM OP GEZAG VAN DE RECTOR MAGNIFICUS PROF. DR. J. SPERNA WEILAND EN VOLGENS BESLUIT VAN HET COLLEGE VAN DEKANEN. DE OPEN BARE VERDEDIGING ZAL PLAATSVINDEN OP WOENSDAG 15 APRIL 1981 DES NAMIDDAGS TE 2.00 UUR PRECIES DOOR EWOUD MARl NUS NOORDEGRAAF GEBOREN TE WOERDEN 1981 DRUKKERIJ J.H. PASMANS B.V .• "s-GRAVENHAGE
description
honda
Transcript of 810415_Noordegraaf, Ewoud Marinus.pdf
GL YCOSAMINOGL YCANS AND THE
HAEMOPOI ETIC MICROENVIRONMENT
PROEFSCHRIFT TER VERKRIJGING VAN DE GRAAD VAN DOCTOR IN DE
GENEESKUNDE AAN DE ERASMUS UNIVERSITEIT ROTTERDAM
OP GEZAG VAN DE RECTOR MAGNIFICUS PROF. DR. J. SPERNA WEILAND
EN VOLGENS BESLUIT VAN HET COLLEGE VAN DEKANEN. DE OPEN BARE VERDEDIGING ZAL PLAATSVINDEN OP
WOENSDAG 15 APRIL 1981 DES NAMIDDAGS TE 2.00 UUR PRECIES
DOOR
EWOUD MARl NUS NOORDEGRAAF
GEBOREN TE WOERDEN
1981 DRUKKERIJ J.H. PASMANS B.V .• "s-GRAVENHAGE

PROMOTOR
CO-REFERENTEN
PROF. DR. 0. VOS
PROF. DR. D.W. VAN BEKKUM PROF. DR. H.J. VANDER MOLEN
Dit proefschrift werd bewerkt binnen de vakgroep Celbiologie en Genetica van de Erasmus Universiteit te Rotterdam.
Aile vruchtbare ideeen zijn ontsproten uit de geest van non--conformisten, voor wie het bekende nog altijd onbekend was, . en die vaak teruggingen tot op het begin waar anderen, zeker van hun weg, aan voorbij 1 iepen.
Immanuel Velikovsky
AanAstrid


I 1·1 1-2 1·2·1 1-2·2 1-3 1-3-1 1-3-2 1-3-3 1-3-4 1·3·5 1·3·6 1·3-7 1-4
II 11·1 11·2 11·2-1 11·2-2 11·2-3 11-3 11-3·1 11-3·2 11·3·3
Ill
111-1
Introduction General introduction Haemopoiesis Introduction Microenvironments Glycosaminoglycans Introduction Nomenclature
CONTENTS
Chemical and physical properties Biological properties Isolation from biological specimens Fractionation·methods Identification and quantification methods Outline of the presented studies
Genera I methods Mice Haematological determinations Incidence of CFU-£ and CFU·C Incidence of erythroblasts Haematocrit determinations Glycosaminoglycan determinations Collection and preparation of tissues Isolation of g!ycosaminog!ycans Analytical methods
Normal amounts of glycosaminoglycans in spleen and bone marrow; changes in the amount of splenic glycosaminoglycans during 24 hours Introduction
111·2 Materials and methods 111-3 Results 111·3·1 Bonemarrow 111-3·2 Spleen 111~4 Discussion
7 7 8 8
11 21 21 22 23 29 32 33 34 36
38 38 38 38 39 39 39 39 40 40
44 44 45 46 46 46 48

4
IV
IV-1 IV-2 IV-3 IV-3-1
IV-3-2
IV-3-3
IV-3-4
IV-4
v
V-1 V-2 V-3 V-4
Content of glycosaminoglycans in bone marrow and spleen under anaemic and polycythaemic conditions Introduction Materials and methods Results Spleen. Changes in glycosaminoglycan amount and haema~ tological parameters following induction of anaemia. Spleen. Changes in g\ycosaminoglycan amount and haema~ tological parameters during 7 days after induction of polycythaemia Bone marrow. Changes in glycosaminoglycan amount and haematological parameters 5 days after induction of anaemia Bone marrow. Changes in glycosaminoglycan amount and haematological parameters 7 days after induction of polycythaemia Discussion
Glycosaminoglycan levels in relation to phenylhydrazine-induced erythropoiesis in the mouse liver Introduction Materials and methods Results Discussion
VI Correlation between glycosaminoglycan levels and haemopoietic activity in the spleen and bone marrow after adrenalectomy, castration and hormone injections
Vl-1 Vl-2 Vl-3 Vl-4
Introduction Materials and methods Results Discussion
VII Changes in murine splenic and bone marrow glycosaminoglycans during post irradiation haemopoietic regeneration
Vll-1 Vll-2 Vll-3 Vll-4
Introduction Materials and methods Results Discussion
51 51 51 52
52
54
55
55 58
60 60 60 61 61
64 64 66 67 68
70 70 71 71 75

5
VIII Glycosaminoglycan levels in spleen of congenital anaemic mice bearing the SJi or wv locus 77
Vlll-1 Introduction 77 Vlll-2 Materials and methods 78 Vlll-3 Results 79 Vlll-4 Discussion 79
IX General discussion and conclusions 85
Summary Samenvatting References Nawoord Curriculum vitae
92 95 99
127 129
6
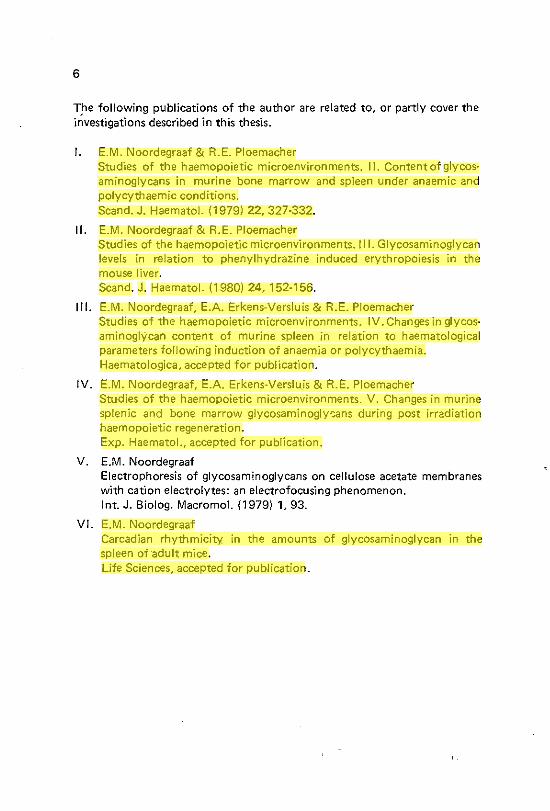
The following publications of the author are related to, or partly cover the irlvestigations described in this thesis.
I. E.M. Noordegraaf & R.E. Ploemacher Studies of the haemopoietic microenvironments. II. Content of glycos~ aminoglycans in murine bone marrow and spleen under anaemic and polycythaemic conditions. Scand. J. Haematol. (1979) 22, 327-332.
II. E.M. Noordegraaf & R.E. Ploemacher Studies of the haemopoietic microenvironments. Ill. Glycosaminoglycan levels in relation to phenylhydrazine induced erythropoiesis in the mouse liver. Scand. J. Haematol. (1980) 24,152-156.
Ill. E.M. Noordegraaf, E.A. Erkens-Versluis & R.E. Ploemacher Studies of the haemopoietic microenvironments. IV. Changes in glycosaminoglYcan content of murine spleen in relation to haematological parameters following induction of anaemia or polycythaemia. Haematologica, accepted for publication.
IV. E.M. Noordegraaf, E.A. Erkens-Verslu.is & R.E. Ploemacher Studies of the haemopoietic microenvironments. V. Changes in murine splenic and bone marrow glycosaminog!y(:ans during post irradiation haemopoietic regeneration. Exp. Haematol., accepted for publication.
V. E.M. Noordegraaf Electrophoresis of glycosaminoglycans on cellulose acetate membranes with cation electrolytes: an electrofocusing phenomenon. Int. J. Biolog. Macromol. (1979) 1, 93.
VI. E.M. Noordegraaf Carcadian rhythmicity, in the amounts of glycosaminoglycan in the spleen of ·adult mice. Life Sciences, accepted for publication.
HYPERLINK "/pubmed/472656"Studies of the haemopoietic microenvironment. II. Content of glycosaminoglycans in murine bone marrow and spleen under anaemic and polycythaemic conditions. Noordegraaf EM, Ploemacher RE. Scand J Haematol. 1979 Apr 4;22(4):327-32. PMID: 472656 [PubMed - indexed for MEDLINE]
HYPERLINK "/pubmed/7375815"Studies of the haemopoietic microenvironments. III. Glycosaminoglycan levels in relation to phenylhydrazine-induced erythropoiesis in the mouse liver. Noordegraaf EM, Ploemacher RE. Scand J Haematol. 1980 Feb;24(2):152-6. PMID: 7375815 [PubMed - indexed for MEDLINE]
HYPERLINK "/pubmed/6797876"Studies of the haemopoietic microenvironments. IV. Changes in glycosaminoglycan content of murine spleen in relation to haematological parameters following induction of anaemia or polycythaemia. Nordegraaf EM, Erkens-Versluis M, Ploemacher RE. Haematologica. 1981 Aug;66(4):409-18. No abstract available. PMID: 6797876 [PubMed - indexed for MEDLINE]
HYPERLINK "/pubmed/7238653"Studies of the hemopoietic microenvironments. V. Changes in murine splenic and bone marrow glycosaminoglycans during post irradiation hemopoietic regeneration. Noordegraaf EM, Erkens-Versluis EA, Ploemacher RE. Exp Hematol. 1981 Apr;9(4):326-31. PMID: 7238653 [PubMed - indexed for MEDLINE]
HYPERLINK "/pubmed/7242265"Circadian rhythmicity in the amounts of glycosaminoglycans in the spleen of adult mice. Noordegraaf EM. Life Sci. 1981 May 4;28(18):2045-8. No abstract available. PMID: 7242265 [PubMed - indexed for MEDLINE]
7
INTRODUCTION
1~1 General introduction
Mature blood cells in mammals have a limited life span. Because these cells are usually unable to multiply in th~ blood stream, a continuous production of new cells is needed. This production, located in specific organs, includes proliferation, differentiation and maturation of cells. In order to guarantee adequate production of the different kinds of blood cells in response to the demands of the organism a continuous regulation of cell production is required. Such a regulation is considered to be effected by two categories of factors, namely (1) humoral factors, and (2) microenvironmental factors. Some humoral factors have been isolated and characterised (for instance the hormone erythropoietin).
The nature of the microenvironmental factors has not been defined up to now. Morphologically, the haemopoietic microenvironment consists of a microvascular and a connective tissue compartment, and neural elements (McCuskey et al., 1972). The connective tissue compartment includes in addition to different kinds of stromal cells {e.g. fibroblasts, macrophages, etc.) and fibers, the ground substance, in which the cells and fibers are embedded. The chemical composition of the ground substance in general has been shown to influence the proliferation, differentiation and matura~ tion of cells that interface with it (Lippman, 1964; Oarzynkiewicz & Balazs, 1971; Pessac & Defendi, 1972). Glycosaminoglycans form an important part of the stromal ground substance,and it has been suggested that glycosamino~ glycans r'night represent an important haemopoietic microenvironmental factor (McCuskey et al., 1972).
Ploemacher et al. (1978) demonstrated that some glycosaminoglycans could affect the in vitro proliferation of red blood cell precursors. Further~ more, it has been described by McCuskey et al. (1972, 1973) and Schrock et al. (1973) that changes in the activity of blood formation in vivo, under pathological or experimentally induced conditions, coincided with alterations in glycosafninoglycans concentrations.
These data form the starting point for the studies described in this thesis, which deals with the question of whether or not glycosaminoglycans are directly or indirectly involved in the regulation of blood cell production.
8
1-2 Haemopoiesis
1-2-1 Introduction
The blood of vertebrates consists of plasma and suspended cellular corpuscles. These corpuscles can be either red cells (erythrocytes), colorless cells (leukocytes) or (in mammals) cell fragments (platelets). The group of leukocytes can be divided into lymphocytes, monocytes and granulocytes. The latter can be split into neutrophilic, eosinophilic and basophilic granulocytes. Most of the cells present in the blood are not capable tO divide and since their lifespan is short, the cells are continuously replenished by new cells produced in blood-forming organs. In order to meet the demands for blood
cells under various conditions the maintenance of stable levels of these blood cells requires a very sensitive regulation of cell production.
The production of each kind of mature blood cell is the result of se· quential mitotic divisions and differentiation of functionally less specialized, immature cells, in specific organs. These cells, generating a definite kind of mature celts are termed "poietic cells", and consequently erythropoietic·, granulopoietic cells etc. can be distinguished. All poietic cells however, are derived from a common cell class which consists of the so·called pluripotent haemopoietic stem cells (Becker et al., 1963; Ford et al., 1966). Stem cells are capable of extensive self·replication, resulting in the formation of new stem cells (Catfrey-Tyler & Everett, 1966; Metcalf & Moore, 1971). On the other hand, they are capable of differentiation into cells which are limited to a specific pathway of haemopoiesis (e.g. erythropoiesis, granulopoiesis, etc.). The process leading to the formation of such progenitor cells, which are restricted to differentiation on a specific differential pathway (Moore & Metcalf, 1970) and are on the base of each line of haemopoietic differentia· tion, is called "commitment". Proliferation of committed cells leads to the formation of morphologically identifiable cells (called "blasts", e.g. erythroblasts, lymphoblasts, etc.). During further proliferation and maturation these cells are kept at the site of formation in the haemopoietic tissues for a certain period and are ultimately released into the blood stream as mature blood cells. Under normal conditions, a few haemopoietic stem cells and early progenitor cells may circulate in the blood, whereas more mature cells are limited to the haemopoietic organs, which, in the adult mouse, are the spleen and the bone marrow.
Detection and enumeration of haemopoietic stem cells and progenitor cells are hampered by their lack of morphological identification marks and the fact that these cells within the haemopoietic organs have no clearly defined specific location. Consequently, functional assays are required in order to study and determine these cell populations. Haemopoietic stem
9
cells can be identified in the mouse by their ability to generate colonies of cells in the spleen and bone marrow of irradiated syngeneic recipients (Till & McCulloch, 1961 ). Accordingly, these cells have been called colony forming units (in the) spleen: CFU~S. When haemopoietic cells are cultured in vitro, using a semisolid culture system, colonies of cells (which are of clonal nature) may develop, which (dependent on kind and amount of specific humoral factors added, period of culturing, etc.) contain cells which might represent haemopoietic stem cells (Dicke et al., 1971), or one or more lines of differentiation. These latter two types of colonies may be: a) mixed type colonies, containing several lines of differentiation, indicating
that these colonies are derived from a multipotential haemopoietic cell (Metcalf et al., 1979).
b) pure colonies, containing one line of differentiation, indicating that such a colony is derived from a committed haemopoietic cell. When the line of differentiation is erythroid, these cells are designated as Colony For~ ming Unit - Erythroid (CFU-E). whereas "CFU-C" indicates Colony Forming ,Units commited to the granulocytic/macrophage cell line. The afore mentioned regulation of the total process of proliferation and
commitment of stem cells, and proliferation and differentiation of progeni~ tor cells in response to variable body demands is considered to be effected by (1} humoral factors, and (2) microenvironmental. factors.
Humoral factors influencing haemopoiesis are numerous and a distinction should be made between nutritional factors (Kendi et al., 1963; Bell et al., 1976) including vitamins (Herbert, 1970). hormones (like adrenal corticosteroids, sex hormones and the growth hormone) (see chapter V\·1) and specific haemopoietic regulators.
The existence of a specific humoral factor, regulating erythropoiesis was first proposed by Carnot and Deflandre (1906) and has been initially established by Stohl man etal. (1954) and Hodgson and Toha (1954). This factor termed erythropoietin, has been thoroughly investigated with regard to its biochemical nature, site of production, mechanism of action etc. (Fisher, 1972). It has been identified as a terminal sialic acid containing glycoprotein of molecular weight 60,000-70,000 (Goldwasser & Kung, 1968; Lukowsky & Painter, 1968). and is produced mainly in the kidney in response to a hypoxic stimulus (Mirand & Prentice, 1957). Extrarenal erythropoietin pro~ duction has also been described (Peschle et al., 1976; Naughton et al., 1977; Erslev et al., 1980). The major target cell for erythropoietin is the erythropoietic progenitor cell (AI pen et al., 1962; Schooley, 1966; Lajtha et al., 1971; lscove, 1977) in which the synthesis of specific m-RNA (Gross & Goldwasser, 1969), DNA and haemoglobin are induced (Stahlman, 1970; Hegemann & DOrmer, 1976). Factors inhibiting erythropoietin activity have been described by Krzymowski and Krzymowska (1962).
10
Several candidate hormones in the regulation of granulopoiesis have been described. The best defined of these is the Colony Stimulating Factor (CSF) (Metcalf & Moore, 1962; Van den Engh, 1974; Hayes & Craddock, 1978). This factor which is indispensable for in vitro culturing of murine CFU~C (Metcalf & Moore, 1971). can be present in various mouse body fluids and can be produced in vitro by cells from different tissues (Stanley et al., 1968, 1971; Chan & Metcalf, 1972). and established cell lines (Austin et al., 1971; Burgess et al., 1977). CSF differs in molecular weight, dependent on its origin. Figures ranging from 23,000 dalton (Burgess et al., 1977). to 145,000 dalton (cf. DiPersio et al., 1978) are described. Its structure is of glycopro· tein nature (Stanley et al., 1975; Stanley & Heard, 1977). The functional properties contributed to CSF are induction of proliferation and differentiation of granulocytic-macrophagic precursor cells, and induction of mes~ senger RNA synthesis in maturing granulopoietic cells (Brennan et at., 1980). It has to be stressed that no decisive evidence exists that CSF is the hormone regulating granulopoiesis in vivo although certain studies do suggest a relation between CSF and granulopoietic regulation (Morley et al .. 1971; Que· senberry et al., 1972). Several humoral inhibitors of granulopoiesis have been described (Vogler & Winton, 1975) but the specificity of these factors is questionable (Broxmeyer et al., 1978). In addition to these humoral fac· tors involved in erythropoiesis and granulopoiesis also factors regulating thrombopoiesis (thrombopoietin) (Odell et al., 1961; McDonald, 1976; Nakeff & Daniels·McQueen, 1976) and lymphopoiesis (Goldstein et al., 1971; Van Bekkum, 1975) have been reported. The specificity of these hormones, however, is not fully established.
Several reports described the existence of stem cell proliferation regulators (Lord et al., 1979; Frindel et al., 1980) and it has been proposed that stem cell proliferation is controlled by an appropriate balance of stimulatory and inhibitory factors (Wright et al., 1979, 1980; Wright & Lord, 1979). The biochemical nature and the origin of these substances are not yet elucidated. An in vitro defined factor, which may act to stimulate cells programmed for erythropoiesis before they acquire a sensitivity for erythropoie· tin has been described and was called Burst Promoting Activity (SPA). SPA has been found in leukocyte conditioned medium (Aye, 1977; Wage· maker, 1978) mitogen stimulated spleen cell conditioned medium (lscove, 1978) and in serum (lscove & Guilbert, 1978). There are indications that BPA plays an in vivo role in erythropoiesis (Pioemacher et al., 1979; Wage· maker, 1980). Since some of the mentioned factors are most likely produced by cells in the neighbourhOod of their target cells (e.g. the haemopoietic cells) they may also be regarded as factors belonging to the haemopoietic microenvironments. These microenvironments will be described in the following paragraph.

11
1~2-2 Microenvironments
The occurrence of stem cells in the blood, in the presence of humoral regulators would, theoretically, permit seeding of haemoPoietic cells and thus haemopoiesis throughoutthe body. However, as previously described haemopoiesis is normally restricted to certain organs (e.g. the bone marrow and the spleen in the mouse). This fact suggests the existence of microenvironments providing conditions necessary for haemopoiesis in these organs. The term microenvironment may in general be applied to a specialized region which differs functionally from adjacent areas within one organ or from regions in other organs. Such regions are believed to provide conditions, which determine whether certain cells can express their genetic potential to function as specialized cells. It is not clear to what extent haemopoietic microenvironments are involved in the different events of haemopoiesis, like lodging of stem cells, commitment of stem cells to a specific pathway of differentiation, the induction of proliferation of stem cells and committed cells and the release of stem cells, progenitor cells and mature cells. Whether the microenvironments provide active stimuli or merely allow or sustain one or more haemopoietic events is also questionable. Evidence for the existence of haemopoietic microenvironments and their involvement in the above mentioned events in haemopoiesis are abundant.
Trentin (1970) introduced the term Hemopoietic Inductive Microenvironment, which was devised to describe the microenvironmental influence on the commitment of stem cells. This in contrast to stochastic models of stem cell development as previously assumed by Till et al. (1964) and Vogel et al. (1968, 1969). Wolf (1974) postulated that the direction of differentiation to be taken by a stem cell, would be influenced by its microenvironment. Indications in favour of this proposition were obtained from the following observations. As previously described, bone marrow cells intravenously injected into irradiated syngeneic recipients produce colonies of cells in the spleen and in the bone marrow of such recipients. These colonies, which are clonal in nature (Becker et al., 1963; Wu et al., 1967) and derive from pluripotential haemopoietic stem cells are predominantly committed to a single line of differentiation for the first 8 to 10 days, e.g. erythrocytic, granulocytic or megakaryocytic (Becker et al., 1963; Curry et al., 1967). Characteristically, more immature cells are observed at the periphery of the colohy surrounding the centrally located more differentiated cells (Curry & Trentin, 1967). The expanding pure colonies become mixed type colonies at later stages of their development, probably because they enter another type of microenvironment (Trentin, 1970, 1971). Pure splenic colonies of any type have been demonstrated to contain stem cells, which upon retransplantation are able to produce colonies of all types (Lewis &

12
Trobaugh, 1964; Juraskova & Tkadlecek, 1965). The existence of definite areas reserved for a specific line of haemopoiesis is suggested by observations that granulocytic colonies are usually found along the subcapsular margins and the trabeculae-; erythroid colonies grow out from the subcapsular regions into the red pulp-, and megakaryocytic colonies are mainly present just beneath the capsule of the spleen (Curry & Trentin, 1967; Ploemacher, 1979). Furthermore, when colonies are induced in irradiated
mice which have low erythropoietin levels (effected by hypertransfusion) nests of andifferentiated but erythropoietin-sensitive celts develop instead of erythroid colonies (Schooley, 1964; Liron & Feldman, 1965; Curry et al., 1967). These colonies remain small and immature unless they are stimulated by injection of erythropoietin or by bleeding, but they do not become granuloid colonies (Curry et al., 1967). Another evidence for the existence of haemopoietic inductive microenvironments is the finding that in the murine spleen the number of erythroid colonies predominates over the number of gran uloid colonies (Curry et al., 1967), whereas in the bone marrow granuloid colonies predominate (Wolf & Trentin, 1968). Transplantation of IJ'{hole spleens subcutaneously does not alter the ratio of erythroid colonies versus granuloid colonies (Wolf & Trentin, 1968). This ratio may be slightly al· tered, however, by manipulation of the erythron of the acceptor mouse (Pioemacher et al., 1980). Also pieces of marrow stroma, transplanted into the spleen support haemopoiesis with an erythroid/granuloid colony ratio similar to that of bone marrow in situ. Single colonies growing across the junction of marrow and spleen stroma show abrupt transition of haemopoietic type, with erythropoiesis in spleen stroma and granulopoiesis in marrow stroma (Trentin et al., 1967; Wolf & Trentin, 1968; Moore, 1971). Furthermore, rat marrow cells injected into irradiated rats give almost only erythroid spleen colonies that grow much more slowly than mouse spleen colonies (E:G colony ratio= 490). Rat marrow cells injected into irradiated mice give both erythroid and gran uloid spleen colonies that grow as fast as mouse cell origin spleen colonies (E:G colony ratio= 3) (Rauchwerger et al., 1973). Also experiments in which genetically anaemic mice were used, demonstrated the existence of a haemopoietic microenvironment. Genetically anaemic SI/Sid mice (see chapter VIII) have normal stem cells and erythropoietin (Bernstein et al., 1968). They are not cured by marrow or spleen cell transfusion but they can be cured by subcutaneous transplantation of whole spleens from non-anaemic Jittermates. Genetically anaemic W/Wv mice have defective stem cells, and can be cured by bone marrow cell transfusion from SI/Sid mice (Bernstein et al., 1968). Parabiosis of anaemic SI/Sid mice with anaemic W/Wv mice cures both partners. If separated after many months, W/Wv partners remain cured, but SI/SJd partners revert to anaemia (Tavassoli, 1975). These experiments showed that SI/Sid mice suffer from
13
a microenvironmenial defect, and that (in contrast to stem cells) the micro~ environment does not circulate. In addition to a somewhat abnormal ery· throid commitment also a strongly reduced proliferation of erythroid com· mitted cells can be observed in SI/Sid mice (Wolf, 1974). This and the findings of Ploemacher (1978) who studied ectopic erythropoiesis in the liver, indicate the existence of a conductive haemopoietic microenvironment, next to the inductive haemopoietic microenvironment, influencing later stages of haemopoiesis.
In vitro cloning techniques using semisolid culture systems demonstrated the ability of in vitro proliferation and differentiation of stem cells and progenitor cells upto the stage of mature blood cells. These processes are de~ pendent on the addition of humoral substances {such as erythropoietin in case of culturing erythropoietic cells and colony stimulating factor in case of culturing granulopoietic cells) and can be sustained for maximally 2-3 weeks. The maintenance of continuous haempoiesis in vitro including pi uripotential stem cell replication, commitment and haemopoietic differentia~ tion, however, could only be achieved by a system of continuous syngeneic marrow coculture (Dexter & Lajtha, 1976). In this system, murine bone marrow cells are inoculated into culture flasks and after 3 weeks when the numbers of nonadherent cells decline and a layer of adherent cells becomes established, fresh syngeneic marrow cells are added. At weekly intervals thereafter, the cultures are subjected to depopulation by removal of half the growth medium and suspended cells with addition of fresh medium (Allen & Dexter, 1976; Dexter & Lajtha, 1976; Moore & Dexter, 1978). When the cultures are subjected to shaking procedures and when erythropoietin is added, in addition to granulopoiesis and megakaryopoiesis which are already present, erythropoiesis occurs (Eliason et a1., 1980). According to this group of investigators the self-replication and multilineage commit~ ment of the pluripotential stem cell in this culture system is dependent on the microenvironment provided by a marrow-adherent cell population composed of macrophages, fibroblasts, epithelioid cells and giant lipid containing cells. Thus, also in vitro, the need of some kind of microenvironment is not excluded.
The ability of committed cells to proliferate and differentiate in vitro, without the presence of a haemopoietic microenvironment would not exclude a regulation of these events by a haemopoietic mircoenvironment in vivo. Likewise, in vivo selfreplication and commitment of pluripotential stem cells may, in addition to microenvironmental factors, be influenced by humoral regulators. In conclusion, evidence for the existence of haemopoietic microenvironments is abundant. Their presence in early events of haemopoiesis seems indispensable and a function of haemopoietic microenvironments in later stages of haemopoiesis is possible. The precise nature
14
of the haemopoietic microenvironment is not known at present but experi· mentation is indicative for the involvement of short range, non or slowly diffusible factors, which are produced by relatively radioresistant cells (Wolf, 1978b; Matioli & Rife, 1980).
McCuskey et al. ( 1972) proposed a concept to the effect that the haemo· poietic microenvironment is morphologically composed of: (1) a micro· vascular compartment, (2) a neural compartment and (3) a connective tissue compartment. Constituents and functional aspects of each of these com· partments· are described by McCuskey and Meineke (1977) and by Ploe· macher (1978), and will next be summarized.
1. The microvascular compartment
Several reports describe that the establishment of a sinusoidal microcircula· tion is a prerequisite for haemopoiesis (Knospe et al., 1966, 1968; Tavassoli & Crosby, 1968). This notion is confirmed by the observation that reestablish· ment of haemopoiesis after autotransplantation of marrow tissue fragments or high doses of local irradiation is preceded by the reconstitution of an extensive circulation (Tavassoli & Weiss, 1971; Maniatis et al., 1971 ). X-irradiation is known to cause damage to the haemopoietic cells as well as to the organ stroma (Maloney & Patt, 1972; Fried et al., 1973; Werts et al., 1977). The damage to the organ stroma can include damage to cen types associated with the microcirculation like sinusoidal lining reticular cells and endothelial cells. The latter cell type has been shown to be inhibited in cell replication after 1000 rad irradiation in vitro (de Gowin, 1976). However, whether such irradiation-induced sinusoidal destruction directly causes haemopoietic aplasia is questionable (Werts et al., 1972).
The involvement of the microcirculation in haemopoiesis is further suggested by reports describing a relation between the blood flow and the erythropoietic activity in the bone marrow. For example Bozzini et al. (1974) and Van Dijke (1967) described that erythropoietic stimulation coincided with increased blood flow in the bone marrow. Erythropoietic stimulation was induced by bleeding (Branemark, 1959) phenylhydrazine treatment (Djaldetti et al., 1975) or treatment with androgens (Horn & Price, 1972). It is not clear whether the increased blood flow originates from a vasoactive action of erythropoietin (Fisher et al., 1965) or via (a) metabolite(s) elabor· ated from erythropoietic tissue stimulated by erythropoietin (McCuskey & Meineke, 1977). Adenosine, prostaglandines E2 and F2a, histamine and bradykinin are known to represent vasoactive metabolites and are mentioned as possible candidates in microvascular regulation (McCuskey & Meineke, 1977). The nature of the role which the microvasculature plays in regulating
15
haemopoiesis is far from elucidated. The non-specific microvascular functions like the supply and removal of numerous substances, the regulation of tissue p02 and pH, and the tissue temperature regulation may theoretically provide conditions which permit haemopoiesis or may activily influence haemopoiesis. The hypothesis of McCuskey et al. ( 1972) describes a role of the microvasculature in regulating tissue p02 clnd pH, which in their turn might lead to the production of factors influencing cell division.
2. The neural companment
A relation between neural elements and haemopoiesis (including the release of mature blood cells) has among others been reported by Feldman et al. (1966). Eeckert and Di:icke (1972) and Paulo et al. (1973). Evidence for such a relation was supplied by findings that stimulation of lumbar sympathetic nerves in rats caused immediate release of reticulocytes (Webber et al., 1970) and stimulation of the hypothalamus resulted in changes in reticulocyte counts and red cell mass (Halvorsen, 1966). A direct or indirect relationship between nerve fibers and haemopoietic cellular elements have been suggested (Calvo, 1968; Calvo & Forteza-Vila, 1969, 1970). Indirectly, the nervous system could affect erythropoiesis by regulating circulating hor- · mone levels (erythropoietin, corticosteroids) (Halvorsen, 1966; Mirand et al., 1964), or by a vasomotor activity of neural elements (Paulo et al., 1973). Reilly and McCuskey (1976, 1977) suggested that subthreshold levels of neurotransmitter may modulate the sensitivity of the vascular walls in the mouse spleen to vasoactive substances, like those mentioned previously. Such a relation has been confirmed by studies of Grosset al. (1979).
3. The connective tissue companment
The connective tissue compartment can be divided in cellular elements and intercellular substances. Cellular elements which may be related to microenvironmental functions are extensively described by Ploemacher (1978) and include the following cell types: (a) reticular cells, (b) macrophages, (c) adherent stromal cells, (d) adipose cells. . Ad a. The supporting framework of the spleen and bone marrow consists among others of a network of cells intimately associated with reticulin. These cells can be distinguished from fibroblasts by the presence of numerous finger! ike cytoplasmic processes (Pictet et al., 1969). A direct involvement of these reticular cells in the regulation of haemopoiesis has been im-
16
plied from the morphological association of "apparent stem cells" and reticular cells in human fetuses (Chen & Weiss, 1975), in haemopoietic colonies (Trentin, 1978) and in Gelfoam sponge cultures (Daniels, 1980) and from comparable situations between a reticular like cell type (the so called interdigitating celts) determining the homing and detainment of T-!ymphocytes in lymphoid organs (Van Ewijk, 1977). The contractile properties of reticular cells (We"1ss & Chen, 1975) have been proposed to be associated with events of the release of T cells from the haemopoietic organs (Tavassoli, 1977).
Ad. b. Macrophages are known to display a large number of functions in addition to their phagocytic properties. Among these functions is the production of many regulatory substances (such as prostaglandins, colony stimulating factors, etc.) (Moore, 1976; Keller et al., 1976). Furthermore, macrophages are involved in immunological reactivity (Calderon et al., 1975; Lipsky et al., 1976), in the control of CFU-C proliferation (Kurland et al., 1977) and the regeneration of eyrthropoiesis. The close contact betweeJ"l erythrob!asts and macrophages in bone marrow {Bessis & Breton·Gorius, 1962), spleen {Orlic et al., 1965) and in ectopic erythropoiesis in the liver (Pioemacher & Van Soest, 1977a, 1977b) suggests an important role for macrophages in erythropoiesis. Whether this role is inductive {Ben·lshay & Yoffey, 1974; Curry & Trentin, 1967) or conductive (Pioemacher, 1978) in character is not clear.
Ad. c. In vitro culturing of adherent cells isolated from bone marrow, spleen, thymus and lymph nodes, led to the observation that some cells are able to
form in vitro colonies of fibroblasts {Friedenstein et al., 1970, 1974a, 1976; Wilson & O'Grady, 1976). Such cells (Colony Forming Units-Fibroblasts= CFU-F) have been considered to be in vitro representatives of the micro· environment since transplantation of these in vitro cloned fibroblasts under the kidney capsule produces haemopoietic foci with the characteristics of the organ from which the initial cells originated {Friedenstein et al., 1974). The exact relation between in vivo fibroblasts, CFU·F and haemopoietic cells is still unclear.
Ad. d. Increasing evidence is published about the importance of the presence of lipid containing cells in haemopoietic organs. Although fat has for a long time been regarded as a volume control mechanism, a direct effect of lipids on haemopoiesis has been proposed by several authors who regarded these substances as bioregulators of cell growth and proliferation {Holley et al., 1974; In bar & Schinitzky, 1974; Leder & Leder, 1975). Besides the importance of the presence of giant lipid containing cells in the feeder layer of the "Dexter system" {Allen & Dexter, 1976) both in vivo and in vitro studies
17
have supported the active role of fat cells and lipids in haemopoiesis (Bathija et al., 1978, 1979; Potter & Wright, 1980).
In summary, although the importance of specific stromal cellular elements in haemopoietic events has been emphasized in many publications (Golde et al., 1980; Daniels, 1980; Werts et al., 1980; Chertkov et al., 1980; Tavassoli, 1980) the mode of action, and the origin and the characteristics of the cells involved are not clear.
Intercellular ground substance
There are two main components of intercellular material in general, namely fibers and amorphous substances. Three types of fibers can be distinguished namely collagen, elastin, and reticulin. The amorphous material consists chiefly of fluid, which is bound by proteins, glycosaminoglycans (GAG) and complexes of these substances (Laurent, 1977). Also glycoproteins are present and especially the glycoprotein fibronectin should be mentioned, since it may play a major role in adhesion of cells to collagen (Ruoslahti & Engvall, -1980). Several studies indicated that the chemical composition of stroma in general may influence the proliferation, differentiation and maturation of cells that interfere with it (Grobstein, 1967; Slavkin et al., 1969; Darzynkiewicz & Balazs, 1971). The possibility that especially GAG constitute one of the factors involved in regulation of cell proliferation and differentiation in general, was suggested by studies concerning effects of GAG in tissue culture and from studies in which changes in GAG (amount or appearance) were related to specific cellular events. Lippman (1964) proposed a role for GAG bound to the cell surface in initiation and control of cell division. The author stated that a change in the cell surface GAG induced by depolymerization (via enzymatic action), by hormone action, or as a result of disease might cause a liberation of calcium, normally bound to GAG. This calcium might enter the cell and act as initiator of mitotic events. The observation that mitosis immediately after the fertilization of an ovum and the finishing of the meiotic division after ovulation are both accompanied by diminished amounts of cell surface GAG of the ovum, and the observation that mitoses in many tumors, marine eggs and intestinal mucosa could be inhibited by addition of different kinds of sulphated GAG are adduced by this author in support of her hypothesis (Lippman, 1968).
The importance of cell coat GAG is also stressed by Chiarugi (1976), Chiarugi and Vannucchi (1976) and Cappelletti et al. (1980). According to these authors especially one type of GAG, i.e. heparan sulphate, would constitute a control element in eukariotic cells by way of causing a fixation
18
of membrane proteins. Desquamation of the cell coat would allow the rearrangement of membrane proteins necessary for cell division. Fixation from outside (in which event also GAG mediated cell-cell" adhesion or celldish adhesion may be involved) would favour cellular qifferentiation. The authors stated that "the more a tissue is stable, compact and well differentiated, the more heparan sulphate the cells expose". In contrast, high hyaluronic acid (an unsulphated GAG) production would be characteristic of situations with high rates of cell proliferation and active cell migration (Pratt et al., 1 975;.Augusti-Tocco & Chiarugi, 1976).
The involvement of GAG in the regulation of cell proliferation and/or migration has also been suggested from studies on malignant transformation of cells. Partly, such studies confirm the hypothesis of Chiarugi and collegues, since for instance MC sarcoma cells in rats.showed increased hyaluronic acid amounts (and only small amounts of heparan sulphate) (Kuroda et al., 1 974) and also Rous sarcoma virus transformed chondrocytes display an increase in synthesis of hyaluronic acid (Okayama et al., 1977; Pacifici et al., 1 977; Mikuni-Takagaki & Toole, 1979, 1980). Other studies, however, though describing distinct changes in (mainly cell surface) GAG composition in malignant cell transformation, are not in agreement with this hypothesis (Yamamoto & Terayama, 1973; Dietrich et al., 1978; Glimelius et al .. 1978).
Since specific tissues display a specific GAG composition (Toledo & Dietrich, 1977), it may be suggested that also malignant transformation of different cell types are accompanied by tissue specific alterations in the GAG composition.
In addition to GAG associated with cell surfaces, GAG (except hyaluronic acid) can also be found in association with cell nuclei (Bhavanandan & Davidson, 1975; Stein et al., 1975; Fromme et al., 1976; Furukawa & Terayama, 1979). These GAG may also be involved in the control of cellular events, since (again with the exception of hyaluronic acid) GAG have been shown to induce changes in chromatin structure {De Po·merai et al., 1974; Saigo & Kinoshita, 1976) and to display a competitive inhibition of DNA polymerases (Schaffrath et al., 1976).
In contradiction to the above mentioned reports, some studies described a growth stimulating effect of chondroitin sulphate A in tissue cultures of Hela cells and chick aorta intima cells (Morrison et al., 1965) and a suppressive effect of hyaluronic acid on the stimulation of cultures of lymphocytes (Darzynkiewicz & Balazs, 1971). However, an involvement of GAG in cellular events in general is most likely and consequently it may be suggested that GAG could be involved in the regulation of haemopoietic events. The chemical composition of haemopoietic tissues has been studied by investigators who were mainly interested in the amounts of lipids present in the bone marrow (Jastrowitz, 1927; Huggins et al., 1940; Krause, 1943;

19
Dietz & Steinberg, 1951). Studies in this field focussed on the intercellular substances in the bone marrow, but reported also the presence of GAG and changes in the total amount of GAG after haematological disturbances (Carter etal., 1961;Carter & Jackson, 1962). These results from biochemical determinations were confirmed by histochemical observations of bone marrow (McCuskey et al., 1 972). Furthermore, the latter authors also studied GAG in the spleen and the changes in GAG amounts in haemopoietic organs in events of erythropoietic regeneration and suppression. They described that "early proliferating cells" (erythroid and granuloid) were enveloped by a coating of sulphated acid mucopolysaccharides (a synonym for sulphated GAG). This coating persisted on cells in later stages of granulopoiesis but not on cells in the later stages of erythropoiesis. The latter were enveloped with a coating of neutral mucopolysaccharides. The interstitium of the splenic red pulp in polycythaemic animals contained intensively stained sulphated GAG, whereas under normal conditions the stroma of the red pulp stained PAS positive which -according to these authors- indicated the presence of neutral mucopolysaccharides. Finally, they reported that mature circulating red blood cells were enveloped with a sulphated GAG coating.
From these observations.and from studies on changes in the microvascular system during erythropoietic regeneration and suppression in the spleen, McCuskey et al. proposed the following hypothesis: "Hypoxia of haemopoietic tissue (resulting from anaemia, irradiation, polycythaemia, disease, etc.) initiates a change in the composition of the mucopolysa·ccharides present in the organ. This results in a large increase in sulphated acid mucopolysaccharides. Such an environment favours mitotic activity of undifferentiated stem cells of both the erythroid and granuloid line. In the anaemic animal there is a concomitant release of erythropoietin from the hypoxic kidney that initiates vasodilatation and/or vasoproliferation in the spleen and bone marrow, resulting in increased blood flow and improved oxygenation. With the increase in p02 (and possibly a shift in pH) there is a shift in production of mucopolysaccharides towards neutral types. Such an environment is favourable for erythropoiesis and permits erythroid committed cells to differentiate and mature.
In the polycythaemic animal, blood flow and tissue p02 , do not return rapidly, since erythropoietin release is suppressed and thus the concentration of sulphated acid mucopolysaccharides remains elevated, an envirohment in which granuloid cells are capable of differentiating". Since the first publication presenting this hypothesis, further support has been obtained from several studies. One of these studies focussed on mice suffering from genetically determined macrocytic anaemia (McCuskey & Meineke, 1973). As described above, such anaemias are attributed to either a defective micro-
20
environment (in case of mice bearing the Sl locus) or defective stem cells (in case of W/Wv mice). Histochemical studies on spleens of SI/Sid mice revealed relatively high levels of sulphated GAG in the stroma of these spleens, which might represent the mentioned microenrivonmental defect. The undifferentiated haemopoietic cells present in the spleen of W/Wv mice appeared to have a defective coating of sulphated GAG according to these authors possibly preventing normal cell-cell interaction or accessibility to the action of erythropoietin, and repre'senting the stem cell defect. Thus, both types of genetically determined anaemias might be caused by a defect in GAG metabolism.
Schrock et al. (1973) described that biochemical analysis of the spleens of mice, 6 days after induction of polycythaemia revealed elevated levels of hyaluronic acid and chondroitin sulphates (an unsulphated and a sulphated acid GAG respectively). The coincidence of reduced erythropoietic activity and increased stromal sulphated GAG amounts was also observed in studies on allografts of bone marrow in the hamster cheek pouch chamber (McCus~ key et al., 1975) and after starvation (Tavassoli et al., 1976).
Also in favour of the hypothesis of McCuskey et al. is the finding of Ploemacher et al. (1978) who demonstrated that addition of different kinds of GAG to haemopoietic progenitor cell cultures caused marked changes in the colony forming ability of these cells dependent on the kind and the con~ centration of GAG used. These authors showed an enhancing effect of the erythrocytic colony numbers for chondroitin sulphates A and 8; a total in~ hibition of sensitivity of CFU~E to erythropoietin by relative high concen~ tration of chondroitin sulphates A and C (40 11g/ml) and slightly enhanced granulocytic colony formation by chondroitin sulphates A and C. Further~ more they described that these effects were not dependent on the concen~ tration of Ca ++ present, and were not evoked by metabolites of the sub~ stances used. However, these results could only be obtained by the use of GAG provided by Dr. Mathews (Chicago). Commercially available GAG (Sigma, St. Louis and Seilo;agaku, Tokyo) were inactive with regard to in vitro haemopoiesis (Pioemacher, 1979).
In addition to other literature about changes in GAG composition of tumors, Seno et al. (1974) described the GAG pattern in the spleen of mice infected with Friend's virus, as well as that in the normal mouse spleen. The GAG of the leukemic mouse spleens were found to be different from those of normal mice in the following respects: (1) the content of hyaluronic acid and heparan sulphate is higher, and (2) dermatan sulphate is absent or present in only a trace amount. Due to the marked increase in the dry weight of leukemic spleens, the concentration of total GAG was decreased with a factor 2~3. The low con~ centrations in sulphated GAG observed in leukemic spleens would represent
21
a microenvironmental reaction to the virus infection, favouring erythroid differentiation (which is hampered by an intrinsic defect in the cells). Another hypothesis for a possible role of GAG in haemopoietic events was proposed by Vannucchi et al. (1980). Results from their studies in which GAG were determined biochemically on nor.mal and leukemic leukocytes and on bone marrow cells indicated that most likely GAG are not present on the surface of bone marrow cells. However, it is suggested that a chondroitin sulphate precursor is synthesized in the granules of immature granulocytic cells, which is refined when maturation is accomplished and exposed at the cell surface when the entry in the blood stream is triggered. This suggestion is confirmed by the finding of high 35S-sulphate uptake in immature granulocytes (Payne and Ackerman, 1977).
In general this group of investigators assumes (as already mentioned for GAG in non-haemopoietic events) that heparan sulphate and chondroitin sulphate 8 on cell surfaces are involved in haemopoietic cell adhesion and recognition while chondroitin sulphate A/C and hyaluronic acid on the cell surfaces of haemopoietic cells are related to cellular growth and cell motility (Chiarugi & Dietrich, 1979). This model, however, is not suitable to explain the release of mature erythrocytes from the haemopoietic tissues into the blood stream, since mature erythrocytes lack a GAG coating. Thus, although numerous studies indicate a role for GAG in haemopoiesis, no clearcut data are available about the specific GAG involved, their origin, their location, their mode of action or the nature of their target cells. With regard to the location of GAG it must be mentioned that intracellular GAG is most likely not related to haemopoietic events, since excessive intracellular GAG storage as found in diseases like mucopolysaccharidosis has never been reported to be accompanied by deviating haemopoiesis. In order to further investigate the possible relation between GAG and haemopoiesis, and to add data on specific aspects of this relation to the existing knowledge, I studied some of these aspects.
1-3 Glycosaminoglycans
1·3·1 Introduction
Wharton described in 1656 the existence of substances which could be extracted from umbilical cords. In his description of various parts of the human body, he referred to the umbilical cord material and its gelatinous characteristics (Wharton, 1656). The first biochemical studies concerning such substances, revealing macromolecular structures in which carbohydrate and protein co-existed, date back to the second part of the 19th century
22
(Eichwald, 1865; Krukenberg, 1884; Schmiedeberg, 1891). According to their chemical properties and abundant occurrence in mucus, these sub~ stances have been called mucoproteins when the major part of the molecule was of protein nature, and mucopolysaccharides when the carbohydrate element of the molecule formed the major part (Meyer, 1938).
Although the carbohydrate chains in mucopolysaccharides are covalently linked with proteins, much attention has been paid to the individual carbo~ hydrates, without implication of the protein part. Studies on these carbo~ hydrates have led to .a classification based on the kind of monosaccharides present, and their degree of sulphatation (chapter 1·3·2). Based on these criteria, five different groups of mucopolysaccharides could be distinguished. Because biochemical studies on mucopolysaccharides are mostly focussed on the carbohydrate chains, the name glycosaminoglycan (GAG) has been introduced, referring to the individual groups of pure carbohydrates. The name proteoglycans is used nowadays for the complex of glycosamino~ glycans and protein (Fig. 3}. The name glycan indicates monosaccharides (glyc·) forming a polymer (·an).
Although specific functions can be attributed to certain GAG (e.g. heparin . blood anticoagulation), knowledge is lacking about the general action of GAG in ground substances and on cell surfaces. A possible action of GAG components in events of cell differentiation and proliferation has been proposed by several authors (Lippman, 1964; Kosher & Searls, 1972; Hoglund, 1976), but no uniform data are available up to now.
1·3·2 Nomenclature
As already has been explained, macromolecules in which proteins and carbo· hydrates co.-exist were formerly called either mucoproteins or muco·polysaccharides. More or less parallel to these conceptions are the modern names glycoproteins and proteogly~ns. The classification criteria for glycoproteins and proteoglycans however, are not primarily based on the relation between the amount of carbot)ydrate versus the amount of protein present in one molecule, but comprise the following points: 1. The carbohydrate chain in glycoproteins is usually an oligosaccharide
which is branched and composed of several monosaccharides which have no regular sequences, whereas the carbohydrate chain' in proteoglycans is linear and has a more or less regular sequence of monosaccharides.
2. The monosaccharides in g/ycoproteins are either neutral, basic or ampho~ teric, the amino groups of the latter two being N-acetylated resulting in an overall mild acidity, whereas the monosaccharides in proteoglycans are either acidic, neutral or basic from which the latter is N-acetylated or
23
N-sulphated and in most cases 0-sulphated at one of the hydroxygroups, resulting in strongly acidic polysaccharides chains. The enormous diversity in biochemical structure, along with the many
functions that glycoproteins can display (e.g. membrane receptors, hormones, blood group determinants) prohibites a simple classification. Proteoglycans, however, are (as already mentioned) classified according to the nature of their carbohydrate chain. Polymers of monosaccharides can be built up either out of one type of monosaccharide unit (homoglycans, e.g. glycogen) or two or more types of monosaccharides (heteroglycans). Glycans in proteoglycansappear to be of linear heteroglycan nature in which basically an aminosugar and an uronic (sugar) acid are intermingled. Due to these substituents the general semi-systematic name for the carbohydrate chains in proteoglycans is GAG. According to the kind of the specific aminosugar or uronic acid present in a certain GAG, a more specific name can be used (e.g. galactosaminoglucuronan). A complicating factor in the classification of the GAG is the possibility of sulphatation of multiple groups of the monosaccharides. Only a few places on the monosaccharide molecule can be sulphated, but the degree of sulphatation may differ considerably within one group of GAG and between different GAG. The term acid-GAG has been introduced when referring to a sulphated-GAG. This term is confusing, since all GAG are strongly acidic in character. Althou.gh a certain GAG isolated from a biological specimen may principally belong to one of the mentioned classes, many irregularities in monosaccharide sequences and differences in the degree of sulphatation and the molecular weight of the GAG may be present.
Historical determination methods (enzymatic digestibilaty, electrophoretic mobility, etc.) have led to a nomenclature with trivial names, which, at least in medical and biological literature, is more often used. Up to now five groups of naturally occurring GAG are distinguished. Their trivial and semisystematic names are: 1. Chondroitin; Chrondoitin sulphate A; Chondroitin sulphate C (= galac-
tosa min ogl u cu ronans). 2. Chondroitin sulphate B or Dermatan sulphate (= galactosaminoiduronan). 3. Heparin; Heparan sulphate(= glucosaminoglucuronoiduronans). 4. Hyaluronic acid (= glucosaminoglucuronan). 5. Keratan sulphate (= glucosaminogalactan).
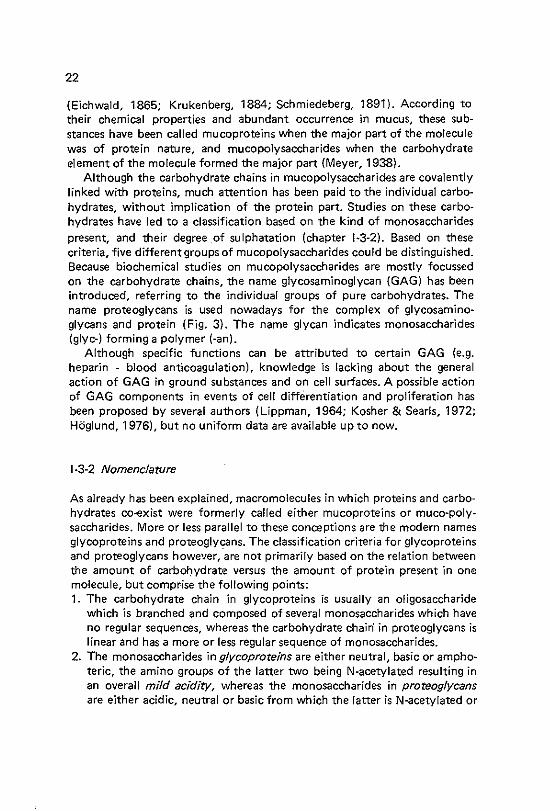
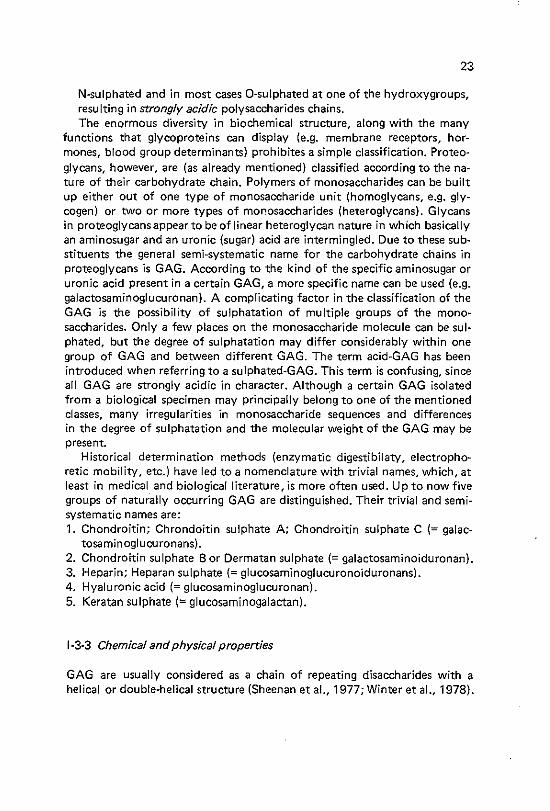
1-3-3 Chemical and physical properties
GAG are usually considered as a chain of repeating disaccharides with a helical or double-helical structure (Sheenan et al., 1977; Winter et al., 1978).
STRUCTURE FORMULAE OF SOME GAG AND OF A GAG-PROTEIN-LINKAGE REGION
OCH,OH OCH20S~3H
H H
O OH H H o......._
H OH H NHCOCH3
REPEATING UNIT OF KERATAN SULPHATE
H
H O
cH2oso3H H
H o a......._
OH H NHS03H
A UNIT OF HEPARIN£
OCOOH ocH,os~,H OCOOH 0 ocH,oH 0 ocH,oH 0 0" 0 bo
OH H H H OH H OH H H H ~H -- 0 0 0 0 0 0
H H H OH H H H H H H H H OH H H ......._ CHz ~H H OH H NHCOCH3 H OH H OH H OH H OH ~O
I LINKAGE REGION OF CHONDROITIN SULPHATE A TO THE PROTEIN CORE NH !
Fig. 1-1
~
OCOOH
0CH20H O
H H 0 0.__
OH H H OCOOH OCH20H 0
OH H 0 0.__
H H H
H OH H NHCOCH3 H OH H NHCOCH3
REPEATING UNIT OF HYALURONIC ACID REPEATING UNIT OF CHONDROITIN
OCOOH OSOOH :H20H 0.
0 0.__ H H
H H OH H NHCOCH 3
REPEATING UNIT OF CHONDROITIN SULPHATE A
H
CH20H
OSOOHH
0
o o.__ H H
H OCOOH
0CH20S~3H
OH H 0 0.__
H H H
H 0
H OH H NHCOCH3 H OH H NHCOCH3
REPEATING UNIT OF CHONDROJTIN SULPHATE C REPEATING UNIT OF CHONDROITIN SULPHATE B
Fig. I- 2
"' "'
26
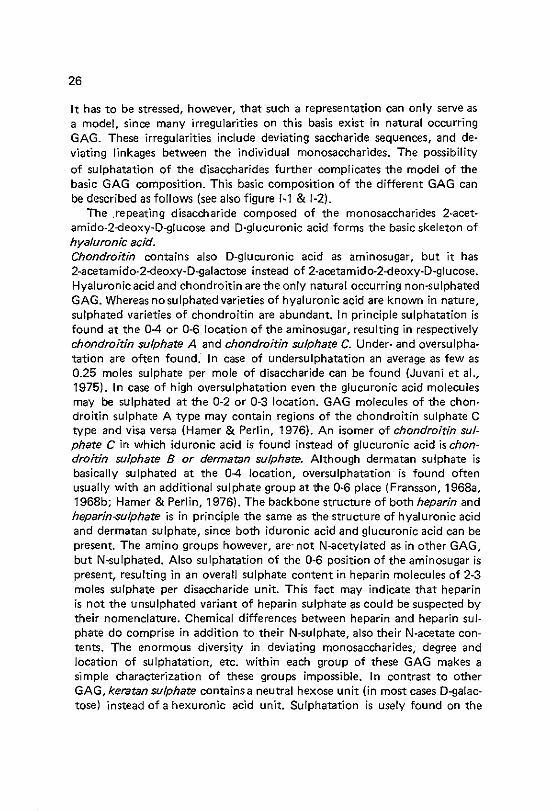
It has to be stressed, however, that such a representation can only serve as a model, since many irregularities on this basis exist in natural occurring GAG. These irregularities include deviating saccharide sequences, and deM viating linkages between the individual monosaccharides. The possibility
of sulphatation of the disaccharides further complicates the model of the basic GAG composition. This basic composition of the different GAG can be described as follows (see also figure 1·1 & 1·2).
The .repeating disaccharide composed of the monosaccharides 2-acetamido-2-deoxy-D-glucose and D-glucuronic acid forms the basic skeleton of hyaluronic acid. Chondroitin contains also D-glucuronic acid as aminosugar, but it has 2-acetamido~2-deoxy-D-galactose instead of 2~acetamido-2~deoxy-D-glucose. Hyaluronic acid and chondroitin are the only natural occurring non-sulphated GAG. Whereas no sulphated varieties of hyaluronic acid are known in nature, sulphated varieties of chondroitin are abundant. In principle sulphatation is found at the 0-4 or 0-6 location of the aminosugar, resulting in respectively chondroitin sulphate A and chondroitin sulphate C. Under- and oversulphatation are often found. In case of undersulphatation an average as few as 0.25 moles sulphate per mole of disaccharide can be found (Juvani et al., 1975). In case of high oversulphatation even the glucuronic acid molecules may be sulphated at the 0·2 or 0·3 location. GAG molecules of the chon· droitin sulphate A type may contain regions of the chondroitin sulphate C type and visa versa (Hamer & Perlin, 1976). An isomer of chondroitin sulphate C in which iduronic acid is found instead of glucuronic acid is chondroitin sulphate 8 or dermatan sulphate. Although dermatan sulphate is basically sulphated at the 0-4 location, oversulphatation is found often usually with an additional sulphate group at the 0·6 place (Fransson, 1968a, 1968b; Hamer & Perlin, 1976). The backbone structure of both heparin and heparin..sulphate is in principle the same as the structure of hyaluronic acid and dermatan sulphate, since both iduronic acid and glucuronic acid can be present. The amino groups however, are· not N-acetylated as in other GAG, but N-sulphated. Also sulphatation of the 0-6 position of the aminosugar is present, resulting in an overall sulphate content in heparin molecules of 2-3 moles sulphate per disaccharide unit. This fact may indicate that heparin is not the unsulphated variant of heparin sulphate as could be suspected by their nomenclature. Chemical differences between heparin and heparin sulphate do comprise in addition to their N~sulphate, also their N-acetate contents. The enormous diversity in deviating monosaccharides, degree and location of sulphatation, etc. within each group of these GAG makes a simple characterization of these groups impossible. In contrast to other GAG, keratan sulphate contains a neutral hexose unit (in most cases D-galactose) instead of a hexuronic acid unit. Sulphatation is usely found on the
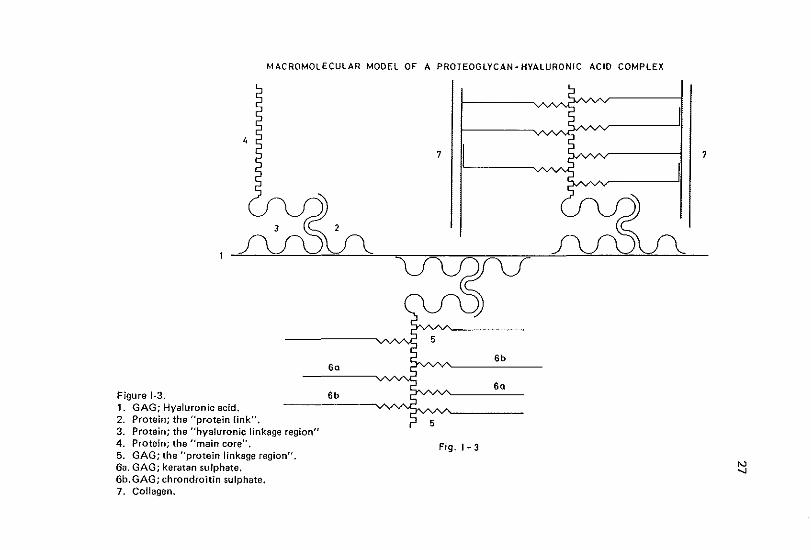
MACROMOLECULAR MODEL OF A PROTEOGLYCAN-HYALURONIC ACID COMPLEX
7
3 ~ ~
5
6b 6a
Sa Figure 1-3. 6b 1. GAG; Hyaluronic acid. --------vvv--?"'"""------2. Protein; the "protein link". 3. Protein; the "hyaluronic linkage region" 4. Protein; the "main core". 5. GAG; the "protein linkage region". 6a. GAG; keratan sulphate. 6b. GAG; chrondroitin sulphate. 7. Collagen.
5
Fig. I- 3
~
7
"' ...,
28
0-6 location of the aminosugar. Variants in the location and degree of sulphatation (Furuhashi, 1961a, 1961b; Anseth & Laurent, 1961; Mathews, 1962; Mathews & Cifonelli, 1965) and in the kind of the neutral hexose (e.g. mannose or fucose instead of galactose) (Hirano & Meyer, 1973) are frequently observed.
In studies concerning GAG, minor attention has been paid to the protein core to which they are attached (Barker et al., 1966, 1969) (Figure 1·3). The amount of protein per proteoglycan may vary considerably (from 2-18% in chondroitin sulphate-keratan sulphate proteogLycan to 50% in dermatan sulphate proteoglycan) (Hoffmanetal., 1975). In most cases, no uniformity in protein chain length, amino acid composition or sequences could be observed (Tsiganos et al., 1971; Heinegard, 1972; Kleine et al., 1973; Baxter. & Muir, 1975). Some specific characteristics, however, are described (e.g. the absence of hydroxyproline and amino acid sequences which determine species common immunological events) (Buddecke et al., 1967; Baxter & Muir, 1972). A hyaluronic acid binding region of constant size and composition and a GAG attachment region of variable length and composition has been proposed (Mathews, 1971; Rosenberg et al., 1976) (Figure 1·3).
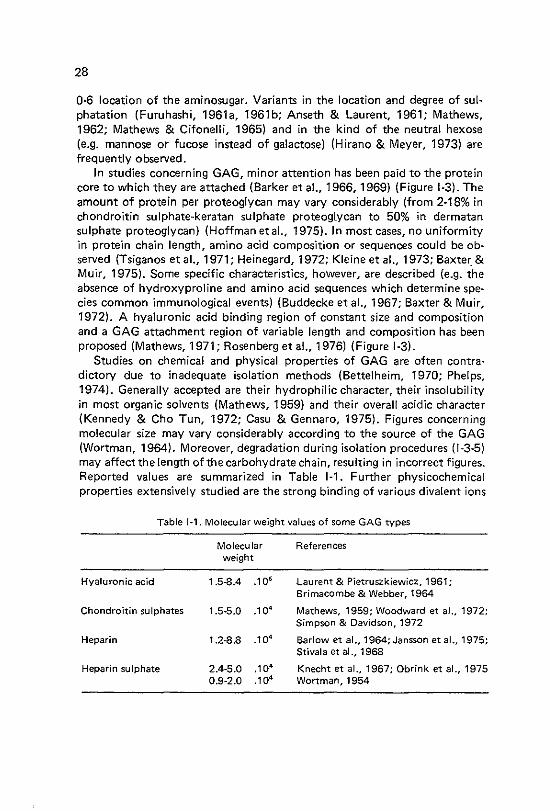
Studies on chemical and physical properties of GAG are often contra· dictory due to inadequate isolation methods (Bettelheim, 1970; Phelps, 1974). Generally accepted are their hydrophilic character, their insolubility in most organic solvents (Mathews, 1959) and their overall acidic character (Kennedy & Cho Tun, 1972; Casu & Gennaro, 1975). Figures concerning molecular size may vary considerably according to the source of the GAG (Wortman, 1964). Moreover, degradation during isolation procedures (1·3·5) may affect the length of the carbohydrate chain, resulting in incorrect figures. Reported values are summarized in Table 1·1. Further physicochemical properties extensively studied are the strong binding of various divalent ions
Table 1·1. Molecular weight values of some GAG types
Hyaluronic acid
Chondroitin sulphates
Heparin
Heparin sulphate
Molecular weight
1 .5-8.4 .1 06
1.5·5.0 .1 04
1.2-8.8 .104
2.4·5.0 .1 04
0.9·2.0 .104
References
Laurent & Pietruszkiewicz, 1961; Brimacombe & Webber, 1964
Mathews, 1959; Woodward et al., 1972; Simpson & Davidson, 1972
Barlow et al., 1964; Jansson et al., 1975; Stivala et aJ ., 1968
Knecht et al., 1967; Obrink et al., 1975 Wortman, 1954
29
such as calcium, ba'rium and magnesium and their effect on the conforma~ tion of GAG; the hydrodynamic properties, especially of hyaluronic acid (Laurent & Pietruszkiewicz, 1961; Ogston & Phelps, 1961 ;Ogston & Preston, 1966) and the metachromatic colour reactions of the GAG with several dyes (Stone, 1969; 1970).
1·3-4 Biological properties
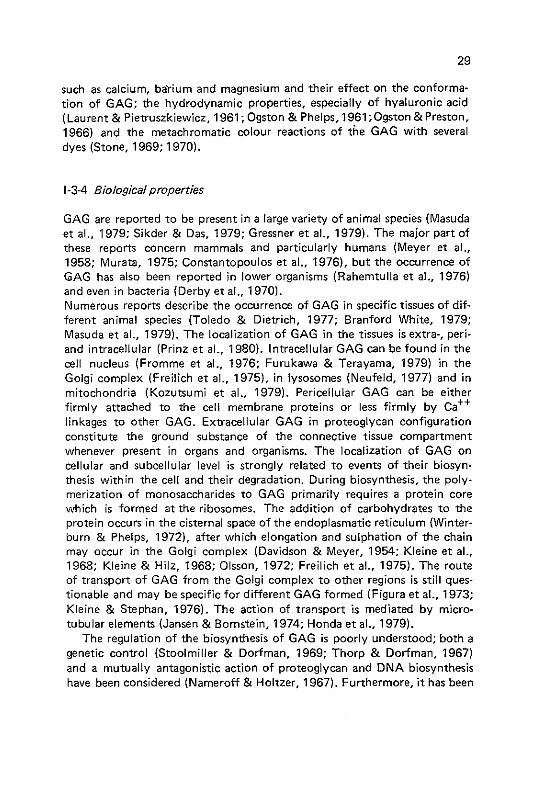
GAG are reported to be present in a large variety of animal species (Masuda et al., 1979; Sikder & Das, 1979; Gressner et al., 1979). The major part of these reports concern mammals and particularly humans {Meyer et al., 1958; Murata, 1975; Constantopoulos et al., 19761. but the occurrence of GAG has also been reported in lower organisms {Rahemtulla et al., 1976) and even in bacteria (Derby et al., 1970). Numerous reports describe the occurrence of GAG in specific tissues of dif~ ferent animal species (Toledo & Dietrich, 1977; Branford White, 1979; Masuda et al., 1979). The localization of GAG in the tissues is extra-, periand intracellular (Prinz et al., 1980). Intracellular GAG can be found in the cell nucleus (Fromme et al., 1976; Furukawa & Terayama, 1979) in the Golgi complex (Freilich et al., 1975), in lysosomes (Neufeld, 1977) and in mitochondria (Kozutsumi et al., 1979). Pericellular GAG can be either firmly attached to the cell membrane proteins or less firmly by Ca ++ linkages to other GAG. Extracellular GAG in proteoglycan configuration constitute the ground substance of the connective tissue compartment whenever present in organs and organisms. The localization of GAG on cellular and subcellular level is strongly related to events of their biosynthesis within the cell and their degradation. During biosynthesis, the polymerization of monosaccharides to GAG primarily requires a protein core which is formed at the ribosomes. The addition of carbohydrates to the protein occurs in the cisternal space of the endoplasmatic reticulum (Winterburn & Phelps, 1972), after which elongation and sulphation of the chain may occur in the Golgi complex (Davidson & Meyer, 1954; Kleine et al., 1968; Kleine & Hilz, 1968; Olsson, 1972; Freilich et al., 1975). The route of transport of GAG from the Golgi complex to other regions is still questionable and may be specific for different GAG formed (Figura et al., 1973; Kleine & Stephan, 1976). The action of transport is mediated by microtubular elements (Jansen & Bornstein, 1974; Honda et al., 1979).
The regulation of the biosynthesis of GAG is poorly understood; both a genetic control (Stoolmiller & Dorfman, 1969; Thorp & Dorfman, 1967) and a mutually antagonistic action of proteoglycan and DNA biosynthesis have been considered (Nameroff & Holtzer, 1967). Furthermore, it has been
30
shown that the rate of GAG synthesis by cells can be influenced by different hormones, such as adrenal hormones (Oessar et al., 1953; Barker et al., 1964; Schiller et al., 1965; Schiller, 1966); insulin (Gastpar, 1965); oestrogens (Bentley et al., 1971; Kofoed et al., 1972) and by lipids (Schwartz & Roden, 1972; Schwartz, 1976), somatomedins (Audhya & Gibson, 1975) and other cell and serum factors (Schwartz et at., 1974). Microenvironmental factors as pH, ionic strength (Lie et al., 1972) and the amount of GAG already present (Neva & Dorfman, 1972) can also influence the rate of GAG synthesiS. Finally, the availability of nutritional factors (manganese II ion, vitamins, etc.) has been described as essential and regulatory (Telser et al., 1969; Thomas & Pasternak, 1969; Shrader et al., 1973; Sudhakaran & Kurup, 1974).
Degradation of GAG has been extensively studied in relation to its disorders in genetic hyperglycosaminoglycanuria (mucopolysaccharidosis) and many enzymes involved have been characterized (McKusick et al., 1965; McKusick, 1972; Van Hoof, 1973; Dorfman & Matalon, 1972; 1976). However, the regulation is still poorly understood. The uptake of proteoglycans into cells has in some cases been proven to be via adsorptive pinocytosis (Kresse et al., 1975) by which phenomenon individual proteoglycans are internalised at different rates. The degradation of GAG occurs by hydrolytic enzymes in secondary lysosomes (Neufeld, 1977).
The widespread occurrence of GAG suggests a general role of these sub~ stances in all tissues. The great diversity within the group GAG, however, may suggest more specific functions for the individual GAG. The physicochemical properties of GAG have served as a basis for most hypotheses about their possible functions, and the functions are supposed to be dif~ ferent for GAG found extra-, peri~ or intracellularly. For GAG found extra~ cellularly it has been stated that the afore mentioned bind.ing of water to GAG (primarily to hyaluronic acid) constituting a viscous solution, may act as lubricant (in synovial fluids) and as shock absorber (in synovial and ocular fluids) (Ogston & Stanier, 1953; Balazs, 1966; Swann et al., 1974; Margolis et al., 1975).
In combination with the ability of aggregation of GAG with other proteoglycan molecules, the aforementioned water binding properties may lead to the formation of a matrix in connective tissues. In this way GAG could perform several functions. In the first place they may account for the connective tissue water retention and its turges·cence ( Hvidberg & Jensen, 1959; Hvidberg, 1 960); they might control intercellular permeability for molecules (Aldrich, 1958; Fabianek et al., 1963; Preston & Snowden, 1972) and arrest large molecules (Fessler, 1957) or corpuscules like bacteriae etc. (Herp et al., 1966). Furthermore, the transport and concentrations of specific ions (like calcium, natrium, strontium and kalium) might be regulated by the
31
amount of GAG present (Abood & Abui-Haj, 1956; Hale et al., 1967; Magdelenat et aL, 1974). It has been suggested that hyaluronic acid could thus be involved in the transduction of pressure into electrical potentials (Barrett, 1975). The three dimensional structure of the matrix could be of importance in for instance the migration of neurons during early develop~ ment of the brain (Margolis et aL, 1975; Derby, 1978)_ Further possible functions of a GAG in relation to its presence in a connective tissue are the maintenance of corneal transparency and a regulatory function in corneal morphogenesis by keratan sulphate (Hart, 1976). The specific blood anticoagulant and antilipaemic action of heparin is well known {Stacey & Barker, 1962; Brimacombe & Stacey, 1964; Brimacombe & Webber, 1964) _ Depending on the circumstances dermatan sulphate may also display an anti-coagulation potency (Marbet & Winterstein, 1951; Yamashina, 1954; Meyer et aL, 1957; Clamp et aL, 1972).
GAG located pericellularly could play a role in events of cell aggregation (Pessac & Defendi, 1972; Morris, 1979) and cell recognition (Dietrich et al., 1977, 1980)_ These hypotheses are partly based on differences in composition and amount of GAG produced by normal and tumor cells (Biix, 1951; Meyer et aL, 1956; Adams, 1963; Anderson et al., 1963; Sylven, 1965; Sweet et aL, 1976; Takeuchi et aL, 1976; Sampaio et al., 1977)_ From these studies an involvement of the cell coat GAG in events of cell division was also suggested, which (among others) Jed to the hypothesis mentioned in chapter 1-2-2.
Finally, GAG found intracellularly have been suggested to be involved in events of cell division (Chapter 1-2-2) and a regulatory action of intracellular GAG on the action of lysosomal enzymes has also been proposed (Avila, 1978).
In conclusion: in some cases, specific functions of GAG have been established. However, most functional aspects of GAG are still hypothetical. Such hypotheses are generally based on changes in GAG composition or
in GAG amounts during certain events. These changes may be secondary to the events studied and be due to altered metabolism in general.
Disorders in the main biochemical pathways of protein and carbohydrate ana- and katabolism are likely to influence the amount of GAG present in the tissues. Consequently deviating amounts of GAG in the tissues under many pathological conditions will (in most cases) be secondary to altered cell metabolism. However, the abnormal metabolism of GAG might in its turn constitute a cause for some pathological features. There are numerous diseases or pathological conditions for which a coincidence with an aberrant GAG metabolism or deposition have been reported. Examples are: diabetes (Craddoch & Kerby, 1955); exophthalmos (Winand, 1967); chronic hepatitis (Kawata et aL, 1961); cirrhosis (Kawata etal., 1961); polymyositis (Murata
32
et al., 1970); rheumatoid arthritis {Pras et al., 1971 ); atherosclerosis (Brimacombe & Stacey, 1964; Okada et al., 1973); tuberculosis (Maeta et al., 1974); Kwashiorkor (Chandrasekaran et al., 1971). Also in many tumors such as chondrosarcoma and chordoma (Meyer et al., 1956); fibroadenoma (Takeuchi et al., 1976; mesothelioma (Meyer & Chaftee, 1940; Blix, 1951); neuroblastoma (Deutsch, 1957) and leukaemia (Rich & Myers, 1959; Slater & Love!!, 1961), changed GAG levels were observed. Furthermore in diseases like psoriasis (Mier & Urselmann, 1970), Weber-Christian disease (Murata et.al., 1973), chronic lupus, lupus erythematosus, dermatomyositis, scleroderma, poikiloderma, urticaria pigmentosa (Brimacombe & Stacey, 1964; Blumenkrantz & Asboe-Hansen, 1980), cystic fibrosis, in the syndromes of: Fabry, Krabbe, Gaucher, Marian, Hurler, Hunter, Scheie, Sanfilippo, Maroteaux-Lamy and Morquio-Uirich (Matalon & Dorfman, 1969), deposition of one or more kinds of GAG can be observed. Even surgical stress has been described to be accompanied by altered urinary GAG excretion (Stern etal., 1968).
1~3~5 Isolation from biological specimens
Methods used for isolation of GAG out of biological structures are depen~ dent on the nature of these structures. The extent of attachment of GAG to other tissue components such as proteins, and to complex structures like membranes determines whether a degradative method is needed or a simple extraction method can be used (Jeanloz, 1963; Brimacombe & Stacey, 1964). GAG in biological fluids like urine, serum or amniotic fluids can be extracted immediately, since no or only minor attachments to low mole~ cular weight proteins are present (Hurst eta!., 1977; Mitra & Balu, 1978). Simple extraction of GAG from other relative "loose" tissues like the vitreous body, the umbilical cord and the synovial fluid are also described (Laurent et al., 1960; Preston et al., 1965). Extraction is accomplished by
use of water (Biix & Snellman, 1945} or neutral salt solutions (Meyer & Smyth, 1937; Blix & Snellman, 1945). Quantitative extraction of pure GAG from solid tissues, however, needs degradative methods in order to cleave linkages between GAG and proteins. This can be accomplished by extrac~ tion with alkali and by proteolytic digestion. Treatment with alkali has been used in isolation procedures for chondroitin sulphates from cartilage. The basis of alkali action has been described by Andersen eta!. (1965) who demonstrated that in addition to cleavage of linkages between amino acids in the protein the carbohydrate was also disrupted. For preparative purposes alkali extraction is consequently no longer used.
33
Proteolytic digestion is usely performed with broad specificity proteases like papain (Muir, 1956), pronase (Barker et al., 1965, 1969), pepsin (Dyrbye & Kirk, 1957) and trypsin (Hadidian & Pirie, 1948). This digestion, how· ever, is almost never successful in removing all amino acid residues. The length of the carbohydrate chain seems to influence the extent to which amino acids can be removed. On the other hand, papain digestion might also attack glycosidic linkages of hyaluronic acid, producing products of con~ siderably lower molecular weight than the originally present hyaluronic acid (Roden et al., 1972). These facts stress the need of critical evaluation of results after digestion procedures.
Removal of residual proteins and protein digestion products can be ac~ complished by precipitation or denaturation, followed by dialysis of the supernatant liquid (Roden et al., 1972). Precipitation or denaturation of proteins can be realized by phosphotungstic acid (Furth & Bruno, 1937), chloroform (Sevag, 1934), trichloroacetic acid, picric acid or formaldehyde (Masamune & Osaki, 1943). Although such procedures facilitate the sub· sequent purification of GAG, losses of low molecular weight GAG, such as heparan sulphate, keratan sulphate and digested hyaluronic acid products may occur on dialysis. Trichloroacetic acid may precipitate certain kinds of hyaluronic acid, and cause losses in this way. Finally, extraction of GAG, whether directly from body fluids (Nitra & Blau, 1978) or from dialysed tissue digests, may be accomplished by precipitation of GAG by various agents. Examples of such agents frequently used are: methanol or ethanol (Jeanloz, 1965; Danishefsky & Abraham, 1971), acetone (Charles & Scott, 1933), acetic acid (Meyer, 1948), copper and zinc salt solutions (Ferrante & Rich, 1956; Meyer et al., 1958; Scott, 1960; Kennedy et al., 1973; Douglas et al., 1973) and benzidine solution (Charles & Scott, 1936; Wolfrom et al., 1943; Astrup, 1947). In spite of the numerous isolation methods for GAG that have been developed it may be stated that no perfect method has been reported yet, and that quantitative isolation of pure GAG is extremely difficult to achieve.
1~3~6 Fractionation methods
As described in chapter 1-3~2 GAG can be subdivided into several different groups. Since almost all tissues contain a mixture of GAG belonging to dif~ ferent groups, fractionation procedures have been developed. However, the close similarity between GAG belonging to different groups, the hetero~ geneity of GAG within a group (with regard to molecular weight and degree of sulphatation) and the presence of amino acids due to incomplete diges~
34
tion makes a complete fractionation into the defined groups very difficult or sometimes even impossible. Methods commonly used are based on either the solubility of different GAG in ethanol (Danishefsky & Abraham, 1971 ), or on charge density differences between the GAG components (Abeling et al., 1974). Addition of ethanol to an aqueous solution containing a mixture of GAG, precipitates separate GAG dependent on the final concentration of ethanol reached. Another method can be used by which a GAG mixture-ethanol precipitate is applied to a cellulose column, followed by elution with stepwise decreasing concentrations of ethanol {Garde!!, 1957). Complex formation of a GAG, belonging to a certain group and a certain quaternary ammonium compound occurs at specific critical electrolyte con· centration. Consequently separation of GAG can be accomplished by applying a mixture of GAG~quaternary ammonium complexes to a sup~ porting medium (e.g. a cellulose column), after which the GAG are frac· tionaly eluted by stepwise increasing concentrations of salt (Antonopoulos et al., 1964, 1965; Svejcar & Robertson, 1967). Frequently used quaternary ammonium compounds are: cetyltrimethylammonium and cetylpyridi~ niumchloride (Jones, 1953; Scott, 1955).·
Other separation methods for GAG based on charge density differences include ion exchange chromatography (Laurent, 1961; Antonopoulos et al., 1967; Lowther et al., 1967) using commercially available ion-exchange resins (Danishefsky & Bella, 1966; Teller, 1967; Cifonelli & King, 1970), high performance liquid chromatography (Hjerpe eta!., 1979L thin layer chromatography (Havass & Szabe, 1972; Humbel & Chamoles, 1972), countercurrent chromatography (Hurst et al., 1978L paper chromatography (Caster & Dorstewitz, 1964; Good, 1967; Sato & Gyorkey, 1978), paper electrophoresis (Rientis, 1953), electrophoresis on cellulose acetate (Stern, 1968; Gardais et al., 1969; Kimura & Tsurumi, 1969; Douglas et al., 1973; Abeling et al., 1974; Noordegraaf, 1979; Cappelletti et al., 1979),on polyacrylamide (Rennert, 19671, on vinylacetate (Hermelin et al., 1975) and on agarose (Dietrich et al., 1971; Taniguchi, 1972; Funderburgh & Chandler, 1978), and isoelectrofocusing (McDuffie & Cowie, 1979). The number of methods for the separation of GAG developed during the last years indicates the lack of a satisfactory method which easily separates all major groups of GAG, and new improved methods are regularly reported (Cappelletti et al., 1~80).
1~3~7 Identification and quantification methods
Identification of GAG in tissue are mainly performed by histochemical methods (Brimacombe & Webber, 1964; Jeanloz, 1963, 1970). Several

35
histochemical methods like the periodic acid-Schiff (PAS) reaction have been extensively reviewed (Ouintarelli, 1968). The validity of this PAS reaction for GAG identification is very doubtful since it has been reported that both sulphated GAG and hyaluronic acid may react PAS negative whereas a large number of other substances react PAS positive (namely glycogen, glycoproteins, glycolipids, unsaturated lipids and phospholipids) (Pearse, 1968). Some other dyes frequently used are alcian blue, toluidine blue, azure A, colloidal iron and silver solutions. All these dyes, lack specificity and must be combined with other methods like enzymatic digestion for identification of GAG. Histochemical methods are valuable for topografical identification but are unreliable for quantification. For studies concerning GAG metabolism autoradiography has proven to be a valuable method, especially when 35Ssulphate incorporation is used, while radioactive carbohydrate precursors display less specificity (Barker & Kennedy, 1969a, 1969b; Barker et al., 1969a). Identification methods of biochemically extracted GAG are often based on their behaviour in the separation methods mentioned in chapter 1-3-6 (e.g. their Rf values in chromatograms and their mobility in electrophoresis in relation to general accepted reference standards issued by Dr. Mathews and Dr. Cifonelli) (Barket et al., 1969b; Douglas et al., 1972; Breen et al., 1976) or on their sensitivity to enzymatic digestion by more or less specific enzymes (Goldberg & Cotlier, 1972; Murata, 1974; Noordegraaf & Ploemacher, 1979). However, none of these enzymes display a specificity for one special type of GAG.
Examples of other identification methods are specific reactions with some dyes like acridine orange (Kupchella & Curran, 1976), optical rotatory dispersion methods (Stone, 1967, 1969a, b), H nuclear magnetic resonance spectroscopy {Perlin et al., 1970; Perlin, 1976), and many structural identification methods based on biochemical degradation methods (Lehtonen et al., 1966; Karkkainen et al., 1966; Robertson & Harvey, 1972). The anticoagulant activity of heparin may be used as identification mark (Brimacombe & Webber, 1964), and since some proteoglycans show immunological properties (Tsiganos & Muir, 1969) proteoglycan antibodies may theoretically form a tool for identification purposes (Keiser et al., 1972; Muir et al., 1973).
Most quantification methods for isolated GAG are based on colorimetric determinations of the constituent monosaccharides which cal) be liberated by sulphuric acid. These methods include the phenol-, the orcinol-, the anthrone-, the naphto- the resorcinol-, and the L-cysteine-sulphuric acid assay (Elson & Morgan, 19'33; Bitter & Muir, 1962; Di Ferrante, 1967; Kennedy,
36
1971; Svennerholm, 1956; Aminoff et al., 1970; Dische, 1962; Blumenkrantz & Asboe-Hansen, 1973). Other colorimetric methods are based on the already mentioned color reactions of GAG with toluidine blue (Walton & Ricketts, 1954; Hsu et al., 1972) and alcian blue (Whiteman, 1973; Hronowski & Anastassiades, 1979; Gold, 1979). These methods can be used on GAG in solution in combination with spectrophotometric analyses (Biumenkrantz & Asboe-Hansen, 1973) or on GAG on paper or cellulose acetate strips in combination with densitometric analyses (Sene et al., 1970; Noordegraaf & Ploemacher, 1979). Especially in in vitro cell studies, radioactive labeling of GAG precursors have been shown to yield reliable quantitative assay systems (Kuettner & Lindenbaum, 1965).
In conclusion: Studies concerning GAG are hampered by the lack of adequate methods for isoration, fractionation, identification and quantification of GAG. According to the aims of a specific study, a selection must be made from the available methods for each step in the biochemical processing. The methods used for studies presented in this thesis are described in Chapter II.
1~4 Outline of the presented studies
Investigations concerning the possible relationship between GAG and haemopoiesis were limited to the following questions: 1. Are different states of haemopoietic activity characterized by specific
concentrations of one or more types of GAG or relative proportions of concentrations of different types of GAG in the haemopoietic organs?
2. Does a relation exist between changes in haemopoietic activity and changes in the concentration of one or more types of GAG in the haemopoietic organs, and in organs in which extramedullary haemopoiesis can be induced in adult animals, and if so, is it a causal relation.
3. To what extent do stromal cells and haemopoietic cells contribute to the amount of GAG present in the haemopoietic organs?
4. Is the spleen of mice bearing the Sl locus in its genome, biochemically characterized by extremely high sulphated GAG levels, thus forming the primary cause of its anaemic state, as was suggested by McCuskey and Meineke (1973)?
A biochemical method was developed in order to determine the kinds and amounts of GAG in haemopoietic and other tissues. This method, and the haematological techniques which were used are described in chapter II. The results of the determinations of GAG present in spleens and bone marrow of normal (C57BL/Rij x CBA/Rij)F1 mice are given in chapter Ill. A distinction is made between GAG present in the sediment and the supernatant of centrifuged tissue samples. In this way an impression is obtained
37
of the amount of GAG bound to structural components and the amount of soluble GAG in the haemopoietic organs under normal conditions. Further· more, data on changes in the amount of the different kinds of GAG present in the spleen of untreated (C57BL/Rij x CBA!Rij)F1 mice during a 24 hours time period are given, indicating diurnal fluctuations under normal conditions. Different states of haemopoietic activity, as mentioned in question 1 were induced by bleeding or hypertransfusion of mice. In chapter IV, the effect of these manipulations on the haemopoietic activity and on the amount of GAG present in the haemopoietic organs are described. Observed changes in these parameters in the spleen were followed over a certain period of time in order to get an answer on question 2. Injection of mice with phenylhydrazine induces a severe anaemia and erythropoietic activity in the liver. Studies on possible relations between the induction of erythropoietic activity in the liver by phenylhydrazine treatment and changes in GAG levels in the liver constitute another approach of question 2, and are described in chapter V. Since sex hormones are known to influence both the haemopoietic activity and the GAG metabolism in animals, they formed another tool in studying the possible correlation between these parameters. These studies' are presented in chapter VI. By determining the amount of GAG present in irradiated spleens, in the presence or absence of regenerating haemopoietic cells (chapter VII) it was attempted to obtain information to what extent stromal cells and haemopoietic cells contribute to the amount of GAG present in this organ (question 3). With respect to question 4, determinations of types and amounts of GAG in spleens of mice bearing the Sl locus are described in chapter VIII. Finally, combined results of the separate chapters are discussed in chapter IX.

38
II GENERAL MATERIALS AND METHODS
In this chapter only methods which were used throughout the experiments reported in the following chapters are described. Specific techniques as far as they are relevant to a certain chapte:- will be described there.
11·1 Mice
(C57BURij x CBA/Rij)F1 male mice were used. The animals were either 17-23 weeks old and weighed 28·35 g (Chapter Ill, IV, V, VI, VII) or 15·18 weeks old, weighing 28-30 g (Chapter Ill, determinations of splenic GAG changes during a 24 hour period). The mice were purchased from the Laboratory Animals Centre of the Erasmus University, Rotterdam, The Netherlands.
11-2 Haematological determinations
11·2-1 Incidence of CFU-E and CFU·C
Preparation of cell suspensions. Pooled cell suspensions of femoral bone marrow or spleen in a buffered saline solution (BSS, of Mishell & Dutton, 1967) were made from three mice per experimental point. For preparing bone marrow suspensions each femur was cleaned from muscle tissue, its ends were cut off and the contents of its epiphyses and diaphyse cavities were flushed out by a single passage of 5 ml of PBS. The suspension was flushed through a nylon gauze filter (pore seize ± 100 pm) and pi petted to break up cell clumps. Spleens were minced with scissors and squeezed through a similar nylon gauze filter with a spatulum to give a single cell suspension. Nucleated cell counts were determined using a Model Zb Coulter Electronics Partikel Counter.
Cell cultures. CFU-E and CFU-C were determined with the plasma clot culture technique as described by McLeod et al. (1974). The medium was slightly modified in that NCTC-1 09 medium and Eagles minimum essential medium were replaced by Dulbecco's medium (Flow Laboratories, U.K.). For CFU-C cultures mouse fibroblast conditioned medium (cf. Van den
39
Engh, 1974) was used instead of the kidney tubule conditioned medium. CFU~E were cultured in microtiter plates {Greiner, NUrtinger, Germany) each well containing 0.1 ml of culture medium. For each experimental point the average colony number was determined in 16 whole clots after 2.5 days of culture.
11-2-2 Incidence of erythroblasts
The percentage of erythroblasts present in the bone marrow nucleated cell population was determined in May~GrUnwald~Giemsa stained sedimentation preparations, as described by Sayk (1960). Splenic erythroblasts were determined in May~GrUnwald~Giemsa stained preparations, obtained by "printing" sectioned spleens on microscopic slides.
11~2~3 Haematocrit determinations
Haematocrit values were determined by use of a "Hawksley" microhaematocrit centrifuge (Hawksley, Sussex, England).
11-3 Glycosaminoglycans determinations
11-3-1 Collection and preparation of tissues
Liver. Complete livers were homogenized in distilled water with a PotterEivehjem homogeniser.
Spleen. Whole spleens were minced with scissors and squeezed through a nylon gauze filter with a spatulum. For determinations concerning experiments described in chapters V-VIII, distilled water was used as a medium. For determinations on "free" or "structure bound" GAG a 0.9% NaCI solution was used as medium (for further details see chapter 111-2).
Bone marrow. Bone marrow suspensions were obtained by flushing tibial and femoral shafts and epiphyses by using a hypodermic needle with distilled water or NaCI according to the protocol followed with splenic tissue.
Blood. Blood was obtained by puncture of the suborbital plexus. Blood clot and serum were separated by means of centrifugation (1000 g for 3 minutes at 4°C) after a period of 30 minutes for coagulation.
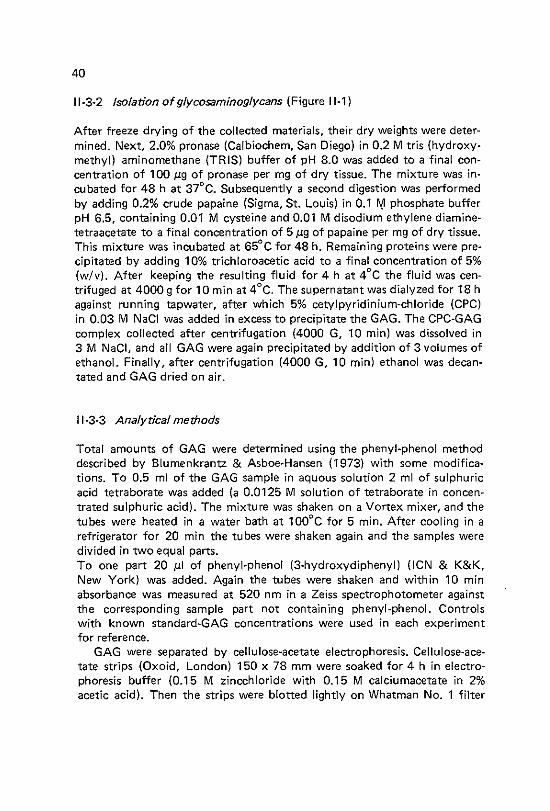
40
11-3-2 Isolation of glycosaminoglycans (Figure 11-1)
After freeze drying of the collected materials, their dry weights were determined. Next, 2.0% pronase (Calbiochem, San Diego) in 0.2 M tris (hydroxymethyl) aminomethane (TRIS) buffer of pH 8.0 was added to a final concentration of 100 J.1.9 of pronase per mg of dry tissue. The mixture was incubated for 48 h at 37°C. Subsequently a second digestion was performed by adding 0.2% crude papaine (Sigma, St. Louis) in 0.1 ¥ phosphate buffer pH 6.5, containing 0.01 M cysteine and 0.01 M disodium ethylenediaminetetraacetate to a final concentration of 5 .U9 of papaine per mg of dry tissue. This mixture was incubated at 65°C for 48 h. Remaining proteins were precipitated by adding 10% trichloroacetic acid to a final concentration of 5% (w/v). After keeping the resulting fluid for 4 h at 4°C the fluid was centrifuged at 4000 g for 10 min at 4°C. The supernatant was dialyzed for 18 h against running tapwater, after which 5% cetylpyridinium-chloride (CPC) in 0.03 M NaCI was added in excess to precipitate the GAG. The CPC-GAG complex collected after centrifugation (4000 G, 10 min) was dissolved in 3 M NaCI, and all GAG were again precipitated by addition of 3 volumes of ethanol. Finally, after centrifugation (4000 G, 10 min) ethanol was decantated and GAG dried on air.
11-3-3 Analytical methods
Total amounts of GAG were determined using the phenyl~phenol method described by Blumenkrantz & Asboe~Hansen (1973) with some modifications. To 0.5 ml of the GAG sample in aquous solution 2 ml of sulphuric acid tetraborate was added (a 0.0125 M solution of tetraborate in concen~ trated sulphuric acid). The mixture was shaken on a Vortex mixer, and the tubes were heated in a water bath at 100°C for 5 min. After cooling in a refrigerator for 20 min the tubes were shaken again and the samples were divided in two equal parts. To one part 20 J.LI of phenyl-phenol (3-hydroxydiphenyl) (ICN & K&K, New York) was added. Again the tubes were shaken and within 10 min absorbance was measured at 520 nm in a Zeiss spectrophotometer against the corresponding sample part not containing phenyl~phenol. Controls with known standard-GAG concentrations were used in each experiment for reference.
GAG were separated by cellulose·acetate electrophoresis. Cellulose-ace~ tate strips (Oxoid, London) 150 x 78 mm were soaked for 4 h in electrophoresis buffer (0.15 M zincchloride with 0.15 M calciumacetate in 2% acetic acid). Then the strips were blotted lightly on Whatman No. 1 filter
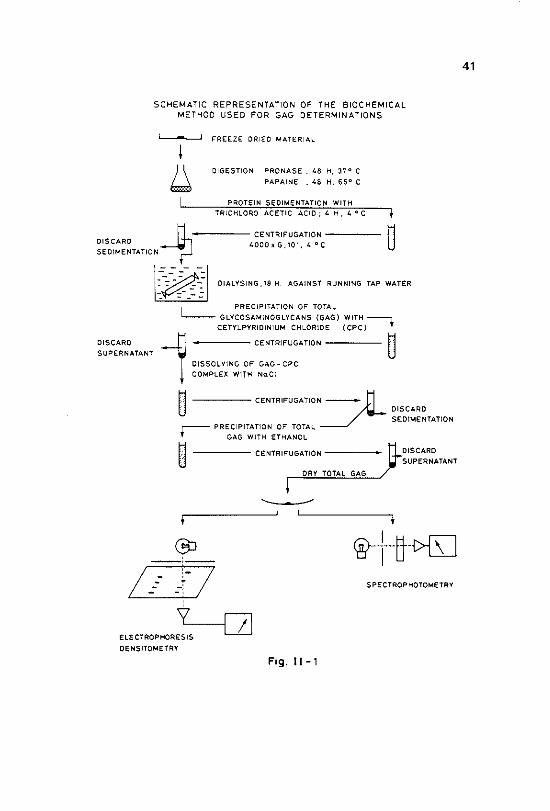
SCHEMATIC REPRESENTATION OF THE BIOCHEMICAL METHOD USED FOR GAG DETERMINATIONS
FREEZE DRIED MATERIAL
DIGESTION PRONASE . 48 H, 37° C
PAPAINE • 46 H. 65" C
PROTEIN SEDIMENTATION WITH
TRICHLORO ACETIC ACID ; 4 H, 4 ° C
------CENTRIFUGATION DISCARD 4000xG,10', 4 "C 0 SEDIMENTATION
DISCARD
SUF>ERNATANT
~~~ ""VS'"G·" H. AGAINST RUNNING TAP WATER
PRECIPITATION OF TOTAl
l__ GLYCOSAMINOGLYCANS (GAG) WITH---. CETYLPYRIDINIUM CHLORIDE (CPC)
1 CENTRIFUGATION
DISSOLVING OF GAG- CPC
COMPLEX WITH NaCI
0 CENTRIFUGATION7
r-- PRECIPITATION OF TOTAl
' GAG WITH ETHANOL g CENTRIFUGATION-----~ DRY TOTAL GAG
DISCARD SEDIMENTATION
DISCARD
SUPERNATANT
SPECTROPHOTOMETRY
ELECTROPHOR~ DENSITOMETRY
Fig. 11-1
41
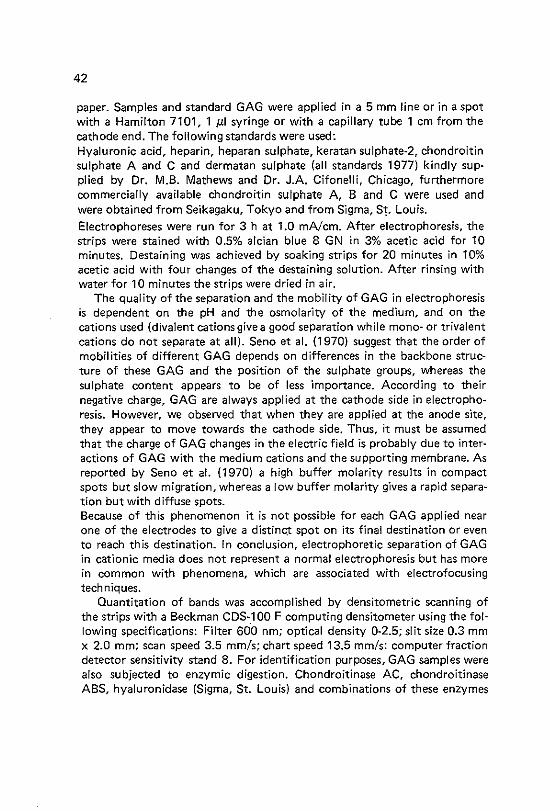
42
paper. Samples and standard GAG were applied in a 5 mm line or in a spot with a Hamilton 7101, 1 pi syringe or with a capillary tube 1 em from the cathode end. The following standards were used: Hyaluronic acid, heparin, heparan sulphate, keratan sulphate-2, chondroitin sulphate A and C and dermatan sulphate (all standards 1977) kindly sup· plied by Dr. M.B. Mathews and Dr. J.A. Cifonelli, Chicago, furthermore commercially available chondroitin sulphate A, B and C were used and were obtained from Seikagaku, Tokyo and from Sigma, St. Louis. Electrophoreses were run for 3 h at 1.0 rnA/em. After electrophoresis, the strips were stained with 0.5% alcian blue 8 GN in 3% acetic acid for 10 minutes. Oestaining was achieved by soaking strips for 20 minutes in 10% acetic acid with four changes of the destaining solution. After rinsing with water for 10 minutes the strips were dried in air.
The quality of the separation and the mobility of GAG in electrophoresis is dependent on the pH and the osmolarity of the medium, and on the cations used (divalent cations give a good separation while mono~ or trivalent cations do not separate at all). Seno et al. (1970) suggest that the order of mobilities of different GAG depends on differences in the backbone struc~ ture of these GAG and the position of the sulphate groups, whereas the sulphate content appears to be of less importance. According to their negative charge, GAG are always applied at the cathode side in electropho~ resis. However, we observed that when they are applied at the anode site, they appear to move towards the cathode side. Thus, it must be assumed that the charge of GAG changes in the electric field is probably due to interactions of GAG with the medium cations and the supporting membrane. As reported by Seno et al. (1970) a high buffer molarity results in compact spots but slow migration, whereas a low buffer molarity gives a rapid separation but with diffuse spots. Because of this phenomenon it is not possible for each GAG applied near one of the electrodes to give a distinc:t spot on its final destination or even to reach this destination. In conclusion, electrophoretic separation of GAG in cationic media does not represent a normal electrophoresis but has more in common with phenomena, which are associated with electrofocusing techniques.
Ouantitation of bands was accomplished by densitometric scanning of the strips with a Beckman CDS-_1 00 F computing densitometer using the following specifications: Filter 600 nm; optical density 0-2.5; slit size 0.3 mm x 2.0 mm; scan speed 3.5 mm/s; chart speed 13.5 mm/s: computer fraction detector sensitivity stand 8. For identification purposes, GAG sam pies were also subjected to enzymic digestion. Chondroitinase AC, chondroitinase ABS, hyaluronidase (Sigma, St. Louis) and combinations of these enzymes
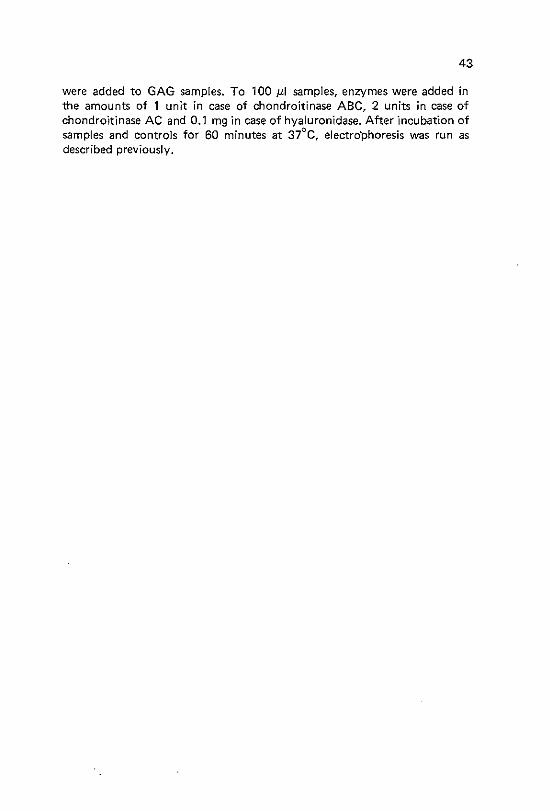
43
were added to GAG samples. To 100 J.Li samples, enzymes were added in the amounts of 1 unit in case of chondroitinase ABC, 2 units in case of chondroitinase AC and 0.1 mg in case of hyaluronidase. After incubation of samples and controls for 60 minutes at 37°C, electro'phoresis was run as described previously.

44
Ill NORMAL AMOUNTS OF GL YCOSAMINOGL YCANS IN
SPLEEN AND BONE MARROW CHANGES IN THE AMOUNT OF SPLENIC
GLYCOSAMINOGLYCANS DURING 24 HOURS
111-1 Introduction
The presence of GAG in the blood and in the haemopoietic organs has been the subject of many studies. It has been reported that GAG in peripheral blood are present as free molecules in the plasma (Calatroni et al., 1969; Sing et al., 1977; Endo et al., 1979). and also in association with cells or cell fragments. Their presence has been established on the cell surface of leuco~ cytes (Kerby, 1955; Orenstein et al., 1978). lymphocytes (Pearse, 1949; Capeau, 1978) and thrombocytes (Nakao and Anorist, 1968) and in the intracellular granules of granulocytes (Murata, 1980; Hasumi and Mori, 1980) and thrombocytes (Ward and Packham, 1979). Remarkable is the absence of detectable amounts of GAG in or on erythrocytes {Hakomori, 1965; Vannucchi et al., 1980).
With respect to the haemopoietic organs, the presence of GAG has been established as intercellular substance in the bone marrow (Carteret al., 1961; Carter and Jackson, 1962; Tavassoli et al., 1976) and Vannucchi et al. (1980) have reported the presence and the composition of GAG in bone marrow cells. Quantitative and qualitative data on bone marrow GAG in relation to their distribution aver the cellular and noncellular compartment, however, are not available. Splenic GAG have been studied by use of histochemical methods (McCuskey et al., 1972; McCuskey & Meineke, 1973) and biochemical methods (Muir & Marshall, 1961; Schrock et al., 1973; Seno et al., 1974). But as in the bone marrow, very little data concerning types, amounts, and distribution of GAG are available. In general, the amounts of GAG present in an organ are dependent on the rates of synthesis and degradation of GAG in that organ. The regulation of GAG metabolism itself is poorly understood. Changes in the amount of one or more types of GAG present in particular tissues or body fluids have been described to occur under normal conditions. For instance, the amounts of a certain GAG, excreted in urine, exhibit a circadian rhythm (Newton et al., 1979). This fact may be contributed to the action of the kidney, but may
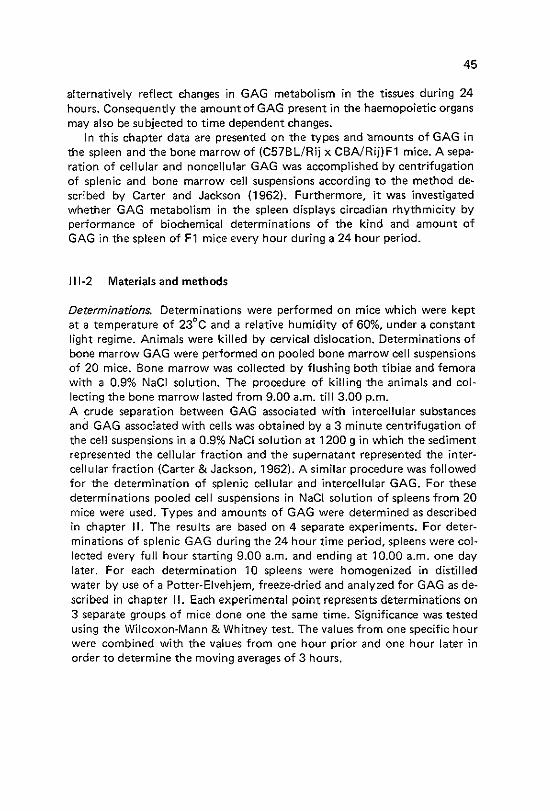
45
alternatively reflect changes in GAG metabolism in the tissues during 24 hours. Consequently the amount of GAG present in the haemopoietic organs may also be subjected to time dependent changes.
In this chapter data are presented on the types and "amounts of GAG in the spleen and the bone marrow of (C57BL/Rij x CBA/Rij) F1 mice. A sepa· ration of cellular and noncellular GAG was accomplished by centrifugation of splenic and bone marrow cell suspensions according to the method de~ scribed by Carter and Jackson (1962). Furthermore, it was investigated whether GAG metabolism in the spleen displays circadian rhythmicity by performance of biochemical determinations of the kind and amount of GAG in the spleen of F1 mice every hour during a 24 hour period.
111·2 Materials and methods
Determinations. Determinations were performed on mice which were kept at a temperature of 23°C and a relative humidity of 60%, under a constant light regime. Animals were killed by cervical dislocation. Determinations of bone marrow GAG were performed on pooled bone marrow cell suspensions of 20 mice. Bone marrow was collected by flushing both tibiae and femora with a 0.9% NaCl solution. The procedure of killing the animals and col~ lecting the bone marrow lasted from 9.00 a.m. till 3.00 p.m. A crude separation between GAG associated with intercellular substances and GAG associated with cells was obtained by a 3 minute centrifugation of the cell suspensions in a 0.9% NaCI solution at 1200 gin which the sediment represented the cellular fraction and the supernatant represented the inter~ cellular fraction (Carter & Jackson, 1962). A similar procedure was followed for the determination of splenic cellular and intercellular GAG. For these determinations pooled cell suspensions in NaCl solution of spleens from 20 mice were used. Types and amounts of GAG were determined as described in chapter II. The results are based on 4 separate experiments. For deter~ minations of splenic GAG during the 24 hour time period, spleens were col~ lected every full hour starting 9.00 a.m. and ending at 10.00 a.m. one day later. For each determination 10 spleens were homogenized in distilled water by use of a Potter~Eivehjem, freeze-dried and analyzed for GAG as de~ scribed in chapter II. Each experimental point represents determinations on 3 separate groups of mice done one the same time. Significance was tested using the Wilcoxon~Mann & Whitney test. The values from one specific hour were combined with the values from one hour prior and one hour later in order to determine the moving averages of 3 hours.

46
111-3 Results
111-3-1 Bone marrow (Table 111-1)
In bone marrow about 1050 IJ.g GAG per g dry weight could be detected. This amount was equally distributed over the cellular and intercellular compartment. In the total amount of GAG in the bone marrow, hyaluronic acid and chondroitin sulphates A, B and C could be distinguished. The amount of hyaluronic acid was found to constitute ± 15% of the total amount of GAG isolated, whereas the amounts o-f the chondroitin sulphates A, Band C contributed respectively about 15%, 25% and 45%. These figures appeared to be valid for the GAG present in the supernatant as well as the sediment of the centrifuged bone marrow suspensions.
TABLE 111-1
Spleen Bone Marrow
cellular inter- total cellular inter- total cellular cellular
Hyaluronic acid 69±25 41±17 110±30 100±33 64±24 164±41 (19%) (32%) 123%) (21%) {11%) (16%)
Chondr. sui. B. 50±20 34±21 84±29 52±18 75±28 127±33 (14%) (26%) (17%) (11%) (13%) (12%)
Chondr. sui. A. 97±28 28± 4 125±28 125±37 119±49 244±61 (27%) 122%) 126%) (26%) (21%) (23%)
Chondr. sui. C. 140±35 26± 3 166±35 198±43 319±36 517±56 (40%) (20%) (34%) (42%) (55%) (49%)
Total GAG 356±43 129±31 485±53 475±83 577±8:! 1052±116 l10il"A) (100%) 1100%) 1100%) (100%) 1100%)
The amount of glycosaminoglycans with standard error of the mean of 4 determinations in spleen and bone marrow. Separation into cellular and intercellular glycosamino-glycans according to the method of Carter and Jackson (1962). Data are expressed in }.LQ per gram dry weight tissue. Chrondr. sui. means chondroifm sulphate. GAG means glycosaminoglycans. Values between brackets indicate percentage of total GAG in each category.
111-3-2 Spleen (Table 111-1)
In the spleen about 500 Jl.g GAG per g dry weight could be isolated. In contrast to the situation in the bone marrow a high percentage (about 70%) was
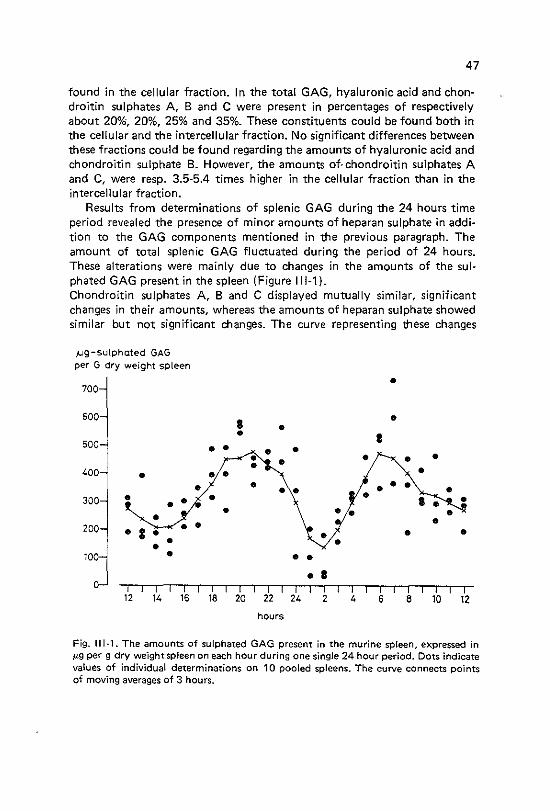
47
found in the cellular fraction. In the total GAG, hyaluronic acid and chondroitin sulphates A, B and C were present in percentages of respectively about 20%, 20%, 25% and 35%. These constituents could be found both in the cellular and the intercellular fraction. No significant differences between these fractions could be found regarding the amounts of hyaluronic acid and chondroitin sulphate B. However, the amounts of-chondroitin sulphates A and C, were resp. 3.5-5.4 times higher in the cellular fraction than in the intercellular fraction.
Results from determinations of splenic GAG during the 24 hours time period revealed the presence of minor amounts of heparan sulphate in addition to the GAG components mentioned in the previous paragraph. The amount of total splenic GAG fluctuated during the period of 24 hours. These alterations were mainly due to changes in the amounts of the sui~ phated GAG present in the spleen (Figure 111-1). Chondroitin sulphates A, B and C displayed mutually similar, significant changes in their amounts, whereas the amounts of heparan sulphate showed similar but not significant changes. The curve representing these changes
,(Jg-su(phated GAG per G dry weight spleen
• 700
600 • • • • • 500 •• • • • • • • • • 400 • •• •
• • • • • • •• 300 • • • •• • • • • • • • • • 200 • I • •• • • • • • • 100 • • •
• • 0 12 14 16 18 20 22 24 2 4 6 8 10 12
hours
Fig, 111~1. The amounts of sulphated GAG present in the murine spleen, expressed in JJ.g per g dry weight spleen on each hour during one single 24 hour period. Dots indicate values of individual determinations on 10 pooled spleens. The curve connects points of moving averages of 3 hours.
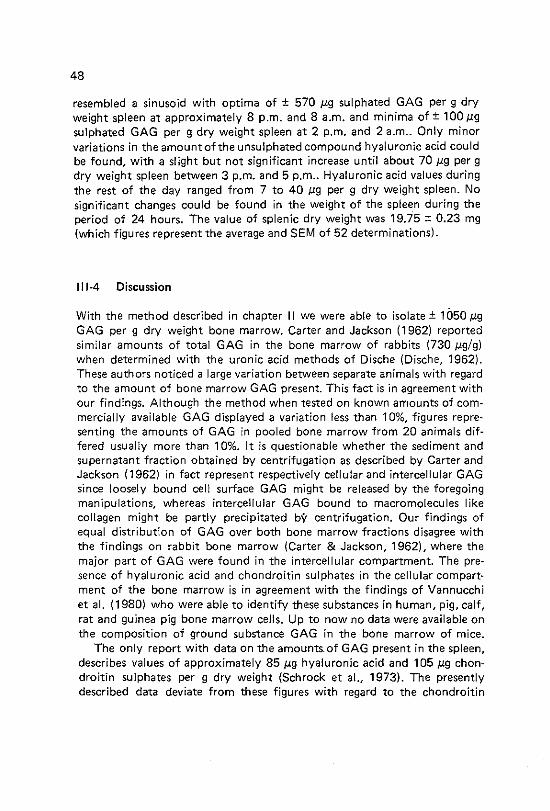
48
resembled a sinusoid with optima of ± 570 11g sulphated GAG per g dry weight spleen at approximately 8 p.m. and 8 a.m. and minima of± 100 11g sulphated GAG per g dry weight spleen at 2 p.m. and 2 a.m .. Only minor variations in the amount of the unsulphated compound hyaluronic acid could be found, with a slight but not significant increase until about 70 J19 per g dry weight spleen between 3 p.m. and 5 p.m .. Hyaluronic acid values during the rest of the day ranged from 7 to 40 11g per g dry weight spleen. No significant changes could be found in the weight of the spleen during the period of 24 hours. The value of splenic dry weight was 19.75 ± 0.23 mg {which figures represent the average and SEM of 52 determinations).
111-4 Discussion
With the method described in chapter II we were able to isolate± 1050 ,ug GAG per g dry weight bone marrow. Carter and Jackson (1962) reported similar amounts of total GAG in the bone marrow of rabbits (730 11g/g) when determined with the uronic acid methods of Dische {Dische, 1962). These authors noticed a large variation between separate animals with regard to the amount of bone marrow GAG present. This fact is in agreement with our findings. Although the method when tested on known amounts of commercially available GAG displayed a variation less than 10%, figures representing the amounts of GAG in pooled bone marrow from 20 animals differed usually more than 10%. It is questionable whether the sediment and supernatant fraction obtained by centrifugation as described by Carter and Jackson (1962) in fact represent respectively cellular and intercellular GAG since loosely bound cell surface GAG might be released by the foregoing manipulations, whereas intercellular GAG bound to macromolecules like collagen might be partly precipitated bY centrifugation. Our findings of equal distribution of GAG over both bone marrow fractions disagree with the findings on rabbit bone marrow (Carter & Jackson, 1962), where the major part of GAG were found in the intercellular compartment. The presence of hyaluronic acid and chondroitin sulphates in the cellular compartment of the bone marrow is in agreement with the findings of Vannucchi et al. (1980) who were able to identify these substances in human, pig, calf, rat and guinea pig bone marrow cells. Up to now no data were available on the composition of ground substance GAG in the bone marrow of mice.
The only report with data on the amounts. of GAG present in the spleen, describes values of approximately 85 J,lg hyaluronic acid and 105 J,lg chondroitin sulphates per g dry weight (Schrock et al., 1973). The presently described data deviate from these figures with regard to the chondroitin
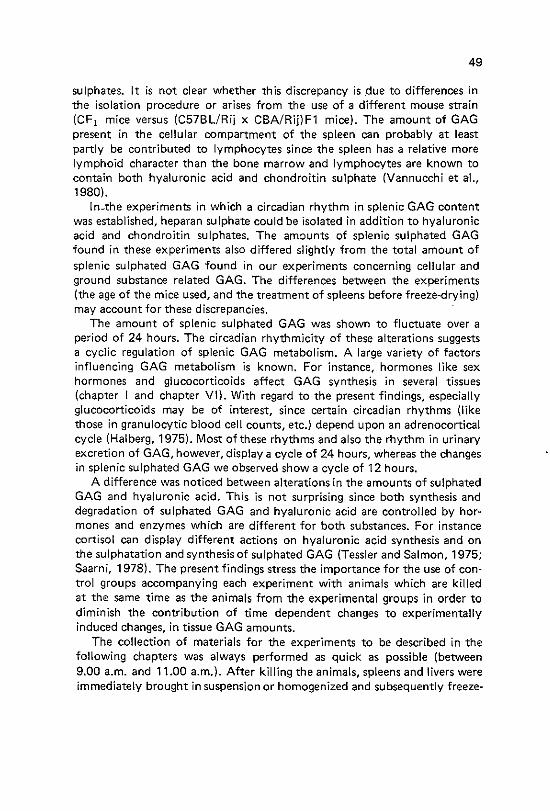
49
sulphates. It is not clear whether this discrepancy is .due to differences in the isolation procedure or arises from the use of a different mouse strain (CF 1 mice versus (C57BL/Rij x CBA/Rij)F1 mice). The amount of GAG present in the cellular compartment of the spleen can probably at least partly be contributed to lymphocytes since the spleeri has a relative more lymphoid character than the bone marrow and lymphocytes are known to contain both hyaluronic acid and chondroitin sulphate (Vannucchi et aL, 1980).
lnythe experiments in which a circadian rhythm in splenic GAG content was established, heparan sulphate could be isolated in addition to hyaluronic acid and chondroitin sulphates. The amounts of splenic sulphated GAG found in these experiments also differed slightly from the total amount of splenic sulphated GAG found in our experiments concerning cellular and ground substance related GAG. The differences between the experiments (the age of the mice used, and the treatment of spleens before freeze-drying) may account for these discrepancies.
The amount of splenic sulphated GAG was shown to fluctuate over a period of 24 hours. The circadian rhythmicity of these alterations suggests a cyclic regulation of splenic GAG metabolism. A large variety of factors influencing GAG metabolism is known. For instance, hormones like sex hormones and glucocorticoids affect GAG synthesis in several tissues (chapter I and chapter VI). With regard to the present findings, especially glucocorticoids may be of interest, since certain circadian rhythms (like those in granulocytic blood cell counts, etc.) depend upon an adrenocortical cycle (Halberg, 1975). Most ofthese rhythms and also the rhythm in urinary excretion of GAG, however, display a cycle of 24 hours, whereas the changes in splenic sulphated GAG we observed show a cycle of 12 hours.
A difference was noticed between alterations in the amounts of sulphated GAG and hyaluronic acid. This is not surprising since both synthesis and degradation of sulphated GAG and hyaluronic acid are controlled by hormones and enzymes which are different for both substances. For instance cortisol can display different actions on hyaluronic acid synthesis and on the sulphatation and synthesis of sulphated GAG (Tessler and Salmon, 1975; Saarni, 1978). The present findings stress the importance for the use of control groups accompanying each experiment with animals which are killed at the same time as the animals from the experimental groups in order to diminish the contribution of time dependent changes to experimentally induced changes, in tissue GAG amounts.
The collection of materials for the experiments to be described in the following chapters was always performed as quick as possible (between 9.00 a.m. and 11.00 a.m.). After killing the animals, spleens and livers were immediately brought in suspension or homogenized and subsequently freeze-

50
dried. The collection of bone marrow, however, could last several hours. Therefore, tibiae and femora were quickly removed from all animals and kept in melting ice until they could be flushed.
In conclusion GAG could be ·ISolated from spleens and bone marrow and be analyzed quantitatively and qualitatively. The method used yielded re· producable figures, which were at least partly consistent with data from literature. The reliability of the methods used to separate cellular and intercellular GAG is questionable and the data evolving should therefore be con· sidered carefully. There appears to be a rhythmicity in the amounts of splenic GAG during a 24 hours period.
IV CONTENT OF GLYCOSAMINOGLYCANS IN BONE MARROW AND SPLEEN UNDER ANAEMIC AND
POL YCYTHAEMIC CONDITIONS
IV~1 Introduction
51
Histochemical studies indicated a correlation between a low erythropoietic activity, as found in polycythaemic mice, with a high sulphated GAG level in the stroma of the haemopoietic organs (McCuskey et al., 1972). These findings and the results from similar studies on anaemic mice led McCuskey et al. (1972) to postulate that high concentrations of sulphated GAG in the haemopoietic microenvironment do not support erythroid differentiation but allow cell proliferation and granuloid differentiation. Low sulphated GAG levels would be favourable for erythropoietic maturation. This concept was supported by the results of several investigations perfor:med by different groups. For instance, in vitro an inhibitory effect of high levels of sulphated GAG on CFU-E formation has been demonstrated whereas no such an inhibition was observed on the CFU-C formation (Pioemacher et al., 1978). Schrock et al. (1973) reported elevated levels of biochemically determined hyaluronic acid and chondroitin sulphates in the spleen, 6 days after induction of polycythaemia.
In this chapter studies are described to test the validity of the hypothesis of McCuskey by investigating whether, after induction of polycythaemia and anaemia, a relation exists between the haemopoietic activity and the content of GAG in the bone marrow and in the spleen. We have examined time dependent changes in GAG concentration and haemopoiesis following manipulation of the erythron.
IV-2 Materials and methods
Treatment. Anaemia was induced by withdrawal of 1 ml blood from the orbital plexus. Polycythaemia was induced by two intraperitoneal injections on consecutive days of 0.5 ml of packed red blood cells (without nucleated cells) which were previously washed with phosphate buffered saline.
Determinations. Haematological and biochemical determinations on bone marrow were done on day 5 after induction of anaemia and on day 7 after
52
induction of polycythaemia. The same determinations were done on spleen each day until day 10, and on day 21 after induction of anaemia, and on seven consecutive days following the induction of polycythaemia. The following parameters were used: Splenic dry weight, haematocrit CFU-E, CFU-C (only in the spleen), erythroblast numbers (only in case of anaemia) and GAG levels. For each item to be determined, 3-6 groups consisting of 3 mice per group were used. CFU-E and CFU-C determinations were done on the pooled cell suspensions of 3 mice; haematocrit and the erythroblast numbers on individual mice. Determinations of splenic dry weights and GAG amounts were based on 3-7 separate determinations on 20 pooled spleens per experimental point. The methods for determinations of CFU-E, CFU-C, erythroblasts and types and amounts of GAG were performed as described in chapter II.
Statistics. Statistical significance was tested using the Wilcoxon~Mann & Whitney test. Multiple regression analyses (ordinary leased squares) and correlation coefficients between values representing percentages of control of sulphated GAG concentrations and haematological parameters in the spleen during anaemia and polycythaemia were obtained by use of an I.B.M. 370 computer.
JV-3 Results
IV~3~1 Spleen. ·Changes in glycosaminoglycan amount and haem ate logical parameters following induction of anaemia
Haematological parameters_ (Figure IV-1). One day after induction of anaemi·a the haematocrit was found to be lowered to about 62% of the con~ trot value. Control values (49 blood volume%) were regained after a period of about 10 days. Splenic dry weight increased to a maximum of 180% of its control value on day 4 after induction of anaemia and returned to its control value of about 19 mg between day 10 and 21. CFU-E numbers increased during the first 4 days following induction of anaemia up to about 1800% of control values. After a decrease on day 5 a second peak was reached on day 6, followed by a decrease to control values of± 2 x 10⁴ CFU-E per spleen, which were reached between day 1 0 and 21. The curve representing changes in splenic erythroblast numbers was similar to the curve of the CFU~E changes, but peaks were one day delayed. A rapid increase in splenic CFU-C numbers to a maximum of 1100% of the control values on day 3 could be observed. Thereafter the numbers gradually decreased to control values of about 500 CFU-C per spleen on day 21.
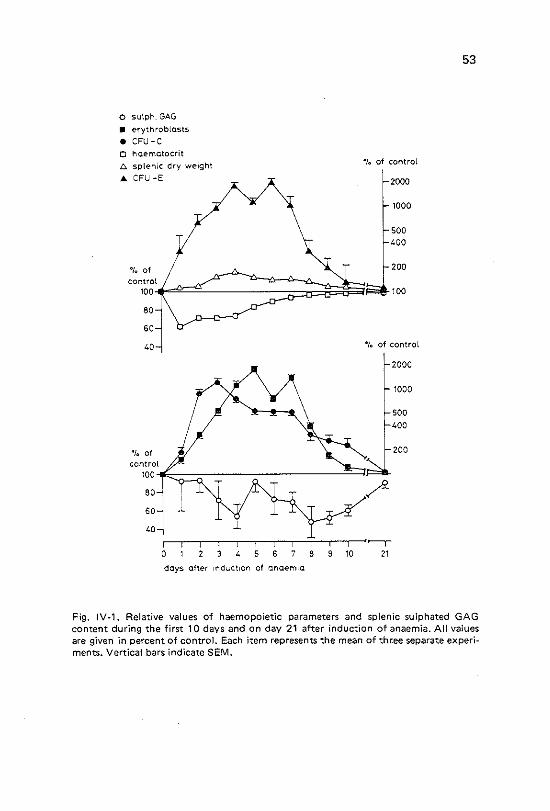
0 sutph. GAG
• erythrob!asts
• CFU -C
0 ho~matocrit
!::. splenic dry weight
A CFU -E
T
40
•1. of
"1. of control
2000
1000
500 400
•t. of control
2000
1000
500 400
200
contro:·'rf~;::::;:;--::---;:;--------:!;:~~~ 100-
80
so 40 r-~,_-,-,-,-,--~~,--,~r-r 0 345678910 21
days after 1nduct10n of anaemia
53
Fig, IV-1. Relative values of haemopoietic parameters and splenic sulphated GAG content during the first 10 days and on day 21 after induction of anaemia. All values are given in percent of control. Each item represents the mean of three separate experiments. Vertical bars indicate SEM.
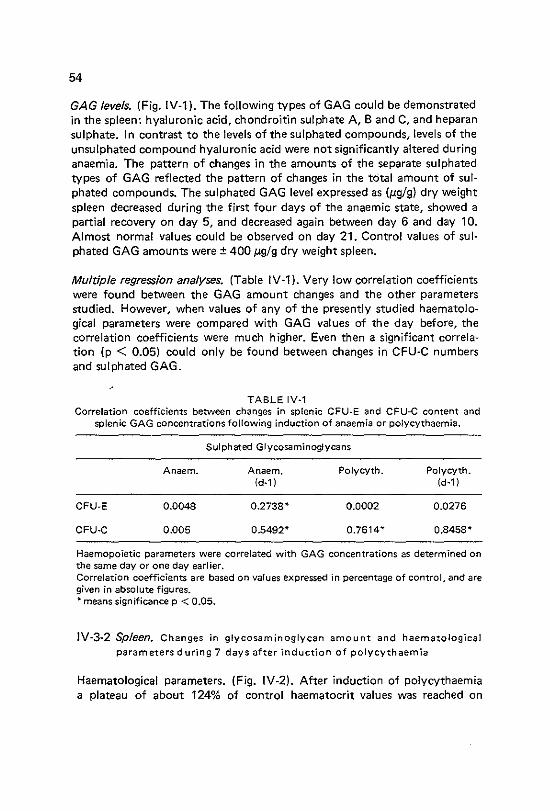
54
GAG levels. (Fig. IV-1 ). The following types of GAG could be demonstrated in the spleen: hyaluronic acid, chondroitin sulphate A, Band C, and heparan sulphate. In contrast to the levels of the sulphated compounds, levels of the unsulphated compound hyaluronic acid were not significantly altered during anaemia. The pattern of changes ln the amounts of the separate sulphated types of GAG reflected the pattern of changes in the total amount of sulphated compounds. The sulphated GAG level expressed as (f.!g/g) dry weight spleen decreased during the first four days of the anaemic state, showed a partial recovery on day 5, and decreased again between day 6 and day 10. Almost normal values could be observed on day 21. Control values of sulphated GAG amounts were± 400 f.!g/g dry weight spleen.
Multiple regression analyses. (Table IV-1). Very low correlation coefficients were found between the GAG amount changes and the other parameters studied. However, when values of any of the presently studied haematological parameters were compared with GAG values of the day before, the correlation coefficients were much higher. Even then a significant correlation (p < 0.05) could only be found between changes in CFU-C numbers and sulphated GAG.
TABLE IV·1 Correlation coefficients between changes in splenic CFU-E and CFU·C content and
splenic GAG concentrations following induction of anaemia or polycythaemia.
Sulphated Glycosaminoglycans
Anaem. Anaem. Polycyth. Polycyth. (d·1) ld·1 I
CFU-E 0.0048 0.2738. 0.0002 0.0276
CFU·C 0.005 0.5492* 0.7614* 0.8458•
Haemopoietic parameters were correlated with GAG concentrations as determined on the same day or one day earlier. Correlation coefficients are based on values expressed in percentage of control, and are given in absolute figures. *means significance p < 0.05.
IV·3·2 Spleen. Changes in glycosaminoglycan amount and haematological parameters during 7 days after induction of polycythaemia
Haematological parameters. (Fig. IV-2). After induction of polycythaemia a plateau of about 124% of control haematocrit values was reached on
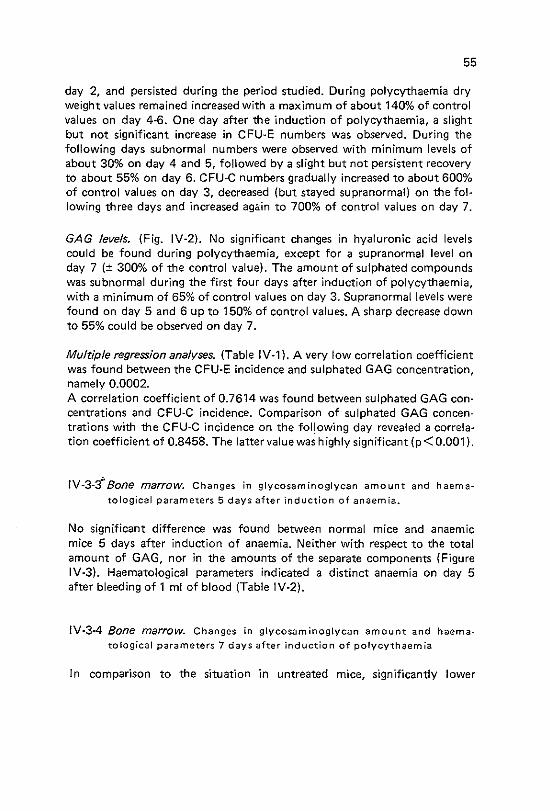
55
day 2, and persisted during the period studied. During polycythaemia dry weight values remained increased with a maximum of about 140% of control values on day 4-6. One day after the induction of polycythaemia, a slight but not significant increase in CFU-E numbers was observed. During the following days subnormal numbers were observed with minimum levels of about 30% on day 4 and 5, followed by a slight but not persistent recovery to about 55% on day 6. CFU-C numbers gradually increased to about 600% of control values on day 3, decreased (but stayed supranormal) on the following three days and increased again to 700% of control values on day 7.
GAG levels. (Fig. IV-2). No significant changes in hyaluronic acid levels could be found during polycythaemia, except for a supranormal level on day 7 (± 300% of the control value). The amount of sulphated compounds was subnormal during the first four days after induction of polycythaemia, with a minimum of 65% of control values on day 3. Supranormallevels were found on day 5 and 6 up to 150% of control values. A sharp decrease down to 55% could be observed on day 7.
Multiple regression analyses. (Table IV -1). A very low correlation coefficient was found between the CFU-E incidence and sulphated GAG concentration, namely 0.0002. A correlation coefficient of 0.7614 was found between sulphated GAG concentrations and CFU-C incidence. Comparison of sulphated GAG concentrations with the CFU-C incidence on the fol]owing day revealed a correlation coefficient of 0.8458. The latter value was highly significant (p< 0.001).
IV-3-3.:. Bone marrow. Changes in glycosaminoglycan amount and haem a
to logical parameters 5 days after induction of anaemia.
No significant difference was found between normal mice and anaemic mice 5 days after induction of anaemia. Neither with respect to the total amount of GAG, nor in the amounts of the separate components (Figure IV-3). Haematological parameters indicated a distinct anaemia on day 5 after bleeding of 1 ml of blood (Table IV-2).
IV-3-4 Bone marrow. Changes in glycosaminoglycan amount and haema
tological parameters 7 days after induction of polycythaemia
In comparison to the situation in untreated mice, significantly lower

56
0 sulph GAG
6 sple-nic dey we-ight
"lo of • CFU -C
control ... CFU -E
D hae-matocrit 140
liO
100
80
60
40
20 "/o of control
120
100 .... ::::-----~.._-----l--r'-----"------'l---
80
60
40
20
0 2 3 4
days after InductiOn of polycythaemia
5 6 7
Fig. IV-2. Relative values of haemopoietic parameters and splenic sulphated GAG content during the first 7 days after induction of polycythaemia. All values are given in percent of control. Each item represents the mean of three separate experiments. Vertical bars indicate SEM.

57
amounts of total GAG were found in animals 7 days after induction of polycythaemia. This decrease was due to a very strong decrease of all chondroitin sulphate levels; hyaluronic acid levels, in contrast, were significantly increased (Figure IV-3). Haematological parameters confirmed the existence of a polycythaemic state in the treated animals (Table lV-2).
A= NORMAL 1 = TOTAL GAG 8 = Sd. ANAEMIC 2 = TOTAL CHONDROITIN SULPHATE$
C = 7d. POLYCYTHAEMIC 3 =CHONDROITIN SULPHATE C ,AJ9 GAG per g dry
weight bone marrow
1200
1000
800
600
400
200
4 =CHONDROITIN SULPHATE A 5 = CHONDROITIN SULPHATE B 6 =HYALURONIC ACID
o~-L~-L~~--~-L~~-Li--L~~~~L__
123456 123456 A 8
123456 c
Fig. lV-3. Amount of GAG in bone marrow of normal, anaemic and polycythaemic mice, expressed in microgram per gram dry weight. Values are calculated from 4 groups of 20 mice for the normal and anaemic state, and from 3 groups of 20 mice for the polycythaemic state. A"' normal; B "'·5 days anaemic; C"' 7 days polycythaemic; 1 =total GAG; 2 =total chondroitiri sulphates; 3 = chondroitin sulphate C; 4 = chondroitin sulphate A; 5 = chondroitin sulphate B; 6 = hyaluronic acid. *means significantly different from "normal" using the Wilcoxon test.
Glycosaminoglycans in peripheral blood. Since GAG have been reported to be present in blood, it is possible that blood contained by the haemopoietic organs contribute significantly to the amounts of GAG present in the organs. We therefore studied the amounts of GAG extractable from the blood. Only relatively small amounts of GAG could be found in peripheral blood. Serum samples contained GAG in an amount of 140!lg per gram dry weight (which corresponds with the weight of about 12 ml serum) consis· ting of about 80% of chondroitin sulphate C and 20% hyaluronic acid. Packed blood cells including erythrocytes, leucocytes and platelets con·
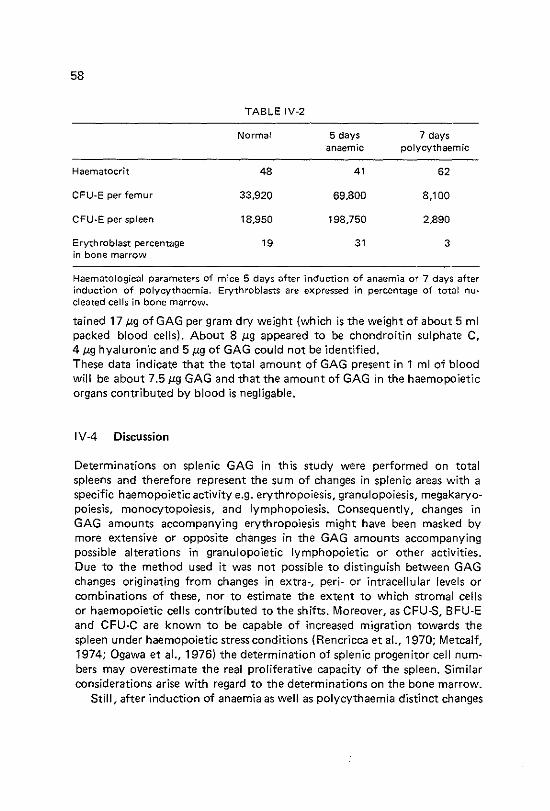
58
TABLE IV-2
Normal 5 days 7 days anaemic polycythaemic
Haematocrit 48 41 62
CFU·E per femur 33,920 69,800 8,100
CFU-E per spleen 18,950 198,750 2,890
Erythroblast percentage 19 31 3 in bone marrow
Haematological parameters of mice 5 days after induction of anaem·la or 7 days after induction of polycythaemia. Erythroblasts are expressed in percentage of total nucleated cells in bone marrow.
tained 17 Jl-g of GAG per gram dry weight (which is the weight of about 5 ml packed blood cells). About 8 11-g appeared to be chondroitin sulphate C, 4 11-g hyaluronic and 5 Jl-g of GAG could not be identified. These data indicate that the total amount of GAG present in 1 ml of blood will be about 7.5 11-g GAG and that the amount of GAG in the haemopoietic organs contributed by blood is negligable.
IV4 Discussion
Determinations on splenic GAG in this study were performed on total spleens and therefore represent the sum of changes in splenic areas with a specific haemopoietic activity e.g. erythropoiesis, granulopoiesis, megakaryopoiesis, monocytopoiesis, and lymphopoiesis. Consequently, changes in GAG amounts accompanying erythropoiesis might have been masked by more extensive or opposite changes in the GAG amounts accompanying possible alterations in granulopoietic lymphopoietic or other activities. Due to the method used it was not possible to distinguish between GAG changes originating from changes in extra-, peri- or intracellular levels or combinations of these, nor to estimate the extent to which stromal cells or haemopoietic cells contributed to the shifts. Moreover, as CFU-S, BFU-E and CFU-C are known to be capable of increased migration towards the spleen under haemopoietic stress conditions (Rencricca et al., 1970; Metcalf, 1974; Ogawa et al., 1976) the determination of splenic progenitor cell numbers may overestimate the real proliferative capacity of the spleen. Similar considerations arise with regard to the determinations on the bone marrow.
Still, after induction of anaemia as well as polycythaemia distinct changes
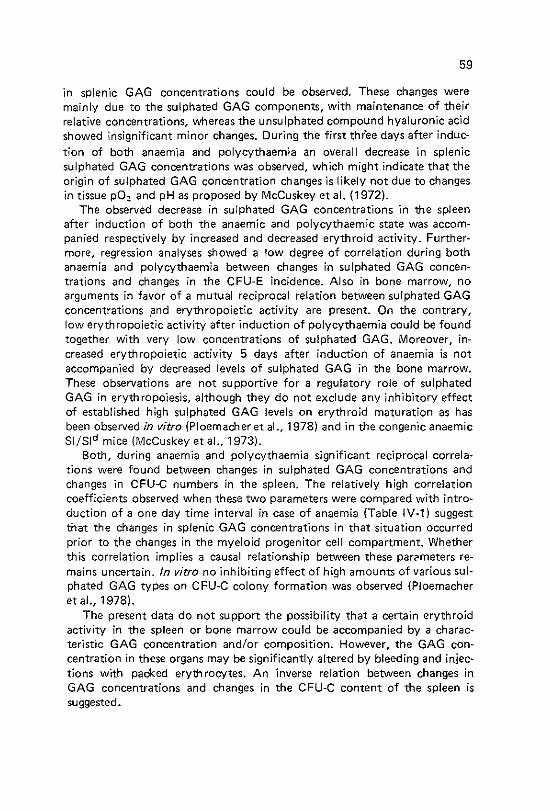
59
in splenic GAG concentrations could be observed. These changes were mainly due to the sulphated GAG components, with maintenance of their relative concentrations, whereas the unsulphated compound hyaluronic acid showed insignificant minor changes. During the first thr'ee days after indue~
tion of both anaemia and polycythaemia an overall decrease in splenic sulphated GAG concentrations was observed, which might indicate that the origin of sulphated GAG concentration changes is likely not due to changes in tissue p02 and pH as proposed by McCuskey et al. (1972).
The observed decrease in sulphated GAG concentrations in the spleen after induction of both the anaemic and polycythaemic state was accom~ panied respectively by increased and decreased erythroid activity. Furthermore, regression analyses showed a low degree of correlation during both anaemia and polycythaemia between changes in sulphated GAG concentrations and changes in the CFU-E incidence. Also in bone marrow, no arguments in favor of a mutual reciprocal relation between sulphated GAG concentrations ,and erythropoietic activity are present. On the contrary, low erythropoietic activity after induction of polycythaemia could be found together with very low concentrations of sulphated GAG. Moreover, increased erythropoietic activity 5 days after induction of anaemia is not accompanied by decreased levels of sulphated GAG in the bone marrow. These observations are not supportive for a regulatory role of sulphated GAG in erythropoiesis, although they do not exclude any inhibitory effect of established high sulphated GAG levels on erythroid maturation as has been observed in vitro {Pioemacheret al., 1978) and in the congenic anaemic SI/Sid mice (McCuskey et al., 1973).
Both, during anaemia and polycythaemia significant reciprocal correlations were found between changes in sulphated GAG concentrations and changes in CFU-C numbers in the spleen. The relatively high correlation coefficients observed when these two parameters were compared with introduction of a one day time interval in case of anaemia {Table IV-1) suggest that the changes in splenic GAG concentrations in that situation occurred prior to the changes in the myeloid progenitor cell compartment. Whether this correlation implies a causal relationship between these parc•meters remains uncertain. In vitro no inhibiting effect of high amounts of various sulphated GAG types on CFU-C colony formation was observed (Pioemacher et al., 1978).
The present data do not support the possibility that a certain erythroid activity in the spleen or bone marrow could be accompanied by a characteristic GAG concentration and/or composition. However, the GAG concentration in these organs may be significantly altered by bleeding and injections with packed erythrocytes. An inverse relation between changes in GAG concentrations and changes in the CFU-C content of the spleen is suggested.

;. .. ~.
60
v GL YCOSAMINOGL YCAN LEVELS IN RELATION TO PHENYLHYDRAZINE INDUCED ERYTHROPOIESIS
IN THE MOUSE LIVER
V~1 Introduction
The liver of normal adult mice does not sustain erythropoiesis. In some cases, however (for instance in splenectomized mice exposed to hypoxia (Bozzini et al., 1970); in mice treated with phenylhydrazine (PHZ); or in chronically irradiated mice (Testa & Hendry, 1977), the liver does sustain erythropoiesis. This phenomenon indicates a re--establishment of a suitable erythroid microenvironment in the organ which has been involved in erythropoiesis for two or three weeks in the fetal and postnatal life (Borghese, 1959; Silini et al., 1967).
In the work presented in this chapter we have investigated whether the induction of erythropoietic activity in the liver by phenylhydrazine treatment includes a change in GAG levels in the liver, and whether the course of such changes follows the course of erythropoietic events during the first 9 days after induction.
V~2 Materials and methods
PHZ~treatment. Haemolytic anaemia was induced by 4 daily ir'!traperitoneal , injections of 1 mg of phenylhydrazine chloride (PHZ) (Merck, Darmstadt).
The day of the first injection was designated as day zero. On each day until day 9, liver GAG levels were determined.
Bleeding. Haemorrhagic anaemia was induced by removing 1 ml of blood out of the orbital plexus. The day of bleeding was designated as day zero. On each day until day 9, liver GAG levels were determined.
GAG determinations. Liver suspensions were-made from three pooled whole livers, and used for GAG determinations. Each point represents 4~6 separate determinations. Significance was tested using the Wilcoxon~Mann & Whitney test. Control values were determined on untreated mice.
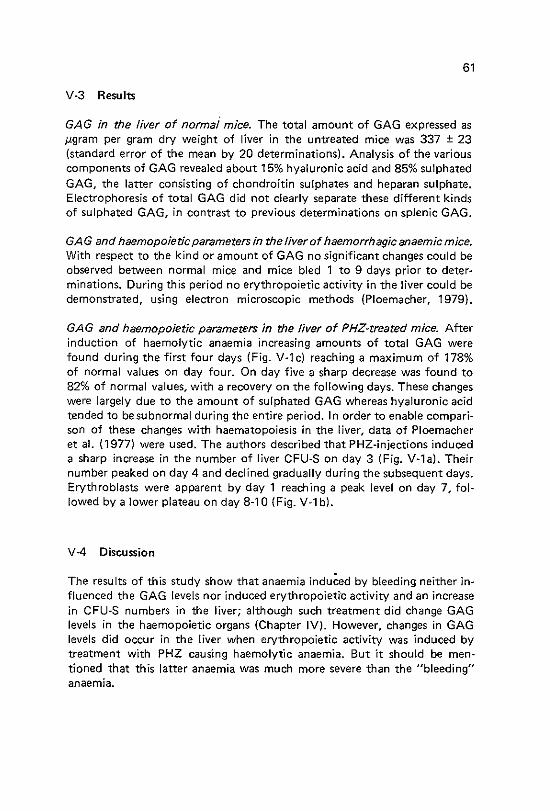
61
V-3 Results
GAG in the liver of normal mice. The total amount of GAG expressed as J..Lgram per gram dry weight of liver in the untreated mice was 337 ± 23 {standard error of the mean by 20 determinations). Analysis of the various components of GAG revealed about 15% hyaluronic acid and 85% sulphated GAG, the latter consisting of chondroitin sulphates and heparan sulphate. Electrophoresis of total GAG did not clearly separate these different kinds of sulphated GAG, in contrast to previous determinations on splenic GAG.
GAG and haemopoietic parameters in the liver of haemorrhagic anaemic mice. With respect to the kind or amount of GAG no significant changes could be observed between normal mice and mice bled 1 to 9 days prior to deter~ minations. During this period no erythropoietic activity in the liver could be demonstrated, using electron microscopic methods {Pioemacher, 1979).
GAG and haemopoietic parameters in the liver of PHZ~treated mice. After induction of haemolytic anaemia increasing amounts of total GAG were found during the first four days {Fig. V~1c) reaching a maximum of 178% of normal values on day four. On day five a sharp decrease was found to 82% of normal values, with a recovery on the following days. These changes were largely due to the amount of sulphated GAG whereas hyaluronic acid tended to be subnormal during the entire period. In order to enable compari~ son of these changes with haematopoiesis in the liver, data of Ploemacher et al. { 1977) were used. The authors described that PHZ~injections induced a sharp increase in the number of liver CFU~S on day 3 (Fig. V~1a). Their number peaked on day 4 and declined gradually during the subsequent days. Erythroblasts were apparent by day 1 reaching a peak level on day 7, fol~ lowed by a lower plateau on day 8-10 (Fig. V-1 b).
V -4 Discussion
The results of this study show that anaemia induced by bleeding neither in· fluenced the GAG levels nor induced erythropoieti'c activity and an increase in CFU-S numbers in the liver; although such treatment did change GAG levels in the haemopoietic organs {Chapter IV). However, changes in GAG levels did occur in the liver when erythropoietic activity was induced by treatment with PHZ causing haemolytic anaemia. But it should be mentioned that this latter anaemia was much more severe than the "bleeding" anaemia.
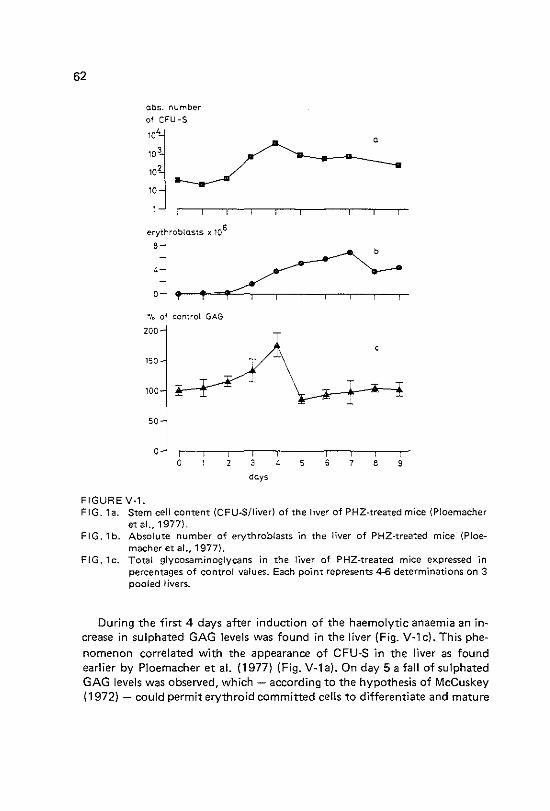
62
abs. number
of CFU -5
"1. of control GAG
200
150
100
so
0 0
FIGURE V-1.
3
days
4 5 6
a
7 8 9
FIG. 1a. Stem cell content (CFU.S/Iiver) of the liver of PHZ-treated mice (Pioemacher et al., 1 977).
FIG.1b. Absolute number of erythroblasts in the liver of PHZ-treated mice (Pioemacher et at., 1977).
FIG. 1c. Total glycosaminoglycans in the liver of PHZ-treated mice expressed in percentages of control values. Each po"1nt represents 4..S determinations on 3 pooled livers.
During the first 4 days after induction of the haemolytic anaemia an increase in sulphated GAG levels was found in the liver {Fig. V-1c). This phenomenon correlated with the appearance of CFU-S in the liver as found earlier by Ploemacher et al. (1977) (Fig. V-1 a). On day 5 a fall of sulphated GAG levels was observed, which- according to the hypothesis of McCuskey (1972) - could permit erythroid committed cells to differentiate and mature

63
into erythroblasts. Accordingly, erythroblast numbers in the liver reached maximum values on day 7 after the start of PHZ treatment.
The amount of hepatic GAG that we found in untreated F1 mice is fairly consistent with the amounts of hepatic GAG found in Swiss-Webster mice as described by Yatziv et al. (1 978). being± 400-500 !lg GAG per g dry weight.
The increase in sulphated GAG levels during th.e first four days after the beginning of PHZ-treatment cannot be due to degradation of erythrocytes, since no GAG can be found in erythrocytes preparations (Hakomori, 1965; Vannu.cchi, 1980). Severe hypoxia of the liver during the first days of the induced haemolytic anaemia might lead to a change towards sulphated GAG, but the sudden large decrease in sulphated GAG levels on day five does suggest that another mechanism regulates the amount of sulphated GAG synthesized.
64
VI CORRELATIONS BETWEEN GL YCOSAMINOGL YCAN
LEVELS AND HAEMOPOIETIC ACTIVITY IN THE SPLEEN AND BONE MARROW AFTER
ADRENALECTOMY, CASTRATION AND HORMONE INJECTION
Vl-1 Introduction
The metabolism of GAG can be influenced by a large variety of factors (Chapter 1-3-4). Especially hormones have been described to exercise actions on the GAG content in different tissues (Lebovitz & Eisenbarth, 1975; Sirek et al., 1978a, 1978b) and on the turnover of GAG in connective tissue {Dziewiatkowski, 1964). Examples of hormones which have been described to interact with GAG metabolism are thyroid hormones (Dziewiatkowski, 1951), follicle-stimulating hormone (Eppig, 1979), insulin (Hajek & Solursh, 1975), follicle-stimulating hormone (Guri & Bernstein, 1964), glycocorticoids (Whitehouse & Bostrom, 1962; Ebert & Prockop, 1967; Anastassiades & Qziewiatkowski, 1970), and sex hormones (Priest & Koplitz, 1962; Sirek et al., 1977). Reports concerning the action of glucocorticoids on GAG metabolism are contradictory. In vitro~ depressed sulphated GAG synthesis and GAG sulphation were reported after administration of cortisone and related compounds to cultures of cartilage (Whitehouse & Lash, 1961; Ebert & Prockop, 1963; Schrijver, 1965; Barret et al., 1966) and to cultures of fibroblasts (Layton, 1951; Castor & Dorstewitz, 1966; Tessler & Salmon, 1975). But enhanced sulphate uptake and increased amounts of GAG after administration of cortisone on in vitro cultures of chick embryo femora are also described (Calcagno et al., 1970). According to Saarni (1970) two sensitivity levels of GAG metabolism in cultures of fibroblasts can exist: low cortisol concentrations decreasing only hyaluronic acid synthesis; and high cortisol concentrations decreasing both hyaluronic acid and sulphated GAG synthesis (see alsoSaarni etal., 1978). Most publications con· cerning relations between corticosteroids and GAG synthesis in vivo, describe an inhibitor action of these substances on the formation of sulphated GAG in several tissues (Schiller & Dorfman, 1957; Anastassiades & Dziewiatkowski, 1970) but an enhancing action of prednisolone on GAG amounts in cartilage has also been described (Oiah & Kostenszky, 1976).

65
Reports on the effects of sex hormones on GAG metabolism are not uniform either. Oestrogens have been described to increase the amount of hyaluronic acid in the abdominal aorta (Sirek eta\., 1977) and in the skin of mice, While chondroitin sulphates were left unaffected (Sobel et al., 1965; Grosman eta!., 1971; Usui et al., 1977). However, there seems to be a difference in the effect of oestrogens on the GAG amount of the skin depen~ dent on the location of the skin (Warren & Fagan, 1960). An inhibiting action on the synthesis of GAG in costal cartilage and aorta by oestradiol have been described by Priest and Koplitz (1962). Kofoed eta!. (1970) measUred the effects of both castration and testosterone treatment on the concentration and synthesis of GAG present in rat tracheal cartilage. Tes~ tosterone increased hyaluronic acid concentrations, whereas the amount of sulphated GAG was unaffected. This action of testosterone on hyaluronic acid could be confirmed by Usui et al. for mouse skin (Usui et al., 1977). In contrast, Sirek et al. (1977) described an increase in sulphated GAG in the canine aorta after injections of testosterone.
Thus, although both corticosteroids and sex hormones may affect GAG metabolism in general, the mode of action appears to be dependent on the organ studied, the number of injections and doses used and many other conditions.
Besides the action of erythropoietin as primary hormonal regulator of erythropoiesis, many other hormones have been shown to influence haemopoiesis (Jepson & Lowenstein, 1967; Golde et al., 1977; Adamson et al., 1978; Chapter 1-2-1). Especially corticoids and sex hormones may have important effects on haemopoiesis. For instance, according to Golde et al. (1976) dexamethasone increases erythroid colony formation in vitro and a glucocorticoid receptor mechanism on erythroid progenitor cells has been suggested. On the other hand, dexamethasone appeared to be a potent inhibitor of cloning of murine erythroleukemia cells (Golde, 1978) and cortisol added to CFU-E cultures at 1 o" M markedly inhibited colony for· mation (Singer et al., 1976). Adrenalectomy has been reported notto affect the proliferative rate of haemopoietic stem cells, but it would result in increased migration of stem cells from the bone marrow to the spleen (Khaitov et al., 1975). Androgenic steroids have been demonstrated to enhance the production of erythropoietin in the kidney (Gordon et al., 1968; Fischer et al., 1971; Zanjani & Banisadre, 1979; Malgor & Fischer, 1980) and to increase the number of erythroid colony forming cells (CFU-E) in the bone marrow (Moriyama & Fischer, 1975; Singer et al., 1976). Other reports describe an action of androgenic hormones also on the level of CFU-S and BFU-E (Byron, 1972; Peschle et al., 1977), and especially 5 ~-steroids would act preferentially on very primitive erythroid progenitor cells (Ohno &
66
Fischer, 1978; Urabe et al., 1979). Some reports also describe the depression of erythropoiesis following orchiectomy (Crafts, 1946; Van Dyke et al., 1954).
In this chapter experiments are described which are based on the above mentioned data, indicating that certain hormones may affect both haemo~ poiesis and GAG metabolism. It must be stressed that this study does not pretent to investigate the influence of hormones on GAG metabolism in general, or the influence of hormones on haemopoiesis, but that these possible influences served as a tool in studying the possible relationship between haemopoiesis and GAG. For instance, disturbances in certain hormone levels which are accompanied by increased sulphated GAG levels in the haemopoietic organs, would (according to the hypothesis of McCuskey et al., 1972) be unfavourable for erythropoiesis, whereas the establishment of de~ creased sulphated GAG levels would permit increased erythropoiesis. In order to induce disturbances in hormone levels, mice were subjected to adrenalectomy, castration and/or hormone injections. Subsequently, deter~ minations of GAG amounts, and CFU-E and CFU-C numbers in spleen and bone marrow were performed.
Vl-2 Materials and methods
Treatment. Determinations were performed on mke of the following experimental groups: I. castrated mice; II. castrated mice injected with tes~ tosterone; Ill. untreated mice injected with testosterone; IV. untreated mice injected with oestradiol; V. adrenalectomized mice; VI. adrenalectomized mice injected with hydrocortison. Sham treated or sham operated mice of similar age served as control groups and were killed at the same time as the mice of the corresponding experimental group. Adrenalectomy, castration and sham operations were performed in mice anaesthetized with Nembutal (Abbot S.A., Sain·Remy-Sur·Avre, France) (70 mg/kg body weight i.p.). Adrenalectomized mice had 0.9% saline for drinking water. Between (sham) operations and determinations of further (sham) treatment a 3 month interval for adaptation was maintained. The day of determination was designated as day 0. Hormone injections were given on day -3, -2 and -1. Doses of hormone injections were for testosterone (17/3-·hydroxyandrosten· (4)-on-(3)) (Merck, Darmstadt) 10 JJ.g per mouse, sub·
cutaneously; for oestradiol (oestratrien -( 1 ,3,5( 1 0) )-diol-(3-17)3)) (Merck, Darmstadt), 10 JJ.g per mouse, subcutaneously; and for hydrocortison (11)3, 17a, 21 trihydroxy-pregnen-(4)-dion-(3,20)) (Merck, Darmstadt) 1 mg per mouse subcutaneously. Hormones were dissolved either in saline (hydrocortison) or in equal amounts of saline and Freund incomplete adjuvant
67
(Difco, Detroit) (testosterone and oestradiol). Determinations of splenic and bone marrow GAG and of CFU-E and CFU-C incidence were performed as described in chapter II. The experimental results are expressed as the percentage of their respective control values. Significance was tested with the Wilcoxon-Mann & Whitney test.
Vl-3 Results
The results are diagrammatically expressed in figure V-1. A significant decrease in the amount of splenic GAG was found after castration. This change implied a decrease both in each of the sulphated GAG (± 60% of control values) and in hyaluronic acid (± 10% of control values). A more dramatic decrease in bone marrow GAG was observed, also affecting both sulphated GAG and hyaluronic acid, the latter to a degree where it was no longer detectable. Injection of castrated mice with testosterone restored normal GAG values in the spleen, whereas sulphated GAG in the bone mar~ row increased but stayed significantly subnormal. After castration splenic CFU-E and CFU-C numbers were increased to respectively 300 and 400 per cent. After testosterone injection still increased numbers of splenic CFU~E and CFU-C were found, although less elevated than without injection. Castration lead to significantly decreased levels of bone marrow CFU-E and unaffected CFU·C numbers. Testosterone injection of castrated mice re~
suited in normal CFU-E and CFU-C numbers. Injection of testosterone or oestradiol in normal male mice did not significantly alter the amounts of GAG in the spleen or bone marrow. Tes~ tosterone injections increased CFU-C numbers both in spleen and bone marrow, increased CFU-E numbers in spleen but significantly decreased CFU~E numbers in bone marrow. Oestradiol injecttons did not affect CFU-E or CFU-C numbers in bone marrow but in the spleen an increase in CFU-E numbers could be observed together with decreased CFU~C numbers. Testosterone injection caused an increase in CFU-C numbers both in the spleen and in the bone marrow, whereas oestradiol injection lead to decreased CFU-C numbers in the spleen and in the bone marrow (the latter not significant). No significant differences could be found after adrenalectomy or after adrenalectomy followed by hydrocortisone injections with regard to the amounts of GAG in the spleen and in the bone marrow. Significant changes in haemopoietic parameters could only be found in the bone mar· row where both after adrenalectomy and after adrenalectomy and subsequent hydrocortisone injections very low CFU-E numbers could be found.
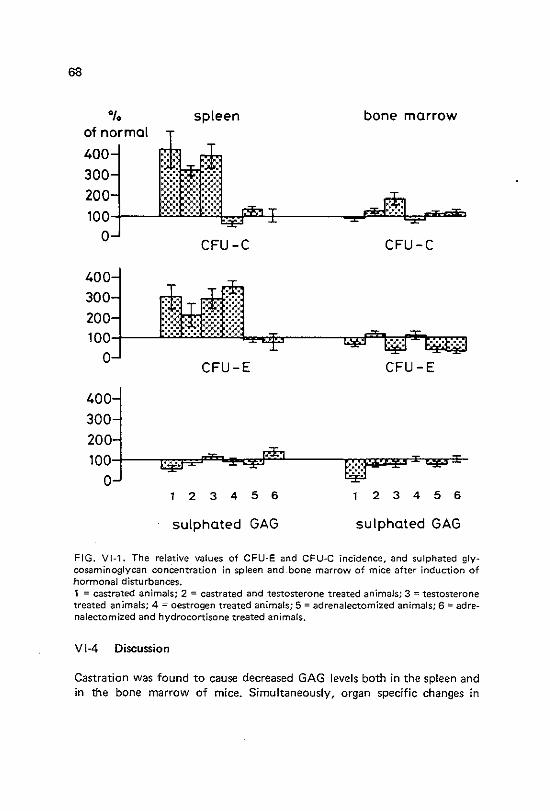
68
.,. spleen bone marrow of normal
CFU-C CFU-C
CFU-E
400 300 200 lOOi---~~~~~~----~~~~~~
0 2 3 4 5 6 2 3 4 5 6
sulphated GAG sulphated GAG
FIG. Vl-1. The relative values of CFU-E and CFU-C incidence, and sulphated glycosaminoglycan concentration in spleen and .bone marrow of mice after induction of hormonal disturbances. 1 =castrated animals; 2 = castrated and testosterone treated animals; 3 =testosterone treated animals; 4 =--oestrogen treated animals; 5 =adrenalectomized animals; 6 = adrenalectomized and hydrocortisone treated animals.
Vl-4 Discussion
Castration was found to cause decreased GAG levels both in the spleen and in the bone marrow of mice. Simultaneously, organ specific changes in
69
haemopoietic parameters could be observed. In this way, an increase in CFU-E numbers (spleen) as well as a decrease in CFU-E numbers (bone marrow) could be found in combination with decreased sulphated GAG concentrations. After castration, a similar situation is found between GAG amounts and CFU~C numbers, albeit with a not significant decrease in bone marrow CFU-C. Except for GAG in bone marrow of testosterone injected castrated mice, no significant alterations could be found in GAG amounts, neither in the spleen nor in the bone marrow. In some cases, however, significant changes in haemopoietic parameters could be observed. Dependent on the treatment and the organ studied these changes could include an increase in CFU-E numbers, a decrease in CFU-E numbers, an increase in CFU-C numbers or a decrease in CFU-C numbers. Thus, significant changes in granulopoiesis and erythropoiesis are possible without detectable chan·ges in the amounts of GAG present in the concerning organ. Moreover, increased as well as decreased erythropoietic activity and increased granulopoietic activity are possible within haemopoietic organs with decreased GAG concentrations (for instance after castration). The absence of quantitative detectable changes in splenic or bone marrow GAG after most treatments does not exclude changes in GAG lOcally in erythroid or gran uloid mrcroenvironments. It is not likely, however, that the increased splenic CFU-C numbers which were observed after castration were sustained by locally present, high sulphated GAG levels (as should be the case according the hypothesis of McCuskey et al. (1972). regarding the observation that a very strong decrease in sulphated GAG levels of the total spleen could be detected.
In conclusion: it is demonstrated that disturbances in certain hormone levels cause alterations both in haemopoietic parameters and in sulphated GAG levels. However, decreased sulphated GAG concentrations could be accompanied by increased erythropoiesis, but by decreased erythropoiesis as well. Although high sulphated GAG levels might inhibit erythroid maturation as was suggested by McCuskey et al. (1972) a regulatory action of these substances in a way as was suggested by these authors is not sustained by the present study.
70
VII CHANGES IN MURINE SPLENIC AND BONE MARROW GLYCOSAMINOGLYCANS DURING POST IRRADIATION
HAEMOPOIETIC REGENERATION
Vll-1 Introduction
The methods for quantification of GAG described in publications concerning the amounts and types of GAG present in haemopoietic organs subsequently to various disturbances of the haemopoietic steady state, are either of biochemical (Schrock et al., 1973; Noordegraaf & Ploemacher, 1979) or of histochemical nature (McCuskey & Meineke, 1973).
Although biochemical methods allow separation and objective quantification of GAG, they do not give information about the location of the GAG on the (sub) cellular level, nor about the origin of the GAG determined. This circumstance has impeded the association of GAG with certain stromal and haemopoietic cells. Histochemical determinations would permit a topographical identification, but they lack high specificity, their quantification is subjective, and also no information can be obtained about the origin of the GAG.
On the basis of histochemical studies McCuskey et al. (1972) made a distinction between GAG found in the stroma of haemopoietic tissues and GAG which envelope haemopoietic cells. The authors suggested that the pericellular GAG were produced by the haemopoietic cells themselves, whereas intercellular "stromal" GAG would be produced by stromal cells (McCuskey & Meineke, 1977).
It is not known as to which extent haemopoietic and stromal cells con~ tribute to the GAG level found in the haemopoietic organs, nor is it known which influence the presence of haemopoietic cells has on the supposed GAG metabolism of stromal cells in haemopoietic organs.
In order to investigate to what extent haemopoietic celts may contribute to the total amount of GAG present in haemopoietic organs under certain conditions, GAG were determined biochemically in spleens and bone marrow
of irradiated mice. The present model seems also suitable to obtain information about the interaction of stromal and haemopoietic cells with respect to the regulation of GAG levels in the haemopoietic environment by studying irradiated, and bone marrow injected irradiated mice.

71
VIIK2 Materials and methods
Treatment. Four groups of fourteen mice received a lethal dose of 850 rad whole body rOntgen irradiation generated in a Philips MUller MG 300 X-ray machine. Group 8, C and D were reconstituted within 4 hours after irradiation with respectively 4 x 1 05
, 4 x 1 06 and 4 x 1 07 syngeneic bone marrow cells. Group A did not receive any bone marrow cells. Determinations on the GAG content and the cellularity of spleens and femora and tibiae were performed at 1, 2, 4, 7 and 11 days after irrad:ation. The experiment was performed in duplicate. Data are given as the average of the two determinations. The separate experimental data did not deviate more than 30% from the average.
Determinations. Nucleated cell counts of spleen and bone marrow were determined on 4 separate mice within an experimental group. For each determination of splenic GAG cell suspensions of 10 spleens were pooled. For each determination of GAG in bone marrow, pooled cell suspensions from both tibiae and both femora of 10 mice were used.
Vll-3 Results
Spleen (Figure Vll-1). One day after irradiation with 850 rad, splenic nucleated cell counts were decreased to about J .7 x 107 (representing about 8% of control values). During the following days minor fluctuations in these numbers were observed. After a small rise on day 2 a further decrease to 1.2 x 10⁷ nucleated cells per spleen on day 7 and 1.5 x 10⁷ on day 11 was seen. In comparison with these figures significantly higher numbers (2.5 x 10⁷
) we.re fOund on day 1 after reconstitution. During the following days a rapid increase in these numbers could be observed in mice reconstituted with 4 x 10⁷ bone marrow cells. In mice reconstituted with 4 x 10⁶ or 4 x 10⁵ cells, however, some decrease in splenic nucleated cell counts was noticed until day 4 after which a recovery followed.
One day after irradiation, in non-reconstituted animals, the total amount of splenic GAG was reduced from 480 to 197 iJ.g per g dry weight. During the following days the amount increased to about 900 iJ.g/g on day 7. On day 11 after irradiation without reconstitution the GAG concentration was again subnormal (315 ,ug/g). The presence of bone marr.ow cells injected subsequently to irradiation led to a more rapid recovery of GAG concentration on day 2 and suppressed the large increase in GAG concentration observed in non-reconstituted mice on day 7. After bone marrow cell injection a tendency towards normal GAG values was noticable during the
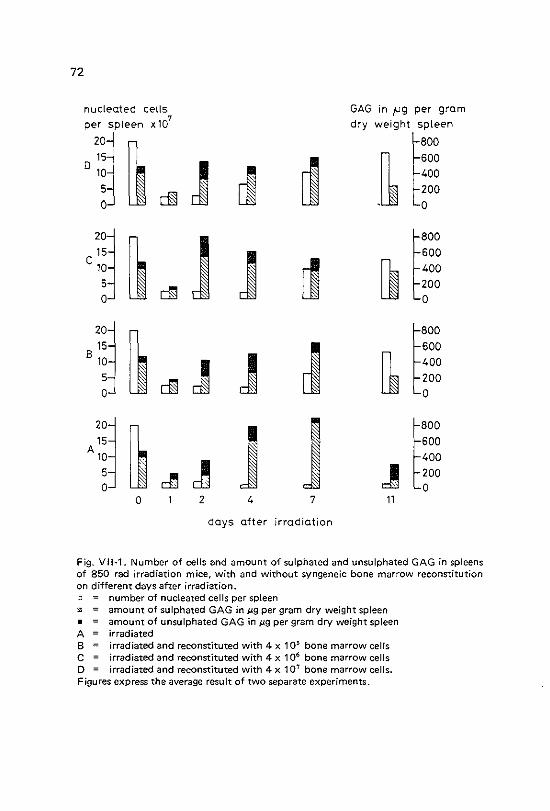
72
nucleated cells GAG in JJ9 per gram
per spleen x 107 dry weight spleen
,:~ ~ r J -~ 600
~ 400
d§ 200 0
'1 ~ J r 15
J 600
c 1~ ~ 400
dil 200 0
'"l ~ r 15
~ 600
8 1~ J J ~ 400
dl 200 0
'1 ~ J J r 15 600 A10
J 400
5 ~ J 200
0 0 0 2 4 7 11
days after irradiation
Fig, Vll~1. Number of cells and amount of sulphated and unsulphated GAG in spleens of 850 rad irradiation mice, with and without syngeneic bone marrow reconstitution on different days after irradiation. o "" number of nucleated cells per spleen lZl = amount of sulphated GAG in ,ug per gram dry weight spleen • = amount of unsulphated GAG in ,ug per gram dry weight spleen A irradiated B irradiated and reconstituted with 4 x 1 0 5 bone marrow cells C irradiated and reconstituted with 4 x 10⁶ bone marrow cells D irradiated and reconstituted with 4 x 10⁷ bone marrow cells. Figures express the average result of two separate experiments.
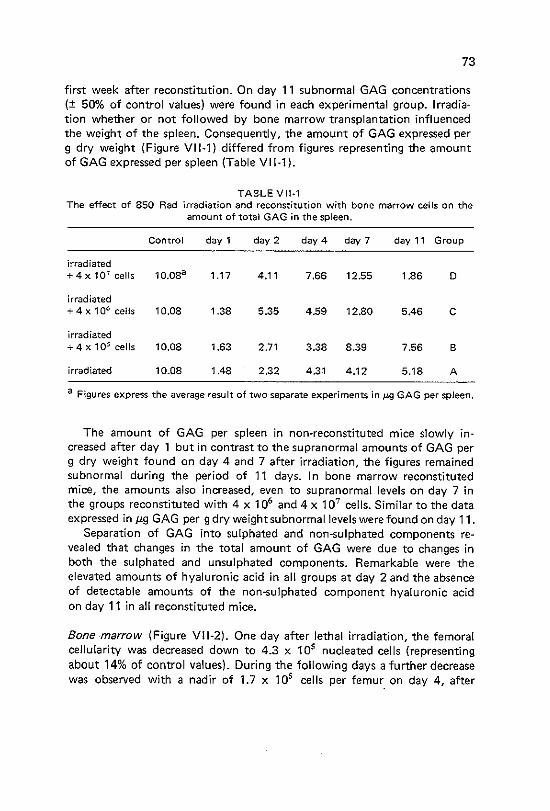
73
first week after reconstitution. On day 11 subnormal GAG concentrations {± 50% of control values) were found in each experimental group. lrradia~ tion whether or not followed by bone marrow transplantation influenced the weight of the spleen. Consequently, the amount of GAG expressed per g dry weight (Figure VII~ 1) differed from figures representing the amount of GAG expressed per spleen (Table Vll-1).
TABLE Vll~1 The effect of 850 Rad irradiation and reconstitution with bone marrow cells on the
amount of total GAG in the spleen.
Control day 1 day 2 day 4 day 7 day 11 Group
irradiated + 4 x 10' cells 10.088 1.17 4.11 7.66 12.55 1.86 0
irradiated +4x10⁶ cells 10.08 1.38 5.35 4.59 12.80 5.46 c
irradiated + 4 x 10⁵ cells 10.08 1.63 2.71 3.38 8.39 7.56 B
irradiated 10.08 1.48 2.32 4.31 4.12 5.18 A
a Figures express the average result of two separate experiments in ,ug GAG per spleen.
The amount of GAG per spleen in non~reconstituted mice slowly in~ creased after day 1 but in contrast to the supranormal amounts of GAG per g dry weight found on day 4 and 7 after irradiation, the figures remained subnormal during the period of 11 days. In bone marrow reconstituted mice, the amounts also increased, even to supranormal levels on day 7 in the groups reconstituted with 4 x 10⁶ and 4 x 10⁷ cells. Similar to the data expressed in j.lg GAG per g dry weight subnormal levels were found on day 11.
Separation of GAG into sulphated and non"'Sulphated components re~ vealed that changes in the total amount of GAG were due to changes in both the sulphated and unsulphated components. Remarkable were the elevated amounts of hyaluronic acid in all groups at day 2 and the absence of detectable amounts of the non~sulphated component hyaluronic acid on day 11 in all reconstituted mice.
Bone marrow (Figure Vll~2). One day after lethal irradiation, the femoral cellularity was decreased down to 4.3 X 10⁵ nucleated cells (representing about 14% of control values). During the following days a further decrease was observed with a nadir of 1.7 x 10⁵ cells per femur_ on day 4, after

74
nucleated cells GAG in f.l9 per gram
per femur x 107 dry weight bone marrow
~~ rn [1000
0 J ~ ~ 500
0, [b 0
i~ rn t1000
c ~ ~ 500
0!! &; 0
~~ rn t1000
B
li [b 500
dJ en 0
1~ rn [000
A
.J 500
crJ c::lll J'l ell! 0 0 2 4 7 11
days after irradiation
Fig. Vll·2. Number of cells and amount of sulphated and unsulphated GAG in bone marrow of 850 rad irradiated mice, with and without syngeneic bone marrow reconsti~ tution on different days after irradiation. o "' number of nucleated cells per femur IZI "" amount of sulphated GAG in ,ug per gram dry weight bone marrow • = amount of unsulphated GAG in ,ug per gram dry weight bone marrow A irradiated 8 irradiated and reconstituted with 4 x 10⁵ bone marrow cells C irradiated and reconstituted with 4 x 10⁶ bone marrow cells D irradiated and reconstituted with 4 x 10⁷ bone marrow cells Figures express the average result of two separate experiments.
which a slight increase took place. Reconstitution resulted in slightly higher cell numbers on day 1, but the nadir was still found on day 2 or 4. Increasing numbers of bone marrow cells injected Jed to a more rapid recovery of the femoral cellularity.
75
Since the dry weight values of the bone marrow from femora and tibiae subsequently to irradiation were unchanged, the changes in the concentration of GAG and the total GAG amount in these organs are identical.
After irradiation alone, subnormal amounts of GAG were found in bone marrow {either expressed per g dry weight or per femur plus tibiae) ranging from 20% of control values on day 1 to 40% of control values on day 4. Reconstitution significantly increased the amount of GAG on day 2 (up to 65% of control) especially after injection of 4 x 10⁶ or 4 x 10⁷ bone marrow cells. Normal values, however, were not reached. After day 2 fluctuations were observed, but the level was always subnormal. On day 11 no significant differences could be found between the total amount of GAG in bone marrow of mice with or without reconstitution. In accordance with the situation of the spleen, most of the changes in the GAG concentration on day 11 appeared to be due to changes in both sulphated and unsulphated components. As in the spleen, hyaluronic acid concentrations were highest in non~reconstituted mice.
VIlA Discussion
The present study shows that 850 rad X~ray irradiation of mice resulted in a strong decrease in GAG levels in the haemopoietic organs shortly after irradiation. Next, a recovery followed by a secondary relapse in GAG con~ ceritrations in these organs could be observed. Such relatively fast changes in GAG levels are very well possible, considering the high turnover rates of GAG in murine tissues (Phelps, 1973). The general effects of a lethal irradiation on haemopoietic organs might directly or indirectly influence the amount of GAG in these organs. For instance, the death of GAG producing haemopoietic cells, the action of lysosomal enzymes released by dying cells, and changes in the GAG metabolism of the remaining stromal cells are some possible events, which may have contributed to the decrease in the amounts of GAG in the haemopoietic organs shortly after irradiation. However, the presently reported subsequent increase in the GAG concen~ tration in the haemopoietic organs and especially in the spleen subsequent to irradiation alone, occurred in the absence of proliferating haemopoietic cells (no colonies could be observed) and hence must be attributed to the action of the remaining stromal cells.
It remains unclear which mechanism is involved in the regulation of stromal GAG production. Changes in their GAG metabolism may originate in the stromal cells themselves by a direct effect of irradiation. Alternatively, the changes may be induced by other influences on the stromal cells, like changes in pH, p02 , the absence of haemopoietic ceiJ.associated regulatory

76
factors, or by changes in systemic hormone levels. With respect to the latter possibility it should be noted that spleen and bone marrow show different patterns of post irradiation GAG concentrations, rendering this last pas~ sibility less likely. The differences in patterns of GAG concentrations be~ tween both organs might be related to the fact, that in contrast to the si~ tuation in the bone marrow, the spleen is predominantly lymphoid in character.
Introduction of proliferating haemopoietic cells in the irradiated haemo~ poietic organs altered the radiation induced GAG changes in the organs. Although our observations clearly show that injection of bone marrow cells induces changes in the GAG concentrations of irradiated haemopoietic organs, no linear relation was found between the amount of GAG and the number of cells present. However, the presence of only some seeded cells in the haemopoietic organs already led to a large increase in the amount of GAG per g dry weight tissue, as can be seen on day 2 in both the spleen and in the bone marrow (Fig. Vll-1 & Vll-2). These observations indicate that a small number of haemopoietic cells are able to induce alterations in the GAG metabolism of radioresistant stromal cells. Thus, a regulatory relation of haemopoietic cells with respect to the GAG metabolism of stromal cells is suggested. Supportive data from literature concerning an interaction of two cell types with respect to their GAG metabolism is provided by Merrilees and Scott (1980) describing an in vitro interaction of hepatocytes and fibroblasts with regard to their GAG metabolism. They concluded from their studies that changes in the GAG metabolism of cells Caused by cocultivation with another type of cell, affecting the ratio of sulphated versus unsulphated GAG, are most likely due to close proximity of the two cell types. Since also in our experiments changes in the mentioned ratios are shown, an interaction might be suggested between stromal cells and haemopoietic cells. Our observations indicate a relation between the GAG metabolism and the presence of haemopoietic cells. Whether absolute amounts of GAG or the ratio of sulphated versus unsulphated GAG or both are essential for the adaptation of the microenvironment for expanding haemopoietic tissue is not clear at present.
On day 11 after irradiation a secondary decrease in total amounts of GAG was observed independent or reconstitution. At the same time, a decrease in the amount of hyaluronic acid was noted only after reconstitution. These results suggest at least two mechanisms able to control the metabolism of stromal cells with respect to GAG. Firstly, a mechanism independent of haemopoietic cells, and secondly a mechanism dependent on the number of haemopoietic cells present in the animal. The last mechanism seemed sometimes to be subordinated to the first.
VIII GL YCOSAMINOGL YCAN LEVELS IN THE SPLEEN OF
CONGENITAL ANAEMIC MICE BEAR'ING THE Sli OR wv LOCUS
V 111-1 Introduction
77
Mouse strains with congenital, genetically determined macrocytic anaemias are often used for studies about normal and pathological physiology of haemopoiesis. Mice bearing the "Steel" gen for instance, have been de~ scribed to suffer from sterility, lack of hair pigmentation and macrocytic anaemia (Russell & Bernstein, 1966; Green, 1966). Over 30 mutations have been described at this locus. Of these, the mutations "Steel" (SL) and "Steei-Dickie" (SL d) have been most thoroughly investigated haematologically. SI/SI homozygotes die at 15 days of gestation, whereas heterozygotes carrying a wild type allele (SI/+ or Sid/+) and also Sid /Sid homozygotes are viable (Russell & Bernstein, 1966). Another, less well documented mutation is the "Steel-Jackson" (Sii). Heterozygotes of the genotype "SteeiJackson"/"Wild" (Sij/+) are viable and suffer from a mild macrocytic anaemia. The decreased haemopoiesis in mice bearing a mutation on the Sl locus is ·a result, in part, of the Steel lesion reducing the size of the compartments of the marrow haemopoietic stem cells (McCulloch et al., 1965; Sutherland et al., 1970; McCarthy 1975; McCarthy et al., 1977), the granulocytic precursor cells (CFU-C) (McCulloch et al., 1970; Knospe et al., 1976; Ruscetti et al., '1976), the megakaryocytes (Ebbe et al., 1973) and the erythroid precursor cells (CFU-E) (McCarthy et al., 1977). The stem cells of these mice, however, are normal, and transfusion of marrow or spleen cells from non~anaemic littermates does not cure these animals (Bernstein et al., 1968; Bernstein, 1970). The mice can be cured by subcutaneous trans~ plantation of whole spleens from non~anaemic littermates, indicating a microenvironmental defect in the recipient mice (Trentin, 1971) although other aberations like intestinal blood loss have also been reported (Wolf, 1978a). It has been suggested (McCuskey & Meineke, 1973) that the microenvironmental defect in "Steel"mice is related with abnormal levels in the amounts of sulphated GAG in the stroma of the haemopoietic tissues. McCuskey and Meineke (1973) demonstrated with histochemical methods an elevated level of sulphated GAG in the stroma of the spleen of "Steel"
mice in comparison with non~anaemic littermates. These high sulphated GAG levels would according to these authors constitute the primary cause of the anaemic state of the "Steel" mice.
78
Another genetic mutation leading to macrocytic anaemia is caused by a mutation on the so called W locus. Mice from identical strains of genotypes w;wv and SI/Sid have similar phenotypeS, with respect to haemopoiesis, hair pigmentation, etc. The anaemic state of W/WV mice, however, is considered to be due to defective stem cells, since these mice can be cured by injection of marrow cells from normal littermates or even bone marrow cells from SI/Sid mice (Bernstein et al., 1968; Bernstein, 1970). Histochemical studies on the spleens of these mice revealed a deficiency of cells with a coating of sulphated GAG (McCuskey & Meineke, 1973) but also in this case, objective data on amounts or k(nds of GAG involved are lacking. In order to obtain qualitative and quantitative data on the GAG present in the spleen of mice bearing the "Steel" or W mutation, biochemical determinations were performed on these mice and the results were related to the amounts of GAG present in the spleens of comparable normal mice.
Vlll·2 Materials and methods
Mice. Mice of the strain 129 were used for determinations concerning the relation between splenic GAG amounts and the Sli mutation. From this strain, heterozygote mutants bearing the Sli mutation (Siif+) were compared with their homozygote non-anaemic siblings (+/+). The mice were purchased from the Laboratory Animals Centre of the Erasmus University, Rotterdam, The Netherlands. In studies concerning the possible relation between altered splenic GAG levels and the mutations on theW locus, (C57BL/6 x WH)F1 mice with genotype (W/+) were compared with (C3H x WH)F1 mice with genotype (W/Wv). These mice were purchased from the Laboratory Animals Center of the Radiobiological Institute TNO, Rijswijk, The Netherlands.
Determinations. Types and amounts of splenic GAG were determined as described in chapter II. The following determinations were performed with respect of the sli mutation. Male (Sii/+) mice: three determinations on 12-19 pooled spleens each. Male(+/+) mice: four determinations on 12-26 pooled spleens eaCh. Female (SP/+f mice: three determinations on 13-16 pool spleens each. Female (+/+) mice: two determinations on 16 and 20 pooled spleens each. All these mice were 6-12 weeks old. Finally, determinations were done in which spleens of male and female mice (33 weeks old) were mixed. For these determinations 13 spleens were pooled in case of (SJi/+) mice and 27 spleens were pooled in case of (+/+) mice. Determinations of splenic GAG
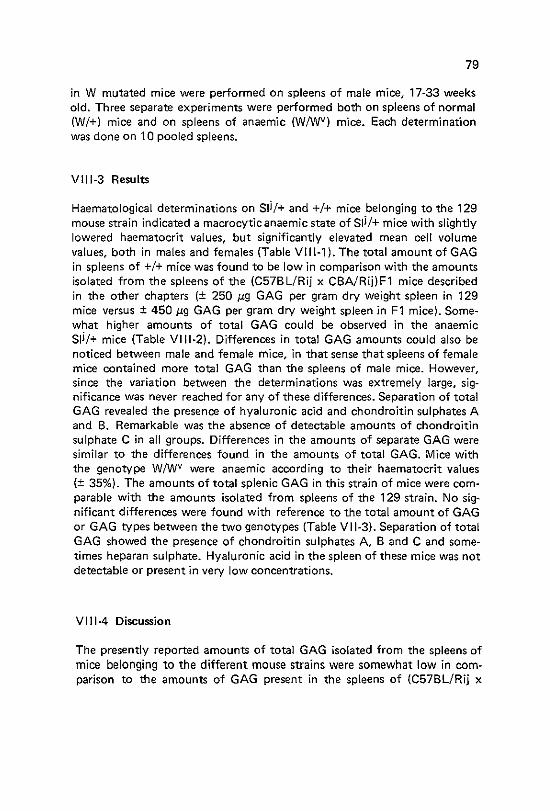
79
in W mutated mice were performed on spleens of male mice, 17-33 weeks old. Three separate experiments were performed both on spleens of normal (W/+) mice and on spleens of anaemic (W/WV) mice. Each determination was done on 1 0 pooled spleens.
Vlll-3 Results
Haematological determinations on Sli/+ and+/+ mice belonging to the 129 mouse strain indicated a macrocytic anaemic state of Slj/+ mice with slightly lowered haematocrit values, but significantly elevated mean cell volume values, both in males and females (Table Vlll-1). The total amount of GAG in spleens of +/+ mice was found to be low in comparison with the amounts isolated from the spleens of the (C57BL!Rij x CBNRij)F1 mice described in the other chapters (± 250 J.Lg GAG per gram dry weight spleen in 129 mice versus ± 450 p.g GAG per gram dry weight spleen in F1 mice). Somewhat higher amounts of total GAG could be observed in the anaemic Sli/+ mice (Table Vlll-2). Differences in total GAG amounts could also be noticed between male and female mice, in that sense that spleens of female mice contained more total GAG than the spleens of male mice. However, since the variation between the determinations was extremely large, significance was never reached for any of these differences. Separation of total GAG revealed the presence of hyaluronic acid and chondroitin sulphates A and B. Remarkable was the absence of detectable amounts of chondroitin sulphate C in all groups. Differences in the amounts of separate GAG were similar to the differences found in the amounts of total GAG. Mice with the genotype W/Wv were anaemic according to their haematocrit values (± 35%). The amounts of total splenic GAG in this strain of mice were comparable with the amounts isolated from spleens of the 129 strain. No significant differences were found with reference to the total amount of GAG or GAG types between the two genotypes (Table Vll-3). Separation of total GAG showed the presence of chondroitin sulphates A, B and C and sometimes heparan sulphate. Hyaluronic acid in the spleen of these mice was not detectable or present in very low concentrations.
Vlll-4 Discussion
The presently reported amounts of total GAG isolated from the spleens of mice belonging to the different mouse strains were somewhat low in comparison to the amounts of GAG present in the spleens of (C57BL/Rij x

TABLE Vlll-1 RBC numbers and volumes and NC numbers in blood of genotypically normal (+/+)and macrocytic
anaemic {Slit+) mice of strain 129
Genotype No. of mice NC x 103 /mm3 RBC x 106 /mm3 HCT%
Normal (+/+) 7 13.45 9_85 51.5 (1.47) (0.08) (0.5)
8 12.30 9.83 53.1 (1.03) (0.09) (0.5)
,---- ----
Anaemic (Slit+) 8 11.12 7.71 47.7 (1.26) (0.25) (0.9)
8 14.25 7.95 49.0 (2.26) (0.05) (0.7)
Mice aged 31-32 weeks. Values are the means(± SEMI of all mice in each group. NC =nucleated cells; RBC ""red blood cells; HCT = haematocrit; MCV =mean cell volume.
gJ
MCV p:m3
52.3 (0.6)
54.0 (0.7)
61.9 (1.0)
61.7 (0.5)
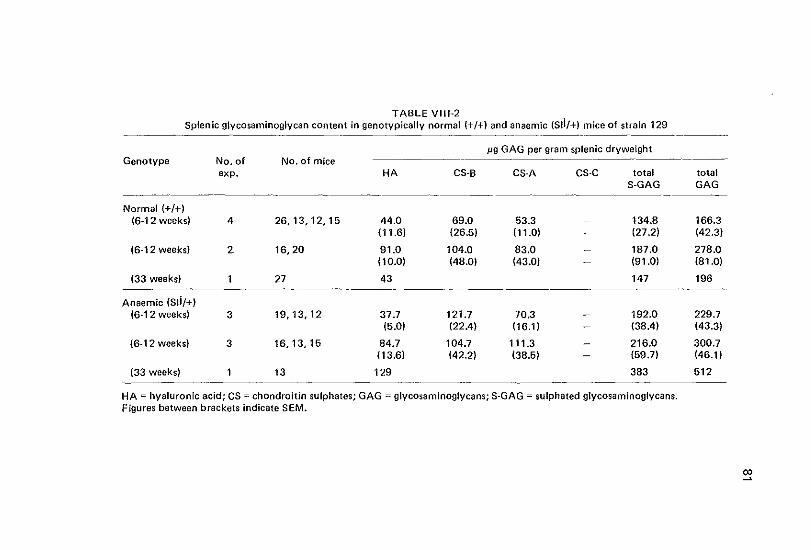
TABLE Vlll-2 Splenic glycosaminoglycan content in genotypically normal(+/+) and anaemic (Sfi/+) mice of strain 129
-------J19 GAG per gram splenic dry weight
Genotype No. of No. of mice ------exp. HA CS-B CS-A es-c total total
S-GAG GAG
Normal (+/+) (6-12 weeks) 4 26, 13, 12,15 44.0 69.0 53.3 134.8 166.3
(11.6) (26.5) (11.0) (27.2) (42.3)
(6-12 weeks) 2 16,20 91.0 104.0 83.0 187.0 278.0 110.0) 148.0) 143.0) 191.0) 181.0)
(33 weeks) 1 27 43 147 196 -----
Anaemic (S!i/+) (6-12 weeks) 3 19, 13,12 37.7 121.7 70.3 192.0 229.7
15.0) 122.4) 116.1) 138.4) 143.3)
(6-12 weeks) 3 16, 13, 15 84.7 104.7 111.3 - 216.0 300.7 113.6) 142.2) 138.5) - 159.7) 146.1)
(33 weeks) 1 13 129 383 512 ---
HA =hyaluronic acid; CS; chondroitin sulphates; GAG= glycosaminoglycans; S-GAG =sulphated glycosaminoglycans. Figures between brackets indicate SEM.
~
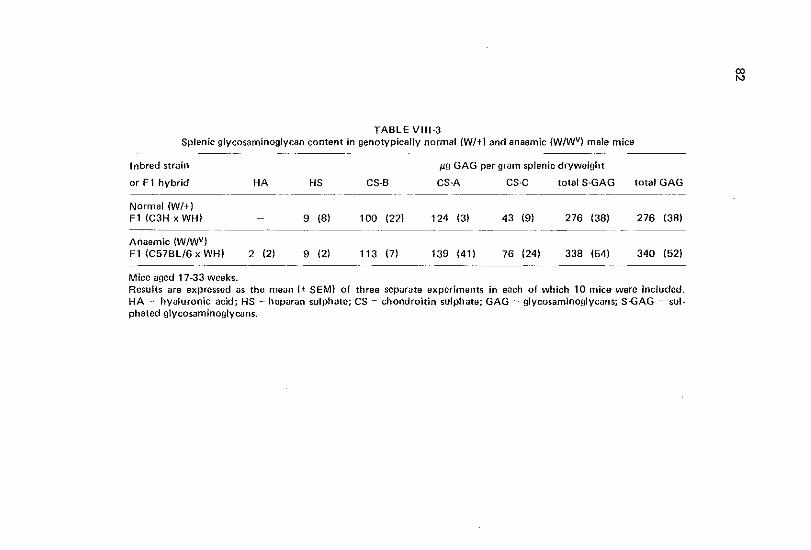
TABLE Vlll-3 Splenic glycosaminoglycan content in genotypically normal (W/+) and anaemic (WJWV) male mice -------- ------- ------- -------- ------
Inbred strain
or F1 hybrid
Normal (W/+) F1 (C3H x WHI
Anaemic {WfWV) F1 (C57BL/6 X WHI
Mice aged 17-33 weeks.
HA
2 (21
HS CS-B
9 (8) 100 (22)
9 (2) 113 (7)
!19 GAG per gram splenic dryweight
CS-A es-c totalS-GAG
124 (3) 43 (9) 276 (38)
139 (411 76 {241 338 (54)
total GAG
276 (38)
340 (52)
Results are expressed as the mean (:t. SEM) of three separate experiments in each of which 10 mice were included. HA = hyaluronic acid; HS = heparan sulphate; CS =chondroitin sulphate; GAG = glycosaminoglycans; S-GAG = sulphated glycosaminoglycans.
"' "'
83
CBA/Rij)F1 mice. Also differences were present in the composition of total GAG between the different strains studied. These differences may reflect strain dependent differences or can alternatively be due to differences in the age of the mice used. Ageing has been shown to constitute a factor which in~ fluences the types and amounts of GAG present in several organs (Kondo et al., 1971; Gressner et al., 1979). Although a tendency towards elevated levels of splenic sulphated GAG in spleens of (Sii/+) anaemic mice of both sexes could be observed in comparison to normal mice of strain 129, no significance was obtained for any group, because a large variation existed between the results of determinations within one group. Age differences may also form a possible explanation for these variations, since a 6 weeks variation in age existed between animals within one group and each determi!1ation differed in the composition of mice with regard to their ages. This situation could not be improved due to the limited availability of these mice. The amounts of GAG (and especially of hyaluronic acid) found in spleens of female mice also displayed a tendency towards higher values compared with male mice of the same genotype but also in these cases no significance was obtained. Sex hormones have been described to influence the GAG metabolism in many tissu_es (see chapter VI). Although we were not able to influence the amounts of splenic GAG in F1 mice by injecting oestradiol (Chapter VI) other authors described an increase in GAG levels (and es~
pecially in hyaluronic acid levels) in different tissues due to oestrogenic treatment (Grosman eta!., 1971; Sirek et al., 1978). The action of oestradiol or other sex hormones might thus cause the mentioned differences in the amounts of splenic GAG between males and females. Similar to the situa~ tion of anaemia induced by the Sli gena tendency towards elevated levels of splenic sulphated GAG could be found in mice with the W/WV genome in comparison to normal (W/+) mice. With respect to the lack of significance between the data from W/+ and w;wv mice the argument used in case of +/+ and Sli/+ mice can also be applied. In conclusion, a tendency towards higher concentrations of at least sulphated GAG in the spleens of genetically anaemic mice in comparison to normal mice of the same strain was shown. The observed differences, however, are relatively small, and within strain 129 mice, similar differences could be found between male and female mice of the same genotype. It should be mentioned that the anaemia in mice with the Slj/+ genotype is less severe than the anaemia described for
SI/Sid mice. It might thus be possible that SI/Sid mice display much higher splenic GAG concentrations when compared with Sli/+ or +/+ mice. We were not able to study this subject because appropriate numbers of SI/Sfd mice were unavailable. In contradiction to the hypothesis of McCuskey and Meineke (1972) and their histochemical observations on SI/Sid and W/Wv mice (1973) no differences could be demonstrated between changes in GAG
84
levels accompanying anaemia due to a microenvironmental defect (SI) and anaemia due to a stem cell defect (W), since a tendency towards elevated GAG levels was found in both types of anaemia. Consequently, it is most unlikely that the anaemia in WIW" mice is due to a decrease or absence of GAG eveloping haemopoietic stem cells as suggested by these authors. However, these results do not exclude a negative influence of elevated sui~ phated GAG levels on erythropoiesis as was suggested by McCuskey and Meineke (1972) and by Ploemacher et al. (1977) using in vitro techniques.
85
IX GENERAL DISCUSSION AND CONCLUSIONS
The biochemical method, developed in order to determine GAG in the haemopoietic organs quantitatively and qualitatively, yielded reproducable figures. However, this method has a nun1ber of disadvantages which hamper a correct interpretation of the results of this study.
Firstly, the variations between separate determinations are relatively large. Because the method is very laborious and time~consuming, the number of determinations which can be done per experiment is limited. As a consequence, significance between experiments is only reached in situations where large differences exist, minor fluctuations can not be traced. The variations are probably due to the combination of methodical and intra~
species differences. In order to diminish the influence of intraspecies dif~ ferences, all experiments were performed on pooled material, which, how~ ever, greatly enlarged the number of animals required. A second disadvantage of the biochemical method used, is that although the method is sensitive in detecting GAG, relatively large amounts of haemopoietic tissue are needed for quantitative purposes, due to the relative low concentration of GAG in haemopoietic organs. A third disadvantage is that this method does not allow GAG determinations at cellular or subcellular level, partly because reliable techniques for separation of haemopoietic and stromal cells, separation of subcellular fractions or separation of cellular and noncellular fractions are not available, and partly because of the necessity of relative large quantities of starting material (see "Second"). The available methods which allow the study of GAG on cellular or subcellular level in situ are either not fit for quantitative purposes (histochemistry) or not suitable for qualification purposes (autoradiography).
Before discussing the results concerning the possible relations between GAG amounts and haemopoiesis, some remarks have to be made with respect to the hypothesis of McCuskey et al. (1972), which, among others, constituted a starting point for this thesis. This hypothesis contains several contradictory aspects and obscurities. (a) In their initial article, the authors describe shifts between "sulphated acid mucopolysaccharides" and uneutral mucopolysaccharides". However, in an attempt to test this hypothesis biochemically Schrock et al. (1973) did not observe such a shift but they did observe shifts between chondroitin sulphates and hyaluronic acid (which are both acid mucopolysaccharides).
86
(b) The methods used for identifying tissue GAG are not reliable. The authors considered al-l PAS positive materials, which were not digestable by
a~amylase to be "neutral mucopolysaccharides". However, many substances, not digestable by "-amylase display a PAS positive reaction (Pearse, 1968), whereas with regard to the interpretation according to Schrock et al. it must be noticed that hyaluronic acid may react PAS negative (Hooghwinkel & Smits, 1957). Material staining with colloidal iron was considered to represent sulphated acid mucopolysaccharides. The specificity of the colloidal iron method has been subject of contradictory reports ever since its introduction by Hale (1946). In spite of its numerous modifications (Pearse, 1968) specific staining of sulphated mucopolysaccharide could not be achieved. McCuskey et al. (1972) also described colloidal iron positive cell coating on many mature circulating red cells, whereas other reports described the total absence of detectable amounts of GAG on mature erythrocytes (Vannucchi et al., 1980; Hakomori, 1965). Since the colloidal iron method (including control experiments with methylation and saponification of the tissue) may also react positively with sulphated glycoproteins, and since for instance some blood group substances can display a sulphated-glycoprotein character (Rolla et al-., 1978), the substances enveloping ery1hroid cells, described by McCuskey et al. as sulphated mucopolysaccharides may at least partly consist of these blood group substances or other sulphated glycoproteins. (c) In the hypothesis it is proposed that "an environment of increased sulphated acid mucopolysaccharides favors mitotic activity of undifferentiated stem cells of both the erythroid and gran uloid line". This proposal is based on the observations that "foci of early proliferating cells (erythroid and granuloid) were enveloped by a coating of materials that stained with colloidal iron". However, since the "early proliferating cells" could be morphologically identified as "erythroid and granuloid" the cells under discussion could not be described as "undifferentiated stem cells". The authors continued their description that "this coating of acid mucopolysaccharides persisted on cells of later stages of granulopoiesis but not on cells in the later stages of erythropoiesis". Since mature erythrocytes possess a colloidal iron positive cell coating according to these authors, it must be concluded that only later stages of morphological identifiable erythropoietic cells (=eosinophilic erythroblasts?) lack this cell coating. (d) In their initial paper these authors distinguish GAG in the cell coat of haemopoietic cells and GAG in the ground substance, both pools being possibly involved in events of haemopoiesis. In a following article (1977) they refer to the first paper but limit their hypothesis to GAG produced by stromal cells, without mentioning the GAG in the cell coat of haemopoietic cells.
87
Such obscurtities hampered the testing of their hypothesis and urged us to adjust it and limit the experiments to some aspects. We restricted our studies primarily to the four questions mentioned in chapter 1-4, in which as parameters for "the different states of haemopoietic activity" values representing haematocrit, and numbers of CFU-E and CFU-C present were used. From the results of experiments described in chapter IV it must be concluded that a state of haemopoietic activity, such as polycythaemia or anaemia in general is not characterised by specific GAG concentrations, since during the first four days of recovery both after induction of polycythaemia and anaemia, subnormal splenic sulphated GAG levels could be observed. Yet, changes in the amounts of GAG in the haemopoietic organs could be observed and their course was specific for the kind of changes in haemopoietic activity induced, since six days after induction of anaemia still subnormal concentrations of splenic sulphated GAG were present, whereas six days after induction of polycythaemia, supranormal concentrations were found. Consequently, there must be a relation between GAG concentrations and the induced changes in haemopoietic activity. The nature of this rei a~ tion, however, is not clear. It may be possible that a relation exists between GAG and one or more specific haemopoietic cell types. It may also be possible th?t not the absolute concentration of GAG present (supra~ or sub~ normal concentrations) but the changes in the concentrations of GAG (a decrease or increase in amounts) are related with haemopoietic events.
With regard to these possible relations one should realise the following points: 1) Changes in the number of a specific haemopoietic cell type present in a
haemopoietic organ may be attributed to altered proliferation but may in some cases also be caused by migration phenomena.
2) Changes in the amounts of (specific) GAG in a haemopoietic organ may be attributed to changes in the ground substance, changes in/on (specific) cells (including the cell type studied), and changes in the number of GAG bearing cells (including the cell type studied).
Neither after induction of anaemia, nor polycythaemia a significant corre· lation was found between any GAG type concentration and the number of CFU~E present, or in the changes of these parameters. Moreover, a decreased GAG concentration could be found in combination with both increased and decreased CFU-E numbers. Similar results were found after the disturbance of hormone levels. De· creased GAG amounts of any type could be found in combination with in· creased CFU·E numbers (in the spleen after castration) but also in combina· tion with decreased CFU~E numbers (in the bone marrow after castration). From these findings it may be concluded that a decrease in organ (sulphated)
88
GAG levels does not induce an increase in CFU-E numbers (but the possibility that this situation allows an increase in CFU-E numbers through action of for instance erythropoietin is not excluded). Significantly increased levels of sulphated GAG were rarely observed, and consequently an absolute negative effect of high sulphated GAG levels on CFU-E numbers in vivo could not be established (Chapters IV, VI, VIII). An inhibiting action of sulphated GAG on CFU-E proliferation in vitro was demonstrated by Plo.emacher et al. (1978). These authors, however, used purified GAG preparations, which might act differently from natural Occurring GAG in the organs of the mouse. Moreover, these authors related the inhibition of erythropoiesis to the amount of GAG added to an in vitro culture system in which (due to serum and plasma used) already different types of GAG must have been present. Consequently it is not possible to judge whether the reported inhibition of erythropoiesis occurred in the presence of GAG concentrations, comparable with in vivo situations.
Induction of erythropoiesis in the liver coincides with changes in the amount of GAG in the liver (Chapter V). The abrupt change from increased sulphated GAG levels to somewhat decreased sulphated GAG levels preceeding the maximum increase in CFU-E numbers might suggest a relation between GAG levels and erythropoiesis. On the other hand, it should be noticed that during the period of PHZ injections, sulphated GAG amounts increased, but that the abrupt decrease in sulphated GAG levels occurred 24-48 hours after terminating PHZ injections. Thus it may be that GAG changes in this case are an effect caused by the treatment.
In summary, the number of CFU-E present in haemopoietic tissues is not absolutely correlated with the amount of any type of GAG present in these tissues; it is neither possible to correlate changes in the number of CFU-E and the amount of GAG. Although, in induced ectopic erythro· poiesis a correlation between GAG concentrations and erythropoietic events is suggested, it may be that this relation is non-causal. Both in geneticallY caused anaemia in mice bearing the Slj rocus and mice bearing the wv locus, no significantly increased levels of splenic sulphated GAG concentrations were observed. Comparably increased splenic sulphated GAG concentrations could be observed in normal female mice when compared with normal male mice. Thus, it is not likely that the primary cause of decreased erythropoiesis in genetically anaemic mice is constituted by elevated sulphated GAG levels in the stroma of Sli/+ mice, nor by the absence of sulphated GAG coated cells in w;wv mice. These results render a causal relationship between the number of CFU-E and the amount of one or more types of GAG present in an organ most unlikely.
89
No correlation could be found between the number of CFU-C and the amount of any kind of GAG present in the haemopoietic organs, neither during experimentally induced anaemia or polycythaemia, nor in case of disturbed hormone levels. However, after induction of anaemia and polycythaemia changes in sulphated GAG levels and changes in CFU-C numbers in the spleen showed a negative correlation in which the first seemed to preceed the latter. The results of studies in which hormonal treatment was used are difficult to interpret with regard to this finding. In some of the groups (namely in case of castrated mice and adrenalectomized mice) a stabilized condition is present, and as is apparent from the previous mentioned results a certain number of CFU~C is not accompanied by a characteristic GAG concentra~ tion. In the groups of mice injected with hormones the results represent a snapshot in a proces of changing events. Consequently, information on pas~
sible causal relationships between these changes can not be obtained from these experiments. In which way the amount of sulphated GAG may influence the number of CFU~C present is not clear. The lack of a relationship between the number of CFU~C and the amount of GAG present, indicates that the changes in GAG observed do not represent changes in GAG associated with these progenitor cells .. Moreover, the number of these progenitor cells is small in rela~ tion to the total cell population in the spleen. GAG in the spleen can theoretically be found in association with these cells but also with other cell types and in the ground substance. The quantitative importance of this latter compartment is stressed by the finding that the haemopoietic stromal cells in the absence of haemopoietic cells are capable of sustaining supranormal GAG concentrations in the spleen {chapter VII). Changes in the cell number of the CFU-C, or changes in the amount of their cell bound GAG will consequently cause only minor changes in the total amount of GAG, while the presently observed changes were relatively large. Thus it may be suggested that changes in granulopoietic activity are related to changes in the amounts of sulphated GAG {at least of those located in the ground substance) but are not sustained by a certain fixed sulphated GAG concentration in the spleen or bone marrow. The changes in the amounts of GAG in the haemopoietic organs after irradiation (thus in the absence of haemopoietic cells) clearly showed the ability of stromal cells to produce GAG, and these changes suggest the existence of factors - not produced by haemopoietic cells - affecting the GAG metabolism of stromal cells in haemopoietic organs. Furthermore, the presence of haemopoietic cells influences the amount of GAG in the haemopoietic organs. This influence may originate from factors

90
produced by haemopoietic cells, affecting the GAG metabolism of stromal cells, or by the possible GAG metabolism of haemopoietic cells or a combination of these possibilities. The changes in GAG amounts after reconstitution cannot be evoked by a regular GAG metabolism of haemopoietic cells alone, since no linear relation could be found betwen the number of haemopoietic cells and the amount of GAG present in addition to the situation of not reconstituted, irradiated mice. With regard to possible factors produced by haemopoietic cells, the existence should be mentioned of a group of substances called Connective Tissue Activating Peptides (CTAP). These substances have been isolated from a number of blood cell types including human lymphocytes, platelets and gra· nulocytes and display an activity on cultured fibroblasts including stimula· tion of DNA synthesis, increased RNA and protein synthesis, increased prostaglandin E formation and intracellular cyclic AMP levels and changed GAG synthesis (Yaron & Castor, 1969; Castor et al., 1977, 1979; Myers & Castor, 1980). Since also spleen extracts have been shown to contain CTAP it may be that such substances were produced by the cells injected in the irradiated mice, resulting in changed GAG metabolism of the stromal cells. Moreover, these substances may be involved in the normal regulation of GAG metabolism in the haemopoietic organs and be responsible for some of the changes in GAG amounts in other experiments.
In general, elucidation of mechanisms involved in GAG metabolism is indispensable for studies on the significance of GAG in cellular events and although numerous factors which influence GAG metabolism have been described, the in vivo regulation is not understood. A possible action of GAG in events of proliferation in haemopoiesis may represent an action specific for one or more haemopoietic cell types, but it may represent also an action of GAG which is not specific for a certain cell type. Studies of the possible action of GAG, their subtypes and proteoglycans on events of proliferation and/or differentiation of different cell types are required in order to solve this question. However, the difficulty in obtaining natural occurring GAG or proteoglycans hamper such studies. The need for appropriate biochemical methods, both for use in accurate determination purposes and for isolation of products which serve as starting point for studies concerning the effect of GAG on cells should be stressed. Improved separation techniques for different haemopoietic cell types may also pro· vide a tool to establish possible relationships between specific GAG/proteo· glycan molecules and specific haematological cell types.
In conclusion, the present studies do not exclude a role of GAG in events of haemopoiesis. However, the possible mechanism of action must be dif· ferent from the one proposed by McCuskey et al. (1972). The amount of
91
GAG present in the spleen and bone marrow is suggested to be the result of a cooperation between stromal cells and haemopoietic cells, and the GAG metabolism in these organs is subjected to regulation mechanisms such as hormone actions. Due to imperfect methods it could not be distinguished whether observed changes in GAG amounts represent cell associated GAG or intercellular GAG. However, the results suggest a relation between changes in the GAG amounts and changes in CFU~C numbers. In answer to the questions in chapter 1-4 it may be stated that: 1) A haemopoietic activity is not characterized by a specific concentration
of any type of GAG in the haemopoietic organs. 2) Changes in GAG concentrations may be related to changes in granulo
poietic progenitor numbers. 3) Stromal cells are able to produce GAG, and are subjected to regulation
mechanisms with regard to their GAG metabolism. Haemopoietic cells have the capacity to influence the concentrations of GAG in the haemopoietic organs. The nature of this influence- directly, or via an effect on stromal cells- is not clear.
4) The spleen of the mice bearing the Sli locus is not characterized by extremely high sulphated GAG levels.
The findings may provide a basis for further studies on the relation between GAG or proteoglycans and haemopoiesis. This thesis indicates the importance of changes in GAG concentrations rather than the existing level of GAG concentrations in relation to haemopoietic events (namely changes in CFU-C numbers during anaemia and polycythaemia and the induction of erythropoiesis in the liver). It may be suggested that further studies on GAG in relation to cellular events in general and haemopoietic events in particular, should be focussed on changes in the concentrations of GAG, instead of existing levels of GAG concentrations.

92
SUMMARY
The number of circulating blood cells in mammals is kept within limited ranges by an equilibrium of cell destruction and cell formation during the entire life. The formation of these cells (called haemopoiesis) is located in specific organs (the bone marrow in humans, and in mice also the spleen). In these organs, a number of cells (the pluripotent haemopoietic stem cells) are able to generate all types of blood cells, by means of a complex system of eel~ lular commitment, differentiation, proliferation and maturation . The regulation of these events is effected by long range (humoral) factors and short range (microenvironmental) factors. Some humoral factors have been characterized and extensively studied. The existence of microenvironmental factors and their influence on haemopoiesis are without doubt. However, their nature (in functional and morphological respect) has not been es~ tablished. Functionally, the presence of microenvironmental factors is presumed to influence haemopoiesis on the stem cell level, in events of stem cell proliferation and the commitment of a stem cell towards one specific cell line. Such factors are defined by the concept "Haemopoietic Inductive Microenvironments". Besides, a regulatory role of microenvironmental factors in events of proliferation, differentiation and maturation of com~ mitted progenitor cells is presumed, indicated by the concept "Haemopoietic Conductive Microenvironments". These microenvironments are supposed to be different for the different kinds of blood cells formed, so that theoretically numerous functional microenvironments might exist. Morphological recognisable structures which may be involved in one or more microenvironmental functions can be divided in micrOvascular elements, neural elements and stromal elements. Within the group of stromal elements the ground substance constituents, and especially the glycosaminoglycans (GAG) in the ground substance have been mentioned as candidates which might influence haemopoiesis. GAG constitute a group of high molecular weight linear carbohydrate polymers and can be found on the cell membranes of many different mammalian cells and in the ground substance of tissues. The experimental work described in this thesis is related to the possible role of GAG in events of haemopoiesis.
Chapter II described a method developed in order to determine biochemical~ ly the amount and kinds of GAG present in the haemopoietic organs. In Chapter Ill figures on the amounts of different kinds of GAG which could be determined in the spleens and the bone marrow of untreated mice
93
are given. A separation of cell-associated GAG and ground substance associated GAG did not yield reliable results. It also appeared that the amount of sulphated GAG in the spleen of untreated mice changed over a period of 24 hours with a rhythmicity of 12 hour periods. These results suggested an active metabolism of at least a part of the GAG present in the spleen. In Chapter IV experiments are reported in which the haemopoiesis in mice was inhibited or stimulated by injection of blood cells or removal of blood. In both cases, specific changes in the amounts of certain GAG in the spleen and in the bone marrow could be observed. These changes in the GAG amounts were followed during some time, together with changes in the number of specific cell types present in the spleen. The specific cell types studied were a very young progenitor of some types of the white blood cells series (CFU-C) and a progenitor of the red blood cells (CFU-E). No relation could be demonstrated between a given number of CFU-C or CFU-E and the accompanying amount of GAG present in the spleen. However, a significant correlation could be found between the changes in the number of CFU-C and changes in the amount of sulphated GAG in the spleen. Moreover, the results suggested that the changes in GAG preceeded the changes in the number of CFU-C. Chapter V reports on experiments in which mice were injected with phenyl· hydrazinechloride which leads to the development of a severe haemolytic anaemia and ectopic erythropoiesis in the liver. Induction of erythropoiesis in .the liver coincided with changes in the amount of sulphated GAG in the liver. Remarkable was the abrupt change from supranormal to subnormal levels of sulphated GAG between day 4 and 5 after induction of ectopic erythropoiesis which is only one day before maximum amounts in CFU-E numbers could be expected. It was not clear, whether this phenomenon represented a causal relationship, or whether GAG changes in the liver occur as an independent side effect of phenylhydrazine treatment. In Chapter VI experiments are described in which hormonal disturbances were induced in order to change the amount of GAG or to change the haemopoietic activity in the haemopoietic organs, or to change both. No relation could be observed between a given concentration of GAG and a given haemopoietic activity, measured on the number of progenitor cells present in the spleen and the bone marrow. Chapter VII reports on experiments in which changes in the amount of sui· phated and unsulphated GAG in the spleen and in the bone marrow of lethally irradiated mice were followed up to 11 days after irradiation. One
day after irradiation, a sharp decrease in the amount of GAG was observed. In the absence of haemopoietic cells the remaining stromal elements of the spleen and the bone marrow caused subsequently marked changes in the amount of the sulphated and unsulphated components of the GAG in both

94
organs. Reconstitution of irradiated mice with bone marrow cells affected the pattern of changes in the amount of GAG. Although no linear correlation could be observed between the amount of GAG and the number of haemopoietic cells present in the haemopoietic organs, these results suggest an interaction between haemopoietic cells and stromal cells in the haemopoietic organs with regard to the GAG metabolism. Finally, Chapter VIII describes determinations performed on spleens of genetically anaemic mice in order to test whether their anaemia may originate from abnormal amounts of sulphated GAG amounts present in their haemopoietic organs. Although some differences could be observed between normal and anaemic mice with regard to splenic sulphated GAG concentra· tions, similar differences could be found between males and females of normal mice. Thus, it is most unlikely that the somewhat supranormal splenic sulphated GAG levels in genetically anaemic mice constitute the cause of their anaemia.
In conclusion: 1) Both stromal cells and haemopoietic cells are involved in the metabolism
of GAG in the haemopoietic organs. This metabolism is subject to a circadian rhythmicity.
2) The amount of one or more kinds of GAG present in the haemopoietic organs are not characteristic for the haemopoietic activity in general in these organs.
3) There is no correlation between the amount of any kind of GAG and the number of erythroid progenitor cells (CFU·E) or granuloid progenitor cells (CFU-C) present in the spleen and in the bone marrow on a given moment.
4) Changes in the amounts of sulphated GAG in the spleen can not be correlated with changes in the number of CFU-E in the sph;~en, but can be correlated with changes in the number of CFU-C in the spleen. A causal relationship between changes in the amount of sulphated GAG and changes in CFU-C numbers is suggested.
5) Decreased erythropoiesis in genetically anaemic mice bearing the Slj or W mutation is not likely due to existing levels of sulphated GAG in the haemopoietic organs.
6) GAG are nbt involved in haemopoietic events in a way as proposed by McCuskey et al. (1972).

95
SAMENVATTING
Het aantal circulerende bloedcellen wordt onder normale omstandigheden gedurende het gehele Ieven binnen nauwe grenzen gehouden. Deze situatie wordt gehandhaafd dank zij een evenwicht tussen de afbraak van oude en de aanmaak van nieuwe bloedcellen. De aanmaak van nieuwe bloedcellen (de zog_enaamde "haemopoiese") vindt plaats in speciale organen (het been~ merg bij de mens, en bij de muis tevens in de milt). Een relatief klein aantal cellen welke zich in deze organen bevinden, zijn in staat om door middel van een ingewikkeld proces aile soorten bloedcel!en te vormen. Een dergelijke eel wordt een pluripotente stamcel genoemd en het proces dat een dergelijke eel moet doorlopen tot rijpe bloedcel omvat onder andere een stap waarbij de richting van bloedcelvorming wordt vastgelegd (de zogenaamde "commit~ ment") en stappen van celdifferentiatie, proliferatie en celrijping. Dergelijke processen worden gereguleerd door factoren die hun oorsprong vinden op lange afstand (humoraal) of op korte afstand werkzaam zijn. De laatste fac~ toren worden wei microOmgevingsfactoren genoemd. Sommige humorale factoren zijn uitgebreid bestudeerd en gekarakteriseerd. Hoewel de invloed van microOmgevingsfactoren op de haemopoiese zonder twijfel bestaat, zijn de aard en de werking van microOmgevingsfactoren tot nag toe niet vast~ gesteld. In functionele zin veronderstelt men het bestaan van microOmge~ vingsfactoren welke de haemopoiese beinvloeden op het niveau van pro!i~ feratie en commitment van de stamcel. Deze factoren worden samengevat in het begrip "haemopoietische inductieve microOmgeving". Daarnaast verwacht men het bestaan van microOmgevingsfactoren welke hun invloed uitoefenen op de latere stappen in de haemopoiese. Deze factoren worden geacht te behoren tot de zogenaamde "haemopoietische conductieve micro~ omgeving". Men veronderstelt dat de betreffende microOmgevingen voor de verschillende soorten bloedcellen welke ontstaan, oak verschillen ver~ tonen, zodat theoretisch vele functionele micro6mgevingen kunnen voor~ komen. De in de haemopoietische organen naar vorm herkenbare structuren welke een of meer micro6mgevingsfactoren zouden kunnen vertegenwoor~ digen, worden verdeeld in microvasculaire elementen, neurale elementen en bindweefsel elementen. Binnen de groep van bindweefsel elementen worden onder meer de glycosaminoglycanen (GAG) verondersteld een invloed op de haemopoiese te kunnen uitoefenen. GAG vormen een groep van uit kool~ waterstoffen bestaande rechte ketens met een hoog moleculair gewicht, en worden onder andere aangetroffen in de celmembraan van vele soorten zoogdiercellen en in de grondsubstantie van weefsels. Het experimentele
96
werk dat in dit proefschrift beschreven wordt heeft betrekking op de mogelijke rol van GAG in het proces van de haemopoiese. In hoofdstuk II wordt een methode beschreven welke werd ontwikkeld ten einde biochemisch de hoeveelheid en de verschillende soorten GAG te bepalen, welke zich in de haemopoietische organen bevinden. In hoofdstuk Ill wordt besproken hoeveel van welke soorten GAG er kon worden bepaald in de milt en in het beenmerg van normale onbehandelde muizen. Een paging om GAG welke zich bevinden in en aan ce!len te scheiden van GAG welke zich bevinden tussen de cellen, leverde geen betrouwbare resultaten op. Het bleek voorts dat de hoeveelheid gesulfateerde GAG in de milt van onbehandelde muizen gedurende een periode van 24 uur fluctuaties vertoonde met een ritme van periodes van 12 uur. Deze resul~ taten doen een aktieve stofwisseling veronderstellen van tenminste een deel van de in de milt aanwezige GAG. In hoofdstuk IV worden experimenten besproken waarin de haemopoiese in muizen geremd dan wei gestimuleerd was door middel van respectievelijk injektie met bloedcellen of het aftappen van bleed. In beide gevallen kon men waarnemen dat specifieke veranderingen in de hoeveelheden van be~
paalde GAG soorten in de milt en in het beenmerg optraden. De veranderingen in de GAG hoeveetheden in de milt werden vervolgd gedurende enige tijd tesamen met veranderingen in het aantal cellen van enige specifieke soorten welke in de milt aanwezig zijn. De bestudeerde celsoorten waren een zeer jonge voorloper van sommige soorten witte bloedcellen (deze eel wordt aangeduid met de letters CFW·C) en een jonge voorloper van rode bloedcetlen (de zogenaamde CFU-E). Er kon geen verband worden aange~ toond tussen het aantal CFU-C of CFU-E en de hoeveelheid GAG die op een bepaald ogenblik in de milt aanwezig was. Er kon echter wei een duidelijke relatie worden aangetoond tussen de veranderingen in het aantal CFU-C en de veranderingen in de hoeveelheid gesulfateerde GAG in de milt. De resultaten wezen er bovendien op dat de veranderingen in het aantal CFU-C werden voorafgegaan door de veranderingen in de hoevee!heid GAG. Experimenten waarbij muizen werden geinjiceerd met phenylhydrazinechloride worden beschreven in hoofdstuk V. Een dergelijke behandeling veroorzaakt ernstige bloedarmoede door een verhoogde afbraak van rode bloedcellen met als gevo!g de vorming van bloedcellen buiten de daarvoor gespecialiseerde organen, bijvoorbeeld in de lever. Het optreden van rode bloedcelvorming (erythropoiese) in de lever ging vergezeld van veranderingen in de hoeveelheid gesulfateerde GAG in de lever. Opmerkelijk was de plotselinge omslag van boven normale naar onder normale waarden in de hoeveelheid gesulfateerde GAG tussen dag 4 en 5 na het begin van de behandeling. Het grootste aantal CFU~E kan men verwachten een dag na dit tijdstip. Het was niet duidelijk of we hier met een oorzakelijk ver~·

97
band tussen deze parameters te maken hadden, of dat de veranderingen in de hoeveelheid GAG optraden als onafhankelijke nevenwerking van de phenyl~ hydrazinechloride behandeling. In hoofdstuk VI worden experimenten beschreven waarin door middel van verstoringen in de hormoonbalans in het Jichaam getracht werd de hoeveelheid GAG of de haemopoiese in de haemopoietische organen (of beide) te beinvloeden. Onder dergelijke omstandigheden kon er oak geen verband worden aangetoond tussen de concentratie van GAG en de haemopoietische activiteit (gemeten aan het aantal aanwezige haemopoietische voorlopercellen) in de haemopoietische organen op een zeker ogenblik . In hoofdstuk VII wordt beschreven welke veranderingen optreden in de hoeveelheid gesulfateerde en niet gesulfateerde GAG in de milt en in het beenmerg van dodelijk bestraalde muizen gedurende 11 dagen na bestraling .. Een dag na de bestraling kon er een sterke daling in de hoeveelheid GAG in beide organen worden waargenomen. In afwezigheid van haemopoietische cellen, veroorzaakten de overgebleven bindweefselcellen in de milt en in het beenmerg vervolgens duidelijke veranderingen in de hoeveelheid gesulfateerde en niet gesulfateerde GAG. Herstel van bestraalde muizen door middel van injectie met beenmergcellen ging gepaard met andere veranderingen in GAG concentraties. Hoewel er geen rechtlijnig verband kon worden aangetoond tussen de hoeveelheid GAG en het aanta! haemo- o
poietische cellen in de haemopoietische organen, suggereren deze resultaten een interactie tussen haemopoietische cellen en bindweefsel cellen in de haemopoietische organen met betrekking tot de GAG stofwisseling. Tenslotte worden in hoofdstuk VIII resultaten van bepalingen vermeld welke uitgevoerd werden aan milten van muizen met een erfelijk bepaalde bloedarmoede, teneinde te testen of deze bloedarmoede te wijten is aan abnormale concentraties van GAG in de haemopoietische organen. Hoewel de GAG concentraties in de milt van deze dieren enigszins afweken van de GAG concentraties in de milt van vergelijkbare gezonde muizen, is het niet waarschijnlijk dat de oorzaak van de bloedarmoede gelegen is in de enigszins verhoogde GAG concentraties, aangezien soortgelijke verschillen in GAG concentraties ook tussen gezonde mannetjes en vrouwtjes muizen bl ijken te bestaan.
Samenvattend kan uit het hier beschreven experimentele werk geconcludeerd worden: 1) Zowel stromale (bindweefsel) cell en als haemopoietische cell en zijn naar
aile waarschijnlijkheid belrokken bij de stofwisseling van GAG in de haemopoietische organen. Deze stofwisseling is onderhavig aan een dagelijks ritme.
98
2) De hoeveelheid van een of meer soorten GAG die in de haemopoietische organen aanwezig is, is niet kenmerkend voor de activiteit van de haemo· poiese binnen die organen.
3) Er bestaat geen correlatie tussen de hoevee/heid van een of meer soorten GAG die in de haemopoietische organen aanwezig is en het aantal aanwezige erythroide voorlopercellen {CFU-E) of granuloide voorloperce!len (CFU-C) in de milt en in het beenmerg op een bepaald tijdstip.
4) In de milt kunnen veranderlngen in de hoeveelheid gesu!fateerde GAG niet gecorre!eerd .worden met veranderingen in het aantal CFU-E, maar wei met veranderingen in het aanta! CFU·C. Een oorzakelijk verband tussen de veranderingen in gesulfateerde GAG hoeveelheden en verande~ ringen in CFU·C aantallen wordt gesuggereerd.
5) Het is niet waarschijnlijk dat de verlaagde erythropoiese in muizen met bepaalde aangeboren afwijkingen welke leiden tot bloedarmoede het directe gevolg is van de aanwezige concentraties van gesulfateerde GAG in de haemopoietische organen.
6) GAG zijn niet betrokken bij de haemopoiese op een wijze zeals door McCuskey en coli ega's wordt verondersteld.
99
REFERENCES
Abeling, N.G.G.M., Wadman, S.K. & Van Gennip, A.H. (1974). Two dimensional electrophoresis of urinary mucopolysaccharides on cellulose acetate after N-cetyiM pyridiniumch!oride (CPC) precipitation: A method suitable for the routine laboraM tory. Clin. Chim. Acta 56,297-303.
Abood, L.G. & Abui-Haj, S.K. (1956) Histochemistry and characterisation of hyaluronic acid in axons of peripheral nerve. J. Neurochem. 1, 119-125.
Adams, J.B. (1963) Sulfate metabolism in avian and mammalian cartilage extracts. Arth, Biochem. Biophys. 101,478-488.
Adamson, J.W., Popovic, W.J. & Brown, J.E. (1978) Hormonal control of erythropoiesis. In: Hematopoietic Cell Differeritia'tion. Eds. Golde, O.W., Cline, M.J., Metcalf, D. & Fox, C. F. Academic Press Inc. New York, pp. 53-67:
Aldrich, 8.1. (1958) The effects of the hyaluronic acid complex on the distribution of ions. Biochem. J. 70, 236~244.
Allen, T.D. & Dexter, T.M. (1976) Cellular interrelationships during in vitro granule~ poiesis. Differentiation 6, 191 ~ 194.
Alpen, E.L., Cranmore, D. & Johnston, M.E. {1962) Early observation on the effects of blood loss. In: Erythropoiesis. Eds. Jacobson, L.O. & Doyle, M. Grune & Stratton, New York, pp. 184.
Aminoff, D., Binkley, W.W., Schaffer, R. & Mowry, R.W. (1970) Analytical methods for carbohydrates. In: The Carbohydrates, Biochemistry and Chemistry. Eds. Pigman, W. & Horton, D. Vol. liB, 2nd ed., Academic Press, New York, pp, 740~ 807.
Anastassiades, T. & Dziewiatkowski. D.O. (1970) The effect of cortisone on the meta~ bolism of connective tissue in the rat. J. Lab. Clin. Med. 75, 826-839.
Anderson, 8., Hoffman, P. & Meyer, K. (1965) The O~serine linkage in peptides of chondroitin 4- or 6-sulphate. J. Bioi. Chern. 240, 156-167.
Anderson, C.E .. Ludowieg, J., Eyring, E.J. & Horowitz, 8. {1963) Ultrastructure and chemical composition of chondrosarcoma: report of one case. J. Bone Joint Surg. 45. 753-764.
Anseth, A. & Laurent, T.C. (1961) Corneal polysaccharides. I. Separation. Exp. Eye Res. 1, 25~38.
Antonopoulos, C.A., Franssen, L.-A. Heineg<ird, D. & Gardell, S. (1967) Chromatogra~ phy of glycosaminoglycans and ecteola-cellulose columns. Biochim. Biophys. Acta 148, 158~163.
Antonopoulos, C.A .• Gardell, S., Szirmai, J.A. & De Tyssonsk, E.R. (1964) Determina· tion of glycosaminoglycans (mucopolysaccharides) from tissues on the microgram scale. Biochim. Biophys. Acta 83,1-19.
Antonopoulos, C.A., Gardell, S. & HamnstrOm, B. {1965) Separation of the glycosaminoglycans {mucopolysaccharides) from aorta by a column procedure using quaternary ammonium salts. J. Atherosclerosis Res. 5, 9-15.
Astrup, 8. (1947) On the determination of heparin in blood plasma and urine. Acta Pharmacal. Toxicol. 3,165-178.
Audhya, T.K. & Gibson, K.D. (1975) Enhancement of somatomedin fibers of normal and hypopituitary sera by addition of L·triiodothyronine in vitro at physiological concentrations. Proc. Nat. Acad. Sci. 72,604-608.
Augusti-Tocco, G. & Chiarugi, V .P. (1976) Surface glycosaminoglycans as a differentia~ tion cofactor in neuroblastoma cell cultures. Cell Differentiation 5, 161~170.
100
Austin, P.E., McCulloch, E.A. & Till, J.E. (1971) Characterization of the factor in L-cell conditioned medium capable of stimulating colony formation by mouse marrow cells in culture. J. Cell. Physic I. 77, 121-133.
Avila, J.L. (1978) The influence of the type of sulphate bond and degree of sulpha· tion of glycosaminoglycans on their interaction with lysosomal enzymes. Biochem. J.171 ,489-491.
Aye, M.T. (1977) Erythroid colony formation in cultures of human marrow. Effect of leukocyte conditioned medium. J. Cell Physic!, 91, 69-78.
Balazs, E.A. (1966) Sedi-ment volume and viscoelastic behaviour of hyaluronic acid solutions. Fed. Proc., 25,1817-1822.
Barker, S.A., Cruickshank, C.N.D. & Webb, T. (1964} The effect of vitamin A, hydrocortisone and citra! upon sulphate metabolism in skin. Exp. Cell Res. 35, 255-261.
Barker, S.A., Cruickshank, C.N.D. & Webb, T. (1965) Mucopolysaccharides in rat skin. Carbohydrate Res. 1, 52-61.
Barker, S.A., Hawkins, C.F. & Hewins, M. (1966) Mucopolysaccharides in synov'tal fluid: detection of chondroitin sulfate. Ann. Rheum. Dis. 25,209-213.
Barker, S.A. & Kennedy, J.F. (1969a) Induced effects upon the sulphate metabolism of acidic mucopolysaccharides of human skin. Carbohydrate Res. 11, 27-31.
Barker, S.A. & Kennedy, J.F. (1969b) Human skin acidic mucopolysaccharides and clinical conditions. Life Sci., Part II 8, 989-994.
Barker, S.A., Kennedy, J.F. & Cruickshank, C.N.O. (1969al The identification of acidic mucopolysaccharides from human sk'm by radioacf1ve incorporafton. Carbohydrate Res. 10, 65-70.
Barker, S.A., Kennedy, J.F. & Somers, P.J. (1969b} The acidic mucopolysaccharides of human skin. Carbohydrate Res. 10,57-63.
Barker, S.A. & Young, N.M. (1966) Isolation of hyaluronic acid by gel filtration on agarose. Carbohydrate Res. 2, 363-370.
Barlow, G.H., Coen, L.J. & Mozen, M.M. (1964) A biological, chemical and physical comparison of hepar'tn from d'tfferent mammal'tan spec'tes. Bioch'tm. Biophys. Acta 83,272-277.
Barrett, T.W. (1975) Hyaluronic acid salt· a mechanoelectrical transducer. Biochim. Biophys. Acta 385, 157-161.
Barrett, A.J., Sledge, C. B. & Dingle, J.T. (1966) Effect of cortisol on the synthesis of chondroitin sulphate by embryonic cartilage. Nature 211,83-84.
Bathija, A., Davis, S. & Trubowitz, S. (1978) Marrow adipose tissue: Response to erythropo'tesis. Am. J. Hemat. 5, 315-321.
Bathija, A., Davis, S. & Trubowitz, S. (1979) Bone marrow adipose tissue: Response to acute starvation. Am. J. Hemat. 6, 191-198.
Baxter, E. & Muir, H. {1972} The antigenicity of cartilage proteoglycans: The relat·tonship of the antigenic determinants present in Smith degraded and intact proteoglycans. Biochim. Biophys. Acta 279, 276-281.
Baxter, E. & Muir, H. (1975) The nature of the protein moieties of cartilage proteoglycans of pig and ox. Biochem. J. 149,657-668.
Becker, A.J., McCulloch, E.A. & Till, J.E. (1963) Cytological demonstration of the clonal nature of spleen colonies derived from transplanted marrow cells. Nature 197,452454.
Bell, R.G., Hazell, L.A. & Sheridan, J.W. {1976) The influence of dietary protein deficiency on haemopoietic cells in the mouse. Cell Tissue Kinet. 9, 305-311.
Ben-lshay, Z. & Yoffey, J.M. (1974) Ultrastructural studies of erythroblastic islands of rat bone marrow. I I I. Effect of sublethal irradiation. Lab. Invest. 30, 320-332.
101
Bentley, J.P., Nakagawa, H. & Davies, G.H. (1971) The biosynthesis of mucopolysaccharides and collagen by the sex skin of estrogen-treated monkeys. Biochim. Biophys. Acta 244,35-46.
Bernstein, S.E. (1970) Tissue transplantation as an analytical and therapeutic tool in heriditary anemias. Amer. J. Surg. 119,448-451.
Bernstein, S.E., Russell, E.S. & Keighley, G. (1968) Two heriditary mouse anemias (SI/Std and W/Wv) deficient in response to erythropoietin. Ann. N.Y. Acad. Sci. 149,475-435.
Bessis, M.C. & Breton-Gorius, J. (1959) Ferritin and ferruginous micelles in normal erythroblasts and hypochromic hypersideremic anemias. Blood 14, 423-432.
Bessis, M.C. & Breton-Gorius, J. {1962) Iron metabolism in the bone marrow as seen by electron microscopy: a critical review. Blood 19, 635~63.
Bettelheim, F.A. (1970) Physical chemistry of acidic polysaccharides. In: Biological Polyelectrolytes. Ed. Veis, A. Biological Macromolecules Series, 3, Marcel Dekker, New York, pp. 131-209.
Bhavanandan, V.P. & Davidson, E.A. (1975) Mucopolysaccharides associated with nuclei of cultured mammalian cells. Proc. Nat. Acad. Sci. 72,2032-2036.
Bitter, T. & Muir, H.M. (1962) A modified uronic acid carbazole reaction. Anal. Biochem. 4, 330-334.
Blix, G. {1951) Hyaluronic acid in the pleural and peritoneal fluids from a case of mesothelioma. Acta. Soc. Med. Upsal, 56,47-50.
Blix, G. & Snell man, 0. (1945) Chrondoitinsulphuric acid and hyaluronic:; acid. Ark. Kemi Mineral., Geol. 19A, No. 32,1-19.
Blumenkrantz, N. & Asboe:Hansen, G. (1973) New method for quantitative determination of uronic acids. Anal, Biochem, 54,484489.
Blumenkrantz, N. & Asboe-Hansen, G. (1980) Variation of urinary acid glycosaminoglycan and collagen metabolite excretion with disease activity in generalized scleroderma. Acta Dermatovener. 60,39-43.
Bon~hese, E. (1959) The present state of research on W/W mice. Acta Anat. 36, 185-220.
Bozzini, C.E., Barrio Rende, M.E., Devoto, F.C.H. & Epper, C. E. (1970) Studies on medullary and extramedullary erythropoiesis in the adult mouse. Am. J. Physiol. 219, 724-728.
Bozzini, C.E., Alippi, R.M. & Montangero, V. (1974) The ·Importance of the blood flow to bone in the conversion of fatty to hemoglobin synthesizing marrow. Acta Physiol. Lat. Am. 24 (1), 14-18.
sanemark, P. (1959) Vital microscopy of bone marrow in rabbit. Scand. J. Clin. Lab. Invest. (suppl. 38), 11,1-82.
Branford White, C.J. (197!1) Identification of glycosaminoglycans in nerve terminals. J, Neural. Sci. 41, 261 ·269.
Breen, M., Weinstein, H.B., Blacik, L.J., Borcherding, M.S. & Sit!ig, R.A. (1976) Microanalysis and characterization of glycosaminoglycans from human tissue via zone-electrophoresis. In: Methods in Carbohydrate Chemistry. Eds. Whistler, R.L. & Bemiller, J.N, Vol. VII, Academic Press, New York, pp. 101-115.
Brennan, J.K., Lichtman, M.A., DiPersio, J.F. & Abboud, C,N. (1980) Chemical mediators of granulopoiesis: A review, Exp. Hemat. 8, 441-464.
Brimacombe, J.S. & Stacey, M. (1964) Mucopolysaccharides in disease. Adv. Clin. Chem. 7, 199-234.
Brimacombe, J.S. & Webber, J.M. (1964) Mucopolysaccharides. Elsevier, Amsterdam. Broxmeyer, H.E., Smithyman, A., Eger, R.E., Meyers, P.A. & de Sousa, M. (1978)
Identification of lactoferrin as the granulocyte-derived inhibitor of colony-stimulating activity production. J. Exp. Med. 148, 1052-1 067.

102
Buddecke, E., KrOz, W. & Titter, W. (1967) Chondroitinsulfat-protein aus Rindernasen Knorpei-Beziehungen zwischen makromolekularen Eigenschaften und Funktion. z. Physiol. Chern. 348, 651.S64.
Burgess, A.W., Camakaris, J. & Metcalf, D. (1977) Purification and properties of colony-stimulating factor from mouse lung~onditioned medium. J. Bioi. Chern. 252, 1998-2003.
Byron, J.W. (1972) Comparison of the action of 3 H-thymidine and hydroxy urea on testosterone treated haemopoietic stem cells. Blood 40,198-203.
Byron, J.W. (1977) Analysis of receptor mechanisms involved in the hemopoietic effects of androgens: Use of the TFM mutant. Exp, Hemat. 5, 429435.
Caffrey Tyler, R.W. & Everett, N.E. (1966) A radioautographic study of hemopoietic repopulation using irradiated parabiotic rats. Relation to the stem cell problem. Blood 28,873-890.
Calatroni, A., Donnelly, P.V. & DiFerrante, N. (1969) The glycosaminoglycans of human plasma. J. Clin. 1nvest.48, 332-343.
Calcagno, M., Goyena, H., Arrambide, E. & de Urse, C.A. (1970) Action of cortisone and cortisol upon biosynthesis of chondroitin sulfate in femur in vitro cultures of chick embryo. Exp. Cell Res. 63,131-137.
Calderon, J., Kiely, J.M., Lefko, J.L. & Unanue, F.R. (1975) The modulation of lymphocyte functions by molecules secreted by macrophages. I. Description and partial biochemical analysis. J. Exp. Med. 142, 151-164.
Calvo, w. (1968) The innervation of the bone marrow in laboratory animals Am. J. Anat. 123,315-328.
Calvo, W. & Porteza-Vila, J. (1969) On the development of bone marrow innervation in newborn rats as studied with silver impregnation and electron microscopy. Am. J. Anat. 126,351-371.
Calvo, w. & Forteza-Vila, J. {1970) Schwann cells of the bone marrow. Blood 36, 180-186.
Capeau, J., Picard, J. & Paui-Gardais, A. (1978) Isolation of glycosaminoglycans from lymphocytes in chronic lymphoid leukemia. Biomedicine 28, 124-129.
Cappelletti, R., DelRosso, M. & Chiarugi, V.P. (1979) A new electrophoretic method for the complete separation of all known animal g!ycosaminoglycans in a monodimensional run. Anal. Biochem. 99,311-315.
Cappelletti, R., DelRosso, M. & Chiarugi, V.P. (1980) A new method for characteriza· tion of N-sulfated g!ycosaminoglycans by a rapid and multisample nitrous acid treatment during an electrophoretic run and its application to the analysis of biological samples. Anal. Bio'chem. 105,430435.
Cappelletti, R., DelRosso, M., Vannucchi, S., Cella, C., Fibbi, G. & Chiarugi, V.P. (1980) Involvement of modulation of cell coat glycosaminoglycans in guinea pig peritoneal macrophage activity. J. Reticuloendoth. Soc. 27, 383-391.
Carnot, P. & Deflandre, C. (1906) Sur l'activite h€mapoietique des differents organes au cours de Ia regeneration du sang. C.R. Acad. Sci. 143,432.
Carter, R.E., Fleishacker, B. & Jackson, W.L. (1961) The 'mtercellular substances of bone marrow. l. Preliminary studies of the physical and chemical character of the intercellular bone marrow substances in normal rabbits. Blood 17, 650-656.
Carter, R.E. & Jackson, W.L. (1962) The intercellular substances of bone marrow. II. Variations in granulocytic and in erythrocytic hyperplasia. Blood 20, 322--329.
Castor, C.W. & Dorstewitz, E.L. (1964) Identification of acid mucopolysaccharides by paper chromatography. J. Chromatog. 13, 157-165.
103
Castor, C.W, & Dorstewitz, E.L. { 1966) Abnormalities of connective tissue cells cultured from patients with rheumatoid arthritis. I. Relative unresponsiveness of rheumatoid synovial cells to hydrocortisone. J. Lab. Clin. Med. 68,300-313.
Castor, C.W., Ritchie, J.C., Scott, M.E. & Whitney, S.L. (1977) Connective tissue activation. XI. Stimulation of glycosaminoglycan and DNA formation by a platelet factor. Arthritis and Rheum. 20,859-868.
Castor, C.W., Ritchie, J.C., Williams, C.H. Jr., Scott, M.E., Whitney, S.L., Mijers, S.L., Sloan, T.B. & Anderson, B.E. (1979) Connective tissue activation. XIV. Composition and actions of a human platelet autacoid mediator. Arthritis Rheum. 22, 260-272.
Casu, B. & Gennaro, U. (1975) A conductimetric method for the determination of sulphate and carboxyl groups in heparin and other mucopolysacciTarides. Carbohydrate Res. 39, 168-176.
Chan, S.H. & Metcalf, D. (1972) Local production of colony stimulating factor within the bone marrow: role of non-hemopoietic cells. Blood 40, 646-653.
Chandrasekaran, E.V., Mukherjee, K.L. & Bachhawat, B.K. (1971) Isolation and characterization of glycosaminoglycans from brain of children with protein-calorie malnutrition. J. Neurochem. 18,1913-1920.
Charles, A.F. & Scott, D.A. (1933) Studies on heparin. ll. Heparin in various tissues. J. Bioi. Chern. 102,431-435.
Charles, A. F. & Scott, D.A. (1936) Studies on heparin. IV. Observations on the chemistry of heparin. Biochem. J. 30, 1927-1933.
Chen, L.T. & Weiss, L. (1975)·The development of vertebral bone marrow of human fetuses. Blood 46,389-408.
Chertkov, J.L., Gurevitch, O.A. & Udalov, G.A. (1980) Role of bone marrow stroma in hemopoietic stem cell regulation. Exp. Hemat. 8, 770-778.
Chiarugi, V.P. (1976) Cell-coat glycosaminoglycans in cellular transformation and differentiation. Exp. Cell Bioi. 44,251-259.
Chiarugi, V.P. & Vannucchi, S. (1976) Surface heparan sulphate as a control element in eukariotic cells: A working model. J. Theor. Bioi. 61,459-475.
Chiarugi, V.P. & Dietrich, C.P. (1979) Sulphated mucopolysaccharides from normal and virus transformed rodent fibroblasts. J. Cell. Physiol. 99, 201-206.
Cifonelli, J.A. & King, J. (1970) The isolation and properties of heparitin sulfate from human umbilical cord tissues. Biochim. Biophys, Acta 215,273-279.
Clamp, J.R., Bhatti, T. & Chambers, R.E. (1972) The examination of carbohydrate in glycoprotein by gas-liquid chromatography. In: Glycoproteins. Ed. Gonschalk, A. 2nd ed. part A, Elsevier, Amsterdam, pp. 300-321.
Constantopoulos, G., McComb, R.D. & Dekaban, A.S. (1976) Neurochemistry of the mucopolysaccharidoses: Brain glycosaminoglycans in normals and four types of mucopolysaccharidoses. J. Neurochem. 26,901-908.
Craddock, J.G. Jr. & Kerby, G.P. (1955) Urinary excretion of acid mucopolysaccharides by diabetic patients. J. Lab. Clin. Med. 46, 193·198.
Crafts, R.C. (1946) Effects of hypophysectomy, castration and testosterone propionate on hemopoiesis in adult male rat. Endocrinology 39,401413.
Curry, J.L. & Trentin, J.J. (1967) Hemopoietic spleen colony studies. I. Growth and differentiation. Develop. Bioi. 15, 395-413.
Curry, J.L., Trentin, J.J. & Wolf, N. (1967) Hemopoietic spleen colony studies. II. Erythropoiesis. J. Exp. Med. 125,703-720.
104
Daniels, E. (1980) Ultrastructural obseTVations on the three-dimensional reorganization and growth of newly~formed candidate stromal cells and residual hemopoietic cells in culture. Exp. Hemat. 8, 157~165.
Oanishefsky, I. & Abraham, G. (1971) Isolation and purification of chondroitin 6--sulfate protein from umbilical cord. Prep. Biochem. 1, 133~140.
Oanishefsky, I. & Bella, A.J r. (1966) The sulphated mucopolysaccharides from human umbilical cord. J. Sial. Chern. 241, 143~146.
Darby, G.K., Jones, A.S., Kennedy, J.F. & Walker, R.T. (1970) Isolation and analysis of the nucleic acids and polysaccharides from Clostridium welchii. J. Bacterial. 103,159-165.
Oarzynkiewicz, z. & Balazs, E.A. (1971) Effect of connective tissue intercellular matrix on lymphocyte stimulation. I. Suppression of lymphocyte stimulation by hyaluronic acid. Exp. Cell Res. 66,113-123.
Davidson, E.A. & Meyer, K. (1954) Chondroitin, a new mucopolysaccharide. J. Bioi. Chern. 211, 605-611.
De Gowin, R.L., Lewis, L.J., Mason, R.E., Berke, M.K. & Hoak, J.C. (1976) Radiationinduced inhibition of human endothelial cells replicating in culture. Radiat. Res. 68, 244-250.
De Pomerai, D.l., Chesterton, J. & Butterworth, P.H.W. (1974) The effect of heparin on the structure and template properties of chromatin. FEBS Lett. 42, 149-153.
Derby, M.A. (1978) Analysis of glycosaminoglycans within the extracellular environments encountered by migrating neural crest cells. Develop, Bioi. 66, 321--336.
Deutsch, H.F. (1957) Some properties of a human serum hyaluronic acid. J. Bioi. Chem. Z24, 767-774.
Dexter, T.M. & Lajtha, L.G. (1976) Proliferation of hemopoietic stem cells and development of potentially leukemic cells in vitro. Bib!. i-laematol. 43, 1.
Dicke, K.A., Platenburg, M.G.C. & Van Bekkum, D.W. (1971) Colony formation in agar: in vitro assay for haemopoietic stem cells. Cell Tissue Kinet. 4, 463477.
Dietrich, C.P., Nader, H.B., Britto, L.R.G. & Silva, M.E. (1971) Chemical composition of heparitin sulfste. Fractionat'10n and characterization of four acidic mucopolysaccharides in heparitin sulfate from beeflung tissue. Biochim. Biophys. Acta 237. 430-441 .
Dietrich, C.P., Sampaio, L.O., Toledo, O.M. et al. (1977) Cell recognition and adhesiveness: A possible biological role for the sulfated mucopolysaccharides. Biochim. Biophys. Res. Commun. 75,329-336.
Dietrich, C.P., Sampaio, L.O., MontesdeOca, H. & Nader, H.B. (1980) Role of sulfated mucopolysaccharides in cell recognition and neoplastic transformation. An. Acad. Brasil. Cienc. 52,179-186.
Dietrich, C.P., Schibuola, C.T., Sampaio, L.O. & lbara, I. (1978) Changes in the composition of sulphated mucopolysaccharides during neoplastic transformation of cerebral tissue. Cancer Res. 38,3969-3971.
Dietz, A.A. & Steinberg, B. (1951) Chemical studies of normal and leukemic bone marrow. Blood 6,175-182.
Di Ferrante, N. (1967) The measurement of urinary mucopolysaccharides. Anal. Biochem. 21,98-106.
Di Ferrante, N. & Rich, C. (1956) The determination of acid aminopolysaccharide in urine. J. Lab. Clin. Med. 48,491-494.
Di Persia, J.F., Brennan, J.K. & Lichtman, M.A. (1978) Granulocytic growth modulators elaborated by human cell lines. In: Hematopoietic Cell Differentiation. Eds. Golde, D.W., Cline, M.J., Metcalf, D. & Fox, C.F. ICN-UCLA Symposia on Molecular and Cellular Biology, Vol. X, Academic Press, New York, p.p. 433-444.
105
Dische, Z. (1962) Colour reactions of carbohydrates. In: Methods in Carbohydrate Chemistry. Eds. Whistler, R.L. & Wolfrom, M.L. Vol. I, Sect. V., Academic Press New York, pp. 475·514.
Ojaldetti, M., Sessler, H. & Fishman, D. (1975) Hematopoiesis in the embryonic mouse spleen. II. Alterations after phenylhydrazine administration to the mothers. Anat. Rec. 182,123-136.
Dorfman, A. & Matalon, R. (1972) The mucopolysaccharidoses. In: The Metabolic Basis of Inherited Disease. Eds. Stanbury, J.B., Wijngaarden, J.B. & Fredrickson, O.S., 3rd ed. McGraw-Hill, New York, pp. 1218-1272.
Dorfman, A. & Matalon, R. (1976) The mucopolysaccharidoses (a review). Proc. Nat, Acad. Sci. 73,630-637.
Douglas, C., Nowak, J. & Danes, B.S. (1973) Mucopolysaccharides in urine during normal human development. Pediat. Res. 7, 724-727.
Dyrbye, M. & Kirk, J.E. (1957) Mucopolysaccharides of human arterial tissue. J. Isolation of mucopolysaccharide material. J. Gerontal. 12, 20-22.
Dziewiatkowski, D.O. ( 1951) Effect of thyroxine and thiouracil on S3 s deposition in articular cartilage. J. Sial. Chern. 189,717-727.
oz·1ewiatkowski, D.O. (1964) Effect of hormones on the turnover of polysaccharides in connective tissues. Biophys. J. 4, 215-238.
Ebbe, S., .Phalen, E. & Stahlman, F. Jr. (1973) Abnormalities of megakaryocytes in SI/Sid mice. Blood 42,865-871.
Ebert, P.S. & Prockop, D.J. (1963) Effects of hydrocortisone on the synthesis of sulphated mucopolysaccharides and collagen in chick embryos. Biochim. Biophys. Acta 78, 390-392.
Ebert, P.S. & Prockop, D.J. (1967) Influence of cort.ISOI on the synthesis of sulphated mucopolysaccharides and collagen in chick embryos. Biochim. Biophys. Acta 136,45-55.
Eckert, H. & DOcke, F. (1972) Tierexperimentelle Untersuchungen Uber die zentralnervOse Beeinflussung der Erythropoiese. Exp. Pathol. (Jena) 6,180-184.
Eichwald, E. (1865) Beitri:ige zur Chemie der gewebbildenden Substanzen und ihrer AbkOmmlinge. I. Ueber das Mucin, besonders der Weinbergschnecke. Ann. Chern. Pharm. 134, 177-211.
Elson, L.A. & Morgan, W.T.J. (1933) A colourimetric method for the determination of glycosamine and chondrosamine. Biochem. J, 27, 1824-1828.
Endo, M., Yamamoto, R., Namiki, 0., Satake, S. & Yosizawa, Z. (1979). Comparison of glycosaminoglycans (GAG) in normal human plasma and urine. Tohoku, J, Exp. Med. 128,89-99.
Eppig, J.J. (1979) FSH stimulates hyaluronic acid synthesis by oocytecumulus cell complexes from mouse preovulatory foJJicles. Nature 281,483484.
Erslev, A.J., Caro, J., Kansu, E. & Silver, R. ( 1980) Renal and extrarenal erythropoietin production in anaemic rats. British J. Haemat. 45,65-72.
Fabianek, J., Herp, A. & Pigman, W. (1963) Effects of ascorbic acids and flavonoids on permeability of dermal connective tissue in rats and guinea pigs. Archiv. Int. Physio!. Biochim. 71,647-661.
Feldman, S., Rachmilewitz, E.A. & lzak, G. (1966) The effect of central nervous system stimulation on erythropoiesis in rats with chronically implanted electrodes. J. Lab. Clin. Med. 67,713-725.
Fessler, J.H. (1957) Water and mucopolysaccharide as structural components of connective tissue. Nature (London) 179, 426427.
106
Figura, K. von, Kiowski, W. & Buddecke, E. (1973) Differently labelled glycosamineprecursor pooles for the biosynthesis of hyaluronate and heparan sulphate. Eur. J, Biochem. 40. 89-94.
Fisher, J.W. (1972) Erythropoietin: Pharmacology, biogenesis and control of production. Pharmacal. Rev. 24,459-509.
Fisher, J,W., Lajtha, L.G., Buttoo, A.S. & Porteous, D.D. (1965) Direct effects of erythropoietin on the bone marrow of the isolated perfused hind limbs of rabbits. Brit .. J. Haemat. 11,342-349.
Fisher, J.W., Samuels, A.J. & Malgor, L.A. (1971) Androgens·and erythropoiesis. Israel. J. Med. Sci. 7, 892-900.
Ford, W.L., Gowans, J.L. & McCullagh, P.J. (1966) The origin and function of lymphocytes. In: CIBA symposium on the thymus. Eds. Wolstenholme G.E.W. & Porter, R.J. & A. Church'1ll Ltd. London, pp. 58..S5.
Fransson, L.~A (1968a) Structure of dermatan sulfate. Ill. The hybrid structure of dermatan sulfate from umbilical cord. J. Bioi, Chern. 243, 1504-1510.
Fransson, L.-A (1968b) Structure of dermatan sulphate. IV. Glycopeptides from the carbohydrate-protein linkage region of pig skin dermatan sulphate. Biochim. B'1ophys. Acta 156, 311·316.
Freilich, L.S., Lewis, R.G., Reppucci, A.C. Jr. & Silbert, J.E. (1975) Glycosaminogly~ can-synthesi-zing activity of an 'isolated Golgi preparation from cultured mast cells. Biochim. Biophys, Res. Commun, 63, 663..£368.
Fried, W., Husseini, S., Knospe, W.H. & Trobaugh, F.E. Jr. (1973) Studies on the source of hematopoietic tissue in the marrow of subcutaneously implanted femurs. Exp. Hemat. 1, 29~35.
Friedenstein, A.J., Chailakhjan, R.K. & Lalykina, K.S. (1970) The development of fibroblast colonies in monolayer cultures of guinea-pig bone marrow and spleen cells. Cell Tissue Kinet. 3, 393-403.
Friedenstein, A.J., Chailakhyan, R.K., Latsinik, N .V ., Panasyuk, A.F. & Keiliss~Borok, I.V. (1974b). Stromal cells responsible for transferring the microenvironment of the hemopoietic tissues. Cloning in vitro and retransplantation in vivo. Transplantation 17, 331-340.
Friedenstein, A.J., Deriglasova, U.F., Kulagina, N.N., Panasuk, A.F., Rudakowa, S.F., Luria, E.A. & Rudakow, I.A. (1974a) Precursors for fibroblasts in different populations of hematopoietic cells as detected by the in vitro colony assay method. Exp. Hemat. 2, 83-92.
Friedenstein, A.J., Gorskaja, U.F. & Kulagina, N.N. (1976) Fibroblast precursors in normal and irradiated mouse hematopoietic organs. Exp. Hemat. 4, 267-274.
Frindel, E., Dumenil, D. & Sainteny, F. (1980) Role of pluripoietins in murine bone marrow stem cell differentiation. Leukemia Res. 4, 287-299.
Fromme, H.G., Buddecke, E., Figura, K, von, & Kresse, H. (1976) Localization of sulfated glycosaminoglycans within cell nuclei by high resolution autoradiography. Exp. Cell Res. 102,445449.
Funderburgh, J.L. & Chandler, J.W. (1978) An agarose gel electrophoretic method for analysis of sulfated glycosaminoglycans of cultured cells. Anal. Biochem. 91, 464· 472.
FUrth, 0. & Bruno, T. (1937) Zur Kenntnis der ChondroitinschwefeJsaure. Biochem. z. 294, 153-173.
Furuhashi, T. (1961a) Polysulfated mucopolysaccharides of elasmobranch cartilage, J. Biochem. (Tokyo) 50,546.047.
Furuhashi, T. (1961b) Studies on sulfated mucopolysaccharides in cartilage of elasmobranchii. Isolation of polysulfated mucopolysaccharides. Seikagaku 33, 746~752.
107
Furukawa, K. & Terayama, H. (1977) Isolation and identification of glycosaminoglycans associated with purified nuclei from rat liver. Biochim. Biophys. Acta 499, 278-289.
Furukawa, K. & Terayama, H. (1979) Pattern of glycosaminoglycans and glycoproteins associated with nuclei of regenerating liver of rat. Biochim. Biophys. Acta 585,575-588.
Gardais, A., Picard, J. & Tarasse, C. (1969) Micro-fractionnement et micro-dosage des glycosaminoglycanes par electrophorese sur bandes d'acEltate de cellulose gelatinisees. J. Chromatog. 42, 396407.
Gardell, $. (1957) Separation of mucopolysaccharides on a cellulose column, Acta Chern. Scand. 11,668-675.
Gastpar, H. (1965) Die Wechselwirkungen von Heparin mit Enzymen und Hormonen. Thromb. Diath. Haemorr. 16,84-89.
Gimelius, B., Norling, B., Westermark, B. & Wasteson, A (1978) Turnover of cell surface associated glycosaminoglycans in cultures of human normal and malignant glial cells. Exp. Cell Res. 117,179-189.
Gold, E.W. (1979) A simple spectrophotometric method for estimating glycosaminoglycan concentrations. Anal. Biochem. 99, 183-188.
Goldberg, J.M. & Cottier, E. (1972) Specific isolation and analysis of mucopolysac· charides (glycosaminoglycans) from human urine. Clin. Chim. Acta 41, 19-27.
Golde, D.W. (1978) Hormonal modulation of erythropoiesis in vitro. In: Vitro Aspects of Erythropoiesis. Ed. Murphy M.J. Jr. Springer Verlag, New York, pp. 81..S5.
Golde, D.W., Bersch, N. & Cline, M.J .. (1976) Potentiation of erythropoiesis in v·1tro by dexamethasone. J. Clin. 1 nvest. 57, 57-62.
Golde, D.W., Bersch, N. & Li, C.H. (1977) Growth hormone: Species-specific stimulation of erythropoiesis in vitro. Science 196,1112-1113.
Golde, D.W., Hocking, W.G., Quan, S.G., Sparkes, R.S. & Gale, R.P. (1980). Origin of human bone marrow fibroblasts. Brit. J. Haemat. 44, 183-187.
Goldstein, A.L., Guha, A., Howe, M.L. & White, A. (1971) Ontogenesis of cell mediated immunity in murine thymocytes and spleen cells and its acceleration by thymosin, a thymic hormone. J. lmmunol. 106,773-780.
Goldwasser, E. & Kung, C.K.H. (1968) Progress in the purification of erythropoietin. Annals N.Y. ACad. Sci. 149,49-53.
Good, T.A. (1967) Ascending paper chromatography of sulfated acid mucopolysaccharides. Anal. Biochem. 19, 109-118.
Gordon, A.S., Mirand, E.A., Wenig, J. et al. (1968) Androgen actions on erythropoiesis Ann. N.Y. Acad. Sci. 149,318-335.
Gordon, L.l., Branda, R.F., Zanjani, E.D. & Jacob, H.S. {1978) Stimulation of erythroid colony formation by bone marrow makrophages. Blood 52,204,
Green, M.C. (1966) Mutant genes and linkages. In: Biology of Laboratory Mouse. Ed. Green, E.L. 2nd ed. McGraw Hill, New York, pp, 87-150.
Gressner, A.M., Schulz, W. & Greiling, H. (1979) The synthesis of glycosaminoglycans in aging rat liver. Mech. Ageing Oev. 1 0, 445-450.
Grobstein, C. (1967) Mechanisms of organogenetic tissue interaction. Nat. Cancer lnst. Monogr. 26,279-299,
Grosman, N., Hvidberg, E. & Schou, J. (1971) The effect of oestrogenic treatment on the acid mucopolysaccharide pattern in the skin of mice. Acta Pharmacal. Toxicol. 30,458-464.
Gross, P.M., Heistad, D.O. & Marcus, M.L. (1979) Neurohumoral regulation of blood flow to bones and marrow. Am. J. Physiol. 237,440448.

108
Gross, M. & Goldwasser, E. (1969) On the mechanism of erythropoietin~induced differentiation. V. Characterization of the ribonuclein acid formed as a result of erythropoietin action. Biochem. (Wash.) 8, 1795~1805.
Guri, C.D. & Bernste'1n, D.S. {1964) Effect of parathyroid hormone on mucopolysaccharide synthesis in rachitic rat cartilage in vitro. Proc. Soc. Exp. Bioi. Med. 116, 702-705.
Hadidian, Z. & Pirie, N.W. (1948) The preparation and some properties of hyaluronic acid from human umbilical cord. Biochem. J. 42,260-265.
Hajek, A.S. & Solursh, -M. (1975) Stimulation of growth arld mucopolysaccharide synthesis by insulin treatment of chick embryo chondrocytes in cell culture. General Camp. Endocrin. 25,432-446.
Hakomori, S.l. (1965) Substances containing amino sugars in blood cells and in hemopoietic organs. In: The Amino Sugars. Vol. II A. Eds, Balazs, E.A. & Jeanloz, R.W. Academic Press, New York, pp. 353-380.
Halberg, F. (1975) Biological rhythms. In: Biological Rhythms and Endocrine Function; Adv. in Exp. Med. & Bioi. Vol. 54 Eds, Hedlund, L.W. Franz, J.M. & Kenney, A.D. Plenum Press, New York pp, 13-25.
Hale, C.W. (1946) Histochemical demonstration of acid polysaccharides in animal tissues. Nature 157, 802.
Hale, A.J., Hall, I. & Curran, R.C. (1967) Electron-microprobe analysis of calcium phosphorous and sulfur in human arteries. J. Pathol. Bacterial. 93, 1-17.
Halvorsen, S. {1966) The central nervous system in regulation of erythropoiesis. Acta Haemat. 35,65-79.
Hamer, G.K. & Perlin, A.S. (1976) A 13 C-NMR spectral study of chondroitin sulfates, A, Band C: evidence of heterogeneity. Carbohydrate Res. 49,3748.
Hart, G.W. (1976) Biosynthesis of glycosaminogtycans during corneal development. J. Bioi. Chem. 251,6513-6521.
Hasumi, F. & Mori, Y. (1980) Characterization of glycosaminoglycans in peritoneal leukocytes from guinea pig. Biochem. Med. 23,6-16.
Havass, Z. & Szab6, L. (1972) Thinlayer chromatographic separation of glycosaminog!ycans. J. Chromatog, 71,580-584.
Hayes, E.F. & Craddock, C.G. (1978) Colony-sf1mu!ating act'1vhy. Arch. Patho!. Lab. Med. 102,165-171.
Hegemann, F. & DOrmer, P. (1976) Effect of ESF preparations on different types of erythroblasts. J. Cell. Physiot. 89, 171 -180.
Heinegflrd, D. (1972) Extraction, fractionation and characterization of proteoglycans from bovine tracheal cartilage. Biochim. Biophys, Acta 285, 181-192.
Herbert, V. (1970) Vitamin requirements for hematopoiesis, In: Regulation of Hematopoiesis. Vol. 1. Red Cell Production. Ed. Gordon, A.S. Appleton-century Crofts, New York, pp. 99-107.
Herme!in, B., Deudon, E., Bruei-Groleas, A. & Picard,J. (1975) Electrophorese preparative des gtycosaminoglycanes·peptides: application au fractionnement des glycosaminoglycanes-peptides de Ia paroi arterielle. J. Chromatog. 110,43-52.
Herp, A., Fabianek, J., Calick, A. & Pigman, W. (1966) Dermal connect'1ve tissue permeability in rheumatoid arthritics. Ann. Rheum. Dis. 25,345-352.
Hirano, S. & Meyer, K. (1971) Enzymatic degradation of corneal and cartilaginous keratosulfates. Biochem. Biophys. Res. Commun. 44, 1371-1375.
Hjerpe, A., Antonopoulos, C.A. & Engfeldt, B. (1979) Determination of sulphated disaccharides from chondroitin sulphates by high-performance liquid chromatography. J. Ch romatog. 171, 339-344.
109
Hoffman, P., Mashburn, T.A. Jr., Hsu, D.-S., Oiep, J, & Trivedi, D. (1975) Distribution studies on proteoglycan aggregates by ultracentrifugation. Connect. Tissue Res. 3,177-186.
Hogdson, G. and Toha, J. (1954) The erythropoietic effect of urine and plasma of repeatedly bled rabbits. Blood 9, 229-309.
Hoglund, L. (1976) Changes in acid mucopolysaccharides during the development of the Blowfly, Calliphora erythrocephala. J. Insect. Physiol. 22, 917-924.
Holley, R.W., Baldwin, J.H. & Kiernan, J.A. (1974) Control of growth of tumor cell by linoleic acid. Proc. Nat. Acad. Sci. 71, 3976-3978.
Honda, A., Takakubo, F., Murakami, N. & Mori, Y. (1979) Effect of colchicine and cytochalasin B on the secretion of proteochondroitin sulfate and protein-free chondroitin sulfate synthesized in cartilage slices. J. Pharm. Dyn. 2, 327·330.
Hooghwinkel, G.J. & Smits, G. {1957) The specificity of the periodic acid..Schiff techn'1que studied by a quantitative test-tube method. J. Histochem. Cytochem. 5,120-126.
Horn, Y. & Price, D.C. (1972) The effect of androgens on erythroid and granulocytic marrow recovery in the irradiated rat. Acta Haemat. (Basel) 48, 300-306.
Hronowski, L. & Anastassiades, T.P. (1979) Quantitation and interaction of glycosaminoglycans with alc'1an blue in dimethylsulfoxide solutions. Anal. Biochem. 93, 60·72.
Hsu, D., Hoffmann, P. & Mashburn, T.A. Jr. (1972) Micro colorimetric method of dye staining and its application to cellulose polyacetate strip electrophoresis for the determination of acid glycosaminoglycans. Anal. Biochem. 46, 156·163.
Huggins, C., McFadyen, J. &_ Wiege, E. (1940) A quantitative study of neutral fat, solids and water in the bone marrow of normal and anemic limbs and the effect of centrifugation on marrow. Anat. Rec. 76,309-317.
Humbel, R. & Chamoles, N.A. (1972) Sequential thin layer chromatography of urinary acidic glycosaminoglycans. Clin. Chim. Acta 40, 290·293.
Hurst, R.E., Jennings, G.C. & Lorincz, A.E. (1977) Partition techn'1ques for isolation and fractionation of urinary glycosaminoglycans. Anal. Biochem. 79, 502·512,
Hurst, R.E., Sheng, P.J.Y. & Ito, Y. (1978) Countercurrent chromatography. A new method for the fractionation of glycosaminoglycans. Anal. Biochem. 85,230-238.
Hvidberg, E. (1960) Water-binding by connective tissue and the acid mucopolysaccharides of the ground substance. Acta Pharmacal. Toxicol. 17,267-276.
Hvidberg, E. & Jensen, C.E. (1959) Changes in molecular weight of acid mucopolysaccharides in connective tissue due to hormone treatment, dehydration and age. Acta Chern. Scand. 13,2047-2056.
lnbar, M. & Schinitzky, M. (1974) Cholesterol as a bioregulator in the development and inhibition of leukemia. Proc. Natl. Acad. Sci. 71,42294231.
lscove, N.N. {1977) The role of erythropoietin in regulation of population size and cell cycling of early and late erythroid precursors in mouse bone marrow. Cell Tissue Kinet. 10,323-334.
lscove, N.N. {1978) Erythropoietin-independent stimulation of early etYthropoiesis in adult marrow cultures by conditioned media from lectin-stimulated mouse spleen cells. In: Hematopoietic Cell Differentiation. Eds. Golde, D.W., Cline, M.J., Metcalf, D. & Fox, C.F. ICN·UCLA Symposia on Molecular and Cellular Biology, Vol. X, Academic Press, New York, pp. 37·52.
lscove, N.N. & Guilbert, L.J. (1978) Erythropoietin-independence of early erythropoies·ls and a two-regulator model of proliferative control in the hemopoietic system. In: In Vitro Aspects of Erythropoiesis. Ed. Murphy, M.J., Springer Verlag, New York, pp. 3-7,
110
Jansen, H.W. & Bornstein, P. (1974) Effects of antimicrotubular agents on glycosaminoglycan synthesis and secretion by embryonic chick cartilage and chondrocytes. Biochim. Biophys, Acta 362,150-159.
Jansson, L., Orgren, S. & Lindahl, U. (1975) Macromolecular properties and end-group analysis of heparin isolated from bovine liver capsule Biochem. J. 145, 53-62.
Jastrowitz, H. (1927) Zur Chemie des Knochenmarks bei experimentellen An§mien. Z. Ges. Exp. Med. 55, 523-546.
Jeanloz, R.W. (1963) Mucopolysaccharides (Acidic glycosaminoglycans). In: Comprehensive Biochemistry, Vol, 5, Carbohydrates. Eds. Florkin, M. & Stotz, E.H., Elsevier, Amsterdam, pp. 262-296.
Jeanloz,R.W. (1965a) Chondroitin 4-sulphate. In: Methods in Carbohydrate Chemistry. Vol, V. General Polysaccharides. Ed. Whistler, R.L., Academic Press, New York, pp.110-113.
Jeanloz, R.W. {1965b) Oermatan sulphate. Enzymic deproteinisation. In: Methods in Carbohydrate Chemistry. Vol. V. General Polysaccharides. Ed. Whistler, R.L., Academic Press, New York, pp, 114-118.
Jeanloz, R.W. {1970) Mucopolysaccharides of higher animals. In: The Carbohydrates. Chemistry and Biochemistry. Eds. Pigman, W. & Horton, 0., 2nd ed. Vol. liB., Academic Press, New York, pp. 589-625.
Jepson, J.H. & Lowenstein, L. {1967) The effect of testosterone, adrenal steroids and prolactin on erythropoiesis. Acta Haemat. 38,292-299.
Jessar, R.A., Ganzell, M.A. & Ragan, C. {1953) The action of hydrocortisone in synovial inflammation. J. Clin. Invest. 32,480482.
Jones, A.S. {1953) The isolation of bacterial nucleic acids using cetyltrimethylammoniumbromide {cetav!on). B'1ochim. Biophys. Acta 10,607-612.
Jun3skova, V. & Tkadlecek, L. (1965) Character of primary and secondary colonies of haematopoiesis in the spleen of irradiated mice. Nature (London) 206, 951-952.
Juvani, M., Friman, C., Ranta, H. & Wegelius,O. (1975) Isolation and character'1sation of undersulphated chondroitin4·sulphate from normal human plasma. Biochim. Biophys. Acta 411, 1-10.
K3rkk3inen, J.E., Haahti, E.O. & Lehtonen, A.A. {1966) Thin layer and column chromatography of carbohydrates as trimethylsilyl ethers with applications to mucopolysaccharide analysis. Anal. Chem. 38, 1316-1319.
Kawata, H., Koizumi, T., Wada, R. & Yoshida, T. (1961) Urinary acid mucopolysaccharide excretion in liver damage. Gastroenterol. 40,507-512.
Keiser, H., Shulman, H.J. & Sandson, J.l. (1972) Immunochemistry of proteoglycan. Immunodiffusion and gel-electrophoretic studies. Biochem. J. 126, 163-169.
Keller, R., Bregnard, A., Gehring, W.J. & Schroeder, H.E. (1976) Morphologic and molecular changes in target cells during in vitro interaction with macrophages. Exp. Cell Bioi. 44, 108-124.
Kennedy, J.F. { 1971) Glycoproteins, glycopeptides and animal polysaccharides. In: Carbohydrate' Chemistry • Specialist Periodical Reports. Vol. 4, Part II. Macromolecules, Chapter 2, pp, 178-221. Chemical Society London.
Kennedy, J.F. & Cho Tun, H. (1972) The degradation of hyaluronic acid by ferrous ions. Carbohydrate Res. 22,43-51.
Kennedy, J.F., Sinnette, C.H. & Familusi, J.B. (1970) A new method for the chemical identification of a mucopolysaccharidosis - Hurler's syndrome with giant hydrocephalus. Clin. Chim. Acta 29,3742.

111
Kerby, C.P. (1955) The occurrence of acid mucopolysaccharides in human leukocytes. J. Clin. Invest. 34,1738-1743,
Khaitov, R.M., Petrov, R.V., Moroz, B.B. & Bezin, G.l. (1975) The factors controlling stem cell recirculation. I. Migration of hemopoietic stem cells in adrenalectomized mice. Blood 46,73-77.
Kimura, A. & Tsumuri, K. (1969) An improved method for the electrophoretic separation of acid mucopolysaccharides on cellulose acetate sheets. J. Biochem. (Tokyo) 65, 303-304.
Kleine, T.O., Heinrich, B. & Goetz, K. (1973) Biosynthesis of chondroitin sulfate proteins. Isolation of four pools of chondroitin sulfate proteins differing in their solubility and labelling rates with radiosulfate in calf rib cartilage. FEB$ Lett. 31, 170-174.
Kleine, T.O. & Hilz, H. (1968) Characterisierung der Protein-Polysaccharide aus Kalberrippenknorpel und lhre ln-Vitro-Markierung mit 35 S042 -. Z. Physiol, Chern. 349, 1027-1036.
Kleine, T.O., Kirsig, H.-J. & Hilz, H. (1968) Ueber die Koordinierung von Protein-, Polysaccharid- und Sulfatester-Synthese in Rippenknorpel von Ki:ilbern. Z. Physiol. Chern. 349,1037-1048.
Kleine, T.O. & Stephan, R. (1976) Biosynthesis of chondroitin sulfate side chains and hyaluronate. Time course studies with cartilage slices of calf ribs under different conditions. Siochim. Biophys, Acta 451,444456.
Knecht, J., Cifonelli, A. & Dorfman, A. (1967) Structural studies on heparitin sulfate of normal and Hurler tissues. J. Bioi. Chern. 242,46524661.
Knospe, W.H., Blom, J. & Crosby, W.H. (1966) Regeneration of locally irradiated bone marrow. I. Dose dependent, longterm changes in the rat, with particular emphasis upon vascular and stromal reaction. Blood 28,398415.
Knospe, W.H., Slam, J. & Crosby, W.H. (1968) Regeneration of locally irradiated bone marrow. II. Induction of regeneration in permanently aplastic medullary cavities. Slood.31, 400405.
Kriospe, W.H., Hinrichs, B., Fried, W., Robinson, W. & Trobaugh, F.E. Jr. {1976) Normal colony stimulating factor {CSF) production by bone marrow stromal cells and abnormal granulopoiesis with decreased CFU-C in SI/Std mice. Exp. Hemat. 4, 125-130.
Kofoed, J.A., Sozzini, C.E., Tocci, A.A. (1970) The concentration and synthesis of glycosaminoglycans in the skin and tracheal cartilage of normal and orchidectomized rats injected with testosterone. Acta Endocrinol. 63, 193-198.
Kofoed, H.A., Houssay, A.B., Tocci, A.A. & Curbelo, H.M. (1972) Effects of oestrogens upon glycosaminoglycans in the uterus of rats. Acta Endocrinol. 69, 87-94.
Kondi, A., MacDougall, L., Fay, H., Mehta, S. & Mbaya, V. (1963) Anemias of marasmus and kwashiorkor in Kenya. Arch. Dis. Child. 38, 267-275.
Kondo, K., Seno, N. & Anno, K. (1971) Mucopolysaccharides from chicken skin of three age groups. Biochim. Siophys. Acta 244,513-522.
Kosher, R.A. & Searls, R.L. (1973) Sulphated mucopolysaccharide synthesis during the development of Rana pipiens. Develop. Sial. 32, 50-68.
Kozutsumi, Y., ltoh, N., Fujimoto, K., Kawasaki, T. & Yamashina, I. (1979) Isolation and characterization of mucopolysaccharides from rat liver mitochondria. J. Biochem. 86, 1049-1 054.
Krause, R.F. (1943) Changes induced by anemia in the bone marrow lipids of cats. J. Bioi. Chern. 149,395-404.
Kresse, H., Tekolf, W., Figura, K. von, & Buddecke, E. (1975) Metabolism of sulfated glycosaminoglycans in cultivated bovine arterial cells. II. Quantitative studies on the uptake of 3 s S04-Iabelled proteoglycans. Z. Physiol. Chern. 356, 943-952.
112
Krukenberg, C.F.W. (1884) Die chemischen Bestandtteile des Knorpels. Zh. Obsch. Bioi. 20,307-326.
Krzymowski, T. & Krzymowska, H. (1962) Studies on the erythropoiesis inhibiting factor in the plasma of animals with transfusion polycythemia. Blood 19, 38-44.
Kuettner, K.E. & Lindenbaum, A. (1965) Analys'1s of mucopolysaccharides in partially aqueous media. Biochim. Biophys. Acta 101,223-225.
Kupchella, C.E. & Curran, K.L. (1976) Color-specific cross..over electrophoresis of acidic glycosaminoglycans. Anal. Biochem. 73,220-221.
Kurland, J., Broxmeyer, H. & Moore, M.A.S. (1977) Auto-regulation of committed granulocyte macrophage precursor cell prol"lferation by humoral mediators of the mononuclear phagocyte. Exp. Hemat. 5, 5.
Kuroda, J., SSito, S., Seno, N., Nagase, S. & Anno, K. (1974) Isolation and chemical characterization of mucopolysaccharides from rat tumors. Cancer Res. 34, 308-312.
Lajtha, L.G., Gilbert, C.W. & Guzman, E. (1971) K'1netics of haemopo·1etic colony growth. Brit. J. Haemat. 20,343-354.
Laurent, T.C. {1961) Studies on fractionated heparin. Arch. Biochem. Biophys. 92, 224-231.
Laurent, T.C. (1977) Interaction between proteins and glycosaminoglycans. Fed. Proc. 36, 24-27.
Laurent, T.C. & Pietruszkiewicz, A. (1961) The effects of hyaluronic acid on the sedimentation rate of other substances. Biochim. Biophys Acta 49, 258-264,
Laurent, T.C., Ryan, M. & Pietruszkiewicz, A. {1960) Fracf1onaf1on of hyaluronic acid. The polydispersity of hyaluronic acid from the bovine vitreous body, Biochim. Biophys. Acta 42,476-485.
Layton, L.L. (1951) Effect of cortisone upon chondroitin sulphate synthesis by animal tissues. Proc. Soc. Exp. Bioi. Med. 76,596-598.
Lebovitz, H.E. & Eisenbarth, G.S. (1975) Hormonal regulation of cartilage growth and metabolism. Vitam. Harm. 33, 575-648.
Leder A. & Leder, P. (1975) Butyric acid, a potent inducer of erythroid differentiation in cultured erythroleukaemic cells. Cell 5, 319-332.
Lehtonen, A., Karkkainen, J. & Haahti, E. (1966) Gas<hromatographic characterisation of the electrophoretically separated fractions of acid mucopolysaccharides. J. Chromatog. 24, 179-182.
Lewis, J.P. & Trobaugh, F.E. (1964) Haemopoietic stem cells. Nature 204, 589-590. Lie, S.O., McKusick, V.A. & Neufeld, E.F. (1972) Simulation of genetic 'mucopolysac
charidoses in normal human fibroblasts by alteration of pH of the medium. Proc. Nat. Acad. Sci. 69,2361-2363.
Lippman, M.S.S.J. (1964) A proposed role for mucopolysaccharides in the initiation and control of cell division. Trans. N.Y. Acad. Sci. 27,342-360.
Lippman, M.S.S.J. (1968) Glycosaminoglycans and cell division. In: Ephheliai-Mesenchymal interactions (eds. Fleischmajer, R. & Billingham, R.E.l. The Williams and Wilkins Camp. Baltimore, pp. 208-229.
Lipsky, P.E., Eilner, J.J. & Rosenthal, A.L. {1976) Phytohemagglutinininduced proliferation of guinea pig thymus-derived lymphocytes. I. Accessory cell dependence. J. lmmunol. 116.868-875.
Liron, M. & Feldman, M. (1965) The specific suppression of the differentiation of erythroid clones in polycythemic animals. Transplantation 3, 509-516.
Lord, 8.1., Wright, E.G., & Lajtha, L.G. {1979) Actions of the haemopoietic stem cell proliferation inhibitor. Biochem. Pharmacal. 28,1843-1848.
113
Lowther, D.A., Toole, B.P. & Meyer, F.A. (1967) Extraction of acid mucopolysac· char ides from bovine heart valves. Arch. Biochem. Biophys. 118, 1-11.
Lukowsky, W. & Painter, R.H. (1968) Molecular weight of erythropoietin from anemic sheep plasma and human urine. Canad. J, Biochem. 46,731-734.
Maeta, T., Endo, M. & Yosizawa, Z. (1974) Glycoproteins and glycosaminoglycans in human pulmonary tuberculosis. Clin, Chim. Acta 57,255-261.
Magdelenat, H., Turq, P. & Chemla, M. {1974) Study of the self-diffusion coefficients of cations in the presence of an acidic polysaccharide. Biopolymers 13, 1535-1548.
Malgor, L.A. & Fisher, J.W. (1970) Effects of testosterone on erythropoietin production in isolated perfused kidneys. Amer. J. Physiol. 218, 1732-1736.
Maloney, M.A. & Patt, H.M. (1972) Persistent marrow hypocellu\arity after local X-irradiation of the rabbit femur with 1000 rad. Rad. Res. 50, 284·292.
Maniatis, A., Tavassoti, M. & Crosby, W.H. ( 1971) Origin of osteogenic precursor cells in extramedullary marrow implants. Blood 38,569-575.
Marbet, R. von & Winterstein, A. (1951) Probleme der Blutgerinnung . .B-Heparin, ein neuer, blutgerinnungshemmender Mucoitinschwefe!si3urester. He!v. Chim. Acta 34,2311-2320.
Margolis, R.U., Margolis, R.K., Chang, L.B. & Preti, C. (1975) Glycosaminoglycans of brain during development. Biochemistry 14, 85..S8.
Masamune, H. & Osaki, S.-1. (1943) Biochemical studies on carbohydrates. LXIX. Preparation of pure chondroitin sulphuric acid. Tohoku J. Exp. Med. 45, 121· 127.
Masuda, H., Shichijo, S. & Takeuchi, M. (1979) Isolation and characterization of glycosaminoglycans from equine gastric mucosa. Int. J. Biochem. 10, 337-341.
Matalon, R. & Dorfman, A. (1969) Acid mucopolysaccharides in cultured human fibroblasts. Lancet ii 838..S41.
Mathews, M.B. (1959) Macromolecular properties of isomeric chondroitin sulfates. Biochim. Biophys. Acta 35,9-17.
Mathews, M.B. (1962) Sodium chondroitin sulfate-protein complexes of cartilage. I I I. Preparation from shark. Biochim. Biophys, Acta 58, 92-101.
Mathews, M.S. (1971) Comparative biochemistry of chondroitin sulphate-proteins of cartilage and notochord. Biochem. J. 125,3746.
Mathews, M.B. & Cifonelli, J.A. (1965) Comparative biochemistry of keratosulphates. J. Bioi. Chern. 240,41404145.
Matio!i, G. & Rife, L.L. (1980) Compartmentalized growth of hemopoietic stem cells within mouse Friend leukemic spleens. Experientia 36,592-594.
McCarthy, K.F. (1975) In vivo colony formation by hematopoietic cells from mice of genotype Sl!SJd. Cell Tissue Kinet. 8, 397-398.
McCarthy, K.F., Ledney, G.D. & Mitchell, R.A. (1977) Deficiency of hematopoietic stem cells in steel mice. Cell Tiss. Kinet. 10,122-126.
McCulloch, E.A., Siminovitch, L., Till, J.E., Russell, E.S. & Bernstein, S.E. (1965). The cellular basis of the genetically determined hemopoietic defect in anaemic mice of genotype SI/Sid. Blood 26,399410.
McCulloch, E.A., Thompson, M.W., Siminovitch, L. & Till, J.E. (1970) Effects of bacterial endotoxin on hemopoietic colony-forming cells in the spleens of normal mice and mice of genotype $1/Sid. Cell Tissue Kinet. 3, 47-54.
McCoskey, R.S., Meineke, H.A. & Townsend, S.F. (1972) Studies of the hemopoietic microenvironment. I. Changes in the microvascular system and stroma during erythropoietic regeneration and suppression in the spleens of CF1 mice. Blood 39, 697-712.
114
McCuskey, R.S. & Meineke, H.A. (1973) Stud'1es of the hemopoietic microenvironment. II t. Differences in the splenic microvascular system and stroma between SI/Std and W/WV anemic mice. Am. J. Anat. 137, 187-198.
McCuskey, R.S. & Me'1neke, H.A. (1977) Erythropoietin and the hemopoietic microenvironment. In: Kidney hormones, Vol. II, Erythropoietin (ed. Fisher, J.W.l. Academic Press, London, pp. 311-327.
McCuskey, P.A., McCuskey, R.S. & Meineke, H.A. (1975) Studies of the hemopoietic microenvironment. IV. In vivo microscopic and histochemical study of allografts of bone marrow in the hamster cheek pouch chamber. Exp. Hemat. 3, 297-308.
McDonald, T.P. {1976) Role of the kidneys in thrombopoietin production. Exp. Hemat. 4, 27-31.
McDuffie, N.M. & Cowie, N.W. (1979) Structural characteristics of heparins revealed by electrofocusing. In: Heparin: Structure, Cellular Functions and Clinical Applications. (Ed. McDuffie, N.M.) Academic Press. New York, pp. 79-98.
McKusick, V.A. (1972) Heritable Disorders of Connective Tissue. The mucopolysaccharidoses. 4th ed. The C.V. Mosby Company Saint Louis, pp. 521-686.
McKusick, V.A., Kaplan, D., Wise, D., Hanley, W.S., Suddarth, S.B., Sevick, M.E. & Maumanee, A.E. (1965) The genetic mucopolysaccharidoses. Medicine 44, 445-483.
McLeod, D.L., Shreeve, M.M. & Axelrad, A.A. (1974) Improved plasma culture system for production of erythrocytic colonies in vitro: Quantitative assay method for CFU-E. Blood 44,517-534.
Merrilees, M.J. & Scott, L. (1980) Interaction of epithelial cells and fibroblasts in culture: effect on glycosaminoglycan levels. Develop. Bioi. 76, 396409.
Metcalf, D. (1974) Depressed responses of the granulocyte-macrophage system to bacterial antigens following preimmunization. Immunology 26, 1115-1125.
Metcalf, D. & Moore, M.A.S. (1971) Haemopoietic cells. North Holland Pubi.Comp,, Amsterdam, London.
Metcalf, D. & Moore, M.A.S. (1971) Haemopoietic cells. In: Frontiers of Biology, Vol. 24, American Elsevier Publ. Co., New York, pp. 383-416.
Metcalf, D. & Moore, M.A.S. (1972) Regulation of growth and differentiation in hemopoietic colonies growing in agar. In: Haemopoietic Stem Cells, (Ciba Symposium 13), Associated Scientific Publishers, Amsterdam & New York, pp. 157-182.
Metcalf, D., Johnson, G.R. & Mandel, T.E. (1979) Colony formation in agar by multipotential hemopoietic cells. J. Cell Physiol. 98,401420.
Meyer, K. (1938) The chemistry and biology of mucopolysaccharides and glycoproteins. Cold Spring Harbor Symp. Quant. Bioi. 6, 91-102.
Meyer, K. (1948) Highly viscous sodium hyaluronate. J. Bioi. Chem. 176,993-994. Meyer, K. & Smyth, E.M. (1937) On glycoproteins. VI. The preparation of chondroi
tinsulphuric acid. J. Bioi. Chern. 119,507-510. Meyer, K. & Chaffee, E. (1940) Hyaluronic acid in the pleural fluid associated with a
malignant tumor involving the pleura and peritoneum. J. Bioi. Chern. 133, 83-91. Meyer, K., Davidson, E.A., Linker, A. & Hoffman, P. (1956) The acid mucopoly
saccharides of connective tissue. Biochim. Biophys. Acta 21,506-518. Meyer, K., Hoffman, P. & Linker, A. (1957) The acid-mucopolysaccharides of connec
tive tissue. In: Connective Tissue. A Symposium. (Tunbridge, R.E., ed.) Blackwell, Oxford, pp, 86-96.
Meyer, K., Grumbach, M.M., Linker, A. & Hoffman, P. (1958a) Excretion of sulphated mucopolysaccharides in gargoylism (Hurler's syndrome). Proc. Soc. Exp. Bioi. Med. 97. 275·279.

115
Meyer, K., Hoffman, P. & Linker, A. (1958b) Mucopolysaccharides of costal cartilage, Science 128, 896.
Meyers, P.A., Kurland, J.l. & Moore, M.A.S. (1978) In vitro control of erythropoiesis by macrophages. Exp. Hemat 6, 14.
Mier, P.O. & Urselmann, E. (1970) Urinary acid mucopolysaccharide excretion in skin disease. Oermatologica 141,34--37.
Mikuni-Takagaki, Y. & Toole, B.P. (1979) Shedding of hyaluronate from the cell surface of Reus sarcoma virus-transformed chondrocytes. J. Bioi. Chern. 254, 8409-8415.
Mikuni-Takagaki, Y. & Toole, B.P. (1980) Cell-substratum attachment and cell surface hyaluronate of Reus sarcoma virus.transformed chondrocytes. J. Cell Bioi. 85, 481· 488.
Mirand, E.A. & Prentice, T.C. (1957) Presence of plasma erythropoietin in hypoxic rats with or without kidney(s) and/or spleen. Proc. Soc. Exp. Bioi. N.Y. 96,49-51.
Mirand, E.A., Grace, J.T., Johnston, G.S. & Murphy, G.P. (1964) Effects of hypothalamic stimulation on the erythropoietic response in the rhesus monkey, Nature 204,1163-1165.
Mishell, R.I. & Dutton, R.W. (1967) Immunization of dissociated spleen cell cultures from normal mice. J. Exp. Med. 126,423442.
Mitra, S.K. & Blau, K. (1978) An improved determination of total glycosaminoglycans in body fluids by formation of complexes with quinacrine: Changes in amniotic fluid total glycosaminoglycans during normal pregnancies and in pregnancies at risk for mucopolysaccharidoses. Clin. Chim. Acta 89, 127-134.
Moore, M.A.S. (1971) Regulatory function of the haemopoietic microenvironment. In: Haemopoietic Cells. Eds. Metcalf, D. & Moore, M.A.S. North Holland Publ. Camp. Amsterdam, p. 97.
Moore, M.A.S. (1976) Regulatory role of macrophages in hemopoiesis. J. Reticula· endoth. Soc. 20,89-91.
Moore, M.A.S. & Metcalf, D. (1970) Ontogeny of the haemopoietic system: Yolk sac origin of in vivo and in vitro colony forming cells into the developing mouse embryo. Brit. J. Haemat. 18,279-296.
Moore, M.A.S. & Dexter,T.M. (1978) Stem cell regulation in continuous hematopoietic cell culture. Transplantation Proc. X (1),83-90.
Moriyama, Y. & Fisher, J.W. (1974) Effects of testosterone and erythropoietin on erythroid colony formation in rabbit bone marrow cultures. Life Sci. 15, 1181-1188.
Moriyama, Y. & Fisher, J.W. (1975) Effects of testosterone and erythropoietin on erythroid colony formation in human bone marrow cultures. Blood 45, 665-670.
Morley, A., Rickard, K.A., Howard, D. & Stahlman, F.Jr. (1971) Studies on the regulation of granulopoiesis: IV. Possible humoral regulation. Blood 37, 14-22.
Morris, J.E. (1979) Steric exclusion of cells. A mechanism of glycosaminoglycaninduced cell aggregation. Exp. Cell Res. 120,141-153.
Morrison, L.M., Schjeide, O.A., Qui!ligan, J.J., Freeman, L. & Murata, K. (1965) Metabolic parameters of the growth-stimulating effect of chondroitin sulfate A in tissue cultures. Proc. Soc. Exp. Bioi. Med. 119,618-622.
Muir, H. (1956) The effect of papain on the viscosity of chondroitin sulphate. Biochem. J. 62, 26p-27p.
Muir, H. & Marshall, A.H.E. (1961) Chemistry of a mucopolysaccharide produced by guinea pig lymphocytes. Nature 191, 706.
Muir, H., Baxter, E. & Brandt, K.O. (1973) The antigenicity of extracellular proteoglycans: Implications for structure and biosynthesis. Biochem. Soc. Trans. 1, 223-226.
116
Murata, K. (1974) Acidic glycosaminoglycans in human platelets and leukocytes; The isolation and enzymatic character'tzation of chondroitin 4-sulfate. Clin. Chim. Acta 57,115-124.
Murata, K. (1975) Acidic glycosaminoglycans in human kidney tissue. Clin. Chim. Acta 63.157-169.
Murata, K., Ishikawa, T. & Oshima, Y. (1970) Enzymatic studies of urinary chondroitin sulfates in normal and systemic connective tissue disease states. Clin. Chim. Acta 28,213-222.
Murata, K., Yukiyama, Y. & Horiuchi, Y. (1973) Metabolic changes of urinary acidic glycosaminoglycans in Weber Christian disease. Clin. Chim. Acta 49, 129-139.
Murata, K. (1980) Structural differences of acidic glycosaminoglycans of leukocytes in leukemic states. Biochem. Med. 23,324-335.
Myers, S.L. & Castor, C.W. (1980) Connective tissue activation. XV. Stimulation of glycosaminoglycan and DNA synthesis by a polymorphonuclear leukocyte factor, Arthritis. Rheum. 23, 556·563.
Nakao, K. & Angrist, A.A. (1968) Membrane surface specialization of blood platelet and megakaryocyte. Nature (London) 217,960-961.
Nakeff, A. & Daniels-McQueen, S. (1976) In vitro colony assay for a new class of megakaryocyte precursor: colony forming unit, megakaryocyte (CFU-M). Proc. Soc. Exp. Bioi. Med. 151,587-590.
Nameroff, M. & Holtzer, H. (1967) The loss of phenolytic traits by differentiated ::;:ells. IV. Changes in polysaccharides produced by dividing chondrocytes. Develop. Bioi. 16,250-281.
Naughton, B.A., Kaplan, S.M., Roy, M., Burdowski, A.J. & Gordon, AS. {1977) Hepatic regeneration and erythropoietin production in the rat. Science 197,301-302-.
Neufeld, E.F. (1977) The enzymology of inherited mucopolysaccharide storage disorders, Trends. Biochem. Sci. 2, 25-26.
Nevo, Z. & Dorfman, A. (1972) Stimulation of chrondromucoprotein synthesis in chondrocytes by extracellular chondromucoprote'm. Proc. Nat. Acad. Sci. 69, 2069-2072.
Newton, O.J., Scott, J.E, & Ahmad, S. (1979) Circadian rhythms and the urinary excretion of acid glycosaminoglycans in normal human adults. Conn. Tissue Res. 7, 47-55.
Noordegraaf, E.M. {1979) Electrophoresis of glycosaminoglycans on cellulose acetate membranes with cation electrolytes: An electrofocusing phenomenon. Int. J. B'1ol. Macromolecules. 1, 93.
Noordegraaf, E.M. & Ploemacher, R.E. (1979) Studies of the haemopoietic microenvironments. II. Content of glycosaminoglycans in mur'1ne bone marrow and spleen under anaemic and polycythaemic conditions. Scand. J. Haemat. 22. 327· 332.
dbrink, 8., Pertoft, H., lverius, P.H. & Laurent, T.C. (1975) The effect of calcium on the macromolecular properties of heparan sulfate. Conn. Tissue Res. 3, 187-193.
Odell, T.T. Jr. & McDonald, T.P. (1961) Stimulation of platelet production by serum of bled rats. Fed. Proc. 20,51.
Ogawa, M., Grush, O.C., O'dell, R.F. & Sexton,J.A. (1976) Circulating erythropoietic precursors in patients with hemoglobinopathies: Absence of correlation with reticulocyte indices. Exp. Hemat. 4, 41.

117
Ogston, A.G. & Stanier, J.E. (1953) Physiological function of hyaluronic acid in synovial fluid, viscous, elastic and lubricant properties. J. Physiol. 119, 244~252.
Ogston, A.<;l. & Phelps, C.F. (1961) The partition of solutes between buffer solutions and solutions containing hyaluronic acid. Biochem. J. 78,827-833.
Ogston, A;G. & Preston, B.N. (1966) The exclusion of protein by hyaluronic acid. Measurement by light scattering. J. Bioi. Chem. 241,17-19.
Ohno, Y. & Fisher, J.W. (1978) Effects of androgens on burst forming units (BFU-E) in normal rabbit bone marrow. Life Sci. 22,2031-2036.
Okada, T., Hazato, N., Nishjio, T. & Sugiua, M. {1973) Acid-mucopolysaccharides and sclerosis of human aorta. Japan. Circ. J. 37, 253·259.
Okayama, M., Yoshimura, M., Muto, M., Chi, J., Roth, S. & Kaji, A. (1977) Transformation of chicken chondrocytes by Rous sarcoma virus. Cancer Res. 37,712-717.
Ol<lh, E.H. & Kostenszky, K.S. (1976) Effect of prednisolone on the glycosaminoglycan components of the regenerat'1ng articular cartilage. Acta Bioi. Acad. Sci. Hung. 27,129-134.
Olsson, I. (1972) Subcellular sites for synthesis of glycosaminoglycans (mucopolysaccharides) of rabbit bone marrow cells. Exp. Cell Res. 70,173-184.
Orenstein, N.S., Galli, S.J., Dvorak, A.M., Silbert, J.E. & Dvorak, H.F. (1978) Sulfated glycosaminoglycans of guinea pig basophilic leukocytes. J. I mmunol. 121, 586-592.
Orlic, D., Gordon, A.S. & Rhodin, J.A. (1965) An ultrastructural study of erythropoie· tin-induced red cell formation in mouse spleen. J. Ultrastruct. Res. 13,516-542.
Pacifici, M., Boettiger, D., Roby, K. & Holtzer, H. (1977) Transformation of chondroblasts by Rous sarcoma virus and synthesis of the sulfated proteoglycan matrix. Cell 11,891-899.
Paulo, L.G., McCuskey, R.S., Fink, G.D., Roh, B.L. & Fisher, J.W. (1973) Effects of posterior hypothalamic stimulation on reticulocyte release and bone marrow microcirculation. Proc. Soc. Exp. Bioi. Med. 143,986-990.
Payne, D.N. & Ackerman, G.A. (1977) Ultrastructural autoradiographic study of the uptake and intracellular localization of BS-sulfate by developing human neutrophils. Blood 50,841-856.
Pearse, A.G.E. (1949) Nature of Russell bodies and Kurloff bodies: Observations on cytochemistry of plasma cells and reticulum cells. J. Clin. Pathol. 2, 81-90.
Pearse, A.G.E. (1968) Histochemistry. Theoretical and Applied. 3rd ed. val. 1. J. & A. Churchill Ltd., London, p. 311.
Perlin, A.S., Casu, B., Sanderson, G.R. & Johnson, L.F. (1970) 200 MHz spectra of heparin, chondroitins and other mucopolysaccharides. Can. J. Chem. 48, 2260-2268.
Perlin, A.S. (1976) Analysis and characterization of glycosaminoglycans by nuclear magnetic resonance spectroscopy. In: Methods in carbohydrate chemistry. Eds. Whistler, R.L. & BeMiller, J.N. Vol. VII, Academic Press, New York, pp. 94-100.
Peschle, C., Magli, M.C., Cillo, C., Lettieri, F., Pizzella, F., Genovese, A., Soricelli, A. (1977) Enhanced erythroid burst formation in mice after testosterone treatment. Life Sci. 21,773-778.
Peschle, C., Marone, G., Genovese, A., Magli, C. & Condorelli, M. (1976) Hepatic erythropoietin; enhanced production in anephric rats with hyperplasia of Kupffer cells. Brit. J. Haemat. 32, 105-111.
Pessac, B. & Defendi, V. (1972) Cell aggregation: role of acid mucopolysaccharides. Science 175,898-900.
Phelps, C.F. (1973) The biosynthesis of glycosaminoglycans. Biochem. Soc. Trans. 1, 814-819.

118
Phelps, C.F. (1974) Physical methods of character"1sing the size and shape of macromolecules in solution. In: Chemistry of macromolecules Ed. Gutfreund, H. MTP Int. Rev. Sci., Biochem. Ser. One, Vol. 1, Butterworths, London, pp. 325-373.
Pictet, R., Orci, L. & Forssmann, W.G. & Girardier, L. (1969) An electron-microscopic study of the perfusion-fixed spleen. I. The splenic circulation and the RES concept. Z. Zellforsch. 96,372-399.
Ploemacher, R.E. (1978) The erythroid hemopoietic microenvironments. Thesis. Ploemacher, R.E. (1979) Personal communication. Ploemacher, R.E. & van Soest, P.L, (1977a) Morphological investigations on phenyl
hydrazine-induced erythropoiesis in the adult mouse liver. J. Cell Tissue Res. 178,435461.
Ploemacher, R.E. & van Soest, P.L. (1977b) Morphological investigations on ectopic erythropoiesis in experimental hemolytic anemia. Cytobiologie 15, 391409.
Ploemacher, R.E., van 't Hull, E. & van Soest, P.L. (1978) Studies of the hemopoietic microenvironments. Effects of acid mucopolysaccharides and dextran sulphate on erythroid and granuloid differentiation in vitro. Exp. Hemat. 6, 311-321.
Ploemacher, R.E., van Soest, P.L., Wagemaker, G. & van 't Hull, E. (1979) Particle· induced erythropoietin-independent effects on erythroid precursor cells in murine bone marrow. Cell Tissue Kinet. 12,539-550.
Ploemacher, R.E., Brons, N.H.C. & van Soest, P.L. (1980) Haemopoietic stroma. VI. Stability of splenic E/G colony ratios upon irradiation and manipulation of the erythron. Haematologica, accepted for publication.
Potter, J.E.R. & Wright, E.G. (1980) Bone marrow lipids in normal and anemic mice. Am. J. Hem at. 8, 361-367.
Pras, M., Nevo, Z., Schubert, M., Rotman,J. & Matalon, R. (1971) The significance of mucopolysaccharides in amyloid, J. H"1stochem. Cytochem. 19,443448.
Pratt, A.M., Larsen, M.A. & Johnston, M.C. (1975) Migration of cranial neural crest cells in a cell free hyaluronate-rich matrix. Develop. Bioi. 44,298-305.
Preston, B.N., Davies, M. & Ogston, A.G. (1965) The composition and physicochemical properties of hyaluronic acids prepared from ox synovial flu.ld and from a case of mesothelioma. Biochem. J. 96,449474.
Preston, B.N. & Snowden, J.Mck. (1972) Model connective tissue systems: The effect of proteoglycans on the diffusional behaviour of small nonelectrolytes and microions. Biopolymers 11, 1627-1643.
Priest, R.E. & Koplitz, A.M. (1962) Inhibition of synthesis of sulphated mucopolysaccharides by estradiol. J. Exp. Med. 116,565-574.
Prin:z, R., Klein, U., Sudhakaran, P.R., Sinn, W., Ullrich, K. & von Figura, K. (1980) Metabolism of sulfated glycosaminoglycans in rat hepatocytes. Synthesis of heparan sulfate and distribution into cellular and extracellular pools. Biochim. Biophys. Acta 630,402413.
Rahemtulla, F., HOglund, N.G. & L0vtrup, S. (1976) Acid mucopolysaccharides in the skin of some lower vertebrates (Hagfish, Lamprey and Chimaera) Comp. Biochem. Physiol. 538,295-298.
Rauchwerger, J.M., Gallagher, M.T. & Trentin, J.J. (1973) Role of the hemopoietic inductive microenvironments (HIM) in xenogenic bone marrow transplantation. Transplantation 15,610-613.
Reilly, F .0. & McCuskey, R .S. (1976) Microcirculation. Vol. 1. Eds. Grayson, J. & Zingg, W. Plenum Press, New York, pp. 356-357.
Reilly, F.D. & McCuskey, R.S. (1977) Studies of the hemopoietic microenvironment. VI. Regulatory mechan'1sms in the splenic microvascular system of mice. Microvasc. Res. 13,79-90.
119
Rencricca, N.J., Rizzoli, V ., Howard, D., Duffy, P. & Stahlman, F. Jr. (1970) Stem cell migration and proliferation during severe anemia. Blood 36,764-771.
Rennert, O.M. (1967) Disk electrophoresis of acid mucopolysaccharides. Nature (London) 213,1133.
Rich, C. & Myers, W.P.L. (1959) Excretion of acid-mucopolysaccharides in the urine of patients with malignant neoplastic disease. J. Lab. Clin. Mecl. 54, 223-228.
Rientis, K.G. (1953) The electrophoresis of acid mucopolysaccharides on filter paper. Biochem. J. 53,79-85.
Rinehart, J.J., Zanjani, E.D., Nomdedeu, B., Gormus, B.J. & Kaplan, M.E. {1978) Cellcell interaction in erythropoiesis: role of human monocytes. J. Clin. Invest. 62, 979-986_
Robertson, W. van B & Harvey, J. (1972) The determination of galactose in urinary acidic glycosaminoglycans as a measure of keratansulfate-like substances in urine. Biochem. Med. 6, 246-256.
Rod€n, L., Baker, J.R., Cifonelli, J .A. & Mathews, M .B. (1972) Isolation and characterization of connective tissue polysaccharides. In: Methods in enzymology, Vol. XXVJII. Eds. Colowick S.P. & Kaplan, N.O. Academic Press, New York, pp, 73 140.
ROlla, G., Melsen, B. & S6nju, T. (1978) Is sulphated blood-group substance in pancreas a factor in cystic fibrosis? Acta Path. Microbial. Scand. Sect. A., 86, 83-86.
Rosenberg, L., Wolfenstein-Todel, C., Margolis, R., Pal, S. & Strider, W. (1976) Proteoglycans from bovine proximal humoral articular cartilage. Structural basis for the polydispersity of proteoglycan subunit. J. Bioi. Chern. 251,6439-6444.
Ruoslahti, E. & Engvall, E .. (1980) Complexing of fibronectin glycosaminoglycans and collagen. Biochim. Biophys. Acta 631,350-358.
Ruscetti, F.W., Boggs, D.P., Torok, B.J. & Boggs, S.S. (1976) Reduced blood and marrow neutrophils and granulocytic colony forming cells in SI/Sid mice. Proc. Soc. Exp. Bioi. Med. 152,398-402.
Russell, E.S. & Bernstein, S.E. (1966) Blood and blood formation. In: The biology of the laboratory mouse. Ed. Green, E.L. 2nd ed. McGraw Hill, New York, 351-372.
Saarni, H. (1978) Cortisol effects on the glycosaminoglycans synthesis and molecular weight distribution in vitro. Biochem. Pharmacal. 27, 1 029-1032.
Saarni, H., Tammi, M. & Doherty, N.S. (1978) Decreased hyaluronic acid synthesis, a sensitive indicator of cortisol action on fibroblast. J. Pharm. Pharmac. 30, 200-201.
Saiga, H. & Kinoshita, S. (1976) Changes of chromatin structure induced by acid mucopolysaccharides. Exp. Cell Res. 102,143-152.
Sampaio, L.O., Dietrich, C.P. & Giannotti Filho, 0, (1977) Changes in sulfated mucopolysaccharide composition of mammalian tissues during growth and in cancer tissues. Biochim. Biophys. Acta 498, 123-131.
Sato, C.S. & Gyorkey, F. (1978) Purification of protease-extracted glycosaminoglycans by short-distance paper chromatography with a zinc acetate solvent. Anal. Biochem. 87, 540-544.
Sayk, J. (1960) Cytologie der Cerebrospinalf!Ussigkeit. Jena. Fisher Verlag. Schaffrath, D .• Stuhlsatz, H.W. & Greiling, H. (1976) Interactions of glycosaminogly
cans with DNA and RNA synthesizing enzymes in vitro. Hoppe-Seyler's z. Physiol. Chern. 357,499-508,
Schiller, S. (1966) Connective and supporting tissues: mucopolysaccharides of connective tissues. Ann. Rev. Physiol. 28,137-158.
120
Schiller, S. & Dorfman, A. (1957) The metabolism of mucopolysaccharides in animals: the effect of cortisone and hydrocortisone on rat skin. Endocrinology 60,376-381.
Schiller, S., Blumenkrantz, M. & Dorfman, A. (1965) Effect of prednisolone and hydrocortisone on distribution of mucopolysaccharides in the skin of rats. Biochim. Siophys. Acta 101,135-137.
Schmiedeberg, 0. (1891) Ueber die chemische Zusammensetzung des Knorpels. Arch. Exp. Pathol. Pharmakol. 28, 355-404.
Schooley, J.C. (1964) Studies on the regulation of erythropoiesis in spleen colonies. Exp. Hemat. 7, 79.
Schooley, J.C. (1966) The effect of erythropoietin on the growth and development of spleen colony forming cells. J. Cell Physiol. 68,249-262.
Schrock, L.M., Judd, J.T., Meineke, HA. & McCuskey, R.S. (1973) Differences in concentrations of acid mucopolysaccharides between spleens of normal and polycythemic CF mice. Proc. Soc. Exp. Bioi. Med. 144,593-595.
Schrijver, M.F. {1965) The effect of hydrocortisone on chondroitin sulfate production and loss by embryonic chick tibiotarsi in organ culture. Exp. Cell Res. 40, 610-618.
Schwartz, N.B. (1976) Biosynthesis of chondroitin sulfate. Role of phospholipids in the activitY of UDP-0-galactose: D-xylose galactosyltransferase. J. Bioi. Chem. 251, 285-291.
Schwartz, N.B. & RodCn, L. (1972) Role of lipids in the activity of UDP-galactose: xylose galactosyltransferase. Fed. Proc. 31,434.
Schwartz, E.R., Kirkpatrick, P.R. & Thompson, R.C. (1974) Sulfate metabolism in human chondrocyte cultures. J. Clin. Invest. 54,1056-1063.
Scott, J.E. (1955) Reaction of long-chain quaternary ammonium salts with acidic polysaccharides. Chern. and !Pd. 168-169.
Scott, J.E. (1960) Aliphatic ammonium salts in the assay of acidic polysaccharides from tissues. In: Methods of b'1ochemical analysis. Vol. 8. Ed. Glick, D. Interscience, New York, pp. 145-197.
Seno, N., Anno, K. & Kondo, K. (1970) Improved method for electrophoretic separation and rapid quantitation of isomeriC chondroitin sulfates on cellulose acetate strips. Anal. Biochem. 37, 197-202.
Seno, N., Masuhara, H., Nagase, S. & Anno, K. (1974) Mucopolysaccharides ·m the spleen of mice with friend leukemia. Gann. 65,451-454.
Sevag, M.G. {1934) Eine neue physikalische Enteiweissungsmethode zur Darstellung biologisch wirksamer Substanzen. lsolierung von Kohlenhydraten aus Hi.ihnereiweisz und Pneumococcen. Biochem. Z. 273,419-429.
Sheehan, J.K., Gardner, K.H:& Atk'ms, E.D.T. (1977) Hyaluronic acid: a doublehelical structure in the presence of potassium at low pH and found also with the cations ammonium, rubidium and caesium. J. Mol. Bioi. 117,113-115.
Shrader, R.E., Erway, L.C. & Hurley, L.S. (1973) Mucopolysaccharide synthesis in the developing inner ear of manganese-deficient and pallid mutant mice. Teratology 8,257-266.
Sikder, S.K. & Das, A. (1979) Isolation and characterization of glycosaminoglycans (mucopolysaccharides) from the skin of the fish Labeo rohita. Carbohydrate Res. 71' 273-285.
Silini, G., Pozzi, L.V. & Pons, S. (1967) Studies on the haemopoietic stem cells on mouse fetal liver. J. Embryo!. Exp. Morph. 17,303-318.
Simpson, D.L. & Davidson, E.A. (1972) Isolation of the peptide core of costal cartilage chondroitin 4-sulfate proteoglycan. Biochemistry 11, 1856-1861.
121
Singer, J.W., Samuels, A.J. & Adamson, J.W. (1976) Steroids and hematopoiesis. l. The effect of steroids on in vitro erythroid colony growth: structure/activity relationships, J. Cell Physic!. 88, 127-134.
Singh, J. DiFerrante, N., Gyorkey, F. & Wilson, N. (1977) Plasma glycosaminoglycans in normal individuals of various age. Atherosclerosis 28, 319-324.
Sirek, O.V., Sirek, A. & Fikar, K. (1977) The effect of sexhormones on glycosaminoglycan content of canine aorta and coronary arteries. Atherosclerosis 27, 227-233.
Sirek, O.V .. Sirek, A. & Cukerman, E. (1978) Effect of hormones on the glycosaminoglycan content of canine renal arteries. Blood Vessels 15,259-265.
Sirek, O.V., Cukerman, E. & Sirek, A. (1978) The relationship-of hormones to arterial gtycosaminoglycans and artheroscterosis. Med. Hypotheses 4, 531-539.
Stater, T.F. & Lovett, D. (1961) Increased serum diphenylamine reaction in patients with leukemia. Experientia 17, 272-274,
Stavkin, H.C., Bringas, P ., Cameron, J., LeBarrow, R. & Bavetta, L.A. (1969) Epithelial and mesenchymal cell interactions with extracellular matrix material in vitro. J. Embryo I. Exp, Morph. 22, 395405.
Sobel, H., Lee, K.D. & Hewlett, M.J. (1965) Effect of estrogen on acid glycosaminoglycans in skin of mice. Biochem. Biophys, Acta 101,225-229.
Stacey, M. & Barker, S.A. (1962) Carbohydrates of living tissues. Van Nostrand, London.
Stanley, E.R., Bradley, T.R. & Summer, M.A. (1971) Properties of the mouse embryo conditioned medium factor(s) stimulating colony formation by mouse bone marrow cells grown in vitro. J. Cett Physiol. 78,301-317.
Stanley, E.R., Hansen, G., Woodcock, J. & Metcalf, D. (1975) Colony stimulating factor and the regulation of granulopoiesis and macrophage production. Fed. Proc. 34,2272-2278, -
Stanley, E.R. & Heard, P.M. (1977) Factors regulating macrophage production and growth. Purification and some properties of the colony stimulating factor from medium conditioned by mouse L cells. J. Bioi. Chem. 252,43054312,
Stanley, E.R., Robinson, W.A. & Ada, G.L. (1968) Properties of the colony stimulating factor in leukemic and normal mouse serum. Aust. J. Exp. Bioi. Med. Sci. 46,715-726,
Stein, G.S., Roberts, R.M., Davis, J.L., Head, W.J., Stein, J.L., Thrall, C.L., van Veen, J, & Welch, D.W. (1975) Are glycoprote'1ns and glycosaminogtycans components of the eukaryotic genome? Nature 258,639-641.
Stern, E.L. (1968) The linkage of dermatan sulphate (OS) to protein. Fed. Proc. 27, 596,
Stern, I.J., Cosmas, F. & Smith, L. (1968) Urinary polyuronide excretion in man after enzymic dissolution of the condromucoprote'1n of the 'mtervertebral d'1sc or surgical stress. Clin. Chim. Acta 21, 181-190,
Stivala, S.S., Herbst, M., Kratky, 0. & Pilz, I. (1968) I. Physiochemical studies of fractionated bovine heparin. V. Some low-angle X-ray scattering data. Arch Biochem. Biophys, 127, 795-802.
Stahlman, F. Jr. (1970) Kinetics of erythropoies·,s. In: Regulation of hematopoiesis. I. Ed. Gordon, A.S. Appleton-Century-Crofts Educations! Division, Meredith Corporation. New York, pp. 317-321,
Stahlman, F. Jr., Rath, C.E. & Rose, J.C. (1954) Evidence for a humoral regulation of erythropoiesis. Studies on a patient with polycythaemia secondary to regional hypoxia. Blood 9, 721-733.
Stone, A.L. (1967) Amide cotton effects of heparin. Nature (London) 216,551-553.
122
Stone, A.L. (1969a) Conformations of hexose polysaccharide in solution. In: Siologi~ cal macromolecules Eds. Timasheff, S.N. & Fasman, G.D. Vol. 2, Marcel Dekker, New York, pp. 353-415.
Stone, A.L. (1969b) Optical rotatory dispersion of mucopolysaccharides and muco· polysaccharide-dye complexes. II. Ultraviolet cotton effects in the amide transition bands. 8"1opolymers 7, 173-188.
Stone, A.L. (1970) Asymmetric modes of metachromatic binding of dyes to glycosaminoglycans and the influence of polymer conformation on the induced cotton effects in vitro. In: Chemistry and molecular biology of the intercellular matrix Ed. Balazs, E.A. Vol. 2, Academic Press London, pp. 1067-1094.
Stoolmiller, A.C. & Dorfman, A. (1969) The metabolism of glycosaminoglycans in: Comprehensive Biochemistry. Vol. 17 Carbohydrate Metabolism. Eds. Florkin, M. & Stolz, E.H. Elsevier Amsterdam pp. 241-275.
Sudhakaran, P.R. & Kurup, P.A. (1974) Vitamin A and glycosaminoglycan metabolism in rats.J. Nutr.104,871-883.
Sutherland, D.J., Till, J.E. & McCulloch, E.A. (1970) A kinetic study of the genetic control of hemopoietic progenitor cells assayed in culture and in vivo. J. Cell Physiol. 75,267-274.
Svennerholm, L. (1956) The quantitative estimation of cerebrosides in nervous tissue. J. Neurochem. 1,42-53.
Svejcar, J. & Robertson, W. van B. (1967) Micro separation and determination of mammalian acidic glycosaminoglycans (mucopolysaccharides). Anal. Biochem. 18,333-350.
Swann, D.A·., Radin, E.L., Nazimiec, M., Weisser, P.A., Curran, N. & Lewinnek, G. (1974) Role of hyaluronic acid in joint lubrication. Ann. Rheum. Dis. 33, 318-326.
Sweet, M.B.E., Thenar, E.J.-M.A.L. & Immerman, A.R. (1976) Glycosaminoglycans and proteoglycans of human chondrosarcoma. Biochim. Biophys. Acta 437, 71-86.
Sylven, B. (1965) Amir.o sugar-containing compounds in tumors. In: The amino sugars, vel. II a. Distribution and biolo-gical role. Eds. Balazs, E.A. & Jeanloz, R.W. Academic Press, New York, pp. 195-204.
Takeuchi, J., Sobue, M., Sato, E., Shamoto, M., Miura, K. & Nakagaki, S. (1976) Variations in glycosaminoglycan components of breast tumors. Cancer Res. 36, 2133-2139.
Taniguchi, N. (1972) Preparative separation of urinary acidic glycosaminoglycans by agar gel electrophoreSis. Clin. Chim. Acta 42,221-224.
Tavassoli, M. (1977) Adaptation of marrow sinus wall to fluctuation in the rate of cell delivery: studies in rabbits after blood-letting. Brit. J. Haemat. 35, 25-32.
Tavassoli, M. & Crosby, W.H. (1968) Transplantation of marrow to extra medullary sites. Science 161, 54-56.
Tavassoli, M. & Weiss, L. (1971) The structure of developing bone marrow sinuses in extra medullary autotransplant of the marrow in rats. Anat. Rec. 171, 477494.
Tavassoli, M., Eastlund, T., Yam, L.T., Neiman, R.S. & Finkel, H. (1976) Gelatinous transformation of bone marrow in prolonged self-induced starvation. Scand. J. Haemat. 16,311-319.
Tavassoli, M., Aoki, M. & Shaklai, M. (1980) A novel stromal cell type in the rat marrow recognizable by its preferential uptake of lanthanum. Exp. Hemat. 8, 568-577.
Tener, W.M. (1967) Urinary excretion patterns of individual acid mucopolysaccharides. Nature (London) 213, 1132-1133.
123
Telser, A., Robinson, H.C. & Dorfman, A. (1969) In: The metabolism of glycosaminoglycans. In: Comprehensive Biochemistry Vol. 17. Carbohydrate Metabolism. Eds. Florkin, M. & Stotz, E.H. Elsevier Amsterdam, p. 269.
Tessler, R.H. & Salmon, W .D. Jr. (1975) Glucocorticoid inhibition of sulfate incorporation by cartilage of normal rats. Endocrinology 96, 898-902.
Testa, N.G. & Hendry, J.H. (1977) Radiation induced hemopoiesis in adult mouse liver. Exp.·Hemat. 5, 136-140.
Thomas, D.B. & Pasternak, C.A. (1969) Vitamin A and the biosynthesis of sulphated mucopolysaccharides. Experiments with rats and cultured neoplastic mast cells. Biochem.J.111,407-412.
Thorp, F.K. & Dorfman, A. (1967) Differentiation of connective tissue. In: Current topics in developmental biology Eds. Moscona, A.A. & Monroy, A. Vo1.2,Acade~ mic Press, New York, pp. 151-190.
Till, J.E., & McCulloch, E.A. (1961) A direct measurement of the radiation sensitivity of normal mouse bone marrow cells. Radiat. Res. 14,213-222.
Till, J.E., McCulloch, E.A. & Siminovitch, L. (1964) A stochastic model of stem cell proliferation based on the growth of spleen colony-forming cell. Proc. Natl. Acad. Sci. 51,29-36.
Toledo, O.M.S. & Dietrich, C.P. (1977) Tissue specific distribution of sulfated mucopolysaccharides in mammals. Biochim. Biophys. Acta 498,114-122.
Trentin, J.J. (1970) Influence of hematopoietic organ stroma {hematopoietic inductive microenvironments) on stem cell differentiation. In: Regulation of hematopoiesis, I. Ed. Gordon, A. Appleton..Century..Crofts Educational Division. Meredith Corp. New York,pp.161-186.
Trentin, J.J: (1971) Determination of bone marrow stem cell differentiation by stromal hemopoietic inductive microenvironments (HIM) Amer. J. Pathol. 65, 621-628.
Trentin, J.J. (1978) Hemopoietic microenvironments. Transplant, Proc. X, 77-82. Trentin, J.J., Curry, J.C., Wolf, N.S. & Cheng, V. (~967) Factors controlling stem cell
differentiation and proliferation: The hemopoietic inductive microenvironment (HIM). In: The proliferation and spread of neoplastic cells. M.D. Anderson Hospital. 21st Annual Symposium on fundamental cancer research. Baltimore, Williams and Wilkins, p. 713.
Tsiganos,. C.P. & Muir, H. (1969) Studies on proteinpolysaccharides from pig laryngealcartilage heterogeneity, fractionation and characterization. Biochem. J. 113, 885-894.
Tsiganos, C.P., Hardingham, T.E. & Muir, H. (1971) Proteoglycans of cartilage: An assessment of their structure. Biochim. Biophys. Acta 229,529-534.
Urabe, A., Sassa, S. & Kappas, A. (1979) The influence of steroid hormone metabolites on the in vitro development of erythroid colonies derived from human bone marrow. J. Exp. Med. 149, 1314-1325.
Usui, Y., Kanke, Y. & Mori, Y. (1977) Effects of gonadal hormones on hyaluronic acid content in male mouse skin. Endocrine!. Japon. 24,399402.
Van Bekkum, D.W. (1975) The biological activity of thymic hormones. Kooyker Scientific Publications Rotterdam.
Van den Engh, G. (1974) Standardization of the activity of CSF containing material. Proposals for a common standardization procedure within the EORTC stem cell club. The Radiobiological Institute, Rijswijk.
124
Van den Engh, G.J. (1974) Standardization of preparations with colony stimulating activity. Leukemia and aplastic anemia. Proc. Int. Confer. ed. II Pensiero Scien~ tifico. Roma, pp. 299-308.
Van Ewijk, W. (1977) Microenvironments of T and B lymphocytes. A light- and electronmicroscopic study. Thesis, Erasmus University Rotterdam.
Van Oijke, D. (1967) Similarity in distribution of skeletal blood flow and erythropoieflc marrow. Clin. Orthop. 52, 37-51.
Van Dijke, D. (1967) Similarity in distribution of skeletal blood flow and erythropoietic marrow. UCRL 17481 US AEC Univ Calif. Radiat. Lab. {Berkeley) 70-85.
Van o'ijke, D.C., Contopoulos, A.N., Williams, B.S., Simpson, M.E., Lawrence, J.H. & Evans, H.M. (1954) Hormonal factors influencing erythropoiesis. Acta Haemat. 11, 203-222.
Van Hoof, F. (1973) Mucopolysaccharidoses. In: Lysosomes and storage diseases Eds. Hers, H.G. & van Hoof, F. Academic Press New York, pp. 217-259.
Van Hoof, F. (1974) Mucopolysaccharidoses and mucolipidoses. In: Molecular variants in disease ed. Raine, D.N. British Medical Association London pp. 64-93.
Vannucchi, S., Fibbi, G., Cella, C., Rosso M. del, Cappelletti, R. & Chiarugi, V.P. (1980) Cell surface glycosaminoglycans in normal and leukemic leukocytes. Cell D'lfferentiation 9, 71-81.
Vogel, H., Niewisch, H. & Matioli, G. (1968) The self renewal probability of hemopoietic stem cells. J. Cell. Physiol. 72,221-228.
Vogel, H., Niewisch, H. & Matoli, G. (1969) Stochastic development of stem cells. J. Theor. Bioi. 22,249-270.
Vogler, W.R. & Winton, E.F. (1975) Humoral granulopoietic inhibitors: A review. Exp. Hemat. 3, 337-353.
Vas, 0., Buurman, W.A. & Ploemacher, R.E. (1972) Mobilization of haemopoietic stem cells (CFU) into the peripheral blood of the mouse: effects of endotox·m and other compounds. Cell Tissue Kinet. 5, 467479.
Wagemaker, G. (1978) Cellular and soluble factors influenc·mg the differentiation of primitive erythroid progenitor cells (BFU-El in vitro. In: In vitro aspects of erythropoiesis Ed. Murphey, M.J. Jr. Springer Verlag New York, pp. 44-57.
Wagemaker, G. & Visser, T.P. (1980) Erythropoietin independent regeneration of erythroid progenitor cells following multiple injections of hydroxyurea. Cell Tissue Kinet. 13,505-517.
Walton, K.W. & Ricketts, C.R. (1954) Investigation of the histochemical basis of metachromasia. Brit. J. Exp. Pathol. 35,227-240.
Ward, J.V. & Packman, M.A. {1979) Characterization of the sulfated glycosaminoglycan on the surface and in the storage granules of rabbit platelets. Biochim. Biophys Acta 583, 196-207.
Warren, G.H. & Fagan, R. (1960) Accumulation of dermal mucopolysaccharides in animals following injection of estradiol benzoate. Proc. Soc. Exp. Bioi. Med. 103,786-789.
Webber, R.H., DeFelice, R., Ferguson, R.J. & Powell, J.P. (1970) Bone marrow response to stimulation of the sympathetic trunks in rats. Acta Anat. Basel 77, 92-97.
Weiss, L. & Chen, L.T. (1975) The organization of hematopoietic cords and vascular sinuses in bone marrow. Blood Cells 1, 617..S38.
Werts, E.D., JOhnson, M.J. & DeGowin, R.L. (1977) Postirradiation hemopoietic repopulation and stromal cell viability. Radiation Res. 71,214-224.
125
Werts, E.D., DeGowin, R.L., Knapp, S.K. & Gibson, D.P. {1980) Characterization of marrow stromal {fibroblastoid) cells and their association with erythropoiesis. Exp. Hemat. 8, 423-433.
Wharton, T. (1656) Adenographia: Sive Glaudularum Totius Corpores Descripto. Landini 1656. (British Museum, E.1579).
Whitehouse, M.W. & Lash, J.W. (1961) Effect of cortisone and related compounds on the biogenesis of cartilage. Nature 189, 37..38.
Whitehouse, M.W. & BostrOm, H. (1_962) The effect of some anti inflammatory (anti~ rheumatic) drugs on the metabolism of connective tissues. Biochem. Pharmacal. 11,1175-1201.
Whiteman, P. (1973) The quantitative measurement of alcian blue-glycosaminoglycan complexes. Biochem. J. 131,343-350.
Wilson, F.D. & O'Grady, L. (1976) Some observations of the hematopoietic status in vivo and in vitro on mice of genotype S!/Std, Blood 48, 601..608.
Winand, R.J. (1967) Increased urinary excretion of acidic mucopo!ysaccharides in exophtalmos. J. C!in. Invest. 47,2563-2568.
Winter, W.T., Arnot, S., Isaac, D.H. & Atkins, E.D.T. (1978) Chondroitin 4-sulfate: the structure of a sulfated glycosaminoglycans. J. Mol. Bioi. 125, 1-19.
Winterburn, P.J. & Phelps, C.F. {1972) The significance of glycosylated proteins. Nature (London) 236,147-151.
Wolf, N.S. (1974) Dissecting the hematopoietic microenvironment. I. Stem cell lodgment and commitment, and the proliferation and differentiation of erythropoietic descendants in the SI/Sid mouse. Cell Tissue Kinet. 7, 89-98.
Wolf, N.S. (1978a) Dissecting the hematopoietic microenvironment. II. The kinetics of the erythron of the SI/SJd mot~se and the dual flature of its anemia. Cell Tissue Kinet. 11, 325-334.
Wolf, N .S. ( 1978b) Dissecting the hematopoietic microenvironment. Ill. Evidence for a positive short range stimulus for cellular proliferation. Cell Tissue Kinet. 11, 335-345.
Wolf, N.S. & Trentin,J.J. (1968) Hemopoietic colony'studies. V. Effect of hemopoietic organ stroma on differentiation of pluripotent stem cells. J. Exp. Med. 127, 205·· 214.
Wolfrom, M.L., Weisbalt, 0.1., Karabinos, J.V ., McNeely, W.H. & McLean, J. (1943) Chemical studies on crystalline barium acid heparinate. J. Amer. Chern. Soc. 65, 2077-2085.
Woodward, C.B., Hranisavljevic, J. & Davidson, E.A. (1972) Physical properties of cartilage proteoglycans. Biochemistry 11, 1168-1176.
Wortman, B. {1964) Variability of keratan sulfate isolated from beef cornea. Biochim. Biophys. Acta 83,288-295.
Wright, E.G. & Lord, 8.1. (1979) Production of stem cell proliferation regulators by fractionated haemopoietic cell suspensions. Leuk. Res. 3,15-22.
Wright, E.G., Lord, 8.1., Dexter, T.M. & Lajtha, L.G. {1979) Mechanisms of haemopoietic stem cell proliferation control. Blood Cells 5, 247-258.
Wright, E.G., Sheridan, P. & Moore, M.A.S. (19$0) An inhibitor of murine stem cell proliferation produced by normal human bone marrow. Leuk. Res. 4, 309-319.
Wu, A.M., Till, J.E., Siminovitch, L. & McCulloch, E.A. (1967) A cytological study of the capacity for differentiation of normal haemopoietic colony forming cells. J. Cell Physiol. 69,177-184.

126
Yamamoto, K. & Terayama, H. (1973) Comparison of cell coat acid mucopolysac~ charides of normal liver and various ascites hepatoma cells. Cancer Res. 33, 2257* 2264.
Yamashina, I. (1954) Note on iS-heparin. Acta Chern. Scand. 8,1316-1318. Varon, M. & Castor, C.W. (1969) Leukocyte-connective tissue cell interaction. 1.
Stimulation of hyaluronate synthesis by live and dead leukocytes. Arthritis. Rheum. 12, 365-373.
Yatziv, S .. Erickson, R.P., Sandman, R. & Robertson, W. {1978) Glycosaminoglycan accumulation with partial deficiency of (3 glucuronidase in the C3H strain of mice. Biochem. Genet. 16,1079-1084.
Zanjani, E.D. & Banisadre, M. (1979) Hormonal stimulation of erythropoietin product-Ion and erythropoiesis in anephric sheep fetuses. J. Clin. Invest. 64, 1181-1187.

127
NAWOORD
Bij deze gelegenheid wil ik gaarne eenieder die heeft bijgedragen aan het tot stand komen van dit proefschrift dank zeggen. Mijn promotor Prof. Dr. 0. Vas, ben ik zeer erkentelijk voor zijn interesse in mijn onderzoek en zijn hulp bij het schrijven van de publicaties en het proef· schrift. lk ben hem dankbaar voor het vertrouwen dat hij in mij stelde ten aanzien van het onderzoek dat soms ver buiten de grenzen van de gangbare haematologie research ging. Prof. Dr. H.J. van der Molen en Prof. Dr. O.W. van Bekkum ben ik erkente· lijk voor de wijze waarop zij als co·reterenten dit proefschrift hebben will en beoordelen. Prof. Dr. W.A. de Voogd van der Straaten ben ik zeer dankbaar voor de interesse getoond in mijn werk; voor zijn waardevolle suggesties en voor het kritisch doorlezen van mijn publicaties. Voor de begeleiding in mijn werk, het inwerken in zowel de theoretische als practische aspecten van de haematologie, en de hulp bij het schrijven van een aantal publicaties en dit proefschrift ben ik Rob Ploemacher vee! dank verschuldigd. I am very grateful to Dr. K.G.M. Brockbank for correcting the English writing in this thesis. Ina Wilschut wil ik bedanken voor haar collegialiteit, haar interesse in mijn werk, en voor het feit dat zij mij in eerste instantie op het laboratorium heeft geintroduceerd. De hulp van Mieke Erkens~Versluis is voor mij van onschatbare waarde ge~ weest. Beste Mieke, voor je betrokkenheid bij mijn experimenten, het door~ zettingsvermogen getoond tijdens de perioden dat de kweek maar niet wilde lukken, en tijdens het eindeloze batten uitspuiten, en voor de verdraag~ zaamheid tijdens mijn veelvuldige plagerijen ben ik je heel dankbaar. Voor hun bijdrage in het "in vitro" kweken dank ik Marcel Paques, Eveline van 't Hull van de afdeling Experimentele Pathologie van de Erasmus Univer~ siteit, en Gerard Wagemaker van het Radiobiologisch lnstituut TNO te Rijswijk. Ger Erkens dank ik voor zijn werk met de computer wat hem ettelijke vrije uurtjes kostte en mij stapels computerpapier opleverde. In Job Mink en Emile Wolters wil ik de coli ega's binnen de groep Celbiolo~ gie II bedanken die mij daadwerkelijk of anderszins hebben geholpen. De fijne sfeer binnen de groep belast met het 2e jaars onderwijs microsco~ pische anatomie wil ik hier niet onvermeld Iaten.
128
De grate aantallen proefdieren welke helaas onontbeerlijk waren voor dit onderzoek zijn altijd optimaal verzorgd. Hiervoor ben ik Joop Bos, Cornelia Frankcen, Marianne Briegoos*Masson en Ferry Siefert zeer dankbaar. Piet Hartwijk en Pim Visser dank ik voor het uitstekende tekenwerk van grafieken en figuren en de heer J. Fengler en Tarry van Os voor het vakbekwaam en razendsnel fotografisch vastleggen van dit tekenwerk. Rein Smid ben ik erkentelijk voor zijn hulp bij het plaatsen van bestellingen van materiaal en mevrouw Godijn en Jopie Bolman voor de hectoliters thee en koffie. Cary Clerkx-Meiierink dank ik voor het voortreffelijke ~pewerk dat zij verzorgde voor publicaties en dit proefschrift. Mijn ouders ben ik zeer dankbaar voor de studiemogelijkheden die zij mij gegeven hebben. Lieve Astrid, het jou naast mij weten, tot zelfs tijdens de promotie, is mij een ongelooflijke steun waarvoor ik je niet genoeg kan bedanken.
129
CURRICULUM VITAE
Na behalen van het B~diploma aan de Rijks Hogere Burgerschool te Woerden in 1967 heeft de schrijver gedurende 2 jaar medicijnen gestudeerd aan de Vrije Universiteit te Amsterdam. Van september 1969 tot juni 1971 is hij vooreerst als aspirant analist en laterals leerling analist werkzaam geweest op het Zoologisch Laboratorium van de Rijks Universiteit te Utrecht. In 1970 werd het leerling analist examen afgelegd in de zoologische en medi· sche richting aan de analistenscholen te Amersfoort en Utrecht, en in 1971 het examen voor histologisch analist in de zoologische richting aan de analistenschool te Utrecht. In 1970 werd aangevangen met de avondstudie Biologie (bijzondere M.O. opleiding) welke na een jaar werd voortgezet als dagstudie algemene Biologie, en na 1972 als bijzondere richting 85' (Biologie met als hoofdvak Medicij~ nen). Het kandidaatsexamen werd afgelegd in juli 1974. De doctoraalstudie met de hoofdrichting celbiologie omvatte de onderwerpen Histologie (bij Dr. J.H.B. Diederen), Biochemie (bij Dr. M.G.M. Balemans). lmmunologie (bij Or. H. van Dijk) en electronenmicroscopie (bij Prof. Dr. W.A. de Voogd van der Straaten en Drs. C.J.A.H.V. Vorstenbosch). Het doctoraalexamen werd in maart 1977 afgelegd. Van november 1971 tot augustus 1973 was hij part-time leraar zoologie aan de analisten dagschool te Utrecht, en van augustus 1972 tot augustus 1977 part-time leraar Histologie aan de analistenavondschool te Utrecht. Tevens was hij part~time leraar medische Histologie aan de analistenschool te Amersfoort van september 1972 tot augustus 1973. Onderwijs aan de Rijks Universiteit te Utrecht werd gegeven in de vorm van assistentschappen in de Histologie (april en mel 1975; april en mei 1976) en in de lmmunologie (november en december 1975; maart, 1976). Sinds april 1977 is de promovendus werkzaam binnen de vakgroep Celbiolo· gie en Genetica van de Erasmus Universiteit te Rotterdam. Binnen deze vakgroep werd onder Ieiding van Prof. Dr. 0. Vos het onderzoek verricht dat in dit proefschrift is beschreven.

Ontwerp omslag: J. Fengler