170 Arun Kumar
6
Proceedings of the 2010 International Conference on Industrial Engineering and Operations Management Dhaka, Bangladesh, January 9-10, 2010 Models for Bed Occupancy Management of a Hospital in Singapore Arun Kumar, and John Mo School of Aerospace, Mechanical & Manufacturing Engineering RMIT University, Melbourne, Victoria 3000, Australia Abstract This paper describes three bed prediction models in aiding hospital planners to anticipate bed demand so as to manage resources efficiently. The Poisson bed occupancy model provides an estimation of bed occupancy and optimal bed requirements in each class based on length of stay and admissions data. The simulation model was developed to predict bed occupancy levels for every class for the following week utilizing historical previous year’s same week admissions data. Regression equations were formulated based on relationship between identified variables to aid bed managers to predict the weekly average number of occupied beds. Keywords Prediction, bed occupancy, simulation, regression, Poisson model 1. Introduction The ability to anticipate the future demand of services would enable an organization to be able to plan effectively. For the past few decades, healthcare providers worldwide have thus been under tremendous pressures and obtaining demerit for failing to plan effectively. Over-crowding is perhaps the most common scene that people see in the Emergency department of a Hospital. The random arrival pattern of patients may somehow mislead healthcare planners, and thus causing them to underestimate the resources that are required within the hospital. Misinterpretation of patients’ arrival patterns is the reason for poor bed management. Hence the ability to forecast the random arrival patterns would definitely be the key solution to over-crowding problems . Many have seen over-crowding particularly in emergency departments to be an intensifying nemesis. All the local public hospitals in Singapore have been constantly facing problems such as bed shortages during peak period of the year. Due to a rise in elderly pneumonia patients, some of the hospitals were being forced to redirect non-critical cases to public hospitals nearby. Additionally, the A&E department of some of the hospitals had been forced to deny access to ambulances during certain hours of the day [1]. This deficiency in the healthcare sector has drawn public awareness. There are rising concerns of over occupancy in various local hospitals such as Changi Hospital, Singapore General Hospital and Tan Seng Hospital. In 2007, when untimely flu season hit the region, various hospitals reached their peak occupancy. The over occupancy problem was so serious that there was not even a single bed available in any class. Bed shortages or inadequacy had an effect on the following: 1. Long wai ting time for i ncoming patients at Emergency Department (ED). 2. Patients from Tan Seng Hospital (TSH) to transfer to another hospital when there was overflow by 85-90%. 3. Cross-discipline allocation was the process whereby a particular discipline had no unoccupied bed; hence, the patient rightfully admitted into a particular discipline was channelled to another discipline. This method of cross allocating had the disadvantage of untrained staff for that discipline. 4. Up-lodging was the last resort, when the beds in other discipline were fully occupied. This solution however posed financial deficits for the hospital. Incoming patients from ED wards that had opted for Class C were channelled to a higher Class (A, B1 or B2), when the waiting time exceeded 2 hours, and with no available beds in other discipline. 5. Public lost confidence in the ability of the hospital in aspect of bed management. Thus, effective planning and management of supply and demand for hospital beds is fundamental for hospitals to deliver high medical standard commitments, including reducing the bed wait time. The objective of this research is
-
Upload
riyazkhan-mp -
Category
Documents
-
view
229 -
download
0
Transcript of 170 Arun Kumar
8/3/2019 170 Arun Kumar
http://slidepdf.com/reader/full/170-arun-kumar 1/6
Proceedings of the 2010 International Conference on Industrial Engineering and Operations Management
Dhaka, Bangladesh, January 9-10, 2010
Models for Bed Occupancy Management of a Hospital in Singapore
Arun Kumar, and John Mo
School of Aerospace, Mechanical & Manufacturing Engineering
RMIT University, Melbourne, Victoria 3000, Australia
Abstract
This paper describes three bed prediction models in aiding hospital planners to anticipate bed demand so as to
manage resources efficiently. The Poisson bed occupancy model provides an estimation of bed occupancy and
optimal bed requirements in each class based on length of stay and admissions data. The simulation model was
developed to predict bed occupancy levels for every class for the following week utilizing historical previous year’ssame week admissions data. Regression equations were formulated based on relationship between identified
variables to aid bed managers to predict the weekly average number of occupied beds.
KeywordsPrediction, bed occupancy, simulation, regression, Poisson model
1. IntroductionThe ability to anticipate the future demand of services would enable an organization to be able to plan effectively.
For the past few decades, healthcare providers worldwide have thus been under tremendous pressures and obtainingdemerit for failing to plan effectively. Over-crowding is perhaps the most common scene that people see in the
Emergency department of a Hospital. The random arrival pattern of patients may somehow mislead healthcare
planners, and thus causing them to underestimate the resources that are required within the hospital.Misinterpretation of patients’ arrival patterns is the reason for poor bed management. Hence the ability to forecast
the random arrival patterns would definitely be the key solution to over-crowding problems.
Many have seen over-crowding particularly in emergency departments to be an intensifying nemesis. All the local
public hospitals in Singapore have been constantly facing problems such as bed shortages during peak period of the
year. Due to a rise in elderly pneumonia patients, some of the hospitals were being forced to redirect non-critical
cases to public hospitals nearby. Additionally, the A&E department of some of the hospitals had been forced to denyaccess to ambulances during certain hours of the day [1]. This deficiency in the healthcare sector has drawn publicawareness.
There are rising concerns of over occupancy in various local hospitals such as Changi Hospital, Singapore GeneralHospital and Tan Seng Hospital. In 2007, when untimely flu season hit the region, various hospitals reached their
peak occupancy. The over occupancy problem was so serious that there was not even a single bed available in any
class.
Bed shortages or inadequacy had an effect on the following:
1. Long waiting time for incoming patients at Emergency Department (ED).
2. Patients from Tan Seng Hospital (TSH) to transfer to another hospital when there was overflow by 85-90%.
3. Cross-discipline allocation was the process whereby a particular discipline had no unoccupied bed; hence, the
patient rightfully admitted into a particular discipline was channelled to another discipline. This method of crossallocating had the disadvantage of untrained staff for that discipline.
4. Up-lodging was the last resort, when the beds in other discipline were fully occupied. This solution however
posed financial deficits for the hospital. Incoming patients from ED wards that had opted for Class C werechannelled to a higher Class (A, B1 or B2), when the waiting time exceeded 2 hours, and with no available beds in
other discipline.
5. Public lost confidence in the ability of the hospital in aspect of bed management.Thus, effective planning and management of supply and demand for hospital beds is fundamental for hospitals to
deliver high medical standard commitments, including reducing the bed wait time. The objective of this research is
8/3/2019 170 Arun Kumar
http://slidepdf.com/reader/full/170-arun-kumar 2/6
Kumar and Mo
to compare the bed forecasts obtained from various mathematical models and recommend the efficient forecast thatenable hospital administrators to plan their resources within the hospital.
2. Literature ReviewHigh levels of inpatient bed occupancy have been used as a tactic to achieve the goals of high service levels while
containing costs. Bagust et al [2] used simulation to examine factors affecting hospitals daily bed requirements. Over
the years, healthcare researchers have developed several models to forecast bed occupancy. Farmer et al [3] usedAutoregressive Inductive Moving Average (ARIMA) modelling to predict the number of surgical beds required at aUK hospital. Further, McManus describes the use of Queuing Theory to predict monthly responsiveness to
changing bed demand [4]. This led to development of alternative models [5, 7] that are able to predict daily bedoccupancy. Using ARIMA modelling, Jones and Joy [5] found that the daily number of occupied beds due to
emergency admissions is related to both air temperature and influenza illness rate. It was found that a period of high
volatility, indicated by GARCH errors, would result in an increase in waiting time in the A&E department.
Harrison et al [8] developed compartment models to analyse the flow of patients through notional time related
compartments. Their model accurately describes length of stay distributions and assumed a stable system.Subsequently, Mackay and Lee [6] improved on Harrison et al’s modelling approach by analysing appropriateness of
the level of model complexity and the ability to use the compartment model for generalization and forecasting. One
major limitation of the compartment models is that the model produces single numbers rather than range of valuesand is deterministic in nature [9].
Harrison and Mackay [7] modelled daily bed occupancy variability using stochastic simulation, which overcomesthe limitations. They found that a flexible bed allocation scheme resulted in fewer overflows with the same level of
occupancy compared to a fixed bed allocation. Their model also proves that variable discharge rates are more
significant than variable admission rates in contributing to overflows. Numerous investigators have also used
regression models to analyse needed bed capacity. Stratman and Spellman [9] studied the impact of demographic,
socioeconomic and Certificate of Need (CON) regulation variables on the supply of hospital beds across the USA.Fullerton and Crawford [10] adopted linear logistic regression to study the variables that caused an increase in bed
occupancy by defining each of these effects independent of the others. They concluded that demand for beds in
specialties that experience seasonal fluctuations is predictable.
A common statistical assumption in modelling count data is that it follows a Poisson distribution. Dexter and
Macario [11] assumed that the number of patients staying in the OB unit is Poisson distributed. Coincidently, this
assumption is validated by various clinical studies [12, 13]. Discussions with hospital personnel indicate thatforecasting bed occupancy rather than admissions is more important to them as this reflects more directly to system
capacity. There has been a lack of available literature that forecasts weekly bed occupancy levels. In this study,
regression, Poisson and simulation models have been adopted to predict bed occupancy on a weekly basis.
Simulation models have been chosen in preference to other models because it allows questions regarding bed
allocation, occupancy and emptiness to be answered. Furthermore, a Poisson bed prediction model allows hospitaladministrators to predict optimal bed numbers with certain tolerance of over occupancy from admissions and length
of stay data.
3. Overview of Bed ManagementA study was conducted at the Bed Management Unit (BMU) of TSH hospital in Singapore to predict the bed
occupancy. Bed assignment to individual patients is done by the staff/ operators in BMU. An average of 150 beds
are planned for admission every day with 120 beds allocated to emergency admissions and 15 beds each allocated to
specialist outpatient clinics and elective admissions. The staff in the BMU would have to match the patient’s profilewith the following 3 characteristics before assigning beds: gender, type of patient’s Medical Discipline, and class of
ward. All emergency patients are triaged upon arrival to assess the severity of the medical conditions so that medicalcare can be suitably prioritized. This is largely done by experienced senior nurses.
The data were collected for the period June 1, 2006 to June 1, 2007. During this period, overall average bed
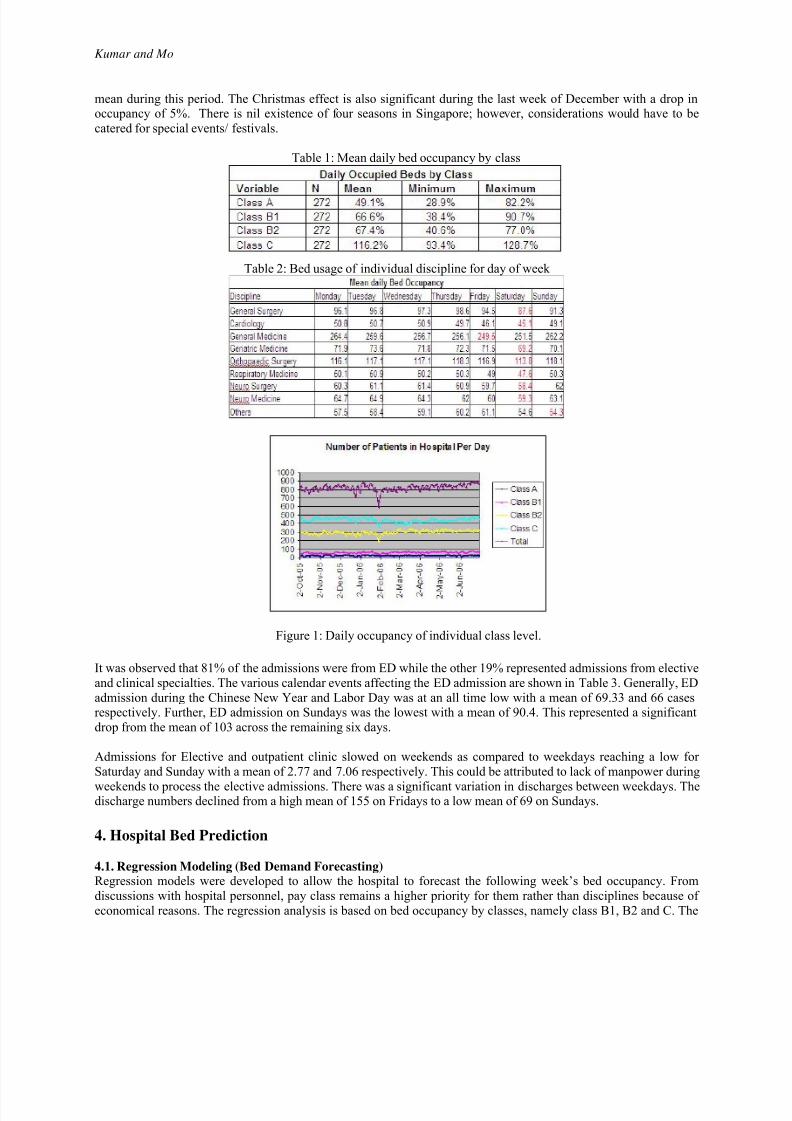
occupancy in the hospital was 86%. A breakdown of bed usage by class and discipline is given in Tables 1 and 2.
The bed occupancy for class C is over capacity and is due to the high demand for class C ward. As a result, patientsare up-lodged to class B2 while paying class C rates. From Figure 1, it can be seen that there is a very strong Chinese
New Year effect stretching from new year eve to 8th day of new year with a drop of 14% in occupancy from the
8/3/2019 170 Arun Kumar
http://slidepdf.com/reader/full/170-arun-kumar 3/6
Kumar and Mo
mean during this period. The Christmas effect is also significant during the last week of December with a drop inoccupancy of 5%. There is nil existence of four seasons in Singapore; however, considerations would have to be
catered for special events/ festivals.
Table 1: Mean daily bed occupancy by class
Table 2: Bed usage of individual discipline for day of week
Figure 1: Daily occupancy of individual class level.
It was observed that 81% of the admissions were from ED while the other 19% represented admissions from elective
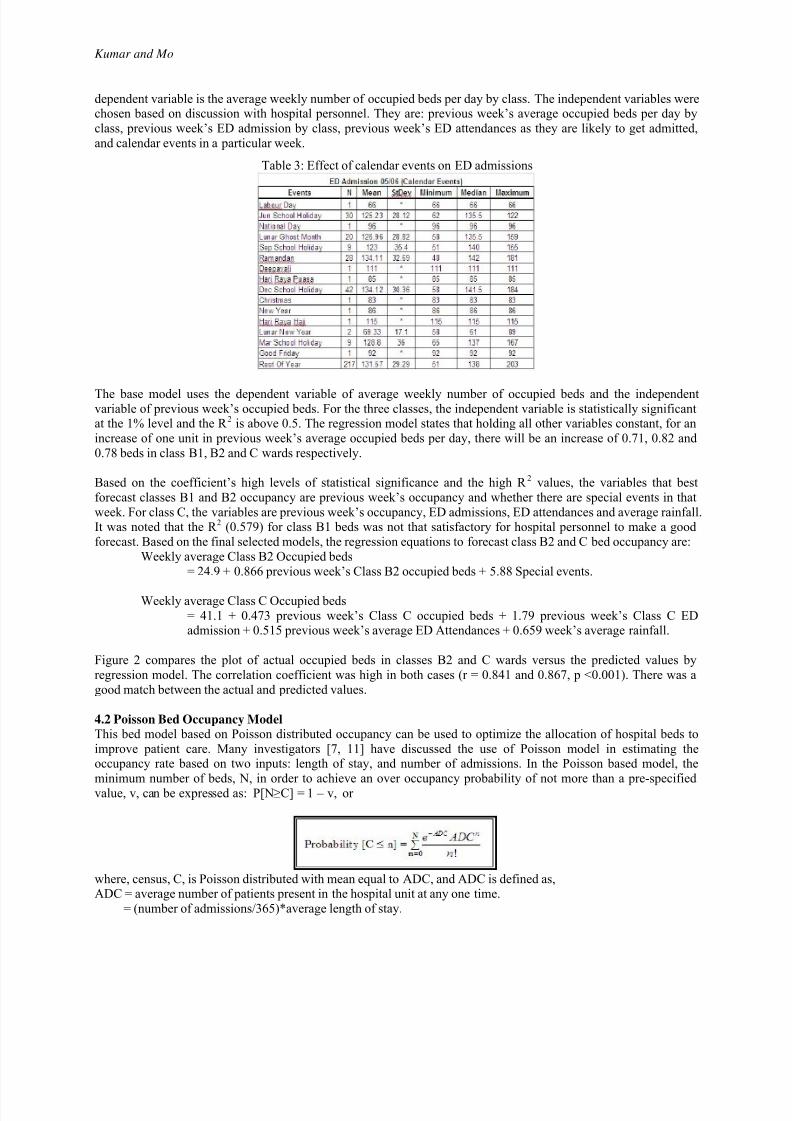
and clinical specialties. The various calendar events affecting the ED admission are shown in Table 3. Generally, ED
admission during the Chinese New Year and Labor Day was at an all time low with a mean of 69.33 and 66 casesrespectively. Further, ED admission on Sundays was the lowest with a mean of 90.4. This represented a significant
drop from the mean of 103 across the remaining six days.
Admissions for Elective and outpatient clinic slowed on weekends as compared to weekdays reaching a low for
Saturday and Sunday with a mean of 2.77 and 7.06 respectively. This could be attributed to lack of manpower during
weekends to process the elective admissions. There was a significant variation in discharges between weekdays. Thedischarge numbers declined from a high mean of 155 on Fridays to a low mean of 69 on Sundays.
4. Hospital Bed Prediction
4.1. Regression Modeling (Bed Demand Forecasting)Regression models were developed to allow the hospital to forecast the following week’s bed occupancy. From
discussions with hospital personnel, pay class remains a higher priority for them rather than disciplines because of
economical reasons. The regression analysis is based on bed occupancy by classes, namely class B1, B2 and C. The
8/3/2019 170 Arun Kumar
http://slidepdf.com/reader/full/170-arun-kumar 4/6
Kumar and Mo
dependent variable is the average weekly number of occupied beds per day by class. The independent variables werechosen based on discussion with hospital personnel. They are: previous week’s average occupied beds per day by
class, previous week’s ED admission by class, previous week’s ED attendances as they are likely to get admitted,
and calendar events in a particular week.
Table 3: Effect of calendar events on ED admissions
The base model uses the dependent variable of average weekly number of occupied beds and the independentvariable of previous week’s occupied beds. For the three classes, the independent variable is statistically significantat the 1% level and the R 2 is above 0.5. The regression model states that holding all other variables constant, for an
increase of one unit in previous week’s average occupied beds per day, there will be an increase of 0.71, 0.82 and
0.78 beds in class B1, B2 and C wards respectively.
Based on the coefficient’s high levels of statistical significance and the high R 2 values, the variables that best
forecast classes B1 and B2 occupancy are previous week’s occupancy and whether there are special events in that
week. For class C, the variables are previous week’s occupancy, ED admissions, ED attendances and average rainfall.It was noted that the R 2 (0.579) for class B1 beds was not that satisfactory for hospital personnel to make a good
forecast. Based on the final selected models, the regression equations to forecast class B2 and C bed occupancy are:
Weekly average Class B2 Occupied beds
= 24.9 + 0.866 previous week’s Class B2 occupied beds + 5.88 Special events.
Weekly average Class C Occupied beds
= 41.1 + 0.473 previous week’s Class C occupied beds + 1.79 previous week’s Class C EDadmission + 0.515 previous week’s average ED Attendances + 0.659 week’s average rainfall.
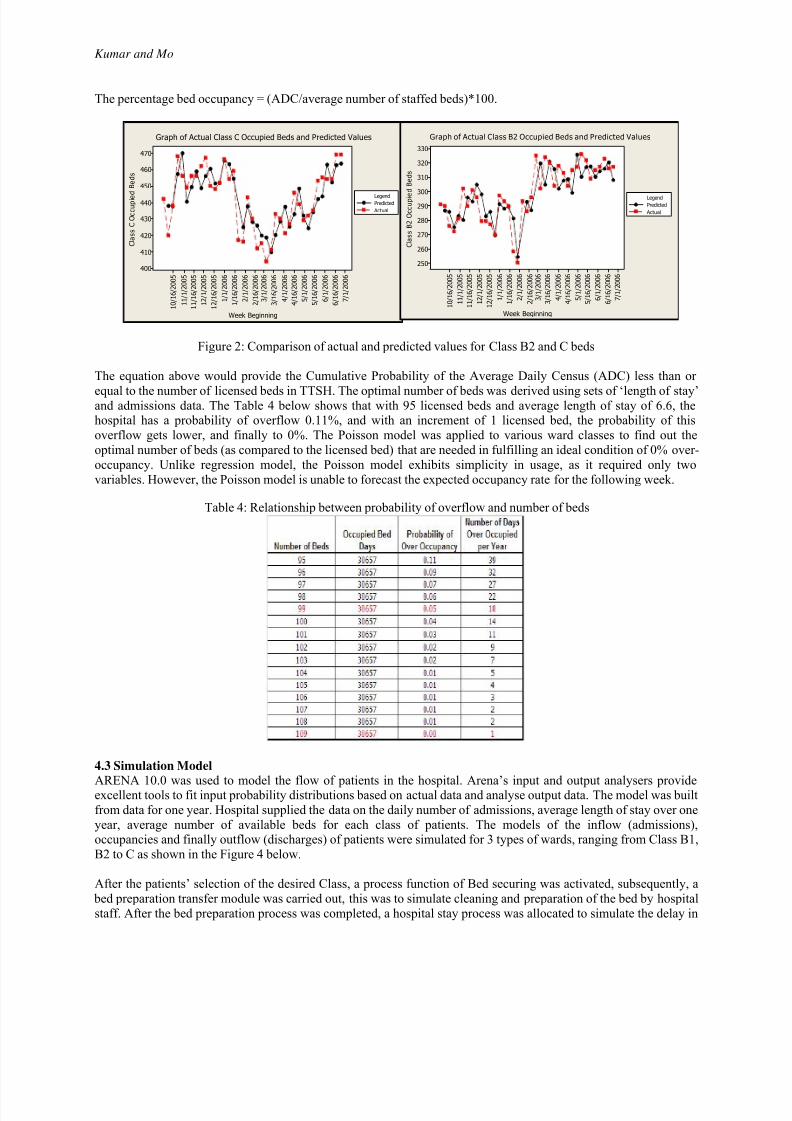
Figure 2 compares the plot of actual occupied beds in classes B2 and C wards versus the predicted values by
regression model. The correlation coefficient was high in both cases (r = 0.841 and 0.867, p <0.001). There was a
good match between the actual and predicted values.
4.2 Poisson Bed Occupancy Model
This bed model based on Poisson distributed occupancy can be used to optimize the allocation of hospital beds to
improve patient care. Many investigators [7, 11] have discussed the use of Poisson model in estimating theoccupancy rate based on two inputs: length of stay, and number of admissions. In the Poisson based model, the
minimum number of beds, N, in order to achieve an over occupancy probability of not more than a pre-specified
value, v, can be expressed as: P[N≥C] = 1 – v, or
where, census, C, is Poisson distributed with mean equal to ADC, and ADC is defined as,ADC = average number of patients present in the hospital unit at any one time.
= (number of admissions/365)*average length of stay.
8/3/2019 170 Arun Kumar
http://slidepdf.com/reader/full/170-arun-kumar 5/6
Kumar and Mo
The percentage bed occupancy = (ADC/average number of staffed beds)*100.
Figure 2: Comparison of actual and predicted values for Class B2 and C beds
The equation above would provide the Cumulative Probability of the Average Daily Census (ADC) less than or
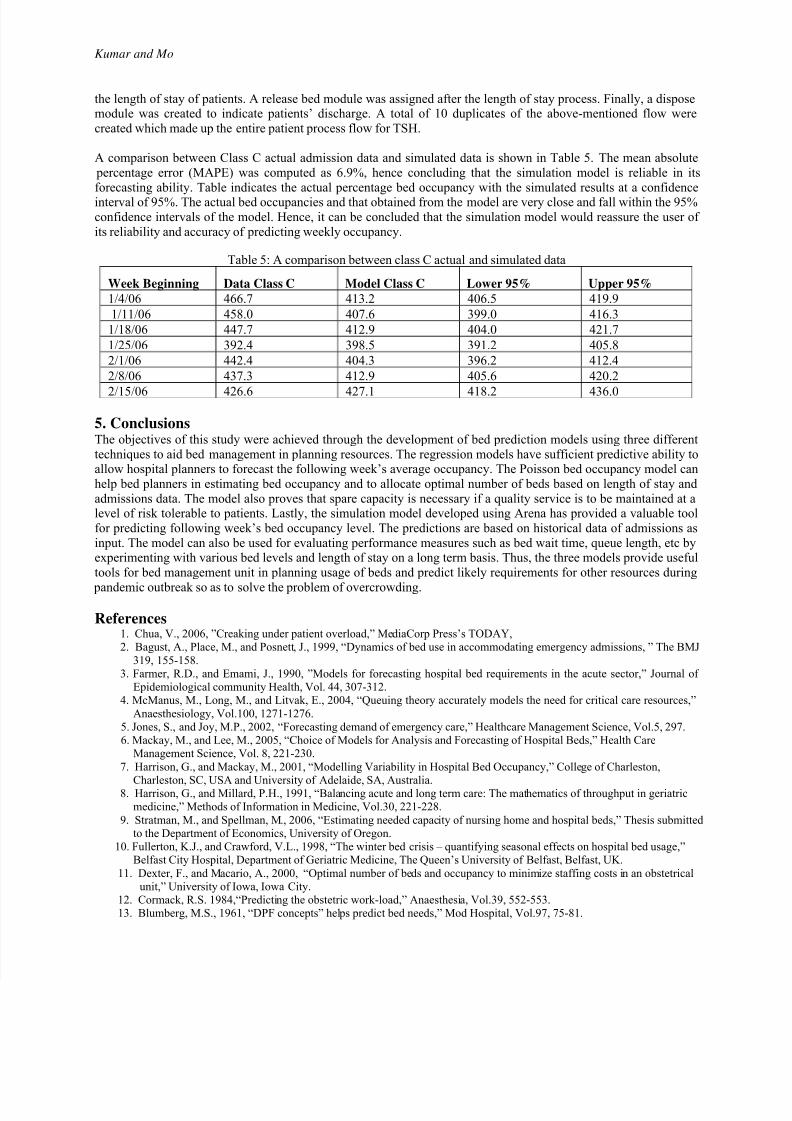
equal to the number of licensed beds in TTSH. The optimal number of beds was derived using sets of ‘length of stay’and admissions data. The Table 4 below shows that with 95 licensed beds and average length of stay of 6.6, thehospital has a probability of overflow 0.11%, and with an increment of 1 licensed bed, the probability of this
overflow gets lower, and finally to 0%. The Poisson model was applied to various ward classes to find out the
optimal number of beds (as compared to the licensed bed) that are needed in fulfilling an ideal condition of 0% over-
occupancy. Unlike regression model, the Poisson model exhibits simplicity in usage, as it required only two
variables. However, the Poisson model is unable to forecast the expected occupancy rate for the following week.
Table 4: Relationship between probability of overflow and number of beds
4.3 Simulation Model
ARENA 10.0 was used to model the flow of patients in the hospital. Arena’s input and output analysers provideexcellent tools to fit input probability distributions based on actual data and analyse output data. The model was built
from data for one year. Hospital supplied the data on the daily number of admissions, average length of stay over one
year, average number of available beds for each class of patients. The models of the inflow (admissions),occupancies and finally outflow (discharges) of patients were simulated for 3 types of wards, ranging from Class B1,
B2 to C as shown in the Figure 4 below.
After the patients’ selection of the desired Class, a process function of Bed securing was activated, subsequently, a
bed preparation transfer module was carried out, this was to simulate cleaning and preparation of the bed by hospital
staff. After the bed preparation process was completed, a hospital stay process was allocated to simulate the delay in
Week Beginning
C l a s s C
O c c u p i e
d
B e d s
7 / 1 / 2 0 0 6
6 / 1 6 / 2 0 0 6
6 / 1 / 2 0 0 6
5 / 1 6 / 2 0 0 6
5 / 1 / 2 0 0 6
4 / 1 6 / 2 0 0 6
4 / 1 / 2 0 0 6
3 / 1 6 / 2 0 0 6
3 / 1 / 2 0 0 6
2 / 1 6 / 2 0 0 6
2 / 1 / 2 0 0 6
1 / 1 6 / 2 0 0 6
1 / 1 / 2 0 0 6
1 2 / 1 6 / 2 0 0 5
1 2 / 1 / 2 0 0 5
1 1 / 1 6 / 2 0 0 5
1 1 / 1 / 2 0 0 5
1 0 / 1 6 / 2 0 0 5
470
460
450
440
430
420
410
400
Predicted
Actual
Legend
Graph of Actual Class C Occupied Beds and Predicted Values
Week Beginning
C l a s s B 2
O c c u p i e
d
B e d s
7 / 1 / 2 0 0 6
6 / 1 6 / 2 0 0 6
6 / 1 / 2 0 0 6
5 / 1 6 / 2 0 0 6
5 / 1 / 2 0 0 6
4 / 1 6 / 2 0 0 6
4 / 1 / 2 0 0 6
3 / 1 6 / 2 0 0 6
3 / 1 / 2 0 0 6
2 / 1 6 / 2 0 0 6
2 / 1 / 2 0 0 6
1 / 1 6 / 2 0 0 6
1 / 1 / 2 0 0 6
1 2 / 1 6 / 2 0 0 5
1 2 / 1 / 2 0 0 5
1 1 / 1 6 / 2 0 0 5
1 1 / 1 / 2 0 0 5
1 0 / 1 6 / 2 0 0 5
330
320
310
300
290
280
270
260
250
Predicted
Actual
Legend
Graph of Actual Class B2 Occupied Beds and Predicted Values
8/3/2019 170 Arun Kumar
http://slidepdf.com/reader/full/170-arun-kumar 6/6
Kumar and Mo
the length of stay of patients. A release bed module was assigned after the length of stay process. Finally, a disposemodule was created to indicate patients’ discharge. A total of 10 duplicates of the above-mentioned flow were
created which made up the entire patient process flow for TSH.
A comparison between Class C actual admission data and simulated data is shown in Table 5. The mean absolute
percentage error (MAPE) was computed as 6.9%, hence concluding that the simulation model is reliable in its
forecasting ability. Table indicates the actual percentage bed occupancy with the simulated results at a confidenceinterval of 95%. The actual bed occupancies and that obtained from the model are very close and fall within the 95%
confidence intervals of the model. Hence, it can be concluded that the simulation model would reassure the user of
its reliability and accuracy of predicting weekly occupancy.
Table 5: A comparison between class C actual and simulated data
Week Beginning Data Class C Model Class C Lower 95% Upper 95%
1/4/06 466.7 413.2 406.5 419.9
1/11/06 458.0 407.6 399.0 416.3
1/18/06 447.7 412.9 404.0 421.7
1/25/06 392.4 398.5 391.2 405.8
2/1/06 442.4 404.3 396.2 412.4
2/8/06 437.3 412.9 405.6 420.2
2/15/06 426.6 427.1 418.2 436.0
5. ConclusionsThe objectives of this study were achieved through the development of bed prediction models using three different
techniques to aid bed management in planning resources. The regression models have sufficient predictive ability toallow hospital planners to forecast the following week’s average occupancy. The Poisson bed occupancy model can
help bed planners in estimating bed occupancy and to allocate optimal number of beds based on length of stay and
admissions data. The model also proves that spare capacity is necessary if a quality service is to be maintained at alevel of risk tolerable to patients. Lastly, the simulation model developed using Arena has provided a valuable tool
for predicting following week’s bed occupancy level. The predictions are based on historical data of admissions as
input. The model can also be used for evaluating performance measures such as bed wait time, queue length, etc byexperimenting with various bed levels and length of stay on a long term basis. Thus, the three models provide useful
tools for bed management unit in planning usage of beds and predict likely requirements for other resources during
pandemic outbreak so as to solve the problem of overcrowding.
References1. Chua, V., 2006, ”Creaking under patient overload,” MediaCorp Press’s TODAY,2. Bagust, A., Place, M., and Posnett, J., 1999, “Dynamics of bed use in accommodating emergency admissions, ” The BMJ
319, 155-158.3. Farmer, R.D., and Emami, J., 1990, ”Models for forecasting hospital bed requirements in the acute sector,” Journal of
Epidemiological community Health, Vol. 44, 307-312.4. McManus, M., Long, M., and Litvak, E., 2004, “Queuing theory accurately models the need for critical care resources,”
Anaesthesiology, Vol.100, 1271-1276.5. Jones, S., and Joy, M.P., 2002, “Forecasting demand of emergency care,” Healthcare Management Science, Vol.5, 297.6. Mackay, M., and Lee, M., 2005, “Choice of Models for Analysis and Forecasting of Hospital Beds,” Health Care
Management Science, Vol. 8, 221-230.
7. Harrison, G., and Mackay, M., 2001, “Modelling Variability in Hospital Bed Occupancy,” College of Charleston,
Charleston, SC, USA and University of Adelaide, SA, Australia.8. Harrison, G., and Millard, P.H., 1991, “Balancing acute and long term care: The mathematics of throughput in geriatricmedicine,” Methods of Information in Medicine, Vol.30, 221-228.
9. Stratman, M., and Spellman, M., 2006, “Estimating needed capacity of nursing home and hospital beds,” Thesis submittedto the Department of Economics, University of Oregon.
10. Fullerton, K.J., and Crawford, V.L., 1998, “The winter bed crisis – quantifying seasonal effects on hospital bed usage,”Belfast City Hospital, Department of Geriatric Medicine, The Queen’s University of Belfast, Belfast, UK.
11. Dexter, F., and Macario, A., 2000, “Optimal number of beds and occupancy to minimize staffing costs in an obstetricalunit,” University of Iowa, Iowa City.
12. Cormack, R.S. 1984,“Predicting the obstetric work-load,” Anaesthesia, Vol.39, 552-553.13. Blumberg, M.S., 1961, “DPF concepts” helps predict bed needs,” Mod Hospital, Vol.97, 75-81.


![Home [] · rashmi sharma indu hina agrawal ashish sharma abhimanyu sharma tarun garg jasvir singh prince singh arun jain sunil sharma vikas sudhanshu singh monu ne-eraj kumar ashu](https://static.fdocuments.nl/doc/165x107/5f51cfbadbbe91146e2dcdce/home-rashmi-sharma-indu-hina-agrawal-ashish-sharma-abhimanyu-sharma-tarun-garg.jpg)