
1, CELIA R. GREGO2, ABEL L. VIEIRA3 LEONARDO DA R. KUSE4 ...
12
Journal of the Brazilian Association of Agricultural Engineering ISSN: 1809-4430 (on-line) _________________________ 1 Engº Agrônomo, Prof. Doutor, Embrapa Uva e Vinho e Universidade de Caxias do Sul, CNPUV-UCS/Vacaria – RS, Fone: (54) 3231-8300, [email protected] 2 Engº A grônoma, Doutora, Embrapa M onitoramento por satélites, Campinas – SP, [email protected] 3 Engº Agrônomo, Vacaria – RS, [email protected] 4 Engº Agrônomo, Vacaria – RS, [email protected] Recebido pelo Conselho Editorial em: 28-11-2012 Aprovado pelo Conselho Editorial em: 06-7-2015 Eng. Agríc., Jaboticabal, v.35, n.6, p.1160-1171, nov./dez. 2015 SPATIAL INFLUENCE OF PHYSICAL AND CHEMICAL PARAMETERS ON MANAGEMENT ZONE DEFINITION IN APPLE ORCHARDS Doi:http://dx.doi.org/10.1590/1809-4430-Eng.Agric.v35n6p1160-1171/2015 LUCIANO GEBLER 1 , CELIA R. GREGO 2 , ABEL L. VIEIRA 3 , LEONARDO DA R. KUSE 4 ABSTRACT: Precision agriculture adoption in Brazilian apple orchards is still incipient. This study aimed at evaluating the spatial variability of certain soil properties as soil density, soil penetration resistance, electrical conductivity, yield, and fruit quality in an apple orchard through digital mapping, as well as assessing the correlation between these factors by means of geostatistics, establishing management zones. Forty representative points were set within 2.5 hectares of apple orchard, wherein soil samples were collected and analyzed, besides measurements of fruit quality (Brix degree, size or diameter, pulp firmness and color) to generate an overall index quality. We concluded that the fruit quality indexes, when isolated, did not show strong spatial dependence, unlike the index of fruit quality (FQI), derived from a combination of these parameters, allowing orchard planning according to management zones based on quality. KEYWORDS : apple trees, precision fruit-growing, electrical conductivity in orchards. INFLUÊNCIA ESPACIAL DE PARÂMETROS FÍSICO-QUÍMICOS DE SOLO NA DEFINIÇÃO DE ZONAS DE MANEJO EM POMAR DE MAÇÃS RESUMO: A aplicação da agricultura de precisão em pomares de maçã no Brasil ainda é incipiente. O objetivo do presente trabalho foi avaliar a variabilidade espacial, através de mapeamento digital, da densidade do solo, resistência do solo à penetração, condutividade elétrica, produtividade e qualidade dos frutos em um pomar de maçãs e verificar a correlação entre estes fatores através de uso de geoestatística para o estabelecimento de zonas de manejo em pomar de maçã. Foram estabelecidos 40 pontos representativos em 2,5 hectares de pomar, de onde foram coletadas e analisadas amostras de solo e mensurados dados relativo à qualidade dos frutos ( o Brix, calibre ou diâmetro, firmeza e cor), utilizados para geração de um índice geral de qualidade de frutos, também mapeado. Concluiu-se que os índices de qualidade de frutas isolados não apresentaram forte dependência espacial, ao contrário do índice de qualidade dos frutos (IQF), derivado da junção desses parâmetros, permitindo o planejamento do pomar segundo zonas de manejo baseadas na qualidade. PALAVRAS-CHAVE: macieiras, fruticultura de precisão, condutividade elétrica em pomares. INTRODUCTION Fruit farming is in constant evolution around the world. Hence, progress monitoring is a key aspect when targeting high productive efficiency and expected profitability achievement. This is expected through a well elaborated planning of all actions to be taken in the field, as well as proper use of new technologies (ARNÓ et al., 2009). The advanced knowledge and correct characterization of Brazilian orchards relies on obtaining a series of information procedures that surpass the traditional production model. In this
Transcript of 1, CELIA R. GREGO2, ABEL L. VIEIRA3 LEONARDO DA R. KUSE4 ...
Journal of the Brazilian Association of Agricultural
Engineering
ISSN: 1809-4430 (on-line)
_________________________ 1 Engº Agrônomo, Prof. Doutor, Embrapa Uva e Vinho e Universidade de Caxias do Sul, CNPUV-UCS/Vacaria – RS, Fone: (54)
3231-8300, [email protected] 2 Engº Agrônoma, Doutora, Embrapa Monitoramento por satélites, Campinas – SP, [email protected] 3 Engº Agrônomo, Vacaria – RS, [email protected] 4 Engº Agrônomo, Vacaria – RS, [email protected]
Recebido pelo Conselho Editorial em: 28-11-2012
Aprovado pelo Conselho Editorial em: 06-7-2015
Eng. Agríc., Jaboticabal, v.35, n.6, p.1160-1171, nov./dez. 2015
SPATIAL INFLUENCE OF PHYSICAL AND CHEMICAL PARAMETERS ON
MANAGEMENT ZONE DEFINITION IN APPLE ORCHARDS
Doi:http://dx.doi.org/10.1590/1809-4430-Eng.Agric.v35n6p1160-1171/2015
LUCIANO GEBLER1, CELIA R. GREGO2, ABEL L. VIEIRA3,
LEONARDO DA R. KUSE4
ABSTRACT: Precision agriculture adoption in Brazilian apple orchards is still incipient. This study aimed at evaluating the spatial variability of certain soil properties as soil density, soil penetration resistance, electrical conductivity, yield, and fruit quality in an apple orchard through
digital mapping, as well as assessing the correlation between these factors by means of geostatistics, establishing management zones. Forty representative points were set within 2.5 hectares of apple
orchard, wherein soil samples were collected and analyzed, besides measurements of fruit quality (Brix degree, size or diameter, pulp firmness and color) to generate an overall index quality. We concluded that the fruit quality indexes, when isolated, did not show strong spatial dependence,
unlike the index of fruit quality (FQI), derived from a combination of these parameters, allowing orchard planning according to management zones based on quality.
KEYWORDS: apple trees, precision fruit-growing, electrical conductivity in orchards.
INFLUÊNCIA ESPACIAL DE PARÂMETROS FÍSICO-QUÍMICOS DE SOLO NA
DEFINIÇÃO DE ZONAS DE MANEJO EM POMAR DE MAÇÃS
RESUMO: A aplicação da agricultura de precisão em pomares de maçã no Brasil ainda é
incipiente. O objetivo do presente trabalho foi avaliar a variabilidade espacial, através de mapeamento digital, da densidade do solo, resistência do solo à penetração, condutividade elétrica, produtividade e qualidade dos frutos em um pomar de maçãs e verificar a correlação entre estes
fatores através de uso de geoestatística para o estabelecimento de zonas de manejo em pomar de maçã. Foram estabelecidos 40 pontos representativos em 2,5 hectares de pomar, de onde foram
coletadas e analisadas amostras de solo e mensurados dados relativo à qualidade dos frutos (oBrix, calibre ou diâmetro, firmeza e cor), utilizados para geração de um índice geral de qualidade de frutos, também mapeado. Concluiu-se que os índices de qualidade de frutas isolados não
apresentaram forte dependência espacial, ao contrário do índice de qualidade dos frutos (IQF), derivado da junção desses parâmetros, permitindo o planejamento do pomar segundo zonas de
manejo baseadas na qualidade. PALAVRAS-CHAVE: macieiras, fruticultura de precisão, condutividade elétrica em pomares.
INTRODUCTION
Fruit farming is in constant evolution around the world. Hence, progress monitoring is a key aspect when targeting high productive efficiency and expected profitability achievement. This is
expected through a well elaborated planning of all actions to be taken in the field, as well as proper use of new technologies (ARNÓ et al., 2009).
The advanced knowledge and correct characterization of Brazilian orchards relies on obtaining a series of information procedures that surpass the traditional production model. In this
Spatial influence of physical and chemical parameters on management zone definition in apple orchards
Eng. Agríc., Jaboticabal, v.35, n.6, p.1160-1171, nov./dez. 2015
1161
way, opportunities to apply Precision Agriculture (PA) techniques are created as a planning tool for the productive environment and subsequent support for decision-making (COELHO, 2003).
The basis of PA application, which incorporates a great number of georeferenced points, distributed in plots and enabling description of spatial variability, has been pointed as an economic obstacle to a more widespread use in Brazilian fruit growing. However, it is through detailed
sampling that spatial variations are analyzed by means of geostatistical application, enabling subsequent elaboration of maps and delimitation of differentiated management areas (FARIAS,
2002).
Regarding fruit-growing and other perennial crops, as well as chemical parameters, physical parameters also undertake a dimension of greater importance once physical management of soils is
only possible in long intervals, such as decades. Therefore, variables like soil density and resistance to penetration must be investigated as they can directly affect plot yield and fruit quality. In this
sense, the application of remote sensors that enables description or correlation of real parameters with results produced in mapping, would allow a substantial reduction of costs and increased technology adoption (CIRANI & MORAES, 2010).
One of the methods that have been tested in several areas in Brazil, and now in precision fruit growing, is the electrical conductivity analysis of soils (MOLIN et al., 2005). Its aim in fruit-
growing areas is to combine with important factors of soil such as clay content, soil-water content, cation exchange capacity, exchangeable calcium and magnesium content, obstruction layer depth, and organic matter content to establish management zones (MOLIN & CASTRO, 2008).
The aim of this study was to evaluate spatial variability, through digital mapping, of soil density, soil penetration resistance, electrical conductivity, fruit quality, and yield, in an apple orchard and verify correlation between these factors through geostatistics, for the establishment of
management zones.
MATERIAL AND METHODS
The experimental area was set in a commercial apple orchard located in the city of Vacaria, RS, Brazil. It was composed of two plots of Fuji variety, Nagafu-6 clone, 13 years old, distributed
in ten lines chosen from a total of 40, distributed so there was alternation between a line with sampling points and one without.
Each of them consisted of around 230 plants distant 4.0 m from each other in lines and approximately 1.4 m in between plants, totaling approximately 9,200 plants in 2.5 hectares, with the research project in the first year.
The predominant orchard soil is typical dystrophic Dark-red Latosol (Oxisol), common in the Vacaria-RS region (EMBRAPA, 1999), which is characterized by gently wavy to wavy reliefs,
climate categorized as Humid Subtropical, altitude classified by Köppen as Cfb (PEEL et al., 2007), and annual average rainfalls of around 1,400 mm year-1, according to data from the local meteorological station.
Soil management in adult orchards is carried out with native vegetation coverage between lines, and mechanical or chemical hoeing on a 1-metre strip for each side from plant line.
Fertilization follows recommendation proposed by ROLAS (2004) method, according to soil analysis at every three years.
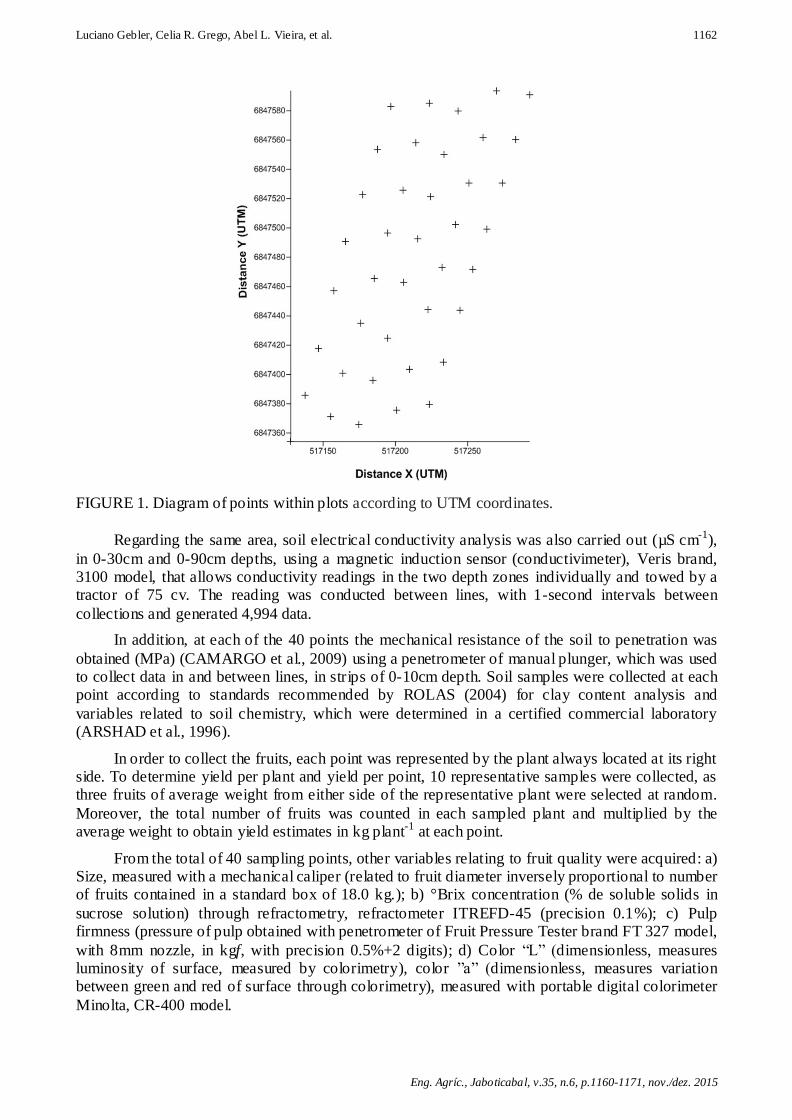
Forty sampling points were marked and georeferenced with the aid of a submetric DGPS
receptor, TRIMBLE brand, GEO XT model, distributing an approximate exploratory range with 8 points along two apple-tree lines from where material was taken for soil conventional analysis in
commercial laboratory, according to figure 1.
Luciano Gebler, Celia R. Grego, Abel L. Vieira, et al.
Eng. Agríc., Jaboticabal, v.35, n.6, p.1160-1171, nov./dez. 2015
1162
FIGURE 1. Diagram of points within plots according to UTM coordinates.
Regarding the same area, soil electrical conductivity analysis was also carried out (µS cm-1),
in 0-30cm and 0-90cm depths, using a magnetic induction sensor (conductivimeter), Veris brand, 3100 model, that allows conductivity readings in the two depth zones individually and towed by a tractor of 75 cv. The reading was conducted between lines, with 1-second intervals between
collections and generated 4,994 data.
In addition, at each of the 40 points the mechanical resistance of the soil to penetration was
obtained (MPa) (CAMARGO et al., 2009) using a penetrometer of manual plunger, which was used to collect data in and between lines, in strips of 0-10cm depth. Soil samples were collected at each point according to standards recommended by ROLAS (2004) for clay content analysis and
variables related to soil chemistry, which were determined in a certified commercial laboratory (ARSHAD et al., 1996).
In order to collect the fruits, each point was represented by the plant always located at its right side. To determine yield per plant and yield per point, 10 representative samples were collected, as three fruits of average weight from either side of the representative plant were selected at random.
Moreover, the total number of fruits was counted in each sampled plant and multiplied by the average weight to obtain yield estimates in kg plant-1 at each point.
From the total of 40 sampling points, other variables relating to fruit quality were acquired: a) Size, measured with a mechanical caliper (related to fruit diameter inversely proportional to number of fruits contained in a standard box of 18.0 kg.); b) °Brix concentration (% de soluble solids in
sucrose solution) through refractometry, refractometer ITREFD-45 (precision 0.1%); c) Pulp firmness (pressure of pulp obtained with penetrometer of Fruit Pressure Tester brand FT 327 model,
with 8mm nozzle, in kgf, with precision 0.5%+2 digits); d) Color “L” (dimensionless, measures luminosity of surface, measured by colorimetry), color ”a” (dimensionless, measures variation between green and red of surface through colorimetry), measured with portable digital colorimeter
Minolta, CR-400 model.
Spatial influence of physical and chemical parameters on management zone definition in apple orchards
Eng. Agríc., Jaboticabal, v.35, n.6, p.1160-1171, nov./dez. 2015
1163
Each one of these variables was numerically classified in one of the following four categories, low, average, good, and high, receiving values from one (low) to four (high).
Categorization was necessary to evaluate promptly the fruit quality and through a sum for each point, it was possible to devise a fruit quality index - FQI (dimensionless). The higher the accumulated value, the better is the product quality (fruit).
Spatial variability data relating to soil and apple production was analyzed with the a id of geostatistics that verified existence or not of spatial dependence in accordance with sampled
distance, with a range of 40 georeferenced points. Data were analyzed through descriptive statistics to determine mean, variance, standard deviation, variation coefficient, maximum and minimum values, asymmetry, and kurtosis. The spatial dependence analysis was conducted through
construction and adjustment of semivariograms with a mathematical model of greater adjustment. The criteria to choose the greatest adjustment were based according to VIEIRA (2000), in the trial-
and-error method combined with parameters of the jack knifing validation tool. According to VIEIRA et al. (2010), the manually adjusted semivariogram models resulted in better parameters of jack knifing due to freedom of choice for the user, of better adjustment in distinct regions of
semivariogram.
The spatial dependence degree (DD) was calculated, which refers to the proportion in
percentage of nugget effect (C1) in relation to plateau (C0+C1), considering, according to ZIMBACK (2001), weak dependence <25%, moderate dependence from 26% to 75% and strong dependence > 75%.
When the existence of spatial dependence is identified, the use of kriging as an interpolator enables generations of values in non-sampled points with no tendency and with minimum variation. Interpolated values allow construction of isoline maps.
In order to calculate descriptive statistical analysis and geostatistics, the GEOESTAT program was used (VIEIRA et al., 1983). Isoline maps were generated in the Surfer program (GOLDEN
SOFTWARE, 1999).
RESULTS AND DISCUSSION
The descriptive statistical analysis aimed to conduct a data exploratory analysis and resulted, based only on the sampling set, in values of means, minimum, and maximum values within the
standards for sampled data, which is, outlier values were not observed. This result indicates that the sampling set by itself will not distort results from the geostatistics analysis to be applied subsequently (Table 1).
The majority of soil physical and chemical data presents low to moderate variation, except from electrical conductivity that presented the highest values of VC (63.95% and 55.9%). The high
sampling density (4,994 data) and the high EC variation, with great difference between minimum and maximum values, resulted in asymmetry and kurtosis values distant from zero, indicating non-normality of data frequency distribution, according to Kolmogorov-Smirnov test. Non-normality
was also identified for penetration resistance between lines and organic matter.
Regarding statistical results related to fruit quality, there was also predominant variation from
low to average, except from color “a” (50.23%), and the asymmetry and kurtosis values indicate normal frequency distribution, except from FQI.
Luciano Gebler, Celia R. Grego, Abel L. Vieira, et al.
Eng. Agríc., Jaboticabal, v.35, n.6, p.1160-1171, nov./dez. 2015
1164
TABLE 1. Descriptive statistics of soil-related factors: penetration resistance (PR, MPa) in plant line and between plant lines from 0 to 10 cm depth; clay content (Clay, %); pH in water;
organic matter content (OM, %); cation exchange capacity (CEC, cmolc dm-3); base saturation (V, %); soil electrical conductivity (EC, µS cm-1) from 0 to 30 cm and from 0 to 90 cm depths. Fruit quality related factors as size, oBrix, pulp firmness (Firmness),
color "L", color "a", fruit quality index (FQI), and fruit yield (Yield, kg plant-1).
Variables Mean Variance Deviation V.C. Minimu
m Maximum Asymmetry Kurtosis
Kolmogorov
Smirnov test
(D)
Physical and Chemical of soil
PR line 3.667 1.183 1.088 29.67 1.86 5.88 0.1938 -0.9335 0.1229*
PR between
lines
6.188 0.4659 0.6826 11.03 4.21 6.86 -0.9731 0.5474 0.18746
Clay 41.2 40.88 6.394 15.52 26 55 -0.3334 -0.2909 0.11083*
pH water 6.945 0.2107 0.4591 6.61 5.7 7.8 -0.8127 0.7837 0.13596*
Organic
matter
3.582 1.025 1.012 28.26 1.1 5 -1.399 0.9905 0.26004
CEC 19.57 2.869 1.694 8.655 14.7 23.5 -0.1688 0.7168 0.06509*
V (%) 86.71 33.4 5.78 6.666 65.4 93.2 -1.644 3.712 0.13066*
EC 0- 30 cm 5.169 10.93 3.306 63.95 0.1 35.8 2.374 9.396 0.13946
EC 0- 90 cm 3.332 3.47 1.863 55.9 0.1 23.9 2.564 11.29 0.15584
Fruit quality
Size 138.6 53.4 7.308 5.272 125 150 -0.084 -0.819 0.07704* oBrix 12.91 1.134 1.065 8.251 11.1 16.8 1.236 3.235 0.1209*
Firmness 16.08 0.9486 0.9739 6.056 13.92 18.08 -0.056 -0.217 0.08385*
Color “L” 56.65 12.04 3.47 6.126 47.87 62.84 -0.929 0.803 0.11792*
Color “a” 8.557 18.48 4.298 50.23 1.8 20.27 0.509 0.062 0.0874*
FQI 11.9 1.938 1.392 11.7 10 15 0.427 -0.439 0.16598
Yield
(kg plant-1
)
25.37 76.07 8.722 34.38 9.478 37.1 -0.567 -0.5372 0.23893*
VC – Variance coefficient (%); *Indicates Normal distribution – Normality test 5% (Kolmogorov Smirnov).
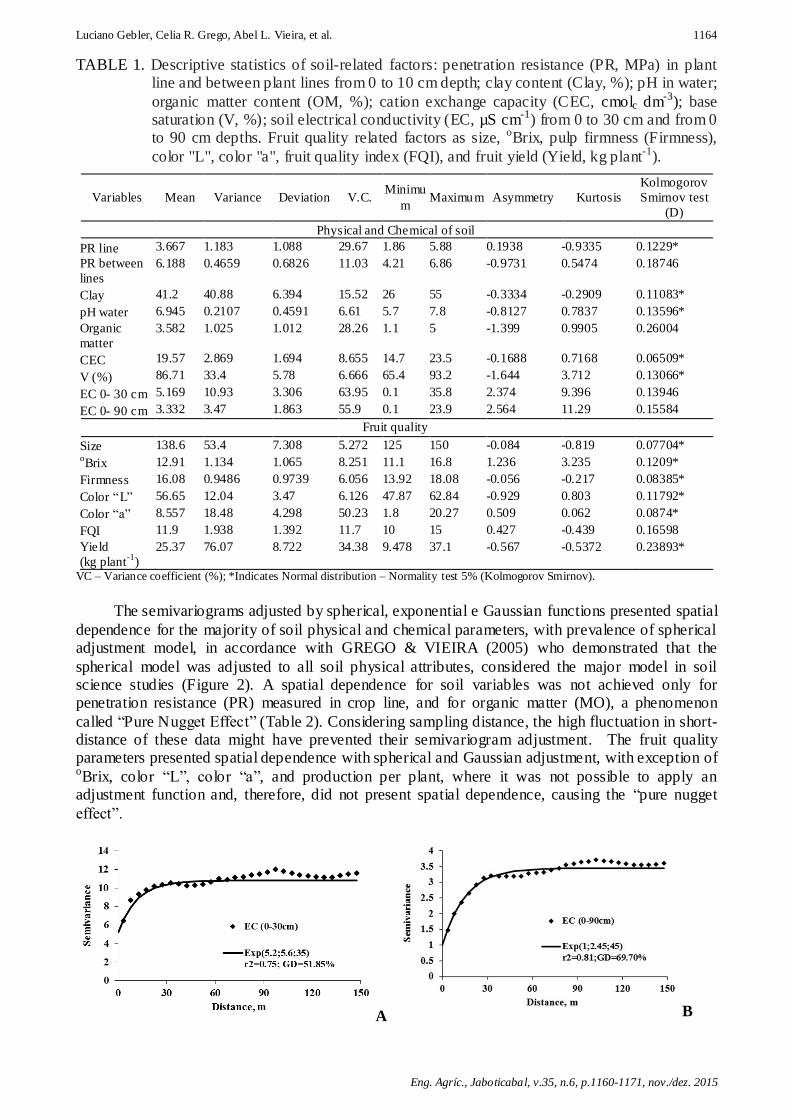
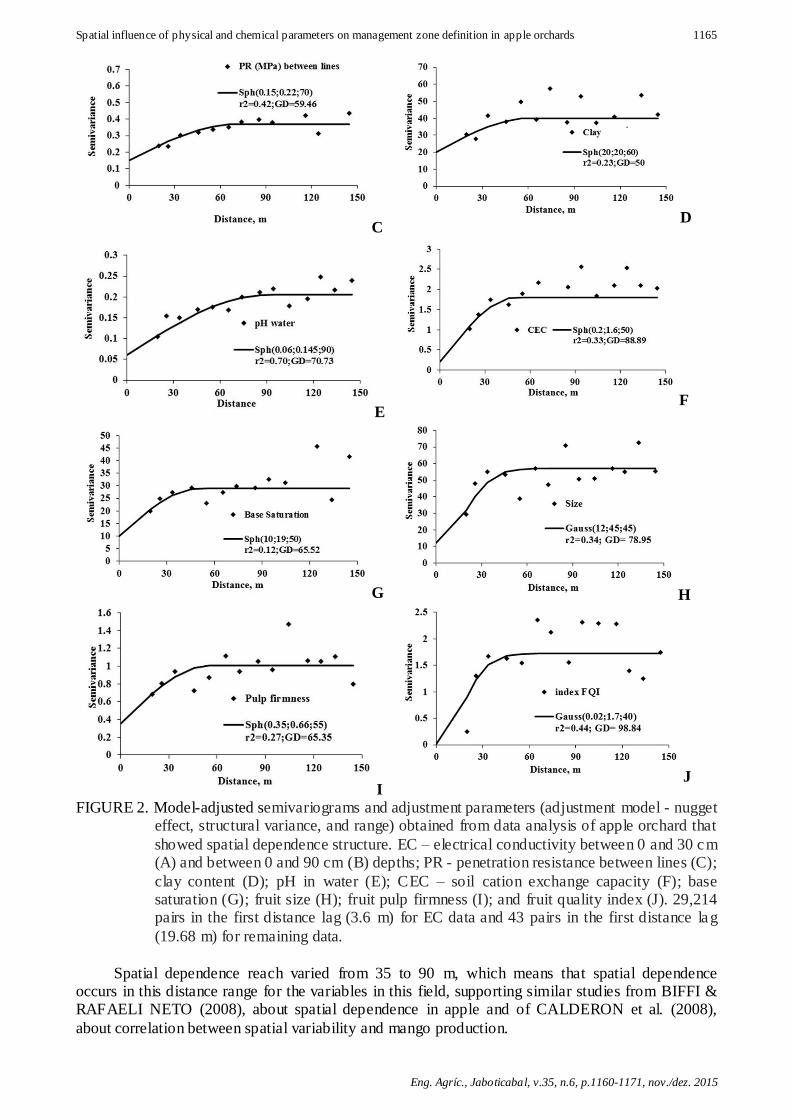
The semivariograms adjusted by spherical, exponential e Gaussian functions presented spatial
dependence for the majority of soil physical and chemical parameters, with prevalence of spherical adjustment model, in accordance with GREGO & VIEIRA (2005) who demonstrated that the
spherical model was adjusted to all soil physical attributes, considered the major model in soil science studies (Figure 2). A spatial dependence for soil variables was not achieved only for penetration resistance (PR) measured in crop line, and for organic matter (MO), a phenomenon
called “Pure Nugget Effect” (Table 2). Considering sampling distance, the high fluctuation in short-distance of these data might have prevented their semivariogram adjustment. The fruit quality parameters presented spatial dependence with spherical and Gaussian adjustment, with exception of oBrix, color “L”, color “a”, and production per plant, where it was not possible to apply an adjustment function and, therefore, did not present spatial dependence, causing the “pure nugget
effect”.
A B
Spatial influence of physical and chemical parameters on management zone definition in apple orchards
Eng. Agríc., Jaboticabal, v.35, n.6, p.1160-1171, nov./dez. 2015
1165
C D
E F
G H
I J
FIGURE 2. Model-adjusted semivariograms and adjustment parameters (adjustment model - nugget effect, structural variance, and range) obtained from data analysis of apple orchard that
showed spatial dependence structure. EC – electrical conductivity between 0 and 30 cm (A) and between 0 and 90 cm (B) depths; PR - penetration resistance between lines (C);
clay content (D); pH in water (E); CEC – soil cation exchange capacity (F); base saturation (G); fruit size (H); fruit pulp firmness (I); and fruit quality index (J). 29,214 pairs in the first distance lag (3.6 m) for EC data and 43 pairs in the first distance lag
(19.68 m) for remaining data.
Spatial dependence reach varied from 35 to 90 m, which means that spatial dependence occurs in this distance range for the variables in this field, supporting similar studies from BIFFI & RAFAELI NETO (2008), about spatial dependence in apple and of CALDERON et al. (2008),
about correlation between spatial variability and mango production.
Luciano Gebler, Celia R. Grego, Abel L. Vieira, et al.
Eng. Agríc., Jaboticabal, v.35, n.6, p.1160-1171, nov./dez. 2015
1166
Regarding parameters where semivariogram adjustments were possible, spatial dependence degree (DD), varied from moderate to strong (Table 2), according to ZIMBACK (2001)
classification, which indicates that spatial variability occurs in lower distances than the spatial dependence range and for the sampled distance, closer neighbors are similar, which proves the geostatistics hypothesis.
TABLE 2. Adjustment model, adjustment correlation coefficient, classification and degree of
spatial dependence for factors related to soil and fruit quality.
Variables Adjustment model Correlation coefficient Dependence degree Classification of
dependence degree
Physical and chemical of soil
PR line Pure Nugget Effect
PR between lines Spherical 0.42 59.46 Moderate
Clay Spherical 0.23 50.00 Moderate
pH water Spherical 0.70 70.73 Strong
Organic matter Pure Nugget Effect
CEC Spherical 0.33 88.89 Strong
V (%) Spherical 0.12 65.52 Moderate
EC 0- 30cm Exponential 0.75 51.85 Moderate
EC 0- 90cm Exponential 0.93 71.01 Strong
Fruit quality
Size Gaussian 0.05 78.95 Strong oBrix Pure Nugget Effect
Firmness Spherical 0.10 65.00 Moderate
Color “L” Pure Nugget Effect
Color “a” Pure Nugget Effect
FQI Gaussian 0.03 98.84 Strong
Fruit y ield (kg p lant-1
) Pure Nugget Effect PR – soil penetration resistance; CEC – cation exchange capacity; V – base saturation; EC – electrical conductivity; FQI – fruit quality index
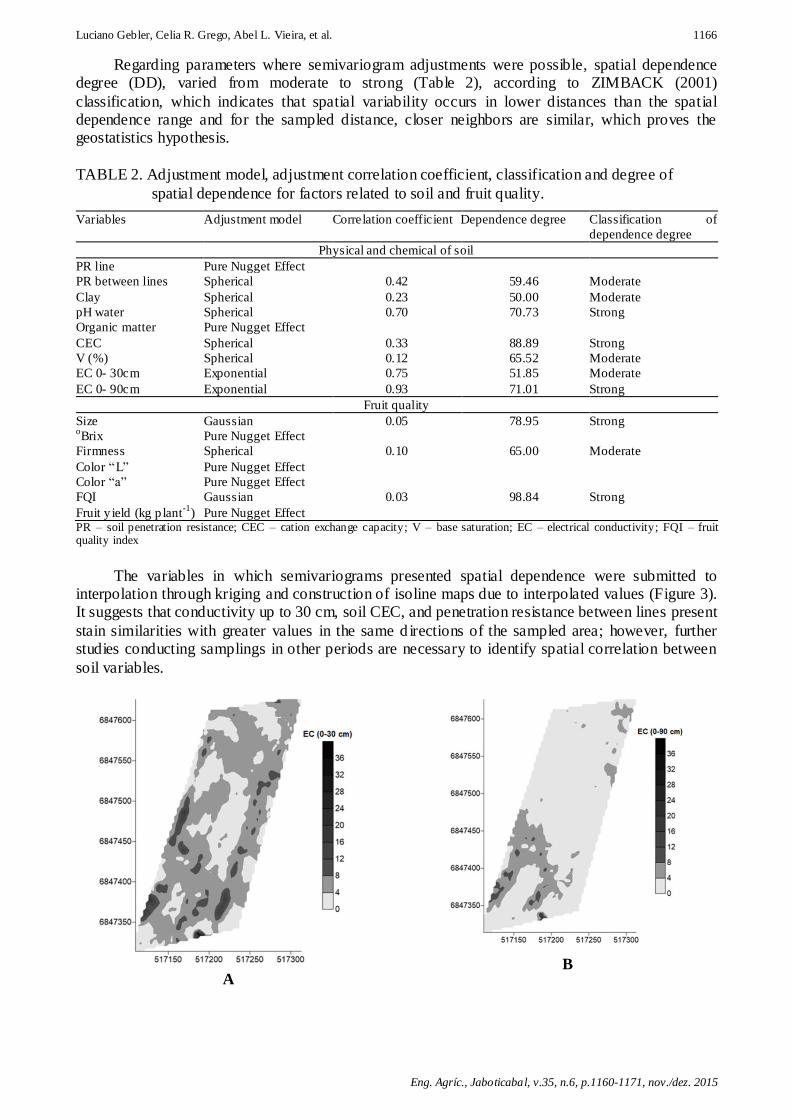
The variables in which semivariograms presented spatial dependence were submitted to interpolation through kriging and construction of isoline maps due to interpolated values (Figure 3). It suggests that conductivity up to 30 cm, soil CEC, and penetration resistance between lines present
stain similarities with greater values in the same d irections of the sampled area; however, further studies conducting samplings in other periods are necessary to identify spatial correlation between
soil variables.
A
B
Spatial influence of physical and chemical parameters on management zone definition in apple orchards
Eng. Agríc., Jaboticabal, v.35, n.6, p.1160-1171, nov./dez. 2015
1167
C
D
E
F
G
H
Luciano Gebler, Celia R. Grego, Abel L. Vieira, et al.
Eng. Agríc., Jaboticabal, v.35, n.6, p.1160-1171, nov./dez. 2015
1168
I
J
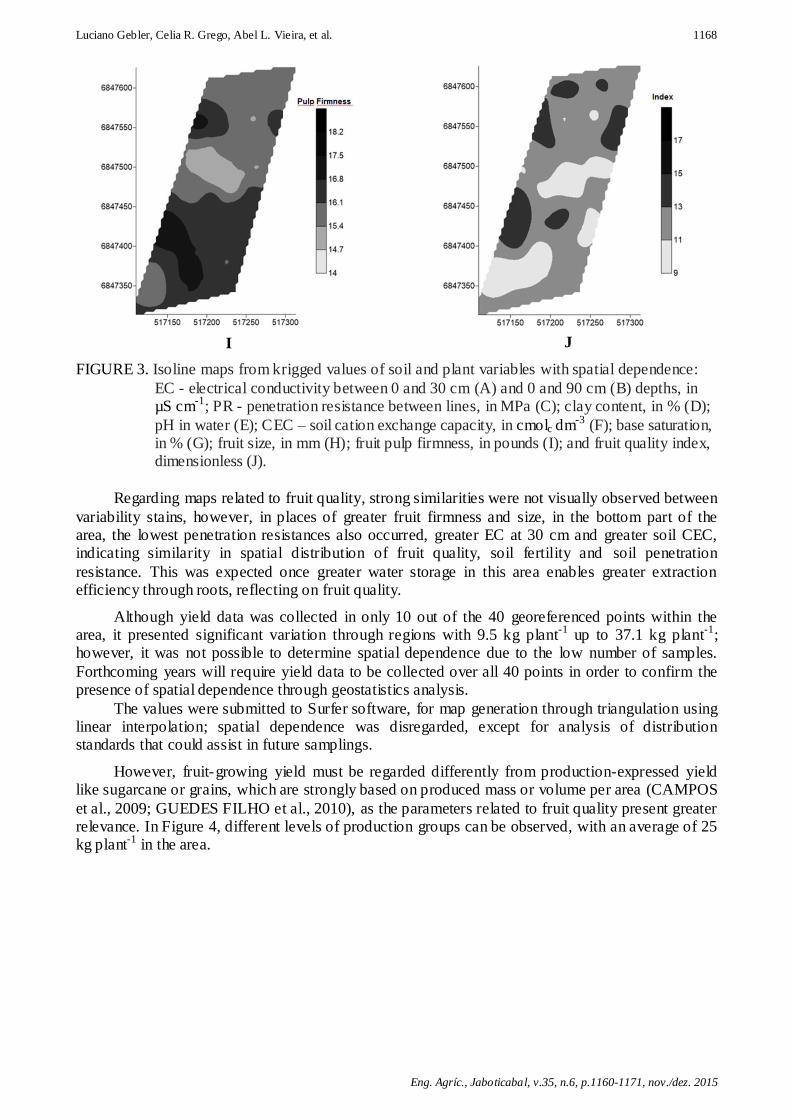
FIGURE 3. Isoline maps from krigged values of soil and plant variables with spatial dependence:
EC - electrical conductivity between 0 and 30 cm (A) and 0 and 90 cm (B) depths, in µS cm-1; PR - penetration resistance between lines, in MPa (C); clay content, in % (D);
pH in water (E); CEC – soil cation exchange capacity, in cmolc dm-3 (F); base saturation, in % (G); fruit size, in mm (H); fruit pulp firmness, in pounds (I); and fruit quality index, dimensionless (J).
Regarding maps related to fruit quality, strong similarities were not visually observed between
variability stains, however, in places of greater fruit firmness and size, in the bottom part of the area, the lowest penetration resistances also occurred, greater EC at 30 cm and greater soil CEC, indicating similarity in spatial distribution of fruit quality, soil fertility and soil penetration
resistance. This was expected once greater water storage in this area enables greater extraction efficiency through roots, reflecting on fruit quality.
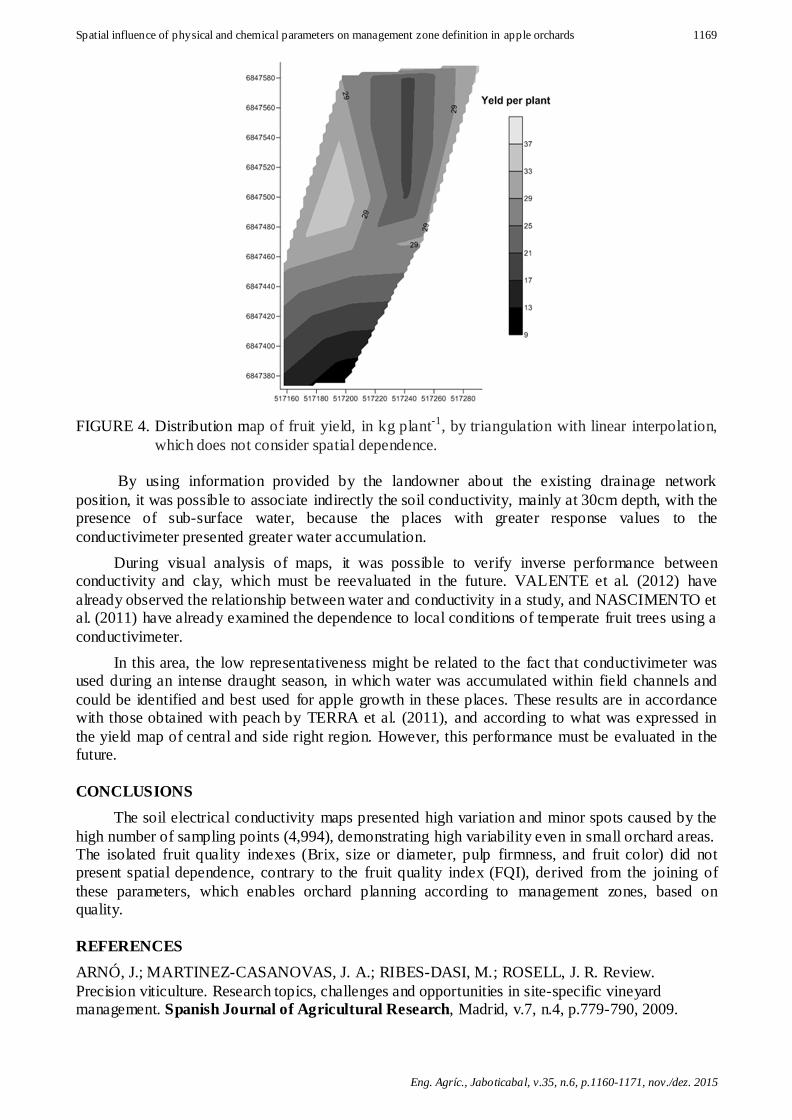
Although yield data was collected in only 10 out of the 40 georeferenced points within the area, it presented significant variation through regions with 9.5 kg plant-1 up to 37.1 kg plant-1; however, it was not possible to determine spatial dependence due to the low number of samples.
Forthcoming years will require yield data to be collected over all 40 points in order to confirm the presence of spatial dependence through geostatistics analysis.
The values were submitted to Surfer software, for map generation through triangulation using linear interpolation; spatial dependence was disregarded, except for analysis of distribution standards that could assist in future samplings.
However, fruit-growing yield must be regarded differently from production-expressed yield like sugarcane or grains, which are strongly based on produced mass or volume per area (CAMPOS
et al., 2009; GUEDES FILHO et al., 2010), as the parameters related to fruit quality present greater relevance. In Figure 4, different levels of production groups can be observed, with an average of 25 kg plant-1 in the area.
Spatial influence of physical and chemical parameters on management zone definition in apple orchards
Eng. Agríc., Jaboticabal, v.35, n.6, p.1160-1171, nov./dez. 2015
1169
FIGURE 4. Distribution map of fruit yield, in kg plant-1, by triangulation with linear interpolation,
which does not consider spatial dependence.
By using information provided by the landowner about the existing drainage network
position, it was possible to associate indirectly the soil conductivity, mainly at 30cm depth, with the presence of sub-surface water, because the places with greater response values to the
conductivimeter presented greater water accumulation.
During visual analysis of maps, it was possible to verify inverse performance between conductivity and clay, which must be reevaluated in the future. VALENTE et al. (2012) have
already observed the relationship between water and conductivity in a study, and NASCIMENTO et al. (2011) have already examined the dependence to local conditions of temperate fruit trees using a
conductivimeter.
In this area, the low representativeness might be related to the fact that conductivimeter was used during an intense draught season, in which water was accumulated within field channels and
could be identified and best used for apple growth in these places. These results are in accordance with those obtained with peach by TERRA et al. (2011), and according to what was expressed in
the yield map of central and side right region. However, this performance must be evaluated in the future.
CONCLUSIONS
The soil electrical conductivity maps presented high variation and minor spots caused by the
high number of sampling points (4,994), demonstrating high variability even in small orchard areas. The isolated fruit quality indexes (Brix, size or diameter, pulp firmness, and fruit color) did not present spatial dependence, contrary to the fruit quality index (FQI), derived from the joining of
these parameters, which enables orchard planning according to management zones, based on quality.
REFERENCES
ARNÓ, J.; MARTINEZ-CASANOVAS, J. A.; RIBES-DASI, M.; ROSELL, J. R. Review.
Precision viticulture. Research topics, challenges and opportunities in site-specific vineyard management. Spanish Journal of Agricultural Research, Madrid, v.7, n.4, p.779-790, 2009.
Luciano Gebler, Celia R. Grego, Abel L. Vieira, et al.
Eng. Agríc., Jaboticabal, v.35, n.6, p.1160-1171, nov./dez. 2015
1170
ARSHAD, M.A.; LOWERY, B.; GROSSMAN, B. Physical tests for monitoring soil quality. In: DORAN, J. W.; JONES, A. J. (Ed.). Methods for assessing soil quality. Madison: Soil Science
Society of America, 1996. p.123-141. (SSSA Special Publication, 49).
BIFFI, L. J.; RAFAELI NETO, S. L. Comportamento espacial de variáveis agronômicas da maçã ‘Fuji’ durante dois anos de observações no planalto serrano de Santa Catarina. Revista Brasileira
de Fruticultura, Jaboticabal, v.30, n.4, p.975-980, 2008.
CALDERON, C. A. V.; MARTINEZ, L. J. M.; HENAO, R. G. Variabilidad espacial del suelo y su
relación con el rendimiento de mango. Revista Brasileira de Fruticultura, Jaboticabal, v.30, n.4, p.1146-1151, 2008.
CAMARGO, O.A.; MONIZ, A. C.; JORGE, J. A.; VALADARES, J. M. A. S. Métodos de análise
química, mineralógica e física de solos do instituto agronômico de campinas . Campinas: Instituto Agronômico, 2009. 77p.
CAMPOS, M. C. C.; MARQUES JÚNIOR, J.; PEREIRA, G. T.; SOUZA, Z. M.; MONTANARI, R. Planejamento agrícola e implantação de cultivo de cana-de-açúcar com auxílio de técnicas de geoprocessamento. Revista Brasileira de Engenharia Agrícola e Ambiental, Campina Grande,
v.13, n.3, p.297-304, 2009.
CIRANI, C. B. S.; MORAES, M. A. F. D. Inovação na indústria sucroalcooleira paulista: os
determinantes da adoção das tecnologias de agricultura de precisão. Revista de Economia e
Sociologia Rural, Brasília, v.48, n.4, p.543-565, 2010.
COELHO, A. M. Agricultura de precisão: manejo da variabilidade espacial e temporal dos solos e
das culturas. In: CURI, N.; MARQUES, J. J.; GUILHERME, L. R. G.; LIMA, J. M.; LOPES, A. S.; ALVAREZ VENEGAS, V. H. Tópicos em ciência do Solo. Viçosa: Sociedade Brasileira de Ciência do Solo, 2003, v.3, p.249-290.
EMBRAPA – Empresa Brasileira de Pesquisa Agropecuária. Sistema brasileiro de classificação
dos solos. Brasília: Embrapa Produção da Informação; Rio de Janeiro: Embrapa Solos, 1999. p.150.
GOLDEN SOFTWARE INC. 1999. Surfer for windows. Surfer. Surfer 7.0. Contouring and 3D
surface mapping for scientist's engineers. User's Guide. New York: Golden Software, 1999. 619p.
GREGO, C. R.; VIEIRA, S. R. Variabilidade espacial de propriedades físicas de solo em uma parcela experimental. Revista Brasileira de Ciência do Solo, Viçosa, MG, v.29, n.2, p.169-177,
2005.
GUEDES FILHO, O.; VIEIRA, S. R.; CHIBA, M. K.; GREGO, C. R. Geostatistical analysis of crop yield maps in a long-term no tillage system. Bragantia, Campinas, v.69, p.9-18. 2010. Suppl.
MOLIN, J. P.; CASTRO, C. N. Establishing management zones using soil electrica l conductivity and other soil properties by the fuzzy clustering technique. Scientia Agricola, Piracicaba, v.65, n.6,
p.567-573, 2008.
MOLIN, J. P.; GIMENEZ, L. M.; PAULETTI, V.; SCHMIDHALTER, U.; HAMMER, J. Mensuração da condutividade elétrica do solo por indução e sua correlação com fatores de
produção. Engenharia Agrícola, Jaboticabal, v.25, n.2, p.420-426. 2005.
NASCIMENTO, P. S.; ROCHA, M. G.; SILVA, J. A.; COSTA, B. R. S.; RABELLO, L. M.;
BASSOI, L. H. Zonas homogêneas de condutividade elétrica aparente em neossolo quartzarênico no semiárido. In: INAMASU, R. Y.; VAZ, C. M. P.; NAIME, J. M.; QUEIROS, L. R.; RESENDE, A. V. R.; VILELA, M. F.; JORGE, L. A. C.; BASSOI, L. H.; PEREZ, B.; FRAGALLE, E. P. (Ed.).
Agricultura de precisão: um novo olhar. São Carlos: Embrapa Instrumentação, 2011. p.290-293.
PEEL, M. C.; FINLAYSON, B. L.; McMAHON, T. A. Update world map of the Köppen-Geiger
climate classification. Hidrology and Earth System Sciences , Kattenburg, n.11, p.1633-1644, 2007.
Spatial influence of physical and chemical parameters on management zone definition in apple orchards
Eng. Agríc., Jaboticabal, v.35, n.6, p.1160-1171, nov./dez. 2015
1171
ROLAS - REDE OFICIAL DE ANÁLISE DE SOLO E DE TECIDO VEGETAL. Manual de
adubação e calagem para os estados do Rio Grande do Sul e Santa Catarina. 10. ed. Porto
Alegre: Sociedade Brasileira de Ciência do Solo, 2004.
TERRA, V. S. S.; REISSER JÚNIOR, C.; TIMM, L. C.; CARVALHO, F. L. C.; PEREIRA, J. F. M. Variabilidade espacial de atributos físicos numa área cultivada com pêssego. In: INAMASU, R.
Y.; VAZ, C. M. P.; NAIME, J. M.; QUEIROS, L. R.; RESENDE, A. V. R.; VILELA, M. F.; JORGE, L. A. C.; BASSOI, L. H.; PEREZ, B.; FRAGALLE, E. P. (Ed.). Agricultura de precisão:
um novo olhar. São Carlos, Embrapa Instrumentação, 2011. p. 212-216.
VALENTE, D. S. M.; QUEIROZ, D. M.; PINTO, F. A. C.; SANTOS, N. T.; SANTOS, F. L. The relationship between apparent soil electrical conductivity and soil properties. Revista Ciências
Agronômicas, Fortaleza, v.43, n.4, p.683-690. 2012.
VIEIRA, S. R. Geoestatística em estudos de variabilidade espacial do solo. In: NOVAIS, R. F.;
ALVAREZ VENEGAS, V. H.; SCHAEFER, G. R. (Ed.). Tópicos em Ciência do solo. Viçosa: Sociedade Brasileira de Ciência do solo, 2000. v.1, p.1-54.
VIEIRA, S. R.; HATFIELD, J. L.; NIELSEN, D. R.; BIGGAR, J. W. Geostatistical theory and
application to variability of some agronomical properties. Hilgardia, Oakland, v.51, n.1, p.175, 1983.
VIEIRA, S. R.; CARVALHO, J. R. P. de; PAZ GONZALEZ, A. Jack knifing for semivariogram validation. Bragantia, Campinas, v.69, p.97-105, 2010.
ZIMBACK, C. R. L. Análise espacial de atributos químicos de solo para o mapeamento da
fertilidade do solo. 2001. 114f. Tese (Livre docência) – Facildade de Ciências Agronômicas, Botucatu, 2001.


![Abel Nabacus n .. ( pl. abaci) primitive board ﻪﻟا هدﺎﺳ هﻮﻳ ﻮﻟﺮﻴﻤﺷ د : سﻮﻛﺎﺑا abbriviate ( a notatuin)( cf Notation] لوډﻨﻟ ab-brivation](https://static.fdocuments.nl/doc/165x107/5ea8d1df8312ce750060b60d/abel-n-abacus-n-pl-abaci-primitive-board-ii-ii-ii-iiiiii.jpg)