
, Roberto Neri Daniel Stern , Michiel Reuland arXiv:astro ...
16
arXiv:astro-ph/0302154v1 7 Feb 2003 1 Astronomy & Astrophysics manuscript no. ms3003 November 4, 2018 (DOI: will be inserted by hand later) CO emission and associated H I absorption from a massive gas reservoir surrounding the z =3 radio galaxy B3 J2330+3927 ⋆ Carlos De Breuck 1 ⋆⋆ , Roberto Neri 2 , Raffaella Morganti 3 , Alain Omont 1 , Brigitte Rocca-Volmerange 1 , Daniel Stern 4 , Michiel Reuland 5 , Wil van Breugel 5 , Huub R¨ ottgering 6 , S. A. Stanford 5,7 , Hyron Spinrad 8 , Mario Vigotti 9 , and Melvyn Wright 10 1 Institut d’Astrophysique de Paris, CNRS, 98bis Boulevard Arago, F-75014 Paris, France e-mail: debreuck,omont,[email protected] 2 Institut de Radioastronomie Millim´ etrique, 300 rue de la piscine, F-38406 St. Martin-d’H` eres, France e-mail: [email protected] 3 ASTRON, Postbus 2, NL-7990 AA Dwingeloo, The Netherlands e-mail: [email protected] 4 Jet Propulsion Laboratory, California Institute of Technology, Mail Stop 169-327, Pasadena, CA 91109, USA e-mail: [email protected] 5 IGPP/LLNL, L-413, 7000 East Ave, Livermore, CA 94550, USA e-mail: mreuland,[email protected] 6 Sterrewacht Leiden, Postbus 9513, NL-2300 RA Leiden, The Netherlands e-mail: [email protected] 7 Department of Physics, University of California, Davis, CA 95616, USA e-mail: [email protected] 8 Department of Astronomy, University of California, Berkeley, CA 94720, USA e-mail: [email protected] 9 Istituto di Radioastronomia del CNR, Via Gobetti 101, I-40129 Bologna, Italy e-mail: [email protected] 10 Radio Astronomy Laboratory, University of California, Berkeley, CA 94720, USA e-mail: [email protected] Received 2002 August 12; accepted 2003 February 7 Abstract. We present results of a comprehensive multi-frequency study of the radio galaxy B3 J2330+3927. The 1. ′′ 9 wide radio source, consisting of 3 components, is bracketed by 2 objects in our Keck K-band image. Optical and near-IR Keck spectroscopy of these two objects yield z =3.087 ± 0.004. The brightest (K = 18.8) object has a standard type II AGN spectrum, and is the most likely location of the AGN, which implies a one-sided jet radio morphology. Deep 113 GHz observations with the IRAM Plateau de Bure Interferometer reveal CO J =4 - 3 emission, which peaks at the position of the AGN. The CO line is offset by 500 km s −1 from the systemic redshift of the AGN, but corresponds very closely to the velocity shift of an associated H I absorber seen in Lyα. This strongly suggests that both originate from the same gas reservoir surrounding the AGN host galaxy. Simultaneous 230 GHz interferometer observations find a ∼ 3× lower integrated flux density when compared to single dish 250 GHz observations with MAMBO at the IRAM 30m telescope. This can be interpreted as spatially resolved thermal dust emission at scales of 0. ′′ 5 to 6 ′′ . Finally, we present a τ< 1.3% limit to the H I 21 cm absorption against the radio source, which represents the seventh non-detection out of 8 z> 2 radio galaxies observed to date with the WSRT. We present mass estimates for the atomic, neutral, and ionized hydrogen, and for the dust, ranging from M(H I)=2 × 10 7 M⊙ derived from the associated H I absorber in Lyα up to M(H2)=7 × 10 10 M⊙ derived from the CO emission. This indicates that the host galaxy is surrounded by a massive reservoir of gas and dust. The K-band companion objects may be concentrations within this reservoir, which will eventually merge with the central galaxy hosting the AGN. Key words. Galaxies: individual: B3 J2330+3927 – galaxies: active – galaxies: formation – galaxies: emission lines – radio lines: galaxies – cosmology: observations
Transcript of , Roberto Neri Daniel Stern , Michiel Reuland arXiv:astro ...
arX
iv:a
stro
-ph/
0302
154v
1 7
Feb
200
31Astronomy & Astrophysics manuscript no. ms3003 November 4, 2018
(DOI: will be inserted by hand later)
CO emission and associated H I absorption from a massive gas
reservoir surrounding the z = 3 radio galaxy B3 J2330+3927⋆
Carlos De Breuck1⋆⋆, Roberto Neri2, Raffaella Morganti3, Alain Omont1, Brigitte Rocca-Volmerange1 ,Daniel Stern4, Michiel Reuland5, Wil van Breugel5, Huub Rottgering6, S. A. Stanford5,7, Hyron Spinrad8,
Mario Vigotti9, and Melvyn Wright10
1 Institut d’Astrophysique de Paris, CNRS, 98bis Boulevard Arago, F-75014 Paris, Francee-mail: debreuck,omont,[email protected]
2 Institut de Radioastronomie Millimetrique, 300 rue de la piscine, F-38406 St. Martin-d’Heres, Francee-mail: [email protected]
3 ASTRON, Postbus 2, NL-7990 AA Dwingeloo, The Netherlandse-mail: [email protected]
4 Jet Propulsion Laboratory, California Institute of Technology, Mail Stop 169-327, Pasadena, CA 91109, USAe-mail: [email protected]
5 IGPP/LLNL, L-413, 7000 East Ave, Livermore, CA 94550, USAe-mail: mreuland,[email protected]
6 Sterrewacht Leiden, Postbus 9513, NL-2300 RA Leiden, The Netherlandse-mail: [email protected]
7 Department of Physics, University of California, Davis, CA 95616, USAe-mail: [email protected]
8 Department of Astronomy, University of California, Berkeley, CA 94720, USAe-mail: [email protected]
9 Istituto di Radioastronomia del CNR, Via Gobetti 101, I-40129 Bologna, Italye-mail: [email protected]
10 Radio Astronomy Laboratory, University of California, Berkeley, CA 94720, USAe-mail: [email protected]
Received 2002 August 12; accepted 2003 February 7
Abstract. We present results of a comprehensive multi-frequency study of the radio galaxy B3 J2330+3927. The1.′′9 wide radio source, consisting of 3 components, is bracketed by 2 objects in our Keck K−band image. Opticaland near-IR Keck spectroscopy of these two objects yield z = 3.087 ± 0.004. The brightest (K = 18.8) objecthas a standard type II AGN spectrum, and is the most likely location of the AGN, which implies a one-sided jetradio morphology.Deep 113 GHz observations with the IRAM Plateau de Bure Interferometer reveal CO J = 4− 3 emission, whichpeaks at the position of the AGN. The CO line is offset by 500 km s−1 from the systemic redshift of the AGN,but corresponds very closely to the velocity shift of an associated H I absorber seen in Lyα. This strongly suggeststhat both originate from the same gas reservoir surrounding the AGN host galaxy. Simultaneous 230 GHzinterferometer observations find a ∼ 3× lower integrated flux density when compared to single dish 250 GHzobservations with MAMBO at the IRAM 30m telescope. This can be interpreted as spatially resolved thermaldust emission at scales of 0.′′5 to 6′′.Finally, we present a τ < 1.3% limit to the H I 21 cm absorption against the radio source, which represents theseventh non-detection out of 8 z > 2 radio galaxies observed to date with the WSRT.We present mass estimates for the atomic, neutral, and ionized hydrogen, and for the dust, ranging fromM(H I) = 2× 10⁷ M⊙ derived from the associated H I absorber in Lyα up to M(H2) = 7× 10¹⁰ M⊙ derived fromthe CO emission. This indicates that the host galaxy is surrounded by a massive reservoir of gas and dust. TheK−band companion objects may be concentrations within this reservoir, which will eventually merge with thecentral galaxy hosting the AGN.
Key words. Galaxies: individual: B3 J2330+3927 – galaxies: active – galaxies: formation – galaxies: emission lines– radio lines: galaxies – cosmology: observations
1. Introduction
The study of high redshift galaxies has for a longtime been limited to the optical/near-IR and radio do-mains. Recent technological progress has now openedup other wavelength regimes (sub-mm, X-ray and evenγ-ray) to high redshift studies. Together with the dis-covery of optically-selected ’Lyman break’ galaxies (e.g.Steidel et al., 1996, 1999; Ouchi et al., 2001), this hasmuch broadened our knowledge of high redshift objects,which was previously based on galaxies containing brightAGN. Similarly, our knowledge of AGN has also bene-fited from this multi-wavelength approach. The fractionof galaxies hosting AGN can now be estimated from deepblank-field X-ray and optical surveys (e.g. Barger et al.,2001; Steidel et al., 2002), providing an estimate of theduration of their active phase.
The presence of an AGN introduces a number of com-plications when studying the host galaxy. This is especiallytrue for Type I (broad-lined) AGN, where the host galaxycan only be seen after a careful subtraction of the dominat-ing AGN emission. This problem does not manifest itselfin Type II (narrow-lined) AGN, where the bright centralemission is conveniently shielded by optically thick mate-rial. We can therefore use the AGN signatures to pinpointthe host galaxies, while still having a relatively unbiasedview of the stellar population.
The downside of using type II AGN is that theirsignatures are much fainter at optical wavelengths, andthus intrinsically more difficult to detect out to high red-shifts. Surveys for distant type II AGN have therefore re-lied on manifestations of the AGN at other wavelengths.Historically, the most successful technique has been the se-lection using powerful radio synchrotron emission from theAGN, which has lead to the discovery of almost 150 radio-loud type II AGN at z > 2 (De Breuck et al., 2000b), withthe most distant known at z = 5.19 (van Breugel et al.,1999). This predominance of radio selection has lead to thealmost unique identification of high redshift type II AGNas ’high redshift radio galaxies’ (HzRGs, z > 2). However,recently radio-quiet type II AGN at z > 2 have also beenfound in submm (Ivison et al., 1998, but see Vernet &Cimatti, 2001), X-ray (Stern et al., 2002; Norman et al.,2002) and optical surveys (Steidel et al., 2002).
Despite these new developments, radio galaxies remainamongst the best studied galaxies at high redshift, becausethey represent some of the most luminous stellar systemsknown out to z > 5 (e.g. Best, Longair, & Rottgering,1998; De Breuck et al., 2002). For example, deep opticalspectropolarimetry can reveal a wealth of information onthe stellar population of the host galaxy (e.g. Dey et al.,1997), the presence of a scattered quasar component (e.g.
Send offprint requests to: Carlos De Breuck⋆ Based on observations obtained with the IRAM Plateau
de Bure Interferometer, the W. M. Keck telescope, theWesterbork Synthesis Radio Telescope and the Very LargeArray.⋆⋆ Marie Curie fellow
Vernet et al., 2001a), and the kinematics, ionization mech-anism and metallicity of the extended emission line re-gions (e.g. Villar-Martın et al., 2000; De Breuck et al.,2000b). Their emission lines (especially Lyα) are oftenbright enough to derive information on the density andmetallicity of associated absorbers (van Ojik et al., 1997a;Binette et al., 2000; Jarvis et al., 2002).
The radio selection has the advantage of being insen-sitive to the dust properties, unlike optical selection tech-niques, which may miss heavily obscured systems. Suchobjects may be identified by their strong dust emissionat far-IR wavelengths. Early observations at 800 µm and1.2 mm by Dunlop et al. (1994) and Ivison (1995) de-tected strong thermal dust emission in the radio galax-ies 4C 41.17 (z = 3.8) and 8C 1425+635 (z = 4.25),suggesting that several HzRGs do indeed contain signifi-cant amounts of dust. Archibald et al. (2001) observed 471 < z < 4.4 radio galaxies at 850 µm using the SCUBAbolometer (Holland et al., 1999) on the JCMT. Even aftercorrecting for the strong negative k−correction effects onthe Rayleigh-Jeans tail of the thermal dust spectrum (e.g.Blain & Longair, 1993), they found a substantial increasein the 850 µm luminosity with redshift. This is confirmedby Reuland et al. (2003c), who detect more than half ofthe sources with SCUBA in a sample of 15 radio galax-ies at z > 3. Such a redshift dependence is not seen forquasars, whose mm and submm luminosity remains al-most unchanged between z ∼ 2 and z ∼ 4 (Omont et al.,2003; Priddey et al., 2003). From a matched sample of1.37 < z < 2.0 quasars and radio galaxies selected at151 MHz, Willott et al. (2002) found that the quasars areactually ∼
> 2 times brighter at submm wavelengths thanthe radio galaxies. They also find an anti-correlation be-tween the far-IR luminosity and radio size, and interpretthis as a synchronization between the jet-triggering eventand processes controlling the far-IR luminosity. A possibleexplanation for the difference between the (sub)mm red-shift evolution of radio galaxies and quasars could thenbe that HzRGs are more massive, leading to a longer(sub)mm-luminous phase due to a larger supply of gas.
The relatively bright submm flux densities of HzRGsimply that they contain dust masses of 108 − 109M⊙, as-suming standard conversion factors (see §4.2). The pres-ence of the AGN introduces an ambiguity on the mech-anism powering this dust emission: direct heating bythe AGN or heating by massive stars formed in star-bursts (e.g. Sanders & Mirabel, 1996; Carilli et al., 2000;Omont et al., 2001; Willott et al., 2002)? Although theAGN could easily introduce sufficient energy to producethis emission, an increasing number of authors have ar-gued that the starbursts are the dominating mechanism(e.g. Rowan-Robinson, 2000; Tadhunter et al., 2002). Astrong argument in favour of the starburst origin is thedetection of dust and CO emission from regions severaltens of kpc away from the AGN (Omont et al., 1996;Papadopoulos et al., 2000). The high gas masses inferredfrom the CO detections could then be the likely reser-voirs feeding these massive starbursts. The presence of
Carlos De Breuck et al.: CO emission and H I absorption in B3 J2330+3927. 3
CO in such reservoirs implies that they must be (at leastpartially) metal enriched, which is consistent with the re-cent detection of ionized metal lines at scales of severaltens of kpc in the z = 2.922 radio galaxy MRC 0943−242(Villar-Martın et al., 2003). These metals may have beendeposited by previous merger events, or by galaxy-scaleoutflows (e.g. Dawson et al., 2002).
These large dust and molecular gas masses are rem-iniscent of the often huge Lyα haloes seen aroundHzRGs (e.g. van Ojik et al., 1996; Venemans et al.,2002; Villar-Martın et al., 2002; Reuland et al., 2003b).Moreover, K−band observations show that HzRGsare amongst the most massive galaxies known ateach redshift (e.g. Best, Longair, & Rottgering, 1998;De Breuck et al., 2002). However, to date, the relation-ship between the different gas and dust components andthe AGN host galaxy has remained elusive. What is therole in the galaxy formation process of the extended Lyαhaloes and the associated absorbers seen in the rest-frameUV emission lines? Are they composed of primordial ma-terial, or have they been enriched by material from thehost galaxy? Are the dust and CO reservoirs in any waylinked to these?
In this paper, we report the discovery of dust and COemission in the z = 3.087 radio galaxy B3 J2330+3927.This is only the third z > 3 radio galaxy where COhas been detected, after 4C 60.07 and 6C 1908+7220(z = 3.791 and z = 3.532; Papadopoulos et al., 2000),and despite several intensive searches (Evans et al., 1996;van Ojik et al., 1997b). Moreover, the CO emission is co-incident in velocity space with associated H I absorptionin the Lyα line. This shows for the first time that these dif-ferent components are indeed physically related, and tracea massive reservoir surrounding the AGN host galaxy.
Throughout this paper, we use a cosmology with aΛ−dominated Universe with H0 = 65h65 km s−1 Mpc−1,ΩM = 0.3 and ΩΛ = 0.7. At z = 3.087, the luminosity dis-tance is DL = 28.34h−1
65 Gpc = 8.74× 1026h−165 m, and 1′′
corresponds to 8.2 kpc. For comparison, in a flat Universewith H0 = 65h65 km s−1 Mpc−1, ΩM = 1.0 and ΩΛ = 0.0,DL = 19.07h−1
65 Gpc, and 1′′ corresponds to 5.5 kpc.
2. Observations and data reduction
2.1. Source selection
Vigotti et al. (1999) defined the B3-VLA sample with theaim of constructing a homogeneous spectral database fora sample of 1049 radio sources, containing flux densitiesin the range 151 MHz to 10.6 GHz. From this sample,we selected 104 sources with steep optical spectra (α <−1;S ∝ να), which remained undetected on the PalomarObservatory Sky Survey. Such sources are known to begood candidates to find HzRGs (e.g. De Breuck et al.,2000a). We first identify the host galaxies of these candi-dates in sensitive optical or near-IR images, followed byoptical spectroscopy to determine their redshift. In the fol-lowing, we report on one of these sources, B3 J2330+3927.
2.2. Optical and Near-IR Imaging and Spectroscopy
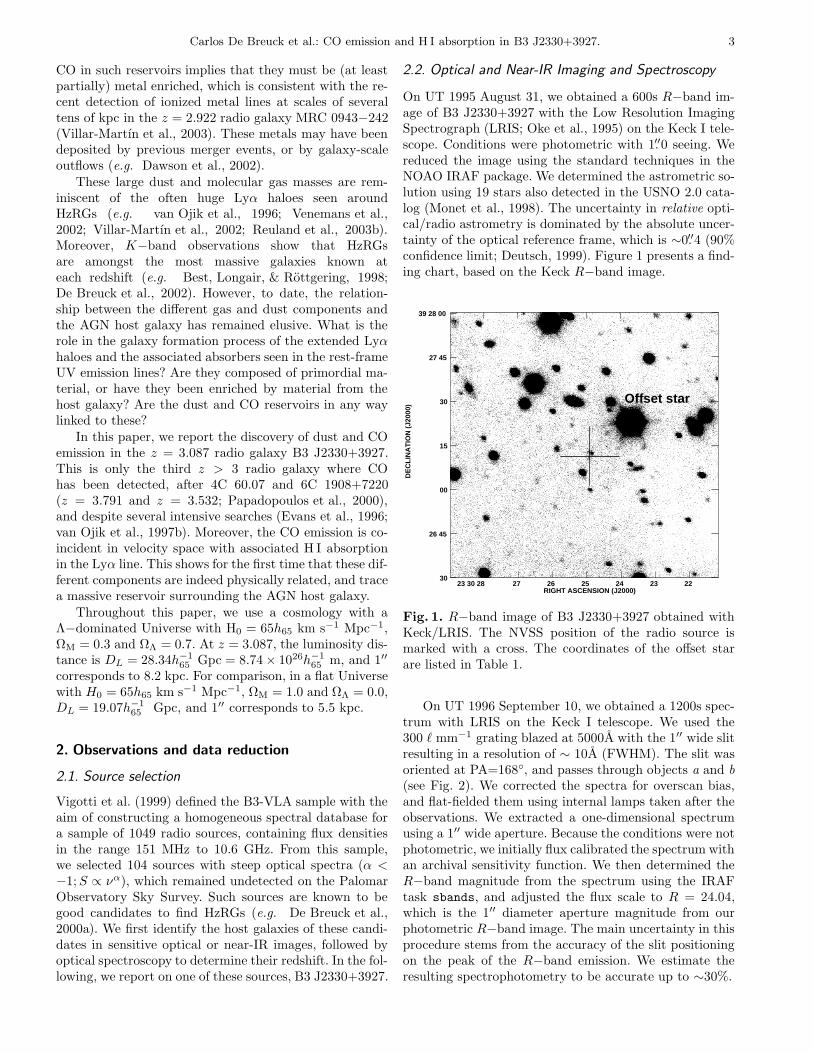
On UT 1995 August 31, we obtained a 600s R−band im-age of B3 J2330+3927 with the Low Resolution ImagingSpectrograph (LRIS; Oke et al., 1995) on the Keck I tele-scope. Conditions were photometric with 1.′′0 seeing. Wereduced the image using the standard techniques in theNOAO IRAF package. We determined the astrometric so-lution using 19 stars also detected in the USNO 2.0 cata-log (Monet et al., 1998). The uncertainty in relative opti-cal/radio astrometry is dominated by the absolute uncer-tainty of the optical reference frame, which is ∼0.′′4 (90%confidence limit; Deutsch, 1999). Figure 1 presents a find-ing chart, based on the Keck R−band image.
DE
CL
INA
TIO
N (
J200
0)
RIGHT ASCENSION (J2000)23 30 28 27 26 25 24 23 22
39 28 00
27 45
30
15
00
26 45
30
Offset star
Fig. 1. R−band image of B3 J2330+3927 obtained withKeck/LRIS. The NVSS position of the radio source ismarked with a cross. The coordinates of the offset starare listed in Table 1.
On UT 1996 September 10, we obtained a 1200s spec-trum with LRIS on the Keck I telescope. We used the300 ℓ mm−1 grating blazed at 5000A with the 1′′ wide slitresulting in a resolution of ∼ 10A (FWHM). The slit wasoriented at PA=168, and passes through objects a and b
(see Fig. 2). We corrected the spectra for overscan bias,and flat-fielded them using internal lamps taken after theobservations. We extracted a one-dimensional spectrumusing a 1′′ wide aperture. Because the conditions were notphotometric, we initially flux calibrated the spectrum withan archival sensitivity function. We then determined theR−band magnitude from the spectrum using the IRAFtask sbands, and adjusted the flux scale to R = 24.04,which is the 1′′ diameter aperture magnitude from ourphotometric R−band image. The main uncertainty in thisprocedure stems from the accuracy of the slit positioningon the peak of the R−band emission. We estimate theresulting spectrophotometry to be accurate up to ∼30%.
4 Carlos De Breuck et al.: CO emission and H I absorption in B3 J2330+3927.
On UT 1997 September 12, we obtained near-IR imag-ing with NIRC (Matthews et al., 1994) on the Keck I tele-scope. Conditions were photometric with 0.′′45 seeing inKS−band. The total integration time of the KS−imagewas 1140s. Observing procedures, calibration and datareduction techniques were similar to those described byDe Breuck et al. (2002). To determine the astrometric so-lution, we used 16 stars also detected in our LRIS R−bandimage. We estimate the relative near-IR/radio astrometricuncertainty to be ∼0.′′5.
Following the KS−band imaging, we also obtainednear-IR spectroscopy with NIRC. We used the gr120 grismin combination with the HK−filter. The position angleon the sky was 302, and includes only object a. Thisposition angle was dictated by the need for a sufficientlybright guide star in the offset guider. The dispersion was∼60 A/pix, and the slit width was 0.′′68, resulting in a res-olution of ∼240 A (FWHM). We obtained 10 exposures of180s each. We discarded two exposures which were use-less due to poor seeing and/or high sky background vari-ability. The total integration time is thus 1440s. We re-duced the spectra following the procedures described byDe Breuck et al. (1998). We extracted a one-dimensionalspectrum using a 1.′′2 wide aperture. Because no near-IRline-lamps were available, we used the dispersion formulalisted in the NIRC manual to wavelength calibrate thespectrum. This does not allow an independent estimateof the uncertainties in the calibration, but a comparisonof the 3 detected emission lines with the optical spec-trum suggests it is accurate up to ∼ 70 A. To correctfor atmospheric absorption lines, we divided the spec-trum by the atmospheric transmission curve for MaunaKea, produced using the program IRTRANS41. To fluxcalibrate the spectrum, we used a spectrum of the A0star HD220750, which was obtained immediately subse-quent to our B3 J2330+3927 observations. We reducedthis spectrum in the same way as B3 J2330+3927. Toconstruct a sensitivity function, we assumed HD220750has a blackbody spectrum with Teff =9850 K implyingV − K = −0.03 (Johnson, 1966). Using V = 7.01 fromthe SIMBAD database, this provides a first order flux cal-ibration. To refine the absolute flux calibration, we deter-mined the KS−band magnitude from the spectrum us-ing the IRAF task sbands, and adjusted the flux scale toK = 19.18, which is the 1′′ diameter aperture magnitudefrom our photometric KS−band image.
We corrected both the optical and near-IR spectra forGalactic reddening using the Cardelli, Clayton, & Mathis(1989) extinction curve with AV = 0.39, as determinedfrom the dust maps of Schlegel, Finkbeiner, & Davis(1998).
1 This curve is available on the UKIRT world wide webpages.
2.3. VLA radio imaging
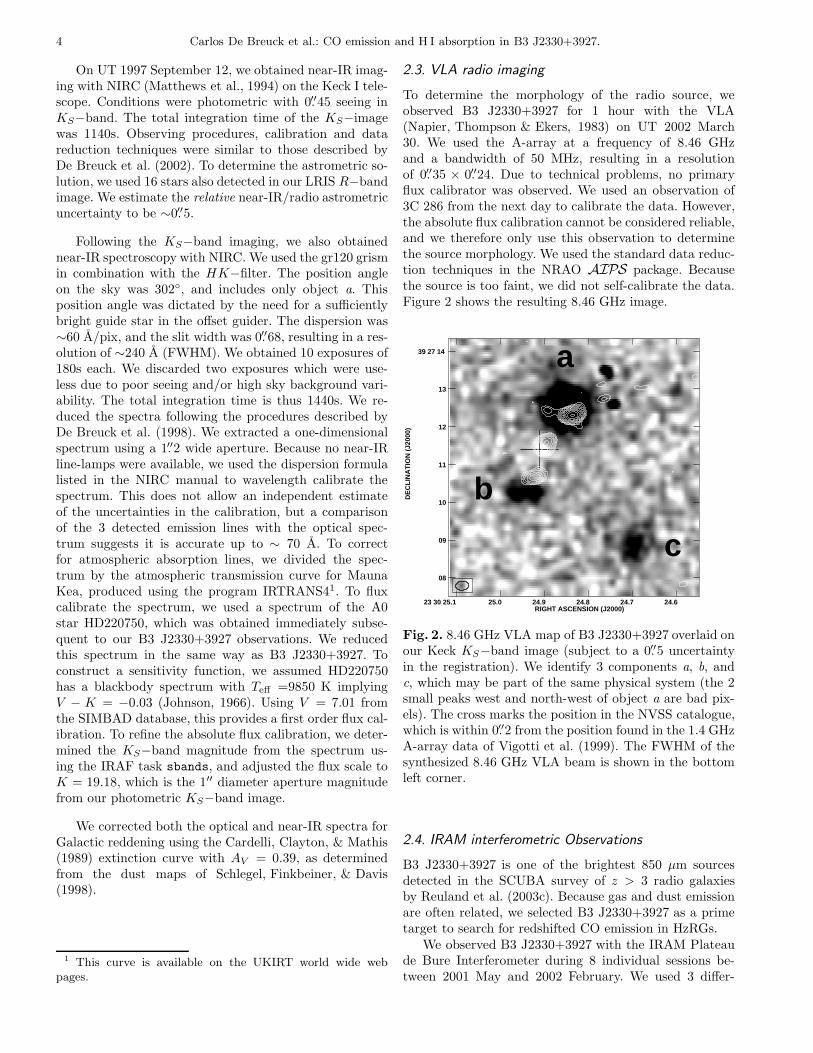
To determine the morphology of the radio source, weobserved B3 J2330+3927 for 1 hour with the VLA(Napier, Thompson & Ekers, 1983) on UT 2002 March30. We used the A-array at a frequency of 8.46 GHzand a bandwidth of 50 MHz, resulting in a resolutionof 0.′′35 × 0.′′24. Due to technical problems, no primaryflux calibrator was observed. We used an observation of3C 286 from the next day to calibrate the data. However,the absolute flux calibration cannot be considered reliable,and we therefore only use this observation to determinethe source morphology. We used the standard data reduc-tion techniques in the NRAO AIPS package. Becausethe source is too faint, we did not self-calibrate the data.Figure 2 shows the resulting 8.46 GHz image.
DE
CL
INA
TIO
N (
J200
0)
RIGHT ASCENSION (J2000)23 30 25.1 25.0 24.9 24.8 24.7 24.6
39 27 14
13
12
11
10
09
08
a
b
c
Fig. 2. 8.46 GHz VLA map of B3 J2330+3927 overlaid onour Keck KS−band image (subject to a 0.′′5 uncertaintyin the registration). We identify 3 components a, b, andc, which may be part of the same physical system (the 2small peaks west and north-west of object a are bad pix-els). The cross marks the position in the NVSS catalogue,which is within 0.′′2 from the position found in the 1.4 GHzA-array data of Vigotti et al. (1999). The FWHM of thesynthesized 8.46 GHz VLA beam is shown in the bottomleft corner.
2.4. IRAM interferometric Observations
B3 J2330+3927 is one of the brightest 850 µm sourcesdetected in the SCUBA survey of z > 3 radio galaxiesby Reuland et al. (2003c). Because gas and dust emissionare often related, we selected B3 J2330+3927 as a primetarget to search for redshifted CO emission in HzRGs.
We observed B3 J2330+3927 with the IRAM Plateaude Bure Interferometer during 8 individual sessions be-tween 2001 May and 2002 February. We used 3 differ-
Carlos De Breuck et al.: CO emission and H I absorption in B3 J2330+3927. 5
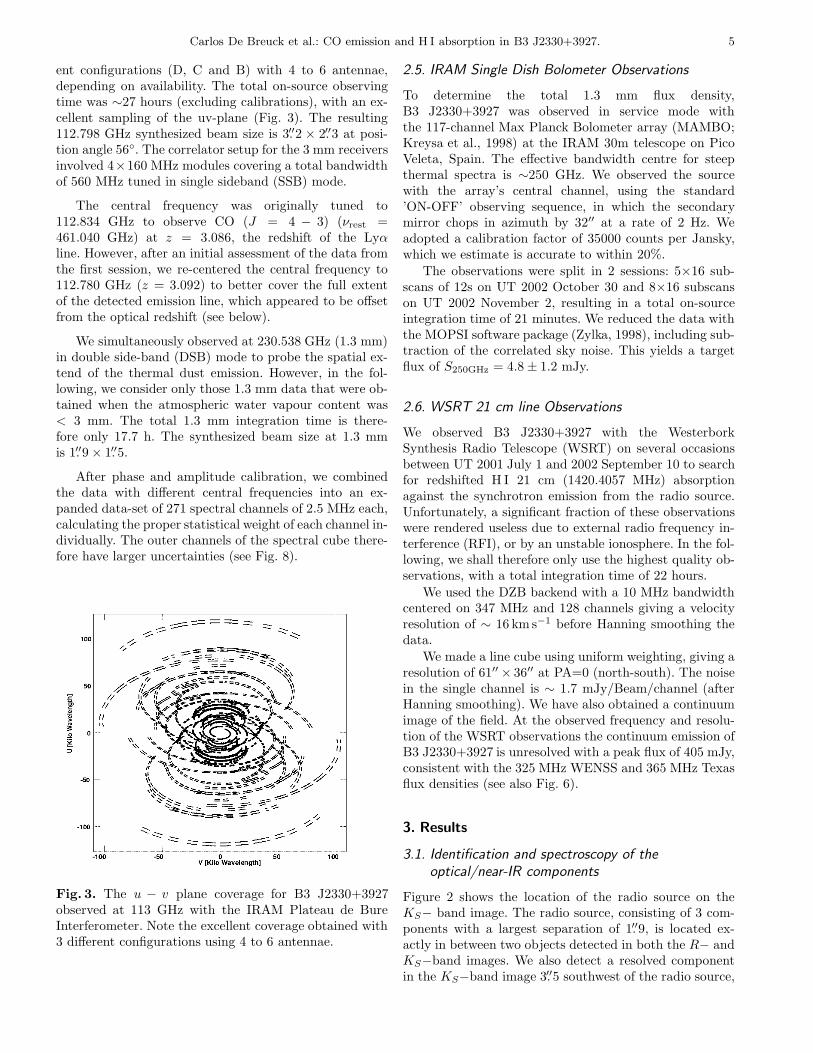
ent configurations (D, C and B) with 4 to 6 antennae,depending on availability. The total on-source observingtime was ∼27 hours (excluding calibrations), with an ex-cellent sampling of the uv-plane (Fig. 3). The resulting112.798 GHz synthesized beam size is 3.′′2 × 2.′′3 at posi-tion angle 56. The correlator setup for the 3 mm receiversinvolved 4×160 MHz modules covering a total bandwidthof 560 MHz tuned in single sideband (SSB) mode.
The central frequency was originally tuned to112.834 GHz to observe CO (J = 4 − 3) (νrest =461.040 GHz) at z = 3.086, the redshift of the Lyαline. However, after an initial assessment of the data fromthe first session, we re-centered the central frequency to112.780 GHz (z = 3.092) to better cover the full extentof the detected emission line, which appeared to be offsetfrom the optical redshift (see below).
We simultaneously observed at 230.538 GHz (1.3 mm)in double side-band (DSB) mode to probe the spatial ex-tend of the thermal dust emission. However, in the fol-lowing, we consider only those 1.3 mm data that were ob-tained when the atmospheric water vapour content was< 3 mm. The total 1.3 mm integration time is there-fore only 17.7 h. The synthesized beam size at 1.3 mmis 1.′′9× 1.′′5.
After phase and amplitude calibration, we combinedthe data with different central frequencies into an ex-panded data-set of 271 spectral channels of 2.5 MHz each,calculating the proper statistical weight of each channel in-dividually. The outer channels of the spectral cube there-fore have larger uncertainties (see Fig. 8).
Fig. 3. The u − v plane coverage for B3 J2330+3927observed at 113 GHz with the IRAM Plateau de BureInterferometer. Note the excellent coverage obtained with3 different configurations using 4 to 6 antennae.
2.5. IRAM Single Dish Bolometer Observations
To determine the total 1.3 mm flux density,B3 J2330+3927 was observed in service mode withthe 117-channel Max Planck Bolometer array (MAMBO;Kreysa et al., 1998) at the IRAM 30m telescope on PicoVeleta, Spain. The effective bandwidth centre for steepthermal spectra is ∼250 GHz. We observed the sourcewith the array’s central channel, using the standard’ON-OFF’ observing sequence, in which the secondarymirror chops in azimuth by 32′′ at a rate of 2 Hz. Weadopted a calibration factor of 35000 counts per Jansky,which we estimate is accurate to within 20%.
The observations were split in 2 sessions: 5×16 sub-scans of 12s on UT 2002 October 30 and 8×16 subscanson UT 2002 November 2, resulting in a total on-sourceintegration time of 21 minutes. We reduced the data withthe MOPSI software package (Zylka, 1998), including sub-traction of the correlated sky noise. This yields a targetflux of S250GHz = 4.8± 1.2 mJy.
2.6. WSRT 21 cm line Observations
We observed B3 J2330+3927 with the WesterborkSynthesis Radio Telescope (WSRT) on several occasionsbetween UT 2001 July 1 and 2002 September 10 to searchfor redshifted H I 21 cm (1420.4057 MHz) absorptionagainst the synchrotron emission from the radio source.Unfortunately, a significant fraction of these observationswere rendered useless due to external radio frequency in-terference (RFI), or by an unstable ionosphere. In the fol-lowing, we shall therefore only use the highest quality ob-servations, with a total integration time of 22 hours.
We used the DZB backend with a 10 MHz bandwidthcentered on 347 MHz and 128 channels giving a velocityresolution of ∼ 16 km s−1 before Hanning smoothing thedata.
We made a line cube using uniform weighting, giving aresolution of 61′′ × 36′′ at PA=0 (north-south). The noisein the single channel is ∼ 1.7 mJy/Beam/channel (afterHanning smoothing). We have also obtained a continuumimage of the field. At the observed frequency and resolu-tion of the WSRT observations the continuum emission ofB3 J2330+3927 is unresolved with a peak flux of 405 mJy,consistent with the 325 MHz WENSS and 365 MHz Texasflux densities (see also Fig. 6).
3. Results
3.1. Identification and spectroscopy of theoptical/near-IR components
Figure 2 shows the location of the radio source on theKS− band image. The radio source, consisting of 3 com-ponents with a largest separation of 1.′′9, is located ex-actly in between two objects detected in both the R− andKS−band images. We also detect a resolved componentin the KS−band image 3.′′5 southwest of the radio source,
6 Carlos De Breuck et al.: CO emission and H I absorption in B3 J2330+3927.
Table 1. Astrometry and photometry (in 2′′ apertures)of the optical/near-IR components of B3 J2330+3927.
Object RA(J2000) DEC(J2000) R(mag) KS(mag)
a 23h30m24.s85 3927′12.′′6 23.08±0.12 18.79±0.03
b 23h30m24.s94 3927′10.′′3 24.18±0.22 20.76±0.11
c 23h30m24.s70 3927′08.′′9 >25 20.70±0.10
Offset 23h30m23.s71 3927′22.′′8 15.3 14.4±0.2
CO peak 23h30m24.s84 3927′12.′′2
which may be related. Table 1 lists the positions and pho-tometry of these 3 components, which we label as a, b,and c.
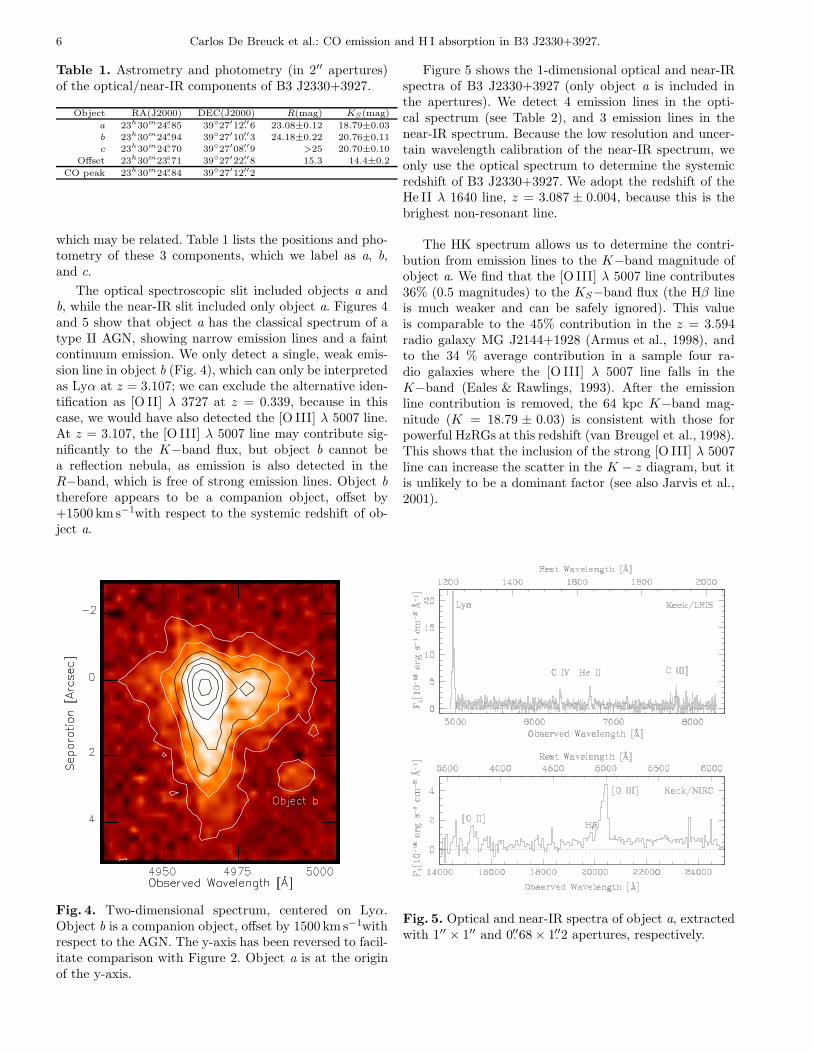
The optical spectroscopic slit included objects a andb, while the near-IR slit included only object a. Figures 4and 5 show that object a has the classical spectrum of atype II AGN, showing narrow emission lines and a faintcontinuum emission. We only detect a single, weak emis-sion line in object b (Fig. 4), which can only be interpretedas Lyα at z = 3.107; we can exclude the alternative iden-tification as [O II] λ 3727 at z = 0.339, because in thiscase, we would have also detected the [O III] λ 5007 line.At z = 3.107, the [O III] λ 5007 line may contribute sig-nificantly to the K−band flux, but object b cannot bea reflection nebula, as emission is also detected in theR−band, which is free of strong emission lines. Object b
therefore appears to be a companion object, offset by+1500 km s−1with respect to the systemic redshift of ob-ject a.
Fig. 4. Two-dimensional spectrum, centered on Lyα.Object b is a companion object, offset by 1500 km s−1withrespect to the AGN. The y-axis has been reversed to facil-itate comparison with Figure 2. Object a is at the originof the y-axis.
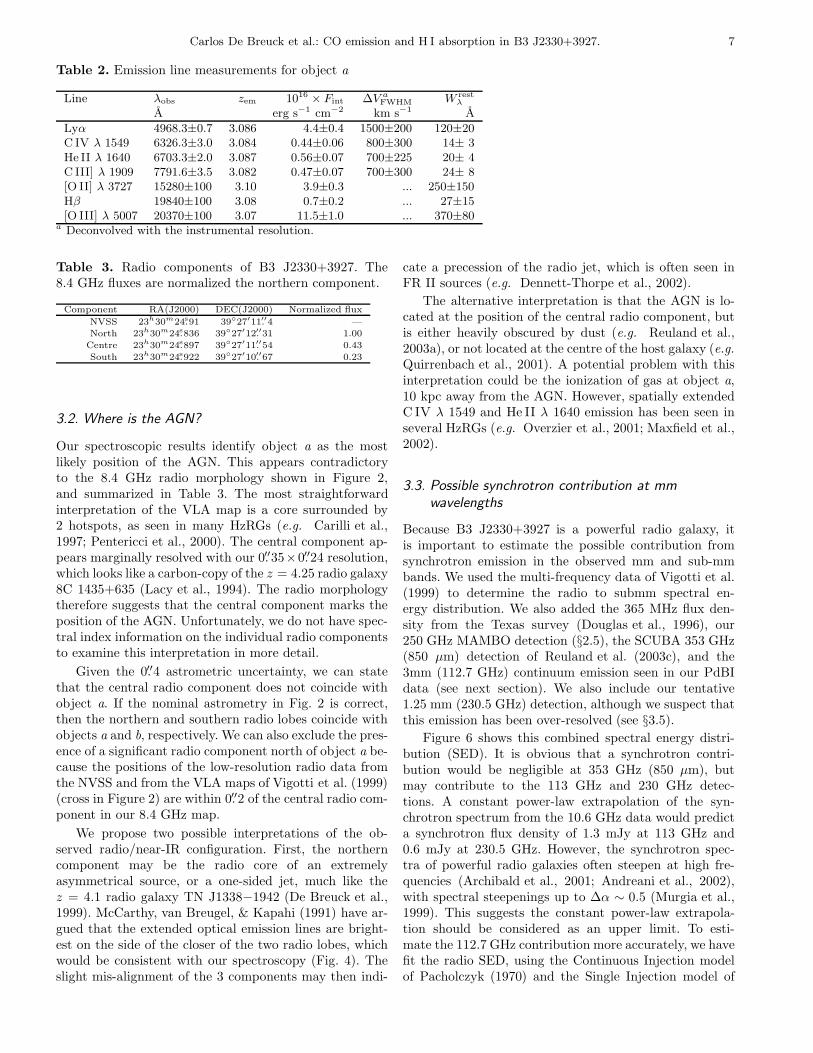
Figure 5 shows the 1-dimensional optical and near-IRspectra of B3 J2330+3927 (only object a is included inthe apertures). We detect 4 emission lines in the opti-cal spectrum (see Table 2), and 3 emission lines in thenear-IR spectrum. Because the low resolution and uncer-tain wavelength calibration of the near-IR spectrum, weonly use the optical spectrum to determine the systemicredshift of B3 J2330+3927. We adopt the redshift of theHe II λ 1640 line, z = 3.087 ± 0.004, because this is thebrighest non-resonant line.
The HK spectrum allows us to determine the contri-bution from emission lines to the K−band magnitude ofobject a. We find that the [O III] λ 5007 line contributes36% (0.5 magnitudes) to the KS−band flux (the Hβ lineis much weaker and can be safely ignored). This valueis comparable to the 45% contribution in the z = 3.594radio galaxy MG J2144+1928 (Armus et al., 1998), andto the 34 % average contribution in a sample four ra-dio galaxies where the [O III] λ 5007 line falls in theK−band (Eales & Rawlings, 1993). After the emissionline contribution is removed, the 64 kpc K−band mag-nitude (K = 18.79 ± 0.03) is consistent with those forpowerful HzRGs at this redshift (van Breugel et al., 1998).This shows that the inclusion of the strong [O III] λ 5007line can increase the scatter in the K − z diagram, but itis unlikely to be a dominant factor (see also Jarvis et al.,2001).
Fig. 5. Optical and near-IR spectra of object a, extractedwith 1′′ × 1′′ and 0.′′68× 1.′′2 apertures, respectively.
Carlos De Breuck et al.: CO emission and H I absorption in B3 J2330+3927. 7
Table 2. Emission line measurements for object a
Line λobs zem 1016 × Fint ∆V a
FWHM W restλ
A erg s−1 cm−2 km s−1 A
Lyα 4968.3±0.7 3.086 4.4±0.4 1500±200 120±20C IV λ 1549 6326.3±3.0 3.084 0.44±0.06 800±300 14± 3He II λ 1640 6703.3±2.0 3.087 0.56±0.07 700±225 20± 4C III] λ 1909 7791.6±3.5 3.082 0.47±0.07 700±300 24± 8[O II] λ 3727 15280±100 3.10 3.9±0.3 ... 250±150Hβ 19840±100 3.08 0.7±0.2 ... 27±15[O III] λ 5007 20370±100 3.07 11.5±1.0 ... 370±80
a Deconvolved with the instrumental resolution.
Table 3. Radio components of B3 J2330+3927. The8.4 GHz fluxes are normalized the northern component.
Component RA(J2000) DEC(J2000) Normalized flux
NVSS 23h30m24.s91 3927′11.′′4 —
North 23h30m24.s836 3927′12.′′31 1.00
Centre 23h30m24.s897 3927′11.′′54 0.43
South 23h30m24.s922 3927′10.′′67 0.23
3.2. Where is the AGN?
Our spectroscopic results identify object a as the mostlikely position of the AGN. This appears contradictoryto the 8.4 GHz radio morphology shown in Figure 2,and summarized in Table 3. The most straightforwardinterpretation of the VLA map is a core surrounded by2 hotspots, as seen in many HzRGs (e.g. Carilli et al.,1997; Pentericci et al., 2000). The central component ap-pears marginally resolved with our 0.′′35×0.′′24 resolution,which looks like a carbon-copy of the z = 4.25 radio galaxy8C 1435+635 (Lacy et al., 1994). The radio morphologytherefore suggests that the central component marks theposition of the AGN. Unfortunately, we do not have spec-tral index information on the individual radio componentsto examine this interpretation in more detail.
Given the 0.′′4 astrometric uncertainty, we can statethat the central radio component does not coincide withobject a. If the nominal astrometry in Fig. 2 is correct,then the northern and southern radio lobes coincide withobjects a and b, respectively. We can also exclude the pres-ence of a significant radio component north of object a be-cause the positions of the low-resolution radio data fromthe NVSS and from the VLA maps of Vigotti et al. (1999)(cross in Figure 2) are within 0.′′2 of the central radio com-ponent in our 8.4 GHz map.
We propose two possible interpretations of the ob-served radio/near-IR configuration. First, the northerncomponent may be the radio core of an extremelyasymmetrical source, or a one-sided jet, much like thez = 4.1 radio galaxy TN J1338−1942 (De Breuck et al.,1999). McCarthy, van Breugel, & Kapahi (1991) have ar-gued that the extended optical emission lines are bright-est on the side of the closer of the two radio lobes, whichwould be consistent with our spectroscopy (Fig. 4). Theslight mis-alignment of the 3 components may then indi-
cate a precession of the radio jet, which is often seen inFR II sources (e.g. Dennett-Thorpe et al., 2002).
The alternative interpretation is that the AGN is lo-cated at the position of the central radio component, butis either heavily obscured by dust (e.g. Reuland et al.,2003a), or not located at the centre of the host galaxy (e.g.Quirrenbach et al., 2001). A potential problem with thisinterpretation could be the ionization of gas at object a,10 kpc away from the AGN. However, spatially extendedC IV λ 1549 and He II λ 1640 emission has been seen inseveral HzRGs (e.g. Overzier et al., 2001; Maxfield et al.,2002).
3.3. Possible synchrotron contribution at mmwavelengths
Because B3 J2330+3927 is a powerful radio galaxy, itis important to estimate the possible contribution fromsynchrotron emission in the observed mm and sub-mmbands. We used the multi-frequency data of Vigotti et al.(1999) to determine the radio to submm spectral en-ergy distribution. We also added the 365 MHz flux den-sity from the Texas survey (Douglas et al., 1996), our250 GHz MAMBO detection (§2.5), the SCUBA 353 GHz(850 µm) detection of Reuland et al. (2003c), and the3mm (112.7 GHz) continuum emission seen in our PdBIdata (see next section). We also include our tentative1.25 mm (230.5 GHz) detection, although we suspect thatthis emission has been over-resolved (see §3.5).
Figure 6 shows this combined spectral energy distri-bution (SED). It is obvious that a synchrotron contri-bution would be negligible at 353 GHz (850 µm), butmay contribute to the 113 GHz and 230 GHz detec-tions. A constant power-law extrapolation of the syn-chrotron spectrum from the 10.6 GHz data would predicta synchrotron flux density of 1.3 mJy at 113 GHz and0.6 mJy at 230.5 GHz. However, the synchrotron spec-tra of powerful radio galaxies often steepen at high fre-quencies (Archibald et al., 2001; Andreani et al., 2002),with spectral steepenings up to ∆α ∼ 0.5 (Murgia et al.,1999). This suggests the constant power-law extrapola-tion should be considered as an upper limit. To esti-mate the 112.7 GHz contribution more accurately, we havefit the radio SED, using the Continuous Injection modelof Pacholczyk (1970) and the Single Injection model of
8 Carlos De Breuck et al.: CO emission and H I absorption in B3 J2330+3927.
Jaffe & Perola (1973). Even with the latter model (whichleads to an exponential steepening of the spectrum at highfrequency), we found that the minimum flux density pre-dicted for the 112.7 GHz point is ∼ 0.6 − 0.8 mJy. Moreobservations between 10.6 GHz and 113 GHz would beneeded to predict this contribution more accurately.
Note that these values refer to the integrated flux den-sity of the radio source. However, Figure 2 shows that theradio source is resolved into three components, which ap-pear to have roughly similar flux densities at 8.4 GHz.Unfortunately, we do not have spectral index informa-tion of the individual components, but in most radiogalaxies, the outer lobes have steeper spectra than thecore (Carilli et al., 1997; Pentericci et al., 2000), althoughsources with relatively steep spectrum cores have also beenseen at high redshift (Athreya et al., 1997). The orienta-tion of the 112.7 GHz PdBI synthesized beam is roughlyperpendicular to the radio axis, which means we shouldslightly resolve the synchrotron component at 112.7 GHz.Depending on the spectral index of the northern hotspot,this further reduces the synchrotron contribution at theposition of the AGN to ∼
< 0.5 mJy.
Fig. 6. Radio to submm spectral energy distribution ofB3 J2330+3927. The solid line is a modified black bodycurve with T = 50 K and β = 1.5, normalized at352 GHz. The 230.538 GHz PdBI measurement severelyover-resolves the thermal dust emission.
3.4. Identification of the CO emission
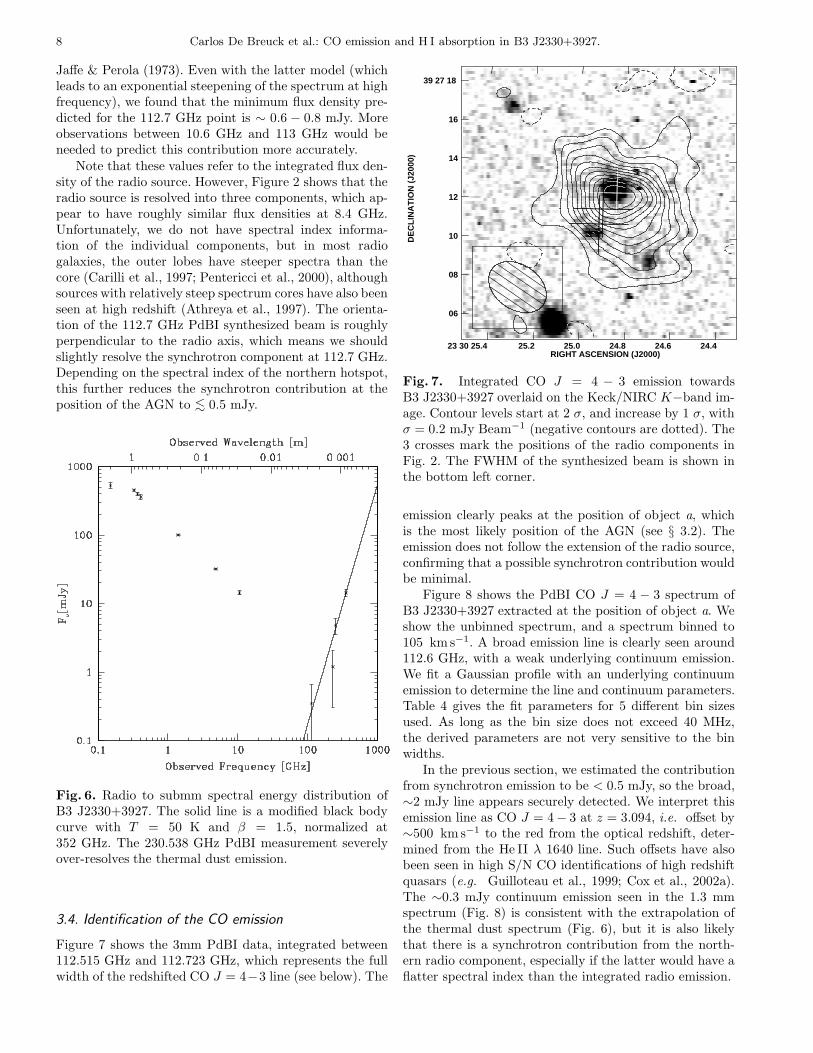
Figure 7 shows the 3mm PdBI data, integrated between112.515 GHz and 112.723 GHz, which represents the fullwidth of the redshifted CO J = 4−3 line (see below). The
DE
CL
INA
TIO
N (
J200
0)
RIGHT ASCENSION (J2000)23 30 25.4 25.2 25.0 24.8 24.6 24.4
39 27 18
16
14
12
10
08
06
Fig. 7. Integrated CO J = 4 − 3 emission towardsB3 J2330+3927 overlaid on the Keck/NIRC K−band im-age. Contour levels start at 2 σ, and increase by 1 σ, withσ = 0.2 mJy Beam−1 (negative contours are dotted). The3 crosses mark the positions of the radio components inFig. 2. The FWHM of the synthesized beam is shown inthe bottom left corner.
emission clearly peaks at the position of object a, whichis the most likely position of the AGN (see § 3.2). Theemission does not follow the extension of the radio source,confirming that a possible synchrotron contribution wouldbe minimal.
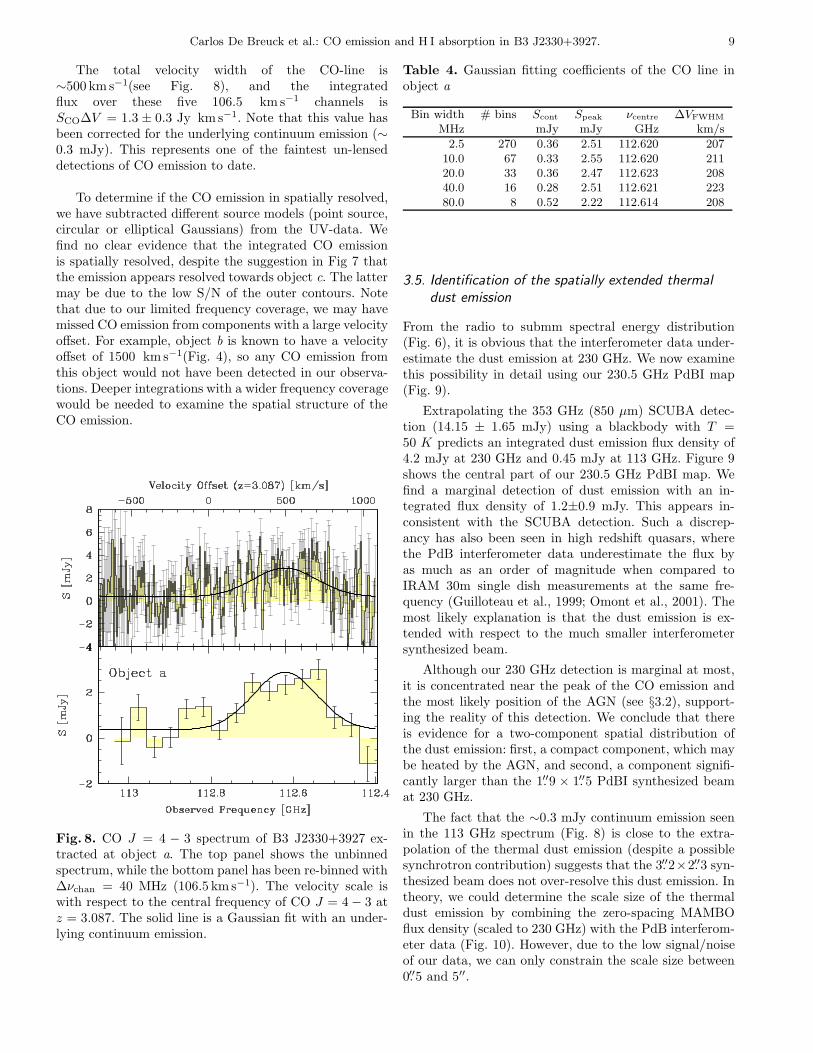
Figure 8 shows the PdBI CO J = 4 − 3 spectrum ofB3 J2330+3927 extracted at the position of object a. Weshow the unbinned spectrum, and a spectrum binned to105 km s−1. A broad emission line is clearly seen around112.6 GHz, with a weak underlying continuum emission.We fit a Gaussian profile with an underlying continuumemission to determine the line and continuum parameters.Table 4 gives the fit parameters for 5 different bin sizesused. As long as the bin size does not exceed 40 MHz,the derived parameters are not very sensitive to the binwidths.
In the previous section, we estimated the contributionfrom synchrotron emission to be < 0.5 mJy, so the broad,∼2 mJy line appears securely detected. We interpret thisemission line as CO J = 4− 3 at z = 3.094, i.e. offset by∼500 km s−1 to the red from the optical redshift, deter-mined from the He II λ 1640 line. Such offsets have alsobeen seen in high S/N CO identifications of high redshiftquasars (e.g. Guilloteau et al., 1999; Cox et al., 2002a).The ∼0.3 mJy continuum emission seen in the 1.3 mmspectrum (Fig. 8) is consistent with the extrapolation ofthe thermal dust spectrum (Fig. 6), but it is also likelythat there is a synchrotron contribution from the north-ern radio component, especially if the latter would have aflatter spectral index than the integrated radio emission.
Carlos De Breuck et al.: CO emission and H I absorption in B3 J2330+3927. 9
The total velocity width of the CO-line is∼500 km s−1(see Fig. 8), and the integratedflux over these five 106.5 km s−1 channels isSCO∆V = 1.3 ± 0.3 Jy km s−1. Note that this value hasbeen corrected for the underlying continuum emission (∼0.3 mJy). This represents one of the faintest un-lenseddetections of CO emission to date.
To determine if the CO emission in spatially resolved,we have subtracted different source models (point source,circular or elliptical Gaussians) from the UV-data. Wefind no clear evidence that the integrated CO emissionis spatially resolved, despite the suggestion in Fig 7 thatthe emission appears resolved towards object c. The lattermay be due to the low S/N of the outer contours. Notethat due to our limited frequency coverage, we may havemissed CO emission from components with a large velocityoffset. For example, object b is known to have a velocityoffset of 1500 km s−1(Fig. 4), so any CO emission fromthis object would not have been detected in our observa-tions. Deeper integrations with a wider frequency coveragewould be needed to examine the spatial structure of theCO emission.
Fig. 8. CO J = 4 − 3 spectrum of B3 J2330+3927 ex-tracted at object a. The top panel shows the unbinnedspectrum, while the bottom panel has been re-binned with∆νchan = 40 MHz (106.5 km s−1). The velocity scale iswith respect to the central frequency of CO J = 4− 3 atz = 3.087. The solid line is a Gaussian fit with an under-lying continuum emission.
Table 4. Gaussian fitting coefficients of the CO line inobject a
Bin width # bins Scont Speak νcentre ∆VFWHM
MHz mJy mJy GHz km/s
2.5 270 0.36 2.51 112.620 20710.0 67 0.33 2.55 112.620 21120.0 33 0.36 2.47 112.623 20840.0 16 0.28 2.51 112.621 22380.0 8 0.52 2.22 112.614 208
3.5. Identification of the spatially extended thermaldust emission
From the radio to submm spectral energy distribution(Fig. 6), it is obvious that the interferometer data under-estimate the dust emission at 230 GHz. We now examinethis possibility in detail using our 230.5 GHz PdBI map(Fig. 9).
Extrapolating the 353 GHz (850 µm) SCUBA detec-tion (14.15 ± 1.65 mJy) using a blackbody with T =50 K predicts an integrated dust emission flux density of4.2 mJy at 230 GHz and 0.45 mJy at 113 GHz. Figure 9shows the central part of our 230.5 GHz PdBI map. Wefind a marginal detection of dust emission with an in-tegrated flux density of 1.2±0.9 mJy. This appears in-consistent with the SCUBA detection. Such a discrep-ancy has also been seen in high redshift quasars, wherethe PdB interferometer data underestimate the flux byas much as an order of magnitude when compared toIRAM 30m single dish measurements at the same fre-quency (Guilloteau et al., 1999; Omont et al., 2001). Themost likely explanation is that the dust emission is ex-tended with respect to the much smaller interferometersynthesized beam.
Although our 230 GHz detection is marginal at most,it is concentrated near the peak of the CO emission andthe most likely position of the AGN (see §3.2), support-ing the reality of this detection. We conclude that thereis evidence for a two-component spatial distribution ofthe dust emission: first, a compact component, which maybe heated by the AGN, and second, a component signifi-cantly larger than the 1.′′9 × 1.′′5 PdBI synthesized beamat 230 GHz.
The fact that the ∼0.3 mJy continuum emission seenin the 113 GHz spectrum (Fig. 8) is close to the extra-polation of the thermal dust emission (despite a possiblesynchrotron contribution) suggests that the 3.′′2×2.′′3 syn-thesized beam does not over-resolve this dust emission. Intheory, we could determine the scale size of the thermaldust emission by combining the zero-spacing MAMBOflux density (scaled to 230 GHz) with the PdB interferom-eter data (Fig. 10). However, due to the low signal/noiseof our data, we can only constrain the scale size between0.′′5 and 5′′.

10 Carlos De Breuck et al.: CO emission and H I absorption in B3 J2330+3927.
DE
CL
INA
TIO
N (
J200
0)
RIGHT ASCENSION (J2000)23 30 25.4 25.2 25.0 24.8 24.6 24.4
39 27 18
16
14
12
10
08
06
Fig. 9. IRAM PdBI 230.5 GHz (1.3 mm) map ofB3 J2330+3927 overlaid on the Keck/NIRC K−band im-age. Contour levels start at 1 σ, and increase by 1 σ, withσ = 0.45 mJy Beam−1 (negative contours are dotted).The 3 crosses mark the positions of the radio componentsin Fig. 2. The FWHM of the synthesized beam is shownin the bottom left corner.
3.6. No H I 21 cm absorption
Despite our deep and repeated WSRT observations,we have not been able to convincingly detect H I21 cm absorption against the radio source. This isconsistent with unsuccessful WSRT searches in 6HzRGs (Rottgering, de Bruyn, & Pentericci, 1999).To date, H I 21 cm absorption has been solidlydetected in only one HzRG, viz. B2 0902+34(z = 3.3909 Uson, Bagri, & Cornwell, 1991;Briggs, Sorar, & Taramopoulos, 1993). This raisesthe question as to why B2 0902+34 stands out. One cluemay come from its bizarre radio morphology (Carilli,1995). Rottgering, de Bruyn, & Pentericci (1999) arguethat the H I is located in a kpc-sized disc, which canbe seen in absorption due to a fortuitous orientationof the radio source. They further suggest that a highcore fraction may characterize such orientations: 15%for B2 0902+34, compared to 0.6% and 2.9% for the 6HzRGs where no 21 cm absorption has been detected.However, in B3 J2330+3927, we find a core fraction of60% or 26% (see Table 3), depending if we adopt thenorthern or central radio component as the core (see§3.2). We conclude that the present sample of 8 HzRGswhere H I 21 cm absorption has been searched is clearlytoo small to address the origin of the absorbing neutralgas.
Fig. 10. Visibility amplitude versus baseline radius in thethe uv-plane for the 230 GHz PdB interferometer data(black/thin points), and the MAMBO/IRAM single dishdata (thick/red point) interpolated to 230 GHz. The solidline represents a point source of 1.8 mJy, the dotted/blueand dashed/magenta lines a circular Gaussian source witha FWHM of 0.′′5 and 5′′, respectively.
4. Mass estimates
The detection of the different emission and absorptioncomponents in B3 J2330+3927 suggests it is a massivesystem. In this section, we use the above data to derive 5independent mass estimates of the gas and dust compo-nents. We discuss each component separately, and sum-marize our results in Table 5. We note that several highredshift CO detections have been helped by gravitationallensing (for reviews, see Combes, Maoli, & Omont, 1999;Cox, Omont & Bertoldi, 2002b). However, from our radioand optical/near-IR imaging, we find no indications thatB3 J2330+3927 could be amplified by gravitational lens-ing, and we do not consider this in the following.
4.1. Molecular gas mass
We can estimate the molecular gas content from our COline detection by making an assumption for the standardconversion factor XCO = M(H2)/L
′CO(1 − 0), where
L′CO =
( c2
2k
)
SCO∆V ν−2obsD
2L(1 + z)−3 (1)
is the CO line luminosity measured in K km s−1 pc2
(Solomon, Downes, & Radford, 1992). The stan-dard value for Galactic molecular clouds isXCO = 4M⊙(K km s−1pc2)−1. However, there are strong
Carlos De Breuck et al.: CO emission and H I absorption in B3 J2330+3927. 11
indications from studies of extreme starbursts in ultra lu-minous infra-red galaxies (ULIRGs) that this value shouldbe considerably smaller for dense starbursts and AGN. Weshall therefore assume XCO ≈ 0.8 M⊙(K km s−1pc2)−1,as given by Downes & Solomon (1998).
Because we have observed the CO J = 4 − 3 transi-tion, we also need to estimate the (4−3)/(1−0) line ratior43. Papadopoulos et al. (2000) have used a large velocitygradient code to predict the r43 ratio in two radio galaxiesat similar redshifts as B3 J2330+3927. Using an interstel-lar matter environment similar to that of a local averagestarburst, they predict r43 = 0.45.
Following Solomon, Downes, & Radford (1992), wefind L′
CO(4− 3) = 3.9× 10¹⁰h−265 K kms−1 pc2. Inserting
the values given above, we find
M(H2) =
(
XCO
r34
)
L′CO(4− 3) ≈ 7h−2
65 × 1010M⊙.
This value is slightly lower than the ones found in the pre-vious two HzRGs, 4C 60.07 and 6C J1908+7220 (2.4 and1.35× 1011M⊙, respectively, in our adopted cosmology).
4.2. Dynamical mass from CO
Our PdBI CO data does not have sufficient S/N to de-rive detailed spatial and spectral information needed tofit models of rotating disks, such as those often seen inlocal ULIRGs and recently also at high redshift (z = 2.8;Genzel et al., 2003). However, we can derive a rough up-per limit on the dynamical mass by assuming that thesize of a possible rotating disk is smaller than the resolu-tion of our PdBI 113 GHz observations. Provided that theCO is effectively located in such a disk, this is probablyclose to the actual extent, given our estimated scale size ofthe dust emission, which is often correlated with the COemission.
Following Papadopoulos et al. (2000), the dynamicalmass Mdyn is then given by
Mdyn ≈ 1.16×10⁹
(
∆VFWHM
100 km s−1
)2(
L
kpc
)
(sin2 i)−1 M⊙, (2)
where i is the inclination of the disk. Adopting L < 25 kpcand ∆VFWHM = 220 km s−1, we find
Mdyn < 6.4× 10¹⁰(sin2 i)−1M⊙.
Although our estimates of M(H2) and Mdyn are very un-certain, this suggests that a substantial fraction of thetotal mass is in the form of molecular gas.
4.3. Dust mass
Figure 6 shows that the 850 µm flux of B3 J2330+3927 isalmost completely dominated by thermal dust emission.We can therefore estimate the dust mass Md using:
Md =SobsD
2L
(1 + z)κd(νrest)B(νrest, Td), (3)
with Sobs the observed flux density at a wavelength wherethe SED is dominated by thermal dust emission, κd(νrest)the rest-frequency mass absorption coefficient, B(νrest, Td)the Planck function for isothermal emission from dustgrains radiating at a temperature Td, and DL the lumi-nosity distance.
We need to make some assumptions for Td andκd(νrest). Because we observe the steep Rayleigh-Jeans tailof the dust distribution, a small change in the adopteddust temperature may cause a significant change in thederived dust mass (see e.g. Hughes, Dunlop, & Rawlings,1997; McMahon et al., 1999). The uncertainties in boththe SCUBA 850 µm and the MAMBO 1.3 mm flux den-sities cannot constrain Td tightly (see Fig. 6). We willtherefore adopt Td = 50 K, which has been used for mostother high redshift AGN (e.g. Papadopoulos et al., 2000;Archibald et al., 2001; Omont et al., 2001), and provides agood fit to the thermal part of the SED of B3 J2330+3927.
The rest-frame mass absorption coefficient κd(νrest)can be found by extrapolation from other frequencies us-ing κd ∝ νβ (Chini, Krugel, & Kreysa, 1986). This emis-sivity index β can be determined from multi-frequencyobservations covering the entire dust emission spectrum.However, such observations are scarce for high redshiftobjects, and assume that the dust emission is dominatedby a single temperature component. Because both β andTd determine the shape of the dust emission spectrum,their values are coupled (Priddey & McMahon, 2001). Thepublished values of β vary between β = 1.3 for Td =36 K (Dunne et al., 2000) and β = 1.95 for Td = 41 K(Priddey & McMahon, 2001). We shall adopt the inter-mediate value of β = 1.5 for Td = 50 K (Benford et al.,1999). These values are consistent with our 113 GHz to352 GHz measurements (Fig. 6).
The value of κd depends on the composition of thedust grains. The estimates of κd normalized to 850 µmusing β = 1.5 vary between κd(850µm) = 0.04 m2kg−1
(Draine & Lee, 1984) and κd(850µm) = 0.3 m2kg−1
(Mathis & Whiffen, 1989). We shall normalize to an inter-mediate value of κd(850µm) = 0.11 m2kg−1 (Hildebrand,1983).
Using these values and S850µm = 14.15 ± 1.65 mJy(Reuland et al., 2003c), we find
Md ≈ 9× 10⁷h−265
(
0.11
κd(850µm)
)
F (Td) M⊙,
with F (Td) = (exp[hν/kTd]− 1)/(exp[hν/k · 50K]− 1).Comparing with the molecular gas mass estimate, this
yields a gas-to-dust ratio
M(H2)
Md≈
850
F (Td)
(
0.11
κd(850µm)
)
.
This is comparable with values found in otherHzRGs (Papadopoulos et al., 2000) and ULIRGs(Sanders, Scoville, & Soifer, 1991). Alternatively, wecan also compare the CO and 850µm fluxes, yielding acomparison that is independent of the assumed param-eters. We find ∆V S(CO)/S800µm = 92 km s−1, again
12 Carlos De Breuck et al.: CO emission and H I absorption in B3 J2330+3927.
similar to the values found in the 2 HzRGs observedby Papadopoulos et al. (2000), the 3σ limit in 53W002(Alloin, Barvainis, & Guilloteau, 2000), and high redshiftquasars (Cox, Omont & Bertoldi, 2002b). This indicatesa standard gas/dust ratio in B3 J2330+3927.
4.4. Ionized gas and associated H I absorption in Lyα
Figure 4 shows the complex velocity structure of the Lyαline. The emission spatially extends well beyond the ra-dio lobes. This has been seen in several other HzRGs(e.g. De Breuck et al., 2001; Villar-Martın et al., 2002),and excludes shocks as the ionization mechanism at thisposition. Because we do not detect a discontinuity in theLyα profile at the position of the radio lobes, this impliesthat photo-ionization by the central AGN is the dominat-ing ionization mechanism of the Lyα line.
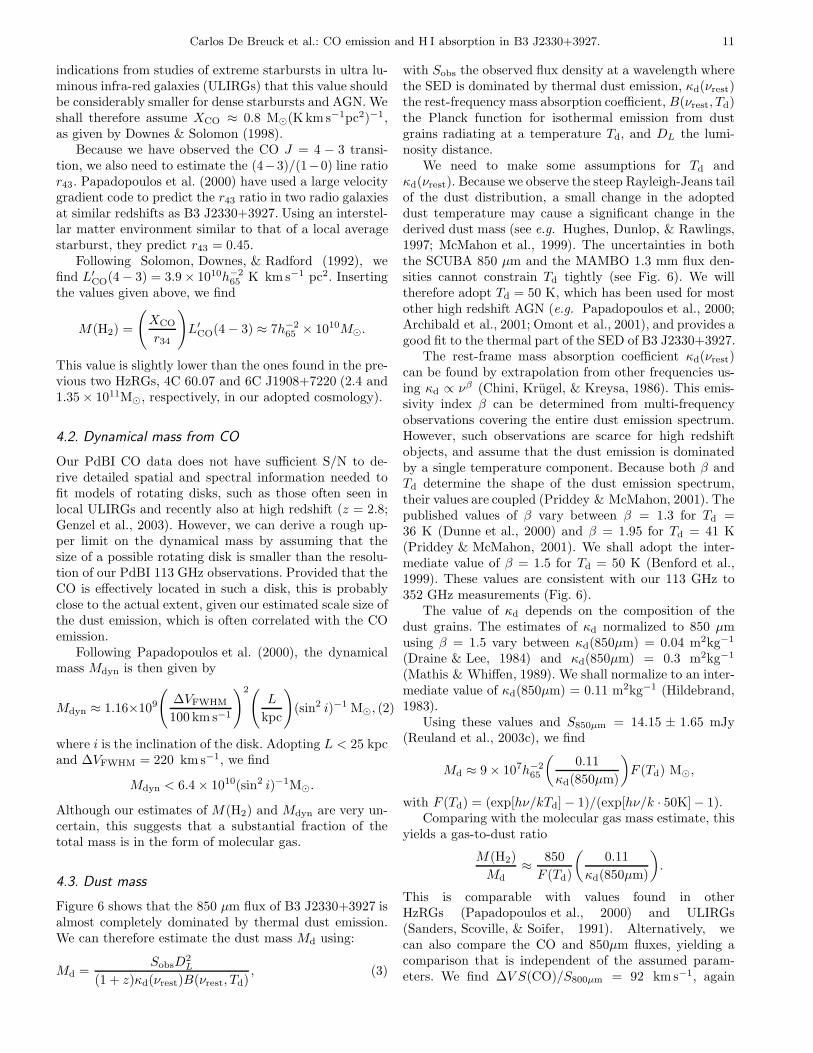
Fig. 11. Lyα velocity profile of B3 J2330+3929(solid/black histogram). The solid/blue line is the modelconsisting of a Gaussian emission (dashed/red line)and two Voigt absorption profiles with the indicatedparameters. The dotted/green histogram is the scaledHe II λ 1640 profile. The horizontal bar indicates the fullvelocity width of the CO 4− 3 line (Fig. 8).
Figure 11 zooms in on the Lyα line in the Keck/LRISspectrum (extraction width 1′′ × 1′′). To check if the ve-locity profile can be explained by pure velocity structurewithout absorption, we have attempted to fit the Lyαprofile with two or three Gaussian components, but thisdoes not provide a good fit between the two peaks, or onthe blue wing. An alternative interpretation is that thedouble-peaked structure is caused by associated H I ab-sorption. Such absorbers are often seen in the Lyα lines
of HzRGs (e.g. van Ojik et al., 1997a; De Breuck et al.,2000b; Jarvis et al., 2002).
We therefore modeled the profile with a Gaussian emis-sion profile, supplemented by two Voigt absorption com-ponents (a second component is needed to fit the non-Gaussian blue wing). Figure 11 presents our best fit, ob-tained through a χ2 minimization. We find that the profilecan be closely represented with this model. Although thecentral wavelength of the Gaussian emission was a freeparameter in our fit, it corresponds very well with theredshift obtained from the He II λ 1640 line, providing astrong physical base for our model.
We can estimate the mass of the associated H I ab-sorber using
M(H I) = mpR2absN kg, (4)
where mp is the proton mass, Rabs is the size of the ab-sorption system, andN is the column density derived fromthe Voigt profile fitting. In convenient astrophysical units(van Ojik et al., 1997a), this becomes:
M(H I) = 108R235N19 M⊙, (5)
where R35 is in units of 35 kpc, and N19 is in units of10−19cm2.
Because the red absorber has a ∼10000 times highercolumn density (N = 8.7× 1018 cm−2) than the blue one,we shall only consider the red absorber in the following.From Figure 4, we obtain a lower limit of ∼
> 2′′ for thefull spatial extent of the red absorber. Assuming conser-vatively a size of Rabs ∼ 17h−1
65 kpc, we derive a total massestimate of the absorber
M(H I) ∼> 2× 10⁷h−265 M⊙.
We can also use the Lyα emission to estimate the massof ionized hydrogen M(H II). Following McCarthy et al.(1990), we assume pure case B recombination at a temper-ature of T = 104 K. Using the Lyα emission corrected forthe associated H I absorption (dashed line in Figure 11),we obtain M(H II) using
M(H II) = 109(f−5L44V70)1/2M⊙, (6)
where f−5 is the filling factor in units of 10−5, L44 is theLyα luminosity in units of 1044 ergs s−1, and V70 is thetotal volume in units of 1070 cm3. Assuming a filling factorof 10−5 (McCarthy et al., 1990), and a volume of 6′′×2′′×6′′ = 1.4× 1069h−3
65 cm3 (see Fig. 4), we find
M(H II) ≈ 2.5× 10⁸h−1/265 M⊙.
This value is consistent with those found in other HzRGs(e.g. van Ojik et al., 1997a).
4.5. H I 21 cm absorption against the radio source
We can determine an upper limit of the H I mass from ournon-detection of the H I 21cm line. The optical depth isdefined as
τ = − ln(1−∆S/(Scf)), (7)
Carlos De Breuck et al.: CO emission and H I absorption in B3 J2330+3927. 13
Table 5. Mass estimates of gas and dust components inB3 J2330+3927, subject to uncertainties discussed in §4.
Component Mass estimate Determined fromM⊙
H2 7× 10¹⁰ CO lineDynamical < 6.4× 10¹⁰(sin2 i)−1 CO line
Dust 9× 10⁷ 850µm continuumH I 2× 10⁷ Lyα absorptionH II 2.5 × 10⁸ Lyα emissionH I < 2× 10⁸ H I 21 cm absorption
where ∆S is the H I absorption flux, S the continuum fluxand cf covering factor that is assumed to be 1. Assuminga 3σ upper limit, we find τ < 1.3%.
A limit to the integrated column density can then bederived from the expression (e.g. Rohlfs, 1986):
NH ≃ 1.83× 10¹⁸Tspin
∫
τ dv cm−2, (8)
where Tspin is the spin temperature in Kelvin, and weassume a profile width of 300 km s−1. H I studies ofhigh-redshift damped Lyα systems (Carilli et al., 1996;Kanekar & Chengalur, 2003) have found values as highas Tspin = 1000 K, but there also appears to be a trendfor lower Tspin in the most luminous galaxies. We thereforeadopt the Tspin = 100 K value found in Galactic clouds(e.g. Braun & Walterbos, 1992). This yields
NH ∼< 9.3× 10²⁰(Tspin/100) cm−2.
Assuming that the absorption occurs only against the ra-dio core, we obtain an estimate of the scale-length of theabsorber of Rabs ∼ 0.′′5 ≈ 4 kpc. Using equation (4), thisyields
M(H I) ∼< 1× 10⁸h−265 M⊙.
5. Discussion
5.1. The interaction between the different gascomponents
We now examine the relationship between the differentcomponents summarized in table 5. The similarity of ob-jects b and c in both size andK−band magnitude suggeststhat object c may also be part of the same system. Wemay therefore witness the accretion of the smaller com-panion object b (and possibly also object c) by a mas-sive galaxy hosting an AGN (object a, but see §3.2), sur-rounded by a large reservoir of molecular gas and dust.Such gas reservoirs are often directly seen in the hugeLyα haloes, which extend out to >100 kpc from theAGN (e.g. van Ojik et al., 1996; Venemans et al., 2002;Villar-Martın et al., 2002; Reuland et al., 2003b). FromFigure 4, we find that the extent of the Lyα halo inB3 J2330+3927 is ∼6′′ (50 kpc), but our spectrum is notvery deep, so this value should be considered as a lowerlimit.
The peaks of the CO, dust and Lyα emission are all atobject a, suggesting that the ionized hydrogen and the COand dust emission are co-spatial. Figure 11 shows that theCO emission also coincides very closely in velocity spacewith the main associated H I absorber. Because these com-ponents are both co-spatial (at object a), and have similarvelocity shifts, this strongly suggests that we detect COemission from the same cloud that absorbs the Lyα emis-sion. Our mass estimate from the associated Lyα absorberis ∼ 3500 times lower than the one obtained from the COemission (Table 5). Although both estimates are uncertainto almost an order of magnitude, this difference does indi-cate that the associated Lyα absorber probes only a tinypart of the total gas mass, either because most of the hy-drogen is in molecular form, or due to the requirement of astrong background source to detect the H I in absorption.
Our multi-wavelength data of B3 J2330+3926 show forthe first time a direct relationship between the associatedH I absorption and CO emission in a HzRG. High reso-lution spectroscopy of the Lyα and C IV λ 1549 lines oftwo HzRGs (Binette et al., 2000; Jarvis et al., 2002) haveshown that the absorbers cannot be co-spatial with theemitting gas. The absorption should therefore occur fur-ther outward, possibly in a shell pressurized by the ex-panding radio source (Binette et al., 2000). Our detec-tion of CO emission from the absorbers suggests thatthis cloud may be quite extended, but it cannot be pri-mordial, as it is already chemically enriched. This is alsoconsistent with the recent findings of Baker et al. (2002),who found a strong correlation between the equivalentwidth of C IV λ 1549 absorbers and optical continuumslope in radio-loud quasars. They interpret this relationas evidence for the presence of dust in the associatedC IV λ 1549 absorbers, which reddens the optical con-tinuum. The gas and dust emission often trace each other(e.g. Papadopoulos et al., 2000), suggesting that the as-sociated absorbers seen in both quasars and radio galaxiesprobe the large gas and dust reservoirs surrounding AGNs.
The presence of CO from these reservoirs impliesthat they contain processed material. This metal emis-sion is sometimes also seen in emission in extendedhaloes of C IV λ 1549, He II λ 1640 and NV λ 1240(Maxfield et al., 2002; Villar-Martın et al., 2003). Theymay have been deposited by previous merger events,or by starburst-driven superwinds at even higher red-shifts (e.g. Taniguchi et al., 2001a; Dawson et al., 2002;Ajiki et al., 2002; Furlanetto & Loeb, 2003). Indeed,Taniguchi, Shioya, & Kakazu (2001b) discuss evidencethat a superwind occurs in a z = 3.09 “blob” of Lyαemission which also emits strongly at submm wavelengths(Chapman et al., 2001). Such objects may be related toHzRGs, e.g. when observed during a radio-quiet phase.
To summarize, our observations of B3 J2330+3927provide further evidence that HzRGs are mas-sive galaxies, located in a dense, interacting en-vironment. Deep near-IR imaging with Keck(van Breugel et al., 1998; De Breuck et al., 2002),HST (Pentericci et al., 2001), and ground-based adaptive
14 Carlos De Breuck et al.: CO emission and H I absorption in B3 J2330+3927.
optics (Steinbring, Crampton, & Hutchings, 2002) showsthat the host galaxies are often surrounded by fainterclumps, like objects b and c in B3 J2330+3926. Theseclumps may well be concentrations within the largegas/dust reservoir surrounding the AGN, which willeventually merge with the massive central galaxy hostingthe AGN.
5.2. Star formation rate
Having found evidence that the host galaxy ofB3 J2330+3927 is surrounded by a large gas reservoir,which has already been chemically enriched, it is of in-terest to estimate the ongoing star formation rate in thisgalaxy. We cannot use the rest-frame UV and optical emis-sion lines, because they are mainly ionized by the AGN,and not by massive stars. Similarly, the UV continuumemission is likely to be contaminated by a scattered quasarcomponent (e.g. Vernet et al., 2001a). We therefore de-termine an upper limit to the global star formation rateof the entire system using the far-IR (FIR) dust emission.
We can determine the total FIR luminosity by inte-grating the thermal spectrum:
LFIR = 4πMd
∫ ∞
0
κd(ν)B(ν, Td)dν, (9)
yielding:
LFIR =8πh
c2·λβκd(λ)
cβ
(
kTd
h
)β+4
Γ[β+4]ζ[β+4]Md, (10)
where Γ and ζ are the Gamma and Riemann ζ functions,respectively.
Substituting equation (3) and x = hνrest/kTd, we find:
LFIR = 4πΓ[β+4]ζ[β+4]D2Lx
−(β+4)(ex− 1)Sobsνobs, (11)
For the values adopted in this paper, we find:
LFIR ≈ 3.3× 10¹³h−265 L⊙.
In §3.5, we have argued that the dust emission prob-ably consists of a central component near the AGN, anda spatially extended component. This would imply thatthe power source of the FIR emission is a combination ofdirect heating by the AGN (heating the central compo-nent) and by recently formed massive stars in a starburst(heating the extended component). It is unlikely that theAGN can power the dust emission out to several tens ofkpc, while the detection of several companion objects inthe optical and near-IR images suggests the presence ofstars out to ∼40 kpc.
Following Omont et al. (2001), we can then calculatethe star formation rate
SFR = δMFδSB(LFIR/1010L⊙) M⊙yr
−1, (12)
where δMF is a function of the stellar mass function, andδSB is the fraction of the FIR emission heated by the star-burst. Assuming conservatively δMF = 1, we find
SFR ≈ 3000δSBh65 M⊙yr−1.
Papadopoulos et al. (2000) report star-formation ratesup to 1500 M⊙yr
−1 in the 2 other HzRGs where CO emis-sion has been detected. Because δSB is likely to be sig-nificantly smaller than 1, our values are probably lower.Nevertheless, they are still extremely high, indicating thatwe are witnessing a major starburst phase, possibly trig-gered by the interaction and/or merging of the differentnearby companion objects seen in the K−band image.
6. Conclusions
The main results from our multi-frequency observationsof B3 J2330+3927 are:
• We detect the CO J = 4 − 3 line with a full ve-locity width of ∼500 km s−1 at the position of the AGNhost galaxy. The line is centered at z = 3.094, much closerto the central velocity of the associated H I absorber inLyα than to the systemic redshift determined from theHe II λ 1640 line. This strongly suggests the CO emis-sion and associated H I absorption both originate fromthe same gas reservoir surrounding the HzRG.
• We find a substantial discrepancy between our250 GHz single dish and 230 GHz interferometer measure-ments of the thermal dust emission. This strongly suggeststhat the dust emission is distributed at spatial scales largerthan the 1.′′9× 1.′′5 synthesized interferometer beam. Thecombined uv-plane data can be fit by a circular Gaussianprofile with a size between 0.′′5 and 5′′.
• The optical/near-IR spectroscopy suggests that theAGN is located at the brightest K−band source (ob-ject a). This is supported by the CO and dust emission,which both peak at the same position. However, the radiomorphology suggests that the AGN is located at the cen-tral radio component, 1′′ south of object a. If the AGN islocated at object a, the radio source is extremely asym-metric. Alternatively, the AGN may be located at the cen-tral radio component, and could be either heavily obscuredin the optical/near-IR, or could be located off-centre fromthe host galaxy. However, this alternative appears unlikelygiven the position of the dust/CO peak.
• We obtain a τ < 1.3% limit on the H I 21 cm absorp-tion against the radio source. This represents the seventhnon-detection out of 8 radio galaxies where H I 21 cm ab-sorption has been searched.
• We estimate the mass of the different componentsin B3 J2330+3927, which indicates that the CO emissiontraces the largest fraction of the total mass in the system.
In summary, our multi-wavelength observations sug-gest the presence of a large gas and dust reservoir sur-rounding the host galaxy of B3 J2330+3927. For the firsttime, we have found strong indications that these differ-ent observations may trace the same material, both inemission and in absorption. The detection of CO emissiontherefore implies that a substantial part of this reservoir isnot primordial, but must have been previously enriched,possibly by a starburst-driven superwind.
Acknowledgements. We thank Alexandre Beelen and RichardWilman for their help with MOPSI and the Lyα profile fit-
Carlos De Breuck et al.: CO emission and H I absorption in B3 J2330+3927. 15
ting, Dennis Downes for useful discussions, and the Plateaude Bure staff for their efficient assistance. We thank theanonymous referee for useful suggestions. We are indebtedto Daniel Stevens for obtaining the initial optical data onthis source in 1995. IRAM is supported by INSU/CNRS(France), MPG (Germany) and IGN (Spain). The W. M. KeckObservatory is operated as a scientific partnership among theCalifornia Institute of Technology, the University of California,and the National Aeronautics and Space Administration. TheObservatory was made possible by the generous financial sup-port of the W. M. Keck foundation. The Westerbork SynthesisRadio Telescope (WSRT) is operated by the NetherlandsFoundation for Research in Astronomy (NFRA) with finan-cial support of the Netherlands Organization for ScientificResearch (NWO). The National Radio Astronomy Observatory(NRAO) is operated by Associated Universities, Inc., under acooperative agreement with the National Science Foundation.This work was supported by a Marie Curie Fellowship ofthe European Community programme ’Improving HumanResearch Potential and the Socio-Economic Knowledge Base’under contract number HPMF-CT-2000-00721. The workof DS was carried out at the Jet Propulsion Laboratory,California Institute of Technology, under contract with NASA.The work by MR and WvB at IGPP/LLNL was per-formed under the auspices of the U.S. Department of Energy,National Nuclear Security Administration by the Universityof California, Lawrence Livermore National Laboratory undercontract No. W-7405-Eng-48. This work was carried out in thecontext of EARA, the European Association for Research inAstronomy.
References
Ajiki, M., et al. 2002, ApJ, 576, L25Alloin, D., Barvainis, R., & Guilloteau, S. 2000, ApJ, 528,L81
Andreani, P., Fosbury, R., van Bemmel, I., & Freudling,W. 2002, A&A, 381, 389
Archibald, E., Dunlop, J., Hughes, D., Rawlings, S., Eales,S., & Ivison, R. 2001, MNRAS, 323, 417
Armus, L., Soifer, B., Murphy, T., Neugebauer, G., Evans,A., & Matthews, K. 1998, ApJ, 495, 276
Athreya, R., Kapahi, V., McCarthy, P., & van Breugel,W. 1997, MNRAS, 289, 525
Baker, J., et al. 2002, ApJ, 568, 592Barger, A., et al. 2001, AJ, 122, 2177Benford, D., Cox, P., Omont, A., Phillips, T., &McMahon, R. 1999, ApJ, 518, L65
Best, P., Longair, M., & Rottgering, H. 1998, MNRAS,295, 549
Binette, L., Kurk, J., Villar-Martın, M., & Rottgering, H.2000, A&A, 356, 23
Blain, A., & Longair, M. 1993, MNRAS, 264, 509Braun, R., & Walterbos, R. 1992, ApJ, 386, 120Briggs, F., Sorar, E., & Taramopoulos, A. 1993, ApJ, 415,L99
Cardelli, J., Clayton, G., & Mathis, J. 1989, ApJ, 345, 245Carilli, C. 1995, A&A, 298, 77Carilli, C., Lane, W., de Bruyn, A., Braun, R., & Miley,G. 1996, AJ, 111, 1830
Carilli, C., Rottgering, H., van Ojik, R., Miley, G., & vanBreugel, W. 1997, ApJS, 109, 1
Carilli, C., et al. 2000, ApJ, 533, L13Chapman, S., et al. 2001, ApJ, 548, 17Chini, R., Krugel, E., & Kreysa, E. 1986, A&A, 167, 315Combes, F., Maoli, R., & Omont, A. 1999, A&A, 345, 369Cox, P., et al. 2002a, A&A, 387, 406Cox, P., Omont, A., & Bertoldi, F. 2002b, EASPublication Series, 4, p. 399
Dawson, S., et al. 2002, ApJ, 570, 92De Breuck, C., Brotherton, M., Tran, H., van Breugel, W.,Rottgering, H. 1998, AJ, 116, 13
De Breuck, C., van Breugel, W., Minniti, D., Miley, G.,Rottgering, H., & Carilli, C. 1999, A&A, 352, L51
De Breuck, C., van Breugel, W., Rottgering, H., & Miley,G. 2000a, A&AS, 143, 303
De Breuck, C., Rottgering, H., Miley, G., van Breugel, W.,& Best, P. 2000b, A&A, 362, 519
De Breuck, C., et al. 2001, AJ, 121, 1241De Breuck, C., van Breugel, W., Stanford, S. A.,Rottgering, H., Miley, G., & Stern, D. 2002, AJ, 123,637
Dennett-Thorpe, J., Scheuer, P., Laing, R., Bridle, A.,Pooley, G., & Reich, W. 2002, MNRAS, 330, 609
Deutsch, E. 1999, AJ, 118, 1882Dey, A., van Breugel, W., Vacca, W., & Antonucci, R.1997, ApJ, 490, 698
Douglas, J. N., Bash, F. N., Bozyan, F. A., Torrence, G.W., & Wolfe, C. 1996, AJ, 111, 1945
Downes, D., & Solomon, P. 1998, ApJ, 507, 615Draine, B., & Lee, H. 1984, ApJ, 285, 89Dunne, L., Eales, S., Edmunds, M., Ivison, R., Alexander,P., & Clements, D. 2000, MNRAS, 315, 115
Dunlop, J., Hughes, D., Rawlings, S., Eales, S., & Ward,M. 1994, Nature, 370, 347
Eales, S. & Rawlings, S. 1993, ApJ, 411, 67Evans, A., et al. 1996, ApJ, 457, 658Furlanetto, S. & Loeb, A. 2003, ApJ, submitted,astro-ph/0211496
Genzel, R., et al. 2003, ApJ, in press, astro-ph/0210449Guilloteau, S., Omont, A., Cox, P., McMahon, R., &Petitjean, P. 1999, A&A, 349, 363
Hildebrand, R. 1983, QJRAS, 24, 267Holland, W., et al. 1999, MNRAS, 303, 659Hughes, D., Dunlop, J., & Rawlings, S. 1997, MNRAS,289, 766
Ivison, R. 1995, MNRAS, 275, L33Ivison, R., et al. 1998, MNRAS, 298, 583Jaffe, W., & Perola, G. 1973, A&A, 26, 423Jarvis, M., et al. 2001, MNRAS, 326, 1585Jarvis, M., Wilman, R.ottgering, H., & Binette, L. 2002,MNRAS, 338, 263
Johnson, H. 1966, ARA&A, 4, 193Kanekar, N. & Chengalur, J. 2003, A&A, in press,astro-ph/0211637
Kreysa, E., et al. 1998, Proc. SPIE, 3357, 319Lacy, M., et al. 1994, MNRAS, 271, 504Mathis, J., & Whiffen, G. 1989, ApJ, 341, 808
16 Carlos De Breuck et al.: CO emission and H I absorption in B3 J2330+3927.
Matthews, K. & Soifer, B. 1994, in Proc. InfraredAstronomy with Arrays: The Next Generation, ed. I.McLean (Dordrecht: Kluwer), p. 239
Maxfield, L., Spinrad, H., Stern, D., Dey, A., & Dickinson,M. 2002, AJ, 123, 2321
McCarthy, P., et al. 1990, ApJ, 365, 487McCarthy, P., van Breugel, W., & Kapahi, V. 1991, ApJ,371, 478
McMahon, R., Priddey, R., Omont, A., Snellen, I., &Withington, S. 1999, MNRAS, 309, L1
Monet, D. et al. 1998, USNO-SA2.0, (U.S. NavalObservatory, Washington DC)
Murgia, M. et al. 1999, A&A, 345, 769Napier, P., Thompson, A., & Ekers, R. 1983, Proc. IEEE,71, 1295
Norman, C., et al. 2002, ApJ, 571, 218Oke, J., et al. 1995, PASP, 107, 375Omont, A., Petitjean, P., Guilloteau, S., McMahon, R.,Solomon, P., & Pecontal, E. 1996, Nature, 382, 428
Omont, A., Cox, P., Bertoldi, F., McMahon, R., Carilli,C., & Isaak, K. 2001, A&A, 374, 371
Omont, A., et al. 2003, A&A, 398, 857Ouchi, M., et al. 2001, ApJ, 558, L83Pacholczyk, A. 1970, Series of Books in Astronomy andAstrophysics, San Francisco: Freeman
Papadopoulos, P., et al. 2000, ApJ, 528, 626Pentericci, L., Van Reeven, W., Carilli, C., Rottgering, H.,& Miley, G. 2000, A&AS, 145, 121
Pentericci, L., McCarthy, P., Rottgering, H., Miley, G.,van Breugel, W., & Fosbury, R. 2001, ApJS, 135, 63
Priddey, R., & McMahon, R. 2001, MNRAS, 324, L17Priddey, R., Isaak, K., McMahon, R., & Omont, A. 2003,MNRAS, in press, astro-ph/0211646
Overzier, R., Rottgering, H., Kurk, J., & De Breuck, C.2001, A&A, 367, L5
Quirrenbach, A., Roberts, J., Fidkowski, K., de Vries, W.,& van Breugel, W. 2001, ApJ, 556, 108
Reuland, M., van Breugel, W., Rottgering, H., de Vries,W., De Breuck, C., & Stern, D. 2003a, ApJ, 582, 71
Reuland, M., van Breugel, W., & Rottgering, H. 2003b,ApJ, submitted
Reuland, M., et al. 2003c, in preparationRohlfs, K. 1986, Tools of Radio Astronomy, Berlin andNew York, Springer-Verlag
Rottgering, H., de Bruyn, G., & Pentericci, L. 1999, TheMost Distant Radio Galaxies, p. 113
Rowan-Robinson, M. 2000, MNRAS, 316, 885Sanders, D., Scoville, N., & Soifer, B. 1991, ApJ, 370, 158Sanders, D., & Mirabel, I. 1996, ARA&A, 34, 749Schlegel, D., Finkbeiner, D., Davis, M. 1998, ApJ, 500,525
Solomon, P., Downes, D., & Radford, S. 1992, ApJ, 398,L29
Steidel, C., Giavalisco, M., Pettini, M., Dickinson, M., &Adelberger, K. 1996, ApJ, 462, L17
Steidel, C., Adelberger, K., Giavalisco, M., Dickinson, M.,& Pettini, M. 1999, ApJ, 519, 1
Steidel, C., et al. 2002, ApJ, 576, 653
Steinbring, E., Crampton, D., & Hutchings, J. 2002, ApJ,569, 611
Stern, D., et al. 2002, ApJ, 568, 71Tadhunter, C., et al. 2002, MNRAS, 330, 977Taniguchi, Y., et al. 2001a, ApJ, 559, L9Taniguchi, Y., Shioya, Y., & Kakazu, Y. 2001b, ApJ, 562,L15
Uson, J., Bagri, D., & Cornwell, T. 1991, Physical ReviewLetters, 67, 3328
van Breugel, W., Stanford, S. A., Spinrad, H., Stern, D.,& Graham, J. 1998, ApJ, 502, 614
van Breugel, W., De Breuck, C., Stanford, S. A., Stern,D., Rottgering, H., & Miley, G. 1999, ApJ, 518, L61
van Ojik, R., Rottgering, H., Carilli, C., Miley, G., Bremer,M., & Macchetto, F. 1996, A&A, 313, 25
van Ojik, R., Rottgering, H., Miley, G., & Hunstead, R.1997a, A&A, 317, 358
van Ojik, R., et al. 1997b, A&A, 321, 389Venemans, B., et al. 2002, ApJ, 569, L11Vernet, J., et al. 2001a, A&A, 366, 7Vernet, J., & Cimatti, A. 2001b, A&A, 380, 409Vigotti, M., Gregorini, L., Klein, U., & Mack, K.-H.,A&AS, 139, 359
Villar-Martın, M., Alonso-Herrero, A., di Serego Alighieri,S., & Vernet, J. 2000, A&AS, 147, 291
Villar-Martın, M., et al. 2002, MNRAS, 336, 436Villar-Martın, M., et al. 2003, in preparationWillott, C., Rawlings, S., Archibald, E., & Dunlop, J.2002, MNRAS, 331, 435
Zylka, R., The MOPSI Cookbook, www.mpifr-bonn.mpg.de/staff/bertoldi/mambo/